UNITED STATES
SECURITIES AND EXCHANGE COMMISSION
WASHINGTON, D.C. 20549
FORM 10-K
ANNUAL REPORT PURSUANT TO SECTION 13 OR 15(d)
OF THE SECURITIES EXCHANGE ACT OF 1934
For the fiscal year ended December 31, 2006
Commission File Number 0-15572
| | FIRST BANCORP | |
| | (Exact Name of Registrant as Specified in its Charter) | |
| North Carolina | | 56-1421916 |
| (State of Incorporation) | | (I.R.S. Employer Identification Number) |
| | | |
| 341 North Main Street, Troy, North Carolina | | 27371-0508 |
| (Address of Principal Executive Offices) | | (Zip Code) |
| | | |
| Registrant’s telephone number, including area code: | | (910) 576-6171 |
Securities Registered Pursuant to Section 12(b) of the Act: None
Securities Registered Pursuant to Section 12(g) of the Act:
COMMON STOCK, NO PAR VALUE
(Title of each class)
Indicate by check mark if the registrant is a well-known seasoned issuer, as defined in Rule 405 of the Securities Act of 1933. ¨ YES ý NO
Indicate by check mark if the registrant is not required to file reports pursuant to Section 13 or Section 15(d) of the Securities Exchange Act of 1934. ¨ YES ý NO
Indicate by check mark whether the registrant (1) has filed all reports required to be filed by Section 13 or 15(d) of the Exchange Act during the preceding twelve months (or for such shorter period that the registrant was required to file such reports), and (2) has been subject to such filing requirements for the past 90 days. ý YES ¨ NO
Indicate by check mark if disclosure of delinquent filers pursuant to Item 405 of Regulation S-K is not contained herein, and will not be contained, to the best of the registrant’s knowledge, in definitive proxy or information statements incorporated by reference in Part III of the Form 10-K or any amendment to the Form 10-K. ý
Indicate by check mark whether the registrant is a large accelerated filer, an accelerated filer, or a non-accelerated filer. ¨ Large Accelerated Filer ý Accelerated Filer ¨ Non-Accelerated Filer
Indicate by check mark whether the registrant is a shell company (as defined in Rule 12b-2 of the Exchange Act). ¨ YES ý NO
The aggregate market value of the Common Stock, no par value, held by non-affiliates of the registrant, based on the closing price of the Common Stock as of June 30, 2006 as reported by The NASDAQ Global Select Market, was approximately $248,390,000.
The number of shares of the registrant’s Common Stock outstanding on February 26, 2007 was 14,362,672.
DOCUMENTS INCORPORATED BY REFERENCE
Portions of the Registrant’s Proxy Statement to be filed pursuant to Regulation 14A are incorporated herein by reference into Part III.
| | | Begins on |
| | | Page (s) |
| | | |
| | |
| Business | 4 |
| Risk Factors | 13 |
| Unresolved Staff Comments | 15 |
| Properties | 15 |
| Legal Proceedings | 15 |
| Submission of Matters to a Vote of Shareholders | 15 |
| | | |
| | |
| Market for the Registrant’s Common Stock, Related Shareholder Matters, and Issuer Purchases of Equity Securities | 16 |
| Selected Consolidated Financial Data | 18, 49 |
| Management’s Discussion and Analysis of Financial Condition and Results of Operations | 18 |
| | Critical Accounting Policies | 18 |
| | Merger and Acquisition Activity | 21 |
| | Overview Comparison of 2006 to 2005 | 22 |
| | Overview Comparison of 2005 to 2004 | 24 |
| | Statistical Information | |
| | Net Interest Income | 26, 50 |
| | Provision for Loan Losses | 28, 56 |
| | Noninterest Income | 28, 51 |
| | Noninterest Expenses | 30, 51 |
| | Income Taxes | 31, 52 |
| | Stock-Based Compensation | 31 |
| | Distribution of Assets and Liabilities | 34, 52 |
| | Securities | 35, 52 |
| | Loans | 36, 54 |
| | Nonperforming Assets | 37, 55 |
| | Allowance for Loan Losses and Loan Loss Experience | 39, 55 |
| | Deposits and Securities Sold Under Agreements to Repurchase | 40, 56 |
| | Borrowings | 41 |
| | Liquidity, Commitments, and Contingencies | 42, 58 |
| | Off-Balance Sheet Arrangements and Derivative Financial Instruments | 43 |
| | Interest Rate Risk (Including Quantitative and Qualitative Disclosures About Market Risk) | 44, 59 |
| | Return on Assets and Equity | 46, 59 |
| | Capital Resources and Shareholders’ Equity | 46, 60 |
| | Inflation | 47 |
| | Current Accounting and Regulatory Matters | 48 |
| Quantitative and Qualitative Disclosures About Market Risk | 48 |
| 48 |
| Financial Statements and Supplementary Data: | |
| | Consolidated Balance Sheets as of December 31, 2006 and 2005 | 62 |
| | Consolidated Statements of Income for each of the years in the three-year period ended December 31, 2006 | 63 |
| | | |
| | | Begins on |
| | | Page (s) |
| | Consolidated Statements of Comprehensive Income for each of the years in the three-year period ended December 31, 2006 | 64 |
| | Consolidated Statements of Shareholders’ Equity for each of the years in the three-year period ended December 31, 2006 | 65 |
| | Consolidated Statements of Cash Flows for each of the years in the three-year period ended December 31, 2006 | 66 |
| | Notes to Consolidated Financial Statements | 67 |
| | Report of Independent Registered Public Accounting Firm (Current Firm) | 102 |
| | Report of Independent Registered Public Accounting Firm (Predecessor Firm) | 104 |
| | Selected Consolidated Financial Data | 49 |
| | Quarterly Financial Summary | 61 |
| | | |
| Changes in and Disagreements with Accountants on Accounting and Financial Disclosures | 105 |
| Controls and Procedures | 105 |
| Other Information | 106 |
| | | |
| | |
| Directors, Executive Officers and Corporate Governance | 107* |
| Executive Compensation | 107* |
| Security Ownership of Certain Beneficial Owners and Management and Related Shareholder Matters | 107* |
| Certain Relationships and Related Transactions, and Director Independence | 108* |
| Principal Accountant Fees and Services | 108* |
| | | |
| | |
| Exhibits and Financial Statement Schedules | 108 |
| | | |
| | 111 |
| | | |
| * | Information called for by Part III (Items 10 through 14) is incorporated herein by reference to the Registrant’s definitive Proxy Statement for the 2007 Annual Meeting of Shareholders to be filed with the Securities and Exchange Commission. |
General Description
The Company
First Bancorp (the “Company”) is a bank holding company. The principal activity of the Company is the ownership and operation of First Bank (the “Bank”), a state-chartered bank with its main office in Troy, North Carolina. The Company also owns and operates two nonbank subsidiaries: Montgomery Data Services, Inc. (“Montgomery Data”), a data processing company, and First Bancorp Financial Services, Inc. (“First Bancorp Financial”), which owns and operates various real estate. Each of these subsidiaries is fully consolidated for financial reporting purposes. The Company is also the parent to four statutory business trusts created under the laws of the State of Delaware, which have issued a total of $67.0 million in trust preferred debt securities. Under current accounting requirements, these four statutory business trusts are not consolidated for financial reporting purposes - see discussion of FIN 46 in Note 1(t) to the consolidated financial statements under Item 8 below.
The Company was incorporated in North Carolina on December 8, 1983, as Montgomery Bancorp, for the purpose of acquiring 100% of the outstanding common stock of the Bank through a stock-for-stock exchange. On December 31, 1986, the Company changed its name to First Bancorp to conform its name to the name of the Bank, which had changed its name from Bank of Montgomery to First Bank in 1985.
The Bank was organized in 1934 and began banking operations in 1935 as the Bank of Montgomery, named for the county in which it operated. As of December 31, 2006, the Bank operated in a 26-county area centered in Troy, North Carolina. Troy, population 3,500, is located in the center of Montgomery County, approximately 60 miles east of Charlotte, 50 miles south of Greensboro, and 80 miles southwest of Raleigh. The Bank conducts business from 68 branches located within a 120-mile radius of Troy, covering principally a geographical area from Latta, South Carolina to the southeast, to Wilmington, North Carolina to the east, to Radford, Virginia to the north, to Wytheville, Virginia to the northwest, and to Harmony, North Carolina to the west. The Bank also has a loan production office in Blacksburg, which is located in southwestern Virginia and represents the Bank’s furthest location to the north of Troy. Of the Bank’s 68 branches, 61 are in North Carolina, with three branches in South Carolina and four braches in Virginia (where the Bank operates under the name “First Bank of Virginia”). Ranked by assets, the Bank was the 7th largest bank headquartered in North Carolina as of December 31, 2006.
As of December 31, 2006, the Bank had one wholly owned subsidiary, First Bank Insurance Services, Inc. (“First Bank Insurance”). First Bank Insurance was acquired as an active insurance agency in 1994 in connection with the Company’s acquisition of a bank that had an insurance subsidiary. On December 29, 1995, the insurance agency operations of First Bank Insurance were divested. From December 1995 until October 1999, First Bank Insurance was inactive. In October 1999, First Bank Insurance began operations again as a provider of non-FDIC insured investments and insurance products. Currently, First Bank Insurance’s primary business activity is the placement of property and casualty insurance coverage.
The Company’s principal executive offices are located at 341 North Main Street, Troy, North Carolina 27371-0508, and its telephone number is (910) 576-6171. Unless the context requires otherwise, references to the “Company” in this annual report on Form 10-K shall mean collectively First Bancorp and its consolidated subsidiaries.
General Business
The Bank engages in a full range of banking activities, providing such services as checking, savings, NOW and
money market accounts and other time deposits of various types including certificates of deposits (CDs) and individual retirement accounts (IRAs); loans for business, agriculture, real estate, personal uses, home improvement and automobiles; credit cards; debit cards; letters of credit; safe deposit box rentals; bank money orders; and electronic funds transfer services, including wire transfers, automated teller machines, and bank-by-phone capabilities. In December 2004, the Bank also began offering its internet banking product, with on-line bill pay and cash management features. In 2005, the Bank began offering repurchase agreements (also called securities sold under agreement to repurchase), which are similar to interest-bearing deposits and allows the Bank to pay interest to business customers without statutory limitations on the number of withdrawals that these customers can make. Because the majority of the Bank’s customers are individuals and small to medium-sized businesses located in the counties it serves, management does not believe that the loss of a single customer or group of customers would have a material adverse impact on the Bank. There are no seasonal factors that tend to have any material effect on the Bank’s business, and the Bank does not rely on foreign sources of funds or income. Because the Bank operates primarily within the central Piedmont region of North Carolina, the economic conditions within that area could have a material impact on the Company. See additional discussion below in the section entitled “Territory Served and Competition.”
Beginning in 1999, First Bank Insurance began offering non-FDIC insured investment and insurance products, including mutual funds, annuities, long-term care insurance, life insurance, and company retirement plans, as well as financial planning services (the “investments division”). In May 2001, First Bank Insurance added to its product line when it acquired two insurance agencies that specialized in the placement of property and casualty insurance. In October 2003, the “investments division” of First Bank Insurance became a part the Bank. The primary activity of First Bank Insurance is now the placement of property and casualty insurance products.
Montgomery Data’s primary business is to provide electronic data processing services for the Bank. Ownership and operation of Montgomery Data allows the Company to do all of its electronic data processing without paying fees for such services to an independent provider. Maintaining its own data processing system also allows the Company to adapt the system to its individual needs and to the services and products it offers. Although not a significant source of income, Montgomery Data has historically made its excess data processing capabilities available to area financial institutions for a fee. For the years ended December 31, 2006, 2005 and 2004, external customers provided gross revenues of $162,000, $279,000 and $416,000, respectively. During 2005, two of the five customers terminated their services with Montgomery Data and switched to another provider. During 2006, one other customer terminated its service, which left Montgomery Data with two outside customers as of December 31, 2006. Montgomery Data intends to continue to market its services to area banks, but does not currently have any near-term prospects for additional business.
First Bancorp Financial was organized under the name of First Recovery in September of 1988 for the purpose of providing a back-up data processing site for Montgomery Data and other financial and non-financial clients. First Recovery’s back-up data processing operations were divested in 1994. First Bancorp Financial now periodically purchases parcels of real estate from the Bank that were acquired through foreclosure or from branch closings. First Bancorp Financial actively pursues the sale of these properties.
First Bancorp Capital Trust I was organized in October 2002 for the purpose of issuing $20.6 million in debt securities. These borrowings are due on November 7, 2032 and are structured as trust preferred capital securities, which qualify as capital for regulatory capital adequacy requirements. These debt securities are callable by the Company at par on any quarterly interest payment date beginning on November 7, 2007. The interest rate on these debt securities adjusts on a quarterly basis at a rate of three-month LIBOR plus 3.45%. This rate may not exceed 12.50% through November 2007.
First Bancorp Capital Trust II and First Bancorp Capital Trust III were organized in December 2003 for the purpose of issuing $20.6 million in debt securities ($10.3 million were issued from each trust). These borrowings are due on December 19, 2033 and are also structured as trust preferred capital securities in order to qualify as
regulatory capital. These debt securities are callable by the Company at par on any quarterly interest payment date beginning on January 23, 2009. The interest rate on these debt securities adjusts on a quarterly basis at a weighted average rate of three-month LIBOR plus 2.70%.
First Bancorp Capital Trust IV was organized in April 2006 for the purpose of issuing $25.8 million in debt securities. These borrowings are due on June 15, 2036 and are structured as trust preferred capital securities, which qualify as capital for regulatory capital adequacy requirements. These debt securities are callable by the Company at par on any quarterly interest payment date beginning on June 15, 2011. The interest rate on these debt securities adjusts on a quarterly basis at a rate of three-month LIBOR plus 1.39%.
Territory Served and Competition
The Company’s headquarters are located in Troy, Montgomery County, North Carolina. The Company serves primarily the south central area of the Piedmont region of North Carolina. The following table presents, for each county where the Company operates, the number of bank branches operated by the Company within the county at December 31, 2006, the approximate amount of deposits with the Company in the county as of December 31, 2006, the Company’s approximate market share at June 30, 2006, and the number of bank competitors located in the county at June 30, 2006.
County | | No. of Branches | | Deposits (in millions) | | Market Share | | Number of Competitors |
| Anson, NC | | 1 | | $ | 12 | | | | 4.5 | % | | | 4 | |
| Brunswick, NC | | 2 | | | 4 | | | | - | | | | 10 | |
| Cabarrus, NC | | 2 | | | 31 | | | | 1.9 | % | | | 11 | |
| Chatham, NC | | 2 | | | 48 | | | | 9.7 | % | | | 9 | |
| Davidson, NC | | 3 | | | 115 | | | | 6.2 | % | | | 10 | |
| Dillon, SC | | 3 | | | 68 | | | | 25.5 | % | | | 2 | |
| Duplin, NC | | 3 | | | 64 | | | | 11.8 | % | | | 7 | |
| Guilford, NC | | 1 | | | 47 | | | | 0.4 | % | | | 25 | |
| Harnett, NC | | 3 | | | 110 | | | | 11.8 | % | | | 7 | |
| Iredell, NC | | 2 | | | 27 | | | | 1.1 | % | | | 16 | |
| Lee, NC | | 4 | | | 171 | | | | 21.4 | % | | | 7 | |
| Montgomery, NC | | 5 | | | 92 | | | | 36.0 | % | | | 4 | |
| Montgomery, VA | | 1 | | | 12 | | | | 0.9 | % | | | 10 | |
| Moore, NC | | 11 | | | 344 | | | | 25.0 | % | | | 10 | |
| New Hanover, NC | | 2 | | | 5 | | | | - | | | | 16 | |
| Pulaski, VA | | 1 | | | 19 | | | | - | | | | 7 | |
| Randolph, NC | | 4 | | | 58 | | | | 3.6 | % | | | 15 | |
| Richmond, NC | | 1 | | | 30 | | | | 7.5 | % | | | 6 | |
| Robeson, NC | | 5 | | | 143 | | | | 15.0 | % | | | 10 | |
| Rockingham, NC | | 1 | | | 20 | | | | 1.6 | % | | | 10 | |
| Rowan, NC | | 2 | | | 46 | | | | 3.1 | % | | | 12 | |
| Scotland, NC | | 2 | | | 47 | | | | 15.5 | % | | | 5 | |
| Stanly, NC | | 4 | | | 92 | | | | 10.3 | % | | | 6 | |
| Wake, NC | | 1 | | | 15 | | | | 0.1 | % | | | 26 | |
| Washington, VA | | 1 | | | 35 | | | | 2.8 | % | | | 13 | |
| Wythe, VA | | 1 | | | 41 | | | | 8.1 | % | | | 9 | |
| Total | | 68 | | $ | 1,696 | | | | | | | | | |
| | | | | | | | | | | | | | | | |
The Company’s 68 branches and facilities are primarily located in small communities whose economies are based primarily on services, manufacturing and light industry. Although the Company’s market is predominantly small communities and rural areas, the market area is not dependent on agriculture. Textiles, furniture, mobile homes, electronics, plastic and metal fabrication, forest products, food products, chicken hatcheries, and cigarettes are among the leading manufacturing industries in the trade area. Leading producers of lumber, socks, hosiery and area rugs are located in Montgomery County. The Pinehurst area within Moore County is a widely known golf resort and retirement area. The High Point area is widely known for its furniture market. New
Hanover and Brunswick Counties are in the southeastern coastal region of North Carolina, which are popular with tourists and have significant retirement populations. Additionally, several of the communities served by the Company are “bedroom” communities of large cities like Charlotte, Raleigh and Greensboro, while several branches are located in medium-sized cities such as Albemarle, Asheboro, High Point, Southern Pines and Sanford. The Company also has branches in small communities such as Bennett, Polkton, Vass, and Harmony.
Approximately 20% of the Company’s deposit base is in Moore County, and approximately 10% is in Lee County, and, accordingly, material changes in competition, the economy or population of Moore or Lee counties could materially impact the Company. No other county comprises more than 10% of the Company’s deposit base.
The Company competes in its various market areas with, among others, several large interstate bank holding companies that are headquartered in North Carolina. These large competitors have substantially greater resources than the Company, including broader geographic markets, higher lending limits and the ability to make greater use of large-scale advertising and promotions. A significant number of interstate banking acquisitions have taken place in the past decade, thus further increasing the size and financial resources of some of the Company’s competitors, three of which are among the largest bank holding companies in the nation. In many of the Company’s markets, the Company also competes against banks that have been organized within the past ten years. These new banks often focus on loan and deposit balance sheet growth, and not necessarily on earnings profitability. This strategy often allows them to offer more attractive terms on loans and deposits than the Company is able to offer because the Company must achieve an acceptable level of profitability. Moore County, which as noted above comprises a disproportionate share of the Company’s deposits, is a particularly competitive market, with at least ten other financial institutions having a physical presence. See “Supervision and Regulation” below for a further discussion of regulations in the Company’s industry that affect competition.
The Company competes not only against banking organizations, but also against a wide range of financial service providers, including federally and state-chartered savings and loan institutions, credit unions, investment and brokerage firms and small-loan or consumer finance companies. One of the credit unions in the Company’s market area is among the largest in the nation. Competition among financial institutions of all types is virtually unlimited with respect to legal ability and authority to provide most financial services. The Company also experiences competition from internet banks, particularly in the area of time deposits.
However, the Company believes it has certain advantages over its competition in the areas it serves. The Company seeks to maintain a distinct local identity in each of the communities it serves and actively sponsors and participates in local civic affairs. Most lending and other customer-related business decisions can be made without delays often associated with larger systems. Additionally, employment of local managers and personnel in various offices and low turnover of personnel enable the Company to establish and maintain long-term relationships with individual and corporate customers.
Lending Policy and Procedures
Conservative lending policies and procedures and appropriate underwriting standards are high priorities of the Bank. Loans are approved under the Bank’s written loan policy, which provides that lending officers, principally branch managers, have authority to approve loans of various amounts up to $250,000. Each of the Bank’s regional senior lending officers has discretion to approve secured loans in principal amounts up to $350,000 and together can approve loans up to $3,000,000. Lending limits may vary depending upon whether the loan is secured or unsecured.
The Bank’s board of directors reviews and approves loans that exceed management’s lending authority, loans to executive officers, directors, and their affiliates and, in certain instances, other types of loans. New credit extensions are reviewed daily by the Bank’s senior management and at least monthly by its board of directors.
The Bank continually monitors its loan portfolio to identify areas of concern and to enable management to take corrective action. Lending officers and the board of directors meet periodically to review past due loans and portfolio quality, while assuring that the Bank is appropriately meeting the credit needs of the communities it serves. Individual lending officers are responsible for pursuing collection of past-due amounts and monitoring any changes in the financial status of borrowers.
The Bank also contracts with an independent consulting firm to review new loan originations meeting certain criteria, as well as to assign risk grades to existing credits meeting certain thresholds. The consulting firm’s observations, comments, and risk grades, including variances with the Bank’s risk grades, are shared with the audit committee of the Company’s board of directors, and are considered by management in setting Bank policy, as well as in evaluating the adequacy of the allowance for loan losses. The consulting firm also provides training on a periodic basis to the Company’s loan officers to keep them updated on current developments in the marketplace. For additional information, see “Allowance for Loan Losses and Loan Loss Experience” under Item 7 below.
Investment Policy and Procedures
The Company has adopted an investment policy designed to optimize the Company’s income from funds not needed to meet loan demand in a manner consistent with appropriate liquidity and risk objectives. Pursuant to this policy, the Company may invest in federal, state and municipal obligations, federal agency obligations, public housing authority bonds, industrial development revenue bonds, the Federal Home Loan Bank, Fannie Mae, Government National Mortgage Association, Freddie Mac, Student Loan Marketing Association securities, and, to a limited extent, corporate bonds. Except for corporate bonds, the Company’s investments must be rated at least Baa by Moody’s or BBB by Standard and Poor’s. Securities rated below A are periodically reviewed for creditworthiness. The Company may purchase non-rated municipal bonds only if such bonds are in the Company’s general market area and determined by the Company to have a credit risk no greater than the minimum ratings referred to above. Industrial development authority bonds, which normally are not rated, are purchased only if they are judged to possess a high degree of credit soundness to assure reasonably prompt sale at a fair value. The Company is also authorized by its board of directors to invest a portion of its security portfolio in high quality corporate bonds, with the amount of bonds related to any one issuer not to exceed the Company’s legal lending limit. Prior to purchasing a corporate bond, the Company’s management performs due diligence on the issuer of the bond, and the purchase is not made unless the Company believes that the purchase of the bond bears no more risk to the Company than would an unsecured loan to the same company.
The Company’s investment officer implements the investment policy, monitors the investment portfolio, recommends portfolio strategies and reports to the Company’s investment committee. Reports of all purchases, sales, issuer calls, net profits or losses and market appreciation or depreciation of the bond portfolio are reviewed by the Company’s board of directors each month. Once a quarter, the Company’s interest rate risk exposure is evaluated by its board of directors. Once a year, the written investment policy is reviewed by the board of directors, and the Company’s portfolio is compared with the portfolios of other companies of comparable size.
Mergers and Acquisitions
As part of its operations, the Company has pursued an acquisition strategy over the years to augment its internal growth. The Company regularly evaluates the potential acquisition of or merger with various financial institutions. The Company’s acquisitions to date have generally fallen into one of three categories - 1) an acquisition of a financial institution or branch thereof within a market in which the Company operates, 2) an acquisition of a financial institution or branch thereof in a market contiguous or nearly contiguous to a market in which the Company operates, or 3) an acquisition of a company that has products or services that the Company does not currently offer.
The Company believes that it can enhance its earnings by pursuing these types of acquisition opportunities through any combination or all of the following: 1) achieving cost efficiencies, 2) enhancing the acquiree’s earnings or gaining new customers by introducing a more successful banking model with more products and services to the acquiree’s market base, 3) increasing customer satisfaction or gaining new customers by providing more locations for the convenience of customers, and 4) leveraging the Company’s customer base by offering new products and services.
Since 2000, the Company has completed acquisitions in all three categories described above. During that time, the Company has 1) completed three whole-bank acquisitions, with one being in the existing market area and the other two being in contiguous markets, with assets totaling approximately $500 million, 2) purchased ten bank branches from other banks (both in the existing market area and in contiguous/nearly contiguous markets) with total assets of approximately $250 million, and 3) acquired two insurance agencies, which provided the Company with the ability to offer property and casualty insurance coverage.
There are many factors that the Company considers when evaluating how much to offer for potential acquisition candidates - in the form of a purchase price comprised of cash and/or stock for a whole company purchase or a deposit premium in a branch purchase. Most significantly, the Company compares expectations of future earnings per share on a stand-alone basis with projected future earnings per share assuming completion of the acquisition under various pricing scenarios. Significant assumptions that affect this analysis include the estimated future earnings stream of the acquisition candidate, the amount of cost efficiencies that can be realized, and the interest rate earned/lost on the cash received/paid. In addition to the earnings per share comparison, the Company also considers other factors including (but not limited to): marketplace acquisition statistics, location of the candidate in relation to the Company’s expansion strategy, market growth potential, management of the candidate, potential integration issues (including corporate culture), and the size of the acquisition candidate.
The Company plans to continue to evaluate acquisition opportunities that could potentially benefit the Company and its shareholders. These opportunities may include acquisitions that do not fit the categories discussed above.
For a further discussion of recent acquisition activity, see “Merger and Acquisition Activity” under Item 7 below.
Employees
As of December 31, 2006, the Company had 579 full-time and 82 part-time employees. The Company is not a party to any collective bargaining agreements and considers its employee relations to be good.
Supervision and Regulation
As a bank holding company, the Company is subject to supervision, examination and regulation by the Board of Governors of the Federal Reserve System (the “Federal Reserve Board”) and the North Carolina Office of the Commissioner of Banks (the “Commissioner”). The Bank is subject to supervision and examination by the Federal Deposit Insurance Corporation (the “FDIC”) and the Commissioner. For additional information, see also Note 15 to the consolidated financial statements.
Supervision and Regulation of the Company
The Company is a bank holding company within the meaning of the Bank Holding Company Act of 1956, as amended. The Company is also regulated by the Commissioner under the Bank Holding Company Act of 1984.
A bank holding company is required to file quarterly reports and other information regarding its business operations and those of its subsidiaries with the Federal Reserve Board. It is also subject to examination by the Federal Reserve Board and is required to obtain Federal Reserve Board approval prior to making certain
acquisitions of other institutions or voting securities. The Commissioner is empowered to regulate certain acquisitions of North Carolina banks and bank holding companies, issue cease and desist orders for violations of North Carolina banking laws, and promulgate rules necessary to effectuate the purposes of the North Carolina Bank Holding Company Act of 1984.
Regulatory authorities have cease and desist powers over bank holding companies and their nonbank subsidiaries where their actions would constitute a serious threat to the safety, soundness or stability of a subsidiary bank. Those authorities may compel holding companies to invest additional capital into banking subsidiaries upon acquisitions or in the event of significant loan losses or rapid growth of loans or deposits.
National and state banks are also authorized by the Act to engage, through “financial subsidiaries,” in any activity that is permissible for a financial holding company (as described below) and any activity that the Secretary of the Treasury, in consultation with the Federal Reserve Board, determines is financial in nature or incidental to any such financial activity, except (i) insurance underwriting, (ii) real estate development or real estate investment activities (unless otherwise permitted by law), (iii) insurance company portfolio investments and (iv) merchant banking. The authority of a national or state bank to invest in a financial subsidiary is subject to a number of conditions, including, among other things, requirements that the bank be well-managed and well-capitalized (after deducting from the bank’s capital outstanding investments in financial subsidiaries).
The United States Congress and the North Carolina General Assembly have periodically considered and adopted legislation that has resulted in, and could result in further, deregulation of both banks and other financial institutions. Such legislation could modify or eliminate geographic restrictions on banks and bank holding companies and current restrictions on the ability of banks to engage in certain nonbanking activities. For example, in 1999, the U.S. enacted legislation that allowed bank holding companies to engage in a wider range of non-banking activities, including greater authority to engage in securities and insurance activities. Under the Gramm-Leach-Bliley Act (the “Act”), a bank holding company that elects to become a financial holding company may engage in any activity that the Federal Reserve Board, in consultation with the Secretary of the Treasury, determines by regulation or order is (i) financial in nature, (ii) incidental to any such financial activity, or (iii) complementary to any such financial activity and does not pose a substantial risk to the safety or soundness of depository institutions or the financial system generally. The Act made significant changes in U.S. banking law, principally by repealing certain restrictive provisions of the 1933 Glass-Steagall Act. The Act lists certain activities that are deemed to be financial in nature, including lending, exchanging, transferring, investing for others, or safeguarding money or securities; underwriting and selling insurance; providing financial, investment, or economic advisory services; underwriting, dealing in or making a market in, securities; and any activity currently permitted for bank holding companies by the Federal Reserve Board under Section 4(c)(8) of the Bank Holding Company Act. The Act does not authorize banks or their affiliates to engage in commercial activities that are not financial in nature. A bank holding company may elect to be treated as a financial holding company only if all depository institution subsidiaries of the holding company are well-capitalized, well-managed and have at least a satisfactory rating under the Community Reinvestment Act. At the present time, the Company does not anticipate applying for status as a financial holding company under the Act. This and other legislative and regulatory changes have increased the ability of financial institutions to expand the scope of their operations, both in terms of services offered and geographic coverage. Such legislative changes have placed the Company in more direct competition with other financial institutions, including mutual funds, securities brokerage firms, insurance companies, investment banking firms, and internet banks. The Company cannot predict what other legislation might be enacted or what other regulations might be adopted or, if enacted or adopted, the effect thereof on the Company’s business.
After the September 11, 2001 terrorist attacks in New York and Washington, D.C., the United States government acted in several ways to tighten control on activities perceived to be connected to money laundering and terrorist funding. A series of orders were issued that identify terrorists and terrorist organizations and require the blocking of property and assets of, as well as prohibiting all transactions or dealings with, such terrorists, terrorist organizations and those that assist or sponsor them. The USA Patriot Act substantially broadened
existing anti-money laundering legislation and the extraterritorial jurisdiction of the United States, imposed new compliance and due diligence obligations, created new crimes and penalties, compelled the production of documents located both inside and outside the United States, including those of foreign institutions that have a correspondent relationship in the United States, and clarified the safe harbor from civil liability to customers. In addition, the United States Treasury Department issued regulations in cooperation with the federal banking agencies, the Securities and Exchange Commission, the Commodity Futures Trading Commission and the Department of Justice to require customer identification and verification, expand the money-laundering program requirement to the major financial services sectors, including insurance and unregistered investment companies, such as hedge funds, and facilitate and permit the sharing of information between law enforcement and financial institutions, as well as among financial institutions themselves. The United States Treasury Department also has created the Treasury USA Patriot Act Task Force to work with other financial regulators, the regulated community, law enforcement and consumers to continually improve the regulations. The Company has established policies and procedures to ensure compliance with the USA Patriot Act.
In 2002, the Sarbanes-Oxley Act was signed into law. The Sarbanes-Oxley Act represents a comprehensive revision of laws affecting corporate governance, accounting obligations and corporate reporting. The Sarbanes-Oxley Act is applicable to all companies with equity or debt securities registered under the Securities Exchange Act of 1934, as amended. In particular, the Sarbanes-Oxley Act established: (i) new requirements for audit committees, including independence, expertise, and responsibilities; (ii) additional responsibilities regarding financial statements for the Chief Executive Officer and Chief Financial Officer of the reporting company; (iii) new standards for auditors and regulation of audits; (iv) increased disclosure and reporting obligations for the reporting company and their directors and executive officers; and (v) new and increased civil and criminal penalties for violation of the securities laws. The most significant expense associated with compliance with the Sarbanes-Oxley Act has been the internal control documentation and attestation requirements of Section 404 of the Act. The Company’s incremental external costs associated with complying with Section 404 of the Sarbanes-Oxley Act amounted to approximately $305,000, $832,000 and $193,000, for the years ended December 31, 2006, 2005, and 2004 respectively. The incremental costs relate to higher external audit fees and outside consultant fees. These amounts do not include the value of the significant internal resources devoted to compliance.
Supervision and Regulation of the Bank
Federal banking regulations applicable to all depository financial institutions, among other things: (i) provide federal bank regulatory agencies with powers to prevent unsafe and unsound banking practices; (ii) restrict preferential loans by banks to “insiders” of banks; (iii) require banks to keep information on loans to major shareholders and executive officers and (iv) bar certain director and officer interlocks between financial institutions.
As a state-chartered bank, the Bank is subject to the provisions of the North Carolina banking statutes and to regulation by the Commissioner. The Commissioner has a wide range of regulatory authority over the activities and operations of the Bank, and the Commissioner’s staff conducts periodic examinations of the Bank and its affiliates to ensure compliance with state banking regulations. Among other things, the Commissioner regulates the merger and consolidation of state-chartered banks, the payment of dividends, loans to officers and directors, recordkeeping, types and amounts of loans and investments, and the establishment of branches. The Commissioner also has cease and desist powers over state-chartered banks for violations of state banking laws or regulations and for unsafe or unsound conduct that is likely to jeopardize the interest of depositors.
The dividends that may be paid by the Bank to the Company are subject to legal limitations under North Carolina law. In addition, regulatory authorities may restrict dividends that may be paid by the Bank or the Company’s other subsidiaries. The ability of the Company to pay dividends to its shareholders is largely dependent on the dividends paid to the Company by its subsidiaries.
The Bank is a member of the FDIC, which currently insures the deposits of member banks. For this protection, each member bank pays a quarterly statutory assessment, based on its level of deposits, and is subject to the rules and regulations of the FDIC. For each of the past three years, due to the funded status of the insurance fund, the FDIC has not assessed the Bank any insurance premiums. However, in late 2006 the FDIC adopted new regulations that will result in all financial institutions, including the Bank, being assessed deposit insurance premiums ranging from 5 cents to 43 cents per $100 of assessable deposits beginning in 2007. The amount of the assessment within that range will be based on risk factors that have been established by the FDIC. Based on the specified risk factors, the Bank believes its assessment rate for 2007 will be between 5 cents and 7 cents per $100 of assessable deposits, which will result in annual insurance premium expense to the Bank of approximately $800,000 to $1.1 million based on its current deposit base. However, as part of the 2006 legislation that created the new assessment schedule, the rules provide credits to certain institutions that paid deposit insurance premiums in years prior to 1996. As a result, the Bank has received a one-time credit of $833,000 that can be used to offset FDIC insurance premiums beginning in 2007. Accordingly, the Company expects that this one-time credit will substantially offset its FDIC insurance premiums in 2007, but that there will be little, or no, remaining credit in 2008. Thus, the Company expects that its deposit insurance premium expense will increase significantly in 2008.
In addition to deposit insurance assessments, the FDIC is authorized to collect assessments against insured deposits to be paid to the Finance Corporation (FICO) to service FICO debt incurred in connection with the resolution of the thrift industry crisis the 1980s. The FICO assessment rate is adjusted quarterly. The average annual assessment rate in 2006 was 1.28 cents per $100 for insured deposits, which resulted in approximately $200,000 in expense for the Bank for 2006. For the first quarter of 2007, the FICO assessment rate for such deposits will decrease to 1.22 cents per $100 of assessable deposits.
The FDIC also is authorized to approve conversions, mergers, consolidations and assumptions of deposit liability transactions between insured banks and uninsured banks or institutions, and to prevent capital or surplus diminution in such transactions where the resulting, continuing, or assumed bank is an insured nonmember bank. In addition, the FDIC monitors the Bank’s compliance with several banking statutes, such as the Depository Institution Management Interlocks Act and the Community Reinvestment Act of 1977. The FDIC also conducts periodic examinations of the Bank to assess its compliance with banking laws and regulations, and it has the power to implement changes in or restrictions on a bank’s operations if it finds that a violation is occurring or is threatened.
Neither the Company nor the Bank can predict what other legislation might be enacted or what other regulations might be adopted, or if enacted or adopted, the effect thereof on the Bank’s operations.
See “Capital Resources and Shareholders’ Equity” under Item 7 below for a discussion of regulatory capital requirements.
Available Information
The Company maintains a corporate Internet site at www.firstbancorp.com, which contains a link within the “Investor Relations” section of the site to each of its filings with the Securities and Exchange Commission, including its annual reports on Form 10-K, its quarterly reports on Form 10-Q, its current reports on Form 8-K, and amendments to those reports filed or furnished pursuant to Section 13(a) or 15(d) of the Securities Exchange Act of 1934. These filings are available, free of charge, as soon as reasonably practicable after the Company electronically files such material with, or furnishes it to, the Securities and Exchange Commission. These filings can also be accessed at the Securities and Exchange Commission’s website located at www.sec.gov. Information included on the Company’s Internet site is not incorporated by reference into this annual report.
We are subject to interest rate risk, which could negatively impact earnings.
Net interest income is our most significant component of earnings. Our net interest income results from the difference between the yields we earn on our interest-earning assets, primarily loans and investments, and the rates that we pay on our interest-bearing liabilities, primarily deposits and borrowings. When interest rates change, the yields we earn on our interest-earning assets and the rates we pay on our interest-bearing liabilities do not necessarily move in tandem with each other because of the difference between their maturities and repricing characteristics. This mismatch can negatively impact net interest income if the margin between yields earned and rates paid narrows, as described below. Interest rate environment changes can occur at any time and are affected by many factors that are outside our control, including inflation, recession, unemployment trends, the Federal Reserve’s monetary policy, domestic and international disorder and instability in domestic and foreign financial markets.
Since mid-2004, the interest rate environment has generally been one in which short-term interest rates have risen faster than long-term interest rates. In 2006, this continued disparity resulted in short-term interest rates reaching the same level as long-term interest rates, which is referred to as a “flat yield curve.” A flat yield curve is unfavorable for us and many other financial institutions because our funding costs are generally tied to short-term interest rates, while our investment rates, in the form of securities and loans, are more closely correlated to long-term interest rates prevailing in the marketplace. The flat yield curve negatively impacted our net interest margin in 2006. However, strong growth that we achieved in loans and deposits in 2006 more than offset its negative impact, resulting in an increase in net interest income in 2006 compared to 2005. Many economists are predicting a continued flat interest rate environment in 2007, or one in which short-term interest rates rise higher than long-term interest rates. If that happens, our net interest margin will continue to experience negative pressure relative to prior periods when short-term interest rates were lower than long-term interest rates.
We face strong competition, which could hurt our business.
Our business operations are centered primarily in North Carolina, southwestern Virginia and northeastern South Carolina. Increased competition within this region may result in reduced loan originations and deposits. Ultimately, we may not be able to compete successfully against current and future competitors. Many competitors offer the types of loans and banking services that we offer. These competitors include savings associations, national banks, regional banks and other community banks. We also face competition from many other types of financial institutions, including finance companies, internet banks, brokerage firms, insurance companies, credit unions, mortgage banks and other financial intermediaries.
We compete in our market areas with several large interstate bank holding companies, including three of the largest in the nation, which are headquartered in North Carolina. These large competitors have substantially greater resources than we have, including broader geographic markets, more banking locations, higher lending limits and the ability to make greater use of large-scale advertising and promotions. Also, these institutions, particularly to the extent they are more diversified than we are, may be able to offer the same products and services that we offer at more competitive rates and prices.
We also compete in some of our market areas with many banks that have been organized within the past ten years. These new banks often focus on loan and deposit balance sheet growth, and not necessarily on earnings profitability. This strategy often allows them to offer more attractive terms on loans and deposits than we are able to offer because we must achieve an acceptable level of profitability.
Moore County, which comprises a disproportionate share of our deposits, is a particularly competitive market, with at least ten other financial institutions having a physical presence, including both large interstate
bank holding companies and recently organized banks.
Our allowance for loan losses may not be adequate to cover actual losses.
Like all financial institutions, we maintain an allowance for loan losses to provide for probable losses caused by customer loan defaults. The allowance for loan losses may not be adequate to cover actual loan losses, and in this case additional and larger provisions for loan losses would be required to replenish the allowance. Provisions for loan losses are a direct charge against income.
We establish the amount of the allowance for loan losses based on historical loss rates, as well as estimates and assumptions about future events. Because of the extensive use of estimates and assumptions, our actual loan losses could differ, possibly significantly, from our estimate. We believes that our allowance for loan losses is adequate to provide for probable losses, but it is possible that the allowance for loan losses will need to be increased for credit reasons or that regulators will require us to increase this allowance. Either of these occurrences could materially and adversely affect our earnings and profitability.
We are vulnerable to the economic conditions within the fairly small geographic region in which we operate.
Like many businesses, our overall success is partially dependent on the economic conditions in the marketplace where we operate. Our marketplace is predominately concentrated in the central Piedmont region of North Carolina. An economic downturn in this fairly small geographic region that negatively impacted our customers would likely also have an adverse impact on us. For example, an economic downturn could result in higher loan default rates and reduce the value of real estate securing those loans, which would likely increase our loan losses. At December 31, 2006, approximately 86% of our loans were secured by real estate collateral, and thus a decrease in real estate values could have an adverse impact on our operations.
We are subject to extensive regulation, which could have an adverse effect on our operations.
We are subject to extensive regulation and supervision from the North Carolina Commissioner of Banks, the FDIC, and the Federal Reserve Board. This regulation and supervision is intended primarily for the protection of the FDIC insurance fund and our depositors and borrowers, rather than for holders of our common stock. Regulatory authorities have extensive discretion in their supervisory and enforcement activities, including the imposition of restrictions on operations, the classification of our assets and determination of the level of the allowance for loan losses. Changes in the regulations that apply to us, or changes in our compliance with regulations, could have a material impact on our operations.
In the normal course of business, we process large volumes of transactions involving millions of dollars. If internal controls fail to work as expected, if systems are used in an unauthorized manner, or if employees subvert our internal controls, we could experience significant losses.
We process large volumes of transactions on a daily basis and are exposed to numerous types of operational risk. Operational risk includes the risk of fraud by persons inside or outside the company, the execution of unauthorized transactions by employees, errors relating to transaction processing and systems and breaches of the internal control system and compliance requirements. This risk of loss also includes potential legal actions that could arise as a result of an operational deficiency or as a result of noncompliance with applicable regulatory standards.
We establish and maintain systems of internal operational controls that provide us with timely and accurate information about our level of operational risk. Although not foolproof, these systems have been designed to manage operational risk at appropriate, cost-effective levels. Procedures exist that are designed to ensure that policies relating to conduct, ethics, and business practices are followed. From time to time, losses from
operational risk may occur, including the effects of operational errors. We continually monitor and improve our internal controls, data processing systems, and corporate-wide processes and procedures, but there can be no assurance that future losses will not occur.
We have a risk of loss related to our merchant credit card activities.
We process credit card transactions for approximately 575 commercial merchant clients. As these clients present us with credit card transactions authorized by their customers, we deposit funds in their checking accounts and collect the corresponding amounts due from the credit card issuer. In the event that the customer disputes the charge, we are contractually liable for any amounts legally due to the customer in the event our merchant clients do not make payment. We experienced a $1.9 million loss in 2006 as a result of this contingent liability. Although we subsequently reviewed the rest of our merchant relationships, we cannot guarantee that a similar loss will not occur again in the future.
None
The main offices of the Company, the Bank and First Bancorp Financial are owned by the Bank and are located in a three-story building in the central business district of Troy, North Carolina. The building houses administrative and bank teller facilities. The Bank’s Operations Division, including customer accounting functions, offices and operations of Montgomery Data, and offices for loan operations, are housed in two one-story steel frame buildings approximately one-half mile west of the main office. Both of these buildings are owned by the Bank. The Company operates 68 bank branches. The Company owns all its bank branch premises except 10 branch offices for which the land and buildings are leased and two branch offices for which the land is leased but the building is owned. In addition, the Company leases one loan production office. There are no options to purchase or lease additional properties. The Company considers its facilities adequate to meet current needs and believes that lease renewals or replacement properties can be acquired as necessary to meet future needs.
Item 3. Legal Proceedings
Various legal proceedings may arise in the ordinary course of business and may be pending or threatened against the Company and/or its subsidiaries. However, neither the Company nor any of its subsidiaries is involved in any pending legal proceedings that management believes could have a material effect on the consolidated financial position of the Company.
There were no tax shelter penalties assessed by the Internal Revenue Service against the Company during the year ended December 31, 2006.
Item 4. Submission of Matters to a Vote of Shareholders
No matters were submitted to a vote of shareholders during the fourth quarter of 2006.
Item 5. Market for the Registrant’s Common Stock, Related Shareholder Matters, and Issuer Purchases of Equity Securities
The Company’s common stock trades on The NASDAQ Global Select Market under the symbol FBNC. Table 22, included in “Management’s Discussion and Analysis” below, set forth the high and low market prices of the Company’s common stock as traded by the brokerage firms that maintain a market in the Company’s common stock and the dividends declared for the periods indicated. It is the Company’s current intention to continue to pay cash dividends in the future comparable to those in the recent past. See “Business - Supervision and Regulation” above and Note 15 to the consolidated financial statements for a discussion of regulatory restrictions on the Company’s payment of dividends. As of December 31, 2006, there were approximately 2,650 shareholders of record and another 3,600 shareholders whose stock is held in “street name.” There were no sales of unregistered securities during the year ended December 31, 2006.
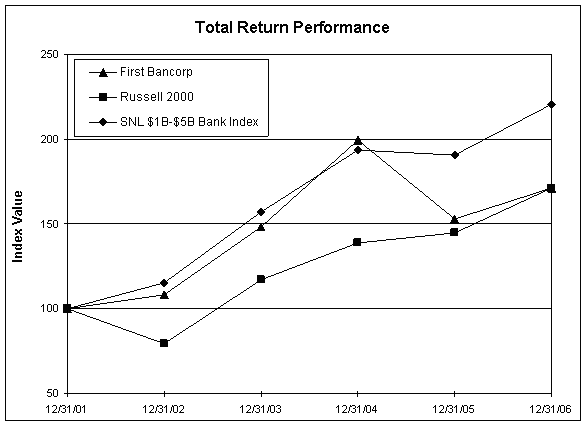
Performance Graph
The performance graph shown below compares the Company’s cumulative total return to shareholders for the five-year period commencing December 31, 2001 and ending December 31, 2006, with the cumulative total return of the Russell 2000 Index (reflecting overall stock market performance of small-capitalization companies), and an index of banks with between $1 billion and $5 billion in assets, as constructed by SNL Securities, LP (reflecting changes in banking industry stocks). The graph and table assume that $100 was invested on December 31, 2001 in each of the Company’s common stock, the Russell 2000 Index, and the SNL Bank Index, and that all dividends were reinvested.
First Bancorp
Comparison of Five-Year Total Return Performances (1)
Five Years Ending December 31, 2006
| | | Total Return Index Values (1) December 31, | |
| | | 2001 | | 2002 | | 2003 | | 2004 | | 2005 | | 2006 | |
| First Bancorp | | $ | 100.00 | | | 108.14 | | | 148.42 | | | 199.43 | | | 152.93 | | | 171.43 | |
| Russell 2000 | | | 100.00 | | | 79.52 | | | 117.09 | | | 138.55 | | | 144.86 | | | 171.47 | |
| SNL Index-Banks between $1 billion and $5 billion | | | 100.00 | | | 115.44 | | | 156.98 | | | 190.74 | | | 190.43 | | | 220.36 | |
Notes:
| (1) | Total return indices were provided from an independent source, SNL Securities LP, Charlottesville, Virginia, and assume initial investment of $100 on December 31, 2001, reinvestment of dividends, and changes in market values. Total return index numerical values used in this example are for illustrative purposes only. |
Issuer Purchases of Equity Securities
Pursuant to authorizations by the Company’s board of directors, the Company has from time to time repurchased shares of common stock in private transactions and in open-market purchases. The most recent board authorization was announced on July 30, 2004 and authorized the repurchase of 375,000 shares of the Company’s stock. During 2006, the Company repurchased a total of 53,000 shares of its own stock at an average price of $20.97 per share. As shown below, the Company did not repurchase any shares of its common stock during the three months ended December 31, 2006.
| Issuer Purchases of Equity Securities | |
Period | | Total Number of Shares Purchased (2) | | Average Price Paid per Share | | Total Number of Shares Purchased as Part of Publicly Announced Plans or Programs (1) | | Maximum Number of Shares that May Yet Be Purchased Under the Plans or Programs (1) | |
| Month #1 (October 1, 2006 to October 31, 2006) | | | – | | | | | | | | | 262,015 | |
| Month #2 (November 1, 2006 to November 30, 2006) | | | | | | | | | | | | 262,015 | |
| Month #3 (December 1, 2006 to December 31, 2006) | | | | | | | | | | | | 262,015 | |
| Total | | | | | | | | | | | | 262,015 | |
Footnotes to the Above Table
(1) Any shares repurchased would be pursuant to publicly announced share repurchase authorizations. On July 30, 2004, the Company announced that its Board of Directors had approved the repurchase of 375,000 shares of the Company’s common stock. The repurchase authorization does not have an expiration date. There are no plans or programs the issuer has determined to terminate prior to expiration, or under which the issuer does not intend to make further purchases.
(2) The table above does not include shares that were used by option holders to satisfy the exercise price of the Company’s call options issued by the Company to its employees and directors pursuant to the Company’s stock option plans. In November 2006, a total of 2,091 shares of the Company’s common stock, with a weighted average market price of $22.35 per share, were used to satisfy an exercise of options.
Item 6. Selected Consolidated Financial Data
Table 1 sets forth selected consolidated financial data for the Company.
Item 7. Management’s Discussion and Analysis of Financial Condition and Results of Operations
Management’s Discussion and Analysis is intended to assist readers in understanding the Company’s results of operations and changes in financial position for the past three years. This review should be read in conjunction with the consolidated financial statements and accompanying notes beginning on page 62 of this report and the supplemental financial data contained in Tables 1 through 22 included with this discussion and analysis. All share data for periods prior to November 15, 2004 has been adjusted from originally reported amounts to reflect the 3-for-2 stock split paid on November 15, 2004.
CRITICAL ACCOUNTING POLICIES
The accounting principles followed by the Company and the methods of applying these principles conform with accounting principles generally accepted in the United States of America and with general practices followed by the banking industry. Certain of these principles involve a significant amount of judgment and/or
use of estimates based on the Company’s best assumptions at the time of the estimation. The Company has identified three policies as being more sensitive in terms of judgments and estimates, taking into account their overall potential impact to the Company’s consolidated financial statements - 1) the allowance for loan losses, 2) tax uncertainties, and 3) intangible assets.
Allowance for Loan Losses
Due to the estimation process and the potential materiality of the amounts involved, the Company has identified the accounting for the allowance for loan losses and the related provision for loan losses as an accounting policy critical to the Company’s consolidated financial statements. The provision for loan losses charged to operations is an amount sufficient to bring the allowance for loan losses to an estimated balance considered adequate to absorb losses inherent in the portfolio.
Management’s determination of the adequacy of the allowance is based primarily on a mathematical model that estimates the appropriate allowance for loan losses. This model has two components. The first component involves the estimation of losses on loans defined as “impaired loans.” A loan is considered to be impaired when, based on current information and events, it is probable the Company will be unable to collect all amounts due according to the contractual terms of the loan agreement. The estimated valuation allowance is the difference, if any, between the loan balance outstanding and the value of the impaired loan as determined by either 1) an estimate of the cash flows that the Company expects to receive from the borrower discounted at the loan’s effective rate, or 2) in the case of a collateral-dependent loan, the fair value of the collateral.
The second component of the allowance model is to estimate losses for all loans not considered to be impaired loans. First, loans that have been risk graded by the Company as having more than “standard” risk but are not considered to be impaired are assigned estimated loss percentages generally accepted in the banking industry. Loans that are classified by the Company as having normal credit risk are segregated by loan type, and estimated loss percentages are assigned to each loan type, based on the historical losses, current economic conditions, and operational conditions specific to each loan type.
The reserve estimated for impaired loans is then added to the reserve estimated for all other loans. This becomes the Company’s “allocated allowance.” In addition to the allocated allowance derived from the model, management also evaluates other data such as the ratio of the allowance for loan losses to total loans, net loan growth information, nonperforming asset levels and trends in such data. Based on this additional analysis, the Company may determine that an additional amount of allowance for loan losses is necessary to reserve for probable losses. This additional amount, if any, is the Company’s “unallocated allowance.” The sum of the allocated allowance and the unallocated allowance is compared to the actual allowance for loan losses recorded on the books of the Company and any adjustment necessary for the recorded allowance to equal the computed allowance is recorded as a provision for loan losses. The provision for loan losses is a direct charge to earnings in the period recorded.
Although management uses the best information available to make evaluations, future adjustments may be necessary if economic, operational, or other conditions change. In addition, various regulatory agencies, as an integral part of their examination process, periodically review the Company’s allowance for loan losses. Such agencies may require the Company to recognize additions to the allowance based on the examiners’ judgment about information available to them at the time of their examinations.
For further discussion, see “Nonperforming Assets” and “Allowance for Loan Losses and Loan Loss Experience” below.
Tax Uncertainties
The Company reserves for tax uncertainties in instances when it has taken a position on a tax return that may differ from the opinion of the applicable taxing authority. In accounting for tax contingencies, the Company assesses the relative merits and risks of certain tax transactions, taking into account statutory, judicial and regulatory guidance in the context of the Company's tax position. For those matters where it is probable that the Company will have to pay additional taxes, interest or penalties and a loss or range of losses can be reasonably estimated, the Company records reserves in the consolidated financial statements. For those matters where it is reasonably possible but not probable that the Company will have to pay additional taxes, interest or penalties and the loss or range of losses can be reasonably estimated, the Company only makes disclosures in the notes and does not record reserves in the consolidated financial statements. The process of concluding that a loss is reasonably possible or probable and estimating the amount of loss or range of losses and related tax reserves is inherently subjective and future changes to the reserve may be necessary based on changes in management's intent, tax law or related interpretations, or other functions.
The section below entitled “Income Taxes” and Note 12 to the consolidated financial statements include information related to a tax loss contingency accrual that was recorded in 2005. For 2004, the Company had determined that this same tax uncertainty required disclosure, but not loss accrual.
Intangible Assets
Due to the estimation process and the potential materiality of the amounts involved, the Company has also identified the accounting for intangible assets as an accounting policy critical to the Company’s consolidated financial statements.
When the Company completes an acquisition transaction, the excess of the purchase price over the amount by which the fair market value of assets acquired exceeds the fair market value of liabilities assumed represents an intangible asset. The Company must then determine the identifiable portions of the intangible asset, with any remaining amount classified as goodwill. Identifiable intangible assets associated with these acquisitions are generally amortized over the estimated life of the related asset, whereas goodwill is tested annually for impairment, but not systematically amortized. Assuming no goodwill impairment, it is beneficial to the Company’s future earnings to have a lower amount assigned to identifiable intangible assets and higher amount of goodwill as opposed to having a higher amount considered to be identifiable intangible assets and a lower amount classified as goodwill.
For the Company, the primary identifiable intangible asset typically recorded in connection with a whole bank or bank branch acquisition is the value of the core deposit intangible, whereas when the Company acquires an insurance agency, the primary identifiable intangible asset is the value of the acquired customer list. Determining the amount of identifiable intangible assets and their average lives involves multiple assumptions and estimates and is typically determined by performing a discounted cash flow analysis, which involves a combination of any or all of the following assumptions: customer attrition/runoff, alternative funding costs, deposit servicing costs, and discount rates. The Company typically engages a third party consultant to assist in each analysis. For the whole bank and bank branch transactions recorded to date, the core deposit intangibles have generally been estimated to have a life ranging from seven to ten years, with an accelerated rate of amortization. For insurance agency acquisitions, the identifiable intangible assets related to the customer lists were determined to have a life of ten to fifteen years, with amortization occurring on a straight-line basis.
Subsequent to the initial recording of the identifiable intangible assets and goodwill, the Company amortizes the identifiable intangible assets over their estimated average lives, as discussed above. In addition, on at least an annual basis, goodwill is evaluated for impairment by comparing the fair value of the Company’s reporting units to their related carrying value, including goodwill (the Company’s community banking operation is its only
material reporting unit). At its last evaluation, the fair value of the Company’s community banking operation exceeded its carrying value, including goodwill. If the carrying value of a reporting unit were ever to exceed its fair value, the Company would determine whether the implied fair value of the goodwill, using a discounted cash flow analysis, exceeded the carrying value of the goodwill. If the carrying value of the goodwill exceeded the implied fair value of the goodwill, an impairment loss would be recorded in an amount equal to that excess. Performing such a discounted cash flow analysis would involve the significant use of estimates and assumptions.
The Company reviews identifiable intangible assets for impairment whenever events or changes in circumstances indicate that the carrying value may not be recoverable. The Company’s policy is that an impairment loss is recognized, equal to the difference between the asset’s carrying amount and its fair value, if the sum of the expected undiscounted future cash flows is less than the carrying amount of the asset. Estimating future cash flows involves the use of multiple estimates and assumptions, such as those listed above.
MERGER AND ACQUISITION ACTIVITY
The Company did not complete any acquisitions in 2004 or 2005. The Company completed two branch purchases in 2006, as follows:
(a) On July 7, 2006, the Company completed the purchase of a branch of First Citizens Bank located in Dublin, Virginia. The Company assumed the branch’s $21 million in deposits and did not purchase any loans in this transaction. The primary reason for this acquisition was to increase the Company’s presence in southwestern Virginia, a market in which the Company already had three branches with a large customer base. The Company paid a deposit premium for the branch of approximately $994,000, all of which is deductible for tax purposes. The identifiable intangible asset associated with the fair value of the core deposit base, as determined by an independent consulting firm, was determined to be $269,000 and is being amortized as expense on an accelerated basis over an eight year period based on an amortization schedule provided by the consulting firm. The weighted-average amortization period is approximately 2.2 years. The remaining intangible asset of $725,000 has been classified as goodwill, and thus is not being systematically amortized, but rather is subject to an annual impairment test. The primary factor that contributed to a purchase price that resulted in recognition of goodwill was the Company��s desire to expand its presence in southwestern Virginia with facilities, operations and experienced staff in place. This branch’s operations are included in the accompanying Consolidated Statements of Income beginning on the acquisition date of July 7, 2006. Historical pro forma information is not presented due to the immateriality of this transaction to the overall consolidated financial statements of the Company.
(b) On September 1, 2006, the Company completed the purchase of a branch of Bank of the Carolinas in Carthage, North Carolina. The Company assumed the branch’s $24 million in deposits and $6 million in loans. The primary reason for this acquisition was to increase the Company’s presence in Moore County, a market in which the Company already had ten branches with a large customer base. The Company paid a deposit premium for the branch of approximately $1,768,000, all of which is deductible for tax purposes. The identifiable intangible asset associated with the fair value of the core deposit base, as determined by an independent consulting firm, was determined to be approximately $235,000 and is being amortized as expense on an accelerated basis over a thirteen year period based on an amortization schedule provided by the consulting firm. The weighted-average amortization period is approximately 3.2 years. The remaining intangible asset of $1,533,000 has been classified as goodwill, and thus is not being systematically amortized, but rather is subject to an annual impairment test. The primary factor that contributed to a purchase price that resulted in recognition of goodwill was the Company’s desire to expand in an existing high-growth market with facilities, operations and experienced staff in place. This branch’s operations are included in the accompanying Consolidated Statements of Income beginning on the acquisition date of September 1, 2006. Historical pro forma information is not presented due to the immateriality of this transaction to the overall consolidated financial statements of the Company.
See Note 2 and Note 6 to the consolidated financial statements for additional information regarding intangible assets.
ANALYSIS OF RESULTS OF OPERATIONS
Net interest income, the “spread” between earnings on interest-earning assets and the interest paid on interest-bearing liabilities, constitutes the largest source of the Company’s earnings. Other factors that significantly affect operating results are the provision for loan losses, noninterest income such as service fees and noninterest expenses such as salaries, occupancy expense, equipment expense and other overhead costs, as well as the effects of income taxes.
2006 Compared to 2005
Overview - Net income was 20.0% higher in 2006 than in 2005. Both years had unusual items of expense that negatively impacted earnings. In 2006, a merchant credit card loss totaling $1.9 million, or $0.08 per diluted share (after-tax) negatively impacted earnings, while in 2005, the Company recorded a tax loss related to an unfavorable state tax audit amounting to $4.3 million, or $0.30 per diluted share. Excluding those items, net income would have been essentially unchanged in 2006 compared to 2005. The positive impact on earnings of high growth in loans and deposits during 2006 was offset by a lower net interest margin and higher expenses that were associated with the Company’s growth.
| Financial Highlights | | | | | | | |
| ($ in thousands except per share data) | | 2006 | | 2005 | | Change |
| | | | | | | | |
| Earnings | | | | | | | | | | |
| Net interest income | | $ | 74,536 | | | 68,591 | | | 8.7 | % |
| Provision for loan losses | | | 4,923 | | | 3,040 | | | 61.9 | % |
| Noninterest income | | | 14,310 | | | 15,004 | | | -4.6 | % |
| Noninterest expenses | | | 53,198 | | | 47,636 | | | 11.7 | % |
| Income before income taxes | | | 30,725 | | | 32,919 | | | -6.7 | % |
| Income tax expense | | | 11,423 | | | 16,829 | | | -32.1 | % |
| Net income | | $ | 19,302 | | | 16,090 | | | 20.0 | % |
| | | | | | | | | | | |
| Net income per share | | | | | | | | | | |
| Basic | | $ | 1.35 | | | 1.14 | | | 18.4 | % |
| Diluted | | | 1.34 | | | 1.12 | | | 19.6 | % |
| | | | | | | | | | | |
| At Year End | | | | | | | | | | |
| Assets | | $ | 2,136,624 | | | 1,801,050 | | | 18.6 | % |
| Loans | | | 1,740,396 | | | 1,482,611 | | | 17.4 | % |
| Deposits | | | 1,695,679 | | | 1,494,577 | | | 13.5 | % |
| | | | | | | | | | | |
| Ratios | | | | | | | | | | |
| Return on average assets | | | 1.00 | % | | 0.94 | % | | | |
| Return on average equity | | | 11.83 | % | | 10.39 | % | | | |
| Net interest margin (taxable-equivalent) | | | 4.18 | % | | 4.33 | % | | | |
The following is a more detailed discussion of the Company’s results for 2006 compared to 2005:
Net income for the year ended December 31, 2006 amounted to $19,302,000, or $1.34 per diluted share, compared to net income of $16,090,000, or $1.12 per diluted share, reported for 2005. Results for 2006 include the write-off loss during the second and third quarters of a merchant credit card receivable amounting to $1,900,000, which had an after-tax impact of $1,149,000, or $0.08 per diluted share, on the Company’s earnings for 2006. Results for 2005 include a loss accrual related to income tax exposure amounting to $4,338,000, or $0.30 per diluted share. See additional discussion in the section entitled “Income Taxes” below.
The Company experienced strong balance sheet growth in 2006. Total assets at December 31, 2006 amounted to $2.14 billion, 18.6% higher than a year earlier. Total loans at December 31, 2006 amounted to $1.74 billion, an increase of $258 million, or 17.4%, from a year earlier. Total deposits amounted to $1.70 billion at December 31, 2006, an increase of $201 million, or 13.5%, from a year earlier. Virtually all of the loan growth was internally-generated, whereas approximately $44 million of the deposit growth was the result of two branch acquisitions that were completed in the third quarter of 2006. Total shareholders’ equity amounted to $162.7 million at December 31, 2006, a 4.5% increase from a year earlier. Shareholders’ equity was negatively impacted at December 31, 2006 by the Company’s adoption of new pension plan accounting rules (FASB Statement 158) that resulted in an increase in pension liabilities of $6.0 million, an increase in assets (primarily deferred tax assets) in the amount of $2.2 million, and a reduction to shareholders’ equity of $3.8 million.
The growth in loans and deposits was the primary reason for increases in the Company’s net interest income when comparing 2006 to 2005. Net interest income for the year ended December 31, 2006 amounted to $74.5 million, an 8.7% increase over the $68.6 million recorded in 2005. The impact of the growth in loans and deposits on the Company’s net interest income was partially offset by declines in the Company’s net interest margin (tax-equivalent net interest income divided by average earning assets). The Company’s net interest margin for the year ended December 31, 2006 was 4.18% compared to 4.33% for 2005. The compressing margin was primarily due to 1) deposit rates paid by the Company rising by more than loan and investment yields, which is largely associated with the flat interest rate yield curve currently prevailing in the marketplace, and 2) the negative impact of the Company having more of its overall funding occurring in its highest cost funding sources, which is a result of a need to fund high loan growth, as well as customers shifting their funds from low cost deposits to higher cost deposits as interest rates have risen.
The Company’s provision for loan losses for 2006 was $4,923,000, an increase of 61.9% over the $3,040,000 recorded in 2005. The higher loss provision was primarily the result of higher loan growth realized in 2006 compared to 2005, and to a lesser extent an increase in the level of the Company’s nonperforming assets. Net internal loan growth was $252 million for 2006 compared to $116 million for 2005.
The Company’s ratio of net charge-offs to average loans was 11 basis points in 2006 compared to 14 basis points in 2005. The Company’s level of nonperforming assets amounted to $8.4 million at December 31, 2006 compared to $3.1 million at December 31, 2005. This increase was primarily the result of the December 31, 2005 level of nonperforming assets being unusually low. The low level of nonperforming assets was the result of several of the Company's largest nonaccrual loan relationships being reduced to zero in the fourth quarter of 2005, either as a result of cash received or the loan being charged-off. This resulted in the amount of the Company's nonperforming loans at December 31, 2005 reaching its lowest level in over five years. In 2006, the Company experienced more typical activity within its nonaccrual loan category, and the amount of nonaccrual loans increased to a more normal level. The Company’s nonperforming assets to total assets ratio was 0.39% at December 31, 2006 compared to 0.17% at December 31, 2005. This ratio averaged 0.34% for each of the five year ends from 2000-2004.
Noninterest income for 2006 amounted to $14.3 million, a decrease of 4.6% from the $15.0 million recorded in 2005. The decrease in the 2006 amount was caused by a $1.9 million write-off loss of a merchant credit card receivable. See the section entitled “Noninterest Income” below for a discussion of this matter.
Noninterest expenses for 2006 amounted to $53.2 million, an 11.7% increase from the $47.6 million recorded in 2005. The increase in noninterest expenses is primarily attributable to costs associated with the Company’s overall growth in loans, deposits and branch network. Since January 1, 2005, the Company’s loans and deposits have increased by 27% and 22%, respectively, and the Company’s branch network has increased from 59 branches to 68 branches. Additionally, in accordance with the new accounting requirements regarding stock-based compensation (FASB Statement 123(R)) that were effective on January 1, 2006, the Company recorded stock option expense of $325,000 ($246,000 after-tax effect) for the year ended December 31, 2006. As permitted by previous accounting standards, no stock option expense was recorded by the Company in 2005, or any prior periods.
The Company’s effective tax rate was 37% for the year ended December 31, 2006. As noted above, the Company’s income tax expense in 2005 was significantly impacted by a tax loss accrual recorded in the third quarter of 2005 and a partial reversal of this accrual recorded in the fourth quarter of 2005. See additional discussion in the section entitled “Income Taxes” below.
2005 Compared to 2004
Overview - Net income was 20.0% lower in 2005 than in 2004. In 2005, the Company recorded a tax loss related to an unfavorable state tax audit amounting to $4.3 million, or $0.30 per diluted share that significantly impacted earnings. Balance sheet growth was generally in the 7%-10% range, which resulted in an increase in income before income tax expense of approximately 8%.
| Financial Highlights | | | | | | | |
| ($ in thousands except per share data) | | 2005 | | 2004 | | Change |
| | | | | | | | |
| Earnings | | | | | | | | | | |
| Net interest income | | $ | 68,591 | | | 61,290 | | | 11.9 | % |
| Provision for loan losses | | | 3,040 | | | 2,905 | | | 4.6 | % |
| Noninterest income | | | 15,004 | | | 15,864 | | | -5.4 | % |
| Noninterest expenses | | | 47,636 | | | 43,717 | | | 9.0 | % |
| Income before income taxes | | | 32,919 | | | 30,532 | | | 7.8 | % |
| Income tax expense | | | 16,829 | | | 10,418 | | | 61.5 | % |
| Net income | | $ | 16,090 | | | 20,114 | | | -20.0 | % |
| | | | | | | | | | | |
| Net income per share | | | | | | | | | | |
| Basic | | $ | 1.14 | | | 1.42 | | | -19.7 | % |
| Diluted | | | 1.12 | | | 1.40 | | | -20.0 | % |
| | | | | | | | | | | |
| At Year End | | | | | | | | | | |
| Assets | | $ | 1,801,050 | | | 1,638,913 | | | 9.9 | % |
| Loans | | | 1,482,611 | | | 1,367,053 | | | 8.5 | % |
| Deposits | | | 1,494,577 | | | 1,388,768 | | | 7.6 | % |
| | | | | | | | | | | |
| Ratios | | | | | | | | | | |
| Return on average assets | | | 0.94 | % | | 1.30 | % | | | |
| Return on average equity | | | 10.39 | % | | 13.71 | % | | | |
| Net interest margin (taxable-equivalent) | | | 4.33 | % | | 4.31 | % | | | |
The following is a more detailed discussion of the Company’s results for 2005 compared to 2004:
Net income for the year ended December 31, 2005 amounted to $16,090,000, or $1.12 per diluted share, a 20.0% decrease from the net income of $20,114,000, or $1.40 per diluted share, reported for 2004. The annual earnings for 2005 were significantly impacted by a contingency loss accrual related to income tax exposure amounting to $4,338,000 (after-tax), or $0.30 per diluted share. The Company originally accrued $6,320,000, or $0.44 per diluted share, related to this loss exposure in the third quarter of 2005. In March 2006, prior to filing its financial statements, the Company reversed $1,982,000, or $0.14 per diluted share, of this accrual, effective for the fourth quarter of 2005, as a result of a change in the loss estimate. See additional discussion in the section entitled “Income Taxes” below.
Total assets at December 31, 2005 amounted to $1.80 billion, 9.9% higher than a year earlier. Total loans at December 31, 2005 amounted to $1.48 billion, an increase of $116 million, or 8.5%, from a year earlier. Total deposits amounted to $1.49 billion at December 31, 2005, an increase of $106 million, or 7.6%, from a year earlier. Deposit growth would have been higher had the Company not paid off, without renewing, $50 million in brokered deposits that were outstanding at December 31, 2004 and matured during 2005. The Company had no brokered deposits outstanding at December 31, 2005.
The growth in loans and deposits was the primary reason for the increase in the Company’s net interest income when comparing 2004 to 2005. Net interest income for the year ended December 31, 2005 amounted to $68.6 million, an 11.9% increase over the $61.3 million recorded in 2004. The Company’s net interest margin (tax-equivalent net interest income divided by average earning assets) realized for 2005 was 4.33% compared to 4.31% for 2004. The rising interest rate environment had a positive effect on the Company’s net interest margin, but the positive effects were largely offset by the mix of the Company’s deposit growth being more concentrated in the categories of time deposits and time deposits greater than $100,000. Time deposits are generally a high cost category of funds for the Company. However, their increased usage has been necessary in order to fund loan growth.
The Company’s provision for loan losses did not vary significantly in 2005 compared to 2004, amounting to $3,040,000 in 2005 compared to $2,905,000 in 2004. The ratio of net-charge offs to average loans for 2005 was 0.14%, which is the same as it was for 2004. At December 31, 2005, the Company’s nonperforming assets to total assets ratio was 0.17% compared to 0.32% at the prior year end, and was the lowest it has been at any year end since the Company became publicly held in 1985.
Noninterest income for 2005 amounted to $15.0 million, a decrease of 5.4% from the $15.9 million recorded in 2004. The decrease in 2005 is partly a result of lower service charges on deposit accounts. Service charges on deposit accounts decreased primarily as a result of the negative impact that higher short term interest rates had on the service charges that the Company earns from its commercial depositors - in the Company’s commercial account service charge rate structure, commercial depositors are given “earnings credits” (negatively impacting service charges) on their average deposit balances that are tied to short term interest rates. Also, in 2005 the Company recorded significantly lower “securities gains” and “other gains” compared to 2004. In 2005, the Company recorded a combined net loss of $258,000 for these two line items compared to a net gain of $648,000 in 2004, a negative change of $906,000.
Noninterest expenses in 2005 amounted to $47.6 million, a 9.0% increase from the $43.7 million recorded in 2004. The increase in noninterest expenses was primarily attributable to costs associated with the Company’s overall growth in loans, deposits and branch network. Also, the Company’s Sarbanes-Oxley compliance costs amounted to $832,000 in 2005 compared to $193,000 in 2004.
The Company’s income tax expense for 2005 of $16.8 million includes the previously discussed contingency tax loss accrual of $4.3 million. During periods that did not include this accrual, the Company’s effective tax rate in 2005 was approximately 38%-39% compared to approximately 34%-35% in 2004. The higher effective
tax rate in 2005 compared to 2004 is the result of the Company discontinuing, effective January 1, 2005, the operating structure involving a real estate investment trust (REIT) that gave rise to the 2005 contingency tax loss accrual.
Net Interest Income
Net interest income on a reported basis amounted to $74,536,000 in 2006, $68,591,000 in 2005, and $61,290,000 in 2004. For internal purposes and in the discussion that follows, the Company evaluates its net interest income on a tax-equivalent basis by adding the tax benefit realized from tax-exempt securities to reported interest income. Net interest income on a tax-equivalent basis amounted to $75,037,000 in 2006, $69,039,000 in 2005, and $61,765,000 in 2004. Management believes that analysis of net interest income on a tax-equivalent basis is useful and appropriate because it allows a comparison of net interest amounts in different periods without taking into account the different mix of taxable versus non-taxable investments that may have existed during those periods. The following is a reconciliation of reported net interest income to tax-equivalent net interest income.
| | | Year ended December 31, | |
($ in thousands) | | 2006 | | 2005 | | 2004 | |
| Net interest income, as reported | | $ | 74,536 | | | 68,591 | | | 61,290 | |
| Tax-equivalent adjustment | | | 501 | | | 448 | | | 475 | |
| Net interest income, tax-equivalent | | $ | 75,037 | | | 69,039 | | | 61,765 | |
Table 2 analyzes net interest income on a tax-equivalent basis. The Company’s net interest income on a taxable-equivalent basis increased by 8.7% in 2006 and 11.8% in 2005. There are two primary factors that cause changes in the amount of net interest income recorded by the Company - 1) growth in loans and deposits, and 2) the Company’s net interest margin (tax-equivalent net interest income divided by average interest-earning assets). In 2006, growth in loans and deposits increased net interest income, the positive effects of which were partially offset by a lower net interest margin. In 2005, growth in loans and deposits was the primary cause of higher net interest income, as the Company’s net interest margin did not change significantly.
The Company’s loans outstanding grew by 17.4% and 8.5% in 2006 and 2005 respectively, while deposits increased 13.5% in 2006 and 7.6% in 2005. As illustrated in Table 3, in both 2006 and 2005, net interest income was positively impacted by this growth (increased volume). In both years, the positive impact on net interest income of growth in interest-earning assets, primarily loans, more than offset the higher interest expense associated with funding the asset growth. In 2006, growth in interest-earning asset volumes resulted in an increase in interest income of $14.1 million, while growth in interest-bearing liabilities only resulted in $6.9 million in higher interest expense. In 2005, growth in interest-earning asset volumes resulted in an increase in interest income of $9.0 million, while growth in interest-bearing liabilities only resulted in $3.2 million in higher interest expense. As a result, balance sheet growth resulted in an increase in tax-equivalent net interest income of $7.2 million in 2006 and $5.8 million in 2005. For analysis regarding the nature of the Company’s loan and deposit growth, see “Analysis of Financial Condition and Changes in Financial Condition” below.
Table 3 also illustrates the impact that changes in the rates that the Company earned/paid had on the Company’s net interest income in 2005 and 2006. Since July 2004, the Federal Reserve has increased interest rates 17 times totaling 425 basis points. The rising rate environment has resulted in higher levels of interest income and interest expense. In 2006, the higher interest rates resulted in an increase in interest expense of $14.9 million compared to an increase in interest income of only $13.7 million, which resulted in a reduction in net interest income by $1.2 million. In 2005, the rising interest rates resulted in an increase of $10.7 million in interest income, while the impact on interest expense was only $9.3 million, which resulted in an increase to net interest income of $1.5 million.
The Company measures the spread between the yield on its earning assets and the cost of its funding primarily in terms of the ratio entitled “net interest margin” which is defined as tax-equivalent net interest income divided by average earning assets. The Company’s net interest margin decreased in 2006 after increasing slightly in 2005, amounting to 4.18% in 2006, 4.33% in 2005, and 4.31% in 2004.
In 2006, the Company’s lower net interest margin was primarily due to 1) deposit rates paid by the Company rising by more than loan and investment yields, which is largely associated with the flat interest rate yield curve currently prevailing in the marketplace, and 2) the negative impact of the Company having more of its overall funding occurring in its highest cost funding sources, which is a result of a need to fund high loan growth, as well as customers shifting their funds from low cost deposits to higher cost deposits as interest rates have risen. As derived from Table 2, in 2006, the yield earned on loans, the Company’s primary earning asset, increased by only 82 basis points (from 6.62% to 7.44%) while the average rate paid on other time deposits, the Company’s largest deposit category, increased by 123 basis points (from 2.86% to 4.09%). The difference in these increases negatively impacted the Company’s net interest margin and was largely a result of short-term interest rates prevailing in the market place increasing faster than long-term interest rates - with short-term interest rates being approximately the same as long-term interest rates at December 31, 2006 (commonly referred to as a “flat yield curve”). A flat yield curve is unfavorable for the Company because the Company’s funding costs are generally tied to short-term interest rates, while its investment rates on earning assets, in the form of securities and loans, are more closely correlated to long-term interest rates prevailing in the marketplace.
Also, as can be derived from Table 2, during 2006, the Company’s highest cost funding sources (time deposits, borrowings and securities sold under agreements to repurchase) comprised 60.5% of its total funding (total interest-bearing liabilities plus non-interest bearing deposits), an increase from 57.6% in 2005. As noted above, this shift to higher cost funding sources has been partially a result of the need to fund high loan growth, as well as it is the Company’s observation that some customers have shifted their funds from low cost deposits to higher cost deposits as interest rates have risen. In addition to the increases in balances experienced in high cost funding sources, the lowest cost category of interest-bearing deposits - Savings, NOW and Money Market Deposits - experienced more rate sensitivity than it has historically. The average interest rate paid on this category of deposits rose 61 basis points in 2006 (from 0.86% to 1.47%) compared to an increase of only 32 basis points in 2005. The 2006 increase is almost entirely due to the Company’s introduction in late 2005 of a high interest rate money market account (4.25% for most of 2006) that was created to compete with area competitors. The average balance of this category of deposits increased $65 million in 2006 compared to a $52 million decrease in average balances in the other lower cost accounts in this category of deposits. The Company believes that a large portion of the $52 million decrease in the lower cost accounts was the result of a shift to the high rate account.
In 2005, the Company’s net interest margin was positively impacted by the rising interest rate environment, which at that time was still positively sloped - meaning long-term interest rates where higher than short term interest rates. The positive effects of the rising interest rates were largely offset by the mix of the Company’s deposit growth being more concentrated in the categories of time deposits and time deposits greater than $100,000. As derived from Table 2, in 2005 the yield earned on loans, the Company’s primary earning asset, increased by 75 basis points, from 5.87% to 6.62%, while the average rate paid on savings, NOW and money market accounts, the Company’s largest deposit category in those years, increased by only 32 basis points (from 0.54% to 0.86%). The difference in these increases positively impacted the Company’s net interest margin. However, 82% of the Company’s average deposit growth in 2005 was comprised of time deposits, which are a high cost category of funds for the Company and incrementally result in lower net interest margins for the Company. In addition to being a high cost source of funds for the Company, this category of deposits is typically more price-sensitive than the Company’s other deposit categories, repricing upward by a greater amount in a rising rate environment than the Company’s other deposits. In 2005, the average rate paid on time deposits greater than $100,000 increased by 92 basis points, from 2.34% to 3.26%, while the average rate paid for all other time deposits increased by 82 basis points, from 2.04% to 2.86%. The higher growth in time deposits was necessary in order to fund the Company’s loan growth. The positive and negative factors discussed above mostly offset each other, resulting in a two basis point increase in net interest margin for 2005 - from 4.31% in 2004 to 4.33% in 2005.
From 2002 to 2004, the Company gradually positioned itself to be protected in a rising interest rate environment by originating more variable rate loans than fixed rate loans - a rising interest rate environment was forecasted by most economists after the steeply declining interest rate environment that began in 2001 and concluded with interest rates being at their lowest levels in 40 years during 2004. This initiative resulted in the Company’s loan mix changing from 57% fixed rate and 43% variable rate at December 31, 2001 to 60% variable rate and 40% fixed rate at December 31, 2004. In 2005, most economists began to forecast that the steadily increasing interest rate environment in effect since mid-2004 would end in 2006. As a result, in 2005 and 2006 the Company began originating a more even mix of fixed rate loans and variable rate loans, which resulted in the Company’s fixed/variable mix shifting to 51% variable rate and 49% fixed rate at December 31, 2006.
See additional information regarding net interest income in the section entitled “Interest Rate Risk.”
Provision for Loan Losses
The provision for loan losses charged to operations is an amount sufficient to bring the allowance for loan losses to an estimated balance considered appropriate to absorb probable losses inherent in the portfolio. Management’s determination of the adequacy of the allowance is based on the level of loan growth, an evaluation of the portfolio, current economic conditions, historical loan loss experience and other risk factors.
The provision for loan losses recorded by the Company amounted to $4,923,000 in 2006, compared to $3,040,000 in 2005 and $2,905,000 in 2004. The increase in the provision for loan losses in 2006 from 2005 was primarily the result of higher loan growth realized in 2006 compared to 2005, and to a lesser extent an increase in the level of the Company’s nonperforming assets. The Company’s net internal loan growth was $252 million in 2006, $116 million in 2005, and $148 million in 2004. There was no acquired loan growth in 2004 or 2005. In 2006, there was acquired growth of $6 million, for which a preexisting allocation for loan losses was already in place.
See the section entitled “Allowance for Loan Losses and Loan Loss Experience” below for a more detailed discussion of the allowance for loan losses. The allowance is monitored and analyzed regularly in conjunction with the Company’s loan analysis and grading program, and adjustments are made to maintain an adequate allowance for loan losses.
Noninterest Income
Noninterest income recorded by the Company amounted to $14,310,000 in 2006, $15,004,000 in 2005, and $15,864,000 in 2004.
As shown in Table 4, core noninterest income, which excludes gains and losses from sales of securities, loans, and other assets, amounted to $16,204,000 in 2006, a 6.2% increase from $15,262,000 in 2005. The 2005 core noninterest income of $15,262,000 was 0.3% higher than the $15,216,000 recorded in 2004.
See Table 4 and the following discussion for an understanding of the components of noninterest income.
Service charges on deposit accounts in 2006 amounted to $8,968,000, a 5.0% increase compared to $8,537,000 recorded in 2005. The $8,537,000 recorded in 2005 was 5.8% less than the 2004 amount of $9,064,000. The decrease from 2004 to 2005 was primarily the result of lower checking account service charge fees that the Company earned from its commercial customers due to the increase in short term interest rates. In the Company’s commercial account service charge rate structure, commercial depositors are given “earnings credits” (negatively impacting service charges) on their average deposit balances that are tied to short term interest rates. Beginning in February 2006, the Company changed the index for these credits to one based on a money market rate that was
lower than the previous rate and less susceptible to volatile changes, while still being competitive in the marketplace. This change in the index negated the impact of rising interest rates in 2006, effectively stabilizing this category of income for the Company. The 5.0% increase in service charges on deposit accounts in 2006 is primarily associated with the Company’s overall growth.
Other service charges, commissions and fees amounted to $4,578,000 in 2006, a 15.5% increase from the $3,963,000 earned in 2005. The 2005 amount of $3,963,000 was 17.9% higher than the $3,361,000 recorded in 2004. This category of noninterest income includes items such as credit card interchange income related to merchants and customers, debit card interchange income, ATM charges, safety deposit box rentals, fees from sales of personalized checks, and check cashing fees. This category of income grew in 2005 and 2006 primarily because of increases in these activity-related fee services as a result of the increased acceptance and popularity of debit cards, special credit and debit card promotions that increased their use, and the overall growth in the Company’s total customer base, including growth achieved from corporate acquisitions. The gross fees that the Company earned from debit card interchange income amounted to $1,023,000 in 2006, a $326,000, or 47%, increase from the $697,000 earned in 2005. The 2005 amount was $81,000 higher than the $616,000 earned in 2004.
Fees from presold mortgages amounted to $1,062,000 in 2006, $1,176,000 in 2005, and $969,000 in 2004. Fees from presold mortgages peaked in 2003 ($2,327,000 recorded in 2003) as a result of a high level of mortgage loan refinancings brought on by low mortgage interest rates. Since that time, the absence of the initial wave of refinancing activity and higher adjustable rate mortgage rates have resulted in the Company’s fees from presold mortgages decreasing from the 2003 level and averaging approximately $200,000-$300,000 per quarter over each of the past three years.
Commissions from sales of insurance and financial products have remained steady over the past three years - amounting to $1,434,000 in 2006, $1,307,000 in 2005, and $1,406,000 in 2004. This line item includes commissions the Company receives from three sources - 1) sales of credit life insurance associated with new loans, 2) commissions from the sales of investment, annuity, and long-term care insurance products, and 3) commissions from the sale of property and casualty insurance. The following table presents the contribution of each of the three sources to the total amount recognized in this line item:
($ in thousands) | | 2006 | | 2005 | | 2004 | |
| Commissions earned from: | | | | | | | |
| Sales of credit life insurance | | $ | 337 | | | 308 | | | 291 | |
| Sales of investments, annuities, and long term care insurance | | | 266 | | | 193 | | | 291 | |
| Sales of property and casualty insurance | | | 831 | | | 806 | | | 824 | |
| Total | | $ | 1,434 | | | 1,307 | | | 1,406 | |
Data processing fees amounted to $162,000 in 2006, $279,000 in 2005, and $416,000 in 2004. As noted earlier, Montgomery Data makes its excess data processing capabilities available to area financial institutions for a fee. The decrease in data processing fees in 2005 is a result of two of the five customers terminating their services with Montgomery Data and switching to another provider. During 2006, one other customer terminated its service, which left Montgomery Data with two outside customers as of December 31, 2006. Montgomery Data intends to continue to market this service to area banks, but does not currently have any near-term prospects for additional business.
Noninterest income not considered to be “core” amounted to a net loss of $1,894,000 in 2006, a net loss of $258,000 in 2005, and a net gain of $648,000 in 2004. In Table 4, the line item entitled “other gains (losses), net” totaling $2,099,000 in 2006 includes a loss of $1,900,000 related to the write-off loss of a merchant credit card
receivable. During the second quarter of 2006, the Company discovered that it had liability associated with a customer that sold furniture over the internet. The furniture store did not deliver furniture that its customers had ordered and paid for, and was unable to immediately refund their credit card purchases. As the furniture store’s credit card processor, the Company became contractually liable for the amounts that were required to be refunded. During the second quarter of 2006, the furniture store changed management, stated its intention to repay the Company for all funds advanced, and began making repayments to the Company. At June 30, 2006, the Company recorded a $230,000 loss to reserve for this situation. During the third quarter of 2006, the furniture store’s financial condition deteriorated significantly. Accordingly, the Company determined that it should fully reserve for the entire $1.9 million exposure associated with this situation, which resulted in recording an additional loss of $1,670,000. The owners of the furniture store continue to state their intent to repay the Company, but at this time their ability to do so is uncertain. During the third quarter of 2006, the Company completed a review of all merchant credit card customers and concluded that this situation appears to be an isolated event that is not likely to recur.
Also included in “other gains (losses), net” is normal write-downs of tax credit partnership investments amounting to $295,000, $189,000 and $70,000 in 2006, 2005, and 2004, respectively. The Company projects $323,000 of tax credit investment write-downs in 2007. Tax credit write-downs have increased as a result of additional investments made in tax credit partnerships. The Company’s total investment in tax credit partnerships amounted to $1.6 million, $1.1 million and $0.8 million at December 31, 2006, 2005, and 2004, respectively. To date, all tax credit write-downs have been exceeded, and are projected to continue to be exceeded, by the amount of tax credits realized and recorded as a reduction of income tax expense.
Miscellaneous gains (losses) related primarily to property sales are also included in the “Other gains (losses), net” line item and totaled $96,000, ($83,000), and $417,000 in 2006, 2005, and 2004, respectively.
The Company realized net securities gains of $205,000, $5,000, and $299,000 in 2006, 2005 and 2004, respectively. These sales were initiated primarily to realize current income.
Noninterest Expenses
Noninterest expenses for 2006 were $53,198,000, compared to $47,636,000 in 2005 and $43,717,000 in 2004. Table 5 presents the components of the Company’s noninterest expense during the past three years.
Based on the amounts noted above, noninterest expenses increased 11.7% in 2006 and 9.0% in 2005. The increases in noninterest expenses over the past three years have occurred in nearly every line item of expense and have been primarily a result of the significant growth experienced by the Company. Over the past three years, the number of the Company’s branches has increased from 57 to 68, and the number of full time equivalent employees has increased from 550 at December 31, 2003 to 620 at December 31, 2006. Additionally, from December 31, 2003 to December 31, 2006, the amount of loans outstanding increased 42.8% and deposits increased 35.7%. The Company’s noninterest expenses were also impacted by external costs associated with complying with Section 404 of the Sarbanes-Oxley Act. The Company’s incremental external costs associated with complying with Section 404 amounted to approximately $305,000, $832,000 and $193,000 for the years ended December 31, 2006, 2005, and 2004 respectively. The incremental costs relate to higher external audit fees and outside consultant fees. These amounts do not include the value of the significant internal resources devoted to compliance.
From 2004-2006, the Company was not required to pay any FDIC deposit insurance premiums. As discussed above in “Supervision and Regulation of the Bank”, in 2006 the FDIC modified its rules relating to the assessment of deposit insurance premiums, and these changes are expected to significantly increase the Company’s FDIC deposit insurance expense beginning in 2008.
Income Taxes
The provision for income taxes was $11,423,000 in 2006, $16,829,000 in 2005, and $10,418,000 in 2004.
Table 6 presents the components of tax expense and the related effective tax rates. The effective tax rate for 2006 was 37.2% compared to 51.1% in 2005 and 34.1% in 2004. The high effective tax rate of 51.1% in 2005 is primarily a result of the contingency loss accrual discussed in the following paragraph. During periods in 2005 that did not include contingency loss accrual matters, the Company’s effective tax rate was approximately 38%-39% compared to approximately 34%-35% in 2004. The higher effective tax rate in 2006 and 2005 (excluding the contingency accrual) compared to 2004 is the result of the Company discontinuing, effective January 1, 2005, the operating structure involving a real estate investment trust (REIT) that gave rise to the contingency tax accrual. The Company recorded nonrecurring adjustments in the third quarter of 2006 and the fourth quarter of 2004 amounting to $182,000 and $89,000, respectively, that reduced otherwise reported income tax expense. The Company expects its effective tax rate to be in the 37%-38% range for the foreseeable future.
In 1999, in consultation with the Company’s tax advisors, the Company established an operating structure involving a real estate investment trust (REIT) that resulted in a reduction in the Company’s state tax liability to the state of North Carolina. In late 2004, the North Carolina Department of Revenue indicated that it would challenge taxpayers engaged in activities deemed to be “income-shifting,” and they indicated that they believed certain REIT operating structures were a type of “income-shifting.” During 2005, the North Carolina Department of Revenue began an audit of the Company’s tax returns for 2001-2004, which represented all years eligible for audit. In the third quarter of 2005, based on consultations with the Company’s external auditor and legal counsel, the Company determined that it should record a $6.3 million loss accrual to reserve for this issue, which was comprised of $8.6 million in estimated liability related to taxes due, interest and penalty, less $2.3 million in related federal tax benefit. In February 2006, the North Carolina Department of Revenue announced a “Settlement Initiative” that offered companies with certain transactions, including those with a REIT operating structure, the opportunity to resolve such matters with reduced penalties by agreeing to participate in the initiative by June 15, 2006. Although the Company believes that its tax returns complied with the relevant statutes, the board of directors of the Company decided that it was in the best interest of the Company to settle this matter by participating in the initiative. Based on the terms of the initiative, the Company estimated that its total liability to settle the matter would be approximately $6.4 million, or $4.3 million net of the federal tax benefit, which was $2.0 million less than the amount that was originally accrued. Accordingly, in March 2006, the Company retroactively recorded an adjustment to its fourth quarter of 2005 earnings to reverse $2.0 million of tax expense. The aspects of the REIT structure that gave rise to this issue were discontinued effective January 1, 2005, and thus the Company does not believe it has any additional exposure related to this item beyond the amount of the accrual other than ongoing interest on the unpaid taxes amounting to $100,000 per quarter ($65,000 after-tax). Under the terms of the initiative, March 15, 2007 is the deadline for payment of the amount due to the North Carolina Department of Revenue, and the Company expects to pay the state the amount due ($6.9 million, which includes $0.5 million in interest that has accrued since December 31, 2005) by that date.
Stock-Based Compensation
For all years prior to 2006, the Company was not required to record any expense for the value of stock options granted to employees or directors. As discussed in more detail in Note 1(t) to the consolidated financial statements, a new accounting standard (“Statement 123(R)”, as defined below) required the Company to record the value of stock options as an expense in the income statement beginning January 1, 2006. Based on the requirement of Statement 123(R), the Company recorded compensation expense of $325,000, or $246,000 net of taxes, in 2006 related to stock option grants. Note 14 to the consolidated financial statements contains pro forma net income and earnings per share information as if the Company applied the fair value recognition provisions required by the new standard in 2004 and 2005. Note 14 indicates that the Company’s stock-based employee compensation expense would have been $335,000 and $1,291,000, for the two years ended December 31, 2005, and 2004, respectively.
The significantly higher expense in 2004 compared to 2005 is primarily due to the Company granting 128,000 employee options in April 2004 with immediate vesting (under the new standard, expense related to the fair market value of options is recognized when the options vest). Prior to that grant, all previous employee option grants had five year vesting periods (20% vesting each year), and thus the amount of expense related to options was generally spread over the five year vesting period. The Compensation Committee of the board of directors of the Company granted the April 2004 options without any vesting requirements for two reasons - 1) the options were granted primarily as a reward for past performance and therefore had already been “earned” in the view of the Committee, and 2) to potentially minimize the impact that any change in accounting standards for stock options could have on future years’ reported net income.
In 2007, 2008, and 2009 the Company’s stock-based compensation expense related to options currently outstanding will be approximately $47,000, $3,000, and $3,000 respectively. There is no tax benefit related to any of those expenses. New stock options that are granted and vest after January 1, 2007 will increase the amount of stock-based compensation expense recorded by the Company. Except for grants to directors (see below), the Company cannot estimate the amount of future stock option grants at this time. In the past, stock option grants to employees have been irregular, generally falling into three categories - 1) to attract and retain new employees, 2) to recognize changes in responsibilities of existing employees, and 3) to periodically reward exemplary performance. The Company expects to continue to grant 2,250 stock options to each of the Company’s non-employee directors in June of each year until the 2014 expiration of the current stock option plan. In 2006, the amount of expense associated with the June director grants was $199,000, or $121,000 net of taxes.
ANALYSIS OF FINANCIAL CONDITION AND CHANGES IN FINANCIAL CONDITION
Overview
Over the past two years, the Company has achieved steady increases in its levels of loans and deposits, which has resulted in an increase in assets from $1.6 billion at December 31, 2004 to $2.1 billion at December 31, 2006. This growth has been both internally generated and acquired. During the third quarter of 2006, the Company completed the acquisition of two branches, while the Company did not complete any acquisitions in 2005. The following table presents detailed information regarding the nature of the Company’s growth in 2005 and 2006:
(in thousands) | | Balance at beginning of period | | Internal growth | | Growth from Acquisitions | | Change in brokered deposits | | Balance at end of period | | Total percentage growth | | Internal growth (1) |
| 2006 | | | | | | | | | | | | | | | | |
| Loans | | $ | 1,482,611 | | | 252,036 | | | 5,749 | | | | | | 1,740,396 | | | 17.4 | % | | | 17.0 | % |
| | | | | | | | | | | | | | | | | | | | | | | | |
| Deposits - Noninterest bearing | | | 194,051 | | | 18,266 | | | 4,974 | | | | | | 217,291 | | | 12.0 | % | | | 9.4 | % |
| Deposits - Savings, NOW, and Money Market | | | 458,221 | | | 32,663 | | | 11,891 | | | | | | 502,775 | | | 9.7 | % | | | 7.1 | % |
| Deposits - Time>$100,000 | | | 356,281 | | | 61,692 | | | 4,799 | | | | | | 422,772 | | | 18.7 | % | | | 17.3 | % |
| Deposits - Time<$100,000 | | | 486,024 | | | 44,504 | | | 22,313 | | | | | | 552,841 | | | 13.7 | % | | | 9.2 | % |
| Total deposits | | $ | 1,494,577 | | | 157,125 | | | 43,977 | | | | | | 1,695,679 | | | 13.5 | % | | | 10.5 | % |
| | | | | | | | | | | | | | | | | | | | | | | | |
| 2005 | | | | | | | | | | | | | | | | | | | | | | | |
| Loans | | $ | 1,367,053 | | | 115,558 | | | | | | | | | 1,482,611 | | | 8.5 | % | | | 8.5 | % |
| | | | | | | | | | | | | | | | | | | | | | | | |
| Deposits - Noninterest bearing | | | 165,778 | | | 28,273 | | | | | | | | | 194,051 | | | 17.1 | % | | | 17.1 | % |
| Deposits - Savings, NOW, and Money Market | | | 472,811 | | | (14,590 | ) | | | | | | | | 458,221 | | | (3.1 | %) | | | (3.1 | %) |
| Deposits - Time>$100,000 | | | 334,756 | | | 71,398 | | | | | | (49,873 | ) | | 356,281 | | | 6.4 | % | | | 21.3 | % |
| Deposits - Time<$100,000 | | | 415,423 | | | 70,601 | | | | | | | | | 486,024 | | | 17.0 | % | | | 17.0 | % |
| Total deposits | | $ | 1,388,768 | | | 155,682 | | | | | | (49,873 | ) | | 1,494,577 | | | 7.6 | % | | | 11.2 | % |
| |
| (1) Excludes the impact of acquisitions and brokered deposits. |
As shown in the table above, the Company experienced internal loan growth of 17.0% and 8.5%, in 2006 and 2005, respectively. The especially strong growth experienced in 2006 was partially due to the Company’s recent expansion into Mooresville, North Carolina, a high growth market near Charlotte, and the Company’s expansion into the coastal North Carolina counties of New Hanover County and Brunswick County. Loan growth in these markets amounted to $75 million in 2006.
Total deposits increased 7.6% in 2005 and 13.5% in 2006. Excluding changes in brokered deposits and acquisitions, the Company’s deposit growth rate was 10%-11% in both 2005 and 2006. The Company had no brokered deposits outstanding at December 31, 2005 or 2006. In both 2005 and 2006, the Company achieved its highest growth in time deposits, particularly time deposits in denominations greater than $100,000. Time deposits, especially time deposits greater than $100,000, are generally the easiest type of deposit to achieve growth in through the use of promotional interest rates. The Company offered promotional interest rates in 2005 and 2006 in order to help fund the strong loan growth experienced both years.
Over the past few years, including 2005 and 2006, the Company’s loan growth has exceeded its deposit growth and to a greater extent exceeded its retail deposit growth (which excludes time deposits greater than $100,000). The Company believes the higher internal growth rates for loans compared to retail deposits over the past two years is largely attributable to the type of customers the Company has been able to attract. Most of the Company’s loan
growth has come from small-business customers that need loans in order to expand their business, and have few deposits. Additionally, the Company has found it difficult to compete for retail deposits in recent years. The Company frequently competes against banks in the marketplace that either 1) are so large that they enjoy better economies of scale over the Company and can thus offer higher rates, or 2) are recently started banks that are focused on building market share, and not necessarily on positive earnings, by offering high deposit rates. The Company believes it enjoys advantages in the loan marketplace by having seasoned lenders in place that have the experience necessary to oversee the completion of a loan and the autonomy to be able to make timely decisions.
The Company’s liquidity did not change significantly during 2005 or 2006. Higher loan growth as compared to deposit growth in recent years has resulted in the Company’s loan to deposit ratio increasing from 98% in 2004 to 99% in 2005 to 103% in 2006. The negative impact on the Company’s liquidity due to the imbalance in loan and deposit growth has been offset by a higher level of securities sold under agreements to repurchase and borrowings. The level of the Company’s liquid assets (consisting of cash, due from banks, federal funds sold, presold mortgages in process of settlement and securities) as a percentage of deposits, securities sold under agreements to repurchase and borrowings has grown slightly over the past two years, with this ratio increasing from 13.1% in 2004 to 14.2% in 2005 to 15.1% in 2006.
In 2006, the Company’s balance sheet growth exceeded internal capital growth resulting from earnings. In order to maintain its regulatory capital ratios at internal targets in 2006, the Company issued an additional $25.8 million in trust preferred debt securities, which are includable as regulatory capital. All of the Company’s capital ratios have significantly exceeded the minimum regulatory thresholds for all periods covered by this report.
Although the Company’s primary market area, the central Piedmont region of North Carolina, has experienced economic difficulties in the past few years as a result of manufacturing job losses, the Company’s asset quality ratios have remained fairly stable over the past three years with net charge-offs to average loans ranging from 11 basis points to 14 basis points and nonperforming assets to total assets ranging from 17 basis points to 39 basis points.
Distribution of Assets and Liabilities
Table 7 sets forth the percentage relationships of significant components of the Company’s balance sheet at December 31, 2006, 2005, and 2004.
The relative size of the components of the balance sheet has not varied significantly over the past two years, with loans comprising 80%-82% of total assets and deposits comprising 79%-85%. The most significant variance in Table 7 is the 2006 increase in the percentage of borrowings, which increased from 5% at December 31, 2004 and 2005, to 10% at December 31, 2006. The Company has increasingly relied on borrowings in order to help fund the strong loan growth that has exceeded deposit growth.
Also shown in Table 7 is a decrease in the relative percentage of the Company’s balance sheet comprised of Savings, NOW and Money Market accounts. The decrease in the percentage from 29% in 2004 to 23% during 2006 is due partially to the high growth experienced in the other categories of deposits, and was also impacted by the introduction of a new product in 2005 - Securities Sold Under Agreements to Repurchase (“repurchase agreements”) - that resulted in a shift of customers’ money from savings and money market accounts to repurchase agreements, which are not classified as deposits. Repurchase agreements are similar to interest-bearing deposits and allow the Company to pay interest to business customers without statutory limitations on the number of withdrawals that these customers can make. Upon the introduction of this product in the second half of 2005, the growth in repurchase agreements to the December 31, 2005 year end balance of $33.5 million was comprised almost entirely of customer funds that had previously been held by the Company as savings or money market deposits. Repurchase agreements increased to $43.3 million as of December 31, 2006.
Securities
Information regarding the Company’s securities portfolio as of December 31, 2006, 2005, and 2004 is presented in Tables 8 and 9.
The composition of the investment securities portfolio reflects the Company’s investment strategy of maintaining an appropriate level of liquidity while providing a relatively stable source of income. The investment portfolio also provides a balance to interest rate risk and credit risk in other categories of the balance sheet while providing a vehicle for the investment of available funds, furnishing liquidity, and supplying securities to pledge as required collateral for certain deposits.
Total securities amounted to $143.1 million, $125.1 million, and $102.6 million at December 31, 2006, 2005, and 2004, respectively. The increase in securities over the past two years was primarily due to securities purchases that have been necessary to collateralize higher levels of repurchase agreements and pledged deposits, as well as to help maintain the Company’s liquidity at targeted levels. Over the past two years, the Company has elected to primarily purchase securities issued by the Federal Home Loan Bank, a government-sponsored enterprise, which, due to their non-amortizing nature, are easier to pledge than mortgage-backed securities and can be more easily purchased in shorter maturity terms than mortgage-backed securities. In recent years the Company has preferred to invest in short-term investments as a result of the generally rising rate environment.
The majority of the Company’s “government-sponsored enterprise” securities are issued by the Federal Home Loan Bank and carry one maturity date, often with an issuer call feature. The Company’s mortgage-backed securities have been primarily issued by Freddie Mac and Fannie Mae, which are government-sponsored corporations, and vary in their repayment in correlation with the underlying pools of home mortgage loans. The Company’s investment in corporate bonds is primarily comprised of trust preferred securities issued by other North Carolina bank holding companies.
Included in mortgage-backed securities at December 31, 2006 were collateralized mortgage obligations (“CMOs”) with an amortized cost of $11,898,000 and a fair value of $11,517,000. Included in mortgage-backed securities at December 31, 2005 were CMOs with an amortized cost of $15,810,000 and a fair value of $15,399,000. Included in mortgage-backed securities at December 31, 2004 were CMOs with an amortized cost of $15,928,000 and a fair value of $15,831,000. The CMOs that the Company has invested in are substantially all “early tranche” portions of the CMOs, which minimizes long-term interest rate risk to the Company.
At December 31, 2006, a net unrealized loss of $860,000 was included in the carrying value of securities classified as available for sale, compared to a net unrealized loss of $1,049,000 at December 31, 2005 and a net unrealized gain of $1,186,000 at December 31, 2004. The declining fair market value of securities available over the past three years was caused by a steadily rising interest rate environment. Higher interest rates negatively impact the value of fixed income securities. Management evaluated any unrealized losses on individual securities at each year end and determined them to be of a temporary nature and caused by fluctuations in market interest rates, not by concerns about the ability of the issuers to meet their obligations. Net unrealized gains (losses), net of applicable deferred income taxes, of ($524,000), ($639,000), and $723,000 have been reported as part of a separate component of shareholders’ equity (accumulated other comprehensive income (loss)) as of December 31, 2006, 2005, and 2004, respectively.
The fair value of securities held to maturity, which the Company carries at amortized cost, was more than the carrying value at December 31, 2006 and 2005 by $46,000 and $149,000, respectively. Management evaluated any unrealized losses on individual securities at each year end and determined them to be of a temporary nature and caused by fluctuations in market interest rates, not by concerns about the ability of the issuers to meet their obligations.
Table 9 provides detail as to scheduled contractual maturities and book yields on securities available for sale and securities held to maturity at December 31, 2006. Mortgage-backed and other amortizing securities are shown maturing in the time periods consistent with their estimated lives based on expected prepayment speeds.
The weighted average taxable-equivalent yield for the securities available for sale portfolio was 4.94% at December 31, 2006. The expected weighted average life of the available for sale portfolio using the call date for above-market callable bonds, the maturity date for all other non-mortgage-backed securities, and the expected life for mortgage-backed securities, was 4.0 years.
The weighted average taxable-equivalent yield for the securities held to maturity portfolio was 6.71% at December 31, 2006. The expected weighted average life of the held to maturity portfolio using the call date for above-market callable bonds and the maturity date for all other securities, was 4.7 years.
As of December 31, 2006 and 2005, the Company held no investment securities of any one issuer, other than government-sponsored enterprises or corporations, in which aggregate book values and market values exceeded 10% of shareholders’ equity.
Loans
Table 10 provides a summary of the loan portfolio composition at each of the past five year ends.
The loan portfolio is the largest category of the Company’s earning assets and is comprised of commercial loans, real estate mortgage loans, real estate construction loans, and consumer loans. The Company restricts virtually all of its lending to its 26 county market area, which is located in central and southeastern North Carolina, three counties in southern Virginia and Dillon County, South Carolina. The diversity of the region’s economic base has historically provided a stable lending environment.
In 2006, loans outstanding increased $257.8 million, or 17.4%, to $1.74 billion. In 2005, loans outstanding increased $115.6 million, or 8.5%, to $1.48 billion. The majority of the loan growth in 2006 was internally generated, as the Company only acquired a total of $6 million in loans from the acquisitions of two bank branches completed in 2006. All of the loan growth in 2005 was internally generated, as the Company did not complete any acquisitions during that year. The majority of the 2006 and 2005 loan growth occurred in loans secured by real estate, with approximately $224.8 million, or 87.2%, in 2006, and $94.4 million, or 81.7%, in 2005, of the net loan growth occurring in real estate mortgage or real estate construction loans.
Over the years, the Company’s loan mix has remained fairly consistent, with real estate loans (mortgage and construction) comprising approximately 86% of the loan portfolio, commercial, financial, and agricultural loans not secured by real estate comprising 9-10%, and consumer installment loans comprising 4-5% of the portfolio. The majority of the Company’s “real estate” loans are primarily various personal and commercial loans where real estate provides additional security for the loan.
At December 31, 2006, $1.500 billion, or 86.2%, of the Company’s loan portfolio was secured by liens on real property. Included in this total are $718.1 million, or 41.3% of total loans, in loans secured by liens on 1-4 family residential properties and $781.9 million, or 44.9% of total loans, in loans secured by liens on other types of real estate. At December 31, 2005, $1.275 billion, or 86.0%, of the Company’s loan portfolio was secured by liens on real property. Included in this total are $668.4 million, or 45.1% of total loans, in loans secured by liens on 1-4 family residential properties and $606.8 million, or 40.9% of total loans, in loans secured by liens on other types of real estate. The Company’s $1.500 billion in real estate mortgage loans at December 31, 2006 can be further classified as follows - for comparison purposes, the classification of the Company’s $1.275 billion real estate loan portfolio at December 31, 2005 is shown in parenthesis:
| | · | $512.8 million, or 29.5% of total loans (vs. $498.4 million, or 33.6% of total loans), are secured by first liens on residential homes, in which the borrower’s personal income is generally the primary repayment source. |
| | · | $472.6 million, or 27.2% of total loans (vs. $406.3 million, or 27.4% of total loans), are primarily dependent on cash flow from a commercial business for repayment. |
| | · | $205.3 million, or 11.8% of total loans (vs. $170.0 million, or 11.5% of total loans), are home equity loans (lines-of-credit and term loans) obtained by consumers for various purposes. |
| | · | $155.4 million, or 8.9% of total loans (vs. $125.2 million, or 8.4% of total loans), are real estate construction loans. |
| | · | $118.6 million, or 6.8% of total loans (vs. $43.4 million, or 2.9% of total loans), are tracts of unimproved land. |
| | · | $35.3 million, or 2.0% of total loans (vs. $31.9 million, or 2.2% of total loans), are primarily dependent on cash flow from agricultural crop sales. |
The above information is derived from the Bank’s quarterly regulatory report. The Company estimates that approximately half of the $75.2 million increase noted above in loans on “unimproved land” relates to a different interpretation taken by the Company in 2006 regarding the classification of loans secured by unimproved residential real estate. Prior to 2006, the Company classified these types of loans as being secured by 1-4 family mortgage loans, while in 2006, the Company began classifying these types of loans as “unimproved land.”
Table 11 provides a summary of scheduled loan maturities over certain time periods, with fixed rate loans and adjustable rate loans shown separately. Approximately 25% of the Company’s loans outstanding at December 31, 2006 mature within one year and 78% of total loans mature within five years. The percentages of variable rate loans and fixed rate loans as compared to total performing loans were 50.6% and 49.4%, respectively, as of December 31, 2006. The Company intentionally makes a blend of fixed and variable rate loans so as to reduce interest rate risk. See discussion regarding fluctuations in the Company’s ratio of fixed rate loans to variable rate loans in the section above entitled “Net Interest Income.”
Nonperforming Assets
Nonperforming assets include nonaccrual loans, loans past due 90 or more days and still accruing interest, restructured loans and other real estate. As a matter of policy the Company places all loans that are past due 90 or more days on nonaccrual basis, and thus there were no loans at any of the past five year ends that were 90 days past due and still accruing interest. Table 12 summarizes the Company’s nonperforming assets at the dates indicated.
Nonaccrual loans are loans on which interest income is no longer being recognized or accrued because management has determined that the collection of interest is doubtful. Placing loans on nonaccrual status negatively impacts earnings because (i) interest accrued but unpaid as of the date a loan is placed on nonaccrual status is reversed and deducted from interest income, (ii) future accruals of interest income are not recognized until
it becomes probable that both principal and interest will be paid and (iii) principal charged-off, if appropriate, may necessitate additional provisions for loan losses that are charged against earnings. In some cases, where borrowers are experiencing financial difficulties, loans may be restructured to provide terms significantly different from the originally contracted terms.
Nonperforming loans (which includes nonaccrual loans and restructured loans) as of December 31, 2006, 2005, and 2004 totaled $6,862,000, $1,653,000, and $3,724,000, respectively. Nonperforming loans as a percentage of total loans amounted to 0.39%, 0.11%, and 0.27%, at December 31, 2006, 2005, and 2004, respectively. The variances in the dollar amount of nonperforming loans among the periods have been primarily due to changes in nonaccrual loans, as restructured loans have not changed significantly. In the fourth quarter of 2005, the collection process for several of the Company's largest nonaccrual loan relationships reached a conclusion and their principal balances were reduced to zero either as a result of cash received or the loan being charged-off. This resulted in the amount of the Company's nonperforming loans at December 31, 2005 reaching its lowest level in over five years. In 2006, the Company experienced more typical activity within its nonaccrual loan category, and the amount of nonaccrual loans increased to more normal levels as a percentage of the total loan portfolio. The Company’s largest nonaccrual relationships at December 31, 2006 and 2005 amounted to $585,000 and $337,000, respectively.
If the nonaccrual loans and restructured loans as of December 31, 2006, 2005 and 2004 had been current in accordance with their original terms and had been outstanding throughout the period (or since origination if held for part of the period), gross interest income in the amounts of approximately $510,000, $123,000 and $247,000 for nonaccrual loans and $1,000, $2,000 and $2,000 for restructured loans would have been recorded for 2006, 2005 and 2004, respectively. Interest income on such loans that was actually collected and included in net income in 2006, 2005 and 2004 amounted to approximately $179,000, $67,000 and $120,000 for nonaccrual loans (prior to their being placed on nonaccrual status) and $1,000, $2,000 and $2,000 for restructured loans, respectively. At December 31, 2006 and 2005, the Company had no commitments to lend additional funds to debtors whose loans were nonperforming.
Management routinely monitors the status of certain large loans that, in management’s opinion, have credit weaknesses that could cause them to become nonperforming loans. In addition to the nonperforming loan amounts discussed above, management believes that an estimated $5.5-$6.0 million of loans that were performing in accordance with their contractual terms at December 31, 2006 have the potential to develop problems depending upon the particular financial situations of the borrowers and economic conditions in general. Management has taken these potential problem loans into consideration when evaluating the adequacy of the allowance for loan losses at December 31, 2006 (see discussion below).
Loans classified for regulatory purposes as loss, doubtful, substandard, or special mention that have not been disclosed in the problem loan amounts and the potential problem loan amounts discussed above do not represent or result from trends or uncertainties that management reasonably expects will materially impact future operating results, liquidity, or capital resources, or represent material credits about which management is aware of any information that causes management to have serious doubts as to the ability of such borrowers to comply with the loan repayment terms.
Other real estate includes foreclosed, repossessed, and idled properties. Other real estate has not varied materially at any of the past three year ends, amounting to $1,539,000 at December 31, 2006, $1,421,000 at December 31, 2005, and $1,470,000 at December 31, 2004. Other real estate represented approximately 0.07%-0.09% of total assets at each of the past three year ends. The Company’s management believes that the fair values of the items of other real estate, less estimated costs to sell, equal or exceed their respective carrying values at the dates presented.
Allowance for Loan Losses and Loan Loss Experience
The allowance for loan losses is created by direct charges to operations (known as a “provision for loan losses” for the period in which the charge is taken). Losses on loans are charged against the allowance in the period in which such loans, in management’s opinion, become uncollectible. The recoveries realized during the period are credited to this allowance. The Company considers its procedures for recording the amount of the allowance for loan losses and the related provision for loan losses to be a critical accounting policy. See the heading “Critical Accounting Policies” above for further discussion.
The factors that influence management’s judgment in determining the amount charged to operating expense include past loan loss experience, composition of the loan portfolio, evaluation of probable inherent losses and current economic conditions.
The Company uses a loan analysis and grading program to facilitate its evaluation of probable inherent loan losses and the adequacy of its allowance for loan losses. In this program, risk grades are assigned by management and tested by an independent third party consulting firm. The testing program includes an evaluation of a sample of new loans, loans that management identifies as having potential credit weaknesses, loans past due 90 days or more, loans originated by new loan officers, nonaccrual loans and any other loans identified during previous regulatory and other examinations.
The Company strives to maintain its loan portfolio in accordance with what management believes are conservative loan underwriting policies that result in loans specifically tailored to the needs of the Company’s market areas. Every effort is made to identify and minimize the credit risks associated with such lending strategies. The Company has no foreign loans, few agricultural loans and does not engage in significant lease financing or highly leveraged transactions. Commercial loans are diversified among a variety of industries. The majority of loans captioned in the tables discussed below as “real estate” loans are primarily various personal and commercial loans where real estate provides additional security for the loan. Collateral for virtually all of these loans is located within the Company’s principal market area.
The allowance for loan losses amounted to $18,947,000 at December 31, 2006 compared to $15,716,000 at December 31, 2005 and $14,717,000 at December 31, 2004. This represented 1.09%, 1.06%, and 1.08%, of loans outstanding as of December 31, 2006, 2005, and 2004, respectively. As noted in Table 12, the Company’s allowance for loan losses as a percentage of nonperforming loans (“coverage ratio”) amounted to 276% at December 31, 2006 compared to 951% at December 31, 2005 and 395% at December 31, 2004. Due to the secured nature of virtually all of the Company’s loans that are on nonaccrual status, the variance in the coverage ratio is not necessarily indicative of the relative adequacy of the allowance for loan losses. As noted above in “Nonperforming Assets”, the level of nonaccrual loans at December 31, 2005 was at an unusually low level, thus resulting in the higher coverage ratio for the 2005 year end.
Table 13 sets forth the allocation of the allowance for loan losses at the dates indicated. The portion of these reserves that was allocated to specific loan types in the loan portfolio increased to $18,942,000 at December 31, 2006 from $15,692,000 at December 31, 2005 and $14,643,000 at December 31, 2004. The 20.7% increase in the amount of the allocated allowance during 2006 is relatively consistent with the 17.4% increase in total loans outstanding during the year. Similarly, the 7.2% increase in the amount of the allocated allowance during 2005 is consistent with the 8.5% increase in total loans outstanding during the year. In addition to the allocated portion of the allowance for loan losses, the Company maintains an unallocated portion that is not assigned to any specific category of loans, but rather is intended to reserve for the inherent risk in the overall portfolio and the intrinsic inaccuracies associated with the estimation of the allowance for loan losses and its allocation to specific loan categories. The amount of the unallocated portion of the allowance for loan losses did not vary materially at any of the past three year ends. The allowance for loan losses is available to absorb losses in all categories.
Management considers the allowance for loan losses adequate to cover probable loan losses on the loans outstanding as of each reporting date. It must be emphasized, however, that the determination of the allowance using the Company’s procedures and methods rests upon various judgments and assumptions about economic conditions and other factors affecting loans. No assurance can be given that the Company will not in any particular period sustain loan losses that are sizable in relation to the amount reserved or that subsequent evaluations of the loan portfolio, in light of conditions and factors then prevailing, will not require significant changes in the allowance for loan losses or future charges to earnings.
In addition, various regulatory agencies, as an integral part of their examination process, periodically review the allowances for loan losses and losses on foreclosed real estate. Such agencies may require the Company to recognize additions to the allowances based on the examiners’ judgments about information available to them at the time of their examinations.
For the years indicated, Table 14 summarizes the Company’s balances of loans outstanding, average loans outstanding, and a detailed rollforward of the allowance for loan losses. In addition to the increases to the allowance for loan losses related to normal provisions, the increases in the dollar amounts of the allowance for loan losses in 2006 was also affected by amounts recorded to provide for loans assumed in corporate acquisitions. In 2006, the Company added $52,000 to the allowance for loan losses related to approximately $6 million in loans assumed in a branch acquisition.
The Company’s net loan charge-offs amounted to $1,744,000 in 2006, $2,041,000 in 2005, and $1,757,000 in 2004. This represents 0.11%, 0.14%, and 0.14% of average loans during 2006, 2005, and 2004 respectively. In each of the past five years, the Company’s net charge-off ratio has been in the range of 0.10%-0.14%.
Deposits and Securities Sold Under Agreements to Repurchase
At December 31, 2006, deposits outstanding amounted to $1.696 billion, an increase of $201 million, or 13.5%, from December 31, 2005. Approximately $157 million, or 78%, of the deposit growth in 2006 was internally generated, while the remaining $44 million, or 22%, resulted from the acquisitions of two bank branches completed in 2006. In 2005, deposits grew from $1.389 billion to $1.495 billion, an increase of $106 million, or 7.6% from December 31, 2004. There were no deposits assumed in acquisitions in 2005. The Company’s deposit growth in 2005 was negatively impacted by paying back $50 million in brokered deposits upon their maturity in 2005.
The nature of the Company’s deposit growth is illustrated in the table on page 33. The following table reflects the mix of the Company’s deposits at each of the past three year ends:
| | | 2006 | | 2005 | | 2004 | |
| Noninterest-bearing deposits | | | 13% | | | 13% | | | 12% | |
| Savings, NOW and Money Market deposits | | | 30% | | | 31% | | | 34% | |
| Time deposits > $100,000 | | | 25% | | | 24% | | | 24% | |
| Time deposits < $100,000 | | | 32% | | | 32% | | | 30% | |
| Total deposits | | | 100% | | | 100% | | | 100% | |
Securities sold under agreements to repurchase as a percent of total deposits | | | 3% | | | 2% | | | | |
The deposit mix remained relatively consistent from 2004 to 2006. Since 2004, the relative percentage of savings, NOW and money market accounts to total deposits has been impacted by the introduction of a new product in 2005 - securities sold under agreements to repurchase (“repurchase agreements”) - that resulted in a shift of customer’s money from savings and money market accounts to repurchase agreements. Repurchase agreements are similar to interest-bearing deposits and allow the Company to pay interest to business customers without statutory
limitations on the number of withdrawals that these customers can make. Upon the introduction of this product in the second half of 2005, the growth in repurchase agreements, which amounted to $33.5 million at December 31, 2005, and $43.3 million at December 31, 2006, has been largely comprised of customer funds that had previously been held by the Company as savings or money market deposits.
Table 15 presents the average amounts of deposits of the Company and the average yield paid for those deposits for the years ended December 31, 2006, 2005, and 2004.
As of December 31, 2006, the Company held approximately $422.8 million in time deposits of $100,000 or more. Table 16 is a maturity schedule of time deposits of $100,000 or more as of December 31, 2006. This table shows that 89% of the Company’s time deposits greater than $100,000 mature within one year.
At each of the past three year ends, the Company had no deposits issued through foreign offices, nor did the Company believe that it held any deposits by foreign depositors.
Borrowings
The Company had borrowings outstanding of $210.0 million at December 31, 2006 compared to $100.2 million at December 31, 2005. This increase in period end borrowings was due to a generally higher use of borrowings in 2006 in order to fund loan growth that exceeded deposit growth, and was also a result of projected temporary period end liquidity needs. As shown in Table 2, average borrowings have fluctuated over the past three years, amounting to $84.9 million in 2004, declining slightly in 2005 to $77.1 million, and then increasing to $113.4 million in 2006. In 2005, growth in average deposits ($154 million) exceeded growth in average loans ($127 million), which reduced the Company’s dependency on borrowings, whereas in 2006, the level of growth in average loans ($201 million) exceeded the growth in average deposits ($139 million).
At December 31, 2006, the Company had three sources of readily available borrowing capacity - 1) an approximately $362 million line of credit with the Federal Home Loan Bank of Atlanta (FHLB), of which $143 million was outstanding at December 31, 2006 and $59 million was outstanding at December 31, 2005, 2) a $50 million overnight federal funds line of credit with a correspondent bank, none of which was outstanding at December 31, 2006 or 2005, and 3) an approximately $74 million line of credit through the Federal Reserve Bank of Richmond’s (FRB) discount window, none of which was outstanding at December 31, 2006 or 2005.
The Company’s line of credit with the FHLB can be structured as either short-term or long-term borrowings, depending on the particular funding or liquidity need, and is secured by the Company’s FHLB stock and a blanket lien on most of its real estate loan portfolio. In addition to the outstanding borrowings from the FHLB that reduce the available borrowing capacity of the line of credit, the borrowing capacity was further reduced by $40 million at December 31, 2006 and 2005 as a result of the Company pledging letters of credit for public deposits at each of those dates.
The Company’s correspondent bank relationship allows the Company to purchase up to $50 million in federal funds on an overnight, unsecured basis (federal funds purchased). The Company had no borrowings outstanding under this line at December 31, 2006 or 2005. This line of credit was not drawn upon during any of the past three years.
The Company also has a line of credit with the FRB discount window. This line is secured by a blanket lien on a portion of the Company’s commercial and consumer loan portfolio (excluding real estate loans). Based on the collateral owned by the Company as of December 31, 2006, the available line of credit is approximately $74 million. This line of credit was established primarily in connection with the Company’s Y2K liquidity contingency plan and has not been drawn on since inception. The FRB has indicated that it would not expect lines of credit that have been granted to financial institutions to be a primary borrowing source. The Company plans to maintain this line of credit, although it is not expected that it will be drawn upon except in unusual circumstances.
In addition to the lines of credit described above, in which the Company had $143 million outstanding as of December 31, 2006, the Company also had a total of $67 million in trust preferred security debt outstanding at December 31, 2006. The Company issued $20.6 million of this debt on October 29, 2002, an additional $20.6 million on December 19, 2003, and $25.8 million on April 13, 2006. These borrowings each have 30 year final maturities and were structured as trust preferred capital securities that qualify as capital for regulatory capital adequacy requirements. These debt securities are callable by the Company at par on any quarterly interest payment date five years after their issue date. The interest rate on these debt securities adjusts on a quarterly basis at a rate of three-month LIBOR plus 3.45% for the securities issued in 2002, three-month LIBOR plus 2.70% for the securities issued in 2003, and three-month LIBOR plus 1.39% for the securities issued in 2006. The Company incurred approximately $1,195,000 in debt issuance costs related to the 2002 and 2003 issuances that were recorded as prepaid expenses that are being amortized to the earliest call dates and are included in the “Other Assets” line item of the consolidated balance sheet. No debt issuance costs were incurred with the 2006 issuance.
Average short-term borrowings for each of the past five years were less than 30% of total shareholders’ equity at all times during each period.
Liquidity, Commitments, and Contingencies
The Company’s liquidity is determined by its ability to convert assets to cash or to acquire alternative sources of funds to meet the needs of its customers who are withdrawing or borrowing funds, and its ability to maintain required reserve levels, pay expenses and operate the Company on an ongoing basis. The Company’s primary liquidity sources are net income from operations, cash and due from banks, federal funds sold and other short-term investments. The Company’s securities portfolio is comprised almost entirely of readily marketable securities which could also be sold to provide cash.
As noted above, in addition to internally generated liquidity sources, the Company has the ability to obtain borrowings from the following three sources - 1) an approximately $362 million line of credit with the FHLB, 2) a $50 million overnight federal funds line of credit with a correspondent bank, and 3) an approximately $74 million line of credit through the FRB’s discount window.
The Company’s liquidity did not change significantly during 2005 or 2006. Higher loan growth than deposit growth in recent years has resulted in the Company’s loan to deposit ratio increasing from 98% in 2004 to 99% in 2005 to 103% in 2006. The negative impact on the Company’s liquidity of the imbalance in loan and deposit growth has been offset by a higher level of securities sold under agreements to repurchase and borrowings. The level of the Company’s liquid assets (consisting of cash, due from banks, federal funds sold, presold mortgages in process of settlement and securities) as a percentage of deposits, securities sold under agreements to repurchase and borrowings has grown over the past two years, with this ratio increasing from 13.1% in 2004 to 14.2% in 2005 to 15.1% in 2006.
The Company’s management believes its liquidity sources, including unused lines of credit, are at an acceptable level and remain adequate to meet its operating needs in the foreseeable future. The Company will continue to monitor its liquidity position carefully and will explore and implement strategies to increase liquidity if deemed appropriate.
In the normal course of business there are various outstanding contractual obligations of the Company that will require future cash outflows. In addition, there are commitments and contingent liabilities, such as commitments to extend credit, that may or may not require future cash outflows.
Table 18 reflects the contractual obligations and other commercial commitments of the Company outstanding as of December 31, 2006. Any of the Company’s $143 million in outstanding borrowings with the FHLB may be accelerated immediately by the FHLB in certain circumstances, including material adverse changes in the
condition of the Company or if the Company’s qualifying collateral is less than the amount required under the terms of the borrowing agreement. As noted in Note 9 to the consolidated financial statements, the Company has the ability to call $20.6 million of its outstanding trust preferred security borrowings on November 7, 2007 and quarterly thereafter. The Company expects to substantively refinance these borrowings on that date by exercising its call option and immediately issuing $20.6 million in new trust preferred securities at what is expected to be a lower interest rate.
In the normal course of business there are various outstanding commitments and contingent liabilities such as commitments to extend credit, which are not reflected in the financial statements. As of December 31, 2006, the Company had outstanding unfunded loan and credit card commitments of $321,131,000, of which $270,592,000 were at variable rates and $50,539,000 were at fixed rates. Included in outstanding loan commitments were unfunded commitments of $168,941,000 on revolving credit plans, of which $142,068,000 were at variable rates and $26,873,000 were at fixed rates.
At December 31, 2006 and 2005, the Company had $4,459,000 and $4,283,000, respectively, in standby letters of credit outstanding. The Company had no carrying amount for these standby letters of credit at either of those dates. The nature of the standby letters of credit is a guarantee made on behalf of the Company’s customers to suppliers of the customers to guarantee payments owed to the supplier by the customer. The standby letters of credit are generally for terms for one year, at which time they may be renewed for another year if both parties agree. The payment of the guarantees would generally be triggered by a continued nonpayment of an obligation owed by the customer to the supplier. The maximum potential amount of future payments (undiscounted) the Company could be required to make under the guarantees in the event of nonperformance by the parties to whom credit or financial guarantees have been extended is represented by the contractual amount of the financial instruments discussed above. In the event that the Company is required to honor a standby letter of credit, a note, already executed with the customer, is triggered which provides repayment terms and any collateral. Over the past ten years, the Company has had to honor one standby letter of credit, which was repaid by the borrower without any loss to the Company. Management expects any draws under existing commitments to be funded through normal operations.
It has been the experience of the Company that deposit withdrawals are generally replaced with new deposits, thus not requiring any net cash outflow. Based on that assumption, management believes that it can meet its contractual cash obligations and existing commitments from normal operations.
The Company is not involved in any legal proceedings that, in management’s opinion, could have a material effect on the consolidated financial position of the Company; however, see “Income Taxes” above for discussion of a tax loss contingency.
The Company processes credit card transactions for approximately 575 commercial merchant clients. As these clients present credit card transactions authorized by their customers to the Company, the Company deposits funds in their checking accounts and collects the corresponding amounts due from the credit card issuer. In the event that the customer disputes the charge, the Company is contractually liable for any amounts legally due to the customer in the event the Company’s merchant clients do not make payment. This represents a contingent liability to the Company that led to a loss in 2006, as discussed in “Noninterest Income” above.
Off-Balance Sheet Arrangements and Derivative Financial Instruments
Off-balance sheet arrangements include transactions, agreements, or other contractual arrangements in which the Company has obligations or provides guarantees on behalf of an unconsolidated entity. The Company has no off-balance sheet arrangements of this kind other than repayment guarantees associated with its trust preferred securities.
Derivative financial instruments include futures, forwards, interest rate swaps, options contracts, and other financial instruments with similar characteristics. The Company has not engaged in derivatives activities through December 31, 2006 and has no current plans to do so.
Interest Rate Risk (Including Quantitative and Qualitative Disclosures About Market Risk - Item 7A.)
Net interest income is the Company’s most significant component of earnings. Notwithstanding changes in volumes of loans and deposits, the Company’s level of net interest income is continually at risk due to the effect that changes in general market interest rate trends have on interest yields earned and paid with respect to the various categories of earning assets and interest-bearing liabilities. It is the Company’s policy to maintain portfolios of earning assets and interest-bearing liabilities with maturities and repricing opportunities that will afford protection, to the extent practical, against wide interest rate fluctuations. The Company’s exposure to interest rate risk is analyzed on a regular basis by management using standard GAP reports, maturity reports, and an asset/liability software model that simulates future levels of interest income and expense based on current interest rates, expected future interest rates, and various intervals of “shock” interest rates. Over the years, the Company has been able to maintain a fairly consistent yield on average earning assets (net interest margin). Over the past five calendar years, the Company’s net interest margin has ranged from a low of 4.18% (realized in 2006) to a high of 4.58% (realized in 2002). During that five year period, the prime rate of interest has ranged from a low of 4.00% to a high of 8.25% (which is the current rate at December 31, 2006).
Table 17 sets forth the Company’s interest rate sensitivity analysis as of December 31, 2006, using stated maturities for all instruments except mortgage-backed securities (which are allocated in the periods of their expected payback) and securities and borrowings with call features that are expected to be called (which are shown in the period of their expected call). As illustrated by this table, at December 31, 2006, the Company had $484 million more in interest-bearing liabilities that are subject to interest rate changes within one year than earning assets. This generally would indicate that net interest income would experience downward pressure in a rising interest rate environment and would benefit from a declining interest rate environment. However, this method of analyzing interest sensitivity only measures the magnitude of the timing differences and does not address earnings, market value, or management actions. Also, interest rates on certain types of assets and liabilities may fluctuate in advance of changes in market interest rates, while interest rates on other types may lag behind changes in market rates. In addition to the effects of “when” various rate-sensitive products reprice, market rate changes may not result in uniform changes in rates among all products. For example, included in interest-bearing liabilities subject to interest rate changes within one year at December 31, 2006 are deposits totaling $503 million comprised of NOW, savings, and certain types of money market deposits with interest rates set by management. These types of deposits historically have not repriced with or in the same proportion as general market indicators.
Overall, the Company believes that in the near term (twelve months), net interest income would not likely experience significant downward pressure from rising interest rates. Similarly, management would not expect a significant increase in near term net interest income from falling interest rates. Generally, when rates change, the Company’s interest-sensitive assets that are subject to adjustment reprice immediately at the full amount of the change, while the Company’s interest-sensitive liabilities that are subject to adjustment reprice at a lag to the rate change and typically not to the full extent of the rate change. The net effect is that in the twelve month horizon, as rates change, the impact of having a higher level of interest-sensitive liabilities is substantially negated by the later and typically lower proportionate change these liabilities experience compared to interest sensitive assets. The general discussion in this paragraph applies most directly when short-term interest rates and long-term interest rates change in an equivalent manner and is less applicable when short-term interest rates and long-term interest rates do not move together, which has occurred recently and is discussed in the following paragraph.
Since the second half of 2004, the Federal Reserve has increased its discount rate (the interest rate it charges to commercial banks on loans) 17 times totaling 425 basis points. Changes in the discount rate tend to have a significant effect on overall interest rates in the marketplace. However the impact of these rate increases has not had an equal effect on short-term interest rates and long-term interest rates. In the marketplace, short-term rates
have risen by a significantly higher amount than have longer-term interest rates. For example, from June 30, 2004 to December 31, 2006, the interest rate on three-month treasury bills rose by 368 basis points, whereas the interest rate for seven-year treasury notes increased by just 19 basis points. This has resulted in what economists refer to as a “flat yield curve”, which means that short-term interest rates are substantially the same as long-term interest rates. This is an unfavorable interest rate environment for many banks, including the Company, as short-term interest rates generally drive the Company’s deposit pricing and longer-term interest rates generally drive loan pricing. When these rates converge, as they have recently (particularly in 2006), the “profit” spread the Company realizes between loan yields and deposit rates narrows, which reduces the Company’s net interest margin.
In addition to the negative impact of the flat yield curve interest rate environment, the Company’s net interest margin has also been negatively impacted by the Company having more of its overall funding occurring in its highest cost funding sources, which is a result of the need fund high loan growth, as well as customers shifting their funds from low cost deposits to higher cost deposits as interest rates have risen.
The factors just discussed are the primary reasons for the Company experiencing a decline in its net interest margin in each successive quarter in 2006. The Company’s net interest margin was 4.37% in the fourth quarter of 2005, 4.33% in the first quarter of 2006, 4.22% in the second quarter of 2006, 4.12% in the third quarter of 2006, and 4.05% in the fourth quarter of 2006. There have been no changes to the Federal Reserve discount rate since July 2006. Rate forecasts reviewed by the Company indicate that some economists are expecting little change in interest rates in 2007. Assuming rates remain the same in 2007 as they were at the end of 2006, the Company believes that its net interest margin will be more stable in 2007 than it was in 2006 because most of the Company’s time deposit portfolio has already repriced to the higher market interest rates in effect from July 2006 to December 2006. If market interest rates do not change, the Company estimates that its net interest margin will be in the range of 3.90% - 4.05% for 2007. Management’s modeling indicates a slight compression in net interest margin in the first half of 2007 as the remaining portion of the Company’s time deposits mature and reprice higher, followed by stable margins for the remainder of the year. Modest parallel increases or decreases in interest rates are not projected to materially impact the Company’s net interest margin, whereas continued inversion of the yield curve would be expected to negatively impact the margin. In addition to the assumption regarding interest rates, the aforementioned modeling is dependent on many other assumptions that could vary significantly from actual developments, including, but not limited to: loan growth, mix of loan growth, deposit growth, mix of deposit growth, the ability of the Company to manage changes in rates earned on loans and paid on deposits, which will depend largely on actions taken by the Company’s competitors.
The Company has no market risk sensitive instruments held for trading purposes, nor does it maintain any foreign currency positions. Table 19 presents the expected maturities of the Company’s other than trading market risk sensitive financial instruments. Table 19 also presents the estimated fair values of market risk sensitive instruments as estimated in accordance with Statement of Financial Accounting Standards No. 107, “Disclosures About Fair Value of Financial Instruments.” The Company’s assets have estimated fair values that are less than their carrying values primarily because of the impact of the rising interest rate environment on the fair value of fixed rate loans/securities that were originated/purchased when interest rates were lower, whereas substantially all of the Company’s interest-bearing liabilities, which are almost all short-term in nature, have already repriced into the higher interest rate environment, and thus their carrying value approximates fair value.
See additional discussion regarding net interest income, as well as discussion of the changes in the annual net interest margin, in the section entitled “Net Interest Income” above.
Return on Assets and Equity
Table 20 shows return on assets (net income divided by average total assets), return on equity (net income divided by average shareholders’ equity), dividend payout ratio (dividends per share divided by net income per share) and shareholders’ equity to assets ratio (average shareholders’ equity divided by average total assets) for each of the years in the three-year period ended December 31, 2006. The significant decrease in return on assets and return on equity and the increase in the dividend payout ratio from 2004 to 2005 were caused primarily by the large contingency tax loss accrual that is discussed in the sections entitled “Income Taxes” above.
Capital Resources and Shareholders’ Equity
Shareholders’ equity at December 31, 2006 amounted to $162.7 million compared to $155.7 million at December 31, 2005. The two basic components that typically have the largest impact on the Company’s shareholders’ equity are net income, which increases shareholders’ equity, and dividends declared, which decreases shareholders’ equity.
In 2006, net income of $19,302,000 increased equity, while dividends declared of $10,589,000 reduced equity. Other significant items affecting shareholders’ equity in 2006 were 1) proceeds of $1,027,000 received from common stock issued as a result of stock option exercises, 2) proceeds of $1,557,000 received from the issuance of stock into the Company’s dividend reinvestment plan, 3) repurchases of 53,000 shares of the Company’s common stock at an average price of $20.97, which reduced shareholders’ equity by $1,112,000, and 4) a $3,775,000 negative adjustment to equity related to the Company’s December 31, 2006 adoption of Statement of Financial Accounting Standards No. 158, “Employers�� Accounting for Defined Benefit Pension and Other Postretirement Plans” (Statement 158). Statement 158 required the Company to recognize a liability for the underfunded amount of the Company’s two defined benefit plans. See Notes 1(t) and 11 to the Company’s consolidated financial statements for additional discussion of Statement 158.
In 2005, net income of $16,090,000 increased equity, while dividends declared of $9,930,000 reduced equity. Other significant items affecting shareholders’ equity in 2005 were 1) proceeds of $785,000 received from common stock issued as a result of stock option exercises, 2) proceeds of $1,604,000 received from the issuance of stock into the Company’s dividend reinvestment plan, and 3) other comprehensive loss of $1,417,000, which was primarily comprised of a $1,362,000 decrease in the net unrealized gain, net of taxes, of the Company’s available for sale securities.
In 2004, net income of $20,114,000 increased equity, while dividends declared of $9,269,000 reduced equity. Also, the Company continued to actively manage its capital and number of common shares outstanding through stock repurchases. In 2004, the Company repurchased a total of 300,816 shares of its common stock at an average price of $21.65, which reduced shareholders’ equity by $6.5 million.
Other items affecting shareholders’ equity in 2004 were 1) proceeds of $1,081,000 received from common stock issued as a result of stock option exercises, 2) proceeds of $1,466,000 received from the issuance of stock into the Company’s dividend reinvestment plan, 3) a $203,000 increase to equity related to the tax benefit that the Company realized due to exercises of nonqualified stock options, and 4) other comprehensive loss of $445,000, which was primarily comprised of a $417,000 decrease in the net unrealized gain, net of taxes, of the Company’s available for sale securities.
The Company is not aware of any recommendations of regulatory authorities or otherwise which, if they were to be implemented, would have a material effect on its liquidity, capital resources, or operations.
The Company and the Bank must comply with regulatory capital requirements established by the FRB and the FDIC. Failure to meet minimum capital requirements can initiate certain mandatory, and possibly additional discretionary, actions by regulators that, if undertaken, could have a direct material effect on the Company’s
financial statements. Under capital adequacy guidelines and the regulatory framework for prompt corrective action, the Company and the Bank must meet specific capital guidelines that involve quantitative measures of the Company’s assets, liabilities, and certain off-balance sheet items as calculated under regulatory accounting practices. The Company’s and Bank’s capital amounts and classifications are also subject to qualitative judgments by the regulators about components, risk weightings, and other factors. These capital standards require the Company and the Bank to maintain minimum ratios of “Tier 1” capital to total risk-weighted assets (“Tier I Capital Ratio”) and total capital to risk-weighted assets (“Total Capital Ratio”) of 4.00% and 8.00%, respectively. Tier 1 capital is comprised of total shareholders’ equity, excluding unrealized gains or losses from the securities available for sale, less intangible assets, and total capital is comprised of Tier 1 capital plus certain adjustments, the largest of which for the Company and the Bank is the allowance for loan losses. Risk-weighted assets refer to the on- and off-balance sheet exposures of the Company and the Bank, adjusted for their related risk levels using formulas set forth in FRB and FDIC regulations.
In addition to the risk-based capital requirements described above, the Company and the Bank are subject to a leverage capital requirement, which calls for a minimum ratio of Tier 1 capital (as defined above) to quarterly average total assets (“Leverage Ratio) of 3.00% to 5.00%, depending upon the institution’s composite ratings as determined by its regulators. The FRB has not advised the Company of any requirement specifically applicable to it.
Table 21 presents the Company’s regulatory capital ratios as of December 31, 2006, 2005, and 2004. In both 2005 and 2006, the Company’s balance sheet growth outpaced the growth rate of its capital. In order to maintain regulatory capital ratios at internal targets in 2006, the Company issued an additional $25.8 million in trust preferred debt securities, which are counted as regulatory capital. All of the Company’s capital ratios have significantly exceeded the minimum regulatory thresholds for all periods covered by this report.
In addition to the minimum capital requirements described above, the regulatory framework for prompt corrective action also contains specific capital guidelines for a bank’s classification as “well capitalized.” The specific guidelines are as follows - Tier I Capital Ratio of at least 6.00%, Total Capital Ratio of at least 10.00%, and a Leverage Ratio of at least 5.00%. The Bank’s regulatory ratios exceeded the threshold for “well-capitalized” status at December 31, 2006, 2005 and 2004.
The Company’s goal is to maintain its capital ratios at levels no less than the “well-capitalized” thresholds set for banks. At December 31, 2006, the Company’s total risk-based capital ratio was 11.81% compared to the 10.00% “well-capitalized” threshold. The Company believes it has readily accessible options to increase capital should the need arise, including perpetual preferred stock, a secondary common stock offering, or the issuance of additional trust preferred securities.
See “Supervision and Regulation” under “Business” above and Note 15 to the consolidated financial statements for discussion of other matters that may affect the Company’s capital resources.
Inflation
Because the assets and liabilities of a bank are primarily monetary in nature (payable in fixed determinable amounts), the performance of a bank is affected more by changes in interest rates than by inflation. Interest rates generally increase as the rate of inflation increases, but the magnitude of the change in rates may not be the same. The effect of inflation on banks is normally not as significant as its influence on those businesses that have large investments in plant and inventories. During periods of high inflation, there are normally corresponding increases in the money supply, and banks will normally experience above average growth in assets, loans and deposits. Also, general increases in the price of goods and services will result in increased operating expenses.
Current Accounting and Regulatory Matters
The Company prepares its consolidated financial statements and related disclosures in conformity with standards established by, among others, the Financial Accounting Standards Board (the “FASB”). Because the information needed by users of financial reports is dynamic, the FASB frequently issues new rules and proposes new rules for companies to apply in reporting their activities. See Note 1(t) to the Company’s consolidated financial statements for a discussion of recent rule proposals and changes.
The information responsive to this Item is found in Item 7 under the caption “Interest Rate Risk.”
The discussion in Part I and Part II of this report contains statements that could be deemed forward-looking statements within the meaning of Section 21E of the Securities Exchange Act of 1934 and the Private Securities Litigation Reform Act, which statements are inherently subject to risks and uncertainties. Forward-looking statements are statements that include projections, predictions, expectations or beliefs about future events or results or otherwise are not statements of historical fact. Such statements are often characterized by the use of qualifying words (and their derivatives) such as “expect,” “believe,” “estimate,” “plan,” “project,” or other statements concerning opinions or judgment of the Company and its management about future events. Factors that could influence the accuracy of such forward-looking statements include, but are not limited to, the financial success or changing strategies of the Company’s customers, the Company’s level of success in integrating acquisitions, actions of government regulators, the level of market interest rates, and general economic conditions, and also include the matters discussed under “Risk Factors” in Item 1A of this report.
| |
| Table 1 Selected Consolidated Financial Data |
| | | | |
($ in thousands, except per share | | Year Ended December 31, | |
and nonfinancial data) | | 2006 | | 2005 | | 2004 | | 2003 | | 2002 | |
Income Statement Data | | | | | | | | | | | | | | | | |
| Interest income | | $ | 129,207 | | | 101,429 | | | 81,593 | | | 74,667 | | | 73,261 | |
| Interest expense | | | 54,671 | | | 32,838 | | | 20,303 | | | 18,907 | | | 23,871 | |
| Net interest income | | | 74,536 | | | 68,591 | | | 61,290 | | | 55,760 | | | 49,390 | |
| Provision for loan losses | | | 4,923 | | | 3,040 | | | 2,905 | | | 2,680 | | | 2,545 | |
| Net interest income after provision | | | 69,613 | | | 65,551 | | | 58,385 | | | 53,080 | | | 46,845 | |
| Noninterest income | | | 14,310 | | | 15,004 | | | 15,864 | | | 14,918 | | | 11,968 | |
| Noninterest expense | | | 53,198 | | | 47,636 | | | 43,717 | | | 37,964 | | | 32,301 | |
| Income before income taxes | | | 30,725 | | | 32,919 | | | 30,532 | | | 30,034 | | | 26,512 | |
| Income taxes | | | 11,423 | | | 16,829 | | | 10,418 | | | 10,617 | | | 9,282 | |
| Net income | | | 19,302 | | | 16,090 | | | 20,114 | | | 19,417 | | | 17,230 | |
| | | | | | | | | | | | | | | | | |
| Earnings per share - basic | | | 1.35 | | | 1.14 | | | 1.42 | | | 1.38 | | | 1.26 | |
| Earnings per share - diluted | | | 1.34 | | | 1.12 | | | 1.40 | | | 1.35 | | | 1.23 | |
| | | | | | | | | | | | | | | | | |
| |
| | | | | | | | | | | | | | | | | |
| | | | | | | | | | | | | | | | | |
Per Share Data | | | | | | | | | | | | | | | | |
| Cash dividends declared | | $ | 0.74 | | | 0.70 | | | 0.66 | | | 0.63 | | | 0.60 | |
| Market Price | | | | | | | | | | | | | | | | |
| High | | | 23.90 | | | 27.88 | | | 29.73 | | | 21.49 | | | 18.35 | |
| Low | | | 19.47 | | | 19.32 | | | 18.47 | | | 15.30 | | | 13.47 | |
| Close | | | 21.84 | | | 20.16 | | | 27.17 | | | 20.80 | | | 15.67 | |
| Book value - stated | | | 11.34 | | | 10.94 | | | 10.54 | | | 10.02 | | | 9.06 | |
| Tangible book value | | | 7.76 | | | 7.48 | | | 7.04 | | | 6.44 | | | 7.22 | |
| |
| | | | | | | | | | | | | | | | | |
Selected Balance Sheet Data (at year end) | | | | | | | | | | | | | | | | |
| Total assets | | $ | 2,136,624 | | | 1,801,050 | | | 1,638,913 | | | 1,475,769 | | | 1,218,146 | |
| Loans | | | 1,740,396 | | | 1,482,611 | | | 1,367,053 | | | 1,218,895 | | | 998,547 | |
| Allowance for loan losses | | | 18,947 | | | 15,716 | | | 14,717 | | | 13,569 | | | 10,907 | |
| Intangible assets | | | 51,394 | | | 49,227 | | | 49,330 | | | 50,701 | | | 25,169 | |
| Deposits | | | 1,695,679 | | | 1,494,577 | | | 1,388,768 | | | 1,249,364 | | | 1,055,957 | |
| Borrowings | | | 210,013 | | | 100,239 | | | 92,239 | | | 76,000 | | | 30,000 | |
| Total shareholders’ equity | | | 162,705 | | | 155,728 | | | 148,478 | | | 141,856 | | | 123,985 | |
| |
| | | | | | | | | | | | | | | | | |
Selected Average Balances | | | | | | | | | | | | | | | | |
| Assets | | $ | 1,922,510 | | | 1,709,380 | | | 1,545,332 | | | 1,339,823 | | | 1,162,708 | |
| Loans | | | 1,623,188 | | | 1,422,419 | | | 1,295,682 | | | 1,113,426 | | | 954,885 | |
| Earning assets | | | 1,793,811 | | | 1,593,554 | | | 1,434,425 | | | 1,245,679 | | | 1,090,666 | |
| Deposits | | | 1,599,575 | | | 1,460,620 | | | 1,306,404 | | | 1,153,385 | | | 1,010,693 | |
| Interest-bearing liabilities | | | 1,537,385 | | | 1,359,744 | | | 1,232,130 | | | 1,065,950 | | | 928,686 | |
| Shareholders’ equity | | | 163,193 | | | 154,871 | | | 146,683 | | | 137,293 | | | 120,943 | |
| |
| | | | | | | | | | | | | | | | | |
Ratios | | | | | | | | | | | | | | | | |
| Return on average assets | | | 1.00 | % | | 0.94 | % | | 1.30 | % | | 1.45 | % | | 1.48 | % |
| Return on average equity | | | 11.83 | % | | 10.39 | % | | 13.71 | % | | 14.14 | % | | 14.25 | % |
| Net interest margin (taxable-equivalent basis) | | | 4.18 | % | | 4.33 | % | | 4.31 | % | | 4.52 | % | | 4.58 | % |
| Shareholders’ equity to assets at year end | | | 7.62 | % | | 8.65 | % | | 9.06 | % | | 9.61 | % | | 10.18 | % |
| Loans to deposits at year end | | | 102.64 | % | | 99.20 | % | | 98.44 | % | | 97.56 | % | | 94.56 | % |
| Allowance for loan losses to total loans | | | 1.09 | % | | 1.06 | % | | 1.08 | % | | 1.11 | % | | 1.09 | % |
| Nonperforming assets to total assets at year end | | | 0.39 | % | | 0.17 | % | | 0.32 | % | | 0.39 | % | | 0.36 | % |
| Net charge-offs to average loans | | | 0.11 | % | | 0.14 | % | | 0.14 | % | | 0.10 | % | | 0.11 | % |
| Efficiency ratio | | | 59.54 | % | | 56.68 | % | | 56.32 | % | | 53.32 | % | | 52.19 | % |
| |
| | | | | | | | | | | | | | | | | |
Nonfinancial Data | | | | | | | | | | | | | | | | |
| Number of branches | | | 68 | | | 61 | | | 59 | | | 57 | | | 48 | |
| Number of employees - Full time equivalents | | | 620 | | | 578 | | | 563 | | | 550 | | | 447 | |
| |
| | | | | | | | | | | | | | | | | |
Per share amounts for 2002 and 2003 have been restated from their originally reported amounts to reflect the 3-for-2 stock split paid on November 15, 2004.
| | |
| Table 2 Average Balances and Net Interest Income Analysis | |
| | | | |
| | | Year Ended December 31, | |
| | | 2006 | | 2005 | | 2004 | |
($ in thousands) | | Average Volume | | Avg. Rate | | Interest Earned or Paid | | Average Volume | | Avg. Rate | | Interest Earned or Paid | | Average Volume | | Avg. Rate | | Interest Earned or Paid | |
Assets | | | | | | | | | | | | | | | | | | | | | | | | | | | | |
| Loans (1) | | $ | 1,623,188 | | | 7.44% | | $ | 120,694 | | $ | 1,422,419 | | | 6.62% | | $ | 94,097 | | $ | 1,295,682 | | | 5.87% | | $ | 76,093 | |
| Taxable securities | | | 118,032 | | | 4.84% | | | 5,718 | | | 114,223 | | | 4.54% | | | 5,184 | | | 98,016 | | | 4.52% | | | 4,428 | |
| Non-taxable securities (2) | | | 11,466 | | | 8.84% | | | 1,014 | | | 10,782 | | | 8.57% | | | 924 | | | 12,082 | | | 8.30% | | | 1,003 | |
| Short-term investments, primarily federal funds | | | 41,125 | | | 5.55% | | | 2,282 | | | 46,130 | | | 3.62% | | | 1,672 | | | 28,645 | | | 1.90% | | | 544 | |
| Total interest-earning assets | | | 1,793,811 | | | 7.23% | | | 129,708 | | | 1,593,554 | | | 6.39% | | | 101,877 | | | 1,434,425 | | | 5.72% | | | 82,068 | |
| Cash and due from banks | | | 37,872 | | | | | | | | | 34,574 | | | | | | | | | 32,594 | | | | | | | |
| Bank premises and equipment, net | | | 38,592 | | | | | | | | | 32,179 | | | | | | | | | 25,915 | | | | | | | |
| Other assets | | | 52,235 | | | | | | | | | 49,073 | | | | | | | | | 52,398 | | | | | | | |
| Total assets | | $ | 1,922,510 | | | | | | | | $ | 1,709,380 | | | | | | | | $ | 1,545,332 | | | | | | | |
| | | | | | | | | | | | | | | | | | | | | | | | | | | | | |
Liabilities and Equity | | | | | | | | | | | | | | | | | | | | | | | | | | | | |
| Savings, NOW and money market deposits | | $ | 483,548 | | | 1.47% | | $ | 7,094 | | $ | 470,648 | | | 0.86% | | $ | 4,048 | | $ | 468,177 | | | 0.54% | | $ | 2,530 | |
| Time deposits >$100,000 | | | 390,246 | | | 4.53% | | | 17,662 | | | 350,240 | | | 3.26% | | | 11,425 | | | 271,448 | | | 2.34% | | | 6,362 | |
| Other time deposits | | | 520,140 | | | 4.09% | | | 21,276 | | | 455,557 | | | 2.86% | | | 13,043 | | | 407,602 | | | 2.04% | | | 8,334 | |
| Total interest-bearing deposits | | | 1,393,934 | | | 3.30% | | | 46,032 | | | 1,276,445 | | | 2.23% | | | 28,516 | | | 1,147,227 | | | 1.50% | | | 17,226 | |
| Securities sold under agreements to repurchase | | | 30,036 | | | 3.72% | | | 1,116 | | | 6,219 | | | 2.88% | | | 179 | | | | | | | | | | |
| Borrowings | | | 113,415 | | | 6.63% | | | 7,523 | | | 77,080 | | | 5.37% | | | 4,143 | | | 84,903 | | | 3.62% | | | 3,077 | |
| Total interest-bearing liabilities | | | 1,537,385 | | | 3.56% | | | 54,671 | | | 1,359,744 | | | 2.42% | | | 32,838 | | | 1,232,130 | | | 1.65% | | | 20,303 | |
| Non-interest-bearing deposits | | | 205,641 | | | | | | | | | 184,175 | | | | | | | | | 159,177 | | | | | | | |
| Other liabilities | | | 16,291 | | | | | | | | | 10,590 | | | | | | | | | 7,342 | | | | | | | |
| Shareholders’ equity | | | 163,193 | | | | | | | | | 154,871 | | | | | | | | | 146,683 | | | | | | | |
| Total liabilities and shareholders’ equity | | $ | 1,922,510 | | | | | | | | $ | 1,709,380 | | | | | | | | $ | 1,545,332 | | | | | | | |
| Net yield on interest- earning assets and net interest income | | | | | | 4.18% | | $ | 75,037 | | | | | | 4.33% | | $ | 69,039 | | | | | | 4.31% | | $ | 61,765 | |
| Interest rate spread | | | | | | 3.67% | | | | | | | | | 3.97% | | | | | | | | | 4.07% | | | | |
| | | | | | | | | | | | | | | | | | | | | | | | | | | | | |
| Average prime rate | | | | | | 7.96% | | | | | | | | | 6.19% | | | | | | | | | 4.34% | | | | |
(1) Average loans include nonaccruing loans, the effect of which is to lower the average rate shown. Interest earned includes recognized loan fees in the amounts of $696,000, $1,037,000, and $1,244,000 for 2006, 2005, and 2004, respectively.
(2) Includes tax-equivalent adjustments of $501,000, $448,000, and $475,000 in 2006, 2005, and 2004, respectively, to reflect the federal and state benefit of the tax-exempt securities (using a 39% combined tax rate), reduced by the related nondeductible portion of interest expense.
| |
| Table 3 Volume and Rate Variance Analysis |
| | | | | | |
| | | Year Ended December 31, 2006 | | Year Ended December 31, 2005 | |
| | | Change Attributable to | | | | Change Attributable to | | | |
(In thousands) | | Changes in Volumes | | Changes in Rates | | Total Increase (Decrease) | | Changes in Volumes | | Changes in Rates | | Total Increase (Decrease) | |
| Interest income (tax-equivalent): | | | | | | | | | | | | | | | | | | | |
| Loans | | $ | 14,105 | | | 12,492 | | | 26,597 | | | 7,914 | | | 10,090 | | | 18,004 | |
| Taxable securities | | | 179 | | | 355 | | | 534 | | | 734 | | | 22 | | | 756 | |
| Non-taxable securities | | | 60 | | | 30 | | | 90 | | | (110 | ) | | 31 | | | (79 | ) |
| Short-term investments, principally federal funds sold | | | (230 | ) | | 840 | | | 610 | | | 483 | | | 645 | | | 1,128 | |
| Total interest income | | | 14,114 | | | 13,717 | | | 27,831 | | | 9,021 | | | 10,788 | | | 19,809 | |
| | | | | | | | | | | | | | | | | | | | |
| Interest expense: | | | | | | | | | | | | | | | | | | | |
| Savings, NOW and money market deposits | | | 150 | | | 2,896 | | | 3,046 | | | 17 | | | 1,501 | | | 1,518 | |
| Time deposits>$100,000 | | | 1,558 | | | 4,679 | | | 6,237 | | | 2,208 | | | 2,855 | | | 5,063 | |
| Other time deposits | | | 2,245 | | | 5,988 | | | 8,233 | | | 1,177 | | | 3,532 | | | 4,709 | |
| Total interest-bearing deposits | | | 3,953 | | | 13,563 | | | 17,516 | | | 3,402 | | | 7,888 | | | 11,290 | |
| Securities sold under agreements to repurchase | | | 785 | | | 152 | | | 937 | | | 179 | | | | | | 179 | |
| Borrowings | | | 2,182 | | | 1,198 | | | 3,380 | | | (352 | ) | | 1,418 | | | 1,066 | |
| Total interest expense | | | 6,920 | | | 14,913 | | | 21,833 | | | 3,229 | | | 9,306 | | | 12,535 | |
| | | | | | | | | | | | | | | | | | | | |
| Net interest income (tax-equivalent) | | $ | 7,194 | | | (1,196 | ) | | 5,998 | | | 5,792 | | | 1,482 | | | 7,274 | |
| | | | | | | | | | | | | | | | | | | | |
Changes attributable to both volume and rate are allocated equally between rate and volume variances.
| |
| Table 4 Noninterest Income |
| | | | |
| | | Year Ended December 31, | |
(In thousands) | | 2006 | | 2005 | | 2004 | |
| | | | | | | | |
| Service charges on deposit accounts | | $ | 8,968 | | | 8,537 | | | 9,064 | |
| Other service charges, commissions, and fees | | | 4,578 | | | 3,963 | | | 3,361 | |
| Fees from presold mortgages | | | 1,062 | | | 1,176 | | | 969 | |
| Commissions from sales of insurance and financial products | | | 1,434 | | | 1,307 | | | 1,406 | |
| Data processing fees | | | 162 | | | 279 | | | 416 | |
| Total core noninterest income | | | 16,204 | | | 15,262 | | | 15,216 | |
| Loan sale gains | | | | | | 9 | | | 2 | |
| Securities gains, net | | | 205 | | | 5 | | | 299 | |
| Other gains (losses), net | | | (2,099 | ) | | (272 | ) | | 347 | |
| Total | | $ | 14,310 | | | 15,004 | | | 15,864 | |
| |
| Table 5 Noninterest Expenses |
| | | | |
| | | Year Ended December 31, | |
(In thousands) | | 2006 | | 2005 | | 2004 | |
| | | | | | | | |
| Salaries | | $ | 23,867 | | | 21,921 | | | 20,116 | |
| Employee benefits | | | 6,811 | | | 6,054 | | | 5,488 | |
| Total personnel expense | | | 30,678 | | | 27,975 | | | 25,604 | |
| Occupancy expense | | | 3,447 | | | 3,037 | | | 2,754 | |
| Equipment related expenses | | | 3,419 | | | 2,965 | | | 2,956 | |
| Amortization of intangible assets | | | 322 | | | 290 | | | 378 | |
| Stationery and supplies | | | 1,675 | | | 1,590 | | | 1,523 | |
| Telephone | | | 1,273 | | | 1,260 | | | 1,345 | |
| Non-credit losses | | | 165 | | | 110 | | | 187 | |
| Other operating expenses | | | 12,219 | | | 10,409 | | | 8,970 | |
| Total | | $ | 53,198 | | | 47,636 | | | 43,717 | |
| |
| |
| Table 6 Income Taxes |
| | | | | | | | |
(In thousands) | | 2006 | | 2005 | | 2004 | |
| | | | | | | | |
| Current - Federal | | $ | 10,809 | | | 8,285 | | | 10,407 | |
| - State | | | 1,927 | | | 8,700 | | | 228 | |
| Deferred - Federal | | | (1,112 | ) | | (124 | ) | | (192 | ) |
| - State | | | (201 | ) | | (32 | ) | | (25 | ) |
| Total | | $ | 11,423 | | | 16,829 | | | 10,418 | |
| | | | | | | | | | | |
| Effective tax rate | | | 37.2 | % | | 51.1 | % | | 34.1 | % |
| |
| Table 7 Distribution of Assets and Liabilities |
| | | | |
| | | As of December 31, | |
| | | 2006 | | 2005 | | 2004 | |
| Assets | | | | | | | | | | |
| Interest-earning assets | | | | | | | | | | |
| Net loans | | | 80 | % | | 81 | % | | 82 | % |
| Securities available for sale | | | 6 | | | 6 | | | 5 | |
| Securities held to maturity | | | 1 | | | 1 | | | 1 | |
| Short term investments | | | 5 | | | 4 | | | 4 | |
| Total interest-earning assets | | | 92 | | | 92 | | | 92 | |
| | | | | | | | | | | |
| Noninterest-earning assets | | | | | | | | | | |
| Cash and due from banks | | | 2 | | | 2 | | | 2 | |
| Premises and equipment | | | 2 | | | 2 | | | 2 | |
| Other assets | | | 4 | | | 4 | | | 4 | |
| Total assets | | | 100 | % | | 100 | % | | 100 | % |
| | | | | | | | | | | |
| Liabilities and shareholders’ equity | | | | | | | | | | |
| Demand deposits - noninterest bearing | | | 10 | % | | 11 | % | | 10 | % |
| Savings, NOW, and money market deposits | | | 23 | | | 25 | | | 29 | |
| Time deposits of $100,000 or more | | | 20 | | | 20 | | | 21 | |
| Other time deposits | | | 26 | | | 27 | | | 25 | |
| Total deposits | | | 79 | | | 83 | | | 85 | |
| Securities sold under agreements to repurchase | | | 2 | | | 2 | | | | |
| Borrowings | | | 10 | | | 5 | | | 5 | |
| Accrued expenses and other liabilities | | | 1 | | | 1 | | | 1 | |
| Total liabilities | | | 92 | | | 91 | | | 91 | |
| | | | | | | | | | | |
| Shareholders’ equity | | | 8 | | | 9 | | | 9 | |
| Total liabilities and shareholders’ equity | | | 100 | % | | 100 | % | | 100 | % |
| |
| Table 8 Securities Portfolio Composition |
| | | | |
| | | As of December 31, | |
(In thousands) | | 2006 | | 2005 | | 2004 | |
Securities available for sale: | | | | | | | | | | |
| Government-sponsored enterprise securities | | $ | 62,456 | | | 44,481 | | | 29,810 | |
| Mortgage-backed securities | | | 43,442 | | | 47,928 | | | 41,062 | |
| Corporate bonds | | | 13,580 | | | 14,912 | | | 12,084 | |
| Equity securities | | | 10,486 | | | 6,292 | | | 5,598 | |
| Total securities available for sale | | | 129,964 | | | 113,613 | | | 88,554 | |
| | | | | | | | | | | |
Securities held to maturity: | | | | | | | | | | |
| State and local governments | | | 13,089 | | | 11,382 | | | 11,605 | |
| Other | | | 33 | | | 66 | | | 2,420 | |
| Total securities held to maturity | | | 13,122 | | | 11,448 | | | 14,025 | |
| | | | | | | | | | | |
| Total securities | | $ | 143,086 | | | 125,061 | | | 102,579 | |
| | | | | | | | | | | |
| Average total securities during year | | $ | 129,498 | | | 125,005 | | | 110,098 | |
| |
| |
| Table 9 Securities Portfolio Maturity Schedule |
| | | | |
| | | As of December 31, |
| | | 2006 |
($ in thousands) | | Book Value | | Fair Value | | Book Yield (1) |
Securities available for sale: | | | | | | | | | | |
| | | | | | | | | | | |
| Government-sponsored enterprise securities | | | | | | | | | | |
| Due within one year | | $ | 14,590 | | | 14,436 | | | 3.81 | % |
| Due after one but within five years | | | 46,414 | | | 46,020 | | | 4.68 | % |
| Due after five but within ten years | | | 2,000 | | | 2,000 | | | 6.01 | % |
| Total | | | 63,004 | | | 62,456 | | | 4.52 | % |
| | | | | | | | | | | |
| Mortgage-backed securities | | | | | | | | | | |
| Due within one year | | | 1,129 | | | 1,118 | | | 4.95 | % |
| Due after one but within five years | | | 25,634 | | | 24,901 | | | 4.37 | % |
| Due after five but within ten years | | | 13,544 | | | 13,179 | | | 4.74 | % |
| Due after ten years | | | 4,265 | | | 4,244 | | | 5.77 | % |
| Total | | | 44,572 | | | 43,442 | | | 4.63 | % |
| | | | | | | | | | | |
| Corporate debt securities | | | | | | | | | | |
| Due after five but within ten years | | | 6,092 | | | 6,009 | | | 5.91 | % |
| Due after ten years | | | 6,761 | | | 7,571 | | | 8.79 | % |
| Total | | | 12,853 | | | 13,580 | | | 7.42 | % |
| | | | | | | | | | | |
| Equity securities | | | 10,395 | | | 10,486 | | | 5.75 | % |
| | | | | | | | | | | |
| Total securities available for sale | | | | | | | | | | |
| Due within one year | | | 15,719 | | | 15,554 | | | 3.89 | % |
| Due after one but within five years | | | 72,048 | | | 70,921 | | | 4.57 | % |
| Due after five but within ten years | | | 21,636 | | | 21,188 | | | 5.19 | % |
| Due after ten years | | | 11,026 | | | 11,815 | | | 7.62 | % |
| Equity securities | | | 10,395 | | | 10,486 | | | 5.75 | % |
| Total | | $ | 130,824 | | | 129,964 | | | 4.94 | % |
| | | | | | | | | | | |
Securities held to maturity: | | | | | | | | | | |
| | | | | | | | | | | |
| State and local governments | | | | | | | | | | |
| Due within one year | | $ | 1,564 | | | 1,568 | | | 6.49 | % |
| Due after one but within five years | | | 4,736 | | | 4,771 | | | 7.31 | % |
| Due after five but within ten years | | | 2,174 | | | 2,204 | | | 6.63 | % |
| Due after ten years | | | 4,615 | | | 4,592 | | | 6.20 | % |
| Total | | | 13,089 | | | 13,135 | | | 6.71 | % |
| | | | | | | | | | | |
| Other | | | | | | | | | | |
| Due after one but within five years | | | 33 | | | 33 | | | 9.47 | % |
| Total | | | 33 | | | 33 | | | 9.47 | % |
| | | | | | | | | | | |
| Total securities held to maturity | | | | | | | | | | |
| Due within one year | | | 1,564 | | | 1,568 | | | 6.49 | % |
| Due after one but within five years | | | 4,769 | | | 4,804 | | | 7.32 | % |
| Due after five but within ten years | | | 2,174 | | | 2,204 | | | 6.63 | % |
| Due after ten years | | | 4,615 | | | 4,592 | | | 6.20 | % |
| Total | | $ | 13,122 | | | 13,168 | | | 6.71 | % |
(1) Yields on tax-exempt investments have been adjusted to a taxable equivalent basis using a 39% tax rate.
(2) Mortgage-backed securities are shown maturing in the periods consistent with their estimated lives based on expected prepayment speeds.
| |
| Table 10 Loan Portfolio Composition |
| | | | |
| | | As of December 31, | |
| | | 2006 | | 2005 | | 2004 | | 2003 | | 2002 | |
($ in thousands) | | Amount | | % of Total Loans | | Amount | | % of Total Loans | | Amount | | % of Total Loans | | Amount | | % of Total Loans | | Amount | | % of Total Loans | |
| Commercial, financial, & agricultural | | $ | 165,214 | | | 9.49% | | $ | 135,942 | | | 9.17% | | $ | 122,501 | | | 8.96% | | $ | 117,287 | | | 9.62% | | $ | 88,291 | | | 8.84% | |
| Real estate - construction | | | 155,440 | | | 8.93% | | | 125,158 | | | 8.44% | | | 117,158 | | | 8.57% | | | 98,189 | | | 8.05% | | | 68,162 | | | 6.82% | |
| Real estate - mortgage(1) | | | 1,344,553 | | | 77.26% | | | 1,150,068 | | | 77.58% | | | 1,063,694 | | | 77.80% | | | 939,578 | | | 77.05% | | | 795,148 | | | 79.57% | |
| Installment loans to individuals | | | 75,162 | | | 4.32% | | | 71,259 | | | 4.81% | | | 63,913 | | | 4.67% | | | 64,444 | | | 5.28% | | | 47,648 | | | 4.77% | |
| Loans, gross | | | 1,740,369 | | | 100.0% | | | 1,482,427 | | | 100.0% | | | 1,367,266 | | | 100.0% | | | 1,219,498 | | | 100.0% | | | 999,249 | | | 100.0% | |
| Unamortized net deferred loan costs/ (fees) | | | 27 | | | | | | 184 | | | | | | (213 | ) | | | | | (603 | ) | | | | | (702 | ) | | | |
| Total loans, net | | $ | 1,740,396 | | | | | $ | 1,482,611 | | | | | $ | 1,367,053 | | | | | $ | 1,218,895 | | | | | $ | 998,547 | | | | |
(1) The majority of these loans are various personal and commercial loans where real estate provides additional security for the loan.
| |
| Table 11 Loan Maturities |
| | | | |
| | | As of December 31, 2006 |
| | | Due within one year | | Due after one year but within five years | | Due after five years | | Total |
($ in thousands) | | Amount | | Yield | | Amount | | Yield | | Amount | | Yield | | Amount | | Yield |
Variable Rate Loans: | | | | | | | | | | | | | | | | | | | | | | | | | |
| Commercial, financial, and agricultural | | $ | 42,635 | | | 8.35% | | $ | 20,430 | | | 8.29% | | $ | 2,289 | | | 8.31% | | $ | 65,354 | | | 8.33 | % |
| Real estate - construction | | | 105,789 | | | 8.63% | | | 15,282 | | | 8.00% | | | 409 | | | 8.41% | | | 121,480 | | | 8.55 | % |
| Real estate - mortgage | | | 109,971 | | | 8.46% | | | 244,599 | | | 7.83% | | | 309,005 | | | 7.40% | | | 663,575 | | | 7.73 | % |
| Installment loans to individuals | | | 11,017 | | | 8.44% | | | 10,890 | | | 8.90% | | | 5,211 | | | 8.53% | | | 27,118 | | | 8.64 | % |
| Total at variable rates | | | 269,412 | | | 8.51% | | | 291,201 | | | 7.91% | | | 316,914 | | | 7.43% | | | 877,527 | | | 7.92 | % |
| | | | | | | | | | | | | | | | | | | | | | | | | | |
Fixed Rate Loans: | | | | | | | | | | | | | | | | | | | | | | | | | |
| Commercial, financial, and agricultural | | | 18,398 | | | 7.42% | | | 49,088 | | | 7.16% | | | 5,599 | | | 6.04% | | | 73,085 | | | 7.14 | % |
| Real estate - construction | | | 25,033 | | | 7.51% | | | 8,815 | | | 7.36% | | | – | | | | | | 33,848 | | | 7.47 | % |
| Real estate - mortgage | | | 104,475 | | | 7.05% | | | 493,917 | | | 6.93% | | | 60,589 | | | 6.95% | | | 658,981 | | | 6.95 | % |
| Installment loans to individuals | | | 18,107 | | | 8.20% | | | 68,765 | | | 8.68% | | | 3,231 | | | 7.56% | | | 90,103 | | | 8.54 | % |
| Total at fixed rates | | | 166,013 | | | 7.29% | | | 620,585 | | | 7.15% | | | 69,419 | | | 6.90% | | | 856,017 | | | 7.15 | % |
| | | | | | | | | | | | | | | | | | | | | | | | | | |
| Subtotal | | | 435,425 | | | 8.04% | | | 911,786 | | | 7.39% | | | 386,333 | | | 7.33% | | | 1,733,544 | | | 7.54 | % |
| Nonaccrual loans | | | 6,852 | | | | | | | | | | | | | | | | | | 6,852 | | | | |
| Total Loans | | $ | 442,277 | | | | | $ | 911,786 | | | | | $ | 386,333 | | | | | $ | 1,740,396 | | | | |
The above table is based on contractual scheduled maturities. Early repayment of loans or renewals at maturity are not considered in this table.
| |
| Table 12 Nonperforming Assets |
| | | | |
| | | As of December 31, | |
($ in thousands) | | 2006 | | 2005 | | 2004 | | 2003 | | 2002 | |
| | | | | | | | | | | | |
| Nonaccrual loans | | $ | 6,852 | | | 1,640 | | | 3,707 | | | 4,274 | | | 2,976 | |
| Restructured loans | | | 10 | | | 13 | | | 17 | | | 21 | | | 41 | |
| Accruing loans >90 days past due | | | | | | | | | | | | | | | | |
| Total nonperforming loans | | | 6,862 | | | 1,653 | | | 3,724 | | | 4,295 | | | 3,017 | |
| Other real estate (included in other assets) | | | 1,539 | | | 1,421 | | | 1,470 | | | 1,398 | | | 1,384 | |
| Total nonperforming assets | | $ | 8,401 | | | 3,074 | | | 5,194 | | | 5,693 | | | 4,401 | |
| | | | | | | | | | | | | | | | | |
| Nonperforming loans as a percentage of total loans | | | 0.39% | | | 0.11% | | | 0.27% | | | 0.35% | | | 0.30% | |
| Nonperforming assets as a percentage of loans and other real estate | | | 0.48% | | | 0.21% | | | 0.38% | | | 0.47% | | | 0.44% | |
| Nonperforming assets as a percentage of total assets | | | 0.39% | | | 0.17% | | | 0.32% | | | 0.39% | | | 0.36% | |
| Allowance for loan losses as a percentage of nonperforming loans | | | 276.11% | | | 950.76% | | | 395.19% | | | 315.93% | | | 361.52% | |
| | | | |
| |
| Table 13 Allocation of the Allowance for Loan Losses |
| | | | |
| | | As of December 31, | |
($ in thousands) | | 2006 | | 2005 | | 2004 | | 2003 | | 2002 | |
| | | | | | | | | | | | |
| Commercial, financial, and agricultural | | $ | 3,548 | | | 2,686 | | | 2,453 | | | 2,420 | | | 1,890 | |
| Real estate - construction | | | 1,182 | | | 798 | | | 757 | | | 641 | | | 483 | |
| Real estate - mortgage | | | 12,186 | | | 10,445 | | | 9,965 | | | 8,920 | | | 7,416 | |
| Installment loans to individuals | | | 2,026 | | | 1,763 | | | 1,468 | | | 1,435 | | | 1,094 | |
| Total allocated | | | 18,942 | | | 15,692 | | | 14,643 | | | 13,416 | | | 10,883 | |
| Unallocated | | | 5 | | | 24 | | | 74 | | | 153 | | | 24 | |
| Total | | $ | 18,947 | | | 15,716 | | | 14,717 | | | 13,569 | | | 10,907 | |
| |
| |
| Table 14 Loan Loss and Recovery Experience | |
| | | | |
| | | As of December 31, | |
($ in thousands) | | 2006 | | 2005 | | 2004 | | 2003 | | 2002 | |
| | | | | | | | | | | | |
| Loans outstanding at end of year | | $ | 1,740,396 | | | 1,482,611 | | | 1,367,053 | | | 1,218,895 | | | 998,547 | |
| Average amount of loans outstanding | | $ | 1,623,188 | | | 1,422,419 | | | 1,295,682 | | | 1,113,426 | | | 954,885 | |
| | | | | | | | | | | | | | | | | |
| Allowance for loan losses, at beginning of year | | $ | 15,716 | | | 14,717 | | | 13,569 | | | 10,907 | | | 9,388 | |
| Provision for loan losses | | | 4,923 | | | 3,040 | | | 2,905 | | | 2,680 | | | 2,545 | |
| Additions related to loans assumed in corporate acquisitions | | | 52 | | | | | | | | | 1,083 | | | 50 | |
| | | | 20,691 | | | 17,757 | | | 16,474 | | | 14,670 | | | 11,983 | |
| Loans charged off: | | | | | | | | | | | | | | | | |
| Commercial, financial and agricultural | | | (486 | ) | | (756 | ) | | (247 | ) | | (205 | ) | | (598 | ) |
| Real estate - mortgage | | | (510 | ) | | (1,120 | ) | | (1,143 | ) | | (705 | ) | | (230 | ) |
| Installment loans to individuals | | | (838 | ) | | (487 | ) | | (548 | ) | | (431 | ) | | (383 | ) |
| Overdraft losses (1) | | | (183 | ) | | | | | | | | | | | | |
| Total charge-offs | | | (2,017 | ) | | (2,363 | ) | | (1,938 | ) | | (1,341 | ) | | (1,211 | ) |
| Recoveries of loans previously charged-off: | | | | | | | | | | | | | | | | |
| Commercial, financial and agricultural | | | 57 | | | 99 | | | 45 | | | 73 | | | 33 | |
| Real estate - mortgage | | | 61 | | | 115 | | | 63 | | | 30 | | | 15 | |
| Installment loans to individuals | | | 112 | | | 108 | | | 73 | | | 137 | | | 87 | |
| Overdraft recoveries (1) | | | 43 | | | | | | | | | | | | | |
| Total recoveries | | | 273 | | | 322 | | | 181 | | | 240 | | | 135 | |
| Net charge-offs | | | (1,744 | ) | | (2,041 | ) | | (1,757 | ) | | (1,101 | ) | | (1,076 | ) |
| Allowance for loan losses, at end of year | | $ | 18,947 | | | 15,716 | | | 14,717 | | | 13,569 | | | 10,907 | |
| | | | | | | | | | | | | | | | | |
| Ratios: | | | | | | | | | | | | | | | | |
| Net charge-offs as a percent of average loans | | | 0.11 | % | | 0.14 | % | | 0.14 | % | | 0.10 | % | | 0.11 | % |
| Allowance for loan losses as a percent of loans at end of year | | | 1.09 | % | | 1.06 | % | | 1.08 | % | | 1.11 | % | | 1.09 | % |
| Allowance for loan losses as a multiple of net charge-offs | | | 10.86 | x | | 7.70 | x | | 8.38 | x | | 12.32 | x | | 10.14 | x |
| Provision for loan losses as a percent of net charge-offs | | | 282.28 | % | | 148.95 | % | | 165.33 | % | | 243.42 | % | | 236.52 | % |
| Recoveries of loans previously charged-off as a percent of loans charged-off | | 13.53 | % | | 13.63 | % | | 9.34 | % | | 17.90 | % | | 11.15 | % |
| |
| (1) Until July 1, 2006, the Company recorded net overdraft charge-offs as a reduction to service charge income. |
| |
| Table 15 Average Deposits |
| | | | |
| | | Year Ended December 31, | |
| | | 2006 | | 2005 | | 2004 | |
($ in thousands) | | Average Amount | | Average Rate | | Average Amount | | Average Rate | | Average Amount | | Average Rate | |
| | | | | | | | | | | | | | |
| Interest-bearing demand deposits - NOW & money market | | $ | 371,639 | | | 1.52% | | | 341,370 | | | 0.81% | | | 338,831 | | | 0.47% | |
| Savings deposits | | | 111,909 | | | 1.29% | | | 129,278 | | | 1.00% | | | 129,346 | | | 0.73% | |
| Time deposits | | | 520,140 | | | 4.09% | | | 455,557 | | | 2.86% | | | 407,602 | | | 2.04% | |
| Time deposits > $100,000 | | | 390,246 | | | 4.53% | | | 350,240 | | | 3.26% | | | 271,448 | | | 2.34% | |
| Total interest-bearing deposits | | | 1,393,934 | | | 3.30% | | | 1,276,445 | | | 2.23% | | | 1,147,227 | | | 1.50% | |
| Noninterest-bearing deposits | | | 205,641 | | | | | | 184,175 | | | | | | 159,177 | | | | |
| Total deposits | | $ | 1,599,575 | | | 2.88% | | | 1,460,620 | | | 1.95% | | | 1,306,404 | | | 1.32% | |
| | | | | | | | | | | | | | | | | | | | |
| |
| |
| Table 16 Maturities of Time Deposits of $100,000 or More |
| | | | |
| | | As of December 31, 2006 | |
(In thousands) | | 3 Months or Less | | Over 3 to 6 Months | | Over 6 to 12 Months | | Over 12 Months | | Total | |
| | | | | | | | | | | | |
| Time deposits of $100,000 or more | | $ | 124,452 | | | 101,229 | | | 149,836 | | | 47,255 | | | 422,772 | |
| |
| Table 17 Interest Rate Sensitivity Analysis |
| | | | |
| | | Repricing schedule for interest-earning assets and interest-bearing liabilities held as of December 31, 2006 | |
($ in thousands) | | 3 Months or Less | | Over 3 to 12 Months | | Total Within 12 Months | | Over 12 Months | | Total | |
| | | | | | | | | | | | |
| Earning assets: | | | | | | | | | | | | | | | | |
| Loans, net of deferred fees (1) | | $ | 842,255 | | | 141,622 | | | 983,877 | | | 756,519 | | | 1,740,396 | |
| Securities available for sale | | | 4,472 | | | 21,830 | | | 26,302 | | | 103,662 | | | 129,964 | |
| Securities held to maturity | | | 616 | | | 1,271 | | | 1,887 | | | 11,235 | | | 13,122 | |
| Short-term investments | | | 108,186 | | | | | | 108,186 | | | | | | 108,186 | |
| Total earning assets | | $ | 955,529 | | | 164,723 | | | 1,120,252 | | | 871,416 | | | 1,991,668 | |
| | | | | | | | | | | | | | | | | |
| Percent of total earning assets | | | 47.98 | % | | 8.27 | % | | 56.25 | % | | 43.75 | % | | 100.00 | % |
| Cumulative percent of total earning assets | | | 47.98 | % | | 56.25 | % | | 56.25 | % | | 100.00 | % | | 100.00 | % |
| | | | | | | | | | | | | | | | | |
| Interest-bearing liabilities: | | | | | | | | | | | | | | | | |
| Savings, NOW and money market deposits | | $ | 502,775 | | | | | | 502,775 | | | | | | 502,775 | |
| Time deposits of $100,000 or more | | | 124,452 | | | 251,065 | | | 375,517 | | | 47,255 | | | 422,772 | |
| Other time deposits | | | 145,261 | | | 333,163 | | | 478,424 | | | 74,417 | | | 552,841 | |
Securities sold under agreements to repurchase | | | 43,276 | | | | | | 43,276 | | | | | | 43,276 | |
| Borrowings | | | 204,013 | | | | | | 204,013 | | | 6,000 | | | 210,013 | |
| Total interest-bearing liabilities | | $ | 1,019,777 | | | 584,228 | | | 1,604,005 | | | 127,672 | | | 1,731,677 | |
| | | | | | | | | | | | | | | | | |
| Percent of total interest-bearing liabilities | | | 58.89 | % | | 33.74 | % | | 92.63 | % | | 7.37 | % | | 100.00 | % |
| Cumulative percent of total interest-bearing liabilities | | | 58.89 | % | | 92.63 | % | | 92.63 | % | | 100.00 | % | | 100.00 | % |
| | | | | | | | | | | | | | | | | |
| Interest sensitivity gap | | $ | (64,248 | ) | | (419,505 | ) | | (483,753 | ) | | 743,744 | | | 259,991 | |
| Cumulative interest sensitivity gap | | | (64,248 | ) | | (483,753 | ) | | (483,753 | ) | | 259,991 | | | 259,991 | |
| Cumulative interest sensitivity gap as a percent of total earning assets | | | (3.23 | %) | | (24.29 | %) | | (24.29 | %) | | 13.05 | % | | 13.05 | % |
| Cumulative ratio of interest-sensitive assets to interest-sensitive liabilities | | | 93.70 | % | | 69.84 | % | | 69.84 | % | | 115.01 | % | | 115.01 | % |
| |
| |
| (1) The three months or less category for loans includes $142,348 in adjustable rate loans that have reached their contractual rate caps. |
| |
| |
| |
| Table 18 Contractual Obligations and Other Commercial Commitments |
| | | | |
| | | Payments Due by Period (in thousands) | |
Contractual Obligations
As of December 31, 2006 | | Total | | On Demand or Less than 1 Year | | 1-3 Years | | 4-5 Years | | After 5 Years | |
| Securities sold under agreements to repurchase | | $ | 43,276 | | | 43,276 | | | | | | | | | | |
| Borrowings | | | 210,013 | | | 137,000 | | | 6,000 | | | | | | 67,013 | |
| Operating leases | | | 2,717 | | | 494 | | | 787 | | | 488 | | | 948 | |
| Total contractual cash obligations, excluding deposits | | | 256,006 | | | 180,770 | | | 6,787 | | | 488 | | | 67,961 | |
| | | | | | | | | | | | | | | | | |
| Deposits | | | 1,695,679 | | | 1,574,007 | | | 84,668 | | | 36,777 | | | 227 | |
| Total contractual cash obligations, including deposits | | $ | 1,951,685 | | | 1,754,777 | | | 91,455 | | | 37,265 | | | 68,188 | |
| | | Amount of Commitment Expiration Per Period (in thousands) | |
Other Commercial Commitments
As of December 31, 2006 | | Total Amounts Committed | | Less than 1 Year | | 1-3 Years | | 4-5 Years | | After 5 Years | |
| Credit cards | | $ | 21,005 | | | 10,503 | | | 10,502 | | | | | | | |
| Lines of credit and loan commitments | | | 300,126 | | | 147,565 | | | 20,084 | | | 8,250 | | | 124,227 | |
| Standby letters of credit | | | 4,459 | | | 4,384 | | | 61 | | | 14 | | | | |
| Total commercial commitments | | $ | 325,590 | | | 162,452 | | | 30,647 | | | 8,264 | | | 124,227 | |
| | | | | | | | | | | | | | | | | |
| | | | | | | | | | | | | | | | | |
| |
| |
| Table 19 Market Risk Sensitive Instruments |
| | | | | | | | |
| | | Expected Maturities of Market Sensitive Instruments Held at December 31, 2006 Occurring in Indicated Year | | | | | |
($ in thousands) | | 2007 | | 2008 | | 2009 | | 2010 | | 2011 | | Beyond | | Total | | Average Interest Rate | | Estimated Fair Value | |
| | | | | | | | | | | | | | | | | | | | |
| Due from banks, interest-bearing | | $ | 83,877 | | | | | | | | | | | | | | | | | | 83,877 | | | 5.15% | | $ | 83,877 | |
| Federal funds sold | | | 19,543 | | | | | | | | | | | | | | | | | | 19,543 | | | 5.15% | | | 19,543 | |
| Presold mortgages in process of settlement | | | 4,766 | | | | | | | | | | | | | | | | | | 4,766 | | | 6.00% | | | 4,766 | |
| Debt Securities- at amortized cost (1) (2) | | | 27,009 | | | 43,054 | | | 12,495 | | | 17,779 | | | 13,018 | | | 20,196 | | | 133,551 | | | 5.05% | | | 132,646 | |
| Loans - fixed (3) (4) | | | 169,761 | | | 134,361 | | | 200,753 | | | 118,949 | | | 162,773 | | | 69,420 | | | 856,017 | | | 7.16% | | | 844,049 | |
| Loans - adjustable (3) (4) | | | 310,913 | | | 134,429 | | | 117,699 | | | 103,103 | | | 74,499 | | | 136,884 | | | 877,527 | | | 7.91% | | | 874,864 | |
| Total | | $ | 615,869 | | | 311,844 | | | 330,947 | | | 239,831 | | | 250,290 | | | 226,500 | | | 1,975,281 | | | 7.24% | | $ | 1,959,745 | |
| | | | | | | | | | | | | | | | | | | | | | | | | | | | | |
| Savings, NOW, and money market deposits | | $ | 502,775 | | | | | | | | | | | | | | | – | | | 502,775 | | | 1.71% | | $ | 502,775 | |
| Time deposits | | | 853,941 | | | 58,546 | | | 26,122 | | | 23,597 | | | 13,180 | | | 227 | | | 975,613 | | | 4.69% | | | 975,304 | |
| Securities sold under agreements to repurchase | | | 43,276 | | | | | | | | | | | | | | | | | | 43,276 | | | 3.78% | | | 43,276 | |
| Borrowings - fixed (2) | | | 2,000 | | | 1,000 | | | 5,000 | | | | | | | | | | | | 8,000 | | | 4.70% | | | 8,003 | |
| Borrowings - adjustable | | | 135,000 | | | | | | | | | | | | | | | 67,013 | | | 202,013 | | | 6.26% | | | 202,423 | |
| Total | | $ | 1,536,992 | | | 59,546 | | | 31,122 | | | 23,597 | | | 13,180 | | | 67,240 | | | 1,731,677 | | | 4.48% | | $ | 1,731,781 | |
| | | | | | | | | | | | | | | | | | | | | | | | | | | | | |
| (1) Tax-exempt securities are reflected at a tax-equivalent basis using a 39% tax rate. |
| (2) Securities and borrowings with call dates within 12 months of December 31, 2006 that have above market interest rates are assumed to mature at their call date for purposes of this table. Mortgage securities are assumed to mature in the period of their expected repayment based on estimated prepayment speeds. |
| (3) Excludes nonaccrual loans. |
| (4) Loans are shown in the period of their contractual maturity, except for home equity lines of credit loans which are assumed to repay on a straight-line basis over five years. |
| |
| Table 20 Return on Assets and Equity |
| | | For the Year Ended December 31, |
| | | 2006 | | 2005 | | 2004 |
| | | | | | | | |
| Return on assets | | | 1.00% | | | 0.94% | | | 1.30 | % |
| Return on equity | | | 11.83% | | | 10.39% | | | 13.71 | % |
| Dividend payout ratio | | | 54.81% | | | 61.40% | | | 46.48 | % |
| Average shareholders’ equity to average assets | | | 8.49% | | | 9.06% | | | 9.49 | % |
| | | | | | | | | | | |
| | | | | | | | | | | |
| |
| |
| Table 21 Risk-Based and Leverage Capital Ratios |
| | | | |
| | | As of December 31, | |
($ in thousands) | | 2006 | | 2005 | | 2004 | |
| | | | | | | | |
| Risk-Based and Leverage Capital | | | | | | | | | | |
| Tier I capital: | | | | | | | | | | |
| Common shareholders’ equity | | $ | 162,705 | | | 155,728 | | | 148,478 | |
| Trust preferred securities eligible for Tier I capital treatment | | | 54,235 | | | 40,000 | | | 40,000 | |
| Intangible assets | | | (51,394 | ) | | (49,227 | ) | | (49,330 | ) |
| Accumulated other comprehensive income adjustments | | | | | | | | | (723 | ) |
| Total Tier I leverage capital | | | 170,096 | | | 147,140 | | | 138,425 | |
| | | | | | | | | | | |
| Tier II capital: | | | | | | | | | | |
| Remaining trust preferred securities | | | 10,765 | | | - | | | - | |
| Allowable allowance for loan losses | | | 18,947 | | | 15,716 | | | 14,717 | |
| Tier II capital additions | | | 29,712 | | | 15,716 | | | 14,717 | |
| Total risk-based capital | | $ | 199,808 | | | 162,856 | | | 153,142 | |
| | | | | | | | | | | |
| Total risk weighted assets | | $ | 1,691,666 | | | 1,402,555 | | | 1,267,590 | |
| | | | | | | | | | | |
| Adjusted fourth quarter average assets | | | 1,979,333 | | | 1,711,029 | | | 1,560,472 | |
| | | | | | | | | | | |
Risk-based capital ratios: | | | | | | | | | | |
| Tier I capital to Tier I risk adjusted assets | | | 10.05 | % | | 10.49 | % | | 10.92 | % |
| Minimum required Tier I capital | | | 4.00 | % | | 4.00 | % | | 4.00 | % |
| | | | | | | | | | | |
| Total risk-based capital to Tier II risk-adjusted assets | | | 11.81 | % | | 11.61 | % | | 12.08 | % |
| Minimum required total risk-based capital | | | 8.00 | % | | 8.00 | % | | 8.00 | % |
| | | | | | | | | | | |
Leverage capital ratios: | | | | | | | | | | |
| Tier I leverage capital to adjusted fourth quarter average assets | | | 8.59 | % | | 8.60 | % | | 8.86 | % |
| Minimum required Tier I leverage capital | | | 4.00 | % | | 4.00 | % | | 4.00 | % |
| | | | | | | | | | | |
| |
| |
| Table 22 Quarterly Financial Summary |
| | | | | | |
| | | 2006 | | 2005 | |
($ in thousands except per share data) | | Fourth Quarter | | Third Quarter | | Second Quarter | | First Quarter | | Fourth Qtr (1) | | Third Qtr (1) | | Second Quarter | | First Quarter | |
Income Statement Data | | | | | | | | | | | | | | | | | |
| Interest income, taxable equivalent | | $ | 35,387 | | | 34,040 | | | 31,440 | | | 28,841 | | | 27,853 | | | 26,178 | | | 24,818 | | | 23,028 | |
| Interest expense | | | 16,072 | | | 14,866 | | | 12,871 | | | 10,862 | | | 9,793 | | | 8,715 | | | 7,700 | | | 6,630 | |
| Net interest income, taxable equivalent | | | 19,315 | | | 19,174 | | | 18,569 | | | 17,979 | | | 18,060 | | | 17,463 | | | 17,118 | | | 16,398 | |
| Taxable equivalent, adjustment | | | 117 | | | 133 | | | 125 | | | 126 | | | 113 | | | 111 | | | 111 | | | 113 | |
| Net interest income | | | 19,198 | | | 19,041 | | | 18,444 | | | 17,853 | | | 17,947 | | | 17,352 | | | 17,007 | | | 16,285 | |
| Provision for loan losses | | | 1,293 | | | 1,215 | | | 1,400 | | | 1,015 | | | 925 | | | 690 | | | 845 | | | 580 | |
| Net interest income after provision for losses | | | 17,905 | | | 17,826 | | | 17,044 | | | 16,838 | | | 17,022 | | | 16,662 | | | 16,162 | | | 15,705 | |
| Noninterest income | | | 4,058 | | | 2,454 | | | 3,844 | | | 3,954 | | | 3,803 | | | 3,779 | | | 3,712 | | | 3,710 | |
| Noninterest expense | | | 13,870 | | | 13,535 | | | 13,064 | | | 12,729 | | | 12,175 | | | 11,486 | | | 12,260 | | | 11,715 | |
| Income before income taxes | | | 8,093 | | | 6,745 | | | 7,824 | | | 8,063 | | | 8,650 | | | 8,955 | | | 7,614 | | | 7,700 | |
| Income taxes | | | 2,949 | | | 2,373 | | | 3,029 | | | 3,072 | | | 1,237 | | | 9,646 | | | 2,962 | | | 2,984 | |
| Net income | | | 5,144 | | | 4,372 | | | 4,795 | | | 4,991 | | | 7,413 | | | (691 | ) | | 4,652 | | | 4,716 | |
| |
| | | | | | | | | | | | | | | | | | | | | | | | | | |
Per Share Data | | | | | | | | | | | | | | | | | | | | | | | | | |
| Earnings per share - basic | | $ | 0.36 | | | 0.31 | | | 0.34 | | | 0.35 | | | 0.52 | | | (0.05 | ) | | 0.33 | | | 0.33 | |
| Earnings per share - diluted | | | 0.36 | | | 0.30 | | | 0.33 | | | 0.35 | | | 0.52 | | | (0.05 | ) | | 0.32 | | | 0.33 | |
| Cash dividends declared | | | 0.19 | | | 0.19 | | | 0.18 | | | 0.18 | | | 0.18 | | | 0.18 | | | 0.17 | | | 0.17 | |
| Market Price | | | | | | | | | | | | | | | | | | | | | | | | | |
| High | | $ | 23.43 | | | 21.84 | | | 22.85 | | | 23.90 | | | 22.89 | | | 22.54 | | | 23.16 | | | 27.88 | |
| Low | | | 20.30 | | | 19.47 | | | 19.59 | | | 20.00 | | | 19.32 | | | 19.66 | | | 19.62 | | | 21.43 | |
| Close | | | 21.84 | | | 20.38 | | | 21.00 | | | 22.38 | | | 20.16 | | | 20.04 | | | 22.13 | | | 22.64 | |
| Book value | | | 11.34 | | | 11.40 | | | 11.20 | | | 11.12 | | | 10.94 | | | 10.63 | | | 10.88 | | | 10.66 | |
| Tangible book value | | | 7.76 | | | 7.78 | | | 7.76 | | | 7.69 | | | 7.48 | | | 7.16 | | | 7.40 | | | 7.17 | |
| |
| | | | | | | | | | | | | | | | | | | | | | | | | | |
Selected Average Balances | | | | | | | | | | | | | | | | | | | | | | | | | |
| Assets | | $ | 2,030,366 | | | 1,970,128 | | | 1,886,234 | | | 1,803,312 | | | 1,759,279 | | | 1,720,505 | | | 1,707,112 | | | 1,650,624 | |
| Loans | | | 1,713,803 | | | 1,669,423 | | | 1,593,070 | | | 1,516,456 | | | 1,463,468 | | | 1,433,874 | | | 1,409,118 | | | 1,383,216 | |
| Earning assets | | | 1,893,969 | | | 1,844,560 | | | 1,764,227 | | | 1,682,535 | | | 1,639,823 | | | 1,604,383 | | | 1,592,845 | | | 1,537,165 | |
| Deposits | | | 1,679,747 | | | 1,623,605 | | | 1,569,781 | | | 1,525,167 | | | 1,493,683 | | | 1,467,183 | | | 1,466,893 | | | 1,414,721 | |
| Interest-bearing liabilities | | | 1,632,107 | | | 1,583,827 | | | 1,501,670 | | | 1,431,936 | | | 1,392,921 | | | 1,365,959 | | | 1,361,365 | | | 1,318,731 | |
| Shareholders’ equity | | | 167,276 | | | 164,590 | | | 162,526 | | | 158,380 | | | 154,562 | | | 158,220 | | | 154,540 | | | 152,162 | |
| |
| | | | | | | | | | | | | | | | | | | | | | | | | | |
Ratios (2) | | | | | | | | | | | | | | | | | | | | | | | | | |
| Return on average assets | | | 1.01 | % | | 0.88 | % | | 1.02 | % | | 1.12 | % | | 1.67 | % | | (0.16 | %) | | 1.09 | % | | 1.16 | % |
| Return on average equity | | | 12.20 | % | | 10.54 | % | | 11.83 | % | | 12.78 | % | | 19.03 | % | | (1.73 | %) | | 12.07 | % | | 12.57 | % |
| Equity to assets at end of period | | | 7.62 | % | | 7.85 | % | | 8.03 | % | | 8.33 | % | | 8.65 | % | | 8.59 | % | | 8.87 | % | | 8.94 | % |
| Tangible equity to tangible assets at end of period | | | 5.34 | % | | 5.50 | % | | 5.70 | % | | 5.91 | % | | 6.08 | % | | 5.95 | % | | 6.21 | % | | 6.19 | % |
| Average loans to average deposits | | | 102.03 | % | | 102.82 | % | | 101.48 | % | | 99.43 | % | | 97.98 | % | | 97.73 | % | | 96.06 | % | | 97.77 | % |
| Average earning assets to interest-bearing liabilities | 116.04 | % | | 116.46 | % | | 117.48 | % | | 117.50 | % | | 117.73 | % | | 117.45 | % | | 117.00 | % | | 116.56 | % |
| Net interest margin | | | 4.05 | % | | 4.12 | % | | 4.22 | % | | 4.33 | % | | 4.37 | % | | 4.32 | % | | 4.31 | % | | 4.33 | % |
| Allowance for loan losses to gross loans | | | 1.09 | % | | 1.09 | % | | 1.08 | % | | 1.07 | % | | 1.06 | % | | 1.10 | % | | 1.10 | % | | 1.08 | % |
| Nonperforming loans as a percent of total loans | | | 0.39 | % | | 0.31 | % | | 0.24 | % | | 0.21 | % | | 0.11 | % | | 0.23 | % | | 0.27 | % | | 0.31 | % |
| Nonperforming assets as a percent of total assets | | | 0.39 | % | | 0.34 | % | | 0.30 | % | | 0.25 | % | | 0.17 | % | | 0.31 | % | | 0.36 | % | | 0.40 | % |
| Net charge-offs as a percent of average loans | | | 0.19 | % | | 0.11 | % | | 0.09 | % | | 0.03 | % | | 0.29 | % | | 0.12 | % | | 0.08 | % | | 0.07 | % |
| |
(1) The third-quarter of 2005 includes a contingency tax loss accrual of $6,320,000, or $0.44 per diluted share. The fourth quarter of 2005 includes a reversal of $1,982,000, or $0.14 per diluted share, related to this same accrual (which increased net income) that was recorded because the Company lowered its original estimate of this loss.
(2) Annualized where applicable.
First Bancorp and Subsidiaries
Consolidated Balance Sheets
December 31, 2006 and 2005
($ in thousands) | 2006 | | 2005 | |
| | | | | | |
ASSETS | | | | | | | |
| Cash and due from banks, noninterest-bearing | | $ | 43,248 | | | 32,985 | |
| Due from banks, interest-bearing | | | 83,877 | | | 41,655 | |
| Federal funds sold | | | 19,543 | | | 28,883 | |
| Total cash and cash equivalents | | | 146,668 | | | 103,523 | |
| | | | | | | | |
| Securities available for sale (costs of | | | | | | | |
| $130,824 in 2006 and $114,662 in 2005) | | | 129,964 | | | 113,613 | |
| | | | | | | | |
| Securities held to maturity (fair values of | | | | | | | |
| $13,168 in 2006 and $11,597 in 2005) | | | 13,122 | | | 11,448 | |
| | | | | | | | |
| Presold mortgages in process of settlement | | | 4,766 | | | 3,347 | |
| | | | | | | | |
| Loans | | | 1,740,396 | | | 1,482,611 | |
| Less: Allowance for loan losses | | | (18,947 | ) | | (15,716 | ) |
| Net loans | | | 1,721,449 | | | 1,466,895 | |
| | | | | | | | |
| Premises and equipment | | | 43,540 | | | 34,840 | |
| Accrued interest receivable | | | 12,158 | | | 8,947 | |
| Goodwill | | | 49,505 | | | 47,247 | |
| Other intangible assets | | | 1,889 | | | 1,980 | |
| Other assets | | | 13,563 | | | 9,210 | |
| Total assets | | $ | 2,136,624 | | | 1,801,050 | |
| | | | | | | | |
LIABILITIES | | | | | | | |
| Deposits: Demand - noninterest-bearing | | $ | 217,291 | | | 194,051 | |
| Savings, NOW, and money market | | | 502,775 | | | 458,221 | |
| Time deposits of $100,000 or more | | | 422,772 | | | 356,281 | |
| Other time deposits | | | 552,841 | | | 486,024 | |
| Total deposits | | | 1,695,679 | | | 1,494,577 | |
| Securities sold under agreements to repurchase | | | 43,276 | | | 33,530 | |
| Borrowings | | | 210,013 | | | 100,239 | |
| Accrued interest payable | | | 5,649 | | | 3,835 | |
| Other liabilities | | | 19,302 | | | 13,141 | |
| Total liabilities | | | 1,973,919 | | | 1,645,322 | |
| | | | | | | | |
SHAREHOLDERS’ EQUITY | | | | | | | |
| Common stock, No par value per share | | | | | | | |
| Authorized: 20,000,000 shares | | | | | | | |
Issued and outstanding: 14,352,884 shares in 2006 and 14,229,148 shares in 2005 | | | 56,035 | | | 54,121 | |
| Retained earnings | | | 111,220 | | | 102,507 | |
| Accumulated other comprehensive income (loss) | | | (4,550 | ) | | (900 | ) |
| Total shareholders’ equity | | | 162,705 | | | 155,728 | |
| Total liabilities and shareholders’ equity | | $ | 2,136,624 | | | 1,801,050 | |
See accompanying notes to consolidated financial statements.
First Bancorp and Subsidiaries
Consolidated Statements of Income
Years Ended December 31, 2006, 2005 and 2004
($ in thousands, except per share data) | 2006 | | 2005 | | 2004 | |
| | | | | | | | |
INTEREST INCOME | | | | | | | | | | |
| Interest and fees on loans | | $ | 120,694 | | | 94,097 | | | 76,093 | |
| Interest on investment securities: | | | | | | | | | | |
| Taxable interest income | | | 5,718 | | | 5,184 | | | 4,428 | |
| Tax-exempt interest income | | | 513 | | | 476 | | | 528 | |
| Other, principally overnight investments | | | 2,282 | | | 1,672 | | | 544 | |
| Total interest income | | | 129,207 | | | 101,429 | | | 81,593 | |
| | | | | | | | | | | |
INTEREST EXPENSE | | | | | | | | | | |
| Savings, NOW and money market | | | 7,094 | | | 4,048 | | | 2,530 | |
| Time deposits of $100,000 or more | | | 17,662 | | | 11,425 | | | 6,362 | |
| Other time deposits | | | 21,276 | | | 13,043 | | | 8,334 | |
| Securities sold under agreements to repurchase | | | 1,116 | | | 179 | | | – | |
| Borrowings | | | 7,523 | | | 4,143 | | | 3,077 | |
| Total interest expense | | | 54,671 | | | 32,838 | | | 20,303 | |
| | | | | | | | | | | |
| Net interest income | | | 74,536 | | | 68,591 | | | 61,290 | |
| Provision for loan losses | | | 4,923 | | | 3,040 | | | 2,905 | |
| Net interest income after provision for loan losses | | | 69,613 | | | 65,551 | | | 58,385 | |
| | | | | | | | | | | |
NONINTEREST INCOME | | | | | | | | | | |
| Service charges on deposit accounts | | | 8,968 | | | 8,537 | | | 9,064 | |
| Other service charges, commissions and fees | | | 4,578 | | | 3,963 | | | 3,361 | |
| Fees from presold mortgage loans | | | 1,062 | | | 1,176 | | | 969 | |
| Commissions from sales of insurance and financial products | | | 1,434 | | | 1,307 | | | 1,406 | |
| Data processing fees | | | 162 | | | 279 | | | 416 | |
| Securities gains | | | 205 | | | 5 | | | 299 | |
| Merchant credit card loss | | | (1,900 | ) | | – | | | – | |
| Other gains (losses) | | | (199 | ) | | (263 | ) | | 349 | |
| Total noninterest income | | | 14,310 | | | 15,004 | | | 15,864 | |
| | | | | | | | | | | |
NONINTEREST EXPENSES | | | | | | | | | | |
| Salaries | | | 23,867 | | | 21,921 | | | 20,116 | |
| Employee benefits | | | 6,811 | | | 6,054 | | | 5,488 | |
| Total personnel expense | | | 30,678 | | | 27,975 | | | 25,604 | |
| Occupancy expense | | | 3,447 | | | 3,037 | | | 2,754 | |
| Equipment related expenses | | | 3,419 | | | 2,965 | | | 2,956 | |
| Intangibles amortization | | | 322 | | | 290 | | | 378 | |
| Other operating expenses | | | 15,332 | | | 13,369 | | | 12,025 | |
| Total noninterest expenses | | | 53,198 | | | 47,636 | | | 43,717 | |
| | | | | | | | | | | |
| Income before income taxes | | | 30,725 | | | 32,919 | | | 30,532 | |
| Income taxes | | | 11,423 | | | 16,829 | | | 10,418 | |
| | | | | | | | | | | |
NET INCOME | | $ | 19,302 | | | 16,090 | | | 20,114 | |
| | | | | | | | | | | |
| Earnings per share: | | | | | | | | | | |
| Basic | | $ | 1.35 | | | 1.14 | | | 1.42 | |
| Diluted | | | 1.34 | | | 1.12 | | | 1.40 | |
| | | | | | | | | | | |
| Weighted average common shares outstanding: | | | | | | | | | | |
| Basic | | | 14,294,753 | | | 14,165,992 | | | 14,138,513 | |
| Diluted | | | 14,435,252 | | | 14,360,032 | | | 14,395,152 | |
| | | | | | | | | | | |
See accompanying notes to consolidated financial statements.
First Bancorp and Subsidiaries
Consolidated Statements of Comprehensive Income
Years Ended December 31, 2006, 2005 and 2004
| | | | | | |
($ in thousands) | 2006 | | 2005 | | 2004 | |
| | | | | | | | |
| Net income | | $ | 19,302 | | | 16,090 | | | 20,114 | |
| Other comprehensive income (loss): | | | | | | | | | | |
| Unrealized gains/losses on securities available for sale: | | | | | | | | | | |
| Unrealized holding gains (losses) arising during the period, pretax | | | 394 | | | (2,229 | ) | | (383 | ) |
| Tax benefit (expense) | | | (154 | ) | | 870 | | | 148 | |
| Reclassification to realized gains | | | (205 | ) | | (5 | ) | | (299 | ) |
| Tax expense | | | 80 | | | 2 | | | 117 | |
| Adjustment for pension liability: | | | | | | | | | | |
| Pension benefit (charge) related to unfunded pension liability | | | 16 | | | (90 | ) | | (46 | ) |
| Tax benefit (expense) | | | (6 | ) | | 35 | | | 18 | |
| Other comprehensive income (loss) | | | 125 | | | (1,417 | ) | | (445 | ) |
Comprehensive income | | $ | 19,427 | | | 14,673 | | | 19,669 | |
| | | | | | | | | | | |
See accompanying notes to consolidated financial statements.
First Bancorp and Subsidiaries
Consolidated Statements of Shareholders’ Equity
Years Ended December 31, 2006, 2005 and 2004
| | | Common Stock | | Retained | | Accumulated Other Comprehensive | | Total Share- holders’ | |
(In thousands, except share data) | Shares | | Amount | | Earnings | | Income (Loss) | | Equity | |
| | | | | | | | | | | | |
| | | | | | | | | | | | |
| Balances, January 1, 2004 | | | 14,153 | | $ | 55,392 | | | 85,502 | | | 962 | | | 141,856 | |
| | | | | | | | | | | | | | | | | |
| Net income | | | | | | | | | 20,114 | | | | | | 20,114 | |
| Cash dividends declared ($0.66 per share) | | | | | | | | | (9,269 | ) | | | | | (9,269 | ) |
| Common stock issued under stock option plans | | | 165 | | | 1,081 | | | | | | | | | 1,081 | |
| Common stock issued into dividend reinvestment plan | | | 67 | | | 1,466 | | | | | | | | | 1,466 | |
| Tax benefit realized from exercise of nonqualified stock options | | | – | | | 203 | | | | | | | | | 203 | |
| Purchases and retirement of common stock | | | (301 | ) | | (6,528 | ) | | | | | | | | (6,528 | ) |
| Other comprehensive loss | | | | | | | | | | | | (445 | ) | | (445 | ) |
| | | | | | | | | | | | | | | | | |
| Balances, December 31, 2004 | | | 14,084 | | | 51,614 | | | 96,347 | | | 517 | | | 148,478 | |
| | | | | | | | | | | | | | | | | |
| Net income | | | | | | | | | 16,090 | | | | | | 16,090 | |
| Cash dividends declared ($0.70 per share) | | | | | | | | | (9,930 | ) | | | | | (9,930 | ) |
| Common stock issued under stock option plans | | | 71 | | | 785 | | | | | | | | | 785 | |
| Common stock issued into dividend reinvestment plan | | | 74 | | | 1,604 | | | | | | | | | 1,604 | |
| Tax benefit realized from exercise of nonqualified stock options | | | – | | | 118 | | | | | | | | | 118 | |
| Other comprehensive loss | | | | | | | | | | | | (1,417 | ) | | (1,417 | ) |
| | | | | | | | | | | | | | | | | |
| Balances, December 31, 2005 | | | 14,229 | | | 54,121 | | | 102,507 | | | (900 | ) | | 155,728 | |
| | | | | | | | | | | | | | | | | |
Net income | | | | | | | | | 19,302 | | | | | | 19,302 | |
Cash dividends declared ($0.74 per share) | | | | | | | | | (10,589 | ) | | | | | (10,589 | ) |
Common stock issued under stock option plans | | | 105 | | | 1,027 | | | | | | | | | 1,027 | |
Common stock issued into dividend reinvestment plan | | | 72 | | | 1,557 | | | | | | | | | 1,557 | |
Purchases and retirement of common stock | | | (53 | ) | | (1,112 | ) | | | | | | | | (1,112 | ) |
Tax benefit realized from exercise of nonqualified stock options | | | – | | | 117 | | | | | | | | | 117 | |
Stock-based compensation | | | – | | | 325 | | | | | | | | | 325 | |
Other comprehensive income | | | | | | | | | | | | 125 | | | 125 | |
Adoption of SFAS No. 158 | | | | | | | | | | | | (3,775 | ) | | (3,775 | ) |
| | | | | | | | | | | | | | | | | |
Balances, December 31, 2006 | | | 14,353 | | $ | 56,035 | | | 111,220 | | | (4,550 | ) | | 162,705 | |
| | | | | | | | | | | | | | | | | |
See accompanying notes to consolidated financial statements.
First Bancorp and Subsidiaries
Consolidated Statements of Cash Flows
Years Ended December 31, 2006, 2005 and 2004
($ in thousands) | 2006 | | 2005 | | 2004 | |
Cash Flows From Operating Activities | | | | | | | | | | |
| Net income | | $ | 19,302 | | | 16,090 | | | 20,114 | |
| Reconciliation of net income to net cash provided by operating activities: | | | | | | | | | | |
| Provision for loan losses | | | 4,923 | | | 3,040 | | | 2,905 | |
| Net security premium amortization | | | 86 | | | 120 | | | 152 | |
| Gains on sales of securities available for sale | | | (205 | ) | | (5 | ) | | (299 | ) |
| Other losses (gains) | | | 281 | | | 263 | | | (349 | ) |
| Loan fees and costs deferred, net of amortization | | | 157 | | | (397 | ) | | (390 | ) |
| Depreciation of premises and equipment | | | 2,873 | | | 2,675 | | | 2,553 | |
| Tax benefit realized from exercise of nonqualified stock options | | | – | | | 118 | | | 203 | |
| Stock-based compensation expense | | | 325 | | | – | | | – | |
| Amortization of intangible assets | | | 322 | | | 290 | | | 378 | |
| Deferred income tax benefit | | | (1,341 | ) | | (156 | ) | | (217 | ) |
| Increase in presold mortgages in process of settlement | | | (1,419 | ) | | (1,576 | ) | | (464 | ) |
| Increase in accrued interest receivable | | | (3,176 | ) | | (2,115 | ) | | (745 | ) |
| Decrease in other assets | | | 1,420 | | | 3,447 | | | 2,331 | |
| Increase in accrued interest payable | | | 1,736 | | | 1,158 | | | 539 | |
| Increase (decrease) in other liabilities | | | (226 | ) | | 5,945 | | | 1,175 | |
| Net cash provided by operating activities | | | 25,058 | | | 28,897 | | | 27,886 | |
| | | | | | | | | | | |
Cash Flows From Investing Activities | | | | | | | | | | |
| Proceeds from sales of loans | | | – | | | 276 | | | 49 | |
| Purchases of securities available for sale | | | (62,067 | ) | | (54,130 | ) | | (30,354 | ) |
| Purchases of securities held to maturity | | | (5,052 | ) | | (1,514 | ) | | (707 | ) |
| Proceeds from sales of securities available for sale | | | 1,575 | | | 17 | | | 12,060 | |
| Proceeds from maturities/issuer calls of securities available for sale | | | 44,471 | | | 26,710 | | | 32,673 | |
| Proceeds from maturities/issuer calls of securities held to maturity | | | 3,355 | | | 1,176 | | | 2,033 | |
| Net increase in loans | | | (255,958 | ) | | (120,065 | ) | | (151,103 | ) |
| Purchases of premises and equipment | | | (10,867 | ) | | (7,212 | ) | | (7,335 | ) |
| Net cash received in purchase of branches | | | 34,819 | | | – | | | – | |
| Net cash used by investing activities | | | (249,724 | ) | | (154,742 | ) | | (142,684 | ) |
| | | | | | | | | | | |
Cash Flows From Financing Activities | | | | | | | | | | |
| Net increase in deposits and repurchase agreements | | | 166,871 | | | 139,339 | | | 139,404 | |
| Proceeds from borrowings, net | | | 109,774 | | | 8,000 | | | 15,000 | |
| Cash dividends paid | | | (10,423 | ) | | (9,761 | ) | | (9,138 | ) |
| Proceeds from issuance of common stock | | | 2,584 | | | 2,389 | | | 2,547 | |
| Purchases and retirement of common stock | | | (1,112 | ) | | – | | | (6,528 | ) |
| Tax benefit from exercise of nonqualified stock options | | | 117 | | | – | | | – | |
| Net cash provided by financing activities | | | 267,811 | | | 139,967 | | | 141,285 | |
| | | | | | | | | | | |
Increase in Cash and Cash Equivalents | | | 43,145 | | | 14,122 | | | 26,487 | |
Cash and Cash Equivalents, Beginning of Year | | | 103,523 | | | 89,401 | | | 62,914 | |
| | | | | | | | | | | |
Cash and Cash Equivalents, End of Year | | $ | 146,668 | | | 103,523 | | | 89,401 | |
| | | | | | | | | | | |
Supplemental Disclosures of Cash Flow Information: | | | | | | | | | | |
| Cash paid during the period for: | | | | | | | | | | |
| Interest | | $ | 52,857 | | | 31,680 | | | 19,764 | |
| Income taxes | | | 13,993 | | | 11,925 | | | 9,738 | |
| Non-cash investing and financing transactions: | | | | | | | | | | |
| Foreclosed loans transferred to other real estate | | | 2,021 | | | 2,596 | | | 1,531 | |
| Additions to held to maturity securities and borrowings related to deconsolidation of subsidiary trusts | | | – | | | – | | | 1,239 | |
| Unrealized gain (loss) on securities available for sale, net of taxes | | | 115 | | | (1,362 | ) | | (417 | ) |
| Other real estate transferred to premises and equipment | | | – | | | – | | | 180 | |
See accompanying notes to consolidated financial statements.
First Bancorp and Subsidiaries
Notes to Consolidated Financial Statements
December 31, 2006
Note 1. Summary of Significant Accounting Policies
(a) Basis of Presentation - The consolidated financial statements include the accounts of First Bancorp (the Company) and its wholly owned subsidiaries: First Bank (the Bank); Montgomery Data Services, Inc. (Montgomery Data); and First Bancorp Financial Services, Inc. (First Bancorp Financial). The Bank has one wholly owned subsidiary: First Bank Insurance Services, Inc. (First Bank Insurance). All significant intercompany accounts and transactions have been eliminated.
The Company is a bank holding company. The principal activity of the Company is the ownership and operation of First Bank, a state chartered bank with its main office in Troy, North Carolina. Other subsidiaries include Montgomery Data, a data processing company whose primary client is First Bank, and First Bancorp Financial, a real estate investment subsidiary, both of which are headquartered in Troy. The Company is also the parent company for four statutory trusts that were formed in 2002, 2003, and 2006 for the purpose of issuing a total of $67 million in debt securities. These securities qualify as capital for regulatory capital adequacy requirements. First Bank Insurance is a provider of non-FDIC insured investment and insurance products.
The preparation of financial statements in conformity with accounting principles generally accepted in the United States of America requires management to make estimates and assumptions that affect the reported amounts of assets and liabilities and disclosure of contingent liabilities at the date of the financial statements and the reported amounts of revenues and expenses during the reporting period. Actual results could differ from those estimates. The most significant estimates made by the Company in the preparation of its consolidated financial statements are the determination of the allowance for loan losses, the valuation of other real estate, and fair value estimates for financial instruments.
(b) Cash and Cash Equivalents - The Company considers all highly liquid assets such as cash on hand, noninterest-bearing and interest-bearing amounts due from banks and federal funds sold to be “cash equivalents.”
(c) Securities - Debt securities that the Company has the positive intent and ability to hold to maturity are classified as “held to maturity” and carried at amortized cost. Securities not classified as held to maturity are classified as “available for sale” and carried at fair value, with unrealized gains and losses being reported as other comprehensive income and reported as a separate component of shareholders’ equity.
A decline in the market value of any available for sale or held to maturity security below cost that is deemed to be other than temporary results in a reduction in carrying amount to fair value. The impairment is charged to earnings and a new cost basis for the security is established. Any equity security that is in an unrealized loss position for twelve consecutive months is presumed to be permanently impaired and an impairment charge is recorded unless the amount of the charge is insignificant.
Gains and losses on sales of securities are recognized at the time of sale based upon the specific identification method. Premiums and discounts are amortized into income on a level yield basis, with premiums being amortized to the earliest call date and discounts being accreted to the stated maturity date.
(d) Premises and Equipment - Premises and equipment are stated at cost less accumulated depreciation. Depreciation, computed by the straight-line method, is charged to operations over the estimated useful lives of the properties, which range from 2 to 40 years or, in the case of leasehold improvements, over the term of the lease, if shorter. Maintenance and repairs are charged to operations in the year incurred. Gains and losses on dispositions are included in current operations.
(e) Loans - Loans are stated at the principal amount outstanding, less unearned income and deferred nonrefundable loan fees, net of certain origination costs. Interest on loans is accrued on the unpaid principal balance outstanding. Net deferred loan origination costs/fees are capitalized and recognized as a yield adjustment over the life of the related loan. Unearned income for each of the reporting periods was immaterial.
A loan is placed on nonaccrual status when, in management’s judgment, the collection of interest appears doubtful. The accrual of interest is discontinued on all loans that become 90 days or more past due with respect to principal or interest. The past due status of loans is based on the contractual payment terms. While a loan is on nonaccrual status, the Company’s policy is that all cash receipts are applied to principal. Once the recorded principal balance has been reduced to zero, future cash receipts are applied to recoveries of any amounts previously charged off. Further cash receipts are recorded as interest income to the extent that any interest has been foregone. Loans are removed from nonaccrual status when they become current as to both principal and interest and when concern no longer exists as to the collectibility of principal or interest. In some cases, where borrowers are experiencing financial difficulties, loans may be restructured to provide terms significantly different from the originally contracted terms.
Commercial loans greater than $100,000 that are on nonaccrual status are evaluated regularly for impairment. A loan is considered to be impaired when, based on current information and events, it is probable the Company will be unable to collect all amounts due according to the contractual terms of the loan agreement. Impaired loans are measured using either 1) an estimate of the cash flows that the Company expects to receive from the borrower discounted at the loan’s effective rate, or 2) in the case of a collateral-dependent loan, the fair value of the collateral is used to value the loan. While a loan is considered to be impaired, the Company’s policy is that interest accrual is discontinued and all cash receipts are applied to principal. Once the recorded principal balance has been reduced to zero, future cash receipts are applied to recoveries of any amounts previously charged off. Further cash receipts are recorded as interest income to the extent that any interest has been foregone.
(f) Presold Mortgages in Process of Settlement and Loans Held for Sale - As a part of normal business operations, the Company originates residential mortgage loans that have been pre-approved by secondary investors. The terms of the loans are set by the secondary investors, and the purchase price that the investor will pay for the loan is agreed to prior to the funding of the loan by the Company. Generally within three weeks after funding, the loans are transferred to the investor in accordance with the agreed-upon terms. The Company records gains from the sale of these loans on the settlement date of the sale equal to the difference between the proceeds received and the carrying amount of the loan. The gain generally represents the portion of the proceeds attributed to service release premiums received from the investors and the realization of origination fees received from borrowers which were deferred as part of the carrying amount of the loan. Between the initial funding of the loans by the Company and the subsequent reimbursement by the investors, the Company carries the loans on its balance sheet at the lower of cost or market. During 2006, the Company originated $66,157,000 and received proceeds from sales amounting to $64,738,000 related to these types of loans. During 2005, the Company originated $74,569,000 and received proceeds from sales amounting to $72,993,000 related to these types of loans.
Periodically, the Company originates commercial loans that are intended for resale. The Company carries these loans at the lower of cost or fair value at each reporting date. There were no such loans held for sale as of December 31, 2006 or 2005.
(g) Allowance for Loan Losses - The allowance for loan losses is established through a provision for loan losses charged to expense. Loans are charged-off against the allowance for loan losses when management believes that the collectibility of the principal is unlikely. The provision for loan losses charged to operations is an amount sufficient to bring the allowance for loan losses to an estimated balance considered adequate to absorb losses inherent in the portfolio. Management’s determination of the adequacy of the allowance is based on
an evaluation of the portfolio, current economic conditions, historical loan loss experience and other risk factors. While management uses the best information available to make evaluations, future adjustments may be necessary if economic and other conditions differ substantially from the assumptions used.
In addition, various regulatory agencies, as an integral part of their examination process, periodically review the Bank’s allowance for loan losses. Such agencies may require the Bank to recognize additions to the allowance based on the examiners’ judgment about information available to them at the time of their examinations.
(h) Other Real Estate - Other real estate owned consists primarily of real estate acquired by the Company through legal foreclosure or deed in lieu of foreclosure. The property is initially carried at the lower of cost (generally the loan balance plus additional costs incurred for improvements to the property) or estimated fair value of the property less estimated selling costs. If there are subsequent declines in fair value, the property is written down to its fair value through a charge to expense. Capital expenditures made to improve the property are capitalized. Costs of holding real estate, such as property taxes, insurance and maintenance, less related revenues during the holding period, are charged to operations.
(i) Income Taxes - Income taxes are accounted for under the asset and liability method. Deferred tax assets and liabilities are recognized for the future tax consequences attributable to differences between the financial statement carrying amounts of existing assets and liabilities and their respective tax bases and operating loss and tax credit carryforwards. Deferred tax assets and liabilities are measured using enacted tax rates expected to apply to taxable income in the years in which those temporary differences are expected to be recovered or settled. The effect on deferred tax assets and liabilities of a change in tax rates is recognized in income in the period that includes the enactment date. Deferred tax assets are reduced, if necessary, by the amount of such benefits that are not expected to be realized based upon available evidence. The Company’s investment tax credits, which for the Company are low income housing tax credits and state historic tax credits, are recorded in the period that they are affirmed by the tax credit fund.
(j) Intangible Assets - Business combinations are accounted for using the purchase method of accounting. Identifiable intangible assets are recognized separately and are amortized over their estimated useful lives, which for the Company has generally been seven to ten years and at an accelerated rate. Goodwill is recognized in business combinations to the extent that the price paid exceeds the fair value of the net assets acquired, including any identifiable intangible assets. Goodwill is not amortized, but as discussed in Note 1(o), is subject to fair value impairment tests on at least an annual basis.
(k) Other Investments - The Company accounts for investments in limited partnerships, limited liability companies (“LLCs”), and other privately held companies using either the cost or the equity method of accounting. The accounting treatment depends upon the Company’s percentage ownership and degree of management influence.
Under the cost method of accounting, the Company records an investment in stock at cost and generally recognizes cash dividends received as income. If cash dividends received exceed the investee’s earnings since the investment date, these payments are considered a return of investment and reduce the cost of the investment.
Under the equity method of accounting, the Company records its initial investment at cost. Subsequently, the carrying amount of the investment is increased or decreased to reflect the Company’s share of income or loss of the investee. The Company’s recognition of earnings or losses from an equity method investment is based on the Company’s ownership percentage in the limited partnership or LLCs and the investee’s earnings on a quarterly basis. The limited partnerships and LLCs generally provide their financial information during the quarter following the end of a given period. The Company’s policy is to record its share of earnings or losses on equity method investments in the quarter the financial information is received.
All of the Company’s investments in limited partnerships and LLCs are privately held, and their market values are not readily available. The Company’s management evaluates its investments in limited partnerships and LLCs for impairment based on the investee’s ability to generate cash through its operations or obtain alternative financing, and other subjective factors. There are inherent risks associated with the Company’s investments in limited partnerships and LLCs, which may result in income statement volatility in future periods.
At December 31, 2006 and 2005, the Company’s investments in limited partnerships, LLCs and other privately held companies totaled $2.2 million and $1.5 million respectively, and were included in other assets.
(l) Stock Option Plan - At December 31, 2006, the Company had six stock-based employee compensation plans, which are described more fully in Note 14. The Company accounts for those plans under the recognition and measurement principles of Statement of Financial Accounting Standards No. 123 (revised 2004) (Statement 123(R)), “Share-Based Payment.” Statement 123(R) replaces FASB Statement No. 123 (Statement 123), “Accounting for Stock-Based Compensation,” and supersedes Accounting Principles Board Opinion No. 25 (Opinion 25), “Accounting for Stock Issued to Employees.” Prior to January 1, 2006, the Company accounted for the stock option plans under Opinion 25, and thus, no stock-based employee compensation expense was reflected in net income prior to January 1, 2006. However, Statement 123(R) requires that the compensation cost relating to share-based payment transactions be recognized in the financial statements, and thus stock-based compensation expense has been recognized in the financial statements during 2006.
(m) Per Share Amounts - Basic Earnings Per Share is calculated by dividing net income by the weighted average number of common shares outstanding during the period. Diluted Earnings Per Share is computed by assuming the issuance of common shares for all dilutive potential common shares outstanding during the reporting period. Currently, the Company’s only potential dilutive common stock issuances relate to options that have been issued under the Company’s stock option plans. In computing Diluted Earnings Per Share, it is assumed that all such dilutive stock options are exercised during the reporting period at their respective exercise prices, with the proceeds from the exercises used by the Company to buy back stock in the open market at the average market price in effect during the reporting period. The difference between the number of shares assumed to be exercised and the number of shares bought back is added to the number of weighted average common shares outstanding during the period. The sum is used as the denominator to calculate Diluted Earnings Per Share for the Company.
The following is a reconciliation of the numerators and denominators used in computing Basic and Diluted Earnings Per Share:
| | | For the Years Ended December 31, | |
| | | 2006 | | 2005 | | 2004 | |
($ in thousands, except per share amounts) | | Income (Numer- ator) | | Shares (Denom- inator) | | Per Share Amount | | Income (Numer- ator) | | Shares (Denom- inator) | | Per Share Amount | | Income (Numer- ator) | | Shares (Denom- inator) | | Per Share Amount | |
| | | | | | | | | | | | | | | | | | | | |
| | | | | | | | | | | | | | | | | | | | |
Basic EPS | | $ | 19,302 | | | 14,294,753 | | $ | 1.35 | | $ | 16,090 | | | 14,165,992 | | $ | 1.14 | | $ | 20,114 | | | 14,138,513 | | $ | 1.42 | |
| | | | | | | | | | | | | | | | | | | | | | | | | | | | | |
Effect of dilutive securities | | | – | | | 140,499 | | | | | | – | | | 194,040 | | | | | | – | | | 256,639 | | | | |
| | | | | | | | | | | | | | | | | | | | | | | | | | | | | |
Diluted EPS | | $ | 19,302 | | | 14,435,252 | | $ | 1.34 | | $ | 16,090 | | | 14,360,032 | | $ | 1.12 | | $ | 20,114 | | | 14,395,152 | | $ | 1.40 | |
For the years ended December 31, 2006 and 2005, there were 214,980 and 34,000 options, respectively, that were anti-dilutive because the exercise price exceeded the average market price for the period. For the year ended December 31, 2004, there were no anti-dilutive options since the exercise price for each option outstanding was less that the average market price for the year.
(n) Fair Value of Financial Instruments - Statement of Financial Accounting Standards (“SFAS”) No. 107, “Disclosures About Fair Value of Financial Instruments,” requires that the Company disclose estimated fair values for its financial instruments. Fair value methods and assumptions are set forth below for the Company’s financial instruments.
Cash and Due from Banks, Federal Funds Sold, Presold Mortgages in Process of Settlement, Accrued Interest Receivable, and Accrued Interest Payable - The carrying amounts approximate their fair value because of the short maturity of these financial instruments.
Available for Sale and Held to Maturity Securities - Fair values are based on quoted market prices, where available. If quoted market prices are not available, fair values are based on quoted market prices of comparable instruments.
Loans - Fair values are estimated for portfolios of loans with similar financial characteristics. Loans are segregated by type such as commercial, financial and agricultural, real estate construction, real estate mortgages and installment loans to individuals. Each loan category is further segmented into fixed and variable interest rate terms. For variable rate loans, the carrying value is a reasonable estimate of the fair value. For fixed rate loans, fair value is determined by discounting scheduled future cash flows using current interest rates offered on loans with similar risk characteristics. Fair values for impaired loans are estimated based on discounted cash flows or underlying collateral values, where applicable.
Deposits and Securities Sold Under Agreements to Repurchase - The fair value of securities sold under agreements to repurchase and deposits with no stated maturity, such as non-interest-bearing demand deposits, savings, NOW, and money market accounts, is equal to the amount payable on demand as of the valuation date. The fair value of certificates of deposit is based on the discounted value of contractual cash flows. The discount rate is estimated using the rates currently offered for deposits of similar remaining maturities.
Borrowings - The fair value of borrowings is based on the discounted value of contractual cash flows. The discount rate is estimated using the rates currently offered by the Company’s lenders for debt of similar remaining maturities.
Commitments to Extend Credit and Standby Letters of Credit - At December 31, 2006 and 2005, the Company’s off-balance sheet financial instruments had no carrying value. The large majority of commitments to extend credit and standby letters of credit are at variable rates and/or have relatively short terms to maturity. Therefore, the fair value for these financial instruments is considered to be immaterial.
(o) Impairment - Goodwill is evaluated for impairment on at least an annual basis by comparing the fair value of its reporting units to their related carrying value. If the carrying value of a reporting unit exceeds its fair value, the Company determines whether the implied fair value of the goodwill, using a discounted cash flow analysis, exceeds the carrying value of the goodwill. If the carrying value of the goodwill exceeds the implied fair value of the goodwill, an impairment loss is recorded in an amount equal to that excess.
For all other long-lived assets, including identifiable intangible assets, the Company reviews them for impairment whenever events or changes in circumstances indicate that the carrying value may not be recoverable. The Company’s policy is that an impairment loss is recognized if the sum of the undiscounted future cash flows is less than the carrying amount of the asset. Any long-lived assets to be disposed of are reported at the lower of the carrying amount or fair value, less costs to sell.
To date, the Company has not had to record any impairment write-downs of its long-lived assets or goodwill.
(p) Comprehensive Income - Comprehensive income is defined as the change in equity during a period for non-owner transactions and is divided into net income and other comprehensive income. Other comprehensive income
includes revenues, expenses, gains, and losses that are excluded from earnings under current accounting standards. The components of accumulated other comprehensive income for the Company are as follows:
| | | December 31, 2006 | | December 31, 2005 | | December 31, 2004 | |
| Unrealized gain (loss) on securities available for sale | | $ | (860 | ) | | (1,049 | ) | | 1,186 | |
| Deferred tax asset (liability) | | | 336 | | | 410 | | | (463 | ) |
| Net unrealized gain (loss) on securities available for sale | | | (524 | ) | | (639 | ) | | 723 | |
| | | | | | | | | | | |
| Additional pension liability | | | (6,649 | ) | | (428 | ) | | (338 | ) |
| Deferred tax asset | | | 2,623 | | | 167 | | | 132 | |
| Net additional pension liability | | | (4,026 | ) | | (261 | ) | | (206 | ) |
| | | | | | | | | | | |
| Total accumulated other comprehensive income (loss) | | $ | (4,550 | ) | | (900 | ) | | 517 | |
(q) Segment Reporting - SFAS No. 131, “Disclosures about Segments of an Enterprise and Related Information” requires management to report selected financial and descriptive information about reportable operating segments. It also establishes standards for related disclosures about products and services, geographic areas, and major customers. Generally, disclosures are required for segments internally identified to evaluate performance and resource allocation. The Company’s operations are primarily within the banking segment, and the financial statements presented herein reflect the results of that segment. Also, the Company has no foreign operations or customers.
(r) Reclassifications - Certain amounts for prior years have been reclassified to conform to the 2006 presentation. The reclassifications had no effect on net income or shareholders’ equity as previously presented, nor did they materially impact trends in financial information.
(s) Stock Split - The Company paid a 3-for-2 stock split on November 15, 2004. All previously reported share totals and per share amounts have been adjusted to retroactively reflect the effect of the split.
(t) Recent Accounting Pronouncements - In January 2003, the Financial Accounting Standards Board (“FASB”) issued FASB Interpretation No. 46 (FIN 46), “Consolidation of Variable Interest Entities,” which was subsequently revised in December 2003. FIN 46 addresses the consolidation by business enterprises of certain variable interest entities. The provisions of this interpretation became effective for the Company on January 31, 2003 as it relates to variable interest entities created or purchased after that date. In December 2003, the FASB issued a revision to FIN 46 (FIN 46R), which clarified and interpreted certain of the provisions of FIN 46, without changing the basic accounting model in FIN 46. The provisions of FIN 46R were effective no later than March 31, 2004. The adoption of FIN 46 did not have an impact on the Company’s financial position or results of operations, as the Company had no investments in variable interest entities that required consolidation under FIN 46. The application of FIN 46R during 2004 resulted in the de-consolidation of three trusts that the Company established in order to issue $40 million in trust preferred capital securities. The de-consolidation of the trusts resulted in the Company recording the amount of the junior subordinated debentures between the Company and the trust subsidiary in the amount of $1,239,000. Previously, the junior subordinated debentures were eliminated in consolidation. The impact of this change was to increase both other assets and borrowings by $1,239,000 each. Additional information regarding the Company’s trust preferred securities is included in Note 9.
From November 2003 through November 2005, the FASB issued several sets of guidance relating to the concept of “other-than-temporary impairment” and its applicability to investments. The final guidance, as stated in Staff Position FAS 115-1 and FAS 124-1, “The Meaning of Other-Than-Temporary Impairment and Its Application to
Certain Investments,” requires the disclosure of information about unrealized losses associated with debt and equity securities, while affirming the existing requirements for determining whether impairment is other-than-temporary. The required disclosures are presented in Note 3.
In December 2003, the FASB issued SFAS No. 132 (revised 2003) (Statement 132(R)), “Employers’ Disclosures about Pensions and Other Postretirement Benefits.” Statement 132(R) revises employers’ disclosures about pension plans and other postretirement plans, but does not change the measurement or recognition of those plans. Statement No. 132(R) requires additional disclosures about the assets, obligations, cash flows, and net periodic pension cost of defined benefit plans and other defined benefit postretirement plans. Most of the provisions of Statement 132(R) became effective for financial statements with fiscal years after December 15, 2003, with certain provisions becoming effective for fiscal years ending after June 15, 2004. The additional disclosures required for the Company are included in Note 11.
In December 2003, the American Institute of Certified Public Accountants issued Statement of Position 03-3 (SOP 03-3), “Accounting for Certain Loans or Debt Securities Acquired in a Transfer.” SOP 03-3 provides guidance on the accounting for differences between contractual and expected cash flows from the purchaser’s initial investment in loans or debt securities acquired in a transfer, if those differences are attributable, at least in part, to credit quality. The scope of SOP 03-3 includes loans that have shown evidence of deterioration of credit quality since origination, and includes loans acquired individually, in pools or as part of a business combination. Among other things, SOP 03-3: (1) prohibits the recognition of the excess of contractual cash flows over expected cash flows as an adjustment of yield, loss accrual or valuation allowance at the time of purchase; (2) requires that subsequent increases in expected cash flows be recognized prospectively through an adjustment of yield; and (3) requires that subsequent decreases in expected cash flows be recognized as impairment. In addition, SOP 03-3 prohibits the creation or carrying over of a valuation allowance in the initial accounting of all loans within the scope that are acquired in a transfer. Under SOP 03-3, the difference between expected cash flows and the purchase price is accreted as an adjustment to yield over the life of the loans. For loans acquired in a business combination that have shown deterioration of credit quality since origination, SOP 03-3 represents a significant change from the previous purchase accounting practice whereby the acquiree’s allowance for loan losses is typically added to the acquirer’s allowance for loan losses. SOP 03-3 became effective for loans or debt securities acquired by the Company beginning on January 1, 2005. The adoption of this statement in the first quarter of 2005 did not have an impact on the Company’s financial statements; however it will change, on a prospective basis, the way that the Company accounts for loans and debt securities that it acquires in the future.
In March 2004, the Securities and Exchange Commission (the “SEC”) issued Staff Accounting Bulletin No. 105 (SAB 105), “Application of Accounting Principles to Loan Commitments.” SAB 105 summarizes the views of the SEC staff regarding the application of generally accepted accounting principles to loan commitments accounted for as derivatives, and its provisions were required for such loan commitments entered into subsequent to March 31, 2004. The adoption of SAB 105 did not have a material impact on the Company’s consolidated financial statements.
On January 1, 2006, the Company adopted SFAS No. 123 (revised 2004) (Statement 123(R)), “Share-Based Payment,” which was issued in December 2004. Statement 123(R) replaces FASB Statement No. 123 (Statement 123), “Accounting for Stock-Based Compensation,” and supersedes Accounting Principles Board Opinion No. 25 (Opinion 25), “Accounting for Stock Issued to Employees.” Statement 123(R) requires that the compensation cost relating to share-based payment transactions be recognized in the financial statements. Statement 123(R) permits public companies to adopt its requirements using one of two methods. The “modified prospective” method recognizes compensation for all stock options granted after the date of adoption and for all previously granted stock options that become vested after the date of adoption. The “modified retrospective” method includes the requirements of the “modified prospective” method described above, but also permits entities to restate prior period results based on the amounts previously presented under Statement 123 for purposes of pro-forma disclosures. The Company has elected to adopt Statement 123(R) under the “modified prospective” method and accordingly has not restated prior period results. See Note 14 for a more detailed description the Company’s adoption of Statement 123(R).
In May 2005, the FASB issued SFAS No. 154 (Statement 154), "Accounting Changes and Error Corrections, a replacement of APB Opinion No. 20 and FASB Statement No. 3." Statement 154 applies to all voluntary changes in accounting principle as well as to changes required by an accounting pronouncement that does not include specific transition provisions. Statement 154 eliminates the previous requirement that the cumulative effect of changes in accounting principle be reflected in the income statement in the period of change. Instead, to enhance the comparability of prior period financial statements, Statement 154 requires that changes in accounting principle be retrospectively applied. Under retrospective application, the new accounting principle is applied as of the beginning of the first period presented, as if that principle had always been used. Statement 154 carries forward the requirement that an error be reported by restating prior period financial statement as of the beginning of the first period. Statement 154 is effective for accounting changes and corrections of errors made in fiscal years beginning after December 15, 2005. The initial adoption of Statement 154 did not have a material impact on the Company's financial statements; however the adoption of this statement could result in a material change to the way the Company reflects future changes in accounting principles, depending on the nature of future changes in accounting principles and whether specific transition provisions are included.
In December 2005, the FASB issued Staff Position SOP 94-6-1, “Terms of Loan Products that May Give Rise to a Concentration of Credit Risk” (“FSP SOP 94-6-1”). FSP SOP 94-6-1 addresses 1) the circumstances under which the terms of loan products give rise to a concentration of credit risk, and 2) the disclosures or other accounting considerations that apply for entities that originate, hold guarantee, service, or invest in loan products with terms that may give rise to a concentration of credit risk. The disclosures required by FSB SOP 94-6-1 are required for interim and annual periods ending after December 19, 2005. See Note 12 for this discussion as it relates to the Company.
In July 2006, the FASB released FASB Interpretation No. 48, “Accounting for Uncertainty in Income Taxes, an interpretation of FASB Statement No. 109” (FIN 48). FIN 48 clarifies the accounting and reporting for uncertainties in income tax law. FIN 48 prescribes a comprehensive model for the financial statement recognition, measurement, presentation and disclosure of uncertain tax positions taken or expected to be taken in income tax returns. The Company will adopt FIN 48 in the first quarter of 2007. The cumulative effect of applying the provisions of this interpretation is required to be reported separately as an adjustment to the opening balance of retained earnings in the year of adoption. The Company does not expect the adoption of FIN 48 to materially impact the Company’s consolidated financial statements.
In September 2006, the SEC issued Staff Accounting Bulletin No. 108 (SAB 108). SAB 108 provides guidance on the consideration of the effects of prior year misstatements in quantifying current year misstatements for the purpose of a materiality assessment. The bulletin is effective for the first fiscal year ending after November 15, 2006. The adoption of SAB 108 did not materially impact the Company’s consolidated financial statements.
In September 2006, the FASB issued SFAS No. 157 (Statement 157), “Fair Value Measurements.” Statement 157 provides enhanced guidance for using fair value to measure assets and liabilities. The standard also requires expanded disclosures about the extent to which companies measure assets and liabilities at fair value, the information used to measure fair value, and the effect of fair value measurements on earnings. Statement 157 is effective for financial statements issued for fiscal years beginning after November 15, 2007, and interim periods within those fiscal years. The Company does not expect the adoption of Statement 157 to materially impact the Company’s consolidated financial statements.
In September 2006, the FASB issued SFAS No. 158 (Statement 158), “Employers’ Accounting for Defined Benefit Pension and Other Postretirement Plans.” Statement 158 requires an employer to: (a) recognize in its statement of financial position an asset for a plan’s overfunded status or a liability for a plan’s underfunded status (b) measure a plan’s assets and its obligations that determine its funded status as of the end of the employer’s
fiscal year (with limited exceptions) and (c) recognize changes in the funded status of a defined benefit postretirement plan in the year in which the changes occur. Those changes will be reported in comprehensive income. The requirement to recognize the funded status of a benefit plan and the disclosure requirements are effective as of the end of the fiscal year ending after December 15, 2006, whereas the measurement date provisions are effective for fiscal years ending after December 15, 2008. The Company currently measures its plan assets and obligations at the end of its fiscal year, and thus the measurement date requirements will not impact the Company. The Company adopted the funded status and disclosure requirements of Statement 158 as of December 31, 2006. The impact of the adoption of Statement 158 is presented in the following table. See Note 11 for additional disclosures required by Statement 158.
(In thousands) | | Balances at December 31, 2006 - Before Application of Statement 158 | | Adjustments | | Balances at December 31, 2006 - After Application of Statement 158 | |
| | | | | | | | |
| Intangible pension asset | | $ | 237 | | | (237 | ) | | – | |
| Deferred income tax asset | | | 162 | | | 2,461 | | | 2,623 | |
| Total assets | | | 2,134,400 | | | 2,224 | | | 2,136,624 | |
| Liability for pension benefits | | | 650 | | | 5,999 | | | 6,649 | |
| Total liabilities | | | 1,967,920 | | | 5,999 | | | 1,973,919 | |
| Accumulated other comprehensive loss | | | (775 | ) | | (3,775 | ) | | (4,550 | ) |
| Total shareholders’ equity | | | 166,480 | | | (3,775 | ) | | 162,705 | |
In February 2007, the FASB issued SFAS No. 159, “The Fair Value Option for Financial Assets and Financial Liabilities - Including an amendment of FASB Statement No. 115.” This statement permits, but does not require, entities to measure many financial instruments at fair value. The objective is to provide entities with an opportunity to mitigate volatility in reported earnings caused by measuring related assets and liabilities differently without having to apply complex hedge accounting provisions. Entities electing this option will apply it when the entity first recognizes an eligible instrument and will report unrealized gains and losses on such instruments in current earnings. This statement 1) applies to all entities, 2) specifies certain election dates, 3) can be applied on an instrument-by-instrument basis with some exceptions, 4) is irrevocable and 5) applies only to entire instruments. One exception is demand deposit liabilities which are explicitly excluded as qualifying for fair value. With respect to SFAS 115, available-for-sale and held-to-maturity securities at the effective date are eligible for the fair value option at that date. If the fair value option is elected for those securities at the effective date, cumulative unrealized gains and losses at that date shall be included in the cumulative-effect adjustment and thereafter, such securities will be accounted for as trading securities. SFAS 159 is effective for the Company on January 1, 2008. Earlier adoption is permitted in 2007 if the Company also elects to apply the provisions of SFAS 157, “Fair Value Measurement.” The Company is currently analyzing the fair value option provided under SFAS 159.
Note 2. Completed Acquisitions
There were no acquisitions during 2004 or 2005. The Company completed two branch purchases during 2006. The results of each acquired branch are included in the Company’s results for the period ended December 31, 2006 beginning on their respective acquisition dates.
(a) On July 7, 2006, the Company completed the purchase of a branch of First Citizens Bank located in Dublin, Virginia. The Company assumed the branch’s $21 million in deposits. No loans were acquired in this transaction. The primary reason for this acquisition was to increase the Company’s presence in southwestern Virginia, a market in which the Company already had three branches with a large customer base. The Company paid a deposit premium for the branch of approximately $994,000, all of which is deductible for tax purposes. The identifiable intangible asset associated with the fair value of the core deposit base, as determined by an independent consulting firm, was determined to be $269,000 and is being amortized as expense on an accelerated basis over an eight year period based on an amortization schedule provided by the consulting firm. The weighted-average amortization period is approximately 2.2 years. The remaining intangible asset of $725,000 has been classified as goodwill, and thus is not being systematically amortized, but rather is subject to an annual impairment test. The primary factors that contributed to a purchase price that resulted in recognition of goodwill were the Company’s desire to expand its presence in southwestern Virginia with facilities, operations and experienced staff in place. This branch’s operations are included in the accompanying Consolidated Statements of Income beginning on the acquisition date of July 7, 2006. Historical pro forma information is not presented due to the immateriality of this transaction to the overall consolidated financial statements of the Company.
(b) On September 1, 2006, the Company completed the purchase of a branch of Bank of the Carolinas in Carthage, North Carolina. The Company assumed the branch’s $24 million in deposits and $6 million in loans. The primary reason for this acquisition was to increase the Company’s presence in Moore County, a market in which the Company already had ten branches with a large customer base. The Company paid a deposit premium for the branch of approximately $1,768,000, all of which is deductible for tax purposes. The identifiable intangible asset associated with the fair value of the core deposit base, as determined by an independent consulting firm, was determined to be approximately $235,000 and is being amortized as expense on an accelerated basis over a thirteen year period based on an amortization schedule provided by the consulting firm. The weighed-average amortization period is approximately 3.2 years. The remaining intangible asset of $1,533,000 has been classified as goodwill, and thus is not being systematically amortized, but rather is subject to an annual impairment test. The primary factors that contributed to a purchase price that resulted in recognition of goodwill were the Company’s desire to expand in an existing high-growth market with facilities, operations and experienced staff in place. This branch’s operations are included in the accompanying Consolidated Statements of Income beginning on the acquisition date of September 1, 2006. Historical pro forma information is not presented due to the immateriality of this transaction to the overall consolidated financial statements of the Company.
Note 3. Securities
The book values and approximate fair values of investment securities at December 31, 2006 and 2005 are summarized as follows:
| | | 2006 | | 2005 | |
| | | Amortized | | Fair | | Unrealized | | Amortized | | Fair | | Unrealized | |
(In thousands) | | Cost | | Value | | Gains | | (Losses) | | Cost | | Value | | Gains | | (Losses) | |
| | | | | | | | | | | | | | | | | | |
| Securities available for sale: | | | | | | | | | | | | | | | | | | | | | | | | | |
| Government-sponsored enterprise securities | | $ | 63,004 | | | 62,456 | | | 16 | | | (564 | ) | | 45,258 | | | 44,481 | | | – | | | (777 | ) |
| Mortgage-backed securities | | | 44,572 | | | 43,442 | | | 4 | | | (1,134 | ) | | 49,235 | | | 47,928 | | | 13 | | | (1,320 | ) |
| Corporate bonds | | | 12,853 | | | 13,580 | | | 810 | | | (83 | ) | | 13,929 | | | 14,912 | | | 1,067 | | | (84 | ) |
| Equity securities | | | 10,395 | | | 10,486 | | | 97 | | | (6 | ) | | 6,240 | | | 6,292 | | | 56 | | | (4 | ) |
| Total available for sale | | $ | 130,824 | | | 129,964 | | | 927 | | | (1,787 | ) | | 114,662 | | | 113,613 | | | 1,136 | | | (2,185 | ) |
| | | | | | | | | | | | | | | | | | | | | | | | | | |
| Securities held to maturity: | | | | | | | | | | | | | | | | | | | | | | | | | |
| State and local governments | | $ | 13,089 | | | 13,135 | | | 98 | | | (52 | ) | | 11,382 | | | 11,531 | | | 181 | | | (32 | ) |
| Other | | | 33 | | | 33 | | | – | | | – | | | 66 | | | 66 | | | – | | | – | |
| Total held to maturity | | $ | 13,122 | | | 13,168 | | | 98 | | | (52 | ) | | 11,448 | | | 11,597 | | | 181 | | | (32 | ) |
Included in mortgage-backed securities at December 31, 2006 were collateralized mortgage obligations with an amortized cost of $11,898,000 and a fair value of $11,517,000. Included in mortgage-backed securities at December 31, 2005 were collateralized mortgage obligations with an amortized cost of $15,810,000 and a fair value of $15,399,000.
The Company owned Federal Home Loan Bank stock with a cost and fair value of $10,036,000 at December 31, 2006 and $5,930,000 at December 31, 2005, which is included in equity securities above and serves as part of the collateral for the Company’s line of credit with the Federal Home Loan Bank (see Note 9 for additional discussion). The investment in this stock is a requirement for membership in the Federal Home Loan Bank system.
The following table presents information regarding securities with unrealized losses at December 31, 2006:
| | | Securities in an Unrealized Loss Position for Less than 12 Months | | Securities in an Unrealized Loss Position for More than 12 Months | | Total | |
(in thousands) | | Fair Value | | Unrealized Losses | | Fair Value | | Unrealized Losses | | Fair Value | | Unrealized Losses | |
| Government-sponsored enterprise securities | | $ | 7,985 | | | 15 | | | 39,465 | | | 549 | | | 47,450 | | | 564 | |
| Mortgage-backed securities | | | 799 | | | 1 | | | 38,985 | | | 1,133 | | | 39,784 | | | 1,134 | |
| Corporate bonds | | | 3,249 | | | 5 | | | 3,022 | | | 78 | | | 6,271 | | | 83 | |
| Equity securities | | | 27 | | | 5 | | | 15 | | | 1 | | | 42 | | | 6 | |
| State and local governments | | | 2,537 | | | 26 | | | 1,050 | | | 26 | | | 3,587 | | | 52 | |
| Total temporarily impaired securities | | $ | 14,597 | | | 52 | | | 82,537 | | | 1,787 | | | 97,134 | | | 1,839 | |
| | | | | | | | | | | | | | | | | | | | |
The following table presents information regarding securities with unrealized losses at December 31, 2005:
(in thousands) | | Securities in an Unrealized Loss Position for Less than 12 Months | | Securities in an Unrealized Loss Position for More than 12 Months | | Total | |
| | | Fair Value | | Unrealized Losses | | Fair Value | | Unrealized Losses | | Fair Value | | Unrealized Losses | |
| Government-sponsored enterprise securities | | $ | 25,004 | | | 380 | | | 16,477 | | | 397 | | | 41,481 | | | 777 | |
| Mortgage-backed securities | | | 30,729 | | | 667 | | | 15,955 | | | 653 | | | 46,684 | | | 1,320 | |
| Corporate bonds | | | – | | | – | | | 3,016 | | | 84 | | | 3,016 | | | 84 | |
| Equity securities | | | 38 | | | 4 | | | – | | | – | | | 38 | | | 4 | |
| State and local governments | | | 1,921 | | | 15 | | | 417 | | | 17 | | | 2,338 | | | 32 | |
| Total temporarily impaired securities | | $ | 57,692 | | | 1,066 | | | 35,865 | | | 1,151 | | | 93,557 | | | 2,217 | |
| | | | | | | | | | | | | | | | | | | | |
In the above tables, all of the non-equity securities that were in an unrealized loss position at December 31, 2006 and 2005 are bonds that the Company has determined are in a loss position due to interest rate factors, and not because of credit quality concerns. The Company has the ability and intent to hold these investments until maturity with no accounting loss. The Company has concluded that each of the equity securities in an unrealized loss position at December 31, 2006 and 2005 were in such a position due to minor temporary fluctuations in the market prices of the securities. The Company’s policy is to record an impairment charge for any of these equity securities that remains in an unrealized loss position for twelve consecutive months unless the amount is insignificant.
The aggregate carrying amount of cost-method investments was $10,204,000 and $6,079,000 at December 31, 2006 and 2005, respectively, which included the Federal Home Loan Bank stock discussed above. The Company determined that none of its cost-method investments were impaired at either year end.
The book values and approximate fair values of investment securities at December 31, 2006, by contractual maturity, are summarized in the table below. Expected maturities may differ from contractual maturities because issuers may have the right to call or prepay obligations with or without call or prepayment penalties.
| | | Securities Available for Sale | | Securities Held to Maturity | |
| | | Amortized | | Fair | | Amortized | | Fair | |
(In thousands) | | Cost | | Value | | Cost | | Value | |
| | | | | | | | | | |
| Debt securities | | | | | | | | | | | | | |
| Due within one year | | $ | 14,590 | | | 14,436 | | $ | 1,564 | | | 1,568 | |
| Due after one year but within five years | | | 46,414 | | | 46,020 | | | 4,769 | | | 4,804 | |
| Due after five years but within ten years | | | 8,092 | | | 8,009 | | | 2,174 | | | 2,204 | |
| Due after ten years | | | 6,761 | | | 7,571 | | | 4,615 | | | 4,592 | |
| Mortgage-backed securities | | | 44,572 | | | 43,442 | | | – | | | – | |
| Total debt securities | | | 120,429 | | | 119,478 | | | 13,122 | | | 13,168 | |
| | | | | | | | | | | | | | |
| Equity securities | | | 10,395 | | | 10,486 | | | – | | | – | |
| Total securities | | $ | 130,824 | | | 129,964 | | $ | 13,122 | | | 13,168 | |
At December 31, 2006 and 2005, investment securities with book values of $92,161,000 and $88,581,000, respectively, were pledged as collateral for public and private deposits and securities sold under agreements to repurchase.
Sales of securities available for sale with aggregate proceeds of $1,575,000 in 2006, $17,000 in 2005, and $12,060,000 in 2004 resulted in gross gains of $205,000 and no gross losses in 2006, resulted in gross gains of $5,000 and no gross losses in 2005, and gross gains of $299,000 and no gross losses in 2004.
Note 4. Loans and Allowance for Loan Losses
Loans at December 31, 2006 and 2005 are summarized as follows:
(In thousands) | | 2006 | | 2005 | |
| | | | | | |
| Commercial, financial, and agricultural | | $ | 165,214 | | | 135,942 | |
| Real estate - construction | | | 155,440 | | | 125,158 | |
| Real estate - mortgage - residential (1-4 family) | | | 718,052 | | | 668,328 | |
| Real estate - mortgage - commercial and other | | | 626,501 | | | 481,740 | |
| Installment loans to individuals | | | 75,162 | | | 71,259 | |
| Subtotal | | | 1,740,369 | | | 1,482,427 | |
| Unamortized net deferred loan costs (fees) | | | 27 | | | 184 | |
| Loans, net of deferred fees | | $ | 1,740,396 | | | 1,482,611 | |
Loans in the amounts of $1,262,729,000 and $1,129,900,000 as of December 31, 2006 and 2005, respectively, are pledged as collateral for certain borrowings (see Note 9). The loans above also include loans to executive officers and directors and to their associates totaling approximately $10,296,000 and $12,857,000 at December 31, 2006 and 2005, respectively. During 2006, additions to such loans were approximately $3,349,000 and repayments totaled approximately $5,910,000. These loans were made on substantially the same terms, including interest rates and collateral, as those prevailing at the time for comparable transactions with other non-related borrowers. Management does not believe these loans involve more than the normal risk of collectibility or present other unfavorable features.
Nonperforming assets at December 31, 2006 and 2005 were as follows:
(In thousands) | | 2006 | | 2005 | |
| | | | | | |
| Loans: Nonaccrual loans | | $ | 6,852 | | | 1,640 | |
| Restructured loans | | | 10 | | | 13 | |
| Accruing loans greater than 90 days past due | | | - | | | - | |
| Total nonperforming loans | | | 6,862 | | | 1,653 | |
| Other real estate (included in other assets) | | | 1,539 | | | 1,421 | |
| Total nonperforming assets | | $ | 8,401 | | | 3,074 | |
| | | | | | | | |
If the nonaccrual loans and restructured loans as of December 31, 2006, 2005 and 2004 had been current in accordance with their original terms and had been outstanding throughout the period (or since origination if held for part of the period), gross interest income in the amounts of approximately $510,000, $123,000 and $247,000 for nonaccrual loans and $1,000, $2,000 and $2,000 for restructured loans would have been recorded for 2006, 2005 and 2004, respectively. Interest income on such loans that was actually collected and included in net income in 2006, 2005 and 2004 amounted to approximately $179,000, $67,000 and $120,000 for nonaccrual loans (prior to their being placed on nonaccrual status) and $1,000, $2,000 and $2,000 for restructured loans, respectively. At December 31, 2006 and 2005, the Company had no commitments to lend additional funds to debtors whose loans were nonperforming.
Activity in the allowance for loan losses for the years ended December 31, 2006, 2005 and 2004 was as follows:
(In thousands) | | 2006 | | 2005 | | 2004 | |
| | | | | | | | |
| Balance, beginning of year | | $ | 15,716 | | | 14,717 | | | 13,569 | |
| Provision for loan losses | | | 4,923 | | | 3,040 | | | 2,905 | |
| Recoveries of loans charged-off | | | 273 | | | 322 | | | 181 | |
| Loans charged-off | | | (2,017 | ) | | (2,363 | ) | | (1,938 | ) |
| Allowance recorded related to loans assumed in corporate acquisitions | | | 52 | | | – | | | – | |
| Balance, end of year | | $ | 18,947 | | | 15,716 | | | 14,717 | |
| | | | | | | | | | | |
At December 31, 2006 and 2005, the recorded investment in loans considered to be impaired was $2,864,000 and $338,000, respectively, of which all were on a nonaccrual basis at each year end. The related allowance for loan losses for the impaired loans at December 31, 2006 and 2005 was $511,000 and $100,000, respectively. At December 31, 2006, there was $842,000 in impaired loans that did not have a related allowance. At December 31, 2005, there were no impaired loans that did not have a related allowance. The average recorded investments in impaired loans during the years ended December 31, 2006, 2005, and 2004 was approximately $1,445,000, $1,474,000, and $1,317,000, respectively. For the years ended December 31, 2006, 2005, and 2004, the Company recognized no interest income on these loans during the period that they were considered to be impaired.
Note 5. Premises and Equipment
Premises and equipment at December 31, 2006 and 2005 consisted of the following:
(In thousands) | | 2006 | | 2005 | |
| | | | | | |
| Land | | $ | 12,547 | | | 7,819 | |
| Buildings | | | 30,735 | | | 27,097 | |
| Furniture and equipment | | | 21,674 | | | 19,118 | |
| Leasehold improvements | | | 1,305 | | | 1,204 | |
| Total cost | | | 66,261 | | | 55,238 | |
| Less accumulated depreciation and amortization | | | (22,721 | ) | | (20,398 | ) |
| Net book value of premises and equipment | | $ | 43,540 | | | 34,840 | |
Note 6. Goodwill and Other Intangible Assets
The following is a summary of the gross carrying amount and accumulated amortization of amortized intangible assets as of December 31, 2006 and December 31, 2005 and the carrying amount of unamortized intangible assets as of December 31, 2006 and December 31, 2005.
| | | December 31, 2006 | | December 31, 2005 | |
(In thousands) | | Gross Carrying Amount | | Accumulated Amortization | | Gross Carrying Amount | | Accumulated Amortization | |
| Amortized intangible assets: | | | | | | | | | | | | | |
| Customer lists | | $ | 394 | | | 148 | | | 394 | | | 117 | |
| Core deposit premiums | | | 2,945 | | | 1,302 | | | 2,441 | | | 1,011 | |
| Total | | $ | 3,339 | | | 1,450 | | | 2,835 | | | 1,128 | |
| | | | | | | | | | | | | | |
| Unamortized intangible assets: | | | | | | | | | | | | | |
| Goodwill | | $ | 49,505 | | | | | | 47,247 | | | | |
| Pension | | $ | – | | | | | | 273 | | | | |
| | | | | | | | | | | | | | |
As a result of two branch acquisitions (see discussion in Note 2), gross core deposit premiums increased $504,000 and goodwill increased $2,258,000 during 2006.
The following table presents the estimated amortization expense for intangible assets for each of the five calendar years ending December 31, 2011 and the estimated amount amortizable thereafter. These estimates are subject to change in future periods to the extent management determines it is necessary to make adjustments to the carrying value or estimated useful lives of amortized intangible assets.
(In thousands) | | Estimated Amortization Expense | |
| 2007 | | $ | 374 | |
| 2008 | | | 316 | |
| 2009 | | | 279 | |
| 2010 | | | 262 | |
| 2011 | | | 247 | |
| Thereafter | | | 411 | |
| Total | | $ | 1,889 | |
| | | | | |
Note 7. Income Taxes
Total income taxes for the years ended December 31, 2006, 2005 and 2004 were allocated as follows:
(In thousands) | | 2006 | | 2005 | | 2004 | |
| | | | | | | | |
| Allocated to net income | | $ | 11,423 | | | 16,829 | | | 10,418 | |
| Allocated to stockholders’ equity, for unrealized holding gain/loss on debt and equity securities for financial reporting purposes | | | 74 | | | (872 | ) | | (265 | ) |
| Allocated to stockholders’ equity, for tax benefit of pension liabilities | | | (2,456 | ) | | (35 | ) | | (18 | ) |
| Total income taxes | | $ | 9,041 | | | 15,922 | | | 10,135 | |
The components of income tax expense (benefit) for the years ended December 31, 2006, 2005 and 2004 were as follows:
(In thousands) | | 2006 | | 2005 | | 2004 | |
| | | | | | | | |
| Current - Federal | | $ | 10,809 | | | 8,285 | | | 10,407 | |
| - State | | | 1,927 | | | 8,700 | | | 228 | |
| Deferred - Federal | | | (1,112 | ) | | (124 | ) | | (192 | ) |
| - State | | | (201 | ) | | (32 | ) | | (25 | ) |
| Total | | $ | 11,423 | | | 16,829 | | | 10,418 | |
The sources and tax effects of temporary differences that gave rise to significant portions of the deferred tax assets (liabilities) at December 31, 2006 and 2005 are presented below:
(In thousands) | | 2006 | | 2005 | |
| | | | | | |
| Deferred tax assets: | | | | | | | |
| Allowance for loan losses | | $ | 7,436 | | | 6,075 | |
| Excess book over tax SERP retirement plan cost | | | 989 | | | 739 | |
| Basis of investment in subsidiary | | | 69 | | | 69 | |
| Reserve for employee medical expense for financial reporting purposes | | | 20 | | | 20 | |
| Deferred compensation | | | 183 | | | 180 | |
| State net operating loss carryforwards | | | 230 | | | 282 | |
| Trust preferred security issuance costs | | | 284 | | | 206 | |
| Accruals, book versus tax | | | 171 | | | 154 | |
| Pension liability adjustments | | | 2,623 | | | 167 | |
| Unrealized loss on securities available for sale | | | 335 | | | 409 | |
| All other | | | 378 | | | 27 | |
| Gross deferred tax assets | | | 12,718 | | | 8,328 | |
| Less: Valuation allowance | | | (239 | ) | | (275 | ) |
| Net deferred tax assets | | | 12,479 | | | 8,053 | |
| Deferred tax liabilities: | | | | | | | |
| Loan fees | | | (1,227 | ) | | (1,115 | ) |
| Excess tax over book pension cost | | | (545 | ) | | (603 | ) |
| Depreciable basis of fixed assets | | | (1,610 | ) | | (1,689 | ) |
| Amortizable basis of intangible assets | | | (3,991 | ) | | (3,166 | ) |
| Net loan fees recognized for tax reporting purposes | | | (7 | ) | | (69 | ) |
| FHLB stock dividends | | | (436 | ) | | (436 | ) |
| Book versus tax basis difference - securities | | | – | | | (7 | ) |
| Gross deferred tax liabilities | | | (7,816 | ) | | (7,085 | ) |
| Net deferred tax asset - included in other assets | | $ | 4,663 | | | 968 | |
A portion of the annual change in the net deferred tax liability relates to unrealized gains and losses on securities available for sale. The related 2006 and 2005 deferred tax expense (benefit) of approximately $74,000 and ($872,000), respectively, has been recorded directly to shareholders’ equity. Additionally, a portion of the annual change in the net deferred tax liability relates to pension adjustments. The related 2006 and 2005 deferred
tax benefit of $2,456,000 and $35,000, respectively, has been recorded directly to shareholders’ equity. The balance of the 2006 and 2005 increase in the net deferred tax asset of $1,313,000 and $156,000, respectively, is reflected as a deferred income tax benefit in the consolidated statements of income.
The valuation allowances for 2006 and 2005 relate primarily to state net operating loss carryforwards. It is management’s belief that the realization of the remaining net deferred tax assets is more likely than not.
See Note 12 for discussion regarding state taxing authority exposure.
Retained earnings at December 31, 2006 and 2005 included approximately $6,869,000 representing pre-1988 tax bad debt reserve base year amounts for which no deferred income tax liability has been provided since these reserves are not expected to reverse or may never reverse. Circumstances that would require an accrual of a portion or all of this unrecorded tax liability are a reduction in qualifying loan levels relative to the end of 1987, failure to meet the definition of a bank, dividend payments in excess of accumulated tax earnings and profits, or other distributions in dissolution, liquidation or redemption of the Bank’s stock.
The following is a reconcilement of federal income tax expense at the statutory rate of 35% to the income tax provision reported in the financial statements.
(In thousands) | | 2006 | | 2005 | | 2004 | |
| | | | | | | | |
| Tax provision at statutory rate | | $ | 10,754 | | | 11,522 | | | 10,686 | |
| Increase (decrease) in income taxes resulting from: | | | | | | | | | | |
| Tax-exempt interest income | | | (287 | ) | | (251 | ) | | (263 | ) |
| Low income housing tax credits | | | (114 | ) | | (109 | ) | | (98 | ) |
| Non-deductible interest expense | | | 34 | | | 20 | | | 14 | |
| State income taxes, net of federal benefit | | | 1,122 | | | 5,634 | | | 132 | |
| Change in valuation allowance | | | (36 | ) | | (92 | ) | | 153 | |
| Non-deductible penalty | | | – | | | 50 | | | – | |
| Other, net | | | (50 | ) | | 55 | | | (206 | ) |
| Total | | $ | 11,423 | | | 16,829 | | | 10,418 | |
Note 8. Time Deposits, Securities Sold Under Agreements to Repurchase, and Related Party Deposits
At December 31, 2006, the scheduled maturities of time deposits were as follows:
| | | (In thousands) | |
| 2007 | | $ | 853,941 | |
| 2008 | | | 58,546 | |
| 2009 | | | 26,122 | |
| 2010 | | | 23,597 | |
| 2011 | | | 13,180 | |
| Thereafter | | | 227 | |
| | | $ | 975,613 | |
Securities sold under agreement to repurchase represent short term borrowings by the Company with maturities less than one year and are collateralized by a portion of the Company’s securities portfolio, which have been delivered to a third party custodian for safekeeping. At December 31, 2006, securities with an amortized cost of $50,970,000 and a market value of $50,013,000 were pledged to secure securities sold under agreements to repurchase.
The following table presents certain information for securities sold under agreements to repurchase:
($ in thousands) | | 2006 | | 2005 | |
| Balance at December 31 | | $ | 43,276 | | | 33,530 | |
| Weighted average interest rate at December 31 | | | 3.78 | % | | 3.08 | % |
| Maximum amount outstanding at any month-end during the year | | $ | 43,276 | | | 33,530 | |
| Average daily balance outstanding during the year | | $ | 30,036 | | | 6,219 | |
| Average annual interest rate paid during the year | | | 3.72 | % | | 2.88 | % |
Deposits received from executive officers and directors and their associates totaled approximately $11,866,000 at December 31, 2006. These deposit accounts have substantially the same terms, including interest rates, as those prevailing at the time for comparable transactions with other non-related depositors.
Note 9. Borrowings and Borrowings Availability
The following table presents information regarding the Company’s outstanding borrowings at December 31, 2006 and 2005:
Description - 2006 | | Due date | | Call Feature | | 2006 Amount | | Interest Rate |
| | | | | | | | | |
FHLB Overnight Borrowings | | January 1, 2007, renewable daily | | None | | $135,000,000 | | 5.50% subject to change daily |
| FHLB Term Note | | Due March 13, 2007 | | None | | 2,000,000 | | 2.91% fixed |
| FHLB Term Note | | Due June 23, 2008 | | None | | 1,000,000 | | 5.51% fixed |
| FHLB Term Note | | Due on April 21, 2009 | | Expired (One time call option in 2004 not exercised by FHLB) | | 5,000,000 | | 5.26% fixed |
Trust Preferred Securities | | Due on November 7, 2032 | | By Company on a quarterly basis beginning on November 7, 2007 | | 20,619,000 | | 8.81% at Dec. 31, 2006 adjustable rate 3 month LIBOR + 3.45% |
Trust Preferred Securities | | Due on January 23, 2034 | | By Company on a quarterly basis beginning on January 23, 2009 | | 20,620,000 | | 8.06% at Dec. 31, 2006 adjustable rate 3 month LIBOR + 2.70% |
Trust Preferred Securities | | Due on June 15, 2036 | | By Company on a quarterly basis beginning on June 15, 2011 | | 25,774,000 | | 6.75% at Dec. 31, 2006 adjustable rate 3 month LIBOR + 1.39% |
Total borrowings/ weighted average rate | | | | | | $210,013,000 | | 6.20% (7.46% excluding overnight borrowings) |
Description - 2005 | | Due date | | Call Feature | | 2005 Amount | | Interest Rate |
| | | | | | | | | |
FHLB Overnight Borrowings | | January 1, 2006, renewable daily | | None | | $30,000,000 | | 4.49% subject to change daily |
| FHLB Term Note | | Due February 15, 2006 | | None | | 6,500,000 | | 3.47% fixed |
| FHLB Term Note | | Due March 13, 2006 | | None | | 2,000,000 | | 2.44% fixed |
| FHLB Term Note | | Due May 15, 2006 | | None | | 7,500,000 | | 3.51% fixed |
| FHLB Term Note | | Due August 10, 2006 | | None | | 5,000,000 | | 3.60% fixed |
| FHLB Term Note | | Due March 13, 2007 | | None | | 2,000,000 | | 2.91% fixed |
| FHLB Term Note | | Due June 23, 2008 | | None | | 1,000,000 | | 5.51% fixed |
| FHLB Term Note | | Due on April 21, 2009 | | Expired (One time call option in 2004 not exercised by FHLB) | | 5,000,000 | | 5.26% fixed |
Trust Preferred Securities | | Due on November 7, 2032 | | By Company on a quarterly basis beginning on November 7, 2007 | | 20,619,000 | | 7.79% at Dec. 31, 2005 adjustable rate 3 month LIBOR + 3.45% |
Trust Preferred Securities | | Due on January 23, 2034 | | By Company on a quarterly basis beginning on January 23, 2009 | | 20,620,000 | | 6.94% at Dec. 31, 2005 adjustable rate 3 month LIBOR + 2.70% |
Total borrowings/ weighted average rate | | | | | | $100,239,000 | | 5.47% (5.88% excluding overnight borrowings) |
In the tables above, only the $5 million due to the FHLB on April 21, 2009 had a lender call provision, which allowed the FHLB, at its option, to call the bond on April 21, 2004. The call provision provided interest rate protection to the FHLB in the event that prevailing market interest rates were higher than the note rate on the date of the call. This call option was not exercised by the FHLB at the April 21, 2004 call date. In addition to the call option, all outstanding FHLB borrowings may be accelerated immediately by the FHLB in certain circumstances including material adverse changes in the condition of the Company or if the Company’s qualifying collateral amounts to less than that required under the terms of the borrowing agreement.
In the above table, the $20.6 million in borrowings due on November 7, 2032 relate to borrowings structured as trust preferred capital securities that were issued by First Bancorp Capital Trust I, an unconsolidated subsidiary of the Company, on October 29, 2002 and qualify as capital for regulatory capital adequacy requirements. These debt securities are callable by the Company at par on any quarterly interest payment date beginning on November 7, 2007. The interest rate on these debt securities adjusts on a quarterly basis at a rate of three-month LIBOR plus 3.45%. This rate may not exceed 12.50% through November 2007. The Company incurred approximately $615,000 in debt issuance costs related to the issuance that were recorded as prepaid expenses and are included in the “Other Assets” line item of the consolidated balance sheet. These debt issuance costs are being amortized as interest expense until the earliest possible call date of November 7, 2007.
In the above table, the $20.6 million in borrowings due on January 23, 2034 relate to borrowings structured as trust preferred capital securities that were issued by First Bancorp Capital Trusts II and III ($10.3 million by each trust), unconsolidated subsidiaries of the Company, on December 19, 2003 and qualify as capital for regulatory capital adequacy requirements. These debt securities are callable by the Company at par on any quarterly interest payment date beginning on January 23, 2009. The interest rate on these debt securities adjusts on a quarterly basis at a rate of three-month LIBOR plus 2.70%. The Company incurred approximately $580,000 of debt issuance costs related to the issuance that were recorded as prepaid expenses and are included in the “Other Assets” line item of the consolidated balance sheet. These debt issuance costs are being amortized as interest expense until the earliest possible call date of January 23, 2009.
In the above table, the $25.8 million in borrowings due on June 15, 2036 relate to borrowings structured as trust preferred capital
securities that were issued by First Bancorp Capital Trust IV, an unconsolidated subsidiary of the Company, on April 13, 2006 and qualify as capital for regulatory capital adequacy requirements. These debt securities are callable by the Company at par on any quarterly interest payment date beginning on June 15, 2011. The interest rate on these debt securities adjusts on a quarterly basis at a rate of three-month LIBOR plus 1.39%. The Company incurred no debt issuance costs related to the issuance.
At December 31, 2006, the Company has three sources of readily available borrowing capacity - 1) an approximately $362 million line of credit with the FHLB, of which $143 million was outstanding at December 31, 2006 and $59 million was outstanding at December 31, 2005, 2) a $50 million overnight federal funds line of credit with a correspondent bank, none of which was outstanding at December 31, 2006 or 2005, and 3) an approximately $74 million line of credit through the Federal Reserve Bank of Richmond’s (FRB) discount window, none of which was outstanding at December 31, 2006 or 2005.
The Company’s line of credit with the FHLB totaling approximately $362 million can be structured as either short-term or long-term borrowings, depending on the particular funding or liquidity need and is secured by the Company’s FHLB stock and a blanket lien on most of its real estate loan portfolio. In addition to the outstanding borrowings from the FHLB that reduce the available borrowing capacity of the line of credit, the borrowing capacity was further reduced by $40 million at December 31, 2006 and 2005 as a result of the Company pledging letters of credit for public deposits at each of those dates. Accordingly, the Company’s unused FHLB line of credit was $179 million at December 31, 2006.
The Company’s correspondent bank relationship allows the Company to purchase up to $50 million in federal funds on an overnight, unsecured basis (federal funds purchased). The Company had no borrowings outstanding under this line at December 31, 2006 or 2005. This line of credit was not drawn upon during any of the past three years.
The Company also has a line of credit with the FRB discount window. This line is secured by a blanket lien on a portion of the Company’s commercial and consumer loan portfolio (excluding real estate). Based on the collateral owned by the Company as of December 31, 2006, the available line of credit is approximately $74 million. This line of credit was established primarily in connection with the Company’s Y2K liquidity contingency plan and has not been drawn on since inception. The FRB has indicated that it would not expect lines of credit that have been granted to financial institutions to be a primary borrowing source. The Company plans to maintain this line of credit, although it is not expected that it will be drawn upon except in unusual circumstances.
Note 10. Leases
Certain bank premises are leased under operating lease agreements. Generally, operating leases contain renewal options on substantially the same basis as current rental terms. Rent expense charged to operations under all operating lease agreements was $560,000 in 2006, $510,000 in 2005, and $452,000 in 2004.
Future obligations for minimum rentals under noncancelable operating leases at December 31, 2006 are as follows:
| | | (In thousands) | |
| Year ending December 31: | | | | |
| 2007 | | $ | 494 | |
| 2008 | | | 443 | |
| 2009 | | | 344 | |
| 2010 | | | 266 | |
| 2011 | | | 222 | |
| Later years | | | 948 | |
| Total | | $ | 2,717 | |
Note 11. Employee Benefit Plans
401(k) Plan. The Company sponsors a retirement savings plan pursuant to Section 401(k) of the Internal Revenue Code. Employees who have completed one year of service are eligible to participate in the plan. An eligible employee may contribute up to 15% of annual salary to the plan. The Company contributes an amount equal to 75% of the first 6% of the employee’s salary contributed. Participants vest in Company contributions at the rate of 20% after one year of service, and 20% for each additional year of service, with 100% vesting after five years of service. The Company’s matching contribution expense was $710,000, $700,000, and $607,000, for the years ended December 31, 2006, 2005 and 2004, respectively. Additionally, the Company made additional discretionary matching contributions to the plan of $122,500 in 2006, $225,000 in 2005, and $175,000 in 2004. The Company’s matching and discretionary contributions are made in the form of Company stock. Employees are not permitted to invest their own contributions in Company stock.
Pension Plan. The Company sponsors a noncontributory defined benefit retirement plan (the “Pension Plan”), which is intended to qualify under Section 401(a) of the Internal Revenue Code. Employees who have attained age 21 and completed one year of service are eligible to participate in the Pension Plan. The Pension Plan provides for a monthly payment, at normal retirement age of 65, equal to one-twelfth of the sum of (i) 0.75% of Final Average Annual Compensation (5 highest consecutive calendar years’ earnings out of the last 10 years of employment) multiplied by the employee’s years of service not in excess of 40 years, and (ii) 0.65% of Final Average Annual Compensation in excess of “covered compensation” multiplied by years of service not in excess of 35 years. “Covered compensation” means the average of the social security taxable wage base during the 35 year period ending with the year the employee attains social security retirement age. Early retirement, with reduced monthly benefits, is available at age 55 after 15 years of service. The Pension Plan provides for 100% vesting after 5 years of service, and provides for a death benefit to a vested participant’s surviving spouse. The costs of benefits under the Pension Plan, which are borne by the Company and/or its subsidiaries, are computed actuarially and defrayed by earnings from the Pension Plan’s investments. The compensation covered by the Pension Plan includes total earnings before reduction for contributions to a cash or deferred profit-sharing plan (such as the 401(k) plan described above) and amounts used to pay group health insurance premiums and includes bonuses (such as amounts paid under the incentive compensation plan). Compensation for the purposes of the Pension Plan may not exceed statutory limits; such limits were $220,000 in 2006, $210,000 in 2005 and $205,000 in 2004.
The Company’s contributions to the Pension Plan are based on computations by independent actuarial consultants and are intended to provide the Company with the maximum deduction for income tax purposes. The
contributions are invested to provide for benefits under the Pension Plan. The Company estimates that its contribution to the Pension Plan will be $1,000,000 in 2007.
Funds in the Pension Plan are invested in a mix of investment types in accordance with the Pension Plan’s investment policy, which is intended to provide a reasonable return while maintaining proper diversification. Except for Company stock, all of the Pension Plan’s assets are invested in an unaffiliated bank money market account or mutual funds. The investment policy of the Pension Plan does not permit the use of derivatives, except to the extent that derivatives are used by any of the mutual funds invested in by the Pension Plan. The following table presents information regarding the mix of investments of the Pension Plan’s assets at December 31, 2006 and its targeted mix, as set out by the Plan’s investment policy:
Investment type | | Balance at December 31, 2006 | | % of Total Assets at December 31, 2006 | | Targeted % of Total Assets |
| | | (Dollars in thousands) | | | | | |
Fixed income investments | | | | | | | | | | |
| Cash/money market account | | $ | 239 | | | 2% | | | 1%-5 | % |
| US government bond fund | | | 1,390 | | | 10% | | | 10%-20 | % |
| US corporate bond fund | | | 1,385 | | | 10% | | | 5%-15 | % |
| US corporate high yield bond fund | | | 709 | | | 5% | | | 0%-10 | % |
Equity investments | | | | | | | | | | |
| Large cap value fund | | | 2,977 | | | 21% | | | 20%-30 | % |
| Large cap growth fund | | | 2,869 | | | 20% | | | 20%-30 | % |
| Mid-small cap growth fund | | | 2,676 | | | 19% | | | 15%-25 | % |
| Foreign equity fund | | | 1,386 | | | 9% | | | 5%-15 | % |
| Company stock | | | 578 | | | 4% | | | 0%-10 | % |
| Total | | $ | 14,209 | | | 100% | | | | |
For the years ended December 31, 2006, 2005, and 2004, the Company used an expected long-term rate-of-return-on-assets assumption of 8.75%, 9.00% and 9.00%, respectively. The Company arrived at this rate based primarily on a third-party investment consulting firm’s historical analysis of investment returns, which indicated that the mix of the Pension Plan’s assets (generally 75% equities and 25% fixed income) can be expected to return approximately 8.75% on a long term basis.
The following table reconciles the beginning and ending balances of the Pension Plan’s benefit obligation, as computed by the Company’s independent actuarial consultants, and its plan assets, with the difference between the two amounts representing the funded status of the Pension Plan as of the end of the respective year.
(In thousands) | | 2006 | | 2005 | | 2004 | |
Change in benefit obligation | | | | | | | | | | |
| Projected benefit obligation at beginning of year | | $ | 16,093 | | | 12,445 | | | 9,892 | |
| Service cost | | | 1,387 | | | 1,137 | | | 955 | |
| Interest cost | | | 902 | | | 766 | | | 642 | |
| Actuarial (gain) loss | | | (418 | ) | | 1,829 | | | 1,013 | |
| Benefits paid | | | (190 | ) | | (84 | ) | | (57 | ) |
| Projected benefit obligation at end of year | | | 17,774 | | | 16,093 | | | 12,445 | |
| Change in plan assets | | | | | | | | | | |
| Plan assets at beginning of year | | | 11,603 | | | 9,907 | | | 8,498 | |
| Actual return on plan assets | | | 1,296 | | | 361 | | | 816 | |
| Employer contributions | | | 1,500 | | | 1,419 | | | 650 | |
| Benefits paid | | | (190 | ) | | (84 | ) | | (57 | ) |
| Plan assets at end of year | | | 14,209 | | | 11,603 | | | 9,907 | |
| | | | | | | | | | | |
| Funded status at end of year | | $ | (3,565 | ) | | (4,490 | ) | | (2,538 | ) |
The accumulated benefit obligation related to the Pension Plan was $11,698,000, $10,284,000, and $7,817,000 at December 31, 2006, 2005, and 2004, respectively.
The following table presents information regarding the amounts recognized in the consolidated balance sheets as it relates to the Pension Plan, excluding the related deferred tax assets. The amounts for 2005 reflect the accounting required prior to the December 31, 2006 adoption of Statement 158 - see Note 1(t) for additional discussion.
(In thousands) | | 2006 | | 2005 | |
| | | | | | |
| Other assets - prepaid pension asset | | $ | 1,497 | | | 1,642 | |
| Other liabilities | | | (5,062 | ) | | – | |
| | | $ | (3,565 | ) | | 1,642 | |
The following table presents information regarding the amounts recognized in accumulated other comprehensive income (AOCI) at December 31, 2006 as it relates to the Pension Plan. Prior to the adoption of Statement 158 as of December 31, 2006, there were no amounts recognized in AOCI as it relates to the Pension Plan.
(In thousands) | | 2006 | |
| | | | |
| Net (gain)/loss | | $ | 4,910 | |
| Net transition obligation | | | 43 | |
| Prior service cost | | | 109 | |
| Amount recognized in AOCI before tax effect | | | 5,062 | |
| Tax benefit | | | (1,997 | ) |
| Net amount recognized as reduction to AOCI | | $ | 3,065 | |
The following table reconciles the beginning and ending balances of the prepaid pension cost related to the Pension Plan:
(In thousands) | | 2006 | | 2005 | |
| | | | | | |
| Prepaid pension cost as of beginning of fiscal year | | $ | 1,642 | | | 1,523 | |
| Net periodic pension cost for fiscal year | | | (1,645 | ) | | (1,300 | ) |
| Actual employer contributions | | | 1,500 | | | 1,419 | |
| Prepaid pension asset as of end of fiscal year | | $ | 1,497 | | | 1,642 | |
Net pension cost for the Pension Plan included the following components for the years ended December 31, 2006, 2005 and 2004:
(In thousands) | | 2006 | | 2005 | | 2004 | |
| | | | | | | | |
| Service cost - benefits earned during the period | | $ | 1,387 | | | 1,137 | | | 955 | |
| Interest cost on projected benefit obligation | | | 902 | | | 766 | | | 642 | |
| Expected return on plan assets | | | (1,037 | ) | | (947 | ) | | (759 | ) |
| Net amortization and deferral | | | 393 | | | 344 | | | 307 | |
| Net periodic pension cost | | $ | 1,645 | | | 1,300 | | | 1,145 | |
The estimated net loss, transition obligation, and prior service cost that will be amortized from accumulated other comprehensive income into net periodic pension cost over the next fiscal year are $245,000, $2,000, and $13,000, respectively.
The following table is an estimate of the benefits that will be paid in accordance with the Pension Plan during the indicated time periods:
| | |
(In thousands) | | Estimated benefit payments | |
| Year ending December 31, 2007 | | $ | 229 | |
| Year ending December 31, 2008 | | | 270 | |
| Year ending December 31, 2009 | | | 291 | |
| Year ending December 31, 2010 | | | 335 | |
| Year ending December 31, 2011 | | | 431 | |
| Years ending December 31, 2012-2016 | | | 4,696 | |
Supplemental Executive Retirement Plan. The Company sponsors a Supplemental Executive Retirement Plan (the “SERP Plan”) for the benefit of certain senior management executives of the Company. The purpose of the SERP Plan is to provide additional monthly pension benefits to ensure that each such senior management executive would receive lifetime monthly pension benefits equal to 3% of his or her final average compensation multiplied by his or her years of service (maximum of 20 years) to the Company or its subsidiaries, subject to a maximum of 60% of his or her final average compensation. The amount of a participant’s monthly SERP benefit is reduced by (i) the amount payable under the Company’s qualified Pension Plan (described above), and (ii) fifty percent (50%) of the participant’s primary social security benefit. Final average compensation means the average of the 5 highest consecutive calendar years of earnings during the last 10 years of service prior to termination of employment. The SERP Plan is an unfunded plan. Payments are made from the general assets of the Company.
The following table reconciles the beginning and ending balances of the SERP Plan’s benefit obligation, as computed by the Company’s independent actuarial consultants:
(In thousands) | | 2006 | | 2005 | | 2004 | |
Change in benefit obligation | | | | | | | | | | |
| Projected benefit obligation at beginning of year | | $ | 3,223 | | | 2,553 | | | 1,631 | |
| Service cost | | | 330 | | | 247 | | | 242 | |
| Interest cost | | | 202 | | | 154 | | | 128 | |
| Actuarial loss | | | 403 | | | 269 | | | 329 | |
| Effect of amendments | | | – | | | – | | | 223 | |
| Benefits paid | | | (25 | ) | | – | | | – | |
| Projected benefit obligation at end of year | | | 4,133 | | | 3,223 | | | 2,553 | |
| Plan assets | | | – | | | – | | | – | |
| Funded status at end of year | | $ | (4,133 | ) | | (3,223 | ) | | (2,553 | ) |
The accumulated benefit obligation related to the SERP Plan was $3,279,000, $2,556,000, and $2,119,000 at December 31, 2006, 2005, and 2004, respectively.
The following table presents information regarding the amounts recognized in the consolidated balance sheets as it relates to the SERP Plan, excluding the related deferred tax assets. The amounts for 2005 reflect the accounting required prior to the December 31, 2006 adoption of Statement 158 - see Note 1(t) for additional discussion:
(In thousands) | | 2006 | | 2005 | |
| | | | | | |
| Intangible assets | | $ | – | | | 273 | |
| Other assets - prepaid pension asset (liability) | | | (2,546 | ) | | (1,907 | ) |
| Other liabilities | | | (1,587 | ) | | (701 | ) |
| | | $ | (4,133 | ) | | (2,335 | ) |
The following table presents information regarding the amounts recognized in accumulated other comprehensive income (AOCI) at December 31, 2006 and 2005 as it relates to the SERP plan.
(In thousands) | | 2006 | | 2005 | |
| | | | | | | | |
| Net (gain)/loss | | $ | 1,386 | | | 155 | |
| Prior service cost | | | 201 | | | 273 | |
| Amount recognized in AOCI before tax effect | | $ | 1,587 | | | 428 | |
| Tax benefit | | | (626 | ) | | (167 | ) |
| Net amount recognized as reduction to AOCI | | $ | 961 | | | 261 | |
The following table reconciles the beginning and ending balances of the prepaid pension cost related to the SERP plan:
(In thousands) | | 2006 | | 2005 | |
| | | | | | |
| Prepaid pension cost as of beginning of fiscal year | | $ | (1,907 | ) | | (1,418 | ) |
| Net periodic pension cost for fiscal year | | | (664 | ) | | (489 | ) |
| Benefits paid | | | 25 | | | – | |
| Prepaid pension cost as of end of fiscal year | | $ | (2,546 | ) | | (1,907 | ) |
Net pension cost for the SERP Plan included the following components for the years ended December 31, 2006, 2005 and 2004:
(In thousands) | | 2006 | | 2005 | | 2004 | |
| | | | | | | | |
| Service cost - benefits earned during the period | | $ | 329 | | | 247 | | | 242 | |
| Interest cost on projected benefit obligation | | | 202 | | | 154 | | | 128 | |
| Net amortization and deferral | | | 133 | | | 88 | | | 80 | |
| Net periodic pension cost | | $ | 664 | | | 489 | | | 450 | |
The estimated net loss and prior service cost that will be amortized from accumulated other comprehensive income into net periodic pension cost over the next fiscal year are $75,000 and $36,000, respectively.
The following table is an estimate of the benefits that will be paid in accordance with the SERP Plan during the indicated time periods:
| | |
(In thousands) | | Estimated benefit payments | |
| Year ending December 31, 2007 | | $ | 184 | |
| Year ending December 31, 2008 | | | 174 | |
| Year ending December 31, 2009 | | | 164 | |
| Year ending December 31, 2010 | | | 184 | |
| Year ending December 31, 2011 | | | 226 | |
| Years ending December 31, 2012-2016 | | | 1,649 | |
The following assumptions were used in determining the actuarial information for the Pension Plan and the SERP Plan for the years ended December 31, 2006, 2005 and 2004:
| | | 2006 | | 2005 | | 2004 | |
| | | Pension Plan | | SERP Plan | | Pension Plan | | SERP Plan | | Pension Plan | | SERP Plan | |
| Discount rate used to determine net periodic pension cost | | | 5.50% | | | 5.50% | | | 6.00% | | | 6.00% | | | 6.25% | | | 6.25% | |
| Discount rate used to calculate end of year liability disclosures | | | 5.75% | | | 5.75% | | | 5.50% | | | 5.50% | | | 6.00% | | | 6.00% | |
| Expected long-term rate of return on assets | | | 8.75% | | | n/a | | | 9.00% | | | n/a | | | 9.00% | | | n/a | |
| Rate of compensation increase | | | 5.00% | | | 5.00% | | | 5.00% | | | 5.00% | | | 5.00% | | | 5.00% | |
| | | | | | | | | | | | | | | | | | | | |
For the year ended December 31, 2004, the Company determined the year end discount rate based on discussions with the Company’s third-party actuarial consultant, giving weight to the year end Moody’s corporate Aa rate and its change during the year, and the expected cash flows associated with the Company’s retirement payment obligations. During 2005, the Company adopted a policy that the year end discount rate would be a rate no greater than the Moody’s Aa corporate bond rate as of December 31 of each year, rounded up to the nearest quarter point. The Company believes that this policy is appropriate given the Company’s desire that the discount rate be based on the rate of return of a high-quality fixed-income security and the expected cash flows of its retirement obligation.
Note 12. Commitments, Contingencies, and Concentrations of Credit Risk
See Note 10 with respect to future obligations under noncancelable operating leases.
In the normal course of business there are various outstanding commitments and contingent liabilities such as commitments to extend credit, which are not reflected in the financial statements. As of December 31, 2006, the
Company had outstanding loan commitments of $321,131,000, of which $270,592,000 were at variable rates and $50,539,000 were at fixed rates. Included in outstanding loan commitments were unfunded commitments of $168,941,000 on revolving credit plans, of which $142,068,000 were at variable rates and $26,873,000 were at fixed rates.
At December 31, 2006 and 2005, the Company had $4,459,000 and $4,283,000, respectively in standby letters of credit outstanding. The Company has no carrying amount for these standby letters of credit at either of those dates. The nature of the standby letters of credit is a guarantee made on behalf of the Company’s customers to suppliers of the customers to guarantee payments owed to the supplier by the customer. The standby letters of credit are generally for terms for one year, at which time they may be renewed for another year if both parties agree. The payment of the guarantees would generally be triggered by a continued nonpayment of an obligation owed by the customer to the supplier. The maximum potential amount of future payments (undiscounted) the Company could be required to make under the guarantees in the event of nonperformance by the parties to whom credit or financial guarantees have been extended is represented by the contractual amount of the financial instruments discussed above. In the event that the Company is required to honor a standby letter of credit, a note, already executed with the customer, is triggered which provides repayment terms and any collateral. Over the past ten years, the Company has had to honor one standby letter of credit, which was repaid by the borrower without any loss to the Company. Management expects any draws under existing commitments to be funded through normal operations.
The Company processes credit card transactions for approximately 575 commercial merchant clients. As these clients present credit card transactions authorized by their customers to the Company, the Company deposits funds in their checking accounts and collects the corresponding amounts due from the credit card issuer. In the event that the customer disputes the charge, the Company is contractually liable for any amounts legally due to the customer in the event the Company’s merchant clients do not make payment. This represents a contingent liability to the Company that led to a loss in 2006, as discussed in the following paragraph.
During 2006, the Company discovered that it had liability associated with a commercial merchant client that sold furniture over the internet. The furniture store did not deliver furniture that its customers had ordered and paid for, and was unable to immediately refund their credit card purchases. As the furniture store’s credit card processor, the Company became contractually liable for the amounts that were required to be refunded. During the second quarter of 2006, the furniture store changed management, stated its intention to repay the Company for all funds advanced, and began making repayments to the Company. At June 30, 2006, the Company recorded a $230,000 loss to reserve for this situation. During the third quarter of 2006, the furniture store’s financial condition deteriorated significantly. Accordingly, the Company determined that it should fully reserve for the entire $1.9 million exposure associated with this situation, which resulted in recording an additional loss of $1,670,000. The owners of the furniture store continue to state their intent to repay the Company, but at this time their ability to do so is uncertain. During the third quarter of 2006, the Company completed a review of all merchant credit card customers and concluded that this situation appears to be an isolated event that is not likely to recur.
In 1999, in consultation with the Company’s tax advisors, the Company established an operating structure involving a real estate investment trust (REIT) that resulted in a reduction in the Company’s state tax liability to the state of North Carolina. In late 2004, the North Carolina Department of Revenue indicated that it would challenge taxpayers engaged in activities deemed to be “income-shifting,” and they indicated that they believed certain REIT operating structures were a type of “income-shifting.” During 2005, the North Carolina Department of Revenue began an audit of the Company’s tax returns for 2001-2004, which represented all years eligible for audit. In the third quarter of 2005, based on consultations with the Company’s external auditor and legal counsel, the Company determined that it should record a $6.3 million loss accrual to reserve for this issue, which was comprised of $8.6 million in estimated liability related to taxes due, interest and penalty, less $2.3 million in related federal tax benefit. In February 2006, the North Carolina Department of Revenue announced a “Settlement Initiative” that offered companies with certain transactions, including those with a REIT operating structure, the opportunity to resolve
such matters with reduced penalties by agreeing to participate in the initiative by June 15, 2006. Although the Company believes that its tax returns complied with the relevant statutes, the board of directors of the Company decided that it was in the best interest of the Company to settle this matter by participating in the initiative. Based on the terms of the initiative, the Company estimated that its total liability to settle the matter would be approximately $6.4 million, or $4.3 million net of the federal tax benefit, which was $2.0 million less than the amount that was originally accrued. Accordingly, in March 2006, the Company retroactively recorded an adjustment to its fourth quarter of 2005 earnings to reverse $2.0 million of tax expense. The aspects of the REIT structure that gave rise to this issue were discontinued effective January 1, 2005, and thus the Company does not believe it has any additional exposure related to this item beyond the amount of the accrual other than ongoing interest on the unpaid taxes amounting to $100,000 per quarter ($65,000 after-tax). Under the terms of the initiative, March 15, 2007 is the deadline for payment of the amount due to the North Carolina Department of Revenue.
The Company is not involved in any legal proceedings which, in management’s opinion, could have a material effect on the consolidated financial position of the Company.
The Bank grants primarily commercial and installment loans to customers throughout its market area, which consists of Anson, Brunswick, Cabarrus, Chatham, Davidson, Duplin, Guilford, Harnett, Iredell, Lee, Montgomery, Moore, New Hanover, Randolph, Richmond, Robeson, Rockingham, Rowan, Scotland, Stanly and Wake Counties in North Carolina, Dillon County in South Carolina, and Montgomery, Pulaski, Washington and Wythe Counties in Virginia. The real estate loan portfolio can be affected by the condition of the local real estate market. The commercial and installment loan portfolios can be affected by local economic conditions.
The Company’s loan portfolio is not concentrated in loans to any single borrower or to a relatively small number of borrowers. Additionally, management is not aware of any concentrations of loans to classes of borrowers or industries that would be similarly affected by economic conditions.
In addition to monitoring potential concentrations of loans to particular borrowers or groups of borrowers, industries and geographic regions, the Company monitors exposure to credit risk that could arise from potential concentrations of lending products and practices such as loans that subject borrowers to substantial payment increases (e.g. principal deferral periods, loans with initial interest-only periods, etc), and loans with high loan-to-value ratios. Additionally, there are industry practices that could subject the Company to increased credit risk should economic conditions change over the course of a loan’s life. For example, the Company makes variable rate loans and fixed rate principal-amortizing loans with maturities prior to the loan being fully paid (i.e. balloon payment loans). These loans are underwritten and monitored to manage the associated risks. The Company has determined that there is no concentration of credit risk associated with its lending policies or practices.
The Company’s investment portfolio consists principally of obligations of the United States, its agencies or its corporations and general obligation municipal securities. In the opinion of the Company, there is no concentration of credit risk in its investment portfolio. The Company places its deposits and correspondent accounts with and sells its federal funds to high quality institutions. The Company believes credit risk associated with correspondent accounts is not significant.
Note 13. Fair Value of Financial Instruments
Fair value estimates as of December 31, 2006 and 2005 and limitations thereon are set forth below for the Company’s financial instruments. Please see Note 1(n) for a discussion of fair value methods and assumptions, as well as fair value information for off-balance sheet financial instruments.
| | | December 31, 2006 | | December 31, 2005 | |
(In thousands) | | Carrying Amount | | Estimated Fair Value | | Carrying Amount | | Estimated Fair Value | |
| | | | | | | | | | |
| Cash and due from banks, noninterest-bearing | | $ | 43,248 | | | 43,248 | | | 32,985 | | | 32,985 | |
| Due from banks, interest-bearing | | | 83,877 | | | 83,877 | | | 41,655 | | | 41,655 | |
| Federal funds sold | | | 19,543 | | | 19,543 | | | 28,883 | | | 28,883 | |
| Securities available for sale | | | 129,964 | | | 129,964 | | | 113,613 | | | 113,613 | |
| Securities held to maturity | | | 13,122 | | | 13,168 | | | 11,448 | | | 11,597 | |
| Presold mortgages in process of settlement | | | 4,766 | | | 4,766 | | | 3,347 | | | 3,347 | |
| Loans, net of allowance | | | 1,721,449 | | | 1,706,818 | | | 1,466,895 | | | 1,460,119 | |
| Accrued interest receivable | | | 12,158 | | | 12,158 | | | 8,947 | | | 8,947 | |
| | | | | | | | | | | | | | |
| Deposits | | | 1,695,679 | | | 1,695,370 | | | 1,494,577 | | | 1,494,043 | |
| Securities sold under agreements to repurchase | | | 43,276 | | | 43,276 | | | 33,530 | | | 33,530 | |
| Borrowings | | | 210,013 | | | 210,426 | | | 100,239 | | | 101,671 | |
| Accrued interest payable | | | 5,649 | | | 5,649 | | | 3,835 | | | 3,835 | |
Limitations Of Fair Value Estimates. Fair value estimates are made at a specific point in time, based on relevant market information and information about the financial instrument. These estimates do not reflect any premium or discount that could result from offering for sale at one time the Company’s entire holdings of a particular financial instrument. Because no highly liquid market exists for a significant portion of the Company’s financial instruments, fair value estimates are based on judgments regarding future expected loss experience, current economic conditions, risk characteristics of various financial instruments, and other factors. These estimates are subjective in nature and involve uncertainties and matters of significant judgment and therefore cannot be determined with precision. Changes in assumptions could significantly affect the estimates.
Fair value estimates are based on existing on- and off-balance sheet financial instruments without attempting to estimate the value of anticipated future business and the value of assets and liabilities that are not considered financial instruments. Significant assets and liabilities that are not considered financial assets or liabilities include net premises and equipment, intangible and other assets such as foreclosed properties, deferred income taxes, prepaid expense accounts, income taxes currently payable and other various accrued expenses. In addition, the income tax ramifications related to the realization of the unrealized gains and losses can have a significant effect on fair value estimates and have not been considered in any of the estimates.
Note 14. Equity-Based Compensation Plans
At December 31, 2006, the Company had the following equity-based compensation plans, all of which are stock option plans: the First Bancorp 2004 Stock Option Plan, the First Bancorp 1994 Stock Option Plan, and four plans that were assumed from acquired entities, which are all described below. The Company’s shareholders approved all equity-based compensation plans, except for those assumed from acquired companies. As of December 31, 2006, the First Bancorp 2004 Stock Option Plan was the only plan that had shares available for future grants.
The First Bancorp 2004 Stock Option Plan and its predecessor plan, the First Bancorp 1994 Stock Option Plan, were intended to serve as a means of attracting, retaining and motivating key employees and directors and to associate the interests of the plans’ participants with those of the Company and its shareholders. Stock option
grants to non-employee directors have historically had no vesting requirements, whereas, except as discussed below, stock option grants to employees have generally had five-year vesting schedules (20% vesting each year). In April 2004, the Company granted 128,000 options to employees with no vesting requirements. These options were granted without any vesting requirements for two reasons - 1) the options were granted primarily as a reward for past performance and therefore had already been “earned” in the view of the committee, and 2) to potentially minimize the impact that any change in accounting standards for stock options could have on future years’ reported net income. Employee stock option grants since the April 2004 grant have reverted to having five year vesting periods. The Company’s options provide for immediate vesting if there is a change in control (as defined in the plans). Under the terms of these two plans, options can have a term of no longer than ten years, and all options granted thus far under these plans have had a term of ten years. Except for grants to directors (see below), the Company cannot estimate the amount of future stock option grants at this time. In the past, stock option grants to employees have been irregular, generally falling into three categories - 1) to attract and retain new employees, 2) to recognize changes in responsibilities of existing employees, and 3) to periodically reward exemplary performance. As it relates to directors, the Company has historically granted 2,250 stock options to each of the Company’s non-employee directors in June of each year, and expects to continue doing so for the foreseeable future. At December 31, 2006, there were 620,233 options outstanding related to these two plans with exercise prices ranging from $9.75 to $22.12. At December 31, 2006, there were 1,180,250 shares remaining available for grant under the First Bancorp 2004 Stock Option Plan.
The Company also has four stock option plans as a result of assuming plans of acquired companies. At December 31, 2006, there were 35,871 stock options outstanding in connection with these plans, with option prices ranging from $10.22 to $11.49.
The Company issues new shares when options are exercised.
Prior to January 1, 2006, the Company accounted for all of these plans using the intrinsic value method prescribed by Opinion 25 and related interpretations. Because all of the Company’s stock options had an exercise price equal to the market value of the underlying common stock on the date of grant, no compensation cost had ever been recognized. On January 1, 2006, the Company adopted Statement 123(R). Statement 123(R) supersedes Opinion 25 (and related interpretations) and requires that the compensation cost relating to share-based payment transactions be recognized in the financial statements. Statement 123(R) permits public companies to adopt its requirements using one of two methods. The “modified prospective” method recognizes compensation expense for all stock options granted after the date of adoption and for all previously granted stock options that become vested after the date of adoption. The “modified retrospective” method includes the requirements of the “modified prospective” method described above, but also permits entities to restate prior period results based on the amounts previously presented under Statement 123 for purposes of pro-forma disclosures. The Company has elected to adopt Statement 123(R) under the “modified prospective” method and accordingly has not restated prior period results.
The Company measures the fair value of each option award on the date of grant using the Black-Scholes option-pricing model. The Company determines the assumptions used in the Black-Scholes option pricing model as follows: the risk-free interest rate is based on the U.S. Treasury yield curve in effect at the time of the grant; the dividend yield is based on the Company’s dividend yield at the time of the grant (subject to adjustment if the dividend yield on the grant date is not expected to approximate the dividend yield over the expected life of the option); the volatility factor is based on the historical volatility of the Company’s stock (subject to adjustment if historical volatility is reasonably expected to differ from the past); the weighted-average expected life is based on the historical behavior of employees related to exercises, forfeitures and cancellations.
The per share weighted-average fair value of options granted during 2006, 2005, and 2004 was $6.79, $6.68, and $7.07 respectively, on the date of the grant using the Black-Scholes option pricing model with the following weighted-average assumptions:
| | 2006 | | 2005 | | 2004 |
| Expected dividend yield | 3.30% | | 3.08% | | 2.97% |
| Risk-free interest rate | 5.05% | | 3.88% | | 3.49% |
| Expected life | 7 years | | 7 years | | 7 years |
| Expected volatility | 32.56% | | 32.97% | | 36.67% |
As noted above, prior to the adoption of Statement 123(R), the Company applied Opinion 25 to account for its stock options. The following table illustrates the effect on net income and earnings per share had the Company accounted for share-based compensation in accordance with Statement 123(R) for the periods indicated:
| | | Year Ended December 31, | | Year Ended December 31, | | Year Ended December 31, | |
(In thousands except per share data) | | 2006 | | 2005 | | 2004 | |
| | | | | | | | |
| Net income, as reported | | $ | 19,302 | | | 16,090 | | | 20,114 | |
| Add: Stock-based employee compensation expense included in reported net income, net of related tax effects | | | 246 | | | — | | | — | |
| Deduct: Total stock-based employee compensation expense determined under fair value based method for all awards, net of related tax effects | | | (246 | ) | | (335 | ) | | (1,291 | ) |
| Pro forma net income | | $ | 19,302 | | | 15,755 | | | 18,823 | |
| | | | | | | | | | | |
| | | | | | | | | | | |
Earnings per share: Basic - As reported | | $ | 1.35 | | | 1.14 | | | 1.42 | |
| Basic - Pro forma | | | 1.35 | | | 1.11 | | | 1.33 | |
| | | | | | | | | | | |
| Diluted - As reported | | | 1.34 | | | 1.12 | | | 1.40 | |
| Diluted - Pro forma | | | 1.34 | | | 1.10 | | | 1.31 | |
For the year ended December 31, 2006, the Company recorded stock-based compensation expense in the income statement of $325,000, which reduced income before income taxes by that same amount. The Company recognized $79,000 of income tax benefits in the income statement during 2006. The impact of stock-based compensation expense on net income for the year ended December 31, 2006 was to reduce it by $246,000, or approximately 1.7 cents basic and diluted earnings per share. The 2006 stock-based compensation expense related to the vesting of several stock option grants made prior to January 1, 2006, as well as a grant of 29,250 options (2,250 options to each non-employee director of the Company) on June 1, 2006 with no vesting requirements. This compensation expense was reflected as an adjustment to cash flows from operating activities on the Company’s Consolidated Statement of Cash Flows. At December 31, 2006, the Company had $56,000 of unrecognized compensation costs related to unvested stock options. The cost is expected to be amortized over a weighted-average life of 1.7 years, with $47,000 being expensed in 2007 equally distributed among each of the four quarters, and $3,000 being expensed in each of 2008, 2009 and 2010, equally distributed among each of the four quarters of each year. In addition, as discussed above, the Company granted 2,250 options, without vesting requirements, to each of its non-employee directors on June 1, 2006 and expects to continue this grant on June 1 of each year thereafter.
As noted above, certain of the Company’s stock option grants contain terms that provide for a graded vesting schedule whereby portions of the award vest in increments over the requisite service period. As provided for under Statement 123(R), the Company has elected to recognize compensation expense for awards with graded vesting schedules on a straight-line basis over the requisite service period for the entire award. Statement 123(R) requires companies to recognize compensation expense based on the estimated number of stock options and awards for which service is to be rendered. Over the past five years, there have only been nine forfeitures or expirations,
totaling 13,500 options, and therefore the Company assumes that all options granted will become vested.
The following table presents information regarding the activity since December 31, 2003 related to all of the Company’s stock options outstanding:
| | | Options Outstanding | |
| | | Number of Shares | | Weighted- Averag Exercise Price | | Weighted- Average Contractual Term (years) | | Aggregate Intrinsic Value | |
| | | | | | | | | | |
| | | | | | | | | | |
| Balance at December 31, 2003 | | | 777,759 | | $ | 11.85 | | | | | | | |
| | | | | | | | | | | | | | |
| Granted | | | 183,230 | | | 21.35 | | | | | | | |
| Exercised | | | (181,663 | ) | | 7.83 | | | | | $ | 2,605,000 | |
| Forfeited | | | (600 | ) | | 15.32 | | | | | | | |
| Expired | | | – | | | | | | | | | | |
| | | | | | | | | | | | | | |
| Balance at December 31, 2004 | | | 778,726 | | | 15.01 | | | | | | | |
| | | | | | | | | | | | | | |
| Granted | | | 34,000 | | | 22.11 | | | | | | | |
| Exercised | | | (65,844 | ) | | 11.41 | | | | | $ | 804,000 | |
| Forfeited | | | (600 | ) | | 15.33 | | | | | | | |
| Expired | | | (3,000 | ) | | 21.70 | | | | | | | |
| | | | | | | | | | | | | | |
| Balance at December 31, 2005 | | | 743,282 | | | 15.73 | | | | | | | |
| | | | | | | | | | | | | | |
| Granted | | | 29,250 | | | 21.83 | | | | | | | |
| Exercised | | | (108,628 | ) | | 10.27 | | | | | $ | 1,205,000 | |
| Forfeited | | | (300 | ) | | 15.33 | | | | | | | |
| Expired | | | (7,500 | ) | | 12.61 | | | | | | | |
| | | | | | | | | | | | | | |
| Outstanding at December 31, 2006 | | | 656,104 | | $ | 16.94 | | | 5.3 | | $ | 3,214,000 | |
| | | | | | | | | | | | | | |
| Exercisable at December 31, 2006 | | | 636,104 | | $ | 16.96 | | | 5.3 | | $ | 3,104,000 | |
The Company received $1,027,000, $785,000, and $1,081,000 as a result of stock option exercises during the years ended December 31, 2006, 2005, and 2004 respectively. The Company recorded $117,000, $118,000, and $203,000 in associated tax benefits from the exercise of nonqualified stock options during the years ended December 31, 2006, 2005, and 2004, respectively. In accordance with Statement 123(R), this benefit is included as a financing activity in the accompanying Statements of Cash Flows for periods subsequent to the adoption of Statement 123(R), but continues to be reported as an operating activity in periods prior to its adoption.
The following table summarizes information about the stock options outstanding at December 31, 2006:
| | | | | | | | | | | |
| | | Options Outstanding | | Options Exercisable |
Range of Exercise Prices | | Number Outstanding at 12/31/06 | | Weighted- Average Remaining Contractual Life | | Weighted- Average Exercise Price | | Number Exercisable at 12/31/06 | | Weighted- Average Exercise Price |
| | | | | | | | | | | |
| $8.85 to $11.06 | | 55,694 | | 2.7 | | $ 10.45 | | 55,694 | | $ 10.45 |
| $11.06 to $13.27 | | 76,946 | | 2.0 | | 11.64 | | 76,946 | | 11.64 |
| $13.27 to $15.48 | | 178,484 | | 4.5 | | 15.28 | | 178,484 | | 15.28 |
| $15.48 to $17.70 | | 98,500 | | 5.6 | | 16.31 | | 80,500 | | 16.45 |
| $17.70 to $19.91 | | 31,500 | | 7.4 | | 19.69 | | 31,500 | | 19.69 |
| $19.91 to $22.12 | | 214,980 | | 7.5 | | 21.78 | | 212,980 | | 21.78 |
| | | 656,104 | | 5.3 | | $ 16.94 | | 636,104 | | $ 16.96 |
| | | | | | | | | | | |
Note 15. Regulatory Restrictions
The Company is regulated by the Board of Governors of the Federal Reserve System (“FED”) and is subject to securities registration and public reporting regulations of the Securities and Exchange Commission. The Bank is regulated by the Federal Deposit Insurance Corporation (“FDIC”) and the North Carolina Office of the Commissioner of Banks.
The primary source of funds for the payment of dividends by the Company is dividends received from its subsidiary, the Bank. The Bank, as a North Carolina banking corporation, may pay dividends only out of undivided profits as determined pursuant to North Carolina General Statutes Section 53-87. As of December 31, 2006, the Bank had undivided profits of approximately $132,708,000 which were available for the payment of dividends. As of December 31, 2006, approximately $99,505,000 of the Company’s investment in the Bank is restricted as to transfer to the Company without obtaining prior regulatory approval.
The average reserve balance maintained by the Bank under the requirements of the Federal Reserve was approximately $133,000 for the year ended December 31, 2006.
The Company and the Bank must comply with regulatory capital requirements established by the FED and FDIC. Failure to meet minimum capital requirements can initiate certain mandatory, and possibly additional discretionary, actions by regulators that, if undertaken, could have a direct material effect on the Company’s financial statements. Under capital adequacy guidelines and the regulatory framework for prompt corrective action, the Company and the Bank must meet specific capital guidelines that involve quantitative measures of the Company’s assets, liabilities, and certain off-balance sheet items as calculated under regulatory accounting practices. The Company’s and Bank’s capital amounts and classification are also subject to qualitative judgments by the regulators about components, risk weightings, and other factors. These capital standards require the Company and the Bank to maintain minimum ratios of “Tier 1” capital to total risk-weighted assets (“Tier I Capital Ratio”) and total capital to risk-weighted assets of 4.00% and 8.00% (“Total Capital Ratio”), respectively. Tier 1 capital is comprised of total shareholders’ equity, excluding unrealized gains or losses from the securities available for sale, less intangible assets, and total capital is comprised of Tier 1 capital plus certain adjustments, the largest of which for the Company and the Bank is the allowance for loan losses. Risk-weighted assets refer to the on- and off-balance sheet exposures of the Company and the Bank, adjusted for their related risk levels using formulas set forth in FED and FDIC regulations.
In addition to the risk-based capital requirements described above, the Company and the Bank are subject to a leverage capital requirement, which calls for a minimum ratio of Tier 1 capital (as defined above) to quarterly
average total assets (“Leverage Ratio) of 3.00% to 5.00%, depending upon the institution’s composite ratings as determined by its regulators. The FED has not advised the Company of any requirement specifically applicable to it.
In addition to the minimum capital requirements described above, the regulatory framework for prompt corrective action also contains specific capital guidelines applicable to banks for classification as “well capitalized,” which are presented with the minimum ratios, the Company’s ratios and the Bank’s ratios as of December 31, 2006 and 2005 in the following table. Based on the most recent notification from its regulators, the Bank is well capitalized under the framework for prompt corrective action. There are no conditions or events since that notification that management believes have changed the Company’s category.
| | | Actual | | For Capital Adequacy Purposes | | To Be Well Capitalized Under Prompt Corrective Action Provisions | |
($ in thousands) | | Amount | | Ratio | | Amount | | Ratio | | Amount | | Ratio | |
| | | | | | | (must equal or exceed) | | (must equal or exceed) | |
As of December 31, 2006 | | | | | | | | | | | | | | | | | | | |
Total Capital Ratio | | | | | | | | | | | | | | | | | | | |
Company | | $ | 199,808 | | | 11.81% | | $ | 135,333 | | | 8.00% | | $ | N/A | | | N/A | |
Bank | | | 199,767 | | | 11.83% | | | 135,081 | | | 8.00% | | | 168,852 | | | 10.00% | |
Tier I Capital Ratio | | | | | | | | | | | | | | | | | | | |
Company | | | 170,096 | | | 10.05% | | | 67,667 | | | 4.00% | | | N/A | | | N/A | |
Bank | | | 180,820 | | | 10.71% | | | 67,541 | | | 4.00% | | | 101,311 | | | 6.00% | |
Leverage Ratio | | | | | | | | | | | | | | | | | | | |
Company | | | 170,096 | | | 8.59% | | | 79,173 | | | 4.00% | | | N/A | | | N/A | |
Bank | | | 180,820 | | | 9.15% | | | 79,014 | | | 4.00% | | | 98,768 | | | 5.00% | |
| | | | | | | | | | | | | | | | | | | | |
| As of December 31, 2005 | | | | | | | | | | | | | | | | | | | |
| Total Capital Ratio | | | | | | | | | | | | | | | | | | | |
| Company | | $ | 162,856 | | | 11.61% | | $ | 112,204 | | | 8.00% | | $ | N/A | | | N/A | |
| Bank | | | 162,776 | | | 11.51% | | | 113,178 | | | 8.00% | | | 141,472 | | | 10.00% | |
| Tier I Capital Ratio | | | | | | | | | | | | | | | | | | | |
| Company | | | 147,140 | | | 10.49% | | | 56,102 | | | 4.00% | | | N/A | | | N/A | |
| Bank | | | 147,060 | | | 10.51% | | | 55,960 | | | 4.00% | | | 83,940 | | | 6.00% | |
| Leverage Ratio | | | | | | | | | | | | | | | | | | | |
| Company | | | 147,140 | | | 8.60% | | | 68,441 | | | 4.00% | | | N/A | | | N/A | |
| Bank | | | 147,060 | | | 8.61% | | | 68,335 | | | 4.00% | | | 85,419 | | | 5.00% | |
Note 16. Supplementary Income Statement Information
Components of other noninterest income/expense exceeding 1% of total income for any of the years ended December 31, 2006, 2005 and 2004 are as follows:
(In thousands) | | 2006 | | 2005 | | 2004 | |
| | | | | | | | |
| Other gains (losses) - merchant credit card loss - see Note 12 | | $ | (1,900 | ) | | — | | | — | |
| | | | | | | | | | | |
| Other operating expenses - stationery and supplies | | | 1,675 | | | 1,590 | | | 1,523 | |
| Other operating expenses - telephone | | | 1,273 | | | 1,260 | | | 1,345 | |
| Other operating expenses - professional fees | | | 756 | | | 1,090 | | | 989 | |
Note 17. Condensed Parent Company Information
Condensed financial data for First Bancorp (parent company only) follows:
| CONDENSED BALANCE SHEETS | | As of December 31, | |
(In thousands) | | 2006 | | 2005 | |
Assets | | | | | | | |
| Cash on deposit with bank subsidiary | | $ | 1,878 | | | 2,000 | |
| Investment in wholly-owned subsidiaries, at equity | | | 228,845 | | | 196,170 | |
| Land | | | 7 | | | 7 | |
| Other assets | | | 2,598 | | | 1,993 | |
| Total assets | | $ | 233,328 | | | 200,170 | |
| | | | | | | | |
Liabilities and shareholders’ equity | | | | | | | |
| Borrowings | | $ | 67,013 | | | 41,239 | |
| Other liabilities | | | 3,610 | | | 3,203 | |
| Total liabilities | | | 70,623 | | | 44,442 | |
| | | | | | | | |
| Shareholders’ equity | | | 162,705 | | | 155,728 | |
| | | | | | | | |
| Total liabilities and shareholders’ equity | | $ | 233,328 | | | 200,170 | |
| CONDENSED STATEMENTS OF INCOME | | Year Ended December 31, | |
(In thousands) | | 2006 | | 2005 | | 2004 | |
| | | | | | | | |
| Dividends from wholly-owned subsidiaries | | $ | 9,500 | | | 6,050 | | | | |
| Undistributed earnings of wholly-owned subsidiaries | | | 13,882 | | | 13,155 | | | 22,332 | |
| Interest expense | | | (4,767 | ) | | (2,846 | ) | | (2,086 | ) |
| All other income and expenses, net | | | 687 | | | (269 | ) | | (132 | ) |
| Net income | | $ | 19,302 | | | 16,090 | | | 20,114 | |
| CONDENSED STATEMENTS OF CASH FLOWS | | Year Ended December 31, | |
(In thousands) | | 2006 | | 2005 | | 2004 | |
| | | | | | | | |
| Operating Activities: | | | | | | | | | | |
| Net income | | $ | 19,302 | | | 16,090 | | | 20,114 | |
| Equity in undistributed earnings of subsidiaries | | | (13,882 | ) | | (13,155 | ) | | (22,332 | ) |
| Decrease (increase) in other assets | | | (605 | ) | | 177 | | | 122 | |
| Increase in other liabilities | | | 240 | | | 325 | | | 356 | |
| Total - operating activities | | | 5,055 | | | 3,437 | | | (1,740 | ) |
| Investing Activities: | | | | | | | | | | |
| Downstream cash investment in subsidiary | | | (22,000 | ) | | | | | – | |
| Total - investing activities | | | (22,000 | ) | | – | | | – | |
| Financing Activities: | | | | | | | | | | |
| Proceeds from borrowings | | | 25,774 | | | – | | | – | |
| Payment of cash dividends | | | (10,423 | ) | | (9,761 | ) | | (9,138 | ) |
| Proceeds from issuance of common stock | | | 2,584 | | | 2,389 | | | 2,547 | |
| Purchases and retirement of common stock | | | (1,112 | ) | | – | | | (6,528 | ) |
| Total - financing activities | | | 16,823 | | | (7,372 | ) | | (13,119 | ) |
| Net decrease in cash and cash equivalents | | | (122 | ) | | (3,935 | ) | | (14,859 | ) |
| Cash and cash equivalents, beginning of year | | | 2,000 | | | 5,935 | | | 20,794 | |
| Cash and cash equivalents, end of year | | $ | 1,878 | | | 2,000 | | | 5,935 | |
| | | | | | | | | | | |
REPORT OF INDEPENDENT REGISTERED PUBLIC ACCOUNTING FIRM
To the Board of Directors and Shareholders
First Bancorp
Troy, North Carolina
We have audited the accompanying consolidated balance sheets of First Bancorp and subsidiaries (the “Company”) as of December 31, 2006 and 2005, and the related consolidated statements of income, comprehensive income, shareholders' equity and cash flows for each of the years in the two-year period ended December 31, 2006. We also have audited management's assessment, included in the accompanying Management’s Report on Internal Control Over Financial Reporting, that the Company maintained effective internal control over financial reporting as of December 31, 2006, based on criteria established in Internal Control— Integrated Framework issued by the Committee of Sponsoring Organizations of the Treadway Commission (“COSO”). The Company's management is responsible for these consolidated financial statements, for maintaining effective internal control over financial reporting, and for its assessment of the effectiveness of internal control over financial reporting. Our responsibility is to express an opinion on these consolidated financial statements, an opinion on management's assessment, and an opinion on the effectiveness of the Company's internal control over financial reporting based on our audits.
We conducted our audits in accordance with the standards of the Public Company Accounting Oversight Board (United States). Those standards require that we plan and perform the audits to obtain reasonable assurance about whether the financial statements are free of material misstatement and whether effective internal control over financial reporting was maintained in all material respects. Our audit of financial statements included examining, on a test basis, evidence supporting the amounts and disclosures in the financial statements, assessing the accounting principles used and significant estimates made by management, and evaluating the overall financial statement presentation. Our audit of internal control over financial reporting included obtaining an understanding of internal control over financial reporting, evaluating management's assessment, testing and evaluating the design and operating effectiveness of internal control, and performing such other procedures as we considered necessary in the circumstances. We believe that our audits provide a reasonable basis for our opinions.
A company's internal control over financial reporting is a process designed to provide reasonable assurance regarding the reliability of financial reporting and the preparation of financial statements for external purposes in accordance with generally accepted accounting principles. A company's internal control over financial reporting includes those policies and procedures that (1) pertain to the maintenance of records that, in reasonable detail, accurately and fairly reflect the transactions and dispositions of the assets of the company; (2) provide reasonable assurance that transactions are recorded as necessary to permit preparation of financial statements in accordance with generally accepted accounting principles, and that receipts and expenditures of the company are being made only in accordance with authorizations of management and directors of the company; and (3) provide reasonable assurance regarding prevention or timely detection of unauthorized acquisition, use, or disposition of the company's assets that could have a material effect on the financial statements.
Because of its inherent limitations, internal control over financial reporting may not prevent or detect misstatements. Also, projections of any evaluation of effectiveness to future periods are subject to the risk that controls may become inadequate because of changes in conditions, or that the degree of compliance with the policies or procedures may deteriorate.
In our opinion, the financial statements referred to above present fairly, in all material respects, the financial position of First Bancorp and subsidiaries as of December 31, 2006 and 2005, and the results of their operations and their cash flows for each of the years in the two-year period ended December 31, 2006 in conformity with accounting principles generally accepted in the United States of America. Also in our opinion, management’s assessment that First Bancorp and subsidiaries maintained effective internal control over financial reporting as of December 31, 2006, is fairly stated, in all material respects, based on criteria established in Internal Control—Integrated Framework issued by COSO. Furthermore, in our opinion, First Bancorp and subsidiaries maintained, in all material respects, effective internal control over financial reporting as of December 31, 2006, based on criteria established in Internal Control—Integrated Framework issued by COSO.
Greenville, South Carolina
March 6, 2007
Report of Independent Registered Public Accounting Firm
The Board of Directors and Shareholders
First Bancorp:
We have audited the accompanying consolidated statements of income, comprehensive income, shareholders’ equity and cash flows of First Bancorp and subsidiaries for the year ended December 31, 2004. These consolidated financial statements are the responsibility of the Company’s management. Our responsibility is to express an opinion on these consolidated financial statements based on our audit.
We conducted our audit in accordance with the standards of the Public Company Accounting Oversight Board (United States). Those standards require that we plan and perform the audit to obtain reasonable assurance about whether the financial statements are free of material misstatement. An audit includes examining, on a test basis, evidence supporting the amounts and disclosures in the financial statements. An audit also includes assessing the accounting principles used and significant estimates made by management, as well as evaluating the overall financial statement presentation. We believe that our audit provides a reasonable basis for our opinion.
In our opinion, the consolidated financial statements referred to above present fairly, in all material respects, the results of operations and the cash flows of First Bancorp and subsidiaries for the year ended December 31, 2004, in conformity with U.S. generally accepted accounting principles.
Charlotte, North Carolina
March 6, 2005
Item 9. Changes in and Disagreements with Accountants on Accounting and Financial Disclosures
During the two years ended December 31, 2006, and any subsequent interim periods, there were no disagreements on any matters of accounting principles or practices or financial statement disclosures.
As of the end of the period covered by this report, we carried out an evaluation, under the supervision and with the participation of our chief executive officer and chief financial officer, of the effectiveness of the design and operation of our disclosure controls and procedures, which are our controls and other procedures that are designed to ensure that information required to be disclosed in our periodic reports with the SEC is recorded, processed, summarized and reported within the required time periods. Disclosure controls and procedures include, without limitation, controls and procedures designed to ensure that information required to be disclosed is communicated to our management to allow timely decisions regarding required disclosure. Based on the evaluation, our chief executive officer and chief financial officer concluded that our disclosure controls and procedures are effective in allowing timely decisions regarding disclosure to be made about material information required to be included in our periodic reports with the SEC. In addition, no change in our internal control over financial reporting has occurred during, or subsequent to, the period covered by this report that has materially affected, or is reasonably likely to materially affect, our internal control over financial reporting.
Management’s Report On Internal Control Over Financial Reporting
Management of First Bancorp and its subsidiaries (the “Company”) is responsible for establishing and maintaining effective internal control over financial reporting. Internal control over financial reporting is a process designed to provide reasonable assurance regarding the reliability of financial reporting and the preparation of financial statements for external purposes in accordance with U.S. generally accepted accounting principles.
Under the supervision and with the participation of management, including the principal executive officer and principal financial officer, the Company conducted an evaluation of the effectiveness of internal control over financial reporting based on the framework in Internal Control - Integrated Framework issued by the Committee of Sponsoring Organizations of the Treadway Commission. Based on this evaluation under the framework in Internal Control - Integrated Framework, management of the Company has concluded the Company maintained effective internal control over financial reporting, as such term is defined in Securities Exchange Act of 1934 Rules 13a-15(f), as of December 31, 2006.
Internal control over financial reporting cannot provide absolute assurance of achieving financial reporting objectives because of its inherent limitations. Internal control over financial reporting is a process that involves human diligence and compliance and is subject to lapses in judgment and breakdowns resulting from human failures. Internal control over financial reporting can also be circumvented by collusion or improper management override. Because of such limitations, there is a risk that material misstatements may not be prevented or detected on a timely basis by internal control over financial reporting. However, these inherent limitations are known features of the financial reporting process. Therefore, it is possible to design into the process safeguards to reduce, though not eliminate, this risk.
Management is also responsible for the preparation and fair presentation of the consolidated financial statements and other financial information contained in this report. The accompanying consolidated financial statements were prepared in conformity with U.S. generally accepted accounting principles and include, as necessary, best estimates and judgments by management.
Elliott Davis, PLLC, an independent, registered public accounting firm, has audited the Company’s consolidated financial statements as of and for the year ended December 31, 2006, and the Company’s assertion as to the effectiveness of internal control over financial reporting as of December 31, 2006, as stated in their report, which is included in Item 8 hereof.
/s/ Jerry L. Ocheltree | | /s/ Eric P. Credle |
| Jerry L. Ocheltree | | Eric P. Credle |
| President and | | Senior Vice President and |
| Chief Executive Officer | | Chief Financial Officer |
| | | |
| March 6, 2007 | | |
Item 9B. Other Information
Not applicable.
Incorporated herein by reference is the information under the captions “Directors, Nominees and Executive Officers,” “Section 16(a) Beneficial Ownership Reporting Compliance,” “Corporate Governance Policies and Practices” and “Board Committees, Attendance and Compensation” from the Company’s definitive proxy statement to be filed pursuant to Regulation 14A.
Incorporated herein by reference is the information under the captions “Executive Compensation” and “Board Committees, Attendance and Compensation” from the Company’s definitive proxy statement to be filed pursuant to Regulation 14A.
Item 12. Security Ownership of Certain Beneficial Owners and Management and Related Shareholder Matters
Incorporated herein by reference is the information under the captions “Principal Holders of First Bancorp Voting Securities” and “Directors, Nominees and Executive Officers” from the Company’s definitive proxy statement to be filed pursuant to Regulation 14A.
Additional Information Regarding the Registrant’s Equity Compensation Plans
At December 31, 2006, the Company had six equity compensation plans. Each of these plans is a stock option plan. Four of the six plans were assumed in corporate acquisitions. The Company’s 2004 Stock Option Plan is the only one of the six plans for which new grants of stock options are possible.
The following table presents information as of December 31, 2006 regarding shares of the Company’s stock that may be issued pursuant to the Company’s stock options plans. The table does not include information with respect to shares subject to outstanding options granted under stock incentive plans assumed by the Company in connection with mergers and acquisitions of companies that originally granted those options. Footnote (2) to the table indicates the total number of shares of common stock issuable upon the exercise of options under the assumed plans as of December 31, 2006, and the weighted average exercise price of those options. No additional options may be granted under those assumed plans. The Company has no warrants or stock appreciation rights outstanding.
| | | As of December 31, 2006 |
| | | (a) | | (b) | | (c) |
Plan category | | Number of securities to be issued upon exercise of outstanding options | | Weighted-average exercise price of outstanding options | | Number of securities available for future issuance under equity compensation plans (excluding securities reflected in column (a)) |
Equity compensation plans approved by security holders (1) | | 620,233 | | $ 16.96 | | 1,193,740 |
Equity compensation plans not approved by security holders | | – | | – | | – |
| Total | | 620,233 | | $ 16.96 | | 1,193,740 |
(1) Consists of (A) the Company’s 2004 Stock Option Plan, which is currently in effect and (B) the Company’s 1994 Option Plan, each of which was approved by shareholders.
The table does not include information for stock incentive plans that the Company assumed in connection with mergers
and acquisitions of the companies that originally established those plans. As of December 31, 2006, a total of 35,871 shares of common stock were issuable upon exercise under those assumed plans. The weighted average exercise price of those outstanding options is $10.88 per share. No additional options may be granted under those assumed plans.
Incorporated herein by reference is the information under the caption “Certain Transactions” and “Corporate Governance Policies and Practices” from the Company’s definitive proxy statement to be filed pursuant to Regulation 14A.
Incorporated herein by reference is the information under the caption “Audit Committee Report” from the Company’s definitive proxy statement to be filed pursuant to Regulation 14A.
Item 15. Exhibits and Financial Statement Schedules
| (a) | 1. | Financial Statements - See Item 8 and the Cross Reference Index on page 2 for information concerning the Company’s consolidated financial statements and report of independent auditors. |
| | | |
| | 2. | Financial Statement Schedules - not applicable |
| | | |
| | 3. | Exhibits |
| | | |
| | | The following exhibits are filed with this report or, as noted, are incorporated by reference. Management contracts, compensatory plans and arrangements are marked with an asterisk (*). |
| 3.a | Copy of Articles of Incorporation of the Company and amendments thereto were filed as Exhibits 3.a.i through 3.a.v to the Company’s Quarterly Report on Form 10-Q for the period ended June 30, 2002, and are incorporated herein by reference. |
| 3.b | Copy of the Amended and Restated Bylaws of the Company was filed as Exhibit 3.b to the Company’s Annual Report on Form 10-K for the year ended December 31, 2003, and is incorporated herein by reference. |
| 4 | Form of Common Stock Certificate was filed as Exhibit 4 to the Company’s Quarterly Report on Form 10-Q for the quarter ended June 30, 1999, and is incorporated herein by reference. |
| 10.a | Data Processing Agreement dated October 1, 1984 by and between Bank of Montgomery (First Bank) and Montgomery Data Services, Inc. was filed as Exhibit 10(k) to the Registrant's Registration Statement Number 33-12692, and is incorporated herein by reference. |
| 10.b | First Bancorp Annual Incentive Plan was filed as Exhibit 10(a) to the Form 8-K filed on February 2, 2007 and is incorporated herein by reference. The target awards under this plan for the named executive officers and the performance goals established by the Board of Directors for 2007 were also disclosed in this filing. (*) |
| 10.c | Indemnification Agreement between the Company and its Directors and Officers was filed as Exhibit 10(t) to the Registrant's Registration Statement Number 33-12692, and is incorporated herein by reference. |
| 10.d | First Bancorp Senior Management Supplemental Executive Retirement Plan was filed as Exhibit 10.1 to the Company's Form 8-K filed on December 22, 2006, and is incorporated herein by reference. (*) |
| 10.e | First Bancorp 1994 Stock Option Plan was filed as Exhibit 10(f) to the Company's Annual Report on Form 10-K for the year ended December 31, 2001, and is incorporated herein by reference. (*) |
| 10.f | First Bancorp 2004 Stock Option Plan was filed as Exhibit B to the Registrant's Form Def 14A filed on March 30, 2004 and is incorporated herein by reference. (*) |
| 10.g | Employment Agreement between the Company and Anna G. Hollers dated August 17, 1998 was filed as Exhibit 10(m) to the Company's Quarterly Report on Form 10-Q for the quarter ended September 30, 1998, and is incorporated by reference (Commission File Number 000-15572). (*) |
| 10.h | Employment Agreement between the Company and Teresa C. Nixon dated August 17, 1998 was filed as Exhibit 10(n) to the Company's Quarterly Report on Form 10-Q for the quarter ended September 30, 1998, and is incorporated by reference (Commission File Number 000-15572). (*) |
| 10.i | Employment Agreement between the Company and Eric P. Credle dated August 17, 1998 was filed as Exhibit 10(p) to the Company's Annual Report on Form 10-K for the year ended December 31, 1998, and is incorporated herein by reference (Commission File Number 333-71431).(*) |
| 10.j | Employment Agreement between the Company and John F. Burns dated September 14, 2000 was filed as Exhibit 10.w to the Company's Quarterly Report on Form 10-Q for the quarter ended September 30, 2000 and is incorporated herein by reference. (*) |
| 10.k | Employment Agreement between the Company and James G. Hudson, Jr. dated May 17, 2001 was filed as Exhibit 10(p) to the Company's Annual Report on Form 10-K for the year ended December 31, 2001, and is incorporated herein by reference. (*) |
| 10.l | Amendment to the employment agreement between the Company and James G. Hudson, Jr. dated April 26, 2005 was filed as Exhibit 10.a to the Form 8-K filed on April 29, 2005 and is incorporated herein by reference. (*) |
| 10.m | Employment Agreement between the Company and R. Walton Brown dated January 15, 2003 was filed as Exhibit 10(b) to the Company's Quarterly Report on Form 10-Q for the quarter ended June 30, 2003 and is incorporated herein by reference. (*) |
| 10.n | Amendment to the employment agreement between the Company and R. Walton Brown dated March 8, 2005 was filed as Exhibit 10.n to the Company's Annual Report on Form 10-K for the year ended December 31, 2004 and is incorporated herein by reference. (*) |
| 10.o | Employment Agreement between the Company and Jerry L. Ocheltree was filed as Exhibit 10.1 to the Form 8-K filed on January 25, 2006, and is incorporated herein by reference. (*) |
| 10.p | First Bancorp Long Term Care Insurance Plan was filed as Exhibit 10(o) to the Company's Quarterly Report on Form 10-Q for the quarter ended September 30, 2004, and is incorporated by reference. (*) |
| 10.q | Description of Director Compensation pursuant to Item 601(b)(10)(iii)(A) of Regulation S-K was filed as Exhibit 10.s to the Company's Annual Report on Form 10-K for the year ended December 31, 2005 and is incorporated herein by reference. |
| 10.r | Advances and Security Agreement with the Federal Home Loan Bank of Atlanta dated February 15, 2005 was attached as Exhibit 99(a) to the Form 8-K filed on February 22, 2005, and is incorporated herein by reference |
| 10.s | The 2007 base salaries for certain of the Company’s executive officers were disclosed in the Company’s Form 8-K filed on December 22, 2006, and is incorporated herein by reference. (*) |
| 10.t | Consulting Agreement between the Company and James H. Garner dated December 4, 2006 was filed as Exhibit 10.1 to the Company's Form 8-K filed on December 4, 2006, and is incorporated by reference (Commission File Number 000-15572). |
| List of Subsidiaries of Registrant. |
| Consent of Independent Registered Public Accounting Firm, Elliott Davis, PLLC |
| Consent of Independent Registered Public Accounting Firm, KPMG LLP |
| Certification Pursuant to 18 U.S.C. Section 1350, as Adopted Pursuant to Section 302(a) of the Sarbanes-Oxley Act of 2002. |
| Certification Pursuant to 18 U.S.C. Section 1350, as Adopted Pursuant to Section 302(a) of the Sarbanes-Oxley Act of 2002. |
| Chief Executive Officer Certification Pursuant to 18 U.S.C. Section 1350, as Adopted Pursuant to Section 906 of the Sarbanes-Oxley Act of 2002. |
| Chief Financial Officer Certification Pursuant to 18 U.S.C. Section 1350, as Adopted Pursuant to Section 906 of the Sarbanes-Oxley Act of 2002 |
| (b) | Exhibits - see (a)(3) above |
| (c) | No financial statement schedules are filed herewith. |
Copies of exhibits are available upon written request to: First Bancorp, Anna G. Hollers, Executive Vice President, P.O. Box 508, Troy, NC 27371
Pursuant to the requirements of Section 13 or 15(d) of the Securities Exchange Act of 1934, FIRST BANCORP has duly caused this Annual Report on Form 10-K to be signed on its behalf by the undersigned, thereunto duly authorized, in the City of Troy, and State of North Carolina, on the 12th day of March 2007.
First Bancorp
By: /s/ Jerry L. Ocheltree
Jerry L. Ocheltree
President, Chief Executive Officer and Treasurer
Pursuant to the requirements of the Securities Exchange Act of 1934, this report has been signed on behalf of the Company by the following persons and in the capacities and on the dates indicated.
Executive Officers
/s/ Jerry L. Ocheltree
Jerry L. Ocheltree
President, Chief Executive Officer and Treasurer
/s/ Anna G. Hollers Anna G. Hollers Executive Vice President Chief Operating Officer / Secretary March 12, 2007 | /s/ Eric P. Credle Eric P. Credle Senior Vice President Chief Financial Officer (Principal Accounting Officer) March 12, 2007 |
| | |
Board of Directors |
| | |
/s/ David L. Burns David L. Burns Chairman of the Board Director March 6, 2007 | /s/ Thomas F. Phillips Thomas F. Phillips Director March 6, 2007 |
| | |
/s/ Jack D. Briggs Jack D. Briggs Director March 6, 2007 | /s/ Edward T. Taws, Jr. Edward T. Taws, Jr. Director March 6, 2007 |
| | |
/s/ R. Walton Brown R. Walton Brown Director March 6, 2007 | /s/ Frederick L. Taylor II Frederick L. Taylor II Director March 6, 2007 |
| | |
/s/ H. David Bruton H. David Bruton Director March 6, 2007 | /s/ Virginia C. Thomasson Virginia C. Thomasson Director March 6, 2007 |
| | |
/s/ John F. Burns John F. Burns Director March 6, 2007 | /s/ Goldie H. Wallace Goldie H. Wallace Director March 6, 2007 |
| | |
| | |
/s/ Mary Clara Capel Mary Clara Capel Director March 6, 2007 | /s/ A. Jordan Washburn A. Jordan Washburn Director March 6, 2007 |
| | |
/s/ James G. Hudson, Jr. James G. Hudson, Jr. Director March 6, 2007 | /s/ Dennis A. Wicker Dennis A. Wicker Director March 6, 2007 |
| | |
/s/ Jerry L. Ocheltree Jerry L. Ocheltree Director March 6, 2007 | John C. Willis Director March 6, 2007 |
| | |
/s/ George R. Perkins, Jr. George R. Perkins, Jr. Director March 6, 2007 | |
112