Exhibit 99.2
Business Update
September 2016
Refer to kaiseraluminum.com
Forward looking statements
Our earnings release and reports filed with the SEC, including the Company’s most recent Form 10-K and Form 10-Q, provide a summary of the risk factors that could cause results to be materially different than any forward-looking statements in this presentation.
Non-GAAP financial measures
Reconciliations of the non-GAAP financial information in our discussion to the most comparable GAAP financial measures are included in our earnings release and in the investor presentation on our website kaiseraluminum.com.
2
Investment considerations
Leading positions in attractive, growing market segments Strong track record of growth and performance Excellent earnings growth potential Financial strength and flexibility to support continued growth
3
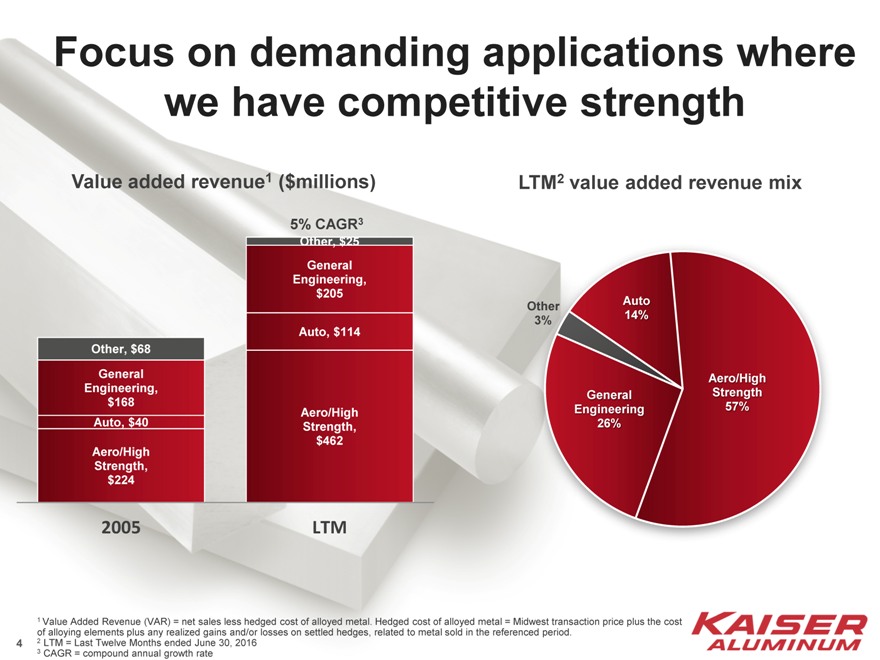
Focus on demanding applications where we have competitive strength
Value added revenue1 ($millions)
Other, $68 General Engineering, $168 Auto, $40
Aero/High Strength, $224
2005
5% CAGR3
Other, $25 General Engineering, $205
Auto, $114
Aero/High Strength, $462
LTM
LTM2 value added revenue mix
Other 3%
Auto 14%
Aero/High Strength 57%
General Engineering 26%
1 Value Added Revenue (VAR) = net sales less hedged cost of alloyed metal. Hedged cost of alloyed metal = Midwest transaction price plus the cost of alloying elements plus any realized gains and/or losses on settled hedges, related to metal sold in the referenced period.
2 LTM = Last Twelve Months ended June 30, 2016
3 CAGR = compound annual growth rate
4
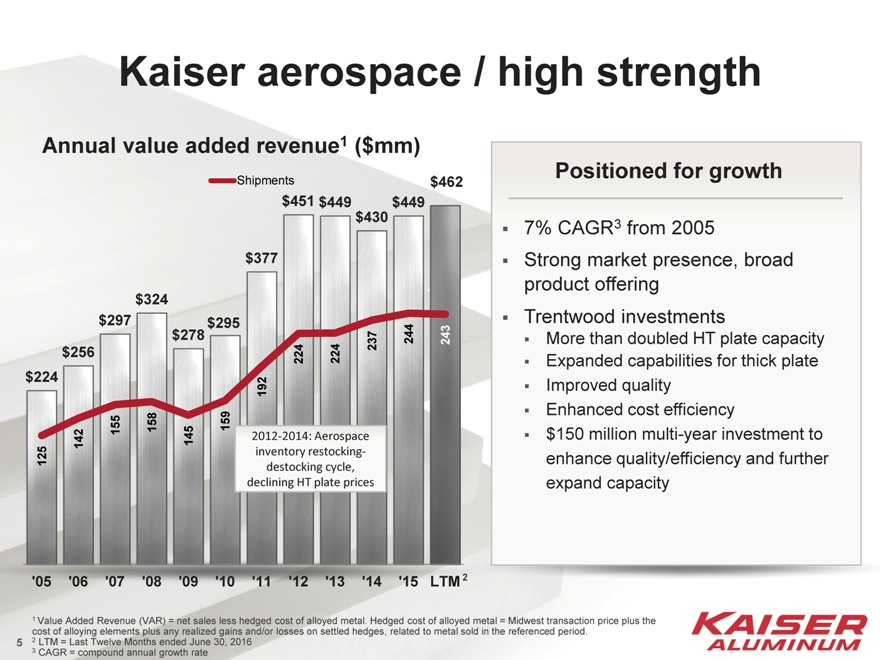
Kaiser aerospace / high strength
Annual value added revenue1 ($mm)
Shipments$462
$451 $449$449
$430
$377
$324
$297$295
$278237244243
$256 224224
$224 192
155158159
142 1452012-2014: Aerospace
125 inventory destocking restocking- cycle,
declining HT plate prices
‘05 ’06 ‘07’08’09’10 ‘11 ‘12 ‘13 ‘14’15LTM 2
Positioned for growth
7% CAGR3 from 2005
Strong market presence, broad product offering Trentwood investments
More than doubled HT plate capacity Expanded capabilities for thick plate Improved quality Enhanced cost efficiency $150 million multi-year investment to enhance quality/efficiency and further expand capacity
1 Value Added Revenue (VAR) = net sales less hedged cost of alloyed metal. Hedged cost of alloyed metal = Midwest transaction price plus the cost of alloying elements plus any realized gains and/or losses on settled hedges, related to metal sold in the referenced period.
2 LTM = Last Twelve Months ended June 30, 2016
3 CAGR = compound annual growth rate
5
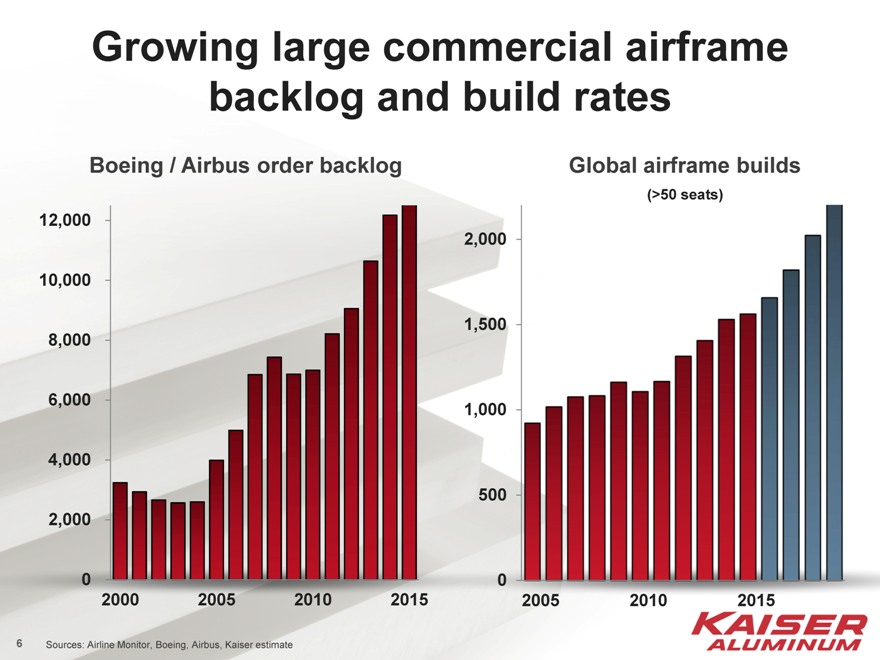
Growing large commercial airframe backlog and build rates
Boeing / Airbus order backlog
12,000 10,000 8,000 6,000 4,000 2,000 0
2000 2005 2010 2015
Global airframe builds
(>50 seats)
2005 2010 2015
2,000 1,500 1,000 500 0
Sources: Airline Monitor, Boeing, Airbus, Kaiser estimate
6
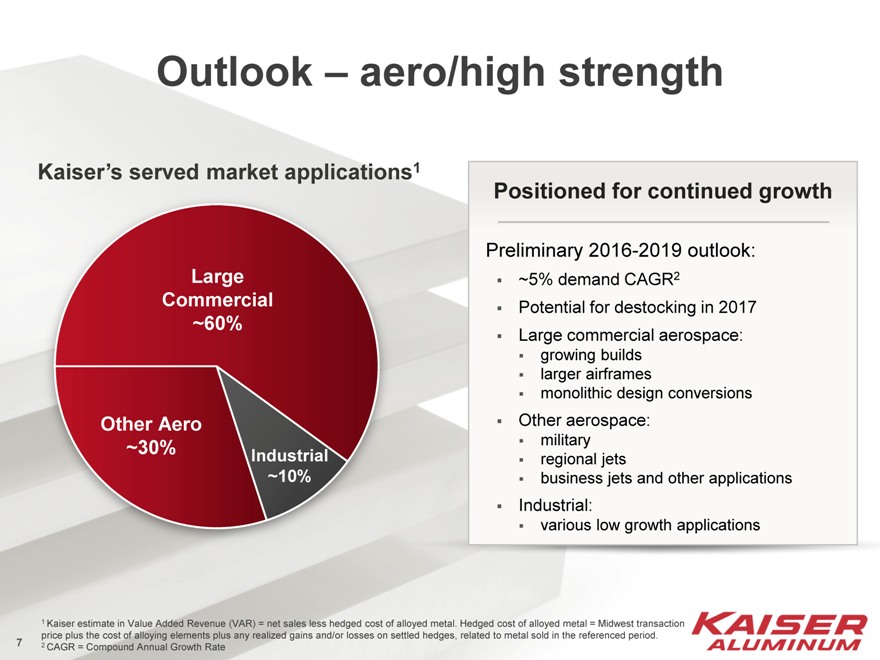
Outlook — aero/high strength
Kaiser’s served market applications1
Large Commercial ~60%
Industrial ~10%
Other Aero ~30%
Positioned for continued growth
Preliminary 2016-2019 outlook:
~5% demand CAGR2
Potential for destocking in 2017 Large commercial aerospace:
growing builds larger airframes monolithic design conversions
Other aerospace:
military regional jets business jets and other applications
Industrial:
various low growth applications
1 Kaiser estimate in Value Added Revenue (VAR) = net sales less hedged cost of alloyed metal. Hedged cost of alloyed metal = Midwest transaction price plus the cost of alloying elements plus any realized gains and/or losses on settled hedges, related to metal sold in the referenced period. 2 CAGR = Compound Annual Growth Rate
7
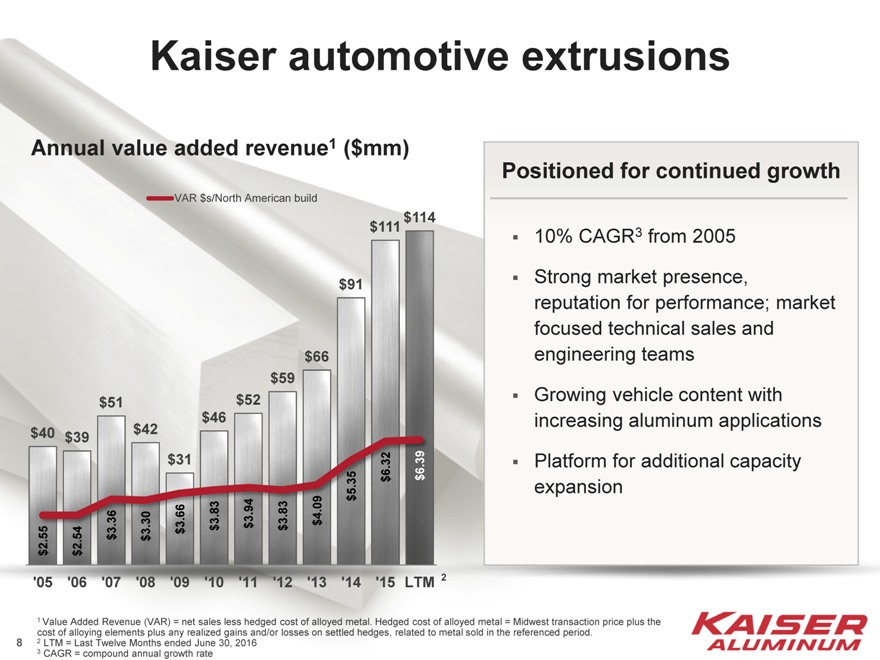
Kaiser automotive extrusions
Annual value added revenue1 ($mm)
VAR $s/North American build
‘05 $2.55 40 $
‘06 $2.54 39 $
‘07 $3.36 51 $
‘08 $3.30 42 $
‘09 $3.66 31 $
‘10 $3.83 46 $
‘11 $3.94 52 $
‘12 $3.83 59 $
‘13 $4.09 66 $
‘14 $5.35 91 $
$
‘15 $6.32111
LTM $6.39114 $
Positioned for continued growth
10% CAGR3 from 2005 Strong market presence, reputation for performance; market focused technical sales and engineering teams Growing vehicle content with increasing aluminum applications Platform for additional capacity expansion
1 Value Added Revenue (VAR) = net sales less hedged cost of alloyed metal. Hedged cost of alloyed metal = Midwest transaction price plus the cost of alloying elements plus any realized gains and/or losses on settled hedges, related to metal sold in the referenced period.
2 LTM = Last Twelve Months ended June 30, 2016
3 CAGR = compound annual growth rate
8
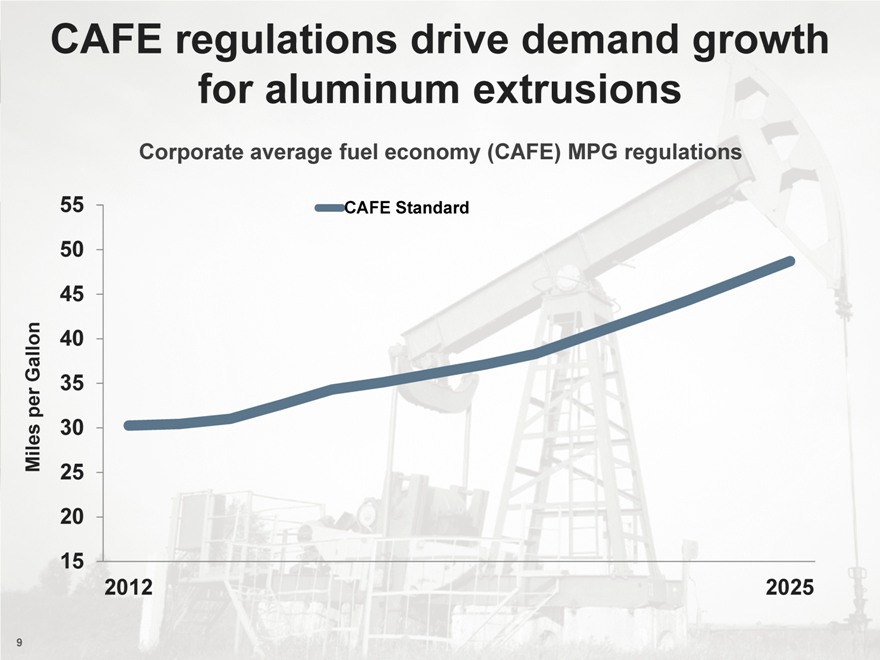
CAFE regulations drive demand growth for aluminum extrusions
Corporate average fuel economy (CAFE) MPG regulations
CAFE Standard
55 50 45
Gallon 40 per 35 Miles 30
25 20 15
2012 2025
9
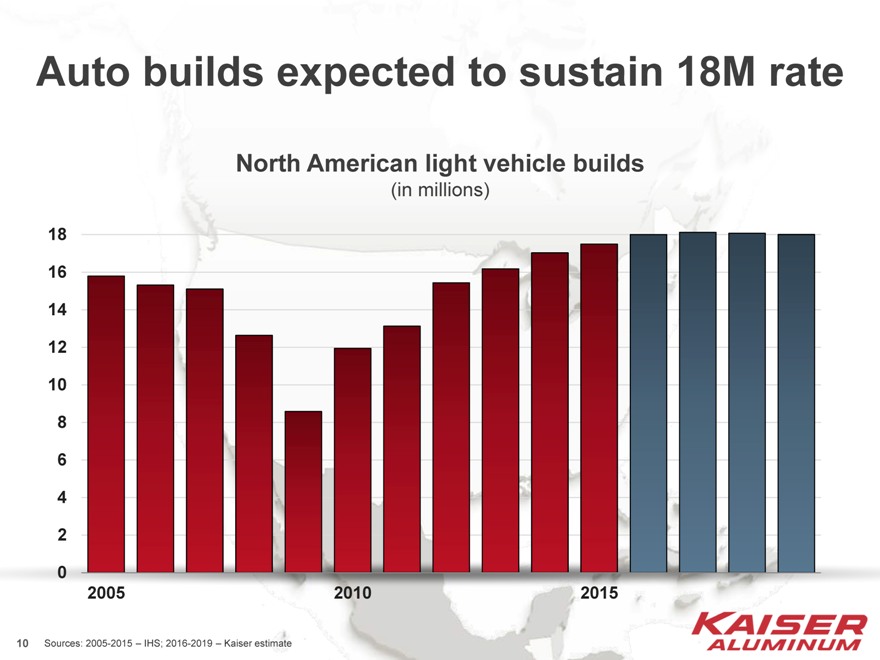
Auto builds expected to sustain 18M rate
North American light vehicle builds
(in millions)
18 16 14 12 10 8 6 4 2 0
2005 2010 2015
Sources: 2005-2015 – IHS; 2016-2019 – Kaiser estimate
10
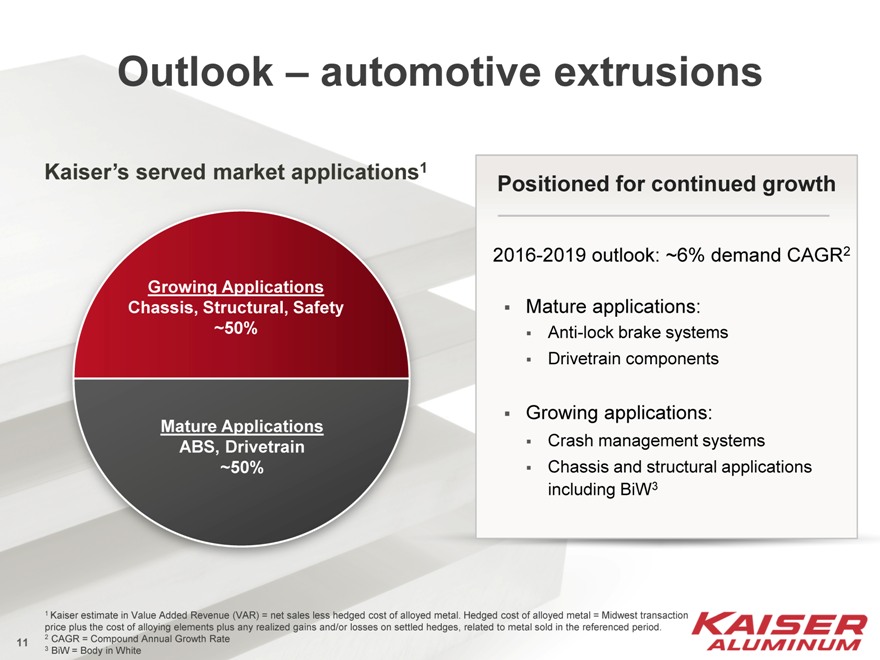
Outlook — automotive extrusions
Kaiser’s served market applications1
Growing Applications Chassis, Structural, Safety ~50%
Mature Applications ABS, Drivetrain ~50%
Positioned for continued growth
2016-2019 outlook: ~6% demand CAGR2
Mature applications:
Anti-lock brake systems Drivetrain components
Growing applications:
Crash management systems Chassis and structural applications including BiW3
1 Kaiser estimate in Value Added Revenue (VAR) = net sales less hedged cost of alloyed metal. Hedged cost of alloyed metal = Midwest transaction price plus the cost of alloying elements plus any realized gains and/or losses on settled hedges, related to metal sold in the referenced period.
2 CAGR = Compound Annual Growth Rate
3 BiW = Body in White
11
Kaiser general engineering
Annual value added revenue1 ($mm)
Armor plate demand surge 2006-2008
$249
$225
$200 $205
$191 $174 $175 $192 $186 $182
$168 $165
‘05 ’06 ‘07’08’09’10 ‘11 ‘12 ‘13 ‘14’15 LTM 2
Growth tied to U.S. industrial economy
2% CAGR3 from 2005 Highly recognized name brand Differentiated KaiserSelect® quality Broad product offering Commitment and infrastructure to support national service centers
1 Value Added Revenue (VAR) = net sales less hedged cost of alloyed metal. Hedged cost of alloyed metal = Midwest transaction price plus the cost of alloying elements plus any realized gains and/or losses on settled hedges, related to metal sold in the referenced period.
2 LTM = Last Twelve Months ended June 30, 2016
3 CAGR = compound annual growth rate
12
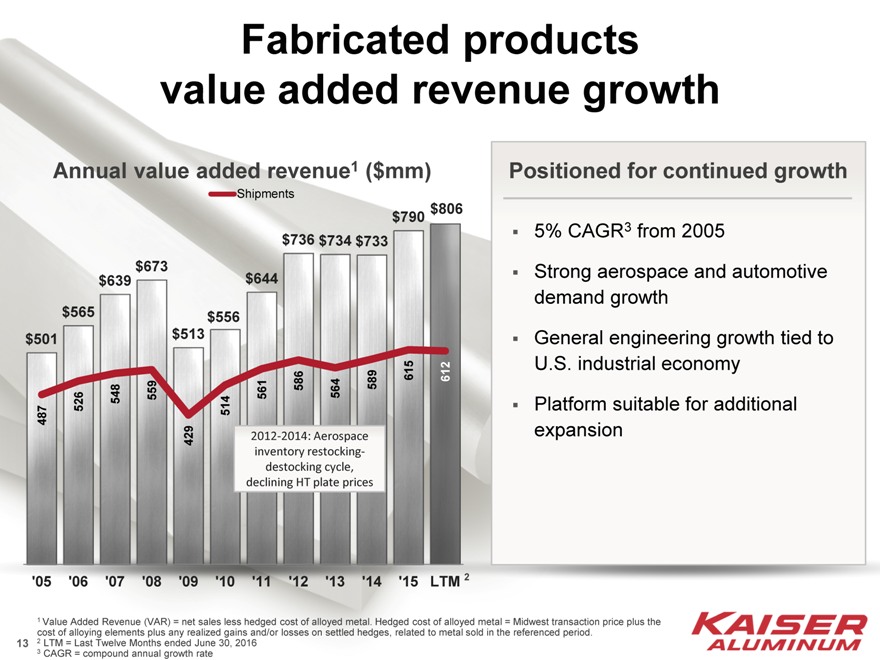
Fabricated products value added revenue growth
Annual value added revenue1 ($mm)
Shipments
$790$806
$736 $734 $733
$673
$639$644
$565 $556
$501 $513
586589615612
526 548559514561564
487
4292012-2014: Aerospace
inventory restocking-
destocking cycle,
declining HT plate prices
‘05 ’06 ‘07’08’09’10’11 ‘12’13 ‘14’15LTM 2
Positioned for continued growth
5% CAGR3 from 2005
Strong aerospace and automotive demand growth General engineering growth tied to U.S. industrial economy Platform suitable for additional expansion
1 Value Added Revenue (VAR) = net sales less hedged cost of alloyed metal. Hedged cost of alloyed metal = Midwest transaction price plus the cost of alloying elements plus any realized gains and/or losses on settled hedges, related to metal sold in the referenced period.
2 LTM = Last Twelve Months ended June 30, 2016
3 CAGR = compound annual growth rate
13
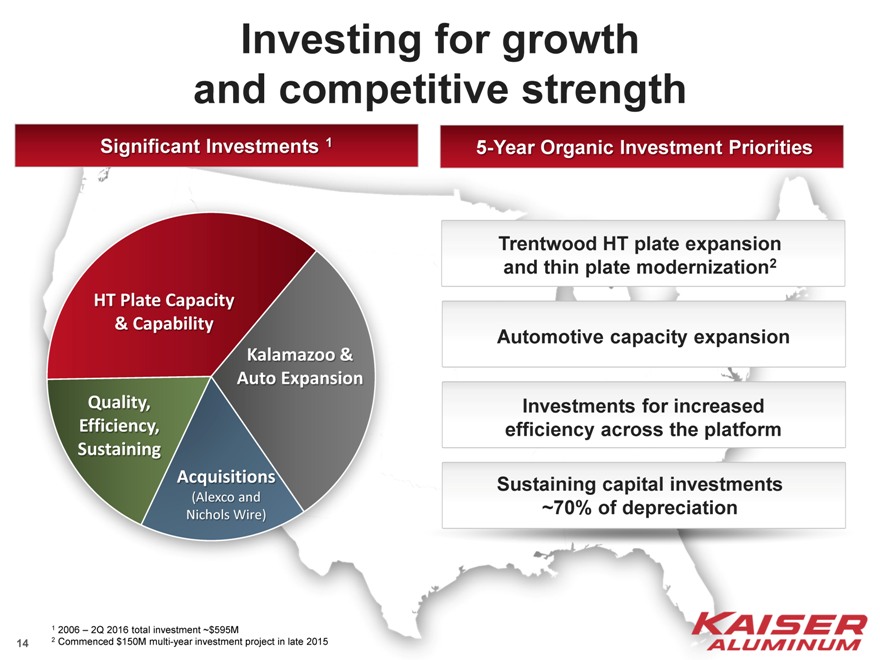
Investing for growth and competitive strength
Significant Investments 1
HT Plate Capacity
& Capability
Kalamazoo &
Auto Expansion
Quality, Efficiency, Sustaining
Acquisitions
(Alexco and Nichols Wire)
Trentwood HT plate expansion and thin plate modernization2
Automotive capacity expansion
Investments for increased efficiency across the platform
Sustaining capital investments ~70% of depreciation
1 2006 – 2Q 2016 total investment ~$595M
2 Commenced $150M multi-year investment project in late 2015
14
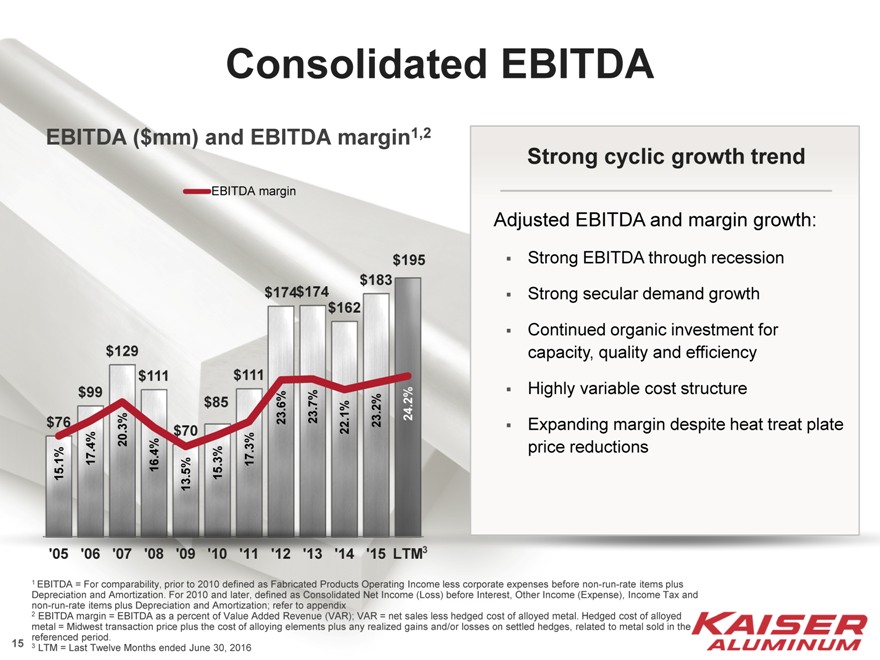
Consolidated EBITDA
EBITDA ($mm) and EBITDA margin1,2
EBITDA margin
$
15.1% 76
$
17.4% 99
$
20.3% 129
$
16.4% 111
$
13.5% 70
$
15.3% 85
$
17.3% 111
$
23.6%174
$
23.7%174
$
22.1%162
$
23.2%183
$
24.2%195
3
Strong cyclic growth trend
Adjusted EBITDA and margin growth:
Strong EBITDA through recession Strong secular demand growth Continued organic investment for capacity, quality and efficiency Highly variable cost structure Expanding margin despite heat treat plate price reductions
1 EBITDA = For comparability, prior to 2010 defined as Fabricated Products Operating Income less corporate expenses before non-run-rate items plus Depreciation and Amortization. For 2010 and later, defined as Consolidated Net Income (Loss) before Interest, Other Income (Expense), Income Tax and non-run-rate items plus Depreciation and Amortization; refer to appendix
2 EBITDA margin = EBITDA as a percent of Value Added Revenue (VAR); VAR = net sales less hedged cost of alloyed metal. Hedged cost of alloyed metal = Midwest transaction price plus the cost of alloying elements plus any realized gains and/or losses on settled hedges, related to metal sold in the referenced period.
3 LTM = Last Twelve Months ended June 30, 2016
15
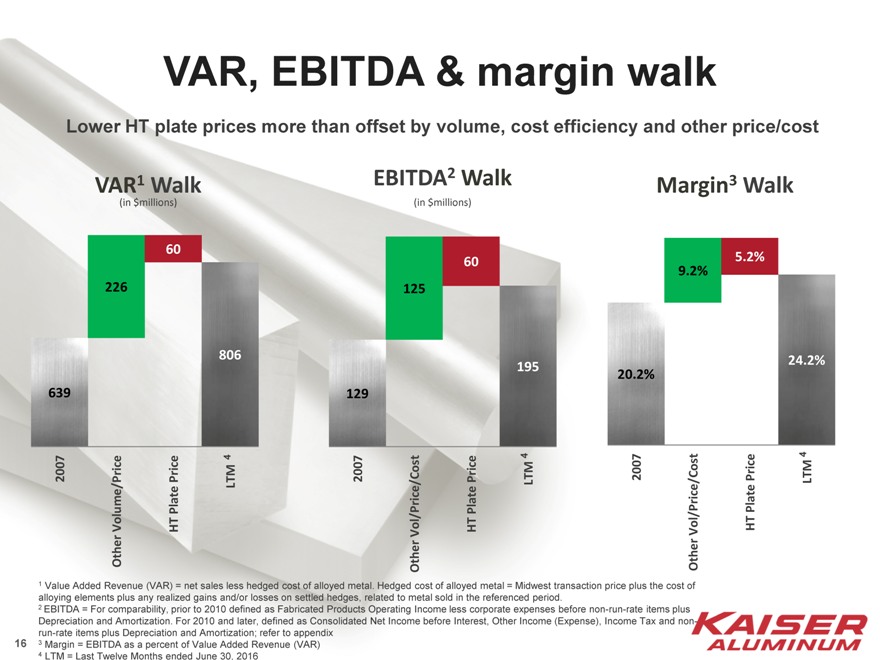
VAR, EBITDA & margin walk
Lower HT plate prices more than offset by volume, cost efficiency and other price/cost
VAR1 Walk
(in $millions)
2007 639
Other Volume/Price 226
HT Plate Price 60
LTM 4 806
EBITDA2 Walk
(in $millions)
2007 129
Other Vol/Price/Cost 125
HT Plate Price 60
LTM 4 195
Margin3 Walk
2007 20.
2%
9.
Other Vol/Price/Cost 2%
5.
HT Plate Price 2%
LTM 4 24.
2%
1 Value Added Revenue (VAR) = net sales less hedged cost of alloyed metal. Hedged cost of alloyed metal = Midwest transaction price plus the cost of alloying elements plus any realized gains and/or losses on settled hedges, related to metal sold in the referenced period.
2 EBITDA = For comparability, prior to 2010 defined as Fabricated Products Operating Income less corporate expenses before non-run-rate items plus Depreciation and Amortization. For 2010 and later, defined as Consolidated Net Income before Interest, Other Income (Expense), Income Tax and non-run-rate items plus Depreciation and Amortization; refer to appendix
3 Margin = EBITDA as a percent of Value Added Revenue (VAR)
4 LTM = Last Twelve Months ended June 30, 2016
16
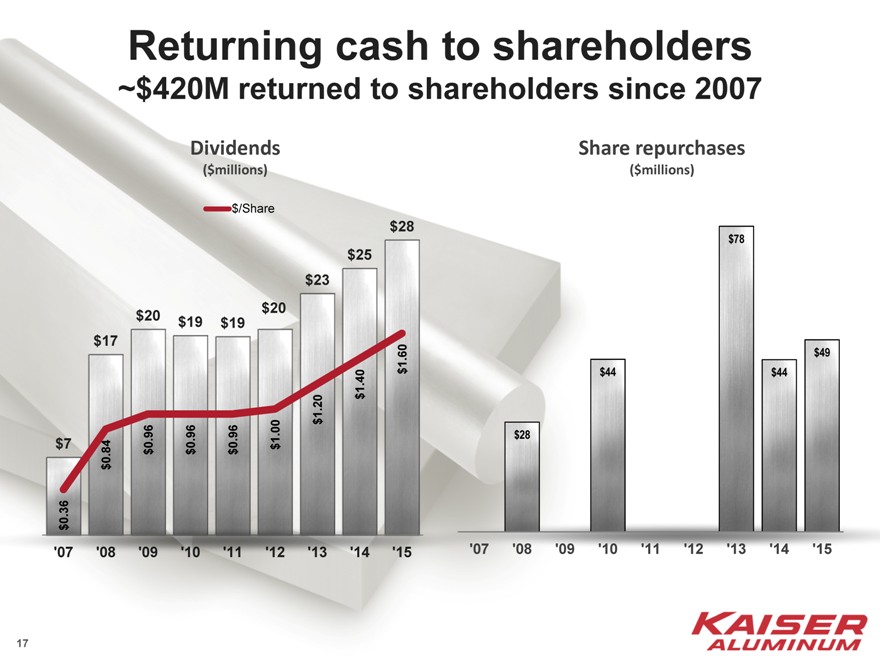
Returning cash to shareholders
~$420M returned to shareholders since 2007
Dividends
($millions)
$/Share
0.36 $
7
$
$0.84 17
$
$0.96 20
$
$0.96 19
$
$0.96 19
$
$1.00 20
$
$1.20 23
$
$1.4025
$
$1.6028
Share repurchases
($millions)
$78
$49
$44$44
$28
‘07 ‘08 ’09 ‘10’11’12’13’14’15
17
Financial flexibility and conservative capital structure
Financial data as of 6/30/16 1
Cash & Short-term investments2 $267
ABL revolver ($300 million) due Dec 1, 2020 -
5.875% Senior Unsecured Notes due May 15, 2024 375
Total Debt $375
Net Debt $108
Book Equity 808
Total Capitalization $1,183
Total Debt / Total Capitalization 31.7%
EBITDA2 $195
Total Debt / EBITDA 1.9x
Net Debt / EBITDA 0.6x
1 Balance Sheet data in millions of dollars, except for percentages and ratios
2 EBITDA = Last Twelve Months ended June 30, 2016 Consolidated Net Income before Interest, Other Income (Expense), Income Tax and non-run-rate items plus Depreciation and Amortization; refer to appendix
18
Experienced management team
Jack Hockema
CEO & Chairman Kaiser—24 years Industry—47 years
Dan Rinkenberger
EVP & CFO Kaiser—25 years Industry—25 years
John Donnan
EVP Legal, Compliance & Human Resources Kaiser—22 years Industry—22 years
Keith Harvey
President & COO Kaiser—35 years Industry—35 years
John Barneson
SVP Corporate Development Kaiser—41 years Industry—41 years
Senior management team has been together over 20 years; supported by a deep, strong organization
First 10 years: restructured and repositioned the company and business model Past 10 years: achieved steady, long-term growth facilitated by the strong business model
19
Investment considerations
Leading positions in attractive, growing market segments Strong track record of growth and performance Excellent earnings growth potential Financial strength and flexibility to support continued growth
20
Well positioned for further growth
21
Appendix – Company Overview
22
Forward looking statements
The information contained in this presentation includes statements based on management’s current expectations, estimates and projections that constitute “forward-looking statements” within the meaning of the Private Securities Litigation Reform Act of 1995. Such statements include statements regarding the company’s anticipated financial and operating performance, relate to future events and expectations and involve known and unknown risks and uncertainties. The Company cautions that such forward-looking statements are not guarantees of future performance or events and involve significant risks and uncertainties and actual events may vary materially from those expressed or implied in the forward-looking statements as a result of various factors. For a summary of specific risk factors that could cause results to differ materially from those expressed in the forward-looking statements, please refer to the company’s reports filed with the Securities and Exchange Commission, including the company’s most recent Forms 10-Q and 10–K. All information in this presentation is as of the date of the presentation. The company undertakes no duty to update any forward-looking statement to conform the statement to actual results or changes in the company’s expectations except as may be required by law.
23
Non-run-rate items
Non-run-rate items to us are items that, while they may recur from period to period, (1) are particularly material to results, (2) impact costs as a result of external market factors and (3) may not recur in future periods if the same level of underlying performance were to occur. These are part of our business and operating environment but are worthy of being highlighted for the benefit of the users of our financial statements.
Further, presentations including such terms as net income, operating income, or earnings before interest, tax, depreciation and amortization (“EBITDA”) “before non-run-rate”, “after adjustments” or “adjusted”, are not intended to be (and should not be relied on) in lieu of the comparable caption under generally accepted accounting principles (“GAAP”) to which it is reconciled. Such presentations are solely intended to provide greater clarity of the impact of certain material items on the GAAP measure and are not intended to imply such items should be excluded.
24
Non-GAAP financial measures
This information contains certain non-GAAP financial measures. A “non-GAAP financial measure” is defined as a numerical measure of a company’s financial performance that excludes or includes amounts so as to be different than the most directly comparable measure calculated and presented in accordance with GAAP in the statements of income, balance sheets or statements of cash flow of the Company. The company has provided a reconciliation of non-GAAP financial measures to the most directly comparable financial measure in the accompanying tables.
The non-GAAP financial measures used within this presentation are value added revenue, EBITDA, Adjusted EBITDA, operating income excluding non-run-rate items, adjusted net income and earnings per diluted share, excluding non-run-rate items and ratios related thereto. These measures are presented because management uses this information to monitor and evaluate financial results and trends and believes this information to also be useful for investors.
25
Investment considerations
Leading positions in attractive, growing market segments
Demanding applications Strong market presence Competitive strength
Excellent earnings growth potential
Attractive, growing market segments Significant investments Platform for organic and acquisition growth
Financial strength and
flexibility to support
continued growth
Strong Liquidity
Moderate leverage
Significant tax attributes
Consistent cash flow
generation
Strong track record of growth and performance
26
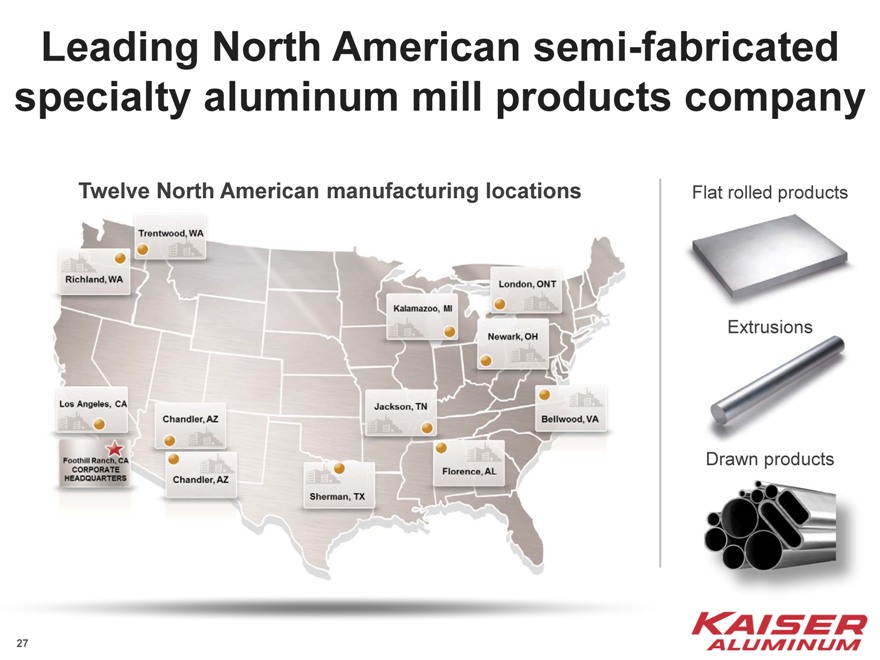
Leading North American semi-fabricated specialty aluminum mill products company
Twelve North American manufacturing locations
Flat rolled products Extrusions Drawn products
27
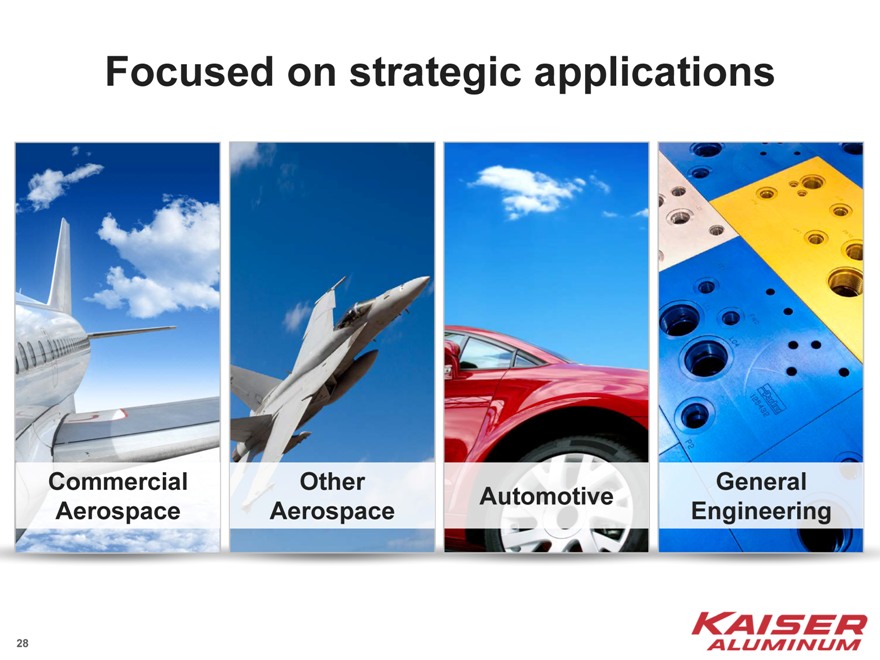
Focused on strategic applications
Commercial Aerospace
Other Aerospace
Automotive
General Engineering
28
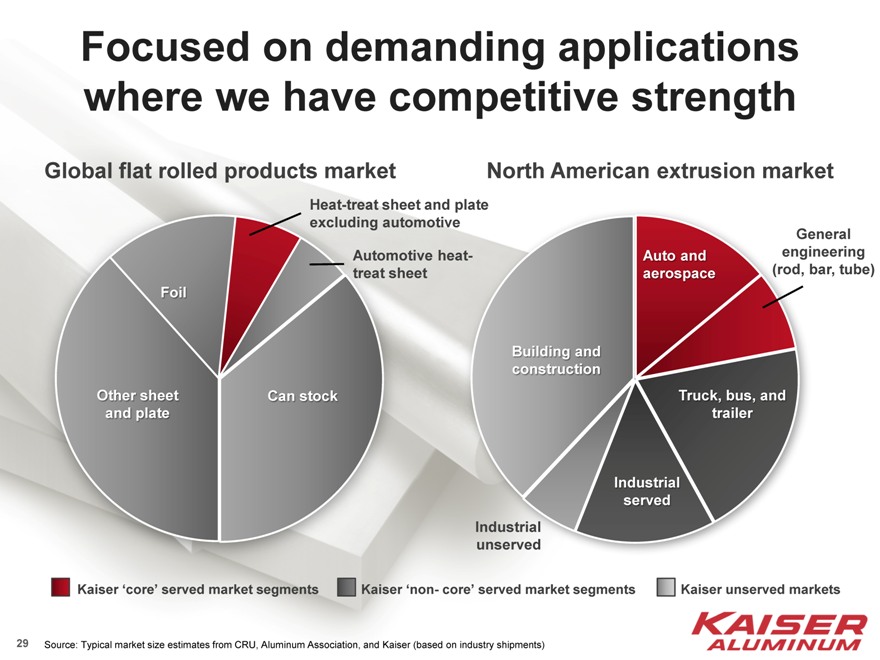
Focused on demanding applications where we have competitive strength
Global flat rolled products market
Heat-treat sheet and plate excluding automotive Automotive heat-treat sheet
Foil
Other sheet Can stock
and plate
North American extrusion market
General engineering (rod, bar, tube)
Auto and aerospace
Truck, bus, and trailer
Industrial served
Building and construction
Industrial unserved
Kaiser ‘core’ served market segments
Kaiser ‘non- core’ served market segments
Kaiser unserved markets
Source: Typical market size estimates from CRU, Aluminum Association, and Kaiser (based on industry shipments)
29
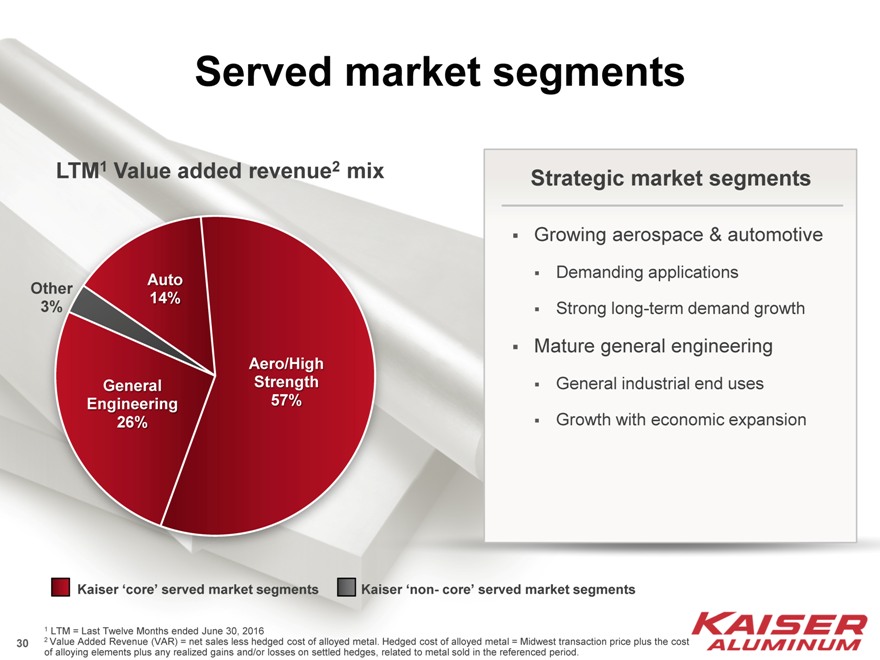
Served market segments
LTM1 Value added revenue2 mix
Auto 14%
Aero/High Strength 57%
General Engineering 26%
Other
3%
Strategic market segments
Growing aerospace & automotive
Demanding applications Strong long-term demand growth
Mature general engineering
General industrial end uses Growth with economic expansion
Kaiser ‘core’ served market segments
Kaiser ‘non- core’ served market segments
1 LTM = Last Twelve Months ended June 30, 2016
2 Value Added Revenue (VAR) = net sales less hedged cost of alloyed metal. Hedged cost of alloyed metal = Midwest transaction price plus the cost of alloying elements plus any realized gains and/or losses on settled hedges, related to metal sold in the referenced period.
30
Creating value with
KaiserSelect ® products
Differentiate with KaiserSelect®
KaiserSelect® products with reliable machinability or other characteristics help create value for customers by improving their manufacturing processes and profitability
We can offer KaiserSelect® products due to Kaiser’s standard work and recipe-driven controls… commercializing the result of our disciplined manufacturing process
31
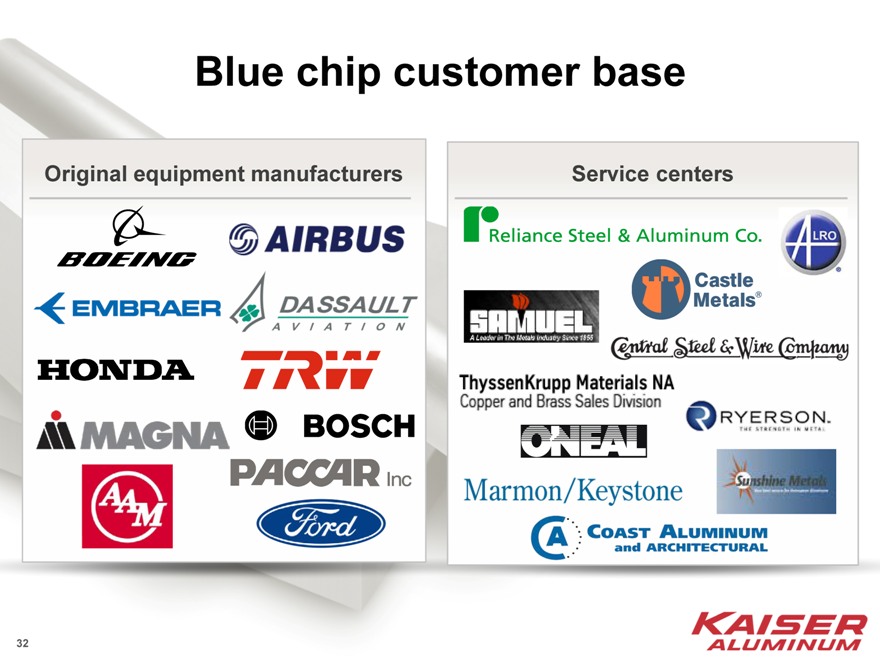
Blue chip customer base
Original equipment manufacturers
Service centers
32
Investing for growth and competitive strength
Significant Investments 1
HT Plate Capacity
& Capability
Kalamazoo &
Auto Expansion
Quality, Efficiency, Sustaining
Acquisitions
(Alexco and Nichols Wire)
Trentwood HT plate expansion and thin plate modernization2
Automotive capacity expansion
Investments for increased efficiency across the platform
Sustaining capital investments ~70% of depreciation
1 2006 – 2Q 2016 total investment ~$595M
2 Commenced $150M multi-year investment project in late 2015
33
Fabricated products value added revenue growth
Annual value added revenue1 ($mm)
Shipments
$806 $790 $736 $734 $733 $673 $639 $644 $565 $556 $501 $513
586 589 615 612 548 559 561 564 487 526 514 429 2012-2014: Aerospace inventory restocking-destocking cycle, declining HT plate prices
‘05 ‘06 ‘07 ‘08 ‘09 ‘10 ‘11 ‘12 ‘13 ‘14 ‘15 LTM 2
Positioned for continued growth
5% CAGR3 from 2005
Strong aerospace and automotive demand growth General engineering growth tied to U.S. industrial economy Platform suitable for additional expansion
1 Value Added Revenue (VAR) = net sales less hedged cost of alloyed metal. Hedged cost of alloyed metal = Midwest transaction price plus the cost of alloying elements plus any realized gains and/or losses on settled hedges, related to metal sold in the referenced period.
2 LTM = Last Twelve Months ended June 30, 2016
3 CAGR = compound annual growth rate
34
Consolidated EBITDA
EBITDA ($mm) and EBITDA margin1,2
EBITDA margin
$
15.1% 76
$
17.4% 99
20.3% 129 $
$
16.4% 111
$
13.5% 70
$
15.3% 85
17.3% 111 $
$
23.6% 174
23.7% 174 $
$
22.1% 162
$
23.2% 183
$
24.2% 195
3
Strong cyclic growth trend
Adjusted EBITDA and margin growth:
Strong EBITDA through recession Strong secular demand growth Continued organic investment for capacity, quality and efficiency Highly variable cost structure Expanding margin despite heat treat plate price reductions
1 EBITDA = For comparability, prior to 2010 defined as Fabricated Products Operating Income less corporate expenses before non-run-rate items plus Depreciation and Amortization. For 2010 and later, defined as Consolidated Net Income (Loss) before Interest, Other Income (Expense), Income Tax and non-run-rate items plus Depreciation and Amortization; refer to appendix
2 EBITDA margin = EBITDA as a percent of Value Added Revenue (VAR); VAR = net sales less hedged cost of alloyed metal. Hedged cost of alloyed metal = Midwest transaction price plus the cost of alloying elements plus any realized gains and/or losses on settled hedges, related to metal sold in the referenced period.
3 LTM = Last Twelve Months ended June 30, 2016
35
VAR, EBITDA & margin walk
Lower HT plate prices more than offset by volume, cost efficiency and other price/cost
VAR1 Walk
(in $millions)
2007 639
Other Volume/Price 226
HT Plate Price 60
LTM 4 806
EBITDA2 Walk
(in $millions)
2007 129
Other Vol/Price/Cost 125
HT Plate Price 60
LTM 4 195
Margin3 Walk
9.2% 5.2%
20.2% 24.2%
4
2007Price LTM Plate Vol/Price/Cost HT
Other
1 Value Added Revenue (VAR) = net sales less hedged cost of alloyed metal. Hedged cost of alloyed metal = Midwest transaction price plus the cost of alloying elements plus any realized gains and/or losses on settled hedges, related to metal sold in the referenced period.
2 EBITDA = For comparability, prior to 2010 defined as Fabricated Products Operating Income less corporate expenses before non-run-rate items plus Depreciation and Amortization. For 2010 and later, defined as Consolidated Net Income before Interest, Other Income (Expense), Income Tax and non-run-rate items plus Depreciation and Amortization; refer to appendix
3 Margin = EBITDA as a percent of Value Added Revenue (VAR)
4 LTM = Last Twelve Months ended June 30, 2016
36
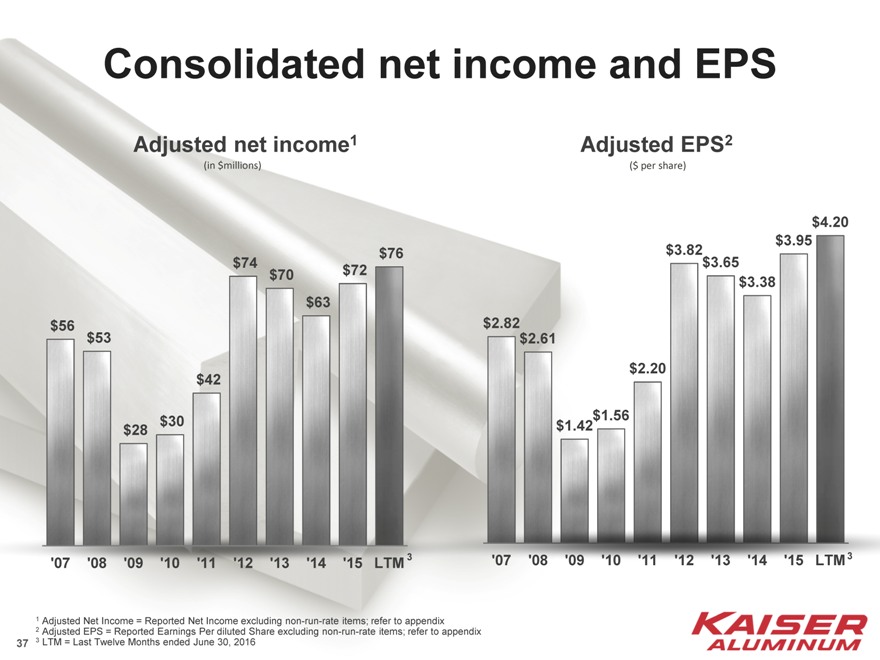
Consolidated net income and EPS
Adjusted net income1
(in $millions)
$76
$74 $72 $70 $63 $56 $53
$42
$30 $28
‘07 ‘08 ‘09 ‘10 ‘11 ‘12 ‘13 ‘14 ‘15 LTM 3
Adjusted EPS2
($ per share)
$4.20
$3.95
$3.82
$3.65
$3.38
$2.82$ 2.61
$2.20
$1.56
$1.42
‘07 ‘08 ‘09 ‘10 ‘11 ‘12 ‘13 ‘14 ‘15 LTM3
1 Adjusted Net Income = Reported Net Income excluding non-run-rate items; refer to appendix
2 Adjusted EPS = Reported Earnings Per diluted Share excluding non-run-rate items; refer to appendix
3 LTM = Last Twelve Months ended June 30, 2016
37
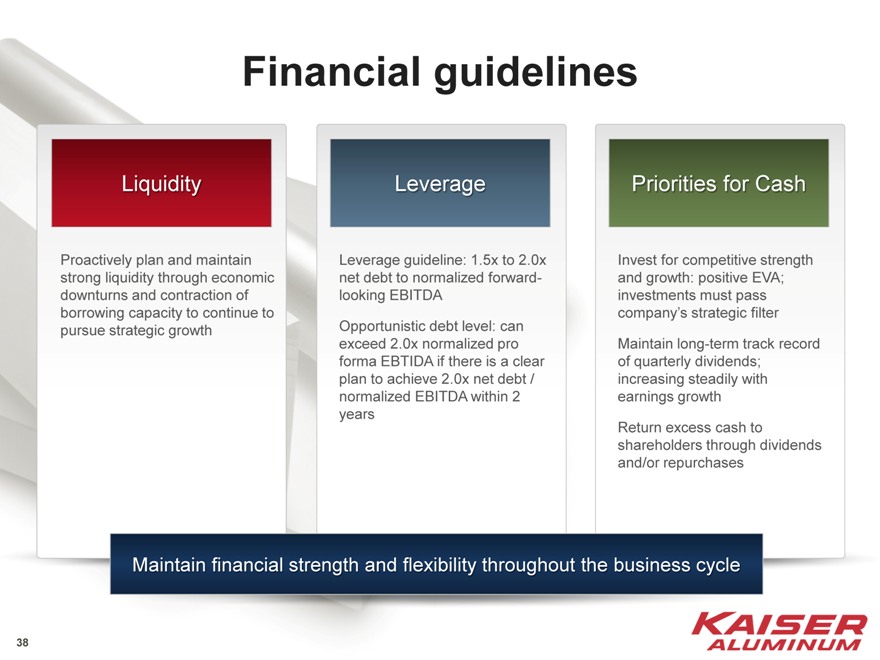
Financial guidelines
Liquidity
Proactively plan and maintain
strong liquidity through economic
downturns and contraction of
borrowing capacity to continue to
pursue strategic growth
Leverage
Leverage guideline: 1.5x to 2.0x net debt to normalized forward-looking EBITDA
Opportunistic debt level: can exceed 2.0x normalized pro forma EBTIDA if there is a clear plan to achieve 2.0x net debt / normalized EBITDA within 2 years
Priorities for Cash
Invest for competitive strength and growth: positive EVA; investments must pass company’s strategic filter Maintain long-term track record of quarterly dividends; increasing steadily with earnings growth Return excess cash to shareholders through dividends and/or repurchases
Maintain financial strength and flexibility throughout the business cycle
38
Financial flexibility and conservative capital structure
Financial data as of 6/30/16 1
Cash & Short-term investments2 $267
ABL revolver ($300 million) due Dec 1, 2020 -
5.875% Senior Unsecured Notes due May 15, 2024 375
Total Debt $375
Net Debt $108
Book Equity 808
Total Capitalization $1,183
Total Debt / Total Capitalization 31.7%
EBITDA2 $195
Total Debt / EBITDA 1.9x
Net Debt / EBITDA 0.6x
1 Balance Sheet data in millions of dollars, except for percentages and ratios
2 EBITDA = Last Twelve Months ended June 30, 2016 Consolidated Net Income before Interest, Other Income (Expense), Income Tax and non-run-rate items plus Depreciation and Amortization; refer to appendix
39
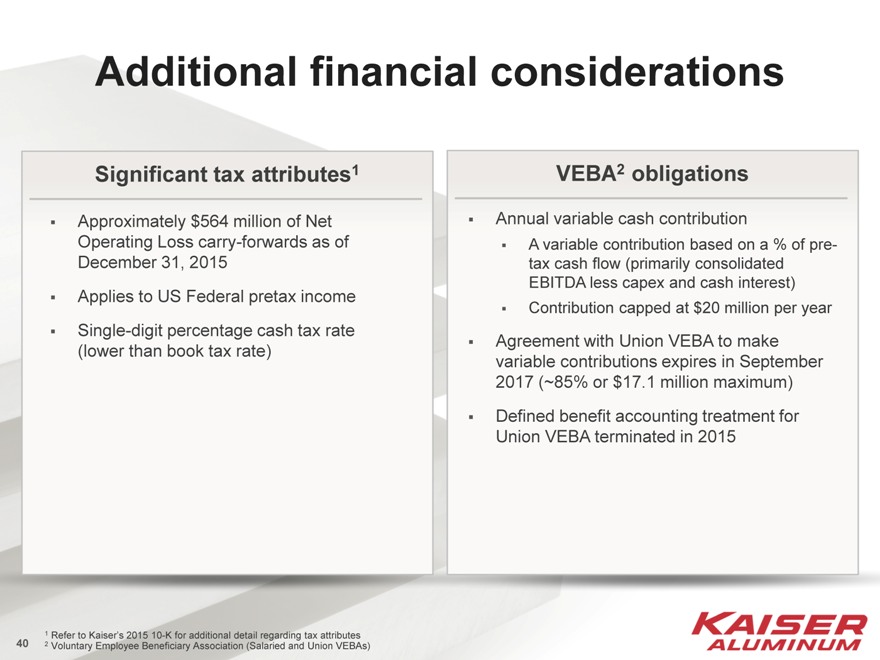
Additional financial considerations
Significant tax attributes1
Approximately $564 million of Net Operating Loss carry-forwards as of December 31, 2015 Applies to US Federal pretax income Single-digit percentage cash tax rate (lower than book tax rate)
VEBA2 obligations
Annual variable cash contribution
A variable contribution based on a % of pre-
tax cash flow (primarily consolidated
EBITDA less capex and cash interest)
Contribution capped at $20 million per year
Agreement with Union VEBA to make
variable contributions expires in September
2017 (~85% or $17.1 million maximum)
Defined benefit accounting treatment for
Union VEBA terminated in 2015
1 Refer to Kaiser’s 2015 10-K for additional detail regarding tax attributes
2 Voluntary Employee Beneficiary Association (Salaried and Union VEBAs)
40
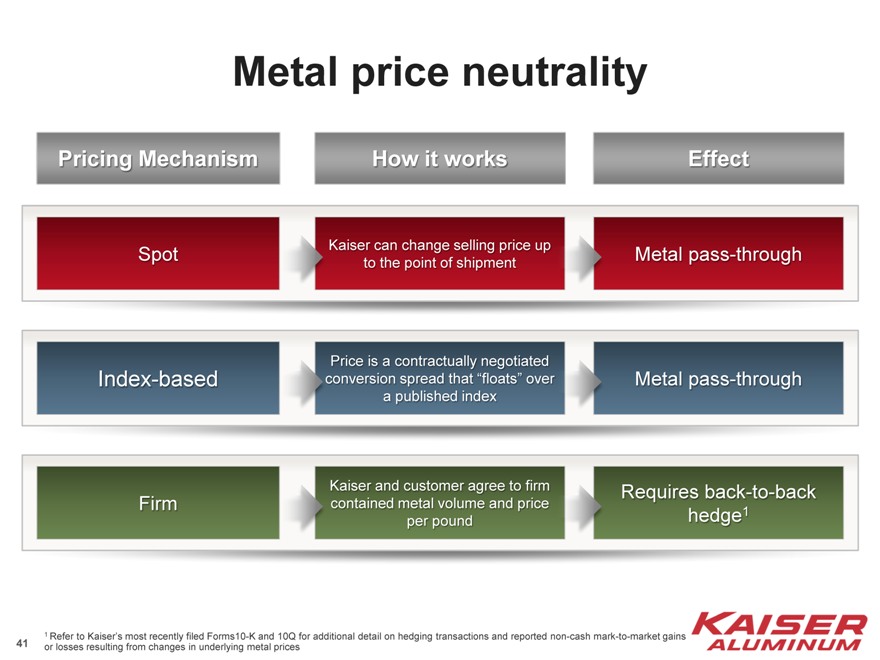
Metal price neutrality
Pricing Mechanism How it work Effe
Spot Kaiser can change selling price up Metalpass-through
to the point of shipment
Price is a contractually negotiated
Index-based conversion spread that “floats” over Metalpass-through
a published index
Kaiser and customer agree to firm Requires back-to-back
Firm contained metal volume and price
per pound hedge1
1 Refer to Kaiser’s most recently filed Forms10-K and 10Q for additional detail on hedging transactions and reported non-cash mark-to-market gains or losses resulting from changes in underlying metal prices
41
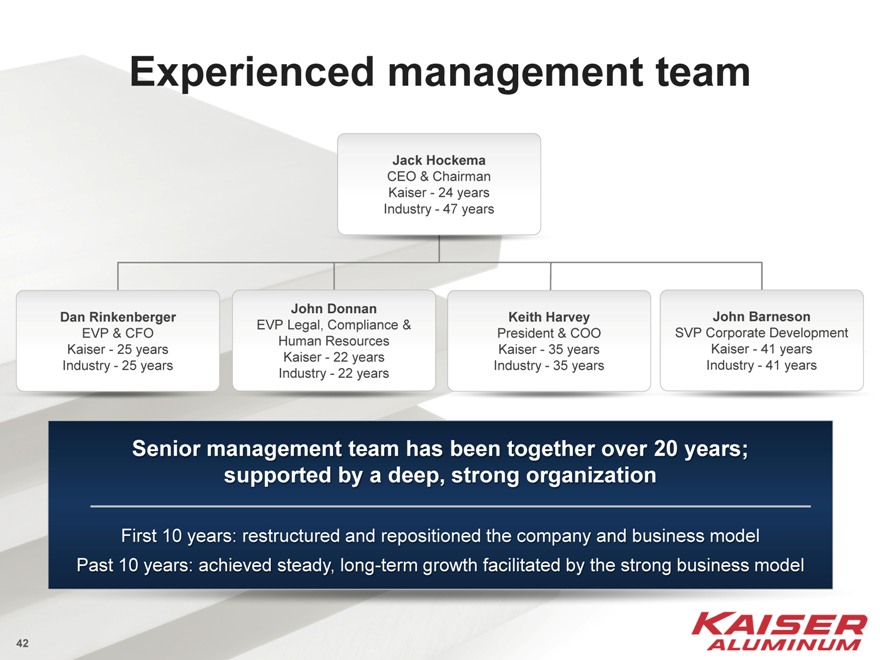
Experienced management team
Jack Hockema
CEO & Chairman Kaiser—24 years Industry—47 years
Dan Rinkenberger
EVP & CFO Kaiser—25 years Industry—25 years
John Donnan
EVP Legal, Compliance & Human Resources Kaiser—22 years Industry—22 years
Keith Harvey
President & COO Kaiser—35 years Industry—35 years
John Barneson
SVP Corporate Development Kaiser—41 years Industry—41 years
Senior management team has been together over 20 years; supported by a deep, strong organization
First 10 years: restructured and repositioned the company and business model Past 10 years: achieved steady, long-term growth facilitated by the strong business model
42
Appendix—Aerospace
43
Strong outlook for commercial aerospace demand
Commercial aerospace attributes
Broad product offering
High barriers to entry
Growth drivers
44
Aluminum demand drivers for commercial aerospace applications
Build rates
Aluminum content
45
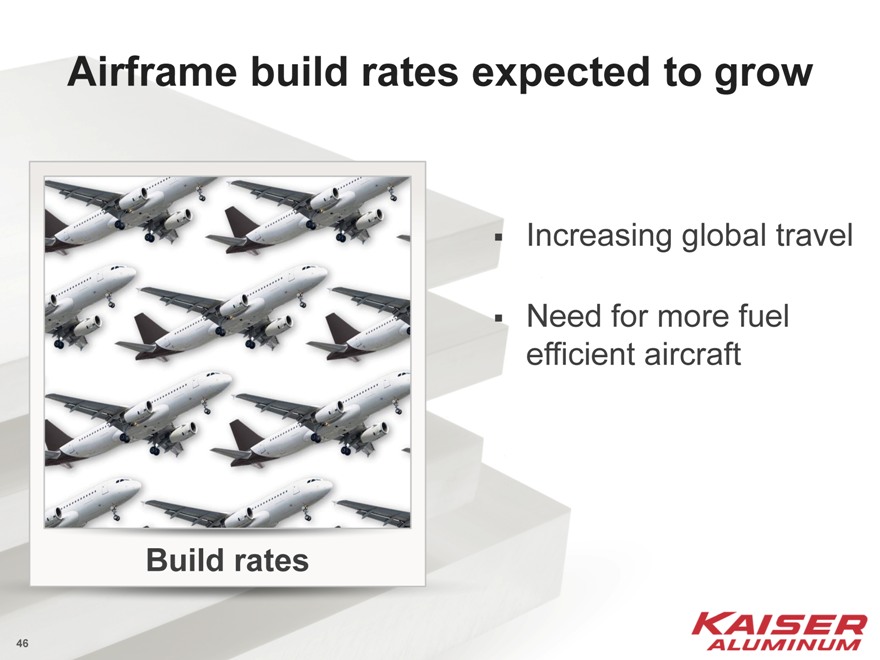
Airframe build rates expected to grow
Increasing global travel
Need for more fuel efficient aircraft
Build rates
46
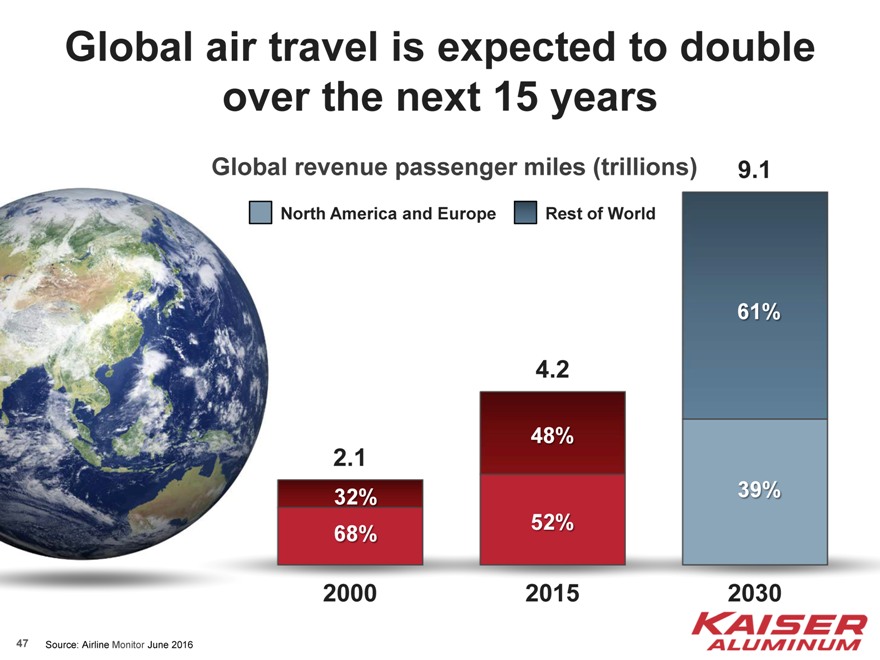
Global air travel is expected to double over the next 15 years
Global air travel is expected to double over the next 15 years
North America and Europe
Rest of World
9.1
61%
4.2
48%
2.1
32% 39% 52% 68%
2000 2015 2030
Source: Airline Monitor June 2016
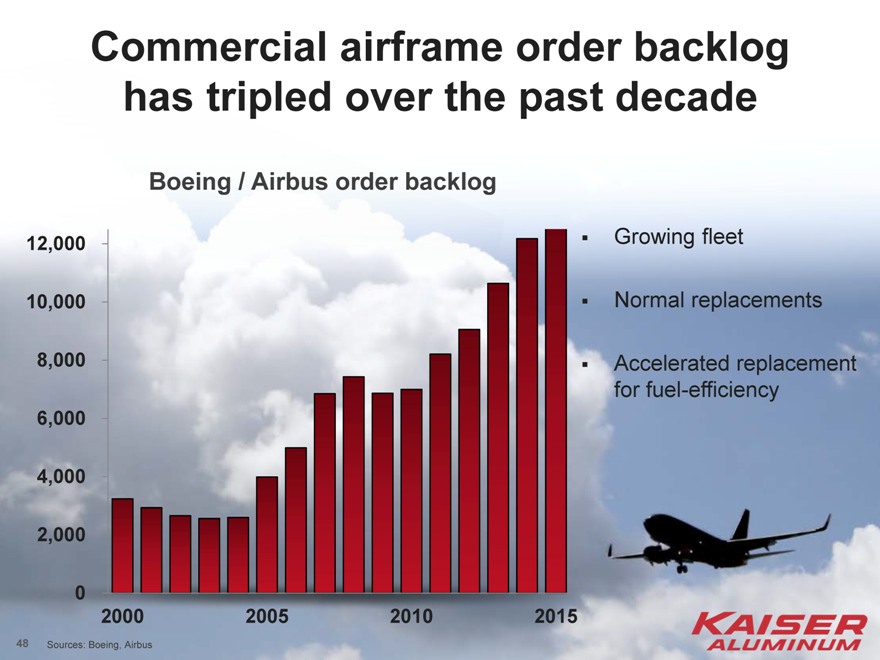
47
Commercial airframe order backlog has tripled over the past decade
Boeing / Airbus order backlog
Growing fleet
Normal replacements
Accelerated replacement for fuel-efficiency
12,000 10,000 8,000 6,000 4,000 2,000
0
2000 2005 2010 2015
Sources: Boeing, Airbus
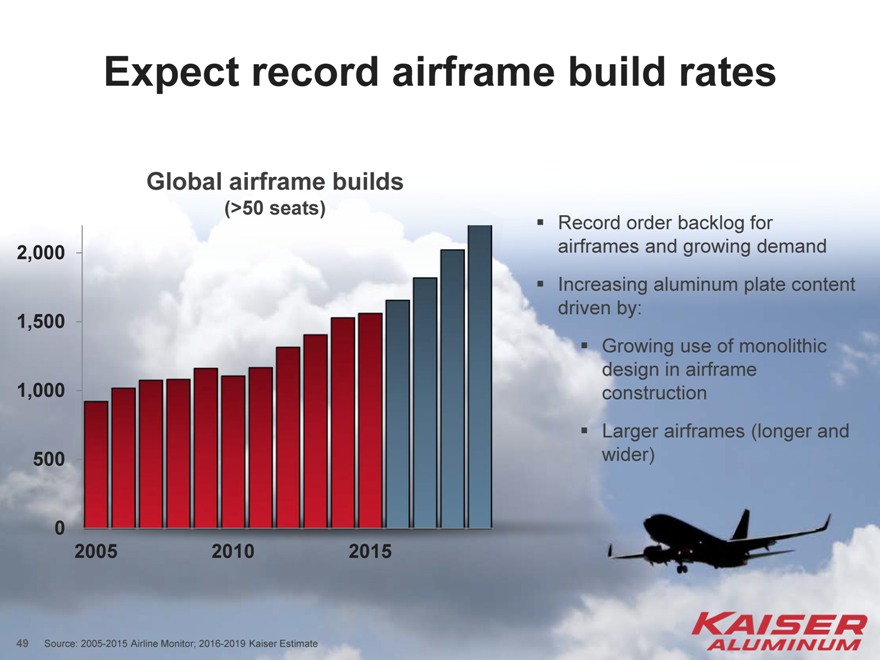
48
Expect record airframe build rates
Global airframe builds
(>50 seats)
Record order backlog for airframes and growing demand Increasing aluminum plate content driven by:
Growing use of monolithic design in airframe construction Larger airframes (longer and wider)
2,000 1,500 1,000 500
0
2005 2010 2015
Source: 2005-2015 Airline Monitor; 2016-2019 Kaiser Estimate
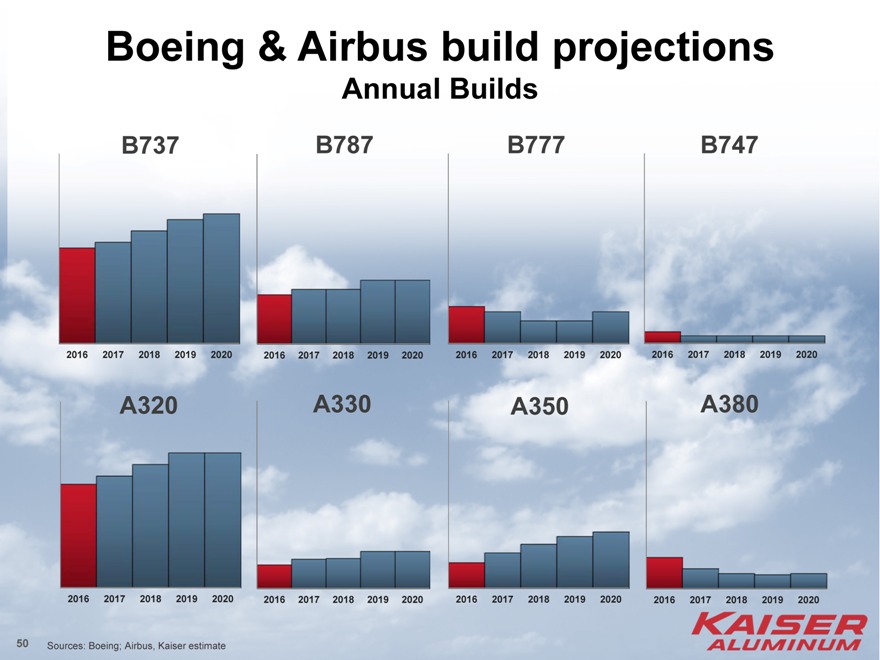
49
Boeing & Airbus build projections Annual Builds
B737 B787 B777 B747
2016 2017 2018 2019 2020 2016 2017 2018 2019 2020 2016 2017 2018 2019 2020 2016 2017 2018 2019 2020
A320 A330 A350 A380
2016 2017 2018 2019 2020 2016 2017 2018 2019 2020 2016 2017 2018 2019 2020 2016 2017 2018 2019 2020
Sources: Boeing; Airbus, Kaiser estimate
50
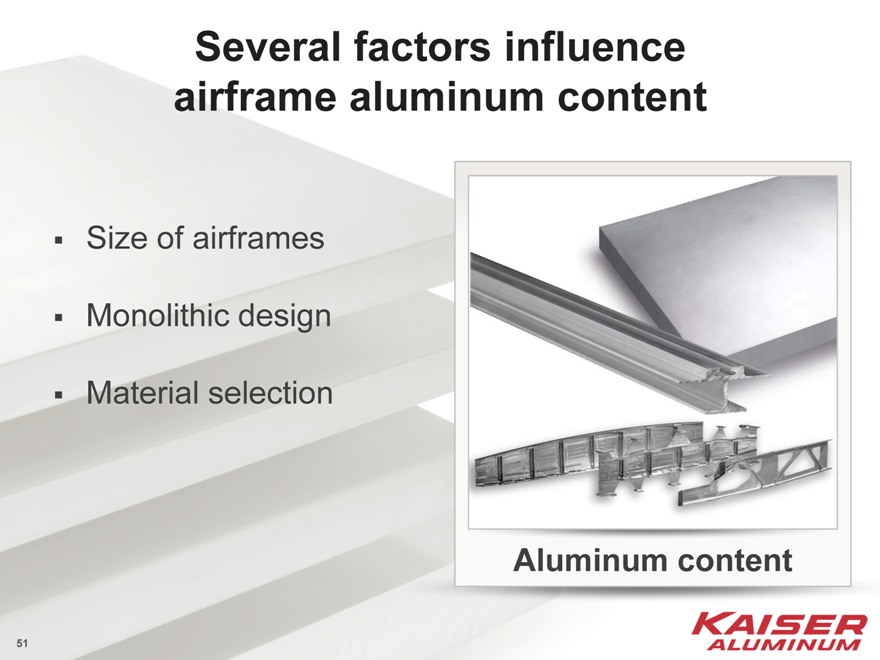
Several factors influence airframe aluminum content
Size of airframes Monolithic design Material selection
Aluminum content
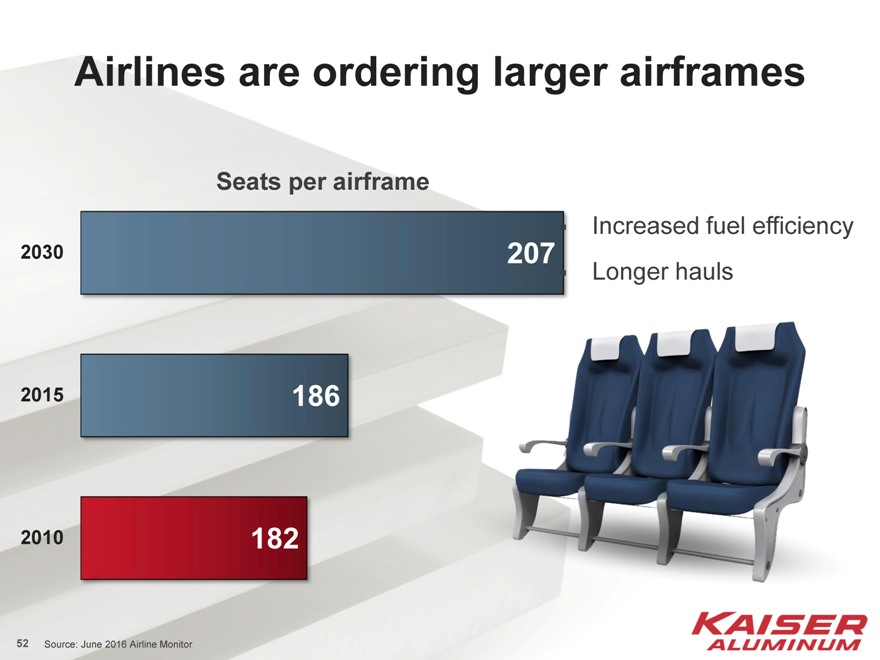
51
Seats per airframe
207 2030
2015 186
2010 182
Source: June 2016 Airline Monitor
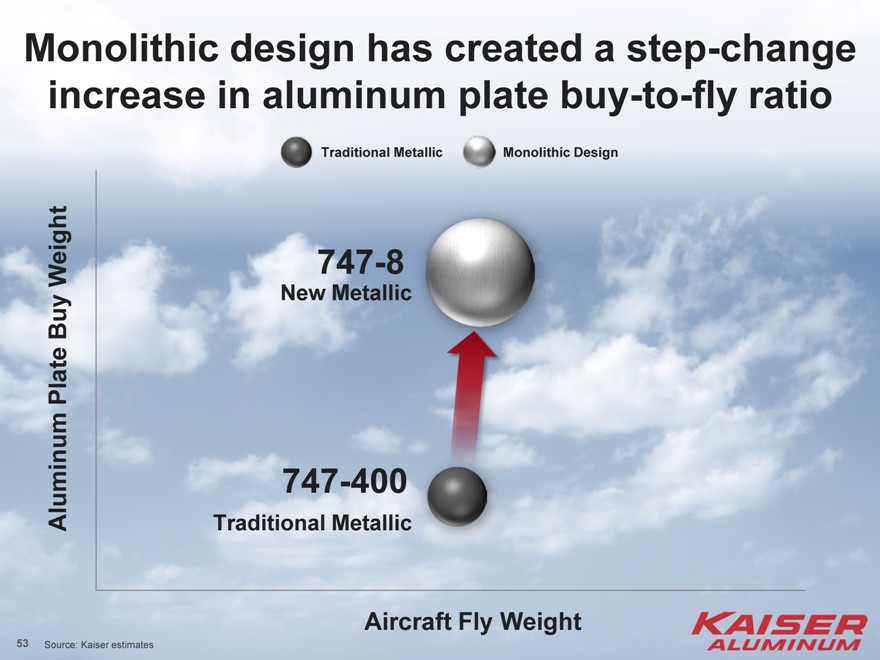
52
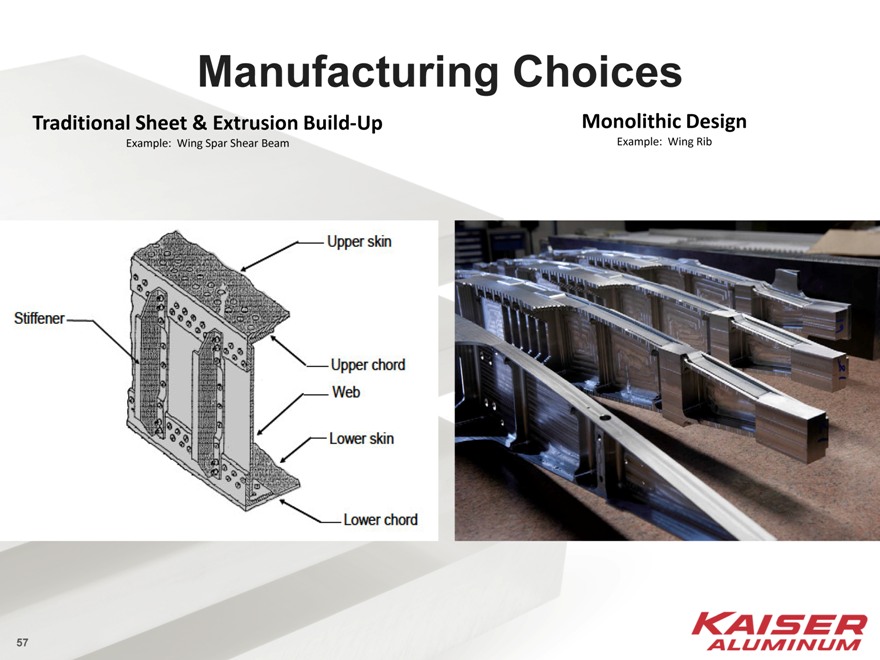
Monolithic design has created a step-change increase in aluminum plate buy-to-fly ratio
Traditional Metallic
Monolithic Design
Aluminum Plate Buy Weight
747-8
New Metallic
747-400
Traditional Metallic
Aircraft Fly Weight
Source: Kaiser estimates
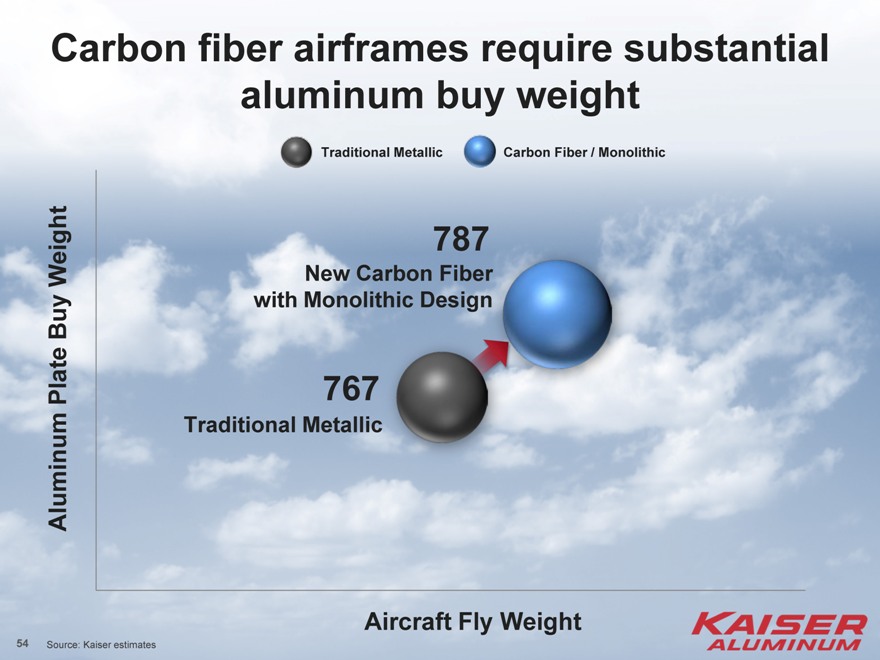
53
Carbon fiber airframes require substantial aluminum buy weight
Traditional Metallic
Carbon Fiber / Monolithic
787
New Carbon Fiber with Monolithic Design
767
Traditional Metallic
Aluminum Plate Buy Weight
Aircraft Fly Weight
Source: Kaiser estimates
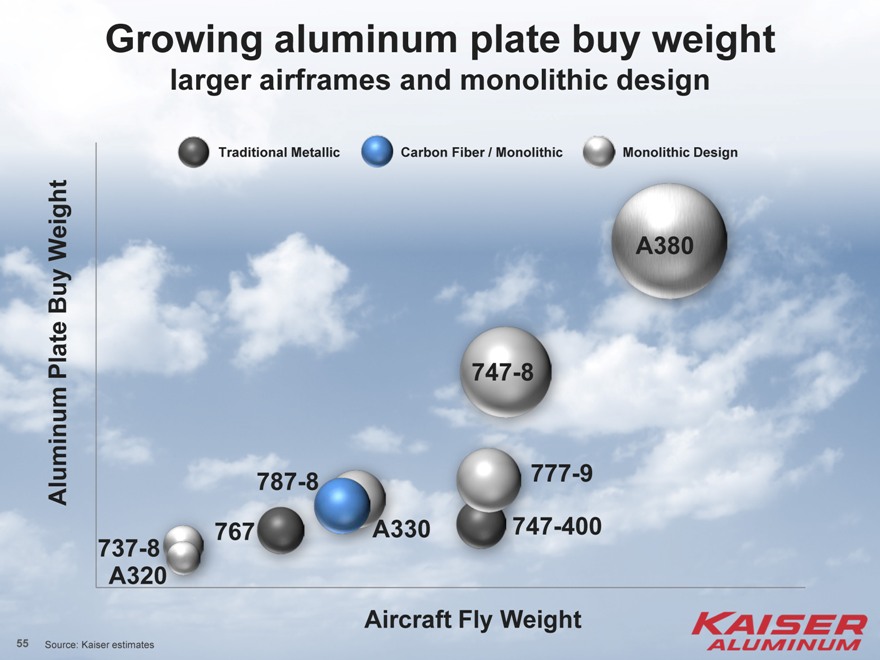
54
Growing aluminum plate buy weight
larger airframes and monolithic design
Traditional Metallic
Carbon Fiber / Monolithic
Monolithic Design
Aluminum Plate Buy Weight
A380
747-8
787-8 777-9 767 A330 747-400 737-8 A320
Aircraft Fly Weight
Source: Kaiser estimates
55
Kaiser aerospace / high strength
Annual value added revenue1 ($mm)
Shipments $462
$451 $449 $449 $430
$377
$324 $297 $295 $278
237 244 243 $256 224 224
$224 192
155 158 159
145 2012-2014: Aerospace 125 142 inventory restocking-destocking cycle, declining HT plate prices
‘05 ‘06 ‘07 ‘08 ‘09 ‘10 ‘11 ‘12 ‘13 ‘14 ‘15 LTM2
Positioned for growth
7% CAGR3 from 2005
Strong market presence, broad product offering Trentwood investments
More than doubled HT plate capacity Expanded capabilities for thick plate Improved quality Enhanced cost efficiency $150 million multi-year investment to enhance quality/efficiency and further expand capacity
1 Value Added Revenue (VAR) = net sales less hedged cost of alloyed metal. Hedged cost of alloyed metal = Midwest transaction price plus the cost of alloying elements plus any realized gains and/or losses on settled hedges, related to metal sold in the referenced period.
2 LTM = Last Twelve Months ended June 30, 2016
3 CAGR = compound annual growth rate
56
Manufacturing Choices
Traditional Sheet & Extrusion Build-Up
Example: Wing Spar Shear Beam
Monolithic Design
Example: Wing Rib
57
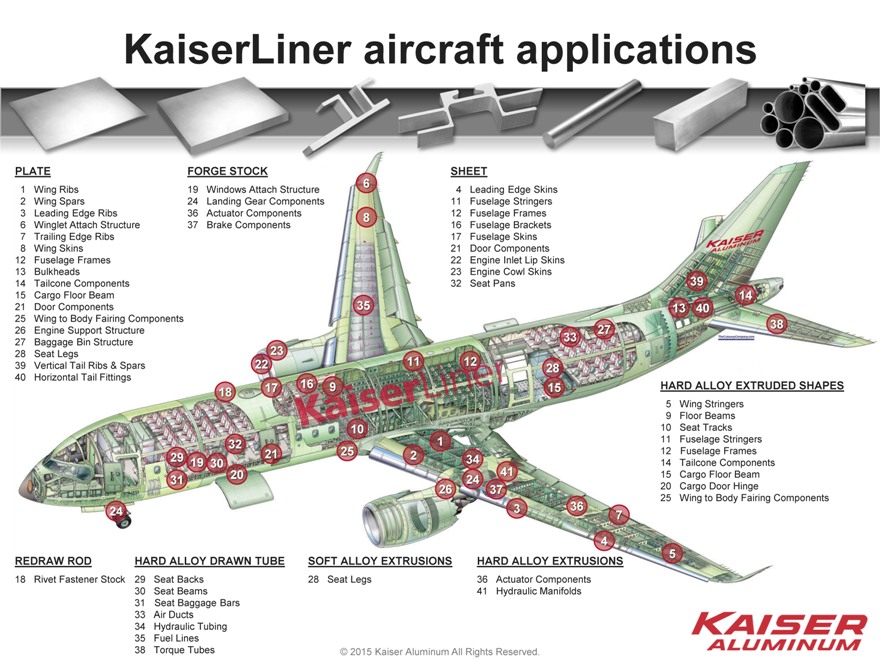
KaiserLiner aircraft applications
PLATE
1 Wing Ribs 2 Wing Spars 3 Leading Edge Ribs 6 Winglet Attach Structure 7 Trailing Edge Ribs 8 Wing Skins
12 Fuselage Frames
13 Bulkheads
14 Tailcone Components
15 Cargo Floor Beam
21 Door Components
25 Wing to Body Fairing Components
26 Engine Support Structure
27 Baggage Bin Structure
28 Seat Legs
39 Vertical Tail Ribs & Spars
40 Horizontal Tail Fittings
FORGE STOCK
19 Windows Attach Structure
24 Landing Gear Components
36 Actuator Components
37 Brake Components
SHEET
4 Leading Edge Skins
11 Fuselage Stringers
12 Fuselage Frames
16 Fuselage Brackets
17 Fuselage Skins
21 Door Components
22 Engine Inlet Lip Skins
23 Engine Cowl Skins
32 Seat Pans
HARD ALLOY EXTRUDED SHAPES
5 Wing Stringers 9 Floor Beams
10 Seat Tracks
11 Fuselage Stringers
12 Fuselage Frames
14 Tailcone Components
15 Cargo Floor Beam
20 Cargo Door Hinge
25 Wing to Body Fairing Components
REDRAW ROD
18 Rivet Fastener Stock
HARD ALLOY DRAWN TUBE
29 Seat Backs
30 Seat Beams
31 Seat Baggage Bars
33 Air Ducts
34 Hydraulic Tubing
35 Fuel Lines
38 Torque Tubes
SOFT ALLOY EXTRUSIONS
28 Seat Legs
HARD ALLOY EXTRUSIONS
36 Actuator Components
41 Hydraulic Manifolds
© 2015 Kaiser Aluminum All Rights Reserved.
Appendix—Automotive
59
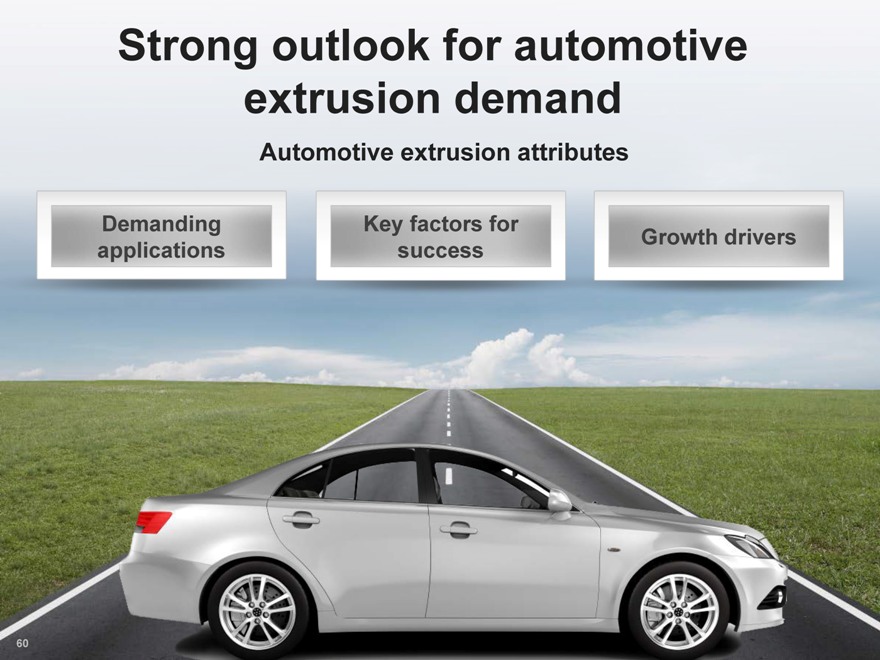
Strong outlook for automotive extrusion demand
Automotive extrusion attributes
Demanding applications
Key factors for success
Growth drivers
60
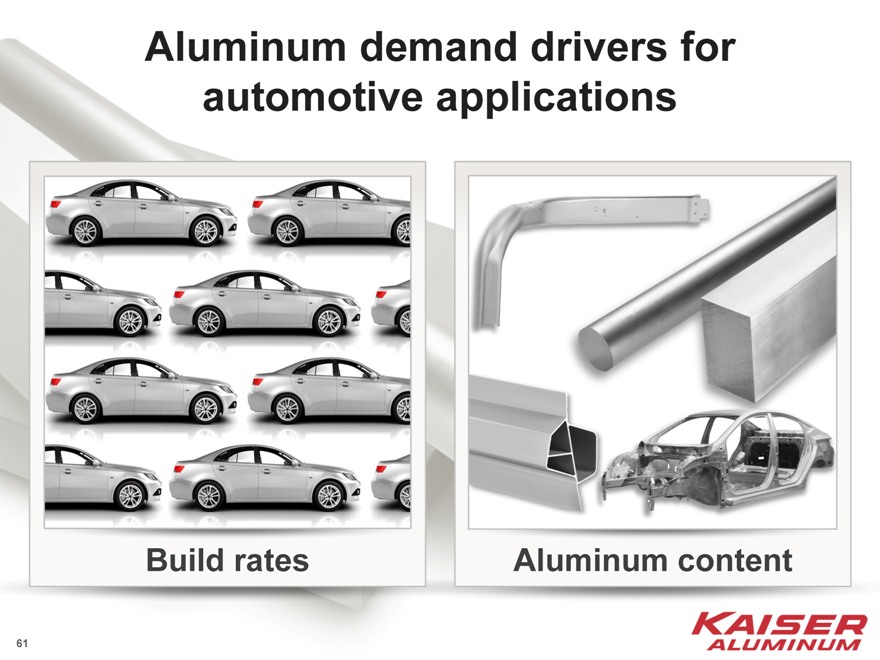
Aluminum demand drivers for automotive applications
Build rates
Aluminum content
61
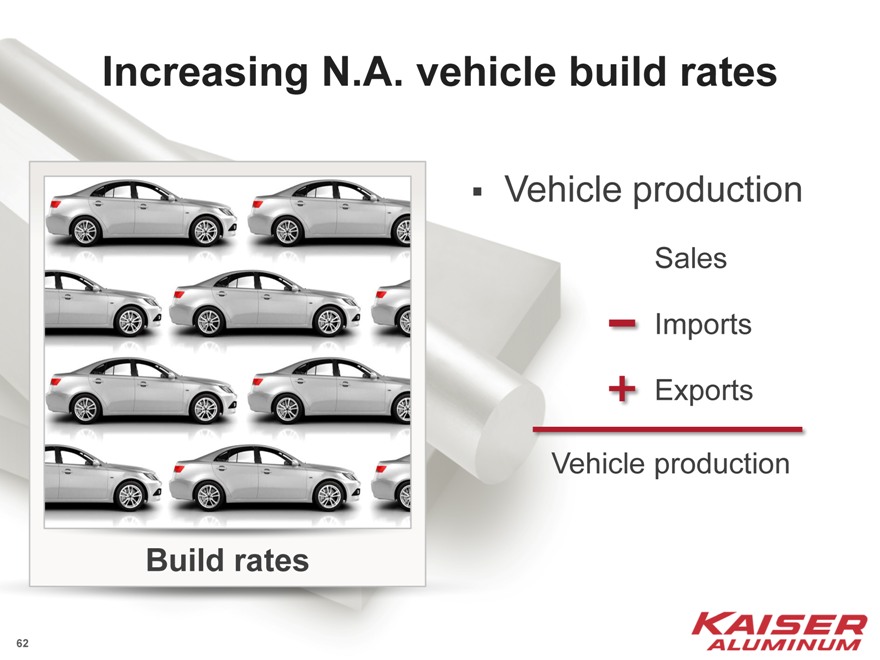
Increasing N.A. vehicle build rates
Vehicle production
Sales Imports Exports
Vehicle production
Build rates
62
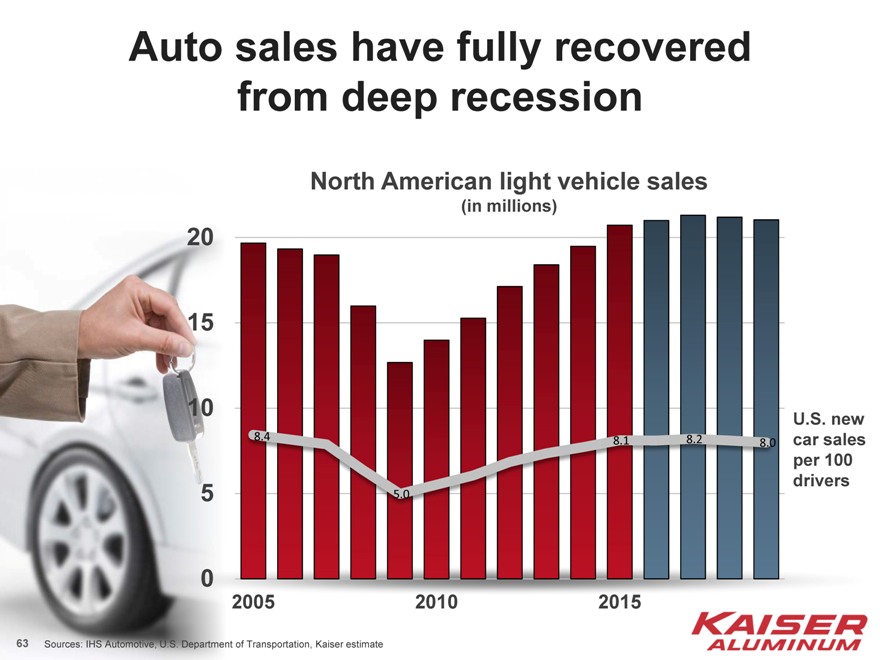
Auto sales have fully recovered from deep recession
North American light vehicle sales
(in millions)
20
15
10
U.S. new
8.4 8.1 8.2 car sales
8.0
per 100
5 5.0 drivers
0
2005 2010 2015
Sources: IHS Automotive, U.S. Department of Transportation, Kaiser estimate
63
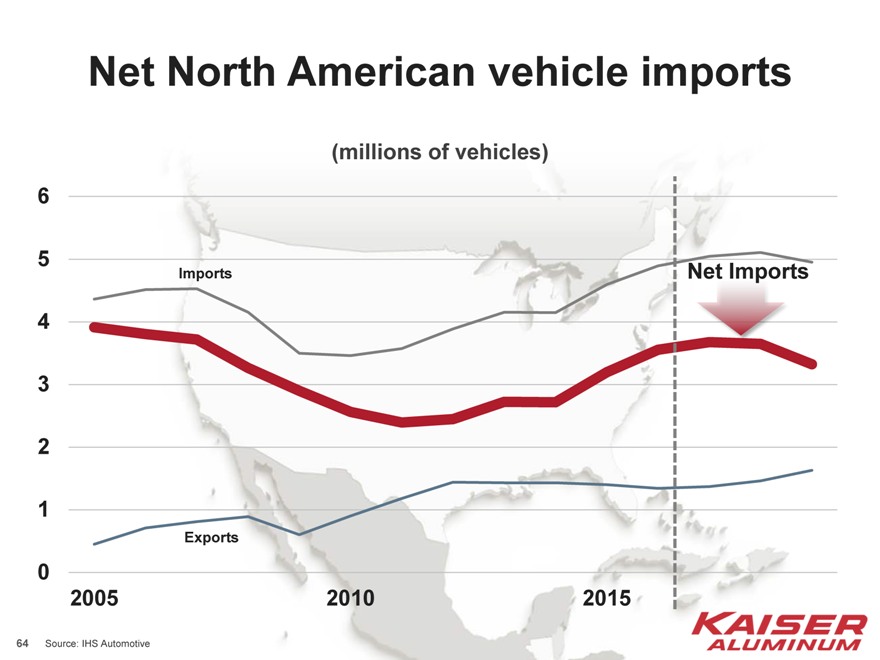
Net North American vehicle imports
(millions of vehicles)
6
5
Imports Net Imports 4
3
2
1
Exports
0
2005 2010 2015
Source: IHS Automotive
64
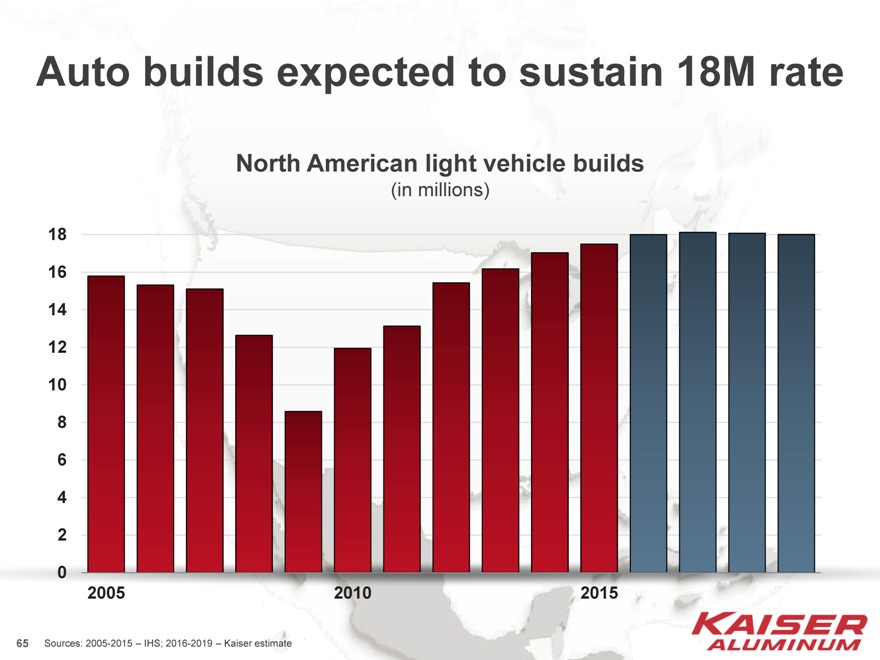
Auto builds expected to sustain 18M rate
North American light vehicle builds
(in millions)
18 16 14 12 10 8 6 4 2 0
2005 2010 2015
Sources: 2005-2015 – IHS; 2016-2019 – Kaiser estimate
65
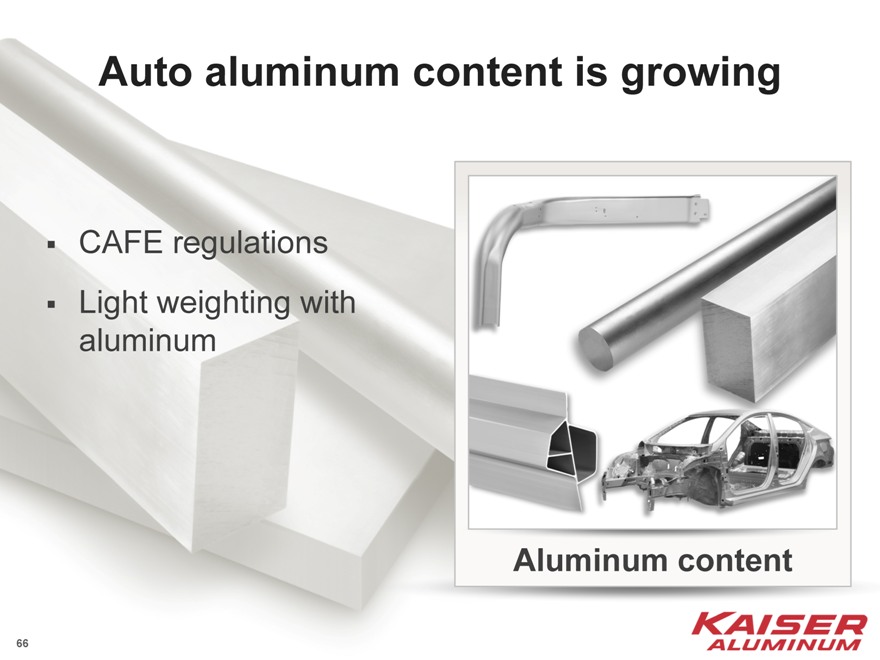
Auto aluminum content is growing
CAFE regulations Light weighting with aluminum
Aluminum content
66
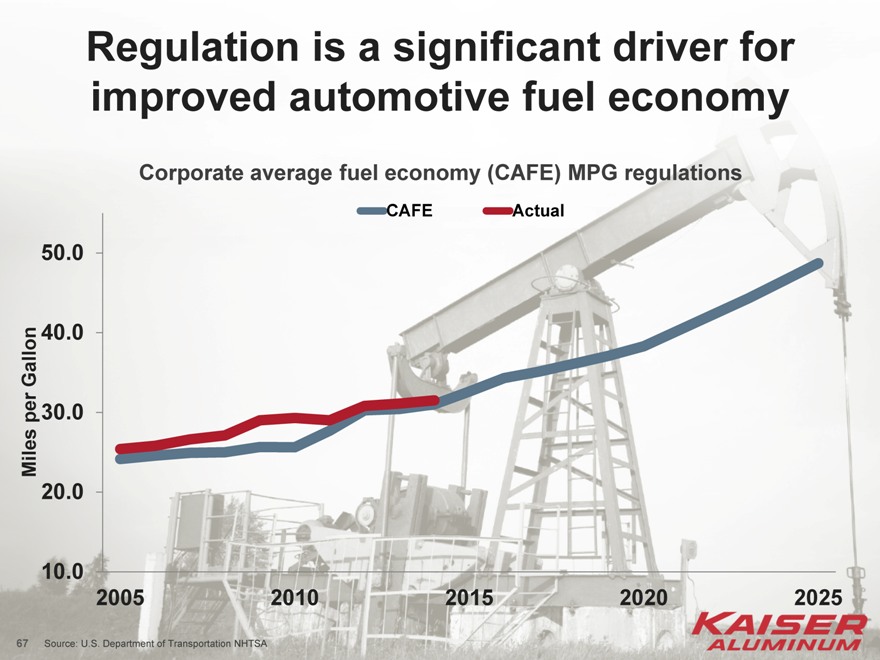
Regulation is a significant driver for improved automotive fuel economy
Corporate average fuel economy (CAFE) MPG regulations
CAFE Actual
50.0
Gallon 40.0
per 30.0
Miles
20.0
10.0
2005 2010 2015 2020 2025
Source: U.S. Department of Transportation NHTSA
67
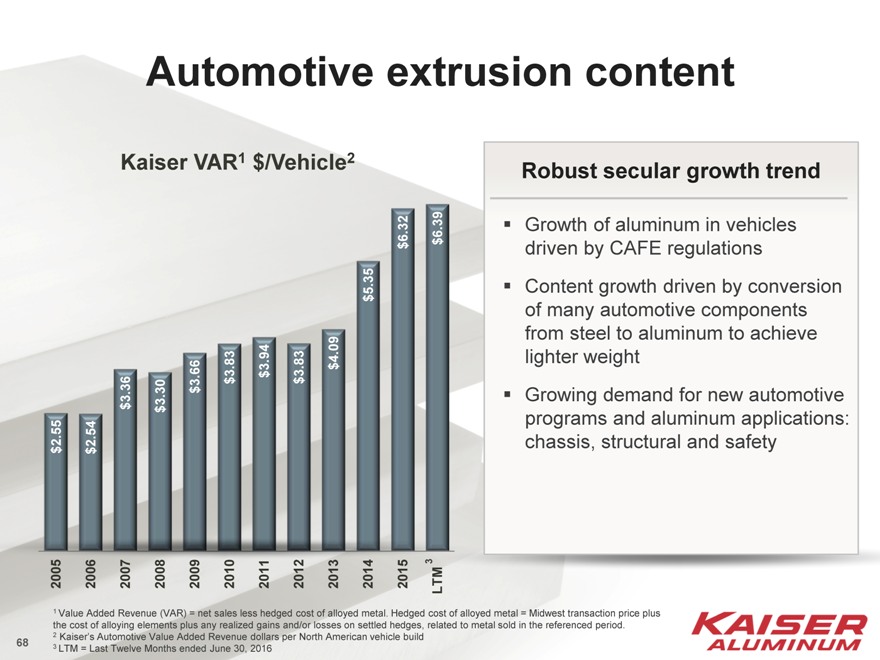
Automotive extrusion content
Kaiser VAR1 $/Vehicle2
2005 $2.55 2006 $2.54 2007 $3.36 2008 $3.30 2009 $3.66 2010 $3.83 2011 $3.94 2012 $3.83 2013 $4.09
2014 $5.35
2015 $6.32
3
LTM $6.39
Robust secular growth trend
Growth of aluminum in vehicles driven by CAFE regulations Content growth driven by conversion of many automotive components from steel to aluminum to achieve lighter weight Growing demand for new automotive programs and aluminum applications: chassis, structural and safety
1 Value Added Revenue (VAR) = net sales less hedged cost of alloyed metal. Hedged cost of alloyed metal = Midwest transaction price plus the cost of alloying elements plus any realized gains and/or losses on settled hedges, related to metal sold in the referenced period.
2 Kaiser’s Automotive Value Added Revenue dollars per North American vehicle build 3 LTM = Last Twelve Months ended June 30, 2016
68
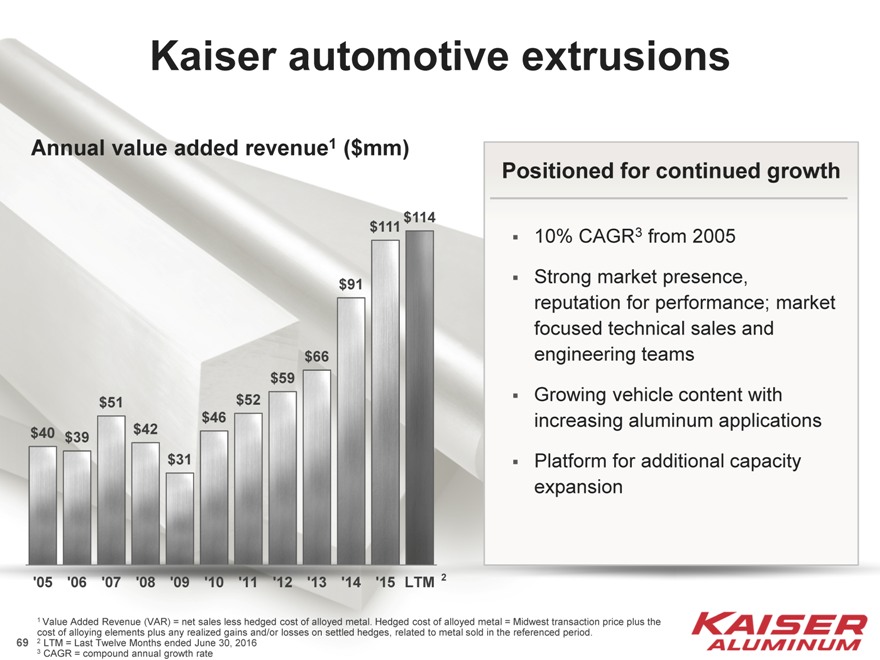
Kaiser automotive extrusions
Annual value added revenue1 ($mm)
$114
$111
$91
$66
$59
$51 $52
$46
$40 $42
$39
$31
‘05 ‘06 ‘07 ‘08 ‘09 ‘10 ‘11 ‘12 ‘13 ‘14 ‘15 LTM 2
Positioned for continued growth
10% CAGR3 from 2005 Strong market presence, reputation for performance; market focused technical sales and engineering teams Growing vehicle content with increasing aluminum applications Platform for additional capacity expansion
1 Value Added Revenue (VAR) = net sales less hedged cost of alloyed metal. Hedged cost of alloyed metal = Midwest transaction price plus the cost of alloying elements plus any realized gains and/or losses on settled hedges, related to metal sold in the referenced period.
2 LTM = Last Twelve Months ended June 30, 2016
3 CAGR = compound annual growth rate
69
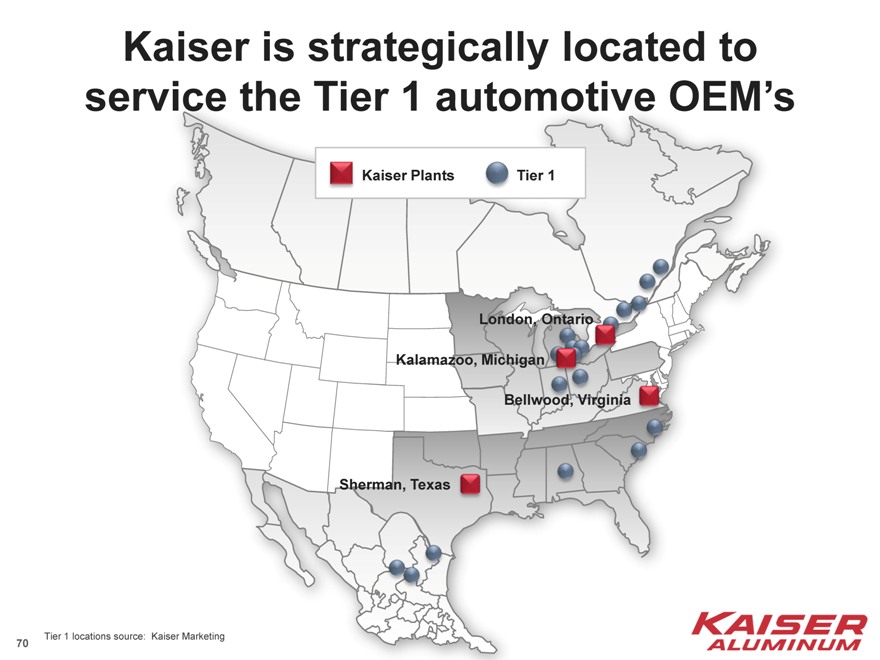
Kaiser is strategically located to service the Tier 1 automotive OEM’s
Kaiser Plants Tier 1
London, Ontario Kalamazoo, Michigan Bellwood, Virginia
Sherman, Texas
Tier 1 locations source: Kaiser Marketing
70
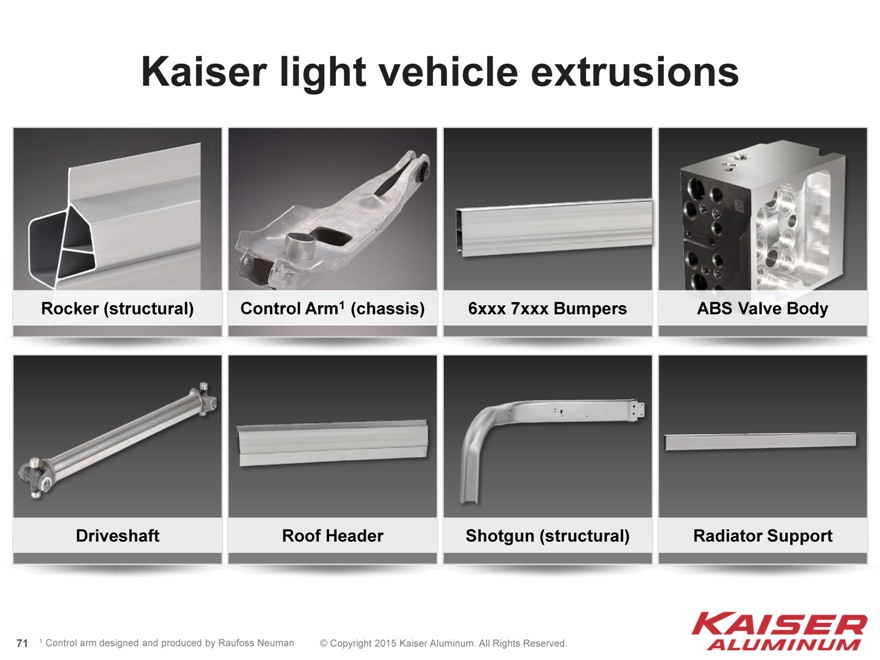
Kaiser light vehicle extrusions
Rocker (structural)
Control Arm1 (chassis)
ABS Valve Body
6xxx 7xxx Bumpers
Driveshaft
Roof Header Shotgun (structural)
Radiator Support
1 Control arm designed and produced by Raufoss Neuman © Copyright 2015 Kaiser Aluminum. All Rights Reserved.
71
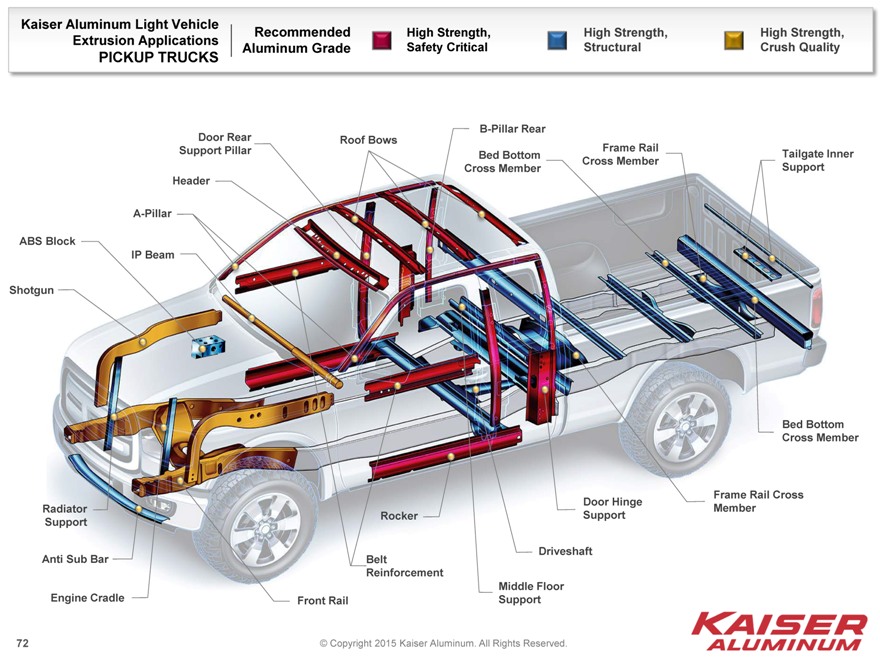
Kaiser Aluminum Light Vehicle
Extrusion Applications
PICKUP TRUCKS
Recommended
Aluminum Grade
High Strength, Safety Critical
High Strength, Structural
High Strength, Crush Quality
B-Pillar Rear
Door Rear Roof Bows Frame Rail
Support Pillar Bed Bottom Cross Member Tailgate Inner Cross Member Support Header
A-Pillar
ABS Block
IP Beam
Shotgun
Bed Bottom Cross Member
Frame Rail Cross Door Hinge Radiator Member Rocker Support Support
Driveshaft Anti Sub Bar Belt Reinforcement Engine Cradle Middle Floor Front Rail Support
© Copyright 2015 Kaiser Aluminum. All Rights Reserved.
72
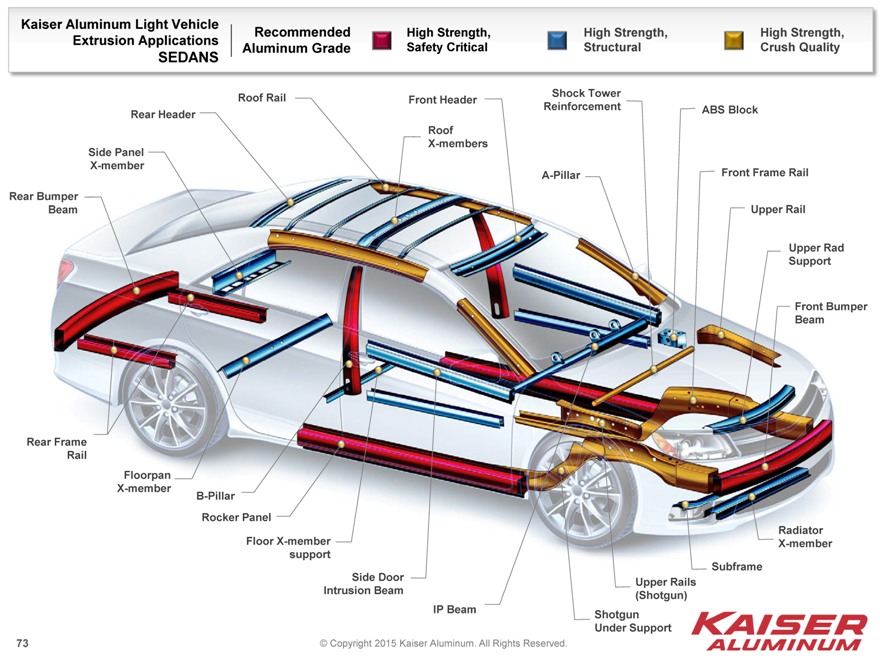
Kaiser Aluminum Light Vehicle
Recommended High Strength, High Strength, High Strength,
Extrusion Applications
Aluminum Grade Safety Critical Structural Crush Quality
SEDANS
Roof Rail Shock Tower Front Header
Reinforcement ABS Block Rear Header Roof X-members Side Panel X-member
A-Pillar Front Frame Rail Rear Bumper Beam Upper Rail
Upper Rad Support
Front Bumper Beam
Rear Frame Rail
Floorpan X-member
B-Pillar Rocker Panel
Floor X-member Radiator support X-member Side Door Subframe Upper Rails Intrusion Beam (Shotgun) IP Beam Shotgun Under Support
© Copyright 2015 Kaiser Aluminum. All Rights Reserved.
73
Appendix – General Engineering
74
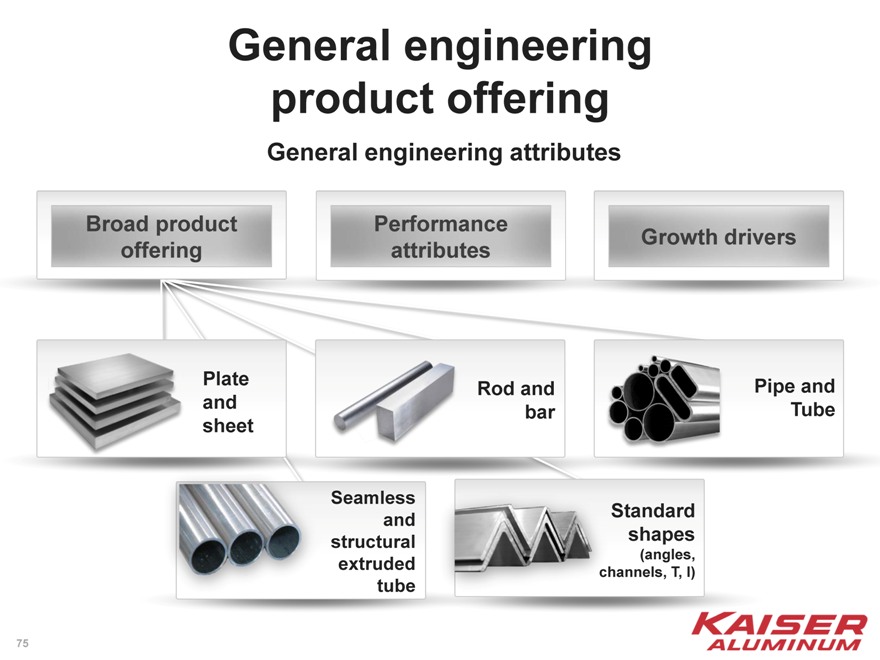
General engineering product offering
General engineering attributes
Broad product Performance
Growth drivers
offering attributes
Plate Rod and Pipe and
and bar Tube
sheet
Seamless
and Standard
structural shapes
extruded (angles,
channels, T, I)
tube
75
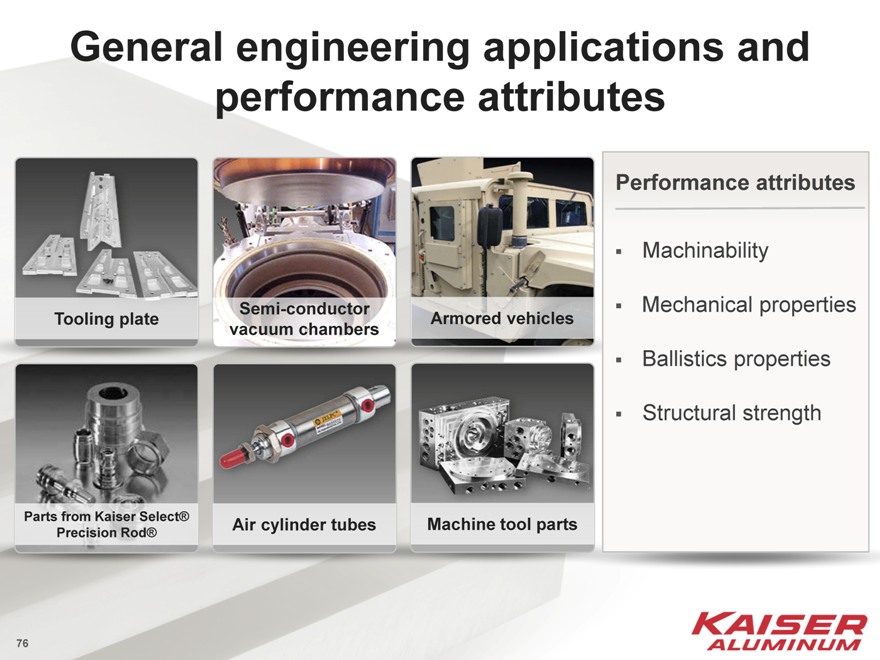
General engineering applications and performance attributes
Performance attributes
Machinability
Mechanical properties Ballistics properties Structural strength
Semi-conductor
Tooling plate Armored vehicles
vacuum chambers
Parts from Kaiser Select® Air cylinder tubes Machine tool parts
Precision Rod®
76
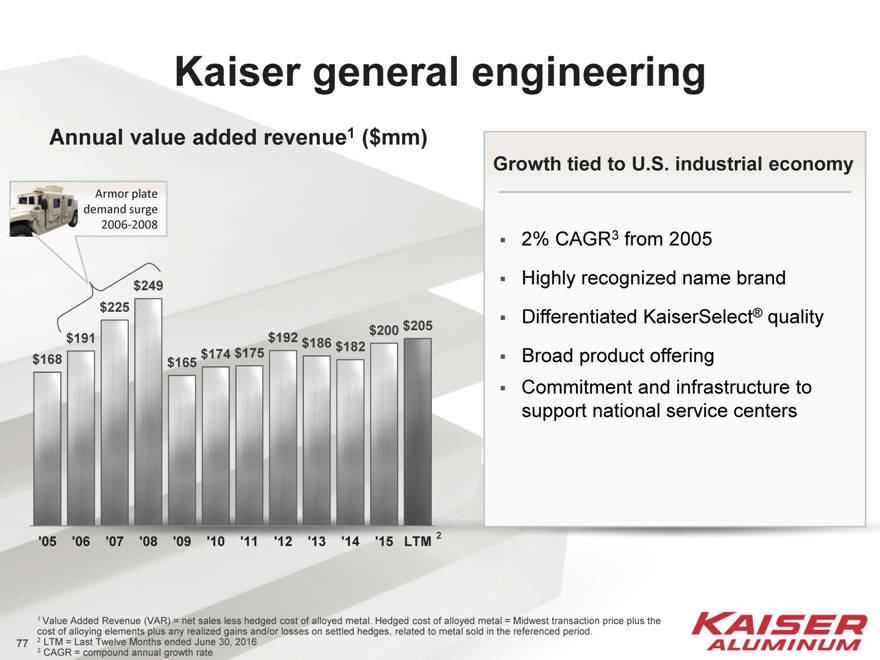
Kaiser general engineering
Annual value added revenue1 ($mm)
Growth tied to U.S. industrial economy
2% CAGR3 from 2005 Highly recognized name brand Differentiated KaiserSelect® quality Broad product offering Commitment and infrastructure to support national service centers
Armor plate
demand surge
2006-2008
$249
$225
$200 $205
$191 $192 $186
$175 $182
$168 $174
$165
‘05 ‘06 ‘07 ‘08 ‘09 ‘10 ‘11 ‘12 ‘13 ‘14 ‘15 LTM 2
1 Value Added Revenue (VAR) = net sales less hedged cost of alloyed metal. Hedged cost of alloyed metal = Midwest transaction price plus the cost of alloying elements plus any realized gains and/or losses on settled hedges, related to metal sold in the referenced period.
2 LTM = Last Twelve Months ended June 30, 2016
3 CAGR = compound annual growth rate
77
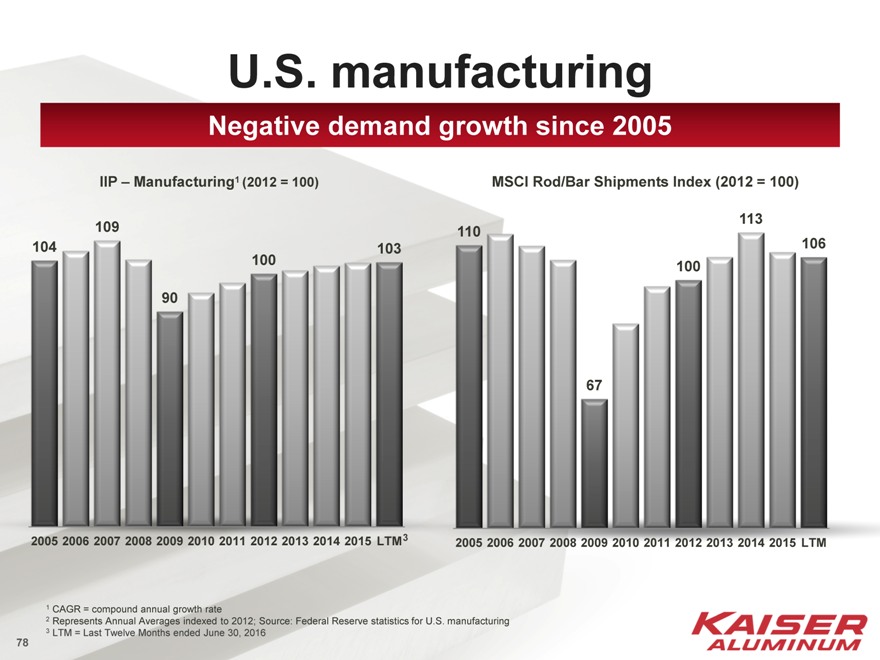
U.S. manufacturing
Negative demand growth since 2005
IIP – Manufacturing1 (2012 = 100) MSCI Rod/Bar Shipments Index (2012 = 100)
113
109 110
104 103 106
100 100
90
67
2005 2006 2007 2008 2009 2010 2011 2012 2013 2014 2015 LTM3 2005 2006 2007 2008 2009 2010 2011 2012 2013 2014 2015 LTM
1 CAGR = compound annual growth rate
2 Represents Annual Averages indexed to 2012; Source: Federal Reserve statistics for U.S. manufacturing
3 LTM = Last Twelve Months ended June 30, 2016
78
Appendix – Financial Reconciliation
79
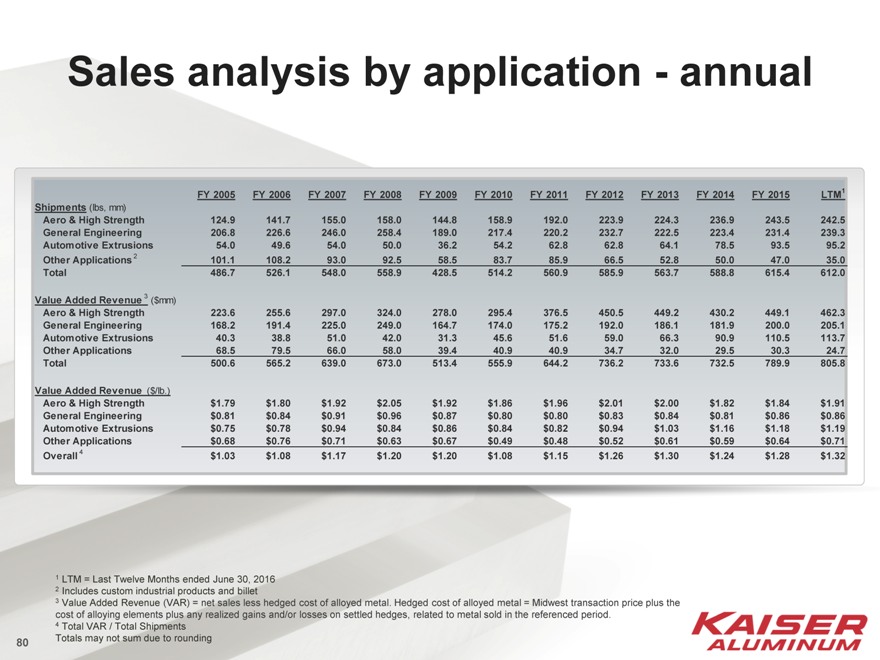
Sales analysis by application—annual
FY 2005 FY 2006FY 2007FY 2008FY 2009FY 2010FY 2011FY 2012FY 2013FY 2014FY 2015LTM1
Shipments (lbs, mm)
Aero & High Strength 124.9 141.7155.0158.0144.8158.9192.0223.9224.3236.9243.5242.5
General Engineering 206.8 226.6246.0258.4189.0217.4220.2232.7222.5223.4231.4239.3
Automotive Extrusions 54.049.654.050.036.254.262.862.864.178.593.595.2
Other Applications 2 101.1 108.293.092.558.583.785.966.552.850.047.035.0
Total 486.7 526.1548.0558.9428.5514.2560.9585.9563.7588.8615.4612.0
Value Added Revenue 3 ($mm)
Aero & High Strength 223.6 255.6297.0324.0278.0295.4376.5450.5449.2430.2449.1462.3
General Engineering 168.2 191.4225.0249.0164.7174.0175.2192.0186.1181.9200.0205.1
Automotive Extrusions 40.338.851.042.031.345.651.659.066.390.9110.5113.7
Other Applications 68.579.566.058.039.440.940.934.732.029.530.324.7
Total 500.6 565.2639.0673.0513.4555.9644.2736.2733.6732.5789.9805.8
Value Added Revenue ($/lb.)
Aero & High Strength $1.79$1.80$1.92$2.05$1.92$1.86$1.96$2.01$2.00$1.82$1.84$1.91
General Engineering $0.81$0.84$0.91$0.96$0.87$0.80$0.80$0.83$0.84$0.81$0.86$0.86
Automotive Extrusions $0.75$0.78$0.94$0.84$0.86$0.84$0.82$0.94$1.03$1.16$1.18$1.19
Other Applications $0.68$0.76$0.71$0.63$0.67$0.49$0.48$0.52$0.61$0.59$0.64$0.71
Overall 4 $1.03$1.08$1.17$1.20$1.20$1.08$1.15$1.26$1.30$1.24$1.28$1.32
1 LTM = Last Twelve Months ended June 30, 2016
2 Includes custom industrial products and billet
3 Value Added Revenue (VAR) = net sales less hedged cost of alloyed metal. Hedged cost of alloyed metal = Midwest transaction price plus the cost of alloying elements plus any realized gains and/or losses on settled hedges, related to metal sold in the referenced period.
4 Total VAR / Total Shipments Totals may not sum due to rounding
80
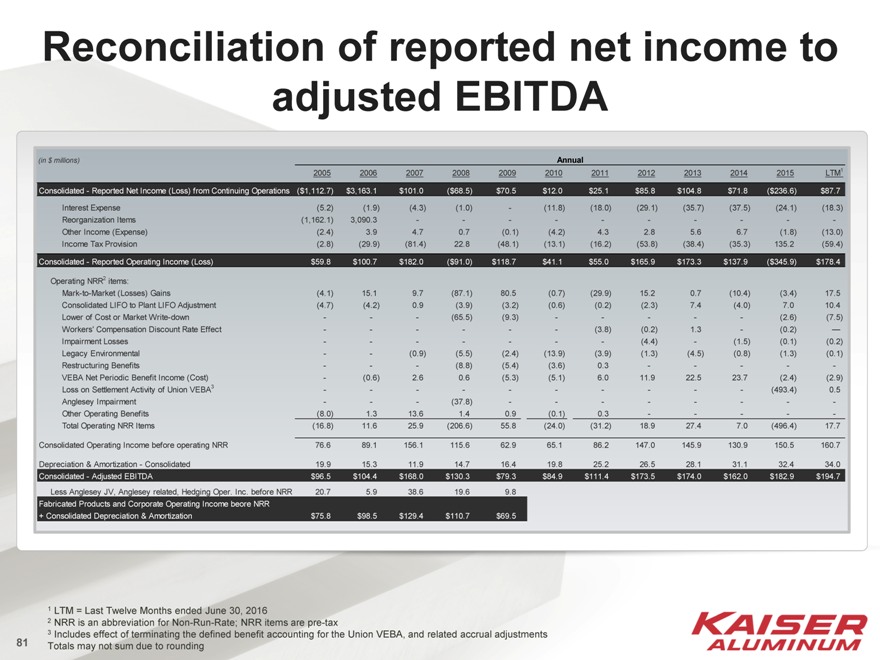
Reconciliation of reported net income to adjusted EBITDA
(in $ millions) Annual
2005 2006200720082009201020112012201320142015LTM1
Consolidated—Reported Net Income (Loss) from Continuing Operations ($1,112.7) $3,163.1 $101.0($68.5)$70.5$12.0$25.1$85.8$104.8$71.8($236.6)$87.7
Interest Expense (5.2) (1.9)(4.3)(1.0)-(11.8)(18.0)(29.1)(35.7)(37.5)(24.1)(18.3)
Reorganization Items (1,162.1) 3,090.3----------
Other Income (Expense) (2.4) 3.94.70.7(0.1)(4.2)4.32.85.66.7(1.8)(13.0)
Income Tax Provision (2.8) (29.9)(81.4)22.8(48.1)(13.1)(16.2)(53.8)(38.4)(35.3)135.2(59.4)
Consolidated—Reported Operating Income (Loss) $59.8 $100.7$182.0($91.0)$118.7$41.1$55.0$165.9$173.3$137.9($345.9)$178.4
Operating NRR2 items:
Mark-to-Market (Losses) Gains (4.1) 15.19.7(87.1)80.5(0.7)(29.9)15.20.7(10.4)(3.4)17.5
Consolidated LIFO to Plant LIFO Adjustment (4.7) (4.2)0.9(3.9)(3.2)(0.6)(0.2)(2.3)7.4(4.0)7.010.4
Lower of Cost or Market Write-down - --(65.5)(9.3)-----(2.6)(7.5)
Workers’ Compensation Discount Rate Effect - -----(3.8)(0.2)1.3-(0.2)—
Impairment Losses - ------(4.4)-(1.5)(0.1)(0.2)
Legacy Environmental - -(0.9)(5.5)(2.4)(13.9)(3.9)(1.3)(4.5)(0.8)(1.3)(0.1)
Restructuring Benefits - --(8.8)(5.4)(3.6)0.3-----
VEBA Net Periodic Benefit Income (Cost) - (0.6)2.60.6(5.3)(5.1)6.011.922.523.7(2.4)(2.9)
Loss on Settlement Activity of Union VEBA3 - ---------(493.4)0.5
Anglesey Impairment - --(37.8)--------
Other Operating Benefits (8.0) 1.313.61.40.9(0.1)0.3-----
Total Operating NRR Items (16.8) 11.625.9(206.6)55.8(24.0)(31.2)18.927.47.0(496.4)17.7
Consolidated Operating Income before operating NRR 76.6 89.1156.1115.662.965.186.2147.0145.9130.9150.5160.7
Depreciation & Amortization—Consolidated 19.9 15.311.914.716.419.825.226.528.131.132.434.0
Consolidated—Adjusted EBITDA $96.5 $104.4$168.0$130.3$79.3$84.9$111.4$173.5$174.0$162.0$182.9$194.7
Less Anglesey JV, Anglesey related, Hedging Oper. Inc. before NRR 20.7 5.938.619.69.8
Fabricated Products and Corporate Operating Income beore NRR
+ Consolidated Depreciation & Amortization $75.8 $98.5$129.4$110.7$69.5
1 LTM = Last Twelve Months ended June 30, 2016
2 NRR is an abbreviation for Non-Run-Rate; NRR items are pre-tax
3 Includes effect of terminating the defined benefit accounting for the Union VEBA, and related accrual adjustments Totals may not sum due to rounding
81
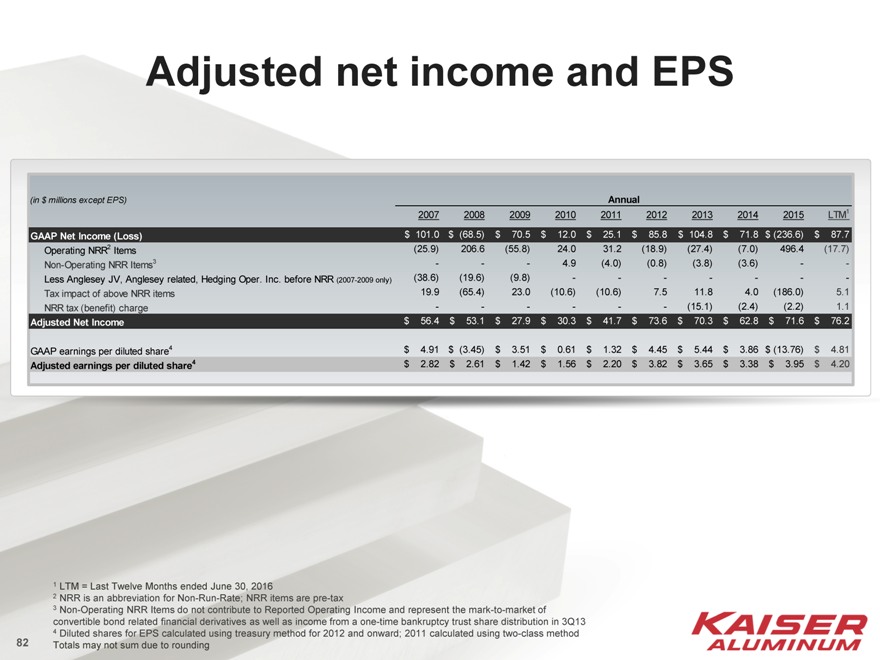
Adjusted net income and EPS
(in $ millions except EPS) Annual
2007 2008 2009 2010 2011 2012 2013 2014 2015 LTM1
GAAP Net Income (Loss) $ 101.0 $ (68.5) $ 70.5 $ 12.0 $ 25.1 $ 85.8 $ 104.8 $ 71.8 $ (236.6) $ 87.7
Operating NRR2 Items (25.9) 206.6 (55.8) 24.0 31.2 (18.9) (27.4) (7.0) 496.4 (17.7)
Non-Operating NRR Items3 — — — 4.9 (4.0) (0.8) (3.8) (3.6) — -
Less Anglesey JV, Anglesey related, Hedging Oper. Inc. before NRR (2007-2009 only) (38.6) (19.6) (9.8) — — — — — — -
Tax impact of above NRR items 19.9 (65.4) 23.0 (10.6) (10.6) 7.5 11.8 4.0 (186.0) 5.1
NRR tax (benefit) charge — — — — — — (15.1) (2.4) (2.2) 1.1
Adjusted Net Income $ 56.4 $ 53.1 $ 27.9 $ 30.3 $ 41.7 $ 73.6 $ 70.3 $ 62.8 $ 71.6 $ 76.2
GAAP earnings per diluted share4 $ 4.91 $ (3.45) $ 3.51 $ 0.61 $ 1.32 $ 4.45 $ 5.44 $ 3.86 $ (13.76) $ 4.81
Adjusted earnings per diluted share4 $ 2.82 $ 2.61 $ 1.42 $ 1.56 $ 2.20 $ 3.82 $ 3.65 $ 3.38 $ 3.95 $ 4.20
1 LTM = Last Twelve Months ended June 30, 2016
2 NRR is an abbreviation for Non-Run-Rate; NRR items are pre-tax
3 Non-Operating NRR Items do not contribute to Reported Operating Income and represent the mark-to-market of convertible bond related financial derivatives as well as income from a one-time bankruptcy trust share distribution in 3Q13
4 Diluted shares for EPS calculated using treasury method for 2012 and onward; 2011 calculated using two-class method Totals may not sum due to rounding
82