OMB APPROVAL
OMB Number: 3235-0570
Expires: October 31, 2006
Estimated average burden hours per response: 19.3
UNITED STATES SECURITIES AND EXCHANGE COMMISSION
FORM N-CSR
CERTIFIED SHAREHOLDER REPORT OF REGISTERED MANAGEMENT INVESTMENT COMPANIES
Investment Company Act file number: 811-05062
ING GET Fund
7337 E. Doubletree Ranch Rd., Scottsdale, AZ 85258
(Address of principal executive offices) (Zip code)
CT Corporation System, 101 Federal Street, Boston, MA 02110
(Name and address of agent for service)
Registrant’s telephone number, including area code: 1-800-992-0180
Date of fiscal year end: December 31
Date of reporting period: December 31, 2004
Item 1. Reports to Stockholders.
The following is a copy of the report transmitted to stockholders pursuant to Rule 30e-1 under the Act (17 CFR 270.30e-1):

| Funds |
| Annual Report | |
| December 31, 2004 |
| ING GET Fund |
| • Series H • Series I • Series J • Series K • Series L • Series M • Series N • Series P • Series Q • Series R • Series S • Series T • Series U • Series V |
| This report is submitted for general information to shareholders of the ING Funds. It is not authorized for distribution to prospective shareholders unless accompanied or preceded by a prospectus which includes details regarding the funds’ investment objectives, risks, charges, expenses and other information. This information should be read carefully. |

| 1 | ||
| 2 | ||
| 4 | ||
| 20 | ||
| 24 | ||
| 26 | ||
| 27 | ||
| 30 | ||
| 33 | ||
| 40 | ||
| 54 | ||
| 66 | ||
| 136 | ||
| 137 |
PROXY VOTING INFORMATION
A description of the policies and procedures that the Registrant uses to determine how to vote proxies related to portfolio securities is available (1) without charge, upon request, by calling Shareholder Services toll-free at 800-992-0180; (2) on the Registrant’s website at www.ingfunds.com and (3) on the SEC’s website at www.sec.gov.
Information regarding how the Registrant voted proxies related to portfolio securities during the most recent 12-month period ended June 30 is available without charge on the Registrant’s website at www.ingfunds.com and on the SEC website at www.sec.gov.
QUARTERLY PORTFOLIO HOLDINGS
The Registrant files its complete schedule of portfolio holdings with the Commission for the first and third quarters of each fiscal year on Form N-Q. The Registrant’s Forms N-Q are available on the SEC’s website at www.sec.gov. The Registrant’s Forms N-Q may be reviewed and copied at the Commission’s Public Reference Room in Washington, DC, and information on the operation of the Public Reference Room may be obtained by calling 1-800-SEC-0330; and is available upon request from the Registrant by calling Shareholder Services toll-free at 800-992-0180.
(THIS PAGE INTENTIONALLY LEFT BLANK)

JAMES M. HENNESSY
Dear Shareholder:
The past year has brought about numerous changes in the mutual funds industry, including requests for additional disclosures. I would like to draw your attention to some additional information you will now see in the reports due, in part, to these new requirements:
| • | You will see a new section entitled “Shareholder Expense Examples.” These examples are intended to illustrate for you the ongoing costs of investing in a mutual fund and to provide a method to compare those costs with the ongoing costs of investing in other mutual funds. |
| • | In addition to the normal performance tables included in the Portfolio Managers’ Reports, there are now additional graphical or tabular presentations, which illustrate the current holdings of the funds as of the period-end. |
| • | Each fund now also files its complete schedule of portfolio holdings with the Securities Exchange Commission (“SEC”) for the first and third quarters of each fiscal year on Form N-Q. These Forms are available for shareholders to view on the SEC’s website at www.sec.gov. |
We welcome these changes and believe that they will provide valuable information to our shareholders. We hope you will find these additional disclosures beneficial and easy to understand.
On behalf of ING Funds, I thank you for your continued support and confidence and look forward to serving you in 2005 and beyond.
Sincerely,

1
In our semi-annual report, we referred to sharp swings in sentiment as investors took stock after the handsome gains of 2003. By the middle of the year, the markets had not done much of anything; however, over the next six months sentiment would change twice more and in the end major asset classes posted respectable returns for the year, if not better.
Global equities gained 10.8% in the six months ended December 31, 2004, according to the Morgan Stanley Capital International (“MSCI”) World Index(1), including net reinvested dividends, and 14.7% for entire year. Nearly one quarter of the annual gain was due to dollar weakness, the main story in the currency markets. The dollar was ahead for most of the year, but by mid October had succumbed to continuing concern over the United States twin budget and trade deficits and whether overseas investors would continue to finance them, raising the nightmare of a disorderly slide in the dollar. In 2004, the euro gained 7.6%, a new record. The yen rose 4.5% to a level not seen since early 2000, while the pound stood 7.4% higher, at a remarkable 12-year peak.
Perhaps the most notable feature in investment grade U.S. fixed income markets in the second six months was the curious “curve flattening” trend. Short-term interest rates drifted up as the Federal Open Market Committee (“FOMC”) raised the Federal Funds rate four times, by 1% in all, while bond yields ignored this and fell in the face of weak economic data and continued foreign central bank purchases. Contrary to earlier fears, tame inflation was a backdrop throughout, while the influential employment reports were weak in July, August, October and December. On December 15, the spread between the yields on the 10-year Note and the 90-day Treasury Bill fell to a three-year low. For the six months, the yield on 10-year Treasury Notes fell by 40 basis points to 4.22%, but the yield on 13-week Treasury Bills soared 88 basis points to 2.18%. More broadly, the Lehman Brothers Aggregate Bond Index(2) gained 4.18% for the six months. For the whole year, the Index returned 4.34%, underscoring the dominance of the second half in driving market movement, and implying not much underlying price change over the year.
Prices rose on riskier asset classes, however, as investors chased more attractive returns than investment grade bonds were offering. The Lehman Brothers U.S. Corporate High Yield Bond Index(3) for example, returned a robust 9.64% in the six months through December and 11.13% for the year.
U.S. equities in the form of the Standard & Poor’s (“S&P”) 500 Index(4), rose 7.2% including dividends, for the six months ended December 31, 2004, breaching and holding levels not seen since before September 11, 2001. By year end, the market was trading at a price to earnings level of just under 16 1/2 times 2005 estimated earnings. For the entire year, the Index returned 10.88%. From the middle of the year, equity investors were disappointed by the weak employment reports referred to above and distracted by surging oil prices as well as bad news affecting individual stocks. The market reached its lowest point in mid-August. But after oil prices climbed over $56 per barrel on October 22, and then slumped, equities squeezed out a narrow gain for the month in the last few days. In November, oil prices continued their retreat and the market powered ahead, cheered by this, the clear presidential election result, perceived as business and shareholder friendly, and at last a powerful employment report. By month end, sentiment was further bolstered by an upward revision to third quarter gross domestic product (“GDP”) growth to 4%, which was doubtless encouraging. But the data released also showed that the engine of growth, the U.S. consumer, was only saving at the rate of 0.5% per annum, which many regard as unsustainable. In addition, the rate of corporate profits growth was already falling and in 2005 may not reach double digits. It is hard to see then what dynamic propelled the S&P 500 Index to another 3.5% gain in December. And while many commentators celebrated this break out and the fact that smaller-cap indices had by then scaled all-time high levels, others feared a reversal before 2005 was very old.
International markets had mixed returns in the second half, but all were inflated in dollar terms by the weakness of that currency. Nonetheless even in local currency terms, Europe’s markets regained mid-2002 levels. Japan equities rose 4.6% in dollar terms during the period, based on the MSCI Japan Index(5) plus net dividends, but fell 1.7% in yen. For the year, Japan returned 15.9% in dollars. First half optimism about GDP growth was dashed as growth collapsed or was revised down as the year wore on.
European excluding (“ex”) UK markets advanced 18.2% in the second half of 2004, according to the MSCI Europe ex UK Index(6) (in dollars including net dividends), about one third due to currency. For all of 2004, the region returned 21.6% in dollars. Profits did grow strongly and markets remain cheap, but given
2
all the issues surrounding low domestic demand, unemployment at 8.9% for the last 20 months and inflexible labor markets, arguably they deserve to be.
The UK market returned 15.7% in the six months through December, based on the MSCI UK Index(7) including net dividends, about 40% due to currency. For the whole year, the UK rose 19.6% in dollars. Contrary to the rest of Europe, the Bank of England has been trying to cool consumer demand and a property boom with five interest rate increases in 12 months. They seem to be succeeding for the most part.
(2) The Lehman Brothers Aggregate Bond Index is composed of securities from the Lehman Brothers Government/ Corporate Bond Index, Mortgage-Backed Securities Index, and the Asset-Backed Securities Index. Total return comprises price appreciation/depreciation and income as a percentage of the original investment.
(3) The Lehman Brothers U.S. Corporate High Yield Bond Index is generally representative of corporate bonds rated below investment-grade.
(4) The Standard & Poor’s 500 Index is a capitalization-weighted index of 500 stocks designed to measure performance of the broad domestic economy through changes in the aggregate market value of 500 stocks representing all major industries.
(5) The MSCI Japan Index is a free float-adjusted market capitalization index that is designed to measure developed market equity performance in Japan.
(6) The MSCI Europe ex UK Index is a free float-adjusted market capitalization index that is designed to measure developed market equity performance in Europe, excluding the UK.
(7) The MSCI UK Index is a free float-adjusted market capitalization index that is designed to measure developed market equity performance in the UK.
All indices are unmanaged and investors cannot invest directly in an index.
Past performance does not guarantee future results. The performance quoted represents past performance. Investment return and principal value of an investment will fluctuate, and shares, when redeemed, may be worth more or less than their original cost. The Series’ performance is subject to change since the period’s end and may be lower or higher than the performance data shown. Please call (800) 366-0066 or log on to www.ingfunds.com to obtain performance data current to the most recent month end.
Market Perspective reflects the views of the Chief Investment Risk Officer only through the end of the period, and is subject to change based on market and other conditions.
3
During the Guarantee Period, the ING GET Fund — Series H, I, J, K, L, M, N, P, Q, R, S, T, U and V (each a “Series”; collectively the “GET Series”) seek to achieve maximum total return and minimal exposure of each Series’ assets to a market value loss by participating, to the extent possible, in favorable equity market performance during the Guarantee Period. The Series are managed by the following Portfolio Management Team with ING Investment Management Co., the Sub-Adviser:
Asset Allocation: Mary Ann Fernandez, Senior Vice President, serves as strategist for the Series and is responsible for overseeing overall Series strategy and the allocation of Series Assets between the Equity and Fixed components.
Equity Component: Hugh T.M. Whelan, Portfolio Manager and Douglas K. Coté, Portfolio Manager, co-manage the Equity Component.
Fixed Component: The Fixed Component is managed by a team of fixed-income specialists led by James B. Kauffmann, Portfolio Manager.
Note: The Series are closed to new deposits.
Performance: Listed below are the total returns for each Series, the Standard & Poor’s (“S&P”) 500 Index(1), the Lehman Brothers Aggregate Bond (“LBAB”) Index(2), and the Lehman Brothers 1-3 Year Government (“LBG 1 - -3”) Index(3) for the year ended December 31, 2004:
| Series H | 1.64 | % | ||
| Series I | 1.17 | % | ||
| Series J | 1.05 | % | ||
| Series K | 0.60 | % | ||
| Series L | 0.56 | % | ||
| Series M | 0.83 | % | ||
| Series N | 1.70 | % | ||
| Series P | 1.48 | % | ||
| Series Q | 1.89 | % | ||
| Series R | 2.77 | % | ||
| Series S | 2.71 | % | ||
| Series T | 2.62 | % | ||
| Series U | 3.40 | % | ||
| Series V | 2.34 | % | ||
| S&P 500 Index | 10.88 | % | ||
| LBAB Index | 4.34 | % | ||
| LBG 1-3 Index | 1.07 | % |
(2) The Lehman Brothers Aggregate Bond Index is an unmanaged index of publicly issued investment grade U.S. Government, mortgage-backed, asset-backed and corporate debt securities.
(3) The Lehman Brothers 1-3 Year Government Index is an unmanaged index of securities issued by the U.S. Government with a maturity from 1 up to (but not including) 3 years.
An investor cannot invest directly in an index.
4
Portfolio Specifics: The Series’ performance is driven by a combination of returns on the equity portfolio, returns on the bond portfolio, and the asset allocation between the two components. The asset allocation process seeks to participate in rising equity markets and protect principal on the downside. Stocks are more volatile than bonds, an important consideration in the asset allocation process. Other factors, such as the current level of interest rates, time remaining to the maturity date, and the ratio of current assets to the underlying guarantee amount are also important. The Series’ allocation to equities and fixed income is dependent on these factors and the path they take over the guarantee period. In general, when the time left to maturity is short,or the ratio of assets to the guarantee amount is low, asset allocation will tend to be conservative in order to protect principal from losses. All other factors being equal, the GET Series generally buys equities (and sells bonds) when the equity market rises and sells equities (and buys bonds) as the equity market declines. The use of fixed income reduces the Series’ ability to participate as fully in upward moving equity markets.
The GET Series’ fixed income component outperformed the Lehman Brothers 1-3 Year Government Index. All of the Series hold a higher percentage of agency securities, as compared to the Index. Over the period, agencies outperformed Treasuries, which accounted for our outperformance. In addition, the GET Series have longer durations than the Index, which helped performance, as longer duration issues outperformed shorter duration issues.
The equity component for the GET Series outperformed the S&P 500 Index due to security selection, especially in the health care, utility, and information technology sectors. Stock selection in the telecommunication and industrial sectors somewhat detracted from performance. The largest positive contributors to performance came from our overweight positions in TUX Corp., United Health Group, Inc., and Apple Computer, Inc. The largest detractors from performance were our overweight position in Ford Motor Co. and our underweight position in Yahoo!, Inc. Individual security selection was helped by the effectiveness of factors historically successful at identifying outperforming stocks, especially free cash flow to price, change in accruals, and analyst estimate revision. Long-term price reversal, price momentum, and trailing price-to-earnings ratio (“P/E”) were not helpful in identifying potentially outperforming stocks during this period.
The Series are invested according to a model investment portfolio. Noteworthy features of the investment performance of the Series are reported according to this model since that reflects the way in which investment decisions are actually made. While we expect our statements to be accurate for each of the individual Series, this may not always be the case due to cash flow differences from Series to Series.
Current Strategy and Outlook: Our outlook for 2005 is positive for equities. We believe inflation should continue to be benign and oil prices should continue to be moderate early in 2005. The Federal Reserve is likely to continue to raise short-term interest rates, while leaving itself latitude to pause. Earnings are still rising, although at a slower pace in 2005. We expect to see job creation pick up after the impacts of higher oil prices percolate through the economy. Given all these economic factors, gross domestic product is likely to decelerate over the next few months to a trend like growth rate in 2005. Allocation between equities and fixed income are dependent on our quantitative asset allocation model, which uses the factors mentioned above not on a qualitative evaluation of the bond versus the equity markets.
Asset Allocation
| Fixed | Common | Other Assets | |||||||||||
| Income | Stock | and Liabilities | |||||||||||
| GET H | 87.7 | % | 11.8 | % | 0.5 | % | |||||||
| GET I | 92.9 | % | 7.2 | % | (0.1 | )% | |||||||
| GET J | 94.8 | % | 5.4 | % | (0.2 | )% | |||||||
| GET K | 98.8 | % | 1.4 | % | (0.2 | )% | |||||||
| GET L | 97.9 | % | 2.2 | % | (0.1 | )% | |||||||
| GET M | 94.4 | % | 5.7 | % | (0.1 | )% | |||||||
| GET N | 87.7 | % | 12.4 | % | (0.1 | )% | |||||||
| GET P | 89.2 | % | 10.9 | % | (0.1 | )% | |||||||
| GET Q | 81.9 | % | 17.6 | % | 0.5 | % | |||||||
| GET R | 75.8 | % | 24.3 | % | (0.1 | )% | |||||||
| GET S | 74.6 | % | 25.5 | % | (0.1 | )% | |||||||
| GET T | 74.8 | % | 25.3 | % | (0.1 | )% | |||||||
| GET U | 65.5 | % | 34.4 | % | 0.1 | % | |||||||
| GET V | 83.9 | % | 16.2 | % | (0.1 | )% | |||||||
| Portfolio holdings are subject to change daily. | |||||||||||||
5
| Average Annual Total Returns for the Periods Ended December 31, 2004 | ||||||||
| Since Inception | ||||||||
| of Guarantee Period | ||||||||
| 1 Year | March 15, 2000 | |||||||
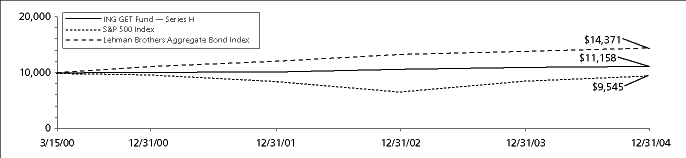
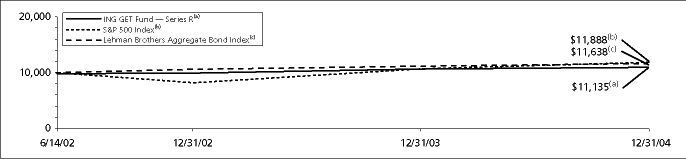
| ING GET Fund — Series H | 1.64 | % | 2.31 | % | ||||
S&P 500 Index(1) | 10.88 | % | (0.96 | )%(2) | ||||
Lehman Brothers Aggregate Bond Index(3) | 4.34 | % | 7.79 | %(2) | ||||
Based on a $10,000 initial investment, the graph and table above illustrate the total return of ING GET Fund — Series H against the S&P 500 Index and the Lehman Brothers Aggregate Bond Index. The Indices are unmanaged and have no cash in their portfolios, impose no sales charges and incur no operating expenses. An investor cannot invest directly in an index. The Series’ performance is shown without the imposition of any expenses or charges which are, or may be, imposed under your annuity contract. Total returns would have been lower if such expenses or charges were included.
The performance graph and table do not reflect the deduction of taxes that a shareholder will pay on Fund distributions or the redemption of Fund shares.
Total returns reflect that the Investment Manager may have waived or recouped fees and expenses otherwise payable by the Portfolio.
The performance update illustrates performance for a variable investment option available through a variable annuity contract. The performance shown indicates past performance and is not a projection or prediction of future results. Actual investment returns and principal value will fluctuate so that shares and/or units, at redemption, may be worth more or less than their original cost. Please call (800) 366-0066 to get performance through the most recent month end.
This report contains statements that may be “forward-looking” statements. Actual results may differ materially from those projected in the “forward-looking” statements.
The views expressed in this report reflect those of the Portfolio managers, only through the end of the period as stated on the cover. The Portfolio managers’ views are subject to change at any time based on market and other conditions.
Portfolio holdings are subject to change daily.
(1)The S&P 500 Index is an unmanaged index that measures the performance of securities of approximately 500 large-capitalization companies whose securities are traded on major U.S. stock markets.
(2)Since inception performance for the index is shown from March 1, 2000.
(3)The Lehman Brothers Aggregate Bond Index is a widely recognized, unmanaged index of publicly issued investment grade U.S. Government, mortgage-backed, asset-backed and corporate debt securities.
6
| Average Annual Total Returns for the Periods Ended December 31, 2004 | ||||||||
| Since Inception | ||||||||
| of Guarantee Period | ||||||||
| 1 Year | June 15, 2000 | |||||||
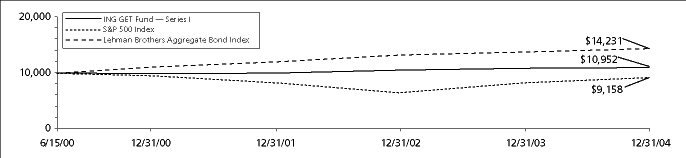
| ING GET Fund — Series I | 1.17 | % | 2.02 | % | ||||
S&P 500 Index(1) | 10.88 | % | (1.90 | )%(2) | ||||
Lehman Brothers Aggregate Bond Index(3) | 4.34 | % | 8.00 | %(2) | ||||
Based on a $10,000 initial investment, the graph and table above illustrate the total return of ING GET Fund — Series I against the S&P 500 Index and the Lehman Brothers Aggregate Bond Index. The Indices are unmanaged and have no cash in their portfolios, impose no sales charges and incur no operating expenses. An investor cannot invest directly in an index. The Series’ performance is shown without the imposition of any expenses or charges which are, or may be, imposed under your annuity contract. Total returns would have been lower if such expenses or charges were included.
The performance graph and table do not reflect the deduction of taxes that a shareholder will pay on Fund distributions or the redemption of Fund shares.
Total returns reflect that the Investment Manager may have waived or recouped fees and expenses otherwise payable by the Portfolio.
The performance update illustrates performance for a variable investment option available through a variable annuity contract. The performance shown indicates past performance and is not a projection or prediction of future results. Actual investment returns and principal value will fluctuate so that shares and/or units, at redemption, may be worth more or less than their original cost. Please call (800) 366-0066 to get performance through the most recent month end.
This report contains statements that may be “forward-looking” statements. Actual results may differ materially from those projected in the “forward-looking” statements.
The views expressed in this report reflect those of the Portfolio managers, only through the end of the period as stated on the cover. The Portfolio managers’ views are subject to change at any time based on market and other conditions.
Portfolio holdings are subject to change daily.
(1)The S&P 500 Index is an unmanaged index that measures the performance of securities of approximately 500 large-capitalization companies whose securities are traded on major U.S. stock markets.
(2)Since inception performance for the index is shown from June 1, 2000.
(3)The Lehman Brothers Aggregate Bond Index is a widely recognized, unmanaged index of publicly issued investment grade U.S. Government, mortgage-backed, asset-backed and corporate debt securities.
7
| Average Annual Total Returns for the Periods Ended December 31, 2004 | ||||||||
| Since Inception | ||||||||
| of Guarantee Period | ||||||||
| 1 Year | September 14, 2000 | |||||||
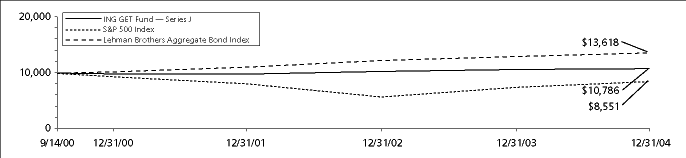
| ING GET Fund — Series J | 1.05 | % | 1.78 | % | ||||
S&P 500 Index(1) | 10.88 | % | (3.55 | )%(2) | ||||
Lehman Brothers Aggregate Bond Index(3) | 4.34 | % | 7.39 | %(2) | ||||
Based on a $10,000 initial investment, the graph and table above illustrate the total return of ING GET Fund — Series J against the S&P 500 Index and the Lehman Brothers Aggregate Bond Index. The Indices are unmanaged and have no cash in their portfolios, impose no sales charges and incur no operating expenses. An investor cannot invest directly in an index. The Series’ performance is shown without the imposition of any expenses or charges which are, or may be, imposed under your annuity contract. Total returns would have been lower if such expenses or charges were included.
The performance graph and table do not reflect the deduction of taxes that a shareholder will pay on Fund distributions or the redemption of Fund shares.
Total returns reflect that the Investment Manager may have waived or recouped fees and expenses otherwise payable by the Portfolio.
The performance update illustrates performance for a variable investment option available through a variable annuity contract. The performance shown indicates past performance and is not a projection or prediction of future results. Actual investment returns and principal value will fluctuate so that shares and/or units, at redemption, may be worth more or less than their original cost. Please call (800) 366-0066 to get performance through the most recent month end.
This report contains statements that may be “forward-looking” statements. Actual results may differ materially from those projected in the “forward-looking” statements.
The views expressed in this report reflect those of the Portfolio managers, only through the end of the period as stated on the cover. The Portfolio managers’ views are subject to change at any time based on market and other conditions.
Portfolio holdings are subject to change daily.
(1)The S&P 500 Index is an unmanaged index that measures the performance of securities of approximately 500 large-capitalization companies whose securities are traded on major U.S. stock markets.
(2)Since inception performance for the index is shown from September 1, 2000.
(3)The Lehman Brothers Aggregate Bond Index is a widely recognized, unmanaged index of publicly issued investment grade U.S. Government, mortgage-backed, asset-backed and corporate debt securities.
8
| Average Annual Total Returns for the Periods Ended December 31, 2004 | ||||||||
| Since Inception | ||||||||
| of Guarantee Period | ||||||||
| 1 Year | December 14, 2000 | |||||||
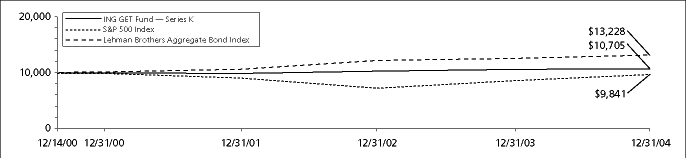
| ING GET Fund — Series K | 0.60 | % | 1.70 | % | ||||
S&P 500 Index(1) | 10.88 | % | (0.39 | )%(2) | ||||
Lehman Brothers Aggregate Bond Index(3) | 4.34 | % | 7.09 | %(2) | ||||
Based on a $10,000 initial investment, the graph and table above illustrate the total return of ING GET Fund — Series K against the S&P 500 Index and the Lehman Brothers Aggregate Bond Index. The Indices are unmanaged and have no cash in their portfolios, impose no sales charges and incur no operating expenses. An investor cannot invest directly in an index. The Series’ performance is shown without the imposition of any expenses or charges which are, or may be, imposed under your annuity contract. Total returns would have been lower if such expenses or charges were included.
The performance graph and table do not reflect the deduction of taxes that a shareholder will pay on Fund distributions or the redemption of Fund shares.
Total returns reflect that the Investment Manager may have waived or recouped fees and expenses otherwise payable by the Portfolio.
The performance update illustrates performance for a variable investment option available through a variable annuity contract. The performance shown indicates past performance and is not a projection or prediction of future results. Actual investment returns and principal value will fluctuate so that shares and/or units, at redemption, may be worth more or less than their original cost. Please call (800) 366-0066 to get performance through the most recent month end.
This report contains statements that may be “forward-looking” statements. Actual results may differ materially from those projected in the “forward-looking” statements.
The views expressed in this report reflect those of the Portfolio managers, only through the end of the period as stated on the cover. The Portfolio managers’ views are subject to change at any time based on market and other conditions.
Portfolio holdings are subject to change daily.
(1)The S&P 500 Index is an unmanaged index that measures the performance of securities of approximately 500 large-capitalization companies whose securities are traded on major U.S. stock markets.
(2)Since inception performance for the index is shown from December 1, 2000.
(3)The Lehman Brothers Aggregate Bond Index is a widely recognized, unmanaged index of publicly issued investment grade U.S. Government, mortgage-backed, asset-backed and corporate debt securities.
9
| Average Annual Total Returns for the Periods Ended December 31, 2004 | ||||||||
| Since Inception | ||||||||
| of Guarantee Period | ||||||||
| 1 Year | March 15, 2001 | |||||||
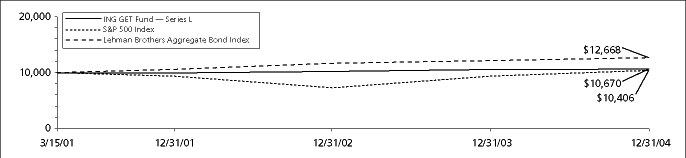
| ING GET Fund — Series L | 0.56 | % | 1.72 | % | ||||
S&P 500 Index(1) | 10.88 | % | 1.04 | %(2) | ||||
Lehman Brothers Aggregate Bond Index(3) | 4.34 | % | 6.36 | %(2) | ||||
Based on a $10,000 initial investment, the graph and table above illustrate the total return of ING GET Fund — Series L against the S&P 500 Index and the Lehman Brothers Aggregate Bond Index. The Indices are unmanaged and have no cash in their portfolios, impose no sales charges and incur no operating expenses. An investor cannot invest directly in an index. The Series’ performance is shown without the imposition of any expenses or charges which are, or may be, imposed under your annuity contract. Total returns would have been lower if such expenses or charges were included.
The performance graph and table do not reflect the deduction of taxes that a shareholder will pay on Fund distributions or the redemption of Fund shares.
Total returns reflect that the Investment Manager may have waived or recouped fees and expenses otherwise payable by the Portfolio.
The performance update illustrates performance for a variable investment option available through a variable annuity contract. The performance shown indicates past performance and is not a projection or prediction of future results. Actual investment returns and principal value will fluctuate so that shares and/or units, at redemption, may be worth more or less than their original cost. Please call (800) 366-0066 to get performance through the most recent month end.
This report contains statements that may be “forward-looking” statements. Actual results may differ materially from those projected in the “forward-looking” statements.
The views expressed in this report reflect those of the Portfolio managers, only through the end of the period as stated on the cover. The Portfolio managers’ views are subject to change at any time based on market and other conditions.
Portfolio holdings are subject to change daily.
(1)The S&P 500 Index is an unmanaged index that measures the performance of securities of approximately 500 large-capitalization companies whose securities are traded on major U.S. stock markets.
(2)Since inception performance for the index is shown from March 1, 2001.
(3)The Lehman Brothers Aggregate Bond Index is a widely recognized, unmanaged index of publicly issued investment grade U.S. Government, mortgage-backed, asset-backed and corporate debt securities.
10
| Average Annual Total Returns for the Periods Ended December 31, 2004 | ||||||||
| Since Inception | ||||||||
| of Guarantee Period | ||||||||
| 1 Year | June 14, 2001 | |||||||
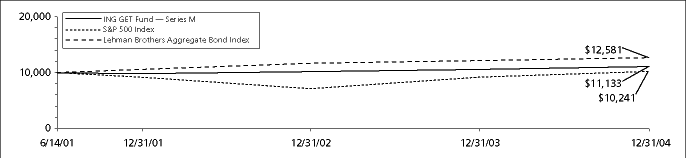
| ING GET Fund — Series M | 0.83 | % | 1.93 | % | ||||
S&P 500 Index(1) | 10.88 | % | 0.67 | %(2) | ||||
Lehman Brothers Aggregate Bond Index(3) | 4.34 | % | 6.62 | %(2) | ||||
Based on a $10,000 initial investment, the graph and table above illustrate the total return of ING GET Fund — Series M against the S&P 500 Index and the Lehman Brothers Aggregate Bond Index. The Indices are unmanaged and have no cash in their portfolios, impose no sales charges and incur no operating expenses. An investor cannot invest directly in an index. The Series’ performance is shown without the imposition of any expenses or charges which are, or may be, imposed under your annuity contract. Total returns would have been lower if such expenses or charges were included.
The performance graph and table do not reflect the deduction of taxes that a shareholder will pay on Fund distributions or the redemption of Fund shares.
Total returns reflect that the Investment Manager may have waived or recouped fees and expenses otherwise payable by the Portfolio.
The performance update illustrates performance for a variable investment option available through a variable annuity contract. The performance shown indicates past performance and is not a projection or prediction of future results. Actual investment returns and principal value will fluctuate so that shares and/or units, at redemption, may be worth more or less than their original cost. Please call (800) 366-0066 to get performance through the most recent month end.
This report contains statements that may be “forward-looking” statements. Actual results may differ materially from those projected in the “forward-looking” statements.
The views expressed in this report reflect those of the Portfolio managers, only through the end of the period as stated on the cover. The Portfolio managers’ views are subject to change at any time based on market and other conditions.
Portfolio holdings are subject to change daily.
(1)The S&P 500 Index is an unmanaged index that measures the performance of securities of approximately 500 large-capitalization companies whose securities are traded on major U.S. stock markets.
(2)Since inception performance for the index is shown from June 1, 2001.
(3)The Lehman Brothers Aggregate Bond Index is a widely recognized, unmanaged index of publicly issued investment grade U.S. Government, mortgage-backed, asset-backed and corporate debt securities.
11
| Average Annual Total Returns for the Periods Ended December 31, 2004 | ||||||||
| Since Inception | ||||||||
| of Guarantee Period | ||||||||
| 1 Year | September 18, 2001 | |||||||
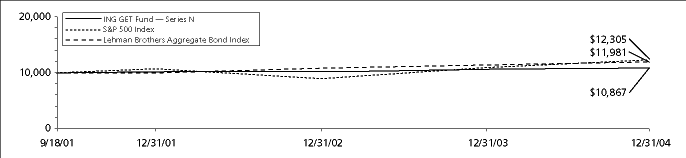
| ING GET Fund — Series N | 1.70 | % | 2.56 | % | ||||
S&P 500 Index(1) | 10.88 | % | 3.76 | %(2) | ||||
Lehman Brothers Aggregate Bond Index(3) | 4.34 | % | 5.94 | %(2) | ||||
Based on a $10,000 initial investment, the graph and table above illustrate the total return of ING GET Fund — Series N against the S&P 500 Index and the Lehman Brothers Aggregate Bond Index. The Indices are unmanaged and have no cash in their portfolios, impose no sales charges and incur no operating expenses. An investor cannot invest directly in an index. The Series’ performance is shown without the imposition of any expenses or charges which are, or may be, imposed under your annuity contract. Total returns would have been lower if such expenses or charges were included.
The performance graph and table do not reflect the deduction of taxes that a shareholder will pay on Fund distributions or the redemption of Fund shares.
Total returns reflect that the Investment Manager may have waived or recouped fees and expenses otherwise payable by the Portfolio.
The performance update illustrates performance for a variable investment option available through a variable annuity contract. The performance shown indicates past performance and is not a projection or prediction of future results. Actual investment returns and principal value will fluctuate so that shares and/or units, at redemption, may be worth more or less than their original cost. Please call (800) 366-0066 to get performance through the most recent month end.
This report contains statements that may be “forward-looking” statements. Actual results may differ materially from those projected in the “forward-looking” statements.
The views expressed in this report reflect those of the Portfolio managers, only through the end of the period as stated on the cover. The Portfolio managers’ views are subject to change at any time based on market and other conditions.
Portfolio holdings are subject to change daily.
(1)The S&P 500 Index is an unmanaged index that measures the performance of securities of approximately 500 large-capitalization companies whose securities are traded on major U.S. stock markets.
(2)Since inception performance for the index is shown from October 1, 2001.
(3)The Lehman Brothers Aggregate Bond Index is a widely recognized, unmanaged index of publicly issued investment grade U.S. Government, mortgage-backed, asset-backed and corporate debt securities.
12
| Average Annual Total Returns for the Periods Ended December 31, 2004 | ||||||||
| Since Inception | ||||||||
| of Guarantee Period | ||||||||
| 1 Year | December 13, 2001 | |||||||
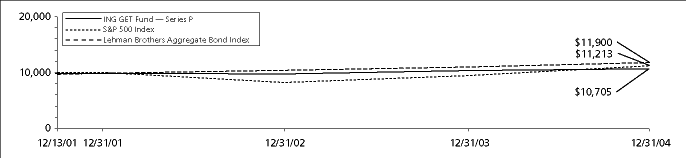
| ING GET Fund — Series P | 1.48 | % | 2.26 | % | ||||
S&P 500 Index(1) | 10.88 | % | 3.78 | %(2) | ||||
Lehman Brothers Aggregate Bond Index(3) | 4.34 | % | 5.80 | %(2) | ||||
Based on a $10,000 initial investment, the graph and table above illustrate the total return of ING GET Fund — Series P against the S&P 500 Index and the Lehman Brothers Aggregate Bond Index. The Indices are unmanaged and have no cash in their portfolios, impose no sales charges and incur no operating expenses. An investor cannot invest directly in an index. The Series’ performance is shown without the imposition of any expenses or charges which are, or may be, imposed under your annuity contract. Total returns would have been lower if such expenses or charges were included.
The performance graph and table do not reflect the deduction of taxes that a shareholder will pay on Fund distributions or the redemption of Fund shares.
Total returns reflect that the Investment Manager may have waived or recouped fees and expenses otherwise payable by the Portfolio.
The performance update illustrates performance for a variable investment option available through a variable annuity contract. The performance shown indicates past performance and is not a projection or prediction of future results. Actual investment returns and principal value will fluctuate so that shares and/or units, at redemption, may be worth more or less than their original cost. Please call (800) 366-0066 to get performance through the most recent month end.
This report contains statements that may be “forward-looking” statements. Actual results may differ materially from those projected in the “forward-looking” statements.
The views expressed in this report reflect those of the Portfolio managers, only through the end of the period as stated on the cover. The Portfolio managers’ views are subject to change at any time based on market and other conditions.
Portfolio holdings are subject to change daily.
(1)The S&P 500 Index is an unmanaged index that measures the performance of securities of approximately 500 large-capitalization companies whose securities are traded on major U.S. stock markets.
(2)Since inception performance for the index is shown from December 1, 2001.
(3)The Lehman Brothers Aggregate Bond Index is a widely recognized, unmanaged index of publicly issued investment grade U.S. Government, mortgage-backed, asset-backed and corporate debt securities.
13

| Average Annual Total Returns for the Periods Ended December 31, 2004 | ||||||||
| Since Inception | ||||||||
| of Guarantee Period | ||||||||
| 1 Year | March 15, 2002 | |||||||
| ING GET Fund — Series Q | 1.89 | % | 3.27 | % | ||||
S&P 500 Index(1) | 10.88 | % | 5.06 | %(2) | ||||
Lehman Brothers Aggregate Bond Index(3) | 4.34 | % | 5.91 | %(2) | ||||
Based on a $10,000 initial investment, the graph and table above illustrate the total return of ING GET Fund — Series Q against the S&P 500 Index and the Lehman Brothers Aggregate Bond Index. The Indices are unmanaged and have no cash in their portfolios, impose no sales charges and incur no operating expenses. An investor cannot invest directly in an index. The Series’ performance is shown without the imposition of any expenses or charges which are, or may be, imposed under your annuity contract. Total returns would have been lower if such expenses or charges were included.
The performance graph and table do not reflect the deduction of taxes that a shareholder will pay on Fund distributions or the redemption of Fund shares.
Total returns reflect that the Investment Manager may have waived or recouped fees and expenses otherwise payable by the Portfolio.
The performance update illustrates performance for a variable investment option available through a variable annuity contract. The performance shown indicates past performance and is not a projection or prediction of future results. Actual investment returns and principal value will fluctuate so that shares and/or units, at redemption, may be worth more or less than their original cost. Please call (800) 366-0066 to get performance through the most recent month end.
This report contains statements that may be “forward-looking” statements. Actual results may differ materially from those projected in the “forward-looking” statements.
The views expressed in this report reflect those of the Portfolio managers, only through the end of the period as stated on the cover. The Portfolio managers’ views are subject to change at any time based on market and other conditions.
Portfolio holdings are subject to change daily.
(1)The S&P 500 Index is an unmanaged index that measures the performance of securities of approximately 500 large-capitalization companies whose securities are traded on major U.S. stock markets.
(2)Since inception performance for the index is shown from March 1, 2002.
(3)The Lehman Brothers Aggregate Bond Index is a widely recognized, unmanaged index of publicly issued investment grade U.S. Government, mortgage-backed, asset-backed and corporate debt securities.
14
| Average Annual Total Returns for the Period Ended December 31, 2004 | ||||||||
| Since Inception | ||||||||
| of Guarantee Period | ||||||||
| 1 Year | June 14, 2002 | |||||||
| ING GET Fund — Series R | 2.77 | % | 4.30 | % | ||||
S&P 500 Index(1) | 10.88 | % | 6.92 | %(2) | ||||
Lehman Brothers Aggregate Bond Index(3) | 4.34 | % | 6.05 | %(2) | ||||
Based on a $10,000 initial investment, the graph and table above illustrate the total return of ING GET Fund — Series R against the S&P 500 Index and the Lehman Brothers Aggregate Bond Index. The Indices are unmanaged and have no cash in their portfolios, impose no sales charges and incur no operating expenses. An investor cannot invest directly in an index. The Series’ performance is shown without the imposition of any expenses or charges which are, or may be, imposed under your annuity contract. Total returns would have been lower if such expenses or charges were included.
The performance graph and table do not reflect the deduction of taxes that a shareholder will pay on Fund distributions or the redemption of Fund shares.
Total returns reflect that the Investment Manager may have waived or recouped fees and expenses otherwise payable by the Portfolio.
The performance update illustrates performance for a variable investment option available through a variable annuity contract. The performance shown indicates past performance and is not a projection or prediction of future results. Actual investment returns and principal value will fluctuate so that shares and/or units, at redemption, may be worth more or less than their original cost. Please call (800) 366-0066 to get performance through the most recent month end.
This report contains statements that may be “forward-looking” statements. Actual results may differ materially from those projected in the “forward-looking” statements.
The views expressed in this report reflect those of the Portfolio managers, only through the end of the period as stated on the cover. The Portfolio managers’ views are subject to change at any time based on market and other conditions.
Portfolio holdings are subject to change daily.
(1)The S&P 500 Index is an unmanaged index that measures the performance of securities of approximately 500 large-capitalization companies whose securities are traded on major U.S. stock markets.
(2)Since inception performance for the index is shown from June 1, 2002.
(3)The Lehman Brothers Aggregate Bond Index is a widely recognized, unmanaged index of publicly issued investment grade U.S. Government, mortgage-backed, asset-backed and corporate debt securities.
15
| Average Annual Total Returns for the Period Ended December 31, 2004 | ||||||||
| Since Inception | ||||||||
| of Guarantee Period | ||||||||
| 1 Year | September 12, 2002 | |||||||
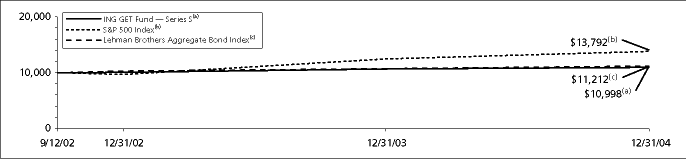
| ING GET Fund — Series S | 2.71 | % | 4.22 | % | ||||
S&P 500 Index(1) | 10.88 | % | 14.77 | %(2) | ||||
Lehman Brothers Aggregate Bond Index(3) | 4.34 | % | 5.02 | %(2) | ||||
Based on a $10,000 initial investment, the graph and table above illustrate the total return of ING GET Fund — Series S against the S&P 500 Index and the Lehman Brothers Aggregate Bond Index. The Indices are unmanaged and have no cash in their portfolios, impose no sales charges and incur no operating expenses. An investor cannot invest directly in an index. The Series’ performance is shown without the imposition of any expenses or charges which are, or may be, imposed under your annuity contract. Total returns would have been lower if such expenses or charges were included.
The performance graph and table do not reflect the deduction of taxes that a shareholder will pay on Fund distributions or the redemption of Fund shares.
Total returns reflect that the Investment Manager may have waived or recouped fees and expenses otherwise payable by the Portfolio.
The performance update illustrates performance for a variable investment option available through a variable annuity contract. The performance shown indicates past performance and is not a projection or prediction of future results. Actual investment returns and principal value will fluctuate so that shares and/or units, at redemption, may be worth more or less than their original cost. Please call (800) 366-0066 to get performance through the most recent month end.
This report contains statements that may be “forward-looking” statements. Actual results may differ materially from those projected in the “forward-looking” statements.
The views expressed in this report reflect those of the Portfolio managers, only through the end of the period as stated on the cover. The Portfolio managers’ views are subject to change at any time based on market and other conditions.
Portfolio holdings are subject to change daily.
(1)The S&P 500 Index is an unmanaged index that measures the performance of securities of approximately 500 large-capitalization companies whose securities are traded on major U.S. stock markets.
(2)Since inception performance for the index is shown from September 1, 2002.
(3)The Lehman Brothers Aggregate Bond Index is a widely recognized, unmanaged index of publicly issued investment grade U.S. Government, mortgage-backed, asset-backed and corporate debt securities.
16
| Average Annual Total Returns for the Period Ended December 31, 2004 | ||||||||
| Since Inception | ||||||||
| of Guarantee Period | ||||||||
| 1 Year | December 12, 2002 | |||||||
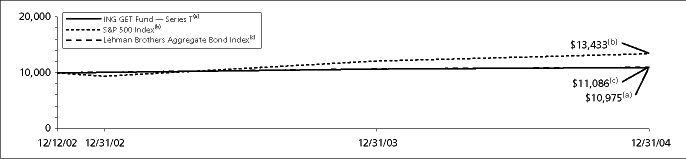
| ING GET Fund — Series T | 2.62 | % | 4.63 | % | ||||
S&P 500 Index(1) | 10.88 | % | 15.22 | %(2) | ||||
Lehman Brothers Aggregate Bond Index(3) | 4.34 | % | 5.08 | %(2) | ||||
Based on a $10,000 initial investment, the graph and table above illustrate the total return of ING GET Fund — Series T against the S&P 500 Index and the Lehman Brothers Aggregate Bond Index. The Indices are unmanaged and have no cash in their portfolios, impose no sales charges and incur no operating expenses. An investor cannot invest directly in an index. The Series’ performance is shown without the imposition of any expenses or charges which are, or may be, imposed under your annuity contract. Total returns would have been lower if such expenses or charges were included.
The performance graph and table do not reflect the deduction of taxes that a shareholder will pay on Fund distributions or the redemption of Fund shares.
Total returns reflect that the Investment Manager may have waived or recouped fees and expenses otherwise payable by the Portfolio.
The performance update illustrates performance for a variable investment option available through a variable annuity contract. The performance shown indicates past performance and is not a projection or prediction of future results. Actual investment returns and principal value will fluctuate so that shares and/or units, at redemption, may be worth more or less than their original cost. Please call (800) 366-0066 to get performance through the most recent month end.
This report contains statements that may be “forward-looking” statements. Actual results may differ materially from those projected in the “forward-looking” statements.
The views expressed in this report reflect those of the Portfolio managers, only through the end of the period as stated on the cover. The Portfolio managers’ views are subject to change at any time based on market and other conditions.
Portfolio holdings are subject to change daily.
(1)The S&P 500 Index is an unmanaged index that measures the performance of securities of approximately 500 large-capitalization companies whose securities are traded on major U.S. stock markets.
(2)Since inception performance for the index is shown from December 1, 2002.
(3)The Lehman Brothers Aggregate Bond Index is a widely recognized, unmanaged index of publicly issued investment grade U.S. Government, mortgage-backed, asset-backed and corporate debt securities.
17
| Average Annual Total Returns for the Period Ended December 31, 2004 | ||||||||
| Since Inception | ||||||||
| of Guarantee Period | ||||||||
| 1 Year | March 13, 2003 | |||||||
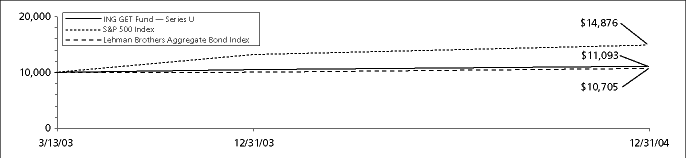
| ING GET Fund — Series U | 3.40 | % | 5.91 | % | ||||
S&P 500 Index(1) | 10.88 | % | 24.19 | %(2) | ||||
Lehman Brothers Aggregate Bond Index(3) | 4.34 | % | 3.78 | %(2) | ||||
Based on a $10,000 initial investment, the graph and table above illustrate the total return of ING GET Fund — Series U against the S&P 500 Index and the Lehman Brothers Aggregate Bond Index. The Indices are unmanaged and have no cash in their portfolios, impose no sales charges and incur no operating expenses. An investor cannot invest directly in an index. The Series’ performance is shown without the imposition of any expenses or charges which are, or may be, imposed under your annuity contract. Total returns would have been lower if such expenses or charges were included.
The performance graph and table do not reflect the deduction of taxes that a shareholder will pay on Fund distributions or the redemption of Fund shares.
Total returns reflect that the Investment Manager may have waived or recouped fees and expenses otherwise payable by the Portfolio.
The performance update illustrates performance for a variable investment option available through a variable annuity contract. The performance shown indicates past performance and is not a projection or prediction of future results. Actual investment returns and principal value will fluctuate so that shares and/or units, at redemption, may be worth more or less than their original cost. Please call (800) 366-0066 to get performance through the most recent month end.
This report contains statements that may be “forward-looking” statements. Actual results may differ materially from those projected in the “forward-looking” statements.
The views expressed in this report reflect those of the Portfolio managers, only through the end of the period as stated on the cover. The Portfolio managers’ views are subject to change at any time based on market and other conditions.
Portfolio holdings are subject to change daily.
(1)The S&P 500 Index is an unmanaged index that measures the performance of securities of approximately 500 large-capitalization companies whose securities are traded on major U.S. stock markets.
(2)Since inception performance for the index is shown from March 1, 2003.
(3)The Lehman Brothers Aggregate Bond Index is a widely recognized, unmanaged index of publicly issued investment grade U.S. Government, mortgage-backed, asset-backed and corporate debt securities.
18
| ING GET FUND — SERIES V |
| Average Annual Total Returns for the Period Ended December 31, 2004 | ||||||||
| Since Inception | ||||||||
| of Guarantee Period | ||||||||
| 1 Year | June 13, 2003 | |||||||
| ING GET Fund — Series V | 2.34 | % | 0.52 | % | ||||
S&P 500 Index(1) | 10.88 | % | 17.61 | %(2) | ||||
Lehman Brothers Aggregate Bond Index(3) | 4.34 | % | 2.70 | %(2) | ||||
Based on a $10,000 initial investment, the graph and table above illustrate the total return of ING GET Fund — Series V against the S&P 500 Index and the Lehman Brothers Aggregate Bond Index. The Indices are unmanaged and have no cash in their portfolios, impose no sales charges and incur no operating expenses. An investor cannot invest directly in an index. The Series’ performance is shown without the imposition of any expenses or charges which are, or may be, imposed under your annuity contract. Total returns would have been lower if such expenses or charges were included.
The performance graph and table do not reflect the deduction of taxes that a shareholder will pay on Fund distributions or the redemption of Fund shares.
Total returns reflect that the Investment Manager may have waived or recouped fees and expenses otherwise payable by the Portfolio.
The performance update illustrates performance for a variable investment option available through a variable annuity contract. The performance shown indicates past performance and is not a projection or prediction of future results. Actual investment returns and principal value will fluctuate so that shares and/or units, at redemption, may be worth more or less than their original cost. Please call (800) 366-0066 to get performance through the most recent month end.
This report contains statements that may be “forward-looking” statements. Actual results may differ materially from those projected in the “forward-looking” statements.
The views expressed in this report reflect those of the Portfolio managers, only through the end of the period as stated on the cover. The Portfolio managers’ views are subject to change at any time based on market and other conditions.
Portfolio holdings are subject to change daily.
(1)The S&P 500 Index is an unmanaged index that measures the performance of securities of approximately 500 large-capitalization companies whose securities are traded on major U.S. stock markets.
(2)Since inception performance for the index is shown from June 1, 2003.
(3)The Lehman Brothers Aggregate Bond Index is a widely recognized, unmanaged index of publicly issued investment grade U.S. Government, mortgage-backed, asset-backed and corporate debt securities.
19
What is the Investment Strategy During the Guarantee Period?
The Series do not implement an “investment strategy” in any conventional sense. Rather, the Series’ asset allocation strategy seeks to optimize the exposure of the Series to the Equity Component while protecting Series assets. Assets allocated to the Equity Component may be reduced or eliminated in order to conserve assets at a level equal to or above the present value of the Guarantee. The Series allocate their assets among the following asset classes:
During the Guarantee Period, the Series’ assets will be allocated between the:
| • | Equity Component, consisting of common stocks included in the Standard & Poor’s (“S&P”) 500 Index, futures contracts on the S&P 500 Index, and when the Equity Component’s market value is $5 million or less, investments in exchange traded funds (“ETFs”) that can reasonably be expected to have at least a 95% correlation ratio with the S&P 500 Index, in S&P 500 Index futures, or in a combination of S&P 500 Index futures and ETFs, subject to any limitation on the Series’ investments in such securities (“Equity Component”); and the |
| • | Fixed Component, consisting primarily of short-to intermediate-duration U.S. Government securities (“Fixed Component”). |
The Series’ asset allocation strategy is implemented by allocating assets appropriately to the Equity Component and to the Fixed Component to optimize exposure to the Equity Component while controlling the risk that an insurance company may be required to make payment under the Guarantee. Consequently, there can be no assurance as to the percentage of assets, if any, allocated to the Equity Component, or to any investment returns generated by the Series.
How does the Series’ Asset Allocation work?
ING Investment Management Co. (“ING IM”), Sub-Adviser to the Series, uses a proprietary computer model to determine on a daily basis the percentage of assets allocated to the Equity Component and to the Fixed Component. The model evaluates a number of factors, including the then current market value of the Series, the then prevailing level of interest rates, equity market volatility, the Series’ total annual expenses, insurance company separate account expenses, and the Maturity Date. The model determines the initial allocation between the Equity Component and the Fixed Component on the first day of the Guarantee Period and provides direction for any reallocations on a daily basis thereafter. Generally, as the value of the Equity Component rises, more assets are allocated to the Equity Component; as the value of the Equity Component declines, more assets are allocated to the Fixed Component. The amount directed to the Equity Component is always restricted so that even if it were to experience a “material decline” in value on a given day and before being redirected to the Fixed Component, the remaining assets would still be sufficient to meet the Guarantee. At the commencement of the Guarantee Period, the Series will define a “material decline” in value as a decline in the value of the Equity Component of at least 20% but no more than 30%. In the event the Series defines the “material decline” at 20%, more assets will likely be allocated to the Equity Component than if the “material decline” is defined at 30%. The allocation to the Equity Component or the Fixed Component may be zero under certain circumstances.
Equity Component: ING IM manages the Equity Component by overweighting those stocks in the S&P 500 Index that it believes will outperform the S&P 500 Index, and underweighting (or avoiding altogether) those stocks ING IM believes will underperform the S&P 500 Index (“Enhanced Index Strategy”). Stocks ING IM believes are likely to match the performance of the S&P 500 Index are invested in proportion to their representation in the Index. To determine which stocks to weight more or less heavily, ING IM uses internally developed quantitative computer models to evaluate various criteria, such as the financial strength of each company and its potential for strong, sustained earnings growth. ING IM expects that there will be a close correlation between the performance of the Equity Component and that of the S&P 500 Index in both rising and falling markets.
If the Equity Component’s market value is $5 million or less, in order to replicate an investment in stocks listed in the S&P 500 Index, ING IM may invest the entire amount of the Equity Component’s assets in S&P 500 Index futures, in exchange traded funds (“ETFs”), or in a combination of S&P 500 Index futures
20
and ETFs, subject to any limitation on the Series’ investment in such securities. ETFs are passively managed investment companies traded on a securities exchange whose goal is to track or replicate a desired index. ING IM will not employ an enhanced index strategy when it invests in S&P 500 Index futures and ETFs.
Fixed Component: ING IM seeks to select investments for the Fixed Component with financial characteristics that will, at any point in time, closely resemble those of a portfolio of zero coupon bonds which mature within three months of the Maturity Date. Generally, at least 55% of the Fixed Component will consist of securities issued or guaranteed by the U.S. Government, its agencies or instrumentalities, including STRIPS (Separate Trading of Registered Interest and Principal of Securities). Although the Series invest in securities insured or guaranteed by the U.S. Government, the Series shares are not issued or guaranteed. STRIPS are created by the Federal Reserve Bank by separating the interest and principal components of an outstanding U.S. Treasury or agency bond and selling them as individual securities. The Fixed Component may also consist of mortgage backed securities (including commercial mortgage backed securities) which are rated AAA or Aaa at the time of purchase by Moody’s Investors Service, Inc. (Moody’s) or S&P, respectively, and corporate obligations which are rated at the time of purchase A- or higher by S&P and/or Aa3 or higher by Moody’s. The Fixed Component may also include U.S. Treasury futures and money market instruments.
What are the Principal Guarantee Period Risks?
Allocation Risk: If, at the inception of, or any time during, the Guarantee Period interest rates are low, the Series’ assets may be largely invested in the Fixed Component in order to decrease the likelihood that an insurance company would be required to make any payment under the Guarantee. The effect of low interest rates on the Series would likely be more pronounced at the inception of the Guarantee Period, as the initial allocation of assets would include more fixed income securities. In addition, if during the Guarantee Period the equity markets experienced a major decline, the Series’ assets may become largely invested in the Fixed Component. In fact, if the value of the Equity Component were to decline by a significant amount, a complete reallocation to the Fixed Component would likely occur. In the event of a reallocation of 100% of the assets to the Fixed Component, the Series would not reallocate any assets into the Equity Component prior to the Maturity Date. Use of the Fixed Component reduces the Series’ ability to participate as fully in upward equity market movements, and therefore represents some loss of opportunity, or opportunity cost, compared to a portfolio that is fully invested in equities.
Active Asset Allocation May Underperform Static Strategies: The asset allocation process results in transaction costs. Volatile periods in the market may increase these costs. This process can have an adverse effect on the performance of the Series during periods of increased equity market volatility. In addition, a high portfolio turnover rate, which may also have an adverse effect on the performance of the Series, may increase the Series’ transaction costs.
Opportunity Costs: There are substantial opportunity costs associated with an investment in the Series. The Series may allocate a substantial portion, and under certain circumstances all, of the Series’ assets to the Fixed Component in order to conserve Series assets to a level equal to or above the present value of the Guarantee.
Initially, if interest rates are low, the allocation to the Fixed Component may be over 70% of the Series’ assets. If the market value of the Equity Component rises, the percentage of the Series’ assets allocated to the Equity Component generally will also rise. However, the relative volatility of these two Components as well as the past performance of the Series will affect these allocations. For example, if the Series incurs early losses, the Series may allocate 100% of the Series’ assets to the Fixed Component for the entire Guarantee Period, irrespective of the subsequent upward movements in the equity markets and/or the Equity Component.
The extent to which the Series participates in upward movements in the Equity Component during the Guarantee Period will depend on the performance of the Series, the performance and volatility of the Fixed and Equity Components, interest rates, expenses of the Series and of the underlying contract, and other factors. The Series might capture a material portion, very little or none of any Equity Component increase.
It is possible that on the Maturity Date, a Contract- holder or Participant could receive only the guaranteed amount even though the equity markets,
21
as well as the Equity Component, has had significant positive performance during the Guarantee Period.
When you hold your investment until the end of the 5-year Guarantee Period, on the Guarantee Maturity Date your account will be worth no less than your investment at the inception of the Guarantee Period, less any redemptions and distributions you have received in cash, and certain Series expenses, such as interest, taxes and extraordinary expenses. If you sell shares during the Guarantee Period, shares are redeemed at the current NAV which may be worth more or less than your original investment and/or the NAV at the inception of the Guarantee Period. The guarantee is based on the beginning NAV on the first day of the Guarantee Period, not the Public Offering Price, and does not apply to any earnings realized during the Guarantee Period. The guarantee is backed by insurance companies offering the Series. As with the sale of any securities, a taxable event may occur if the Series liquidates fixed income securities at the end of the Guarantee Period.
Worse Case Scenarios for the Series’ Equity Participation: The opportunity cost of not allocating assets to the Equity Component will be particularly high if early in the Guarantee Period: (a) the Series’ NAV decreases; or (b) the value of the Equity Component declines. In either case, all or substantially all of the Series’ assets could be allocated to the Fixed Component for the remainder of the Guarantee Period.
Annuity Charges: Contract-holders and Participants acquiring interests in the Series through separate accounts are not all subject to the same contract charges. The Series’ asset allocation strategy seeks to optimize the exposure of the Series to the Equity Component while protecting Series assets. As such, Contract-holders and Participants will incur different opportunity costs, as the Series’ Equity Component allocation will be reduced so as to preserve the Series’ assets at a level that may be higher than that needed to return to certain investors their initial separate account investment directed to the Series as of the Maturity Date, plus their (lower) contract charges.
Stock and Bond Investments: The risks associated with investing in stocks include sudden and unpredictable drops in the value of the market as a whole and periods of lackluster or negative performance. The performance of the Equity Component also depends significantly on ING IM’s skill in determining which securities to overweight, underweight or avoid altogether.
The principal risk associated with investing in bonds is that interest rates may rise, which generally causes bond prices to fall. The market prices of STRIPS generally are more volatile than the market prices of other fixed income securities with similar maturities that pay interest periodically. With corporate bonds, there is a risk that the issuer will default on the payment of principal or interest.
With mortgage backed securities, there is a risk of prepayment of the underlying mortgage. Because prepayments of principal generally occur when interest rates are declining, it is likely that the Series may have to reinvest the proceeds of prepayments at lower yields. In addition, with credit risk, the Series could lose money if the issuer of a debt security is unable to meet its financial obligations or goes bankrupt. This Series is subject to less credit risk than other funds because it principally invests in debt securities issued or guaranteed by the U.S. Government or its agencies.
Declining Interest Rates: A decline in prevailing U.S. interest rates could materially increase the opportunity costs. Any such decline would increase the present value of the Guarantee, potentially causing the Series to allocate all or substantially all of the Series’ assets to the Fixed Component in order to assure that such assets do not fall below the Guarantee.
Futures Contracts: The Series may invest in futures contracts, which provide for the future sale by one party and purchase by another party of a specified amount of a financial instrument or a specific stock market index for a specified price on a designated date. The Series uses futures for hedging purposes or to temporarily increase or limit exposure to a particular asset class. The main risk with futures contracts is that they can amplify a gain or loss, potentially earning or losing substantially more money than the actual investment made in the futures contract.
Exchange Traded Funds: ETFs are passively managed investment companies traded on a securities exchange whose goal is to track or replicate a desired index. ETFs present risks similar to those of an investment in the underlying securities held by the ETF. Because ETFs trade on an exchange, they may not trade at net asset value (“NAV”). Sometimes, the
22
prices of ETFs may vary significantly from the NAVs of the ETFs underlying securities. Additionally, if the Fund elects to redeem its ETF shares rather than selling them on the secondary market, the Fund may receive the underlying securities which it must then sell in order to obtain cash. Additionally, you may pay a proportionate share of the expenses of the ETF in addition to the expenses of the Fund.
Risks of Using Derivatives: Certain securities in which the Series may invest, including futures contracts, are derivative instruments. In general terms, a derivative instrument is a financial contract whose value is derived, at least in part, from the performance of an underlying asset, interest rate, or index. If the issuer of a derivative does not pay the amount owed on the contract when due, the Series can lose money on the investment. The underlying investment on which the derivative is based, and the derivative itself, might not perform in the manner the Sub-Adviser expected, which could cause the Series’ share price to decline. Markets underlying securities may move in a direction not anticipated by the Sub-Adviser, which may result in the Series’ realizing a lower return than expected on an investment.
23
As a shareholder of a Fund, you incur two types of costs: (1) transaction costs, including sales charges (loads) on purchase payments, reinvested dividends, or other distributions; redemption fees; and exchange fees; and (2) ongoing costs, including management fees; distribution [and/or service] (12b–1) fees; and other Fund expenses. These Examples are intended to help you understand your ongoing costs (in dollars) of investing in a Fund and to compare these costs with the ongoing costs of investing in other mutual funds.
The Examples are based on an investment of $1,000 invested at the beginning of the period and held for the entire period from July 1, 2004 to December 31, 2004.
Actual Expenses
The first section of the table shown, “Actual Fund Return,” provides information about actual account values and actual expenses. You may use the information in this section, together with the amount you invested, to estimate the expenses that you paid over the period. Simply divide your account value by $1,000 (for example, an $8,600 account value divided by $1,000 = 8.6), then multiply the result by the number in the first section under the heading entitled “Expenses Paid During Period” to estimate the expenses you paid on your account during this period.
Hypothetical Example for Comparison Purposes
The second section of the table shown, “Hypothetical 5% Return,” provides information about hypothetical account values and hypothetical expenses based on the Fund’s actual expense ratio and an assumed rate of return of 5% per year before expenses, which is not the Fund’s actual return. The hypothetical account values and expenses may not be used to estimate the actual ending account balance or expenses you paid for the period. You may use this information to compare the ongoing costs of investing in the Fund and other funds. To do so, compare this 5% hypothetical example with the 5% hypothetical examples that appear in the shareholder reports of the other funds.
Please note that the expenses shown in the table are meant to highlight your ongoing costs only and do not reflect any transactional costs, such as sales charges (loads), redemption fees, or exchange fees. Therefore, the hypothetical lines of the table are useful in comparing ongoing costs only, and will not help you determine the relative total costs of owning different funds. In addition, if these transactional costs were included, your costs would have been higher.
24
| Beginning | Ending | Expenses Paid | ||||||||||||||
| Account | Account | Annualized | During the Six | |||||||||||||
| Value | Value | Expense | Months Ended | |||||||||||||
| July 1, 2004 | December 31, 2004 | Ratio | December 31, 2004* | |||||||||||||
| Actual Fund Return | ||||||||||||||||
| Series H | $ | 1,000.00 | $ | 1,012.40 | 0.71 | % | $ | 3.59 | ||||||||
| Series I | $ | 1,000.00 | 1,010.70 | 0.75 | 3.79 | |||||||||||
| Series J | $ | 1,000.00 | 1,009.50 | 0.75 | 3.81 | |||||||||||
| Series K | $ | 1,000.00 | 1,007.00 | 0.75 | 3.78 | |||||||||||
| Series L | $ | 1,000.00 | 1,004.60 | 0.75 | 3.78 | |||||||||||
| Series M | $ | 1,000.00 | 1,008.30 | 0.75 | 3.79 | |||||||||||
| Series N | $ | 1,000.00 | 1,017.00 | 0.74 | 3.75 | |||||||||||
| Series P | $ | 1,000.00 | 1,017.70 | 0.96 | 4.88 | |||||||||||
| Series Q | $ | 1,000.00 | 1,019.90 | 0.96 | 4.88 | |||||||||||
| Series R | $ | 1,000.00 | 1,026.70 | 0.93 | 4.74 | |||||||||||
| Series S | $ | 1,000.00 | 1,027.10 | 0.96 | 4.89 | |||||||||||
| Series T | $ | 1,000.00 | 1,026.20 | 0.96 | 4.89 | |||||||||||
| Series U | $ | 1,000.00 | 1,034.00 | 0.95 | 4.86 | |||||||||||
| Series V | $ | 1,000.00 | 1,027.60 | 0.96 | 4.89 | |||||||||||
| Hypothetical (5% return before expenses) | ||||||||||||||||
| Series H | $ | 1,000.00 | $ | 1,021.57 | 0.71 | % | $ | 3.61 | ||||||||
| Series I | $ | 1,000.00 | 1,021.37 | 0.75 | 3.81 | |||||||||||
| Series J | $ | 1,000.00 | 1,021.37 | 0.75 | 3.81 | |||||||||||
| Series K | $ | 1,000.00 | 1,021.37 | 0.75 | 3.81 | |||||||||||
| Series L | $ | 1,000.00 | 1,021.37 | 0.75 | 3.81 | |||||||||||
| Series M | $ | 1,000.00 | 1,021.37 | 0.75 | 3.81 | |||||||||||
| Series N | $ | 1,000.00 | 1,021.42 | 0.74 | 3.76 | |||||||||||
| Series P | $ | 1,000.00 | 1,020.31 | 0.96 | 4.88 | |||||||||||
| Series Q | $ | 1,000.00 | 1,020.31 | 0.96 | 4.88 | |||||||||||
| Series R | $ | 1,000.00 | 1,020.46 | 0.93 | 4.72 | |||||||||||
| Series S | $ | 1,000.00 | 1,020.31 | 0.96 | 4.88 | |||||||||||
| Series T | $ | 1,000.00 | 1,020.31 | 0.96 | 4.88 | |||||||||||
| Series U | $ | 1,000.00 | 1,020.36 | 0.95 | 4.82 | |||||||||||
| Series V | $ | 1,000.00 | 1,021.31 | 0.96 | 4.88 | |||||||||||
| * | Expenses are equal to the Fund’s annualized expense ratio multiplied by the average account value over the period, multiplied by 184/366 (to reflect the one-half year period). |
25
The Board of Trustees and Shareholders
We have audited the accompanying statements of assets and liabilities of ING GET Fund — Series H, Series I, Series J, Series K, Series L, Series M, Series N, Series P, Series Q, Series R, Series S, Series T, Series U, and Series V, each a series of ING GET Fund, including the portfolios of investments, as of December 31, 2004, and the related statements of operations for the year then ended, the statements of changes in net assets for each of the years or periods in the two-year period then ended, and the financial highlights for each of the years or periods in the five-year period then ended. These financial statements and financial highlights are the responsibility of management. Our responsibility is to express an opinion on these financial statements and financial highlights based on our audits.
We conducted our audits in accordance with the standards of the Public Company Accounting Oversight Board (United States). Those standards require that we plan and perform the audits to obtain reasonable assurance about whether the financial statements and financial highlights are free of material misstatement. An audit includes examining, on a test basis, evidence supporting the amounts and disclosures in the financial statements. Our procedures included confirmation of securities owned as of December 31, 2004 by correspondence with the custodian and brokers. An audit also includes assessing the accounting principles used and significant estimates made by management, as well as evaluating the overall financial statement presentation. We believe that our audits provide a reasonable basis for our opinion.
In our opinion, the financial statements and financial highlights referred to above present fairly, in all material respects, the financial position of the aforementioned portfolios as of December 31, 2004, the results of their operations, the changes in their net assets, and the financial highlights for the periods specified in the first paragraph above, in conformity with accounting principles generally accepted in the United States of America.
Boston, Massachusetts
26
| ING | ING | ING | ING | ING | ||||||||||||||||||
| GET Fund | GET Fund | GET Fund | GET Fund | GET Fund | ||||||||||||||||||
| Series H | Series I | Series J | Series K | Series L | ||||||||||||||||||
ASSETS: | ||||||||||||||||||||||
| Investments in securities at value* | $ | 100,678,005 | $ | 61,056,143 | $ | 47,251,385 | $ | 56,666,041 | $ | 52,476,351 | ||||||||||||
| Repurchase agreement | 455,000 | 456,000 | 307,000 | 206,000 | 224,000 | |||||||||||||||||
| Cash | 6 | 654 | 344 | 585 | 412 | |||||||||||||||||
| Receivables: | ||||||||||||||||||||||
| Investment securities sold | 558,684 | — | — | — | — | |||||||||||||||||
| Dividends and interest | 15,021 | 5,581 | 3,227 | 1,015 | 1,459 | |||||||||||||||||
| Prepaid expenses | 3,712 | 2,270 | 1,773 | 2,200 | 1,971 | |||||||||||||||||
| Total assets | 101,710,428 | 61,520,648 | 47,563,729 | 56,875,841 | 52,704,193 | |||||||||||||||||
LIABILITIES: | ||||||||||||||||||||||
| Payable to affiliates | 56,803 | 46,538 | 43,630 | 49,184 | 43,456 | |||||||||||||||||
| Payable for trustee fees | 7,126 | 3,852 | 3,195 | 4,463 | 825 | |||||||||||||||||
| Other accrued expenses and liabilities | 44,346 | 34,387 | 36,327 | 38,566 | 31,340 | |||||||||||||||||
| Total liabilities | 108,275 | 84,777 | 83,152 | 92,213 | 75,621 | |||||||||||||||||
NET ASSETS | $ | 101,602,153 | $ | 61,435,871 | $ | 47,480,577 | $ | 56,783,628 | $ | 52,628,572 | ||||||||||||
NET ASSETS WERE COMPRISED OF: | ||||||||||||||||||||||
| Paid-in capital | $ | 106,094,997 | $ | 64,149,663 | $ | 50,675,449 | $ | 58,573,651 | $ | 54,561,361 | ||||||||||||
| Undistributed net investment income | 4,443,400 | 2,503,145 | 1,999,295 | 2,138,832 | 1,757,240 | |||||||||||||||||
| Accumulated net realized loss on investments | (10,557,465 | ) | (6,218,003 | ) | (6,081,463 | ) | (4,587,384 | ) | (4,252,503 | ) | ||||||||||||
| Net unrealized appreciation on investments | 1,621,221 | 1,001,066 | 887,296 | 658,529 | 562,474 | |||||||||||||||||
NET ASSETS | $ | 101,602,153 | $ | 61,435,871 | $ | 47,480,577 | $ | 56,783,628 | $ | 52,628,572 | ||||||||||||
| * Cost of investments in securities | $ | 99,056,784 | $ | 60,055,077 | $ | 46,364,089 | $ | 56,007,512 | $ | 51,913,877 | ||||||||||||
| Net assets | $ | 101,602,153 | $ | 61,435,871 | $ | 47,480,577 | $ | 56,783,628 | $ | 52,628,572 | ||||||||||||
| Shares authorized | unlimited | unlimited | unlimited | unlimited | unlimited | |||||||||||||||||
| Par value | $ | 0.001 | $ | 0.001 | $ | 0.001 | $ | 0.001 | $ | 0.001 | ||||||||||||
| Shares outstanding | 10,451,294 | 6,295,515 | 4,931,128 | 5,752,051 | 5,401,245 | |||||||||||||||||
| Net asset value and redemption price per share | $ | 9.72 | $ | 9.76 | $ | 9.63 | $ | 9.87 | $ | 9.74 | ||||||||||||
27
| ING | ING | ING | ING | ING | ||||||||||||||||||
| GET Fund | GET Fund | GET Fund | GET Fund | GET Fund | ||||||||||||||||||
| Series M | Series N | Series P | Series Q | Series R | ||||||||||||||||||
ASSETS: | ||||||||||||||||||||||
| Investments in securities at value* | $ | 76,544,757 | $ | 80,529,520 | $ | 131,745,634 | $ | 147,574,545 | $ | 145,651,315 | ||||||||||||
| Repurchase agreement | 364,000 | 521,000 | 1,311,000 | 705,000 | 1,226,000 | |||||||||||||||||
| Cash | 332 | 237 | 424 | 486 | 688 | |||||||||||||||||
| Receivables: | ||||||||||||||||||||||
| Investment securities sold | — | — | — | 786,605 | — | |||||||||||||||||
| Dividends and interest | 5,546 | 21,947 | 18,233 | 47,086 | 44,759 | |||||||||||||||||
| Prepaid expenses | 2,862 | 3,032 | 4,964 | 5,492 | 5,314 | |||||||||||||||||
| Total assets | 76,917,497 | 81,075,736 | 133,080,255 | 149,119,214 | 146,928,076 | |||||||||||||||||
LIABILITIES: | ||||||||||||||||||||||
| Payable to affiliates | 44,238 | 45,271 | 103,182 | 114,974 | 113,137 | |||||||||||||||||
| Payable for trustee fees | 5,341 | 3,706 | 7,438 | 4,897 | 3,333 | |||||||||||||||||
| Other accrued expenses and liabilities | 36,936 | 38,058 | 45,764 | 43,585 | 46,021 | |||||||||||||||||
| Total liabilities | 86,515 | 87,035 | 156,384 | 163,456 | 162,491 | |||||||||||||||||
NET ASSETS | $ | 76,830,982 | $ | 80,988,701 | $ | 132,923,871 | $ | 148,955,758 | $ | 146,765,585 | ||||||||||||
NET ASSETS WERE COMPRISED OF: | ||||||||||||||||||||||
| Paid-in capital | $ | 79,039,633 | $ | 79,929,378 | $ | 130,507,986 | $ | 140,617,438 | $ | 134,262,425 | ||||||||||||
| Undistributed net investment income | 3,160,504 | 2,739,100 | 4,388,248 | 5,098,936 | 4,289,267 | |||||||||||||||||
| Accumulated net realized gain (loss) on investments | (7,113,745 | ) | (3,672,007 | ) | (4,926,718 | ) | (2,903,362 | ) | 2,447,265 | |||||||||||||
| Net unrealized appreciation on investments | 1,744,590 | 1,992,230 | 2,954,355 | 6,142,746 | 5,766,628 | |||||||||||||||||
NET ASSETS | $ | 76,830,982 | $ | 80,988,701 | $ | 132,923,871 | $ | 148,955,758 | $ | 146,765,585 | ||||||||||||
| * Cost of investments in securities | $ | 74,800,167 | $ | 78,537,290 | $ | 128,791,279 | $ | 141,431,799 | $ | 139,884,687 | ||||||||||||
| Net assets | $ | 76,830,982 | $ | 80,988,701 | $ | 132,923,871 | $ | 148,955,758 | $ | 146,765,585 | ||||||||||||
| Shares authorized | unlimited | unlimited | unlimited | unlimited | unlimited | |||||||||||||||||
| Par value | $ | 0.001 | $ | 0.001 | $ | 0.001 | $ | 0.001 | $ | 0.001 | ||||||||||||
| Shares outstanding | 7,830,680 | 8,027,250 | 13,196,185 | 14,357,226 | 13,781,795 | |||||||||||||||||
| Net asset value and redemption price per share | $ | 9.81 | $ | 10.09 | $ | 10.07 | $ | 10.37 | $ | 10.65 | ||||||||||||
28
| ING | ING | ING | ING | ||||||||||||||
| GET Fund | GET Fund | GET Fund | GET Fund | ||||||||||||||
| Series S | Series T | Series U | Series V | ||||||||||||||
ASSETS: | |||||||||||||||||
| Investments in securities at value* | $ | 202,678,020 | $ | 163,918,256 | $ | 169,143,711 | $ | 285,024,557 | |||||||||
| Repurchase agreement | 1,563,000 | 1,284,000 | 1,497,000 | 1,904,000 | |||||||||||||
| Cash | 869 | 306 | 105 | 84 | |||||||||||||
| Dividends and interest receivable | 64,761 | 52,153 | 270,361 | 58,975 | |||||||||||||
| Prepaid expenses | 7,576 | 6,023 | 6,144 | 10,942 | |||||||||||||
| Total assets | 204,314,226 | 165,260,738 | 170,917,321 | 286,998,558 | |||||||||||||
LIABILITIES: | |||||||||||||||||
| Payable to affiliates | 157,472 | 127,682 | 131,341 | 222,500 | |||||||||||||
| Payable for trustee fees | 6,752 | 4,939 | 2,323 | 1,274 | |||||||||||||
| Other accrued expenses and liabilities | 58,254 | 43,563 | 39,457 | 68,759 | |||||||||||||
| Total liabilities | 222,478 | 176,184 | 173,121 | 292,533 | |||||||||||||
NET ASSETS | $ | 204,091,748 | $ | 165,084,554 | $ | 170,744,200 | $ | 286,706,025 | |||||||||
NET ASSETS WERE COMPRISED OF: | |||||||||||||||||
| Paid-in capital | $ | 189,353,868 | $ | 152,052,331 | $ | 156,370,170 | $ | 289,684,881 | |||||||||
| Undistributed net investment income | 4,605,686 | 3,984,944 | 3,406,372 | 4,943,082 | |||||||||||||
| Accumulated net realized gain (loss) on investments | 4,660,145 | 4,680,908 | 7,524,517 | (2,297,912 | ) | ||||||||||||
| Net unrealized appreciation (depreciation) on investments | 5,472,049 | 4,366,371 | 3,443,141 | (5,624,026 | ) | ||||||||||||
NET ASSETS | $ | 204,091,748 | $ | 165,084,554 | $ | 170,744,200 | $ | 286,706,025 | |||||||||
| * Cost of investments in securities | $ | 197,205,971 | $ | 159,551,885 | $ | 165,700,570 | $ | 290,648,593 | |||||||||
| Net assets | $ | 204,091,748 | $ | 165,084,554 | $ | 170,744,200 | $ | 286,706,025 | |||||||||
| Shares authorized | unlimited | unlimited | unlimited | unlimited | |||||||||||||
| Par value | $ | 0.001 | $ | 0.001 | $ | 0.001 | $ | 0.001 | |||||||||
| Shares outstanding | 19,491,344 | 15,745,940 | 16,392,536 | 28,692,895 | |||||||||||||
| Net asset value and redemption price per share | $ | 10.47 | $ | 10.48 | $ | 10.42 | $ | 9.99 | |||||||||
29
| ING | ING | ING | ING | ING | |||||||||||||||||
| GET Fund | GET Fund | GET Fund | GET Fund | GET Fund | |||||||||||||||||
| Series H | Series I | Series J | Series K | Series L | |||||||||||||||||
INVESTMENT INCOME: | |||||||||||||||||||||
| Dividends | $ | 223,545 | $ | 83,264 | $ | 47,886 | $ | 15,019 | $ | 48,374 | |||||||||||
| Interest | 5,015,657 | 2,930,624 | 2,350,984 | 2,610,741 | 2,151,282 | ||||||||||||||||
| Total investment income | 5,239,202 | 3,013,888 | 2,398,870 | 2,625,760 | 2,199,656 | ||||||||||||||||
EXPENSES: | |||||||||||||||||||||
| Investment management fees | 669,630 | 407,414 | 318,156 | 388,359 | 352,808 | ||||||||||||||||
| Transfer agent fees | 537 | 479 | 670 | 470 | 520 | ||||||||||||||||
| Administrative service fees | 61,382 | 37,346 | 29,164 | 35,599 | 32,340 | ||||||||||||||||
| Shareholder reporting expense | 9,443 | 4,846 | 2,850 | 5,124 | 3,186 | ||||||||||||||||
| Professional fees | 16,006 | 5,792 | 5,197 | 6,634 | 6,341 | ||||||||||||||||
| Custody and accounting expense | 19,783 | 13,391 | 12,326 | 13,941 | 8,915 | ||||||||||||||||
| Trustee fees | 10,065 | 5,819 | 4,397 | 5,472 | 2,444 | ||||||||||||||||
| Miscellaneous expense | 7,032 | 4,722 | 4,415 | 4,906 | 3,114 | ||||||||||||||||
| Total expenses | 793,878 | 479,809 | 377,175 | 460,505 | 409,668 | ||||||||||||||||
| Recouped fees | — | 29,270 | 21,000 | 25,000 | 31,000 | ||||||||||||||||
| Net expenses | 793,878 | 509,079 | 398,175 | 485,505 | 440,668 | ||||||||||||||||
| Net investment income | 4,445,324 | 2,504,809 | 2,000,695 | 2,140,255 | 1,758,988 | ||||||||||||||||
REALIZED AND UNREALIZED GAIN (LOSS) ON INVESTMENTS: | |||||||||||||||||||||
| Net realized gain on investments | 1,222,929 | 837,786 | 454,856 | 570,261 | 1,374,615 | ||||||||||||||||
| Net change in unrealized appreciation or depreciation on investments | (3,880,178 | ) | (2,554,223 | ) | (1,889,775 | ) | (2,272,760 | ) | (2,711,700 | ) | |||||||||||
| Net realized and unrealized loss on investments | (2,657,249 | ) | (1,716,437 | ) | (1,434,919 | ) | (1,702,499 | ) | (1,337,085 | ) | |||||||||||
Net increase in net assets resulting from operations | $ | 1,788,075 | $ | 788,372 | $ | 565,776 | $ | 437,756 | $ | 421,903 | |||||||||||
30
| ING | ING | ING | ING | ING | |||||||||||||||||
| GET Fund | Get Fund | GET Fund | GET Fund | GET Fund | |||||||||||||||||
| Series M | Series N | Series P | Series Q | Series R | |||||||||||||||||
INVESTMENT INCOME: | |||||||||||||||||||||
| Dividends | $ | 122,303 | $ | 234,223 | $ | 319,072 | $ | 541,730 | $ | 725,546 | |||||||||||
| Interest | 3,672,709 | 3,171,322 | 5,485,690 | 6,108,809 | 5,063,118 | ||||||||||||||||
| Total investment income | 3,795,012 | 3,405,545 | 5,804,762 | 6,650,539 | 5,788,664 | ||||||||||||||||
EXPENSES: | |||||||||||||||||||||
| Investment management fees | 507,882 | 539,727 | 886,140 | 970,707 | 947,200 | ||||||||||||||||
| Distribution and service fees | — | — | 369,226 | 404,462 | 394,668 | ||||||||||||||||
| Transfer agent fees | 487 | 524 | 563 | 524 | 551 | ||||||||||||||||
| Administrative service fees | 46,555 | 49,474 | 81,228 | 88,980 | 86,825 | ||||||||||||||||
| Shareholder reporting expense | 5,375 | 6,546 | 13,176 | 12,540 | 10,712 | ||||||||||||||||
| Registration fees | — | — | — | 4,428 | 4,257 | ||||||||||||||||
| Professional fees | 9,973 | 11,428 | 19,314 | 22,832 | 11,298 | ||||||||||||||||
| Custody and accounting expense | 17,773 | 16,549 | 25,657 | 26,006 | 18,872 | ||||||||||||||||
| Trustee fees | 7,070 | 5,813 | 10,423 | 9,864 | 6,550 | ||||||||||||||||
| Miscellaneous expense | 5,185 | 4,878 | 9,033 | 8,981 | 9,076 | ||||||||||||||||
| Total expenses | 600,300 | 634,939 | 1,414,760 | 1,549,324 | 1,490,009 | ||||||||||||||||
| Recouped fees | 32,493 | 29,258 | — | — | — | ||||||||||||||||
| Net expenses | 632,793 | 664,197 | 1,414,760 | 1,549,324 | 1,490,009 | ||||||||||||||||
| Net investment income | 3,162,219 | 2,741,348 | 4,390,002 | 5,101,215 | 4,298,655 | ||||||||||||||||
REALIZED AND UNREALIZED GAIN (LOSS) ON INVESTMENTS: | |||||||||||||||||||||
| Net realized gain on investments | 1,856,222 | 1,915,022 | 3,548,291 | 4,174,953 | 4,346,271 | ||||||||||||||||
| Net change in unrealized appreciation or depreciation on investments | (4,247,118 | ) | (3,193,310 | ) | (5,728,395 | ) | (6,245,109 | ) | (4,455,894 | ) | |||||||||||
| Net realized and unrealized loss on investments | (2,390,896 | ) | (1,278,288 | ) | (2,180,104 | ) | (2,070,156 | ) | (109,623 | ) | |||||||||||
Net increase in net assets resulting from operations | $ | 771,323 | $ | 1,463,060 | $ | 2,209,898 | $ | 3,031,059 | $ | 4,189,032 | |||||||||||
31
| ING | ING | ING | ING | ||||||||||||||
| GET Fund | GET Fund | GET Fund | GET Fund | ||||||||||||||
| Series S | Series T | Series U | Series V | ||||||||||||||
INVESTMENT INCOME: | |||||||||||||||||
| Dividends | $ | 1,038,387 | $ | 866,735 | $ | 1,192,984 | $ | 1,051,300 | |||||||||
| Interest | 5,706,424 | 4,821,345 | 3,956,895 | 7,045,867 | |||||||||||||
| Total investment income | 6,744,811 | 5,688,080 | 5,149,879 | 8,097,167 | |||||||||||||
EXPENSES: | |||||||||||||||||
| Investment management fees | 1,334,541 | 1,062,628 | 1,090,706 | 1,972,316 | |||||||||||||
| Distribution and service fees | 556,060 | 442,763 | 454,462 | 821,707 | |||||||||||||
| Transfer agent fees | 66 | 141 | 641 | 1,647 | |||||||||||||
| Administrative service fees | 122,331 | 97,406 | 99,980 | 180,772 | |||||||||||||
| Shareholder reporting expense | 16,888 | 12,078 | 8,418 | 27,435 | |||||||||||||
| Registration fees | 6,682 | 5,507 | — | 210 | |||||||||||||
| Professional fees | 32,159 | 20,731 | 26,511 | 55,725 | |||||||||||||
| Custody and accounting expense | 31,260 | 28,370 | 30,390 | 44,680 | |||||||||||||
| Trustee fees | 16,104 | 12,261 | 10,248 | 18,342 | |||||||||||||
| Offering expense and organization costs | — | — | 2,958 | 6,738 | |||||||||||||
| Miscellaneous expense | 13,488 | 10,641 | 10,884 | 20,020 | |||||||||||||
| Net expenses | 2,129,579 | 1,692,526 | 1,735,198 | 3,149,592 | |||||||||||||
| Net investment income | 4,615,232 | 3,995,554 | 3,414,681 | 4,947,575 | |||||||||||||
REALIZED AND UNREALIZED GAIN (LOSS) ON INVESTMENTS AND FOREIGN CURRENCY RELATED TRANSACTIONS: | |||||||||||||||||
| Net realized gain on investments | 5,630,946 | 4,977,076 | 7,604,280 | 1,975,911 | |||||||||||||
| Net change in unrealized appreciation or depreciation on: | |||||||||||||||||
| Investments | (4,322,190 | ) | (4,372,106 | ) | (5,106,221 | ) | 1,396,383 | ||||||||||
| Foreign currency related transactions | — | — | — | 10 | |||||||||||||
| Net change in unrealized appreciation or depreciation on investments and foreign currency related transactions | (4,322,190 | ) | (4,372,106 | ) | (5,106,221 | ) | 1,396,393 | ||||||||||
| Net realized and unrealized gain on investments and foreign currency related transactions | 1,308,756 | 604,970 | 2,498,059 | 3,372,304 | |||||||||||||
Net increase in net assets resulting from operations | $ | 5,923,988 | $ | 4,600,524 | $ | 5,912,740 | $ | 8,319,879 | |||||||||
32
| ING GET Fund Series H | ING GET Fund Series I | |||||||||||||||
| Year Ended | Year Ended | Year Ended | Year Ended | |||||||||||||
| December 31, | December 31, | December 31, | December 31, | |||||||||||||
| 2004 | 2003 | 2004 | 2003 | |||||||||||||
FROM OPERATIONS: | ||||||||||||||||
| Net investment income | $ | 4,445,324 | $ | 5,233,823 | $ | 2,504,809 | $ | 2,822,652 | ||||||||
| Net realized gain on investments | 1,222,929 | 549,366 | 837,786 | 321,203 | ||||||||||||
| Net change in unrealized appreciation or depreciation on investments | (3,880,178 | ) | (1,484,545 | ) | (2,554,223 | ) | (714,688 | ) | ||||||||
| Net increase in net assets resulting from operations | 1,788,075 | 4,298,644 | 788,372 | 2,429,167 | ||||||||||||
FROM DISTRIBUTIONS TO SHAREHOLDERS: | ||||||||||||||||
| Net investment income | (5,231,638 | ) | (5,631,397 | ) | (2,821,163 | ) | (2,773,357 | ) | ||||||||
| Total distributions | (5,231,638 | ) | (5,631,397 | ) | (2,821,163 | ) | (2,773,357 | ) | ||||||||
FROM CAPITAL SHARE TRANSACTIONS: | ||||||||||||||||
| Dividends reinvested | 5,231,638 | 5,631,397 | 2,821,163 | 2,773,357 | ||||||||||||
| Cost of shares redeemed | (26,728,191 | ) | (24,798,342 | ) | (15,171,484 | ) | (11,910,674 | ) | ||||||||
| Net decrease in net assets resulting from capital share transactions | (21,496,553 | ) | (19,166,945 | ) | (12,350,321 | ) | (9,137,317 | ) | ||||||||
| Net decrease in net assets | (24,940,116 | ) | (20,499,698 | ) | (14,383,112 | ) | (9,481,507 | ) | ||||||||
NET ASSETS: | ||||||||||||||||
| Beginning of year | 126,542,269 | 147,041,967 | 75,818,983 | 85,300,490 | ||||||||||||
| End of year | $ | 101,602,153 | $ | 126,542,269 | $ | 61,435,871 | $ | 75,818,983 | ||||||||
| Undistributed net investment income at end of year | $ | 4,443,400 | $ | 5,230,179 | $ | 2,503,145 | $ | 2,819,670 | ||||||||
33
| ING GET Fund Series J | ING GET Fund Series K | |||||||||||||||
| Year Ended | Year Ended | Year Ended | Year Ended | |||||||||||||
| December 31, | December 31, | December 31, | December 31, | |||||||||||||
| 2004 | 2003 | 2004 | 2003 | |||||||||||||
FROM OPERATIONS: | ||||||||||||||||
| Net investment income | $ | 2,000,695 | $ | 2,358,468 | $ | 2,140,255 | $ | 2,324,594 | ||||||||
| Net realized gain on investments | 454,856 | 553,854 | 570,261 | 378,097 | ||||||||||||
| Net change in unrealized appreciation or depreciation on investments | (1,889,775 | ) | (1,203,694 | ) | (2,272,760 | ) | (889,477 | ) | ||||||||
| Net increase in net assets resulting from operations | 565,776 | 1,708,628 | 437,756 | 1,813,214 | ||||||||||||
FROM DISTRIBUTIONS TO SHAREHOLDERS: | ||||||||||||||||
| Net investment income | (2,357,441 | ) | (2,419,393 | ) | (2,323,685 | ) | (2,487,886 | ) | ||||||||
| Total distributions | (2,357,441 | ) | (2,419,393 | ) | (2,323,685 | ) | (2,487,886 | ) | ||||||||
FROM CAPITAL SHARE TRANSACTIONS: | ||||||||||||||||
| Dividends reinvested | 2,357,441 | 2,419,393 | 2,323,685 | 2,487,886 | ||||||||||||
| Cost of shares redeemed | (13,534,834 | ) | (13,525,186 | ) | (15,885,574 | ) | (12,897,089 | ) | ||||||||
| Net decrease in net assets resulting from capital share transactions | (11,177,393 | ) | (11,105,793 | ) | (13,561,889 | ) | (10,409,203 | ) | ||||||||
| Net decrease in net assets | (12,969,058 | ) | (11,816,558 | ) | (15,447,818 | ) | (11,083,875 | ) | ||||||||
NET ASSETS: | ||||||||||||||||
| Beginning of year | 60,449,635 | 72,266,193 | 72,231,446 | 83,315,321 | ||||||||||||
| End of year | $ | 47,480,577 | $ | 60,449,635 | $ | 56,783,628 | $ | 72,231,446 | ||||||||
| Undistributed net investment income at end of year | $ | 1,999,295 | $ | 2,356,141 | $ | 2,138,832 | $ | 2,322,295 | ||||||||
34
| ING GET Fund Series L | ING GET Fund Series M | |||||||||||||||
| Year Ended | Year Ended | Year Ended | Year Ended | |||||||||||||
| December 31, | December 31, | December 31, | December 31, | |||||||||||||
| 2004 | 2003 | 2004 | 2003 | |||||||||||||
FROM OPERATIONS: | ||||||||||||||||
| Net investment income | $ | 1,758,988 | $ | 2,406,609 | $ | 3,162,219 | $ | 3,724,668 | ||||||||
| Net realized gain (loss) on investments | 1,374,615 | 719,917 | 1,856,222 | 1,499,838 | ||||||||||||
| Net change in unrealized appreciation or depreciation on investments | (2,711,700 | ) | (662,527 | ) | (4,247,118 | ) | (1,244,693 | ) | ||||||||
| Net increase in net assets resulting from operations | 421,903 | 2,463,999 | 771,323 | 3,979,813 | ||||||||||||
FROM DISTRIBUTIONS TO SHAREHOLDERS: | ||||||||||||||||
| Net investment income | (2,405,744 | ) | (2,511,486 | ) | (3,723,446 | ) | (3,720,631 | ) | ||||||||
| Total distributions | (2,405,744 | ) | (2,511,486 | ) | (3,723,446 | ) | (3,720,631 | ) | ||||||||
FROM CAPITAL SHARE TRANSACTIONS: | ||||||||||||||||
| Dividends reinvested | 2,405,744 | 2,511,486 | 3,723,446 | 3,720,631 | ||||||||||||
| Cost of shares redeemed | (15,696,441 | ) | (10,993,465 | ) | (18,774,905 | ) | (24,571,950 | ) | ||||||||
| Net decrease in net assets resulting from capital share transactions | (13,290,697 | ) | (8,481,979 | ) | (15,051,459 | ) | (20,851,319 | ) | ||||||||
| Net decrease in net assets | (15,274,538 | ) | (8,529,466 | ) | (18,003,582 | ) | (20,592,137 | ) | ||||||||
NET ASSETS: | ||||||||||||||||
| Beginning of year | 67,903,110 | 76,432,576 | 94,834,564 | 115,426,701 | ||||||||||||
| End of year | $ | 52,628,572 | $ | 67,903,110 | $ | 76,830,982 | $ | 94,834,564 | ||||||||
| Undistributed net investment income at end of year | $ | 1,757,240 | $ | 2,404,167 | $ | 3,160,504 | $ | 3,722,129 | ||||||||
35
| ING Get Fund Series N | ING Get Fund Series P | |||||||||||||||
| Year Ended | Year Ended | Year Ended | Year Ended | |||||||||||||
| December 31, | December 31, | December 31, | December 31, | |||||||||||||
| 2004 | 2003 | 2004 | 2003 | |||||||||||||
FROM OPERATIONS: | ||||||||||||||||
| Net investment income | $ | 2,741,348 | $ | 3,110,420 | $ | 4,390,002 | $ | 5,411,075 | ||||||||
| Net realized gain on investments | 1,915,022 | 1,193,154 | 3,548,291 | 4,611,533 | ||||||||||||
| Net change in unrealized appreciation or depreciation on investments | (3,193,310 | ) | 453,190 | (5,728,395 | ) | (2,246,641 | ) | |||||||||
| Net increase in net assets resulting from operations | 1,463,060 | 4,756,764 | 2,209,898 | 7,775,967 | ||||||||||||
FROM DISTRIBUTIONS TO SHAREHOLDERS: | ||||||||||||||||
| Net investment income | (3,108,483 | ) | (2,920,441 | ) | (5,406,227 | ) | (4,996,497 | ) | ||||||||
| Total distributions | (3,108,483 | ) | (2,920,441 | ) | (5,406,227 | ) | (4,996,497 | ) | ||||||||
FROM CAPITAL SHARE TRANSACTIONS: | ||||||||||||||||
| Dividends reinvested | 3,108,483 | 2,920,441 | 5,406,227 | 4,996,497 | ||||||||||||
| Cost of shares redeemed | (20,658,266 | ) | (23,387,448 | ) | (37,526,523 | ) | (58,200,729 | ) | ||||||||
| Net decrease in net assets resulting from capital share transactions | (17,549,783 | ) | (20,467,007 | ) | (32,120,296 | ) | (53,204,232 | ) | ||||||||
| Net decrease in net assets | (19,195,206 | ) | (18,630,684 | ) | (35,316,625 | ) | (50,424,762 | ) | ||||||||
NET ASSETS: | ||||||||||||||||
| Beginning of year | 100,183,907 | 118,814,591 | 168,240,496 | 218,665,258 | ||||||||||||
| End of year | $ | 80,988,701 | $ | 100,183,907 | $ | 132,923,871 | $ | 168,240,496 | ||||||||
| Undistributed net investment income at end of year | $ | 2,739,100 | $ | 3,106,879 | $ | 4,388,248 | $ | 5,405,294 | ||||||||
36
| ING GET Fund Series Q | ING GET Fund Series R | |||||||||||||||
| Year Ended | Year Ended | Year Ended | Year Ended | |||||||||||||
| December 31, | December 31, | December 31, | December 31, | |||||||||||||
| 2004 | 2003 | 2004 | 2003 | |||||||||||||
FROM OPERATIONS: | ||||||||||||||||
| Net investment income | $ | 5,101,215 | $ | 5,807,160 | $ | 4,298,655 | $ | 5,047,803 | ||||||||
| Net realized gain on investments | 4,174,953 | 4,450,637 | 4,346,271 | 3,744,764 | ||||||||||||
| Net change in unrealized appreciation or depreciation on investments | (6,245,109 | ) | 505,835 | (4,455,894 | ) | 2,867,814 | ||||||||||
| Net increase in net assets resulting from operations | 3,031,059 | 10,763,632 | 4,189,032 | 11,660,381 | ||||||||||||
FROM DISTRIBUTIONS TO SHAREHOLDERS: | ||||||||||||||||
| Net investment income | (5,804,349 | ) | (3,911 | ) | (5,052,323 | ) | (27,218 | ) | ||||||||
| Total distributions | (5,804,349 | ) | (3,911 | ) | (5,052,323 | ) | (27,218 | ) | ||||||||
FROM CAPITAL SHARE TRANSACTIONS: | ||||||||||||||||
| Dividends reinvested | 5,804,349 | 3,911 | 5,052,323 | 27,218 | ||||||||||||
| Cost of shares redeemed | (34,099,980 | ) | (59,658,973 | ) | (30,479,231 | ) | (52,683,043 | ) | ||||||||
| Net decrease in net assets resulting from capital share transactions | (28,295,631 | ) | (59,655,062 | ) | (25,426,908 | ) | (52,655,825 | ) | ||||||||
| Net decrease in net assets | (31,068,921 | ) | (48,895,341 | ) | (26,290,199 | ) | (41,022,662 | ) | ||||||||
NET ASSETS: | ||||||||||||||||
| Beginning of year | 180,024,679 | 228,920,020 | 173,055,784 | 214,078,446 | ||||||||||||
| End of year | $ | 148,955,758 | $ | 180,024,679 | $ | 146,765,585 | $ | 173,055,784 | ||||||||
| Undistributed net investment income at end of year | $ | 5,098,936 | $ | 5,803,437 | $ | 4,289,267 | $ | 5,044,605 | ||||||||
37
| ING GET Fund Series S | ING GET Fund Series T | |||||||||||||||
| Year Ended | Year Ended | Year Ended | Year Ended | |||||||||||||
| December 31, | December 31, | December 31, | December 31, | |||||||||||||
| 2004 | 2003 | 2004 | 2003 | |||||||||||||
FROM OPERATIONS: | ||||||||||||||||
| Net investment income | $ | 4,615,232 | $ | 5,958,196 | $ | 3,995,554 | $ | 4,972,256 | ||||||||
| Net realized gain on investments | 5,630,946 | 3,829,598 | 4,977,076 | 2,806,431 | ||||||||||||
| Net change in unrealized appreciation or depreciation on investments | (4,322,190 | ) | 6,961,470 | (4,372,106 | ) | 6,078,921 | ||||||||||
| Net increase in net assets resulting from operations | 5,923,988 | 16,749,264 | 4,600,524 | 13,857,608 | ||||||||||||
FROM DISTRIBUTIONS TO SHAREHOLDERS: | ||||||||||||||||
| Net investment income | (5,950,093 | ) | (276,982 | ) | (4,981,310 | ) | (314,206 | ) | ||||||||
| Net realized gains | (3,429,111 | ) | — | (2,938,404 | ) | — | ||||||||||
| Total distributions | (9,379,204 | ) | (276,982 | ) | (7,919,714 | ) | (314,206 | ) | ||||||||
FROM CAPITAL SHARE TRANSACTIONS: | ||||||||||||||||
| Dividends reinvested | 9,379,204 | 276,982 | 7,919,714 | 314,206 | ||||||||||||
| Cost of shares redeemed | (52,124,639 | ) | (91,498,065 | ) | (34,479,696 | ) | (96,328,093 | ) | ||||||||
| Net decrease in net assets resulting from capital share transactions | (42,745,435 | ) | (91,221,083 | ) | (26,559,982 | ) | (96,013,887 | ) | ||||||||
| Net decrease in net assets | (46,200,651 | ) | (74,748,801 | ) | (29,879,172 | ) | (82,470,485 | ) | ||||||||
NET ASSETS: | ||||||||||||||||
| Beginning of year | 250,292,399 | 325,041,200 | 194,963,726 | 277,434,211 | ||||||||||||
| End of year | $ | 204,091,748 | $ | 250,292,399 | $ | 165,084,554 | $ | 194,963,726 | ||||||||
| Undistributed net investment income at end of year | $ | 4,605,686 | $ | 5,943,110 | $ | 3,984,944 | $ | 4,972,858 | ||||||||
38
| ING GET Fund Series U | ING GET Fund Series V | |||||||||||||||
| Year Ended | Year Ended | Year Ended | March 13, 2003(1) | |||||||||||||
| December 31, | December 31, | December 31, | to December 31, | |||||||||||||
| 2004 | 2003 | 2004 | 2003 | |||||||||||||
FROM OPERATIONS: | ||||||||||||||||
| Net investment income | $ | 3,414,681 | $ | 3,464,311 | $ | 4,947,575 | $ | 3,434,389 | ||||||||
| Net realized gain (loss) on investments | 7,604,280 | 7,580,562 | 1,975,911 | (4,278,210 | ) | |||||||||||
| Net change in unrealized appreciation or depreciation on investments | (5,106,221 | ) | 8,549,194 | 1,396,393 | (7,020,419 | ) | ||||||||||
| Net increase (decrease) in net assets resulting from operations | 5,912,740 | 19,594,067 | 8,319,879 | (7,864,240 | ) | |||||||||||
FROM DISTRIBUTIONS TO SHAREHOLDERS: | ||||||||||||||||
| Net investment income | (3,520,352 | ) | (2,156 | ) | (3,464,926 | ) | — | |||||||||
| Net realized gains | (7,666,840 | ) | — | — | — | |||||||||||
| Total distributions | (11,187,192 | ) | (2,156 | ) | (3,464,926 | ) | — | |||||||||
FROM CAPITAL SHARE TRANSACTIONS: | ||||||||||||||||
| Net proceeds from sale of shares | — | 302,850,826 | — | 470,446,442 | ||||||||||||
| Dividends reinvested | 11,187,192 | 2,156 | 3,464,926 | — | ||||||||||||
| 11,187,192 | 302,852,982 | 3,464,926 | 470,446,442 | |||||||||||||
| Cost of shares redeemed | (34,267,953 | ) | (124,895,637 | ) | (122,698,741 | ) | (61,497,315 | ) | ||||||||
| Net increase (decrease) in net assets resulting from capital share transactions | (23,080,761 | ) | 177,957,345 | (119,233,815 | ) | 408,949,127 | ||||||||||
| Net increase (decrease) in net assets | (28,355,213 | ) | 197,549,256 | (114,378,862 | ) | 401,084,887 | ||||||||||
NET ASSETS: | ||||||||||||||||
| Beginning of period | 199,099,413 | 1,550,157 | 401,084,887 | — | ||||||||||||
| End of period | $ | 170,744,200 | $ | 199,099,413 | $ | 286,706,025 | $ | 401,084,887 | ||||||||
| Undistributed net investment income at end of period | $ | 3,406,372 | $ | 3,512,059 | $ | 4,943,082 | $ | 3,463,062 | ||||||||
| (1) | Commencement of operations. |
39
Selected data for a share of beneficial interest outstanding throughout each period.
| Year Ended December 31, | ||||||||||||||||||||||
| 2004 | 2003 | 2002 | 2001 | 2000 | ||||||||||||||||||
Per Share Operating Performance: | ||||||||||||||||||||||
| Net asset value, beginning of period | $ | 10.04 | 10.14 | 10.04 | 10.02 | 10.03 | ||||||||||||||||
| Income (loss) from investment operations: | ||||||||||||||||||||||
| Net investment income | $ | 0.39 | * | 0.44 | 0.41 | 0.35 | 0.20 | |||||||||||||||
| Net realized and unrealized gain (loss) on investments | $ | (0.23 | ) | (0.12 | ) | 0.05 | (0.28 | ) | (0.01 | ) | ||||||||||||
| Total from investment operations | $ | 0.16 | 0.32 | 0.46 | 0.07 | 0.19 | ||||||||||||||||
| Less distributions from: | ||||||||||||||||||||||
| Net investment income | $ | 0.48 | 0.42 | 0.36 | 0.03 | 0.18 | ||||||||||||||||
| Net realized gains on investments | $ | — | — | — | 0.02 | 0.02 | ||||||||||||||||
| Total distributions | $ | 0.48 | 0.42 | 0.36 | 0.05 | 0.20 | ||||||||||||||||
| Net asset value, end of period | $ | 9.72 | 10.04 | 10.14 | 10.04 | 10.02 | ||||||||||||||||
| Total Return(1): | % | 1.64 | 3.16 | 4.77 | 0.68 | 0.89 | ** | |||||||||||||||
Ratios and Supplemental Data: | ||||||||||||||||||||||
| Net assets, end of period (000’s) | $ | 101,602 | 126,542 | 147,042 | 160,239 | 173,271 | ||||||||||||||||
| Ratios to average net assets: | ||||||||||||||||||||||
| Net expenses after expense reimbursement(2)(3) | % | 0.71 | 0.73 | 0.74 | 0.72 | 0.70 | ||||||||||||||||
| Gross expenses prior to expense reimbursement(2) | % | 0.71 | 0.73 | 0.74 | 0.72 | 0.72 | ||||||||||||||||
| Net investment income after expense reimbursement (2)(3) | % | 3.98 | 3.77 | 3.67 | 3.35 | 2.37 | ||||||||||||||||
| Portfolio turnover rate | % | 6 | 13 | 69 | 71 | 163 | ||||||||||||||||
(1) Total return is calculated assuming reinvestment of all dividends and capital gain distribution at net asset value and does not reflect the effect of insurance contract charges. Total return for periods less than one year is not annualized.
(2) Annualized for periods less than one year.
(3) The Adviser has agreed to limit expenses (excluding interest, taxes, brokerage and extraordinary expenses) subject to possible recoupment by ING Investments, LLC within three years.
| * | Per share data calculated using weighted average number of shares outstanding throughout the period. |
| ** | Total return calculation began on March 15, 2000, the first day of the Guarantee Period. Total return for year ended December 31, 2000 was 1.90%. |
40
Selected data for a share of beneficial interest outstanding throughout each period.
| March 15, | ||||||||||||||||||||||
| Year Ended December 31, | 2000(1) to | |||||||||||||||||||||
| December 31, | ||||||||||||||||||||||
| 2004 | 2003 | 2002 | 2001 | 2000 | ||||||||||||||||||
Per Share Operating Performance: | ||||||||||||||||||||||
| Net asset value, beginning of period | $ | 10.07 | 10.11 | 9.95 | 9.86 | 10.00 | ||||||||||||||||
| Income (loss) from investment operations: | ||||||||||||||||||||||
| Net investment income | $ | 0.45 | 0.40 | 0.34 | 0.37 | 0.15 | ||||||||||||||||
| Net realized and unrealized gain (loss) on investments | $ | (0.34 | ) | (0.09 | ) | 0.18 | (0.26 | ) | (0.16 | ) | ||||||||||||
| Total from investment operations | $ | 0.11 | 0.31 | 0.52 | 0.11 | (0.01 | ) | |||||||||||||||
| Less distributions from: | ||||||||||||||||||||||
| Net investment income | $ | 0.42 | 0.35 | 0.36 | 0.02 | 0.13 | ||||||||||||||||
| Total distributions | $ | 0.42 | 0.35 | 0.36 | 0.02 | 0.13 | ||||||||||||||||
| Net asset value, end of period | $ | 9.76 | 10.07 | 10.11 | 9.95 | 9.86 | ||||||||||||||||
| Total Return(2): | % | 1.17 | 3.14 | 5.35 | 1.17 | (1.15 | )* | |||||||||||||||
Ratios and Supplemental Data: | ||||||||||||||||||||||
| Net assets, end of period (000’s) | $ | 61,436 | 75,819 | 85,300 | 88,660 | 94,336 | ||||||||||||||||
| Ratios to average net assets: | ||||||||||||||||||||||
| Net expenses after expense reimbursement/recoupment (3)(4) | % | 0.75 | 0.75 | 0.75 | 0.75 | 0.73 | ||||||||||||||||
| Gross expenses prior to expense reimbursement/recoupment(3) | % | 0.71 | 0.75 | 0.78 | 0.75 | 0.76 | ||||||||||||||||
| Net investment income after expense reimbursement/recoupment(3)(4) | % | 3.69 | 3.49 | 3.20 | 3.38 | 2.64 | ||||||||||||||||
| Portfolio turnover rate | % | 11 | 4 | 58 | 103 | 70 | ||||||||||||||||
(1) Commencement of operations.
(2) Total return is calculated assuming reinvestment of all dividends and capital gain distribution at net asset value and does not reflect the effect of insurance contract charges. Total return for periods less than one year is not annualized.
(3) Annualized for periods less than one year.
(4) The Adviser has agreed to limit expenses (excluding interest, taxes, brokerage and extraordinary expenses) subject to possible recoupment by ING Investments, LLC within three years.
| * | Total return calculation began on June 15, 2000, the first day of the Guarantee Period. Total return from commencement of operations was (0.14%). |
41
Selected data for a share of beneficial interest outstanding throughout each period.
| June 15, | ||||||||||||||||||||||
| Year Ended December 31, | 2000(1) to | |||||||||||||||||||||
| December 31, | ||||||||||||||||||||||
| 2004 | 2003 | 2002 | 2001 | 2000 | ||||||||||||||||||
Per Share Operating Performance: | ||||||||||||||||||||||
| Net asset (loss) value, beginning of period | $ | 9.98 | 10.08 | 9.85 | 9.74 | 10.00 | ||||||||||||||||
| Income from investment operations: | ||||||||||||||||||||||
| Net investment income | $ | 0.47 | 0.42 | 0.35 | 0.35 | 0.09 | ||||||||||||||||
| Net realized and unrealized gain (loss) on investments | $ | (0.37 | ) | (0.15 | ) | 0.23 | (0.22 | ) | (0.28 | ) | ||||||||||||
| Total from investment operations | $ | 0.10 | 0.27 | 0.58 | 0.13 | (0.19 | ) | |||||||||||||||
| Less distributions from: | ||||||||||||||||||||||
| Net investment income | $ | 0.45 | 0.37 | 0.35 | 0.02 | 0.07 | ||||||||||||||||
| Total distributions | $ | 0.45 | 0.37 | 0.35 | 0.02 | 0.07 | ||||||||||||||||
| Net asset value, end of period | $ | 9.63 | 9.98 | 10.08 | 9.85 | 9.74 | ||||||||||||||||
| Total Return(2): | % | 1.05 | 2.66 | 6.07 | 1.31 | (3.24 | )* | |||||||||||||||
Ratios and Supplemental Data: | ||||||||||||||||||||||
| Net assets, end of period (000’s) | $ | 47,481 | 60,450 | 72,266 | 75,182 | 80,341 | ||||||||||||||||
| Ratios to average net assets: | ||||||||||||||||||||||
| Net expenses after expense reimbursement(3)(4) | % | 0.75 | 0.75 | 0.75 | 0.75 | 0.72 | ||||||||||||||||
| Gross expenses prior to expense reimbursement(3) | % | 0.71 | 0.78 | 0.81 | 0.76 | 0.81 | ||||||||||||||||
| Net investment income after expense reimbursement (3)(4) | % | 3.77 | 3.51 | 3.30 | 3.34 | 2.97 | ||||||||||||||||
| Portfolio turnover rate | % | 29 | 5 | 42 | 97 | 35 | ||||||||||||||||
(1) Commencement of operations.
(2) Total return is calculated assuming reinvestment of all dividends and capital gain distribution at net asset value and does not reflect the effect of insurance contract charges. Total return for periods less than one year is not annualized.
(3) Annualized for periods less than one year.
(4) The Adviser has agreed to limit expenses (excluding interest, taxes, brokerage and extraordinary expenses) subject to possible recoupment by ING Investments, LLC within three years.
| * | Total return calculation began on September 14, 2000, the first day of the Guarantee Period. Total return from commencement of operations was (1.89%). |
42
Selected data for a share of beneficial interest outstanding throughout each period.
| September 14, | ||||||||||||||||||||||
| Year Ended December 31, | 2000(1) to | |||||||||||||||||||||
| December 31, | ||||||||||||||||||||||
| 2004 | 2003 | 2002 | 2001 | 2000 | ||||||||||||||||||
Per Share Operating Performance: | ||||||||||||||||||||||
| Net asset value, beginning of period | $ | 10.18 | 10.27 | 9.98 | 10.06 | 10.00 | ||||||||||||||||
| Income (loss) from investment operations: | ||||||||||||||||||||||
| Net investment income | $ | 0.41 | 0.35 | 0.32 | 0.26 | 0.02 | ||||||||||||||||
| Net realized and unrealized gain (loss) on investments | $ | (0.35 | ) | (0.11 | ) | 0.24 | (0.34 | ) | 0.06 | |||||||||||||
| Total from investment operations | $ | 0.06 | 0.24 | 0.56 | (0.08 | ) | 0.08 | |||||||||||||||
| Less distributions from: | ||||||||||||||||||||||
| Net investment income | $ | 0.37 | 0.33 | 0.27 | — | 0.02 | ||||||||||||||||
| Total distributions | $ | 0.37 | 0.33 | 0.27 | — | 0.02 | ||||||||||||||||
| Net asset value, end of period | $ | 9.87 | 10.18 | 10.27 | 9.98 | 10.06 | ||||||||||||||||
| Total Return(2): | % | 0.60 | 2.37 | 5.73 | (0.79 | ) | (0.85 | )* | ||||||||||||||
Ratios and Supplemental Data: | ||||||||||||||||||||||
| Net assets, end of period (000’s) | $ | 56,784 | 72,231 | 83,315 | 90,817 | 96,608 | ||||||||||||||||
| Ratios to average net assets: | ||||||||||||||||||||||
| Net expenses after expense reimbursement(3)(4) | % | 0.75 | 0.75 | 0.74 | 0.75 | 0.68 | ||||||||||||||||
| Gross expenses prior to expense reimbursement(3) | % | 0.71 | 0.77 | 0.78 | 0.75 | 1.01 | ||||||||||||||||
| Net investment income after expense reimbursement (3)(4) | % | 3.31 | 2.98 | 2.82 | 2.50 | 3.15 | ||||||||||||||||
| Portfolio turnover rate | % | 8 | 1 | 131 | 106 | 9 | ||||||||||||||||
(1) Commencement of operations.
(2) Total return is calculated assuming reinvestment of all dividends and capital gain distribution at net asset value and does not reflect the effect of insurance contract charges. Total return for periods less than one year is not annualized.
(3) Annualized for periods less than one year.
(4) The Adviser has agreed to limit expenses (excluding interest, taxes, brokerage and extraordinary expenses) subject to possible recoupment by ING Investments, LLC within three years.
| * | Total return calculation began on December 14, 2000, the first day of the Guarantee Period. Total return from commencement of operations was 0.79%. |
43
Selected data for a share of beneficial interest outstanding throughout each period.
| December 14, | ||||||||||||||||||||||
| Year Ended December 31, | 2000(1) to | |||||||||||||||||||||
| December 31, | ||||||||||||||||||||||
| 2004 | 2003 | 2002 | 2001 | 2000 | ||||||||||||||||||
Per Share Operating Performance: | ||||||||||||||||||||||
| Net asset value, beginning of period | $ | 10.11 | 10.12 | 9.86 | 10.01 | 10.00 | ||||||||||||||||
| Income (loss) from investment operations: | ||||||||||||||||||||||
| Net investment income | $ | 0.39 | 0.39 | 0.33 | 0.24 | 0.03 | ||||||||||||||||
| Net realized and unrealized loss on investments | $ | (0.33 | ) | (0.04 | ) | (0.07 | ) | (0.15 | ) | — | ||||||||||||
| Total from investment operations | $ | 0.06 | 0.35 | 0.26 | 0.09 | 0.03 | ||||||||||||||||
| Less distributions from: | ||||||||||||||||||||||
| Net investment income | $ | 0.43 | 0.36 | 0.00 | (5) | 0.24 | 0.02 | |||||||||||||||
| Total distributions | $ | 0.43 | 0.36 | 0.00 | (5) | 0.24 | 0.02 | |||||||||||||||
| Net asset value, end of period | $ | 9.74 | 10.11 | 10.12 | 9.86 | 10.01 | ||||||||||||||||
| Total Return(2): | % | 0.56 | 3.47 | 2.69 | (0.14 | )* | — | † | ||||||||||||||
Ratios and Supplemental Data: | ||||||||||||||||||||||
| Net assets, end of period (000’s) | $ | 52,629 | 67,903 | 76,433 | 81,636 | 1,203 | ||||||||||||||||
| Ratios to average net assets: | ||||||||||||||||||||||
| Net expenses after expense reimbursement(3)(4) | % | 0.75 | 0.75 | 0.75 | 0.74 | 0.08 | ||||||||||||||||
| Gross expenses prior to expense reimbursement(3) | % | 0.70 | 0.76 | 0.81 | 0.76 | 5.94 | ||||||||||||||||
| Net investment income after expense reimbursement (3)(4) | % | 2.99 | 3.32 | 3.20 | 2.80 | 1.17 | ||||||||||||||||
| Portfolio turnover rate | % | 25 | 13 | 91 | 126 | — | ||||||||||||||||
(1) Commencement of operations.
(2) Total return is calculated assuming reinvestment of all dividends and capital gain distribution at net asset value and does not reflect the effect of insurance contract charges. Total return for periods less than one year is not annualized.
(3) Annualized for periods less than one year.
(4) The Adviser has agreed to limit expenses (excluding interest, taxes, brokerage and extraordinary expenses) subject to possible recoupment by ING Investments, LLC within three years.
(5) Amount is less than $0.01 per share.
| † | As of December 31, 2000, the Series was in its Offering Period. Total return from commencement of operations was 0.30%. |
| * | Total return calculation began on March 15, 2001, the first day of the Guarantee Period. Total return for year ended December 31, 2001 was 0.86%. |
44
Selected data for a share of beneficial interest outstanding throughout each period.
| March 15, | ||||||||||||||||||
| Year Ended December 31, | 2001(1) to | |||||||||||||||||
| December 31, | ||||||||||||||||||
| 2004 | 2003 | 2002 | 2001 | |||||||||||||||
Per Share Operating Performance: | ||||||||||||||||||
| Net asset value, beginning of period | $ | 10.18 | 10.16 | 9.81 | 10.00 | |||||||||||||
| Income (loss) from investment operations: | ||||||||||||||||||
| Net investment income | $ | 0.45 | 0.44 | 0.33 | 0.16 | |||||||||||||
| Net realized and unrealized gain (loss) on investments | $ | (0.37 | ) | (0.05 | ) | 0.02 | (0.19 | ) | ||||||||||
| Total from investment operations | $ | 0.08 | 0.39 | 0.35 | (0.03 | ) | ||||||||||||
| Less distributions from: | ||||||||||||||||||
| Net investment income | $ | 0.45 | 0.37 | 0.00 | (5) | 0.16 | ||||||||||||
| Total distributions | $ | 0.45 | 0.37 | 0.00 | (5) | 0.16 | ||||||||||||
| Net asset value, end of period | $ | 9.81 | 10.18 | 10.16 | 9.81 | |||||||||||||
| Total Return(2): | % | 0.83 | 3.85 | 3.60 | (1.24 | )* | ||||||||||||
Ratios and Supplemental Data: | ||||||||||||||||||
| Net assets, end of period (000’s) | $ | 76,831 | 94,835 | 115,427 | 123,103 | |||||||||||||
| Ratios to average net assets: | ||||||||||||||||||
| Net expenses after expense reimbursement/recoupment (3)(4) | % | 0.75 | 0.74 | 0.74 | 0.72 | |||||||||||||
| Gross expenses prior to expense reimbursement/recoupment(3) | % | 0.71 | 0.74 | 0.77 | 0.73 | |||||||||||||
| Net investment income after expense reimbursement/recoupment(3)(4) | % | 3.74 | 3.51 | 3.14 | 2.95 | |||||||||||||
| Portfolio turnover rate | % | 19 | 5 | 65 | 55 | |||||||||||||
(1) Commencement of operations.
(2) Total return is calculated assuming reinvestment of all dividends and capital gain distribution at net asset value and does not reflect the effect of insurance contract charges. Total return for periods less than one year is not annualized.
(3) Annualized for periods less than one year.
(4) The Adviser has agreed to limit expenses (excluding interest, taxes, brokerage and extraordinary expenses) subject to possible recoupment by ING Investments, LLC within three years.
(5) Amount is less than $0.01 per share.
| * | Total return calculation began on June 14, 2001, the first day of the Guarantee Period. Total return from commencement of operations was (0.25%). |
45
Selected data for a share of beneficial interest outstanding throughout each period.
| June 14, | ||||||||||||||||||
| Year Ended December 31, | 2001(1) to | |||||||||||||||||
| December 31, | ||||||||||||||||||
| 2004 | 2003 | 2002 | 2001 | |||||||||||||||
Per Share Operating Performance: | ||||||||||||||||||
| Net asset value, beginning of period | $ | 10.28 | 10.12 | 10.30 | 10.00 | |||||||||||||
| Income (loss) from investment operations: | ||||||||||||||||||
| Net investment income | $ | 0.38 | 0.34 | 0.25 | 0.07 | |||||||||||||
| Net realized and unrealized gain (loss) on investments | $ | (0.21 | ) | 0.09 | (0.29 | ) | 0.31 | |||||||||||
| Total from investment operations | $ | 0.17 | 0.43 | (0.04 | ) | 0.38 | ||||||||||||
| Less distributions from: | ||||||||||||||||||
| Net investment income | $ | 0.36 | 0.27 | 0.00 | (5) | 0.07 | ||||||||||||
| Net realized gains on investments | $ | — | — | 0.14 | 0.01 | |||||||||||||
| Total distributions | $ | 0.36 | 0.27 | 0.14 | 0.08 | |||||||||||||
| Net asset value, end of period | $ | 10.09 | 10.28 | 10.12 | 10.30 | |||||||||||||
| Total Return(2): | % | 1.70 | 4.30 | (0.37 | ) | 2.82 | * | |||||||||||
Ratios and Supplemental Data: | ||||||||||||||||||
| Net assets, end of period (000’s) | $ | 80,989 | 100,184 | 118,815 | 135,532 | |||||||||||||
| Ratios to average net assets: | ||||||||||||||||||
| Net expenses after expense reimbursement/recoupment (3)(4) | % | 0.74 | 0.74 | 0.75 | 0.72 | |||||||||||||
| Gross expenses prior to expense reimbursement/recoupment(3) | % | 0.71 | 0.74 | 0.77 | 0.73 | |||||||||||||
| Net investment income after expense reimbursement/recoupment(3)(4) | % | 3.05 | 2.80 | 2.36 | 2.11 | |||||||||||||
| Portfolio turnover rate | % | 22 | 12 | 124 | 48 | |||||||||||||
(1) Commencement of operations.
(2) Total return is calculated assuming reinvestment of all dividends and capital gain distribution at net asset value and does not reflect the effect of insurance contract charges. Total return for periods less than one year is not annualized.
(3) Annualized for periods less than one year.
(4) The Adviser has agreed to limit expenses (excluding interest, taxes, brokerage and extraordinary expenses) subject to possible recoupment by ING Investments, LLC within three years.
(5) Amount is less than $0.01 per share.
| * | Total return calculation began on September 18, 2001, the first day of the Guarantee Period. Total return from commencement of operations was 3.75%. |
46
Selected data for a share of beneficial interest outstanding throughout each period.
| September 18, | ||||||||||||||||||
| Year Ended December 31, | 2001(1) to | |||||||||||||||||
| December 31, | ||||||||||||||||||
| 2004 | 2003 | 2002 | 2001 | |||||||||||||||
Per Share Operating Performance: | ||||||||||||||||||
| Net asset value, beginning of period | $ | 10.31 | 10.18 | 10.06 | 10.00 | |||||||||||||
| Income (loss) from investment operations: | ||||||||||||||||||
| Net investment income | $ | 0.39 | 0.37 | 0.23 | 0.01 | |||||||||||||
| Net realized and unrealized gain (loss) on investments | $ | (0.24 | ) | 0.03 | (0.10 | ) | 0.06 | |||||||||||
| Total from investment operations | $ | 0.15 | 0.40 | 0.13 | 0.07 | |||||||||||||
| Less distributions from: | ||||||||||||||||||
| Net investment income | $ | 0.39 | 0.27 | 0.00 | (5) | 0.01 | ||||||||||||
| Net realized gains on investments | $ | — | — | 0.00 | (5) | — | ||||||||||||
| Total distributions | $ | 0.39 | 0.27 | 0.01 | 0.01 | |||||||||||||
| Net asset value, end of period | $ | 10.07 | 10.31 | 10.18 | 10.06 | |||||||||||||
| Total Return(2): | % | 1.48 | 3.91 | 1.27 | 0.26 | * | ||||||||||||
Ratios and Supplemental Data: | ||||||||||||||||||
| Net assets, end of period (000’s) | $ | 132,924 | 168,240 | 218,665 | 236,096 | |||||||||||||
| Ratios to average net assets: | ||||||||||||||||||
| Net expenses after expense reimbursement(3)(4) | % | 0.96 | 0.97 | 0.98 | 0.88 | |||||||||||||
| Gross expenses prior to expense reimbursement(3) | % | 0.96 | 0.97 | 0.98 | 0.98 | |||||||||||||
| Net investment income after expense reimbursement (3)(4) | % | 2.97 | 2.75 | 2.21 | 1.51 | |||||||||||||
| Portfolio turnover rate | % | 40 | 25 | 123 | 2 | |||||||||||||
(1) Commencement of operations.
(2) Total return is calculated assuming reinvestment of all dividends and capital gain distribution at net asset value and does not reflect the effect of insurance contract charges. Total return for periods less than one year is not annualized.
(3) Annualized for periods less than one year.
(4) The Adviser has agreed to limit expenses (excluding interest, taxes, brokerage and extraordinary expenses) subject to possible recoupment by ING Investments, LLC within three years.
(5) Amount is less than $0.01 per share.
| * | Total return calculation began on December 13, 2001, the first day of the Guarantee Period. Total return from commencement of operations was 0.66%. |
47
Selected data for a share of beneficial interest outstanding throughout each period.
| December 13, | ||||||||||||||||||
| Year Ended December 31, | 2001(1) to | |||||||||||||||||
| December 31, | ||||||||||||||||||
| 2004 | 2003 | 2002 | 2001 | |||||||||||||||
Per Share Operating Performance: | ||||||||||||||||||
| Net asset value, beginning of period | $ | 10.56 | 10.04 | 10.01 | 10.00 | |||||||||||||
| Income (loss) from investment operations: | ||||||||||||||||||
| Net investment income | $ | 0.40 | 0.34 | 0.20 | 0.01 | |||||||||||||
| Net realized and unrealized gain on investments | $ | (0.21 | ) | 0.18 | 0.03 | — | ||||||||||||
| Total from investment operations | $ | 0.19 | 0.52 | 0.23 | 0.01 | |||||||||||||
| Less distributions from: | ||||||||||||||||||
| Net investment income | $ | 0.38 | — | 0.20 | — | |||||||||||||
| Total distributions | $ | 0.38 | — | 0.20 | — | |||||||||||||
| Net asset value, end of period | $ | 10.37 | 10.56 | 10.04 | 10.01 | |||||||||||||
| Total Return(2): | % | 1.89 | 5.18 | 2.11 | * | — | † | |||||||||||
Ratios and Supplemental Data: | ||||||||||||||||||
| Net assets, end of period (000’s) | $ | 148,956 | 180,025 | 228,920 | 7,767 | |||||||||||||
| Ratios to average net assets: | ||||||||||||||||||
| Net expenses after expense reimbursement(3)(4) | % | 0.96 | 0.97 | 0.97 | 0.82 | |||||||||||||
| Gross expenses prior to expense reimbursement(3) | % | 0.96 | 0.97 | 0.98 | 7.74 | |||||||||||||
| Net investment income after expense reimbursement (3)(4) | % | 3.15 | 2.82 | 2.37 | 0.90 | |||||||||||||
| Portfolio turnover rate | % | 26 | 15 | 95 | — | |||||||||||||
(1) Commencement of operations.
(2) Total return is calculated assuming reinvestment of all dividends and capital gain distribution at net asset value and does not reflect the effect of insurance contract charges. Total return for periods less than one year is not annualized.
(3) Annualized for periods less than one year.
(4) The Adviser has agreed to limit expenses (excluding interest, taxes, brokerage and extraordinary expenses) subject to possible recoupment by ING Investments, LLC within three years.
| † | As of December 31, 2001, the Series was in its Offering Period. Total return from commencement of operations was 0.10%. |
| * | Total return calculation began on March 15, 2002, the first day of the Guarantee Period. Total return for year ended December 31, 2002 was 2.31%. |
48
Selected data for a share of beneficial interest outstanding throughout each period.
| Year Ended | March 15, | |||||||||||||
| December 31, | 2002(1) to | |||||||||||||
| December 31, | ||||||||||||||
| 2004 | 2003 | 2002 | ||||||||||||
Per Share Operating Performance: | ||||||||||||||
| Net asset value, beginning of period | $ | 10.71 | 10.10 | 10.00 | ||||||||||
| Income (loss) from investment operations: | ||||||||||||||
| Net investment income | $ | 0.35 | 0.31 | 0.15 | ||||||||||
| Net realized and unrealized gain on investments | $ | (0.06 | ) | 0.30 | 0.10 | |||||||||
| Total from investment operations | $ | 0.29 | 0.61 | 0.25 | ||||||||||
| Less distributions from: | ||||||||||||||
| Net investment income | $ | 0.35 | — | 0.15 | ||||||||||
| Total distributions | $ | 0.35 | — | 0.15 | ||||||||||
| Net asset value, end of period | $ | 10.65 | 10.71 | 10.10 | ||||||||||
| Total Return(2): | % | 2.77 | 6.05 | 2.17 | * | |||||||||
Ratios and Supplemental Data: | ||||||||||||||
| Net assets, end of period (000’s) | $ | 146,766 | 173,056 | 214,078 | ||||||||||
| Ratios to average net assets: | ||||||||||||||
| Net expenses after expense reimbursement/recoupment(3)(4) | % | 0.94 | 1.00 | 0.99 | ||||||||||
| Gross expenses prior to expense reimbursement/recoupment(3) | % | 0.94 | 0.98 | 1.02 | ||||||||||
| Net investment income after expense reimbursement/recoupment (3)(4) | % | 2.72 | 2.59 | 2.57 | ||||||||||
| Portfolio turnover rate | % | 45 | 17 | 76 | ||||||||||
(1) Commencement of operations.
(2) Total return is calculated assuming reinvestment of all dividends and capital gain distribution at net asset value and does not reflect the effect of insurance contract charges. Total return for periods less than one year is not annualized.
(3) Annualized for periods less than one year.
(4) The Adviser has agreed to limit expenses (excluding interest, taxes, brokerage and extraordinary expenses) subject to possible recoupment by ING Investments, LLC within three years.
| * | Total return calculation began on June 14, 2002, the first day of the Guarantee Period. Total return from commencement of operations was 2.47%. |
49
Selected data for a share of beneficial interest outstanding throughout each period.
| Year Ended | June 17, | |||||||||||||
| December 31, | 2002(1) to | |||||||||||||
| December 31, | ||||||||||||||
| 2004 | 2003 | 2002 | ||||||||||||
Per Share Operating Performance: | ||||||||||||||
| Net asset value, beginning of period | $ | 10.65 | 10.07 | 10.00 | ||||||||||
| Income (loss) from investment operations: | ||||||||||||||
| Net investment income | $ | 0.22 | * | 0.25 | 0.07 | |||||||||
| Net realized and unrealized gain (loss) on investments | $ | 0.06 | 0.34 | 0.06 | ||||||||||
| Total from investment operations | $ | 0.28 | 0.59 | 0.13 | ||||||||||
| Less distributions from: | ||||||||||||||
| Net investment income | $ | 0.29 | 0.01 | 0.06 | ||||||||||
| Net realized gains from investments | $ | 0.17 | — | — | ||||||||||
| Total distributions | $ | 0.46 | 0.01 | 0.06 | ||||||||||
| Net asset value, end of period | $ | 10.47 | 10.65 | 10.07 | ||||||||||
| Total Return(2): | % | 2.71 | 5.86 | 1.15 | ** | |||||||||
Ratios and Supplemental Data: | ||||||||||||||
| Net assets, end of period (000’s) | $ | 204,092 | 250,292 | 325,041 | ||||||||||
| Ratios to average net assets: | ||||||||||||||
| Expenses(3) | % | 0.96 | 0.97 | 0.97 | ||||||||||
| Net investment income(3) | % | 2.07 | 2.04 | 2.01 | ||||||||||
| Portfolio turnover rate | % | 18 | 13 | 60 | ||||||||||
(1) Commencement of operations.
(2) Total return is calculated assuming reinvestment of all dividends and capital gain distribution at net asset value and does not reflect the effect of insurance contract charges. Total return for periods less than one year is not annualized.
(3) Annualized for periods less than one year.
| * | Per share data calculated using weighted average number of shares outstanding throughout the period. |
| ** | Total return calculation began on September 12, 2002, the first day of the Guarantee Period. Total return from commencement of operations was 1.35%. |
50
Selected data for a share of beneficial interest outstanding throughout each period.
| Year Ended | September 12, | |||||||||||||
| December 31, | 2002(1) to | |||||||||||||
| December 31, | ||||||||||||||
| 2004 | 2003 | 2002 | ||||||||||||
Per Share Operating Performance: | ||||||||||||||
| Net asset value, beginning of period | $ | 10.70 | 10.12 | 10.00 | ||||||||||
| Income (loss) from investment operations: | ||||||||||||||
| Net investment income | $ | 0.24 | * | 0.28 | 0.01 | |||||||||
| Net realized and unrealized gain (loss) on investments | $ | 0.03 | 0.32 | 0.11 | ||||||||||
| Total from investment operations | $ | 0.27 | 0.60 | 0.12 | ||||||||||
| Less distributions from: | ||||||||||||||
| Net investment income | $ | 0.31 | 0.02 | 0.00(5 | ) | |||||||||
| Net realized gains from investments | $ | 0.18 | — | — | ||||||||||
| Total distributions | $ | 0.49 | 0.02 | 0.00(5 | ) | |||||||||
| Net asset value, end of period | $ | 10.48 | 10.70 | 10.12 | ||||||||||
| Total Return(2): | % | 2.62 | 5.88 | 1.21 | ** | |||||||||
Ratios and Supplemental Data: | ||||||||||||||
| Net assets, end of period (000’s) | $ | 165,085 | 194,964 | 277,434 | ||||||||||
| Ratios to average net assets: | ||||||||||||||
| Net expenses after expense reimbursement/recoupment(3)(4) | % | 0.96 | 0.98 | 0.96 | ||||||||||
| Gross expenses prior to expense reimbursement/recoupment(3) | % | 0.96 | 0.98 | 1.07 | ||||||||||
| Net investment income after expense reimbursement/recoupment (3)(4) | % | 2.26 | 2.14 | 1.91 | ||||||||||
| Portfolio turnover rate | % | 36 | 24 | 4 | ||||||||||
(1) Commencement of operations.
(2) Total return is calculated assuming reinvestment of all dividends and capital gain distribution at net asset value and does not reflect the effect of insurance contract charges. Total return for periods less than one year is not annualized.
(3) Annualized for periods less than one year.
(4) The Adviser has agreed to limit expenses (excluding interest, taxes, brokerage and extraordinary expenses) subject to possible recoupment by ING Investments, LLC within three years.
| (5) | Amount is less than $0.01 per share. |
| * | Per share data calculated using weighted average number of shares outstanding throughout the period. |
| ** | Total return calculation began on December 12, 2002, the first day of the Guarantee Period. Total return from commencement of operations was 1.21%. |
51
Selected data for a share of beneficial interest outstanding throughout each period.
| Year Ended | December 12, | |||||||||||||
| December 31, | 2002(1) to | |||||||||||||
| December 31, | ||||||||||||||
| 2004 | 2003 | 2002 | ||||||||||||
Per Share Operating Performance: | ||||||||||||||
| Net asset value, beginning of period | $ | 10.75 | 10.00 | 10.00 | ||||||||||
| Income (loss) from investment operations: | ||||||||||||||
| Net investment income | $ | 0.23 | 0.18 | 0.00 | * | |||||||||
| Net realized and unrealized gain (loss) on investments | $ | 0.11 | 0.57 | 0.00 | * | |||||||||
| Total from investment operations | $ | 0.34 | 0.75 | 0.00 | * | |||||||||
| Less distributions from: | ||||||||||||||
| Net investment income | $ | 0.21 | — | — | ||||||||||
| Net realized gains from investments | $ | 0.46 | — | — | ||||||||||
| Total distributions | $ | 0.67 | — | — | ||||||||||
| Net asset value, end of period | $ | 10.42 | 10.75 | 10.00 | ||||||||||
| Total Return(2): | % | 3.40 | 7.29 | †† | — | † | ||||||||
Ratios and Supplemental Data: | ||||||||||||||
| Net assets, end of period (000’s) | $ | 170,744 | 199,099 | 1,550 | ||||||||||
| Ratios to average net assets: | ||||||||||||||
| Net expenses after expense reimbursement(3)(4) | % | 0.95 | 0.98 | 0.65 | ||||||||||
| Gross expenses prior to expense reimbursement(3) | % | 0.95 | 0.98 | 17.95 | ||||||||||
| Net investment income after expense reimbursement(3)(4) | % | 1.88 | 1.78 | 0.66 | ||||||||||
| Portfolio turnover rate | % | 59 | 74 | — | ||||||||||
(1) Commencement of operations.
(2) Total return is calculated assuming reinvestment of all dividends and capital gain distribution at net asset value and does not reflect the effect of insurance contract charges. Total return for periods less than one year is not annualized.
(3) Annualized for periods less than one year.
(4) The Adviser has agreed to limit expenses; (excluding interest, taxes, brokerage and extraordinary expenses) subject to possible recoupment by ING Investments, LLC within three years.
| * | Amount represents less than $0.01 per share. |
| † | As of December 31, 2002, the Series was in its Offering Period. Total return from commencement of operations was 0.00%. |
| †† | Total return calculation began on March 13, 2003, the first day of the Guarantee Period. Total return for the entire calendar year was 7.50%. |
52
Selected data for a share of beneficial interest outstanding throughout each period.
| March 13, | ||||||||||
| Year Ended | 2003(1) to | |||||||||
| December 31, | December 31, | |||||||||
| 2004 | 2003 | |||||||||
Per Share Operating Performance: | ||||||||||
| Net asset value, beginning of period | $ | 9.87 | 10.00 | |||||||
| Income from investment operations: | ||||||||||
| Net investment income | $ | 0.19 | 0.08 | |||||||
| Net realized and unrealized loss on investments | $ | 0.04 | (0.21 | ) | ||||||
| Total from investment operations | $ | 0.23 | (0.13 | ) | ||||||
| Less distributions from: | ||||||||||
| Net investment income | $ | 0.11 | — | |||||||
| Total distributions | $ | 0.11 | — | |||||||
| Net asset value, end of period | $ | 9.99 | 9.87 | |||||||
| Total Return(2): | % | 2.34 | (1.50 | )* | ||||||
Ratios and Supplemental Data: | ||||||||||
| Net assets, end of period (000’s) | $ | 286,706 | 401,085 | |||||||
| Ratios to average net assets: | ||||||||||
| Expenses(3) | % | 0.96 | 0.94 | |||||||
| Net investment income(3) | % | 1.50 | 1.39 | |||||||
| Portfolio turnover rate | % | 37 | 29 | |||||||
(1) Commencement of operations.
(2) Total return is calculated assuming reinvestment of all dividends and capital gain distribution at net asset value and does not reflect the effect of insurance contract charges. Total return for periods less than one year is not annualized.
(3) Annualized for periods less than one year.
| * | Total return calculation began on June 13, 2003, the first day of the Guarantee Period. Total return from commencement of operations was -1.30%. |
53
NOTE 1 — ORGANIZATION
Organization. The ING GET Fund is registered under the Investment Company Act of 1940 as an open-end management investment company. It was organized under the laws of Massachusetts as a business trust on March 9, 1987. Currently there are fourteen diversified Series of the Fund, ING GET Fund-Series H (“GET H”), ING GET Fund-Series I (“GET I”), ING GET Fund-Series J (“GET J”), ING GET Fund-Series K (“GET K”), ING GET Fund-Series L (“GET L”), ING GET Fund-Series M (“GET M”), ING GET Fund-Series N (“GET N”), ING GET Fund-Series P (“GET P”), ING GET Fund-Series Q (“GET Q”), ING GET Fund-Series R (“GET R”), ING GET Fund-Series S (“GET S”), ING GET Fund-Series T (“GET T”), ING GET Fund-Series U (“GET U”) and ING GET Fund-Series V (“GET V”).
Each Series seeks to achieve maximum total return by participating in favorable equity market performance without compromising a minimum targeted rate of return (Targeted Return) during a specified five year period (Guarantee Period). If during the Guarantee Period the equity markets experience a major decline, the Series’ assets may become largely or entirely invested in the Fixed Component. Use of the Fixed Component reduces the Series’ ability to participate as fully in upward equity market movements, and therefore represents some loss of opportunity, or opportunity cost, compared to a portfolio that is more heavily invested in equities. The minimum Targeted Return for each Series during the Guarantee Period is 1.5% (except for GET U and GET V, which do not have a Targeted Return) before asset based contract charges and each Series’ cost of operations. Investors are guaranteed by ING Life Insurance & Annuity Company (“ILIAC”, formerly, Aetna Life Insurance & Annuity Company) their initial investment less certain maintenance charges only if an investor had remained in the Series from the beginning of the Guarantee Period to the end of the Guarantee Period. Investors receive a guarantee from ILIAC that on the maturity date they will receive no less than the value of their investment in a GET Series Fund as of the last day of the offering period, adjusted for certain charges. The value of dividends and distributions made by each GET Series Fund throughout the Guarantee Period is taken into account in determining whether, for purposes of the Guarantee, the value of a Shareholder’s investment on the Maturity Date is no less than the value of their investment as of the last day of the Offering Period. Amounts withdrawn prior to the Maturity Date do not get the benefit of the Guarantee. ILIAC does not guarantee that investors will earn the minimum target return.
| Offering | Guarantee | Maturity | ||||||||||
| Period | Period | Date | ||||||||||
| GET H* | 12/15/99 – 03/14/00 | 03/15/00 – 03/14/05 | 03/14/05 | |||||||||
| GET I* | 03/15/00 – 06/14/00 | �� | 06/15/00 – 06/14/05 | 06/14/05 | ||||||||
| GET J* | 06/15/00 – 09/13/00 | 09/14/00 – 09/13/05 | 09/13/05 | |||||||||
| GET K* | 09/14/00 – 12/13/00 | 12/14/00 – 12/13/05 | 12/13/05 | |||||||||
| GET L* | 12/14/00 – 03/14/01 | 03/15/01 – 03/14/06 | 03/14/06 | |||||||||
| GET M* | 03/15/01 – 06/13/01 | 06/14/01 – 06/13/06 | 06/13/06 | |||||||||
| GET N* | 06/14/01 – 09/17/01 | 09/18/01 – 09/15/06 | 09/15/06 | |||||||||
| GET P* | 09/18/01 – 12/12/01 | 12/13/01 – 12/15/06 | 12/15/06 | |||||||||
| GET Q* | 12/13/01 – 03/14/02 | 03/15/02 – 03/16/07 | 03/16/07 | |||||||||
| GET R* | 03/15/02 – 06/13/02 | 06/14/02 – 06/15/07 | 06/15/07 | |||||||||
| GET S* | 06/14/02 – 09/11/02 | 09/12/02 – 09/14/07 | 09/14/07 | |||||||||
| GET T* | 09/12/02 – 12/11/02 | 12/12/02 – 12/14/07 | 12/14/07 | |||||||||
| GET U* | 12/12/02 – 03/12/03 | 03/13/03 – 03/14/08 | 03/14/08 | |||||||||
| GET V* | 03/13/03 – 06/12/03 | 06/13/03 – 06/13/08 | 06/13/08 | |||||||||
| * | Closed to new investors. |
Shares of the Series are offered to insurance company separate accounts that fund both annuity and life insurance contracts and certain tax-qualified retirement plans. At December 31, 2004, separate accounts of ILIAC and its affiliates held all the shares outstanding of each Series.
In accordance with the original fund prospectuses, GET H, GET I, GET J and GET K will liquidate on the Maturity Dates listed above. Accounting rules require that financial statements for entities in liquidation, or for which liquidation appears imminent, be prepared on a liquidation basis of accounting. As the accounting principles generally accepted in the United States of America for investment companies are materially consistent with the liquidation basis of accounting, the financial statements for GET H and GET I have been prepared in conformity with both accounting methods.
NOTE 2 — SIGNIFICANT ACCOUNTING POLICIES
The following significant accounting policies are consistently followed by the Series in the preparation of their financial statements, and such policies are in conformity with accounting principles generally accepted in the United States of America for investment companies.
| A. | Security Valuation. Investments in equity securities traded on a national securities exchange are valued at the last reported sale price. Securities reported by NASDAQ are valued at the NASDAQ official closing prices. Securities traded on an exchange or NASDAQ for which there has been no sale and equity securities traded in the over-the-counter-market are valued at the mean between the last reported |
54
| bid and ask prices. All investments quoted in foreign currencies will be valued daily in U.S. dollars on the basis of the foreign currency exchange rates prevailing at that time. Debt securities are valued at prices obtained from independent services or from one or more dealers making markets in the securities and may be adjusted based on the Fund’s valuation procedures. U.S. Government obligations are valued by using market quotations or independent pricing services that use prices provided by market-makers or estimates of market values obtained from yield data relating to instruments or securities with similar characteristics. | |
| Securities and assets for which market quotations are not readily available (which may include certain restricted securities which are subject to limitations as to their sale) are valued at their fair values as determined in good faith by or under the supervision of the Fund’s Board of Trustees (“Board”), in accordance with methods that are specifically authorized by the Board. Securities traded on exchanges, including foreign exchanges, which close earlier than the time that a Fund calculates its net asset value may also be valued at their fair values as determined in good faith by or under the supervision of a Fund’s Board, in accordance with methods that are specifically authorized by the Board. If a significant event which is likely to impact the value of one or more foreign securities held by a Fund occurs after the time at which the foreign market for such security(ies) closes but before the time that the Fund’s net asset value is calculated on any business day, such event may be taken into account in determining the fair value of such security(ies) at the time the Fund calculates its net asset value. For these purposes, significant events after the close of trading on a foreign market may include, among others, securities trading in the U.S. and other markets, corporate announcements, natural and other disasters, and political and other events. Among other elements of analysis, the Board has authorized the use of one or more research services to assist with the determination of the fair value of foreign securities in light of significant events. Research services use statistical analyses and quantitative models to help determine fair value as of the time a Fund calculates its net asset value. Unlike the closing price of a security on an exchange, fair value determinations employ elements of judgment, and the fair value assigned to a security may not represent the actual value that a Fund could obtain if it were to sell the security at the time of the close of the NYSE. Investments in securities maturing in less than 60 days from the date of valuation are valued at amortized cost, which, when combined with accrued interest, approximates market value. | |
| B. | Security Transactions and Revenue Recognition. Securities transactions are accounted for on the trade date. Realized gains and losses are reported on the basis of identified cost of securities sold. Interest income is recorded on an accrual basis. Dividend income is recorded on the ex-dividend date, or for certain foreign securities, when the information becomes available to the Series. Premium amortization and discount accretion are determined by the effective yield method. Dividend income is recorded on the ex-dividend date. |
| C. | Foreign Currency Translation. The books and records of the Series are maintained in U.S. dollars. Any foreign currency amounts are translated into U.S. dollars on the following basis: |
| (1) | Market value of investment securities, other assets and liabilities — at the exchange rates prevailing at the end of the day. | |
| (2) | Purchases and sales of investment securities, income and expenses — at the rates of exchange prevailing on the respective dates of such transactions. |
| Although the net assets and the market values are presented at the foreign exchange rates at the end of the day, the Series do not isolate the portion of the results of operations resulting from changes in foreign exchange rates on investments from the fluctuations arising from changes in market prices of securities held. Such fluctuations are included with the net realized and unrealized gains or losses from investments. For securities, which are subject to foreign withholding tax upon disposition, liabilities are recorded on the statement of assets and liabilities for the estimated tax withholding |
55
| based on the securities current market value. Upon disposition, realized gains or losses on such securities are recorded net of foreign withholding tax. | |
| Reported net realized foreign exchange gains or losses arise from sales of foreign currencies, currency gains or losses realized between the trade and settlement dates on securities transactions, the difference between the amounts of dividends, interest, and foreign withholding taxes recorded on the Series’ books, and the U.S. dollar equivalent of the amounts actually received or paid. Net unrealized foreign exchange gains and losses arise from changes in the value of assets and liabilities other than investments in securities at fiscal year end, resulting from changes in the exchange rate. Foreign security and currency transactions may involve certain considerations and risks not typically associated with investing in U.S. companies and U.S. Government securities. These risks include, but are not limited to, revaluation of currencies and future adverse political and economic developments which could cause securities and their markets to be less liquid and prices more volatile than those of comparable U.S. companies and U.S. Government securities. | |
| D. | Foreign Currency Transactions and Futures Contracts. Certain series may enter into foreign currency exchange transactions to convert to and from different foreign currencies and to and from the U.S. dollar in connection with the planned purchases or sales of securities. The Series either enter into these transactions on a spot basis at the spot rate prevailing in the foreign currency exchange market or use forward foreign currency contracts to purchase or sell foreign currencies. When the contract is fulfilled or closed, gains or losses are realized. Until then, the gain or loss is included in unrealized appreciation or depreciation. Risks may arise upon entering into forward contracts from the potential inability of counterparties to meet the terms of their forward contracts and from the potential inability of counterparties to meet the terms of their forward contracts and from unanticipated movements in the value of foreign currencies relative to the U.S. dollar. |
| Each Series may enter into futures contracts involving foreign currency, interest rates, securities and securities indices. A futures contract obligates the seller of the contract to deliver and the purchaser of the contract to take delivery of the type of foreign currency, financial instrument or security called for in the contract at a specified future time for a specified price. Upon entering into such a contract, a Series is required to deposit and maintain as collateral such initial margin as required by the exchange on which the contract is traded. Pursuant to the contract, a Series agrees to receive from or pay to the broker an amount equal to the daily fluctuations in the value of the contract. Such receipts or payments are known as variation margins and are recorded as unrealized gains or losses by the Series. When the contract is closed, the Series records a realized gain or loss equal to the difference between the value of the contract at the time it was opened and the value at the time it was closed. | |
| E. | Distributions to Shareholders. The Series records distributions to their shareholders on ex-dividend date. Dividends from net investment income and capital gains, if any, are declared and paid annually by the Series. The Series may make distributions on a more frequent basis to comply with the distribution requirements of the Internal Revenue Code. The characteristics of income and gains to be distributed are determined in accordance with income tax regulations, which may differ from accounting principals generally accepted in the United States of America for investment companies. |
| F. | Federal Income Taxes. It is the policy of the Series to comply with subchapter M of the Internal Revenue Code and related excise tax provisions applicable to regulated investment companies and to distribute substantially all of their net investment income and any net realized capital gains to their shareholders. No federal income tax provision is required. No capital gain distributions shall be made until any capital loss carryforwards have been fully utilized or expired. |
| G. | Use of Estimates. Management of the Series has made certain estimates and assumptions relating to the reporting of assets, liabilities, income, and expenses to prepare these financial statements in conformity with accounting principles generally |
56
| accepted in the United States of America. Actual results could differ from these estimates. | |
| H. | Repurchase Agreements. Each Series may invest in repurchase agreements only with government securities dealers recognized by the Board of Governors of the Federal Reserve System. Under such agreements, the seller of the security agrees to repurchase it at a mutually agreed upon time and price. The resale price is in excess of the purchase price and reflects an agreed upon interest rate for the period of time the agreement is outstanding. The period of the repurchase agreements is usually short, from overnight to one week, while the underlying securities generally have longer maturities. Each Series will receive as collateral cash or securities acceptable to it whose market value is equal to at least 100% of the carrying amount of the repurchase agreements, plus accrued interest, being invested by the Series. The underlying collateral is valued daily on a mark to market basis to assure that the value, including accrued interest is at least equal to the repurchase price. If the seller defaults, a Series might incur a loss or delay in the realization of proceeds if the value of the security collateralizing the repurchase agreement declines, and it might incur disposition costs in liquidating the collateral. |
| I. | Illiquid and Restricted Securities. Each Series may not invest more than 15% of its net assets in illiquid securities. Illiquid securities are not readily marketable. Disposing of illiquid investments may involve time-consuming negotiation and legal expenses, and it may be difficult or impossible for the Series to sell them promptly at an acceptable price. Restricted securities are those sold under Rule 144A of the Securities Act of 1933 (1933 Act) or are securities offered pursuant to Section 4(2) of the 1933 Act, and are subject to legal or contractual restrictions on resale and may not be publicly sold without registration under the 1933 Act. Certain restricted securities may be considered liquid pursuant to guidelines approved by the Board or may be deemed to be illiquid because they may not be readily marketable. Illiquid and restricted securities are valued using market quotations when readily available. |
| J. | Delayed Delivery Transactions. A Series may purchase or sell securities on a when-issued or forward commitment basis. The price of the underlying securities and date when the securities will be delivered and paid for are fixed at the time the transaction is negotiated. The market value of such is identified in the Series’ Portfolio of Investments. Losses may arise due to changes in the market value of the securities or from the inability of counterparties to meet the terms of the contract. In connection with such purchases, the Series are required to hold liquid assets as collateral with the Series’ custodian sufficient to cover the purchase price. |
| K. | Organization Expenses and Offering Costs. Costs incurred with the organization of the Series are expensed as incurred. Costs incurred with the offering of shares of the Series are deferred and amortized over a twelve-month period on a straight-line basis starting at the commencement of Guarantee Period. |
NOTE 3 — INVESTMENT TRANSACTIONS
For the year ended December 31, 2004, the cost of purchases and proceeds from sales of securities, excluding U.S. Government and short-term securities, were as follows:
| Purchases | Sales | |||||||
| GET H | $ | 6,669,103 | $ | 6,111,068 | ||||
| GET I | 2,548,208 | 2,448,777 | ||||||
| GET J | 1,536,819 | 1,468,349 | ||||||
| GET K | 451,192 | 443,088 | ||||||
| GET L | 1,696,623 | 4,073,319 | ||||||
| GET M | 3,876,514 | 7,362,446 | ||||||
| GET N | 7,535,210 | 10,551,091 | ||||||
| GET P | 9,583,269 | 16,126,984 | ||||||
| GET Q | 17,456,548 | 22,351,231 | ||||||
| GET R | 22,596,735 | 34,919,057 | ||||||
| GET S | 32,542,774 | 37,911,493 | ||||||
| GET T | 26,811,061 | 38,643,728 | ||||||
| GET U | 56,103,898 | 64,665,946 | ||||||
| GET V | 33,495,582 | 63,750,834 | ||||||
U.S. Government securities not included above were as follows:
| Purchases | Sales | |||||||
| GET H | $ | — | $ | 36,431,122 | ||||
| GET I | 4,434,480 | 21,567,860 | ||||||
| GET J | 13,983,468 | 28,113,255 | ||||||
| GET K | 4,744,474 | 25,940,081 | ||||||
| GET L | 12,914,472 | 26,627,511 | ||||||
| GET M | 12,496,280 | 27,845,000 | ||||||
| GET N | 12,043,947 | 29,599,280 | ||||||
| GET P | 49,752,666 | 81,468,344 | ||||||
| GET Q | 23,765,825 | 54,518,816 | ||||||
| GET R | 48,521,195 | 67,798,415 | ||||||
| GET S | 8,259,390 | 56,509,258 | ||||||
| GET T | 36,789,316 | 60,096,178 | ||||||
| GET U | 51,045,963 | 77,559,394 | ||||||
| GET V | 88,675,387 | 182,859,073 | ||||||
57
NOTE 4 — INVESTMENT MANAGEMENT AND ADMINISTRATIVE FEES
Each of the Series has entered into an Investment Management Agreement with ING Investments, LLC (The “Investment Manager”). The Investment Management Agreement compensates the Investment Manager with a fee, computed daily and payable monthly, based on the average daily net assets of each Series. The fee for each Series is 0.25% during its Offering Period and 0.60% during its Guarantee Period.
The Investment Manager has engaged ING Investment Management Co., (formerly, Aeltus Investment Management, Inc., “ING IM”, a wholly-owned subsidiary of ING Groep, N.V., to serve as Sub-Adviser to the Series. ING IM is responsible for managing the assets of the Series’ in accordance with their investment objective and policies, subject to oversight by the Investment Manager.
ING Funds Services, LLC (“IFS”) acts as administrator and provides certain administrative and shareholder services necessary for Series’ operations and is responsible for the supervision of other service providers. For its services, IFS is entitled to receive from each Series a fee at an annual rate of 0.055% on the first $5 billion of average daily net assets and 0.030% thereafter.
NOTE 5 — DISTRIBUTION AND SERVICE FEES
GET P, GET Q, GET R, GET S, GET T, GET U and GET V have adopted a distribution Plan pursuant to Rule 12b-1 under the 1940 Act (the “12b-1 Plan”), whereby ING Funds Distributor, LLC (the “Distributor”) is reimbursed or compensated by the Series for expenses incurred in the distribution of each Series’ shares (“Distribution Fees”). Pursuant to the 12b-1 Plan, the Distributor is entitled to a payment each month to reimburse or compensate expenses for the distribution and promotion of each Series’ shares, including expenses incurred in printing prospectuses and reports used for sales purposes, expenses incurred in preparing and printing sales literature and other such distribution related expenses, including any distribution or shareholder servicing fees (“Service Fees”) paid to securities dealers who have executed a distribution agreement with the Distributor. Under the 12b-1 Plan, each Series pays the Distributor a Distribution Fee based on average daily net assets at the following rates:
| GET P | 0.25 | % | ||
| GET Q | 0.25 | % | ||
| GET R | 0.25 | % | ||
| GET S | 0.25 | % | ||
| GET T | 0.25 | % | ||
| GET U | 0.25 | % | ||
| GET V | 0.25 | % |
NOTE 6 — OTHER TRANSACTIONS WITH AFFILIATED AND RELATED PARTIES
At December 31, 2004, the Series had the following amounts recorded in payable to affiliates on the accompanying Statements of Assets and Liabilities (see Notes 4 and 5):
| Accrued | ||||||||||||||||||||
| Accrued | Accrued | Payable to | Shareholder | |||||||||||||||||
| Investment | Administrative | Adviser for | Services and | |||||||||||||||||
| Management | Service | Recouped | Distribution | |||||||||||||||||
| Fees | Fees | Fees | Fees | Total | ||||||||||||||||
| GET H | $ | 52,035 | $ | 4,768 | — | — | $ | 56,803 | ||||||||||||
| GET I | 31,639 | 2,899 | $ | 12,000 | — | 46,538 | ||||||||||||||
| GET J | 24,395 | 2,235 | 17,000 | — | 43,630 | |||||||||||||||
| GET K | 29,483 | 2,701 | 17,000 | — | 49,184 | |||||||||||||||
| GET L | 26,984 | 2,472 | 14,000 | — | 43,456 | |||||||||||||||
| GET M | 39,157 | 3,588 | 1,493 | — | 44,238 | |||||||||||||||
| GET N | 41,471 | 3,800 | — | — | 45,271 | |||||||||||||||
| GET P | 68,410 | 6,268 | — | $ | 28,504 | 103,182 | ||||||||||||||
| GET Q | 76,228 | 6,984 | — | 31,762 | 114,974 | |||||||||||||||
| GET R | 75,010 | 6,873 | — | 31,254 | 113,137 | |||||||||||||||
| GET S | 104,404 | 9,566 | — | 43,502 | 157,472 | |||||||||||||||
| GET T | 84,654 | 7,756 | — | 35,272 | 127,682 | |||||||||||||||
| GET U | 87,079 | 7,979 | — | 36,283 | 131,341 | |||||||||||||||
| GET V | 147,519 | 13,515 | — | 61,466 | 222,500 | |||||||||||||||
The Series have adopted a Deferred Compensation Plan (the “Plan”) which allows eligible non-affiliated Trustees as described in the Plan to defer the receipt of all or a portion of the trustees’ fees payable. The deferred fees are invested in various funds advised by ING Investments, LLC until distribution in accordance with the Plan.
NOTE 7 — OTHER ACCRUED EXPENSES AND LIABILITIES
At December 31, 2004, the Series had the following payables included in Other Accrued Expenses and
58
Liabilities on the Statements of Assets and Liabilities that exceeded 5% of total expenses.
| Custody | Professional | |||||||||||
| Expense | Fees | |||||||||||
| GET H | $ | 10,227 | GET H | $ | 22,653 | |||||||
| GET I | 6,284 | GET I | 18,469 | |||||||||
| GET J | 7,917 | GET J | 19,918 | |||||||||
| GET K | 5,475 | GET K | 20,371 | |||||||||
| GET L | 3,844 | GET L | 22,107 | |||||||||
| GET M | 10,496 | GET M | 16,454 | |||||||||
| GET N | 8,342 | GET N | 19,552 | |||||||||
| GET P | 13,143 | GET P | 17,932 | |||||||||
| GET Q | 11,824 | GET Q | 17,312 | |||||||||
| GET R | 14,909 | GET R | 18,970 | |||||||||
| GET S | 17,755 | GET S | 28,108 | |||||||||
| GET T | 12,583 | GET T | 24,403 | |||||||||
| GET U | 13,997 | GET U | 20,842 | |||||||||
| GET V | 16,238 | GET V | 34,103 | |||||||||
| Shareholder | ||||||||||||
| Reporting | Miscellaneous | |||||||||||
| Expense | Fees | |||||||||||
| GET K | $ | 7,129 | GET H | $ | 6,283 | |||||||
| GET M | 8,540 | GET I | 5,829 | |||||||||
| GET N | 6,428 | GET J | 5,626 | |||||||||
| GET P | 11,388 | |||||||||||
| GET Q | 12,369 | |||||||||||
| GET R | 9,018 | |||||||||||
| GET V | 17,020 | |||||||||||
NOTE 8 — EXPENSE LIMITATIONS
ING Investments, LLC entered into written Expense Limitation Agreements with each Series whereby, the Investment Manager has voluntarily agreed to limit expenses, excluding interest, taxes, brokerage and extraordinary expenses to the levels listed below:
| Maximum Operating Expense Limit | ||||
| (as a percentage of average net assets) | ||||
| GET H | 0.75 | % | ||
| GET I | 0.75 | |||
| GET J | 0.75 | |||
| GET K | 0.75 | |||
GET L(1) | 0.75 | |||
GET M(1) | 0.75 | |||
GET N(1) | 0.75 | |||
GET P(2) | 1.00* | |||
GET Q(2) | 1.00* | |||
GET R(2) | 1.00* | |||
GET S(2) | 1.00* | |||
GET T(2) | 1.00* | |||
GET U(2) | 1.00* | |||
GET V(2) | 1.00* | |||
(1) Effective January 1, 2005, the expense limitation will be 0.55%.
(2) Effective January 1, 2005, the expense limitation will be 0.80%.
| * | Including 0.25% distribution and service fee. |
The Investment Manager may at a later date recoup from a Series for management fees waived and other expenses assumed by the Investment Manager during the previous 36 months, but only if, after such reimbursement, the Series’ expense ratio does not exceed the percentage described above. Waived and reimbursed fees, net of any recoupment by the Investment Manager of such waived and reimbursed fees, are reflected on the accompanying Statements of Operations for each Series. Amounts payable by the Investment Manager are reflected in the Statements of Assets and Liabilities for each Series.
As of December 31, 2004, the cumulative amounts of reimbursed fees that are subject to possible future recoupment by the Investment Manager and their related expiration dates are as follows:
| December 31, | ||||||||||||
| 2005 | 2006 | Total | ||||||||||
| GET J | $ | 18,484 | $ | 22,459 | $ | 40,943 | ||||||
| GET K | — | 12,579 | 12,579 | |||||||||
| GET L | 5,216 | 9,711 | 14,927 | |||||||||
The Expense Limitation Agreements are contractual and shall renew automatically for one-year terms unless ING Investments, LLC provides written notice of the termination of the Expense Limitation Agreements within 90 days of the end of the then current term.
NOTE 9 — LINE OF CREDIT
The Series in addition to certain other funds managed by the Investment Manager, have entered into an unsecured committed revolving line of credit agreement (the “Credit Agreement“) with a syndicate of banks led by Citibank, N.A. for an aggregate amount of $150,000,000. The proceeds may be used to: (1) temporarily finance the purchase and sale of securities; (2) finance the redemption of shares of an investor in the funds; and (3) enable the funds to meet other emergency expenses as defined in the Credit Agreement. The funds to which the line of credit is available pay a commitment fee equal to 0.09% per annum on the daily unused portion of the committed line amount. Each of the Series will pay its pro rata share of both the agent and commitment fee. Generally, borrowings under the Credit Agreement accrue interest at the Federal Funds Rate plus a specified margin. Repayments generally must be made within 30 days after the date of a revolving credit advance. At December 31, the Series did not have any loans outstanding under the line of credit.
59
| NOTE 10 — | CAPITAL SHARES |
Transaction in capital shares and dollars were as follows:
| GET Fund — Series H | GET Fund — Series I | |||||||||||||||
| Year Ended | Year Ended | Year Ended | Year Ended | |||||||||||||
| December 31, | December 31, | December 31, | December 31, | |||||||||||||
| 2004 | 2003 | 2004 | 2003 | |||||||||||||
(Number of Shares) | ||||||||||||||||
| Dividends reinvested | 545,531 | 566,985 | 292,046 | 277,293 | ||||||||||||
| Shares redeemed | (2,701,100 | ) | (2,466,196 | ) | (1,529,396 | ) | (1,178,664 | ) | ||||||||
| Net decrease in shares outstanding | (2,155,569 | ) | (1,899,211 | ) | (1,237,350 | ) | (901,371 | ) | ||||||||
($) | ||||||||||||||||
| Dividends reinvested | $ | 5,231,638 | $ | 5,631,397 | $ | 2,821,163 | $ | 2,773,357 | ||||||||
| Shares redeemed | (26,728,191 | ) | (24,798,342 | ) | (15,171,484 | ) | (11,910,674 | ) | ||||||||
| Net decrease | $ | (21,496,553 | ) | $ | (19,166,945 | ) | $ | (12,350,321 | ) | $ | (9,137,317 | ) | ||||
| GET Fund — Series J | GET Fund — Series K | |||||||||||||||
| Year Ended | Year Ended | Year Ended | Year Ended | |||||||||||||
| December 31, | December 31, | December 31, | December 31, | |||||||||||||
| 2004 | 2003 | 2004 | 2003 | |||||||||||||
(Number of Shares) | ||||||||||||||||
| Dividends reinvested | 247,111 | 243,044 | 236,869 | 244,390 | ||||||||||||
| Shares redeemed | (1,375,933 | ) | (1,349,720 | ) | (1,583,398 | ) | (1,257,581 | ) | ||||||||
| Net decrease in shares outstanding | (1,128,822 | ) | (1,106,676 | ) | (1,346,529 | ) | (1,013,191 | ) | ||||||||
($) | ||||||||||||||||
| Dividends reinvested | $ | 2,357,441 | $ | 2,419,393 | $ | 2,323,685 | $ | 2,487,886 | ||||||||
| Shares redeemed | (13,534,834 | ) | (13,525,186 | ) | (15,885,574 | ) | (12,897,089 | ) | ||||||||
| Net decrease | $ | (11,177,393 | ) | $ | (11,105,793 | ) | $ | (13,561,889 | ) | $ | (10,409,203 | ) | ||||
| * | Exchanges into the Series are from initial shareholders who have exchange privileges. |
| GET Fund — Series L | GET Fund — Series M | |||||||||||||||
| Year Ended | Year Ended | Year Ended | Year Ended | |||||||||||||
| December 31, | December 31, | December 31, | December 31, | |||||||||||||
| 2004 | 2003 | 2004 | 2003 | |||||||||||||
(Number of Shares) | ||||||||||||||||
| Dividends reinvested | 248,015 | 248,908 | 382,677 | 367,367 | ||||||||||||
| Shares redeemed | (1,565,026 | ) | (1,084,117 | ) | (1,871,956 | ) | (2,403,816 | ) | ||||||||
| Net decrease in shares outstanding | (1,317,011 | ) | (835,209 | ) | (1,489,279 | ) | (2,036,449 | ) | ||||||||
($) | ||||||||||||||||
| Dividends reinvested | $ | 2,405,744 | $ | 2,511,486 | $ | 3,723,446 | $ | 3,720,631 | ||||||||
| Shares redeemed | (15,696,441 | ) | (10,993,465 | ) | (18,774,905 | ) | (24,571,950 | ) | ||||||||
| Net decrease | $ | (13,290,697 | ) | $ | (8,481,979 | ) | $ | (15,051,459 | ) | $ | (20,851,319 | ) | ||||
| GET Fund — Series N | GET Fund — Series P | |||||||||||||||
| Year Ended | Year Ended | Year Ended | Year Ended | |||||||||||||
| December 31, | December 31, | December 31, | December 31, | |||||||||||||
| 2004 | 2003 | 2004 | 2003 | |||||||||||||
(Number of Shares) | ||||||||||||||||
| Dividends reinvested | 313,040 | 286,318 | 545,533 | 486,322 | ||||||||||||
| Shares redeemed | (2,028,424 | ) | (2,283,414 | ) | (3,666,906 | ) | (5,658,202 | ) | ||||||||
| Net decrease in shares outstanding | (1,715,384 | ) | (1,997,096 | ) | (3,121,373 | ) | (5,171,880 | ) | ||||||||
($) | ||||||||||||||||
| Dividends reinvested | $ | 3,108,483 | $ | 2,920,441 | $ | 5,406,227 | $ | 4,996,497 | ||||||||
| Shares redeemed | (20,658,266 | ) | (23,387,448 | ) | (37,526,523 | ) | (58,200,729 | ) | ||||||||
| Net decrease | $ | (17,549,783 | ) | $ | (20,467,007 | ) | $ | (32,120,296 | ) | $ | (53,204,232 | ) | ||||
60
| NOTE 10 — | CAPITAL SHARES (continued) |
| GET Fund — Series Q | GET Fund — Series R | |||||||||||||||
| Year Ended | Year Ended | Year Ended | Year Ended | |||||||||||||
| December 31, | December 31, | December 31, | December 31, | |||||||||||||
| 2004 | 2003 | 2004 | 2003 | |||||||||||||
(Number of Shares) | ||||||||||||||||
| Dividends reinvested | 570,172 | 374 | 487,206 | 2,580 | ||||||||||||
| Shares redeemed | (3,253,745 | ) | (5,760,168 | ) | (2,865,529 | ) | (5,042,160 | ) | ||||||||
| Net decrease in shares outstanding | (2,683,573 | ) | (5,759,794 | ) | (2,378,323 | ) | (5,039,580 | ) | ||||||||
($) | ||||||||||||||||
| Dividends reinvested | $ | 5,804,349 | $ | 3,911 | $ | 5,052,323 | $ | 27,218 | ||||||||
| Shares redeemed | (34,099,980 | ) | (59,658,973 | ) | (30,479,231 | ) | (52,683,043 | ) | ||||||||
| Net decrease | $ | (28,295,631 | ) | $ | (59,655,062 | ) | $ | (25,426,908 | ) | $ | (52,655,825 | ) | ||||
| GET Fund — Series S | GET Fund — Series T | |||||||||||||||
| Year Ended | Year Ended | Year Ended | Year Ended | |||||||||||||
| December 31, | December 31, | December 31, | December 31, | |||||||||||||
| 2004 | 2003 | 2004 | 2003 | |||||||||||||
(Number of Shares) | ||||||||||||||||
| Dividends reinvested | 920,432 | 26,347 | 775,682 | 29,797 | ||||||||||||
| Shares redeemed | (4,937,729 | ) | (8,779,953 | ) | (3,246,974 | ) | (9,217,934 | ) | ||||||||
| Net decrease in shares outstanding | (4,017,297 | ) | (8,753,606 | ) | (2,471,292 | ) | (9,188,137 | ) | ||||||||
($) | ||||||||||||||||
| Dividends reinvested | $ | 9,379,204 | $ | 276,982 | $ | 7,919,714 | $ | 314,206 | ||||||||
| Shares redeemed | (52,124,639 | ) | (91,498,065 | ) | (34,479,696 | ) | (96,328,093 | ) | ||||||||
| Net decrease | $ | (42,745,435 | ) | $ | (91,221,083 | ) | $ | (26,559,982 | ) | $ | (96,013,887 | ) | ||||
| GET Fund — Series U | GET Fund — Series V | |||||||||||||||
| March 13, | ||||||||||||||||
| Year Ended | Year Ended | Year Ended | 2003(1) to | |||||||||||||
| December 31, | December 31, | December 31, | June 30, | |||||||||||||
| 2004 | 2003 | 2004 | 2003 | |||||||||||||
(Number of Shares) | ||||||||||||||||
| Shares sold | — | 30,236,058 | — | 46,988,009 | ||||||||||||
| Dividends reinvested | 1,110,943 | 215 | 356,108 | — | ||||||||||||
| Shares redeemed | (3,240,723 | ) | (11,868,901 | ) | (12,315,461 | ) | (6,335,761 | ) | ||||||||
| Net increase (decrease) in shares outstanding | (2,129,780 | ) | 18,367,372 | (11,959,353 | ) | 40,652,248 | ||||||||||
($) | ||||||||||||||||
| Shares sold | $ | — | $ | 302,850,826 | $ | — | $ | 470,446,442 | ||||||||
| Dividends reinvested | 11,187,192 | 2,156 | 3,464,926 | — | ||||||||||||
| Shares redeemed | (34,267,953 | ) | (124,895,637 | ) | (122,698,741 | ) | (61,497,315 | ) | ||||||||
| Net increase (decrease) | $ | (23,080,761 | ) | $ | 177,957,345 | $ | (119,233,815 | ) | $ | 408,949,127 | ||||||
| (1) | Commencement of operations. |
NOTE 11 — FEDERAL INCOME TAXES
The amount of distributions from net investment income and net realized capital gains are determined in accordance with federal income tax regulations, which may differ from accounting principles generally accepted in the United States of America for investment companies. These book/tax differences may be either temporary or permanent. Permanent differences are reclassified within the capital accounts based on their federal tax-basis treatment; temporary differences are not reclassified. Key differences include the treatment of short-term capital gains, foreign currency transactions, and wash sale deferrals. Distributions in excess of available earnings and profits, current and accumulated, for tax purposes are reported as distributions of paid-in capital.
61
The following permanent tax differences have been reclassified as of December 31, 2004:
| Undistributed | Accumulated | |||||||||||
| Net Investment | Net Realized | |||||||||||
| Paid-in | Income On | Gains | ||||||||||
| Capital | Investments | (Losses) | ||||||||||
| GET H | $ | — | $ | (465 | ) | $ | 465 | |||||
| GET I | — | (171 | ) | 171 | ||||||||
| GET J | — | (100 | ) | 100 | ||||||||
| GET K | — | (33 | ) | 33 | ||||||||
| GET L | — | (171 | ) | 171 | ||||||||
| GET M | — | (398 | ) | 398 | ||||||||
| GET N | — | (644 | ) | 644 | ||||||||
| GET P | — | (821 | ) | 821 | ||||||||
| GET Q | — | (1,367 | ) | 1,367 | ||||||||
| GET R | — | (1,670 | ) | 1,670 | ||||||||
| GET S | — | (2,563 | ) | 2,563 | ||||||||
| GET T | — | (2,158 | ) | 2,158 | ||||||||
| GET U | (2,958 | ) | (16 | ) | 2,974 | |||||||
| GET V | — | (2,629 | ) | 2,629 | ||||||||
The tax composition of dividends and distributions to shareholders was as follows:
| Year ended | ||||||||||||
| Year ended December 31, 2004 | December 31, 2003 | |||||||||||
| Long-Term | ||||||||||||
| Ordinary Income | Capital Gains | Ordinary Income | ||||||||||
| GET H | $ | 5,231,638 | $ | — | $ | 5,631,397 | ||||||
| GET I | $ | 2,821,163 | $ | — | 2,773,357 | |||||||
| GET J | $ | 2,357,441 | $ | — | 2,419,393 | |||||||
| GET K | $ | 2,323,685 | $ | — | 2,487,886 | |||||||
| GET L | $ | 2,405,744 | $ | — | 2,511,486 | |||||||
| GET M | $ | 3,723,446 | $ | — | 3,720,631 | |||||||
| GET N | $ | 3,108,483 | $ | — | 2,920,441 | |||||||
| GET P | $ | 5,406,227 | $ | — | 4,996,497 | |||||||
| GET Q | $ | 5,804,349 | $ | — | 3,911 | |||||||
| GET R | $ | 5,052,323 | $ | — | 27,218 | |||||||
| GET S | $ | 8,495,730 | $ | 883,474 | 276,982 | |||||||
| GET T | $ | 7,887,210 | $ | 32,504 | 314,206 | |||||||
| GET U | $ | 11,163,878 | $ | 23,314 | 2,156 | |||||||
| GET V | $ | 3,464,926 | $ | — | — | |||||||
62
The tax-basis components of distributable earnings and the expiration dates of the capital loss carryforwards which may be used to offset future realized capital gains for federal income tax purposes as of December 31, 2004 are as follows:
| Undistributed | Undistributed | Unrealized | Post October | Capital | ||||||||||||||||||||
| Ordinary | Long-term | Appreciation | Losses | Loss | Expiration | |||||||||||||||||||
| Income | Capital Gain | (Depreciation) | Deferred | Carryforwards | Dates | |||||||||||||||||||
| GET H | $ | 4,443,134 | $ | — | $ | 1,150,339 | $ | — | $ | (7,567,761 | ) | 2009 | ||||||||||||
| (2,099,521 | ) | 2010 | ||||||||||||||||||||||
| (419,035 | ) | 2011 | ||||||||||||||||||||||
| (10,086,317 | ) | |||||||||||||||||||||||
| GET I | $ | 2,503,030 | $ | — | $ | 822,096 | $ | — | $ | (1,270,215 | ) | 2008 | ||||||||||||
| (2,847,033 | ) | 2009 | ||||||||||||||||||||||
| (1,921,671 | ) | 2010 | ||||||||||||||||||||||
| (6,038,919 | ) | |||||||||||||||||||||||
| GET J | $ | 1,999,238 | $ | — | $ | 811,805 | $ | — | $ | (1,366,099 | ) | 2008 | ||||||||||||
| (2,800,726 | ) | 2009 | ||||||||||||||||||||||
| (1,839,090 | ) | 2010 | ||||||||||||||||||||||
| (6,005,915 | ) | |||||||||||||||||||||||
| GET K | $ | 2,138,814 | $ | — | $ | 598,501 | $ | — | $ | (3,687,005 | ) | 2009 | ||||||||||||
| (840,333 | ) | 2010 | ||||||||||||||||||||||
| (4,527,338 | ) | |||||||||||||||||||||||
| GET L | $ | 1,757,218 | $ | — | $ | 531,273 | $ | (6,855 | ) | $ | (4,214,426 | ) | 2010 | |||||||||||
| GET M | $ | 3,160,422 | $ | — | $ | 1,463,843 | $ | — | $ | (1,207,148 | ) | 2009 | ||||||||||||
| (5,625,768 | ) | 2010 | ||||||||||||||||||||||
| (6,832,916 | ) | |||||||||||||||||||||||
| GET N | $ | 2,738,859 | $ | — | $ | 1,731,880 | $ | — | $ | (2,922,016 | ) | 2010 | ||||||||||||
| (489,400 | ) | 2011 | ||||||||||||||||||||||
| (3,411,416 | ) | |||||||||||||||||||||||
| GET P | $ | 4,387,937 | $ | — | $ | 2,815,435 | $ | — | $ | (4,787,487 | ) | 2010 | ||||||||||||
| GET Q | $ | 5,098,418 | $ | — | $ | 5,261,250 | $ | — | $ | (2,021,348 | ) | 2010 | ||||||||||||
| GET R | $ | 4,563,425 | $ | 2,917,628 | $ | 5,026,440 | $ | — | $ | — | ||||||||||||||
| GET S | $ | 4,983,091 | $ | 4,867,495 | $ | 4,892,127 | $ | — | $ | — | ||||||||||||||
| GET T | $ | 4,653,908 | $ | 4,333,378 | $ | 4,050,269 | $ | — | $ | — | ||||||||||||||
| GET U | $ | 6,285,112 | $ | 5,304,821 | $ | 2,789,930 | $ | — | $ | — | ||||||||||||||
| GET V | $ | 4,942,144 | $ | — | $ | (6,353,274 | ) | $ | (487,288 | ) | $ | (944,787 | ) | 2011 | ||||||||||
| (135,661 | ) | 2012 | ||||||||||||||||||||||
| (1,080,448 | ) | |||||||||||||||||||||||
NOTE 12 — INFORMATION REGARDING TRADING OF ING’S U.S. MUTUAL FUNDS
ING Investments, LLC (“Investments”), the adviser to the ING Funds, has reported to the Boards of Directors/ Trustees (the “Board”) of the ING Funds that, like many U.S. financial services companies, Investments and certain of its U.S. affiliates have received informal and formal requests for information since September 2003 from various governmental and self-regulatory agencies in connection with investigations related to mutual funds and variable insurance products. Investments has advised the Board that it and its affiliates have cooperated fully with each request.
In addition to responding to regulatory and governmental requests, Investments reported that management of U.S. affiliates of ING Groep N.V., including Investments (collectively, “ING”), on their own initiative, have conducted, through independent special counsel and a national accounting firm, an extensive internal review of trading in ING insurance, retirement, and mutual fund products. The goal of this review was to identify any instances of inappropriate trading in those products by third parties or by ING investment professionals and other ING personnel. ING’s internal review related to mutual fund trading is now substantially completed. ING has reported that, of the millions of customer relationships that ING maintains, the internal review identified several isolated arrangements allowing third parties to engage in frequent trading of mutual funds within ING’s variable insurance and mutual fund products, and identified other circumstances
63
where frequent trading occurred, despite measures taken by ING intended to combat market timing. ING further reported that each of these arrangements has been terminated and fully disclosed to regulators. The results of the internal review were also reported to the independent members of the Board.
Investments has advised the Board that most of the identified arrangements were initiated prior to ING’s acquisition of the businesses in question in the U.S. Investments further reported that the companies in question did not receive special benefits in return for any of these arrangements, which have all been terminated. Based on the internal review, Investments has advised the Board that the identified arrangements do not represent a systemic problem in any of the companies that were involved.
More specifically, Investments reported to the Board that, at this time, these instances include the following:
| • | ING has identified three arrangements, dating from 1995, 1996 and 1998, under which the administrator to the then-Pilgrim Funds, which subsequently became part of the ING Funds, entered formal and informal arrangements that permitted frequent trading. ING Funds Distributor, LLC (“IFD”) has received a notice from the staff of the NASD informing IFD that it has made a preliminary determination to recommend that disciplinary action be brought against IFD and one of its registered persons for violations of the NASD Conduct Rules and certain provisions of the federal securities laws in connection with these arrangements. |
| • | Aeltus Investment Management, Inc. (a predecessor entity to ING Investment Management Co.) has identified two investment professionals who engaged in extensive frequent trading in certain ING Funds. One was subsequently terminated for cause and incurred substantial financial penalties in connection with this conduct and the second has been disciplined. |
| • | ReliaStar Life Insurance Company (“ReliaStar”) entered into agreements seven years ago permitting the owner of policies issued by the insurer to engage in frequent trading and to submit orders until 4 p.m. Central Time. In 2001 ReliaStar also entered into a selling agreement with a broker-dealer that engaged in frequent trading. Employees of ING affiliates were terminated and/or disciplined in connection with these matters. |
| • | In 1998, Golden American Life Insurance Company entered into arrangements permitting a broker-dealer to frequently trade up to certain specific limits in a fund available in an ING variable annuity product. No employee responsible for this arrangement remains at the company. |
For additional information regarding these matters, you may consult the Form 8-K for each of four life insurance companies, ING USA Annuity and Life Insurance Company, ING Life Insurance and Annuity Company, ING Insurance Company of America, and ReliaStar Life Insurance Company of New York, each filed with the Securities and Exchange Commission (the “SEC”) on September 9, 2004. These Forms 8-K can be accessed through the SEC’s Web site at http://www.sec.gov. Despite the extensive internal review conducted through independent special counsel and a national accounting firm, there can be no assurance that the instances of inappropriate trading reported to the Board are the only instances of such trading respecting the ING Funds. Investments reported to the Board that ING is committed to conducting its business with the highest standards of ethical conduct with zero tolerance for noncompliance.
Accordingly, Investments advised the Board that ING management was disappointed that its voluntary internal review identified these situations. Viewed in the context of the breadth and magnitude of its U.S. business as a whole, ING management does not believe that ING’s acquired companies had systemic ethical or compliance issues in these areas. Nonetheless, Investments reported that given ING’s refusal to tolerate any lapses, it has taken the steps noted below, and will continue to seek opportunities to further strengthen the internal controls of its affiliates.
| • | ING has agreed with the ING Funds to indemnify and hold harmless the ING Funds from all damages resulting from wrongful conduct by ING or its employees or from ING’s internal investigation, any investigations conducted by any governmental or self-regulatory agencies, litigation or other formal proceedings, including any proceedings by the Securities and Exchange Commission. Investments reported to the Board that ING management believes that the total amount of any |
64
| indemnification obligations will not be material to ING or its U.S. business. | |
| • | ING updated its Code of Conduct for employees reinforcing its employees’ obligation to conduct personal trading activity consistent with the law, disclosed limits, and other requirements. |
| • | The ING Funds, upon a recommendation from ING, updated their respective Codes of Ethics applicable to investment professionals with ING entities and certain other fund personnel, requiring such personnel to pre-clear any purchases or sales of ING Funds that are not systematic in nature (i.e., dividend reinvestment), and imposing minimum holding periods for shares of ING Funds. |
| • | ING instituted excessive trading policies for all customers in its variable insurance and retirement products and for shareholders of the ING Funds sold to the public through financial intermediaries. ING does not make exceptions to these policies. |
| • | ING reorganized and expanded its U.S. Compliance Department, and created an Enterprise Compliance team to enhance controls and consistency in regulatory compliance. |
65
| Shares | Value | |||||||||
| COMMON STOCK: 11.8% | ||||||||||
| Advertising: 0.0% | ||||||||||
| 470 | @ | Interpublic Group of Cos., Inc. | $ | 6,298 | ||||||
| 200 | Omnicom Group, Inc. | 16,864 | ||||||||
| 23,162 | ||||||||||
| Aerospace/Defense: 0.3% | ||||||||||
| 1,460 | Boeing Co. | 75,583 | ||||||||
| 340 | General Dynamics Corp. | 35,564 | ||||||||
| 80 | Goodrich Corp. | 2,611 | ||||||||
| 100 | L-3 Communications Holdings, Inc. | 7,324 | ||||||||
| 610 | Lockheed Martin Corp. | 33,886 | ||||||||
| 380 | Northrop Grumman Corp. | 20,657 | ||||||||
| 800 | Raytheon Co. | 31,064 | ||||||||
| 180 | Rockwell Collins, Inc. | 7,099 | ||||||||
| 530 | United Technologies Corp. | 54,776 | ||||||||
| 268,564 | ||||||||||
| Agriculture: 0.2% | ||||||||||
| 2,110 | Altria Group, Inc. | 128,921 | ||||||||
| 652 | Archer-Daniels-Midland Co. | 14,546 | ||||||||
| 300 | Monsanto Co. | 16,665 | ||||||||
| 160 | Reynolds American, Inc. | 12,576 | ||||||||
| 300 | UST, Inc. | 14,433 | ||||||||
| 187,141 | ||||||||||
| Apparel: 0.1% | ||||||||||
| 260 | @ | Coach, Inc. | 14,664 | |||||||
| 210 | Jones Apparel Group, Inc. | 7,680 | ||||||||
| 160 | Liz Claiborne, Inc. | 6,754 | ||||||||
| 440 | Nike, Inc. | 39,903 | ||||||||
| 90 | Reebok Intl., Ltd. | 3,960 | ||||||||
| 200 | VF Corp. | 11,076 | ||||||||
| 84,037 | ||||||||||
| Auto Manufacturers: 0.1% | ||||||||||
| 3,160 | Ford Motor Co. | 46,262 | ||||||||
| 580 | General Motors Corp. | 23,235 | ||||||||
| 277 | PACCAR, Inc. | 22,293 | ||||||||
| 91,790 | ||||||||||
| Auto Parts and Equipment: 0.0% | ||||||||||
| 180 | Johnson Controls, Inc. | 11,419 | ||||||||
| 11,419 | ||||||||||
| Banks: 0.7% | ||||||||||
| 400 | AmSouth Bancorporation | 10,360 | ||||||||
| 4,090 | Bank of America Corp. | 192,189 | ||||||||
| 560 | BB&T Corp. | 23,548 | ||||||||
| 250 | Comerica, Inc. | 15,255 | ||||||||
| 120 | Compass Bancshares, Inc. | 5,840 | ||||||||
| 240 | Fifth Third Bancorp | 11,347 | ||||||||
| 130 | First Horizon National Corp. | 5,604 | ||||||||
| 330 | Huntington Bancshares, Inc. | 8,177 | ||||||||
| 580 | KeyCorp | 19,662 | ||||||||
| 120 | M & T Bank Corp. | 12,941 | ||||||||
| 250 | Marshall & Ilsley Corp. | 11,050 | ||||||||
| 400 | Mellon Financial Corp. | 12,444 | ||||||||
| 940 | National City Corp. | 35,297 | ||||||||
| 460 | North Fork Bancorporation, Inc. | 13,271 | ||||||||
| 220 | Northern Trust Corp. | 10,688 | ||||||||
| 120 | PNC Financial Services Group, Inc. | 6,893 | ||||||||
| 474 | Regions Financial Corp. | 16,870 | ||||||||
| 330 | State Street Corp. | 16,210 | ||||||||
| 360 | SunTrust Banks, Inc. | 26,597 | ||||||||
| 130 | Synovus Financial Corp. | 3,715 | ||||||||
| 770 | The Bank of New York Co., Inc. | 25,733 | ||||||||
| 1,904 | U.S. Bancorp | 59,633 | ||||||||
| 1,633 | Wachovia Corp. | 85,896 | ||||||||
| 1,730 | Wells Fargo & Co. | 107,520 | ||||||||
| 90 | Zions Bancorporation | 6,123 | ||||||||
| 742,863 | ||||||||||
| Beverages: 0.3% | ||||||||||
| 60 | Adolph Coors Co. | 4,540 | ||||||||
| 330 | Anheuser-Busch Cos., Inc. | 16,741 | ||||||||
| 120 | Brown-Forman Corp. | 5,842 | ||||||||
| 2,520 | Coca-Cola Co. | 104,907 | ||||||||
| 490 | Coca-Cola Enterprises, Inc. | 10,217 | ||||||||
| 290 | Pepsi Bottling Group, Inc. | 7,842 | ||||||||
| 2,320 | PepsiCo, Inc. | 121,103 | ||||||||
| 271,192 | ||||||||||
| Biotechnology: 0.1% | ||||||||||
| 1,300 | @ | Amgen, Inc. | 83,395 | |||||||
| 340 | @ | Biogen Idec, Inc. | 22,647 | |||||||
| 240 | @ | Genzyme Corp. | 13,937 | |||||||
| 240 | @ | MedImmune, Inc. | 6,506 | |||||||
| 60 | @ | Millipore Corp. | 2,989 | |||||||
| 129,474 | ||||||||||
| Building Materials: 0.0% | ||||||||||
| 210 | @ | American Standard Cos., Inc. | 8,677 | |||||||
| 430 | Masco Corp. | 15,709 | ||||||||
| 140 | Vulcan Materials Co. | 7,645 | ||||||||
| 32,031 | ||||||||||
| Chemicals: 0.2% | ||||||||||
| 220 | Air Products & Chemicals, Inc. | 12,753 | ||||||||
| 80 | Ashland, Inc. | 4,670 | ||||||||
| 1,000 | Dow Chemical Co. | 49,510 | ||||||||
| 1,020 | E.I. du Pont de Nemours & Co. | 50,032 | ||||||||
| 80 | Eastman Chemical Co. | 4,618 | ||||||||
| 120 | Ecolab, Inc. | 4,216 | ||||||||
| 180 | Engelhard Corp. | 5,521 | ||||||||
| 130 | International Flavors & Fragrances, Inc. | 5,569 | ||||||||
| 320 | PPG Industries, Inc. | 21,811 | ||||||||
| 380 | Praxair, Inc. | 16,777 | ||||||||
| 240 | Rohm & Haas Co. | 10,615 | ||||||||
| 260 | Sherwin-Williams Co. | 11,604 | ||||||||
| 90 | Sigma-Aldrich Corp. | 5,441 | ||||||||
| 203,137 | ||||||||||
| Commercial Services: 0.1% | ||||||||||
| 170 | @ | Apollo Group, Inc. | 13,721 | |||||||
| 1,090 | Cendant Corp. | 25,483 | ||||||||
| 200 | Equifax, Inc. | 5,620 | ||||||||
| 230 | H&R Block, Inc. | 11,270 | ||||||||
| 300 | McKesson Corp. | 9,438 | ||||||||
| 150 | Moody’s Corp. | 13,028 | ||||||||
| 490 | Paychex, Inc. | 16,699 | ||||||||
| 230 | R.R. Donnelley & Sons Co. | 8,117 | ||||||||
| 260 | Robert Half Intl., Inc. | 7,652 | ||||||||
| 111,028 | ||||||||||
| Computers: 0.6% | ||||||||||
| 140 | @ | Affiliated Computer Services, Inc. | 8,427 | |||||||
| 650 | @ | Apple Computer, Inc. | 41,860 | |||||||
| 200 | @ | Computer Sciences Corp. | 11,274 | |||||||
| 4,290 | @ | Dell, Inc. | 180,781 | |||||||
| 540 | Electronic Data Systems Corp. | 12,474 | ||||||||
| 2,430 | @ | EMC Corp. | 36,134 | |||||||
| 360 | @ | Gateway, Inc. | 2,164 | |||||||
| 3,058 | Hewlett-Packard Co. | 64,126 | ||||||||
| 2,290 | International Business Machines Corp. | 225,748 | ||||||||
| 130 | @ | Lexmark Intl., Inc. | 11,050 | |||||||
| 140 | @ | NCR Corp. | 9,692 | |||||||
66
| Shares | Value | |||||||||
| Computers (continued) | ||||||||||
| 350 | @ | Network Appliance, Inc. | $ | 11,627 | ||||||
| 5,840 | @ | Sun Microsystems, Inc. | 31,419 | |||||||
| 300 | @ | Sungard Data Systems, Inc. | 8,499 | |||||||
| 360 | @ | Unisys Corp. | 3,665 | |||||||
| 658,940 | ||||||||||
| Cosmetics/Personal Care: 0.4% | ||||||||||
| 120 | Alberto-Culver Co. | 5,828 | ||||||||
| 200 | Avon Products, Inc. | 7,740 | ||||||||
| 520 | Colgate-Palmolive Co. | 26,603 | ||||||||
| 1,730 | Gillette Co. | 77,469 | ||||||||
| 500 | Kimberly-Clark Corp. | 32,905 | ||||||||
| 4,410 | Procter & Gamble Co. | 242,904 | ||||||||
| 393,449 | ||||||||||
| Distribution/Wholesale: 0.0% | ||||||||||
| 320 | Genuine Parts Co. | 14,099 | ||||||||
| 140 | W.W. Grainger, Inc. | 9,327 | ||||||||
| 23,426 | ||||||||||
| Diversified Financial Services: 0.9% | ||||||||||
| 1,720 | American Express Co. | 96,956 | ||||||||
| 150 | Bear Stearns Cos., Inc. | 15,347 | ||||||||
| 420 | Capital One Financial Corp. | 35,368 | ||||||||
| 300 | CIT Group, Inc. | 13,746 | ||||||||
| 5,249 | Citigroup, Inc. | 252,896 | ||||||||
| 558 | Countrywide Financial Corp. | 20,652 | ||||||||
| 400 | @ | E*TRADE Financial Corp. | 5,980 | |||||||
| 1,010 | Fannie Mae | 71,922 | ||||||||
| 120 | Federated Investors, Inc. | 3,648 | ||||||||
| 260 | Franklin Resources, Inc. | 18,109 | ||||||||
| 680 | Freddie Mac | 50,116 | ||||||||
| 490 | Goldman Sachs Group, Inc. | 50,980 | ||||||||
| 260 | Janus Capital Group, Inc. | 4,371 | ||||||||
| 370 | Lehman Brothers Holdings, Inc. | 32,368 | ||||||||
| 1,255 | MBNA Corp. | 35,378 | ||||||||
| 960 | Merrill Lynch & Co., Inc. | 57,379 | ||||||||
| 1,110 | Morgan Stanley | 61,627 | ||||||||
| 430 | @ | Providian Financial Corp. | 7,082 | |||||||
| 420 | SLM Corp. | 22,424 | ||||||||
| 120 | T. Rowe Price Group, Inc. | 7,464 | ||||||||
| 863,813 | ||||||||||
| Electric: 0.3% | ||||||||||
| 640 | @ | AES Corp. | 8,749 | |||||||
| 80 | Ameren Corp. | 4,011 | ||||||||
| 470 | American Electric Power Co., Inc. | 16,140 | ||||||||
| 160 | Cinergy Corp. | 6,661 | ||||||||
| 260 | Consolidated Edison, Inc. | 11,375 | ||||||||
| 170 | Constellation Energy Group, Inc. | 7,431 | ||||||||
| 140 | Dominion Resources, Inc. | 9,484 | ||||||||
| 180 | DTE Energy Co. | 7,763 | ||||||||
| 1,620 | Duke Energy Corp. | 41,034 | ||||||||
| 420 | Edison Intl. | 13,453 | ||||||||
| 240 | Entergy Corp. | 16,222 | ||||||||
| 700 | Exelon Corp. | 30,848 | ||||||||
| 320 | FirstEnergy Corp. | 12,643 | ||||||||
| 180 | FPL Group, Inc. | 13,455 | ||||||||
| 440 | @ | PG&E Corp. | 14,643 | |||||||
| 100 | Pinnacle West Capital Corp. | 4,441 | ||||||||
| 270 | PPL Corp. | 14,386 | ||||||||
| 240 | Public Service Enterprise Group, Inc. | 12,425 | ||||||||
| 750 | Southern Co. | 25,140 | ||||||||
| 410 | TXU Corp. | 26,470 | ||||||||
| 550 | Xcel Energy, Inc. | 10,010 | ||||||||
| 306,784 | ||||||||||
| Electrical Components and Equipment: 0.0% | ||||||||||
| 570 | Emerson Electric Co. | 39,957 | ||||||||
| 39,957 | ||||||||||
| Electronics: 0.1% | ||||||||||
| 460 | @ | Agilent Technologies, Inc. | 11,086 | |||||||
| 230 | Applera Corp. — Applied Biosystems Group | 4,809 | ||||||||
| 120 | @ | Fisher Scientific Intl. | 7,486 | |||||||
| 290 | @ | Jabil Circuit, Inc. | 7,418 | |||||||
| 120 | Parker Hannifin Corp. | 9,089 | ||||||||
| 190 | PerkinElmer, Inc. | 4,273 | ||||||||
| 220 | @ | Sanmina-SCI Corp. | 1,863 | |||||||
| 790 | @ | Solectron Corp. | 4,211 | |||||||
| 100 | Tektronix, Inc. | 3,021 | ||||||||
| 200 | @ | Thermo Electron Corp. | 6,038 | |||||||
| 140 | @ | Waters Corp. | 6,551 | |||||||
| 65,845 | ||||||||||
| Engineering and Construction: 0.0% | ||||||||||
| 100 | Fluor Corp. | 5,451 | ||||||||
| 5,451 | ||||||||||
| Entertainment: 0.0% | ||||||||||
| 400 | International Game Technology | 13,752 | ||||||||
| 13,752 | ||||||||||
| Environmental Control: 0.0% | ||||||||||
| 540 | Waste Management, Inc. | 16,168 | ||||||||
| 16,168 | ||||||||||
| Food: 0.2% | ||||||||||
| 380 | Albertson’s, Inc. | 9,074 | ||||||||
| 420 | Campbell Soup Co. | 12,554 | ||||||||
| 540 | ConAgra Foods, Inc. | 15,903 | ||||||||
| 380 | General Mills, Inc. | 18,890 | ||||||||
| 350 | H.J. Heinz Co. | 13,647 | ||||||||
| 280 | Hershey Foods Corp. | 15,551 | ||||||||
| 380 | Kellogg Co. | 16,971 | ||||||||
| 300 | @ | Kroger Co. | 5,262 | |||||||
| 160 | McCormick & Co., Inc. | 6,176 | ||||||||
| 480 | @ | Safeway, Inc. | 9,475 | |||||||
| 790 | Sara Lee Corp. | 19,071 | ||||||||
| 180 | SUPERVALU, Inc. | 6,214 | ||||||||
| 390 | Wm. Wrigley Jr. Co. | 26,983 | ||||||||
| 175,771 | ||||||||||
| Forest Products and Paper: 0.1% | ||||||||||
| 270 | Georgia-Pacific Corp. | 10,120 | ||||||||
| 530 | International Paper Co. | 22,260 | ||||||||
| 160 | Louisiana-Pacific Corp. | 4,278 | ||||||||
| 200 | MeadWestvaco Corp. | 6,778 | ||||||||
| 180 | Plum Creek Timber Co., Inc. | 6,919 | ||||||||
| 80 | Temple-Inland, Inc. | 5,472 | ||||||||
| 350 | Weyerhaeuser Co. | 23,527 | ||||||||
| 79,354 | ||||||||||
| Gas: 0.0% | ||||||||||
| 150 | KeySpan Corp. | 5,918 | ||||||||
| 300 | Sempra Energy | 11,004 | ||||||||
| 16,922 | ||||||||||
| Hand/Machine Tools: 0.0% | ||||||||||
| 130 | Black & Decker Corp. | 11,483 | ||||||||
| 100 | Snap-On, Inc. | 3,436 | ||||||||
| 100 | Stanley Works | 4,899 | ||||||||
| 19,818 | ||||||||||
| Healthcare — Products: 0.5% | ||||||||||
| 70 | Bausch & Lomb, Inc. | 4,512 | ||||||||
| 250 | Baxter Intl., Inc. | 8,635 | ||||||||
67
| Shares | Value | |||||||||
| Healthcare — Products (continued) | ||||||||||
| 430 | Becton Dickinson & Co. | $ | 24,424 | |||||||
| 250 | Biomet, Inc. | 10,848 | ||||||||
| 820 | @ | Boston Scientific Corp. | 29,151 | |||||||
| 120 | C.R. Bard, Inc. | 7,678 | ||||||||
| 130 | Guidant Corp. | 9,373 | ||||||||
| 5,140 | Johnson & Johnson | 325,979 | ||||||||
| 1,220 | Medtronic, Inc. | 60,597 | ||||||||
| 360 | @ | St. Jude Medical, Inc. | 15,095 | |||||||
| 160 | Stryker Corp. | 7,720 | ||||||||
| 260 | @ | Zimmer Holdings, Inc. | 20,831 | |||||||
| 524,843 | ||||||||||
| Healthcare — Services: 0.2% | ||||||||||
| 220 | @ | Humana, Inc. | 6,532 | |||||||
| 140 | @ | Laboratory Corp. Of America Holdings | 6,975 | |||||||
| 100 | Manor Care, Inc. | 3,543 | ||||||||
| 100 | Quest Diagnostics, Inc. | 9,555 | ||||||||
| 1,130 | UnitedHealth Group, Inc. | 99,474 | ||||||||
| 490 | @ | WellPoint, Inc. | 56,350 | |||||||
| 182,429 | ||||||||||
| Home Builders: 0.0% | ||||||||||
| 40 | Centex Corp. | 2,383 | ||||||||
| 2,383 | ||||||||||
| Home Furnishings: 0.0% | ||||||||||
| 220 | Leggett & Platt, Inc. | 6,254 | ||||||||
| 80 | Whirlpool Corp. | 5,537 | ||||||||
| 11,791 | ||||||||||
| Household Products/Wares: 0.0% | ||||||||||
| 100 | Avery Dennison Corp. | 5,997 | ||||||||
| 210 | Clorox Co. | 12,375 | ||||||||
| 180 | Fortune Brands, Inc. | 13,893 | ||||||||
| 32,265 | ||||||||||
| Housewares: 0.0% | ||||||||||
| 280 | Newell Rubbermaid, Inc. | 6,773 | ||||||||
| 6,773 | ||||||||||
| Insurance: 0.6% | ||||||||||
| 300 | @@ | ACE Ltd. | 12,825 | |||||||
| 510 | AFLAC, Inc. | 20,318 | ||||||||
| 700 | Allstate Corp. | 36,204 | ||||||||
| 100 | AMBAC Financial Group, Inc. | 8,213 | ||||||||
| 2,650 | American Intl. Group, Inc. | 174,025 | ||||||||
| 310 | AON Corp. | 7,397 | ||||||||
| 340 | Chubb Corp. | 26,146 | ||||||||
| 240 | CIGNA Corp. | 19,577 | ||||||||
| 189 | Cincinnati Financial Corp. | 8,365 | ||||||||
| 380 | Hartford Financial Services Group, Inc. | 26,338 | ||||||||
| 140 | Jefferson-Pilot Corp. | 7,274 | ||||||||
| 250 | Lincoln National Corp. | 11,670 | ||||||||
| 340 | Loews Corp. | 23,902 | ||||||||
| 220 | Marsh & McLennan Cos., Inc. | 7,238 | ||||||||
| 160 | MBIA, Inc. | 10,125 | ||||||||
| 760 | MetLife, Inc. | 30,788 | ||||||||
| 100 | MGIC Investment Corp. | 6,891 | ||||||||
| 320 | Principal Financial Group | 13,101 | ||||||||
| 210 | Progressive Corp. | 17,816 | ||||||||
| 910 | Prudential Financial, Inc. | 50,013 | ||||||||
| 200 | Safeco Corp. | 10,448 | ||||||||
| 280 | St. Paul Travelers Cos., Inc. | 10,380 | ||||||||
| 130 | Torchmark Corp. | 7,428 | ||||||||
| 320 | UnumProvident Corp. | 5,741 | ||||||||
| 140 | @@ | XL Capital Ltd. | 10,871 | |||||||
| 563,094 | ||||||||||
| Internet: 0.2% | ||||||||||
| 670 | @ | eBay, Inc. | 77,908 | |||||||
| 1,040 | @ | Symantec Corp. | 26,790 | |||||||
| 1,320 | @ | Yahoo!, Inc. | 49,738 | |||||||
| 154,436 | ||||||||||
| Iron/Steel: 0.0% | ||||||||||
| 160 | Nucor Corp. | 8,374 | ||||||||
| 140 | United States Steel Corp. | 7,175 | ||||||||
| 15,549 | ||||||||||
| Leisure Time: 0.1% | ||||||||||
| 110 | Brunswick Corp. | 5,445 | ||||||||
| 620 | Carnival Corp. | 35,730 | ||||||||
| 300 | Harley-Davidson, Inc. | 18,225 | ||||||||
| 160 | Sabre Holdings Corp. | 3,546 | ||||||||
| 62,946 | ||||||||||
| Lodging: 0.0% | ||||||||||
| 100 | Harrah’s Entertainment, Inc. | 6,689 | ||||||||
| 370 | Hilton Hotels Corp. | 8,414 | ||||||||
| 310 | Marriott Intl., Inc. | 19,524 | ||||||||
| 190 | Starwood Hotels & Resorts Worldwide, Inc. | 11,096 | ||||||||
| 45,723 | ||||||||||
| Machinery — Construction and Mining: 0.0% | ||||||||||
| 140 | Caterpillar, Inc. | 13,651 | ||||||||
| 13,651 | ||||||||||
| Machinery — Diversified: 0.0% | ||||||||||
| 60 | Cummins, Inc. | 5,027 | ||||||||
| 250 | Deere & Co. | 18,600 | ||||||||
| 170 | Rockwell Automation, Inc. | 8,424 | ||||||||
| 32,051 | ||||||||||
| Media: 0.4% | ||||||||||
| 2,260 | @ | Comcast Corp. | 75,213 | |||||||
| 270 | Gannett Co., Inc. | 22,059 | ||||||||
| 80 | Knight-Ridder, Inc. | 5,355 | ||||||||
| 330 | McGraw-Hill Cos., Inc. | 30,208 | ||||||||
| 50 | Meredith Corp. | 2,710 | ||||||||
| 150 | New York Times Co. | 6,120 | ||||||||
| 2,680 | News Corp. | 50,009 | ||||||||
| 4,510 | @ | Time Warner, Inc. | 87,674 | |||||||
| 140 | Tribune Co. | 5,900 | ||||||||
| 1,750 | Viacom, Inc. | 63,683 | ||||||||
| 2,110 | Walt Disney Co. | 58,658 | ||||||||
| 407,589 | ||||||||||
| Mining: 0.0% | ||||||||||
| 150 | Phelps Dodge Corp. | 14,838 | ||||||||
| 14,838 | ||||||||||
| Miscellaneous Manufacturing: 0.7% | ||||||||||
| 790 | 3M Co. | 64,835 | ||||||||
| 90 | Cooper Industries Ltd. | 6,110 | ||||||||
| 300 | Danaher Corp. | 17,223 | ||||||||
| 80 | Dover Corp. | 3,355 | ||||||||
| 290 | Eastman Kodak Co. | 9,353 | ||||||||
| 140 | Eaton Corp. | 10,130 | ||||||||
| 10,820 | General Electric Co. | 394,930 | ||||||||
| 860 | Honeywell Intl., Inc. | 30,453 | ||||||||
| 310 | Illinois Tool Works, Inc. | 28,731 | ||||||||
| 180 | @@ | Ingersoll-Rand Co. | 14,454 | |||||||
| 80 | ITT Industries, Inc. | 6,756 | ||||||||
| 120 | Pall Corp. | 3,474 | ||||||||
| 150 | Textron, Inc. | 11,070 | ||||||||
| 2,050 | @@ | Tyco Intl., Ltd. | 73,267 | |||||||
| 674,141 | ||||||||||
68
| Shares | Value | |||||||||
| Office/Business Equipment: 0.0% | ||||||||||
| 270 | Pitney Bowes, Inc. | $ | 12,496 | |||||||
| 1,290 | @ | Xerox Corp. | 21,943 | |||||||
| 34,439 | ||||||||||
| Oil and Gas: 0.9% | ||||||||||
| 150 | Amerada Hess Corp. | 12,357 | ||||||||
| 310 | Anadarko Petroleum Corp. | 20,091 | ||||||||
| 326 | Apache Corp. | 16,486 | ||||||||
| 660 | Burlington Resources, Inc. | 28,710 | ||||||||
| 2,740 | ChevronTexaco Corp. | 143,877 | ||||||||
| 1,121 | ConocoPhillips | 97,336 | ||||||||
| 800 | Devon Energy Corp. | 31,136 | ||||||||
| 120 | EOG Resources, Inc. | 8,563 | ||||||||
| 8,420 | Exxon Mobil Corp. | 431,609 | ||||||||
| 160 | Kerr-McGee Corp. | 9,246 | ||||||||
| 420 | Marathon Oil Corp. | 15,796 | ||||||||
| 50 | @,@@ | Nabors Industries, Ltd. | 2,565 | |||||||
| 140 | @ | Noble Corp. | 6,964 | |||||||
| 410 | Occidental Petroleum Corp. | 23,928 | ||||||||
| 130 | Sunoco, Inc. | 10,622 | ||||||||
| 280 | @ | Transocean, Inc. | 11,869 | |||||||
| 300 | Unocal Corp. | 12,972 | ||||||||
| 360 | Valero Energy Corp. | 16,344 | ||||||||
| 900,471 | ||||||||||
| Oil and Gas Services: 0.0% | ||||||||||
| 340 | Baker Hughes, Inc. | 14,508 | ||||||||
| 150 | BJ Services Co. | 6,981 | ||||||||
| 400 | Halliburton Co. | 15,696 | ||||||||
| 37,185 | ||||||||||
| Packaging and Containers: 0.0% | ||||||||||
| 160 | Ball Corp. | 7,036 | ||||||||
| 140 | Bemis Co. | 4,073 | ||||||||
| 250 | @ | Pactiv Corp. | 6,323 | |||||||
| 130 | @ | Sealed Air Corp. | 6,925 | |||||||
| 24,357 | ||||||||||
| Pharmaceuticals: 0.6% | ||||||||||
| 1,560 | Abbott Laboratories | 72,774 | ||||||||
| 130 | Allergan, Inc. | 10,539 | ||||||||
| 100 | AmerisourceBergen Corp. | 5,868 | ||||||||
| 1,930 | Bristol-Myers Squibb Co. | 49,447 | ||||||||
| 580 | Cardinal Health, Inc. | 33,727 | ||||||||
| 780 | @ | Caremark Rx, Inc. | 30,755 | |||||||
| 460 | Eli Lilly & Co. | 26,105 | ||||||||
| 80 | @ | Express Scripts, Inc. | 6,115 | |||||||
| 350 | @ | Forest Laboratories, Inc. | 15,701 | |||||||
| 440 | @ | Gilead Sciences, Inc. | 15,396 | |||||||
| 160 | @ | Hospira, Inc. | 5,360 | |||||||
| 296 | @ | King Pharmaceuticals, Inc. | 3,670 | |||||||
| 275 | @ | Medco Health Solutions, Inc. | 11,440 | |||||||
| 2,280 | Merck & Co., Inc. | 73,279 | ||||||||
| 7,616 | Pfizer, Inc. | 204,794 | ||||||||
| 1,460 | Schering-Plough Corp. | 30,485 | ||||||||
| 1,320 | Wyeth | 56,219 | ||||||||
| 651,674 | ||||||||||
| Pipelines: 0.0% | ||||||||||
| 560 | El��Paso Corp. | 5,824 | ||||||||
| 50 | Kinder Morgan, Inc. | 3,657 | ||||||||
| 530 | Williams Cos., Inc. | 8,633 | ||||||||
| 18,114 | ||||||||||
| Real Estate Investment Trusts: 0.0% | ||||||||||
| 160 | Equity Office Properties Trust | 4,659 | ||||||||
| 180 | ProLogis | 7,799 | ||||||||
| 220 | Simon Property Group, Inc. | 14,228 | ||||||||
| 26,686 | ||||||||||
| Retail: 1.0% | ||||||||||
| 290 | @ | Bed Bath & Beyond, Inc. | 11,551 | |||||||
| 330 | Best Buy Co., Inc. | 19,609 | ||||||||
| 280 | Circuit City Stores, Inc. | 4,379 | ||||||||
| 800 | Costco Wholesale Corp. | 38,728 | ||||||||
| 390 | CVS Corp. | 17,577 | ||||||||
| 180 | Darden Restaurants, Inc. | 4,993 | ||||||||
| 230 | Federated Department Stores, Inc. | 13,292 | ||||||||
| 1,210 | Gap, Inc. | 25,555 | ||||||||
| 3,770 | Home Depot, Inc. | 161,130 | ||||||||
| 480 | J.C. Penney Co., Inc. Holding Co. | 19,872 | ||||||||
| 140 | @ | Kohl’s Corp. | 6,884 | |||||||
| 570 | Limited Brands, Inc. | 13,121 | ||||||||
| 810 | Lowe’s Cos., Inc. | 46,648 | ||||||||
| 420 | May Department Stores Co. | 12,348 | ||||||||
| 2,180 | McDonald’s Corp. | 69,891 | ||||||||
| 140 | Nordstrom, Inc. | 6,542 | ||||||||
| 480 | @ | Office Depot, Inc. | 8,333 | |||||||
| 250 | RadioShack Corp. | 8,220 | ||||||||
| 870 | Staples, Inc. | 29,328 | ||||||||
| 530 | @ | Starbucks Corp. | 33,051 | |||||||
| 920 | Target Corp. | 47,776 | ||||||||
| 480 | TJX Cos., Inc. | 12,062 | ||||||||
| 320 | @ | Toys R US, Inc. | 6,550 | |||||||
| 4,270 | Wal-Mart Stores, Inc. | 225,540 | ||||||||
| 1,030 | Walgreen Co. | 39,521 | ||||||||
| 180 | Wendy’s Intl., Inc. | 7,067 | ||||||||
| 280 | Yum! Brands, Inc. | 13,210 | ||||||||
| 902,778 | ||||||||||
| Savings and Loans: 0.1% | ||||||||||
| 300 | Golden West Financial Corp. | 18,426 | ||||||||
| 140 | Sovereign Bancorp, Inc. | 3,157 | ||||||||
| 935 | Washington Mutual, Inc. | 39,532 | ||||||||
| 61,115 | ||||||||||
| Semiconductors: 0.3% | ||||||||||
| 540 | @ | Altera Corp. | 11,178 | |||||||
| 400 | Analog Devices, Inc. | 14,768 | ||||||||
| 1,720 | @ | Applied Materials, Inc. | 29,412 | |||||||
| 354 | @ | Freescale Semiconductor Inc. | 6,499 | |||||||
| 6,610 | Intel Corp. | 154,607 | ||||||||
| 200 | @ | KLA-Tencor Corp. | 9,316 | |||||||
| 310 | Linear Technology Corp. | 12,016 | ||||||||
| 130 | Maxim Integrated Products, Inc. | 5,511 | ||||||||
| 380 | National Semiconductor Corp. | 6,821 | ||||||||
| 690 | Texas Instruments, Inc. | 16,988 | ||||||||
| 267,116 | ||||||||||
| Software: 0.6% | ||||||||||
| 250 | Adobe Systems, Inc. | 15,685 | ||||||||
| 280 | Autodesk, Inc. | 10,626 | ||||||||
| 630 | Automatic Data Processing, Inc. | 27,941 | ||||||||
| 340 | @ | BMC Software, Inc. | 6,324 | |||||||
| 220 | @ | Citrix Systems, Inc. | 5,397 | |||||||
| 600 | Computer Associates Intl., Inc. | 18,636 | ||||||||
| 490 | @ | Compuware Corp. | 3,170 | |||||||
| 120 | @ | Electronic Arts, Inc. | 7,402 | |||||||
| 877 | First Data Corp. | 37,307 | ||||||||
| 240 | @ | Fiserv, Inc. | 9,646 | |||||||
| 370 | IMS Health, Inc. | 8,588 | ||||||||
| 190 | @ | Intuit, Inc. | 8,362 | |||||||
| 11,090 | Microsoft Corp. | 296,213 | ||||||||
| 630 | @ | Novell, Inc. | 4,253 | |||||||
| 9,000 | @ | Oracle Corp. | 123,479 | |||||||
| 290 | @ | PeopleSoft, Inc. | 7,679 | |||||||
| 760 | @ | Siebel Systems, Inc. | 7,980 | |||||||
| 410 | @ | Veritas Software Corp. | 11,706 | |||||||
| 610,394 | ||||||||||
| Telecommunications: 0.7% | ||||||||||
| 440 | Alltel Corp. | 25,854 | ||||||||
| 310 | AT&T Corp. | 5,909 | ||||||||
69
| Shares | Value | |||||||||
| Telecommunications (continued) | ||||||||||
| 410 | @ | Avaya, Inc. | $ | 7,052 | ||||||
| 1,880 | BellSouth Corp. | 52,245 | ||||||||
| 200 | CenturyTel, Inc. | 7,094 | ||||||||
| 6,770 | @ | Cisco Systems, Inc. | 130,661 | |||||||
| 200 | Citizens Communications Co. | 2,758 | ||||||||
| 270 | @ | Comverse Technology, Inc. | 6,602 | |||||||
| 550 | @ | Corning, Inc. | 6,474 | |||||||
| 4,220 | @ | Lucent Technologies, Inc. | 15,867 | |||||||
| 2,390 | Motorola, Inc. | 41,108 | ||||||||
| 1,120 | @ | Nextel Communications, Inc. | 33,600 | |||||||
| 1,600 | QUALCOMM, Inc. | 67,840 | ||||||||
| 740 | @ | Qwest Communications Intl., Inc. | 3,286 | |||||||
| 3,400 | SBC Communications, Inc. | 87,618 | ||||||||
| 230 | Scientific-Atlanta, Inc. | 7,592 | ||||||||
| 1,480 | Sprint Corp. | 36,778 | ||||||||
| 390 | @ | Tellabs, Inc. | 3,350 | |||||||
| 3,750 | Verizon Communications, Inc. | 151,912 | ||||||||
| 693,600 | ||||||||||
| Textiles: 0.0% | ||||||||||
| 160 | Cintas Corp. | 7,018 | ||||||||
| 7,018 | ||||||||||
| Toys/Games/Hobbies: 0.0% | ||||||||||
| 200 | Hasbro, Inc. | 3,876 | ||||||||
| 420 | Mattel, Inc. | 8,186 | ||||||||
| 12,062 | ||||||||||
| Transportation: 0.2% | ||||||||||
| 500 | Burlington Northern Santa Fe Corp. | 23,655 | ||||||||
| 220 | CSX Corp. | 8,818 | ||||||||
| 510 | FedEx Corp. | 50,230 | ||||||||
| 530 | Norfolk Southern Corp. | 19,181 | ||||||||
| 60 | Ryder System, Inc. | 2,866 | ||||||||
| 1,160 | United Parcel Service, Inc. | 99,133 | ||||||||
| 203,883 | ||||||||||
| Total Common Stock (Cost $10,451,744) | 12,030,682 | |||||||||
| Principal | ||||||||||
| Amount | Value | |||||||||
| U.S. GOVERNMENT AGENCY OBLIGATIONS: 79.1% | ||||||||||
| Federal Home Loan Mortgage Corporation: 29.6% | ||||||||||
| $ | 30,080,000 | 2.100%, due 01/15/05 | $ | 30,053,652 | ||||||
| 30,053,652 | ||||||||||
| Federal National Mortgage Association: 23.2% | ||||||||||
| 13,022,000 | 2.180%, due 01/15/05 | 13,010,163 | ||||||||
| 5,005,000 | 2.070%, due 02/07/05 | 4,994,078 | ||||||||
| 5,588,000 | 2.240%, due 02/15/05 | 5,572,484 | ||||||||
| 23,576,725 | ||||||||||
| Other: 26.3% | ||||||||||
| 5,311,000 | FICO STRIP, 2.030%, due 02/08/05 | 5,299,340 | ||||||||
| 11,372,000 | Resolution Funding Corp., 1.960%, due 01/15/05 | 11,362,726 | ||||||||
| 10,291,000 | Tennessee Valley Authority, 2.940%, due 10/15/05 | 10,054,832 | ||||||||
| 26,716,898 | ||||||||||
| Total U.S. Government Agency Obligations (Cost $80,304,854) | 80,347,275 | |||||||||
| U.S. TREASURY OBLIGATIONS: 8.2% | ||||||||||
| U.S. Treasury STRIP: 8.2% | ||||||||||
| 8,320,000 | 1.930%, due 02/15/05 | 8,300,048 | ||||||||
| Total U.S. Treasury Obligations (Cost $8,300,186) | 8,300,048 | |||||||||
| Total Long-Term Investments (Cost $99,056,784) | 100,678,005 | |||||||||
| SHORT-TERM INVESTMENTS: 0.4% | ||||||||||
| Repurchase Agreement: 0.4% | ||||||||||
| 455,000 | Morgan Stanley Repurchase Agreement dated 12/31/04, 2.200% due 01/03/05, $455,083 to be received upon repurchase (Collateralized by $425,000 Federal Home Loan Bank, 5.750%, Market Value plus accrued interest $467,303, due 05/15/12) | 455,000 | ||||||||
| Total Short-Term Investments (Cost $455,000) | 455,000 | |||||||||
Total Investments In Securities (Cost $99,511,784)* | 99.5 | % | $ | 101,133,005 | ||||||||
Other Assets and Liabilities-Net | 0.5 | 469,148 | ||||||||||
Net Assets | 100.0 | % | $ | 101,602,153 | ||||||||
| @ | Non-income producing security | |
| @@ | Foreign issuer | |
| STRIP | Separate Trading of Registered Interest and Principal of Securities | |
| * | Cost for federal income tax purposes is $99,982,666. Net unrealized depreciation consists of: |
| Gross Unrealized Appreciation | $ | 1,463,056 | ||
| Gross Unrealized Depreciation | (312,717 | ) | ||
| Net Unrealized Appreciation | $ | 1,150,339 | ||
70
| Shares | Value | |||||||||
| COMMON STOCK: 7.2% | ||||||||||
| Advertising: 0.0% | ||||||||||
| 70 | @ | Interpublic Group of Cos., Inc. | $ | 938 | ||||||
| 70 | Omnicom Group, Inc. | 5,902 | ||||||||
| 6,840 | ||||||||||
| Aerospace/Defense: 0.2% | ||||||||||
| 540 | Boeing Co. | 27,955 | ||||||||
| 130 | General Dynamics Corp. | 13,598 | ||||||||
| 40 | Goodrich Corp. | 1,306 | ||||||||
| 40 | L-3 Communications Holdings, Inc. | 2,930 | ||||||||
| 220 | Lockheed Martin Corp. | 12,221 | ||||||||
| 140 | Northrop Grumman Corp. | 7,610 | ||||||||
| 290 | Raytheon Co. | 11,261 | ||||||||
| 70 | Rockwell Collins, Inc. | 2,761 | ||||||||
| 200 | United Technologies Corp. | 20,670 | ||||||||
| 100,312 | ||||||||||
| Agriculture: 0.1% | ||||||||||
| 760 | Altria Group, Inc. | 46,436 | ||||||||
| 233 | Archer-Daniels-Midland Co. | 5,198 | ||||||||
| 110 | Monsanto Co. | 6,111 | ||||||||
| 60 | Reynolds American, Inc. | 4,716 | ||||||||
| 80 | UST, Inc. | 3,849 | ||||||||
| 66,310 | ||||||||||
| Apparel: 0.1% | ||||||||||
| 100 | @ | Coach, Inc. | 5,640 | |||||||
| 70 | Jones Apparel Group, Inc. | 2,560 | ||||||||
| 60 | Liz Claiborne, Inc. | 2,533 | ||||||||
| 170 | Nike, Inc. | 15,416 | ||||||||
| 30 | Reebok Intl., Ltd. | 1,320 | ||||||||
| 70 | VF Corp. | 3,877 | ||||||||
| 31,346 | ||||||||||
| Auto Manufacturers: 0.1% | ||||||||||
| 1,180 | Ford Motor Co. | 17,275 | ||||||||
| 210 | General Motors Corp. | 8,413 | ||||||||
| 85 | PACCAR, Inc. | 6,841 | ||||||||
| 32,529 | ||||||||||
| Auto Parts and Equipment: 0.0% | ||||||||||
| 80 | @ | Goodyear Tire & Rubber Co. | 1,173 | |||||||
| 70 | Johnson Controls, Inc. | 4,441 | ||||||||
| 5,614 | ||||||||||
| Banks: 0.5% | ||||||||||
| 140 | AmSouth Bancorporation | 3,626 | ||||||||
| 1,534 | Bank of America Corp. | 72,082 | ||||||||
| 210 | BB&T Corp. | 8,831 | ||||||||
| 90 | Comerica, Inc. | 5,492 | ||||||||
| 40 | Compass Bancshares, Inc. | 1,947 | ||||||||
| 80 | Fifth Third Bancorp | 3,782 | ||||||||
| 50 | First Horizon National Corp. | 2,156 | ||||||||
| 110 | Huntington Bancshares, Inc. | 2,726 | ||||||||
| 210 | KeyCorp | 7,119 | ||||||||
| 40 | M & T Bank Corp. | 4,314 | ||||||||
| 100 | Marshall & Ilsley Corp. | 4,420 | ||||||||
| 150 | Mellon Financial Corp. | 4,667 | ||||||||
| 350 | National City Corp. | 13,143 | ||||||||
| 165 | North Fork Bancorporation, Inc. | 4,760 | ||||||||
| 80 | Northern Trust Corp. | 3,886 | ||||||||
| 40 | PNC Financial Services Group, Inc. | 2,298 | ||||||||
| 173 | Regions Financial Corp. | 6,157 | ||||||||
| 120 | State Street Corp. | 5,894 | ||||||||
| 130 | SunTrust Banks, Inc. | 9,604 | ||||||||
| 50 | Synovus Financial Corp. | 1,429 | ||||||||
| 290 | The Bank of New York Co., Inc. | 9,692 | ||||||||
| 700 | U.S. Bancorp | 21,924 | ||||||||
| 605 | Wachovia Corp. | 31,823 | ||||||||
| 640 | Wells Fargo & Co. | 39,775 | ||||||||
| 40 | Zions Bancorporation | 2,721 | ||||||||
| 274,268 | ||||||||||
| Beverages: 0.2% | ||||||||||
| 20 | Adolph Coors Co. | 1,513 | ||||||||
| 120 | Anheuser-Busch Cos., Inc. | 6,088 | ||||||||
| 40 | Brown-Forman Corp. | 1,947 | ||||||||
| 900 | Coca-Cola Co. | 37,467 | ||||||||
| 180 | Coca-Cola Enterprises, Inc. | 3,753 | ||||||||
| 100 | Pepsi Bottling Group, Inc. | 2,704 | ||||||||
| 850 | PepsiCo, Inc. | 44,370 | ||||||||
| 97,842 | ||||||||||
| Biotechnology: 0.1% | ||||||||||
| 481 | @ | Amgen, Inc. | 30,857 | |||||||
| 130 | @ | Biogen Idec, Inc. | 8,659 | |||||||
| 90 | @ | Genzyme Corp. | 5,226 | |||||||
| 40 | @ | MedImmune, Inc. | 1,084 | |||||||
| 20 | @ | Millipore Corp. | 996 | |||||||
| 46,822 | ||||||||||
| Building Materials: 0.0% | ||||||||||
| 90 | @ | American Standard Cos., Inc. | 3,719 | |||||||
| 160 | Masco Corp. | 5,844 | ||||||||
| 50 | Vulcan Materials Co. | 2,731 | ||||||||
| 12,294 | ||||||||||
| Chemicals: 0.1% | ||||||||||
| 80 | Air Products & Chemicals, Inc. | 4,638 | ||||||||
| 30 | Ashland, Inc. | 1,751 | ||||||||
| 360 | Dow Chemical Co. | 17,824 | ||||||||
| 410 | E.I. du Pont de Nemours & Co. | 20,111 | ||||||||
| 30 | Eastman Chemical Co. | 1,732 | ||||||||
| 40 | Ecolab, Inc. | 1,405 | ||||||||
| 70 | Engelhard Corp. | 2,147 | ||||||||
| 30 | International Flavors & Fragrances, Inc. | 1,285 | ||||||||
| 120 | PPG Industries, Inc. | 8,179 | ||||||||
| 120 | Praxair, Inc. | 5,298 | ||||||||
| 100 | Rohm & Haas Co. | 4,423 | ||||||||
| 80 | Sherwin-Williams Co. | 3,570 | ||||||||
| 30 | Sigma-Aldrich Corp. | 1,814 | ||||||||
| 74,177 | ||||||||||
| Commercial Services: 0.1% | ||||||||||
| 70 | @ | Apollo Group, Inc. | 5,650 | |||||||
| 400 | Cendant Corp. | 9,351 | ||||||||
| 70 | Equifax, Inc. | 1,967 | ||||||||
| 90 | H&R Block, Inc. | 4,410 | ||||||||
| 110 | McKesson Corp. | 3,461 | ||||||||
| 50 | Moody’s Corp. | 4,343 | ||||||||
| 140 | Paychex, Inc. | 4,771 | ||||||||
| 80 | R.R. Donnelley & Sons Co. | 2,823 | ||||||||
| 60 | Robert Half Intl., Inc. | 1,766 | ||||||||
| 38,542 | ||||||||||
| Computers: 0.4% | ||||||||||
| 50 | @ | Affiliated Computer Services, Inc. | 3,010 | |||||||
| 240 | @ | Apple Computer, Inc. | 15,456 | |||||||
| 70 | @ | Computer Sciences Corp. | 3,946 | |||||||
| 1,580 | @ | Dell, Inc. | 66,580 | |||||||
| 200 | Electronic Data Systems Corp. | 4,620 | ||||||||
| 910 | @ | EMC Corp. | 13,532 | |||||||
| 160 | @ | Gateway, Inc. | 962 | |||||||
| 1,169 | Hewlett-Packard Co. | 24,514 | ||||||||
| 850 | International Business Machines Corp. | 83,792 | ||||||||
| 60 | @ | Lexmark Intl., Inc. | 5,100 | |||||||
| 30 | @ | NCR Corp. | 2,077 | |||||||
71
| Shares | Value | |||||||||
| Computers (continued) | ||||||||||
| 130 | @ | Network Appliance, Inc. | $ | 4,319 | ||||||
| 2,160 | @ | Sun Microsystems, Inc. | 11,621 | |||||||
| 120 | @ | Sungard Data Systems, Inc. | 3,400 | |||||||
| 130 | @ | Unisys Corp. | 1,323 | |||||||
| 244,252 | ||||||||||
| Cosmetics/Personal Care: 0.2% | ||||||||||
| 45 | Alberto-Culver Co. | 2,186 | ||||||||
| 70 | Avon Products, Inc. | 2,709 | ||||||||
| 210 | Colgate-Palmolive Co. | 10,744 | ||||||||
| 640 | Gillette Co. | 28,659 | ||||||||
| 180 | Kimberly-Clark Corp. | 11,846 | ||||||||
| 1,620 | Procter & Gamble Co. | 89,229 | ||||||||
| 145,373 | ||||||||||
| Distribution/Wholesale: 0.0% | ||||||||||
| 90 | Genuine Parts Co. | 3,965 | ||||||||
| 50 | W.W. Grainger, Inc. | 3,331 | ||||||||
| 7,296 | ||||||||||
| Diversified Financial Services: 0.5% | ||||||||||
| 640 | American Express Co. | 36,077 | ||||||||
| 40 | Bear Stearns Cos., Inc. | 4,092 | ||||||||
| 160 | Capital One Financial Corp. | 13,474 | ||||||||
| 110 | CIT Group, Inc. | 5,040 | ||||||||
| 1,949 | Citigroup, Inc. | 93,903 | ||||||||
| 210 | Countrywide Financial Corp. | 7,772 | ||||||||
| 140 | @ | E*TRADE Financial Corp. | 2,093 | |||||||
| 360 | Fannie Mae | 25,636 | ||||||||
| 40 | Federated Investors, Inc. | 1,216 | ||||||||
| 90 | Franklin Resources, Inc. | 6,269 | ||||||||
| 250 | Freddie Mac | 18,425 | ||||||||
| 180 | Goldman Sachs Group, Inc. | 18,727 | ||||||||
| 40 | Janus Capital Group, Inc. | 672 | ||||||||
| 140 | Lehman Brothers Holdings, Inc. | 12,247 | ||||||||
| 475 | MBNA Corp. | 13,390 | ||||||||
| 360 | Merrill Lynch & Co., Inc. | 21,517 | ||||||||
| 410 | Morgan Stanley | 22,763 | ||||||||
| 150 | @ | Providian Financial Corp. | 2,471 | |||||||
| 180 | SLM Corp. | 9,610 | ||||||||
| 50 | T. Rowe Price Group, Inc. | 3,110 | ||||||||
| 318,504 | ||||||||||
| Electric: 0.2% | ||||||||||
| 230 | @ | AES Corp. | 3,144 | |||||||
| 30 | Ameren Corp. | 1,504 | ||||||||
| 160 | American Electric Power Co., Inc. | 5,494 | ||||||||
| 30 | Cinergy Corp. | 1,249 | ||||||||
| 100 | Consolidated Edison, Inc. | 4,375 | ||||||||
| 70 | Constellation Energy Group, Inc. | 3,060 | ||||||||
| 50 | Dominion Resources, Inc. | 3,387 | ||||||||
| 60 | DTE Energy Co. | 2,588 | ||||||||
| 600 | Duke Energy Corp. | 15,198 | ||||||||
| 130 | Edison Intl. | 4,164 | ||||||||
| 80 | Entergy Corp. | 5,407 | ||||||||
| 260 | Exelon Corp. | 11,458 | ||||||||
| 120 | FirstEnergy Corp. | 4,741 | ||||||||
| 70 | FPL Group, Inc. | 5,233 | ||||||||
| 160 | @ | PG&E Corp. | 5,325 | |||||||
| 30 | Pinnacle West Capital Corp. | 1,332 | ||||||||
| 100 | PPL Corp. | 5,328 | ||||||||
| 90 | Public Service Enterprise Group, Inc. | 4,659 | ||||||||
| 280 | Southern Co. | 9,386 | ||||||||
| 90 | TECO Energy, Inc. | 1,381 | ||||||||
| 150 | TXU Corp. | 9,684 | ||||||||
| 140 | Xcel Energy, Inc. | 2,548 | ||||||||
| 110,645 | ||||||||||
| Electrical Components and Equipment: 0.0% | ||||||||||
| 210 | Emerson Electric Co. | 14,721 | ||||||||
| 14,721 | ||||||||||
| Electronics: 0.0% | ||||||||||
| 170 | @ | Agilent Technologies, Inc. | 4,096 | |||||||
| 80 | Applera Corp. — Applied Biosystems Group | 1,673 | ||||||||
| 50 | @ | Fisher Scientific Intl. | 3,119 | |||||||
| 70 | @ | Jabil Circuit, Inc. | 1,791 | |||||||
| 50 | Parker Hannifin Corp. | 3,787 | ||||||||
| 60 | PerkinElmer, Inc. | 1,349 | ||||||||
| 170 | @ | Sanmina-SCI Corp. | 1,440 | |||||||
| 290 | @ | Solectron Corp. | 1,546 | |||||||
| 50 | Tektronix, Inc. | 1,511 | ||||||||
| 70 | @ | Thermo Electron Corp. | 2,113 | |||||||
| 50 | @ | Waters Corp. | 2,340 | |||||||
| 24,765 | ||||||||||
| Engineering and Construction: 0.0% | ||||||||||
| 30 | Fluor Corp. | 1,635 | ||||||||
| 1,635 | ||||||||||
| Entertainment: 0.0% | ||||||||||
| 120 | International Game Technology | 4,126 | ||||||||
| 4,126 | ||||||||||
| Environmental Control: 0.0% | ||||||||||
| 200 | Waste Management, Inc. | 5,988 | ||||||||
| 5,988 | ||||||||||
| Food: 0.1% | ||||||||||
| 140 | Albertson’s, Inc. | 3,343 | ||||||||
| 150 | Campbell Soup Co. | 4,484 | ||||||||
| 210 | ConAgra Foods, Inc. | 6,185 | ||||||||
| 140 | General Mills, Inc. | 6,959 | ||||||||
| 130 | H.J. Heinz Co. | 5,069 | ||||||||
| 100 | Hershey Foods Corp. | 5,554 | ||||||||
| 140 | Kellogg Co. | 6,252 | ||||||||
| 110 | @ | Kroger Co. | 1,929 | |||||||
| 60 | McCormick & Co., Inc. | 2,316 | ||||||||
| 170 | @ | Safeway, Inc. | 3,356 | |||||||
| 290 | Sara Lee Corp. | 7,001 | ||||||||
| 60 | SUPERVALU, Inc. | 2,071 | ||||||||
| 140 | Wm. Wrigley Jr. Co. | 9,686 | ||||||||
| 64,205 | ||||||||||
| Forest Products and Paper: 0.0% | ||||||||||
| 100 | Georgia-Pacific Corp. | 3,748 | ||||||||
| 200 | International Paper Co. | 8,400 | ||||||||
| 60 | Louisiana-Pacific Corp. | 1,604 | ||||||||
| 110 | MeadWestvaco Corp. | 3,728 | ||||||||
| 60 | Plum Creek Timber Co., Inc. | 2,306 | ||||||||
| 30 | Temple-Inland, Inc. | 2,052 | ||||||||
| 130 | Weyerhaeuser Co. | 8,739 | ||||||||
| 30,577 | ||||||||||
| Gas: 0.0% | ||||||||||
| 50 | KeySpan Corp. | 1,973 | ||||||||
| 110 | Sempra Energy | 4,034 | ||||||||
| 6,007 | ||||||||||
| Hand/Machine Tools: 0.0% | ||||||||||
| 40 | Black & Decker Corp. | 3,533 | ||||||||
| 30 | Snap-On, Inc. | 1,031 | ||||||||
| 50 | Stanley Works | 2,450 | ||||||||
| 7,014 | ||||||||||
| Healthcare — Products: 0.3% | ||||||||||
| 20 | Bausch & Lomb, Inc. | 1,289 | ||||||||
| 90 | Baxter Intl., Inc. | 3,109 | ||||||||
72
| Shares | Value | |||||||||
| Healthcare — Products (continued) | ||||||||||
| 160 | Becton Dickinson & Co. | $ | 9,088 | |||||||
| 90 | Biomet, Inc. | 3,905 | ||||||||
| 310 | @ | Boston Scientific Corp. | 11,021 | |||||||
| 60 | C.R. Bard, Inc. | 3,839 | ||||||||
| 50 | Guidant Corp. | 3,605 | ||||||||
| 1,890 | Johnson & Johnson | 119,863 | ||||||||
| 460 | Medtronic, Inc. | 22,848 | ||||||||
| 140 | @ | St. Jude Medical, Inc. | 5,870 | |||||||
| 60 | Stryker Corp. | 2,895 | ||||||||
| 100 | @ | Zimmer Holdings, Inc. | 8,012 | |||||||
| 195,344 | ||||||||||
| Healthcare — Services: 0.1% | ||||||||||
| 80 | @ | Humana, Inc. | 2,375 | |||||||
| 50 | @ | Laboratory Corp. Of America Holdings | 2,491 | |||||||
| 40 | Manor Care, Inc. | 1,417 | ||||||||
| 40 | Quest Diagnostics, Inc. | 3,822 | ||||||||
| 420 | UnitedHealth Group, Inc. | 36,973 | ||||||||
| 190 | @ | WellPoint, Inc. | 21,850 | |||||||
| 68,928 | ||||||||||
| Home Builders: 0.0% | ||||||||||
| 20 | Centex Corp. | 1,192 | ||||||||
| 1,192 | ||||||||||
| Home Furnishings: 0.0% | ||||||||||
| 80 | Leggett & Platt, Inc. | 2,275 | ||||||||
| 20 | Whirlpool Corp. | 1,384 | ||||||||
| 3,659 | ||||||||||
| Household Products/Wares: 0.0% | ||||||||||
| 40 | Avery Dennison Corp. | 2,399 | ||||||||
| 80 | Clorox Co. | 4,714 | ||||||||
| 60 | Fortune Brands, Inc. | 4,631 | ||||||||
| 11,744 | ||||||||||
| Housewares: 0.0% | ||||||||||
| 110 | Newell Rubbermaid, Inc. | 2,661 | ||||||||
| 2,661 | ||||||||||
| Insurance: 0.3% | ||||||||||
| 100 | @@ | ACE Ltd. | 4,275 | |||||||
| 190 | AFLAC, Inc. | 7,570 | ||||||||
| 260 | Allstate Corp. | 13,447 | ||||||||
| 40 | AMBAC Financial Group, Inc. | 3,285 | ||||||||
| 970 | American Intl. Group, Inc. | 63,699 | ||||||||
| 110 | AON Corp. | 2,625 | ||||||||
| 120 | Chubb Corp. | 9,228 | ||||||||
| 90 | CIGNA Corp. | 7,341 | ||||||||
| 63 | Cincinnati Financial Corp. | 2,788 | ||||||||
| 140 | Hartford Financial Services Group, Inc. | 9,703 | ||||||||
| 50 | Jefferson-Pilot Corp. | 2,598 | ||||||||
| 60 | Lincoln National Corp. | 2,801 | ||||||||
| 120 | Loews Corp. | 8,436 | ||||||||
| 80 | Marsh & McLennan Cos., Inc. | 2,632 | ||||||||
| 60 | MBIA, Inc. | 3,797 | ||||||||
| 280 | MetLife, Inc. | 11,343 | ||||||||
| 50 | MGIC Investment Corp. | 3,446 | ||||||||
| 120 | Principal Financial Group | 4,913 | ||||||||
| 80 | Progressive Corp. | 6,787 | ||||||||
| 320 | Prudential Financial, Inc. | 17,587 | ||||||||
| 80 | Safeco Corp. | 4,179 | ||||||||
| 100 | St. Paul Travelers Cos., Inc. | 3,707 | ||||||||
| 40 | Torchmark Corp. | 2,286 | ||||||||
| 120 | UnumProvident Corp. | 2,153 | ||||||||
| 50 | @@ | XL Capital Ltd. | 3,883 | |||||||
| 204,509 | ||||||||||
| Internet: 0.1% | ||||||||||
| 240 | @ | eBay, Inc. | 27,907 | |||||||
| 380 | @ | Symantec Corp. | 9,789 | |||||||
| 490 | @ | Yahoo!, Inc. | 18,463 | |||||||
| 56,159 | ||||||||||
| Iron/Steel: 0.0% | ||||||||||
| 60 | Nucor Corp. | 3,140 | ||||||||
| 40 | United States Steel Corp. | 2,050 | ||||||||
| 5,190 | ||||||||||
| Leisure Time: 0.0% | ||||||||||
| 50 | Brunswick Corp. | 2,475 | ||||||||
| 240 | Carnival Corp. | 13,831 | ||||||||
| 110 | Harley-Davidson, Inc. | 6,683 | ||||||||
| 50 | Sabre Holdings Corp. | 1,108 | ||||||||
| 24,097 | ||||||||||
| Lodging: 0.0% | ||||||||||
| 40 | Harrah’s Entertainment, Inc. | 2,676 | ||||||||
| 140 | Hilton Hotels Corp. | 3,184 | ||||||||
| 120 | Marriott Intl., Inc. | 7,557 | ||||||||
| 70 | Starwood Hotels & Resorts Worldwide, Inc. | 4,088 | ||||||||
| 17,505 | ||||||||||
| Machinery — Construction and Mining: 0.0% | ||||||||||
| 50 | Caterpillar, Inc. | 4,876 | ||||||||
| 4,876 | ||||||||||
| Machinery — Diversified: 0.0% | ||||||||||
| 20 | Cummins, Inc. | 1,676 | ||||||||
| 100 | Deere & Co. | 7,439 | ||||||||
| 70 | Rockwell Automation, Inc. | 3,469 | ||||||||
| 12,584 | ||||||||||
| Media: 0.3% | ||||||||||
| 830 | @ | Comcast Corp. | 27,622 | |||||||
| 100 | Gannett Co., Inc. | 8,170 | ||||||||
| 30 | Knight-Ridder, Inc. | 2,008 | ||||||||
| 120 | McGraw-Hill Cos., Inc. | 10,985 | ||||||||
| 20 | Meredith Corp. | 1,084 | ||||||||
| 60 | New York Times Co. | 2,448 | ||||||||
| 980 | News Corp. | 18,287 | ||||||||
| 1,690 | @ | Time Warner, Inc. | 32,853 | |||||||
| 50 | Tribune Co. | 2,107 | ||||||||
| 650 | Viacom, Inc. | 23,654 | ||||||||
| 780 | Walt Disney Co. | 21,684 | ||||||||
| 150,902 | ||||||||||
| Mining: 0.0% | ||||||||||
| 40 | Phelps Dodge Corp. | 3,957 | ||||||||
| 3,957 | ||||||||||
| Miscellaneous Manufacturing: 0.4% | ||||||||||
| 290 | 3M Co. | 23,800 | ||||||||
| 40 | Cooper Industries Ltd. | 2,716 | ||||||||
| 120 | Danaher Corp. | 6,889 | ||||||||
| 30 | Dover Corp. | 1,258 | ||||||||
| 140 | Eastman Kodak Co. | 4,515 | ||||||||
| 50 | Eaton Corp. | 3,618 | ||||||||
| 3,940 | General Electric Co. | 143,809 | ||||||||
| 320 | Honeywell Intl., Inc. | 11,331 | ||||||||
| 120 | Illinois Tool Works, Inc. | 11,122 | ||||||||
| 60 | @@ | Ingersoll-Rand Co. | 4,818 | |||||||
| 30 | ITT Industries, Inc. | 2,534 | ||||||||
| 50 | Pall Corp. | 1,448 | ||||||||
| 50 | Textron, Inc. | 3,690 | ||||||||
| 750 | @@ | Tyco Intl., Ltd. | 26,805 | |||||||
| 248,353 | ||||||||||
73
| Shares | Value | |||||||||
| Office/Business Equipment: 0.0% | ||||||||||
| 80 | Pitney Bowes, Inc. | $ | 3,702 | |||||||
| 480 | @ | Xerox Corp. | 8,165 | |||||||
| 11,867 | ||||||||||
| Oil and Gas: 0.6% | ||||||||||
| 50 | Amerada Hess Corp. | 4,119 | ||||||||
| 110 | Anadarko Petroleum Corp. | 7,129 | ||||||||
| 118 | Apache Corp. | 5,967 | ||||||||
| 240 | Burlington Resources, Inc. | 10,440 | ||||||||
| 1,010 | ChevronTexaco Corp. | 53,035 | ||||||||
| 410 | ConocoPhillips | 35,600 | ||||||||
| 300 | Devon Energy Corp. | 11,676 | ||||||||
| 40 | EOG Resources, Inc. | 2,854 | ||||||||
| 3,070 | Exxon Mobil Corp. | 157,369 | ||||||||
| 60 | Kerr-McGee Corp. | 3,467 | ||||||||
| 120 | Marathon Oil Corp. | 4,513 | ||||||||
| 20 | @,@@ | Nabors Industries, Ltd. | 1,026 | |||||||
| 50 | @ | Noble Corp. | 2,487 | |||||||
| 150 | Occidental Petroleum Corp. | 8,754 | ||||||||
| 30 | Sunoco, Inc. | 2,451 | ||||||||
| 100 | @ | Transocean, Inc. | 4,239 | |||||||
| 90 | Unocal Corp. | 3,892 | ||||||||
| 160 | Valero Energy Corp. | 7,264 | ||||||||
| 326,282 | ||||||||||
| Oil and Gas Services: 0.0% | ||||||||||
| 120 | Baker Hughes, Inc. | 5,120 | ||||||||
| 60 | BJ Services Co. | 2,792 | ||||||||
| 150 | Halliburton Co. | 5,887 | ||||||||
| 13,799 | ||||||||||
| Packaging and Containers: 0.0% | ||||||||||
| 60 | Ball Corp. | 2,639 | ||||||||
| 60 | Bemis Co. | 1,745 | ||||||||
| 50 | @ | Pactiv Corp. | 1,265 | |||||||
| 30 | @ | Sealed Air Corp. | 1,598 | |||||||
| 7,247 | ||||||||||
| Pharmaceuticals: 0.4% | ||||||||||
| 580 | Abbott Laboratories | 27,057 | ||||||||
| 50 | Allergan, Inc. | 4,054 | ||||||||
| 40 | AmerisourceBergen Corp. | 2,347 | ||||||||
| 720 | Bristol-Myers Squibb Co. | 18,446 | ||||||||
| 210 | Cardinal Health, Inc. | 12,212 | ||||||||
| 290 | @ | Caremark Rx, Inc. | 11,435 | |||||||
| 170 | Eli Lilly & Co. | 9,648 | ||||||||
| 30 | @ | Express Scripts, Inc. | 2,293 | |||||||
| 130 | @ | Forest Laboratories, Inc. | 5,832 | |||||||
| 160 | @ | Gilead Sciences, Inc. | 5,598 | |||||||
| 60 | @ | Hospira, Inc. | 2,010 | |||||||
| 110 | @ | King Pharmaceuticals, Inc. | 1,364 | |||||||
| 102 | @ | Medco Health Solutions, Inc. | 4,243 | |||||||
| 830 | Merck & Co., Inc. | 26,676 | ||||||||
| 2,836 | Pfizer, Inc. | 76,260 | ||||||||
| 540 | Schering-Plough Corp. | 11,275 | ||||||||
| 490 | Wyeth | 20,869 | ||||||||
| 241,619 | ||||||||||
| Pipelines: 0.0% | ||||||||||
| 100 | @ | Dynegy, Inc. | 462 | |||||||
| 200 | El Paso Corp. | 2,080 | ||||||||
| 20 | Kinder Morgan, Inc. | 1,463 | ||||||||
| 190 | Williams Cos., Inc. | 3,095 | ||||||||
| 7,100 | ||||||||||
| Real Estate Investment Trusts: 0.0% | ||||||||||
| 60 | Equity Office Properties Trust | 1,747 | ||||||||
| 70 | ProLogis | 3,033 | ||||||||
| 80 | Simon Property Group, Inc. | 5,174 | ||||||||
| 9,954 | ||||||||||
| Retail: 0.6% | ||||||||||
| 120 | @ | Bed Bath & Beyond, Inc. | 4,780 | |||||||
| 120 | Best Buy Co., Inc. | 7,130 | ||||||||
| 140 | Circuit City Stores, Inc. | 2,190 | ||||||||
| 290 | Costco Wholesale Corp. | 14,039 | ||||||||
| 150 | CVS Corp. | 6,761 | ||||||||
| 70 | Darden Restaurants, Inc. | 1,942 | ||||||||
| 50 | Dillard’s, Inc. | 1,344 | ||||||||
| 60 | Federated Department Stores, Inc. | 3,467 | ||||||||
| 450 | Gap, Inc. | 9,504 | ||||||||
| 1,390 | Home Depot, Inc. | 59,408 | ||||||||
| 180 | J.C. Penney Co., Inc. Holding Co. | 7,452 | ||||||||
| 50 | @ | Kohl’s Corp. | 2,459 | |||||||
| 240 | Limited Brands, Inc. | 5,525 | ||||||||
| 300 | Lowe’s Cos., Inc. | 17,277 | ||||||||
| 110 | May Department Stores Co. | 3,234 | ||||||||
| 800 | McDonald’s Corp. | 25,647 | ||||||||
| 50 | Nordstrom, Inc. | 2,337 | ||||||||
| 120 | @ | Office Depot, Inc. | 2,083 | |||||||
| 50 | RadioShack Corp. | 1,644 | ||||||||
| 320 | Staples, Inc. | 10,787 | ||||||||
| 200 | @ | Starbucks Corp. | 12,472 | |||||||
| 340 | Target Corp. | 17,655 | ||||||||
| 180 | TJX Cos., Inc. | 4,523 | ||||||||
| 80 | @ | Toys R US, Inc. | 1,638 | |||||||
| 1,590 | Wal-Mart Stores, Inc. | 83,983 | ||||||||
| 380 | Walgreen Co. | 14,581 | ||||||||
| 40 | Wendy’s Intl., Inc. | 1,570 | ||||||||
| 110 | Yum! Brands, Inc. | 5,190 | ||||||||
| 330,622 | ||||||||||
| Savings and Loans: 0.0% | ||||||||||
| 120 | Golden West Financial Corp. | 7,370 | ||||||||
| 50 | Sovereign Bancorp, Inc. | 1,128 | ||||||||
| 320 | Washington Mutual, Inc. | 13,530 | ||||||||
| 22,028 | ||||||||||
| Semiconductors: 0.2% | ||||||||||
| 60 | @ | Advanced Micro Devices, Inc. | 1,321 | |||||||
| 180 | @ | Altera Corp. | 3,726 | |||||||
| 150 | Analog Devices, Inc. | 5,538 | ||||||||
| 640 | @ | Applied Materials, Inc. | 10,944 | |||||||
| 131 | @ | Freescale Semiconductor Inc. | 2,405 | |||||||
| 2,400 | Intel Corp. | 56,136 | ||||||||
| 70 | @ | KLA-Tencor Corp. | 3,261 | |||||||
| 120 | Linear Technology Corp. | 4,651 | ||||||||
| 50 | Maxim Integrated Products, Inc. | 2,120 | ||||||||
| 140 | National Semiconductor Corp. | 2,513 | ||||||||
| 40 | @ | Qlogic Corp. | 1,469 | |||||||
| 260 | Texas Instruments, Inc. | 6,401 | ||||||||
| 100,485 | ||||||||||
| Software: 0.4% | ||||||||||
| 90 | Adobe Systems, Inc. | 5,647 | ||||||||
| 120 | Autodesk, Inc. | 4,554 | ||||||||
| 210 | Automatic Data Processing, Inc. | 9,314 | ||||||||
| 104 | @ | BMC Software, Inc. | 1,934 | |||||||
| 80 | @ | Citrix Systems, Inc. | 1,962 | |||||||
| 220 | Computer Associates Intl., Inc. | 6,833 | ||||||||
| 200 | @ | Compuware Corp. | 1,294 | |||||||
| 50 | @ | Electronic Arts, Inc. | 3,084 | |||||||
| 315 | First Data Corp. | 13,400 | ||||||||
| 75 | @ | Fiserv, Inc. | 3,014 | |||||||
| 80 | IMS Health, Inc. | 1,857 | ||||||||
| 70 | @ | Intuit, Inc. | 3,081 | |||||||
| 4,040 | Microsoft Corp. | 107,908 | ||||||||
| 150 | @ | Novell, Inc. | 1,013 | |||||||
| 3,320 | @ | Oracle Corp. | 45,550 | |||||||
| 120 | @ | Parametric Technology Corp. | 707 | |||||||
| 140 | @ | PeopleSoft, Inc. | 3,707 | |||||||
74
| Shares | Value | |||||||||
| Software (continued) | ||||||||||
| 180 | @ | Siebel Systems, Inc. | $ | 1,890 | ||||||
| 160 | @ | Veritas Software Corp. | 4,568 | |||||||
| 221,317 | ||||||||||
| Telecommunications: 0.5% | ||||||||||
| 170 | Alltel Corp. | 9,989 | ||||||||
| 122 | AT&T Corp. | 2,325 | ||||||||
| 170 | @ | Avaya, Inc. | 2,924 | |||||||
| 700 | BellSouth Corp. | 19,453 | ||||||||
| 60 | CenturyTel, Inc. | 2,128 | ||||||||
| 2,510 | @ | Cisco Systems, Inc. | 48,443 | |||||||
| 90 | Citizens Communications Co. | 1,241 | ||||||||
| 80 | @ | Comverse Technology, Inc. | 1,956 | |||||||
| 200 | @ | Corning, Inc. | 2,354 | |||||||
| 1,560 | @ | Lucent Technologies, Inc. | 5,866 | |||||||
| 880 | Motorola, Inc. | 15,136 | ||||||||
| 410 | @ | Nextel Communications, Inc. | 12,300 | |||||||
| 600 | QUALCOMM, Inc. | 25,440 | ||||||||
| 270 | @ | Qwest Communications Intl., Inc. | 1,199 | |||||||
| 1,260 | SBC Communications, Inc. | 32,470 | ||||||||
| 80 | Scientific-Atlanta, Inc. | 2,641 | ||||||||
| 550 | Sprint Corp. | 13,668 | ||||||||
| 170 | @ | Tellabs, Inc. | 1,460 | |||||||
| 1,390 | Verizon Communications, Inc. | 56,309 | ||||||||
| 257,302 | ||||||||||
| Textiles: 0.0% | ||||||||||
| 60 | Cintas Corp. | 2,632 | ||||||||
| 2,632 | ||||||||||
| Toys/Games/Hobbies: 0.0% | ||||||||||
| 100 | Hasbro, Inc. | 1,938 | ||||||||
| 160 | Mattel, Inc. | 3,118 | ||||||||
| 5,056 | ||||||||||
| Transportation: 0.1% | ||||||||||
| 180 | Burlington Northern Santa Fe Corp. | 8,516 | ||||||||
| 80 | CSX Corp. | 3,206 | ||||||||
| 190 | FedEx Corp. | 18,713 | ||||||||
| 190 | Norfolk Southern Corp. | 6,876 | ||||||||
| 30 | Ryder System, Inc. | 1,433 | ||||||||
| 0 | Union Pacific Corp. | 0 | ||||||||
| 420 | United Parcel Service, Inc. | 35,894 | ||||||||
| 74,638 | ||||||||||
| Total Common Stock (Cost $3,854,880) | 4,415,612 | |||||||||
| Principal | ||||||||||
| Amount | Value | |||||||||
| U.S. GOVERNMENT AGENCY OBLIGATIONS: 52.3% | ||||||||||
| Federal Home Loan Mortgage Corporation: 16.1% | ||||||||||
| $ | 10,000,000 | 2.530%, due 05/31/05 | $ | 9,894,900 | ||||||
| 9,894,900 | ||||||||||
| Federal National Mortgage Association: 24.2% | ||||||||||
| 15,000,000 | 2.520%, due 06/14/05 | 14,828,671 | ||||||||
| 14,828,671 | ||||||||||
| Other: 12.0% | ||||||||||
| 1,164,000 | FICO STRIP, 2.350%, due 04/06/05 | 1,156,749 | ||||||||
| 1,959,000 | FICO STRIP, 2.530%, due 06/06/05 | 1,937,590 | ||||||||
| 3,238,000 | FICO STRIP, 2.530%, due 06/06/05 | 3,202,612 | ||||||||
| 1,100,000 | Tennessee Valley Authority, 2.510%, due 04/15/05 | 1,092,001 | ||||||||
| 7,388,952 | ||||||||||
| Total U.S. Government Agency Obligations (Cost $31,778,201) | 32,112,523 | |||||||||
| U.S. TREASURY OBLIGATIONS: 2.0% | ||||||||||
| U.S. Treasury STRIP: 2.0% | ||||||||||
| 1,271,000 | 2.560%, due 08/15/05 | 1,250,989 | ||||||||
| Total U.S. Treasury Obligations (Cost $1,255,371) | 1,250,989 | |||||||||
| OTHER BONDS: 37.9% | ||||||||||
| Sovereign: 37.9% | ||||||||||
| 3,510,000 | Israel Government Aid Bond, 2.440%, due 05/15/05 | 3,478,119 | ||||||||
| 5,000,000 | Israel Trust, 2.710%, due 05/15/05 | 4,949,725 | ||||||||
| 15,000,000 | Israel Trust, 2.710%, due 05/15/05 | 14,849,175 | ||||||||
| Total Other Bonds (Cost $23,166,625) | 23,277,019 | |||||||||
| Total Long-Term Investments (Cost $60,055,077) | 61,056,143 | |||||||||
| SHORT-TERM INVESTMENTS: 0.7% | ||||||||||
| Repurchase Agreement: 0.7% | ||||||||||
| 456,000 | Morgan Stanley Repurchase Agreement dated 12/31/04, 2.200% due 01/03/05, $456,084 to be received upon repurchase (Collateralized by $425,000 Federal Home Loan Bank, 5.750%, Market Value plus accrued interest $467,303, due 05/15/12) | 456,000 | ||||||||
| Total Short-term Investments (Cost $456,000) | 456,000 | |||||||||
Total Investments In Securities (Cost $60,511,077)* | 100.1 | % | $ | 61,512,143 | ||||||||
Other Assets and Liabilities-Net | (0.1 | ) | (76,272 | ) | ||||||||
Net Assets | 100.0 | % | $ | 61,435,871 | ||||||||
| @ | Non-income producing security | |
| @@ | Foreign issuer | |
| STRIP | Separate Trading of Registered Interest and Principal of Securities | |
| * | Cost for federal income tax purposes is $60,690,047. Net unrealized depreciation consists of: |
| Gross Unrealized Appreciation | $ | 907,404 | ||
| Gross Unrealized Depreciation | (85,308 | ) | ||
| Net Unrealized Appreciation | $ | 822,096 | ||
75
| Shares | Value | |||||||||
| COMMON STOCK: 5.4% | ||||||||||
| Advertising: 0.0% | ||||||||||
| 70 | @ | Interpublic Group of Cos., Inc. | $ | 938 | ||||||
| 45 | Omnicom Group, Inc. | 3,794 | ||||||||
| 4,732 | ||||||||||
| Aerospace/Defense: 0.1% | ||||||||||
| 306 | Boeing Co. | 15,841 | ||||||||
| 75 | General Dynamics Corp. | 7,845 | ||||||||
| 30 | Goodrich Corp. | 979 | ||||||||
| 20 | L-3 Communications Holdings, Inc. | 1,465 | ||||||||
| 131 | Lockheed Martin Corp. | 7,277 | ||||||||
| 80 | Northrop Grumman Corp. | 4,349 | ||||||||
| 170 | Raytheon Co. | 6,601 | ||||||||
| 33 | Rockwell Collins, Inc. | 1,302 | ||||||||
| 111 | United Technologies Corp. | 11,472 | ||||||||
| 57,131 | ||||||||||
| Agriculture: 0.1% | ||||||||||
| 445 | Altria Group, Inc. | 27,189 | ||||||||
| 132 | Archer-Daniels-Midland Co. | 2,945 | ||||||||
| 59 | Monsanto Co. | 3,277 | ||||||||
| 30 | Reynolds American, Inc. | 2,358 | ||||||||
| 60 | UST, Inc. | 2,887 | ||||||||
| 38,656 | ||||||||||
| Apparel: 0.0% | ||||||||||
| 50 | @ | Coach, Inc. | 2,820 | |||||||
| 25 | Jones Apparel Group, Inc. | 914 | ||||||||
| 20 | Liz Claiborne, Inc. | 844 | ||||||||
| 100 | Nike, Inc. | 9,070 | ||||||||
| 15 | Reebok Intl., Ltd. | 660 | ||||||||
| 30 | VF Corp. | 1,661 | ||||||||
| 15,969 | ||||||||||
| Auto Manufacturers: 0.0% | ||||||||||
| 684 | Ford Motor Co. | 10,014 | ||||||||
| 120 | General Motors Corp. | 4,807 | ||||||||
| 50 | PACCAR, Inc. | 4,024 | ||||||||
| 18,845 | ||||||||||
| Auto Parts and Equipment: 0.0% | ||||||||||
| 50 | @ | Goodyear Tire & Rubber Co. | 733 | |||||||
| 44 | Johnson Controls, Inc. | 2,791 | ||||||||
| 3,524 | ||||||||||
| Banks: 0.4% | ||||||||||
| 75 | AmSouth Bancorporation | 1,943 | ||||||||
| 868 | Bank of America Corp. | 40,786 | ||||||||
| 120 | BB&T Corp. | 5,046 | ||||||||
| 50 | Comerica, Inc. | 3,051 | ||||||||
| 20 | Compass Bancshares, Inc. | 973 | ||||||||
| 50 | Fifth Third Bancorp | 2,364 | ||||||||
| 30 | First Horizon National Corp. | 1,293 | ||||||||
| 51 | Huntington Bancshares, Inc. | 1,264 | ||||||||
| 120 | KeyCorp | 4,068 | ||||||||
| 30 | M & T Bank Corp. | 3,235 | ||||||||
| 55 | Marshall & Ilsley Corp. | 2,431 | ||||||||
| 97 | Mellon Financial Corp. | 3,018 | ||||||||
| 196 | National City Corp. | 7,360 | ||||||||
| 95 | North Fork Bancorporation, Inc. | 2,741 | ||||||||
| 50 | Northern Trust Corp. | 2,429 | ||||||||
| 20 | PNC Financial Services Group, Inc. | 1,149 | ||||||||
| 100 | Regions Financial Corp. | 3,559 | ||||||||
| 65 | State Street Corp. | 3,193 | ||||||||
| 80 | SunTrust Banks, Inc. | 5,910 | ||||||||
| 30 | Synovus Financial Corp. | 857 | ||||||||
| 160 | The Bank of New York Co., Inc. | 5,347 | ||||||||
| 407 | U.S. Bancorp | 12,747 | ||||||||
| 346 | Wachovia Corp. | 18,200 | ||||||||
| 370 | Wells Fargo & Co. | 22,996 | ||||||||
| 17 | Zions Bancorporation | 1,157 | ||||||||
| 157,117 | ||||||||||
| Beverages: 0.1% | ||||||||||
| 10 | Adolph Coors Co. | 757 | ||||||||
| 67 | Anheuser-Busch Cos., Inc. | 3,399 | ||||||||
| 30 | Brown-Forman Corp. | 1,460 | ||||||||
| 521 | Coca-Cola Co. | 21,689 | ||||||||
| 108 | Coca-Cola Enterprises, Inc. | 2,252 | ||||||||
| 51 | Pepsi Bottling Group, Inc. | 1,379 | ||||||||
| 495 | PepsiCo, Inc. | 25,839 | ||||||||
| 56,775 | ||||||||||
| Biotechnology: 0.1% | ||||||||||
| 274 | @ | Amgen, Inc. | 17,577 | |||||||
| 70 | @ | Biogen Idec, Inc. | 4,663 | |||||||
| 50 | @ | Genzyme Corp. | 2,904 | |||||||
| 20 | @ | MedImmune, Inc. | 542 | |||||||
| 10 | @ | Millipore Corp. | 498 | |||||||
| 26,184 | ||||||||||
| Building Materials: 0.0% | ||||||||||
| 45 | @ | American Standard Cos., Inc. | 1,859 | |||||||
| 92 | Masco Corp. | 3,361 | ||||||||
| 25 | Vulcan Materials Co. | 1,365 | ||||||||
| 6,585 | ||||||||||
| Chemicals: 0.1% | ||||||||||
| 50 | Air Products & Chemicals, Inc. | 2,899 | ||||||||
| 10 | Ashland, Inc. | 584 | ||||||||
| 219 | Dow Chemical Co. | 10,842 | ||||||||
| 220 | E.I. du Pont de Nemours & Co. | 10,790 | ||||||||
| 20 | Eastman Chemical Co. | 1,155 | ||||||||
| 20 | Ecolab, Inc. | 703 | ||||||||
| 39 | Engelhard Corp. | 1,196 | ||||||||
| 20 | International Flavors & Fragrances, Inc. | 857 | ||||||||
| 62 | PPG Industries, Inc. | 4,226 | ||||||||
| 66 | Praxair, Inc. | 2,914 | ||||||||
| 45 | Rohm & Haas Co. | 1,990 | ||||||||
| 55 | Sherwin-Williams Co. | 2,455 | ||||||||
| 15 | Sigma-Aldrich Corp. | 907 | ||||||||
| 41,518 | ||||||||||
| Commercial Services: 0.0% | ||||||||||
| 42 | @ | Apollo Group, Inc. | 3,390 | |||||||
| 230 | Cendant Corp. | 5,376 | ||||||||
| 50 | Equifax, Inc. | 1,405 | ||||||||
| 43 | H&R Block, Inc. | 2,107 | ||||||||
| 60 | McKesson Corp. | 1,888 | ||||||||
| 30 | Moody’s Corp. | 2,606 | ||||||||
| 104 | Paychex, Inc. | 3,544 | ||||||||
| 40 | R.R. Donnelley & Sons Co. | 1,412 | ||||||||
| 40 | Robert Half Intl., Inc. | 1,177 | ||||||||
| 22,905 | ||||||||||
| Computers: 0.3% | ||||||||||
| 30 | @ | Affiliated Computer Services, Inc. | 1,806 | |||||||
| 140 | @ | Apple Computer, Inc. | 9,016 | |||||||
| 40 | @ | Computer Sciences Corp. | 2,255 | |||||||
| 904 | @ | Dell, Inc. | 38,095 | |||||||
| 110 | Electronic Data Systems Corp. | 2,541 | ||||||||
| 531 | @ | EMC Corp. | 7,896 | |||||||
| 70 | @ | Gateway, Inc. | 421 | |||||||
| 671 | Hewlett-Packard Co. | 14,071 | ||||||||
| 487 | International Business Machines Corp. | 48,007 | ||||||||
| 25 | @ | Lexmark Intl., Inc. | 2,125 | |||||||
| 20 | @ | NCR Corp. | 1,385 | |||||||
76
| Shares | Value | |||||||||
| Computers (continued) | ||||||||||
| 98 | @ | Network Appliance, Inc. | $ | 3,256 | ||||||
| 1,240 | @ | Sun Microsystems, Inc. | 6,671 | |||||||
| 70 | @ | Sungard Data Systems, Inc. | 1,983 | |||||||
| 80 | @ | Unisys Corp. | 814 | |||||||
| 140,342 | ||||||||||
| Cosmetics/Personal Care: 0.2% | ||||||||||
| 19 | Alberto-Culver Co. | 923 | ||||||||
| 40 | Avon Products, Inc. | 1,548 | ||||||||
| 116 | Colgate-Palmolive Co. | 5,935 | ||||||||
| 363 | Gillette Co. | 16,255 | ||||||||
| 105 | Kimberly-Clark Corp. | 6,910 | ||||||||
| 934 | Procter & Gamble Co. | 51,444 | ||||||||
| 83,015 | ||||||||||
| Distribution/Wholesale: 0.0% | ||||||||||
| 70 | Genuine Parts Co. | 3,084 | ||||||||
| 30 | W.W. Grainger, Inc. | 1,999 | ||||||||
| 5,083 | ||||||||||
| Diversified Financial Services: 0.5% | ||||||||||
| 367 | American Express Co. | 20,688 | ||||||||
| 30 | Bear Stearns Cos., Inc. | 3,069 | ||||||||
| 91 | Capital One Financial Corp. | 7,663 | ||||||||
| 60 | CIT Group, Inc. | 2,749 | ||||||||
| 1,116 | Citigroup, Inc. | 53,770 | ||||||||
| 116 | Countrywide Financial Corp. | 4,293 | ||||||||
| 80 | @ | E*TRADE Financial Corp. | 1,196 | |||||||
| 208 | Fannie Mae | 14,812 | ||||||||
| 20 | Federated Investors, Inc. | 608 | ||||||||
| 57 | Franklin Resources, Inc. | 3,970 | ||||||||
| 151 | Freddie Mac | 11,129 | ||||||||
| 102 | Goldman Sachs Group, Inc. | 10,612 | ||||||||
| 20 | Janus Capital Group, Inc. | 336 | ||||||||
| 78 | Lehman Brothers Holdings, Inc. | 6,823 | ||||||||
| 270 | MBNA Corp. | 7,611 | ||||||||
| 202 | Merrill Lynch & Co., Inc. | 12,074 | ||||||||
| 231 | Morgan Stanley | 12,825 | ||||||||
| 100 | @ | Providian Financial Corp. | 1,647 | |||||||
| 93 | SLM Corp. | 4,965 | ||||||||
| 30 | T. Rowe Price Group, Inc. | 1,866 | ||||||||
| 182,706 | ||||||||||
| Electric: 0.1% | ||||||||||
| 139 | @ | AES Corp. | 1,900 | |||||||
| 20 | Ameren Corp. | 1,003 | ||||||||
| 84 | American Electric Power Co., Inc. | 2,885 | ||||||||
| 20 | Cinergy Corp. | 833 | ||||||||
| 30 | @ | CMS Energy Corp. | 314 | |||||||
| 50 | Consolidated Edison, Inc. | 2,188 | ||||||||
| 35 | Constellation Energy Group, Inc. | 1,530 | ||||||||
| 30 | Dominion Resources, Inc. | 2,032 | ||||||||
| 40 | DTE Energy Co. | 1,725 | ||||||||
| 347 | Duke Energy Corp. | 8,789 | ||||||||
| 77 | Edison Intl. | 2,466 | ||||||||
| 50 | Entergy Corp. | 3,380 | ||||||||
| 144 | Exelon Corp. | 6,345 | ||||||||
| 70 | FirstEnergy Corp. | 2,766 | ||||||||
| 42 | FPL Group, Inc. | 3,140 | ||||||||
| 90 | @ | PG&E Corp. | 2,995 | |||||||
| 20 | Pinnacle West Capital Corp. | 888 | ||||||||
| 57 | PPL Corp. | 3,037 | ||||||||
| 50 | Public Service Enterprise Group, Inc. | 2,589 | ||||||||
| 160 | Southern Co. | 5,363 | ||||||||
| 50 | TECO Energy, Inc. | 767 | ||||||||
| 90 | TXU Corp. | 5,809 | ||||||||
| 94 | Xcel Energy, Inc. | 1,711 | ||||||||
| 64,455 | ||||||||||
| Electrical Components and Equipment: 0.0% | ||||||||||
| 120 | Emerson Electric Co. | 8,412 | ||||||||
| 8,412 | ||||||||||
| Electronics: 0.0% | ||||||||||
| 100 | @ | Agilent Technologies, Inc. | 2,409 | |||||||
| 50 | Applera Corp. — Applied Biosystems Group | 1,046 | ||||||||
| 30 | @ | Fisher Scientific Intl. | 1,871 | |||||||
| 33 | @ | Jabil Circuit, Inc. | 844 | |||||||
| 30 | Parker Hannifin Corp. | 2,271 | ||||||||
| 40 | PerkinElmer, Inc. | 900 | ||||||||
| 50 | @ | Sanmina-SCI Corp. | 424 | |||||||
| 190 | @ | Solectron Corp. | 1,013 | |||||||
| 10 | Tektronix, Inc. | 302 | ||||||||
| 50 | @ | Thermo Electron Corp. | 1,510 | |||||||
| 30 | @ | Waters Corp. | 1,404 | |||||||
| 13,994 | ||||||||||
| Engineering and Construction: 0.0% | ||||||||||
| 20 | Fluor Corp. | 1,090 | ||||||||
| 1,090 | ||||||||||
| Entertainment: 0.0% | ||||||||||
| 84 | International Game Technology | 2,888 | ||||||||
| 2,888 | ||||||||||
| Environmental Control: 0.0% | ||||||||||
| 128 | Waste Management, Inc. | 3,832 | ||||||||
| 3,832 | ||||||||||
| Food: 0.1% | ||||||||||
| 80 | Albertson’s, Inc. | 1,910 | ||||||||
| 90 | Campbell Soup Co. | 2,690 | ||||||||
| 120 | ConAgra Foods, Inc. | 3,534 | ||||||||
| 80 | General Mills, Inc. | 3,977 | ||||||||
| 80 | H.J. Heinz Co. | 3,119 | ||||||||
| 60 | Hershey Foods Corp. | 3,332 | ||||||||
| 86 | Kellogg Co. | 3,841 | ||||||||
| 60 | @ | Kroger Co. | 1,052 | |||||||
| 30 | McCormick & Co., Inc. | 1,158 | ||||||||
| 100 | @ | Safeway, Inc. | 1,974 | |||||||
| 170 | Sara Lee Corp. | 4,104 | ||||||||
| 50 | SUPERVALU, Inc. | 1,726 | ||||||||
| 84 | Wm. Wrigley Jr. Co. | 5,813 | ||||||||
| 38,230 | ||||||||||
| Forest Products and Paper: 0.0% | ||||||||||
| 60 | Georgia-Pacific Corp. | 2,249 | ||||||||
| 115 | International Paper Co. | 4,830 | ||||||||
| 30 | Louisiana-Pacific Corp. | 802 | ||||||||
| 40 | MeadWestvaco Corp. | 1,356 | ||||||||
| 40 | Plum Creek Timber Co., Inc. | 1,538 | ||||||||
| 20 | Temple-Inland, Inc. | 1,368 | ||||||||
| 70 | Weyerhaeuser Co. | 4,705 | ||||||||
| 16,848 | ||||||||||
| Gas: 0.0% | ||||||||||
| 40 | KeySpan Corp. | 1,578 | ||||||||
| 10 | Nicor, Inc. | 369 | ||||||||
| 69 | Sempra Energy | 2,531 | ||||||||
| 4,478 | ||||||||||
| Hand/Machine Tools: 0.0% | ||||||||||
| 28 | Black & Decker Corp. | 2,473 | ||||||||
| 10 | Snap-On, Inc. | 344 | ||||||||
| 25 | Stanley Works | 1,225 | ||||||||
| 4,042 | ||||||||||
77
| Shares | Value | |||||||||
| Healthcare — Products: 0.2% | ||||||||||
| 15 | Bausch & Lomb, Inc. | $ | 967 | |||||||
| 50 | Baxter Intl., Inc. | 1,727 | ||||||||
| 90 | Becton Dickinson & Co. | 5,112 | ||||||||
| 60 | Biomet, Inc. | 2,603 | ||||||||
| 184 | @ | Boston Scientific Corp. | 6,541 | |||||||
| 32 | C.R. Bard, Inc. | 2,047 | ||||||||
| 24 | Guidant Corp. | 1,730 | ||||||||
| 1,090 | Johnson & Johnson | 69,129 | ||||||||
| 270 | Medtronic, Inc. | 13,411 | ||||||||
| 84 | @ | St. Jude Medical, Inc. | 3,522 | |||||||
| 30 | Stryker Corp. | 1,448 | ||||||||
| 53 | @ | Zimmer Holdings, Inc. | 4,246 | |||||||
| 112,483 | ||||||||||
| Healthcare — Services: 0.1% | ||||||||||
| 53 | @ | Humana, Inc. | 1,574 | |||||||
| 30 | @ | Laboratory Corp. Of America Holdings | 1,495 | |||||||
| 20 | Manor Care, Inc. | 709 | ||||||||
| 20 | Quest Diagnostics, Inc. | 1,911 | ||||||||
| 244 | UnitedHealth Group, Inc. | 21,478 | ||||||||
| 104 | @ | WellPoint, Inc. | 11,960 | |||||||
| 39,127 | ||||||||||
| Home Builders: 0.0% | ||||||||||
| 14 | Centex Corp. | 834 | ||||||||
| 834 | ||||||||||
| Home Furnishings: 0.0% | ||||||||||
| 50 | Leggett & Platt, Inc. | 1,422 | ||||||||
| 15 | Whirlpool Corp. | 1,038 | ||||||||
| 2,460 | ||||||||||
| Household Products/Wares: 0.0% | ||||||||||
| 20 | Avery Dennison Corp. | 1,199 | ||||||||
| 45 | Clorox Co. | 2,653 | ||||||||
| 30 | Fortune Brands, Inc. | 2,315 | ||||||||
| 6,167 | ||||||||||
| Housewares: 0.0% | ||||||||||
| 60 | Newell Rubbermaid, Inc. | 1,451 | ||||||||
| 1,451 | ||||||||||
| Insurance: 0.2% | ||||||||||
| 62 | @@ | ACE Ltd. | 2,651 | |||||||
| 105 | AFLAC, Inc. | 4,183 | ||||||||
| 148 | Allstate Corp. | 7,655 | ||||||||
| 27 | AMBAC Financial Group, Inc. | 2,218 | ||||||||
| 560 | American Intl. Group, Inc. | 36,775 | ||||||||
| 60 | AON Corp. | 1,432 | ||||||||
| 73 | Chubb Corp. | 5,614 | ||||||||
| 51 | CIGNA Corp. | 4,160 | ||||||||
| 36 | Cincinnati Financial Corp. | 1,593 | ||||||||
| 80 | Hartford Financial Services Group, Inc. | 5,545 | ||||||||
| 30 | Jefferson-Pilot Corp. | 1,559 | ||||||||
| 40 | Lincoln National Corp. | 1,867 | ||||||||
| 70 | Loews Corp. | 4,921 | ||||||||
| 46 | Marsh & McLennan Cos., Inc. | 1,513 | ||||||||
| 30 | MBIA, Inc. | 1,898 | ||||||||
| 156 | MetLife, Inc. | 6,320 | ||||||||
| 30 | MGIC Investment Corp. | 2,067 | ||||||||
| 64 | Principal Financial Group | 2,620 | ||||||||
| 49 | Progressive Corp. | 4,157 | ||||||||
| 190 | Prudential Financial, Inc. | 10,442 | ||||||||
| 35 | Safeco Corp. | 1,828 | ||||||||
| 60 | St. Paul Travelers Cos., Inc. | 2,224 | ||||||||
| 20 | Torchmark Corp. | 1,143 | ||||||||
| 70 | UnumProvident Corp. | 1,256 | ||||||||
| 29 | @@ | XL Capital Ltd. | 2,252 | |||||||
| 117,893 | ||||||||||
| Internet: 0.1% | ||||||||||
| 144 | @ | eBay, Inc. | 16,745 | |||||||
| 224 | @ | Symantec Corp. | 5,770 | |||||||
| 300 | @ | Yahoo!, Inc. | 11,304 | |||||||
| 33,819 | ||||||||||
| Iron/Steel: 0.0% | ||||||||||
| 40 | Nucor Corp. | 2,094 | ||||||||
| 40 | United States Steel Corp. | 2,050 | ||||||||
| 4,144 | ||||||||||
| Leisure Time: 0.0% | ||||||||||
| 30 | Brunswick Corp. | 1,485 | ||||||||
| 130 | Carnival Corp. | 7,491 | ||||||||
| 62 | Harley-Davidson, Inc. | 3,767 | ||||||||
| 30 | Sabre Holdings Corp. | 665 | ||||||||
| 13,408 | ||||||||||
| Lodging: 0.0% | ||||||||||
| 20 | Harrah’s Entertainment, Inc. | 1,338 | ||||||||
| 81 | Hilton Hotels Corp. | 1,842 | ||||||||
| 55 | Marriott Intl., Inc. | 3,464 | ||||||||
| 40 | Starwood Hotels & Resorts Worldwide, Inc. | 2,336 | ||||||||
| 8,980 | ||||||||||
| Machinery — Construction and Mining: 0.0% | ||||||||||
| 32 | Caterpillar, Inc. | 3,120 | ||||||||
| 3,120 | ||||||||||
| Machinery — Diversified: 0.0% | ||||||||||
| 10 | Cummins, Inc. | 838 | ||||||||
| 55 | Deere & Co. | 4,092 | ||||||||
| 40 | Rockwell Automation, Inc. | 1,982 | ||||||||
| 6,912 | ||||||||||
| Media: 0.2% | ||||||||||
| 480 | @ | Comcast Corp. | 15,974 | |||||||
| 58 | Gannett Co., Inc. | 4,739 | ||||||||
| 7 | Knight-Ridder, Inc. | 469 | ||||||||
| 65 | McGraw-Hill Cos., Inc. | 5,950 | ||||||||
| 15 | Meredith Corp. | 813 | ||||||||
| 33 | New York Times Co. | 1,346 | ||||||||
| 570 | News Corp. | 10,636 | ||||||||
| 996 | @ | Time Warner, Inc. | 19,363 | |||||||
| 32 | Tribune Co. | 1,348 | ||||||||
| 370 | Viacom, Inc. | 13,464 | ||||||||
| 455 | Walt Disney Co. | 12,649 | ||||||||
| 86,751 | ||||||||||
| Mining: 0.0% | ||||||||||
| 25 | Phelps Dodge Corp. | 2,473 | ||||||||
| 2,473 | ||||||||||
| Miscellaneous Manufacturing: 0.3% | ||||||||||
| 172 | 3M Co. | 14,116 | ||||||||
| 17 | Cooper Industries Ltd. | 1,154 | ||||||||
| 60 | Danaher Corp. | 3,445 | ||||||||
| 20 | Dover Corp. | 839 | ||||||||
| 62 | Eastman Kodak Co. | 2,000 | ||||||||
| 30 | Eaton Corp. | 2,171 | ||||||||
| 2,268 | General Electric Co. | 82,781 | ||||||||
| 182 | Honeywell Intl., Inc. | 6,445 | ||||||||
| 70 | Illinois Tool Works, Inc. | 6,488 | ||||||||
| 33 | @@ | Ingersoll-Rand Co. | 2,650 | |||||||
| 16 | ITT Industries, Inc. | 1,351 | ||||||||
| 30 | Pall Corp. | 869 | ||||||||
78
| Shares | Value | |||||||||
| Miscellaneous Manufacturing (continued) | ||||||||||
| 40 | Textron, Inc. | $ | 2,952 | |||||||
| 438 | @@ | Tyco Intl., Ltd. | 15,653 | |||||||
| 142,914 | ||||||||||
| Office/Business Equipment: 0.0% | ||||||||||
| 50 | Pitney Bowes, Inc. | 2,314 | ||||||||
| 275 | @ | Xerox Corp. | 4,678 | |||||||
| 6,992 | ||||||||||
| Oil and Gas: 0.5% | ||||||||||
| 26 | Amerada Hess Corp. | 2,142 | ||||||||
| 68 | Anadarko Petroleum Corp. | 4,407 | ||||||||
| 72 | Apache Corp. | 3,641 | ||||||||
| 138 | Burlington Resources, Inc. | 6,003 | ||||||||
| 580 | ChevronTexaco Corp. | 30,456 | ||||||||
| 235 | ConocoPhillips | 20,405 | ||||||||
| 170 | Devon Energy Corp. | 6,616 | ||||||||
| 24 | EOG Resources, Inc. | 1,713 | ||||||||
| 1,765 | Exxon Mobil Corp. | 90,474 | ||||||||
| 26 | Kerr-McGee Corp. | 1,503 | ||||||||
| 67 | Marathon Oil Corp. | 2,520 | ||||||||
| 13 | @,@@ | Nabors Industries, Ltd. | 667 | |||||||
| 30 | @ | Noble Corp. | 1,492 | |||||||
| 83 | Occidental Petroleum Corp. | 4,844 | ||||||||
| 16 | Sunoco, Inc. | 1,307 | ||||||||
| 60 | @ | Transocean, Inc. | 2,543 | |||||||
| 53 | Unocal Corp. | 2,292 | ||||||||
| 80 | Valero Energy Corp. | 3,632 | ||||||||
| 186,657 | ||||||||||
| Oil and Gas Services: 0.0% | ||||||||||
| 70 | Baker Hughes, Inc. | 2,987 | ||||||||
| 24 | BJ Services Co. | 1,117 | ||||||||
| 90 | Halliburton Co. | 3,531 | ||||||||
| 7,635 | ||||||||||
| Packaging and Containers: 0.0% | ||||||||||
| 30 | Ball Corp. | 1,319 | ||||||||
| 30 | Bemis Co. | 873 | ||||||||
| 50 | @ | Pactiv Corp. | 1,265 | |||||||
| 25 | @ | Sealed Air Corp. | 1,331 | |||||||
| 4,788 | ||||||||||
| Pharmaceuticals: 0.3% | ||||||||||
| 330 | Abbott Laboratories | 15,395 | ||||||||
| 30 | Allergan, Inc. | 2,432 | ||||||||
| 20 | AmerisourceBergen Corp. | 1,174 | ||||||||
| 410 | Bristol-Myers Squibb Co. | 10,504 | ||||||||
| 120 | Cardinal Health, Inc. | 6,978 | ||||||||
| 170 | @ | Caremark Rx, Inc. | 6,703 | |||||||
| 103 | Eli Lilly & Co. | 5,845 | ||||||||
| 20 | @ | Express Scripts, Inc. | 1,529 | |||||||
| 81 | @ | Forest Laboratories, Inc. | 3,634 | |||||||
| 100 | @ | Gilead Sciences, Inc. | 3,499 | |||||||
| 30 | @ | Hospira, Inc. | 1,005 | |||||||
| 41 | @ | King Pharmaceuticals, Inc. | 508 | |||||||
| 64 | @ | Medco Health Solutions, Inc. | 2,662 | |||||||
| 486 | Merck & Co., Inc. | 15,620 | ||||||||
| 1,635 | Pfizer, Inc. | 43,965 | ||||||||
| 310 | Schering-Plough Corp. | 6,473 | ||||||||
| 290 | Wyeth | 12,351 | ||||||||
| 140,277 | ||||||||||
| Pipelines: 0.0% | ||||||||||
| 60 | @ | Dynegy, Inc. | 277 | |||||||
| 120 | El Paso Corp. | 1,248 | ||||||||
| 9 | Kinder Morgan, Inc. | 658 | ||||||||
| 120 | Williams Cos., Inc. | 1,955 | ||||||||
| 4,138 | ||||||||||
| Real Estate Investment Trusts: 0.0% | ||||||||||
| 20 | Apartment Investment & Management Co. | 771 | ||||||||
| 30 | Equity Office Properties Trust | 874 | ||||||||
| 40 | ProLogis | 1,733 | ||||||||
| 45 | Simon Property Group, Inc. | 2,910 | ||||||||
| 6,288 | ||||||||||
| Retail: 0.5% | ||||||||||
| 10 | @ | Autozone, Inc. | 913 | |||||||
| 61 | @ | Bed Bath & Beyond, Inc. | 2,430 | |||||||
| 70 | Best Buy Co., Inc. | 4,159 | ||||||||
| 50 | Circuit City Stores, Inc. | 782 | ||||||||
| 170 | Costco Wholesale Corp. | 8,230 | ||||||||
| 80 | CVS Corp. | 3,606 | ||||||||
| 40 | Darden Restaurants, Inc. | 1,110 | ||||||||
| 30 | Dillard’s, Inc. | 806 | ||||||||
| 51 | Federated Department Stores, Inc. | 2,947 | ||||||||
| 261 | Gap, Inc. | 5,512 | ||||||||
| 796 | Home Depot, Inc. | 34,021 | ||||||||
| 100 | J.C. Penney Co., Inc. Holding Co. | 4,140 | ||||||||
| 30 | @ | Kohl’s Corp. | 1,475 | |||||||
| 140 | Limited Brands, Inc. | 3,223 | ||||||||
| 172 | Lowe’s Cos., Inc. | 9,905 | ||||||||
| 60 | May Department Stores Co. | 1,764 | ||||||||
| 458 | McDonald’s Corp. | 14,683 | ||||||||
| 40 | Nordstrom, Inc. | 1,869 | ||||||||
| 94 | @ | Office Depot, Inc. | 1,632 | |||||||
| 53 | RadioShack Corp. | 1,743 | ||||||||
| 183 | Staples, Inc. | 6,169 | ||||||||
| 110 | @ | Starbucks Corp. | 6,860 | |||||||
| 200 | Target Corp. | 10,386 | ||||||||
| 106 | TJX Cos., Inc. | 2,664 | ||||||||
| 85 | @ | Toys R US, Inc. | 1,740 | |||||||
| 905 | Wal-Mart Stores, Inc. | 47,802 | ||||||||
| 220 | Walgreen Co. | 8,441 | ||||||||
| 39 | Wendy’s Intl., Inc. | 1,531 | ||||||||
| 61 | Yum! Brands, Inc. | 2,878 | ||||||||
| 193,421 | ||||||||||
| Savings and Loans: 0.0% | ||||||||||
| 60 | Golden West Financial Corp. | 3,685 | ||||||||
| 30 | Sovereign Bancorp, Inc. | 677 | ||||||||
| 183 | Washington Mutual, Inc. | 7,737 | ||||||||
| 12,099 | ||||||||||
| Semiconductors: 0.1% | ||||||||||
| 107 | @ | Altera Corp. | 2,215 | |||||||
| 85 | Analog Devices, Inc. | 3,138 | ||||||||
| 368 | @ | Applied Materials, Inc. | 6,293 | |||||||
| 76 | @ | Freescale Semiconductor Inc. | 1,395 | |||||||
| 1,368 | Intel Corp. | 31,998 | ||||||||
| 40 | @ | KLA-Tencor Corp. | 1,863 | |||||||
| 70 | Linear Technology Corp. | 2,713 | ||||||||
| 31 | Maxim Integrated Products, Inc. | 1,314 | ||||||||
| 80 | National Semiconductor Corp. | 1,436 | ||||||||
| 20 | @ | Qlogic Corp. | 735 | |||||||
| 150 | Texas Instruments, Inc. | 3,693 | ||||||||
| 56,793 | ||||||||||
| Software: 0.3% | ||||||||||
| 55 | Adobe Systems, Inc. | 3,451 | ||||||||
| 80 | Autodesk, Inc. | 3,036 | ||||||||
| 130 | Automatic Data Processing, Inc. | 5,766 | ||||||||
| 75 | @ | BMC Software, Inc. | 1,395 | |||||||
| 30 | @ | Citrix Systems, Inc. | 736 | |||||||
| 127 | Computer Associates Intl., Inc. | 3,945 | ||||||||
| 92 | @ | Compuware Corp. | 595 | |||||||
| 30 | @ | Electronic Arts, Inc. | 1,850 | |||||||
| 193 | First Data Corp. | 8,210 | ||||||||
| 45 | @ | Fiserv, Inc. | 1,809 | |||||||
79
| Shares | Value | |||||||||
| Software (continued) | ||||||||||
| 60 | IMS Health, Inc. | $ | 1,393 | |||||||
| 45 | @ | Intuit, Inc. | 1,980 | |||||||
| 2,344 | Microsoft Corp. | 62,609 | ||||||||
| 100 | @ | Novell, Inc. | 675 | |||||||
| 1,909 | @ | Oracle Corp. | 26,191 | |||||||
| 70 | @ | Parametric Technology Corp. | 412 | |||||||
| 80 | @ | PeopleSoft, Inc. | 2,118 | |||||||
| 110 | @ | Siebel Systems, Inc. | 1,155 | |||||||
| 88 | @ | Veritas Software Corp. | 2,512 | |||||||
| 129,838 | ||||||||||
| Telecommunications: 0.4% | ||||||||||
| 100 | Alltel Corp. | 5,876 | ||||||||
| 68 | AT&T Corp. | 1,296 | ||||||||
| 100 | @ | Avaya, Inc. | 1,720 | |||||||
| 400 | BellSouth Corp. | 11,116 | ||||||||
| 30 | CenturyTel, Inc. | 1,064 | ||||||||
| 1,411 | @ | Cisco Systems, Inc. | 27,232 | |||||||
| 50 | Citizens Communications Co. | 690 | ||||||||
| 60 | @ | Comverse Technology, Inc. | 1,467 | |||||||
| 120 | @ | Corning, Inc. | 1,412 | |||||||
| 900 | @ | Lucent Technologies, Inc. | 3,384 | |||||||
| 510 | Motorola, Inc. | 8,772 | ||||||||
| 247 | @ | Nextel Communications, Inc. | 7,410 | |||||||
| 350 | QUALCOMM, Inc. | 14,840 | ||||||||
| 160 | @ | Qwest Communications Intl., Inc. | 710 | |||||||
| 722 | SBC Communications, Inc. | 18,606 | ||||||||
| 28 | Scientific-Atlanta, Inc. | 924 | ||||||||
| 310 | Sprint Corp. | 7,704 | ||||||||
| 130 | @ | Tellabs, Inc. | 1,117 | |||||||
| 795 | Verizon Communications, Inc. | 32,206 | ||||||||
| 147,546 | ||||||||||
| Textiles: 0.0% | ||||||||||
| 30 | Cintas Corp. | 1,316 | ||||||||
| 1,316 | ||||||||||
| Toys/Games/Hobbies: 0.0% | ||||||||||
| 52 | Hasbro, Inc. | 1,008 | ||||||||
| 90 | Mattel, Inc. | 1,754 | ||||||||
| 2,762 | ||||||||||
| Transportation: 0.1% | ||||||||||
| 104 | Burlington Northern Santa Fe Corp. | 4,920 | ||||||||
| 50 | CSX Corp. | 2,004 | ||||||||
| 105 | FedEx Corp. | 10,341 | ||||||||
| 110 | Norfolk Southern Corp. | 3,981 | ||||||||
| 15 | Ryder System, Inc. | 717 | ||||||||
| 243 | United Parcel Service, Inc. | 20,767 | ||||||||
| 42,730 | ||||||||||
| Total Common Stock (Cost $2,256,895) | 2,545,572 | |||||||||
| Principal | ||||||||||
| Amount | Value | |||||||||
| U.S. GOVERNMENT AGENCY OBLIGATIONS: 55.4% | ||||||||||
| Federal Home Loan Mortgage Corporation: 10.2% | ||||||||||
| $ | 5,000,000 | 3.070%, due 03/14/06 | $ | 4,820,065 | ||||||
| 4,820,065 | ||||||||||
| Federal National Mortgage Association: 31.2% | ||||||||||
| 15,000,000 | 2.520%, due 06/14/05 | 14,828,670 | ||||||||
| 14,828,670 | ||||||||||
| Other: 14.0% | ||||||||||
| 6,799,000 | FICO STRIP, 2.760%, due 09/26/05 | 6,661,402 | ||||||||
| 6,661,402 | ||||||||||
| Total U.S. Government Agency Obligations (Cost $25,859,979) | 26,310,137 | |||||||||
| U.S. TREASURY OBLIGATIONS: 8.0% | ||||||||||
| U.S. Treasury STRIP: 8.0% | ||||||||||
| 3,856,000 | 2.560%, due 08/15/05 | 3,795,291 | ||||||||
| Total U.S. Treasury Obligations (Cost $3,807,750) | 3,795,291 | |||||||||
| OTHER BONDS: 30.8% | ||||||||||
| Sovereign: 30.8% | ||||||||||
| 15,000,000 | Israel Trust, 3.090%, due 11/15/05 | 14,600,385 | ||||||||
| Total Other Bonds (Cost $14,439,465) | 14,600,385 | |||||||||
| Total Long-Term Investments (Cost $46,364,089) | 47,251,385 | |||||||||
| SHORT-TERM INVESTMENTS: 0.6% | ||||||||||
| Repurchase Agreement: 0.6% | ||||||||||
| 307,000 | Morgan Stanley Repurchase Agreement dated 12/31/05, 2.199% due 01/03/05, $307,056 to be received upon repurchase (Collateralized by $320,000 Federal Farm Credit Bank, 2.350%, Market Value plus accrued interest $317,652, due 09/18/06) | 307,000 | ||||||||
| Total Short-Term Investments (Cost $307,000) | 307,000 | |||||||||
Total Investments In Securities (Cost $46,671,089)* | 100.2 | % | $ | 47,558,385 | ||||||||
Other Assets and Liabilities-Net | (0.2 | ) | (77,808 | ) | ||||||||
Net Assets | 100.0 | % | $ | 47,480,577 | ||||||||
| @ | Non-income producing security | |
| @@ | Foreign issuer | |
| STRIP | Separate Trading of Registered Interest and Principal of Securities | |
| * | Cost for federal income tax purposes is $46,746,580. Net unrealized depreciation consists of: |
| Gross Unrealized Appreciation | $ | 871,927 | ||
| Gross Unrealized Depreciation | (60,122 | ) | ||
| Net Unrealized Appreciation | $ | 811,805 | ||
80
| Shares | Value | |||||||||
| COMMON STOCK: 1.4% | ||||||||||
| Advertising: 0.0% | ||||||||||
| 31 | @ | Interpublic Group of Cos., Inc. | $ | 415 | ||||||
| 14 | Omnicom Group, Inc. | 1,181 | ||||||||
| 1,596 | ||||||||||
| Aerospace/Defense: 0.0% | ||||||||||
| 98 | Boeing Co. | 5,074 | ||||||||
| 19 | General Dynamics Corp. | 1,987 | ||||||||
| 10 | Goodrich Corp. | 326 | ||||||||
| 10 | L-3 Communications Holdings, Inc. | 732 | ||||||||
| 41 | Lockheed Martin Corp. | 2,278 | ||||||||
| 26 | Northrop Grumman Corp. | 1,413 | ||||||||
| 53 | Raytheon Co. | 2,058 | ||||||||
| 12 | Rockwell Collins, Inc. | 473 | ||||||||
| 35 | United Technologies Corp. | 3,618 | ||||||||
| 17,959 | ||||||||||
| Agriculture: 0.0% | ||||||||||
| 138 | Altria Group, Inc. | 8,432 | ||||||||
| 43 | Archer-Daniels-Midland Co. | 959 | ||||||||
| 16 | Monsanto Co. | 889 | ||||||||
| 10 | Reynolds American, Inc. | 786 | ||||||||
| 20 | UST, Inc. | 962 | ||||||||
| 12,028 | ||||||||||
| Apparel: 0.0% | ||||||||||
| 17 | @ | Coach, Inc. | 959 | |||||||
| 8 | Jones Apparel Group, Inc. | 293 | ||||||||
| 10 | Liz Claiborne, Inc. | 422 | ||||||||
| 30 | Nike, Inc. | 2,720 | ||||||||
| 5 | Reebok Intl., Ltd. | 220 | ||||||||
| 12 | VF Corp. | 665 | ||||||||
| 5,279 | ||||||||||
| Auto Manufacturers: 0.0% | ||||||||||
| 213 | Ford Motor Co. | 3,118 | ||||||||
| 36 | General Motors Corp. | 1,442 | ||||||||
| 20 | PACCAR, Inc. | 1,610 | ||||||||
| 6,170 | ||||||||||
| Auto Parts and Equipment: 0.0% | ||||||||||
| 16 | @ | Goodyear Tire & Rubber Co. | 235 | |||||||
| 12 | Johnson Controls, Inc. | 761 | ||||||||
| 996 | ||||||||||
| Banks: 0.1% | ||||||||||
| 25 | AmSouth Bancorporation | 648 | ||||||||
| 274 | Bank of America Corp. | 12,875 | ||||||||
| 38 | BB&T Corp. | 1,598 | ||||||||
| 16 | Comerica, Inc. | 976 | ||||||||
| 10 | Compass Bancshares, Inc. | 487 | ||||||||
| 15 | Fifth Third Bancorp | 709 | ||||||||
| 10 | First Horizon National Corp. | 431 | ||||||||
| 14 | Huntington Bancshares, Inc. | 347 | ||||||||
| 37 | KeyCorp | 1,254 | ||||||||
| 8 | M & T Bank Corp. | 863 | ||||||||
| 15 | Marshall & Ilsley Corp. | 663 | ||||||||
| 27 | Mellon Financial Corp. | 840 | ||||||||
| 63 | �� | National City Corp. | 2,366 | |||||||
| 33 | North Fork Bancorporation, Inc. | 952 | ||||||||
| 15 | Northern Trust Corp. | 729 | ||||||||
| 9 | PNC Financial Services Group, Inc. | 517 | ||||||||
| 31 | Regions Financial Corp. | 1,103 | ||||||||
| 19 | State Street Corp. | 933 | ||||||||
| 24 | SunTrust Banks, Inc. | 1,773 | ||||||||
| 9 | Synovus Financial Corp. | 257 | ||||||||
| 52 | The Bank of New York Co., Inc. | 1,738 | ||||||||
| 127 | U.S. Bancorp | 3,978 | ||||||||
| 107 | Wachovia Corp. | 5,628 | ||||||||
| 115 | Wells Fargo & Co. | 7,147 | ||||||||
| 6 | Zions Bancorporation | 408 | ||||||||
| 49,220 | ||||||||||
| Beverages: 0.0% | ||||||||||
| 2 | Adolph Coors Co. | 151 | ||||||||
| 25 | Anheuser-Busch Cos., Inc. | 1,268 | ||||||||
| 8 | Brown-Forman Corp. | 389 | ||||||||
| 164 | Coca-Cola Co. | 6,828 | ||||||||
| 32 | Coca-Cola Enterprises, Inc. | 667 | ||||||||
| 21 | Pepsi Bottling Group, Inc. | 568 | ||||||||
| 157 | PepsiCo, Inc. | 8,196 | ||||||||
| 18,067 | ||||||||||
| Biotechnology: 0.0% | ||||||||||
| 86 | @ | Amgen, Inc. | 5,517 | |||||||
| 22 | @ | Biogen Idec, Inc. | 1,465 | |||||||
| 15 | @ | Genzyme Corp. | 871 | |||||||
| 6 | @ | MedImmune, Inc. | 163 | |||||||
| 3 | @ | Millipore Corp. | 149 | |||||||
| 8,165 | ||||||||||
| Building Materials: 0.0% | ||||||||||
| 15 | @ | American Standard Cos., Inc. | 620 | |||||||
| 30 | Masco Corp. | 1,096 | ||||||||
| 9 | Vulcan Materials Co. | 491 | ||||||||
| 2,207 | ||||||||||
| Chemicals: 0.0% | ||||||||||
| 15 | Air Products & Chemicals, Inc. | 870 | ||||||||
| 5 | Ashland, Inc. | 292 | ||||||||
| 65 | Dow Chemical Co. | 3,218 | ||||||||
| 73 | E.I. du Pont de Nemours & Co. | 3,580 | ||||||||
| 5 | Eastman Chemical Co. | 289 | ||||||||
| 8 | Ecolab, Inc. | 281 | ||||||||
| 4 | Engelhard Corp. | 123 | ||||||||
| 6 | International Flavors & Fragrances, Inc. | 257 | ||||||||
| 18 | PPG Industries, Inc. | 1,227 | ||||||||
| 22 | Praxair, Inc. | 971 | ||||||||
| 17 | Rohm & Haas Co. | 752 | ||||||||
| 13 | Sherwin-Williams Co. | 580 | ||||||||
| 5 | Sigma-Aldrich Corp. | 302 | ||||||||
| 12,742 | ||||||||||
| Commercial Services: 0.0% | ||||||||||
| 12 | @ | Apollo Group, Inc. | 969 | |||||||
| 73 | Cendant Corp. | 1,706 | ||||||||
| 9 | Equifax, Inc. | 253 | ||||||||
| 16 | H&R Block, Inc. | 784 | ||||||||
| 20 | McKesson Corp. | 629 | ||||||||
| 9 | Moody’s Corp. | 782 | ||||||||
| 26 | Paychex, Inc. | 886 | ||||||||
| 13 | R.R. Donnelley & Sons Co. | 459 | ||||||||
| 7 | Robert Half Intl., Inc. | 206 | ||||||||
| 6,674 | ||||||||||
| Computers: 0.1% | ||||||||||
| 9 | @ | Affiliated Computer Services, Inc. | 542 | |||||||
| 43 | @ | Apple Computer, Inc. | 2,769 | |||||||
| 13 | @ | Computer Sciences Corp. | 733 | |||||||
| 289 | @ | Dell, Inc. | 12,178 | |||||||
| 35 | Electronic Data Systems Corp. | 809 | ||||||||
| 165 | @ | EMC Corp. | 2,454 | |||||||
| 30 | @ | Gateway, Inc. | 180 | |||||||
| 208 | Hewlett-Packard Co. | 4,362 | ||||||||
| 152 | International Business Machines Corp. | 14,984 | ||||||||
| 9 | @ | Lexmark Intl., Inc. | 765 | |||||||
| 6 | @ | NCR Corp. | 415 | |||||||
81
| Shares | Value | |||||||||
| Computers (continued) | ||||||||||
| 20 | @ | Network Appliance, Inc. | $ | 664 | ||||||
| 390 | @ | Sun Microsystems, Inc. | 2,098 | |||||||
| 20 | @ | Sungard Data Systems, Inc. | 567 | |||||||
| 20 | @ | Unisys Corp. | 204 | |||||||
| 43,724 | ||||||||||
| Cosmetics/Personal Care: 0.0% | ||||||||||
| 8 | Alberto-Culver Co. | 389 | ||||||||
| 11 | Avon Products, Inc. | 426 | ||||||||
| 36 | Colgate-Palmolive Co. | 1,842 | ||||||||
| 115 | Gillette Co. | 5,150 | ||||||||
| 36 | Kimberly-Clark Corp. | 2,369 | ||||||||
| 293 | Procter & Gamble Co. | 16,137 | ||||||||
| 26,313 | ||||||||||
| Distribution/Wholesale: 0.0% | ||||||||||
| 20 | Genuine Parts Co. | 881 | ||||||||
| 9 | W.W. Grainger, Inc. | 600 | ||||||||
| 1,481 | ||||||||||
| Diversified Financial Services: 0.2% | ||||||||||
| 118 | American Express Co. | 6,652 | ||||||||
| 8 | Bear Stearns Cos., Inc. | 818 | ||||||||
| 26 | Capital One Financial Corp. | 2,189 | ||||||||
| 19 | CIT Group, Inc. | 871 | ||||||||
| 354 | Citigroup, Inc. | 17,056 | ||||||||
| 34 | Countrywide Financial Corp. | 1,258 | ||||||||
| 22 | @ | E*TRADE Financial Corp. | 329 | |||||||
| 65 | Fannie Mae | 4,629 | ||||||||
| 6 | Federated Investors, Inc. | 182 | ||||||||
| 17 | Franklin Resources, Inc. | 1,184 | ||||||||
| 48 | Freddie Mac | 3,538 | ||||||||
| 33 | Goldman Sachs Group, Inc. | 3,433 | ||||||||
| 10 | Janus Capital Group, Inc. | 168 | ||||||||
| 20 | Lehman Brothers Holdings, Inc. | 1,750 | ||||||||
| 87 | MBNA Corp. | 2,453 | ||||||||
| 65 | Merrill Lynch & Co., Inc. | 3,885 | ||||||||
| 70 | Morgan Stanley | 3,886 | ||||||||
| 30 | @ | Providian Financial Corp. | 494 | |||||||
| 29 | SLM Corp. | 1,548 | ||||||||
| 10 | T. Rowe Price Group, Inc. | 622 | ||||||||
| 56,945 | ||||||||||
| Electric: 0.0% | ||||||||||
| 60 | @ | AES Corp. | 820 | |||||||
| 10 | @ | Allegheny Energy, Inc. | 197 | |||||||
| 6 | Ameren Corp. | 301 | ||||||||
| 30 | American Electric Power Co., Inc. | 1,030 | ||||||||
| 20 | CenterPoint Energy, Inc. | 226 | ||||||||
| 2 | Cinergy Corp. | 83 | ||||||||
| 17 | Consolidated Edison, Inc. | 744 | ||||||||
| 12 | Constellation Energy Group, Inc. | 525 | ||||||||
| 11 | Dominion Resources, Inc. | 745 | ||||||||
| 11 | DTE Energy Co. | 474 | ||||||||
| 107 | Duke Energy Corp. | 2,711 | ||||||||
| 23 | Edison Intl. | 737 | ||||||||
| 16 | Entergy Corp. | 1,081 | ||||||||
| 48 | Exelon Corp. | 2,116 | ||||||||
| 22 | FirstEnergy Corp. | 869 | ||||||||
| 13 | FPL Group, Inc. | 972 | ||||||||
| 10 | NiSource, Inc. | 228 | ||||||||
| 29 | @ | PG&E Corp. | 965 | |||||||
| 5 | Pinnacle West Capital Corp. | 222 | ||||||||
| 18 | PPL Corp. | 959 | ||||||||
| 16 | Public Service Enterprise Group, Inc. | 828 | ||||||||
| 50 | Southern Co. | 1,676 | ||||||||
| 15 | TECO Energy, Inc. | 230 | ||||||||
| 28 | TXU Corp. | 1,808 | ||||||||
| 26 | Xcel Energy, Inc. | 473 | ||||||||
| 21,020 | ||||||||||
| Electrical Components and Equipment: 0.0% | ||||||||||
| 39 | Emerson Electric Co. | 2,734 | ||||||||
| 2,734 | ||||||||||
| Electronics: 0.0% | ||||||||||
| 31 | @ | Agilent Technologies, Inc. | 747 | |||||||
| 10 | Applera Corp. — Applied Biosystems Group | 209 | ||||||||
| 8 | @ | Fisher Scientific Intl. | 499 | |||||||
| 13 | @ | Jabil Circuit, Inc. | 333 | |||||||
| 9 | Parker Hannifin Corp. | 682 | ||||||||
| 10 | PerkinElmer, Inc. | 225 | ||||||||
| 15 | @ | Sanmina-SCI Corp. | 127 | |||||||
| 24 | @ | Solectron Corp. | 128 | |||||||
| 5 | Tektronix, Inc. | 151 | ||||||||
| 16 | @ | Thermo Electron Corp. | 483 | |||||||
| 8 | @ | Waters Corp. | 374 | |||||||
| 3,958 | ||||||||||
| Engineering and Construction: 0.0% | ||||||||||
| 6 | Fluor Corp. | 327 | ||||||||
| 327 | ||||||||||
| Entertainment: 0.0% | ||||||||||
| 24 | International Game Technology | 825 | ||||||||
| 825 | ||||||||||
| Environmental Control: 0.0% | ||||||||||
| 38 | Waste Management, Inc. | 1,138 | ||||||||
| 1,138 | ||||||||||
| Food: 0.0% | ||||||||||
| 20 | Albertson’s, Inc. | 478 | ||||||||
| 26 | Campbell Soup Co. | 777 | ||||||||
| 38 | ConAgra Foods, Inc. | 1,119 | ||||||||
| 25 | General Mills, Inc. | 1,243 | ||||||||
| 25 | H.J. Heinz Co. | 975 | ||||||||
| 18 | Hershey Foods Corp. | 1,000 | ||||||||
| 27 | Kellogg Co. | 1,206 | ||||||||
| 19 | @ | Kroger Co. | 333 | |||||||
| 10 | McCormick & Co., Inc. | 386 | ||||||||
| 31 | @ | Safeway, Inc. | 612 | |||||||
| 56 | Sara Lee Corp. | 1,351 | ||||||||
| 17 | SUPERVALU, Inc. | 587 | ||||||||
| 29 | Wm. Wrigley Jr. Co. | 2,006 | ||||||||
| 12,073 | ||||||||||
| Forest Products and Paper: 0.0% | ||||||||||
| 19 | Georgia-Pacific Corp. | 712 | ||||||||
| 35 | International Paper Co. | 1,470 | ||||||||
| 11 | Louisiana-Pacific Corp. | 294 | ||||||||
| 23 | MeadWestvaco Corp. | 779 | ||||||||
| 12 | Plum Creek Timber Co., Inc. | 461 | ||||||||
| 5 | Temple-Inland, Inc. | 342 | ||||||||
| 27 | Weyerhaeuser Co. | 1,816 | ||||||||
| 5,874 | ||||||||||
| Gas: 0.0% | ||||||||||
| 15 | KeySpan Corp. | 592 | ||||||||
| 20 | Sempra Energy | 733 | ||||||||
| 1,325 | ||||||||||
82
| Shares | Value | |||||||||
| Hand/Machine Tools: 0.0% | ||||||||||
| 9 | Black & Decker Corp. | $ | 795 | |||||||
| 5 | Snap-On, Inc. | 172 | ||||||||
| 9 | Stanley Works | 441 | ||||||||
| 1,408 | ||||||||||
| Healthcare — Products: 0.1% | ||||||||||
| 5 | Bausch & Lomb, Inc. | 322 | ||||||||
| 22 | Baxter Intl., Inc. | 760 | ||||||||
| 28 | Becton Dickinson & Co. | 1,590 | ||||||||
| 20 | Biomet, Inc. | 868 | ||||||||
| 56 | @ | Boston Scientific Corp. | 1,991 | |||||||
| 8 | C.R. Bard, Inc. | 512 | ||||||||
| 11 | Guidant Corp. | 793 | ||||||||
| 342 | Johnson & Johnson | 21,689 | ||||||||
| 83 | Medtronic, Inc. | 4,123 | ||||||||
| 22 | @ | St. Jude Medical, Inc. | 922 | |||||||
| 10 | Stryker Corp. | 483 | ||||||||
| 18 | @ | Zimmer Holdings, Inc. | 1,442 | |||||||
| 35,495 | ||||||||||
| Healthcare — Services: 0.0% | ||||||||||
| 17 | Aetna, Inc. | 2,121 | ||||||||
| 15 | @ | Humana, Inc. | 445 | |||||||
| 9 | @ | Laboratory Corp. Of America Holdings | 448 | |||||||
| 7 | Manor Care, Inc. | 248 | ||||||||
| 3 | Quest Diagnostics, Inc. | 287 | ||||||||
| 76 | UnitedHealth Group, Inc. | 6,690 | ||||||||
| 31 | @ | WellPoint, Inc. | 3,565 | |||||||
| 13,804 | ||||||||||
| Home Builders: 0.0% | ||||||||||
| 8 | Centex Corp. | 477 | ||||||||
| 477 | ||||||||||
| Home Furnishings: 0.0% | ||||||||||
| 12 | Leggett & Platt, Inc. | 341 | ||||||||
| 5 | Whirlpool Corp. | 346 | ||||||||
| 687 | ||||||||||
| Household Products/Wares: 0.0% | ||||||||||
| 7 | Avery Dennison Corp. | 420 | ||||||||
| 19 | Clorox Co. | 1,119 | ||||||||
| 10 | Fortune Brands, Inc. | 772 | ||||||||
| 2,311 | ||||||||||
| Housewares: 0.0% | ||||||||||
| 19 | Newell Rubbermaid, Inc. | 460 | ||||||||
| 460 | ||||||||||
| Insurance: 0.1% | ||||||||||
| 16 | @@ | ACE Ltd. | 684 | |||||||
| 35 | AFLAC, Inc. | 1,394 | ||||||||
| 45 | Allstate Corp. | 2,327 | ||||||||
| 7 | AMBAC Financial Group, Inc. | 575 | ||||||||
| 180 | American Intl. Group, Inc. | 11,821 | ||||||||
| 19 | AON Corp. | 453 | ||||||||
| 22 | Chubb Corp. | 1,692 | ||||||||
| 16 | CIGNA Corp. | 1,305 | ||||||||
| 11 | Cincinnati Financial Corp. | 487 | ||||||||
| 30 | Hartford Financial Services Group, Inc. | 2,079 | ||||||||
| 9 | Jefferson-Pilot Corp. | 468 | ||||||||
| 16 | Lincoln National Corp. | 747 | ||||||||
| 17 | Loews Corp. | 1,195 | ||||||||
| 15 | Marsh & McLennan Cos., Inc. | 494 | ||||||||
| 10 | MBIA, Inc. | 633 | ||||||||
| 49 | MetLife, Inc. | 1,985 | ||||||||
| 9 | MGIC Investment Corp. | 620 | ||||||||
| 21 | Principal Financial Group | 860 | ||||||||
| 18 | Progressive Corp. | 1,527 | ||||||||
| 60 | Prudential Financial, Inc. | 3,298 | ||||||||
| 13 | Safeco Corp. | 679 | ||||||||
| 20 | St. Paul Travelers Cos., Inc. | 741 | ||||||||
| 10 | Torchmark Corp. | 571 | ||||||||
| 22 | UnumProvident Corp. | 395 | ||||||||
| 9 | @@ | XL Capital Ltd. | 699 | |||||||
| 37,729 | ||||||||||
| Internet: 0.0% | ||||||||||
| 44 | @ | eBay, Inc. | 5,116 | |||||||
| 70 | @ | Symantec Corp. | 1,803 | |||||||
| 94 | @ | Yahoo!, Inc. | 3,542 | |||||||
| 10,461 | ||||||||||
| Iron/Steel: 0.0% | ||||||||||
| 8 | Allegheny Technologies Inc. | 173 | ||||||||
| 10 | Nucor Corp. | 524 | ||||||||
| 4 | United States Steel Corp. | 205 | ||||||||
| 902 | ||||||||||
| Leisure Time: 0.0% | ||||||||||
| 7 | Brunswick Corp. | 347 | ||||||||
| 43 | Carnival Corp. | 2,478 | ||||||||
| 21 | Harley-Davidson, Inc. | 1,276 | ||||||||
| 9 | Sabre Holdings Corp. | 199 | ||||||||
| 4,300 | ||||||||||
| Lodging: 0.0% | ||||||||||
| 10 | Harrah’s Entertainment, Inc. | 669 | ||||||||
| 25 | Hilton Hotels Corp. | 569 | ||||||||
| 16 | Marriott Intl., Inc. | 1,007 | ||||||||
| 13 | Starwood Hotels & Resorts Worldwide, Inc. | 759 | ||||||||
| 3,004 | ||||||||||
| Machinery — Construction and Mining: 0.0% | ||||||||||
| 10 | Caterpillar, Inc. | 975 | ||||||||
| 975 | ||||||||||
| Machinery — Diversified: 0.0% | ||||||||||
| 3 | Cummins, Inc. | 251 | ||||||||
| 18 | Deere & Co. | 1,339 | ||||||||
| 12 | Rockwell Automation, Inc. | 595 | ||||||||
| 2,185 | ||||||||||
| Media: 0.0% | ||||||||||
| 150 | @ | Comcast Corp. | 4,992 | |||||||
| 18 | Gannett Co., Inc. | 1,471 | ||||||||
| 3 | Knight-Ridder, Inc. | 201 | ||||||||
| 18 | McGraw-Hill Cos., Inc. | 1,648 | ||||||||
| 5 | Meredith Corp. | 271 | ||||||||
| 10 | New York Times Co. | 408 | ||||||||
| 180 | News Corp. | 3,359 | ||||||||
| 314 | @ | Time Warner, Inc. | 6,103 | |||||||
| 9 | Tribune Co. | 379 | ||||||||
| 115 | Viacom, Inc. | 4,185 | ||||||||
| 142 | Walt Disney Co. | 3,948 | ||||||||
| 26,965 | ||||||||||
| Mining: 0.0% | ||||||||||
| 7 | Phelps Dodge Corp. | 692 | ||||||||
| 692 | ||||||||||
| Miscellaneous Manufacturing: 0.1% | ||||||||||
| 53 | 3M Co. | 4,350 | ||||||||
| 6 | Cooper Industries Ltd. | 407 | ||||||||
| 20 | Danaher Corp. | 1,148 | ||||||||
| 4 | Dover Corp. | 168 | ||||||||
| 25 | Eastman Kodak Co. | 806 | ||||||||
| 10 | Eaton Corp. | 724 | ||||||||
| 722 | General Electric Co. | 26,352 | ||||||||
83
| Shares | Value | |||||||||
| Miscellaneous Manufacturing (continued) | ||||||||||
| 58 | Honeywell Intl., Inc. | $ | 2,054 | |||||||
| 20 | Illinois Tool Works, Inc. | 1,854 | ||||||||
| 11 | @@ | Ingersoll-Rand Co. | 883 | |||||||
| 6 | ITT Industries, Inc. | 507 | ||||||||
| 3 | Pall Corp. | 87 | ||||||||
| 10 | Textron, Inc. | 738 | ||||||||
| 137 | @@ | Tyco Intl., Ltd. | 4,896 | |||||||
| 44,974 | ||||||||||
| Office/Business Equipment: 0.0% | ||||||||||
| 16 | Pitney Bowes, Inc. | 740 | ||||||||
| 83 | @ | Xerox Corp. | 1,412 | |||||||
| 2,152 | ||||||||||
| Oil and Gas: 0.2% | ||||||||||
| 6 | Amerada Hess Corp. | 494 | ||||||||
| 17 | Anadarko Petroleum Corp. | 1,102 | ||||||||
| 20 | Apache Corp. | 1,011 | ||||||||
| 43 | Burlington Resources, Inc. | 1,871 | ||||||||
| 181 | ChevronTexaco Corp. | 9,505 | ||||||||
| 74 | ConocoPhillips | 6,425 | ||||||||
| 52 | Devon Energy Corp. | 2,024 | ||||||||
| 8 | EOG Resources, Inc. | 571 | ||||||||
| 562 | Exxon Mobil Corp. | 28,809 | ||||||||
| 9 | Kerr-McGee Corp. | 520 | ||||||||
| 22 | Marathon Oil Corp. | 827 | ||||||||
| 4 | @,@@ | Nabors Industries, Ltd. | 205 | |||||||
| 9 | @ | Noble Corp. | 448 | |||||||
| 24 | Occidental Petroleum Corp. | 1,401 | ||||||||
| 9 | Sunoco, Inc. | 735 | ||||||||
| 18 | @ | Transocean, Inc. | 763 | |||||||
| 14 | Unocal Corp. | 605 | ||||||||
| 28 | Valero Energy Corp. | 1,271 | ||||||||
| 58,587 | ||||||||||
| Oil and Gas Services: 0.0% | ||||||||||
| 22 | Baker Hughes, Inc. | 939 | ||||||||
| 10 | BJ Services Co. | 465 | ||||||||
| 30 | Halliburton Co. | 1,177 | ||||||||
| 2,581 | ||||||||||
| Packaging and Containers: 0.0% | ||||||||||
| 10 | Ball Corp. | 439 | ||||||||
| 8 | Bemis Co. | 233 | ||||||||
| 10 | @ | Pactiv Corp. | 253 | |||||||
| 6 | @ | Sealed Air Corp. | 320 | |||||||
| 1,245 | ||||||||||
| Pharmaceuticals: 0.1% | ||||||||||
| 104 | Abbott Laboratories | 4,851 | ||||||||
| 8 | Allergan, Inc. | 649 | ||||||||
| 7 | AmerisourceBergen Corp. | 411 | ||||||||
| 130 | Bristol-Myers Squibb Co. | 3,331 | ||||||||
| 39 | Cardinal Health, Inc. | 2,268 | ||||||||
| 53 | @ | Caremark Rx, Inc. | 2,090 | |||||||
| 27 | Eli Lilly & Co. | 1,532 | ||||||||
| 5 | @ | Express Scripts, Inc. | 382 | |||||||
| 24 | @ | Forest Laboratories, Inc. | 1,077 | |||||||
| 28 | @ | Gilead Sciences, Inc. | 980 | |||||||
| 11 | @ | Hospira, Inc. | 369 | |||||||
| 21 | @ | King Pharmaceuticals, Inc. | 260 | |||||||
| 18 | @ | Medco Health Solutions, Inc. | 749 | |||||||
| 149 | Merck & Co., Inc. | 4,788 | ||||||||
| 513 | Pfizer, Inc. | 13,794 | ||||||||
| 97 | Schering-Plough Corp. | 2,025 | ||||||||
| 89 | Wyeth | 3,791 | ||||||||
| 43,347 | ||||||||||
| Pipelines: 0.0% | ||||||||||
| 16 | @ | Dynegy, Inc. | 74 | |||||||
| 37 | El Paso Corp. | 385 | ||||||||
| 4 | Kinder Morgan, Inc. | 293 | ||||||||
| 32 | Williams Cos., Inc. | 521 | ||||||||
| 1,273 | ||||||||||
| Real Estate Investment Trusts: 0.0% | ||||||||||
| 10 | Apartment Investment & Management Co. | 385 | ||||||||
| 11 | Equity Office Properties Trust | 320 | ||||||||
| 12 | ProLogis | 520 | ||||||||
| 14 | Simon Property Group, Inc. | 906 | ||||||||
| 2,131 | ||||||||||
| Retail: 0.2% | ||||||||||
| 21 | @ | Bed Bath & Beyond, Inc. | 836 | |||||||
| 22 | Best Buy Co., Inc. | 1,307 | ||||||||
| 18 | Circuit City Stores, Inc. | 282 | ||||||||
| 52 | Costco Wholesale Corp. | 2,517 | ||||||||
| 26 | CVS Corp. | 1,172 | ||||||||
| 10 | Darden Restaurants, Inc. | 277 | ||||||||
| 8 | Dillard’s, Inc. | 215 | ||||||||
| 12 | Federated Department Stores, Inc. | 693 | ||||||||
| 81 | Gap, Inc. | 1,711 | ||||||||
| 254 | Home Depot, Inc. | 10,856 | ||||||||
| 32 | J.C. Penney Co., Inc. Holding Co. | 1,325 | ||||||||
| 13 | @ | Kohl’s Corp. | 639 | |||||||
| 34 | Limited Brands, Inc. | 783 | ||||||||
| 53 | Lowe’s Cos., Inc. | 3,052 | ||||||||
| 19 | May Department Stores Co. | 559 | ||||||||
| 146 | McDonald’s Corp. | 4,681 | ||||||||
| 10 | Nordstrom, Inc. | 467 | ||||||||
| 22 | @ | Office Depot, Inc. | 382 | |||||||
| 10 | RadioShack Corp. | 329 | ||||||||
| 56 | Staples, Inc. | 1,888 | ||||||||
| 36 | @ | Starbucks Corp. | 2,245 | |||||||
| 61 | Target Corp. | 3,168 | ||||||||
| 34 | TJX Cos., Inc. | 854 | ||||||||
| 25 | @ | Toys R US, Inc. | 512 | |||||||
| 287 | Wal-Mart Stores, Inc. | 15,160 | ||||||||
| 65 | Walgreen Co. | 2,494 | ||||||||
| 13 | Wendy’s Intl., Inc. | 510 | ||||||||
| 20 | Yum! Brands, Inc. | 944 | ||||||||
| 59,858 | ||||||||||
| Savings and Loans: 0.0% | ||||||||||
| 22 | Golden West Financial Corp. | 1,351 | ||||||||
| 12 | Sovereign Bancorp, Inc. | 271 | ||||||||
| 61 | Washington Mutual, Inc. | 2,579 | ||||||||
| 4,201 | ||||||||||
| Semiconductors: 0.0% | ||||||||||
| 10 | @ | Advanced Micro Devices, Inc. | 220 | |||||||
| 25 | @ | Altera Corp. | 518 | |||||||
| 21 | Analog Devices, Inc. | 775 | ||||||||
| 116 | @ | Applied Materials, Inc. | 1,984 | |||||||
| 23 | @ | Freescale Semiconductor Inc. | 422 | |||||||
| 434 | Intel Corp. | 10,151 | ||||||||
| 12 | @ | KLA-Tencor Corp. | 559 | |||||||
| 22 | Linear Technology Corp. | 853 | ||||||||
| 10 | Maxim Integrated Products, Inc. | 424 | ||||||||
| 25 | National Semiconductor Corp. | 449 | ||||||||
| 7 | @ | Qlogic Corp. | 257 | |||||||
| 47 | Texas Instruments, Inc. | 1,157 | ||||||||
| 17,769 | ||||||||||
| Software: 0.1% | ||||||||||
| 17 | Adobe Systems, Inc. | 1,067 | ||||||||
| 22 | Autodesk, Inc. | 835 | ||||||||
| 40 | Automatic Data Processing, Inc. | 1,774 | ||||||||
| 24 | @ | BMC Software, Inc. | 446 | |||||||
| 11 | @ | Citrix Systems, Inc. | 270 | |||||||
| 40 | Computer Associates Intl., Inc. | 1,242 | ||||||||
84
| Shares | Value | |||||||||
| Software (continued) | ||||||||||
| 34 | @ | Compuware Corp. | $ | 220 | ||||||
| 10 | @ | Electronic Arts, Inc. | 617 | |||||||
| 60 | First Data Corp. | 2,552 | ||||||||
| 15 | @ | Fiserv, Inc. | 603 | |||||||
| 20 | IMS Health, Inc. | 464 | ||||||||
| 14 | @ | Intuit, Inc. | 616 | |||||||
| 734 | Microsoft Corp. | 19,606 | ||||||||
| 28 | @ | Novell, Inc. | 189 | |||||||
| 601 | @ | Oracle Corp. | 8,246 | |||||||
| 23 | @ | Parametric Technology Corp. | 135 | |||||||
| 25 | @ | PeopleSoft, Inc. | 662 | |||||||
| 48 | @ | Siebel Systems, Inc. | 504 | |||||||
| 29 | @ | Veritas Software Corp. | 828 | |||||||
| 40,876 | ||||||||||
| Telecommunications: 0.1% | ||||||||||
| 30 | Alltel Corp. | 1,763 | ||||||||
| 18 | AT&T Corp. | 343 | ||||||||
| 31 | @ | Avaya, Inc. | 533 | |||||||
| 126 | BellSouth Corp. | 3,502 | ||||||||
| 10 | CenturyTel, Inc. | 355 | ||||||||
| 455 | @ | Cisco Systems, Inc. | 8,781 | |||||||
| 16 | Citizens Communications Co. | 221 | ||||||||
| 10 | @ | Comverse Technology, Inc. | 245 | |||||||
| 33 | @ | Corning, Inc. | 388 | |||||||
| 282 | @ | Lucent Technologies, Inc. | 1,060 | |||||||
| 156 | Motorola, Inc. | 2,683 | ||||||||
| 75 | @ | Nextel Communications, Inc. | 2,250 | |||||||
| 110 | QUALCOMM, Inc. | 4,664 | ||||||||
| 47 | @ | Qwest Communications Intl., Inc. | 209 | |||||||
| 228 | SBC Communications, Inc. | 5,876 | ||||||||
| 11 | Scientific-Atlanta, Inc. | 363 | ||||||||
| 102 | Sprint Corp. | 2,535 | ||||||||
| 31 | @ | Tellabs, Inc. | 266 | |||||||
| 250 | Verizon Communications, Inc. | 10,127 | ||||||||
| 46,164 | ||||||||||
| Textiles: 0.0% | ||||||||||
| 14 | Cintas Corp. | 614 | ||||||||
| 614 | ||||||||||
| Toys/Games/Hobbies: 0.0% | ||||||||||
| 8 | Hasbro, Inc. | 155 | ||||||||
| 28 | Mattel, Inc. | 546 | ||||||||
| 701 | ||||||||||
| Transportation: 0.0% | ||||||||||
| 34 | Burlington Northern Santa Fe Corp. | 1,609 | ||||||||
| 15 | CSX Corp. | 601 | ||||||||
| 38 | FedEx Corp. | 3,743 | ||||||||
| 35 | Norfolk Southern Corp. | 1,267 | ||||||||
| 5 | Ryder System, Inc. | 239 | ||||||||
| 77 | United Parcel Service, Inc. | 6,579 | ||||||||
| 14,038 | ||||||||||
| Total Common Stock (Cost $694,755) | 801,206 | |||||||||
| Principal | ||||||||||
| Amount | Value | |||||||||
| U.S. GOVERNMENT AGENCY OBLIGATIONS: 62.8% | ||||||||||
| Federal Home Loan Mortgage Corporation: 8.5% | ||||||||||
| $ | 5,000,000 | 3.070%, due 03/14/06 | $ | 4,820,065 | ||||||
| 4,820,065 | ||||||||||
| Federal National Mortgage Association: 36.0% | ||||||||||
| 6,050,000 | 2.960%, due 01/15/06 | 5,866,673 | ||||||||
| 15,000,000 | 2.940%, due 12/13/05 | 14,587,304 | ||||||||
| 20,453,977 | ||||||||||
| Other: 18.3% | ||||||||||
| 10,510,000 | FICO STRIP, 2.490%, due 05/11/05 | 10,415,589 | ||||||||
| 10,415,589 | ||||||||||
| Total U.S. Government Agency Obligations (Cost $35,261,831) | 35,689,631 | |||||||||
| U.S. TREASURY OBLIGATIONS: 12.6% | ||||||||||
| U.S. Treasury STRIP: 12.6% | ||||||||||
| 7,313,000 | 2.750%, due 11/15/05 | 7,141,927 | ||||||||
| Total U.S. Treasury Obligations (Cost $7,154,567) | 7,141,927 | |||||||||
| OTHER BONDS: 23.0% | ||||||||||
| Sovereign: 23.0% | ||||||||||
| 10,000,000 | Israel Trust, 3.090%, due 11/15/05 | 9,733,590 | ||||||||
| 1,390,000 | Israel Trust, 3.090%, due 11/15/05 | 1,352,969 | ||||||||
| 2,000,000 | Turkey Trust, 3.090%, due 11/15/05 | 1,946,718 | ||||||||
| Total Other Bonds (Cost $12,896,359) | 13,033,277 | |||||||||
| Total Long-Term Investments (Cost $56,007,512) | 56,666,041 | |||||||||
| SHORT-TERM INVESTMENTS: 0.4% | ||||||||||
| Repurchase Agreement: 0.4% | ||||||||||
| 206,000 | Morgan Stanley Repurchase Agreement dated 12/31/05, 2.200% due 01/03/05, $206,038 to be received upon repurchase (Collateralized by $195,000 Federal Home Loan Bank, 5.750%, Market Value plus accrued interest $214,410, due 05/15/12) | 206,000 | ||||||||
| Total Short-Term Investments (Cost $206,000) | 206,000 | |||||||||
Total Investments In Securities (Cost $56,213,512)* | 100.2 | % | $ | 56,872,041 | ||||||||
Other Assets and Liabilities-Net | (0.2) | (88,413 | ) | |||||||||
Net Assets | 100.0 | % | $ | 56,783,628 | ||||||||
| @ | Non-income producing security | |
| @@ | Foreign issuer | |
| STRIP | Separate Trading of Registered Interest and Principal of Securities | |
| * | Cost for federal income tax purposes is $56,273,540. Net unrealized depreciation consists of: |
| Gross Unrealized Appreciation | $ | 623,722 | ||
| Gross Unrealized Depreciation | (25,221 | ) | ||
| Net Unrealized Appreciation | $ | 598,501 | ||
85
| Shares | Value | |||||||||
| COMMON STOCK: 2.2% | ||||||||||
| Advertising: 0.0% | ||||||||||
| 20 | @ | Interpublic Group of Cos., Inc. | $ | 268 | ||||||
| 20 | Omnicom Group, Inc. | 1,686 | ||||||||
| 1,954 | ||||||||||
| Aerospace/Defense: 0.0% | ||||||||||
| 140 | Boeing Co. | 7,249 | ||||||||
| 30 | General Dynamics Corp. | 3,138 | ||||||||
| 10 | Goodrich Corp. | 326 | ||||||||
| 10 | L-3 Communications Holdings, Inc. | 732 | ||||||||
| 60 | Lockheed Martin Corp. | 3,333 | ||||||||
| 40 | Northrop Grumman Corp. | 2,174 | ||||||||
| 80 | Raytheon Co. | 3,106 | ||||||||
| 20 | Rockwell Collins, Inc. | 789 | ||||||||
| 50 | United Technologies Corp. | 5,168 | ||||||||
| 26,015 | ||||||||||
| Agriculture: 0.0% | ||||||||||
| 200 | Altria Group, Inc. | 12,220 | ||||||||
| 62 | Archer-Daniels-Midland Co. | 1,383 | ||||||||
| 30 | Monsanto Co. | 1,667 | ||||||||
| 10 | Reynolds American, Inc. | 786 | ||||||||
| 20 | UST, Inc. | 962 | ||||||||
| 17,018 | ||||||||||
| Apparel: 0.0% | ||||||||||
| 30 | @ | Coach, Inc. | 1,692 | |||||||
| 10 | Jones Apparel Group, Inc. | 366 | ||||||||
| 10 | Liz Claiborne, Inc. | 422 | ||||||||
| 40 | Nike, Inc. | 3,627 | ||||||||
| 10 | Reebok Intl., Ltd. | 440 | ||||||||
| 20 | VF Corp. | 1,108 | ||||||||
| 7,655 | ||||||||||
| Auto Manufacturers: 0.0% | ||||||||||
| 320 | Ford Motor Co. | 4,684 | ||||||||
| 60 | General Motors Corp. | 2,404 | ||||||||
| 25 | PACCAR, Inc. | 2,012 | ||||||||
| 9,100 | ||||||||||
| Auto Parts and Equipment: 0.0% | ||||||||||
| 30 | @ | Goodyear Tire & Rubber Co. | 440 | |||||||
| 20 | Johnson Controls, Inc. | 1,269 | ||||||||
| 1,709 | ||||||||||
| Banks: 0.2% | ||||||||||
| 40 | AmSouth Bancorporation | 1,036 | ||||||||
| 400 | Bank of America Corp. | 18,795 | ||||||||
| 50 | BB&T Corp. | 2,103 | ||||||||
| 20 | Comerica, Inc. | 1,220 | ||||||||
| 10 | Compass Bancshares, Inc. | 487 | ||||||||
| 20 | Fifth Third Bancorp | 946 | ||||||||
| 10 | First Horizon National Corp. | 431 | ||||||||
| 20 | Huntington Bancshares, Inc. | 496 | ||||||||
| 50 | KeyCorp | 1,695 | ||||||||
| 10 | M & T Bank Corp. | 1,078 | ||||||||
| 20 | Marshall & Ilsley Corp. | 884 | ||||||||
| 40 | Mellon Financial Corp. | 1,244 | ||||||||
| 90 | National City Corp. | 3,380 | ||||||||
| 45 | North Fork Bancorporation, Inc. | 1,298 | ||||||||
| 20 | Northern Trust Corp. | 972 | ||||||||
| 10 | PNC Financial Services Group, Inc. | 574 | ||||||||
| 48 | Regions Financial Corp. | 1,708 | ||||||||
| 30 | State Street Corp. | 1,474 | ||||||||
| 40 | SunTrust Banks, Inc. | 2,955 | ||||||||
| 10 | Synovus Financial Corp. | 286 | ||||||||
| 80 | The Bank of New York Co., Inc. | 2,674 | ||||||||
| 180 | U.S. Bancorp | 5,638 | ||||||||
| 156 | Wachovia Corp. | 8,206 | ||||||||
| 170 | Wells Fargo & Co. | 10,565 | ||||||||
| 10 | Zions Bancorporation | 680 | ||||||||
| 70,825 | ||||||||||
| Beverages: 0.0% | ||||||||||
| 30 | Anheuser-Busch Cos., Inc. | 1,522 | ||||||||
| 10 | Brown-Forman Corp. | 487 | ||||||||
| 240 | Coca-Cola Co. | 9,991 | ||||||||
| 50 | Coca-Cola Enterprises, Inc. | 1,043 | ||||||||
| 30 | Pepsi Bottling Group, Inc. | 811 | ||||||||
| 220 | PepsiCo, Inc. | 11,484 | ||||||||
| 25,338 | ||||||||||
| Biotechnology: 0.0% | ||||||||||
| 122 | @ | Amgen, Inc. | 7,827 | |||||||
| 30 | @ | Biogen Idec, Inc. | 1,998 | |||||||
| 20 | @ | Genzyme Corp. | 1,161 | |||||||
| 20 | @ | MedImmune, Inc. | 542 | |||||||
| 11,528 | ||||||||||
| Building Materials: 0.0% | ||||||||||
| 20 | @ | American Standard Cos., Inc. | 826 | |||||||
| 40 | Masco Corp. | 1,462 | ||||||||
| 10 | Vulcan Materials Co. | 546 | ||||||||
| 2,834 | ||||||||||
| Chemicals: 0.0% | ||||||||||
| 20 | Air Products & Chemicals, Inc. | 1,159 | ||||||||
| 10 | Ashland, Inc. | 584 | ||||||||
| 100 | Dow Chemical Co. | 4,951 | ||||||||
| 110 | E.I. du Pont de Nemours & Co. | 5,395 | ||||||||
| 10 | Eastman Chemical Co. | 577 | ||||||||
| 10 | Ecolab, Inc. | 351 | ||||||||
| 10 | Engelhard Corp. | 307 | ||||||||
| 10 | International Flavors & Fragrances, Inc. | 428 | ||||||||
| 30 | PPG Industries, Inc. | 2,045 | ||||||||
| 30 | Praxair, Inc. | 1,325 | ||||||||
| 20 | Rohm & Haas Co. | 885 | ||||||||
| 20 | Sherwin-Williams Co. | 893 | ||||||||
| 10 | Sigma-Aldrich Corp. | 605 | ||||||||
| 19,505 | ||||||||||
| Commercial Services: 0.0% | ||||||||||
| 20 | @ | Apollo Group, Inc. | 1,614 | |||||||
| 110 | Cendant Corp. | 2,571 | ||||||||
| 10 | Equifax, Inc. | 281 | ||||||||
| 20 | H&R Block, Inc. | 980 | ||||||||
| 30 | McKesson Corp. | 944 | ||||||||
| 20 | Moody’s Corp. | 1,737 | ||||||||
| 40 | Paychex, Inc. | 1,363 | ||||||||
| 20 | R.R. Donnelley & Sons Co. | 706 | ||||||||
| 20 | Robert Half Intl., Inc. | 589 | ||||||||
| 10,785 | ||||||||||
| Computers: 0.1% | ||||||||||
| 10 | @ | Affiliated Computer Services, Inc. | 602 | |||||||
| 70 | @ | Apple Computer, Inc. | 4,508 | |||||||
| 20 | @ | Computer Sciences Corp. | 1,127 | |||||||
| 420 | @ | Dell, Inc. | 17,699 | |||||||
| 50 | Electronic Data Systems Corp. | 1,155 | ||||||||
| 250 | @ | EMC Corp. | 3,718 | |||||||
| 30 | @ | Gateway, Inc. | 180 | |||||||
| 311 | Hewlett-Packard Co. | 6,522 | ||||||||
| 220 | International Business Machines Corp. | 21,687 | ||||||||
| 10 | @ | Lexmark Intl., Inc. | 850 | |||||||
| 10 | @ | NCR Corp. | 692 | |||||||
| 30 | @ | Network Appliance, Inc. | 997 | |||||||
| 570 | @ | Sun Microsystems, Inc. | 3,067 | |||||||
86
| Shares | Value | |||||||||
| Computers (continued) | ||||||||||
| 30 | @ | Sungard Data Systems, Inc. | $ | 850 | ||||||
| 40 | @ | Unisys Corp. | 407 | |||||||
| 64,061 | ||||||||||
| Cosmetics/Personal Care: 0.1% | ||||||||||
| 10 | Alberto-Culver Co. | 486 | ||||||||
| 20 | Avon Products, Inc. | 774 | ||||||||
| 50 | Colgate-Palmolive Co. | 2,558 | ||||||||
| 170 | Gillette Co. | 7,613 | ||||||||
| 50 | Kimberly-Clark Corp. | 3,291 | ||||||||
| 430 | Procter & Gamble Co. | 23,683 | ||||||||
| 38,405 | ||||||||||
| Distribution/Wholesale: 0.0% | ||||||||||
| 30 | Genuine Parts Co. | 1,322 | ||||||||
| 10 | W.W. Grainger, Inc. | 666 | ||||||||
| 1,988 | ||||||||||
| Diversified Financial Services: 0.3% | ||||||||||
| 170 | American Express Co. | 9,583 | ||||||||
| 10 | Bear Stearns Cos., Inc. | 1,023 | ||||||||
| 40 | Capital One Financial Corp. | 3,368 | ||||||||
| 30 | CIT Group, Inc. | 1,375 | ||||||||
| 510 | Citigroup, Inc. | 24,572 | ||||||||
| 58 | Countrywide Financial Corp. | 2,147 | ||||||||
| 40 | @ | E*TRADE Financial Corp. | 598 | |||||||
| 100 | Fannie Mae | 7,121 | ||||||||
| 10 | Federated Investors, Inc. | 304 | ||||||||
| 20 | Franklin Resources, Inc. | 1,393 | ||||||||
| 70 | Freddie Mac | 5,159 | ||||||||
| 50 | Goldman Sachs Group, Inc. | 5,202 | ||||||||
| 30 | Janus Capital Group, Inc. | 504 | ||||||||
| 40 | Lehman Brothers Holdings, Inc. | 3,499 | ||||||||
| 125 | MBNA Corp. | 3,524 | ||||||||
| 90 | Merrill Lynch & Co., Inc. | 5,379 | ||||||||
| 110 | Morgan Stanley | 6,107 | ||||||||
| 30 | @ | Providian Financial Corp. | 494 | |||||||
| 40 | SLM Corp. | 2,136 | ||||||||
| 10 | T. Rowe Price Group, Inc. | 622 | ||||||||
| 84,110 | ||||||||||
| Electric: 0.1% | ||||||||||
| 80 | @ | AES Corp. | 1,094 | |||||||
| 10 | Ameren Corp. | 501 | ||||||||
| 40 | American Electric Power Co., Inc. | 1,374 | ||||||||
| 30 | CenterPoint Energy, Inc. | 339 | ||||||||
| 10 | Cinergy Corp. | 416 | ||||||||
| 30 | Consolidated Edison, Inc. | 1,313 | ||||||||
| 20 | Constellation Energy Group, Inc. | 874 | ||||||||
| 10 | Dominion Resources, Inc. | 677 | ||||||||
| 20 | DTE Energy Co. | 863 | ||||||||
| 160 | Duke Energy Corp. | 4,054 | ||||||||
| 30 | Edison Intl | 961 | ||||||||
| 20 | Entergy Corp. | 1,352 | ||||||||
| 70 | Exelon Corp. | 3,085 | ||||||||
| 30 | FirstEnergy Corp. | 1,185 | ||||||||
| 20 | FPL Group, Inc. | 1,495 | ||||||||
| 40 | @ | PG&E Corp. | 1,331 | |||||||
| 10 | Pinnacle West Capital Corp. | 444 | ||||||||
| 30 | PPL Corp. | 1,598 | ||||||||
| 20 | Public Service Enterprise Group, Inc. | 1,035 | ||||||||
| 70 | Southern Co. | 2,346 | ||||||||
| 20 | TECO Energy, Inc. | 307 | ||||||||
| 40 | TXU Corp. | 2,582 | ||||||||
| 40 | Xcel Energy, Inc. | 728 | ||||||||
| 29,954 | ||||||||||
| Electrical Components and Equipment: 0.0% | ||||||||||
| 60 | Emerson Electric Co. | 4,206 | ||||||||
| 4,206 | ||||||||||
| Electronics: 0.0% | ||||||||||
| 50 | @ | Agilent Technologies, Inc. | 1,204 | |||||||
| 20 | Applera Corp. — Applied Biosystems Group | 418 | ||||||||
| 10 | @ | Fisher Scientific Intl | 624 | |||||||
| 20 | @ | Jabil Circuit, Inc. | 512 | |||||||
| 10 | Parker Hannifin Corp. | 757 | ||||||||
| 10 | PerkinElmer, Inc. | 225 | ||||||||
| 50 | @ | Sanmina-SCI Corp. | 424 | |||||||
| 40 | @ | Solectron Corp. | 213 | |||||||
| 10 | Tektronix, Inc. | 302 | ||||||||
| 20 | @ | Thermo Electron Corp. | 604 | |||||||
| 10 | @ | Waters Corp. | 468 | |||||||
| 5,751 | ||||||||||
| Entertainment: 0.0% | ||||||||||
| 30 | International Game Technology | 1,031 | ||||||||
| 1,031 | ||||||||||
| Environmental Control: 0.0% | ||||||||||
| 60 | Waste Management, Inc. | 1,796 | ||||||||
| 1,796 | ||||||||||
| Food: 0.0% | ||||||||||
| 40 | Albertson’s, Inc. | 955 | ||||||||
| 40 | Campbell Soup Co. | 1,196 | ||||||||
| 60 | ConAgra Foods, Inc. | 1,767 | ||||||||
| 40 | General Mills, Inc. | 1,988 | ||||||||
| 30 | H.J. Heinz Co. | 1,170 | ||||||||
| 20 | Hershey Foods Corp. | 1,111 | ||||||||
| 40 | Kellogg Co. | 1,786 | ||||||||
| 30 | @ | Kroger Co. | 526 | |||||||
| 10 | McCormick & Co., Inc. | 386 | ||||||||
| 50 | @ | Safeway, Inc. | 987 | |||||||
| 80 | Sara Lee Corp. | 1,931 | ||||||||
| 20 | SUPERVALU, Inc. | 690 | ||||||||
| 40 | Wm. Wrigley Jr. Co. | 2,769 | ||||||||
| 17,262 | ||||||||||
| Forest Products and Paper: 0.0% | ||||||||||
| 30 | Georgia-Pacific Corp. | 1,124 | ||||||||
| 50 | International Paper Co. | 2,100 | ||||||||
| 10 | Louisiana-Pacific Corp. | 267 | ||||||||
| 30 | MeadWestvaco Corp. | 1,017 | ||||||||
| 20 | Plum Creek Timber Co., Inc. | 769 | ||||||||
| 10 | Temple-Inland, Inc. | 684 | ||||||||
| 30 | Weyerhaeuser Co. | 2,017 | ||||||||
| 7,978 | ||||||||||
| Gas: 0.0% | ||||||||||
| 20 | KeySpan Corp. | 789 | ||||||||
| 30 | Sempra Energy | 1,100 | ||||||||
| 1,889 | ||||||||||
| Hand/Machine Tools: 0.0% | ||||||||||
| 10 | Black & Decker Corp. | 883 | ||||||||
| 10 | Snap-On, Inc. | 344 | ||||||||
| 10 | Stanley Works | 490 | ||||||||
| 1,717 | ||||||||||
| Healthcare — Products: 0.1% | ||||||||||
| 10 | Bausch & Lomb, Inc. | 645 | ||||||||
| 20 | Baxter Intl., Inc. | 691 | ||||||||
| 40 | Becton Dickinson & Co. | 2,272 | ||||||||
| 30 | Biomet, Inc. | 1,302 | ||||||||
| 80 | @ | Boston Scientific Corp. | 2,844 | |||||||
| 10 | C.R. Bard, Inc. | 640 | ||||||||
87
| Shares | Value | |||||||||
| Healthcare — Products (continued) | ||||||||||
| 10 | Guidant Corp. | $ | 721 | |||||||
| 500 | Johnson & Johnson | 31,710 | ||||||||
| 120 | Medtronic, Inc. | 5,960 | ||||||||
| 40 | @ | St. Jude Medical, Inc. | 1,677 | |||||||
| 20 | Stryker Corp. | 965 | ||||||||
| 20 | @ | Zimmer Holdings, Inc. | 1,602 | |||||||
| 51,029 | ||||||||||
| Healthcare — Services: 0.0% | ||||||||||
| 20 | Aetna, Inc. | 2,495 | ||||||||
| 20 | @ | Humana, Inc. | 594 | |||||||
| 10 | @ | Laboratory Corp. Of America Holdings | 498 | |||||||
| 10 | Manor Care, Inc. | 354 | ||||||||
| 10 | Quest Diagnostics, Inc. | 956 | ||||||||
| 110 | UnitedHealth Group, Inc. | 9,683 | ||||||||
| 50 | @ | WellPoint, Inc. | 5,750 | |||||||
| 20,330 | ||||||||||
| Home Builders: 0.0% | ||||||||||
| 10 | Centex Corp. | 596 | ||||||||
| 596 | ||||||||||
| Home Furnishings: 0.0% | ||||||||||
| 20 | Leggett & Platt, Inc. | 569 | ||||||||
| 10 | Whirlpool Corp. | 692 | ||||||||
| 1,261 | ||||||||||
| Household Products/Wares: 0.0% | ||||||||||
| 10 | Avery Dennison Corp. | 600 | ||||||||
| 20 | Clorox Co. | 1,178 | ||||||||
| 10 | Fortune Brands, Inc. | 772 | ||||||||
| 2,550 | ||||||||||
| Housewares: 0.0% | ||||||||||
| 30 | Newell Rubbermaid, Inc. | 726 | ||||||||
| 726 | ||||||||||
| Insurance: 0.1% | ||||||||||
| 30 | @@ | ACE Ltd. | 1,283 | |||||||
| 50 | AFLAC, Inc. | 1,992 | ||||||||
| 70 | Allstate Corp. | 3,620 | ||||||||
| 10 | AMBAC Financial Group, Inc. | 821 | ||||||||
| 260 | American Intl. Group, Inc. | 17,075 | ||||||||
| 30 | AON Corp. | 716 | ||||||||
| 30 | Chubb Corp. | 2,307 | ||||||||
| 20 | CIGNA Corp. | 1,631 | ||||||||
| 13 | Cincinnati Financial Corp. | 575 | ||||||||
| 40 | Hartford Financial Services Group, Inc. | 2,772 | ||||||||
| 10 | Jefferson-Pilot Corp. | 520 | ||||||||
| 20 | Lincoln National Corp. | 934 | ||||||||
| 30 | Loews Corp. | 2,109 | ||||||||
| 20 | Marsh & McLennan Cos., Inc. | 658 | ||||||||
| 15 | MBIA, Inc. | 949 | ||||||||
| 70 | MetLife, Inc. | 2,836 | ||||||||
| 10 | MGIC Investment Corp. | 689 | ||||||||
| 30 | Principal Financial Group | 1,228 | ||||||||
| 20 | Progressive Corp. | 1,697 | ||||||||
| 90 | Prudential Financial, Inc. | 4,946 | ||||||||
| 20 | Safeco Corp. | 1,045 | ||||||||
| 30 | St. Paul Travelers Cos., Inc. | 1,112 | ||||||||
| 10 | Torchmark Corp. | 571 | ||||||||
| 30 | UnumProvident Corp. | 538 | ||||||||
| 10 | @@ | XL Capital Ltd. | 777 | |||||||
| 53,401 | ||||||||||
| Internet: 0.0% | ||||||||||
| 70 | @ | eBay, Inc. | 8,140 | |||||||
| 100 | @ | Symantec Corp. | 2,576 | |||||||
| 140 | @ | Yahoo!, Inc. | 5,275 | |||||||
| 15,991 | ||||||||||
| Iron/Steel: 0.0% | ||||||||||
| 20 | Nucor Corp. | 1,046 | ||||||||
| 10 | United States Steel Corp. | 513 | ||||||||
| 1,559 | ||||||||||
| Leisure Time: 0.0% | ||||||||||
| 10 | Brunswick Corp. | 495 | ||||||||
| 60 | Carnival Corp. | 3,457 | ||||||||
| 30 | Harley-Davidson, Inc. | 1,823 | ||||||||
| 10 | Sabre Holdings Corp. | 222 | ||||||||
| 5,997 | ||||||||||
| Lodging: 0.0% | ||||||||||
| 10 | Harrah’s Entertainment, Inc. | 669 | ||||||||
| 40 | Hilton Hotels Corp. | 910 | ||||||||
| 30 | Marriott Intl., Inc. | 1,889 | ||||||||
| 20 | Starwood Hotels & Resorts Worldwide, Inc. | 1,168 | ||||||||
| 4,636 | ||||||||||
| Machinery — Construction and Mining: 0.0% | ||||||||||
| 10 | Caterpillar, Inc. | 975 | ||||||||
| 975 | ||||||||||
| Machinery — Diversified: 0.0% | ||||||||||
| 20 | Deere & Co. | 1,488 | ||||||||
| 20 | Rockwell Automation, Inc. | 991 | ||||||||
| 2,479 | ||||||||||
| Media: 0.1% | ||||||||||
| 220 | @ | Comcast Corp. | 7,322 | |||||||
| 30 | Gannett Co., Inc. | 2,451 | ||||||||
| 10 | Knight-Ridder, Inc. | 669 | ||||||||
| 30 | McGraw-Hill Cos., Inc. | 2,746 | ||||||||
| 10 | New York Times Co. | 408 | ||||||||
| 260 | News Corp. | 4,852 | ||||||||
| 450 | @ | Time Warner, Inc. | 8,749 | |||||||
| 10 | Tribune Co. | 421 | ||||||||
| 170 | Viacom, Inc. | 6,186 | ||||||||
| 210 | Walt Disney Co. | 5,838 | ||||||||
| 39,642 | ||||||||||
| Mining: 0.0% | ||||||||||
| 10 | Phelps Dodge Corp. | 989 | ||||||||
| 989 | ||||||||||
| Miscellaneous Manufacturing: 0.1% | ||||||||||
| 80 | 3M Co. | 6,566 | ||||||||
| 10 | Cooper Industries Ltd. | 679 | ||||||||
| 30 | Danaher Corp. | 1,722 | ||||||||
| 10 | Dover Corp. | 419 | ||||||||
| 40 | Eastman Kodak Co. | 1,290 | ||||||||
| 20 | Eaton Corp. | 1,447 | ||||||||
| 1,050 | General Electric Co. | 38,325 | ||||||||
| 90 | Honeywell Intl., Inc. | 3,187 | ||||||||
| 30 | Illinois Tool Works, Inc. | 2,780 | ||||||||
| 20 | @@ | Ingersoll-Rand Co. | 1,606 | |||||||
| 10 | ITT Industries, Inc. | 845 | ||||||||
| 10 | Pall Corp. | 290 | ||||||||
| 10 | Textron, Inc. | 738 | ||||||||
| 200 | @@ | Tyco Intl., Ltd. | 7,148 | |||||||
| 67,042 | ||||||||||
88
| Shares | Value | |||||||||
| Office/Business Equipment: 0.0% | ||||||||||
| 20 | Pitney Bowes, Inc. | $ | 926 | |||||||
| 130 | @ | Xerox Corp. | 2,211 | |||||||
| 3,137 | ||||||||||
| Oil and Gas: 0.3% | ||||||||||
| 10 | Amerada Hess Corp. | 824 | ||||||||
| 30 | Anadarko Petroleum Corp. | 1,944 | ||||||||
| 30 | Apache Corp. | 1,517 | ||||||||
| 60 | Burlington Resources, Inc. | 2,610 | ||||||||
| 270 | ChevronTexaco Corp. | 14,178 | ||||||||
| 110 | ConocoPhillips | 9,551 | ||||||||
| 80 | Devon Energy Corp. | 3,114 | ||||||||
| 10 | EOG Resources, Inc. | 714 | ||||||||
| 810 | Exxon Mobil Corp. | 41,520 | ||||||||
| 10 | Kerr-McGee Corp. | 578 | ||||||||
| 30 | Marathon Oil Corp. | 1,128 | ||||||||
| 10 | @,@@ | Nabors Industries, Ltd. | 513 | |||||||
| 10 | @ | Noble Corp. | 497 | |||||||
| 40 | Occidental Petroleum Corp. | 2,334 | ||||||||
| 10 | Sunoco, Inc. | 817 | ||||||||
| 30 | @ | Transocean, Inc. | 1,272 | |||||||
| 20 | Unocal Corp. | 865 | ||||||||
| 40 | Valero Energy Corp. | 1,816 | ||||||||
| 85,792 | ||||||||||
| Oil and Gas Services: 0.0% | ||||||||||
| 30 | Baker Hughes, Inc. | 1,280 | ||||||||
| 20 | BJ Services Co. | 931 | ||||||||
| 40 | Halliburton Co. | 1,570 | ||||||||
| 3,781 | ||||||||||
| Packaging and Containers: 0.0% | ||||||||||
| 10 | Ball Corp. | 440 | ||||||||
| 10 | Bemis Co. | 291 | ||||||||
| 20 | @ | Pactiv Corp. | 506 | |||||||
| 10 | @ | Sealed Air Corp. | 532 | |||||||
| 1,769 | ||||||||||
| Pharmaceuticals: 0.1% | ||||||||||
| 150 | Abbott Laboratories | 6,998 | ||||||||
| 10 | Allergan, Inc. | 811 | ||||||||
| 10 | AmerisourceBergen Corp. | 587 | ||||||||
| 190 | Bristol-Myers Squibb Co. | 4,868 | ||||||||
| 60 | Cardinal Health, Inc. | 3,489 | ||||||||
| 80 | @ | Caremark Rx, Inc. | 3,154 | |||||||
| 50 | Eli Lilly & Co. | 2,838 | ||||||||
| 10 | @ | Express Scripts, Inc. | 764 | |||||||
| 40 | @ | Forest Laboratories, Inc. | 1,794 | |||||||
| 40 | @ | Gilead Sciences, Inc. | 1,400 | |||||||
| 20 | @ | Hospira, Inc. | 670 | |||||||
| 26 | @ | King Pharmaceuticals, Inc. | 322 | |||||||
| 29 | @ | Medco Health Solutions, Inc. | 1,206 | |||||||
| 220 | Merck & Co., Inc. | 7,071 | ||||||||
| 744 | Pfizer, Inc. | 20,006 | ||||||||
| 140 | Schering-Plough Corp. | 2,923 | ||||||||
| 130 | Wyeth | 5,537 | ||||||||
| 64,438 | ||||||||||
| Pipelines: 0.0% | ||||||||||
| 30 | @ | Dynegy, Inc. | 139 | |||||||
| 60 | El Paso Corp. | 624 | ||||||||
| 10 | Kinder Morgan, Inc. | 731 | ||||||||
| 50 | Williams Cos., Inc. | 814 | ||||||||
| 2,308 | ||||||||||
| Real Estate Investment Trusts: 0.0% | ||||||||||
| 10 | Apartment Investment & Management Co. | 385 | ||||||||
| 20 | Equity Office Properties Trust | 582 | ||||||||
| 20 | ProLogis | 867 | ||||||||
| 20 | Simon Property Group, Inc. | 1,294 | ||||||||
| 3,128 | ||||||||||
| Retail: 0.3% | ||||||||||
| 30 | @ | Bed Bath & Beyond, Inc. | 1,195 | |||||||
| 30 | Best Buy Co., Inc. | 1,783 | ||||||||
| 30 | Circuit City Stores, Inc. | 469 | ||||||||
| 80 | Costco Wholesale Corp. | 3,873 | ||||||||
| 40 | CVS Corp. | 1,803 | ||||||||
| 20 | Darden Restaurants, Inc. | 555 | ||||||||
| 10 | Dillard’s, Inc. | 269 | ||||||||
| 10 | Family Dollar Stores, Inc. | 312 | ||||||||
| 20 | Federated Department Stores, Inc. | 1,156 | ||||||||
| 120 | Gap, Inc. | 2,534 | ||||||||
| 370 | Home Depot, Inc. | 15,813 | ||||||||
| 50 | J.C. Penney Co., Inc. Holding Co. | 2,070 | ||||||||
| 10 | @ | Kohl’s Corp. | 492 | |||||||
| 60 | Limited Brands, Inc. | 1,381 | ||||||||
| 80 | Lowe’s Cos., Inc. | 4,607 | ||||||||
| 30 | May Department Stores Co. | 882 | ||||||||
| 210 | McDonald’s Corp. | 6,732 | ||||||||
| 10 | Nordstrom, Inc. | 467 | ||||||||
| 30 | @ | Office Depot, Inc. | 521 | |||||||
| 20 | RadioShack Corp. | 658 | ||||||||
| 80 | Staples, Inc. | 2,697 | ||||||||
| 50 | @ | Starbucks Corp. | 3,118 | |||||||
| 90 | Target Corp. | 4,674 | ||||||||
| 50 | TJX Cos., Inc. | 1,257 | ||||||||
| 40 | @ | Toys R US, Inc. | 819 | |||||||
| 420 | Wal-Mart Stores, Inc. | 22,183 | ||||||||
| 100 | Walgreen Co. | 3,837 | ||||||||
| 10 | Wendy’s Intl., Inc. | 393 | ||||||||
| 30 | Yum! Brands, Inc. | 1,415 | ||||||||
| 87,965 | ||||||||||
| Savings and Loans: 0.0% | ||||||||||
| 30 | Golden West Financial Corp. | 1,843 | ||||||||
| 10 | Sovereign Bancorp, Inc. | 226 | ||||||||
| 85 | Washington Mutual, Inc. | 3,593 | ||||||||
| 5,662 | ||||||||||
| Semiconductors: 0.1% | ||||||||||
| 20 | @ | Advanced Micro Devices, Inc. | 440 | |||||||
| 50 | @ | Altera Corp. | 1,035 | |||||||
| 40 | Analog Devices, Inc. | 1,477 | ||||||||
| 170 | @ | Applied Materials, Inc. | 2,907 | |||||||
| 35 | @ | Freescale Semiconductor Inc. | 643 | |||||||
| 630 | Intel Corp. | 14,736 | ||||||||
| 20 | @ | KLA-Tencor Corp. | 932 | |||||||
| 30 | Linear Technology Corp. | 1,163 | ||||||||
| 10 | Maxim Integrated Products, Inc. | 424 | ||||||||
| 40 | National Semiconductor Corp. | 718 | ||||||||
| 10 | @ | Qlogic Corp. | 367 | |||||||
| 70 | Texas Instruments, Inc. | 1,723 | ||||||||
| 26,565 | ||||||||||
| Software: 0.1% | ||||||||||
| 20 | Adobe Systems, Inc. | 1,255 | ||||||||
| 30 | Autodesk, Inc. | 1,139 | ||||||||
| 60 | Automatic Data Processing, Inc. | 2,661 | ||||||||
| 30 | @ | BMC Software, Inc. | 558 | |||||||
| 20 | @ | Citrix Systems, Inc. | 491 | |||||||
| 60 | Computer Associates Intl., Inc. | 1,864 | ||||||||
| 70 | @ | Compuware Corp. | 453 | |||||||
| 10 | @ | Electronic Arts, Inc. | 617 | |||||||
| 81 | First Data Corp. | 3,445 | ||||||||
| 15 | @ | Fiserv, Inc. | 603 | |||||||
| 20 | IMS Health, Inc. | 464 | ||||||||
| 20 | @ | Intuit, Inc. | 880 | |||||||
| 1,070 | Microsoft Corp. | 28,579 | ||||||||
89
| Shares | Value | |||||||||
| Software (continued) | ||||||||||
| 30 | @ | Novell, Inc. | $ | 203 | ||||||
| 870 | @ | Oracle Corp. | 11,935 | |||||||
| 30 | @ | Parametric Technology Corp. | 177 | |||||||
| 40 | @ | PeopleSoft, Inc. | 1,059 | |||||||
| 60 | @ | Siebel Systems, Inc. | 630 | |||||||
| 50 | @ | Veritas Software Corp. | 1,428 | |||||||
| 58,441 | ||||||||||
| Telecommunications: 0.1% | ||||||||||
| 40 | Alltel Corp. | 2,350 | ||||||||
| 36 | AT&T Corp. | 686 | ||||||||
| 50 | @ | Avaya, Inc. | 860 | |||||||
| 180 | BellSouth Corp. | 5,002 | ||||||||
| 10 | CenturyTel, Inc. | 355 | ||||||||
| 650 | @ | Cisco Systems, Inc. | 12,545 | |||||||
| 30 | Citizens Communications Co. | 414 | ||||||||
| 20 | @ | Comverse Technology, Inc. | 489 | |||||||
| 50 | @ | Corning, Inc. | 589 | |||||||
| 420 | @ | Lucent Technologies, Inc. | 1,579 | |||||||
| 230 | Motorola, Inc. | 3,956 | ||||||||
| 110 | @ | Nextel Communications, Inc. | 3,300 | |||||||
| 160 | QUALCOMM, Inc. | 6,784 | ||||||||
| 70 | @ | Qwest Communications Intl., Inc. | 311 | |||||||
| 340 | SBC Communications, Inc. | 8,762 | ||||||||
| 10 | Scientific-Atlanta, Inc. | 330 | ||||||||
| 140 | Sprint Corp. | 3,479 | ||||||||
| 50 | @ | Tellabs, Inc. | 430 | |||||||
| 370 | Verizon Communications, Inc. | 14,988 | ||||||||
| 67,209 | ||||||||||
| Textiles: 0.0% | ||||||||||
| 20 | Cintas Corp. | 877 | ||||||||
| 877 | ||||||||||
| Toys/Games/Hobbies: 0.0% | ||||||||||
| 20 | Hasbro, Inc. | 388 | ||||||||
| 40 | Mattel, Inc. | 779 | ||||||||
| 1,167 | ||||||||||
| Transportation: 0.0% | ||||||||||
| 50 | Burlington Northern Santa Fe Corp. | 2,365 | ||||||||
| 20 | CSX Corp. | 802 | ||||||||
| 50 | FedEx Corp. | 4,924 | ||||||||
| 50 | Norfolk Southern Corp. | 1,810 | ||||||||
| 10 | Ryder System, Inc. | 478 | ||||||||
| 110 | United Parcel Service, Inc. | 9,400 | ||||||||
| 19,779 | ||||||||||
| Total Common Stock (Cost $1,063,837) | 1,165,635 | |||||||||
| Principal | ||||||||||
| Amount | Value | |||||||||
| U.S. GOVERNMENT AGENCY OBLIGATIONS: 59.4% | ||||||||||
| Federal Home Loan Mortgage Corporation: 27.5% | ||||||||||
| $ | 15,000,000 | 3.070%, due 03/14/06 | $ | 14,460,194 | ||||||
| 14,460,194 | ||||||||||
| Federal National Mortgage Association: 15.9% | ||||||||||
| 4,715,000 | 2.930%, due 11/15/05 | 4,595,645 | ||||||||
| 3,879,000 | 3.010%, due 01/15/06 | 3,759,511 | ||||||||
| 8,355,156 | ||||||||||
| Other: 16.0% | ||||||||||
| 4,608,000 | FICO STRIP, 3.000%, due 03/07/06 | 4,448,057 | ||||||||
| 4,126,000 | FICO STRIP, 3.040%, due 04/06/06 | 3,971,642 | ||||||||
| 8,419,699 | ||||||||||
| Total U.S. Government Agency Obligations (Cost $30,705,716) | 31,235,049 | |||||||||
| U.S. TREASURY OBLIGATIONS: 14.3% | ||||||||||
| Other: 14.3% | ||||||||||
| 7,766,000 | United States Treasury Strip Coupon, 2.750%, due 02/15/06 | 7,532,717 | ||||||||
| Total U.S. Treasury Obligations (Cost $7,605,985) | 7,532,717 | |||||||||
| OTHER BONDS: 23.8% | ||||||||||
| Sovereign: 23.8% | ||||||||||
| 3,115,000 | Israel Trust, 3.280%, due 05/15/06 | 2,979,130 | ||||||||
| 10,000,000 | Turkey Trust, 3.280%, due 05/15/06 | 9,563,820 | ||||||||
| Total Other Bonds (Cost $12,538,339) | 12,542,950 | |||||||||
| Total Long-Term Investments (Cost $51,913,877) | 52,476,351 | |||||||||
| SHORT-TERM INVESTMENTS: 0.4% | ||||||||||
| Repurchase Agreement: 0.4% | ||||||||||
| 224,000 | Morgan Stanley Repurchase Agreement dated 12/31/05, 2.200% due 01/03/05, $224,041 to be received upon repurchase (Collateralized by $235,000 Federal Farm Credit Bank, 2.350%, Market Value plus accrued interest $233,276, due 09/18/06). | 224,000 | ||||||||
| Total Short-Term Investments (Cost $224,000) | 224,000 | |||||||||
Total Investments In Securities (Cost $52,137,877)* | 100.1 | % | $ | 52,700,351 | ||||||||
Other Assets and Liabilities-Net | (0.1 | ) | (71,779 | ) | ||||||||
Net Assets | 100.0 | % | $ | 52,628,572 | ||||||||
| @ | Non-income producing security | |
| @@ | Foreign issuer | |
| & | Payment-in-kind | |
| STRIP | Separate Trading of Registered Interest and Principal of Securities | |
| * | Cost for federal income tax purposes is $52,169,078. Net unrealized depreciation consists of: |
| Gross Unrealized Appreciation | $ | 633,631 | ||
| Gross Unrealized Depreciation | (102,358 | ) | ||
| Net Unrealized Appreciation | $ | 531,273 | ||
90
| Shares | Value | |||||||||
| COMMON STOCK: 5.7% | ||||||||||
| Advertising: 0.0% | ||||||||||
| 60 | @ | Interpublic Group of Cos., Inc. | $ | 804 | ||||||
| 70 | Omnicom Group, Inc. | 5,902 | ||||||||
| 6,706 | ||||||||||
| Aerospace/ Defense: 0.1% | ||||||||||
| 540 | Boeing Co. | 27,955 | ||||||||
| 130 | General Dynamics Corp. | 13,598 | ||||||||
| 50 | Goodrich Corp. | 1,632 | ||||||||
| 40 | L-3 Communications Holdings, Inc. | 2,930 | ||||||||
| 220 | Lockheed Martin Corp. | 12,221 | ||||||||
| 130 | Northrop Grumman Corp. | 7,067 | ||||||||
| 290 | Raytheon Co. | 11,261 | ||||||||
| 70 | Rockwell Collins, Inc. | 2,761 | ||||||||
| 190 | United Technologies Corp. | 19,636 | ||||||||
| 99,061 | ||||||||||
| Agriculture: 0.1% | ||||||||||
| 770 | Altria Group, Inc. | 47,047 | ||||||||
| 235 | Archer-Daniels-Midland Co. | 5,243 | ||||||||
| 120 | Monsanto Co. | 6,666 | ||||||||
| 60 | Reynolds American, Inc. | 4,716 | ||||||||
| 80 | UST, Inc. | 3,849 | ||||||||
| 67,521 | ||||||||||
| Apparel: 0.0% | ||||||||||
| 100 | @ | Coach, Inc. | 5,640 | |||||||
| 70 | Jones Apparel Group, Inc. | 2,560 | ||||||||
| 40 | Liz Claiborne, Inc. | 1,688 | ||||||||
| 160 | Nike, Inc. | 14,510 | ||||||||
| 20 | Reebok Intl., Ltd. | 880 | ||||||||
| 70 | VF Corp. | 3,877 | ||||||||
| 29,155 | ||||||||||
| Auto Manufacturers: 0.0% | ||||||||||
| 1,180 | Ford Motor Co. | 17,275 | ||||||||
| 210 | General Motors Corp. | 8,413 | ||||||||
| 92 | PACCAR, Inc. | 7,404 | ||||||||
| 33,092 | ||||||||||
| Auto Parts and Equipment: 0.0% | ||||||||||
| 80 | @ | Goodyear Tire & Rubber Co. | 1,173 | |||||||
| 70 | Johnson Controls, Inc. | 4,441 | ||||||||
| 5,614 | ||||||||||
| Banks: 0.5% | ||||||||||
| 140 | AmSouth Bancorporation | 3,626 | ||||||||
| 1,516 | Bank of America Corp. | 71,237 | ||||||||
| 210 | BB&T Corp. | 8,831 | ||||||||
| 90 | Comerica, Inc. | 5,492 | ||||||||
| 40 | Compass Bancshares, Inc. | 1,947 | ||||||||
| 80 | Fifth Third Bancorp | 3,782 | ||||||||
| 40 | First Horizon National Corp. | 1,724 | ||||||||
| 80 | Huntington Bancshares, Inc. | 1,982 | ||||||||
| 210 | KeyCorp | 7,119 | ||||||||
| 40 | M & T Bank Corp. | 4,314 | ||||||||
| 90 | Marshall & Ilsley Corp. | 3,978 | ||||||||
| 160 | Mellon Financial Corp. | 4,978 | ||||||||
| 340 | National City Corp. | 12,767 | ||||||||
| 165 | North Fork Bancorporation, Inc. | 4,760 | ||||||||
| 80 | Northern Trust Corp. | 3,886 | ||||||||
| 40 | PNC Financial Services Group, Inc. | 2,298 | ||||||||
| 174 | Regions Financial Corp. | 6,193 | ||||||||
| 120 | State Street Corp. | 5,894 | ||||||||
| 130 | SunTrust Banks, Inc. | 9,604 | ||||||||
| 50 | Synovus Financial Corp. | 1,429 | ||||||||
| 280 | The Bank of New York Co., Inc. | 9,358 | ||||||||
| 700 | U.S. Bancorp | 21,924 | ||||||||
| 596 | Wachovia Corp. | 31,350 | ||||||||
| 630 | Wells Fargo & Co. | 39,155 | ||||||||
| 30 | Zions Bancorporation | 2,041 | ||||||||
| 269,669 | ||||||||||
| Beverages: 0.1% | ||||||||||
| 20 | Adolph Coors Co. | 1,513 | ||||||||
| 120 | Anheuser-Busch Cos., Inc. | 6,088 | ||||||||
| 50 | Brown-Forman Corp. | 2,434 | ||||||||
| 900 | Coca-Cola Co. | 37,467 | ||||||||
| 180 | Coca-Cola Enterprises, Inc. | 3,753 | ||||||||
| 100 | Pepsi Bottling Group, Inc. | 2,704 | ||||||||
| 850 | PepsiCo, Inc. | 44,370 | ||||||||
| 98,329 | ||||||||||
| Biotechnology: 0.1% | ||||||||||
| 481 | @ | Amgen, Inc. | 30,857 | |||||||
| 130 | @ | Biogen Idec, Inc. | 8,659 | |||||||
| 90 | @ | Genzyme Corp. | 5,226 | |||||||
| 40 | @ | MedImmune, Inc. | 1,084 | |||||||
| 45,826 | ||||||||||
| Building Materials: 0.0% | ||||||||||
| 110 | @ | American Standard Cos., Inc. | 4,545 | |||||||
| 160 | Masco Corp. | 5,845 | ||||||||
| 50 | Vulcan Materials Co. | 2,731 | ||||||||
| 13,121 | ||||||||||
| Chemicals: 0.1% | ||||||||||
| 80 | Air Products & Chemicals, Inc. | 4,638 | ||||||||
| 20 | Ashland, Inc. | 1,168 | ||||||||
| 380 | Dow Chemical Co. | 18,813 | ||||||||
| 380 | E.I. du Pont de Nemours & Co. | 18,639 | ||||||||
| 30 | Eastman Chemical Co. | 1,732 | ||||||||
| 40 | Ecolab, Inc. | 1,405 | ||||||||
| 60 | Engelhard Corp. | 1,840 | ||||||||
| 30 | International Flavors & Fragrances, Inc. | 1,285 | ||||||||
| 120 | PPG Industries, Inc. | 8,179 | ||||||||
| 140 | Praxair, Inc. | 6,181 | ||||||||
| 100 | Rohm & Haas Co. | 4,423 | ||||||||
| 90 | Sherwin-Williams Co. | 4,017 | ||||||||
| 30 | Sigma-Aldrich Corp. | 1,814 | ||||||||
| 74,134 | ||||||||||
| Commercial Services: 0.1% | ||||||||||
| 70 | @ | Apollo Group, Inc. | 5,650 | |||||||
| 400 | Cendant Corp. | 9,352 | ||||||||
| 50 | Equifax, Inc. | 1,405 | ||||||||
| 90 | H&R Block, Inc. | 4,410 | ||||||||
| 110 | McKesson Corp. | 3,461 | ||||||||
| 60 | Moody’s Corp. | 5,211 | ||||||||
| 140 | Paychex, Inc. | 4,771 | ||||||||
| 80 | R.R. Donnelley & Sons Co. | 2,823 | ||||||||
| 80 | Robert Half Intl., Inc. | 2,354 | ||||||||
| 39,437 | ||||||||||
| Computers: 0.3% | ||||||||||
| 50 | @ | Affiliated Computer Services, Inc. | 3,010 | |||||||
| 240 | @ | Apple Computer, Inc. | 15,456 | |||||||
| 70 | @ | Computer Sciences Corp. | 3,946 | |||||||
| 1,570 | @ | Dell, Inc. | 66,160 | |||||||
| 190 | Electronic Data Systems Corp. | 4,389 | ||||||||
| 900 | @ | EMC Corp. | 13,383 | |||||||
| 100 | @ | Gateway, Inc. | 601 | |||||||
| 1,138 | Hewlett-Packard Co. | 23,864 | ||||||||
| 840 | International Business Machines Corp. | 82,807 | ||||||||
| 50 | @ | Lexmark Intl., Inc. | 4,250 | |||||||
| 40 | @ | NCR Corp. | 2,769 | |||||||
| 140 | @ | Network Appliance, Inc. | 4,651 | |||||||
91
| Shares | Value | |||||||||
| Computers (continued) | ||||||||||
| 2,140 | @ | Sun Microsystems, Inc. | $ | 11,513 | ||||||
| 110 | @ | Sungard Data Systems, Inc. | 3,116 | |||||||
| 150 | @ | Unisys Corp. | 1,527 | |||||||
| 241,442 | ||||||||||
| Cosmetics/ Personal Care: 0.2% | ||||||||||
| 60 | Alberto-Culver Co. | 2,914 | ||||||||
| 70 | Avon Products, Inc. | 2,709 | ||||||||
| 200 | Colgate-Palmolive Co. | 10,232 | ||||||||
| 630 | Gillette Co. | 28,211 | ||||||||
| 180 | Kimberly-Clark Corp. | 11,846 | ||||||||
| 1,610 | Procter & Gamble Co. | 88,679 | ||||||||
| 144,591 | ||||||||||
| Distribution/ Wholesale: 0.0% | ||||||||||
| 110 | Genuine Parts Co. | 4,847 | ||||||||
| 60 | W.W. Grainger, Inc. | 3,997 | ||||||||
| 8,844 | ||||||||||
| Diversified Financial Services: 0.5% | ||||||||||
| 630 | American Express Co. | 35,513 | ||||||||
| 40 | Bear Stearns Cos., Inc. | 4,092 | ||||||||
| 150 | Capital One Financial Corp. | 12,632 | ||||||||
| 110 | CIT Group, Inc. | 5,040 | ||||||||
| 1,920 | Citigroup, Inc. | 92,507 | ||||||||
| 208 | Countrywide Financial Corp. | 7,698 | ||||||||
| 140 | @ | E*TRADE Financial Corp. | 2,093 | |||||||
| 360 | Fannie Mae | 25,636 | ||||||||
| 20 | Federated Investors, Inc. | 608 | ||||||||
| 90 | Franklin Resources, Inc. | 6,269 | ||||||||
| 260 | Freddie Mac | 19,162 | ||||||||
| 180 | Goldman Sachs Group, Inc. | 18,727 | ||||||||
| 90 | Janus Capital Group, Inc. | 1,513 | ||||||||
| 130 | Lehman Brothers Holdings, Inc. | 11,372 | ||||||||
| 475 | MBNA Corp. | 13,390 | ||||||||
| 360 | Merrill Lynch & Co., Inc. | 21,517 | ||||||||
| 410 | Morgan Stanley | 22,763 | ||||||||
| 100 | @ | Providian Financial Corp. | 1,647 | |||||||
| 170 | SLM Corp. | 9,076 | ||||||||
| 50 | T. Rowe Price Group, Inc. | 3,110 | ||||||||
| 314,365 | ||||||||||
| Electric: 0.1% | ||||||||||
| 230 | @ | AES Corp. | 3,144 | |||||||
| 30 | Ameren Corp. | 1,504 | ||||||||
| 150 | American Electric Power Co., Inc. | 5,151 | ||||||||
| 30 | Cinergy Corp. | 1,249 | ||||||||
| 90 | Consolidated Edison, Inc. | 3,938 | ||||||||
| 70 | Constellation Energy Group, Inc. | 3,060 | ||||||||
| 50 | Dominion Resources, Inc. | 3,387 | ||||||||
| 70 | DTE Energy Co. | 3,019 | ||||||||
| 590 | Duke Energy Corp. | 14,944 | ||||||||
| 130 | Edison Intl. | 4,164 | ||||||||
| 80 | Entergy Corp. | 5,407 | ||||||||
| 250 | Exelon Corp. | 11,017 | ||||||||
| 120 | FirstEnergy Corp. | 4,741 | ||||||||
| 70 | FPL Group, Inc. | 5,233 | ||||||||
| 160 | @ | PG&E Corp. | 5,325 | |||||||
| 40 | Pinnacle West Capital Corp. | 1,776 | ||||||||
| 90 | PPL Corp. | 4,795 | ||||||||
| 90 | Public Service Enterprise Group, Inc. | 4,659 | ||||||||
| 280 | Southern Co. | 9,386 | ||||||||
| 90 | TECO Energy, Inc. | 1,381 | ||||||||
| 150 | TXU Corp. | 9,684 | ||||||||
| 150 | Xcel Energy, Inc. | 2,730 | ||||||||
| 109,694 | ||||||||||
| Electrical Components and Equipment: 0.0% | ||||||||||
| 210 | Emerson Electric Co. | 14,721 | ||||||||
| 14,721 | ||||||||||
| Electronics: 0.0% | ||||||||||
| 190 | @ | Agilent Technologies, Inc. | 4,578 | |||||||
| 80 | Applera Corp. — Applied Biosystems Group | 1,673 | ||||||||
| 50 | @ | Fisher Scientific Intl. | 3,119 | |||||||
| 80 | @ | Jabil Circuit, Inc. | 2,046 | |||||||
| 50 | Parker Hannifin Corp. | 3,787 | ||||||||
| 50 | PerkinElmer, Inc. | 1,125 | ||||||||
| 180 | @ | Sanmina-SCI Corp. | 1,525 | |||||||
| 140 | @ | Solectron Corp. | 746 | |||||||
| 40 | Tektronix, Inc. | 1,208 | ||||||||
| 110 | @ | Thermo Electron Corp. | 3,321 | |||||||
| 50 | @ | Waters Corp. | 2,340 | |||||||
| 25,468 | ||||||||||
| Engineering and Construction: 0.0% | ||||||||||
| 30 | Fluor Corp. | 1,635 | ||||||||
| 1,635 | ||||||||||
| Entertainment: 0.0% | ||||||||||
| 130 | International Game Technology | 4,469 | ||||||||
| 4,469 | ||||||||||
| Environmental Control: 0.0% | ||||||||||
| 220 | Waste Management, Inc. | 6,587 | ||||||||
| 6,587 | ||||||||||
| Food: 0.1% | ||||||||||
| 140 | Albertson’s, Inc. | 3,343 | ||||||||
| 150 | Campbell Soup Co. | 4,484 | ||||||||
| 200 | ConAgra Foods, Inc. | 5,890 | ||||||||
| 140 | General Mills, Inc. | 6,959 | ||||||||
| 130 | H.J. Heinz Co. | 5,069 | ||||||||
| 90 | Hershey Foods Corp. | 4,999 | ||||||||
| 160 | Kellogg Co. | 7,146 | ||||||||
| 110 | @ | Kroger Co. | 1,929 | |||||||
| 60 | McCormick & Co., Inc. | 2,316 | ||||||||
| 170 | @ | Safeway, Inc. | 3,356 | |||||||
| 300 | Sara Lee Corp. | 7,241 | ||||||||
| 80 | SUPERVALU, Inc. | 2,762 | ||||||||
| 140 | Wm. Wrigley Jr. Co. | 9,686 | ||||||||
| 65,180 | ||||||||||
| Forest Products and Paper: 0.0% | ||||||||||
| 130 | Georgia-Pacific Corp. | 4,872 | ||||||||
| 200 | International Paper Co. | 8,400 | ||||||||
| 60 | Louisiana-Pacific Corp. | 1,604 | ||||||||
| 80 | MeadWestvaco Corp. | 2,711 | ||||||||
| 70 | Plum Creek Timber Co., Inc. | 2,691 | ||||||||
| 30 | Temple-Inland, Inc. | 2,052 | ||||||||
| 130 | Weyerhaeuser Co. | 8,739 | ||||||||
| 31,069 | ||||||||||
| Gas: 0.0% | ||||||||||
| 60 | KeySpan Corp. | 2,367 | ||||||||
| 110 | Sempra Energy | 4,035 | ||||||||
| 6,402 | ||||||||||
| Hand/ Machine Tools: 0.0% | ||||||||||
| 50 | Black & Decker Corp. | 4,416 | ||||||||
| 20 | Snap-On, Inc. | 687 | ||||||||
| 40 | Stanley Works | 1,960 | ||||||||
| 7,063 | ||||||||||
92
| Shares | Value | |||||||||
| Healthcare — Products: 0.3% | ||||||||||
| 30 | Bausch & Lomb, Inc. | $ | 1,934 | |||||||
| 90 | Baxter Intl., Inc. | 3,109 | ||||||||
| 160 | Becton Dickinson & Co. | 9,088 | ||||||||
| 90 | Biomet, Inc. | 3,905 | ||||||||
| 310 | @ | Boston Scientific Corp. | 11,021 | |||||||
| 50 | C.R. Bard, Inc. | 3,199 | ||||||||
| 50 | Guidant Corp. | 3,605 | ||||||||
| 1,880 | Johnson & Johnson | 119,229 | ||||||||
| 450 | Medtronic, Inc. | 22,351 | ||||||||
| 140 | @ | St. Jude Medical, Inc. | 5,870 | |||||||
| 60 | Stryker Corp. | 2,895 | ||||||||
| 90 | @ | Zimmer Holdings, Inc. | 7,211 | |||||||
| 193,417 | ||||||||||
| Healthcare — Services: 0.1% | ||||||||||
| 100 | Aetna, Inc. | 12,475 | ||||||||
| 100 | @ | Humana, Inc. | 2,969 | |||||||
| 50 | @ | Laboratory Corp. Of America Holdings | 2,491 | |||||||
| 30 | Manor Care, Inc. | 1,063 | ||||||||
| 30 | Quest Diagnostics, Inc. | 2,867 | ||||||||
| 420 | UnitedHealth Group, Inc. | 36,972 | ||||||||
| 190 | @ | WellPoint, Inc. | 21,850 | |||||||
| 80,687 | ||||||||||
| Home Builders: 0.0% | ||||||||||
| 40 | Centex Corp. | 2,383 | ||||||||
| 2,383 | ||||||||||
| Home Furnishings: 0.0% | ||||||||||
| 70 | Leggett & Platt, Inc. | 1,990 | ||||||||
| 30 | Whirlpool Corp. | 2,076 | ||||||||
| 4,066 | ||||||||||
| Household Products/ Wares: 0.0% | ||||||||||
| 40 | Avery Dennison Corp. | 2,399 | ||||||||
| 80 | Clorox Co. | 4,714 | ||||||||
| 50 | Fortune Brands, Inc. | 3,859 | ||||||||
| 10,972 | ||||||||||
| Housewares: 0.0% | ||||||||||
| 100 | Newell Rubbermaid, Inc. | 2,419 | ||||||||
| 2,419 | ||||||||||
| Insurance: 0.3% | ||||||||||
| 100 | @@ | ACE Ltd. | 4,275 | |||||||
| 190 | AFLAC, Inc. | 7,570 | ||||||||
| 260 | Allstate Corp. | 13,447 | ||||||||
| 40 | AMBAC Financial Group, Inc. | 3,285 | ||||||||
| 970 | American Intl. Group, Inc. | 63,699 | ||||||||
| 120 | AON Corp. | 2,863 | ||||||||
| 120 | Chubb Corp. | 9,228 | ||||||||
| 90 | CIGNA Corp. | 7,341 | ||||||||
| 66 | Cincinnati Financial Corp. | 2,921 | ||||||||
| 140 | Hartford Financial Services Group, Inc. | 9,703 | ||||||||
| 50 | Jefferson-Pilot Corp. | 2,598 | ||||||||
| 60 | Lincoln National Corp. | 2,801 | ||||||||
| 120 | Loews Corp. | 8,436 | ||||||||
| 80 | Marsh & McLennan Cos., Inc. | 2,632 | ||||||||
| 60 | MBIA, Inc. | 3,797 | ||||||||
| 280 | MetLife, Inc. | 11,343 | ||||||||
| 50 | MGIC Investment Corp. | 3,446 | ||||||||
| 120 | Principal Financial Group | 4,913 | ||||||||
| 80 | Progressive Corp. | 6,787 | ||||||||
| 330 | Prudential Financial, Inc. | 18,137 | ||||||||
| 70 | Safeco Corp. | 3,657 | ||||||||
| 100 | St. Paul Travelers Cos., Inc. | 3,707 | ||||||||
| 50 | Torchmark Corp. | 2,857 | ||||||||
| 120 | UnumProvident Corp. | 2,153 | ||||||||
| 50 | @@ | XL Capital Ltd. | 3,883 | |||||||
| 205,479 | ||||||||||
| Internet: 0.1% | ||||||||||
| 240 | @ | eBay, Inc. | 27,907 | |||||||
| 380 | @ | Symantec Corp. | 9,789 | |||||||
| 490 | @ | Yahoo!, Inc. | 18,463 | |||||||
| 56,159 | ||||||||||
| Iron/ Steel: 0.0% | ||||||||||
| 60 | Nucor Corp. | 3,140 | ||||||||
| 60 | United States Steel Corp. | 3,075 | ||||||||
| 6,215 | ||||||||||
| Leisure Time: 0.0% | ||||||||||
| 40 | Brunswick Corp. | 1,980 | ||||||||
| 230 | Carnival Corp. | 13,254 | ||||||||
| 110 | Harley-Davidson, Inc. | 6,683 | ||||||||
| 50 | Sabre Holdings Corp. | 1,108 | ||||||||
| 23,025 | ||||||||||
| Lodging: 0.0% | ||||||||||
| 40 | Harrah’s Entertainment, Inc. | 2,676 | ||||||||
| 140 | Hilton Hotels Corp. | 3,184 | ||||||||
| 110 | Marriott Intl., Inc. | 6,927 | ||||||||
| 70 | Starwood Hotels & Resorts Worldwide, Inc. | 4,088 | ||||||||
| 16,875 | ||||||||||
| Machinery — Construction and Mining: 0.0% | ||||||||||
| 50 | Caterpillar, Inc. | 4,876 | ||||||||
| 4,876 | ||||||||||
| Machinery — Diversified: 0.0% | ||||||||||
| 20 | Cummins, Inc. | 1,676 | ||||||||
| 100 | Deere & Co. | 7,439 | ||||||||
| 70 | Rockwell Automation, Inc. | 3,469 | ||||||||
| 12,584 | ||||||||||
| Media: 0.2% | ||||||||||
| 820 | @ | Comcast Corp. | 27,290 | |||||||
| 100 | Gannett Co., Inc. | 8,170 | ||||||||
| 20 | Knight-Ridder, Inc. | 1,339 | ||||||||
| 120 | McGraw-Hill Cos., Inc. | 10,985 | ||||||||
| 20 | Meredith Corp. | 1,084 | ||||||||
| 50 | New York Times Co. | 2,040 | ||||||||
| 980 | News Corp. | 18,287 | ||||||||
| 1,710 | @ | Time Warner, Inc. | 33,241 | |||||||
| 50 | Tribune Co. | 2,107 | ||||||||
| 640 | Viacom, Inc. | 23,290 | ||||||||
| 770 | Walt Disney Co. | 21,406 | ||||||||
| 149,239 | ||||||||||
| Mining: 0.0% | ||||||||||
| 50 | Phelps Dodge Corp. | 4,946 | ||||||||
| 4,946 | ||||||||||
| Miscellaneous Manufacturing: 0.3% | ||||||||||
| 290 | 3M Co. | 23,800 | ||||||||
| 30 | Cooper Industries Ltd. | 2,037 | ||||||||
| 120 | Danaher Corp. | 6,889 | ||||||||
| 30 | Dover Corp. | 1,258 | ||||||||
| 150 | Eastman Kodak Co. | 4,838 | ||||||||
| 60 | Eaton Corp. | 4,342 | ||||||||
| 3,950 | General Electric Co. | 144,174 | ||||||||
| 320 | Honeywell Intl., Inc. | 11,331 | ||||||||
| 120 | Illinois Tool Works, Inc. | 11,122 | ||||||||
| 60 | @@ | Ingersoll-Rand Co. | 4,818 | |||||||
| 40 | ITT Industries, Inc. | 3,378 | ||||||||
| 20 | Pall Corp. | 579 | ||||||||
93
| Shares | Value | |||||||||
| Miscellaneous Manufacturing (continued) | ||||||||||
| 60 | Textron, Inc. | $ | 4,428 | |||||||
| 750 | @@ | Tyco Intl., Ltd. | 26,805 | |||||||
| 249,799 | ||||||||||
| Office/ Business Equipment: 0.0% | ||||||||||
| 90 | Pitney Bowes, Inc. | 4,165 | ||||||||
| 480 | @ | Xerox Corp. | 8,165 | |||||||
| 12,330 | ||||||||||
| Oil and Gas: 0.5% | ||||||||||
| 50 | Amerada Hess Corp. | 4,119 | ||||||||
| 110 | Anadarko Petroleum Corp. | 7,129 | ||||||||
| 108 | Apache Corp. | 5,462 | ||||||||
| 220 | Burlington Resources, Inc. | 9,570 | ||||||||
| 1,010 | ChevronTexaco Corp. | 53,035 | ||||||||
| 414 | ConocoPhillips | 35,948 | ||||||||
| 280 | Devon Energy Corp. | 10,898 | ||||||||
| 40 | EOG Resources, Inc. | 2,854 | ||||||||
| 3,060 | Exxon Mobil Corp. | 156,855 | ||||||||
| 50 | Kerr-McGee Corp. | 2,890 | ||||||||
| 120 | Marathon Oil Corp. | 4,513 | ||||||||
| 40 | @,@@ | Nabors Industries, Ltd. | 2,052 | |||||||
| 50 | @ | Noble Corp. | 2,487 | |||||||
| 150 | Occidental Petroleum Corp. | 8,754 | ||||||||
| 40 | Sunoco, Inc. | 3,268 | ||||||||
| 100 | @ | Transocean, Inc. | 4,239 | |||||||
| 90 | Unocal Corp. | 3,892 | ||||||||
| 140 | Valero Energy Corp. | 6,356 | ||||||||
| 324,321 | ||||||||||
| Oil and Gas Services: 0.0% | ||||||||||
| 120 | Baker Hughes, Inc. | 5,120 | ||||||||
| 50 | BJ Services Co. | 2,327 | ||||||||
| 150 | Halliburton Co. | 5,886 | ||||||||
| 13,333 | ||||||||||
| Packaging and Containers: 0.0% | ||||||||||
| 40 | Ball Corp. | 1,759 | ||||||||
| 50 | Bemis Co. | 1,455 | ||||||||
| 70 | @ | Pactiv Corp. | 1,770 | |||||||
| 40 | @ | Sealed Air Corp. | 2,131 | |||||||
| 7,115 | ||||||||||
| �� | ||||||||||
| Pharmaceuticals: 0.3% | ||||||||||
| 570 | Abbott Laboratories | 26,591 | ||||||||
| 50 | Allergan, Inc. | 4,054 | ||||||||
| 40 | AmerisourceBergen Corp. | 2,347 | ||||||||
| 710 | Bristol-Myers Squibb Co. | 18,190 | ||||||||
| 210 | Cardinal Health, Inc. | 12,212 | ||||||||
| 290 | @ | Caremark Rx, Inc. | 11,435 | |||||||
| 170 | Eli Lilly & Co. | 9,648 | ||||||||
| 30 | @ | Express Scripts, Inc. | 2,293 | |||||||
| 140 | @ | Forest Laboratories, Inc. | 6,280 | |||||||
| 160 | @ | Gilead Sciences, Inc. | 5,598 | |||||||
| 50 | @ | Hospira, Inc. | 1,675 | |||||||
| 93 | @ | King Pharmaceuticals, Inc. | 1,153 | |||||||
| 100 | @ | Medco Health Solutions, Inc. | 4,160 | |||||||
| 830 | Merck & Co., Inc. | 26,676 | ||||||||
| 2,792 | Pfizer, Inc. | 75,077 | ||||||||
| 530 | Schering-Plough Corp. | 11,066 | ||||||||
| 490 | Wyeth | 20,869 | ||||||||
| 239,324 | ||||||||||
| Pipelines: 0.0% | ||||||||||
| 50 | @ | Dynegy, Inc. | 231 | |||||||
| 200 | El Paso Corp. | 2,080 | ||||||||
| 20 | Kinder Morgan, Inc. | 1,463 | ||||||||
| 170 | Williams Cos., Inc. | 2,769 | ||||||||
| 6,543 | ||||||||||
| Real Estate Investment Trusts: 0.0% | ||||||||||
| 60 | Equity Office Properties Trust | 1,747 | ||||||||
| 60 | ProLogis | 2,600 | ||||||||
| 80 | Simon Property Group, Inc. | 5,174 | ||||||||
| 9,521 | ||||||||||
| Retail: 0.5% | ||||||||||
| 110 | @ | Bed Bath & Beyond, Inc. | 4,381 | |||||||
| 120 | Best Buy Co., Inc. | 7,130 | ||||||||
| 100 | Circuit City Stores, Inc. | 1,564 | ||||||||
| 290 | Costco Wholesale Corp. | 14,039 | ||||||||
| 150 | CVS Corp. | 6,761 | ||||||||
| 60 | Darden Restaurants, Inc. | 1,664 | ||||||||
| 70 | Federated Department Stores, Inc. | 4,045 | ||||||||
| 440 | Gap, Inc. | 9,293 | ||||||||
| 1,380 | Home Depot, Inc. | 58,981 | ||||||||
| 180 | J.C. Penney Co., Inc. Holding Co. | 7,452 | ||||||||
| 50 | @ | Kohl’s Corp. | 2,459 | |||||||
| 240 | Limited Brands, Inc. | 5,525 | ||||||||
| 290 | Lowe’s Cos., Inc. | 16,701 | ||||||||
| 120 | May Department Stores Co. | 3,528 | ||||||||
| 800 | McDonald’s Corp. | 25,648 | ||||||||
| 50 | Nordstrom, Inc. | 2,337 | ||||||||
| 120 | @ | Office Depot, Inc. | 2,083 | |||||||
| 50 | RadioShack Corp. | 1,644 | ||||||||
| 320 | Staples, Inc. | 10,787 | ||||||||
| 200 | @ | Starbucks Corp. | 12,472 | |||||||
| 350 | Target Corp. | 18,176 | ||||||||
| 190 | TJX Cos., Inc. | 4,775 | ||||||||
| 140 | @ | Toys R US, Inc. | 2,866 | |||||||
| 1,570 | Wal-Mart Stores, Inc. | 82,927 | ||||||||
| 380 | Walgreen Co. | 14,581 | ||||||||
| 40 | Wendy’s Intl., Inc. | 1,570 | ||||||||
| 110 | Yum! Brands, Inc. | 5,190 | ||||||||
| 328,579 | ||||||||||
| Savings and Loans: 0.0% | ||||||||||
| 120 | Golden West Financial Corp. | 7,370 | ||||||||
| 50 | Sovereign Bancorp, Inc. | 1,128 | ||||||||
| 330 | Washington Mutual, Inc. | 13,952 | ||||||||
| 22,450 | ||||||||||
| Semiconductors: 0.1% | ||||||||||
| 60 | @ | Advanced Micro Devices, Inc. | 1,321 | |||||||
| 180 | @ | Altera Corp. | 3,726 | |||||||
| 140 | Analog Devices, Inc. | 5,169 | ||||||||
| 620 | @ | Applied Materials, Inc. | 10,602 | |||||||
| 130 | @ | Freescale Semiconductor Inc. | 2,387 | |||||||
| 2,400 | Intel Corp. | 56,135 | ||||||||
| 70 | @ | KLA-Tencor Corp. | 3,261 | |||||||
| 110 | Linear Technology Corp. | 4,264 | ||||||||
| 50 | Maxim Integrated Products, Inc. | 2,120 | ||||||||
| 140 | National Semiconductor Corp. | 2,513 | ||||||||
| 40 | @ | Qlogic Corp. | 1,469 | |||||||
| 260 | Texas Instruments, Inc. | 6,401 | ||||||||
| 99,368 | ||||||||||
| Software: 0.3% | ||||||||||
| 90 | Adobe Systems, Inc. | 5,647 | ||||||||
| 140 | Autodesk, Inc. | 5,313 | ||||||||
| 220 | Automatic Data Processing, Inc. | 9,757 | ||||||||
| 140 | @ | BMC Software, Inc. | 2,604 | |||||||
| 70 | @ | Citrix Systems, Inc. | 1,717 | |||||||
| 210 | Computer Associates Intl., Inc. | 6,523 | ||||||||
| 230 | @ | Compuware Corp. | 1,488 | |||||||
| 50 | @ | Electronic Arts, Inc. | 3,084 | |||||||
| 327 | First Data Corp. | 13,911 | ||||||||
| 80 | @ | Fiserv, Inc. | 3,215 | |||||||
| 80 | IMS Health, Inc. | 1,857 | ||||||||
| 70 | @ | Intuit, Inc. | 3,081 | |||||||
| 4,060 | Microsoft Corp. | 108,442 | ||||||||
94
| Shares | Value | |||||||||
| Software (continued) | ||||||||||
| 120 | @ | Novell, Inc. | $ | 810 | ||||||
| 3,290 | @ | Oracle Corp. | 45,138 | |||||||
| 120 | @ | Parametric Technology Corp. | 707 | |||||||
| 140 | @ | PeopleSoft, Inc. | 3,707 | |||||||
| 210 | @ | Siebel Systems, Inc. | 2,205 | |||||||
| 170 | @ | Veritas Software Corp. | 4,854 | |||||||
| 224,060 | ||||||||||
| Telecommunications: 0.3% | ||||||||||
| 170 | Alltel Corp. | 9,989 | ||||||||
| 116 | AT&T Corp. | 2,211 | ||||||||
| 170 | @ | Avaya, Inc. | 2,924 | |||||||
| 690 | BellSouth Corp. | 19,175 | ||||||||
| 50 | CenturyTel, Inc. | 1,774 | ||||||||
| 2,450 | @ | Cisco Systems, Inc. | 47,284 | |||||||
| 110 | Citizens Communications Co. | 1,517 | ||||||||
| 70 | @ | Comverse Technology, Inc. | 1,712 | |||||||
| 200 | @ | Corning, Inc. | 2,354 | |||||||
| 1,540 | @ | Lucent Technologies, Inc. | 5,790 | |||||||
| 870 | Motorola, Inc. | 14,964 | ||||||||
| 420 | @ | Nextel Communications, Inc. | 12,600 | |||||||
| 600 | QUALCOMM, Inc. | 25,440 | ||||||||
| 270 | @ | Qwest Communications Intl., Inc. | 1,199 | |||||||
| 1,250 | SBC Communications, Inc. | 32,213 | ||||||||
| 50 | Scientific-Atlanta, Inc. | 1,651 | ||||||||
| 540 | Sprint Corp. | 13,419 | ||||||||
| 250 | @ | Tellabs, Inc. | 2,148 | |||||||
| 1,380 | Verizon Communications, Inc. | 55,903 | ||||||||
| 254,267 | ||||||||||
| Textiles: 0.0% | ||||||||||
| 70 | Cintas Corp. | 3,070 | ||||||||
| 3,070 | ||||||||||
| Toys/ Games/ Hobbies: 0.0% | ||||||||||
| 90 | Hasbro, Inc. | 1,744 | ||||||||
| 150 | Mattel, Inc. | 2,924 | ||||||||
| 4,668 | ||||||||||
| Transportation: 0.1% | ||||||||||
| 180 | Burlington Northern Santa Fe Corp. | 8,516 | ||||||||
| 80 | CSX Corp. | 3,206 | ||||||||
| 190 | FedEx Corp. | 18,713 | ||||||||
| 190 | Norfolk Southern Corp. | 6,876 | ||||||||
| 40 | Ryder System, Inc. | 1,911 | ||||||||
| 420 | United Parcel Service, Inc. | 35,893 | ||||||||
| 75,115 | ||||||||||
| Total Common Stock (Cost $3,932,879) | 4,410,400 | |||||||||
| Principal | ||||||||||
| Amount | Value | |||||||||
| U.S. GOVERNMENT AGENCY OBLIGATIONS: 72.6% | ||||||||||
| Federal Home Loan Bank: 31.0% | ||||||||||
| $ | 25,000,000 | 3.230%, due 06/13/06 | $ | 23,866,425 | ||||||
| 23,866,425 | ||||||||||
| Federal Home Loan Mortgage Corporation: 10.4% | ||||||||||
| 2,538,000 | 3.030%, due 03/15/06 | 2,447,470 | ||||||||
| 5,800,000 | 3.170%, due 07/15/06 | 5,526,622 | ||||||||
| 7,974,092 | ||||||||||
| Federal National Mortgage Association: 18.7% | ||||||||||
| 15,000,000 | 3.170%, due 06/13/06 | 14,332,275 | ||||||||
| 14,332,275 | ||||||||||
| Other: 12.5% | ||||||||||
| 2,962,000 | FICO STRIP, 3.040%, due 04/06/06 | 2,851,189 | ||||||||
| 6,979,000 | Tennessee Valley Authority, 3.060%, due 01/15/06 | 6,760,752 | ||||||||
| 9,611,941 | ||||||||||
| Total U.S. Government Agency Obligations (Cost $54,593,866) | 55,784,733 | |||||||||
| U.S. TREASURY OBLIGATIONS: 11.9% | ||||||||||
| U.S. Treasury STRIP: 11.9% | ||||||||||
| 9,500,000 | 2.900%, due 05/15/06 | 9,134,678 | ||||||||
| Total U.S. Treasury Obligations (Cost $9,149,428) | 9,134,678 | |||||||||
| OTHER BONDS: 9.4% | ||||||||||
| Sovereign: 9.4% | ||||||||||
| 5,984,000 | Israel Trust, 3.280%, due 05/15/06 | 5,722,990 | ||||||||
| 1,560,000 | Turkey Trust, 3.280%, due 05/15/06 | 1,491,956 | ||||||||
| Total Other Bonds (Cost $7,123,994) | 7,214,946 | |||||||||
| Total Long-Term Investments (Cost $74,800,167) | 76,544,757 | |||||||||
| SHORT-TERM INVESTMENTS: 0.5% | ||||||||||
| Repurchase Agreement: 0.5% | ||||||||||
| 364,000 | Morgan Stanley Repurchase Agreement dated 12/31/04, 2.199% due 01/03/05, $364,067 to be received upon repurchase (Collateralized by $340,000 Federal Home Loan Bank, 5.750%, Market Value plus accrued interest $373,843, due 05/15/12). | 364,000 | ||||||||
| Total Short-Term Investments (Cost $364,000) | 364,000 | |||||||||
Total Investments In Securities (Cost $75,164,167)* | 100.1 | % | $ | 76,908,757 | ||||||||
Other Assets and Liabilities-Net | (0.1 | ) | (77,775 | ) | ||||||||
Net Assets | 100.0 | % | $ | 76,830,982 | ||||||||
| @ | Non-income producing security | |
| @@ | Foreign issuer | |
| STRIP | Separate Trading of Registered Interest and Principal of Securities | |
| * | Cost for federal income tax purposes is $75,444,914. Net unrealized depreciation consists of: |
| Gross Unrealized Appreciation | $ | 1,576,880 | ||
| Gross Unrealized Depreciation | (113,037 | ) | ||
| Net Unrealized Appreciation | $ | 1,463,843 | ||
95
| Shares | Value | |||||||||
| COMMON STOCK: 12.4% | ||||||||||
| Advertising: 0.0% | ||||||||||
| 170 | @ | Interpublic Group of Cos., Inc. | $ | 2,278 | ||||||
| 150 | Omnicom Group, Inc. | 12,648 | ||||||||
| 14,926 | ||||||||||
| Aerospace/ Defense: 0.3% | ||||||||||
| 1,240 | Boeing Co. | 64,194 | ||||||||
| 290 | General Dynamics Corp. | 30,334 | ||||||||
| 150 | Goodrich Corp. | 4,896 | ||||||||
| 90 | L-3 Communications Holdings, Inc. | 6,592 | ||||||||
| 510 | Lockheed Martin Corp. | 28,331 | ||||||||
| 310 | Northrop Grumman Corp. | 16,852 | ||||||||
| 670 | Raytheon Co. | 26,016 | ||||||||
| 200 | Rockwell Collins, Inc. | 7,888 | ||||||||
| 420 | United Technologies Corp. | 43,407 | ||||||||
| 228,510 | ||||||||||
| Agriculture: 0.2% | ||||||||||
| 1,780 | Altria Group, Inc. | 108,758 | ||||||||
| 540 | Archer-Daniels-Midland Co. | 12,047 | ||||||||
| 230 | Monsanto Co. | 12,777 | ||||||||
| 120 | Reynolds American, Inc. | 9,432 | ||||||||
| 200 | UST, Inc. | 9,622 | ||||||||
| 152,636 | ||||||||||
| Apparel: 0.1% | ||||||||||
| 250 | @ | Coach, Inc. | 14,100 | |||||||
| 100 | Jones Apparel Group, Inc. | 3,657 | ||||||||
| 120 | Liz Claiborne, Inc. | 5,065 | ||||||||
| 360 | Nike, Inc. | 32,649 | ||||||||
| 90 | Reebok Intl., Ltd. | 3,960 | ||||||||
| 140 | VF Corp. | 7,753 | ||||||||
| 67,184 | ||||||||||
| Auto Manufacturers: 0.1% | ||||||||||
| 2,520 | Ford Motor Co. | 36,893 | ||||||||
| 490 | General Motors Corp. | 19,629 | ||||||||
| 200 | PACCAR, Inc. | 16,096 | ||||||||
| 72,618 | ||||||||||
| Auto Parts and Equipment: 0.0% | ||||||||||
| 150 | Johnson Controls, Inc. | 9,516 | ||||||||
| 9,516 | ||||||||||
| Banks: 0.9% | ||||||||||
| 300 | AmSouth Bancorporation | 7,770 | ||||||||
| 3,428 | Bank of America Corp. | 161,083 | ||||||||
| 440 | BB&T Corp. | 18,502 | ||||||||
| 220 | Comerica, Inc. | 13,424 | ||||||||
| 100 | Compass Bancshares, Inc. | 4,867 | ||||||||
| 180 | Fifth Third Bancorp | 8,510 | ||||||||
| 100 | First Horizon National Corp. | 4,311 | ||||||||
| 190 | Huntington Bancshares, Inc. | 4,708 | ||||||||
| 450 | KeyCorp | 15,255 | ||||||||
| 90 | M & T Bank Corp. | 9,706 | ||||||||
| 180 | Marshall & Ilsley Corp. | 7,956 | ||||||||
| 330 | Mellon Financial Corp. | 10,266 | ||||||||
| 790 | National City Corp. | 29,665 | ||||||||
| 380 | North Fork Bancorporation, Inc. | 10,963 | ||||||||
| 190 | Northern Trust Corp. | 9,230 | ||||||||
| 90 | PNC Financial Services Group, Inc. | 5,170 | ||||||||
| 368 | Regions Financial Corp. | 13,097 | ||||||||
| 270 | State Street Corp. | 13,262 | ||||||||
| 290 | SunTrust Banks, Inc. | 21,425 | ||||||||
| 140 | Synovus Financial Corp. | 4,001 | ||||||||
| 650 | The Bank of New York Co., Inc. | 21,723 | ||||||||
| 1,620 | U.S. Bancorp | 50,738 | ||||||||
| 1,360 | Wachovia Corp. | 71,536 | ||||||||
| 1,460 | Wells Fargo & Co. | 90,739 | ||||||||
| 40 | Zions Bancorporation | 2,721 | ||||||||
| 610,628 | ||||||||||
| Beverages: 0.3% | ||||||||||
| 30 | Adolph Coors Co. | 2,270 | ||||||||
| 270 | Anheuser-Busch Cos., Inc. | 13,697 | ||||||||
| 120 | Brown-Forman Corp. | 5,842 | ||||||||
| 2,090 | Coca-Cola Co. | 87,007 | ||||||||
| 390 | Coca-Cola Enterprises, Inc. | 8,132 | ||||||||
| 210 | Pepsi Bottling Group, Inc. | 5,678 | ||||||||
| 1,930 | PepsiCo, Inc. | 100,745 | ||||||||
| 223,371 | ||||||||||
| Biotechnology: 0.1% | ||||||||||
| 1,092 | @ | Amgen, Inc. | 70,051 | |||||||
| 270 | @ | Biogen Idec, Inc. | 17,985 | |||||||
| 200 | @ | Genzyme Corp. | 11,614 | |||||||
| 90 | @ | MedImmune, Inc. | 2,440 | |||||||
| 102,090 | ||||||||||
| Building Materials: 0.0% | ||||||||||
| 160 | @ | American Standard Cos., Inc. | 6,611 | |||||||
| 360 | Masco Corp. | 13,151 | ||||||||
| 150 | Vulcan Materials Co. | 8,192 | ||||||||
| 27,954 | ||||||||||
| Chemicals: 0.2% | ||||||||||
| 200 | Air Products & Chemicals, Inc. | 11,594 | ||||||||
| 80 | Ashland, Inc. | 4,670 | ||||||||
| 870 | Dow Chemical Co. | 43,073 | ||||||||
| 870 | E.I. du Pont de Nemours & Co. | 42,674 | ||||||||
| 100 | Eastman Chemical Co. | 5,773 | ||||||||
| 120 | Ecolab, Inc. | 4,216 | ||||||||
| 100 | Engelhard Corp. | 3,067 | ||||||||
| 110 | International Flavors & Fragrances, Inc. | 4,712 | ||||||||
| 250 | PPG Industries, Inc. | 17,040 | ||||||||
| 280 | Praxair, Inc. | 12,362 | ||||||||
| 210 | Rohm & Haas Co. | 9,288 | ||||||||
| 190 | Sherwin-Williams Co. | 8,480 | ||||||||
| 60 | Sigma-Aldrich Corp. | 3,628 | ||||||||
| 170,577 | ||||||||||
| Commercial Services: 0.1% | ||||||||||
| 150 | @ | Apollo Group, Inc. | 12,107 | |||||||
| 840 | Cendant Corp. | 19,639 | ||||||||
| 100 | Equifax, Inc. | 2,810 | ||||||||
| 170 | H&R Block, Inc. | 8,330 | ||||||||
| 340 | McKesson Corp. | 10,696 | ||||||||
| 110 | Moody’s Corp. | 9,554 | ||||||||
| 300 | Paychex, Inc. | 10,224 | ||||||||
| 190 | R.R. Donnelley & Sons Co. | 6,705 | ||||||||
| 130 | Robert Half Intl., Inc. | 3,826 | ||||||||
| 83,891 | ||||||||||
| Computers: 0.7% | ||||||||||
| 110 | @ | Affiliated Computer Services, Inc. | 6,621 | |||||||
| 540 | @ | Apple Computer, Inc. | 34,776 | |||||||
| 160 | @ | Computer Sciences Corp. | 9,019 | |||||||
| 3,580 | @ | Dell, Inc. | 150,861 | |||||||
| 430 | Electronic Data Systems Corp. | 9,933 | ||||||||
| 1,910 | @ | EMC Corp. | 28,402 | |||||||
| 420 | @ | Gateway, Inc. | 2,524 | |||||||
| 2,626 | Hewlett-Packard Co. | 55,067 | ||||||||
| 1,900 | International Business Machines Corp. | 187,302 | ||||||||
| 110 | @ | Lexmark Intl., Inc. | 9,350 | |||||||
| 100 | @ | NCR Corp. | 6,923 | |||||||
| 280 | @ | Network Appliance, Inc. | 9,302 | |||||||
| 4,930 | @ | Sun Microsystems, Inc. | 26,523 | |||||||
96
| Shares | Value | |||||||||
| Computers (continued) | ||||||||||
| 230 | @ | Sungard Data Systems, Inc. | $ | 6,516 | ||||||
| 420 | @ | Unisys Corp. | 4,276 | |||||||
| 547,395 | ||||||||||
| Cosmetics/ Personal Care: 0.4% | ||||||||||
| 105 | Alberto-Culver Co. | 5,100 | ||||||||
| 160 | Avon Products, Inc. | 6,192 | ||||||||
| 420 | Colgate-Palmolive Co. | 21,487 | ||||||||
| 1,460 | Gillette Co. | 65,379 | ||||||||
| 410 | Kimberly-Clark Corp. | 26,982 | ||||||||
| 3,670 | Procter & Gamble Co. | 202,144 | ||||||||
| 327,284 | ||||||||||
| Distribution/ Wholesale: 0.0% | ||||||||||
| 180 | Genuine Parts Co. | 7,931 | ||||||||
| 120 | W.W. Grainger, Inc. | 7,994 | ||||||||
| 15,925 | ||||||||||
| Diversified Financial Services: 1.0% | ||||||||||
| 1,440 | American Express Co. | 81,172 | ||||||||
| 120 | Bear Stearns Cos., Inc. | 12,277 | ||||||||
| 350 | Capital One Financial Corp. | 29,474 | ||||||||
| 250 | CIT Group, Inc. | 11,455 | ||||||||
| 4,400 | Citigroup, Inc. | 211,991 | ||||||||
| 478 | Countrywide Financial Corp. | 17,691 | ||||||||
| 460 | @ | E*TRADE Financial Corp. | 6,877 | |||||||
| 840 | Fannie Mae | 59,815 | ||||||||
| 40 | Federated Investors, Inc. | 1,216 | ||||||||
| 210 | Franklin Resources, Inc. | 14,627 | ||||||||
| 550 | Freddie Mac | 40,535 | ||||||||
| 400 | Goldman Sachs Group, Inc. | 41,616 | ||||||||
| 70 | Janus Capital Group, Inc. | 1,177 | ||||||||
| 310 | Lehman Brothers Holdings, Inc. | 27,119 | ||||||||
| 1,040 | MBNA Corp. | 29,318 | ||||||||
| 750 | Merrill Lynch & Co., Inc. | 44,828 | ||||||||
| 930 | Morgan Stanley | 51,634 | ||||||||
| 230 | @ | Providian Financial Corp. | 3,788 | |||||||
| 350 | SLM Corp. | 18,687 | ||||||||
| 110 | T. Rowe Price Group, Inc. | 6,842 | ||||||||
| 712,139 | ||||||||||
| Electric: 0.3% | ||||||||||
| 720 | @ | AES Corp. | 9,842 | |||||||
| 100 | Ameren Corp. | 5,014 | ||||||||
| 320 | American Electric Power Co., Inc. | 10,989 | ||||||||
| 60 | Cinergy Corp. | 2,498 | ||||||||
| 200 | Consolidated Edison, Inc. | 8,750 | ||||||||
| 200 | Constellation Energy Group, Inc. | 8,742 | ||||||||
| 110 | Dominion Resources, Inc. | 7,451 | ||||||||
| 140 | DTE Energy Co. | 6,038 | ||||||||
| 1,360 | Duke Energy Corp. | 34,448 | ||||||||
| 370 | Edison Intl. | 11,851 | ||||||||
| 190 | Entergy Corp. | 12,842 | ||||||||
| 530 | Exelon Corp. | 23,356 | ||||||||
| 260 | FirstEnergy Corp. | 10,273 | ||||||||
| 150 | FPL Group, Inc. | 11,213 | ||||||||
| 320 | @ | PG&E Corp. | 10,650 | |||||||
| 100 | Pinnacle West Capital Corp. | 4,441 | ||||||||
| 210 | PPL Corp. | 11,189 | ||||||||
| 210 | Public Service Enterprise Group, Inc. | 10,872 | ||||||||
| 630 | Southern Co. | 21,118 | ||||||||
| 310 | TXU Corp. | 20,014 | ||||||||
| 340 | Xcel Energy, Inc. | 6,188 | ||||||||
| 247,779 | ||||||||||
| Electrical Components and Equipment: 0.0% | ||||||||||
| 480 | Emerson Electric Co. | 33,648 | ||||||||
| 33,648 | ||||||||||
| Electronics: 0.1% | ||||||||||
| 390 | @ | Agilent Technologies, Inc. | 9,399 | |||||||
| 180 | Applera Corp. — Applied Biosystems Group | 3,764 | ||||||||
| 140 | @ | Fisher Scientific Intl. | 8,733 | |||||||
| 170 | @ | Jabil Circuit, Inc. | 4,349 | |||||||
| 100 | Parker Hannifin Corp. | 7,574 | ||||||||
| 100 | PerkinElmer, Inc. | 2,249 | ||||||||
| 260 | @ | Sanmina-SCI Corp. | 2,202 | |||||||
| 310 | @ | Solectron Corp. | 1,652 | |||||||
| 120 | Tektronix, Inc. | 3,625 | ||||||||
| 190 | @ | Thermo Electron Corp. | 5,736 | |||||||
| 100 | @ | Waters Corp. | 4,679 | |||||||
| 53,962 | ||||||||||
| Engineering and Construction: 0.0% | ||||||||||
| 30 | Fluor Corp. | 1,635 | ||||||||
| 1,635 | ||||||||||
| Entertainment: 0.0% | ||||||||||
| 300 | International Game Technology | 10,314 | ||||||||
| 10,314 | ||||||||||
| Environmental Control: 0.0% | ||||||||||
| 470 | Waste Management, Inc. | 14,072 | ||||||||
| 14,072 | ||||||||||
| Food: 0.2% | ||||||||||
| 330 | Albertson’s, Inc. | 7,880 | ||||||||
| 350 | Campbell Soup Co. | 10,462 | ||||||||
| 420 | ConAgra Foods, Inc. | 12,369 | ||||||||
| 310 | General Mills, Inc. | 15,410 | ||||||||
| 280 | H.J. Heinz Co. | 10,917 | ||||||||
| 190 | Hershey Foods Corp. | 10,553 | ||||||||
| 330 | Kellogg Co. | 14,738 | ||||||||
| 340 | @ | Kroger Co. | 5,964 | |||||||
| 180 | McCormick & Co., Inc. | 6,948 | ||||||||
| 390 | @ | Safeway, Inc. | 7,699 | |||||||
| 630 | Sara Lee Corp. | 15,208 | ||||||||
| 190 | SUPERVALU, Inc. | 6,559 | ||||||||
| 320 | Wm. Wrigley Jr. Co. | 22,140 | ||||||||
| 146,847 | ||||||||||
| Forest Products and Paper: 0.1% | ||||||||||
| 220 | Georgia-Pacific Corp. | 8,246 | ||||||||
| 410 | International Paper Co. | 17,220 | ||||||||
| 140 | Louisiana-Pacific Corp. | 3,744 | ||||||||
| 240 | MeadWestvaco Corp. | 8,134 | ||||||||
| 200 | Plum Creek Timber Co., Inc. | 7,688 | ||||||||
| 60 | Temple-Inland, Inc. | 4,104 | ||||||||
| 300 | Weyerhaeuser Co. | 20,165 | ||||||||
| 69,301 | ||||||||||
| Gas: 0.0% | ||||||||||
| 130 | KeySpan Corp. | 5,129 | ||||||||
| 210 | Sempra Energy | 7,702 | ||||||||
| 12,831 | ||||||||||
| Hand/ Machine Tools: 0.0% | ||||||||||
| 110 | Black & Decker Corp. | 9,716 | ||||||||
| 80 | Snap-On, Inc. | 2,749 | ||||||||
| 110 | Stanley Works | 5,389 | ||||||||
| 17,854 | ||||||||||
| Healthcare — Products: 0.5% | ||||||||||
| 80 | Bausch & Lomb, Inc. | 5,157 | ||||||||
| 200 | Baxter Intl., Inc. | 6,908 | ||||||||
| 360 | Becton Dickinson & Co. | 20,448 | ||||||||
| 200 | Biomet, Inc. | 8,678 | ||||||||
| 730 | @ | Boston Scientific Corp. | 25,952 | |||||||
| 120 | C.R. Bard, Inc. | 7,678 | ||||||||
97
| Shares | Value | |||||||||
| Healthcare — Products (continued) | ||||||||||
| 110 | Guidant Corp. | $ | 7,931 | |||||||
| 4,250 | Johnson & Johnson | 269,534 | ||||||||
| 1,040 | Medtronic, Inc. | 51,657 | ||||||||
| 300 | @ | St. Jude Medical, Inc. | 12,579 | |||||||
| 180 | Stryker Corp. | 8,685 | ||||||||
| 220 | @ | Zimmer Holdings, Inc. | 17,626 | |||||||
| 442,833 | ||||||||||
| Healthcare — Services: 0.2% | ||||||||||
| 210 | Aetna, Inc. | 26,198 | ||||||||
| 230 | @ | Humana, Inc. | 6,829 | |||||||
| 120 | @ | Laboratory Corp. Of America Holdings | 5,978 | |||||||
| 120 | Manor Care, Inc. | 4,252 | ||||||||
| 90 | Quest Diagnostics, Inc. | 8,600 | ||||||||
| 940 | UnitedHealth Group, Inc. | 82,747 | ||||||||
| 440 | @ | WellPoint, Inc. | 50,600 | |||||||
| 185,204 | ||||||||||
| Home Builders: 0.0% | ||||||||||
| 40 | Centex Corp. | 2,383 | ||||||||
| 2,383 | ||||||||||
| Home Furnishings: 0.0% | ||||||||||
| 150 | Leggett & Platt, Inc. | 4,265 | ||||||||
| 70 | Whirlpool Corp. | 4,844 | ||||||||
| 9,109 | ||||||||||
| Household Products/ Wares: 0.0% | ||||||||||
| 140 | Avery Dennison Corp. | 8,396 | ||||||||
| 220 | Clorox Co. | 12,964 | ||||||||
| 120 | Fortune Brands, Inc. | 9,262 | ||||||||
| 30,622 | ||||||||||
| Housewares: 0.0% | ||||||||||
| 340 | Newell Rubbermaid, Inc. | 8,225 | ||||||||
| 8,225 | ||||||||||
| Insurance: 0.6% | ||||||||||
| 300 | @@ | ACE Ltd. | 12,825 | |||||||
| 420 | AFLAC, Inc. | 16,733 | ||||||||
| 580 | Allstate Corp. | 29,998 | ||||||||
| 90 | AMBAC Financial Group, Inc. | 7,392 | ||||||||
| 2,210 | American Intl. Group, Inc. | 145,131 | ||||||||
| 340 | AON Corp. | 8,112 | ||||||||
| 280 | Chubb Corp. | 21,532 | ||||||||
| 190 | CIGNA Corp. | 15,498 | ||||||||
| 129 | Cincinnati Financial Corp. | 5,710 | ||||||||
| 320 | Hartford Financial Services Group, Inc. | 22,179 | ||||||||
| 170 | Jefferson-Pilot Corp. | 8,833 | ||||||||
| 190 | Lincoln National Corp. | 8,869 | ||||||||
| 270 | Loews Corp. | 18,981 | ||||||||
| 180 | Marsh & McLennan Cos., Inc. | 5,922 | ||||||||
| 130 | MBIA, Inc. | 8,226 | ||||||||
| 630 | MetLife, Inc. | 25,521 | ||||||||
| 120 | MGIC Investment Corp. | 8,269 | ||||||||
| 270 | Principal Financial Group | 11,054 | ||||||||
| 170 | Progressive Corp. | 14,423 | ||||||||
| 710 | Prudential Financial, Inc. | 39,022 | ||||||||
| 160 | Safeco Corp. | 8,358 | ||||||||
| 230 | St. Paul Travelers Cos., Inc. | 8,526 | ||||||||
| 80 | Torchmark Corp. | 4,571 | ||||||||
| 380 | UnumProvident Corp. | 6,817 | ||||||||
| 110 | @@ | XL Capital Ltd. | 8,542 | |||||||
| 471,044 | ||||||||||
| Internet: 0.2% | ||||||||||
| 540 | @ | eBay, Inc. | 62,791 | |||||||
| 880 | @ | Symantec Corp. | 22,669 | |||||||
| 1,190 | @ | Yahoo!, Inc. | 44,839 | |||||||
| 130,299 | ||||||||||
| Iron/ Steel: 0.0% | ||||||||||
| 130 | Nucor Corp. | 6,804 | ||||||||
| 160 | United States Steel Corp. | 8,200 | ||||||||
| 15,004 | ||||||||||
| Leisure Time: 0.1% | ||||||||||
| 120 | Brunswick Corp. | 5,940 | ||||||||
| 520 | Carnival Corp. | 29,967 | ||||||||
| 260 | Harley-Davidson, Inc. | 15,795 | ||||||||
| 180 | Sabre Holdings Corp. | 3,989 | ||||||||
| 55,691 | ||||||||||
| Lodging: 0.0% | ||||||||||
| 90 | Harrah’s Entertainment, Inc. | 6,020 | ||||||||
| 300 | Hilton Hotels Corp. | 6,822 | ||||||||
| 260 | Marriott Intl., Inc. | 16,375 | ||||||||
| 160 | Starwood Hotels & Resorts Worldwide, Inc. | 9,344 | ||||||||
| 38,561 | ||||||||||
| Machinery — Construction and Mining: 0.0% | ||||||||||
| 110 | Caterpillar, Inc. | 10,726 | ||||||||
| 10,726 | ||||||||||
| Machinery — Diversified: 0.0% | ||||||||||
| 60 | Cummins, Inc. | 5,027 | ||||||||
| 220 | Deere & Co. | 16,368 | ||||||||
| 200 | Rockwell Automation, Inc. | 9,910 | ||||||||
| 31,305 | ||||||||||
| Media: 0.4% | ||||||||||
| 1,930 | @ | Comcast Corp. | 64,230 | |||||||
| 220 | Gannett Co., Inc. | 17,974 | ||||||||
| 30 | Knight-Ridder, Inc. | 2,008 | ||||||||
| 270 | McGraw-Hill Cos., Inc. | 24,716 | ||||||||
| 30 | Meredith Corp. | 1,626 | ||||||||
| 170 | New York Times Co. | 6,936 | ||||||||
| 2,230 | News Corp. | 41,612 | ||||||||
| 3,950 | @ | Time Warner, Inc. | 76,789 | |||||||
| 160 | Tribune Co. | 6,742 | ||||||||
| 1,470 | Viacom, Inc. | 53,493 | ||||||||
| 1,780 | Walt Disney Co. | 49,484 | ||||||||
| 345,610 | ||||||||||
| Mining: 0.0% | ||||||||||
| 120 | Phelps Dodge Corp. | 11,870 | ||||||||
| 11,870 | ||||||||||
| Miscellaneous Manufacturing: 0.7% | ||||||||||
| 680 | 3M Co. | 55,808 | ||||||||
| 100 | Cooper Industries Ltd. | 6,789 | ||||||||
| 250 | Danaher Corp. | 14,353 | ||||||||
| 70 | Dover Corp. | 2,936 | ||||||||
| 320 | Eastman Kodak Co. | 10,320 | ||||||||
| 120 | Eaton Corp. | 8,683 | ||||||||
| 9,000 | General Electric Co. | 328,499 | ||||||||
| 690 | Honeywell Intl., Inc. | 24,433 | ||||||||
| 260 | Illinois Tool Works, Inc. | 24,097 | ||||||||
| 140 | @@ | Ingersoll-Rand Co. | 11,242 | |||||||
| 100 | ITT Industries, Inc. | 8,445 | ||||||||
| 140 | Pall Corp. | 4,053 | ||||||||
| 120 | Textron, Inc. | 8,856 | ||||||||
| 1,730 | @@ | Tyco Intl., Ltd. | 61,830 | |||||||
| 570,344 | ||||||||||
98
| Shares | Value | |||||||||
| Office/ Business Equipment: 0.0% | ||||||||||
| 190 | Pitney Bowes, Inc. | $ | 8,793 | |||||||
| 1,080 | @ | Xerox Corp. | 18,371 | |||||||
| 27,164 | ||||||||||
| Oil and Gas: 1.0% | ||||||||||
| 90 | Amerada Hess Corp. | 7,414 | ||||||||
| 260 | Anadarko Petroleum Corp. | 16,851 | ||||||||
| 250 | Apache Corp. | 12,643 | ||||||||
| 510 | Burlington Resources, Inc. | 22,185 | ||||||||
| 2,290 | ChevronTexaco Corp. | 120,248 | ||||||||
| 941 | ConocoPhillips | 81,707 | ||||||||
| 660 | Devon Energy Corp. | 25,687 | ||||||||
| 90 | EOG Resources, Inc. | 6,422 | ||||||||
| 6,970 | Exxon Mobil Corp. | 357,282 | ||||||||
| 110 | Kerr-McGee Corp. | 6,357 | ||||||||
| 360 | Marathon Oil Corp. | 13,540 | ||||||||
| 70 | @,@@ | Nabors Industries, Ltd. | 3,590 | |||||||
| 100 | @ | Noble Corp. | 4,974 | |||||||
| 300 | Occidental Petroleum Corp. | 17,508 | ||||||||
| 90 | Sunoco, Inc. | 7,354 | ||||||||
| 240 | @ | Transocean, Inc. | 10,174 | |||||||
| 280 | Unocal Corp. | 12,107 | ||||||||
| 310 | Valero Energy Corp. | 14,074 | ||||||||
| 740,117 | ||||||||||
| Oil and Gas Services: 0.0% | ||||||||||
| 250 | Baker Hughes, Inc. | 10,668 | ||||||||
| 120 | BJ Services Co. | 5,585 | ||||||||
| 340 | Halliburton Co. | 13,341 | ||||||||
| 29,594 | ||||||||||
| Packaging and Containers: 0.0% | ||||||||||
| 100 | Ball Corp. | 4,398 | ||||||||
| 180 | Bemis Co. | 5,236 | ||||||||
| 120 | @ | Pactiv Corp. | 3,035 | |||||||
| 80 | @ | Sealed Air Corp. | 4,262 | |||||||
| 16,931 | ||||||||||
| Pharmaceuticals: 0.7% | ||||||||||
| 1,340 | Abbott Laboratories | 62,511 | ||||||||
| 140 | Allergan, Inc. | 11,350 | ||||||||
| 120 | AmerisourceBergen Corp. | 7,042 | ||||||||
| 1,570 | Bristol-Myers Squibb Co. | 40,223 | ||||||||
| 490 | Cardinal Health, Inc. | 28,494 | ||||||||
| 640 | @ | Caremark Rx, Inc. | 25,235 | |||||||
| 390 | Eli Lilly & Co. | 22,133 | ||||||||
| 100 | @ | Express Scripts, Inc. | 7,644 | |||||||
| 320 | @ | Forest Laboratories, Inc. | 14,355 | |||||||
| 350 | @ | Gilead Sciences, Inc. | 12,247 | |||||||
| 180 | @ | Hospira, Inc. | 6,030 | |||||||
| 80 | @ | King Pharmaceuticals, Inc. | 992 | |||||||
| 240 | @ | Medco Health Solutions, Inc. | 9,984 | |||||||
| 1,930 | Merck & Co., Inc. | 62,030 | ||||||||
| 6,340 | Pfizer, Inc. | 170,482 | ||||||||
| 1,190 | Schering-Plough Corp. | 24,847 | ||||||||
| 1,070 | Wyeth | 45,571 | ||||||||
| 551,170 | ||||||||||
| Pipelines: 0.0% | ||||||||||
| 640 | El Paso Corp. | 6,656 | ||||||||
| 40 | Kinder Morgan, Inc. | 2,925 | ||||||||
| 420 | Williams Cos., Inc. | 6,842 | ||||||||
| 16,423 | ||||||||||
| Real Estate Investment Trusts: 0.0% | ||||||||||
| 200 | Equity Office Properties Trust | 5,824 | ||||||||
| 200 | ProLogis | 8,666 | ||||||||
| 180 | Simon Property Group, Inc. | 11,641 | ||||||||
| 26,131 | ||||||||||
| Retail: 1.0% | ||||||||||
| 230 | @ | Bed Bath & Beyond, Inc. | 9,161 | |||||||
| 270 | Best Buy Co., Inc. | 16,043 | ||||||||
| 280 | Circuit City Stores, Inc. | 4,379 | ||||||||
| 640 | Costco Wholesale Corp. | 30,982 | ||||||||
| 330 | CVS Corp. | 14,873 | ||||||||
| 200 | Darden Restaurants, Inc. | 5,548 | ||||||||
| 140 | Federated Department Stores, Inc. | 8,091 | ||||||||
| 1,010 | Gap, Inc. | 21,331 | ||||||||
| 3,150 | Home Depot, Inc. | 134,632 | ||||||||
| 410 | J.C. Penney Co., Inc. Holding Co. | 16,974 | ||||||||
| 110 | @ | Kohl’s Corp. | 5,409 | |||||||
| 520 | Limited Brands, Inc. | 11,970 | ||||||||
| 680 | Lowe’s Cos., Inc. | 39,161 | ||||||||
| 230 | May Department Stores Co. | 6,762 | ||||||||
| 1,820 | McDonald’s Corp. | 58,349 | ||||||||
| 100 | Nordstrom, Inc. | 4,673 | ||||||||
| 370 | @ | Office Depot, Inc. | 6,423 | |||||||
| 120 | RadioShack Corp. | 3,946 | ||||||||
| 730 | Staples, Inc. | 24,608 | ||||||||
| 450 | @ | Starbucks Corp. | 28,062 | |||||||
| 730 | Target Corp. | 37,909 | ||||||||
| 400 | TJX Cos., Inc. | 10,052 | ||||||||
| 320 | @ | Toys R US, Inc. | 6,550 | |||||||
| 3,610 | Wal-Mart Stores, Inc. | 190,681 | ||||||||
| 860 | Walgreen Co. | 32,998 | ||||||||
| 100 | Wendy’s Intl., Inc. | 3,926 | ||||||||
| 230 | Yum! Brands, Inc. | 10,851 | ||||||||
| 744,344 | ||||||||||
| Savings and Loans: 0.1% | ||||||||||
| 240 | Golden West Financial Corp. | 14,741 | ||||||||
| 120 | Sovereign Bancorp, Inc. | 2,706 | ||||||||
| 700 | Washington Mutual, Inc. | 29,596 | ||||||||
| 47,043 | ||||||||||
| Semiconductors: 0.3% | ||||||||||
| 290 | @ | Altera Corp. | 6,003 | |||||||
| 330 | Analog Devices, Inc. | 12,184 | ||||||||
| 1,390 | @ | Applied Materials, Inc. | 23,769 | |||||||
| 301 | @ | Freescale Semiconductor Inc. | 5,526 | |||||||
| 5,410 | Intel Corp. | 126,539 | ||||||||
| 160 | @ | KLA-Tencor Corp. | 7,453 | |||||||
| 250 | Linear Technology Corp. | 9,690 | ||||||||
| 120 | Maxim Integrated Products, Inc. | 5,087 | ||||||||
| 330 | National Semiconductor Corp. | 5,924 | ||||||||
| 580 | Texas Instruments, Inc. | 14,280 | ||||||||
| 216,455 | ||||||||||
| Software: 0.6% | ||||||||||
| 190 | Adobe Systems, Inc. | 11,921 | ||||||||
| 280 | Autodesk, Inc. | 10,626 | ||||||||
| 470 | Automatic Data Processing, Inc. | 20,845 | ||||||||
| 320 | @ | BMC Software, Inc. | 5,952 | |||||||
| 120 | @ | Citrix Systems, Inc. | 2,944 | |||||||
| 460 | Computer Associates Intl., Inc. | 14,288 | ||||||||
| 600 | @ | Compuware Corp. | 3,882 | |||||||
| 110 | @ | Electronic Arts, Inc. | 6,785 | |||||||
| 753 | First Data Corp. | 32,032 | ||||||||
| 170 | @ | Fiserv, Inc. | 6,832 | |||||||
| 250 | IMS Health, Inc. | 5,803 | ||||||||
| 150 | @ | Intuit, Inc. | 6,602 | |||||||
| 9,240 | Microsoft Corp. | 246,799 | ||||||||
| 460 | @ | Novell, Inc. | 3,105 | |||||||
| 7,390 | @ | Oracle Corp. | 101,390 | |||||||
| 340 | @ | PeopleSoft, Inc. | 9,003 | |||||||
| 370 | @ | Siebel Systems, Inc. | 3,885 | |||||||
| 360 | @ | Veritas Software Corp. | 10,278 | |||||||
| 502,972 | ||||||||||
99
| Shares | Value | |||||||||
| Telecommunications: 0.7% | ||||||||||
| 350 | Alltel Corp. | $ | 20,566 | |||||||
| 270 | AT&T Corp. | 5,146 | ||||||||
| 470 | @ | Avaya, Inc. | 8,084 | |||||||
| 1,600 | BellSouth Corp. | 44,464 | ||||||||
| 170 | CenturyTel, Inc. | 6,030 | ||||||||
| 5,660 | @ | Cisco Systems, Inc. | 109,238 | |||||||
| 300 | Citizens Communications Co. | 4,137 | ||||||||
| 170 | @ | Comverse Technology, Inc. | 4,157 | |||||||
| 460 | @ | Corning, Inc. | 5,414 | |||||||
| 3,590 | @ | Lucent Technologies, Inc. | 13,498 | |||||||
| 1,990 | Motorola, Inc. | 34,228 | ||||||||
| 970 | @ | Nextel Communications, Inc. | 29,100 | |||||||
| 1,420 | QUALCOMM, Inc. | 60,208 | ||||||||
| 620 | @ | Qwest Communications Intl., Inc. | 2,753 | |||||||
| 2,890 | SBC Communications, Inc. | 74,475 | ||||||||
| 120 | Scientific-Atlanta, Inc. | 3,961 | ||||||||
| 1,240 | Sprint Corp. | 30,814 | ||||||||
| 460 | @ | Tellabs, Inc. | 3,951 | |||||||
| 3,140 | Verizon Communications, Inc. | 127,202 | ||||||||
| 587,426 | ||||||||||
| Textiles: 0.0% | ||||||||||
| 180 | Cintas Corp. | 7,895 | ||||||||
| 7,895 | ||||||||||
| Toys/ Games/ Hobbies: 0.0% | ||||||||||
| 150 | Hasbro, Inc. | 2,907 | ||||||||
| 500 | Mattel, Inc. | 9,745 | ||||||||
| 12,652 | ||||||||||
| Transportation: 0.2% | ||||||||||
| 410 | Burlington Northern Santa Fe Corp. | 19,397 | ||||||||
| 170 | CSX Corp. | 6,814 | ||||||||
| 420 | FedEx Corp. | 41,366 | ||||||||
| 440 | Norfolk Southern Corp. | 15,924 | ||||||||
| 60 | Ryder System, Inc. | 2,866 | ||||||||
| 970 | United Parcel Service, Inc. | 82,896 | ||||||||
| 169,263 | ||||||||||
| Total Common Stock (Cost $8,922,781) | 10,029,297 | |||||||||
| Principal | ||||||||||
| Amount | Value | |||||||||
| CORPORATE BONDS/ NOTES: 5.1% | ||||||||||
| Diversified Financial Services: 5.1% | ||||||||||
| $ | 4,000,000 | @ | General Electric Capital Corp., 5.000%, due 06/15/07 | $ | 4,137,236 | |||||
| Total Corporate Bonds/Notes (Cost $4,110,900) | 4,137,236 | |||||||||
| U.S. GOVERNMENT AGENCY OBLIGATIONS: 76.0% | ||||||||||
| Federal Home Loan Bank: 35.0% | ||||||||||
| 30,000,000 | @ | 3.320%, due 09/15/06 | 28,369,110 | |||||||
| 28,369,110 | ||||||||||
| Federal Home Loan Mortgage Corporation: 17.6% | ||||||||||
| 3,750,000 | 3.350%, due 01/15/07 | 3,506,610 | ||||||||
| 6,250,000 | 3.170%, due 07/15/06 | 5,955,413 | ||||||||
| 5,000,000 | 3.170%, due 07/15/06 | 4,764,330 | ||||||||
| 14,226,353 | ||||||||||
| Federal National Mortgage Association: 23.4% | ||||||||||
| 20,000,000 | 3.260%, due 09/15/06 | 18,930,420 | ||||||||
| 18,930,420 | ||||||||||
| Total U.S. Government Agency Obligations (Cost $60,637,524) | 61,525,883 | |||||||||
| U.S. TREASURY OBLIGATIONS: 6.0% | ||||||||||
| Other: 6.0% | ||||||||||
| 5,070,000 | United States Treasury STRIP Coupon, 2.940%, due 08/15/06 | 4,837,104 | ||||||||
| Total U.S. Treasury Obligations (Cost $4,866,085) | 4,837,104 | |||||||||
| Total Long-Term Investments (Cost $78,537,290) | 80,529,520 | |||||||||
| SHORT-TERM INVESTMENTS: 0.6% | ||||||||||
| Repurchase Agreement: 0.6% | ||||||||||
| 521,000 | Morgan Stanley Repurchase Agreement dated 12/31/04, 2.200% due 01/03/05, $521,096 to be received upon repurchase (Collateralized by $485,000 Federal Home Loan Bank, 5.750%, Market Value plus accrued interest $533,276, due 05/15/12) | 521,000 | ||||||||
| Total Short-Term Investments (Cost $521,000) | 521,000 | |||||||||
Total Investments In Securities (Cost $79,058,290)* | 100.1 | % | $ | 81,050,520 | ||||||||
Other Assets and Liabilities-Net | (0.1 | ) | (61,819 | ) | ||||||||
Net Assets | 100.0 | % | $ | 80,988,701 | ||||||||
| @ | Non-income producing security | |
| @@ | Foreign issuer | |
| STRIP | Separate Trading of Registered Interest and Principal of Securities | |
| * | Cost for federal income tax purposes is $79,318,640. Net unrealized depreciation consists of: |
| Gross Unrealized Appreciation | $ | 1,955,366 | ||
| Gross Unrealized Depreciation | (223,486 | ) | ||
| Net Unrealized Appreciation | $ | 1,731,880 | ||
100
| Shares | Value | |||||||||
| COMMON STOCK: 10.9% | ||||||||||
| Advertising: 0.0% | ||||||||||
| 190 | @ | Interpublic Group of Cos., Inc. | $ | 2,546 | ||||||
| 230 | Omnicom Group, Inc. | 19,394 | ||||||||
| 21,940 | ||||||||||
| Aerospace/Defense: 0.2% | ||||||||||
| 1,790 | Boeing Co. | 92,667 | ||||||||
| 420 | General Dynamics Corp. | 43,932 | ||||||||
| 200 | Goodrich Corp. | 6,528 | ||||||||
| 120 | L-3 Communications Holdings, Inc. | 8,789 | ||||||||
| 730 | Lockheed Martin Corp. | 40,552 | ||||||||
| 480 | Northrop Grumman Corp. | 26,093 | ||||||||
| 970 | Raytheon Co. | 37,665 | ||||||||
| 210 | Rockwell Collins, Inc. | 8,282 | ||||||||
| 630 | United Technologies Corp. | 65,111 | ||||||||
| 329,619 | ||||||||||
| Agriculture: 0.2% | ||||||||||
| 2,510 | Altria Group, Inc. | 153,360 | ||||||||
| 790 | Archer-Daniels-Midland Co. | 17,625 | ||||||||
| 350 | Monsanto Co. | 19,443 | ||||||||
| 160 | Reynolds American, Inc. | 12,576 | ||||||||
| 380 | UST, Inc. | 18,282 | ||||||||
| 221,286 | ||||||||||
| Apparel: 0.1% | ||||||||||
| 320 | @ | Coach, Inc. | 18,048 | |||||||
| 260 | Jones Apparel Group, Inc. | 9,508 | ||||||||
| 210 | Liz Claiborne, Inc. | 8,864 | ||||||||
| 540 | Nike, Inc. | 48,973 | ||||||||
| 100 | Reebok Intl., Ltd. | 4,400 | ||||||||
| 200 | VF Corp. | 11,076 | ||||||||
| 100,869 | ||||||||||
| Auto Manufacturers: 0.1% | ||||||||||
| 3,740 | Ford Motor Co. | 54,753 | ||||||||
| 700 | General Motors Corp. | 28,042 | ||||||||
| 287 | PACCAR, Inc. | 23,098 | ||||||||
| 105,893 | ||||||||||
| Auto Parts and Equipment: 0.0% | ||||||||||
| 240 | Johnson Controls, Inc. | 15,226 | ||||||||
| 15,226 | ||||||||||
| Banks: 0.7% | ||||||||||
| 420 | AmSouth Bancorporation | 10,878 | ||||||||
| 4,994 | Bank of America Corp. | 234,668 | ||||||||
| 700 | BB&T Corp. | 29,435 | ||||||||
| 300 | Comerica, Inc. | 18,306 | ||||||||
| 140 | Compass Bancshares, Inc. | 6,814 | ||||||||
| 280 | Fifth Third Bancorp | 13,238 | ||||||||
| 190 | First Horizon National Corp. | 8,191 | ||||||||
| 410 | Huntington Bancshares, Inc. | 10,160 | ||||||||
| 690 | KeyCorp | 23,391 | ||||||||
| 140 | M & T Bank Corp. | 15,098 | ||||||||
| 280 | Marshall & Ilsley Corp. | 12,376 | ||||||||
| 520 | Mellon Financial Corp. | 16,177 | ||||||||
| 1,140 | National City Corp. | 42,807 | ||||||||
| 560 | North Fork Bancorporation, Inc. | 16,156 | ||||||||
| 280 | Northern Trust Corp. | 13,602 | ||||||||
| 130 | PNC Financial Services Group, Inc. | 7,467 | ||||||||
| 585 | Regions Financial Corp. | 20,820 | ||||||||
| 390 | State Street Corp. | 19,157 | ||||||||
| 440 | SunTrust Banks, Inc. | 32,507 | ||||||||
| 150 | Synovus Financial Corp. | 4,287 | ||||||||
| 940 | The Bank of New York Co., Inc. | 31,415 | ||||||||
| 2,290 | U.S. Bancorp | 71,723 | ||||||||
| 1,958 | Wachovia Corp. | 102,991 | ||||||||
| 2,050 | Wells Fargo & Co. | 127,408 | ||||||||
| 110 | Zions Bancorporation | 7,483 | ||||||||
| 896,555 | ||||||||||
| Beverages: 0.2% | ||||||||||
| 60 | Adolph Coors Co. | 4,540 | ||||||||
| 400 | Anheuser-Busch Cos., Inc. | 20,292 | ||||||||
| 160 | Brown-Forman Corp. | 7,789 | ||||||||
| 3,060 | Coca-Cola Co. | 127,388 | ||||||||
| 550 | Coca-Cola Enterprises, Inc. | 11,468 | ||||||||
| 280 | Pepsi Bottling Group, Inc. | 7,571 | ||||||||
| 2,800 | PepsiCo, Inc. | 146,160 | ||||||||
| 325,208 | ||||||||||
| Biotechnology: 0.1% | ||||||||||
| 1,584 | @ | Amgen, Inc. | 101,613 | |||||||
| 410 | @ | Biogen Idec, Inc. | 27,310 | |||||||
| 280 | @ | Genzyme Corp. | 16,260 | |||||||
| 280 | @ | MedImmune, Inc. | 7,591 | |||||||
| 80 | @ | Millipore Corp. | 3,985 | |||||||
| 156,759 | ||||||||||
| Building Materials: 0.0% | ||||||||||
| 280 | @ | American Standard Cos., Inc. | 11,570 | |||||||
| 510 | Masco Corp. | 18,630 | ||||||||
| 120 | Vulcan Materials Co. | 6,553 | ||||||||
| 36,753 | ||||||||||
| Chemicals: 0.2% | ||||||||||
| 280 | Air Products & Chemicals, Inc. | 16,232 | ||||||||
| 140 | Ashland, Inc. | 8,173 | ||||||||
| 1,160 | Dow Chemical Co. | 57,432 | ||||||||
| 1,260 | E.I. du Pont de Nemours & Co. | 61,802 | ||||||||
| 150 | Eastman Chemical Co. | 8,660 | ||||||||
| 130 | Ecolab, Inc. | 4,567 | ||||||||
| 190 | Engelhard Corp. | 5,827 | ||||||||
| 110 | International Flavors & Fragrances, Inc. | 4,712 | ||||||||
| 390 | PPG Industries, Inc. | 26,582 | ||||||||
| 420 | Praxair, Inc. | 18,543 | ||||||||
| 290 | Rohm & Haas Co. | 12,827 | ||||||||
| 320 | Sherwin-Williams Co. | 14,282 | ||||||||
| 100 | Sigma-Aldrich Corp. | 6,046 | ||||||||
| 245,685 | ||||||||||
| Commercial Services: 0.1% | ||||||||||
| 230 | @ | Apollo Group, Inc. | 18,563 | |||||||
| 1,320 | Cendant Corp. | 30,861 | ||||||||
| 210 | Equifax, Inc. | 5,901 | ||||||||
| 270 | H&R Block, Inc. | 13,230 | ||||||||
| 360 | McKesson Corp. | 11,326 | ||||||||
| 170 | Moody’s Corp. | 14,765 | ||||||||
| 440 | Paychex, Inc. | 14,995 | ||||||||
| 250 | R.R. Donnelley & Sons Co. | 8,823 | ||||||||
| 230 | Robert Half Intl., Inc. | 6,769 | ||||||||
| 125,233 | ||||||||||
| Computers: 0.6% | ||||||||||
| 160 | @ | Affiliated Computer Services, Inc. | 9,630 | |||||||
| 790 | @ | Apple Computer, Inc. | 50,876 | |||||||
| 240 | @ | Computer Sciences Corp. | 13,529 | |||||||
| 5,180 | @ | Dell, Inc. | 218,285 | |||||||
| 640 | Electronic Data Systems Corp. | 14,784 | ||||||||
| 2,990 | @ | EMC Corp. | 44,461 | |||||||
| 320 | @ | Gateway, Inc. | 1,923 | |||||||
| 3,729 | Hewlett-Packard Co. | 78,197 | ||||||||
| 2,770 | International Business Machines Corp. | 273,068 | ||||||||
| 160 | @ | Lexmark Intl., Inc. | 13,600 | |||||||
| 110 | @ | NCR Corp. | 7,615 | |||||||
101
| Shares | Value | |||||||||
| Computers (continued) | ||||||||||
| 410 | @ | Network Appliance, Inc. | $ | 13,620 | ||||||
| 7,080 | @ | Sun Microsystems, Inc. | 38,090 | |||||||
| 370 | @ | Sungard Data Systems, Inc. | 10,482 | |||||||
| 460 | @ | Unisys Corp. | 4,683 | |||||||
| 792,843 | ||||||||||
| Cosmetics/Personal Care: 0.4% | ||||||||||
| 135 | Alberto-Culver Co. | 6,557 | ||||||||
| 240 | Avon Products, Inc. | 9,288 | ||||||||
| 650 | Colgate-Palmolive Co. | 33,254 | ||||||||
| 2,100 | Gillette Co. | 94,038 | ||||||||
| 590 | Kimberly-Clark Corp. | 38,828 | ||||||||
| 5,320 | Procter & Gamble Co. | 293,025 | ||||||||
| 474,990 | ||||||||||
| Distribution/Wholesale: 0.0% | ||||||||||
| 380 | Genuine Parts Co. | 16,743 | ||||||||
| 150 | W.W. Grainger, Inc. | 9,993 | ||||||||
| 26,736 | ||||||||||
| Diversified Financial Services: 0.8% | ||||||||||
| 2,080 | American Express Co. | 117,249 | ||||||||
| 180 | Bear Stearns Cos., Inc. | 18,416 | ||||||||
| 520 | Capital One Financial Corp. | 43,789 | ||||||||
| 360 | CIT Group, Inc. | 16,495 | ||||||||
| 6,400 | Citigroup, Inc. | 308,351 | ||||||||
| 678 | Countrywide Financial Corp. | 25,093 | ||||||||
| 750 | @ | E*TRADE Financial Corp. | 11,213 | |||||||
| 1,190 | Fannie Mae | 84,740 | ||||||||
| 50 | Federated Investors, Inc. | 1,520 | ||||||||
| 310 | Franklin Resources, Inc. | 21,592 | ||||||||
| 840 | Freddie Mac | 61,908 | ||||||||
| 600 | Goldman Sachs Group, Inc. | 62,424 | ||||||||
| 120 | Janus Capital Group, Inc. | 2,017 | ||||||||
| 440 | Lehman Brothers Holdings, Inc. | 38,491 | ||||||||
| 1,585 | MBNA Corp. | 44,681 | ||||||||
| 1,170 | Merrill Lynch & Co., Inc. | 69,931 | ||||||||
| 1,340 | Morgan Stanley | 74,397 | ||||||||
| 430 | @ | Providian Financial Corp. | 7,082 | |||||||
| 550 | SLM Corp. | 29,365 | ||||||||
| 160 | T. Rowe Price Group, Inc. | 9,952 | ||||||||
| 1,048,706 | ||||||||||
| Electric: 0.3% | ||||||||||
| 770 | @ | AES Corp. | 10,526 | |||||||
| 90 | Ameren Corp. | 4,513 | ||||||||
| 520 | American Electric Power Co., Inc. | 17,857 | ||||||||
| 200 | Cinergy Corp. | 8,326 | ||||||||
| 320 | Consolidated Edison, Inc. | 14,000 | ||||||||
| 200 | Constellation Energy Group, Inc. | 8,742 | ||||||||
| 160 | Dominion Resources, Inc. | 10,838 | ||||||||
| 220 | DTE Energy Co. | 9,489 | ||||||||
| 1,960 | Duke Energy Corp. | 49,646 | ||||||||
| 420 | Edison Intl. | 13,453 | ||||||||
| 280 | Entergy Corp. | 18,925 | ||||||||
| 800 | Exelon Corp. | 35,256 | ||||||||
| 400 | FirstEnergy Corp. | 15,804 | ||||||||
| 230 | FPL Group, Inc. | 17,193 | ||||||||
| 510 | @ | PG&E Corp. | 16,973 | |||||||
| 40 | Pinnacle West Capital Corp. | 1,776 | ||||||||
| 380 | PPL Corp. | 20,246 | ||||||||
| 300 | Public Service Enterprise Group, Inc. | 15,531 | ||||||||
| 910 | Southern Co. | 30,503 | ||||||||
| 500 | TXU Corp. | 32,280 | ||||||||
| 450 | Xcel Energy, Inc. | 8,190 | ||||||||
| 360,067 | ||||||||||
| Electrical Components and Equipment: 0.0% | ||||||||||
| 700 | Emerson Electric Co. | 49,070 | ||||||||
| 49,070 | ||||||||||
| Electronics: 0.1% | ||||||||||
| 580 | @ | Agilent Technologies, Inc. | 13,978 | |||||||
| 210 | Applera Corp. — Applied Biosystems Group | 4,391 | ||||||||
| 160 | @ | Fisher Scientific Intl. | 9,981 | |||||||
| 240 | @ | Jabil Circuit, Inc. | 6,139 | |||||||
| 140 | Parker Hannifin Corp. | 10,604 | ||||||||
| 140 | PerkinElmer, Inc. | 3,149 | ||||||||
| 270 | @ | Sanmina-SCI Corp. | 2,287 | |||||||
| 480 | @ | Solectron Corp. | 2,558 | |||||||
| 130 | Tektronix, Inc. | 3,927 | ||||||||
| 300 | @ | Thermo Electron Corp. | 9,057 | |||||||
| 130 | @ | Waters Corp. | 6,083 | |||||||
| 72,154 | ||||||||||
| Engineering and Construction: 0.0% | ||||||||||
| 120 | Fluor Corp. | 6,541 | ||||||||
| 6,541 | ||||||||||
| Entertainment: 0.0% | ||||||||||
| 420 | International Game Technology | 14,440 | ||||||||
| 14,440 | ||||||||||
| Environmental Control: 0.0% | ||||||||||
| 720 | Waste Management, Inc. | 21,557 | ||||||||
| 21,557 | ||||||||||
| Food: 0.2% | ||||||||||
| 480 | Albertson’s, Inc. | 11,462 | ||||||||
| 500 | Campbell Soup Co. | 14,945 | ||||||||
| 670 | ConAgra Foods, Inc. | 19,732 | ||||||||
| 460 | General Mills, Inc. | 22,867 | ||||||||
| 440 | H.J. Heinz Co. | 17,156 | ||||||||
| 300 | Hershey Foods Corp. | 16,662 | ||||||||
| 500 | Kellogg Co. | 22,330 | ||||||||
| 360 | @ | Kroger Co. | 6,314 | |||||||
| 160 | McCormick & Co., Inc. | 6,176 | ||||||||
| 580 | @ | Safeway, Inc. | 11,449 | |||||||
| 990 | Sara Lee Corp. | 23,899 | ||||||||
| 190 | SUPERVALU, Inc. | 6,559 | ||||||||
| 470 | Wm. Wrigley Jr. Co. | 32,518 | ||||||||
| 212,069 | ||||||||||
| Forest Products and Paper: 0.1% | ||||||||||
| 440 | Georgia-Pacific Corp. | 16,491 | ||||||||
| 620 | International Paper Co. | 26,040 | ||||||||
| 200 | Louisiana-Pacific Corp. | 5,348 | ||||||||
| 240 | MeadWestvaco Corp. | 8,134 | ||||||||
| 230 | Plum Creek Timber Co., Inc. | 8,841 | ||||||||
| 100 | Temple-Inland, Inc. | 6,840 | ||||||||
| 420 | Weyerhaeuser Co. | 28,232 | ||||||||
| 99,926 | ||||||||||
| Gas: 0.0% | ||||||||||
| 190 | KeySpan Corp. | 7,496 | ||||||||
| 410 | Sempra Energy | 15,038 | ||||||||
| 22,534 | ||||||||||
| Hand/Machine Tools: 0.0% | ||||||||||
| 150 | Black & Decker Corp. | 13,249 | ||||||||
| 100 | Snap-On, Inc. | 3,436 | ||||||||
| 130 | Stanley Works | 6,369 | ||||||||
| 23,054 | ||||||||||
| Healthcare — Products: 0.5% | ||||||||||
| 70 | Bausch & Lomb, Inc. | 4,512 | ||||||||
| 300 | Baxter Intl., Inc. | 10,362 | ||||||||
102
| Shares | Value | |||||||||
| Healthcare — Products (continued) | ||||||||||
| 520 | Becton Dickinson & Co. | $ | 29,536 | |||||||
| 290 | Biomet, Inc. | 12,583 | ||||||||
| 1,010 | @ | Boston Scientific Corp. | 35,906 | |||||||
| 120 | C.R. Bard, Inc. | 7,678 | ||||||||
| 160 | Guidant Corp. | 11,536 | ||||||||
| 6,150 | Johnson & Johnson | 390,032 | ||||||||
| 1,480 | Medtronic, Inc. | 73,512 | ||||||||
| 420 | @ | St. Jude Medical, Inc. | 17,611 | |||||||
| 200 | Stryker Corp. | 9,650 | ||||||||
| 310 | @ | Zimmer Holdings, Inc. | 24,837 | |||||||
| 627,755 | ||||||||||
| Healthcare — Services: 0.2% | ||||||||||
| 320 | Aetna, Inc. | 39,920 | ||||||||
| 280 | @ | Humana, Inc. | 8,313 | |||||||
| 180 | @ | Laboratory Corp. Of America Holdings | 8,968 | |||||||
| 80 | Manor Care, Inc. | 2,834 | ||||||||
| 140 | Quest Diagnostics, Inc. | 13,377 | ||||||||
| 1,360 | UnitedHealth Group, Inc. | 119,721 | ||||||||
| 610 | @ | WellPoint, Inc. | 70,150 | |||||||
| 263,283 | ||||||||||
| Home Builders: 0.0% | ||||||||||
| 140 | Centex Corp. | 8,341 | ||||||||
| 8,341 | ||||||||||
| Home Furnishings: 0.0% | ||||||||||
| 270 | Leggett & Platt, Inc. | 7,676 | ||||||||
| 80 | Whirlpool Corp. | 5,537 | ||||||||
| 13,213 | ||||||||||
| Household Products/Wares: 0.0% | ||||||||||
| 100 | Avery Dennison Corp. | 5,997 | ||||||||
| 270 | Clorox Co. | 15,911 | ||||||||
| 170 | Fortune Brands, Inc. | 13,121 | ||||||||
| 35,029 | ||||||||||
| Housewares: 0.0% | ||||||||||
| 360 | Newell Rubbermaid, Inc. | 8,708 | ||||||||
| 8,708 | ||||||||||
| Insurance: 0.5% | ||||||||||
| 350 | @@ | ACE Ltd. | 14,963 | |||||||
| 630 | AFLAC, Inc. | 25,099 | ||||||||
| 850 | Allstate Corp. | 43,962 | ||||||||
| 130 | AMBAC Financial Group, Inc. | 10,677 | ||||||||
| 3,200 | American Intl. Group, Inc. | 210,144 | ||||||||
| 390 | AON Corp. | 9,305 | ||||||||
| 400 | Chubb Corp. | 30,760 | ||||||||
| 290 | CIGNA Corp. | 23,655 | ||||||||
| 220 | Cincinnati Financial Corp. | 9,737 | ||||||||
| 460 | Hartford Financial Services Group, Inc. | 31,883 | ||||||||
| 170 | Jefferson-Pilot Corp. | 8,833 | ||||||||
| 290 | Lincoln National Corp. | 13,537 | ||||||||
| 410 | Loews Corp. | 28,823 | ||||||||
| 260 | Marsh & McLennan Cos., Inc. | 8,554 | ||||||||
| 200 | MBIA, Inc. | 12,656 | ||||||||
| 900 | MetLife, Inc. | 36,459 | ||||||||
| 150 | MGIC Investment Corp. | 10,337 | ||||||||
| 390 | Principal Financial Group | 15,967 | ||||||||
| 250 | Progressive Corp. | 21,210 | ||||||||
| 1,090 | Prudential Financial, Inc. | 59,906 | ||||||||
| 240 | Safeco Corp. | 12,538 | ||||||||
| 320 | St. Paul Travelers Cos., Inc. | 11,862 | ||||||||
| 160 | Torchmark Corp. | 9,142 | ||||||||
| 400 | UnumProvident Corp. | 7,176 | ||||||||
| 220 | @@ | XL Capital Ltd. | 17,083 | |||||||
| 684,268 | ||||||||||
| Internet: 0.1% | ||||||||||
| 800 | @ | eBay, Inc. | 93,023 | |||||||
| 1,280 | @ | Symantec Corp. | 32,973 | |||||||
| 1,620 | @ | Yahoo!, Inc. | 61,042 | |||||||
| 187,038 | ||||||||||
| Iron/Steel: 0.0% | ||||||||||
| 200 | Nucor Corp. | 10,468 | ||||||||
| 130 | United States Steel Corp. | 6,663 | ||||||||
| 17,131 | ||||||||||
| Leisure Time: 0.1% | ||||||||||
| 110 | Brunswick Corp. | 5,445 | ||||||||
| 770 | Carnival Corp. | 44,375 | ||||||||
| 380 | Harley-Davidson, Inc. | 23,085 | ||||||||
| 160 | Sabre Holdings Corp. | 3,546 | ||||||||
| 76,451 | ||||||||||
| Lodging: 0.0% | ||||||||||
| 130 | Harrah’s Entertainment, Inc. | 8,696 | ||||||||
| 440 | Hilton Hotels Corp. | 10,006 | ||||||||
| 370 | Marriott Intl., Inc. | 23,302 | ||||||||
| 260 | Starwood Hotels & Resorts Worldwide, Inc. | 15,184 | ||||||||
| 57,188 | ||||||||||
| Machinery — Construction and Mining: 0.0% | ||||||||||
| 170 | Caterpillar, Inc. | 16,577 | ||||||||
| 16,577 | ||||||||||
| Machinery — Diversified: 0.0% | ||||||||||
| 40 | Cummins, Inc. | 3,352 | ||||||||
| 320 | Deere & Co. | 23,807 | ||||||||
| 210 | Rockwell Automation, Inc. | 10,406 | ||||||||
| 37,565 | ||||||||||
| Media: 0.4% | ||||||||||
| 2,760 | @ | Comcast Corp. | 91,853 | |||||||
| 320 | Gannett Co., Inc. | 26,144 | ||||||||
| 100 | Knight-Ridder, Inc. | 6,694 | ||||||||
| 380 | McGraw-Hill Cos., Inc. | 34,785 | ||||||||
| 50 | Meredith Corp. | 2,710 | ||||||||
| 270 | New York Times Co. | 11,016 | ||||||||
| 3,240 | News Corp. | 60,458 | ||||||||
| 5,530 | @ | Time Warner, Inc. | 107,503 | |||||||
| 150 | Tribune Co. | 6,321 | ||||||||
| 2,130 | Viacom, Inc. | 77,511 | ||||||||
| 2,480 | Walt Disney Co. | 68,944 | ||||||||
| 493,939 | ||||||||||
| Mining: 0.0% | ||||||||||
| 150 | Phelps Dodge Corp. | 14,838 | ||||||||
| 14,838 | ||||||||||
| Miscellaneous Manufacturing: 0.6% | ||||||||||
| 970 | 3M Co. | 79,608 | ||||||||
| 130 | Cooper Industries Ltd. | 8,826 | ||||||||
| 380 | Danaher Corp. | 21,816 | ||||||||
| 100 | Dover Corp. | 4,194 | ||||||||
| 350 | Eastman Kodak Co. | 11,288 | ||||||||
| 180 | Eaton Corp. | 13,025 | ||||||||
| 13,040 | General Electric Co. | 475,959 | ||||||||
| 1,040 | Honeywell Intl., Inc. | 36,826 | ||||||||
| 380 | Illinois Tool Works, Inc. | 35,218 | ||||||||
| 210 | @@ | Ingersoll-Rand Co. | 16,863 | |||||||
| 110 | ITT Industries, Inc. | 9,290 | ||||||||
| 160 | Pall Corp. | 4,632 | ||||||||
| 160 | Textron, Inc. | 11,808 | ||||||||
| 2,490 | @@ | Tyco Intl., Ltd. | 88,993 | |||||||
| 818,346 | ||||||||||
103
| Shares | Value | |||||||||
| Office/Business Equipment: 0.0% | ||||||||||
| 290 | Pitney Bowes, Inc. | $ | 13,421 | |||||||
| 1,570 | @ | Xerox Corp. | 26,706 | |||||||
| 40,127 | ||||||||||
| Oil and Gas: 0.9% | ||||||||||
| 180 | Amerada Hess Corp. | 14,828 | ||||||||
| 370 | Anadarko Petroleum Corp. | 23,980 | ||||||||
| 404 | Apache Corp. | 20,430 | ||||||||
| 780 | Burlington Resources, Inc. | 33,930 | ||||||||
| 3,320 | ChevronTexaco Corp. | 174,333 | ||||||||
| 1,361 | ConocoPhillips | 118,176 | ||||||||
| 980 | Devon Energy Corp. | 38,142 | ||||||||
| 160 | EOG Resources, Inc. | 11,418 | ||||||||
| 10,090 | Exxon Mobil Corp. | 517,214 | ||||||||
| 200 | Kerr-McGee Corp. | 11,558 | ||||||||
| 400 | Marathon Oil Corp. | 15,044 | ||||||||
| 70 | @,@@ | Nabors Industries, Ltd. | 3,590 | |||||||
| 130 | @ | Noble Corp. | 6,466 | |||||||
| 490 | Occidental Petroleum Corp. | 28,596 | ||||||||
| 110 | Sunoco, Inc. | 8,988 | ||||||||
| 340 | @ | Transocean, Inc. | 14,413 | |||||||
| 310 | Unocal Corp. | 13,404 | ||||||||
| 520 | Valero Energy Corp. | 23,608 | ||||||||
| 1,078,118 | ||||||||||
| Oil and Gas Services: 0.0% | ||||||||||
| 400 | Baker Hughes, Inc. | 17,068 | ||||||||
| 200 | BJ Services Co. | 9,308 | ||||||||
| 500 | Halliburton Co. | 19,620 | ||||||||
| 45,996 | ||||||||||
| Packaging and Containers: 0.0% | ||||||||||
| 220 | Ball Corp. | 9,675 | ||||||||
| 220 | Bemis Co. | 6,400 | ||||||||
| 300 | @ | Pactiv Corp. | 7,587 | |||||||
| 100 | @ | Sealed Air Corp. | 5,327 | |||||||
| 28,989 | ||||||||||
| Pharmaceuticals: 0.6% | ||||||||||
| 1,900 | Abbott Laboratories | 88,635 | ||||||||
| 160 | Allergan, Inc. | 12,971 | ||||||||
| 120 | AmerisourceBergen Corp. | 7,042 | ||||||||
| 2,370 | Bristol-Myers Squibb Co. | 60,719 | ||||||||
| 700 | Cardinal Health, Inc. | 40,705 | ||||||||
| 940 | @ | Caremark Rx, Inc. | 37,064 | |||||||
| 550 | Eli Lilly & Co. | 31,213 | ||||||||
| 140 | @ | Express Scripts, Inc. | 10,702 | |||||||
| 450 | @ | Forest Laboratories, Inc. | 20,187 | |||||||
| 520 | @ | Gilead Sciences, Inc. | 18,195 | |||||||
| 200 | @ | Hospira, Inc. | 6,700 | |||||||
| 380 | @ | King Pharmaceuticals, Inc. | 4,712 | |||||||
| 337 | @ | Medco Health Solutions, Inc. | 14,019 | |||||||
| 2,710 | Merck & Co., Inc. | 87,099 | ||||||||
| 9,162 | Pfizer, Inc. | 246,366 | ||||||||
| 1,780 | Schering-Plough Corp. | 37,166 | ||||||||
| 1,650 | Wyeth | 70,274 | ||||||||
| 793,769 | ||||||||||
| Pipelines: 0.0% | ||||||||||
| 680 | El Paso Corp. | 7,072 | ||||||||
| 70 | Kinder Morgan, Inc. | 5,119 | ||||||||
| 680 | Williams Cos., Inc. | 11,077 | ||||||||
| 23,268 | ||||||||||
| Real Estate Investment Trusts: 0.0% | ||||||||||
| 200 | Equity Office Properties Trust | 5,824 | ||||||||
| 220 | ProLogis | 9,533 | ||||||||
| 260 | Simon Property Group, Inc. | 16,814 | ||||||||
| 32,171 | ||||||||||
| Retail: 0.9% | ||||||||||
| 380 | @ | Bed Bath & Beyond, Inc. | 15,135 | |||||||
| 400 | Best Buy Co., Inc. | 23,768 | ||||||||
| 350 | Circuit City Stores, Inc. | 5,474 | ||||||||
| 960 | Costco Wholesale Corp. | 46,474 | ||||||||
| 480 | CVS Corp. | 21,634 | ||||||||
| 350 | Darden Restaurants, Inc. | 9,709 | ||||||||
| 210 | Federated Department Stores, Inc. | 12,136 | ||||||||
| 1,460 | Gap, Inc. | 30,835 | ||||||||
| 4,550 | Home Depot, Inc. | 194,466 | ||||||||
| 590 | J.C. Penney Co., Inc. Holding Co. | 24,426 | ||||||||
| 160 | @ | Kohl’s Corp. | 7,867 | |||||||
| 740 | Limited Brands, Inc. | 17,035 | ||||||||
| 950 | Lowe’s Cos., Inc. | 54,711 | ||||||||
| 360 | May Department Stores Co. | 10,584 | ||||||||
| 2,640 | McDonald’s Corp. | 84,638 | ||||||||
| 160 | Nordstrom, Inc. | 7,477 | ||||||||
| 520 | @ | Office Depot, Inc. | 9,027 | |||||||
| 300 | RadioShack Corp. | 9,864 | ||||||||
| 1,060 | Staples, Inc. | 35,733 | ||||||||
| 650 | @ | Starbucks Corp. | 40,534 | |||||||
| 1,120 | Target Corp. | 58,162 | ||||||||
| 620 | TJX Cos., Inc. | 15,581 | ||||||||
| 440 | @ | Toys R US, Inc. | 9,007 | |||||||
| 5,190 | Wal-Mart Stores, Inc. | 274,135 | ||||||||
| 1,250 | Walgreen Co. | 47,963 | ||||||||
| 250 | Wendy’s Intl., Inc. | 9,815 | ||||||||
| 350 | Yum! Brands, Inc. | 16,513 | ||||||||
| 1,092,703 | ||||||||||
| Savings and Loans: 0.1% | ||||||||||
| 360 | Golden West Financial Corp. | 22,111 | ||||||||
| 160 | Sovereign Bancorp, Inc. | 3,608 | ||||||||
| 1,080 | Washington Mutual, Inc. | 45,663 | ||||||||
| 71,382 | ||||||||||
| Semiconductors: 0.2% | ||||||||||
| 470 | @ | Altera Corp. | 9,729 | |||||||
| 480 | Analog Devices, Inc. | 17,722 | ||||||||
| 2,090 | @ | Applied Materials, Inc. | 35,739 | |||||||
| 431 | @ | Freescale Semiconductor Inc. | 7,913 | |||||||
| 7,940 | Intel Corp. | 185,717 | ||||||||
| 230 | @ | KLA-Tencor Corp. | 10,713 | |||||||
| 400 | Linear Technology Corp. | 15,504 | ||||||||
| 160 | Maxim Integrated Products, Inc. | 6,782 | ||||||||
| 420 | National Semiconductor Corp. | 7,539 | ||||||||
| 840 | Texas Instruments, Inc. | 20,681 | ||||||||
| 318,039 | ||||||||||
| Software: 0.6% | ||||||||||
| 290 | Adobe Systems, Inc. | 18,195 | ||||||||
| 420 | Autodesk, Inc. | 15,939 | ||||||||
| 730 | Automatic Data Processing, Inc. | 32,376 | ||||||||
| 410 | @ | BMC Software, Inc. | 7,626 | |||||||
| 260 | @ | Citrix Systems, Inc. | 6,378 | |||||||
| 730 | Computer Associates Intl., Inc. | 22,674 | ||||||||
| �� | 700 | @ | Compuware Corp. | 4,529 | ||||||
| 160 | @ | Electronic Arts, Inc. | 9,869 | |||||||
| 1,090 | First Data Corp. | 46,369 | ||||||||
| 230 | @ | Fiserv, Inc. | 9,244 | |||||||
| 280 | IMS Health, Inc. | 6,499 | ||||||||
| 230 | @ | Intuit, Inc. | 10,122 | |||||||
| 13,230 | Microsoft Corp. | 353,372 | ||||||||
| 780 | @ | Novell, Inc. | 5,265 | |||||||
| 10,970 | @ | Oracle Corp. | 150,507 | |||||||
| 410 | @ | PeopleSoft, Inc. | 10,857 | |||||||
104
| Shares | Value | |||||||||
| Software (continued) | ||||||||||
| 840 | @ | Siebel Systems, Inc. | $ | 8,820 | ||||||
| 510 | @ | Veritas Software Corp. | 14,561 | |||||||
| 733,202 | ||||||||||
| Telecommunications: 0.6% | ||||||||||
| 540 | Alltel Corp. | 31,730 | ||||||||
| 376 | AT&T Corp. | 7,167 | ||||||||
| 500 | @ | Avaya, Inc. | 8,600 | |||||||
| 2,280 | BellSouth Corp. | 63,361 | ||||||||
| 260 | CenturyTel, Inc. | 9,222 | ||||||||
| 8,190 | @ | Cisco Systems, Inc. | 158,067 | |||||||
| 400 | Citizens Communications Co. | 5,516 | ||||||||
| 410 | @ | Comverse Technology, Inc. | 10,025 | |||||||
| 660 | @ | Corning, Inc. | 7,768 | |||||||
| 5,140 | @ | Lucent Technologies, Inc. | 19,326 | |||||||
| 2,870 | Motorola, Inc. | 49,364 | ||||||||
| 1,370 | @ | Nextel Communications, Inc. | 41,100 | |||||||
| 1,960 | QUALCOMM, Inc. | 83,104 | ||||||||
| 900 | @ | Qwest Communications Intl., Inc. | 3,996 | |||||||
| 4,130 | SBC Communications, Inc. | 106,430 | ||||||||
| 170 | Scientific-Atlanta, Inc. | 5,612 | ||||||||
| 1,780 | Sprint Corp. | 44,233 | ||||||||
| 530 | @ | Tellabs, Inc. | 4,553 | |||||||
| 4,550 | Verizon Communications, Inc. | 184,320 | ||||||||
| 843,494 | ||||||||||
| Textiles: 0.0% | ||||||||||
| 190 | Cintas Corp. | 8,333 | ||||||||
| 8,333 | ||||||||||
| Toys/Games/Hobbies: 0.0% | ||||||||||
| 260 | Hasbro, Inc. | 5,039 | ||||||||
| 520 | Mattel, Inc. | 10,135 | ||||||||
| 15,174 | ||||||||||
| Transportation: 0.2% | ||||||||||
| 600 | Burlington Northern Santa Fe Corp. | 28,386 | ||||||||
| 280 | CSX Corp. | 11,222 | ||||||||
| 620 | FedEx Corp. | 61,064 | ||||||||
| 640 | Norfolk Southern Corp. | 23,162 | ||||||||
| 60 | Ryder System, Inc. | 2,866 | ||||||||
| 1,380 | United Parcel Service, Inc. | 117,935 | ||||||||
| 244,635 | ||||||||||
| Total Common Stock (Cost $13,005,512) | 14,534,783 | |||||||||
| Principal | ||||||||||
| Amount | Value | |||||||||
| U.S. GOVERNMENT AGENCY OBLIGATIONS: 62.7% | ||||||||||
| Federal Home Loan Mortgage Corporation: 18.4% | ||||||||||
| $ | 20,000,000 | 3.380%, due 01/26/07 | $ | 18,673,540 | ||||||
| 6,250,000 | 3.350%, due 01/15/07 | 5,844,350 | ||||||||
| 24,517,890 | ||||||||||
| Federal National Mortgage Association: 28.3% | ||||||||||
| 40,000,000 | 3.360%, due 12/15/06 | 37,497,839 | ||||||||
| 37,497,839 | ||||||||||
| Other: 16.0% | ||||||||||
| 13,420,000 | FICO STRIP, 3.210%, due 09/07/06 | 12,721,409 | ||||||||
| 6,210,000 | FICO STRIP, 3.320%, due 12/06/06 | 5,831,221 | ||||||||
| 2,894,000 | FICO STRIP, 3.330%, due 12/27/06 | 2,711,912 | ||||||||
| 21,264,542 | ||||||||||
| Total U.S. Government Agency Obligations (Cost $82,102,014) | 83,280,271 | |||||||||
| U.S. TREASURY OBLIGATIONS: 11.7% | ||||||||||
| Other: 11.7% | ||||||||||
| 16,610,000 | United States Treasury Strip Principal, 3.100%, due 02/15/07 | 15,566,178 | ||||||||
| Total U.S. Treasury Obligations (Cost $15,610,816) | 15,566,178 | |||||||||
| OTHER BONDS: 13.8% | ||||||||||
| Sovereign: 13.8% | ||||||||||
| 6,913,000 | Israel Trust, 3.500%, due 11/15/06 | 6,481,829 | ||||||||
| 12,673,000 | Turkey Trust, 3.500%, due 11/15/06 | 11,882,573 | ||||||||
| Total Other Bonds (Cost $18,072,937) | 18,364,402 | |||||||||
| Total Long-Term Investments (Cost $128,791,279) | 131,745,634 | |||||||||
| SHORT-TERM INVESTMENTS: 1.0% | ||||||||||
| Repurchase Agreement: 1.0% | ||||||||||
| 1,311,000 | Morgan Stanley Repurchase Agreement dated 12/31/04, 2.200% due 01/03/05, $1,311,240 to be received upon repurchase (Collateralized by $1,220,000 Federal Home Loan Bank, 5.750%, Market Value plus accrued interest $1,341,435, due 05/15/12) | 1,311,000 | ||||||||
| Total Short-Term Investments (Cost $1,311,000) | 1,311,000 | |||||||||
Total Investments In Securities (Cost $130,102,279)* | 100.1 | % | $ | 133,056,634 | ||||||||
Other Assets and Liabilities-Net | (0.1) | (132,763 | ) | |||||||||
Net Assets | 100.0 | % | $ | 132,923,871 | ||||||||
| @ | Non-income producing security | |
| @@ | Foreign issuer | |
| STRIP | Separate Trading of Registered Interest and Principal of Securities | |
| * | Cost for federal income tax purposes is $130,241,199. Net unrealized depreciation consists of: |
| Gross Unrealized Appreciation | $ | 3,345,603 | ||
| Gross Unrealized Depreciation | (530,168 | ) | ||
| Net Unrealized Appreciation | $ | 2,815,435 | ||
105
| Shares | Value | |||||||||
| COMMON STOCK: 17.6% | ||||||||||
| Advertising: 0.0% | ||||||||||
| 350 | @ | Interpublic Group of Cos., Inc. | $ | 4,690 | ||||||
| 400 | Omnicom Group, Inc. | 33,728 | ||||||||
| 38,418 | ||||||||||
| Aerospace/Defense: 0.4% | ||||||||||
| 3,150 | Boeing Co. | 163,075 | ||||||||
| 750 | General Dynamics Corp. | 78,450 | ||||||||
| 400 | Goodrich Corp. | 13,056 | ||||||||
| 250 | L-3 Communications Holdings, Inc. | 18,310 | ||||||||
| 1,330 | Lockheed Martin Corp. | 73,882 | ||||||||
| 700 | Northrop Grumman Corp. | 38,052 | ||||||||
| 1,750 | Raytheon Co. | 67,953 | ||||||||
| 220 | Rockwell Collins, Inc. | 8,677 | ||||||||
| 1,130 | United Technologies Corp. | 116,785 | ||||||||
| 578,240 | ||||||||||
| Agriculture: 0.3% | ||||||||||
| 4,620 | Altria Group, Inc. | 282,281 | ||||||||
| 1,380 | Archer-Daniels-Midland Co. | 30,788 | ||||||||
| 550 | Monsanto Co. | 30,553 | ||||||||
| 350 | Reynolds American, Inc. | 27,510 | ||||||||
| 650 | UST, Inc. | 31,272 | ||||||||
| 402,404 | ||||||||||
| Apparel: 0.1% | ||||||||||
| 550 | @ | Coach, Inc. | 31,020 | |||||||
| 240 | Jones Apparel Group, Inc. | 8,777 | ||||||||
| 230 | Liz Claiborne, Inc. | 9,708 | ||||||||
| 1,010 | Nike, Inc. | 91,597 | ||||||||
| 230 | Reebok Intl., Ltd. | 10,120 | ||||||||
| 350 | VF Corp. | 19,383 | ||||||||
| 170,605 | ||||||||||
| Auto Manufacturers: 0.1% | ||||||||||
| 6,770 | Ford Motor Co. | 99,112 | ||||||||
| 1,250 | General Motors Corp. | 50,075 | ||||||||
| 595 | PACCAR, Inc. | 47,886 | ||||||||
| 197,073 | ||||||||||
| Auto Parts and Equipment: 0.0% | ||||||||||
| 380 | Johnson Controls, Inc. | 24,107 | ||||||||
| 24,107 | ||||||||||
| Banks: 1.1% | ||||||||||
| 1,000 | AmSouth Bancorporation | 25,900 | ||||||||
| 8,890 | Bank of America Corp. | 417,740 | ||||||||
| 1,100 | BB&T Corp. | 46,255 | ||||||||
| 500 | Comerica, Inc. | 30,510 | ||||||||
| 250 | Compass Bancshares, Inc. | 12,168 | ||||||||
| 500 | Fifth Third Bancorp | 23,640 | ||||||||
| 380 | First Horizon National Corp. | 16,382 | ||||||||
| 450 | Huntington Bancshares, Inc. | 11,151 | ||||||||
| 1,140 | KeyCorp | 38,646 | ||||||||
| 250 | M & T Bank Corp. | 26,960 | ||||||||
| 670 | Marshall & Ilsley Corp. | 29,614 | ||||||||
| 1,100 | Mellon Financial Corp. | 34,221 | ||||||||
| 2,020 | National City Corp. | 75,851 | ||||||||
| 975 | North Fork Bancorporation, Inc. | 28,129 | ||||||||
| 500 | Northern Trust Corp. | 24,290 | ||||||||
| 250 | PNC Financial Services Group, Inc. | 14,360 | ||||||||
| 1,023 | Regions Financial Corp. | 36,409 | ||||||||
| 730 | State Street Corp. | 35,858 | ||||||||
| 760 | SunTrust Banks, Inc. | 56,149 | ||||||||
| 300 | Synovus Financial Corp. | 8,574 | ||||||||
| 1,700 | The Bank of New York Co., Inc. | 56,814 | ||||||||
| 4,120 | U.S. Bancorp | 129,038 | ||||||||
| 3,565 | Wachovia Corp. | 187,519 | ||||||||
| 3,800 | Wells Fargo & Co. | 236,169 | ||||||||
| 100 | Zions Bancorporation | 6,803 | ||||||||
| 1,609,150 | ||||||||||
| Beverages: 0.4% | ||||||||||
| 100 | Adolph Coors Co. | 7,567 | ||||||||
| 710 | Anheuser-Busch Cos., Inc. | 36,018 | ||||||||
| 300 | Brown-Forman Corp. | 14,604 | ||||||||
| 5,240 | Coca-Cola Co. | 218,141 | ||||||||
| 1,350 | Coca-Cola Enterprises, Inc. | 28,148 | ||||||||
| 580 | Pepsi Bottling Group, Inc. | 15,683 | ||||||||
| 5,050 | PepsiCo, Inc. | 263,610 | ||||||||
| 583,771 | ||||||||||
| Biotechnology: 0.2% | ||||||||||
| 2,856 | @ | Amgen, Inc. | 183,212 | |||||||
| 700 | @ | Biogen Idec, Inc. | 46,627 | |||||||
| 500 | @ | Genzyme Corp. | 29,035 | |||||||
| 500 | @ | MedImmune, Inc. | 13,555 | |||||||
| 272,429 | ||||||||||
| Building Materials: 0.1% | ||||||||||
| 570 | @ | American Standard Cos., Inc. | 23,552 | |||||||
| 950 | Masco Corp. | 34,703 | ||||||||
| 350 | Vulcan Materials Co. | 19,114 | ||||||||
| 77,369 | ||||||||||
| Chemicals: 0.3% | ||||||||||
| 500 | Air Products & Chemicals, Inc. | 28,985 | ||||||||
| 200 | Ashland, Inc. | 11,676 | ||||||||
| 2,200 | Dow Chemical Co. | 108,922 | ||||||||
| 2,250 | E.I. du Pont de Nemours & Co. | 110,362 | ||||||||
| 250 | Eastman Chemical Co. | 14,433 | ||||||||
| 230 | Ecolab, Inc. | 8,080 | ||||||||
| 350 | Engelhard Corp. | 10,735 | ||||||||
| 300 | International Flavors & Fragrances, Inc. | 12,852 | ||||||||
| 600 | PPG Industries, Inc. | 40,896 | ||||||||
| 680 | Praxair, Inc. | 30,022 | ||||||||
| 570 | Rohm & Haas Co. | 25,211 | ||||||||
| 400 | Sherwin-Williams Co. | 17,852 | ||||||||
| 250 | Sigma-Aldrich Corp. | 15,115 | ||||||||
| 435,141 | ||||||||||
| Commercial Services: 0.2% | ||||||||||
| 420 | @ | Apollo Group, Inc. | 33,898 | |||||||
| 2,350 | Cendant Corp. | 54,942 | ||||||||
| 410 | Equifax, Inc. | 11,521 | ||||||||
| 500 | H&R Block, Inc. | 24,500 | ||||||||
| 850 | McKesson Corp. | 26,741 | ||||||||
| 400 | Moody’s Corp. | 34,740 | ||||||||
| 1,000 | Paychex, Inc. | 34,080 | ||||||||
| 650 | R.R. Donnelley & Sons Co. | 22,939 | ||||||||
| 450 | Robert Half Intl., Inc. | 13,244 | ||||||||
| 256,605 | ||||||||||
| Computers: 1.0% | ||||||||||
| 300 | @ | Affiliated Computer Services, Inc. | 18,057 | |||||||
| 1,450 | @ | Apple Computer, Inc. | 93,380 | |||||||
| 550 | @ | Computer Sciences Corp. | 31,004 | |||||||
| 9,320 | @ | Dell, Inc. | 392,744 | |||||||
| 1,150 | Electronic Data Systems Corp. | 26,565 | ||||||||
| 4,950 | @ | EMC Corp. | 73,607 | |||||||
| 1,000 | @ | Gateway, Inc. | 6,010 | |||||||
| 6,587 | Hewlett-Packard Co. | 138,129 | ||||||||
| 5,010 | International Business Machines Corp. | 493,885 | ||||||||
| 250 | @ | Lexmark Intl., Inc. | 21,250 | |||||||
| 200 | @ | NCR Corp. | 13,846 | |||||||
| 1,000 | @ | Network Appliance, Inc. | 33,220 | |||||||
106
| Shares | Value | |||||||||
| Computers (continued) | ||||||||||
| 12,750 | @ | Sun Microsystems, Inc. | $ | 68,595 | ||||||
| 850 | @ | Sungard Data Systems, Inc. | 24,081 | |||||||
| 1,000 | @ | Unisys Corp. | 10,180 | |||||||
| 1,444,553 | ||||||||||
| Cosmetics/Personal Care: 0.6% | ||||||||||
| 300 | Alberto-Culver Co. | 14,571 | ||||||||
| 400 | Avon Products, Inc. | 15,480 | ||||||||
| 1,100 | Colgate-Palmolive Co. | 56,276 | ||||||||
| 3,780 | Gillette Co. | 169,268 | ||||||||
| 1,090 | Kimberly-Clark Corp. | 71,733 | ||||||||
| 9,600 | Procter & Gamble Co. | 528,768 | ||||||||
| 856,096 | ||||||||||
| Distribution/Wholesale: 0.0% | ||||||||||
| 700 | Genuine Parts Co. | 30,842 | ||||||||
| 300 | W.W. Grainger, Inc. | 19,986 | ||||||||
| 50,828 | ||||||||||
| Diversified Financial Services: 1.3% | ||||||||||
| 3,760 | American Express Co. | 211,951 | ||||||||
| 280 | Bear Stearns Cos., Inc. | 28,647 | ||||||||
| 910 | Capital One Financial Corp. | 76,631 | ||||||||
| 650 | CIT Group, Inc. | 29,783 | ||||||||
| 11,380 | Citigroup, Inc. | 548,287 | ||||||||
| 1,228 | Countrywide Financial Corp. | 45,448 | ||||||||
| 1,100 | @ | E*TRADE Financial Corp. | 16,445 | |||||||
| 2,080 | Fannie Mae | 148,117 | ||||||||
| 300 | Federated Investors, Inc. | 9,120 | ||||||||
| 550 | Franklin Resources, Inc. | 38,308 | ||||||||
| 1,500 | Freddie Mac | 110,550 | ||||||||
| 1,050 | Goldman Sachs Group, Inc. | 109,242 | ||||||||
| 700 | Janus Capital Group, Inc. | 11,767 | ||||||||
| 820 | Lehman Brothers Holdings, Inc. | 71,734 | ||||||||
| 2,585 | MBNA Corp. | 72,871 | ||||||||
| 2,080 | Merrill Lynch & Co., Inc. | 124,322 | ||||||||
| 2,400 | Morgan Stanley | 133,248 | ||||||||
| 620 | @ | Providian Financial Corp. | 10,211 | |||||||
| 910 | SLM Corp. | 48,585 | ||||||||
| 300 | T. Rowe Price Group, Inc. | 18,660 | ||||||||
| 1,863,927 | ||||||||||
| Electric: 0.4% | ||||||||||
| 1,400 | @ | AES Corp. | 19,138 | |||||||
| 200 | Ameren Corp. | 10,028 | ||||||||
| 820 | American Electric Power Co., Inc. | 28,159 | ||||||||
| 150 | Cinergy Corp. | 6,245 | ||||||||
| 550 | Consolidated Edison, Inc. | 24,063 | ||||||||
| 450 | Constellation Energy Group, Inc. | 19,670 | ||||||||
| 300 | Dominion Resources, Inc. | 20,322 | ||||||||
| 350 | DTE Energy Co. | 15,096 | ||||||||
| 3,550 | Duke Energy Corp. | 89,921 | ||||||||
| 750 | Edison Intl. | 24,023 | ||||||||
| 500 | Entergy Corp. | 33,794 | ||||||||
| 1,350 | Exelon Corp. | 59,494 | ||||||||
| 700 | FirstEnergy Corp. | 27,657 | ||||||||
| 350 | FPL Group, Inc. | 26,163 | ||||||||
| 870 | @ | PG&E Corp. | 28,954 | |||||||
| 250 | Pinnacle West Capital Corp. | 11,103 | ||||||||
| 650 | PPL Corp. | 34,631 | ||||||||
| 550 | Public Service Enterprise Group, Inc. | 28,474 | ||||||||
| 1,630 | Southern Co. | 54,637 | ||||||||
| 900 | TXU Corp. | 58,103 | ||||||||
| 850 | Xcel Energy, Inc. | 15,470 | ||||||||
| 635,145 | ||||||||||
| Electrical Components and Equipment: 0.1% | ||||||||||
| 1,230 | Emerson Electric Co. | 86,223 | ||||||||
| 86,223 | ||||||||||
| Electronics: 0.1% | ||||||||||
| 1,250 | @ | Agilent Technologies, Inc. | 30,124 | |||||||
| 640 | Applera Corp. — Applied Biosystems Group | 13,382 | ||||||||
| 250 | @ | Fisher Scientific Intl. | 15,595 | |||||||
| 460 | @ | Jabil Circuit, Inc. | 11,767 | |||||||
| 300 | Parker Hannifin Corp. | 22,721 | ||||||||
| 250 | PerkinElmer, Inc. | 5,623 | ||||||||
| 1,250 | @ | Sanmina-SCI Corp. | 10,588 | |||||||
| 2,200 | @ | Solectron Corp. | 11,726 | |||||||
| 150 | Tektronix, Inc. | 4,532 | ||||||||
| 500 | @ | Thermo Electron Corp. | 15,095 | |||||||
| 350 | @ | Waters Corp. | 16,377 | |||||||
| 157,530 | ||||||||||
| Engineering and Construction: 0.0% | ||||||||||
| 200 | Fluor Corp. | 10,902 | ||||||||
| 10,902 | ||||||||||
| Entertainment: 0.0% | ||||||||||
| 650 | International Game Technology | 22,347 | ||||||||
| 22,347 | ||||||||||
| Environmental Control: 0.0% | ||||||||||
| 1,120 | Waste Management, Inc. | 33,533 | ||||||||
| 33,533 | ||||||||||
| Food: 0.3% | ||||||||||
| 850 | Albertson’s, Inc. | 20,298 | ||||||||
| 900 | Campbell Soup Co. | 26,901 | ||||||||
| 1,050 | ConAgra Foods, Inc. | 30,923 | ||||||||
| 750 | General Mills, Inc. | 37,283 | ||||||||
| 950 | H.J. Heinz Co. | 37,041 | ||||||||
| 700 | Hershey Foods Corp. | 38,878 | ||||||||
| 1,020 | Kellogg Co. | 45,552 | ||||||||
| 600 | @ | Kroger Co. | 10,524 | |||||||
| 400 | McCormick & Co., Inc. | 15,440 | ||||||||
| 1,050 | @ | Safeway, Inc. | 20,727 | |||||||
| 1,530 | Sara Lee Corp. | 36,934 | ||||||||
| 350 | SUPERVALU, Inc. | 12,082 | ||||||||
| 850 | Wm. Wrigley Jr. Co. | 58,811 | ||||||||
| 391,394 | ||||||||||
| Forest Products and Paper: 0.1% | ||||||||||
| 600 | Georgia-Pacific Corp. | 22,488 | ||||||||
| 1,170 | International Paper Co. | 49,140 | ||||||||
| 350 | Louisiana-Pacific Corp. | 9,359 | ||||||||
| 550 | MeadWestvaco Corp. | 18,640 | ||||||||
| 400 | Plum Creek Timber Co., Inc. | 15,376 | ||||||||
| 150 | Temple-Inland, Inc. | 10,260 | ||||||||
| 750 | Weyerhaeuser Co. | 50,415 | ||||||||
| 175,678 | ||||||||||
| Gas: 0.0% | ||||||||||
| 430 | KeySpan Corp. | 16,964 | ||||||||
| 730 | Sempra Energy | 26,776 | ||||||||
| 43,740 | ||||||||||
| Hand/Machine Tools: 0.0% | ||||||||||
| 280 | Black & Decker Corp. | 24,732 | ||||||||
| 100 | Snap-On, Inc. | 3,436 | ||||||||
| 230 | Stanley Works | 11,268 | ||||||||
| 39,436 | ||||||||||
| Healthcare — Products: 0.8% | ||||||||||
| 200 | Bausch & Lomb, Inc. | 12,892 | ||||||||
| 550 | Baxter Intl., Inc. | 18,997 | ||||||||
107
| Shares | Value | |||||||||
| Healthcare — Products (continued) | ||||||||||
| 950 | Becton Dickinson & Co. | $ | 53,960 | |||||||
| 550 | Biomet, Inc. | 23,865 | ||||||||
| 1,880 | @ | Boston Scientific Corp. | 66,834 | |||||||
| 300 | C.R. Bard, Inc. | 19,194 | ||||||||
| 270 | Guidant Corp. | 19,467 | ||||||||
| 11,100 | Johnson & Johnson | 703,961 | ||||||||
| 2,650 | Medtronic, Inc. | 131,625 | ||||||||
| 960 | @ | St. Jude Medical, Inc. | 40,253 | |||||||
| 350 | Stryker Corp. | 16,888 | ||||||||
| 550 | @ | Zimmer Holdings, Inc. | 44,066 | |||||||
| 1,152,002 | ||||||||||
| Healthcare — Services: 0.3% | ||||||||||
| 550 | Aetna, Inc. | 68,613 | ||||||||
| 600 | @ | Humana, Inc. | 17,814 | |||||||
| 300 | @ | Laboratory Corp. Of America Holdings | 14,946 | |||||||
| 300 | Manor Care, Inc. | 10,629 | ||||||||
| 250 | Quest Diagnostics, Inc. | 23,888 | ||||||||
| 2,460 | UnitedHealth Group, Inc. | 216,553 | ||||||||
| 1,060 | @ | WellPoint, Inc. | 121,900 | |||||||
| 474,343 | ||||||||||
| Home Builders: 0.0% | ||||||||||
| 90 | Centex Corp. | 5,362 | ||||||||
| 5,362 | ||||||||||
| Home Furnishings: 0.0% | ||||||||||
| 230 | Leggett & Platt, Inc. | 6,539 | ||||||||
| 200 | Whirlpool Corp. | 13,842 | ||||||||
| 20,381 | ||||||||||
| Household Products/Wares: 0.0% | ||||||||||
| 300 | Avery Dennison Corp. | 17,991 | ||||||||
| 540 | Clorox Co. | 31,822 | ||||||||
| 260 | Fortune Brands, Inc. | 20,067 | ||||||||
| 69,880 | ||||||||||
| Housewares: 0.0% | ||||||||||
| 650 | Newell Rubbermaid, Inc. | 15,724 | ||||||||
| 15,724 | ||||||||||
| Insurance: 0.8% | ||||||||||
| 630 | @@ | ACE Ltd. | 26,933 | |||||||
| 1,110 | AFLAC, Inc. | 44,222 | ||||||||
| 1,500 | Allstate Corp. | 77,580 | ||||||||
| 230 | AMBAC Financial Group, Inc. | 18,890 | ||||||||
| 5,750 | American Intl. Group, Inc. | 377,602 | ||||||||
| 850 | AON Corp. | 20,281 | ||||||||
| 660 | Chubb Corp. | 50,754 | ||||||||
| 480 | CIGNA Corp. | 39,154 | ||||||||
| 525 | Cincinnati Financial Corp. | 23,237 | ||||||||
| 850 | Hartford Financial Services Group, Inc. | 58,914 | ||||||||
| 420 | Jefferson-Pilot Corp. | 21,823 | ||||||||
| 350 | Lincoln National Corp. | 16,338 | ||||||||
| 750 | Loews Corp. | 52,725 | ||||||||
| 450 | Marsh & McLennan Cos., Inc. | 14,805 | ||||||||
| 320 | MBIA, Inc. | 20,250 | ||||||||
| 1,650 | MetLife, Inc. | 66,842 | ||||||||
| 300 | MGIC Investment Corp. | 20,673 | ||||||||
| 710 | Principal Financial Group | 29,067 | ||||||||
| 450 | Progressive Corp. | 38,178 | ||||||||
| 1,950 | Prudential Financial, Inc. | 107,171 | ||||||||
| 400 | Safeco Corp. | 20,896 | ||||||||
| 600 | St. Paul Travelers Cos., Inc. | 22,242 | ||||||||
| 350 | Torchmark Corp. | 19,999 | ||||||||
| 700 | UnumProvident Corp. | 12,558 | ||||||||
| 400 | @@ | XL Capital Ltd. | 31,060 | |||||||
| 1,232,194 | ||||||||||
| Internet: 0.2% | ||||||||||
| 1,400 | @ | eBay, Inc. | 162,792 | |||||||
| 2,400 | @ | Symantec Corp. | 61,824 | |||||||
| 2,950 | @ | Yahoo!, Inc. | 111,156 | |||||||
| 335,772 | ||||||||||
| Iron/Steel: 0.0% | ||||||||||
| 400 | Nucor Corp. | 20,936 | ||||||||
| 350 | United States Steel Corp. | 17,938 | ||||||||
| 38,874 | ||||||||||
| Leisure Time: 0.1% | ||||||||||
| 360 | Brunswick Corp. | 17,820 | ||||||||
| 1,300 | Carnival Corp. | 74,919 | ||||||||
| 630 | Harley-Davidson, Inc. | 38,273 | ||||||||
| 400 | Sabre Holdings Corp. | 8,864 | ||||||||
| 139,876 | ||||||||||
| Lodging: 0.1% | ||||||||||
| 240 | Harrah’s Entertainment, Inc. | 16,054 | ||||||||
| 1,000 | Hilton Hotels Corp. | 22,740 | ||||||||
| 700 | Marriott Intl., Inc. | 44,086 | ||||||||
| 550 | Starwood Hotels & Resorts Worldwide, Inc. | 32,120 | ||||||||
| 115,000 | ||||||||||
| Machinery — Construction and Mining: 0.0% | ||||||||||
| 300 | Caterpillar, Inc. | 29,253 | ||||||||
| 29,253 | ||||||||||
| Machinery — Diversified: 0.1% | ||||||||||
| 150 | Cummins, Inc. | 12,569 | ||||||||
| 560 | Deere & Co. | 41,664 | ||||||||
| 480 | Rockwell Automation, Inc. | 23,784 | ||||||||
| 78,017 | ||||||||||
| Media: 0.6% | ||||||||||
| 4,900 | @ | Comcast Corp. | 163,072 | |||||||
| 560 | Gannett Co., Inc. | 45,752 | ||||||||
| 110 | Knight-Ridder, Inc. | 7,363 | ||||||||
| 720 | McGraw-Hill Cos., Inc. | 65,909 | ||||||||
| 170 | Meredith Corp. | 9,214 | ||||||||
| 300 | New York Times Co. | 12,240 | ||||||||
| 5,850 | News Corp. | 109,161 | ||||||||
| 9,850 | @ | Time Warner, Inc. | 191,484 | |||||||
| 290 | Tribune Co. | 12,221 | ||||||||
| 3,830 | Viacom, Inc. | 139,374 | ||||||||
| 4,450 | Walt Disney Co. | 123,710 | ||||||||
| 879,500 | ||||||||||
| Mining: 0.0% | ||||||||||
| 250 | Phelps Dodge Corp. | 24,730 | ||||||||
| 24,730 | ||||||||||
| Miscellaneous Manufacturing: 1.0% | ||||||||||
| 1,730 | 3M Co. | 141,981 | ||||||||
| 300 | Cooper Industries Ltd. | 20,367 | ||||||||
| 820 | Danaher Corp. | 47,076 | ||||||||
| 200 | Dover Corp. | 8,388 | ||||||||
| 780 | Eastman Kodak Co. | 25,155 | ||||||||
| 400 | Eaton Corp. | 28,944 | ||||||||
| 23,490 | General Electric Co. | 857,385 | ||||||||
| 1,740 | Honeywell Intl., Inc. | 61,613 | ||||||||
| 650 | Illinois Tool Works, Inc. | 60,242 | ||||||||
| 450 | @@ | Ingersoll-Rand Co. | 36,135 | |||||||
| 240 | ITT Industries, Inc. | 20,268 | ||||||||
| 350 | Pall Corp. | 10,133 | ||||||||
| 330 | Textron, Inc. | 24,354 | ||||||||
| 4,450 | @@ | Tyco Intl., Ltd. | 159,043 | |||||||
| 1,501,084 | ||||||||||
108
| Shares | Value | |||||||||
| Office/Business Equipment: 0.0% | ||||||||||
| 490 | Pitney Bowes, Inc. | $ | 22,677 | |||||||
| 2,840 | @ | Xerox Corp. | 48,309 | |||||||
| 70,986 | ||||||||||
| Oil and Gas: 1.3% | ||||||||||
| 220 | Amerada Hess Corp. | 18,124 | ||||||||
| 650 | Anadarko Petroleum Corp. | 42,127 | ||||||||
| 636 | Apache Corp. | 32,163 | ||||||||
| 1,330 | Burlington Resources, Inc. | 57,855 | ||||||||
| 5,950 | ChevronTexaco Corp. | 312,434 | ||||||||
| 2,463 | ConocoPhillips | 213,861 | ||||||||
| 1,780 | Devon Energy Corp. | 69,277 | ||||||||
| 300 | EOG Resources, Inc. | 21,408 | ||||||||
| 18,220 | Exxon Mobil Corp. | 933,956 | ||||||||
| 250 | Kerr-McGee Corp. | 14,448 | ||||||||
| 890 | Marathon Oil Corp. | 33,473 | ||||||||
| 100 | @,@@ | Nabors Industries, Ltd. | 5,129 | |||||||
| 400 | @ | Noble Corp. | 19,896 | |||||||
| 780 | Occidental Petroleum Corp. | 45,521 | ||||||||
| 200 | Sunoco, Inc. | 16,342 | ||||||||
| 600 | @ | Transocean, Inc. | 25,434 | |||||||
| 640 | Unocal Corp. | 27,674 | ||||||||
| 1,000 | Valero Energy Corp. | 45,400 | ||||||||
| 1,934,522 | ||||||||||
| Oil and Gas Services: 0.1% | ||||||||||
| 700 | Baker Hughes, Inc. | 29,869 | ||||||||
| 400 | BJ Services Co. | 18,616 | ||||||||
| 900 | Halliburton Co. | 35,316 | ||||||||
| 83,801 | ||||||||||
| Packaging and Containers: 0.0% | ||||||||||
| 200 | Ball Corp. | 8,796 | ||||||||
| 280 | Bemis Co. | 8,145 | ||||||||
| 570 | @ | Pactiv Corp. | 14,416 | |||||||
| 200 | @ | Sealed Air Corp. | 10,654 | |||||||
| 42,011 | ||||||||||
| Pharmaceuticals: 1.0% | ||||||||||
| 3,400 | Abbott Laboratories | 158,610 | ||||||||
| 250 | Allergan, Inc. | 20,268 | ||||||||
| 300 | AmerisourceBergen Corp. | 17,604 | ||||||||
| 4,200 | Bristol-Myers Squibb Co. | 107,604 | ||||||||
| 1,250 | Cardinal Health, Inc. | 72,688 | ||||||||
| 1,700 | @ | Caremark Rx, Inc. | 67,031 | |||||||
| 1,000 | Eli Lilly & Co. | 56,750 | ||||||||
| 200 | @ | Express Scripts, Inc. | 15,288 | |||||||
| 740 | @ | Forest Laboratories, Inc. | 33,196 | |||||||
| 1,000 | @ | Gilead Sciences, Inc. | 34,990 | |||||||
| 450 | @ | Hospira, Inc. | 15,075 | |||||||
| 790 | @ | King Pharmaceuticals, Inc. | 9,796 | |||||||
| 629 | @ | Medco Health Solutions, Inc. | 26,166 | |||||||
| 4,820 | Merck & Co., Inc. | 154,915 | ||||||||
| 16,786 | Pfizer, Inc. | 451,375 | ||||||||
| 3,200 | Schering-Plough Corp. | 66,816 | ||||||||
| 2,900 | Wyeth | 123,511 | ||||||||
| 1,431,683 | ||||||||||
| Pipelines: 0.0% | ||||||||||
| 1,200 | El Paso Corp. | 12,480 | ||||||||
| 100 | Kinder Morgan, Inc. | 7,313 | ||||||||
| 1,450 | Williams Cos., Inc. | 23,621 | ||||||||
| 43,414 | ||||||||||
| Real Estate Investment Trusts: 0.0% | ||||||||||
| 350 | Equity Office Properties Trust | 10,192 | ||||||||
| 400 | ProLogis | 17,332 | ||||||||
| 450 | Simon Property Group, Inc. | 29,102 | ||||||||
| 56,626 | ||||||||||
| Retail: 1.4% | ||||||||||
| 840 | @ | Bed Bath & Beyond, Inc. | 33,457 | |||||||
| 650 | Best Buy Co., Inc. | 38,623 | ||||||||
| 500 | Circuit City Stores, Inc. | 7,820 | ||||||||
| 1,700 | Costco Wholesale Corp. | 82,297 | ||||||||
| 750 | CVS Corp. | 33,803 | ||||||||
| 500 | Darden Restaurants, Inc. | 13,870 | ||||||||
| 460 | Federated Department Stores, Inc. | 26,583 | ||||||||
| 2,650 | Gap, Inc. | 55,968 | ||||||||
| 8,210 | Home Depot, Inc. | 350,894 | ||||||||
| 1,000 | J.C. Penney Co., Inc. Holding Co. | 41,400 | ||||||||
| 300 | @ | Kohl’s Corp. | 14,751 | |||||||
| 1,110 | Limited Brands, Inc. | 25,552 | ||||||||
| 1,730 | Lowe’s Cos., Inc. | 99,631 | ||||||||
| 550 | May Department Stores Co. | 16,170 | ||||||||
| 4,760 | McDonald’s Corp. | 152,606 | ||||||||
| 300 | Nordstrom, Inc. | 14,019 | ||||||||
| 800 | @ | Office Depot, Inc. | 13,888 | |||||||
| 310 | RadioShack Corp. | 10,193 | ||||||||
| 1,710 | Staples, Inc. | 57,644 | ||||||||
| 1,170 | @ | Starbucks Corp. | 72,961 | |||||||
| 2,000 | Target Corp. | 103,860 | ||||||||
| 1,320 | TJX Cos., Inc. | 33,172 | ||||||||
| 600 | @ | Toys R US, Inc. | 12,282 | |||||||
| 9,410 | Wal-Mart Stores, Inc. | 497,035 | ||||||||
| 2,250 | Walgreen Co. | 86,333 | ||||||||
| 370 | Wendy’s Intl., Inc. | 14,526 | ||||||||
| 760 | Yum! Brands, Inc. | 35,857 | ||||||||
| 1,945,195 | ||||||||||
| Savings and Loans 0.1% | ||||||||||
| 640 | Golden West Financial Corp. | 39,309 | ||||||||
| 300 | Sovereign Bancorp, Inc. | 6,765 | ||||||||
| 1,930 | Washington Mutual, Inc. | 81,600 | ||||||||
| 127,674 | ||||||||||
| Semiconductors: 0.4% | ||||||||||
| 1,000 | @ | Altera Corp. | 20,700 | |||||||
| 850 | Analog Devices, Inc. | 31,382 | ||||||||
| 3,340 | @ | Applied Materials, Inc. | 57,114 | |||||||
| 772 | @ | Freescale Semiconductor Inc. | 14,174 | |||||||
| 14,140 | Intel Corp. | 330,734 | ||||||||
| 400 | @ | KLA-Tencor Corp. | 18,632 | |||||||
| 850 | Linear Technology Corp. | 32,946 | ||||||||
| 310 | Maxim Integrated Products, Inc. | 13,141 | ||||||||
| 350 | National Semiconductor Corp. | 6,283 | ||||||||
| 1,500 | Texas Instruments, Inc. | 36,930 | ||||||||
| 562,036 | ||||||||||
| Software: 0.9% | ||||||||||
| 490 | Adobe Systems, Inc. | 30,743 | ||||||||
| 740 | Autodesk, Inc. | 28,083 | ||||||||
| 1,200 | Automatic Data Processing, Inc. | 53,220 | ||||||||
| 670 | @ | BMC Software, Inc. | 12,462 | |||||||
| 350 | @ | Citrix Systems, Inc. | 8,586 | |||||||
| 1,140 | Computer Associates Intl., Inc. | 35,408 | ||||||||
| 1,350 | @ | Compuware Corp. | 8,735 | |||||||
| 300 | @ | Electronic Arts, Inc. | 18,504 | |||||||
| 1,922 | First Data Corp. | 81,762 | ||||||||
| 550 | @ | Fiserv, Inc. | 22,105 | |||||||
| 850 | IMS Health, Inc. | 19,729 | ||||||||
| 540 | @ | Intuit, Inc. | 23,765 | |||||||
| 23,830 | Microsoft Corp. | 636,498 | ||||||||
| 1,100 | @ | Novell, Inc. | 7,425 | |||||||
| 19,550 | @ | Oracle Corp. | 268,226 | |||||||
| 800 | @ | PeopleSoft, Inc. | 21,184 | |||||||
109
| Shares | Value | |||||||||
| Software (continued) | ||||||||||
| 990 | @ | Siebel Systems, Inc. | $ | 10,395 | ||||||
| 1,140 | @ | Veritas Software Corp. | 32,547 | |||||||
| 1,319,377 | ||||||||||
| Telecommunications: 1.0% | ||||||||||
| 960 | Alltel Corp. | 56,410 | ||||||||
| 712 | AT&T Corp. | 13,571 | ||||||||
| 1,250 | @ | Avaya, Inc. | 21,500 | |||||||
| 4,090 | BellSouth Corp. | 113,661 | ||||||||
| 370 | CenturyTel, Inc. | 13,124 | ||||||||
| 14,510 | @ | Cisco Systems, Inc. | 280,043 | |||||||
| 700 | Citizens Communications Co. | 9,653 | ||||||||
| 610 | @ | Comverse Technology, Inc. | 14,915 | |||||||
| 1,200 | @ | Corning, Inc. | 14,124 | |||||||
| 9,150 | @ | Lucent Technologies, Inc. | 34,404 | |||||||
| 5,200 | Motorola, Inc. | 89,440 | ||||||||
| 2,600 | @ | Nextel Communications, Inc. | 78,000 | |||||||
| 3,500 | QUALCOMM, Inc. | 148,400 | ||||||||
| 1,600 | @ | Qwest Communications Intl., Inc. | 7,104 | |||||||
| 7,440 | SBC Communications, Inc. | 191,729 | ||||||||
| 450 | Scientific-Atlanta, Inc. | 14,855 | ||||||||
| 3,200 | Sprint Corp. | 79,520 | ||||||||
| 760 | @ | Tellabs, Inc. | 6,528 | |||||||
| 8,200 | Verizon Communications, Inc. | 332,181 | ||||||||
| 1,519,162 | ||||||||||
| Textiles: 0.0% | ||||||||||
| 450 | Cintas Corp. | 19,737 | ||||||||
| 19,737 | ||||||||||
| Toys/Games/Hobbies: 0.0% | ||||||||||
| 460 | Hasbro, Inc. | 8,915 | ||||||||
| 900 | Mattel, Inc. | 17,541 | ||||||||
| 26,456 | ||||||||||
| Transportation: 0.3% | ||||||||||
| 1,170 | Burlington Northern Santa Fe Corp. | 55,353 | ||||||||
| 500 | CSX Corp. | 20,040 | ||||||||
| 1,090 | FedEx Corp. | 107,354 | ||||||||
| 1,150 | Norfolk Southern Corp. | 41,619 | ||||||||
| 150 | Ryder System, Inc. | 7,166 | ||||||||
| 2,440 | United Parcel Service, Inc. | 208,521 | ||||||||
| 440,053 | ||||||||||
| Total Common Stock (Cost $23,076,214) | 26,191,369 | |||||||||
| Principal | ||||||||||
| Amount | Value | |||||||||
| CORPORATE BONDS/NOTES: 4.2% | ||||||||||
| Diversified Financial Services: 4.2% | ||||||||||
| $ | 6,000,000 | @ | General Electric Capital Corp., 5.000%, due 06/15/07 | $ | 6,205,854 | |||||
| Total Corporate Bonds/Notes (Cost $6,166,350) | 6,205,854 | |||||||||
| U.S. GOVERNMENT AGENCY OBLIGATIONS: 69.8% | ||||||||||
| Federal Home Loan Mortgage Corporation: 12.5% | ||||||||||
| 20,000,000 | 3.380%, due 01/26/07 | 18,673,540 | ||||||||
| 18,673,540 | ||||||||||
| Federal National Mortgage Association: 45.0% | ||||||||||
| 3,021,000 | 3.480%, due 03/15/07 | 2,803,101 | ||||||||
| 69,300,000 | 3.520%, due 03/15/07 | 64,255,444 | ||||||||
| 67,058,545 | ||||||||||
| Other: 12.3% | ||||||||||
| 3,500,000 | FICO STRIP, 3.400%, due 04/06/07 | 3,246,747 | ||||||||
| 12,637,000 | FICO STRIP, 3.430%, due 05/11/07 | 11,678,383 | ||||||||
| 3,645,000 | FICO STRIP, 3.450%, due 05/30/07 | 3,361,295 | ||||||||
| 18,286,425 | ||||||||||
| Total U.S. Government Agency Obligations (Cost $101,249,715) | 104,018,510 | |||||||||
| U.S. TREASURY OBLIGATIONS: 2.5% | ||||||||||
U.S. Treasury STRIP: 2.5% | ||||||||||
| 4,047,000 | 3.080%, due 02/15/07 | 3,795,046 | ||||||||
| Total U.S. Treasury Obligations (Cost $3,800,165) | 3,795,046 | |||||||||
| OTHER BONDS: 4.9% | ||||||||||
| Sovereign: 4.9% | ||||||||||
| 1,000,000 | Israel Trust, Zero Coupon, Due 05/15/07, 3.640%, due 05/15/07 | 919,666 | ||||||||
| 7,007,000 | Israel Trust, Zero Coupon, Due 05/15/07, 3.640%, due 05/15/07 | 6,444,100 | ||||||||
| Total Other Bonds (Cost $7,139,355) | 7,363,766 | |||||||||
| Total Long-Term Investments (Cost $141,431,799) | 147,574,545 | |||||||||
| SHORT-TERM INVESTMENTS: 0.5% | ||||||||||
| Repurchase Agreement: 0.5% | ||||||||||
| 705,000 | Morgan Stanley Repurchase Agreement dated 12/31/04, 2.200% due 01/03/05, $705,129 to be received upon repurchase (Collateralized by $655,000 Federal Home Loan Bank, 5.750%, Market Value plus accrued interest $720,197, due 05/15/12) | 705,000 | ||||||||
| Total Short-Term Investments (Cost $705,000) | 705,000 | |||||||||
Total Investments In Securities (Cost $142,136,799)* | 99.5 | % | $ | 148,279,545 | ||||||||
Other Assets and Liabilities-Net | 0.5 | 676,213 | ||||||||||
Net Assets | 100.0 | % | $ | 148,955,758 | ||||||||
| @ | Non-income producing security | |
| @@ | Foreign issuer | |
| STRIP | Separate Trading of Registered Interest and Principal of Securities | |
| * | Cost for federal income tax purposes is $143,018,295. Net unrealized depreciation consists of: |
| Gross Unrealized Appreciation | $ | 5,747,769 | ||
| Gross Unrealized Depreciation | (486,519 | ) | ||
| Net Unrealized Appreciation | $ | 5,261,250 | ||
110
| Shares | Value | |||||||||
| COMMON STOCK: 24.3% | ||||||||||
| Advertising: 0.0% | ||||||||||
| 1,250 | @ | Interpublic Group of Cos., Inc. | $ | 16,750 | ||||||
| 550 | Omnicom Group, Inc. | 46,376 | ||||||||
| 63,126 | ||||||||||
| Aerospace/ Defense: 0.5% | ||||||||||
| 4,150 | Boeing Co. | 214,845 | ||||||||
| 1,050 | General Dynamics Corp. | 109,830 | ||||||||
| 300 | Goodrich Corp. | 9,792 | ||||||||
| 300 | L-3 Communications Holdings, Inc. | 21,972 | ||||||||
| 1,800 | Lockheed Martin Corp. | 99,990 | ||||||||
| 1,050 | Northrop Grumman Corp. | 57,078 | ||||||||
| 2,350 | Raytheon Co. | 91,251 | ||||||||
| 540 | Rockwell Collins, Inc. | 21,298 | ||||||||
| 1,510 | United Technologies Corp. | 156,058 | ||||||||
| 782,114 | ||||||||||
| Agriculture: 0.4% | ||||||||||
| 6,100 | Altria Group, Inc. | 372,710 | ||||||||
| 1,900 | Archer-Daniels-Midland Co. | 42,389 | ||||||||
| 950 | Monsanto Co. | 52,773 | ||||||||
| 550 | Reynolds American, Inc. | 43,230 | ||||||||
| 900 | UST, Inc. | 43,299 | ||||||||
| 554,401 | ||||||||||
| Apparel: 0.2% | ||||||||||
| 750 | @ | Coach, Inc. | 42,300 | |||||||
| 580 | Jones Apparel Group, Inc. | 21,211 | ||||||||
| 470 | Liz Claiborne, Inc. | 19,839 | ||||||||
| 1,300 | Nike, Inc. | 117,896 | ||||||||
| 230 | Reebok Intl., Ltd. | 10,120 | ||||||||
| 500 | VF Corp. | 27,690 | ||||||||
| 239,056 | ||||||||||
| Auto Manufacturers: 0.2% | ||||||||||
| 9,050 | Ford Motor Co. | 132,492 | ||||||||
| 1,700 | General Motors Corp. | 68,102 | ||||||||
| 850 | PACCAR, Inc. | 68,408 | ||||||||
| 269,002 | ||||||||||
| Auto Parts and Equipment: 0.0% | ||||||||||
| 700 | Johnson Controls, Inc. | 44,408 | ||||||||
| 44,408 | ||||||||||
| Banks: 1.5% | ||||||||||
| 950 | AmSouth Bancorporation | 24,605 | ||||||||
| 12,030 | Bank of America Corp. | 565,289 | ||||||||
| 1,600 | BB&T Corp. | 67,280 | ||||||||
| 650 | Comerica, Inc. | 39,663 | ||||||||
| 350 | Compass Bancshares, Inc. | 17,035 | ||||||||
| 700 | Fifth Third Bancorp | 33,096 | ||||||||
| 500 | First Horizon National Corp. | 21,555 | ||||||||
| 600 | Huntington Bancshares, Inc. | 14,868 | ||||||||
| 1,550 | KeyCorp | 52,545 | ||||||||
| 450 | M & T Bank Corp. | 48,528 | ||||||||
| 600 | Marshall & Ilsley Corp. | 26,520 | ||||||||
| 1,450 | Mellon Financial Corp. | 45,110 | ||||||||
| 2,750 | National City Corp. | 103,263 | ||||||||
| 1,375 | North Fork Bancorporation, Inc. | 39,669 | ||||||||
| 700 | Northern Trust Corp. | 34,006 | ||||||||
| 350 | PNC Financial Services Group, Inc. | 20,104 | ||||||||
| 1,397 | Regions Financial Corp. | 49,719 | ||||||||
| 950 | State Street Corp. | 46,664 | ||||||||
| 1,050 | SunTrust Banks, Inc. | 77,574 | ||||||||
| 350 | Synovus Financial Corp. | 10,003 | ||||||||
| 2,300 | The Bank of New York Co., Inc. | 76,866 | ||||||||
| 5,600 | U.S. Bancorp | 175,392 | ||||||||
| 4,790 | Wachovia Corp. | 251,953 | ||||||||
| 5,050 | Wells Fargo & Co. | 313,857 | ||||||||
| 300 | Zions Bancorporation | 20,409 | ||||||||
| 2,175,573 | ||||||||||
| Beverages: 0.5% | ||||||||||
| 100 | Adolph Coors Co. | 7,567 | ||||||||
| 950 | Anheuser-Busch Cos., Inc. | 48,194 | ||||||||
| 400 | Brown-Forman Corp. | 19,472 | ||||||||
| 7,250 | Coca-Cola Co. | 301,818 | ||||||||
| 1,750 | Coca-Cola Enterprises, Inc. | 36,488 | ||||||||
| 1,100 | Pepsi Bottling Group, Inc. | 29,744 | ||||||||
| 6,850 | PepsiCo, Inc. | 357,569 | ||||||||
| 800,852 | ||||||||||
| Biotechnology: 0.3% | ||||||||||
| 3,842 | @ | Amgen, Inc. | 246,464 | |||||||
| 950 | @ | Biogen Idec, Inc. | 63,280 | |||||||
| 700 | @ | Genzyme Corp. | 40,649 | |||||||
| 700 | @ | MedImmune, Inc. | 18,977 | |||||||
| 369,370 | ||||||||||
| Building Materials: 0.1% | ||||||||||
| 650 | @ | American Standard Cos., Inc. | 26,858 | |||||||
| 1,250 | Masco Corp. | 45,662 | ||||||||
| 450 | Vulcan Materials Co. | 24,575 | ||||||||
| 97,095 | ||||||||||
| Chemicals: 0.4% | ||||||||||
| 650 | Air Products & Chemicals, Inc. | 37,681 | ||||||||
| 300 | Ashland, Inc. | 17,514 | ||||||||
| 2,950 | Dow Chemical Co. | 146,054 | ||||||||
| 3,000 | E.I. du Pont de Nemours & Co. | 147,149 | ||||||||
| 300 | Eastman Chemical Co. | 17,319 | ||||||||
| 350 | Ecolab, Inc. | 12,296 | ||||||||
| 500 | Engelhard Corp. | 15,335 | ||||||||
| 450 | International Flavors & Fragrances, Inc. | 19,278 | ||||||||
| 950 | PPG Industries, Inc. | 64,752 | ||||||||
| 1,050 | Praxair, Inc. | 46,358 | ||||||||
| 900 | Rohm & Haas Co. | 39,807 | ||||||||
| 750 | Sherwin-Williams Co. | 33,473 | ||||||||
| 200 | Sigma-Aldrich Corp. | 12,092 | ||||||||
| 609,108 | ||||||||||
| Commercial Services: 0.2% | ||||||||||
| 650 | @ | Apollo Group, Inc. | 52,462 | |||||||
| 3,150 | Cendant Corp. | 73,647 | ||||||||
| 350 | Equifax, Inc. | 9,835 | ||||||||
| 610 | H&R Block, Inc. | 29,890 | ||||||||
| 1,100 | McKesson Corp. | 34,606 | ||||||||
| 500 | Moody’s Corp. | 43,425 | ||||||||
| 1,100 | Paychex, Inc. | 37,488 | ||||||||
| 800 | R.R. Donnelley & Sons Co. | 28,232 | ||||||||
| 800 | Robert Half Intl., Inc. | 23,544 | ||||||||
| 333,129 | ||||||||||
| Computers: 1.3% | ||||||||||
| 400 | @ | Affiliated Computer Services, Inc. | 24,076 | |||||||
| 2,100 | @ | Apple Computer, Inc. | 135,240 | |||||||
| 700 | @ | Computer Sciences Corp. | 39,459 | |||||||
| 12,650 | @ | Dell, Inc. | 533,070 | |||||||
| 1,550 | Electronic Data Systems Corp. | 35,805 | ||||||||
| 7,100 | @ | EMC Corp. | 105,577 | |||||||
| 1,300 | @ | Gateway, Inc. | 7,813 | |||||||
| 8,800 | Hewlett-Packard Co. | 184,536 | ||||||||
| 6,750 | International Business Machines Corp. | 665,414 | ||||||||
| 450 | @ | Lexmark Intl., Inc. | 38,250 | |||||||
| 250 | @ | NCR Corp. | 17,308 | |||||||
| 1,300 | @ | Network Appliance, Inc. | 43,186 | |||||||
111
| Shares | Value | |||||||||
| Computers (continued) | ||||||||||
| 17,200 | @ | Sun Microsystems, Inc. | $ | 92,536 | ||||||
| 750 | @ | Sungard Data Systems, Inc. | 21,248 | |||||||
| 950 | @ | Unisys Corp. | 9,671 | |||||||
| 1,953,189 | ||||||||||
| Cosmetics/ Personal Care: 0.8% | ||||||||||
| 300 | Alberto-Culver Co. | 14,571 | ||||||||
| 550 | Avon Products, Inc. | 21,285 | ||||||||
| 1,550 | Colgate-Palmolive Co. | 79,298 | ||||||||
| 5,100 | Gillette Co. | 228,378 | ||||||||
| 1,450 | Kimberly-Clark Corp. | 95,425 | ||||||||
| 13,000 | Procter & Gamble Co. | 716,040 | ||||||||
| 1,154,997 | ||||||||||
| Distribution/ Wholesale: 0.1% | ||||||||||
| 950 | Genuine Parts Co. | 41,857 | ||||||||
| 500 | W.W. Grainger, Inc. | 33,310 | ||||||||
| 75,167 | ||||||||||
| Diversified Financial Services: 1.8% | ||||||||||
| 5,100 | American Express Co. | 287,486 | ||||||||
| 380 | Bear Stearns Cos., Inc. | 38,878 | ||||||||
| 1,250 | Capital One Financial Corp. | 105,263 | ||||||||
| 850 | CIT Group, Inc. | 38,947 | ||||||||
| 15,650 | Citigroup, Inc. | 754,016 | ||||||||
| 1,648 | Countrywide Financial Corp. | 60,992 | ||||||||
| 1,450 | @ | E*TRADE Financial Corp. | 21,678 | |||||||
| 2,900 | Fannie Mae | 206,508 | ||||||||
| 450 | Federated Investors, Inc. | 13,680 | ||||||||
| 750 | Franklin Resources, Inc. | 52,238 | ||||||||
| 2,000 | Freddie Mac | 147,400 | ||||||||
| 1,400 | Goldman Sachs Group, Inc. | 145,656 | ||||||||
| 900 | Janus Capital Group, Inc. | 15,129 | ||||||||
| 1,100 | Lehman Brothers Holdings, Inc. | 96,228 | ||||||||
| 3,725 | MBNA Corp. | 105,008 | ||||||||
| 2,750 | Merrill Lynch & Co., Inc. | 164,368 | ||||||||
| 3,250 | Morgan Stanley | 180,439 | ||||||||
| 1,450 | @ | Providian Financial Corp. | 23,882 | |||||||
| 1,250 | SLM Corp. | 66,738 | ||||||||
| 400 | T. Rowe Price Group, Inc. | 24,880 | ||||||||
| 2,549,414 | ||||||||||
| Electric: 0.6% | ||||||||||
| 1,850 | @ | AES Corp. | 25,290 | |||||||
| 250 | Ameren Corp. | 12,535 | ||||||||
| 1,200 | American Electric Power Co., Inc. | 41,208 | ||||||||
| 200 | Cinergy Corp. | 8,326 | ||||||||
| 950 | Consolidated Edison, Inc. | 41,563 | ||||||||
| 450 | Constellation Energy Group, Inc. | 19,670 | ||||||||
| 400 | Dominion Resources, Inc. | 27,096 | ||||||||
| 650 | DTE Energy Co. | 28,035 | ||||||||
| 4,800 | Duke Energy Corp. | 121,583 | ||||||||
| 1,020 | Edison Intl. | 32,671 | ||||||||
| 700 | Entergy Corp. | 47,313 | ||||||||
| 1,900 | Exelon Corp. | 83,732 | ||||||||
| 1,200 | FirstEnergy Corp. | 47,412 | ||||||||
| 500 | FPL Group, Inc. | 37,375 | ||||||||
| 1,150 | @ | PG&E Corp. | 38,272 | |||||||
| 400 | Pinnacle West Capital Corp. | 17,764 | ||||||||
| 900 | PPL Corp. | 47,952 | ||||||||
| 750 | Public Service Enterprise Group, Inc. | 38,828 | ||||||||
| 2,200 | Southern Co. | 73,744 | ||||||||
| 1,200 | TXU Corp. | 77,471 | ||||||||
| 1,200 | Xcel Energy, Inc. | 21,840 | ||||||||
| 889,680 | ||||||||||
| Electrical Components and Equipment: 0.1% | ||||||||||
| 1,700 | Emerson Electric Co. | 119,170 | ||||||||
| 119,170 | ||||||||||
| Electronics: 0.2% | ||||||||||
| 1,700 | @ | Agilent Technologies, Inc. | 40,969 | |||||||
| 650 | Applera Corp.— Applied Biosystems Group | 13,592 | ||||||||
| 450 | @ | Fisher Scientific Intl. | 28,070 | |||||||
| 840 | @ | Jabil Circuit, Inc. | 21,487 | |||||||
| 350 | Parker Hannifin Corp. | 26,509 | ||||||||
| 350 | PerkinElmer, Inc. | 7,872 | ||||||||
| 1,600 | @ | Sanmina-SCI Corp. | 13,552 | |||||||
| 2,900 | @ | Solectron Corp. | 15,457 | |||||||
| 350 | Tektronix, Inc. | 10,574 | ||||||||
| 650 | @ | Thermo Electron Corp. | 19,624 | |||||||
| 500 | @ | Waters Corp. | 23,395 | |||||||
| 221,101 | ||||||||||
| Engineering and Construction: 0.0% | ||||||||||
| 250 | Fluor Corp. | 13,628 | ||||||||
| 13,628 | ||||||||||
| Entertainment: 0.0% | ||||||||||
| 1,200 | International Game Technology | 41,256 | ||||||||
| 41,256 | ||||||||||
| Environmental Control: 0.0% | ||||||||||
| 1,700 | Waste Management, Inc. | 50,898 | ||||||||
| 50,898 | ||||||||||
| Food: 0.4% | ||||||||||
| 1,150 | Albertson’s, Inc. | 27,462 | ||||||||
| 1,250 | Campbell Soup Co. | 37,363 | ||||||||
| 1,550 | ConAgra Foods, Inc. | 45,648 | ||||||||
| 1,100 | General Mills, Inc. | 54,681 | ||||||||
| 1,250 | H.J. Heinz Co. | 48,738 | ||||||||
| 750 | Hershey Foods Corp. | 41,655 | ||||||||
| 1,400 | Kellogg Co. | 62,523 | ||||||||
| 1,050 | @ | Kroger Co. | 18,417 | |||||||
| 550 | McCormick & Co., Inc. | 21,230 | ||||||||
| 1,400 | @ | Safeway, Inc. | 27,636 | |||||||
| 2,350 | Sara Lee Corp. | 56,729 | ||||||||
| 550 | SUPERVALU, Inc. | 18,986 | ||||||||
| 1,150 | Wm. Wrigley Jr. Co. | 79,568 | ||||||||
| 540,636 | ||||||||||
| Forest Products and Paper: 0.2% | ||||||||||
| 790 | Georgia-Pacific Corp. | 29,609 | ||||||||
| 1,500 | International Paper Co. | 63,000 | ||||||||
| 450 | Louisiana-Pacific Corp. | 12,033 | ||||||||
| 750 | MeadWestvaco Corp. | 25,418 | ||||||||
| 550 | Plum Creek Timber Co., Inc. | 21,142 | ||||||||
| 200 | Temple-Inland, Inc. | 13,680 | ||||||||
| 1,050 | Weyerhaeuser Co. | 70,581 | ||||||||
| 235,463 | ||||||||||
| Gas: 0.0% | ||||||||||
| 650 | KeySpan Corp. | 25,643 | ||||||||
| 1,000 | Sempra Energy | 36,680 | ||||||||
| 62,323 | ||||||||||
| Hand/ Machine Tools: 0.0% | ||||||||||
| 420 | Black & Decker Corp. | 37,098 | ||||||||
| 250 | Snap-On, Inc. | 8,590 | ||||||||
| 350 | Stanley Works | 17,147 | ||||||||
| 62,835 | ||||||||||
| Healthcare — Products: 1.1% | ||||||||||
| 250 | Bausch & Lomb, Inc. | 16,115 | ||||||||
| 700 | Baxter Intl., Inc. | 24,178 | ||||||||
112
| Shares | Value | |||||||||
| Healthcare — Products (continued) | ||||||||||
| 1,260 | Becton Dickinson & Co. | $ | 71,568 | |||||||
| 850 | Biomet, Inc. | 36,882 | ||||||||
| 2,420 | @ | Boston Scientific Corp. | 86,031 | |||||||
| 400 | C.R. Bard, Inc. | 25,592 | ||||||||
| 360 | Guidant Corp. | 25,956 | ||||||||
| 15,200 | Johnson & Johnson | 963,983 | ||||||||
| 3,500 | Medtronic, Inc. | 173,845 | ||||||||
| 1,200 | @ | St. Jude Medical, Inc. | 50,316 | |||||||
| 450 | Stryker Corp. | 21,713 | ||||||||
| 750 | @ | Zimmer Holdings, Inc. | 60,090 | |||||||
| 1,556,269 | ||||||||||
| Healthcare — Services: 0.4% | ||||||||||
| 780 | Aetna, Inc. | 97,305 | ||||||||
| 800 | @ | Humana, Inc. | 23,752 | |||||||
| 400 | @ | Laboratory Corp. Of America Holdings | 19,928 | |||||||
| 350 | Manor Care, Inc. | 12,401 | ||||||||
| 300 | Quest Diagnostics, Inc. | 28,665 | ||||||||
| 3,350 | UnitedHealth Group, Inc. | 294,900 | ||||||||
| 1,450 | @ | WellPoint, Inc. | 166,750 | |||||||
| 643,701 | ||||||||||
| Home Builders: 0.0% | ||||||||||
| 190 | Centex Corp. | 11,320 | ||||||||
| 11,320 | ||||||||||
| Home Furnishings: 0.0% | ||||||||||
| 700 | Leggett & Platt, Inc. | 19,901 | ||||||||
| 300 | Whirlpool Corp. | 20,763 | ||||||||
| 40,664 | ||||||||||
| Household Products/ Wares: 0.1% | ||||||||||
| 400 | Avery Dennison Corp. | 23,988 | ||||||||
| 710 | Clorox Co. | 41,840 | ||||||||
| 400 | Fortune Brands, Inc. | 30,872 | ||||||||
| 96,700 | ||||||||||
| Housewares: 0.0% | ||||||||||
| 850 | Newell Rubbermaid, Inc. | 20,562 | ||||||||
| 20,562 | ||||||||||
| Insurance: 1.1% | ||||||||||
| 900 | @@ | ACE Ltd. | 38,475 | |||||||
| 1,500 | AFLAC, Inc. | 59,760 | ||||||||
| 2,050 | Allstate Corp. | 106,026 | ||||||||
| 350 | AMBAC Financial Group, Inc. | 28,746 | ||||||||
| 7,800 | American Intl. Group, Inc. | 512,225 | ||||||||
| 1,100 | AON Corp. | 26,246 | ||||||||
| 1,000 | Chubb Corp. | 76,900 | ||||||||
| 670 | CIGNA Corp. | 54,652 | ||||||||
| 472 | Cincinnati Financial Corp. | 20,891 | ||||||||
| 1,150 | Hartford Financial Services Group, Inc. | 79,707 | ||||||||
| 400 | Jefferson-Pilot Corp. | 20,784 | ||||||||
| 550 | Lincoln National Corp. | 25,674 | ||||||||
| 1,000 | Loews Corp. | 70,300 | ||||||||
| 650 | Marsh & McLennan Cos., Inc. | 21,385 | ||||||||
| 550 | MBIA, Inc. | 34,804 | ||||||||
| 2,200 | MetLife, Inc. | 89,122 | ||||||||
| 350 | MGIC Investment Corp. | 24,119 | ||||||||
| 950 | Principal Financial Group | 38,893 | ||||||||
| 600 | Progressive Corp. | 50,904 | ||||||||
| 2,650 | Prudential Financial, Inc. | 145,643 | ||||||||
| 650 | Safeco Corp. | 33,956 | ||||||||
| 800 | St. Paul Travelers Cos., Inc. | 29,656 | ||||||||
| 300 | Torchmark Corp. | 17,142 | ||||||||
| 950 | UnumProvident Corp. | 17,043 | ||||||||
| 400 | @@ | XL Capital Ltd. | 31,060 | |||||||
| 1,654,113 | ||||||||||
| Internet: 0.3% | ||||||||||
| 1,900 | @ | eBay, Inc. | 220,932 | |||||||
| 3,000 | @ | Symantec Corp. | 77,280 | |||||||
| 3,900 | @ | Yahoo!, Inc. | 146,952 | |||||||
| 445,164 | ||||||||||
| Iron/ Steel: 0.0% | ||||||||||
| 600 | Nucor Corp. | 31,404 | ||||||||
| 500 | United States Steel Corp. | 25,625 | ||||||||
| 57,029 | ||||||||||
| Leisure Time: 0.1% | ||||||||||
| 300 | Brunswick Corp. | 14,850 | ||||||||
| 1,850 | Carnival Corp. | 106,616 | ||||||||
| 900 | Harley-Davidson, Inc. | 54,675 | ||||||||
| 550 | Sabre Holdings Corp. | 12,188 | ||||||||
| 188,329 | ||||||||||
| Lodging: 0.1% | ||||||||||
| 310 | Harrah’s Entertainment, Inc. | 20,736 | ||||||||
| 1,350 | Hilton Hotels Corp. | 30,699 | ||||||||
| 900 | Marriott Intl., Inc. | 56,682 | ||||||||
| 700 | Starwood Hotels & Resorts Worldwide, Inc. | 40,880 | ||||||||
| 148,997 | ||||||||||
| Machinery — Construction and Mining: 0.0% | ||||||||||
| 400 | Caterpillar, Inc. | 39,004 | ||||||||
| 39,004 | ||||||||||
| Machinery — Diversified: 0.1% | ||||||||||
| 200 | Cummins, Inc. | 16,758 | ||||||||
| 750 | Deere & Co. | 55,800 | ||||||||
| 550 | Rockwell Automation, Inc. | 27,253 | ||||||||
| 99,811 | ||||||||||
| Media: 0.8% | ||||||||||
| 6,600 | @ | Comcast Corp. | 219,648 | |||||||
| 750 | Gannett Co., Inc. | 61,275 | ||||||||
| 100 | Knight-Ridder, Inc. | 6,694 | ||||||||
| 950 | McGraw-Hill Cos., Inc. | 86,963 | ||||||||
| 170 | Meredith Corp. | 9,214 | ||||||||
| 550 | New York Times Co. | 22,440 | ||||||||
| 7,900 | News Corp. | 147,414 | ||||||||
| 13,850 | @ | Time Warner, Inc. | 269,244 | |||||||
| 400 | Tribune Co. | 16,856 | ||||||||
| 5,200 | Viacom, Inc. | 189,228 | ||||||||
| 5,850 | Walt Disney Co. | 162,630 | ||||||||
| 1,191,606 | ||||||||||
| Mining: 0.0% | ||||||||||
| 400 | Phelps Dodge Corp. | 39,568 | ||||||||
| 39,568 | ||||||||||
| Miscellaneous Manufacturing: 1.4% | ||||||||||
| 2,300 | 3M Co. | 188,761 | ||||||||
| 300 | Cooper Industries Ltd. | 20,367 | ||||||||
| 1,100 | Danaher Corp. | 63,151 | ||||||||
| 250 | Dover Corp. | 10,485 | ||||||||
| 1,020 | Eastman Kodak Co. | 32,895 | ||||||||
| 550 | Eaton Corp. | 39,798 | ||||||||
| 32,000 | General Electric Co. | 1,167,999 | ||||||||
| 2,450 | Honeywell Intl., Inc. | 86,755 | ||||||||
| 900 | Illinois Tool Works, Inc. | 83,412 | ||||||||
| 600 | @@ | Ingersoll-Rand Co. | 48,180 | |||||||
| 300 | ITT Industries, Inc. | 25,335 | ||||||||
| 350 | Pall Corp. | 10,133 | ||||||||
| 400 | Textron, Inc. | 29,520 | ||||||||
| 5,950 | @@ | Tyco Intl., Ltd. | 212,652 | |||||||
| 2,019,443 | ||||||||||
113
| Shares | Value | |||||||||
| Office/ Business Equipment: 0.1% | ||||||||||
| 700 | Pitney Bowes, Inc. | $ | 32,396 | |||||||
| 3,850 | @ | Xerox Corp. | 65,489 | |||||||
| 97,885 | ||||||||||
| Oil and Gas: 1.9% | ||||||||||
| 460 | Amerada Hess Corp. | 37,895 | ||||||||
| 900 | Anadarko Petroleum Corp. | 58,329 | ||||||||
| 832 | Apache Corp. | 42,074 | ||||||||
| 1,700 | Burlington Resources, Inc. | 73,950 | ||||||||
| 8,100 | ChevronTexaco Corp. | 425,330 | ||||||||
| 3,345 | ConocoPhillips | 290,446 | ||||||||
| 2,100 | Devon Energy Corp. | 81,732 | ||||||||
| 350 | EOG Resources, Inc. | 24,976 | ||||||||
| 24,700 | Exxon Mobil Corp. | 1,266,121 | ||||||||
| 350 | Kerr-McGee Corp. | 20,227 | ||||||||
| 1,190 | Marathon Oil Corp. | 44,756 | ||||||||
| 200 | @,@@ | Nabors Industries, Ltd. | 10,258 | |||||||
| 500 | @ | Noble Corp. | 24,870 | |||||||
| 1,050 | Occidental Petroleum Corp. | 61,278 | ||||||||
| 250 | Sunoco, Inc. | 20,428 | ||||||||
| 850 | @ | Transocean, Inc. | 36,032 | |||||||
| 850 | Unocal Corp. | 36,754 | ||||||||
| 1,200 | Valero Energy Corp. | 54,480 | ||||||||
| 2,609,936 | ||||||||||
| Oil and Gas Services: 0.1% | ||||||||||
| 950 | Baker Hughes, Inc. | 40,537 | ||||||||
| 550 | BJ Services Co. | 25,597 | ||||||||
| 1,200 | Halliburton Co. | 47,088 | ||||||||
| 113,222 | ||||||||||
| Packaging and Containers: 0.0% | ||||||||||
| 400 | Ball Corp. | 17,592 | ||||||||
| 300 | Bemis Co. | 8,727 | ||||||||
| 500 | @ | Pactiv Corp. | 12,645 | |||||||
| 300 | @ | Sealed Air Corp. | 15,981 | |||||||
| 54,945 | ||||||||||
| Pharmaceuticals: 1.3% | ||||||||||
| 4,600 | Abbott Laboratories | 214,590 | ||||||||
| 450 | Allergan, Inc. | 36,482 | ||||||||
| 400 | AmerisourceBergen Corp. | 23,472 | ||||||||
| 5,650 | Bristol-Myers Squibb Co. | 144,753 | ||||||||
| 1,700 | Cardinal Health, Inc. | 98,855 | ||||||||
| 2,300 | @ | Caremark Rx, Inc. | 90,689 | |||||||
| 1,350 | Eli Lilly & Co. | 76,613 | ||||||||
| 300 | @ | Express Scripts, Inc. | 22,932 | |||||||
| 1,050 | @ | Forest Laboratories, Inc. | 47,103 | |||||||
| 1,300 | @ | Gilead Sciences, Inc. | 45,487 | |||||||
| 600 | @ | Hospira, Inc. | 20,100 | |||||||
| 300 | @ | King Pharmaceuticals, Inc. | 3,720 | |||||||
| 852 | @ | Medco Health Solutions, Inc. | 35,443 | |||||||
| 6,400 | Merck & Co., Inc. | 205,696 | ||||||||
| 22,660 | Pfizer, Inc. | 609,327 | ||||||||
| 4,300 | Schering-Plough Corp. | 89,784 | ||||||||
| 3,800 | Wyeth | 161,842 | ||||||||
| 1,926,888 | ||||||||||
| Pipelines: 0.0% | ||||||||||
| 1,650 | El Paso Corp. | 17,160 | ||||||||
| 150 | Kinder Morgan, Inc. | 10,970 | ||||||||
| 1,300 | Williams Cos., Inc. | 21,177 | ||||||||
| 49,307 | ||||||||||
| Real Estate Investment Trusts: 0.1% | ||||||||||
| 500 | Equity Office Properties Trust | 14,560 | ||||||||
| 500 | ProLogis | 21,665 | ||||||||
| 650 | Simon Property Group, Inc. | 42,036 | ||||||||
| 78,261 | ||||||||||
| Retail: 1.9% | ||||||||||
| 850 | @ | Bed Bath & Beyond, Inc. | 33,856 | |||||||
| 950 | Best Buy Co., Inc. | 56,449 | ||||||||
| 1,050 | Circuit City Stores, Inc. | 16,422 | ||||||||
| 2,300 | Costco Wholesale Corp. | 111,343 | ||||||||
| 1,400 | CVS Corp. | 63,098 | ||||||||
| 650 | Darden Restaurants, Inc. | 18,031 | ||||||||
| 500 | Federated Department Stores, Inc. | 28,895 | ||||||||
| 3,540 | Gap, Inc. | 74,765 | ||||||||
| 11,080 | Home Depot, Inc. | 473,558 | ||||||||
| 1,450 | J.C. Penney Co., Inc. Holding Co. | 60,030 | ||||||||
| 400 | @ | Kohl’s Corp. | 19,668 | |||||||
| 1,700 | Limited Brands, Inc. | 39,134 | ||||||||
| 2,230 | Lowe’s Cos., Inc. | 128,426 | ||||||||
| 800 | May Department Stores Co. | 23,520 | ||||||||
| 6,450 | McDonald’s Corp. | 206,786 | ||||||||
| 550 | Nordstrom, Inc. | 25,702 | ||||||||
| 1,420 | @ | Office Depot, Inc. | 24,651 | |||||||
| 750 | RadioShack Corp. | 24,660 | ||||||||
| 2,600 | Staples, Inc. | 87,646 | ||||||||
| 1,600 | @ | Starbucks Corp. | 99,776 | |||||||
| 2,650 | Target Corp. | 137,615 | ||||||||
| 1,800 | TJX Cos., Inc. | 45,234 | ||||||||
| 800 | @ | Toys R US, Inc. | 16,376 | |||||||
| 12,600 | Wal-Mart Stores, Inc. | 665,531 | ||||||||
| 3,050 | Walgreen Co. | 117,029 | ||||||||
| 600 | Wendy’s Intl., Inc. | 23,556 | ||||||||
| 1,000 | Yum! Brands, Inc. | 47,180 | ||||||||
| 2,668,937 | ||||||||||
| Savings and Loans: 0.1% | ||||||||||
| 860 | Golden West Financial Corp. | 52,821 | ||||||||
| 400 | �� | Sovereign Bancorp, Inc. | 9,020 | |||||||
| 2,500 | Washington Mutual, Inc. | 105,700 | ||||||||
| 167,541 | ||||||||||
| Semiconductors: 0.5% | ||||||||||
| 1,050 | @ | Altera Corp. | 21,735 | |||||||
| 1,150 | Analog Devices, Inc. | 42,458 | ||||||||
| 4,850 | @ | Applied Materials, Inc. | 82,935 | |||||||
| 1,037 | @ | Freescale Semiconductor Inc. | 19,039 | |||||||
| 19,100 | Intel Corp. | 446,749 | ||||||||
| 600 | @ | KLA-Tencor Corp. | 27,948 | |||||||
| 1,150 | Linear Technology Corp. | 44,574 | ||||||||
| 400 | Maxim Integrated Products, Inc. | 16,956 | ||||||||
| 1,150 | National Semiconductor Corp. | 20,643 | ||||||||
| 2,050 | Texas Instruments, Inc. | 50,471 | ||||||||
| 773,508 | ||||||||||
| Software: 1.2% | ||||||||||
| 650 | Adobe Systems, Inc. | 40,781 | ||||||||
| 1,000 | Autodesk, Inc. | 37,950 | ||||||||
| 1,700 | Automatic Data Processing, Inc. | 75,395 | ||||||||
| 1,050 | @ | BMC Software, Inc. | 19,530 | |||||||
| 450 | @ | Citrix Systems, Inc. | 11,039 | |||||||
| 1,700 | Computer Associates Intl., Inc. | 52,802 | ||||||||
| 1,800 | @ | Compuware Corp. | 11,646 | |||||||
| 350 | @ | Electronic Arts, Inc. | 21,588 | |||||||
| 2,537 | First Data Corp. | 107,923 | ||||||||
| 850 | @ | Fiserv, Inc. | 34,162 | |||||||
| 1,050 | IMS Health, Inc. | 24,371 | ||||||||
| 700 | @ | Intuit, Inc. | 30,807 | |||||||
| 32,450 | Microsoft Corp. | 866,739 | ||||||||
| 1,450 | @ | Novell, Inc. | 9,788 | |||||||
| 26,300 | @ | Oracle Corp. | 360,835 | |||||||
| 1,100 | @ | PeopleSoft, Inc. | 29,128 | |||||||
114
| Shares | Value | |||||||||
| Software (continued) | ||||||||||
| 1,740 | @ | Siebel Systems, Inc. | $ | 18,270 | ||||||
| 1,500 | @ | Veritas Software Corp. | 42,825 | |||||||
| 1,795,579 | ||||||||||
| Telecommunications: 1.4% | ||||||||||
| 1,300 | Alltel Corp. | 76,388 | ||||||||
| 920 | AT&T Corp. | 17,535 | ||||||||
| 1,500 | @ | Avaya, Inc. | 25,800 | |||||||
| 5,500 | BellSouth Corp. | 152,845 | ||||||||
| 600 | CenturyTel, Inc. | 21,282 | ||||||||
| 19,950 | @ | Cisco Systems, Inc. | 385,034 | |||||||
| 1,150 | Citizens Communications Co. | 15,859 | ||||||||
| 1,000 | @ | Comverse Technology, Inc. | 24,450 | |||||||
| 1,600 | @ | Corning, Inc. | 18,832 | |||||||
| 12,350 | @ | Lucent Technologies, Inc. | 46,436 | |||||||
| 7,050 | Motorola, Inc. | 121,260 | ||||||||
| 3,300 | @ | Nextel Communications, Inc. | 99,000 | |||||||
| 4,700 | QUALCOMM, Inc. | 199,280 | ||||||||
| 2,200 | @ | Qwest Communications Intl., Inc. | 9,768 | |||||||
| 10,050 | SBC Communications, Inc. | 258,988 | ||||||||
| 700 | Scientific-Atlanta, Inc. | 23,107 | ||||||||
| 4,350 | Sprint Corp. | 108,098 | ||||||||
| 1,350 | @ | Tellabs, Inc. | 11,597 | |||||||
| 11,100 | Verizon Communications, Inc. | 449,660 | ||||||||
| 2,065,219 | ||||||||||
| Textiles: 0.0% | ||||||||||
| 600 | Cintas Corp. | 26,316 | ||||||||
| 26,316 | ||||||||||
| Toys/ Games/ Hobbies: 0.0% | ||||||||||
| 950 | Hasbro, Inc. | 18,411 | ||||||||
| 1,550 | Mattel, Inc. | 30,210 | ||||||||
| 48,621 | ||||||||||
| Transportation: 0.4% | ||||||||||
| 1,300 | Burlington Northern Santa Fe Corp. | 61,503 | ||||||||
| 650 | CSX Corp. | 26,052 | ||||||||
| 1,500 | FedEx Corp. | 147,735 | ||||||||
| 1,550 | Norfolk Southern Corp. | 56,095 | ||||||||
| 200 | Ryder System, Inc. | 9,554 | ||||||||
| 3,400 | United Parcel Service, Inc. | 290,564 | ||||||||
| 591,503 | ||||||||||
| Total Common Stock (Cost $31,222,655) | 35,626,939 | |||||||||
| Principal | ||||||||||
| Amount | Value | |||||||||
| U.S. GOVERNMENT AGENCY OBLIGATIONS: 55.7% | ||||||||||
| Federal National Mortgage Association: 47.1% | ||||||||||
| $ | 67,000,000 | 3.560%, due 06/15/07 | $ | 61,543,654 | ||||||
| 6,250,000 | 3.520%, due 07/15/07 | 5,730,556 | ||||||||
| 2,000,000 | 3.570%, due 09/15/07 | 1,821,486 | ||||||||
| 69,095,696 | ||||||||||
| Other: 8.6% | ||||||||||
| 3,720,000 | FICO STRIP, 3.460%, due 06/06/07 | 3,428,036 | ||||||||
| 7,558,000 | FICO STRIP, 3.590%, due 12/06/07 | 6,829,650 | ||||||||
| 2,653,000 | FICO STRIP, 3.600%, due 12/27/07 | 2,392,176 | ||||||||
| 12,649,862 | ||||||||||
| Total U.S. Government Agency Obligations (Cost $80,351,136) | 81,745,558 | |||||||||
| U.S. TREASURY OBLIGATIONS: 11.7% | ||||||||||
| U.S. Treasury STRIP: 11.7% | ||||||||||
| 18,510,000 | United States Treasury STRIP Principal, 3.180%, due 05/15/07 | 17,186,239 | ||||||||
| Total U.S. Treasury Obligations (Cost $17,218,245) | 17,186,239 | |||||||||
| OTHER BONDS: 7.6% | ||||||||||
| Sovereign: 7.6% | ||||||||||
| 9,063,000 | Israel Trust, 3.780%, due 11/15/07 | 8,163,443 | ||||||||
| 3,185,000 | Turkey Trust, 3.640%, due 05/15/07 | 2,929,136 | ||||||||
| Total Other Bonds (Cost $11,092,651) | 11,092,579 | |||||||||
| Total Long-Term Investments (Cost $139,884,687) | 145,651,315 | |||||||||
| SHORT-TERM INVESTMENTS: 0.8% | ||||||||||
| Repurchase Agreement: 0.8% | ||||||||||
| 1,226,000 | Morgan Stanley Repurchase Agreement dated 12/31/04, 2.2000% due 01/03/05, $1,226,225 to be received upon repurchase (Collateralized by $1,140,000 Federal Home Loan Bank, 5.750%, Market Value plus accrued interest $1,253,472, due 05/15/12) | 1,226,000 | ||||||||
| Total Short-Term Investments (Cost $1,226,000) | 1,226,000 | |||||||||
Total Investments In Securities (Cost $141,110,687)* | 100.1 | % | $ | 146,877,315 | ||||||||
Other Assets and Liabilities-Net | (0.1 | ) | (111,730 | ) | ||||||||
Net Assets | 100.0 | % | $ | 146,765,585 | ||||||||
| @ | Non-income producing security | |
| @@ | Foreign issuer | |
| STRIP | Separate Trading of Registered Interest and Principal of Securities | |
| * | Cost for federal income tax purposes is $141,850,875. Net unrealized depreciation consists of: |
| Gross Unrealized Appreciation | $ | 5,776,968 | ||
| Gross Unrealized Depreciation | (750,528 | ) | ||
| Net Unrealized Appreciation | $ | 5,026,440 | ||
115
| Shares | Value | |||||||||
| COMMON STOCK: 25.5% | ||||||||||
| Advertising: 0.0% | ||||||||||
| 650 | @ | Interpublic Group of Cos., Inc. | $ | 8,710 | ||||||
| 950 | Omnicom Group, Inc. | 80,104 | ||||||||
| 88,814 | ||||||||||
| Aerospace/ Defense: 0.6% | ||||||||||
| 6,000 | Boeing Co. | 310,619 | ||||||||
| 1,400 | General Dynamics Corp. | 146,440 | ||||||||
| 450 | Goodrich Corp. | 14,688 | ||||||||
| 450 | L-3 Communications Holdings, Inc. | 32,958 | ||||||||
| 2,650 | Lockheed Martin Corp. | 147,208 | ||||||||
| 1,600 | Northrop Grumman Corp. | 86,976 | ||||||||
| 3,400 | Raytheon Co. | 132,022 | ||||||||
| 780 | Rockwell Collins, Inc. | 30,763 | ||||||||
| 2,150 | United Technologies Corp. | 222,203 | ||||||||
| 1,123,877 | ||||||||||
| Agriculture: 0.4% | ||||||||||
| 8,900 | Altria Group, Inc. | 543,790 | ||||||||
| 2,750 | Archer-Daniels-Midland Co. | 61,353 | ||||||||
| 1,500 | Monsanto Co. | 83,325 | ||||||||
| 800 | Reynolds American, Inc. | 62,880 | ||||||||
| 1,300 | UST, Inc. | 62,543 | ||||||||
| 813,891 | ||||||||||
| Apparel: 0.2% | ||||||||||
| 1,100 | @ | Coach, Inc. | 62,040 | |||||||
| 510 | Jones Apparel Group, Inc. | 18,651 | ||||||||
| 460 | Liz Claiborne, Inc. | 19,417 | ||||||||
| 1,900 | Nike, Inc. | 172,310 | ||||||||
| 400 | Reebok Intl., Ltd. | 17,600 | ||||||||
| 750 | VF Corp. | 41,535 | ||||||||
| 331,553 | ||||||||||
| Auto Manufacturers: 0.2% | ||||||||||
| 13,100 | Ford Motor Co. | 191,784 | ||||||||
| 2,500 | General Motors Corp. | 100,150 | ||||||||
| 1,015 | PACCAR, Inc. | 81,687 | ||||||||
| 373,621 | ||||||||||
| Auto Parts and Equipment: 0.0% | ||||||||||
| 950 | Johnson Controls, Inc. | 60,268 | ||||||||
| 60,268 | ||||||||||
| Banks: 1.5% | ||||||||||
| 2,000 | AmSouth Bancorporation | 51,800 | ||||||||
| 17,608 | Bank of America Corp. | 827,399 | ||||||||
| 2,350 | BB&T Corp. | 98,818 | ||||||||
| 950 | Comerica, Inc. | 57,969 | ||||||||
| 500 | Compass Bancshares, Inc. | 24,335 | ||||||||
| 1,000 | Fifth Third Bancorp | 47,280 | ||||||||
| 650 | First Horizon National Corp. | 28,022 | ||||||||
| 850 | Huntington Bancshares, Inc. | 21,063 | ||||||||
| 2,250 | KeyCorp | 76,275 | ||||||||
| 600 | M & T Bank Corp. | 64,704 | ||||||||
| 1,050 | Marshall & Ilsley Corp. | 46,410 | ||||||||
| 2,000 | Mellon Financial Corp. | 62,220 | ||||||||
| 4,000 | National City Corp. | 150,200 | ||||||||
| 1,975 | North Fork Bancorporation, Inc. | 56,979 | ||||||||
| 1,000 | Northern Trust Corp. | 48,580 | ||||||||
| 500 | PNC Financial Services Group, Inc. | 28,720 | ||||||||
| 2,008 | Regions Financial Corp. | 71,465 | ||||||||
| 1,400 | State Street Corp. | 68,768 | ||||||||
| 1,550 | SunTrust Banks, Inc. | 114,514 | ||||||||
| 550 | Synovus Financial Corp. | 15,719 | ||||||||
| 3,350 | The Bank of New York Co., Inc. | 111,957 | ||||||||
| 8,150 | U.S. Bancorp | 255,258 | ||||||||
| 7,024 | Wachovia Corp. | 369,461 | ||||||||
| 7,300 | Wells Fargo & Co. | 453,694 | ||||||||
| 150 | Zions Bancorporation | 10,205 | ||||||||
| 3,161,815 | ||||||||||
| Beverages: 0.6% | ||||||||||
| 250 | Adolph Coors Co. | 18,918 | ||||||||
| 1,400 | Anheuser-Busch Cos., Inc. | 71,022 | ||||||||
| 600 | Brown-Forman Corp. | 29,208 | ||||||||
| 10,550 | Coca-Cola Co. | 439,197 | ||||||||
| 2,450 | Coca-Cola Enterprises, Inc. | 51,083 | ||||||||
| 1,050 | Pepsi Bottling Group, Inc. | 28,392 | ||||||||
| 10,000 | PepsiCo, Inc. | 521,999 | ||||||||
| 1,159,819 | ||||||||||
| Biotechnology: 0.3% | ||||||||||
| 5,600 | @ | Amgen, Inc. | 359,240 | |||||||
| 1,400 | @ | Biogen Idec, Inc. | 93,254 | |||||||
| 1,000 | @ | Genzyme Corp. | 58,070 | |||||||
| 1,050 | @ | MedImmune, Inc. | 28,466 | |||||||
| 300 | @ | Millipore Corp. | 14,943 | |||||||
| 553,973 | ||||||||||
| Building Materials: 0.1% | ||||||||||
| 950 | @ | American Standard Cos., Inc. | 39,254 | |||||||
| 1,850 | Masco Corp. | 67,581 | ||||||||
| 700 | Vulcan Materials Co. | 38,227 | ||||||||
| 145,062 | ||||||||||
| Chemicals: 0.4% | ||||||||||
| 1,000 | Air Products & Chemicals, Inc. | 57,970 | ||||||||
| 400 | Ashland, Inc. | 23,352 | ||||||||
| 4,250 | Dow Chemical Co. | 210,417 | ||||||||
| 4,750 | E.I. du Pont de Nemours & Co. | 232,987 | ||||||||
| 450 | Eastman Chemical Co. | 25,979 | ||||||||
| 500 | Ecolab, Inc. | 17,565 | ||||||||
| 700 | Engelhard Corp. | 21,469 | ||||||||
| 400 | International Flavors & Fragrances, Inc. | 17,136 | ||||||||
| 1,400 | PPG Industries, Inc. | 95,424 | ||||||||
| 1,450 | Praxair, Inc. | 64,018 | ||||||||
| 1,200 | Rohm & Haas Co. | 53,076 | ||||||||
| 750 | Sherwin-Williams Co. | 33,473 | ||||||||
| 450 | Sigma-Aldrich Corp. | 27,207 | ||||||||
| 880,073 | ||||||||||
| Commercial Services: 0.2% | ||||||||||
| 850 | @ | Apollo Group, Inc. | 68,604 | |||||||
| 4,600 | Cendant Corp. | 107,547 | ||||||||
| 700 | Equifax, Inc. | 19,670 | ||||||||
| 1,080 | H&R Block, Inc. | 52,920 | ||||||||
| 1,500 | McKesson Corp. | 47,190 | ||||||||
| 750 | Moody’s Corp. | 65,138 | ||||||||
| 1,600 | Paychex, Inc. | 54,528 | ||||||||
| 700 | R.R. Donnelley & Sons Co. | 24,703 | ||||||||
| 650 | Robert Half Intl., Inc. | 19,130 | ||||||||
| 459,430 | ||||||||||
| Computers: 1.4% | ||||||||||
| 550 | @ | Affiliated Computer Services, Inc. | 33,105 | |||||||
| 2,800 | @ | Apple Computer, Inc. | 180,320 | |||||||
| 1,000 | @ | Computer Sciences Corp. | 56,370 | |||||||
| 18,450 | @ | Dell, Inc. | 777,482 | |||||||
| 2,300 | Electronic Data Systems Corp. | 53,130 | ||||||||
| 10,250 | @ | EMC Corp. | 152,418 | |||||||
| 1,800 | @ | Gateway, Inc. | 10,818 | |||||||
| 12,750 | Hewlett-Packard Co. | 267,367 | ||||||||
| 9,800 | International Business Machines Corp. | 966,083 | ||||||||
| 540 | @ | Lexmark Intl., Inc. | 45,900 | |||||||
| 450 | @ | NCR Corp. | 31,154 | |||||||
116
| Shares | Value | |||||||||
| Computers (continued) | ||||||||||
| 1,800 | @ | Network Appliance, Inc. | $ | 59,796 | ||||||
| 25,100 | @ | Sun Microsystems, Inc. | 135,038 | |||||||
| 1,550 | @ | Sungard Data Systems, Inc. | 43,912 | |||||||
| 1,850 | @ | Unisys Corp. | 18,833 | |||||||
| 2,831,726 | ||||||||||
| Cosmetics/ Personal Care: 0.8% | ||||||||||
| 450 | Alberto-Culver Co. | 21,857 | ||||||||
| 800 | Avon Products, Inc. | 30,960 | ||||||||
| 2,250 | Colgate-Palmolive Co. | 115,110 | ||||||||
| 7,400 | Gillette Co. | 331,372 | ||||||||
| 2,150 | Kimberly-Clark Corp. | 141,492 | ||||||||
| 19,000 | Procter & Gamble Co. | 1,046,519 | ||||||||
| 1,687,310 | ||||||||||
| Distribution/ Wholesale: 0.1% | ||||||||||
| 1,350 | Genuine Parts Co. | 59,481 | ||||||||
| 700 | W.W. Grainger, Inc. | 46,634 | ||||||||
| 106,115 | ||||||||||
| Diversified Financial Services: 1.8% | ||||||||||
| 7,450 | American Express Co. | 419,957 | ||||||||
| 520 | Bear Stearns Cos., Inc. | 53,201 | ||||||||
| 1,820 | Capital One Financial Corp. | 153,262 | ||||||||
| 1,250 | CIT Group, Inc. | 57,275 | ||||||||
| 22,800 | Citigroup, Inc. | 1,098,503 | ||||||||
| 2,448 | Countrywide Financial Corp. | 90,600 | ||||||||
| 2,000 | @ | E*TRADE Financial Corp. | 29,900 | |||||||
| 4,190 | Fannie Mae | 298,370 | ||||||||
| 600 | Federated Investors, Inc. | 18,240 | ||||||||
| 1,100 | Franklin Resources, Inc. | 76,615 | ||||||||
| 2,890 | Freddie Mac | 212,993 | ||||||||
| 2,000 | Goldman Sachs Group, Inc. | 208,080 | ||||||||
| 1,300 | Janus Capital Group, Inc. | 21,853 | ||||||||
| 1,600 | Lehman Brothers Holdings, Inc. | 139,968 | ||||||||
| 5,400 | MBNA Corp. | 152,226 | ||||||||
| 4,000 | Merrill Lynch & Co., Inc. | 239,080 | ||||||||
| 4,800 | Morgan Stanley | 266,496 | ||||||||
| 2,100 | @ | Providian Financial Corp. | 34,587 | |||||||
| 2,100 | SLM Corp. | 112,119 | ||||||||
| 550 | T. Rowe Price Group, Inc. | 34,210 | ||||||||
| 3,717,535 | ||||||||||
| Electric: 0.6% | ||||||||||
| 3,500 | @ | AES Corp. | 47,845 | |||||||
| 350 | Ameren Corp. | 17,549 | ||||||||
| 1,700 | American Electric Power Co., Inc. | 58,378 | ||||||||
| 300 | Cinergy Corp. | 12,489 | ||||||||
| 1,300 | Consolidated Edison, Inc. | 56,875 | ||||||||
| 800 | Constellation Energy Group, Inc. | 34,968 | ||||||||
| 550 | Dominion Resources, Inc. | 37,257 | ||||||||
| 950 | DTE Energy Co. | 40,974 | ||||||||
| 7,000 | Duke Energy Corp. | 177,309 | ||||||||
| 1,440 | Edison Intl. | 46,123 | ||||||||
| 1,000 | Entergy Corp. | 67,590 | ||||||||
| 2,750 | Exelon Corp. | 121,192 | ||||||||
| 1,700 | FirstEnergy Corp. | 67,167 | ||||||||
| 750 | FPL Group, Inc. | 56,063 | ||||||||
| 2,200 | @ | PG&E Corp. | 73,216 | |||||||
| 550 | Pinnacle West Capital Corp. | 24,426 | ||||||||
| 1,300 | PPL Corp. | 69,264 | ||||||||
| 1,050 | Public Service Enterprise Group, Inc. | 54,359 | ||||||||
| 3,250 | Southern Co. | 108,940 | ||||||||
| 1,750 | TXU Corp. | 112,980 | ||||||||
| 1,750 | Xcel Energy, Inc. | 31,850 | ||||||||
| 1,316,814 | ||||||||||
| Electrical Components and Equipment: 0.1% | ||||||||||
| 2,450 | Emerson Electric Co. | 171,745 | ||||||||
| 171,745 | ||||||||||
| Electronics: 0.2% | ||||||||||
| 2,350 | @ | Agilent Technologies, Inc. | 56,634 | |||||||
| 850 | Applera Corp. — Applied Biosystems Group | 17,774 | ||||||||
| 650 | @ | Fisher Scientific Intl. | 40,547 | |||||||
| 890 | @ | Jabil Circuit, Inc. | 22,766 | |||||||
| 550 | Parker Hannifin Corp. | 41,657 | ||||||||
| 950 | PerkinElmer, Inc. | 21,366 | ||||||||
| 2,000 | @ | Sanmina-SCI Corp. | 16,940 | |||||||
| 4,000 | @ | Solectron Corp. | 21,320 | |||||||
| 500 | Tektronix, Inc. | 15,105 | ||||||||
| 900 | @ | Thermo Electron Corp. | 27,171 | |||||||
| 650 | @ | Waters Corp. | 30,414 | |||||||
| 311,694 | ||||||||||
| Engineering and Construction: 0.0% | ||||||||||
| 400 | Fluor Corp. | 21,804 | ||||||||
| 21,804 | ||||||||||
| Entertainment: 0.0% | ||||||||||
| 1,500 | International Game Technology | 51,570 | ||||||||
| 51,570 | ||||||||||
| Environmental Control: 0.0% | ||||||||||
| 2,500 | Waste Management, Inc. | 74,850 | ||||||||
| 74,850 | ||||||||||
| Food: 0.4% | ||||||||||
| 1,700 | Albertson’s, Inc. | 40,596 | ||||||||
| 1,800 | Campbell Soup Co. | 53,802 | ||||||||
| 2,650 | ConAgra Foods, Inc. | 78,043 | ||||||||
| 1,900 | General Mills, Inc. | 94,449 | ||||||||
| 1,750 | H.J. Heinz Co. | 68,233 | ||||||||
| 1,050 | Hershey Foods Corp. | 58,317 | ||||||||
| 1,900 | Kellogg Co. | 84,854 | ||||||||
| 1,500 | @ | Kroger Co. | 26,310 | |||||||
| 750 | McCormick & Co., Inc. | 28,950 | ||||||||
| 2,050 | @ | Safeway, Inc. | 40,467 | |||||||
| 4,000 | Sara Lee Corp. | 96,560 | ||||||||
| 850 | SUPERVALU, Inc. | 29,342 | ||||||||
| 1,650 | Wm. Wrigley Jr. Co. | 114,163 | ||||||||
| 814,086 | ||||||||||
| Forest Products and Paper: 0.2% | ||||||||||
| 1,150 | Georgia-Pacific Corp. | 43,102 | ||||||||
| 2,200 | International Paper Co. | 92,400 | ||||||||
| 690 | Louisiana-Pacific Corp. | 18,451 | ||||||||
| 1,000 | MeadWestvaco Corp. | 33,890 | ||||||||
| 800 | Plum Creek Timber Co., Inc. | 30,752 | ||||||||
| 300 | Temple-Inland, Inc. | 20,520 | ||||||||
| 1,550 | Weyerhaeuser Co. | 104,191 | ||||||||
| 343,306 | ||||||||||
| Gas: 0.0% | ||||||||||
| 950 | KeySpan Corp. | 37,478 | ||||||||
| 990 | Sempra Energy | 36,313 | ||||||||
| 73,791 | ||||||||||
| Hand/ Machine Tools: 0.0% | ||||||||||
| 620 | Black & Decker Corp. | 54,765 | ||||||||
| 200 | Snap-On, Inc. | 6,872 | ||||||||
| 500 | Stanley Works | 24,495 | ||||||||
| 86,132 | ||||||||||
| Healthcare — Products: 1.1% | ||||||||||
| 300 | Bausch & Lomb, Inc. | 19,338 | ||||||||
| 1,050 | Baxter Intl., Inc. | 36,267 | ||||||||
117
| Shares | Value | |||||||||
| Healthcare — Products (continued) | ||||||||||
| 1,880 | Becton Dickinson & Co. | $ | 106,784 | |||||||
| 1,350 | Biomet, Inc. | 58,577 | ||||||||
| 3,500 | @ | Boston Scientific Corp. | 124,425 | |||||||
| 600 | C.R. Bard, Inc. | 38,388 | ||||||||
| 530 | Guidant Corp. | 38,213 | ||||||||
| 21,950 | Johnson & Johnson | 1,392,068 | ||||||||
| 5,100 | Medtronic, Inc. | 253,317 | ||||||||
| 1,800 | @ | St. Jude Medical, Inc. | 75,474 | |||||||
| 700 | Stryker Corp. | 33,775 | ||||||||
| 1,100 | @ | Zimmer Holdings, Inc. | 88,132 | |||||||
| 2,264,758 | ||||||||||
| Healthcare — Services: 0.5% | ||||||||||
| 1,160 | Aetna, Inc. | 144,710 | ||||||||
| 1,100 | @ | Humana, Inc. | 32,659 | |||||||
| 600 | @ | Laboratory Corp. Of America Holdings | 29,892 | |||||||
| 500 | Manor Care, Inc. | 17,715 | ||||||||
| 450 | Quest Diagnostics, Inc. | 42,998 | ||||||||
| 4,850 | UnitedHealth Group, Inc. | 426,945 | ||||||||
| 2,150 | @ | WellPoint, Inc. | 247,250 | |||||||
| 942,169 | ||||||||||
| Home Builders: 0.0% | ||||||||||
| 200 | Centex Corp. | 11,916 | ||||||||
| 11,916 | ||||||||||
| Home Furnishings: 0.0% | ||||||||||
| 1,100 | Leggett & Platt, Inc. | 31,273 | ||||||||
| 300 | Whirlpool Corp. | 20,763 | ||||||||
| 52,036 | ||||||||||
| Household Products/ Wares: 0.1% | ||||||||||
| 550 | Avery Dennison Corp. | 32,984 | ||||||||
| 1,000 | Clorox Co. | 58,930 | ||||||||
| 800 | Fortune Brands, Inc. | 61,744 | ||||||||
| 153,658 | ||||||||||
| Housewares: 0.0% | ||||||||||
| 1,250 | Newell Rubbermaid, Inc. | 30,238 | ||||||||
| 30,238 | ||||||||||
| Insurance: 1.2% | ||||||||||
| 1,300 | @@ | ACE Ltd. | 55,575 | |||||||
| 2,200 | AFLAC, Inc. | 87,648 | ||||||||
| 3,000 | Allstate Corp. | 155,160 | ||||||||
| 450 | AMBAC Financial Group, Inc. | 36,959 | ||||||||
| 11,400 | American Intl. Group, Inc. | 748,637 | ||||||||
| 1,550 | AON Corp. | 36,983 | ||||||||
| 1,250 | Chubb Corp. | 96,125 | ||||||||
| 960 | CIGNA Corp. | 78,307 | ||||||||
| 840 | Cincinnati Financial Corp. | 37,178 | ||||||||
| 1,650 | Hartford Financial Services Group, Inc. | 114,362 | ||||||||
| 750 | Jefferson-Pilot Corp. | 38,970 | ||||||||
| 800 | Lincoln National Corp. | 37,344 | ||||||||
| 1,450 | Loews Corp. | 101,935 | ||||||||
| 900 | Marsh & McLennan Cos., Inc. | 29,610 | ||||||||
| 800 | MBIA, Inc. | 50,624 | ||||||||
| 3,250 | MetLife, Inc. | 131,658 | ||||||||
| 500 | MGIC Investment Corp. | 34,455 | ||||||||
| 1,400 | Principal Financial Group | 57,316 | ||||||||
| 900 | Progressive Corp. | 76,356 | ||||||||
| 3,850 | Prudential Financial, Inc. | 211,595 | ||||||||
| 900 | Safeco Corp. | 47,016 | ||||||||
| 1,150 | St. Paul Travelers Cos., Inc. | 42,631 | ||||||||
| 500 | Torchmark Corp. | 28,570 | ||||||||
| 1,400 | UnumProvident Corp. | 25,116 | ||||||||
| 600 | @@ | XL Capital Ltd. | 46,590 | |||||||
| 2,406,720 | ||||||||||
| Internet: 0.3% | ||||||||||
| 2,750 | @ | eBay, Inc. | 319,770 | |||||||
| 4,400 | @ | Symantec Corp. | 113,344 | |||||||
| 5,650 | @ | Yahoo!, Inc. | 212,892 | |||||||
| 646,006 | ||||||||||
| Iron/ Steel: 0.0% | ||||||||||
| 800 | Nucor Corp. | 41,872 | ||||||||
| 700 | United States Steel Corp. | 35,875 | ||||||||
| 77,747 | ||||||||||
| Leisure Time: 0.1% | ||||||||||
| 550 | Brunswick Corp. | 27,225 | ||||||||
| 2,650 | Carnival Corp. | 152,720 | ||||||||
| 1,300 | Harley-Davidson, Inc. | 78,975 | ||||||||
| 750 | Sabre Holdings Corp. | 16,620 | ||||||||
| 275,540 | ||||||||||
| Lodging: 0.1% | ||||||||||
| 530 | Harrah’s Entertainment, Inc. | 35,452 | ||||||||
| 1,850 | Hilton Hotels Corp. | 42,069 | ||||||||
| 1,200 | Marriott Intl., Inc. | 75,576 | ||||||||
| 1,000 | Starwood Hotels & Resorts Worldwide, Inc. | 58,400 | ||||||||
| 211,497 | ||||||||||
| Machinery — Construction and Mining: 0.0% | ||||||||||
| 600 | Caterpillar, Inc. | 58,506 | ||||||||
| 58,506 | ||||||||||
| Machinery — Diversified: 0.1% | ||||||||||
| 250 | Cummins, Inc. | 20,948 | ||||||||
| 1,050 | Deere & Co. | 78,120 | ||||||||
| 900 | Rockwell Automation, Inc. | 44,595 | ||||||||
| 143,663 | ||||||||||
| Media: 0.9% | ||||||||||
| 9,600 | @ | Comcast Corp. | 319,488 | |||||||
| 1,100 | Gannett Co., Inc. | 89,870 | ||||||||
| 150 | Knight-Ridder, Inc. | 10,041 | ||||||||
| 1,400 | McGraw-Hill Cos., Inc. | 128,156 | ||||||||
| 340 | Meredith Corp. | 18,428 | ||||||||
| 750 | New York Times Co. | 30,600 | ||||||||
| 11,550 | News Corp. | 215,523 | ||||||||
| 20,100 | @ | Time Warner, Inc. | 390,743 | |||||||
| 550 | Tribune Co. | 23,177 | ||||||||
| 7,550 | Viacom, Inc. | 274,745 | ||||||||
| 8,500 | Walt Disney Co. | 236,300 | ||||||||
| 1,737,071 | ||||||||||
| Mining: 0.0% | ||||||||||
| 600 | Phelps Dodge Corp. | 59,352 | ||||||||
| 59,352 | ||||||||||
| Miscellaneous Manufacturing: 1.4% | ||||||||||
| 3,350 | 3M Co. | 274,935 | ||||||||
| 500 | Cooper Industries Ltd. | 33,945 | ||||||||
| 1,300 | Danaher Corp. | 74,633 | ||||||||
| 350 | Dover Corp. | 14,679 | ||||||||
| 1,410 | Eastman Kodak Co. | 45,473 | ||||||||
| 750 | Eaton Corp. | 54,270 | ||||||||
| 46,600 | General Electric Co. | 1,700,899 | ||||||||
| 3,550 | Honeywell Intl., Inc. | 125,706 | ||||||||
| 1,250 | Illinois Tool Works, Inc. | 115,850 | ||||||||
| 850 | @@ | Ingersoll-Rand Co. | 68,255 | |||||||
| 400 | ITT Industries, Inc. | 33,780 | ||||||||
| 600 | Pall Corp. | 17,370 | ||||||||
| 820 | Textron, Inc. | 60,516 | ||||||||
| 8,700 | @@ | Tyco Intl., Ltd. | 310,937 | |||||||
| 2,931,248 | ||||||||||
118
| Shares | Value | |||||||||
| Office/ Business Equipment: 0.1% | ||||||||||
| 950 | Pitney Bowes, Inc. | $ | 43,966 | |||||||
| 5,600 | @ | Xerox Corp. | 95,256 | |||||||
| 139,222 | ||||||||||
| Oil and Gas: 2.0% | ||||||||||
| 670 | Amerada Hess Corp. | 55,195 | ||||||||
| 1,350 | Anadarko Petroleum Corp. | 87,494 | ||||||||
| 1,222 | Apache Corp. | 61,797 | ||||||||
| 2,900 | Burlington Resources, Inc. | 126,150 | ||||||||
| 11,850 | ChevronTexaco Corp. | 622,243 | ||||||||
| 4,850 | ConocoPhillips | 421,125 | ||||||||
| 3,400 | Devon Energy Corp. | 132,327 | ||||||||
| 600 | EOG Resources, Inc. | 42,816 | ||||||||
| 36,400 | Exxon Mobil Corp. | 1,865,863 | ||||||||
| 500 | Kerr-McGee Corp. | 28,895 | ||||||||
| 1,700 | Marathon Oil Corp. | 63,937 | ||||||||
| 300 | @,@@ | Nabors Industries, Ltd. | 15,387 | |||||||
| 700 | @ | Noble Corp. | 34,818 | |||||||
| 1,510 | Occidental Petroleum Corp. | 88,124 | ||||||||
| 550 | Sunoco, Inc. | 44,941 | ||||||||
| 1,200 | @ | Transocean, Inc. | 50,868 | |||||||
| 1,050 | Unocal Corp. | 45,402 | ||||||||
| 1,700 | Valero Energy Corp. | 77,180 | ||||||||
| 3,864,562 | ||||||||||
| Oil and Gas Services: 0.1% | ||||||||||
| 1,400 | Baker Hughes, Inc. | 59,738 | ||||||||
| 750 | BJ Services Co. | 34,905 | ||||||||
| 1,750 | Halliburton Co. | 68,670 | ||||||||
| 163,313 | ||||||||||
| Packaging and Containers: 0.0% | ||||||||||
| 860 | Ball Corp. | 37,822 | ||||||||
| 800 | Bemis Co. | 23,272 | ||||||||
| 550 | @ | Pactiv Corp. | 13,910 | |||||||
| 350 | @ | Sealed Air Corp. | 18,645 | |||||||
| 93,649 | ||||||||||
| Pharmaceuticals: 1.4% | ||||||||||
| 6,650 | Abbott Laboratories | 310,222 | ||||||||
| 650 | Allergan, Inc. | 52,696 | ||||||||
| 550 | AmerisourceBergen Corp. | 32,274 | ||||||||
| 8,250 | Bristol-Myers Squibb Co. | 211,365 | ||||||||
| 2,500 | Cardinal Health, Inc. | 145,375 | ||||||||
| 3,400 | @ | Caremark Rx, Inc. | 134,062 | |||||||
| 2,000 | Eli Lilly & Co. | 113,500 | ||||||||
| 400 | @ | Express Scripts, Inc. | 30,576 | |||||||
| 1,800 | @ | Forest Laboratories, Inc. | 80,748 | |||||||
| 1,900 | @ | Gilead Sciences, Inc. | 66,481 | |||||||
| 800 | @ | Hospira, Inc. | 26,800 | |||||||
| 1,500 | @ | King Pharmaceuticals, Inc. | 18,600 | |||||||
| 1,246 | @ | Medco Health Solutions, Inc. | 51,834 | |||||||
| 9,600 | Merck & Co., Inc. | 308,544 | ||||||||
| 32,990 | Pfizer, Inc. | 887,100 | ||||||||
| 6,250 | Schering-Plough Corp. | 130,500 | ||||||||
| 5,500 | Wyeth | 234,245 | ||||||||
| 2,834,922 | ||||||||||
| Pipelines: 0.0% | ||||||||||
| 2,400 | El Paso Corp. | 24,960 | ||||||||
| 200 | Kinder Morgan, Inc. | 14,626 | ||||||||
| 2,650 | Williams Cos., Inc. | 43,169 | ||||||||
| 82,755 | ||||||||||
| Real Estate Investment Trusts: 0.1% | ||||||||||
| 700 | Equity Office Properties Trust | 20,384 | ||||||||
| 750 | ProLogis | 32,498 | ||||||||
| 900 | Simon Property Group, Inc. | 58,203 | ||||||||
| 111,085 | ||||||||||
| Retail: 2.0% | ||||||||||
| 1,550 | @ | Bed Bath & Beyond, Inc. | 61,737 | |||||||
| 1,600 | Best Buy Co., Inc. | 95,072 | ||||||||
| 1,500 | Circuit City Stores, Inc. | 23,460 | ||||||||
| 3,150 | Costco Wholesale Corp. | 152,492 | ||||||||
| 2,000 | CVS Corp. | 90,140 | ||||||||
| 900 | Darden Restaurants, Inc. | 24,966 | ||||||||
| 750 | Federated Department Stores, Inc. | 43,343 | ||||||||
| 5,180 | Gap, Inc. | 109,402 | ||||||||
| 16,200 | Home Depot, Inc. | 692,387 | ||||||||
| 2,000 | J.C. Penney Co., Inc. Holding Co. | 82,800 | ||||||||
| 600 | @ | Kohl’s Corp. | 29,502 | |||||||
| 2,500 | Limited Brands, Inc. | 57,550 | ||||||||
| 3,220 | Lowe’s Cos., Inc. | 185,439 | ||||||||
| 1,150 | May Department Stores Co. | 33,810 | ||||||||
| 9,450 | McDonald’s Corp. | 302,966 | ||||||||
| 750 | Nordstrom, Inc. | 35,048 | ||||||||
| 1,990 | @ | Office Depot, Inc. | 34,546 | |||||||
| 1,090 | RadioShack Corp. | 35,839 | ||||||||
| 3,770 | Staples, Inc. | 127,087 | ||||||||
| 2,300 | @ | Starbucks Corp. | 143,428 | |||||||
| 3,850 | Target Corp. | 199,930 | ||||||||
| 2,450 | TJX Cos., Inc. | 61,569 | ||||||||
| 1,150 | @ | Toys R US, Inc. | 23,541 | |||||||
| 18,700 | Wal-Mart Stores, Inc. | 987,733 | ||||||||
| 4,450 | Walgreen Co. | 170,747 | ||||||||
| 900 | Wendy’s Intl., Inc. | 35,334 | ||||||||
| 1,450 | Yum! Brands, Inc. | 68,411 | ||||||||
| 3,908,279 | ||||||||||
| Savings and Loans: 0.1% | ||||||||||
| 1,220 | Golden West Financial Corp. | 74,932 | ||||||||
| 600 | Sovereign Bancorp, Inc. | 13,530 | ||||||||
| 3,650 | Washington Mutual, Inc. | 154,322 | ||||||||
| 242,784 | ||||||||||
| Semiconductors: 0.6% | ||||||||||
| 1,500 | @ | Altera Corp. | 31,050 | |||||||
| 1,700 | Analog Devices, Inc. | 62,764 | ||||||||
| 7,000 | @ | Applied Materials, Inc. | 119,700 | |||||||
| 1,512 | @ | Freescale Semiconductor Inc. | 27,760 | |||||||
| 27,850 | Intel Corp. | 651,412 | ||||||||
| 850 | @ | KLA-Tencor Corp. | 39,593 | |||||||
| 1,600 | Linear Technology Corp. | 62,016 | ||||||||
| 600 | Maxim Integrated Products, Inc. | 25,434 | ||||||||
| 1,700 | National Semiconductor Corp. | 30,515 | ||||||||
| 3,000 | Texas Instruments, Inc. | 73,860 | ||||||||
| 1,124,104 | ||||||||||
| Software: 1.3% | ||||||||||
| 1,250 | Adobe Systems, Inc. | 78,425 | ||||||||
| 1,400 | Autodesk, Inc. | 53,130 | ||||||||
| 2,500 | Automatic Data Processing, Inc. | 110,874 | ||||||||
| 1,460 | @ | BMC Software, Inc. | 27,156 | |||||||
| 1,200 | @ | Citrix Systems, Inc. | 29,436 | |||||||
| 3,000 | Computer Associates Intl., Inc. | 93,180 | ||||||||
| 2,450 | @ | Compuware Corp. | 15,852 | |||||||
| 520 | @ | Electronic Arts, Inc. | 32,074 | |||||||
| 3,678 | First Data Corp. | 156,461 | ||||||||
| 900 | @ | Fiserv, Inc. | 36,171 | |||||||
| 1,550 | IMS Health, Inc. | 35,976 | ||||||||
| 950 | @ | Intuit, Inc. | 41,810 | |||||||
| 47,150 | Microsoft Corp. | 1,259,376 | ||||||||
| 1,350 | @ | Novell, Inc. | 9,113 | |||||||
| 38,350 | @ | Oracle Corp. | 526,161 | |||||||
| 1,500 | @ | PeopleSoft, Inc. | 39,720 | |||||||
119
| Shares | Value | |||||||||
| Software (continued) | ||||||||||
| 1,940 | @ | Siebel Systems, Inc. | $ | 20,370 | ||||||
| 2,100 | @ | Veritas Software Corp. | 59,955 | |||||||
| 2,625,240 | ||||||||||
| Telecommunications: 1.5% | ||||||||||
| 1,900 | Alltel Corp. | 111,644 | ||||||||
| 1,350 | AT&T Corp. | 25,731 | ||||||||
| 2,050 | @ | Avaya, Inc. | 35,260 | |||||||
| 8,000 | BellSouth Corp. | 222,320 | ||||||||
| 800 | CenturyTel, Inc. | 28,376 | ||||||||
| 29,100 | @ | Cisco Systems, Inc. | 561,629 | |||||||
| 1,300 | Citizens Communications Co. | 17,927 | ||||||||
| 1,200 | @ | Comverse Technology, Inc. | 29,340 | |||||||
| 2,350 | @ | Corning, Inc. | 27,660 | |||||||
| 17,950 | @ | Lucent Technologies, Inc. | 67,492 | |||||||
| 10,250 | Motorola, Inc. | 176,300 | ||||||||
| 4,800 | @ | Nextel Communications, Inc. | 144,000 | |||||||
| 6,800 | QUALCOMM, Inc. | 288,320 | ||||||||
| 3,200 | @ | Qwest Communications Intl., Inc. | 14,208 | |||||||
| 14,650 | SBC Communications, Inc. | 377,531 | ||||||||
| 1,050 | Scientific-Atlanta, Inc. | 34,661 | ||||||||
| 6,400 | Sprint Corp. | 159,040 | ||||||||
| 3,000 | @ | Tellabs, Inc. | 25,770 | |||||||
| 16,200 | Verizon Communications, Inc. | 656,261 | ||||||||
| 3,003,470 | ||||||||||
| Textiles: 0.0% | ||||||||||
| 800 | Cintas Corp. | 35,088 | ||||||||
| 35,088 | ||||||||||
| Toys/ Games/ Hobbies: 0.0% | ||||||||||
| 1,300 | Hasbro, Inc. | 25,194 | ||||||||
| 2,150 | Mattel, Inc. | 41,904 | ||||||||
| 67,098 | ||||||||||
| Transportation: 0.4% | ||||||||||
| 2,300 | Burlington Northern Santa Fe Corp. | 108,813 | ||||||||
| 950 | CSX Corp. | 38,076 | ||||||||
| 2,200 | FedEx Corp. | 216,678 | ||||||||
| 2,250 | Norfolk Southern Corp. | 81,428 | ||||||||
| 500 | Ryder System, Inc. | 23,885 | ||||||||
| 4,900 | United Parcel Service, Inc. | 418,754 | ||||||||
| 887,634 | ||||||||||
| Total Common Stock (Cost $45,491,897) | 51,946,004 | |||||||||
| Principal | ||||||||||
| Amount | Value | |||||||||
| U.S. GOVERNMENT AGENCY OBLIGATIONS: 58.1% | ||||||||||
| Federal Home Loan Bank: 17.8% | ||||||||||
| $ | 40,000,000 | 3.670%, due 09/14/07 | $ | 36,341,800 | ||||||
| 36,341,800 | ||||||||||
| Federal Home Loan Mortgage Corporation: 18.1% | ||||||||||
| 40,000,000 | 3.570%, due 09/14/07 | 36,433,760 | ||||||||
| 538,000 | 3.570%, due 09/15/07 | 489,980 | ||||||||
| 36,923,740 | ||||||||||
| Federal National Mortgage Association: 22.2% | ||||||||||
| 50,000,000 | 3.630%, due 09/14/07 | 45,470,500 | ||||||||
| 45,470,500 | ||||||||||
| Total U.S. Government Agency Obligations (Cost $119,426,832) | 118,736,040 | |||||||||
| U.S. TREASURY OBLIGATIONS: 10.6% | ||||||||||
| U.S. Treasury STRIP: 10.6% | ||||||||||
| 23,395,000 | 3.210%, due 08/15/07 | 21,535,636 | ||||||||
| Total U.S. Treasury Obligations (Cost $21,659,538) | 21,535,636 | |||||||||
| OTHER BONDS: 5.1% | ||||||||||
| Sovereign: 5.1% | ||||||||||
| 10,163,000 | Israel Trust, 3.780%, due 11/15/07 | 9,154,261 | ||||||||
| 1,450,000 | Turkey Trust, 3.780%, due 11/15/07 | 1,306,079 | ||||||||
| Total Other Bonds (Cost $10,627,704) | 10,460,340 | |||||||||
| Total Long-Term Investments (Cost $197,205,971) | 202,678,020 | |||||||||
| SHORT-TERM INVESTMENTS: 0.8% | ||||||||||
| Repurchase Agreement: 0.8% | ||||||||||
| 1,563,000 | Morgan Stanley Repurchase Agreement dated 12/31/04, 2.2000% due 01/03/05, $1,563,000 to be received upon repurchase (Collateralized by Federal Home Loan Mortgage Corporation, 0.000%, Market Value plus accrued interest $1,597,948, due 08/25/14) | 1,563,000 | ||||||||
| Total Short-Term Investments (Cost $1,563,000) | 1,563,000 | |||||||||
Total Investments In Securities (Cost $198,768,971)* | 100.1 | % | $ | 204,241,020 | ||||||||
Other Assets and Liabilities-Net | (0.1 | ) | (149,272 | ) | ||||||||
Net Assets | 100.0 | % | $ | 204,091,748 | ||||||||
| @ | Non-income producing security | |
| @@ | Foreign issuer | |
| STRIP | Separate Trading of Registered Interest and Principal of Securities | |
| * | Cost for federal income tax purposes is $199,348,893. Net unrealized depreciation consists of: |
| Gross Unrealized Appreciation | $ | 6,784,295 | ||
| Gross Unrealized Depreciation | (1,892,168 | ) | ||
| Net Unrealized Appreciation | $ | 4,892,127 | ||
120
| Shares | Value | |||||||||
| COMMON STOCK: 25.3% | ||||||||||
| Advertising: 0.0% | ||||||||||
| 550 | @ | Interpublic Group of Cos., Inc. | $ | 7,370 | ||||||
| 650 | Omnicom Group, Inc. | 54,808 | ||||||||
| 62,178 | ||||||||||
| Aerospace/Defense: 0.6% | ||||||||||
| 4,800 | Boeing Co. | 248,495 | ||||||||
| 1,200 | General Dynamics Corp. | 125,520 | ||||||||
| 400 | Goodrich Corp. | 13,056 | ||||||||
| 350 | L-3 Communications Holdings, Inc. | 25,634 | ||||||||
| 2,100 | Lockheed Martin Corp. | 116,655 | ||||||||
| 1,300 | Northrop Grumman Corp. | 70,668 | ||||||||
| 2,750 | Raytheon Co. | 106,783 | ||||||||
| 640 | Rockwell Collins, Inc. | 25,242 | ||||||||
| 1,750 | United Technologies Corp. | 180,863 | ||||||||
| 912,916 | ||||||||||
| Agriculture: 0.4% | ||||||||||
| 7,100 | Altria Group, Inc. | 433,809 | ||||||||
| 2,200 | Archer-Daniels-Midland Co. | 49,082 | ||||||||
| 850 | Monsanto Co. | 47,218 | ||||||||
| 650 | Reynolds American, Inc. | 51,090 | ||||||||
| 1,050 | UST, Inc. | 50,516 | ||||||||
| 631,715 | ||||||||||
| Apparel: 0.2% | ||||||||||
| 900 | @ | Coach, Inc. | 50,760 | |||||||
| 400 | Jones Apparel Group, Inc. | 14,628 | ||||||||
| 380 | Liz Claiborne, Inc. | 16,040 | ||||||||
| 1,550 | Nike, Inc. | 140,569 | ||||||||
| 300 | Reebok Intl., Ltd. | 13,200 | ||||||||
| 600 | VF Corp. | 33,228 | ||||||||
| 268,425 | ||||||||||
| Auto Manufacturers: 0.2% | ||||||||||
| 10,490 | Ford Motor Co. | 153,574 | ||||||||
| 2,000 | General Motors Corp. | 80,120 | ||||||||
| 800 | PACCAR, Inc. | 64,384 | ||||||||
| 298,078 | ||||||||||
| Auto Parts and Equipment: 0.0% | ||||||||||
| 800 | Johnson Controls, Inc. | 50,752 | ||||||||
| 50,752 | ||||||||||
| Banks: 1.6% | ||||||||||
| 1,550 | AmSouth Bancorporation | 40,145 | ||||||||
| 14,320 | Bank of America Corp. | 672,896 | ||||||||
| 1,850 | BB&T Corp. | 77,793 | ||||||||
| 900 | Comerica, Inc. | 54,918 | ||||||||
| 400 | Compass Bancshares, Inc. | 19,468 | ||||||||
| 800 | Fifth Third Bancorp | 37,824 | ||||||||
| 550 | First Horizon National Corp. | 23,711 | ||||||||
| 1,200 | Huntington Bancshares, Inc. | 29,736 | ||||||||
| 1,800 | KeyCorp | 61,020 | ||||||||
| 500 | M & T Bank Corp. | 53,920 | ||||||||
| 700 | Marshall & Ilsley Corp. | 30,940 | ||||||||
| 1,650 | Mellon Financial Corp. | 51,332 | ||||||||
| 3,200 | National City Corp. | 120,160 | ||||||||
| 1,575 | North Fork Bancorporation, Inc. | 45,439 | ||||||||
| 800 | Northern Trust Corp. | 38,864 | ||||||||
| 400 | PNC Financial Services Group, Inc. | 22,976 | ||||||||
| 1,619 | Regions Financial Corp. | 57,620 | ||||||||
| 1,150 | State Street Corp. | 56,488 | ||||||||
| 1,250 | SunTrust Banks, Inc. | 92,350 | ||||||||
| 450 | Synovus Financial Corp. | 12,861 | ||||||||
| 2,700 | The Bank of New York Co., Inc. | 90,234 | ||||||||
| 6,500 | U.S. Bancorp | 203,579 | ||||||||
| 5,646 | Wachovia Corp. | 296,979 | ||||||||
| 5,850 | Wells Fargo & Co. | 363,577 | ||||||||
| 350 | Zions Bancorporation | 23,811 | ||||||||
| 2,578,641 | ||||||||||
| Beverages: 0.6% | ||||||||||
| 200 | Adolph Coors Co. | 15,134 | ||||||||
| 1,100 | Anheuser-Busch Cos., Inc. | 55,803 | ||||||||
| 500 | Brown-Forman Corp. | 24,340 | ||||||||
| 8,400 | Coca-Cola Co. | 349,692 | ||||||||
| 2,000 | Coca-Cola Enterprises, Inc. | 41,700 | ||||||||
| 850 | Pepsi Bottling Group, Inc. | 22,984 | ||||||||
| 8,000 | PepsiCo, Inc. | 417,600 | ||||||||
| 927,253 | ||||||||||
| Biotechnology: 0.3% | ||||||||||
| 4,450 | @ | Amgen, Inc. | 285,467 | |||||||
| 1,100 | @ | Biogen Idec, Inc. | 73,271 | |||||||
| 800 | @ | Genzyme Corp. | 46,456 | |||||||
| 800 | @ | MedImmune, Inc. | 21,688 | |||||||
| 250 | @ | Millipore Corp. | 12,453 | |||||||
| 439,335 | ||||||||||
| Building Materials: 0.1% | ||||||||||
| 1,050 | @ | American Standard Cos., Inc. | 43,386 | |||||||
| 1,450 | Masco Corp. | 52,968 | ||||||||
| 550 | Vulcan Materials Co. | 30,036 | ||||||||
| 126,390 | ||||||||||
| Chemicals: 0.4% | ||||||||||
| 800 | Air Products & Chemicals, Inc. | 46,376 | ||||||||
| 400 | Ashland, Inc. | 23,352 | ||||||||
| 3,400 | Dow Chemical Co. | 168,334 | ||||||||
| 3,500 | E.I. du Pont de Nemours & Co. | 171,674 | ||||||||
| 350 | Eastman Chemical Co. | 20,206 | ||||||||
| 400 | Ecolab, Inc. | 14,052 | ||||||||
| 550 | Engelhard Corp. | 16,869 | ||||||||
| 300 | International Flavors & Fragrances, Inc. | 12,852 | ||||||||
| 1,100 | PPG Industries, Inc. | 74,976 | ||||||||
| 1,400 | Praxair, Inc. | 61,810 | ||||||||
| 850 | Rohm & Haas Co. | 37,596 | ||||||||
| 800 | Sherwin-Williams Co. | 35,704 | ||||||||
| 400 | Sigma-Aldrich Corp. | 24,184 | ||||||||
| 707,985 | ||||||||||
| Commercial Services: 0.2% | ||||||||||
| 700 | @ | Apollo Group, Inc. | 56,497 | |||||||
| 3,700 | Cendant Corp. | 86,506 | ||||||||
| 550 | Equifax, Inc. | 15,455 | ||||||||
| 750 | H&R Block, Inc. | 36,750 | ||||||||
| 1,250 | McKesson Corp. | 39,325 | ||||||||
| 600 | Moody’s Corp. | 52,110 | ||||||||
| 1,300 | Paychex, Inc. | 44,304 | ||||||||
| 1,000 | R.R. Donnelley & Sons Co. | 35,290 | ||||||||
| 900 | Robert Half Intl., Inc. | 26,487 | ||||||||
| 392,724 | ||||||||||
| Computers: 1.4% | ||||||||||
| 450 | @ | Affiliated Computer Services, Inc. | 27,086 | |||||||
| 2,250 | @ | Apple Computer, Inc. | 144,900 | |||||||
| 800 | @ | Computer Sciences Corp. | 45,096 | |||||||
| 14,950 | @ | Dell, Inc. | 629,992 | |||||||
| 1,800 | Electronic Data Systems Corp. | 41,580 | ||||||||
| 8,250 | @ | EMC Corp. | 122,678 | |||||||
| 850 | @ | Gateway, Inc. | 5,109 | |||||||
| 10,200 | Hewlett-Packard Co. | 213,894 | ||||||||
| 7,850 | International Business Machines Corp. | 773,852 | ||||||||
| 430 | @ | Lexmark Intl., Inc. | 36,550 | |||||||
| 350 | @ | NCR Corp. | 24,231 | |||||||
121
| Shares | Value | |||||||||
| Computers (continued) | ||||||||||
| 1,450 | @ | Network Appliance, Inc. | $ | 48,169 | ||||||
| 20,100 | @ | Sun Microsystems, Inc. | 108,138 | |||||||
| 1,250 | @ | Sungard Data Systems, Inc. | 35,413 | |||||||
| 1,450 | @ | Unisys Corp. | 14,761 | |||||||
| 2,271,449 | ||||||||||
| Cosmetics/Personal Care: 0.8% | ||||||||||
| 450 | Alberto-Culver Co. | 21,857 | ||||||||
| 650 | Avon Products, Inc. | 25,155 | ||||||||
| 1,800 | Colgate-Palmolive Co. | 92,088 | ||||||||
| 5,950 | Gillette Co. | 266,441 | ||||||||
| 1,700 | Kimberly-Clark Corp. | 111,877 | ||||||||
| 15,250 | Procter & Gamble Co. | 839,970 | ||||||||
| 1,357,388 | ||||||||||
| Distribution/Wholesale: 0.1% | ||||||||||
| 1,100 | Genuine Parts Co. | 48,466 | ||||||||
| 550 | W.W. Grainger, Inc. | 36,641 | ||||||||
| 85,107 | ||||||||||
| Diversified Financial Services: 1.8% | ||||||||||
| 6,000 | American Express Co. | 338,219 | ||||||||
| 390 | Bear Stearns Cos., Inc. | 39,901 | ||||||||
| 1,450 | Capital One Financial Corp. | 122,105 | ||||||||
| 1,000 | CIT Group, Inc. | 45,820 | ||||||||
| 18,300 | Citigroup, Inc. | 881,693 | ||||||||
| 1,948 | Countrywide Financial Corp. | 72,095 | ||||||||
| 1,650 | @ | E*TRADE Financial Corp. | 24,668 | |||||||
| 3,350 | Fannie Mae | 238,553 | ||||||||
| 500 | Federated Investors, Inc. | 15,200 | ||||||||
| 900 | Franklin Resources, Inc. | 62,685 | ||||||||
| 2,300 | Freddie Mac | 169,510 | ||||||||
| 1,600 | Goldman Sachs Group, Inc. | 166,464 | ||||||||
| 1,050 | Janus Capital Group, Inc. | 17,651 | ||||||||
| 1,300 | Lehman Brothers Holdings, Inc. | 113,724 | ||||||||
| 4,300 | MBNA Corp. | 121,217 | ||||||||
| 3,200 | Merrill Lynch & Co., Inc. | 191,264 | ||||||||
| 3,850 | Morgan Stanley | 213,752 | ||||||||
| 1,710 | @ | Providian Financial Corp. | 28,164 | |||||||
| 1,450 | SLM Corp. | 77,416 | ||||||||
| 450 | T. Rowe Price Group, Inc. | 27,990 | ||||||||
| 2,968,091 | ||||||||||
| Electric: 0.6% | ||||||||||
| 2,200 | @ | AES Corp. | 30,074 | |||||||
| 300 | Ameren Corp. | 15,042 | ||||||||
| 1,600 | American Electric Power Co., Inc. | 54,944 | ||||||||
| 250 | Cinergy Corp. | 10,408 | ||||||||
| 1,050 | Consolidated Edison, Inc. | 45,938 | ||||||||
| 550 | Constellation Energy Group, Inc. | 24,041 | ||||||||
| 450 | Dominion Resources, Inc. | 30,483 | ||||||||
| 750 | DTE Energy Co. | 32,348 | ||||||||
| 5,650 | Duke Energy Corp. | 143,114 | ||||||||
| 1,140 | Edison Intl. | 36,514 | ||||||||
| 800 | Entergy Corp. | 54,072 | ||||||||
| 2,200 | Exelon Corp. | 96,953 | ||||||||
| 1,350 | FirstEnergy Corp. | 53,339 | ||||||||
| 750 | FPL Group, Inc. | 56,063 | ||||||||
| 1,750 | @ | PG&E Corp. | 58,240 | |||||||
| 350 | Pinnacle West Capital Corp. | 15,544 | ||||||||
| 1,050 | PPL Corp. | 55,944 | ||||||||
| 850 | Public Service Enterprise Group, Inc. | 44,005 | ||||||||
| 2,600 | Southern Co. | 87,151 | ||||||||
| 1,400 | TXU Corp. | 90,383 | ||||||||
| 1,550 | Xcel Energy, Inc. | 28,210 | ||||||||
| 1,062,810 | ||||||||||
| Electrical Components and Equipment: 0.1% | ||||||||||
| 2,000 | Emerson Electric Co. | 140,200 | ||||||||
| 140,200 | ||||||||||
| Electronics: 0.2% | ||||||||||
| 1,650 | @ | Agilent Technologies, Inc. | 39,764 | |||||||
| 1,200 | Applera Corp. — Applied Biosystems Group | 25,092 | ||||||||
| 500 | @ | Fisher Scientific Intl. | 31,190 | |||||||
| 1,000 | @ | Jabil Circuit, Inc. | 25,580 | |||||||
| 450 | Parker Hannifin Corp. | 34,083 | ||||||||
| 400 | PerkinElmer, Inc. | 8,996 | ||||||||
| 1,900 | @ | Sanmina-SCI Corp. | 16,093 | |||||||
| 3,200 | @ | Solectron Corp. | 17,056 | |||||||
| 250 | Tektronix, Inc. | 7,553 | ||||||||
| 650 | @ | Thermo Electron Corp. | 19,624 | |||||||
| 550 | @ | Waters Corp. | 25,735 | |||||||
| 250,766 | ||||||||||
| Engineering and Construction: 0.0% | ||||||||||
| 300 | Fluor Corp. | 16,353 | ||||||||
| 16,353 | ||||||||||
| Entertainment: 0.0% | ||||||||||
| 1,200 | International Game Technology | 41,256 | ||||||||
| 41,256 | ||||||||||
| Environmental Control: 0.0% | ||||||||||
| 2,000 | Waste Management, Inc. | 59,880 | ||||||||
| 59,880 | ||||||||||
| Food: 0.4% | ||||||||||
| 1,350 | Albertson’s, Inc. | 32,238 | ||||||||
| 1,450 | Campbell Soup Co. | 43,341 | ||||||||
| 1,800 | ConAgra Foods, Inc. | 53,010 | ||||||||
| 1,250 | General Mills, Inc. | 62,138 | ||||||||
| 1,200 | H.J. Heinz Co. | 46,788 | ||||||||
| 1,100 | Hershey Foods Corp. | 61,094 | ||||||||
| 1,400 | Kellogg Co. | 62,524 | ||||||||
| 1,200 | @ | Kroger Co. | 21,048 | |||||||
| 650 | McCormick & Co., Inc. | �� | 25,090 | |||||||
| 1,650 | @ | Safeway, Inc. | 32,571 | |||||||
| 3,200 | Sara Lee Corp. | 77,248 | ||||||||
| 750 | SUPERVALU, Inc. | 25,890 | ||||||||
| 1,300 | Wm. Wrigley Jr. Co. | 89,946 | ||||||||
| 632,926 | ||||||||||
| Forest Products and Paper: 0.2% | ||||||||||
| 950 | Georgia-Pacific Corp. | 35,606 | ||||||||
| 1,750 | International Paper Co. | 73,500 | ||||||||
| 550 | Louisiana-Pacific Corp. | 14,707 | ||||||||
| 850 | MeadWestvaco Corp. | 28,807 | ||||||||
| 650 | Plum Creek Timber Co., Inc. | 24,986 | ||||||||
| 250 | Temple-Inland, Inc. | 17,100 | ||||||||
| 1,250 | Weyerhaeuser Co. | 84,025 | ||||||||
| 278,731 | ||||||||||
| Gas: 0.0% | ||||||||||
| 700 | KeySpan Corp. | 27,615 | ||||||||
| 1,050 | Sempra Energy | 38,514 | ||||||||
| 66,129 | ||||||||||
| Hand/Machine Tools: 0.0% | ||||||||||
| 490 | Black & Decker Corp. | 43,282 | ||||||||
| 200 | Snap-On, Inc. | 6,872 | ||||||||
| 400 | Stanley Works | 19,596 | ||||||||
| 69,750 | ||||||||||
| Healthcare — Products: 1.1% | ||||||||||
| 300 | Bausch & Lomb, Inc. | 19,338 | ||||||||
| 850 | Baxter Intl., Inc. | 29,359 | ||||||||
122
| Shares | Value | |||||||||
| Healthcare — Products (continued) | ||||||||||
| 1,500 | Becton Dickinson & Co. | $ | 85,200 | |||||||
| 850 | Biomet, Inc. | 36,882 | ||||||||
| 2,800 | @ | Boston Scientific Corp. | 99,540 | |||||||
| 500 | C.R. Bard, Inc. | 31,990 | ||||||||
| 420 | Guidant Corp. | 30,282 | ||||||||
| 17,800 | Johnson & Johnson | 1,128,875 | ||||||||
| 4,100 | Medtronic, Inc. | 203,647 | ||||||||
| 1,400 | @ | St. Jude Medical, Inc. | 58,702 | |||||||
| 550 | Stryker Corp. | 26,538 | ||||||||
| 900 | @ | Zimmer Holdings, Inc. | 72,108 | |||||||
| 1,822,461 | ||||||||||
| Healthcare — Services: 0.5% | ||||||||||
| 930 | Aetna, Inc. | 116,018 | ||||||||
| 900 | @ | Humana, Inc. | 26,721 | |||||||
| 500 | @ | Laboratory Corp. Of America Holdings | 24,910 | |||||||
| 250 | Manor Care, Inc. | 8,858 | ||||||||
| 400 | Quest Diagnostics, Inc. | 38,220 | ||||||||
| 3,900 | UnitedHealth Group, Inc. | 343,316 | ||||||||
| 1,690 | @ | WellPoint, Inc. | 194,350 | |||||||
| 752,393 | ||||||||||
| Home Builders: 0.0% | ||||||||||
| 180 | Centex Corp. | 10,724 | ||||||||
| 10,724 | ||||||||||
| Home Furnishings: 0.0% | ||||||||||
| 1,000 | Leggett & Platt, Inc. | 28,430 | ||||||||
| 300 | Whirlpool Corp. | 20,763 | ||||||||
| 49,193 | ||||||||||
| Household Products/Wares: 0.1% | ||||||||||
| 450 | Avery Dennison Corp. | 26,987 | ||||||||
| 850 | Clorox Co. | 50,090 | ||||||||
| 600 | Fortune Brands, Inc. | 46,308 | ||||||||
| 123,385 | ||||||||||
| Housewares: 0.0% | ||||||||||
| 1,000 | Newell Rubbermaid, Inc. | 24,190 | ||||||||
| 24,190 | ||||||||||
| Insurance: 1.2% | ||||||||||
| 1,300 | @@ | ACE Ltd. | 55,575 | |||||||
| 1,750 | AFLAC, Inc. | 69,720 | ||||||||
| 2,400 | Allstate Corp. | 124,128 | ||||||||
| 450 | AMBAC Financial Group, Inc. | 36,959 | ||||||||
| 9,150 | American Intl. Group, Inc. | 600,880 | ||||||||
| 1,450 | AON Corp. | 34,597 | ||||||||
| 1,150 | Chubb Corp. | 88,435 | ||||||||
| 770 | CIGNA Corp. | 62,809 | ||||||||
| 682 | Cincinnati Financial Corp. | 30,185 | ||||||||
| 1,350 | Hartford Financial Services Group, Inc. | 93,569 | ||||||||
| 600 | Jefferson-Pilot Corp. | 31,176 | ||||||||
| 750 | Lincoln National Corp. | 35,010 | ||||||||
| 1,150 | Loews Corp. | 80,845 | ||||||||
| �� | 750 | Marsh & McLennan Cos., Inc. | 24,675 | |||||||
| 650 | MBIA, Inc. | 41,132 | ||||||||
| 2,600 | MetLife, Inc. | 105,326 | ||||||||
| 300 | MGIC Investment Corp. | 20,673 | ||||||||
| 1,100 | Principal Financial Group | 45,034 | ||||||||
| 700 | Progressive Corp. | 59,388 | ||||||||
| 3,100 | Prudential Financial, Inc. | 170,375 | ||||||||
| 550 | Safeco Corp. | 28,732 | ||||||||
| 950 | St. Paul Travelers Cos., Inc. | 35,217 | ||||||||
| 450 | Torchmark Corp. | 25,713 | ||||||||
| 1,100 | UnumProvident Corp. | 19,734 | ||||||||
| 600 | @@ | XL Capital Ltd. | 46,590 | |||||||
| 1,966,477 | ||||||||||
| Internet: 0.3% | ||||||||||
| 2,350 | @ | eBay, Inc. | 273,258 | |||||||
| 3,500 | @ | Symantec Corp. | 90,160 | |||||||
| 4,550 | @ | Yahoo!, Inc. | 171,444 | |||||||
| 534,862 | ||||||||||
| Iron/Steel: 0.0% | ||||||||||
| 500 | Nucor Corp. | 26,170 | ||||||||
| 550 | United States Steel Corp. | 28,188 | ||||||||
| 54,358 | ||||||||||
| Leisure Time: 0.1% | ||||||||||
| 560 | Brunswick Corp. | 27,720 | ||||||||
| 2,150 | Carnival Corp. | 123,904 | ||||||||
| 1,050 | Harley-Davidson, Inc. | 63,788 | ||||||||
| 750 | Sabre Holdings Corp. | 16,620 | ||||||||
| 232,032 | ||||||||||
| Lodging: 0.1% | ||||||||||
| 550 | Harrah’s Entertainment, Inc. | 36,790 | ||||||||
| 1,300 | Hilton Hotels Corp. | 29,562 | ||||||||
| 950 | Marriott Intl., Inc. | 59,831 | ||||||||
| 800 | Starwood Hotels & Resorts Worldwide, Inc. | 46,720 | ||||||||
| 172,903 | ||||||||||
| Machinery — Construction and Mining: 0.0% | ||||||||||
| 450 | Caterpillar, Inc. | 43,880 | ||||||||
| 43,880 | ||||||||||
| Machinery — Diversified: 0.1% | ||||||||||
| 200 | Cummins, Inc. | 16,758 | ||||||||
| 850 | Deere & Co. | 63,240 | ||||||||
| 850 | Rockwell Automation, Inc. | 42,118 | ||||||||
| 122,116 | ||||||||||
| Media: 0.8% | ||||||||||
| 7,700 | @ | Comcast Corp. | 256,256 | |||||||
| 900 | Gannett Co., Inc. | 73,530 | ||||||||
| 100 | Knight-Ridder, Inc. | 6,694 | ||||||||
| 1,100 | McGraw-Hill Cos., Inc. | 100,694 | ||||||||
| 150 | Meredith Corp. | 8,130 | ||||||||
| 500 | New York Times Co. | 20,400 | ||||||||
| 9,250 | News Corp. | 172,605 | ||||||||
| 16,100 | @ | Time Warner, Inc. | 312,984 | |||||||
| 450 | Tribune Co. | 18,963 | ||||||||
| 6,100 | Viacom, Inc. | 221,979 | ||||||||
| 6,800 | Walt Disney Co. | 189,040 | ||||||||
| 1,381,275 | ||||||||||
| Mining: 0.0% | ||||||||||
| 500 | Phelps Dodge Corp. | 49,460 | ||||||||
| 49,460 | ||||||||||
| Miscellaneous Manufacturing: 1.4% | ||||||||||
| 2,700 | 3M Co. | 221,588 | ||||||||
| 350 | Cooper Industries Ltd. | 23,762 | ||||||||
| 1,050 | Danaher Corp. | 60,281 | ||||||||
| 300 | Dover Corp. | 12,582 | ||||||||
| 1,180 | Eastman Kodak Co. | 38,055 | ||||||||
| 650 | Eaton Corp. | 47,034 | ||||||||
| 37,250 | General Electric Co. | 1,359,624 | ||||||||
| 2,850 | Honeywell Intl., Inc. | 100,919 | ||||||||
| 1,000 | Illinois Tool Works, Inc. | 92,680 | ||||||||
| 700 | @@ | Ingersoll-Rand Co. | 56,210 | |||||||
| 330 | ITT Industries, Inc. | 27,869 | ||||||||
| 500 | Pall Corp. | 14,475 | ||||||||
| 650 | Textron, Inc. | 47,970 | ||||||||
| 6,950 | @@ | Tyco Intl., Ltd. | 248,392 | |||||||
| 2,351,441 | ||||||||||
123
| Shares | Value | |||||||||
| Office/Business Equipment: 0.1% | ||||||||||
| 1,050 | Pitney Bowes, Inc. | $ | 48,594 | |||||||
| 4,500 | @ | Xerox Corp. | 76,545 | |||||||
| 125,139 | ||||||||||
| Oil and Gas: 1.9% | ||||||||||
| 350 | Amerada Hess Corp. | 28,833 | ||||||||
| 1,050 | Anadarko Petroleum Corp. | 68,051 | ||||||||
| 1,204 | Apache Corp. | 60,886 | ||||||||
| 2,000 | Burlington Resources, Inc. | 87,000 | ||||||||
| 9,500 | ChevronTexaco Corp. | 498,844 | ||||||||
| 3,900 | ConocoPhillips | 338,637 | ||||||||
| 2,700 | Devon Energy Corp. | 105,084 | ||||||||
| 500 | EOG Resources, Inc. | 35,680 | ||||||||
| 28,950 | Exxon Mobil Corp. | 1,483,976 | ||||||||
| 400 | Kerr-McGee Corp. | 23,116 | ||||||||
| 1,350 | Marathon Oil Corp. | 50,774 | ||||||||
| 200 | @,@@ | Nabors Industries, Ltd. | 10,258 | |||||||
| 600 | @ | Noble Corp. | 29,844 | |||||||
| 1,200 | Occidental Petroleum Corp. | 70,032 | ||||||||
| 450 | Sunoco, Inc. | 36,770 | ||||||||
| 1,000 | @ | Transocean, Inc. | 42,390 | |||||||
| 950 | Unocal Corp. | 41,078 | ||||||||
| 1,400 | Valero Energy Corp. | 63,560 | ||||||||
| 3,074,813 | ||||||||||
| Oil and Gas Services: 0.1% | ||||||||||
| 1,150 | Baker Hughes, Inc. | 49,071 | ||||||||
| 600 | BJ Services Co. | 27,924 | ||||||||
| 1,400 | Halliburton Co. | 54,936 | ||||||||
| 131,931 | ||||||||||
| Packaging and Containers: 0.0% | ||||||||||
| 600 | Ball Corp. | 26,388 | ||||||||
| 600 | Bemis Co. | 17,454 | ||||||||
| 700 | @ | Pactiv Corp. | 17,703 | |||||||
| 300 | @ | Sealed Air Corp. | 15,981 | |||||||
| 77,526 | ||||||||||
| Pharmaceuticals: 1.4% | ||||||||||
| 5,350 | Abbott Laboratories | 249,577 | ||||||||
| 550 | Allergan, Inc. | 44,589 | ||||||||
| 450 | AmerisourceBergen Corp. | 26,406 | ||||||||
| 6,600 | Bristol-Myers Squibb Co. | 169,092 | ||||||||
| 2,000 | Cardinal Health, Inc. | 116,300 | ||||||||
| 2,700 | @ | Caremark Rx, Inc. | 106,461 | |||||||
| 1,600 | Eli Lilly & Co. | 90,800 | ||||||||
| 400 | @ | Express Scripts, Inc. | 30,576 | |||||||
| 1,250 | @ | Forest Laboratories, Inc. | 56,075 | |||||||
| 1,500 | @ | Gilead Sciences, Inc. | 52,485 | |||||||
| 650 | @ | Hospira, Inc. | 21,775 | |||||||
| 1,220 | @ | King Pharmaceuticals, Inc. | 15,128 | |||||||
| 991 | @ | Medco Health Solutions, Inc. | 41,226 | |||||||
| 7,700 | Merck & Co., Inc. | 247,477 | ||||||||
| 26,370 | Pfizer, Inc. | 709,088 | ||||||||
| 5,000 | Schering-Plough Corp. | 104,400 | ||||||||
| 4,750 | Wyeth | 202,303 | ||||||||
| 2,283,758 | ||||||||||
| Pipelines: 0.0% | ||||||||||
| 1,900 | El Paso Corp. | 19,760 | ||||||||
| 150 | Kinder Morgan, Inc. | 10,970 | ||||||||
| 2,150 | Williams Cos., Inc. | 35,023 | ||||||||
| 65,753 | ||||||||||
| Real Estate Investment Trusts: 0.1% | ||||||||||
| 550 | Equity Office Properties Trust | 16,016 | ||||||||
| 600 | ProLogis | 25,998 | ||||||||
| 750 | Simon Property Group, Inc. | 48,503 | ||||||||
| 90,517 | ||||||||||
| Retail: 2.0% | ||||||||||
| 1,150 | @ | Bed Bath & Beyond, Inc. | 45,805 | |||||||
| 1,100 | Best Buy Co., Inc. | 65,362 | ||||||||
| 1,250 | Circuit City Stores, Inc. | 19,550 | ||||||||
| 2,700 | Costco Wholesale Corp. | 130,707 | ||||||||
| 1,650 | CVS Corp. | 74,366 | ||||||||
| 850 | Darden Restaurants, Inc. | 23,579 | ||||||||
| 700 | Federated Department Stores, Inc. | 40,453 | ||||||||
| 4,190 | Gap, Inc. | 88,493 | ||||||||
| 13,000 | Home Depot, Inc. | 555,619 | ||||||||
| 1,600 | J.C. Penney Co., Inc. Holding Co. | 66,240 | ||||||||
| 450 | @ | Kohl’s Corp. | 22,127 | |||||||
| 2,000 | Limited Brands, Inc. | 46,040 | ||||||||
| 2,590 | Lowe’s Cos., Inc. | 149,157 | ||||||||
| 950 | May Department Stores Co. | 27,930 | ||||||||
| 7,600 | McDonald’s Corp. | 243,655 | ||||||||
| 750 | Nordstrom, Inc. | 35,048 | ||||||||
| 1,050 | @ | Office Depot, Inc. | 18,228 | |||||||
| 860 | RadioShack Corp. | 28,277 | ||||||||
| 3,020 | Staples, Inc. | 101,804 | ||||||||
| 1,850 | @ | Starbucks Corp. | 115,366 | |||||||
| 3,050 | Target Corp. | 158,386 | ||||||||
| 1,750 | TJX Cos., Inc. | 43,978 | ||||||||
| 1,150 | @ | Toys R US, Inc. | 23,541 | |||||||
| 15,000 | Wal-Mart Stores, Inc. | 792,299 | ||||||||
| 3,550 | Walgreen Co. | 136,214 | ||||||||
| 700 | Wendy’s Intl., Inc. | 27,482 | ||||||||
| 1,150 | Yum! Brands, Inc. | 54,257 | ||||||||
| 3,133,963 | ||||||||||
| Savings and Loans: 0.1% | ||||||||||
| 1,020 | Golden West Financial Corp. | 62,648 | ||||||||
| 500 | Sovereign Bancorp, Inc. | 11,275 | ||||||||
| 2,950 | Washington Mutual, Inc. | 124,726 | ||||||||
| 198,649 | ||||||||||
| Semiconductors: 0.5% | ||||||||||
| 1,200 | @ | Altera Corp. | 24,840 | |||||||
| 1,400 | Analog Devices, Inc. | 51,688 | ||||||||
| 5,650 | @ | Applied Materials, Inc. | 96,615 | |||||||
| 1,209 | @ | Freescale Semiconductor Inc. | 22,197 | |||||||
| 22,250 | Intel Corp. | 520,427 | ||||||||
| 650 | @ | KLA-Tencor Corp. | 30,277 | |||||||
| 1,050 | Linear Technology Corp. | 40,698 | ||||||||
| 450 | Maxim Integrated Products, Inc. | 19,076 | ||||||||
| 1,200 | National Semiconductor Corp. | 21,540 | ||||||||
| 2,400 | Texas Instruments, Inc. | 59,088 | ||||||||
| 886,446 | ||||||||||
| Software: 1.3% | ||||||||||
| 800 | Adobe Systems, Inc. | 50,192 | ||||||||
| 1,000 | Autodesk, Inc. | 37,950 | ||||||||
| 2,000 | Automatic Data Processing, Inc. | 88,700 | ||||||||
| 1,200 | @ | BMC Software, Inc. | 22,320 | |||||||
| 500 | @ | Citrix Systems, Inc. | 12,265 | |||||||
| 2,450 | Computer Associates Intl., Inc. | 76,097 | ||||||||
| 1,950 | @ | Compuware Corp. | 12,617 | |||||||
| 450 | @ | Electronic Arts, Inc. | 27,756 | |||||||
| 2,960 | First Data Corp. | 125,918 | ||||||||
| 600 | @ | Fiserv, Inc. | 24,114 | |||||||
| 1,250 | IMS Health, Inc. | 29,013 | ||||||||
| 800 | @ | Intuit, Inc. | 35,208 | |||||||
| 38,350 | Microsoft Corp. | 1,024,328 | ||||||||
| 1,100 | @ | Novell, Inc. | 7,425 | |||||||
| 30,650 | @ | Oracle Corp. | 420,518 | |||||||
| 1,200 | @ | PeopleSoft, Inc. | 31,776 | |||||||
124
| Shares | Value | |||||||||
| Software (continued) | ||||||||||
| 1,970 | @ | Siebel Systems, Inc. | $ | 20,685 | ||||||
| 1,700 | @ | Veritas Software Corp. | 48,535 | |||||||
| 2,095,417 | ||||||||||
| Telecommunications: 1.5% | ||||||||||
| 1,550 | Alltel Corp. | 91,078 | ||||||||
| 1,100 | AT&T Corp. | 20,966 | ||||||||
| 1,500 | @ | Avaya, Inc. | 25,800 | |||||||
| 6,400 | BellSouth Corp. | 177,856 | ||||||||
| 800 | CenturyTel, Inc. | 28,376 | ||||||||
| 23,100 | @ | Cisco Systems, Inc. | 445,829 | |||||||
| 1,050 | Citizens Communications Co. | 14,480 | ||||||||
| 600 | @ | Comverse Technology, Inc. | 14,670 | |||||||
| 1,900 | @ | Corning, Inc. | 22,363 | |||||||
| 14,350 | @ | Lucent Technologies, Inc. | 53,956 | |||||||
| 8,250 | Motorola, Inc. | 141,900 | ||||||||
| 3,850 | @ | Nextel Communications, Inc. | 115,500 | |||||||
| 5,800 | QUALCOMM, Inc. | 245,920 | ||||||||
| 2,550 | @ | Qwest Communications Intl., Inc. | 11,322 | |||||||
| 11,750 | SBC Communications, Inc. | 302,798 | ||||||||
| 850 | Scientific-Atlanta, Inc. | 28,059 | ||||||||
| 5,100 | Sprint Corp. | 126,735 | ||||||||
| 2,300 | @ | Tellabs, Inc. | 19,757 | |||||||
| 13,000 | Verizon Communications, Inc. | 526,629 | ||||||||
| 2,413,994 | ||||||||||
| Textiles: 0.0% | ||||||||||
| 750 | Cintas Corp. | 32,895 | ||||||||
| 32,895 | ||||||||||
| Toys/Games/Hobbies: 0.0% | ||||||||||
| 800 | Hasbro, Inc. | 15,504 | ||||||||
| 1,750 | Mattel, Inc. | 34,108 | ||||||||
| 49,612 | ||||||||||
| Transportation: 0.4% | ||||||||||
| 1,700 | Burlington Northern Santa Fe Corp. | 80,427 | ||||||||
| 800 | CSX Corp. | 32,064 | ||||||||
| 1,750 | FedEx Corp. | 172,358 | ||||||||
| 1,800 | Norfolk Southern Corp. | 65,142 | ||||||||
| 400 | Ryder System, Inc. | 19,108 | ||||||||
| 3,950 | United Parcel Service, Inc. | 337,567 | ||||||||
| 706,666 | ||||||||||
| Total Common Stock (Cost $36,942,692) | 41,755,457 | |||||||||
| Principal | ||||||||||
| Amount | Value | |||||||||
| U.S. GOVERNMENT AGENCY OBLIGATIONS: 46.7% | ||||||||||
| Federal Home Loan Mortgage Corporation: 14.9% | ||||||||||
| $ | 27,363,000 | 3.630%, due 01/15/08 | $ | 24,608,504 | ||||||
| �� | ||||||||||
| 24,608,504 | ||||||||||
| Federal National Mortgage Association: 31.8% | ||||||||||
| 58,726,000 | 3.770%, due 02/15/08 | 52,451,655 | ||||||||
| 52,451,655 | ||||||||||
| Total U.S. Government Agency Obligations (Cost $77,140,830) | 77,060,159 | |||||||||
| U.S. TREASURY OBLIGATIONS: 1.1% | ||||||||||
| U.S. Treasury STRIP: 1.1% | ||||||||||
| 2,010,000 | 3.220%, due 11/15/07 | 1,833,600 | ||||||||
| Total U.S. Treasury Obligations (Cost $1,848,884) | 1,833,600 | |||||||||
| OTHER BONDS: 26.2% | ||||||||||
| Sovereign: 26.2% | ||||||||||
| 48,037,000 | Turkey Trust, 3.780%, due 11/15/07 | 43,269,040 | ||||||||
| Total Other Bonds (Cost $43,619,479) | 43,269,040 | |||||||||
| Total Long-Term Investments (Cost $159,551,885) | 163,918,256 | |||||||||
| SHORT-TERM INVESTMENTS: 0.8% | ||||||||||
| Repurchase Agreement: 0.8% | ||||||||||
| 1,284,000 | Morgan Stanley Repurchase Agreement dated 12/31/04, 2.2000% due 01/03/05, $1,284,235 to be received upon repurchase (Collateralized by $1,195,000 Federal Home Loan Bank, 5.750%, Market Value plus accrued interest $1,313,947, due 05/15/12). | 1,284,000 | ||||||||
| Total Short-Term Investments (Cost $1,284,000) | 1,284,000 | |||||||||
Total Investments In Securities (Cost $160,835,885)* | 100.1 | % | $ | 165,202,256 | ||||||||
Other Assets and Liabilities-Net | (0.1 | ) | (117,702 | ) | ||||||||
Net Assets | 100.0 | % | $ | 165,084,554 | ||||||||
| @ | Non-income producing security | |
| @@ | Foreign issuer | |
| STRIP | Separate Trading of Registered Interest and Principal of Securities | |
| * | Cost for federal income tax purposes is $161,151,987. Net unrealized depreciation consists of: |
| Gross Unrealized Appreciation | $ | 5,345,574 | ||
| Gross Unrealized Depreciation | (1,295,305 | ) | ||
| Net Unrealized Appreciation | $ | 4,050,269 | ||
125
| Shares | Value | |||||||||
| COMMON STOCK: 34.4% | ||||||||||
| Advertising: 0.0% | ||||||||||
| 750 | @ | Interpublic Group of Cos., Inc. | $ | 10,050 | ||||||
| 850 | Omnicom Group, Inc. | 71,672 | ||||||||
| 81,722 | ||||||||||
| Aerospace/Defense: 0.8% | ||||||||||
| 7,200 | Boeing Co. | 372,744 | ||||||||
| 1,750 | General Dynamics Corp. | 183,050 | ||||||||
| 500 | Goodrich Corp. | 16,320 | ||||||||
| 500 | L-3 Communications Holdings, Inc. | 36,620 | ||||||||
| 3,000 | Lockheed Martin Corp. | 166,650 | ||||||||
| 1,600 | Northrop Grumman Corp. | 86,976 | ||||||||
| 4,150 | Raytheon Co. | 161,145 | ||||||||
| 900 | Rockwell Collins, Inc. | 35,496 | ||||||||
| 2,700 | United Technologies Corp. | 279,045 | ||||||||
| 1,338,046 | ||||||||||
| Agriculture: 0.5% | ||||||||||
| 10,400 | Altria Group, Inc. | 635,440 | ||||||||
| 3,150 | Archer-Daniels-Midland Co. | 70,277 | ||||||||
| 1,400 | Monsanto Co. | 77,770 | ||||||||
| 750 | Reynolds American, Inc. | 58,950 | ||||||||
| 1,500 | UST, Inc. | 72,165 | ||||||||
| 914,602 | ||||||||||
| Apparel: 0.2% | ||||||||||
| 1,300 | @ | Coach, Inc. | 73,320 | |||||||
| 550 | Jones Apparel Group, Inc. | 20,114 | ||||||||
| 550 | Liz Claiborne, Inc. | 23,216 | ||||||||
| 2,400 | Nike, Inc. | 217,655 | ||||||||
| 300 | Reebok Intl., Ltd. | 13,200 | ||||||||
| 700 | VF Corp. | 38,766 | ||||||||
| 386,271 | ||||||||||
| Auto Manufacturers: 0.3% | ||||||||||
| 16,270 | Ford Motor Co. | 238,193 | ||||||||
| 2,900 | General Motors Corp. | 116,174 | ||||||||
| 1,175 | PACCAR, Inc. | 94,564 | ||||||||
| 448,931 | ||||||||||
| Auto Parts and Equipment: 0.0% | ||||||||||
| 1,050 | Johnson Controls, Inc. | 66,612 | ||||||||
| 66,612 | ||||||||||
| Banks: 2.1% | ||||||||||
| 1,500 | AmSouth Bancorporation | 38,850 | ||||||||
| 20,196 | Bank of America Corp. | 949,009 | ||||||||
| 2,500 | BB&T Corp. | 105,125 | ||||||||
| 1,000 | Comerica, Inc. | 61,020 | ||||||||
| 600 | Compass Bancshares, Inc. | 29,202 | ||||||||
| 1,150 | Fifth Third Bancorp | 54,372 | ||||||||
| 700 | First Horizon National Corp. | 30,177 | ||||||||
| 1,200 | Huntington Bancshares, Inc. | 29,736 | ||||||||
| 3,000 | KeyCorp | 101,700 | ||||||||
| 500 | M & T Bank Corp. | 53,920 | ||||||||
| 1,100 | Marshall & Ilsley Corp. | 48,620 | ||||||||
| 2,200 | Mellon Financial Corp. | 68,442 | ||||||||
| 4,750 | National City Corp. | 178,363 | ||||||||
| 2,250 | North Fork Bancorporation, Inc. | 64,913 | ||||||||
| 1,150 | Northern Trust Corp. | 55,867 | ||||||||
| 550 | PNC Financial Services Group, Inc. | 31,592 | ||||||||
| 1,893 | Regions Financial Corp. | 67,372 | ||||||||
| 1,600 | State Street Corp. | 78,592 | ||||||||
| 1,750 | SunTrust Banks, Inc. | 129,290 | ||||||||
| 600 | Synovus Financial Corp. | 17,148 | ||||||||
| 3,850 | The Bank of New York Co., Inc. | 128,667 | ||||||||
| 9,850 | U.S. Bancorp | 308,502 | ||||||||
| 8,007 | Wachovia Corp. | 421,168 | ||||||||
| 8,550 | Wells Fargo & Co. | 531,382 | ||||||||
| 500 | Zions Bancorporation | 34,015 | ||||||||
| 3,617,044 | ||||||||||
| Beverages: 0.8% | ||||||||||
| 250 | Adolph Coors Co. | 18,918 | ||||||||
| 1,600 | Anheuser-Busch Cos., Inc. | 81,168 | ||||||||
| 700 | Brown-Forman Corp. | 34,076 | ||||||||
| 12,100 | Coca-Cola Co. | 503,723 | ||||||||
| 2,050 | Coca-Cola Enterprises, Inc. | 42,743 | ||||||||
| 1,500 | Pepsi Bottling Group, Inc. | 40,560 | ||||||||
| 11,350 | PepsiCo, Inc. | 592,469 | ||||||||
| 1,313,657 | ||||||||||
| Biotechnology: 0.4% | ||||||||||
| 6,350 | @ | Amgen, Inc. | 407,353 | |||||||
| 1,800 | @ | Biogen Idec, Inc. | 119,898 | |||||||
| 1,200 | @ | Genzyme Corp. | 69,684 | |||||||
| 1,200 | @ | MedImmune, Inc. | 32,532 | |||||||
| 629,467 | ||||||||||
| Building Materials: 0.1% | ||||||||||
| 850 | @ | American Standard Cos., Inc. | 35,122 | |||||||
| 2,150 | Masco Corp. | 78,540 | ||||||||
| 500 | Vulcan Materials Co. | 27,305 | ||||||||
| 140,967 | ||||||||||
| Chemicals: 0.6% | ||||||||||
| 1,100 | Air Products & Chemicals, Inc. | 63,767 | ||||||||
| 450 | Ashland, Inc. | 26,271 | ||||||||
| 5,300 | Dow Chemical Co. | 262,402 | ||||||||
| 5,700 | E.I. du Pont de Nemours & Co. | 279,584 | ||||||||
| 550 | Eastman Chemical Co. | 31,752 | ||||||||
| 550 | Ecolab, Inc. | 19,322 | ||||||||
| 500 | Engelhard Corp. | 15,335 | ||||||||
| 600 | International Flavors & Fragrances, Inc. | 25,704 | ||||||||
| 1,650 | PPG Industries, Inc. | 112,464 | ||||||||
| 1,450 | Praxair, Inc. | 64,018 | ||||||||
| 1,050 | Rohm & Haas Co. | 46,442 | ||||||||
| 1,250 | Sherwin-Williams Co. | 55,788 | ||||||||
| 400 | Sigma-Aldrich Corp. | 24,184 | ||||||||
| 1,027,033 | ||||||||||
| Commercial Services: 0.3% | ||||||||||
| 800 | @ | Apollo Group, Inc. | 64,568 | |||||||
| 5,450 | Cendant Corp. | 127,421 | ||||||||
| 500 | Equifax, Inc. | 14,050 | ||||||||
| 1,100 | H&R Block, Inc. | 53,900 | ||||||||
| 1,650 | McKesson Corp. | 51,909 | ||||||||
| 650 | Moody’s Corp. | 56,453 | ||||||||
| 1,850 | Paychex, Inc. | 63,048 | ||||||||
| 1,300 | R.R. Donnelley & Sons Co. | 45,877 | ||||||||
| 900 | Robert Half Intl., Inc. | 26,487 | ||||||||
| 503,713 | ||||||||||
| Computers: 1.9% | ||||||||||
| 650 | @ | Affiliated Computer Services, Inc. | 39,124 | |||||||
| 3,550 | @ | Apple Computer, Inc. | 228,619 | |||||||
| 1,050 | @ | Computer Sciences Corp. | 59,189 | |||||||
| 21,200 | @ | Dell, Inc. | 893,367 | |||||||
| 2,600 | Electronic Data Systems Corp. | 60,060 | ||||||||
| 12,750 | @ | EMC Corp. | 189,593 | |||||||
| 2,150 | @ | Gateway, Inc. | 12,922 | |||||||
| 14,950 | Hewlett-Packard Co. | 313,501 | ||||||||
| 11,200 | International Business Machines Corp. | 1,104,095 | ||||||||
| 550 | @ | Lexmark Intl., Inc. | 46,750 | |||||||
| 450 | @ | NCR Corp. | 31,154 | |||||||
| 1,500 | @ | Network Appliance, Inc. | 49,830 | |||||||
126
| Shares | Value | |||||||||
| Computers (continued) | ||||||||||
| 30,600 | @ | Sun Microsystems, Inc. | $ | 164,628 | ||||||
| 1,650 | @ | Sungard Data Systems, Inc. | 46,745 | |||||||
| 1,900 | @ | Unisys Corp. | 19,342 | |||||||
| 3,258,919 | ||||||||||
| Cosmetics/Personal Care: 1.1% | ||||||||||
| 450 | Alberto-Culver Co. | 21,857 | ||||||||
| 950 | Avon Products, Inc. | 36,765 | ||||||||
| 2,400 | Colgate-Palmolive Co. | 122,784 | ||||||||
| 8,400 | Gillette Co. | 376,152 | ||||||||
| 2,450 | Kimberly-Clark Corp. | 161,235 | ||||||||
| 21,650 | Procter & Gamble Co. | 1,192,481 | ||||||||
| 1,911,274 | ||||||||||
| Distribution/Wholesale: 0.1% | ||||||||||
| 1,550 | Genuine Parts Co. | 68,293 | ||||||||
| 650 | W.W. Grainger, Inc. | 43,303 | ||||||||
| 111,596 | ||||||||||
| Diversified Financial Services: 2.6% | ||||||||||
| 8,500 | American Express Co. | 479,144 | ||||||||
| 700 | Bear Stearns Cos., Inc. | 71,617 | ||||||||
| 2,100 | Capital One Financial Corp. | 176,841 | ||||||||
| 1,750 | CIT Group, Inc. | 80,185 | ||||||||
| 25,700 | Citigroup, Inc. | 1,238,225 | ||||||||
| 2,800 | Countrywide Financial Corp. | 103,628 | ||||||||
| 2,550 | @ | E*TRADE Financial Corp. | 38,123 | |||||||
| 4,800 | Fannie Mae | 341,807 | ||||||||
| 200 | Federated Investors, Inc. | 6,080 | ||||||||
| 1,250 | Franklin Resources, Inc. | 87,063 | ||||||||
| 3,600 | Freddie Mac | 265,320 | ||||||||
| 2,550 | Goldman Sachs Group, Inc. | 265,302 | ||||||||
| 450 | Janus Capital Group, Inc. | 7,565 | ||||||||
| 1,800 | Lehman Brothers Holdings, Inc. | 157,464 | ||||||||
| 6,700 | MBNA Corp. | 188,873 | ||||||||
| 4,650 | Merrill Lynch & Co., Inc. | 277,931 | ||||||||
| 5,500 | Morgan Stanley | 305,360 | ||||||||
| 1,600 | @ | Providian Financial Corp. | 26,352 | |||||||
| 1,950 | SLM Corp. | 104,111 | ||||||||
| 650 | T. Rowe Price Group, Inc. | 40,430 | ||||||||
| 4,261,421 | ||||||||||
| Electric: 0.8% | ||||||||||
| 3,750 | @ | AES Corp. | 51,263 | |||||||
| 400 | Ameren Corp. | 20,056 | ||||||||
| 1,800 | American Electric Power Co., Inc. | 61,812 | ||||||||
| 400 | Cinergy Corp. | 16,652 | ||||||||
| 1,200 | Consolidated Edison, Inc. | 52,500 | ||||||||
| 900 | Constellation Energy Group, Inc. | 39,339 | ||||||||
| 650 | Dominion Resources, Inc. | 44,031 | ||||||||
| 800 | DTE Energy Co. | 34,504 | ||||||||
| 8,050 | Duke Energy Corp. | 203,906 | ||||||||
| 1,570 | Edison Intl | 50,287 | ||||||||
| 1,150 | Entergy Corp. | 77,729 | ||||||||
| 3,550 | Exelon Corp. | 156,448 | ||||||||
| 1,450 | FirstEnergy Corp. | 57,290 | ||||||||
| 750 | FPL Group, Inc. | 56,063 | ||||||||
| 1,650 | @ | PG&E Corp. | 54,912 | |||||||
| 150 | Pinnacle West Capital Corp. | 6,662 | ||||||||
| 1,050 | PPL Corp. | 55,944 | ||||||||
| 1,250 | Public Service Enterprise Group, Inc. | 64,713 | ||||||||
| 3,900 | Southern Co. | 130,727 | ||||||||
| 2,150 | TXU Corp. | 138,803 | ||||||||
| 2,100 | Xcel Energy, Inc. | 38,220 | ||||||||
| 1,411,861 | ||||||||||
| Electrical Components and Equipment: 0.1% | ||||||||||
| 2,900 | Emerson Electric Co. | 203,290 | ||||||||
| 203,290 | ||||||||||
| Electronics: 0.2% | ||||||||||
| 2,000 | @ | Agilent Technologies, Inc. | 48,199 | |||||||
| 1,200 | Applera Corp. — Applied Biosystems Group | 25,092 | ||||||||
| 600 | @ | Fisher Scientific Intl | 37,428 | |||||||
| 1,050 | @ | Jabil Circuit, Inc. | 26,859 | |||||||
| 600 | Parker Hannifin Corp. | 45,444 | ||||||||
| 550 | PerkinElmer, Inc. | 12,370 | ||||||||
| 2,500 | @ | Sanmina-SCI Corp. | 21,175 | |||||||
| 1,650 | @ | Solectron Corp. | 8,795 | |||||||
| 600 | Tektronix, Inc. | 18,126 | ||||||||
| 1,250 | @ | Thermo Electron Corp. | 37,738 | |||||||
| 800 | @ | Waters Corp. | 37,432 | |||||||
| 318,658 | ||||||||||
| Engineering and Construction: 0.0% | ||||||||||
| 450 | Fluor Corp. | 24,530 | ||||||||
| 24,530 | ||||||||||
| Entertainment: 0.0% | ||||||||||
| 1,900 | International Game Technology | 65,322 | ||||||||
| 65,322 | ||||||||||
| Environmental Control: 0.0% | ||||||||||
| 2,550 | Waste Management, Inc. | 76,347 | ||||||||
| 76,347 | ||||||||||
| Food: 0.5% | ||||||||||
| 1,950 | Albertson’s, Inc. | 46,566 | ||||||||
| 2,050 | Campbell Soup Co. | 61,275 | ||||||||
| 2,200 | ConAgra Foods, Inc. | 64,790 | ||||||||
| 2,050 | General Mills, Inc. | 101,906 | ||||||||
| 1,500 | H.J. Heinz Co. | 58,485 | ||||||||
| 1,200 | Hershey Foods Corp. | 66,648 | ||||||||
| 1,750 | Kellogg Co. | 78,155 | ||||||||
| 1,400 | @ | Kroger Co. | 24,556 | |||||||
| 950 | McCormick & Co., Inc. | 36,670 | ||||||||
| 2,300 | @ | Safeway, Inc. | 45,402 | |||||||
| 3,450 | Sara Lee Corp. | 83,283 | ||||||||
| 800 | SUPERVALU, Inc. | 27,616 | ||||||||
| 1,900 | Wm. Wrigley Jr. Co. | 131,460 | ||||||||
| 826,812 | ||||||||||
| Forest Products and Paper: 0.2% | ||||||||||
| 1,350 | Georgia-Pacific Corp. | 50,598 | ||||||||
| 2,750 | International Paper Co. | 115,500 | ||||||||
| 700 | Louisiana-Pacific Corp. | 18,718 | ||||||||
| 1,100 | MeadWestvaco Corp. | 37,279 | ||||||||
| 950 | Plum Creek Timber Co., Inc. | 36,518 | ||||||||
| 350 | Temple-Inland, Inc. | 23,940 | ||||||||
| 1,800 | Weyerhaeuser Co. | 120,996 | ||||||||
| 403,549 | ||||||||||
| Gas: 0.0% | ||||||||||
| 700 | KeySpan Corp. | 27,615 | ||||||||
| 1,100 | Sempra Energy | 40,348 | ||||||||
| 67,963 | ||||||||||
| Hand/Machine Tools: 0.0% | ||||||||||
| 550 | Black & Decker Corp. | 48,582 | ||||||||
| 200 | Snap-On, Inc. | 6,872 | ||||||||
| 400 | Stanley Works | 19,596 | ||||||||
| 75,050 | ||||||||||
| Healthcare — Products: 1.5% | ||||||||||
| 400 | Bausch & Lomb, Inc. | 25,784 | ||||||||
| 1,200 | Baxter Intl., Inc. | 41,448 | ||||||||
127
| Shares | Value | |||||||||
| Healthcare — Products (continued) | ||||||||||
| 1,800 | Becton Dickinson & Co. | $ | 102,240 | |||||||
| 1,400 | Biomet, Inc. | 60,746 | ||||||||
| 4,400 | @ | Boston Scientific Corp. | 156,420 | |||||||
| 450 | C.R. Bard, Inc. | 28,791 | ||||||||
| 600 | Guidant Corp. | 43,260 | ||||||||
| 25,100 | Johnson & Johnson | 1,591,842 | ||||||||
| 6,350 | Medtronic, Inc. | 315,405 | ||||||||
| 2,000 | @ | St. Jude Medical, Inc. | 83,860 | |||||||
| 800 | Stryker Corp. | 38,600 | ||||||||
| 1,100 | @ | Zimmer Holdings, Inc. | 88,132 | |||||||
| 2,576,528 | ||||||||||
| Healthcare — Services: 0.6% | ||||||||||
| 1,250 | Aetna, Inc. | 155,938 | ||||||||
| 1,300 | @ | Humana, Inc. | 38,597 | |||||||
| 600 | @ | Laboratory Corp. Of America Holdings | 29,892 | |||||||
| 600 | Manor Care, Inc. | 21,258 | ||||||||
| 550 | Quest Diagnostics, Inc. | 52,553 | ||||||||
| 5,700 | UnitedHealth Group, Inc. | 501,770 | ||||||||
| 2,650 | @ | WellPoint, Inc. | 304,750 | |||||||
| 1,104,758 | ||||||||||
| Home Builders: 0.0% | ||||||||||
| 250 | Centex Corp. | 14,895 | ||||||||
| 14,895 | ||||||||||
| Home Furnishings: 0.0% | ||||||||||
| 1,000 | Leggett & Platt, Inc. | 28,430 | ||||||||
| 500 | Whirlpool Corp. | 34,605 | ||||||||
| 63,035 | ||||||||||
| Household Products/Wares: 0.1% | ||||||||||
| 550 | Avery Dennison Corp. | 32,984 | ||||||||
| 1,050 | Clorox Co. | 61,876 | ||||||||
| 750 | Fortune Brands, Inc. | 57,885 | ||||||||
| 152,745 | ||||||||||
| Housewares: 0.0% | ||||||||||
| 1,400 | Newell Rubbermaid, Inc. | 33,866 | ||||||||
| 33,866 | ||||||||||
| Insurance: 1.6% | ||||||||||
| 1,700 | @@ | ACE Ltd. | 72,675 | |||||||
| 2,500 | AFLAC, Inc. | 99,600 | ||||||||
| 3,450 | Allstate Corp. | 178,434 | ||||||||
| 500 | AMBAC Financial Group, Inc. | 41,065 | ||||||||
| 13,000 | American Intl. Group, Inc. | 853,709 | ||||||||
| 1,850 | AON Corp. | 44,141 | ||||||||
| 1,750 | Chubb Corp. | 134,575 | ||||||||
| 1,000 | CIGNA Corp. | 81,570 | ||||||||
| 945 | Cincinnati Financial Corp. | 41,826 | ||||||||
| 1,900 | Hartford Financial Services Group, Inc. | 131,689 | ||||||||
| 800 | Jefferson-Pilot Corp. | 41,568 | ||||||||
| 1,000 | Lincoln National Corp. | 46,680 | ||||||||
| 1,650 | Loews Corp. | 115,995 | ||||||||
| 1,050 | Marsh & McLennan Cos., Inc. | 34,545 | ||||||||
| 750 | MBIA, Inc. | 47,460 | ||||||||
| 3,700 | MetLife, Inc. | 149,887 | ||||||||
| 550 | MGIC Investment Corp. | 37,901 | ||||||||
| 1,400 | Principal Financial Group | 57,316 | ||||||||
| 1,000 | Progressive Corp. | 84,840 | ||||||||
| 4,350 | Prudential Financial, Inc. | 239,076 | ||||||||
| 850 | Safeco Corp. | 44,404 | ||||||||
| 1,350 | St. Paul Travelers Cos., Inc. | 50,045 | ||||||||
| 600 | Torchmark Corp. | 34,284 | ||||||||
| 1,600 | UnumProvident Corp. | 28,704 | ||||||||
| 600 | @@ | XL Capital Ltd. | 46,590 | |||||||
| 2,738,579 | ||||||||||
| Internet: 0.5% | ||||||||||
| 3,300 | @ | eBay, Inc. | 383,724 | |||||||
| 5,800 | @ | Symantec Corp. | 149,408 | |||||||
| 6,750 | @ | Yahoo!, Inc. | 254,340 | |||||||
| 787,472 | ||||||||||
| Iron/Steel: 0.1% | ||||||||||
| 1,000 | Nucor Corp. | 52,340 | ||||||||
| 800 | United States Steel Corp. | 41,000 | ||||||||
| 93,340 | ||||||||||
| Leisure Time: 0.2% | ||||||||||
| 400 | Brunswick Corp. | 19,800 | ||||||||
| 3,400 | Carnival Corp. | 195,942 | ||||||||
| 1,250 | Harley-Davidson, Inc. | 75,938 | ||||||||
| 900 | Sabre Holdings Corp. | 19,944 | ||||||||
| 311,624 | ||||||||||
| Lodging: 0.1% | ||||||||||
| 500 | Harrah’s Entertainment, Inc. | 33,445 | ||||||||
| 2,100 | Hilton Hotels Corp. | 47,754 | ||||||||
| 1,550 | Marriott Intl., Inc. | 97,619 | ||||||||
| 1,150 | Starwood Hotels & Resorts Worldwide, Inc. | 67,160 | ||||||||
| 245,978 | ||||||||||
| Machinery — Construction and Mining: 0.0% | ||||||||||
| 650 | Caterpillar, Inc. | 63,382 | ||||||||
| 63,382 | ||||||||||
| Machinery — Diversified: 0.1% | ||||||||||
| 250 | Cummins, Inc. | 20,948 | ||||||||
| 1,100 | Deere & Co. | 81,839 | ||||||||
| 950 | Rockwell Automation, Inc. | 47,073 | ||||||||
| 149,860 | ||||||||||
| Media: 1.2% | ||||||||||
| 11,050 | @ | Comcast Corp. | 367,744 | |||||||
| 1,400 | Gannett Co., Inc. | 114,380 | ||||||||
| 200 | Knight-Ridder, Inc. | 13,388 | ||||||||
| 1,600 | McGraw-Hill Cos., Inc. | 146,464 | ||||||||
| 150 | Meredith Corp. | 8,130 | ||||||||
| 650 | New York Times Co. | 26,520 | ||||||||
| 13,150 | News Corp. | 245,379 | ||||||||
| 22,600 | @ | Time Warner, Inc. | 439,344 | |||||||
| 650 | Tribune Co. | 27,391 | ||||||||
| 8,700 | Viacom, Inc. | 316,593 | ||||||||
| 10,150 | Walt Disney Co. | 282,170 | ||||||||
| 1,987,503 | ||||||||||
| Mining: 0.0% | ||||||||||
| 600 | Phelps Dodge Corp. | 59,352 | ||||||||
| 59,352 | ||||||||||
| Miscellaneous Manufacturing: 1.9% | ||||||||||
| 3,850 | 3M Co. | 315,969 | ||||||||
| 400 | Cooper Industries Ltd. | 27,156 | ||||||||
| 1,350 | Danaher Corp. | 77,504 | ||||||||
| 850 | Dover Corp. | 35,649 | ||||||||
| 1,530 | Eastman Kodak Co. | 49,343 | ||||||||
| 650 | Eaton Corp. | 47,034 | ||||||||
| 52,450 | General Electric Co. | 1,914,424 | ||||||||
| 4,500 | Honeywell Intl., Inc. | 159,345 | ||||||||
| 1,600 | Illinois Tool Works, Inc. | 148,288 | ||||||||
| 900 | @@ | Ingersoll-Rand Co. | 72,270 | |||||||
| 500 | ITT Industries, Inc. | 42,225 | ||||||||
| 750 | Pall Corp. | 21,713 | ||||||||
| 800 | Textron, Inc. | 59,040 | ||||||||
| 9,900 | @@ | Tyco Intl., Ltd. | 353,825 | |||||||
| 3,323,785 | ||||||||||
128
| Shares | Value | |||||||||
| Office/Business Equipment: 0.1% | ||||||||||
| 1,100 | Pitney Bowes, Inc. | $ | 50,908 | |||||||
| 6,400 | @ | Xerox Corp. | 108,864 | |||||||
| 159,772 | ||||||||||
| Oil and Gas: 2.6% | ||||||||||
| 600 | Amerada Hess Corp. | 49,428 | ||||||||
| 1,550 | Anadarko Petroleum Corp. | 100,456 | ||||||||
| 1,440 | Apache Corp. | 72,821 | ||||||||
| 3,250 | Burlington Resources, Inc. | 141,375 | ||||||||
| 13,450 | ChevronTexaco Corp. | 706,259 | ||||||||
| 5,550 | ConocoPhillips | 481,906 | ||||||||
| 4,100 | Devon Energy Corp. | 159,571 | ||||||||
| 450 | EOG Resources, Inc. | 32,112 | ||||||||
| 41,350 | Exxon Mobil Corp. | 2,119,600 | ||||||||
| 550 | Kerr-McGee Corp. | 31,785 | ||||||||
| 1,400 | Marathon Oil Corp. | 52,654 | ||||||||
| 350 | @,@@ | Nabors Industries, Ltd. | 17,952 | |||||||
| 500 | @ | Noble Corp. | 24,870 | |||||||
| 1,760 | Occidental Petroleum Corp. | 102,714 | ||||||||
| 500 | Sunoco, Inc. | 40,855 | ||||||||
| 1,400 | @ | Transocean, Inc. | 59,346 | |||||||
| 1,500 | Unocal Corp. | 64,860 | ||||||||
| 1,750 | Valero Energy Corp. | 79,450 | ||||||||
| 4,338,014 | ||||||||||
| Oil and Gas Services: 0.1% | ||||||||||
| 1,300 | Baker Hughes, Inc. | 55,471 | ||||||||
| 850 | BJ Services Co. | 39,559 | ||||||||
| 2,050 | Halliburton Co. | 80,442 | ||||||||
| 175,472 | ||||||||||
| Packaging and Containers: 0.1% | ||||||||||
| 600 | Ball Corp. | 26,388 | ||||||||
| 600 | Bemis Co. | 17,454 | ||||||||
| 750 | @ | Pactiv Corp. | 18,968 | |||||||
| 650 | @ | Sealed Air Corp. | 34,625 | |||||||
| 97,435 | ||||||||||
| Pharmaceuticals: 1.9% | ||||||||||
| 7,700 | Abbott Laboratories | 359,204 | ||||||||
| 600 | Allergan, Inc. | 48,642 | ||||||||
| 650 | AmerisourceBergen Corp. | 38,142 | ||||||||
| 10,350 | Bristol-Myers Squibb Co. | 265,167 | ||||||||
| 2,850 | Cardinal Health, Inc. | 165,728 | ||||||||
| 4,050 | @ | Caremark Rx, Inc. | 159,692 | |||||||
| 2,300 | Eli Lilly & Co. | 130,525 | ||||||||
| 450 | @ | Express Scripts, Inc. | 34,398 | |||||||
| 1,600 | @ | Forest Laboratories, Inc. | 71,776 | |||||||
| 2,200 | @ | Gilead Sciences, Inc. | 76,978 | |||||||
| 900 | @ | Hospira, Inc. | 30,150 | |||||||
| 450 | @ | King Pharmaceuticals, Inc. | 5,580 | |||||||
| 1,396 | @ | Medco Health Solutions, Inc. | 58,074 | |||||||
| 10,950 | Merck & Co., Inc. | 351,932 | ||||||||
| 38,130 | Pfizer, Inc. | 1,025,315 | ||||||||
| 7,800 | Schering-Plough Corp. | 162,864 | ||||||||
| 6,600 | Wyeth | 281,094 | ||||||||
| 3,265,261 | ||||||||||
| Pipelines: 0.1% | ||||||||||
| 2,750 | El Paso Corp. | 28,600 | ||||||||
| 200 | Kinder Morgan, Inc. | 14,626 | ||||||||
| 3,200 | Williams Cos., Inc. | 52,128 | ||||||||
| 95,354 | ||||||||||
| Real Estate Investment Trusts: 0.1% | ||||||||||
| 800 | Equity Office Properties Trust | 23,296 | ||||||||
| 850 | ProLogis | 36,831 | ||||||||
| 1,050 | Simon Property Group, Inc. | 67,903 | ||||||||
| 128,030 | ||||||||||
| Retail: 2.7% | ||||||||||
| 1,450 | @ | Bed Bath & Beyond, Inc. | 57,754 | |||||||
| 1,400 | Best Buy Co., Inc. | 83,188 | ||||||||
| 1,350 | Circuit City Stores, Inc. | 21,114 | ||||||||
| 4,150 | Costco Wholesale Corp. | 200,902 | ||||||||
| 1,750 | CVS Corp. | 78,873 | ||||||||
| 1,050 | Darden Restaurants, Inc. | 29,127 | ||||||||
| 750 | Federated Department Stores, Inc. | 43,343 | ||||||||
| 5,900 | Gap, Inc. | 124,608 | ||||||||
| 18,850 | Home Depot, Inc. | 805,648 | ||||||||
| 2,150 | J.C. Penney Co., Inc. Holding Co. | 89,010 | ||||||||
| 700 | @ | Kohl’s Corp. | 34,419 | |||||||
| 2,700 | Limited Brands, Inc. | 62,154 | ||||||||
| 4,170 | Lowe’s Cos., Inc. | 240,150 | ||||||||
| 1,200 | May Department Stores Co. | 35,280 | ||||||||
| 10,750 | McDonald’s Corp. | 344,644 | ||||||||
| 650 | Nordstrom, Inc. | 30,375 | ||||||||
| 1,500 | @ | Office Depot, Inc. | 26,040 | |||||||
| 600 | RadioShack Corp. | 19,728 | ||||||||
| 4,300 | Staples, Inc. | 144,953 | ||||||||
| 2,650 | @ | Starbucks Corp. | 165,254 | |||||||
| 4,750 | Target Corp. | 246,667 | ||||||||
| 2,050 | TJX Cos., Inc. | 51,517 | ||||||||
| 1,600 | @ | Toys R US, Inc. | 32,752 | |||||||
| 21,100 | Wal-Mart Stores, Inc. | 1,114,501 | ||||||||
| 5,100 | Walgreen Co. | 195,687 | ||||||||
| 1,000 | Wendy’s Intl., Inc. | 39,260 | ||||||||
| 1,500 | Yum! Brands, Inc. | 70,770 | ||||||||
| 4,387,718 | ||||||||||
| Savings and Loans: 0.2% | ||||||||||
| 1,400 | Golden West Financial Corp. | 85,988 | ||||||||
| 700 | Sovereign Bancorp, Inc. | 15,785 | ||||||||
| 4,650 | Washington Mutual, Inc. | 196,602 | ||||||||
| 298,375 | ||||||||||
| Semiconductors: 0.7% | ||||||||||
| 2,000 | @ | Altera Corp. | 41,400 | |||||||
| 1,950 | Analog Devices, Inc. | 71,994 | ||||||||
| 8,800 | @ | Applied Materials, Inc. | 150,480 | |||||||
| 1,854 | @ | Freescale Semiconductor Inc. | 34,039 | |||||||
| 31,600 | Intel Corp. | 739,124 | ||||||||
| 950 | @ | KLA-Tencor Corp. | 44,251 | |||||||
| 1,550 | Linear Technology Corp. | 60,078 | ||||||||
| 600 | Maxim Integrated Products, Inc. | 25,434 | ||||||||
| 750 | National Semiconductor Corp. | 13,463 | ||||||||
| 3,450 | Texas Instruments, Inc. | 84,939 | ||||||||
| 1,265,202 | ||||||||||
| Software: 1.7% | ||||||||||
| 1,050 | Adobe Systems, Inc. | 65,877 | ||||||||
| 1,800 | Autodesk, Inc. | 68,310 | ||||||||
| 3,100 | Automatic Data Processing, Inc. | 137,485 | ||||||||
| 1,550 | @ | BMC Software, Inc. | 28,830 | |||||||
| 1,300 | @ | Citrix Systems, Inc. | 31,889 | |||||||
| 2,450 | Computer Associates Intl., Inc. | 76,097 | ||||||||
| 2,800 | @ | Compuware Corp. | 18,116 | |||||||
| 650 | @ | Electronic Arts, Inc. | 40,092 | |||||||
| 4,583 | First Data Corp. | 194,961 | ||||||||
| 1,000 | @ | Fiserv, Inc. | 40,190 | |||||||
| 1,100 | IMS Health, Inc. | 25,531 | ||||||||
| 800 | @ | Intuit, Inc. | 35,208 | |||||||
| 54,750 | Microsoft Corp. | 1,462,372 | ||||||||
| 2,450 | @ | Novell, Inc. | 16,538 | |||||||
| 44,400 | @ | Oracle Corp. | 609,167 | |||||||
| 1,800 | @ | PeopleSoft, Inc. | 47,664 | |||||||
129
| Shares | Value | |||||||||
| Software (continued) | ||||||||||
| 1,950 | @ | Siebel Systems, Inc. | $ | 20,475 | ||||||
| 1,850 | @ | Veritas Software Corp. | 52,818 | |||||||
| 2,971,620 | ||||||||||
| Telecommunications: 2.0% | ||||||||||
| 1,900 | Alltel Corp. | 111,644 | ||||||||
| 1,600 | AT&T Corp. | 30,496 | ||||||||
| 2,800 | @ | Avaya, Inc. | 48,160 | |||||||
| 9,650 | BellSouth Corp. | 268,174 | ||||||||
| 900 | CenturyTel, Inc. | 31,923 | ||||||||
| 32,750 | @ | Cisco Systems, Inc. | 632,074 | |||||||
| 1,750 | Citizens Communications Co. | 24,133 | ||||||||
| 850 | @ | Comverse Technology, Inc. | 20,783 | |||||||
| 2,700 | @ | Corning, Inc. | 31,779 | |||||||
| 20,650 | @ | Lucent Technologies, Inc. | 77,644 | |||||||
| 11,700 | Motorola, Inc. | 201,240 | ||||||||
| 5,250 | @ | Nextel Communications, Inc. | 157,500 | |||||||
| 8,050 | QUALCOMM, Inc. | 341,319 | ||||||||
| 8,200 | @ | Qwest Communications Intl., Inc. | 36,408 | |||||||
| 16,650 | SBC Communications, Inc. | 429,070 | ||||||||
| 650 | Scientific-Atlanta, Inc. | 21,457 | ||||||||
| 7,450 | Sprint Corp. | 185,133 | ||||||||
| 2,300 | @ | Tellabs, Inc. | 19,757 | |||||||
| 18,600 | Verizon Communications, Inc. | 753,485 | ||||||||
| 3,422,179 | ||||||||||
| Textiles: 0.0% | ||||||||||
| 1,000 | Cintas Corp. | 43,860 | ||||||||
| 43,860 | ||||||||||
| Toys/Games/Hobbies: 0.0% | ||||||||||
| 1,200 | Hasbro, Inc. | 23,256 | ||||||||
| 2,000 | Mattel, Inc. | 38,980 | ||||||||
| 62,236 | ||||||||||
| Transportation: 0.6% | ||||||||||
| 2,450 | Burlington Northern Santa Fe Corp. | 115,910 | ||||||||
| 1,100 | CSX Corp. | 44,088 | ||||||||
| 2,500 | FedEx Corp. | 246,225 | ||||||||
| 2,550 | Norfolk Southern Corp. | 92,285 | ||||||||
| 300 | Ryder System, Inc. | 14,331 | ||||||||
| 5,750 | United Parcel Service, Inc. | 491,394 | ||||||||
| 1,004,233 | ||||||||||
| Total Common Stock (Cost $53,295,691) | 58,906,120 | |||||||||
| Principal | ||||||||||
| Amount | Value | |||||||||
| CORPORATE BONDS/NOTES: 6.0% | ||||||||||
| Diversified Financial Services: 6.0% | ||||||||||
| $ | 10,000,000 | @ | General Electric Capital Corp., 4.250%, due 01/15/08 | $ | 10,165,490 | |||||
| Total Corporate Bonds/Notes (Cost $10,256,949) | 10,165,490 | |||||||||
| U.S. GOVERNMENT AGENCY OBLIGATIONS: 49.3% | ||||||||||
| Federal National Mortgage Association: 33.7% | ||||||||||
| 58,000,000 | STRIP, 3.870%, due 05/15/08 | 51,222,642 | ||||||||
| 7,340,000 | STRIP, 3.870%, due 05/15/08 | 6,482,798 | ||||||||
| 57,705,440 | ||||||||||
| Other: 15.6% | ||||||||||
| 30,065,000 | FICO STRIP, 3.740%, due 06/06/08 | 26,602,294 | ||||||||
| 26,602,294 | ||||||||||
| Total U.S. Government Agency Obligations (Cost $86,071,869) | 84,307,734 | |||||||||
| U.S. TREASURY OBLIGATIONS: 0.9% | ||||||||||
| U.S. Treasury STRIP: 0.9% | ||||||||||
| 1,632,000 | 3.270%, due 02/15/08 | 1,475,989 | ||||||||
| Total U.S. Treasury Obligations (Cost $1,494,119) | 1,475,989 | |||||||||
| OTHER BONDS: 8.4% | ||||||||||
| Sovereign: 8.4% | ||||||||||
| 5,498,000 | Israel Trust, 3.530%, due 02/15/08 | 4,944,494 | ||||||||
| 10,429,000 | Israel Trust, 3.570%, due 03/15/08 | 9,343,884 | ||||||||
| Total Other Bonds (Cost $14,581,942) | 14,288,378 | |||||||||
| Total Long-Term Investments (Cost $165,700,570) | 169,143,711 | |||||||||
| SHORT-TERM INVESTMENTS: 0.9% | ||||||||||
| Repurchase Agreement: 0.9% | ||||||||||
| 1,497,000 | Morgan Stanley Repurchase Agreement dated 12/31/04, 2.2000% due 01/03/05, $1,497,274 to be received upon repurchase (Collateralized by $1,390,000 Federal Home Loan Bank, 5.750%, Market Value plus accrued interest $1,528,357, due 05/15/12) | 1,497,000 | ||||||||
| Total Short-Term Investments (Cost $1,497,000) | 1,497,000 | |||||||||
Total Investments In Securities (Cost $167,197,570)* | 99.9 | % | $ | 170,640,711 | ||||||||
Other Assets and Liabilities-Net | 0.1 | 103,489 | ||||||||||
Net Assets | 100.0 | % | $ | 170,744,200 | ||||||||
| @ | Non-income producing security | |
| @@ | Foreign issuer | |
| STRIP | Separate Trading of Registered Interest and Principal of Securities | |
| * | Cost for federal income tax purposes is $167,850,781. Net unrealized depreciation consists of: |
| Gross Unrealized Appreciation | $ | 6,019,797 | ||
| Gross Unrealized Depreciation | (3,229,867 | ) | ||
| Net Unrealized Appreciation | $ | 2,789,930 | ||
130
| Shares | Value | |||||||||
| COMMON STOCK: 16.2% | ||||||||||
| Advertising: 0.0% | ||||||||||
| 1,450 | @ | Interpublic Group of Cos., Inc. | $ | 19,430 | ||||||
| 750 | Omnicom Group, Inc. | 63,240 | ||||||||
| 82,670 | ||||||||||
| Aerospace/Defense: 0.4% | ||||||||||
| 5,650 | Boeing Co. | 292,500 | ||||||||
| 1,350 | General Dynamics Corp. | 141,210 | ||||||||
| 450 | Goodrich Corp. | 14,688 | ||||||||
| 400 | L-3 Communications Holdings, Inc. | 29,296 | ||||||||
| 2,350 | Lockheed Martin Corp. | 130,543 | ||||||||
| 1,300 | Northrop Grumman Corp. | 70,668 | ||||||||
| 3,050 | Raytheon Co. | 118,432 | ||||||||
| 350 | Rockwell Collins, Inc. | 13,804 | ||||||||
| 2,000 | United Technologies Corp. | 206,700 | ||||||||
| 1,017,841 | ||||||||||
| Agriculture: 0.2% | ||||||||||
| 8,000 | Altria Group, Inc. | 488,800 | ||||||||
| 2,500 | Archer-Daniels-Midland Co. | 55,775 | ||||||||
| 1,000 | Monsanto Co. | 55,550 | ||||||||
| 600 | Reynolds American, Inc. | 47,160 | ||||||||
| 850 | UST, Inc. | 40,894 | ||||||||
| 688,179 | ||||||||||
| Apparel: 0.1% | ||||||||||
| 1,000 | @ | Coach, Inc. | 56,400 | |||||||
| 450 | Jones Apparel Group, Inc. | 16,457 | ||||||||
| 550 | Liz Claiborne, Inc. | 23,216 | ||||||||
| 1,800 | Nike, Inc. | 163,241 | ||||||||
| 300 | Reebok Intl., Ltd. | 13,200 | ||||||||
| 650 | VF Corp. | 35,997 | ||||||||
| 308,511 | ||||||||||
| Auto Manufacturers: 0.1% | ||||||||||
| 12,200 | Ford Motor Co. | 178,608 | ||||||||
| 2,250 | General Motors Corp. | 90,135 | ||||||||
| 925 | PACCAR, Inc. | 74,444 | ||||||||
| 343,187 | ||||||||||
| Auto Parts and Equipment: 0.0% | ||||||||||
| 750 | Johnson Controls, Inc. | 47,580 | ||||||||
| 47,580 | ||||||||||
| Banks: 1.0% | ||||||||||
| 1,650 | AmSouth Bancorporation | 42,735 | ||||||||
| 15,930 | Bank of America Corp. | 748,550 | ||||||||
| 2,000 | BB&T Corp. | 84,100 | ||||||||
| 850 | Comerica, Inc. | 51,867 | ||||||||
| 450 | Compass Bancshares, Inc. | 21,902 | ||||||||
| 900 | Fifth Third Bancorp | 42,552 | ||||||||
| 450 | First Horizon National Corp. | 19,400 | ||||||||
| 1,050 | Huntington Bancshares, Inc. | 26,019 | ||||||||
| 2,050 | KeyCorp | 69,495 | ||||||||
| 450 | M & T Bank Corp. | 48,528 | ||||||||
| 1,050 | Marshall & Ilsley Corp. | 46,410 | ||||||||
| 1,600 | Mellon Financial Corp. | 49,776 | ||||||||
| 3,600 | National City Corp. | 135,180 | ||||||||
| 1,750 | North Fork Bancorporation, Inc. | 50,488 | ||||||||
| 900 | Northern Trust Corp. | 43,722 | ||||||||
| 450 | PNC Financial Services Group, Inc. | 25,848 | ||||||||
| 1,854 | Regions Financial Corp. | 65,984 | ||||||||
| 1,250 | State Street Corp. | 61,400 | ||||||||
| 1,400 | SunTrust Banks, Inc. | 103,432 | ||||||||
| 500 | Synovus Financial Corp. | 14,290 | ||||||||
| 3,000 | The Bank of New York Co., Inc. | 100,260 | ||||||||
| 7,350 | U.S. Bancorp | 230,201 | ||||||||
| 6,268 | Wachovia Corp. | 329,696 | ||||||||
| 6,550 | Wells Fargo & Co. | 407,082 | ||||||||
| 300 | Zions Bancorporation | 20,409 | ||||||||
| 2,839,326 | ||||||||||
| Beverages: 0.4% | ||||||||||
| 150 | Adolph Coors Co. | 11,351 | ||||||||
| 1,250 | Anheuser-Busch Cos., Inc. | 63,413 | ||||||||
| 650 | Brown-Forman Corp. | 31,642 | ||||||||
| 9,500 | Coca-Cola Co. | 395,485 | ||||||||
| 1,750 | Coca-Cola Enterprises, Inc. | 36,488 | ||||||||
| 1,200 | Pepsi Bottling Group, Inc. | 32,448 | ||||||||
| 8,950 | PepsiCo, Inc. | 467,189 | ||||||||
| 1,038,016 | ||||||||||
| Biotechnology: 0.2% | ||||||||||
| 5,050 | @ | Amgen, Inc. | 323,957 | |||||||
| 1,250 | @ | Biogen Idec, Inc. | 83,263 | |||||||
| 900 | @ | Genzyme Corp. | 52,263 | |||||||
| 950 | @ | MedImmune, Inc. | 25,755 | |||||||
| 300 | @ | Millipore Corp. | 14,943 | |||||||
| 500,181 | ||||||||||
| Building Materials: 0.0% | ||||||||||
| 1,200 | @ | American Standard Cos., Inc. | 49,584 | |||||||
| 1,650 | Masco Corp. | 60,275 | ||||||||
| 400 | Vulcan Materials Co. | 21,844 | ||||||||
| 131,703 | ||||||||||
| Chemicals: 0.3% | ||||||||||
| 900 | Air Products & Chemicals, Inc. | 52,173 | ||||||||
| 250 | Ashland, Inc. | 14,595 | ||||||||
| 3,650 | Dow Chemical Co. | 180,711 | ||||||||
| 4,000 | E.I. du Pont de Nemours & Co. | 196,199 | ||||||||
| 450 | Eastman Chemical Co. | 25,979 | ||||||||
| 450 | Ecolab, Inc. | 15,809 | ||||||||
| 650 | Engelhard Corp. | 19,936 | ||||||||
| 300 | International Flavors & Fragrances, Inc. | 12,852 | ||||||||
| 1,100 | PPG Industries, Inc. | 74,976 | ||||||||
| 1,250 | Praxair, Inc. | 55,188 | ||||||||
| 900 | Rohm & Haas Co. | 39,807 | ||||||||
| 1,000 | Sherwin-Williams Co. | 44,630 | ||||||||
| 250 | Sigma-Aldrich Corp. | 15,115 | ||||||||
| 747,970 | ||||||||||
| Commercial Services: 0.2% | ||||||||||
| 800 | @ | Apollo Group, Inc. | 64,568 | |||||||
| 4,200 | Cendant Corp. | 98,196 | ||||||||
| 450 | Equifax, Inc. | 12,645 | ||||||||
| 900 | H&R Block, Inc. | 44,100 | ||||||||
| 1,500 | McKesson Corp. | 47,190 | ||||||||
| 700 | Moody’s Corp. | 60,795 | ||||||||
| 1,450 | Paychex, Inc. | 49,416 | ||||||||
| 900 | R.R. Donnelley & Sons Co. | 31,761 | ||||||||
| 750 | Robert Half Intl., Inc. | 22,073 | ||||||||
| 430,744 | ||||||||||
| Computers: 0.9% | ||||||||||
| 550 | @ | Affiliated Computer Services, Inc. | 33,105 | |||||||
| 2,550 | @ | Apple Computer, Inc. | 164,220 | |||||||
| 700 | @ | Computer Sciences Corp. | 39,459 | |||||||
| 16,550 | @ | Dell, Inc. | 697,416 | |||||||
| 2,050 | Electronic Data Systems Corp. | 47,355 | ||||||||
| 8,950 | @ | EMC Corp. | 133,087 | |||||||
| 2,450 | @ | Gateway, Inc. | 14,725 | |||||||
| 11,900 | Hewlett-Packard Co. | 249,542 | ||||||||
| 8,850 | International Business Machines Corp. | 872,432 | ||||||||
| 600 | @ | Lexmark Intl., Inc. | 51,000 | |||||||
| 350 | @ | NCR Corp. | 24,231 | |||||||
| 1,750 | @ | Network Appliance, Inc. | 58,135 | |||||||
131
| Shares | Value | |||||||||
| Computers (continued) | ||||||||||
| 22,600 | @ | Sun Microsystems, Inc. | $ | 121,588 | ||||||
| 1,050 | @ | Sungard Data Systems, Inc. | 29,747 | |||||||
| 1,450 | @ | Unisys Corp. | 14,761 | |||||||
| 2,550,803 | ||||||||||
| Cosmetics/Personal Care: 0.5% | ||||||||||
| 450 | Alberto-Culver Co. | 21,857 | ||||||||
| 750 | Avon Products, Inc. | 29,025 | ||||||||
| 1,950 | Colgate-Palmolive Co. | 99,762 | ||||||||
| 6,700 | Gillette Co. | 300,026 | ||||||||
| 1,900 | Kimberly-Clark Corp. | 125,039 | ||||||||
| 17,000 | Procter & Gamble Co. | 936,360 | ||||||||
| 1,512,069 | ||||||||||
| Distribution/Wholesale: 0.0% | ||||||||||
| 1,200 | Genuine Parts Co. | 52,872 | ||||||||
| 600 | W.W. Grainger, Inc. | 39,972 | ||||||||
| 92,844 | ||||||||||
| Diversified Financial Services: 1.2% | ||||||||||
| 6,650 | American Express Co. | 374,860 | ||||||||
| 400 | Bear Stearns Cos., Inc. | 40,924 | ||||||||
| 1,650 | Capital One Financial Corp. | 138,947 | ||||||||
| 1,150 | CIT Group, Inc. | 52,693 | ||||||||
| 20,450 | Citigroup, Inc. | 985,280 | ||||||||
| 2,198 | Countrywide Financial Corp. | 81,348 | ||||||||
| 2,000 | @ | E*TRADE Financial Corp. | 29,900 | |||||||
| 3,750 | Fannie Mae | 267,037 | ||||||||
| 150 | Federated Investors, Inc. | 4,560 | ||||||||
| 1,000 | Franklin Resources, Inc. | 69,650 | ||||||||
| 2,700 | Freddie Mac | 198,990 | ||||||||
| 1,900 | Goldman Sachs Group, Inc. | 197,676 | ||||||||
| 350 | Janus Capital Group, Inc. | 5,884 | ||||||||
| 1,450 | Lehman Brothers Holdings, Inc. | 126,846 | ||||||||
| 4,700 | MBNA Corp. | 132,493 | ||||||||
| 3,750 | Merrill Lynch & Co., Inc. | 224,138 | ||||||||
| 4,300 | Morgan Stanley | 238,735 | ||||||||
| 1,700 | @ | Providian Financial Corp. | 27,999 | |||||||
| 1,600 | SLM Corp. | 85,424 | ||||||||
| 500 | T. Rowe Price Group, Inc. | 31,100 | ||||||||
| 3,314,484 | ||||||||||
| Electric: 0.4% | ||||||||||
| 2,430 | @ | AES Corp. | 33,218 | |||||||
| 300 | Ameren Corp. | 15,042 | ||||||||
| 1,450 | American Electric Power Co., Inc. | 49,793 | ||||||||
| 300 | Cinergy Corp. | 12,489 | ||||||||
| 1,000 | Consolidated Edison, Inc. | 43,750 | ||||||||
| 600 | Constellation Energy Group, Inc. | 26,226 | ||||||||
| 500 | Dominion Resources, Inc. | 33,870 | ||||||||
| 650 | DTE Energy Co. | 28,035 | ||||||||
| 6,250 | Duke Energy Corp. | 158,312 | ||||||||
| 1,550 | Edison Intl. | 49,647 | ||||||||
| 900 | Entergy Corp. | 60,831 | ||||||||
| 2,450 | Exelon Corp. | 107,971 | ||||||||
| 1,150 | FirstEnergy Corp. | 45,437 | ||||||||
| 900 | FPL Group, Inc. | 67,275 | ||||||||
| 1,600 | @ | PG&E Corp. | 53,248 | |||||||
| 600 | Pinnacle West Capital Corp. | 26,646 | ||||||||
| 1,000 | PPL Corp. | 53,280 | ||||||||
| 950 | Public Service Enterprise Group, Inc. | 49,182 | ||||||||
| 2,900 | Southern Co. | 97,208 | ||||||||
| 1,550 | TXU Corp. | 100,067 | ||||||||
| 2,250 | Xcel Energy, Inc. | 40,950 | ||||||||
| 1,152,477 | ||||||||||
| Electrical Components and Equipment: 0.1% | ||||||||||
| 2,200 | Emerson Electric Co. | 154,220 | ||||||||
| 154,220 | ||||||||||
| Electronics: 0.1% | ||||||||||
| 2,300 | @ | Agilent Technologies, Inc. | 55,429 | |||||||
| 950 | Applera Corp. — Applied Biosystems Group | 19,865 | ||||||||
| 500 | @ | Fisher Scientific Intl. | 31,190 | |||||||
| 1,100 | @ | Jabil Circuit, Inc. | 28,138 | |||||||
| 500 | Parker Hannifin Corp. | 37,869 | ||||||||
| 550 | PerkinElmer, Inc. | 12,370 | ||||||||
| 2,050 | @ | Sanmina-SCI Corp. | 17,364 | |||||||
| 1,500 | @ | Solectron Corp. | 7,995 | |||||||
| 350 | Tektronix, Inc. | 10,574 | ||||||||
| 1,000 | @ | Thermo Electron Corp. | 30,190 | |||||||
| 650 | @ | Waters Corp. | 30,414 | |||||||
| 281,398 | ||||||||||
| Engineering and Construction: 0.0% | ||||||||||
| 350 | Fluor Corp. | 19,079 | ||||||||
| 19,079 | ||||||||||
| Entertainment: 0.0% | ||||||||||
| 1,650 | International Game Technology | 56,727 | ||||||||
| 56,727 | ||||||||||
| Environmental Control: 0.0% | ||||||||||
| 2,050 | Waste Management, Inc. | 61,377 | ||||||||
| 61,377 | ||||||||||
| Food: 0.2% | ||||||||||
| 1,500 | Albertson’s, Inc. | 35,820 | ||||||||
| 1,600 | Campbell Soup Co. | 47,824 | ||||||||
| 1,900 | ConAgra Foods, Inc. | 55,955 | ||||||||
| 1,350 | General Mills, Inc. | 67,109 | ||||||||
| 1,350 | H.J. Heinz Co. | 52,637 | ||||||||
| 950 | Hershey Foods Corp. | 52,763 | ||||||||
| 1,450 | Kellogg Co. | 64,757 | ||||||||
| 1,100 | @ | Kroger Co. | 19,294 | |||||||
| 750 | McCormick & Co., Inc. | 28,950 | ||||||||
| 1,850 | @ | Safeway, Inc. | 36,519 | |||||||
| 2,800 | Sara Lee Corp. | 67,592 | ||||||||
| 650 | SUPERVALU, Inc. | 22,438 | ||||||||
| 1,450 | Wm. Wrigley Jr. Co. | 100,325 | ||||||||
| 651,983 | ||||||||||
| Forest Products and Paper: 0.1% | ||||||||||
| 1,450 | Georgia-Pacific Corp. | 54,346 | ||||||||
| 2,100 | International Paper Co. | 88,200 | ||||||||
| 600 | Louisiana-Pacific Corp. | 16,044 | ||||||||
| 1,000 | MeadWestvaco Corp. | 33,890 | ||||||||
| 750 | Plum Creek Timber Co., Inc. | 28,830 | ||||||||
| 300 | Temple-Inland, Inc. | 20,520 | ||||||||
| 1,350 | Weyerhaeuser Co. | 90,747 | ||||||||
| 332,577 | ||||||||||
| Gas: 0.0% | ||||||||||
| 750 | KeySpan Corp. | 29,588 | ||||||||
| 900 | Sempra Energy | 33,012 | ||||||||
| 62,600 | ||||||||||
| Hand/Machine Tools: 0.0% | ||||||||||
| 550 | Black & Decker Corp. | 48,581 | ||||||||
| 200 | Snap-On, Inc. | 6,872 | ||||||||
| 450 | Stanley Works | 22,046 | ||||||||
| 77,499 | ||||||||||
| Healthcare — Products: 0.7% | ||||||||||
| 250 | Bausch & Lomb, Inc. | 16,115 | ||||||||
| 950 | Baxter Intl., Inc. | 32,813 | ||||||||
132
| Shares | Value | |||||||||
| Healthcare — Products (continued) | ||||||||||
| 1,700 | Becton Dickinson & Co. | $ | 96,560 | |||||||
| 950 | Biomet, Inc. | 41,221 | ||||||||
| 3,050 | @ | Boston Scientific Corp. | 108,428 | |||||||
| 600 | C.R. Bard, Inc. | 38,388 | ||||||||
| 500 | Guidant Corp. | 36,050 | ||||||||
| 19,600 | Johnson & Johnson | 1,243,031 | ||||||||
| 4,750 | Medtronic, Inc. | 235,932 | ||||||||
| 1,700 | @ | St. Jude Medical, Inc. | 71,281 | |||||||
| 600 | Stryker Corp. | 28,950 | ||||||||
| 1,000 | @ | Zimmer Holdings, Inc. | 80,120 | |||||||
| 2,028,889 | ||||||||||
| Healthcare — Services: 0.3% | ||||||||||
| 1,000 | Aetna, Inc. | 124,750 | ||||||||
| 1,100 | @ | Humana, Inc. | 32,659 | |||||||
| 550 | @ | Laboratory Corp. Of America Holdings | 27,401 | |||||||
| 300 | Manor Care, Inc. | 10,629 | ||||||||
| 400 | Quest Diagnostics, Inc. | 38,220 | ||||||||
| 4,450 | UnitedHealth Group, Inc. | 391,734 | ||||||||
| 2,000 | @ | WellPoint, Inc. | 230,000 | |||||||
| 855,393 | ||||||||||
| Home Builders: 0.0% | ||||||||||
| 250 | Centex Corp. | 14,895 | ||||||||
| 14,895 | ||||||||||
| Home Furnishings: 0.0% | ||||||||||
| 900 | Leggett & Platt, Inc. | 25,587 | ||||||||
| 400 | Whirlpool Corp. | 27,684 | ||||||||
| 53,271 | ||||||||||
| Household Products/Wares: 0.0% | ||||||||||
| 550 | Avery Dennison Corp. | 32,984 | ||||||||
| 1,000 | Clorox Co. | 58,930 | ||||||||
| 550 | Fortune Brands, Inc. | 42,449 | ||||||||
| 134,363 | ||||||||||
| Housewares: 0.0% | ||||||||||
| 1,150 | Newell Rubbermaid, Inc. | 27,819 | ||||||||
| 27,819 | ||||||||||
| Insurance: 0.8% | ||||||||||
| 1,150 | @@ | ACE Ltd. | 49,163 | |||||||
| 2,000 | AFLAC, Inc. | 79,680 | ||||||||
| 2,700 | Allstate Corp. | 139,643 | ||||||||
| 400 | AMBAC Financial Group, Inc. | 32,852 | ||||||||
| 10,200 | American Intl. Group, Inc. | 669,833 | ||||||||
| 1,150 | AON Corp. | 27,439 | ||||||||
| 1,300 | Chubb Corp. | 99,970 | ||||||||
| 900 | CIGNA Corp. | 73,413 | ||||||||
| 660 | Cincinnati Financial Corp. | 29,212 | ||||||||
| 1,500 | Hartford Financial Services Group, Inc. | 103,965 | ||||||||
| 750 | Jefferson-Pilot Corp. | 38,970 | ||||||||
| 650 | Lincoln National Corp. | 30,342 | ||||||||
| 1,300 | Loews Corp. | 91,390 | ||||||||
| 850 | Marsh & McLennan Cos., Inc. | 27,965 | ||||||||
| 600 | MBIA, Inc. | 37,968 | ||||||||
| 2,900 | MetLife, Inc. | 117,479 | ||||||||
| 550 | MGIC Investment Corp. | 37,901 | ||||||||
| 1,250 | Principal Financial Group | 51,175 | ||||||||
| 800 | Progressive Corp. | 67,872 | ||||||||
| 3,300 | Prudential Financial, Inc. | 181,367 | ||||||||
| 700 | Safeco Corp. | 36,568 | ||||||||
| 1,050 | St. Paul Travelers Cos., Inc. | 38,924 | ||||||||
| 450 | Torchmark Corp. | 25,713 | ||||||||
| 1,300 | UnumProvident Corp. | 23,322 | ||||||||
| 700 | @@ | XL Capital Ltd. | 54,355 | |||||||
| 2,166,481 | ||||||||||
| Internet: 0.2% | ||||||||||
| 2,600 | @ | eBay, Inc. | 302,328 | |||||||
| 3,800 | @ | Symantec Corp. | 97,888 | |||||||
| 5,300 | @ | Yahoo!, Inc. | 199,704 | |||||||
| 599,920 | ||||||||||
| Iron/Steel: 0.0% | ||||||||||
| 600 | Nucor Corp. | 31,404 | ||||||||
| 650 | United States Steel Corp. | 33,313 | ||||||||
| 64,717 | ||||||||||
| Leisure Time: 0.1% | ||||||||||
| 600 | Brunswick Corp. | 29,700 | ||||||||
| 2,300 | Carnival Corp. | 132,549 | ||||||||
| 1,150 | Harley-Davidson, Inc. | 69,863 | ||||||||
| 450 | Sabre Holdings Corp. | 9,972 | ||||||||
| 242,084 | ||||||||||
| Lodging: 0.1% | ||||||||||
| 400 | Harrah’s Entertainment, Inc. | 26,756 | ||||||||
| 1,400 | Hilton Hotels Corp. | 31,836 | ||||||||
| 1,200 | Marriott Intl., Inc. | 75,576 | ||||||||
| 950 | Starwood Hotels & Resorts Worldwide, Inc. | 55,480 | ||||||||
| 189,648 | ||||||||||
| Machinery — Construction and Mining: 0.0% | ||||||||||
| 550 | Caterpillar, Inc. | 53,631 | ||||||||
| 53,631 | ||||||||||
| Machinery — Diversified: 0.0% | ||||||||||
| 200 | Cummins, Inc. | 16,758 | ||||||||
| 1,000 | Deere & Co. | 74,400 | ||||||||
| 850 | Rockwell Automation, Inc. | 42,118 | ||||||||
| 133,276 | ||||||||||
| Media: 0.6% | ||||||||||
| 8,800 | @ | Comcast Corp. | 292,864 | |||||||
| 1,000 | Gannett Co., Inc. | 81,700 | ||||||||
| 350 | Knight-Ridder, Inc. | 23,429 | ||||||||
| 1,250 | McGraw-Hill Cos., Inc. | 114,425 | ||||||||
| 200 | Meredith Corp. | 10,840 | ||||||||
| 600 | New York Times Co. | 24,480 | ||||||||
| 10,350 | News Corp. | 193,131 | ||||||||
| 17,750 | @ | Time Warner, Inc. | 345,059 | |||||||
| 500 | Tribune Co. | 21,070 | ||||||||
| 6,800 | Viacom, Inc. | 247,452 | ||||||||
| 8,050 | Walt Disney Co. | 223,790 | ||||||||
| 1,578,240 | ||||||||||
| Mining: 0.0% | ||||||||||
| 500 | Phelps Dodge Corp. | 49,460 | ||||||||
| 49,460 | ||||||||||
| Miscellaneous Manufacturing: 0.9% | ||||||||||
| 3,100 | 3M Co. | 254,417 | ||||||||
| 450 | Cooper Industries Ltd. | 30,551 | ||||||||
| 1,100 | Danaher Corp. | 63,151 | ||||||||
| 350 | Dover Corp. | 14,679 | ||||||||
| 1,400 | Eastman Kodak Co. | 45,150 | ||||||||
| 600 | Eaton Corp. | 43,416 | ||||||||
| 41,700 | General Electric Co. | 1,522,049 | ||||||||
| 3,150 | Honeywell Intl., Inc. | 111,542 | ||||||||
| 1,150 | Illinois Tool Works, Inc. | 106,582 | ||||||||
| 650 | @@ | Ingersoll-Rand Co. | 52,195 | |||||||
| 350 | ITT Industries, Inc. | 29,558 | ||||||||
| 200 | Pall Corp. | 5,790 | ||||||||
| 650 | Textron, Inc. | 47,970 | ||||||||
| 7,950 | @@ | Tyco Intl., Ltd. | 284,132 | |||||||
| 2,611,182 | ||||||||||
133
| Shares | Value | |||||||||
| Office/Business Equipment: 0.0% | ||||||||||
| 1,100 | Pitney Bowes, Inc. | $ | 50,908 | |||||||
| 5,000 | @ | Xerox Corp. | 85,050 | |||||||
| 135,958 | ||||||||||
| Oil and Gas: 1.3% | ||||||||||
| 600 | Amerada Hess Corp. | 49,428 | ||||||||
| 1,200 | Anadarko Petroleum Corp. | 77,772 | ||||||||
| 1,150 | Apache Corp. | 58,156 | ||||||||
| 2,350 | Burlington Resources, Inc. | 102,225 | ||||||||
| 10,600 | ChevronTexaco Corp. | 556,605 | ||||||||
| 4,350 | ConocoPhillips | 377,710 | ||||||||
| 3,100 | Devon Energy Corp. | 120,652 | ||||||||
| 400 | EOG Resources, Inc. | 28,544 | ||||||||
| 32,600 | Exxon Mobil Corp. | 1,671,075 | ||||||||
| 700 | Kerr-McGee Corp. | 40,453 | ||||||||
| 1,250 | Marathon Oil Corp. | 47,013 | ||||||||
| 300 | @,@@ | Nabors Industries, Ltd. | 15,387 | |||||||
| 700 | @ | Noble Corp. | 34,818 | |||||||
| 1,600 | Occidental Petroleum Corp. | 93,376 | ||||||||
| 450 | Sunoco, Inc. | 36,770 | ||||||||
| 1,100 | @ | Transocean, Inc. | 46,629 | |||||||
| 1,250 | Unocal Corp. | 54,050 | ||||||||
| 1,800 | Valero Energy Corp. | 81,720 | ||||||||
| 3,492,383 | ||||||||||
| Oil and Gas Services: 0.1% | ||||||||||
| 1,300 | Baker Hughes, Inc. | 55,471 | ||||||||
| 700 | BJ Services Co. | 32,578 | ||||||||
| 1,600 | Halliburton Co. | 62,784 | ||||||||
| 150,833 | ||||||||||
| Packaging and Containers: 0.0% | ||||||||||
| 600 | Ball Corp. | 26,388 | ||||||||
| 600 | Bemis Co. | 17,454 | ||||||||
| 600 | @ | Pactiv Corp. | 15,174 | |||||||
| 450 | @ | Sealed Air Corp. | 23,972 | |||||||
| 82,988 | ||||||||||
| Pharmaceuticals: 0.9% | ||||||||||
| 6,100 | Abbott Laboratories | 284,564 | ||||||||
| 500 | Allergan, Inc. | 40,535 | ||||||||
| 500 | AmerisourceBergen Corp. | 29,340 | ||||||||
| 7,550 | Bristol-Myers Squibb Co. | 193,431 | ||||||||
| 2,250 | Cardinal Health, Inc. | 130,838 | ||||||||
| 3,050 | @ | Caremark Rx, Inc. | 120,262 | |||||||
| 1,750 | Eli Lilly & Co. | 99,313 | ||||||||
| 300 | @ | Express Scripts, Inc. | 22,932 | |||||||
| 1,350 | @ | Forest Laboratories, Inc. | 60,561 | |||||||
| 1,700 | @ | Gilead Sciences, Inc. | 59,483 | |||||||
| 800 | @ | Hospira, Inc. | 26,800 | |||||||
| 700 | @ | King Pharmaceuticals, Inc. | 8,680 | |||||||
| 1,108 | @ | Medco Health Solutions, Inc. | 46,093 | |||||||
| 8,700 | Merck & Co., Inc. | 279,617 | ||||||||
| 29,750 | Pfizer, Inc. | 799,977 | ||||||||
| 5,650 | Schering-Plough Corp. | 117,972 | ||||||||
| 5,250 | Wyeth | 223,597 | ||||||||
| 2,543,995 | ||||||||||
| Pipelines: 0.0% | ||||||||||
| 2,150 | El Paso Corp. | 22,360 | ||||||||
| 200 | Kinder Morgan, Inc. | 14,626 | ||||||||
| 1,750 | Williams Cos., Inc. | 28,508 | ||||||||
| 65,494 | ||||||||||
| Real Estate Investment Trusts: 0.0% | ||||||||||
| 650 | Equity Office Properties Trust | 18,928 | ||||||||
| 700 | ProLogis | 30,331 | ||||||||
| 850 | Simon Property Group, Inc. | 54,970 | ||||||||
| 104,229 | ||||||||||
| Retail: 1.2% | ||||||||||
| 1,150 | @ | Bed Bath & Beyond, Inc. | 45,805 | |||||||
| 1,150 | Best Buy Co., Inc. | 68,333 | ||||||||
| 1,100 | Circuit City Stores, Inc. | 17,204 | ||||||||
| 3,100 | Costco Wholesale Corp. | 150,071 | ||||||||
| 1,400 | CVS Corp. | 63,098 | ||||||||
| 500 | Darden Restaurants, Inc. | 13,870 | ||||||||
| 850 | Federated Department Stores, Inc. | 49,122 | ||||||||
| 4,650 | Gap, Inc. | 98,208 | ||||||||
| 14,500 | Home Depot, Inc. | 619,729 | ||||||||
| 1,800 | J.C. Penney Co., Inc. Holding Co. | 74,520 | ||||||||
| 500 | @ | Kohl’s Corp. | 24,585 | |||||||
| 1,950 | Limited Brands, Inc. | 44,889 | ||||||||
| 2,900 | Lowe’s Cos., Inc. | 167,011 | ||||||||
| 1,500 | May Department Stores Co. | 44,100 | ||||||||
| 8,450 | McDonald’s Corp. | 270,907 | ||||||||
| 500 | Nordstrom, Inc. | 23,365 | ||||||||
| 1,500 | @ | Office Depot, Inc. | 26,040 | |||||||
| 550 | RadioShack Corp. | 18,084 | ||||||||
| 3,400 | Staples, Inc. | 114,614 | ||||||||
| 2,100 | @ | Starbucks Corp. | 130,956 | |||||||
| 3,600 | Target Corp. | 186,948 | ||||||||
| 1,900 | TJX Cos., Inc. | 47,747 | ||||||||
| 700 | @ | Toys R US, Inc. | 14,329 | |||||||
| 16,500 | Wal-Mart Stores, Inc. | 871,529 | ||||||||
| 3,950 | Walgreen Co. | 151,562 | ||||||||
| 700 | Wendy’s Intl., Inc. | 27,482 | ||||||||
| 1,100 | Yum! Brands, Inc. | 51,898 | ||||||||
| 3,416,006 | ||||||||||
| Savings and Loans: 0.1% | ||||||||||
| 1,100 | Golden West Financial Corp. | 67,562 | ||||||||
| 550 | Sovereign Bancorp, Inc. | 12,403 | ||||||||
| 3,450 | Washington Mutual, Inc. | 145,866 | ||||||||
| 225,831 | ||||||||||
| Semiconductors: 0.4% | ||||||||||
| 1,850 | @ | Altera Corp. | 38,295 | |||||||
| 1,550 | Analog Devices, Inc. | 57,226 | ||||||||
| 6,050 | @ | Applied Materials, Inc. | 103,454 | |||||||
| 1,380 | @ | Freescale Semiconductor Inc. | 25,337 | |||||||
| 25,550 | Intel Corp. | 597,614 | ||||||||
| 750 | @ | KLA-Tencor Corp. | 34,935 | |||||||
| 1,200 | Linear Technology Corp. | 46,512 | ||||||||
| 550 | Maxim Integrated Products, Inc. | 23,315 | ||||||||
| 1,550 | National Semiconductor Corp. | 27,823 | ||||||||
| 2,700 | Texas Instruments, Inc. | 66,474 | ||||||||
| 1,020,985 | ||||||||||
| Software: 0.8% | ||||||||||
| 1,150 | Adobe Systems, Inc. | 72,151 | ||||||||
| 1,300 | Autodesk, Inc. | 49,335 | ||||||||
| 2,150 | Automatic Data Processing, Inc. | 95,353 | ||||||||
| 1,300 | @ | BMC Software, Inc. | 24,180 | |||||||
| 700 | @ | Citrix Systems, Inc. | 17,171 | |||||||
| 2,100 | Computer Associates Intl., Inc. | 65,226 | ||||||||
| 2,600 | @ | Compuware Corp. | 16,822 | |||||||
| 500 | @ | Electronic Arts, Inc. | 30,840 | |||||||
| 3,422 | First Data Corp. | 145,571 | ||||||||
| 1,000 | @ | Fiserv, Inc. | 40,190 | |||||||
| 850 | IMS Health, Inc. | 19,729 | ||||||||
| 950 | @ | Intuit, Inc. | 41,810 | |||||||
| 42,600 | Microsoft Corp. | 1,137,845 | ||||||||
| 1,250 | @ | Novell, Inc. | 8,438 | |||||||
| 35,100 | @ | Oracle Corp. | 481,571 | |||||||
| 1,850 | @ | PeopleSoft, Inc. | 48,988 | |||||||
| 2,400 | @ | Siebel Systems, Inc. | 25,200 | |||||||
| 2,100 | @ | Veritas Software Corp. | 59,955 | |||||||
| 2,380,375 | ||||||||||
134
| Shares | Value | |||||||||
| Telecommunications: 1.0% | ||||||||||
| 1,750 | Alltel Corp. | $ | 102,830 | |||||||
| 1,250 | AT&T Corp. | 23,825 | ||||||||
| 1,700 | @ | Avaya, Inc. | 29,240 | |||||||
| 7,300 | BellSouth Corp. | 202,867 | ||||||||
| 800 | CenturyTel, Inc. | 28,376 | ||||||||
| 26,400 | @ | Cisco Systems, Inc. | 509,519 | |||||||
| 1,600 | Citizens Communications Co. | 22,064 | ||||||||
| 850 | @ | Comverse Technology, Inc. | 20,783 | |||||||
| 2,100 | @ | Corning, Inc. | 24,717 | |||||||
| 16,450 | @ | Lucent Technologies, Inc. | 61,852 | |||||||
| 9,200 | Motorola, Inc. | 158,240 | ||||||||
| 4,700 | @ | Nextel Communications, Inc. | 141,000 | |||||||
| 6,400 | QUALCOMM, Inc. | 271,360 | ||||||||
| 2,850 | @ | Qwest Communications Intl., Inc. | 12,654 | |||||||
| 13,200 | SBC Communications, Inc. | 340,164 | ||||||||
| 850 | Scientific-Atlanta, Inc. | 28,059 | ||||||||
| 5,700 | Sprint Corp. | 141,645 | ||||||||
| 2,000 | @ | Tellabs, Inc. | 17,180 | |||||||
| 14,500 | Verizon Communications, Inc. | 587,394 | ||||||||
| 2,723,769 | ||||||||||
| Textiles: 0.0% | ||||||||||
| 600 | Cintas Corp. | 26,316 | ||||||||
| 26,316 | ||||||||||
| Toys/Games/Hobbies: 0.0% | ||||||||||
| 850 | Hasbro, Inc. | 16,473 | ||||||||
| 1,600 | Mattel, Inc. | 31,184 | ||||||||
| 47,657 | ||||||||||
| Transportation: 0.3% | ||||||||||
| 1,900 | Burlington Northern Santa Fe Corp. | 89,889 | ||||||||
| 900 | CSX Corp. | 36,072 | ||||||||
| 1,950 | FedEx Corp. | 192,056 | ||||||||
| 2,000 | Norfolk Southern Corp. | 72,380 | ||||||||
| 250 | Ryder System, Inc. | 11,943 | ||||||||
| 4,400 | United Parcel Service, Inc. | 376,023 | ||||||||
| 778,363 | ||||||||||
| Total Common Stock (Cost $41,699,544) | 46,494,496 | |||||||||
| Principal | ||||||||||
| Amount | Value | |||||||||
| U.S. GOVERNMENT AGENCY OBLIGATIONS: 77.9% | ||||||||||
| Federal Home Loan Mortgage Corporation: 25.9% | ||||||||||
| $ | 80,000,000 | STRIP | 3.750%, due 10/15/08 | $ | 69,594,320 | |||||
| 5,375,000 | 3.790%, due 07/15/08 | 4,731,403 | ||||||||
| 74,325,723 | ||||||||||
| Federal National Mortgage Association: 27.5% | ||||||||||
| 89,000,000 | 3.870%, due 05/15/08 | 78,600,260 | ||||||||
| 78,600,260 | ||||||||||
| Other: 24.5% | ||||||||||
| 14,205,000 | FICO STRIP, 3.750%, due 06/27/08 | 12,540,827 | ||||||||
| 5,763,000 | FICO STRIP, 3.840%, due 10/06/08 | 5,025,561 | ||||||||
| 55,000,000 | Resolution Funding Corp Interest STRIP, 3.590%, due 07/15/08 | 48,719,441 | ||||||||
| 4,604,000 | Tennessee Valley Authority, 3.930%, due 07/15/08 | 4,035,249 | ||||||||
| 70,321,078 | ||||||||||
| Total U.S. Government Agency Obligations (Cost $233,698,552) | 223,247,061 | |||||||||
| U.S. TREASURY OBLIGATIONS: 5.3% | ||||||||||
| U.S. Treasury STRIP: 5.3% | ||||||||||
| 17,086,000 | 3.360%, due 05/15/08 | 15,283,000 | ||||||||
| Total U.S. Treasury Obligations (Cost $15,250,497) | 15,283,000 | |||||||||
| Total Long-Term Investments (Cost $290,648,593) | 285,024,557 | |||||||||
| SHORT-TERM INVESTMENTS: 0.7% | ||||||||||
| Repurchase Agreement: 0.7% | ||||||||||
| 1,904,000 | Morgan Stanley Repurchase Agreement dated 12/31/04, 2.2000% due 01/03/05, $1,904,349 to be received upon repurchase (Collateralized by $1,810,000 Federal Farm Credit Bank, 5.770%, Market Value plus accrued interest $1,963,432, due 01/05/27) | 1,904,000 | ||||||||
| Total Short-Term Investments (Cost $1,904,000) | 1,904,000 | |||||||||
Total Investments In Securities (Cost $292,552,593)* | 100.1 | % | $ | 286,928,557 | ||||||||
Other Assets and Liabilities-Net | (0.1 | ) | (222,532 | ) | ||||||||
Net Assets | 100.0 | % | $ | 286,706,025 | ||||||||
| @ | Non-income producing security | |
| @@ | Foreign issuer | |
| STRIP | Separate Trading of Registered Interest and Principal of Securities | |
| * | Cost for federal income tax purposes is $293,281,831. Net unrealized depreciation consists of: |
| Gross Unrealized Appreciation | $ | 5,136,052 | ||
| Gross Unrealized Depreciation | (11,489,326 | ) | ||
| Net Unrealized Depreciation | $ | (6,353,274 | ) | |
135
Dividends paid during the year ended December 31, 2004 were as follows:
| Fund Name | Type | Per Share Amount | ||||||
| GET H | NII | $ | 0.4783 | |||||
| GET I | NII | $ | 0.4234 | |||||
| GET J | NII | $ | 0.4504 | |||||
| GET K | NII | $ | 0.3685 | |||||
| GET L | NII | $ | 0.4250 | |||||
| GET M | NII | $ | 0.4505 | |||||
| GET N | NII | $ | 0.3587 | |||||
| GET P | NII | $ | 0.3859 | |||||
| GET Q | NII | $ | 0.3829 | |||||
| GET R | NII | $ | 0.3468 | |||||
| GET S | NII | $ | 0.2896 | |||||
| STCG | $ | 0.1239 | ||||||
| LTCG | $ | 0.0430 | ||||||
| GET T | NII | $ | 0.3065 | |||||
| STCG | $ | 0.1788 | ||||||
| LTCG | $ | 0.0020 | ||||||
| GET U | NII | $ | 0.2114 | |||||
| STCG | $ | 0.4590 | ||||||
| LTCG | $ | 0.0014 | ||||||
| GET V | NII | $ | 0.1083 | |||||
NII — Net investment income
Of the ordinary distributions made during the year ended December 31, 2004, the following percentages qualify for the dividends received deduction available to corporate shareholders:
| GET H: | 3.08 | % | ||
| GET I: | 2.12 | % | ||
| GET J: | 97.95 | % | ||
| GET K: | 0.48 | % | ||
| GET L: | 2.39 | % | ||
| GET M: | 3.10 | % | ||
| GET N: | 6.26 | % | ||
| GET P: | 4.68 | % | ||
| GET Q: | 7.70 | % | ||
| GET R: | 10.74 | % | ||
| GET S: | 9.45 | % | ||
| GET T: | 8.87 | % | ||
| GET U: | 6.87 | % | ||
| GET V: | 18.67 | % |
Above figures may differ from those cited elsewhere in this report due to differences in the calculation of income and gains under accounting principles generally accepted in the United States of America (book) purposes and Internal Revenue Service (tax) purposes.
Shareholders are strongly advised to consult their own tax advisers with respect to the tax consequences of their investments in the Funds. In January, shareholders, excluding corporate shareholders, receive an IRS 1099-DIV regarding the federal tax status of the dividends and distributions they received in the calendar year.
136
The business and affairs of the Funds are managed under the direction of the Trust’s Board of Trustees. A director who is not an interested person of the Funds, as defined in the 1940 Act, is an independent director (“Non-Interested Trustee”). The Trustees of the Funds are listed below. The Statement of Additional Information includes additional information about directors of the Registrant and is available, without charge, upon request at 1-800-992-0180.
| Principal | ||||||
| Position(s) | Term of Office | Occupation(s) | ||||
| held with | and Length of | during the Past Five | ||||
| Name, Address and Age | the Trust | Time Served(1) | Years | |||
Non-Interested Directors: | ||||||
| Albert E. DePrince, Jr. 7337 E. Doubletree Ranch Rd. Scottsdale, AZ 85258 Born: 1941 | Trustee | June 1998 — Present | Professor of Economics and Finance, Middle Tennessee State University (August 1991 to Present). Formerly, Director, Business and Economic Research Center (August 1999 — August 2002). | |||
| Maria T. Fighetti 7337 E. Doubletree Ranch Rd. Scottsdale, AZ 85258 Born: 1943 | Trustee | April 1994 — Present | Retired. Formerly, Attorney, New York City Department of Mental Health (June 1973 — October 2002) and Associate Commissioner (1995 — 2002). | |||
| Sidney Koch 7337 E. Doubletree Ranch Rd. Scottsdale, AZ 85258 Born: 1935 | Trustee | April 1994 — Present | Financial Adviser, Self-Employed (January 1993 — Present). | |||
| Corine T. Norgaard 7337 E. Doubletree Ranch Rd. Scottsdale, AZ 85258 Born: 1937 | Trustee | June 1991 — Present | Retired. Formerly, Dean, Barney School of Business, University of Hartford (August 1996 — May 2004). | |||
| Edward T. O’Dell 7337 E. Doubletree Ranch Rd. Scottsdale, AZ 85258 Born: 1935 | Trustee | June 2002 — Present | Retired. Formerly, Partner/Chairman of Financial Service Group, Goodwin Procter LLP (June 1966 — September 2000); | |||
| Joseph E. Obermeyer(2) 7337 E. Doubletree Ranch Rd. Scottsdale, AZ 85258 Born: 1957 | Trustee | January 2003 — Present | President, Obermeyer & Associates, Inc. (Consulting firm) (November 1999 — Present). | |||
[Additional columns below]
[Continued from above table, first column(s) repeated]
| Number of | ||||
| Portfolios | ||||
| in Fund | ||||
| Complex | ||||
| Overseen | Other Directorships | |||
| Name, Address and Age | by Trustee | held by Trustee | ||
Non-Interested Directors: | ||||
| Albert E. DePrince, Jr. 7337 E. Doubletree Ranch Rd. Scottsdale, AZ 85258 Born: 1941 | 48 | Director, International Atlantic Economic Society (October 2002 — Present); Academy of Economics and Finance (February 2001 — Present). | ||
| Maria T. Fighetti 7337 E. Doubletree Ranch Rd. Scottsdale, AZ 85258 Born: 1943 | 48 | None | ||
| Sidney Koch 7337 E. Doubletree Ranch Rd. Scottsdale, AZ 85258 Born: 1935 | 48 | Director, Northwest Center for the Arts, Torrington, CT. | ||
| Corine T. Norgaard 7337 E. Doubletree Ranch Rd. Scottsdale, AZ 85258 Born: 1937 | 48 | Director/Trustee, Mass Mutual Corporate and Participation Investors (April 1997 — Present) Director, Advest Trust Company (1998 — Present); Director, Connecticut Health Foundation (2002 — Present). | ||
| Edward T. O’Dell 7337 E. Doubletree Ranch Rd. Scottsdale, AZ 85258 Born: 1935 | 48 | None | ||
| Joseph E. Obermeyer(2) 7337 E. Doubletree Ranch Rd. Scottsdale, AZ 85258 Born: 1957 | 48 | None |
137
| Principal | ||||||
| Position(s) | Term of Office | Occupation(s) | ||||
| held with | and Length of | during the Past Five | ||||
| Name, Address and Age | the Trust | Time Served(1) | Years | |||
Directors who are “Interested Persons” | ||||||
| J. Scott Fox(3) ING Investment Management Co. 10 State House Square Hartford, CT 06103 Born: 1955 | Trustee | December 1997 — Present | Vice Chairman and Chief Operating Officer, ING Investment Management (September 2002 — Present); President and Chief Executive Officer (April 2001 — Present). Formerly, Managing Director and Chief Operating Officer (April 1994 — April 2001), Aeltus Investment Management, Inc. | |||
| Thomas J. McInerney(4) 7337 E. Doubletree Ranch Rd. Scottsdale, AZ 85258 Born: 1956 | Trustee | April 2002 — Present | Chief Executive Officer, ING U.S. Financial Services (September 2001 — Present); Member, ING Americas Executive Committee (2001 — Present); ING Aeltus Holding Company, Inc. (2000 — Present), ING Retail Holding Company (1998 — Present), and ING Retirement Holdings, Inc. (1997 — Present). Formerly, President, ING Life Insurance Annuity Company (September 1997 — November 2002); President, Chief Executive Officer and Director of Northern Life Insurance Company (March 2001 — October 2002); General Manager and Chief Executive Officer, ING Worksite Division (December 2000 — October 2001), President, ING-SCI, Inc. (August 1997 — December 2000); President, Aetna Financial Services (August 1997 — December 2000). | |||
[Additional columns below]
[Continued from above table, first column(s) repeated]
| Number of | ||||
| Portfolios | ||||
| in Fund | ||||
| Complex | ||||
| Overseen | Other Directorships | |||
| Name, Address and Age | by Trustee | held by Trustee | ||
Directors who are “Interested Persons” | ||||
| J. Scott Fox(3) ING Investment Management Co. 10 State House Square Hartford, CT 06103 Born: 1955 | 48 | Director of IPC Financial Network, Inc. (January 2001 — Present); Director, Metro Hartford Chamber of Commerce and The Greater Hartford Arts Council. | ||
| Thomas J. McInerney(4) 7337 E. Doubletree Ranch Rd. Scottsdale, AZ 85258 Born: 1956 | 161 | Director, Equitable Life Insurance Co., Golden American Life Insurance Co., Life Insurance Company of Georgia, Midwestern United Life Insurance Co., ReliaStar Life Insurance Co., Security Life of Denver, Security Connecticut Life Insurance Co., Southland Life Insurance Co., USG Annuity and Life Company, and United Life and Annuity Insurance Co., Inc. (March 2001 — Present); Member of the Board, Bushnell Performing Arts Center; St. Francis Hospital; National Conference for Community Justice; and Metro Atlanta Chamber of Commerce. |
| (1) | Trustees serve until their successors are duly elected and qualified, subject to the Board’s retirement policy. |
| (2) | Mr. Obermeyer was elected to the Board on January 1, 2003. |
| (3) | Mr. Fox is an “interested person,” as defined under the 1940 Act, because of his relationship with ING IM, an affiliate of ING Investments. |
| (4) | Mr. McInerney is an “interested person,” as defined under the 1940 Act, because of his affiliation with ING Groep N.V., the parent corporation of the Investment Manager, ING Investments, LLC and the Distributor, ING Funds Distributor, LLC. |
138
| Position(s) | Term of Office | |||||
| held with | and Length of | Principal Occupation(s) | ||||
| Name, Address and Age | the Trust | Time Served(1) | during the Past Five Years | |||
| James M. Hennessy 7337 E. Doubletree Ranch Rd. Scottsdale, AZ 85258 Born: 1949 | President, Chief Executive Officer and Chief Operating Officer | March 2002 — Present | President and Chief Executive Officer, ING Investments, LLC (December 2000 — Present). Formerly, Senior Executive Vice President and Chief Operating Officer, ING Investments, LLC (April 1995 — December 2000); and Executive Vice President, ING Investments, LLC (May 1998 — June 2000). | |||
| Michael J. Roland 7337 E. Doubletree Ranch Rd. Scottsdale, AZ 85258 Born: 1958 | Executive Vice President and Assistant Secretary Principal Financial Officer | April 2002 — Present March 2002 — Present | Executive Vice President, Chief Financial Officer, Treasurer, (December 2001 — Present) and Chief Compliance Officer (October 2004 — Present) ING Investments, LLC. Formerly, Senior Vice President, ING Investments, LLC (June 1998 — December 2001). | |||
| Stanley D. Vyner 7337 E. Doubletree Ranch Rd. Scottsdale, AZ 85258 Born: 1950 | Executive Vice President | March 2002 — Present | Executive Vice President, ING Investments, LLC (July 2000 — Present) and Chief Investment Risk Officer (January 2003 — Present); Formerly, Chief Investment Officer of the International Portfolios, ING Investments, LLC (August 2000 — January 2003); and Chief Executive Officer, ING Investments, LLC (August 1996 — August 2000). | |||
| Joseph M. O’Donnell 7337 E. Doubletree Ranch Rd. Scottsdale, AZ 85258 Born: 1954 | Chief Compliance Officer | November 2004 — Present | Chief Compliance Officer of the ING Funds (November 2004 — Present). Formerly, Vice President, Chief Legal Counsel, Chief Compliance Officer and Secretary of Atlas Securities, Inc., Atlas Advisers, Inc. and Atlas Funds (October 2001 — October 2004); and Chief Operating Officer and General Counsel of Matthews International Capital Management LLC and Vice President and Secretary of Matthews International Funds (August 1999 — May 2001). | |||
| Robert S. Naka 7337 E. Doubletree Ranch Rd. Scottsdale, AZ 85258 Born: 1963 | Senior Vice President and Assistant Secretary | March 2002 — Present | Senior Vice President and Assistant Secretary, ING Funds Services, LLC (October 2001 — Present). Formerly, Senior Vice President, ING Funds Services, LLC (August 1999 — October 2001). | |||
| Kimberly A. Anderson 7337 E. Doubletree Ranch Rd. Scottsdale, AZ 85258 Born: 1964 | Senior Vice President | December 2003 — Present | Senior Vice President, ING Investments, LLC (October 2003 — Present). Formerly, Vice President and Assistant Secretary, ING Investments, LLC (October 2001 — October 2003); and Assistant Vice President, ING Funds Services, LLC (November 1999 — January 2001). | |||
| Robyn L. Ichilov 7337 E. Doubletree Ranch Rd. Scottsdale, AZ 85258 Born: 1967 | Vice President and Treasurer | March 2002 — Present | Vice President, ING Funds Services, LLC (October 2001 — Present) and ING Investments, LLC (August 1997 — Present). | |||
| Lauren D. Bensinger 7337 E. Doubletree Ranch Rd. Scottsdale, AZ 85258 Born: 1954 | Vice President | March 2003 — Present | Vice President and Chief Compliance Officer, ING Funds Distributor, LLC (July 1995 — Present); and Vice President (February 1996 — Present). Formerly, Chief Compliance Officer (October 2001 — October 2004), ING Investments, LLC. | |||
139
| Position(s) | Term of Office | |||||
| held with | and Length of | Principal Occupation(s) | ||||
| Name, Address and Age | the Trust | Time Served(1) | during the Past Five Years | |||
| Todd Modic 7337 E. Doubletree Ranch Rd. Scottsdale, AZ 85258 Born: 1967 | Vice President | September 2003 — Present | Vice President of Financial Reporting, Fund Accounting, ING Funds Services, LLC (September 2002 — Present). Formerly, Director of Financial Reporting, ING Investments, LLC (March 2001 — September 2002); Director of Financial Reporting, Axient Communications, Inc. (May 2000 — January 2001); and Director of Finance, Rural/Metro Corporation (March 1995 — May 2000). | |||
| Maria M. Anderson 7337 E. Doubletree Ranch Rd. Scottsdale, AZ 85258 Born: 1958 | Vice President | September 2004 — Present | Vice President, ING Funds Services, LLC (September 2004 — Present). Formerly, Assistant Vice President, ING Funds Services, LLC (October 2001 — September 2004); Manager of Fund Accounting and Fund Compliance, ING Investments, LLC (September 1999 — October 2001). | |||
| Susan P. Kinens 7337 E. Doubletree Ranch Rd. Scottsdale, AZ 85258 Born: 1976 | Assistant Vice President | March 2003 — Present | Assistant Vice President, ING Funds Services, LLC (December 2002 — Present); and has held various other positions with ING Funds Services, LLC for more than the last five years. | |||
| Kimberly K. Palmer 7337 E. Doubletree Ranch Rd. Scottsdale, AZ 85258 Born: 1957 | Assistant Vice President | September 2004 — Present | Assistant Vice President, ING Funds Services, LLC (August 2004 — Present). Formerly, Manager, Registration Statements, ING Funds Services, LLC (May 2003 — August 2004); Associate Partner, AMVESCAP PL (October 2000 — May 2003); Director of Federal Filings and Blue Sky Filings, INVESCO Funds Group, Inc. (March 1994 — May 2003). | |||
| Theresa K. Kelety 7337 E. Doubletree Ranch Rd. Scottsdale, AZ 85258 Born: 1963 | Secretary | September 2003 — Present | Counsel, ING, U.S. Legal Services (April 2003 — Present). Formerly, Senior Associate with Shearman & Sterling (February 2000 — April 2003); and Associate with Sutherland Asbill & Brennan (1996 — February 2000). | |||
| Huey P. Falgout, Jr. 7337 E. Doubletree Ranch Rd. Scottsdale, AZ 85258 Born: 1963 | Assistant Secretary | September 2003 — Present | Chief Counsel, ING, U.S. Legal Services (September 2003 — Present). Formerly, Counsel, ING, U.S. Legal Services (November 2002 — September 2003); and Associate General Counsel of AIG American General (January 1999 — November 2002). | |||
| Robin R. Nesbitt 7337 E. Doubletree Ranch Rd. Scottsdale, AZ 85258 Born: 1973 | Assistant Secretary | September 2004 — Present | Supervisor, Board Operations, ING Funds Services, LLC (August 2003 — Present). Formerly, Senior Legal Analyst, ING Funds Services, LLC (August 2002 — August 2003); Associate, PricewaterhouseCoopers (January 2001 — August 2001); and Paralegal, McManis, Faulkner & Morgan (May 2000 — December 2000). | |||
| (1) | The officers hold office until the next annual meeting of the Trustees and until their successors have been elected and qualified. |
140
Administrator
Distributor
Transfer Agent
Custodian
Legal Counsel
Independent Registered Public Accounting Firm
Before investing, carefully consider the investment objectives, risks, charges and expenses of the variable annuity contract and the underlying variable investment options. This and other information is contained in the prospectus for the variable annuity contract and the underlying variable investment options. Obtain these prospectuses from your agent/registered representative and read them carefully before investing. Information regarding how the Portfolios voted proxies related to portfolio securities during the most recent 12-month period ended June 30 is available without charge on the Portfolios’ website at www.ingfunds.com and on the SEC’s website at www.sec.gov.
 | VPAR-AFGET (1204-021805) |
Item 2. Code of Ethics.
As of the end of the period covered by this report, Registrant had adopted a code of ethics, as defined in Item 2 of Form N-CSR, that applies to the Registrant’s principal executive officer and principal financial officer. There were no amendments to the Code during the period covered by the report. The Registrant did not grant any waivers, including implicit waivers, from any provisions of the Code during the period covered by this report. The code of ethics is filed herewith pursuant to Item 10(a)(1), Exhibit 99.CODE ETH.
Item 3. Audit Committee Financial Expert.
The Board of Trustees has determined that Corine Norgaard and Joseph Obermeyer are each audit committee financial experts, as defined in Item 3 of Form N-CSR. Ms. Norgaard and Mr. Obermeyer are both “independent” for purposes of Item 3 of Form N-CSR.
Item 4. Principal Accountant Fees and Services.
| (a) | Audit Fees: The aggregate fees billed for each of the last two fiscal years for professional services rendered by KPMG LLP (“KPMG”), the principal accountant for the audit of the registrant’s annual financial statements, for services that are normally provided by the accountant in connection with statutory and regulatory filings or engagements for those fiscal years were $191,250 for year ended December 31, 2004 and $214,500 for year ended December 31, 2003. | |||
| (b) | Audit-Related Fees: The aggregate fees billed in each of the last two fiscal years for assurance and related services by KPMG that are reasonably related to the performance of the audit of the registrant’s financial statements and are not reported under paragraph (a) of this Item. | |||
| None | ||||
| (c) | Tax Fees: The aggregate fees billed in each of the last two fiscal years for professional services rendered by KPMG for tax compliance, tax advice, and tax planning were $97,737 in the year ended December 31, 2004 and $51,000 in the year ended December 31, 2003. Such services included review of excise distribution calculations (if applicable), preparation of the Funds’ federal, state and excise tax returns, tax services related to mergers and routine consulting. | |||
| (d) | All Other Fees: The aggregate fees billed in each of the last two fiscal years for products and services provided by KPMG, other than the services reported in paragraphs (a) through (c) of this Item. | |||
| None | ||||
| (e) | (1) Audit Committee Pre-Approval Policies and Procedures |
AUDIT AND NON-AUDIT SERVICES
PRE-APPROVAL POLICY
I. Statement of Principles
Under the Sarbanes-Oxley Act of 2002 (the “Act”), the Audit Committee of the Board of Directors or Trustees (the “Committee”) of the ING Funds (each a “Fund,” collectively, the “Funds”) set out under Paragraph I on Exhibit A to this Audit and Non-Audit Services Pre-Approval Policy (“Policy”) is responsible for the oversight of the work of the Funds’ independent auditors. As part of its responsibilities, the Committee must pre-approve the audit and non-audit services performed by the auditors in order to assure that the provision of these services does not impair the auditors’ independence from the Funds. The Committee has adopted, and the Board has ratified, this Policy, which sets out the procedures and conditions under which the services of the independent auditors may be pre-approved.
Under Securities and Exchange Commission (“SEC”) rules promulgated in accordance with the Act, the Funds’ may establish two different approaches to pre-approving audit and non-audit services. The Committee may approve services without consideration of specific case-by-case services (“general pre-approval”) or it may pre-approve specific services (“specific pre-approval”). The Committee believes that the combination of these approaches contemplated in this Policy results in an effective and efficient method for pre-approving audit and non-audit services to be performed by the Funds’ independent auditors. Under this Policy, services that are not of a type that may receive general pre-approval require specific pre-approval by the Committee. Any proposed services that exceed pre-approved cost levels or budgeted amounts will also require the Committee’s specific pre-approval.
For both types of approval, the Committee considers whether the subject services are consistent with the SEC’s rules on auditor independence and that such services are compatible with maintaining the auditors’ independence. The Committee also considers whether a particular audit firm is in the best position to provide effective and efficient services to the Funds. Reasons that the auditors are in the best position include the auditors’ familiarity with the Funds’ business, personnel, culture, accounting systems, risk profile, and other factors, and whether the services will enhance the Funds’ ability to manage and control risk or improve audit quality. Such factors will be considered as a whole, with no one factor being determinative.
The appendices attached to this Policy describe the audit, audit-related, tax-related, and other services that have the Committee’s general pre-approval. For any service that has been approved through general pre-approval, the general pre-approval will remain in place for a period 12 months from the date of pre-approval, unless the Committee determines that a different period is appropriate. The Committee will annually review and pre-approve the services that may be provided by the independent auditors without specific pre-approval. The Committee will revise the list of services subject to general pre-approval as appropriate. This Policy does not serve as a delegation to Fund management of the Committee’s duty to pre-approve services performed by the Funds’ independent auditors.
II. Audit Services
The annual audit services engagement terms and fees are subject to the Committee’s specific pre-approval. Audit services are those services that are normally provided by auditors in connection with statutory and regulatory filings or engagements or those that generally only independent auditors can reasonably provide. They include the Funds’ annual financial statement audit and procedures that the independent auditors must perform in order to form an opinion on the Funds’ financial statements (e.g., information systems and procedural reviews and testing). The Committee will monitor the audit services engagement and approve any changes in terms, conditions or fees deemed by the Committee to be necessary or appropriate.
The Committee may grant general pre-approval to other audit services, such as statutory audits and services associated with SEC registration statements, periodic reports and other documents filed with the SEC or issued in connection with securities offerings.
The Committee has pre-approved the audit services listed on Appendix A. The Committee must specifically approve all audit services not listed on Appendix A.
III. Audit-related Services
Audit-related services are assurance and related services that are reasonably related to the performance of the audit or the review of the Funds’ financial statements or are traditionally performed by the independent auditors. The Committee believes that the provision of audit-related services will not impair the independent auditors’ independence, and therefore may grant pre-approval to audit-related services. Audit-related services include accounting consultations related to accounting, financial reporting or disclosure matters not classified as “audit services;” assistance with understanding and implementing new accounting and financial reporting guidance from rulemaking authorities; agreed-upon or expanded audit procedures relating to accounting and/or billing records required to respond to or comply with financial, accounting or regulatory reporting matters; and assistance with internal control reporting requirements under Form N-SAR or Form N-CSR.
The Committee has pre-approved the audit-related services listed on Appendix B. The Committee must specifically approve all audit-related services not listed on Appendix B.
IV. Tax Services
The Committee believes the independent auditors can provide tax services to the Funds, including tax compliance, tax planning, and tax advice, without compromising the auditors’ independence. Therefore, the Committee may grant general pre-approval with respect to tax services historically provided by the Funds’ independent auditors that do not, in the Committee’s view, impair auditor independence and that are consistent with the SEC’s rules on auditor independence.
The Committee will not grant pre-approval if the independent auditors initially recommends a transaction the sole business purpose of which is tax avoidance and the tax treatment of which may not be supported in the Internal Revenue Code and related regulations. The Committee may consult
outside counsel to determine that tax planning and reporting positions are consistent with this Policy.
The Committee has pre-approved the tax-related services listed on Appendix C. The Committee must specifically approve all tax-related services not listed on Appendix C.
V. Other Services
The Committee believes it may grant approval of non-audit services that are permissible services for independent auditors to a Fund. The Committee has determined to grant general pre-approval to other services that it believes are routine and recurring, do not impair auditor independence, and are consistent with SEC rules on auditor independence.
The Committee has pre-approved the non-audit services listed on Appendix D. The Committee must specifically approve all non-audit services not listed on Appendix D.
A list of the SEC’s prohibited non-audit services is attached to this Policy as Appendix E. The SEC’s rules and relevant guidance should be consulted to determine the precise definitions of these impermissible services and the applicability of exceptions to certain of the SEC’s prohibitions.
VI. Pre-approval of Fee levels and Budgeted Amounts
The Committee will annually establish pre-approval fee levels or budgeted amounts for audit, audit-related, tax and non-audit services to be provided to the Funds by the independent auditors. Any proposed services exceeding these levels or amounts require the Committee’s specific pre-approval. The Committee considers fees for audit and non-audit services when deciding whether to pre-approve services. The Committee may determine, for a pre-approval period of 12 months, the appropriate ratio between the total amount of fees for the Fund’s audit, audit-related, and tax services (including fees for services provided to Fund affiliates that are subject to pre-approval), and the total amount of fees for certain permissible non-audit services for the Fund classified as other services (including any such services provided to Fund affiliates that are subject to pre-approval).
VII. Procedures
Requests or applications for services to be provided by the independent auditors will be submitted to management. If management determines that the services do not fall within those services generally pre-approved by the Committee and set out in the appendices to these procedures, management will submit the services to the Committee or its delagee. Any such submission will include a detailed description of the services to be rendered.
Notwithstanding this paragraph, the Committee will, on quarterly basis, receive from the independent auditors a list of services provided to date by the auditors during Pre-Approval Period.
VIII. Delegation
The Committee may delegate pre-approval authority to one or more of the Committee’s members. Any member or members to whom such pre-approval authority is delegated must report any pre-approval decisions, including any pre-approved services, to the Committee at its next scheduled meeting. The Committee will identify any member to whom pre-approval authority is delegated in writing. The member will retain such authority for a period of 12 months from the date of pre-approval unless the Committee determines that a different period is appropriate. The period of delegated authority may be terminated by the Committee or at the option of the member.
IX. Additional Requirements
The Committee will take any measures the Committee deems necessary or appropriate to oversee the work of the independent auditors and to assure the auditors’ independence from the Funds. This may include reviewing a formal written statement from the independent auditors delineating all relationships between the auditors and the Funds, consistent with Independence Standards Board No. 1, and discussing with the auditors their methods and procedures for ensuring independence.
Appendix A
Pre-Approved Audit Services for the Pre-Approval Period June 1, 2004 through December 31, 2004
| Service | The Fund(s) | Fee Range | ||
| Statutory audits or financial audits (including tax services associated with audit services) | þ | As presented to Audit Committee1 | ||
Services associated with SEC registration statements, periodic reports and other documents filed with the SEC or other documents issued in connection with securities offerings (e.g., consents), and assistance in responding to SEC comment letters. | þ | Not to exceed $8,500 per filing | ||
| Consultations by Fund management with respect to accounting or disclosure treatment of transactions or events and/or the actual or potential effect of final or proposed rules, standards or interpretations by the SEC, Financial Accounting Standards Board, or other regulatory or standard setting bodies. | þ | Not to exceed $8,000 during the Pre-Approval Period |
| 1 | For new Funds launched during the Pre-Approval Period, the fee ranges pre-approved will be the same as those for existing Funds, pro-rated in accordance with inception dates as provided in KPMG’s Proposal or any Engagement Letter covering the period at issue. Fees in the Engagement Letter will be controlling. |
Appendix B
Pre-Approved Audit-Related Services for the Pre-Approval Period June 1, 2004 through December 31, 2004
| Service | The Fund(s) | Fund Affiliates | Fee Range | |||
| Services related to Fund mergers | þ | þ | Not to exceed $10,000 per merger | |||
Consultations by Fund management with respect to accounting or disclosure treatment of transactions or events and/or the actual or potential effect of final or proposed rules, standards or interpretations by the SEC, Financial Accounting Standards Board, or other regulatory or standard setting bodies. [Note: Under SEC rules some consultations may be “audit” services and others may be “audit-related” services.] | þ | o | Not to exceed $5,000 per occurrence during the Pre-Approval Period | |||
| Review of the Funds’ semi-annual financial statements | þ | o | Not to exceed $5,000 for each set of financial statements | |||
| Reports to regulatory or government agencies related to the annual engagement | þ | o | Up to $5,000 per occurrence during the Pre-Approval Period | |||
| Regulatory compliance assistance | þ | þ | Not to exceed $5,000 per quarter | |||
| Training courses | þ | þ | Not to exceed $2,000 per course |
Appendix C
Pre-Approved Tax Services for the Pre-Approval Period June 1, 2004 through December 31, 2004
| Service | The Fund(s) | Fund Affiliates | Fee Range | |||
| Preparation of federal and state income tax returns and federal excise tax returns for the Funds including assistance and review with excise tax distributions. | þ | o | As presented to Audit Committee2 | |||
| Review of IRC Sections 851(b) and 817(h) diversification testing on a real-time basis | þ | o | As presented to Audit Committee2 | |||
| Review of year-end reporting for 1099’s | þ | o | As presented to Audit Committee2 | |||
| Tax assistance and advice regarding statutory, regulatory or administrative developments | þ | þ | Not to exceed $5,000 for the Funds or for the Funds’ investment adviser during the Pre-Approval Period | |||
| International tax services (e.g., Taiwan and India) | þ | o | Not to exceed $5,000 per Fund during the Pre-Approval Period | |||
| Tax training courses | þ | o | Not to exceed $2,000 per course during the Pre-Approval Period | |||
| Loan Staff Services | þ | o | Not to exceed $15,000 during the Pre-Approval Period | |||
| Tax services associated with Fund mergers | þ | o | Not to exceed $8,000 per merger during the Pre-Approval Period | |||
| Other tax-related assistance and consultation, including, without limitation, assistance in evaluating the tax treatment of swaps, swaptions, mortgage-backed securities and other derivatives. | þ | o | Not to exceed $25,000 during the Pre-Approval Period |
| 2 | For new Funds launched during the Pre-Approval Period, the fee ranges pre-approved will be the same as those for existing Funds, as provided in KPMG’s Proposal or any Engagement Letter covering the period at issue. Fees in the Engagement Letter will be controlling. |
Appendix D
Pre-Approved Other Services for the Pre-Approval Period June 1, 2004 through December 31, 2004
| Service | The Fund(s) | Fund Affiliates | Fee Range | |||
| Agreed-upon procedures for Class B share 12b-1 programs | o | þ | Not to exceed $25,000 during the Pre-Approval Period |
Appendix E
Prohibited Non-Audit Services
Dated: 2004
| • | Bookkeeping or other services related to the accounting records or financial statements of the Funds | |||
| • | Financial information systems design and implementation | |||
| • | Appraisal or valuation services, fairness opinions, or contribution-in-kind reports | |||
| • | Actuarial services | |||
| • | Internal audit outsourcing services | |||
| • | Management functions | |||
| • | Human resources | |||
| • | Broker-dealer, investment adviser, or investment banking services | |||
| • | Legal services | |||
| • | Expert services unrelated to the audit | |||
| • | Any other service that the Public Company Accounting Oversight Board determines, by regulation, is impermissible | |||
| (e)(2) | Percentage of services referred to in 4(b) – (4)(d) that were approved by the audit committee | |||
| 100% of the services were approved by the audit committee. | ||||
| (f) | Percentage of hours expended attributable to work performed by other than full time employees of KPMG if greater than 50%. | |||
| Not applicable. | ||||
| (g) | Non-Audit Fees: The non-audit fees billed by the registrant’s accountant for services rendered to the registrant, and rendered to the registrant’s investment adviser, and any entity controlling, controlled by, or under common control with the adviser that provides ongoing services to the registrant for each of the last two fiscal years of the registrant were $525,067 for year ended December 31, 2004 and $391,873 for fiscal year ended December 31, 2003. | |||
| (h) | Principal Accountants Independence: The Registrant’s Audit committee has considered whether the provision of non-audit services that were rendered to the registrant’s investment adviser and any entity controlling, controlled by, or under common control with the investment adviser that provides ongoing services to the registrant that were not pre-approved pursuant to Rule 2-01(c)(7)(ii) of Regulation S-X is compatible with maintaining KPMG’s independence. | |||
Item 5. Audit Committee of Listed Registrants.
Not applicable.
Item 6. Schedule of Investments
Schedule is included as part of the report to shareholders filed under Item 1 of this Form.
Item 7. Disclosure of Proxy Voting Policies and Procedures for Closed-End Management Investment companies.
Not applicable.
Item 8. Purchases of Equity Securities by Closed-End Management Investment Company and Affiliated Purchasers
Not applicable.
Item 9. Submission of Matters to a Vote of Security Holders.
Nominating Committee. The Nominating Committee operates pursuant to a Charter approved by the Board and is comprised of persons who are not “interested persons” of the Fund within the meaning of the Investment Company Act of 1940, as amended. The primary purpose of the Nominating Committee is to consider, evaluate and make recommendations to the Board with respect to the nomination and selection of Independent Trustees. In evaluating candidates, the Nominating Committee may consider a variety of factors, but specific qualifications of candidates for Board membership will be based on the needs of the Board at the time of nomination.
The Nominating Committee is willing to consider nominations received from shareholders and shall assess shareholder nominees in the same manner as it reviews nominees it identifies. A shareholder nominee for director should be submitted in writing to the Fund’s Secretary and must be received in a timely manner in order to be considered. Any such shareholder nomination should include: sufficient background information concerning the candidate; the individual’s written consent to be named in the proxy statement as a nominee (if nominated) and to serve as a director (if elected); and all information relating to such individual that is required to be disclosed in a solicitation of proxies for election of directors, or is otherwise required, in each case under applicable federal securities laws, rules and regulations. To be timely, any such submission must be delivered to the Fund’s Secretary not earlier than the 90th day prior to such meeting and not later than the close of business on the later of the 60th day prior to such meeting or the 10th day following the day on which public announcement of the date of the meeting is first made, by either disclosure in a press release or in a document publicly filed by the Fund with the SEC.
Item 10. Controls and Procedures.
| (a) | Based on our evaluation conducted within 90 days of the filing date, hereof, the design and operation of the registrant’s disclosure controls and procedures are effective to ensure that material information relating to the registrant is made known to the certifying officers by others within the appropriate entities, particularly during the period in which Forms N-CSR are being prepared, and the registrant’s disclosure controls and procedures allow timely preparation and review of the information for the registrant’s Form N-CSR and the officer certifications of such Form N-CSR. |
| (b) | There were no significant changes in the registrant’s internal controls that occurred during the second fiscal quarter of the period covered by this report that has materially affected, or is reasonably likely to materially affect, the registrant’s internal control over financial reporting. |
Item 11. Exhibits.
| (a)(1) | Code of Ethics pursuant to Item 2 of Form N-CSR is filed and attached hereto as EX-99.CODE ETH. | |||
| (a)(2) | A separate certification for each principal executive officer and principal financial officer of the registrant as required by Rule 30a-2 under the Act (17 CFR 270.30a-2) is attached hereto as EX-99.CERT. | |||
| (b) | The officer certifications required by Section 906 of the Sarbanes-Oxley Act of 2002 are attached hereto as EX-99.906CERT | |||
(3) Not applicable.
SIGNATURES
Pursuant to the requirements of the Securities Exchange Act of 1934 and the Investment Company Act of 1940, the registrant has duly caused this report to be signed on its behalf by the undersigned, thereunto duly authorized.
| (Registrant): ING GET Fund. | ||
| By | /s/ James M. Hennessy James M. Hennessy President and Chief Executive Officer | |
Date: March 7, 2005
Pursuant to the requirements of the Securities Exchange Act of 1934 and the Investment Company Act of 1940, this report has been signed below by the following persons on behalf of the registrant and in the capacities and on the dates indicated.
| By | /s/ James M. Hennessy James M. Hennessy President and Chief Executive Officer |
Date: March 7, 2005
| By | /s/ Michael J. Roland Michael J. Roland Executive Vice President and Chief Financial Officer |
Date: March 7, 2005