Table of Contents
☐ | REGISTRATION STATEMENT PURSUANT TO SECTION 12(b) OR 12(g) OF THE SECURITIES EXCHANGE ACT OF 1934 |
☒ | ANNUAL REPORT PURSUANT TO SECTION 13 OR 15(d) OF THE SECURITIES EXCHANGE ACT OF 1934 |
☐ | TRANSITION REPORT PURSUANT TO SECTION 13 OR 15(d) OF THE SECURITIES EXCHANGE ACT OF 1934 |
☐ | SHELL COMPANY REPORT PURSUANT TO SECTION 13 OR 15(d) OF THE SECURITIES EXCHANGE ACT OF 1934 |
Commission File No.: 001-09526 |
BHP GROUP LIMITED |
(ABN 49 004 028 077) |
(Exact name of Registrant as specified in its charter) |
N/A |
(Translation of Registrant’s name into English) |
VICTORIA, AUSTRALIA |
(Jurisdiction of incorporation or organization) |
171 COLLINS STREET MELBOURNE, VICTORIA 3000 AUSTRALIA (Address of principal executive offices) |
STEFANIE WILKINSON BHP GROUP LIMITED 171 COLLINS STREET MELBOURNE VIC 3000 AUSTRALIA TELEPHONE AUSTRALIA 1300 55 47 57 TELEPHONE INTERNATIONAL +61 3 9609 3333 FACSIMILE +61 3 9609 3015 (Name, telephone, e-mail and/or facsimile number and address of company contact person) |
Title of each class | Trading symbol | Name of each exchange on which registered | ||
American Depositary Shares* | BHP | New York Stock Exchange | ||
Ordinary Shares** | BHP | New York Stock Exchange | ||
| * | Evidenced by American Depositary Receipts. Each American Depositary Receipt represents two ordinary shares of BHP Group Limited. |
| ** | Not for trading, but only in connection with the listing of the American Depositary Shares. |
BHP Group Limited | ||
Ordinary Shares | 5,071,530,817 |
| Large accelerated filer | ☒ | Accelerated filer | ☐ | |||
| Non-accelerated filer | ☐ | Emerging growth company | ☐ | |||
U.S. GAAP ☐ | International Financial Reporting Standards as issued by the International Accounting Standards Board ☒ | Other ☐ |
Table of Contents
Company details
BHP Group Limited’s registered office and global headquarters are at 171 Collins Street, Melbourne, Victoria 3000, Australia.
‘BHP’, the ‘Company’, the ‘Group’, ‘BHP Group’, ‘our business’, ‘organisation’, ‘we’, ‘us’, ‘our’ and ‘ourselves’ refer to BHP Group Limited, and except where the context otherwise requires, our subsidiaries.
Refer to Financial Statements note 30 ‘Subsidiaries’ for a list of our significant subsidiaries and to Exhibit 8.1 – List of Subsidiaries for a list of our subsidiaries. Those terms do not include non-operated assets.
This Report covers functions and assets (including those under exploration, projects in development or execution phases, sites and operations that are closed or in the closure phase) that have been wholly owned and operated by BHP or that have been owned as a joint venture(1) operated by BHP (referred to in this Report as ‘operated assets’ or ‘operations’) from 1 July 2023 to 30 June 2024, unless otherwise stated. Certain sections of this Report include data in relation to the Daunia and Blackwater mines, which were divested during the year. Data in relation to the Daunia and Blackwater mines is shown for the period up to completion on 2 April 2024, unless stated otherwise. Some of the land and tenements related to the Daunia and Blackwater mines are pending transfer following completion, however given that the assets are no longer under BMA’s control or operated for BMA’s benefit (except for periods prior to completion or where specifically stated) data related to the land and tenements has been excluded from this Report.
BHP also holds interests in assets that are owned as a joint venture but not operated by BHP (referred to in this Report as ‘non-operated joint ventures’ or ‘non-operated assets’). Notwithstanding that this Report may include production, financial and other information from non-operated assets, non-operated assets are not included in the BHP Group and, as a result, statements regarding our operations, assets and values apply only to our operated assets unless stated otherwise.
BHP Group Limited has a primary listing on the Australian Securities Exchange. BHP holds an international secondary listing on the London Stock Exchange, a secondary listing on the Johannesburg Stock Exchange and an ADR program listed on the New York Stock Exchange.
Introduction
This document is our annual report on Form 20-F for the year ended 30 June 2024 (this “Annual Report”). Reference is made to our Australian Annual Report for the year ended 30 June 2024, which has been furnished to the U.S. Securities and Exchange Commission (the “SEC”) on a Report on Form 6-K on 27 August 2024, which includes information that has been omitted from this Form 20-F. Only information that is included in, or expressly incorporated by reference into, this Form 20-F shall be deemed to form a part of this Annual Report.
The SEC maintains an Internet website that contains reports and other information regarding issuers that file electronically with the SEC. Our filings with the SEC are available to the public through the SEC’s website at http://www.sec.gov.
Materiality, as used in the context of climate and sustainability-related disclosures, may differ from the materiality standards applied by other reporting regimes, including as defined for SEC reporting purposes. Any issues identified as material for purposes of sustainability in this document are therefore not necessarily material for SEC reporting purposes.
All references to websites in this Annual Report are intended to be inactive textual references for information only and any information contained in or accessible through any such website does not form a part of this Annual Report.
Forward-looking statements
This Report contains forward-looking statements, which involve risks and uncertainties. Forward-looking statements include all statements, other than statements of historical or present facts, including: statements regarding trends in commodity prices and currency exchange rates; demand for commodities; global market conditions, reserves and resources estimates; development and production forecasts; guidance; expectations, plans, strategies and objectives of management; climate scenarios; approval of projects and consummation of transactions; closure, divestment, acquisition or integration of certain assets, operations or facilities (including associated costs or benefits); anticipated production or construction commencement dates; capital costs and scheduling; operating costs and availability of materials and skilled employees; anticipated productive lives of projects, mines and facilities; the availability, implementation and adoption of new technologies, including artificial intelligence; provisions and contingent liabilities; and tax, legal and other regulatory developments.
Forward-looking statements may be identified by the use of terminology, including, but not limited to, ‘aim’, ‘ambition’, ‘anticipate’, ‘aspiration’, ‘believe’, ‘commit’, ‘continue’, ‘could’, ‘ensure’, ‘estimate’, ‘expect’, ‘forecast’, ‘goal’, ‘guidance’, ‘intend’, ‘likely’, ‘may’, ‘milestone’, ‘must’, ‘need’, ‘objective’, ‘outlook’, ‘pathways’, ‘plan’, ‘project’, ‘schedule’, ‘seek’, ‘should’, ‘target’, ‘trend’, ‘will’, ‘would’, or similar words. These statements discuss future expectations or performance, or provide other forward-looking information.
| (1) | References in this Annual Report to a ‘joint venture’ are used for convenience to collectively describe assets that are not wholly owned by BHP. Such references are not intended to characterise the legal relationship between the owners of the asset. |
i
Table of Contents
Examples of forward-looking statements contained in this Report include, without limitation, statements describing (i) our strategy, our values and how we define our success; (ii) our expectations regarding future demand for certain commodities, in particular copper, nickel, iron ore, steelmaking coal, potash and steel, and our intentions, commitments or expectations with respect to our supply of certain commodities, including copper, nickel, iron ore, potash, uranium and gold; (iii) our future exploration and partnership plans and perceived benefits and opportunities, including our focus to grow our copper and potash assets; (iv) our business outlook, including our outlook for long-term economic growth and other macroeconomic and industry trends; (vi) our projected and expected production and performance levels and development projects; (vii) our expectations regarding our investments, including in potential growth options and technology and innovation, and perceived benefits and opportunities; (viii) our reserves and resources estimates; (ix) our plans for our major projects and related budget and capital allocations; (x) our expectations, commitments and objectives with respect to sustainability, decarbonisation, natural resource management, climate change and portfolio resilience and timelines and plans to seek to achieve or implement such objectives, including our approach to equitable change and transitions, our Climate Transition Action Plan, climate change adaptation strategy and goals, targets, pathways and strategies to seek to reduce or support the reduction of greenhouse gas emissions, and related perceived costs, benefits and opportunities for BHP; (xi) the assumptions, beliefs and conclusions in our climate change related statements and strategies, including in our Climate Change Report 2020, for example, in respect of future temperatures, energy consumption and greenhouse gas emissions, and climate-related impacts; (xii) our commitment to social value; (xiii) our commitments to sustainability reporting, frameworks, standards and initiatives; (xiv) our commitments to improve or maintain safe tailings storage management; (xv) our commitments to achieve certain inclusion and diversity targets, aspirations and outcomes; (xvi) our commitments to achieve certain targets and outcomes with respect to Indigenous peoples and the communities where we operate; and (xvii) our commitments to achieve certain health and safety targets and outcomes.
Forward-looking statements are based on management’s expectations and reflect judgements, assumptions, estimates and other information available, as at the date of this Report. These statements do not represent guarantees or predictions of future financial or operational performance and involve known and unknown risks, uncertainties and other factors, many of which are beyond our control and which may cause actual results to differ materially from those expressed in the statements contained in this Report. BHP cautions against reliance on any forward-looking statements.
For example, our future revenues from our assets, projects or mines described in this Report will be based, in part, on the market price of the commodities produced, which may vary significantly from current levels or those reflected in our reserves and resources estimates. These variations, if materially adverse, may affect the timing or the feasibility of the development of a particular project, the expansion of certain facilities or mines, or the continuation of existing assets.
Other factors that may affect our future operations and performance, including the actual construction or production commencement dates, revenues, costs or production output and anticipated lives of assets, mines or facilities include: (i) our ability to profitably produce and deliver the products extracted to applicable markets; (ii) the impact of economic and geopolitical factors, including foreign currency exchange rates on the market prices of the commodities we produce and competition in the markets in which we operate; (iii) activities of government authorities in the countries where we sell our products and in the countries where we are exploring or developing projects, facilities or mines, including increases in taxes and royalties or implementation of trade or export restrictions; (iv) changes in environmental and other regulations; (v) political or geopolitical uncertainty; (vi) labour unrest; (vii) weather, climate variability or other manifestations of climate change; and (viii) other factors identified in the risk factors set out in OFR 8.1.
In addition, there are limitations with respect to scenario analysis, including any climate-related scenario analysis, and it is difficult to predict which, if any, of the scenarios might eventuate. Scenario analysis is not an indication of probable outcomes and relies on assumptions that may or may not prove to be correct or eventuate.
Except as required by applicable regulations or by law, BHP does not undertake to publicly update or review any forward-looking statements, whether as a result of new information or future events.
Past performance cannot be relied on as a guide to future performance.
Emissions and energy consumption data
Due to the inherent uncertainty and limitations in measuring GHG emissions and operational energy consumption under the calculation methodologies used in the preparation of such data, all GHG emissions and operational energy consumption data or references to GHG emissions and operational energy consumption volumes (including ratios or percentages) in this Report are estimates. There may also be differences in the manner that third parties calculate or report GHG emissions or operational energy consumption data compared to BHP, which means third-party data may not be comparable to our data. For information on how we calculate our GHG emissions and operational energy consumption, refer to the BHP GHG Emissions Calculation Methodology 2024, available at bhp.com/climate
ii
Table of Contents
Form 20-F Cross Reference Table
Item Number | Description | Report section reference | ||||
1. | Identity of Directors, Senior Management and Advisors | Not applicable | ||||
2. | Offer Statistics and Expected Timetable | Not applicable | ||||
3. | Key Information | |||||
| A | [Reserved] | Not applicable | ||||
| B | Capitalization and indebtedness | Not applicable | ||||
| C | Reasons for the offer and use of proceeds | Not applicable | ||||
| D | Risk factors | 8.1 | ||||
4. | Information on the Company | |||||
| A | History and development of the company | Cover page, Company details, Chair’s review, Chief Executive Officer’s review, Operating and Financial Review 1 to 9, Additional information 1, 2, 4 to 9.4 | ||||
| B | Business overview | Operating and Financial Review 1 to 5, 9, Additional information 1, 4 to 8, 9.3, 9.9 and Note 1 to the Financial Statements | ||||
| C | Organizational structure | Additional information 9.3 and Note 30 to the Financial Statements | ||||
| D | Property, plants and equipment | Operating and Financial Review 3, 5.1, 5.2, 5.3, 6 to 9, Additional information 1, 4 to 6 and Notes 11, 15 and 22 to the Financial Statements | ||||
4A. | Unresolved Staff Comments | None | ||||
5. | Operating and Financial Review and Prospects | |||||
| A | Operating results | Operating and Financial Review 4, 5, 9, Additional information 2 to 4 | ||||
| B | Liquidity and capital resources | Operating and Financial Review 4, Financial Statements 1.4, Notes 11 and 21 to 24 to the Financial Statements | ||||
| C | Research and development, patents and licenses, etc. | Operating and Financial Review 3, 5, 8 and 9, Directors’ Report 10, Additional information 1, 5, 6 and Notes 11 and 15 to the Financial Statements | ||||
| D | Trend information | Chair’s review, Chief Executive Officer’s review, Operating and Financial Review 1 to 6, 8, 9, Additional information 1 to 7 | ||||
| E | Critical Accounting Estimates | IFRS is applied in the Financial Statements as issued by the IASB | ||||
6. | Directors, Senior Management and Employees | |||||
| A | Directors and senior management | Corporate Governance Statement 4.1, 6.1, Directors’ Report 2 | ||||
| B | Compensation | Remuneration Report | ||||
| C | Board practices | Corporate Governance Statement 4.1, 4.7, 5.2, 5.4, Remuneration Report | ||||
| D | Employees | Operating and Financial Review 6.6, Additional information 7 | ||||
| E | Share ownership | Remuneration Report, Directors’ Report 3, 4 and Notes 17, 18, 25 and 26 to the Financial Statements | ||||
| F | Erroneously Awarded Compensation | Not applicable | ||||
7. | Major Shareholders and Related Party Transactions | |||||
| A | Major shareholders | Additional information 9.5 | ||||
| B | Related party transactions | Remuneration Report and Notes 25 and 33 to the Financial Statements | ||||
| C | Interests of experts and counsel | Not applicable | ||||
8. | Financial Information | |||||
iii
Table of Contents
| A | Consolidated Statements and Other Financial Information | Operating and Financial Review 7, Additional information 8, 9.6, Financial Statements beginning on page F-1 in this Annual Report and Financial Statements 1A | ||||
| B | Significant Changes | Note 35 to the Financial Statements | ||||
9. | The Offer and Listing | |||||
| A | Offer and listing details | Additional information 9.2 | ||||
| B | Plan of distribution | Not applicable | ||||
| C | Markets | Additional information 9.2 | ||||
| D | Selling shareholders | Not applicable | ||||
| E | Dilution | Not applicable | ||||
| F | Expenses of the issue | Not applicable | ||||
10. | Additional Information | |||||
| A | Share capital | Not applicable | ||||
| B | Memorandum and articles of association | Additional information 9.3, 9.4 | ||||
| C | Material contracts | Additional Information 8 (regarding the Framework Agreement) | ||||
| D | Exchange controls | Additional information 9.9 | ||||
| E | Taxation | Additional information 9.10 | ||||
| F | Dividends and paying agents | Not applicable | ||||
| G | Statement by experts | Not applicable | ||||
| H | Documents on display | Additional information 9.4 | ||||
| I | Subsidiary information | Note 30 to the Financial Statements and Exhibit 8.1 | ||||
| J | Annual Report to Security Holders | Not applicable | ||||
11. | Quantitative and Qualitative Disclosures About Market Risk | Note 24 to the Financial Statements | ||||
12. | Description of Securities Other than Equity Securities | |||||
| A | Debt Securities | Not applicable | ||||
| B | Warrants and Rights | Not applicable | ||||
| C | Other Securities | Not applicable | ||||
| D | American Depositary Shares | Additional information 9.7 and Exhibit 2.1 | ||||
13. | Defaults, Dividend Arrearages and Delinquencies | Not applicable | ||||
14. | Material Modifications to the Rights of Security Holders and Use of Proceeds | Not applicable | ||||
15. | Controls and Procedures | Corporate Governance Statement 9.2 and Financial Statements 1A | ||||
16A. | Audit committee financial expert | Corporate Governance Statement 5.2 | ||||
16B. | Code of Ethics | Corporate Governance Statement 8 | ||||
16C. | Principal Accountant Fees and Services | Corporate Governance Statement 9.2 and Note 36 to the Financial Statements | ||||
16D. | Exemptions from the Listing Standards for Audit Committees | Not applicable | ||||
16E. | Purchases of Equity Securities by the Issuer and Affiliated Purchasers | Directors’ Report 4 | ||||
16F. | Change in Registrant’s Certifying Accountant | Not applicable | ||||
16G. | Corporate Governance | Corporate Governance Statement | ||||
16H. | Mine Safety Disclosure | Not applicable | ||||
16I. | Disclosure Regarding Foreign Jurisdictions that Prevent Inspections | Not applicable | ||||
16J. | Insider Trading Policies | Exhibit 11.1 | ||||
16K. | Cybersecurity | Operating and Financial Review 8.1, Additional information 9.8 | ||||
17. | Financial Statements | Not applicable | ||||
18. | Financial Statements | Financial Statements begin on page F-1 in this Annual Report | ||||
19. | Exhibits | Exhibits |
iv
Table of Contents

Bringing people and resources together to build a better world.
“A resource mix for today. Critical for the future. Our project pipeline and focus on continuous improvement in existing operations leave us well poised for growth across our four commodity pillars of copper, potash, iron ore and steelmaking coal in the decades ahead.”
Mike Henry
Chief Executive Officer
v
Table of Contents
Contents
| 1 | ||||||
| 3 | ||||||
Operating and Financial Review | ||||||
| 1 | Why BHP | 5 | ||||
| 1.1 | Where we operate | 7 | ||||
| 1.2 | Our portfolio | 8 | ||||
| 2 | What differentiates us | 10 | ||||
| 3 | Positioning for growth | 15 | ||||
| 4 | Financial review | 18 | ||||
| 4.1 | 18 | |||||
| 4.2 | Key performance indicators | 18 | ||||
| 4.3 | Financial results | 20 | ||||
| 4.4 | Debt and sources of liquidity | 22 | ||||
| 5 | Our assets | 25 | ||||
| 5.1 | Minerals Australia | 25 | ||||
| 5.2 | Copper South Australia | 28 | ||||
| 5.3 | Minerals Americas | 29 | ||||
| 5.4 | Commercial | 32 | ||||
| 6 | Sustainability | 34 | ||||
| 6.1 | Safety | 34 | ||||
| 6.2 | Our sustainability approach | 37 | ||||
| 6.3 | Sustainability governance | 37 | ||||
| 6.4 | Material sustainability topics for reporting | 38 | ||||
| 6.5 | 2030 goals | 40 | ||||
| 6.6 | People | 43 | ||||
| 6.7 | Health | 50 | ||||
| 6.8 | Ethics and business conduct | 53 | ||||
| 6.9 | Climate change | 55 | ||||
| 6.10 | Environment and nature | 70 | ||||
| 6.11 | Community | 77 | ||||
| 6.12 | Indigenous peoples | 79 | ||||
| 6.13 | Independent limited assurance report | 83 | ||||
| 7 | Samarco | 84 | ||||
| 8 | How we manage risk | 85 | ||||
| 8.1 | Risk factors | 87 | ||||
| 8.2 | Management of risks | 92 | ||||
| 9 | Performance by commodity | 99 | ||||
vi
Table of Contents
vii
Table of Contents
| 147 | ||||||
People and Remuneration Committee Chair letter to shareholders | 148 | |||||
| 1 | Remuneration governance | 151 | ||||
| 2 | Executive KMP remuneration framework | 152 | ||||
| 3 | Remuneration for the CEO and other Executive KMP | 155 | ||||
| 4 | Remuneration for Non-executive Directors | 162 | ||||
| 5 | Statutory KMP remuneration and other disclosures | 164 | ||||
| 171 | ||||||
Additional information | ||||||
| 1 | Information on mining operations | 172 | ||||
| 2 | Financial information summary | 195 | ||||
| 3 | Financial information by commodity | 196 | ||||
| 4 | Production | 198 | ||||
| 5 | Major projects | 201 | ||||
| 6 | Mineral resources and mineral reserves | 202 | ||||
| 7 | People - performance data | 225 | ||||
| 8 | Legal proceedings | 227 | ||||
| 9 | Shareholder information | 231 | ||||
| 9.1 | History and development | 231 | ||||
| 9.2 | Markets | 231 | ||||
| 9.3 | Organisational structure | 232 | ||||
| 9.4 | Constitution | 232 | ||||
| 9.5 | Share ownership | 235 | ||||
| 9.6 | Dividends | 238 | ||||
| 9.7 | American Depositary Receipts fees and charges | 238 | ||||
| 9.8 | Supplemental cybersecurity disclosures for US reporting | 239 | ||||
| 9.9 | Government regulations | 240 | ||||
| 9.10 | Taxation | 243 | ||||
| 10 | Glossary | 247 | ||||
| 263 | ||||||
viii
Table of Contents
ix
Table of Contents

x
Table of Contents
Chair’s review
Dear Shareholders,
I am pleased to provide BHP’s Annual Report for FY2024.
Our operational and financial performance was strong in FY2024, and we made solid progress against our social value and sustainability commitments. It is more than four years since we began the strategic transformation of BHP’s portfolio towards future-facing commodities and the world has changed markedly in that time. Thank you for the trust you have given us through this period.
Today, BHP has a portfolio of world-class assets focused on products that are critical to the future. A portfolio positioned for growth, yet resilient and able to withstand volatility. A product mix that can continue to deliver financial and social value over the long term.
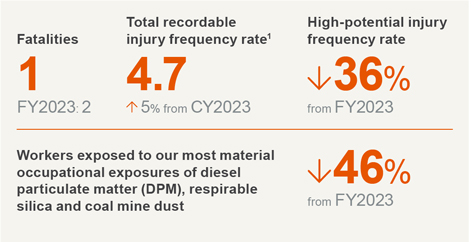
However, FY2024 was overshadowed by a fatality. We are deeply saddened that Luke O’Brien, a team member working with one of our contracting partners at BHP Mitsubishi Alliance (BMA), was fatally injured in January in a vehicle incident at the Saraji mine in Queensland. Our heartfelt thoughts and condolences go to Luke’s family and friends. Safety is our top priority and our commitment to zero fatalities and serious injuries at BHP is unwavering.
Our strategic priorities
During FY2024 I had the pleasure of meeting with our people, Indigenous partners, suppliers and other stakeholders at our global sites and offices. These discussions reinforced that our ongoing commitment to the priorities of safety, culture and capability, capital discipline, the continued development of our world-class portfolio and social value continue to be the right focus areas for BHP.
Safe, inclusive and productive workplaces
Our commitment to safety includes eliminating sexual harassment, racism and bullying in our workplaces. We are determined to eliminate these unequivocally unacceptable behaviours.
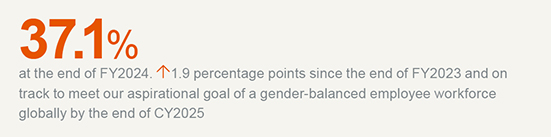
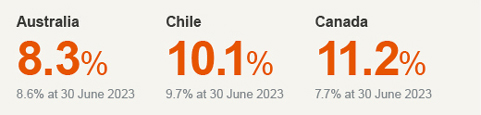
We know diverse and inclusive teams are safer and more productive. We achieved a 1.9 percentage point year-on-year increase in female employee participation in FY2024 to 37.1 per cent by year end. We also made progress towards our Indigenous employment targets, including Indigenous employee participation reaching 10.1 per cent in Chile and 11.2 per cent in Canada by year end. We have more work to do, but we are making progress on our commitment to provide a safe and inclusive workplace culture.
Positioned for success
BHP, and mining, have a clear and undeniable role to provide the metals and minerals the world needs for more sustainable development.
The global trends shaping our future are interconnected, unstoppable and bring with them new challenges and opportunities for our sector. A growing and increasingly urbanised population seeking a higher standard of living will require vast amounts of metals and minerals. That demand will only be amplified by the energy transition.
We are continuing to position our portfolio to align with these trends. Iron ore for steel to build cities and renewables infrastructure, steelmaking coal for the blast furnace process for making steel, copper for electrification, nickel for electric vehicle batteries and potash for food security and more sustainable land.
Delivering value
BHP’s strong operational performance and disciplined approach to capital allocation has seen the Board determine dividends totaling US$7.4 billion to shareholders for the year. This will take the total amount of cash dividends returned to you since 1 July 2021 to over US$42 billion including the FY2024 final dividend.
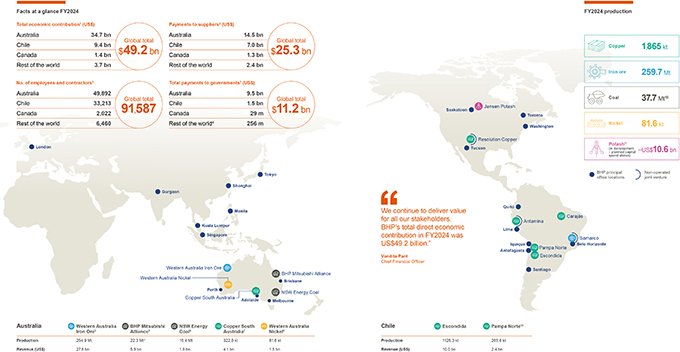
We continued to make significant contributions to the communities where we operate through employment, community partnerships, payments to local suppliers, and taxes and royalties paid to governments. Our total global economic contribution was US$49.2 billion in FY2024.
Creating social value is vital to our business and goes hand in hand with long-term sustainable shareholder value. In FY2024, we delivered tangible progress in each of the six pillars of our social framework which are focused on decarbonisation, the environment, Indigenous partnerships, workforce, communities, and supply chains. Social value is interwoven into our strategic decision-making through our social value framework, which helps us to meet the world’s demand for resources more sustainably, with more renewable energy, less fresh water use and less disruption.
Our social value highlights in FY2024 included the completion of all our FY2024 Australian Reconciliation Action Plan targets and reforms, US$137 million in voluntary social investment including community and environmental initiatives and continued progress towards reducing our operational greenhouse gas emissions.
1
Table of Contents
Our Climate Transition Action Plan 2024 provides an update on our climate change strategy and our progress and plans in relation to our greenhouse gas emissions goals and targets. Our plan shows we are serious about addressing the impacts of climate change from our business while continuing to provide strong shareholder returns. At the Annual General Meeting this year there will be a ‘Say on climate’ vote and I recommend you vote in favour of our Climate Transition Action Plan 2024.
Board updates
Our structured Board renewal process continued in FY2024. Ross McEwan joined the Board as a Non-executive Director on 3 April 2024. Ross has significant experience in the financial services industry with deep expertise in capital allocation, risk management and value creation in complex regulatory environments. Don Lindsay also joined the Board as a Non-executive Director on 1 May 2024 and brings over 40 years of global experience in the resources sector and investment banking, including in mining and resource development, financial markets, growth and value creation. In April 2024, Ian Cockerill retired from the Board and in October 2023, Terry Bowen also retired from the Board. We benefited greatly from Ian’s and Terry’s extensive experience and I would like to thank them for their contribution and commitment to BHP during their time with us.
Outlook
In recent decades, we have seen global economies and supply chains come together and support sustained economic development. Today, we are seeing more turbulence, tension and polarisation in the geopolitical landscape. We expect economic conditions to remain challenging in FY2025 as geopolitical issues continue to create volatility and impact global markets, security and trade.
Despite these challenges, I am optimistic about our future.
We have a world-class portfolio of large, long-life and high-quality assets which stands to benefit from the global changes shaping our world. We have a clear focus on being the best operator in the resources sector, being disciplined in capital management through our Capital Allocation Framework and having a differentiated approach to creating social value. We have a culture that is committed to safety, productivity and continuous improvement and we are working to make our workforce more inclusive and diverse.
I am confident BHP is well positioned to continue to create sustainable long-term value for shareholders and for our partners and stakeholders in the year ahead.
Thank you for your continued support.
/s/ Ken MacKenzie
Ken MacKenzie
Chair
2
Table of Contents
Chief Executive Officer’s review
Dear Shareholders,
At BHP, we work to bring people and resources together to build a better world, and we continued to make solid progress on this in FY2024.
The tragic loss of a coworker at Saraji in January in a light vehicle incident underscored why safety must remain our first priority. Following an investigation, we have identified improvement areas for Saraji and BMA and work is underway to implement these. We must eliminate fatalities and serious injuries at our operations.
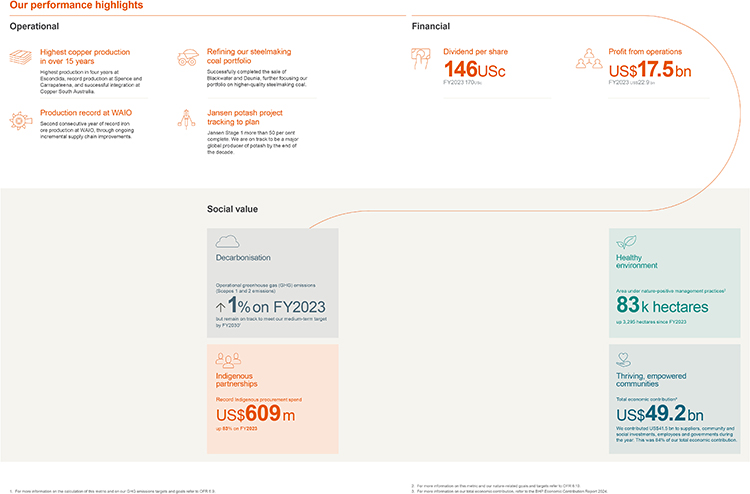
It was a year of strong overall business performance at BHP. By executing our strategy, we outperformed our competitors in key areas. We achieved an annual production record at Western Australia Iron Ore (WAIO), where we also widened our lead as the world’s lowest-cost iron ore producer. We delivered record production at copper assets Spence and Carrapateena, and the highest copper production in four years at Escondida – the world’s largest copper mine. We will distribute dividends totaling 146 US cents per share for the year.
Poised for growth
We continued to advance growth options in the commodities the world needs to meet the demands of the energy transition and population growth. We believe we have the balance sheet, technical and operational capability that will be needed to unlock new supply for the decades to come.
Construction of our Jansen potash project in Canada is ahead of the original schedule and first production is expected in just over two years. We have approved Jansen Stage 2, which will make BHP one of the leading players in the global potash industry by the end of the decade.
We have strengthened our position in copper. The integration of Prominent Hill and Carrapateena with Olympic Dam has delivered greater-than-expected synergies. We are exploring options to grow Copper South Australia’s production beyond 500 kilotonnes per annum (ktpa) of copper, with further potential up to 650 ktpa. In July 2024, we increased our early-stage copper options by agreeing to acquire a 50 per cent interest in the Filo del Sol and Josemaria projects with Lundin Mining in Argentina and Chile. If approved, this will give us the opportunity to advance one of the most significant copper discoveries globally in recent decades.
Our project pipeline and focus on continuous improvement in existing operations leave us well poised for growth across our four commodity pillars of copper, potash, iron ore and steelmaking coal in the decades ahead.
Winning strategy
Our actions in FY2024 are consistent with our winning strategy, founded on the three strategic pillars of safety and sustainability, exceptional performance and winning portfolio. In a cyclical industry, the stability of our operations and financial performance reflects the resilience and durability of our business.
The creation of social value is integral to our strategy and the delivery of long-term shareholder value. When we create social value, we build our case as the preferred partner for communities, we gain access to more opportunities, and we attract the best talent.
In the financial year, we increased Indigenous employment globally and boosted supplier spend with Indigenous businesses by 83 per cent to more than US$600 million. This was part of a broader 9 per cent increase to US$3.3 billion in supplier spend by BHP-operated businesses to more than 2,600 small, local and Indigenous businesses. This not only benefits our operations, but provides crucial support for jobs, businesses and families in regional communities surrounding them.
We made further progress on our operational decarbonisation plans and remain on track to meet our operational GHG emissions target of at least a 30 per cent reduction by FY2030 against an FY2020 baseline.
Refining our portfolio
We continue to focus on building a portfolio of world-class assets in attractive commodities in stable jurisdictions.
We refined our steelmaking coal portfolio in Queensland with the sale of the Daunia and Blackwater mines by our joint venture BMA. This strategic shift positions BMA well for the forecasted strong demand for higher-quality steelmaking coal. Following the transaction, around 90 per cent of our steelmaking coals are high-grade products attracting premium pricing.
In July 2024, we made the difficult but necessary decision to transition Western Australia Nickel into a period of temporary suspension. This reflected significant global oversupply of nickel, which we expect will continue until the end of the decade. We have offered redeployment to all frontline workers in other parts of BHP and will continue to support impacted host communities in a range of ways, including through our A$20 million Community Fund. We will continue to invest approximately US$300 million per annum in our Western Australia Nickel facilities to enable a potential re-start if the global nickel market outlook improves. We will review the decision by February 2027.
Our people and culture differentiate us
Our strong performance in FY2024 is a testament to our more than 90,000 employees and contractors who work hard to build a better BHP every day. They are empowered to do so by the BHP Operating System and we continue to build an inclusive and diverse culture with a performance edge.
3
Table of Contents
During the year we refreshed Our Values, which set the tone for our culture. Our Values comprise three simple statements. First and foremost, we must always ‘Do what’s right’ – operating safely and with integrity are non-negotiable. We also need to constantly ‘Seek better ways’ – listening to others, seeking out new ideas, and improving on today. And finally, we must always strive to ‘Make a difference’, which applies not only to the company and the team, but also to the individual. Every day we have the opportunity to have a positive impact on performance, those around us, and the world. Our Values help guide everything we do at BHP. They reflect both what we stand for and who we aspire to be.
Innovation and technology
BHP is well placed to capitalise on the opportunities afforded by artificial intelligence (AI) and advanced data analytics given our large-scale, repeatable operations and processes, and vast amounts of data. We are already starting to see benefits. The application of AI at our Escondida processing plants has helped save more than three gigalitres of water – and 118-gigawatt hours of energy – since FY2022. Machine learning has assisted in the discovery of new copper deposits in Australia and the United States.
Through our Xplor and BHP Ventures programs we continue to seek new partnerships and access to game-changing technologies and insight to help drive sustainable growth for the decades ahead.
In great shape
BHP finished FY2024 in an excellent position. We are well placed to benefit from the significant global changes happening around us. We have strategic clarity and exposure to the right commodities. We continue to build on our excellence in operations and discipline in our capital allocation.
We hold resilient, long-term assets with substantial optionality. This allows us to make smart choices about how and where we use our balance sheet to fund growth and generate value.
As we look to FY2025, we will continue to execute our strategy to create value for our shareholders, community partners and stakeholders, now and into the future.
Thank you for your continued support.
/s/ Mike Henry
Mike Henry
Chief Executive Officer
4
Table of Contents
1 Why BHP
Our strategy
We will responsibly manage the most resilient long-term portfolio of assets, in highly attractive commodities, and will grow value through being excellent at operations, discovering and developing resources, acquiring the right assets and options, and capital allocation.
Through our differentiated approach to social value, we will be a trusted partner who creates value for all stakeholders.

The world needs essential metals and minerals to be produced by companies who set and uphold high ESG standards, who run their operations safely and efficiently, and who allocate capital in a consistent and disciplined way. These are the companies that will succeed. This is BHP.
Our capabilities, track record, scale and the unique way we work through the BHP Operating System enable a culture of continuous improvement.
We aim to grow value for our shareholders, partners and stakeholders through our portfolio of large long-life quality assets in attractive commodities and through our focus on social value, which is integral to how we operate.
BHP is positioned to benefit from the changes shaping our planet now and for decades to come as demand for our commodities grows.
Our products are vital
Population growth, urbanisation and improving living standards are global trends that underpin strong demand for the commodities we produce.
Demand for essential commodities is expected to increase as the world seeks to decarbonise.
Iron ore is needed for making steel to build cities and renewables infrastructure. Steelmaking coal is needed for the blast furnace process for making steel. Copper is vital for electrification. Nickel can be used in electric vehicle batteries. Potash can help with food security and more sustainable land use.
Scale is important
As new large low-cost ore bodies become harder to find and develop, the scale and quality of our assets set us apart. We have some of the largest resources and lowest-cost assets in the world.
One of our biggest growth levers is productivity and unlocking more value from our existing assets. We seek to improve productivity through the capabilities of our people and culture of continuous improvement driven through the BHP Operating System, and the use of technology and innovation to extract more from what we do every day and more from our resources.
5
Table of Contents
The scale of our assets provides multiple growth options. We are seeking to produce more iron ore in Western Australia. We are working to improve productivity at our steelmaking coal operations in Queensland. We are advancing multiple growth options in copper in Chile and our recently established copper province in South Australia. We have sanctioned the second stage of our Jansen potash project in Canada, which will eventually double its expected annual production.
>For more information refer to OFR 5
Social value is embedded in everything we do
We are committed to social value: our positive contribution to society. It is vital for our future and a consideration in the strategic decisions we make.
Social value underpins stable operations, reduces risk and opens doors to opportunities, partnerships, talent and capital. Delivering social value will help us to continue to generate long-term value for all partners and stakeholders, including shareholders.
>For more information refer to OFR 6.2 to 6.5
We do what we say
BHP has a track record of doing what we say we will do. We continue to plan strategically, responsibly, consistently, with a clear focus on being the best operator, being disciplined in capital allocation and continuing to generate value and returns for stakeholders.
We have generated net operating cash flows of over US$15 billion for all but one of the past 15 years. This stability is our hallmark – achieved through robust capital management and consistent operational performance.
Including the final dividend for FY2024 declared, we will have distributed more than US$42 billion in total in cash dividends to shareholders since 1 July 2021. This includes US$7.4 billion in cash dividends for FY2024.
Our total economic contribution in FY2024 was US$49.2 billion. This includes contributions to suppliers, wages and benefits for more than 90,000 employees and contractors, dividends, taxes and royalties, and voluntary investment in projects in the communities where we operate.
>For more information refer to OFR 4 and the BHP Economic Contribution Report 2024 available at bhp.com/ECR2024
The future is clear
Key commodities we produce or are positioning to produce are vital for a better world and can help address global challenges, such as climate change and food security.
We are continuing to build an inclusive and diverse workforce of talented people. We have a strong balance sheet and industry-leading operational capability underpinned by the BHP Operating System and our technical Centres of Excellence.
Our track record, long-term stability and commitment to social value and sustainability set us apart.
This combination will help us achieve our aim of growing value more consistently for our partners and stakeholders and drive attractive returns and long-term value for our shareholders.
6
Table of Contents
1.1 Where we operate
Footnotes
| 1. | This includes contribution to suppliers, wages and benefits for employees and contractors, dividends, taxes and royalties, and voluntary social investment. For more information refer to the Economic Contribution Report 2024. |
| 2. | For more information refer to the Economic Contribution Report 2024. |
| 3. | Based on a ‘point-in-time’ snapshot of employees as at 30 June 2024, including employees on extended absence. Contractor data is collected from internal organisation systems and averaged for a 10-month period, July 2023 to April 2024. Figures reported do not include employees and contractors of BHP Mitsubishi Alliance Blackwater and Daunia operations, sold to Whitehaven Coal during FY2024, and employees and contractors of the operations in Brazil that were acquired as part of the OZ Minerals acquisition completed during FY2023. |
| 4. | Rest of the world includes consolidation adjustments related to intra-group transactions. |
| 5. | Shown on a BHP share basis. |
| 6. | Includes Newcastle Coal Infrastructure Group (NCIG), which is an equity accounted investment and its financial information presented above, with the exception of net operating assets, reflects BHP Group’s share. Total Coal statutory result excludes contribution related to NCIG until future profits exceed accumulated losses. |
| 7. | Includes Olympic Dam, Prominent Hill and Carrapateena. |
| 8. | Includes Nickel West and West Musgrave project. |
| 9. | Reflects the contribution of the Blackwater and Daunia mines to 2 April 2024, the date on which BMA’s owners completed its divestment. |
| 10. | BHP’s attributable coal production for the year, being 50 per cent of BMA’s steelmaking coal production (22.3 Mt) and 100 per cent of New South Wales Energy Coal production (15.4 Mt). |
| 11. | In October 2023, BHP approved US$4.9 billion in capital expenditure for Jansen Stage 2. First potash production from Jansen Stage 1, which has approved capital expenditure of US$5.7 billion, is expected in late CY2026. |
| 12. | Includes Spence and Cerro Colorado. |
7
Table of Contents
1.2 Our portfolio
A resource mix for today – and for the future
We have copper, which is used in electrification. Iron ore, which is essential for making steel needed for construction, including renewables infrastructure. Our higher-quality steelmaking coal is used in the blast furnace process for making steel. Nickel can be used in electric vehicle batteries. We are on track to be a major global producer of potash by the end of the decade. Potash is used in fertilisers to assist with food security for a growing population and more sustainable land use. Among our by-products, we are a major producer of uranium and gold.
Copper
Highest production in over 15 years
1.86 Mt
^9% on FY2023
We hold the world’s largest copper mineral resources.1 We are using technical innovation, such as new flotation technology, to help lower energy costs and unlock value. We continue to pursue our strategy to increase our exposure to future-facing commodities, including copper, through exploration, acquisition and early-stage options. Our copper production rose 9 per cent in FY2024 to the highest in more than 15 years.
Escondida in Chile is the world’s largest copper mine. It increased production by 7 per cent in FY2024 compared to FY2023, to 1.12 million tonnes (Mt) (100 per cent basis). This was primarily due to a higher concentrator feed grade as mining progressed into areas of higher-grade ore as planned following the implementation of measures to manage geotechnical events in FY2023. Spence in Chile delivered another year of record production, up 6 per cent to 255 kilotonnes (kt). We are exploring a range of growth options across our Chilean copper assets, including a potential new concentrator at Escondida and the application of leaching technologies at Spence and Cerro Colorado.
We have established a significant resource base at Copper South Australia by adding Olympic Dam with Carrapateena and Prominent Hill from our OZ Minerals acquisition in FY2023. The successful integration of the former OZ Minerals assets has delivered increased production and exceeded our annualised synergies planned at the time of the acquisition of OZ Minerals. This has been through actions such as the processing of Prominent Hill and Carrapateena concentrate at Olympic Dam into higher-margin cathode and refined gold, resulting in annual records for cathode and gold production at Olympic Dam. Copper South Australia production was 322 kt in FY2024, including record production at Carrapateena. We’re progressing growth options at Copper South Australia, where our aspiration is to grow copper production to beyond 500 kt per year. Given the gold, silver and uranium co-products, this would be equivalent to over 700 kt per annum copper equivalent. We had exploration success in South Australia in FY2024 with OD Deeps, delivering greater than two kilometres in strike and more than one kilometre in depth at over 1 per cent copper grade and an Inferred Mineral Resource declaration at Oak Dam.
In July 2024, we agreed to acquire a 50 per cent interest in the Filo del Sol and Josemaria copper projects in Argentina and Chile with Lundin Mining. If approved, this will give us the opportunity to jointly advance an emerging copper district with world-class potential.
>For more information refer to OFR 5.2 and 5.3
Iron ore
Second-consecutive full-year production record
260 Mt
^1% on FY2023
Western Australia Iron Ore (WAIO) is the lowest-cost major iron ore producer globally2 and has one of the lowest greenhouse gas (GHG) emission production intensities of benchmarked iron ore operations.3
WAIO delivered a second-consecutive full-year production record of 287 Mt (255 Mt BHP share), reflecting strong supply chain performance with increased capacity unlocked by the Port Debottlenecking Project 1 and increased production from South Flank, our newest and most technologically advanced mine. These more than offset the impacts of the continued tie-in activity for the Rail Technology Programme 1. South Flank ramped up to full production capacity of 80 million tonnes per annum (Mtpa) (100 per cent basis) on schedule during FY2024.
8
Table of Contents
We continue to invest in improvements in our rail and port operations and are assessing options to grow our WAIO production up to 330 Mtpa if market conditions warrant. These options include optimal mine and infrastructure configurations and potentially increased ore beneficiation. We expect to complete these studies in CY2025.
>For more information refer to OFR 5.1
Steelmaking coal
Focusing on higher-quality product
22.3 Mt
i 23% on FY2023
We continue to focus our steelmaking coal operations in Queensland on higher-quality product and have one of the lowest GHG emission production intensities of benchmarked export steelmaking coal mines.3 In a challenging year for BMA, production decreased from the prior year as a result of increased stripping to improve supply chain stability and restore depleted inventory positions, which arose from extended weather impacts and labour constraints over recent years, and the divestment of Blackwater and Daunia on 2 April 2024.
We believe a wholesale shift away from the blast furnace process for steelmaking is decades in the future. We also believe higher-quality steelmaking coals have potential for greater upside for quality premiums. This is because we believe steelmakers will seek to operate their blast furnaces with stronger, higher-performance steelmaking coal to lower overall coal consumption and, over time, to improve blast furnace process performance when implementing future GHG emission reduction technologies.
On 2 April 2024, BHP and its joint venture partner, Mitsubishi Development Pty Ltd, completed the sale of the Blackwater and Daunia mines to Whitehaven Coal for up to US$4.1 billion (100 per cent basis). Following the sale, around 90 per cent of BMA’s products will be sold by reference to the Platts PLV HCC FOB Qld index, the highest quality steelmaking coal index, up from 64 per cent prior to the transaction.
>For more information refer to OFR 5.1
Nickel
Temporary suspension announced
81.6 kt
^2% on FY2023
Nickel West production in FY2024 was in line with the prior year.
On 11 July 2024, we announced Western Australia Nickel, comprising the Nickel West operations and West Musgrave project, would be temporarily suspended from October 2024. We intend to review this decision by February 2027.
The decision to temporarily suspend Western Australia Nickel reflects oversupply in the global nickel market. Forward consensus nickel prices over the next half of the decade have fallen sharply reflecting strong growth of alternative low-cost nickel supply.
During the temporary suspension, BHP will continue to support our workforce and local communities. BHP will invest approximately US$300 million per annum following completion of a transition period to support a potential re-start of Western Australia Nickel. The transition period commenced in July 2024. Operations will be suspended in October 2024 and handover activities for temporary suspension are expected to be completed by December 2024.
>For more information refer to OFR 5.1
9
Table of Contents
Potash
Major global producer by the end of the decade
US$10.6bn
Total approved capital expenditure through Jansen Stage 1 and Jansen Stage 2
We are developing one of the world’s largest potash mines in Canada. The Jansen potash project will increase our product diversification, customer base and operating footprint, and expand our business into a future growth market.
The US$5.7 billion Jansen Stage 1 project is ahead of the original schedule and was over 50 per cent complete by the end of FY2024. First production from Jansen Stage 1 is expected in late CY2026, followed by a two-year ramp-up period. In October 2023, we announced an additional investment of US$4.9 billion for Jansen Stage 2, which will increase Jansen’s total planned potash production capacity to ~8.5 Mtpa. We have commenced execution of Jansen Stage 2.
Transitioning directly from Jansen Stage 1 to Jansen Stage 2 during the construction period will bring operational benefits, including leveraging the experience of our integrated project team and continued use of our existing suppliers and contractors.
We are on track to be a major global producer of potash by the end of the decade. Longer term, Jansen has the potential for two additional expansions to reach an ultimate production capacity of 16 to 17 Mtpa (subject to studies and approvals).
>For more information refer to OFR 5.3
Footnotes
| 1. | Largest copper mineral resources on a contained metal basis, equity share. Peers include: Anglo American, Antofagasta, Codelco, First Quantum Minerals, Freeport, Glencore, Rio Tinto, Southern Copper and Teck. Source peers: Wood Mackenzie Ltd, Q2 2023. Source BHP data: BHP Annual Report 2024. |
| 2. | Based on published unit costs of major iron ore producers as reported at 30 June 2024. There may be differences in the manner that third parties calculate or report unit costs data compared to BHP, which means third-party data may not be comparable with our data. |
| 3. | For CY2023, the GHG emissions intensity of our production of our commodities is estimated to rank in the first quartile for our iron ore, copper and steelmaking coal mines, and the second quartile for our nickel operations (ahead of all Indonesian-based operations) of global mining operations analysed by CRU. This analysis is based on CY2023 data from CRU (as CRU data is prepared on a calendar year basis), and includes CRU’s assumptions and estimates of BHP’s operations. We transitioned to using CRU (rather than Skarn Associates) for this analysis in FY2024 as part of an annual vendor assessment and selection process. For more information on how the GHG emission intensity for our iron ore and steelmaking coal mines has been calculated and compared refer to the BHP ESG Standards and Databook 2024 available at bhp.com/climate. |
2 What differentiates us
BHP’s ability to deliver differentiates us from our competitors. We do what we say we will do. This has created stability in our historical performance that has been a hallmark of BHP for more than a decade.
There are many factors that underpin this historic stability, each of which is vital. It’s the unique combination of these factors that sets us apart.
Our people
We have more than 90,000 employees and contractors globally. We strive to offer an engaging and supportive workplace, which empowers our people to find safer and more productive ways of working. We do this by providing the tools and opportunities in our working environment to allow our people to perform at their best. Our people are empowered daily in their work by the BHP Operating System.
10
Table of Contents
Our Values
Our Values set the tone for our culture, a unique part of our competitive advantage. They are a declaration of what we stand for. They guide our decision-making, reinforce our culture and ensure all our people are steering in the same direction, delivering on our purpose.
In FY2024, Our Values were refreshed to:
Do what’s right – A sustainable future starts with safety and integrity, building trust with those around us
Seek better ways – Listening to learn and inspiring challenge is how we drive progress
Make a difference – The accountability to act, create value and have impact is on each of us, every day
Our Values help our people move quickly and deliberately when we encounter challenges and opportunities.
Health and safety
>For more information refer to OFR 6.1 and 6.8
Female employee participation
Indigenous employee participation2
Footnotes
| 1. | Combined employee and contractor frequency per 1 million hours worked. |
| 2. | Point in time data at 30 June 2024. |
| 3. | Participation in Minerals Australia operations in Australia. FY2023 figure does not include OZ Minerals. |
| 4. | Participation in Minerals Americas operations in Chile. |
| 5. | Participation in Jansen potash project and operation employees in Canada. |
11
Table of Contents
BHP Operating System
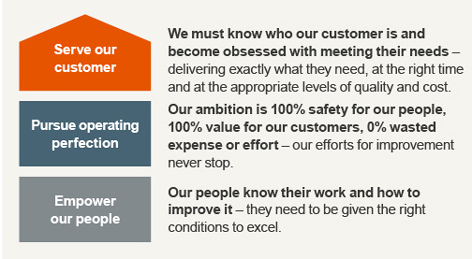
The BHP Operating System (BOS) is our unique overarching management system that enables the right culture, routines, behaviours and leadership to deliver stable operating excellence and leading safety performance. It provides us with a competitive edge.
BOS drives continuous improvement through the application of BOS tools and practices. It makes improvement central to everyone’s role, allowing people to work on the system, not just in it.
BOS helps us continuously focus on leadership development, capability and engagement, and creates better-planned, more stable work processes.
Aligning around our strategy, operating philosophy and principles for decision-making will make us an even better company – one that focuses on safety, leads the sector, generates strong returns for our shareholders, and meets the expectations of our partners, communities and other stakeholders.
We have deployed BOS across our business.
How BOS works
Three principles underpin BOS and guide how we think and behave at BHP
Exceptional performance
Operating and financial strength
The strength of our portfolio, our operating excellence and financial rigour from our disciplined application of the Capital Allocation Framework (CAF) enables us to deliver strong and consistent returns. We achieved net operating cash flow of US$20.7 billion in FY2024. Our net operating cash flow has been more than US$15 billion for all but one of the past 15 years.
In FY2024, through our CAF, we kept our balance sheet strong, delivered growth and returns for our shareholders, made progress towards our social value and GHG emission reduction objectives and prioritised capital to maintain reliable operations.
Operational excellence
Our strong results in FY2024 were driven by performance and discipline at our operations, which overall performed well. We achieved production guidance across all commodities in FY2024, with steelmaking coal achieving the upper end of its revised production guidance. This included record annual production at WAIO, Spence and Carrapateena, record cathode and gold production at Olympic Dam, and the highest production in four years at Escondida.
Our focus on cost discipline helped us manage inflationary pressures effectively. We experienced a global inflation rate of around 4 per cent, particularly in relation to labour. Our cost discipline allowed us to mitigate these ongoing cost pressures with unit costs around 2.9 per cent higher across our major assets. We met unit cost guidance at Escondida, WAIO and Spence, and revised unit cost guidance at BMA. WAIO extended its lead over competitors as the lowest cost major iron ore producer globally.
For mining companies, cost differentiation is becoming even more pronounced. General inflation and labour are expected to continue to put upwards pressure on costs. The costs of decarbonisation are also expected to be inflationary and will disproportionately impact companies with higher GHG emissions intensity. As such, while the marginal cost of mining production is clearly higher than in the past; in the medium term there are signs it could go higher.
12
Table of Contents
Technology and innovation
The use of technology and our focus on innovation, together with BOS, have helped accelerate continuous improvement – from the introduction of advanced technologies designed to improve safety and increase productivity of our operated assets, to reducing water and energy consumption.
Technology is a key lever for BHP and has been used to:
| • | support the maintenance of safe, predictable and productive operations |
| • | drive productivity improvements, with an emphasis on automation and real-time, data-driven insights and decision-making |
| • | unlock the next stage of value growth potential, such as by realising greater margins at our existing operations and enabling the discovery of new assets |
| • | improve sustainability outcomes through innovation |
| • | help drive inclusion and diversity, such as remote operations and decision support tools that make roles more accessible to a wider range of people |
The advanced use of next generation technologies, such as artificial intelligence (AI) and cloud and data analytics, are supporting quicker and more efficient resource recovery, more safely and more sustainably. They are also helping lift performance through operational improvements.
Examples of how BHP used AI in FY2024 include:
| • | A digital tool at Escondida used AI to increase revenue by US$18.9 million in FY2024 by enabling drill and blast teams to select a more optimal blasting pattern design. The technology also helps to mitigate coarse ore restrictions at Escondida’s semi-autogenous grinding (SAG) mills by improving post-blasting fragmentation. We will use this tool at Spence to assist with stabilising its SAG mill performance and increase its productivity. |
| • | Next generation improvements to the Process Area Set Point Optimisation (PASPO) were rolled out across BMA sites in FY2024 to increase production of on-specification steelmaking coal, increasing revenue by US$15.5 million. For example, the Caval Ridge team identified an opportunity to increase yield by reducing density variation while keeping train product ash on specification. |
We upgraded our global technology system 1SAP ERP to S/4HANA in FY2024. The modernisation of this core global platform is critical to our operations, as it is used to:
| • | pay our people and suppliers |
| • | sell and deliver our products |
| • | better maintain our equipment |
| • | accurately report our financial results to the market |
| • | above all, enable us to operate more safely, efficiently and reliably |
Social value
We are committed to social value and sustainability and are making progress in more responsibly providing commodities the world needs to develop and decarbonise. We believe this commitment can help us become a partner of choice with communities, governments, suppliers and our customers. We seek to be a valued partner with the communities where we operate and the Indigenous peoples we interact with.
In FY2024, we continued to refine our approach to social value. We have provided progress on our 2030 goals through our 2030 social value scorecard.
>For more information on our 2030 social value scorecard refer to OFR 6.5
Through our commitment to sustainability, we seek to reduce the impact of our operational activities. We have set a long-term goal to achieve net zero operational GHG emissions (Scopes 1 and 2 emissions from our operated assets) by CY2050. We also have a long-term goal of net zero Scope 3 GHG emissions by CY2050. Achievement of this Scope 3 goal is uncertain, particularly given the challenges of a net zero pathway for our customers in steelmaking, and we cannot ensure the outcome alone.
We manage our operational decarbonisation projects across our operated assets through our CAF to help us use our capital effectively.
13
Table of Contents
We are also working with our suppliers and customers to support their efforts to reduce GHG emissions. For example, during FY2024 we signed a framework agreement with Rio Tinto and BlueScope to investigate the development of an ironmaking electric smelting furnace pilot plant using Pilbara iron ores that have been pre-processed into direct reduced iron. This process route could open a pathway to an alternative to the conventional blast furnace method of steelmaking with the potential to reduce GHG emissions intensity by 85 per cent and meet near zero emission steelmaking benchmarks.1
For more information on our GHG emission goals and targets refer to OFR 6.9
We have set goals in areas such as environment and water stewardship. To meet the FY2024 short-term milestone for the Healthy environment pillar of our social value scorecard, we have developed a Group-level framework for nature-positive plans to achieve our 2030 Healthy environment goal (BHP Healthy environment goal roadmap).2 Our 2030 Healthy environment goal is to create nature-positive3 outcomes by having at least 30 per cent of the land and water we steward4 at the end of FY2030 under conservation, restoration or regenerative practices.
At 30 June 2024, we had 83,012 hectares or 1.62 per cent5 of the land and water we steward4,6 under nature-positive management practices.7
>For more information refer to OFR 6.5
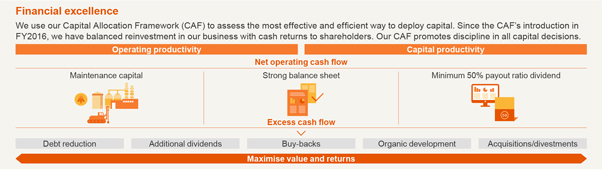
Financial excellence
We use our Capital Allocation Framework (CAF) to assess the most effective and efficient way to deploy capital. Since the CAF’s introduction in FY2016, we have balanced reinvestment in our business with cash returns to shareholders.
Our CAF promotes discipline in all capital decisions.
Footnotes
| 1. | Based on direct reduced iron electric smelting furnace route (using renewable or other low to zero GHG emissions power). Estimated reduction in GHG emissions intensity is calculated relative to a baseline reference of 2.2 tonnes of CO2-e per tonne of crude steel, as sourced from IEA Iron and Steel Technology Roadmap (October 2020). For more information refer to our Value chain GHG emissions – Hydrogen reduction and electric smelting of BHP ores case study on page 26 of our Climate Transition Action Plan 2024, available at bhp.com/CTAP2024. |
| 2. | The BHP Healthy environment goal roadmap is intended to apply to our operated assets in Australia, Chile and Canada. Due to the acquisition of OZ Minerals and prioritisation of activities based on risks and impacts, Carrapateena, Prominent Hill, West Musgrave and legacy assets are currently out of scope for the roadmap; with the exception of West Musgrave, these assets are planned to be incorporated into the roadmap in FY2025. Incorporation of West Musgrave into the BHP Healthy environment goal roadmap will be reviewed following the decision to temporarily suspend the Western Australia Nickel operations. |
| 3. | Nature-positive is defined by the TNFD Glossary version 1.0 as ‘A high-level goal and concept describing a future state of nature (e.g. biodiversity, ecosystem services and natural capital), which is greater than the current state’. We understand it includes land and water management practices that halt and reverse nature loss – that is, supporting healthy, functioning ecosystems. BHP intends to review this definition in FY2025, in light of the recently revised TNFD Glossary version 2.0 (June 2024) definition of nature-positive. |
| 4. | This excludes areas we hold under greenfield exploration licences (or equivalent tenements), which are outside the area of influence of our existing mine operations. 30 per cent will be calculated based on the areas of land and water that we steward at the end of FY2030. |
| 5. | 1.62 per cent is calculated based on the areas of land and water that we stewarded (excluding areas we hold under greenfield exploration licences (or equivalent tenements) and subject to footnote 6) at 30 June 2024 – which was approximately 5,125,935 hectares; an increase of approximately 18,750 hectares compared to approximately 5,107,185 hectares at 30 June 2023. For more information on the restatement of FY023 figures refer to OFR 6.10. |
| 6. | While some of the land related to the Daunia and Blackwater mines is pending transfer following BMA’s divestment of these mines on 2 April 2024, these areas are no longer under BMA’s control or operated for BMA’s benefit so have been excluded from the areas of land and water we stewarded at 30 June 2024. |
| 7. | Nature-positive management practices refer to an area under stewardship that has a formal management plan that includes conservation, restoration or regenerative practices. For more information refer to the BHP ESG Standards and Databook 2024, available at bhp.com/ESGStandards2024. |
14
Table of Contents
3 Positioning for growth
With our clear strategy and our laser-like focus on creating and sustaining the right portfolio of the best assets in attractive commodities with enhanced growth optionality, BHP is well placed to capitalise on the changes shaping our world. As the global population grows and urbanises and the world pursues decarbonisation and electrification, we are positioning our portfolio and pursuing multiple growth options to increase our exposure to these megatrends.
Unlocking growth at our assets
One of our biggest near-term growth levers is from improving productivity at our existing assets and unlocking more of their potential.
WAIO was designed with an initial capacity of 240 Mtpa. In FY2024, it produced a record 287 Mt (100 per cent basis). We are implementing initiatives to grow WAIO production to more than 305 Mtpa over the medium term. This is expected to be through South Flank, which reached full production capacity in FY2024, the continued debottlenecking of our port and rail systems, the rollout of autonomous haulage trucks, and ongoing productivity enhancements. We are studying options to further grow annual production up to 330 Mt over the medium to long term, with these studies expected to be completed in CY2025.
Escondida has significant resource potential and we are progressing a range of studies, including potentially replacing the original Los Colorados concentrator. We are also looking at different leaching technologies that could help us extract more copper while potentially using less energy and water, reduce or eliminate the need for tailings dams, and enable production of cathode-finished product that does not require smelting.
Growing our position in potash
Potash is a fertiliser and enables more efficient and sustainable farming. With the world’s population continuing to grow and rising concerns around food security and land use, potash is a future-facing commodity that presents opportunities for growth.
At the end of FY2024, Jansen Stage 1 was tracking ahead of the original schedule and more than 50 per cent complete. Production is expected to commence in late CY2026, followed by a two-year ramp-up period. When Jansen Stage 1 reaches full production, planned production will be approximately 4.15 Mtpa.
During FY2024, BHP approved Jansen Stage 2, which will double planned production to around 8.5 Mtpa at full capacity. Jansen Stage 2 is an important milestone that underscores our confidence in potash and marks the next phase of BHP’s growth in Canada. We believe Jansen will deliver long-term value for shareholders and the local community, and will position BHP as one of the leaders in the global potash industry. We have commenced execution of Jansen Stage 2, with first production expected in FY2029.
Copper South Australia: Consolidating a significant resource base
We have established a significant resource base at Copper South Australia by combining OZ Minerals’ two South Australian mines, Prominent Hill and Carrapateena, with Olympic Dam and the Oak Dam deposit.
With Copper South Australia, we are focused on developing an asset with greater scale and simplicity. Copper South Australia produced 322 kt of copper in FY2024 and we are pursuing potential pathways to expand this to more than 500 kilotonnes per annum (ktpa) through increases in mine production rates and improved mining methods, the expansion of smelting and refining capacity, the application of BOS, the development of exploration assets and greater by-product production.
Exploration efforts progressed at the Oak Dam copper deposit located 65 kilometres southeast of Olympic Dam and at OD Deeps, which is below Olympic Dam. The Copper South Australia province is expected to produce copper, gold and uranium oxide for decades to come.
>For more information refer to OFR 5.2
Creating and accelerating longer-term options
BHP Ventures
BHP Ventures is our dedicated venture capital unit. It looks for game-changing technologies via emerging companies to help drive ongoing and more sustainable growth within BHP and provides us with a portfolio of new growth options for the decades ahead.
BHP Ventures complements the innovation already underway within BHP by forging new partnerships and creating fresh opportunities to strengthen our portfolio and support the decarbonisation of our operated assets and decarbonisation opportunities in our value chain. For our partners, BHP Ventures provides an opportunity to collaborate with us.
New investments in FY2024 included SiTration, which is developing a silicon membrane-based technology for metal extraction, and ZwitterCo, which is developing membrane solutions for the treatment of water. BHP continued to support existing portfolio companies Boston Metal and Electra through technical knowledge exchanges and the supply of iron ores for testing in relation to technologies that have potential to contribute to our Scope 3 emissions medium-term goal for steelmaking and our long-term net zero goal. BHP also continued to test early-stage leaching technologies from Jetti Resources and Ceibo as part of broader copper leaching studies.
Think & Act Differently
Think & Act Differently is BHP’s internal team set up to find and accelerate the best mining technology solutions to support our ambitions to deliver commodities the world needs in new ways. It is focused on opening new and accelerated pathways to market through partnerships, rapid experimentation and systems thinking. It aims to de-risk a portfolio of over 100 initiatives, from small scale experiments to on-site demonstrations.
15
Table of Contents
We are seeking to advance technologies that can unlock resource growth, particularly relating to copper, and build capability across the mining value chain to find new ways to understand ore bodies and responsibly extract and process resources. Current areas of work include leaching, ore body knowledge and accelerated minerals recovery.
BHP Exploration
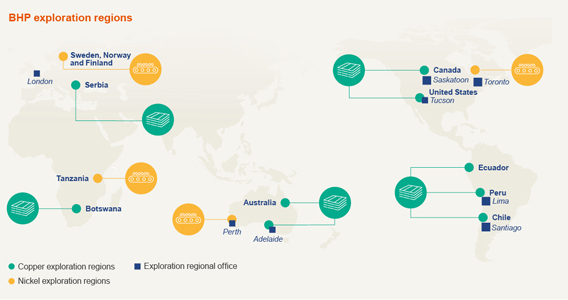
During FY2024, we advanced our global programs focusing on early-stage exploration opportunities in Australia, Canada, Chile, Peru, Sweden, Serbia and the United States. This effort involved concept evaluation work through prospect testing.
We fully integrated the OZ Minerals exploration portfolio, significantly expanding our land holdings and enabling us to develop an important province in South Australia with significant copper potential.
In Canada, we continued our partnership with Midland Exploration Inc. through our prospect generation exploration alliance.
In the United States, we entered an alliance with Ivanhoe Electric Inc., with BHP to provide initial funding of US$15 million over three years to explore for copper and other critical minerals across areas of interest in Arizona, New Mexico and Utah.
In Australia, we commenced a partnership with Red Ox Copper Pty Ltd, exploring for copper in Northern Queensland.
In Europe, we acquired Ragnar Metals Sweden AB for A$9.8 million, gaining ownership of the Tullsta nickel project. Similarly, we entered into early-stage exploration alliances with Kingsrose Mining Ltd across areas of interest in Finland and Norway, and with Tutume Metals in Botswana.
Aso in FY2024, we withdrew from the Elliott Farm-in and joint venture agreement with Encounter Resources Limited in Australia.
Growth through exploration, focused on copper and nickel
BHP Xplor
BHP Xplor, launched in FY2023, is a global accelerator program designed to support early-stage mineral exploration companies in finding critical resources needed for the energy transition. Its aim is to identify and nurture the next generation of explorers, empowering them to fast track their geologic concepts for potential long-term partnership. The program supports technical, business and operational facets to equip participant companies with the necessary tools and guidance to become investment ready.
To date, agreements have been concluded with three companies from the inaugural FY2023 cohort for follow-on investment, due to their region of interest, potential technical opportunity, team capability and strategic alignment.
In FY2024, six companies were chosen from a pool of over 500 applications to take part in this year’s program. These companies were East Star Resources Plc, Hamelin Gold Ltd, Pallas Resources Ltd, Longreach Mineral Exploration Pty Ltd, Equivest Metals Oy and Cobre Ltd. They have concluded their six-month program and follow-on investment discussions have started. Applications for the FY2025 Xplor program opened in August 2024.
16
Table of Contents
Exploration expenditure
Our resource assessment exploration expenditure increased by 31 per cent in FY2024 to US$333 million, while our greenfield expenditure increased by 31 per cent to US$124 million. Expenditure on resources assessment and greenfield exploration over the last three financial years is set out below.
Year ended 30 June | 2024 US$M | 2023 US$M | 2022 US$M | |||||||||
Greenfield exploration | 124 | 95 | 77 | |||||||||
Resources assessment | 333 | 255 | 179 | |||||||||
|
|
|
|
|
| |||||||
Total metals exploration and assessment | 457 | 350 | 256 | |||||||||
|
|
|
|
|
| |||||||
Exploration expense
Exploration expense represents that portion of exploration expenditure that is not capitalised in accordance with our accounting policies, as set out in Financial Statements note 11 ‘Property, plant and equipment’.
Exploration expense for each segment over the last three financial years is set out below.
Year ended 30 June | 2024 US$M | 2023 US$M | 2022 US$M | |||||||||
Exploration expense | ||||||||||||
Copper | 213 | 145 | 85 | |||||||||
Iron Ore | 41 | 52 | 54 | |||||||||
Coal | 3 | 6 | 6 | |||||||||
Group and unallocated items1,2 | 152 | 91 | 54 | |||||||||
|
|
|
|
|
| |||||||
Total Group | 409 | 294 | 199 | |||||||||
|
|
|
|
|
| |||||||
| 1. | Group and unallocated items includes functions, other unallocated operations including Potash, Western Australia Nickel (which comprises the Nickel West operations and, following the OZ Minerals Ltd (OZL) acquisition on 2 May 2023, the West Musgrave project), legacy assets and consolidation adjustments. |
| 2. | Includes US$10 million of exploration expenditure previously capitalised, written off as impaired (included in depreciation and amortisation) (FY2023: US$ nil; FY2022: US$ nil). |
Chief Financial Officer’s review
Not required for US reporting.
17
Table of Contents
4 Financial review
4.1 Group overview
We prepare our Consolidated Financial Statements in accordance with International Financial Reporting Standards (IFRS), as issued by the International Accounting Standards Board. We publish our Consolidated Financial Statements in US dollars. All Consolidated Income Statement, Consolidated Balance Sheet and Consolidated Cash Flow Statement information below has been derived from audited Consolidated Financial Statements.
>For more information refer to Financial Statements
We use various non-IFRS financial information to reflect our underlying performance. Non-IFRS financial information is not defined or specified under the requirements of IFRS, however is derived from the Group’s Consolidated Financial Statements prepared in accordance with IFRS. Non-IFRS financial information is consistent with how management reviews financial performance of the Group with the Board and the investment community. OFR 10 ‘Non-IFRS financial information’ includes our non-IFRS financial information and OFR 10.1 ‘Definition and calculation of non-IFRS financial information’ outlines why we believe non-IFRS financial information is useful and the relevant calculation methodology. We believe non-IFRS financial information provides useful information, however it should not be considered as an indication of, or as a substitute for, statutory measures as an indicator of actual operating performance (such as profit or net operating cash flow) or any other measure of financial performance or position presented in accordance with IFRS, or as a measure of a company’s profitability, liquidity or financial position.
Summary of financial measures
Year ended 30 June US$M | 2024 | 2023 | ||||||
Consolidated Income Statement (Financial Statements 1.1) | ||||||||
Revenue | 55,658 | 53,817 | ||||||
Profit/(loss) after taxation from Continuing operations | 9,601 | 14,324 | ||||||
Profit/(loss) after taxation from Continuing and Discontinued operations attributable to BHP shareholders | 7,897 | 12,921 | ||||||
Dividends per ordinary share – paid during the period (US cents) | 152.0 | 265.0 | ||||||
Dividends per ordinary share – determined in respect of the period (US cents) | 146.0 | 170.0 | ||||||
Basic earnings/(loss) per ordinary share (US cents) | 155.8 | 255.2 | ||||||
| ||||||||
Consolidated Balance Sheet (Financial Statements 1.3) | ||||||||
Total assets | 102,362 | 101,296 | ||||||
Net assets | 49,120 | 48,530 | ||||||
| ||||||||
Consolidated Cash Flow Statement (Financial Statements 1.4) | ||||||||
Net operating cash flows | 20,665 | 18,701 | ||||||
Capital and exploration and evaluation expenditure | 9,273 | 7,083 | ||||||
| ||||||||
Other financial information (OFR 10) | ||||||||
Net debt | 9,120 | 11,166 | ||||||
Underlying attributable profit | 13,660 | 13,420 | ||||||
Underlying EBITDA | 29,016 | 27,956 | ||||||
Underlying basic earnings per share (US cents) | 269.5 | 265.0 | ||||||
Underlying return on capital employed (per cent) | 27.2 | 28.8 | ||||||
4.2 Key performance indicators
Our key performance indicators (KPIs) enable us to measure our development and financial performance. These KPIs are used to assess performance of our people throughout the Group.
>For information on our approach to performance and reward refer to Remuneration Report
>For information on our overall approach to executive remuneration, including remuneration policies and remuneration outcomes refer to Remuneration Report
Following BHP’s sale of the Onshore US assets in FY2019 and subsequently the merger of our Petroleum business with Woodside in FY2022, the contribution of these assets to the Group’s results is presented as Discontinued operations. Footnotes to tables and infographics indicate whether data presented in OFR 4.2 is inclusive or exclusive of Petroleum assets. Details of the contribution of the Petroleum assets to the Group’s results are disclosed in Financial Statements note 28 ‘Discontinued operations’.
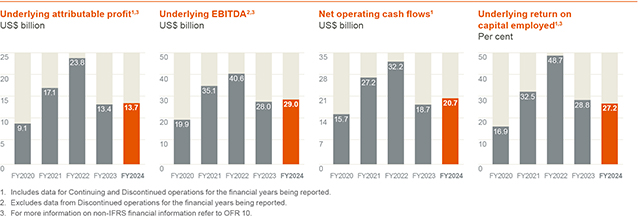
18
Table of Contents
Reconciling our financial results to our key performance indicators
Profit | Earnings | Cash | Returns | |||||||||||||||||||||||||||||||||||
| US$M | US$M | US$M | US$M | |||||||||||||||||||||||||||||||||||
Measure | Profit after taxation from Continuing and Discontinued operations |
| 9,601 | Profit after taxation from Continuing and Discontinued operations | 9,601 | Net operating cash flows from Continuing operations | 20,665 | Profit after taxation from Continuing and Discontinued operations |
| 9,601 | ||||||||||||||||||||||||||||
| Made up of | Profit after taxation | Profit after taxation | Cash generated by the Group’s consolidated operations, after dividends received, interest, proceeds and settlements of cash management related instruments, taxation and royalty-related taxation. It excludes cash flows relating to investing and financing activities. |
| Profit after taxation |
| ||||||||||||||||||||||||||||||||
| Adjusted for | Exceptional items before taxation | 6,600 | Exceptional items before taxation | 6,600 | Exceptional items after taxation |
| 5,763 | |||||||||||||||||||||||||||||||
Tax effect of exceptional items |
|
(837) |
|
Tax effect of exceptional items |
|
(837 |
) | Net finance costs excluding exceptional items |
|
|
983 |
| ||||||||||||||||||||||||||
Exceptional items after tax attributable to non-controlling interests |
|
– |
|
Depreciation and amortisation excluding exceptional items |
|
5,295 |
|
Income tax expense on net finance costs |
|
|
(303) |
| ||||||||||||||||||||||||||
|
| |||||||||||||||||||||||||||||||||||||
Exceptional items attributable to BHP shareholders |
|
5,763 |
| Impairments of property, plant and equipment, financial assets and intangibles excluding exceptional items | 90 | Profit after taxation excluding net finance costs and exceptional items |
|
|
16,044 |
| ||||||||||||||||||||||||||||
|
| |||||||||||||||||||||||||||||||||||||
| Profit after taxation attributable to non-controlling interests |
|
(1,704 |
) |
Net finance costs excluding exceptional items | 983 | Net Assets at the beginning of period |
|
48,530 |
| |||||||||||||||||||||||||||||
Taxation expense excluding exceptional items | 7,284 | Net Debt at the beginning of period |
|
11,166 |
| |||||||||||||||||||||||||||||||||
|
| |||||||||||||||||||||||||||||||||||||
| Capital employed at the beginning of period | 59,696 | |||||||||||||||||||||||||||||||||||||
| Net Assets at the end of period | 49,120 | |||||||||||||||||||||||||||||||||||||
| Net Debt at the end of period | 9,120 | |||||||||||||||||||||||||||||||||||||
|
| |||||||||||||||||||||||||||||||||||||
| Capital employed at the end of period | 58,240 | |||||||||||||||||||||||||||||||||||||
|
| |||||||||||||||||||||||||||||||||||||
| Average capital employed | 58,968 | |||||||||||||||||||||||||||||||||||||
|
| |||||||||||||||||||||||||||||||||||||
| To reach our KPIs | Underlying attributable profit |
| 13,660 | Underlying EBITDA | 29,016 | Net operating cash flows | 20,665 | Underlying return on capital employed | 27.2% | |||||||||||||||||||||||||||||
| Why do we use it? | Underlying attributable profit allows the comparability of underlying financial performance by excluding the impacts of exceptional items. |
| Underlying EBITDA is used to help assess current operational profitability excluding the impacts of sunk costs (i.e. depreciation from initial investment). It is a measure that management uses internally to assess the performance of the Group’s segments and make decisions on the allocation of resources. | Net operating cash flows provide insights into how we are managing costs and increasing productivity across BHP. | Underlying return on capital employed is an indicator of the Group’s capital efficiency. It is provided on an underlying basis to allow comparability of underlying financial performance by excluding the impacts of exceptional items. |
| ||||||||||||||||||||||||||||||||
19
Table of Contents
4.3 Financial results
The following table provides more information on the revenue and expenses of the Group in FY2024.
Year ended 30 June | 2024 US$M | 2023 US$M | 2022 US$M | |||||||||
Continuing operations | ||||||||||||
Revenue1 | 55,658 | 53,817 | 65,098 | |||||||||
Other income | 1,285 | 394 | 1,398 | |||||||||
Expenses excluding net finance costs | (36,750 | ) | (31,873 | ) | (32,371 | ) | ||||||
(Loss)/profit from equity accounted investments, related impairments and expenses | (2,656 | ) | 594 | (19 | ) | |||||||
|
|
|
|
|
| |||||||
Profit from operations | 17,537 | 22,932 | 34,106 | |||||||||
|
|
|
|
|
| |||||||
Net finance costs | (1,489 | ) | (1,531 | ) | (969 | ) | ||||||
Total taxation expense | (6,447 | ) | (7,077 | ) | (10,737 | ) | ||||||
|
|
|
|
|
| |||||||
Profit after taxation from Continuing operations | 9,601 | 14,324 | 22,400 | |||||||||
|
|
|
|
|
| |||||||
Discontinued operations | ||||||||||||
Profit/(loss) after taxation from Discontinued operations | – | – | 10,655 | |||||||||
|
|
|
|
|
| |||||||
Profit after taxation from Continuing and Discontinued operations | 9,601 | 14,324 | 33,055 | |||||||||
|
|
|
|
|
| |||||||
Attributable to non-controlling interests | 1,704 | 1,403 | 2,155 | |||||||||
Attributable to BHP shareholders | 7,897 | 12,921 | 30,900 | |||||||||
|
|
|
|
|
| |||||||
| 1. | Includes the sale of third-party products. |
Profit after taxation attributable to BHP shareholders decreased from US$12.9 billion in FY2023 to US$7.9 billion in FY2024. Attributable profit of US$7.9 billion includes an exceptional loss of US$5.8 billion (after tax), compared to an Attributable profit of US$12.9 billion, including an exceptional loss of US$0.5 billion (after tax) in the prior period. The FY2024 exceptional loss includes a US$2.7 billion non-cash (after tax) impairment at Western Australia Nickel (WAN) due to oversupply in the global nickel market that has seen a sharp decline in forward nickel prices in the short to medium term, escalation in capital costs, and changes to development plans including the Group’s decision, announced on 11 July 2024, to temporarily suspend Nickel West operations and the West Musgrave project at WAN. The FY2024 exceptional loss also includes US$3.8 billion (after tax) relating to Samarco dam failure impacts, partially offset by the gain on divestment of Blackwater and Daunia coal assets of US$0.7 billion (after tax).
>For more information on Exceptional items refer to Financial Statements note 3 ‘Exceptional items’
Revenue of US$55.7 billion increased by US$1.8 billion, or 3 per cent from FY2023. This increase was mainly due to higher average realised prices for iron ore and copper combined with higher sales volumes, partially offset by lower average realised prices for thermal coal and nickel.
Higher sales volumes were achieved at WAIO supported by record production reflecting strong supply chain performance, at Copper SA from the successful integration of OZ Minerals (OZL) following the acquisition in FY2023, at Escondida due to higher concentrator feed grade and at New South Wales Energy Coal (NSWEC) from improved weather and labour availability. These were partially offset by lower sales volumes at BMA as a result of increased stripping to improve supply chain stability and restore depleted inventory positions which arose from extended weather impacts and labour constraints over recent years, and the divestment of Blackwater and Daunia on 2 April 2024.
>For information on our average realised prices and production of our commodities refer to OFR 9
Other income of US$1.3 billion increased by US$0.9 billion, or 226 per cent from FY2023 primarily due to the divestment of Blackwater and Daunia.
Total expenses excluding net finance costs of US$36.8 billion increased by US$4.9 billion, or 15 per cent from FY2023. This primarily reflected a higher impairment expense of US$3.8 billion of WAN due to the deterioration in the short and medium-term outlook for nickel. Higher external contractor services expenses of US$1.0 billion was mainly due to the full-year contribution of Prominent Hill and Carrapateena since their acquisition in FY2023, impacts of inflation across the Group, additional tailings work at Spence, higher maintenance at Escondida and higher stripping and contractor costs in line with higher volumes at NSWEC.
Loss from equity accounted investments, related impairments and expenses of US$2.7 billion increased by US$3.3 billion from a profit of US$0.6 billion in FY2023 predominantly reflects the change in the assessment of the estimated costs to resolve all aspects of the Federal Public Prosecution Office Claim and the Framework Agreement obligations.
>For more information on the total impact of the Samarco dam failure provision and impairment charges connected with equity accounted investments refer to Financial Statements note 3 ‘Exceptional items’ and Financial Statements note 13 ‘Impairment of non-current assets’ respectively
Net finance costs of US$1.5 billion were in line with FY2023 primarily driven by higher market interest rates, offset by a reduction in closure and rehabilitation provision discounting due to lower global inflation rates and higher capitalised interest mainly at Potash.
>For more information on net finance costs refer to Financial Statements note 23 ‘Net finance costs’
Total taxation expense of US$6.4 billion decreased by US$0.6 billion, or 9 per cent from FY2023 primarily due to a tax benefit of US$1.1 billion in relation to the impairment of WAN partially offset by higher tax in line with higher profits from higher average realised prices.
>For more information on income tax expense refer to Financial Statements note 6 ‘Income tax expense’
20
Table of Contents
Principal factors that affect Underlying EBITDA
The following table and commentary describe the impact of the principal factors1 that affected Underlying EBITDA for FY2024 compared with FY2023.
| US$M | ||||||
Year ended 30 June 2023 | 27,956 | |||||
Net price impact: | ||||||
Change in sales prices | 1,476 | Higher average realised prices for iron ore and copper partially offset by lower average realised prices for thermal coal and nickel. | ||||
Price-linked costs | 108 | Lower coal and nickel royalties largely offset by higher iron ore royalties in line with price movements. | ||||
| 1,584 | ||||||
Change in volumes | 10 | Higher sales volumes were achieved at WAIO supported by record production reflecting strong supply chain performance including record production at South Flank following ramp up to full capacity in FY2024, at Escondida due to higher concentrator feed grade and at NSWEC from improved weather and labour availability. These were offset by lower sales volumes at BMA as a result of increased stripping to improve supply chain stability and restore depleted inventory positions, which arose from extended weather impacts and labour constraints over recent years. | ||||
| Change in controllable cash costs | ||||||
Operating cash costs | (655 | ) | Higher costs at WAIO primarily as we ramped up South Flank and increased production, at NSWEC from higher stripping and contractor costs to support higher production, at Escondida reflecting higher maintenance and at WAN due to increased third-party ore purchases following delivery issues in FY2023. | |||
Exploration and business development | (118 | ) | Higher exploration spend for drilling activities at Oak Dam at Copper SA. | |||
| (773 | ) | |||||
| Change in other costs: | ||||||
Exchange rates | 253 | Impact of movements in the Australian dollar and Chilean peso against the US dollar. | ||||
Inflation | (686 | ) | Impact of inflation on the Group’s cost base. | |||
Fuel, energy, and consumable price movements | 487 | Predominantly lower diesel and acid prices. | ||||
Non-cash | (301 | ) | ||||
One-off items | 316 | Primarily non recurrence of FY2023 review of employee allowances and entitlements, and OZL acquisition costs. | ||||
| 69 | ||||||
| Ceased and sold operations | (510 | ) | Lower contribution from the Blackwater and Daunia mines related to divestment in April 2024. | |||
| New and acquired operations | 528 | At Copper SA from the successful integration of OZL following the acquisition in FY2023. | ||||
| Other items | 152 | Includes increased profit from Antamina driven by higher average copper realised prices and VAT refund received in relation to previously divested Petroleum operations. | ||||
Year ended 30 June 2024 | 29,016 | |||||
| 1. | For information on the method of calculation of the principal factors that affect Underlying EBITDA refer to OFR 10.2. |
21
Table of Contents
Cash flow
The following table provides a summary of the Consolidated Cash Flow Statement contained in Financial Statements 1.4, excluding the impact of foreign currency exchange rate changes on cash and cash equivalents.
Year ended 30 June | 2024 US$M | 2023 US$M | 2022 US$M | |||||||||
Net operating cash flows from Continuing operations | 20,665 | 18,701 | 29,285 | |||||||||
Net operating cash flows from Discontinued operations | – | – | 2,889 | |||||||||
|
|
|
|
|
| |||||||
Net operating cash flows | 20,665 | 18,701 | 32,174 | |||||||||
|
|
|
|
|
| |||||||
Net investing cash flows from Continuing operations | (8,762 | ) | (13,065 | ) | (4,973 | ) | ||||||
Net investing cash flows from Discontinued operations | – | – | (904 | ) | ||||||||
Net cash completion payment on merger of Petroleum with Woodside | – | – | (683 | ) | ||||||||
Cash and cash equivalents disposed on merger of Petroleum with Woodside | – | – | (399 | ) | ||||||||
|
|
|
|
|
| |||||||
Net investing cash flows | (8,762 | ) | (13,065 | ) | (6,959 | ) | ||||||
|
|
|
|
|
| |||||||
Net financing cash flows from Continuing operations | (11,669 | ) | (10,315 | ) | (22,734 | ) | ||||||
Net financing cash flows from Discontinued operations | – | – | (33 | ) | ||||||||
|
|
|
|
|
| |||||||
Net financing cash flows | (11,669 | ) | (10,315 | ) | (22,767 | ) | ||||||
|
|
|
|
|
| |||||||
Net increase/(decrease) in cash and cash equivalents | 234 | (4,679 | ) | 2,448 | ||||||||
|
|
|
|
|
| |||||||
Net increase/(decrease) in cash and cash equivalents from Continuing operations | 234 | (4,679 | ) | 1,578 | ||||||||
Net increase in cash and cash equivalents from Discontinued operations | – | – | 1,952 | |||||||||
Net cash completion payment on merger of Petroleum with Woodside | – | – | (683 | ) | ||||||||
Cash and cash equivalents disposed on merger of Petroleum with Woodside | – | – | (399 | ) | ||||||||
|
|
|
|
|
| |||||||
Net operating cash inflows from Continuing operations of US$20.7 billion increased by US$2.0 billion. This is primarily due to lower tax and royalty related taxation finalisation payments in FY2024 relating to FY2023 profits, compared to payments in FY2023 relating to FY2022 profits.
Net investing cash outflows from Continuing operations of US$8.8 billion decreased by US$4.3 billion. This decrease primarily reflects the non-recurrence of the US$5.9 billion acquisition of OZL completed in FY2023 in conjunction with the proceeds received in FY2024 related to the divestment of BHP’s interest in Blackwater and Daunia coal operations to Whitehaven Coal of US$1.1 billion, partially offset by higher capital expenditure of US$2.1 billion including for Jansen and West Musgrave.
>For more information on exceptional items relating to the divestment of Blackwater and Daunia and a breakdown of capital and exploration expenditure on a commodity basis refer to Financial Statements note 3 ‘Exceptional items’ and OFR 9 respectively
Net financing cash outflows from Continuing operations of US$11.7 billion increased by US$1.4 billion. This increase reflects a net movement in repayments/proceeds of interest bearing liabilities of US$7.1 billion mainly due to the repayment of the OZL acquisition facility in FY2024 (US$5.0 billion) and higher other bond issuances compared to FY2023. These were partially offset by lower dividends paid to BHP shareholders of US$5.6 billion.
>For more information refer to Financial Statements note 21 ‘Net debt’
Underlying return on capital employed (ROCE) of 27.2 per cent decreased by 1.6 percentage points (FY2023: 19.9 percentage point decrease) reflecting an increase in average capital employed attributable to the impact of the OZL acquisition in FY2023. Reductions in capital employed related to the impairment of WAN and the divestment of Blackwater and Daunia are largely offset by capital expenditure in the period.
>For more information on ROCE refer to OFR 10
Prior year comparatives
The comparisons for the year ended 30 June 2023 to 30 June 2022 in connection with Financial results, Principal factors that affect Underlying EBITDA and Cash flow have been omitted from this annual report on Form 20-F and can be found in our annual report on Form 20-F for the fiscal year ended 30 June 2023, filed on 5 September 2023.
4.4 Debt and sources of liquidity
Our policies on debt and liquidity management have the following objectives:
| • | a strong balance sheet through the cycle |
| • | diversification of funding sources |
| • | maintain borrowings and excess cash predominantly in US dollars |
Interest bearing liabilities, net debt and gearing
At the end of FY2024, Interest bearing liabilities were US$20.7 billion (FY2023: US$22.3 billion) and Cash and cash equivalents were US$12.5 billion (FY2023: US$12.4 billion). This resulted in Net debt of US$9.1 billion, which represented a decrease of US$2.0 billion compared with the Net debt position at 30 June 2023. The reduction is primarily due to US$20.7 billion operating cash flows generated combined with US$1.1 billion proceeds from the divestment of the Blackwater and Daunia mines, which were partially offset by capital and exploration expenditure of US$9.3 billion and dividend payments of US$9.1 billion. Gearing, which is the ratio of Net debt to Net debt plus Net assets, was 15.7 per cent at 30 June 2024, compared with 18.7 per cent at 30 June 2023.
>For more information on Net debt and gearing refer to Financial Statements note 21 ‘Net debt’ and OFR 10
22
Table of Contents
During FY2024, gross debt decreased by US$1.6 billion to US$20.7 billion as at 30 June 2024. The decrease reflects the repayment of the US$5.0 billion OZL acquisition facility in September 2023 combined with the repayment of US$734 million of 3.85 per cent USD senior notes that matured in September 2023 and €560 million of EUR senior notes that matured in May 2024, largely offset by the issuance of US$4.75 billion of US bonds in September 2023.
At the subsidiary level, Escondida repaid US$0.3 billion of debt and received proceeds from debt of US$0.4 billion in the period.
Funding sources
In September 2023, the Group issued five tranches of USD bonds comprising US$850 million 5.25 per cent bonds due CY2026, US$700 million 5.1 per cent bonds due CY2028, US$900 million 5.25 per cent bonds due CY2030, US$1.5 billion 5.25 per cent bonds due CY2033 and US$800 million 5.5 per cent bonds due CY2053. The USD bonds were issued by BHP Billiton Finance (USA) Limited, a wholly-owned finance subsidiary of BHP Group Limited, and are fully and unconditionally guaranteed by BHP Group Limited.
Our Group-level borrowing facilities are not subject to financial covenants. Certain specific financing facilities in relation to specific assets are the subject of financial covenants that vary from facility to facility, but this would be considered normal for such facilities.
In addition to the Group’s uncommitted debt issuance programs, we hold the following committed standby facility:
| Facility available 2024 US$M | Drawn 2024 US$M | Undrawn 2024 US$M | Facility available 2023 US$M | Drawn 2023 US$M | Undrawn 2023 US$M | |||||||||||||||||||
Revolving credit facility1 | 5,500 | – | 5,500 | 5,500 | – | 5,500 | ||||||||||||||||||
|
|
|
|
|
|
|
|
|
|
|
| |||||||||||||
Total financing facility | 5,500 | – | 5,500 | 5,500 | – | 5,500 | ||||||||||||||||||
|
|
|
|
|
|
|
|
|
|
|
| |||||||||||||
| 1. | The facility is due to mature on 10 October 2026. The committed US$5.5 billion revolving credit facility operates as a back-stop to the Group’s uncommitted commercial paper program. The combined amount drawn under the facility or as commercial paper will not exceed US$5.5 billion. As at 30 June 2024, US$ nil commercial paper was drawn (FY2023: US$ nil), therefore US$5.5 billion of committed facility was available to use (FY2023: US$5.5 billion). A commitment fee is payable on the undrawn balance and interest is payable on any drawn balance comprising a reference rate plus a margin. The agreed margins are typical for a credit facility extended to a company with the Group’s credit rating. |
>For more information on the maturity profile of our debt obligations and details of our standby and support agreements refer to Financial Statements note 24 ‘Financial risk management’
>Information in relation to our material off-balance sheet arrangements, principally contingent liabilities, commitments for capital expenditure and commitments under leases at 30 June 2024 is provided in Financial Statements note 11 ‘Property, plant and equipment’, Financial Statements note 22 ‘Leases’ and Financial Statements note 34 ‘Contingent liabilities’, respectively
In our opinion, working capital is sufficient for our present requirements. The Group’s Moody’s credit rating has remained at A1/P-1 outlook stable (long-term/short-term). The Group’s S&P Global rating has remained at A-/A-1 outlook stable (long-term/short-term). Credit ratings are forward-looking opinions on credit risk. Moody’s and S&P Global’s credit ratings express the opinion of each agency on the ability and willingness of BHP to meet its financial obligations in full and on time. A credit rating is not a recommendation to buy, sell or hold securities and may be subject to suspension, reduction or withdrawal at any time by an assigning rating agency. Any credit rating should be evaluated independently of any other information.
23
Table of Contents
The following table expands on the Net debt position, to provide more information on the cash and non-cash movements in FY2024.
Year ended 30 June | 2024 US$M | 2023 US$M | ||||||
Net debt at the beginning of the period | (11,166 | ) | (333 | ) | ||||
|
|
|
| |||||
Net operating cash flows | 20,665 | 18,701 | ||||||
Net investing cash flows | (8,762 | ) | (13,065 | ) | ||||
Net financing cash flows | (11,669 | ) | (10,315 | ) | ||||
|
|
|
| |||||
Net increase/(decrease) in cash and cash equivalents from Continuing and Discontinued operations | 234 | (4,679 | ) | |||||
|
|
|
| |||||
Carrying value of interest bearing liability net repayments/(proceeds) | 2,236 | (4,893 | ) | |||||
|
|
|
| |||||
Carrying value of debt related instruments settlements/(proceeds) | 321 | 677 | ||||||
|
|
|
| |||||
Carrying value of cash management related instruments (proceeds)/settlements | (361 | ) | (331 | ) | ||||
|
|
|
| |||||
Fair value change on hedged loans1 | 214 | 803 | ||||||
Fair value change on hedged derivatives1 | (188 | ) | (691 | ) | ||||
Foreign currency exchange rate changes on cash and cash equivalents | (159 | ) | (134 | ) | ||||
Lease additions (excluding leases associated with index-linked freight contracts) | (429 | ) | (472 | ) | ||||
Acquisition of subsidiaries and operations2 | – | (1,111 | ) | |||||
Divestment of subsidiaries and operations3 | 60 | – | ||||||
Other | 118 | (2 | ) | |||||
|
|
|
| |||||
Non-cash movements | (384 | ) | (1,607 | ) | ||||
|
|
|
| |||||
Net debt at the end of the period | (9,120 | ) | (11,166 | ) | ||||
|
|
|
| |||||
| 1. | The Group hedges against the volatility in both exchange and interest rates on debt, and also exchange rates on cash, with associated movements in derivatives reported in Other financial assets/liabilities as effective hedged derivatives (cross currency and interest rate swaps), in accordance with accounting standards. For more information refer to Financial Statements note 24 ‘Financial risk management’. |
| 2. | US$1,111 million of Interest bearing liabilities were acquired on 2 May 2023 as part of the acquisition of OZL. Excludes US$104 million cash acquired which is included in Net investing cash flows. |
| 3. | Relates to leases disposed of as part of the Blackwater and Daunia mines divestment completed on 2 April 2024. Refer to Financial Statements note 3 ‘Exceptional items’ for further information. |
Dividends
Our dividend policy provides for a minimum 50 per cent payout of Underlying attributable profit (Continuing operations) at every reporting period. The minimum dividend payment for the second half of FY2024 was US$0.70 per share. The Board determined to pay an additional amount of US$0.04 per share, taking the final dividend to US$0.74 per share (US$3.8 billion). In total, cash dividends of US$7.4 billion (US$1.46 per share) have been determined for FY2024.
Prior year comparatives
The comparison for the year ended 30 June 2023 to 30 June 2022 has been omitted from this annual report on Form 20-F and can be found in our annual report on Form 20-F for the fiscal year ended 30 June 2023, filed on 5 September 2023.
24
Table of Contents
5 Our assets
5.1 Minerals Australia
Minerals Australia includes operated assets in Western Australia, Queensland and New South Wales, focused on iron ore, steelmaking coal, nickel and energy coal. The commodities produced by our Minerals Australia assets are transported by rail and road to port and exported to our global customers or by rail to domestic customers.
Iron ore
Western Australia Iron Ore
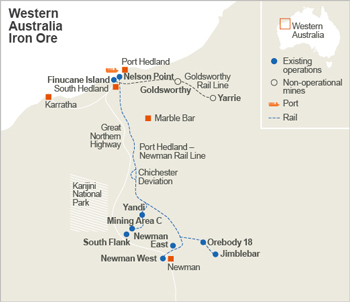
Overview
Western Australia Iron Ore (WAIO) is an integrated system of four processing hubs and five open-cut operational mines in the Pilbara region of northern Western Australia, connected by more than 1,000 kilometres of rail infrastructure and port facilities.
WAIO’s Pilbara reserve base is relatively concentrated, allowing development through integrated mining hubs connected to the mines and satellite orebodies by conveyors or spur lines. This approach seeks to maximise the value of installed infrastructure by using the same processing plant and rail infrastructure for several orebodies.
Ore is crushed, beneficiated (where necessary) and blended at the processing hubs – Mt Newman operations (which has our beneficiation plant), Yandi, Mining Area C (our largest operating iron ore hub processing ore from Area C and South Flank) and Jimblebar – to create lump and fines products that are transported along the Port Hedland–Mt Newman rail line to the Finucane Island and Nelson Point port facilities at Port Hedland.
There are four main WAIO joint ventures (JVs): Mt Newman JV, Yandi JV, Mt Goldsworthy JV (which includes the South Flank mining area) and Jimblebar JV. BHP’s interest in each is 85 per cent, with Mitsui and ITOCHU owning the remaining 15 per cent. The joint ventures are unincorporated, except Jimblebar JV.
BHP, along with Mitsui, ITOCHU and POSCO are also participants in the POSMAC JV. BHP’s interest in POSMAC is 65 per cent. The ore from the POSMAC JV is sold to the Mt Goldsworthy JV.
All ore is transported on the Mt Newman JV and Mt Goldsworthy JV rail lines. The Nelson Point port facility is owned by the Mt Newman JV and the Finucane Island facility is owned by the Mt Goldsworthy JV. On 7 September 2021, BHP received regulatory approval to increase our export capacity at WAIO’s Port Hedland operations, in stages, up to 330 million tonnes per annum (Mtpa) (100 per cent basis). We are currently studying expansion alternatives for growth up to 330 Mtpa with the feasibility study expected to be completed in CY2025.
Our near-term focus remains on stable production of 290 Mtpa of iron ore. Successful tie-in of capital projects, including the port debottlenecking project, is expected to enable growth in excess of 305 Mtpa in the medium term.
Key developments in FY2024
WAIO achieved record production of 255 million tonnes (Mt) (253 Mt FY2023) or 287 Mt (285 Mt FY2023) on a 100 per cent basis, reflecting strong supply chain performance with increased capacity unlocked by the Port Debottlenecking Project 1 and increased production at South Flank. South Flank completed ramp up to full production capacity of 80 Mtpa (100 per cent basis) in FY2024 as planned, which contributed to WAIO achieving record lump sales for the year.
Autonomous haulage deployment continues as planned.
The Shiploader Automation Project has continued to progress with the automation completed on two shiploaders and the third shiploader nearing completion. Together with autonomous haulage rollouts at South Flank and Newman West, these initiatives are expected to deliver safety, production and cost improvements as well as new job and development opportunities.
The Port Debottlenecking Project 1 was commissioned in December 2023 and has enabled higher production volumes and contributed to record sales volumes in FY2024. The project remains on track to be completed in CY2024.
25
Table of Contents
In February 2024, BHP approved US$943 million in capital expenditure for the development of the Western Ridge Crusher Project. This project is expected to deliver an average of 25 Mtpa providing around 12 years of product for WAIO to replace part of the production from depleting orebodies around Newman. First ore is targeted in CY2026.
In FY2024, WAIO achieved record spend with Traditional Owners and Indigenous businesses representing a 69 per cent increase on the previous year to A$465 million of which A$237 million was spent with 68 Traditional Owner businesses.
Coal
BHP Mitsubishi Alliance
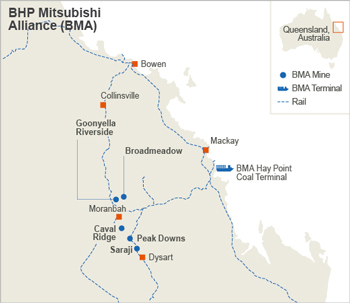
Overview
BHP Mitsubishi Alliance (BMA) (BHP ownership: 50 per cent) operates five steelmaking coal mines – Goonyella Riverside, Broadmeadow, Peak Downs, Saraji and Caval Ridge in the Bowen Basin, Queensland. BMA’s mines are open cut, except for the Broadmeadow underground longwall operation. BMA has access to infrastructure, including a modern, multi-user rail network, and owns and operates its own coal-loading terminal at Hay Point, near Mackay.
Key developments in FY2024
BMA production of 22.3 Mt (44.6 Mt on a 100 per cent basis) decreased from the prior year as a result of increased stripping to improve supply chain stability and restore depleted inventory positions, which arose from extended weather impacts and labour constraints over recent years, and the divestment of Blackwater and Daunia on 2 April 2024. Production was also impacted by an extended longwall move and geotechnical faulting at Broadmeadow during H1 FY2024, and the temporary suspension of operations following the fatality of a team member at Saraji. Blackwater and Daunia produced 5 Mt (10 Mt on a 100 per cent basis) in FY2024 prior to their divestment.
In April 2024, BMA’s owners, BHP and Mitsubishi Development, divested the Daunia and Blackwater mines to Whitehaven Coal, an ASX-listed company. Whitehaven Coal paid a combined US$2.0 billion cash consideration on completion plus a preliminary completion adjustment of US$44.1 million for working capital and other agreed adjustments (100 per cent interest basis). The total consideration for the transaction includes earnout and adjustments and may be up to US$4.1 billion plus the final completion adjustment amount.
Goonyella continued to safely increase autonomous productivity and ultra-class truck fleet performance in FY2024 – delivering an annualised production hours increase of 7 per cent, contributing to a 6 per cent increase in truck and shovel stripping volumes at Goonyella Riverside, as we’ve continued to adapt and unlock the efficiencies of the system.
In October 2023, BMA successfully commissioned a replacement berth structure and shiploader at Hay Point Coal Terminal resulting in improved resilience for significant weather and major cyclone events and enabling the port’s future and long-term capability.
BMA operations largely lie within the Native Title Determination area of the Barada Barna people. BMA has been working closely with the Barada Barna Aboriginal Corporation (BBAC) to negotiate a project-wide Indigenous Land Use Agreement. The agreement was approved and signed by BBAC and BMA and is expected to be approved by the Queensland Government in early FY2025. This agreement demonstrates a refreshed approach to agreement structures and establishes a process to obtain and maintain Free Prior and Informed Consent (FPIC) across the life of the operation. It provides a fit-for-purpose benefits package intended to provide intergenerational benefit for Barada Barna people through financial compensation, provision of housing, as well as in the areas of employment, education and contracting opportunities.
26
Table of Contents
New South Wales Energy Coal
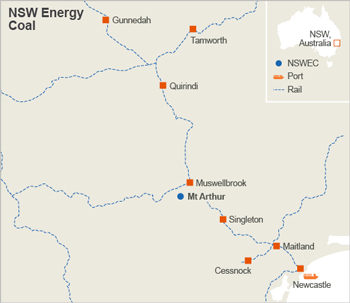
Overview
New South Wales Energy Coal (NSWEC) (BHP ownership: 100 per cent) comprises the Mt Arthur Coal open-cut energy coal mine in the Hunter Valley. It has access to infrastructure in the Hunter Region, including a multi-user rail network and coal loading terminal access at the Port of Newcastle through Newcastle Coal Infrastructure Group (BHP ownership: 28 per cent) and Port Waratah Coal Services.
On 16 June 2022, we announced we would retain NSWEC in our portfolio, seek the relevant approvals to continue mining beyond the current consent that expires at the end of FY2026 and proceed with a managed process to cease mining at the asset by the end of FY2030. Continuation of mining to the end of FY2030 is intended to provide the time to work with our people and the local community on an equitable change and transition approach as well as the time to plan and execute the necessary works to deliver a positive legacy from BHP mining in the Hunter Valley.
Key developments in FY2024
Production increased due to strong operating performance across the year as improved weather and labour availability conditions enabled an uplift in truck productivity and record annualised truck hours. We also supported regional coal-fired power stations by delivering 1.3 Mt in line with New South Wales Government Coal Directions (Directions). The Directions ceased on 1 July 2024, with the change in royalty rates for open-cut mines increasing 2.6 percentage points, from 8.2 per cent to 10.8 per cent. In FY2024, we renegotiated a contract with Thiess Mining Services for six years to provide contract mining services at the Mt Arthur South Operation.
The application to continue mining for an additional four years from FY2026 to FY2030 was lodged with the New South Wales Government in September 2023 and is currently under assessment, with a determination expected in the first half of CY2025.
We continue to progress plans to cease mining at the asset in FY2030, which includes the completion of progressive rehabilitation commitments during FY2024. We undertook significant engagement with our workforce and community in FY2024 as we worked to consider alternate mine land re-use outcomes for the site.
Nickel
Western Australia Nickel
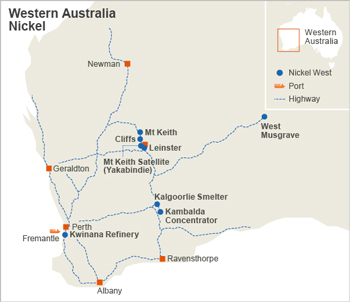
Overview
Nickel West (BHP ownership: 100 per cent) is a fully integrated nickel business located in Western Australia, with three streams of concentrate. It comprises open-cut and underground mines, concentrators, a smelter and refinery. Nickel West owns the majority of tenements hosting Nickel Sulphide Mineral Resources in the Agnew-Wiluna belt, Western Australia.
Disseminated sulphide ore is mined at the Mt Keith open-pit operation and Mt Keith Satellite mine (Yakabindie) and crushed and processed on-site to produce nickel concentrate. Nickel sulphide ore is mined at the Cliffs and Leinster underground mines and processed through a concentrator and dryer at Leinster. A concentrator plant in Kambalda processes ore and concentrate purchased from third parties.
The three streams feed the Kalgoorlie nickel smelter, which uses a flash furnace to produce nickel matte. The Kwinana nickel refinery then turns this into nickel powder, briquettes and nickel sulphate.
27
Table of Contents
The West Musgrave Project (BHP ownership: 100 per cent; acquired as part of OZ Minerals) is a greenfield nickel and copper project located on Ngaanyatjarra Country in the West Musgrave Ranges of Western Australia, approximately 1,300 kilometres northeast of Perth and 1,400 kilometres northwest of Adelaide, near the intersection of the borders of Western Australia, South Australia and the Northern Territory.
Key developments in FY2024
On 11 July 2024, BHP announced Western Australia Nickel would be temporarily suspended from October 2024. We intend to review the decision to temporarily suspend Western Australia Nickel by February 2027.
The decision to temporarily suspend Western Australia Nickel follows oversupply in the global nickel market. Forward consensus nickel prices over the next half of the decade have fallen sharply reflecting strong growth of alternative low-cost nickel supply.
BHP will invest approximately US$300 million (A$450 million) per annum following completion of a transition period to support a potential re-start of Western Australia Nickel. The transition period commenced in July 2024. Operations will be suspended in October 2024 and handover activities for temporary suspension will be completed by December 2024. We will continue to support our workforce and local communities during the temporary suspension, including the establishment of a A$20 million Community Fund.
5.2 Copper South Australia
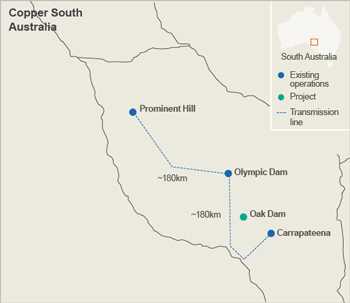
Copper South Australia comprises surface processing and underground mining operations in one of the world’s most significant copper, gold, silver and uranium basins. Copper South Australia was formed following our acquisition of OZ Minerals in May 2023 and refers to Olympic Dam, and Carrapateena and Prominent Hill operations, which were acquired from OZ Minerals, and the Oak Dam exploration project. The underground mining and conventional crushing operations of Carrapateena and Prominent Hill produce copper concentrate and are located in close proximity to the mining and integrated crushing, grinding, concentrating, smelting and refining operations of Olympic Dam, which produces copper cathode, gold and silver bullion, and uranium oxide concentrate. The commodities produced by Copper South Australia are transported by road and rail to our domestic customers and via the Adelaide and Whyalla ports to be exported to our global customers.
Overview
The Olympic Dam Mine (BHP ownership: 100 per cent) is one of the world’s most significant deposits of copper, gold, silver and uranium, located on Kokatha Country in the Gawler Craton, South Australia. It comprises underground mining and surface operations and is a fully integrated processing facility from ore to metal.
Ore mined underground via sub-level open stoping is hauled by an automated train system to crushing, storage and ore hoisting facilities or trucked directly to the surface. Olympic Dam has a fully integrated metallurgical complex with a grinding and concentrating circuit, a hydrometallurgical plant incorporating solvent extraction circuits for copper and uranium, a copper smelter, a copper refinery, including an electro-refinery and an electrowinning-refinery, and a recovery circuit for precious metals.
Carrapateena (BHP ownership: 100 per cent; acquired as part of OZ Minerals) is an underground copper, gold and silver mine located on Kokatha Country in the Gawler Craton, South Australia, approximately 180 kilometres by road southeast of Olympic Dam and 160 kilometres north of Port Augusta. Underground mining at Carrapateena is by sub-level caving. Conventional crushing, grinding and flotation produces copper concentrate.
Prominent Hill (BHP ownership: 100 per cent; acquired as part of OZ Minerals) is an underground copper, gold and silver mine located on Antakirinja Matu-Yankunytjatjara Country in the Gawler Craton, South Australia, 200 kilometres northwest of Olympic Dam. Prominent Hill was first developed as an open-pit mine, however, mining activities have progressed underground via sub-level open stoping since 2012. Conventional crushing, grinding and flotation produce copper concentrate.
The Oak Dam Project (BHP ownership: 100 per cent) is a greenfield copper, gold, silver and uranium deposit located on Kokatha Country in the Gawler Craton, South Australia.
Key developments in FY2024
Copper South Australia achieved production of 322 kilotonnes (kt) of payable copper, gold production of 370 thousand troy ounces (ktoz) and 3.6 kt of uranium.
Olympic Dam achieved a record cathode production outcome under BHP operatorship of 216 kt, primarily driven by record mine and smelter performance. Record ore mined was achieved at 10.8 Mt (10.6 Mt FY2014) and record concentrate smelted was achieved at 508.9 kt (507.9 kt FY2023). Strong smelter performance at Olympic Dam was supported by 12.6 kt of concentrate transfers from Prominent Hill and Carrapateena, for processing to higher margin cathode. Record gold bullion production was also delivered in FY2024 at 207 ktoz (186 ktoz FY2023).
The Olympic Dam underground mine continues to develop further into the Southern Mine Area, with approximately 70 per cent of total ore production currently from this part of the mine. Average copper grade remained strong at 2.01 per cent. The short-term focus is on optimising operational performance and debottlenecking existing facilities to further improve production performance.
28
Table of Contents
Resource drilling at Oak Dam continued, with up to 12 deep directional diamond drill rigs on the exploration licence, informing an Inferred Mineral Resource declaration. Drilling at OD Deeps in FY2024 was executed through up to 11 diamond rigs that explored beneath the Iron Oxide Copper Gold (IOCG) orebody at Olympic Dam. Results from this drilling were released as part of the Q2 FY2024 BHP Operational Review.
Carrapateena achieved a record production outcome of 68 kt of payable copper production (60 kt in FY2023). Crusher Station 2 was successfully commissioned in Q3 FY2024 enabling higher productivity from the sub-level cave and record ore mined of 5.2 Mt in FY2024 (4.6 Mt FY2023) enabled milling throughput to increase to record rates of 5.2 Mt (4.7 Mt in FY2023). The bottom half of the Carrapateena orebody is being developed into a block cave, with the aim of unlocking the mine’s potential to be a multigenerational, low quartile cash cost producing operation and progress continued in FY2024 with the development of the decline below the current sub-level cave.
In FY2024, Prominent Hill produced 50 kt of payable copper (54 kt in FY2023). Record ore to surface production was achieved at 4.5 Mt (4.4 Mt in FY2023) as development of the underground mine progresses, supported by record underground development of 17.2 kilometres (14.7 kilometres in FY2023). The Prominent Hill Operations Expansion to extend mine life and increase copper production continues works to construct and commission the 6.5 Mtpa ore capacity Wira Shaft. Shaft works advanced and the shaft sink is approximately 35 per cent complete at a current depth of approximately 450 metres.
A funding agreement with the South Australian Government was signed in Q3 FY2024 for a study on the Northern Water Supply Project. Infrastructure South Australia will be undertaking the study for construction of a multi-user coastal desalination plant in the Upper Spencer Gulf to reduce reliance on the Great Artesian Basin.
5.3 Minerals Americas
The Minerals Americas asset group includes operated assets, projects and interests in non-operated joint ventures in Canada, Chile, Peru, the United States and Brazil.
Our operated assets in the Americas are Escondida and Pampa Norte, which are open-cut mines that produce copper concentrate and copper cathodes, and the Jansen potash project in Canada. The non-operated assets in the Minerals Americas portfolio are open-cut mines that produce copper (Antamina) and iron ore (Samarco), and the Resolution Copper Project in the United States. The commodities produced by our Minerals Americas assets are transported to port by pipeline, rail or road and exported to customers around the world. In July 2024, we agreed to acquire a 50 per cent interest in the Filo del Sol and Josemaria copper projects in Argentina and Chile with Lundin Mining. If approved, this will give us the opportunity to jointly advance an emerging copper district with world-class potential.
Copper
Escondida
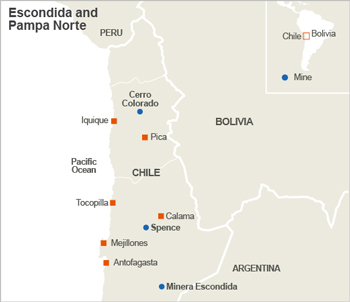
Overview
Escondida (BHP ownership: 57.5 per cent), located in the Atacama Desert in northern Chile, is a leading producer of copper concentrate and cathodes, with by-products including gold and silver.
Escondida’s two pits feed three concentrator plants, as well as two leaching operations (oxide and sulphide).
Key developments in FY2024
Escondida copper production increased by 7 per cent to 1,125 kt primarily due to higher concentrator feed grade of 0.88 per cent, up from 0.82 per cent in FY2023, as mining progressed into areas of higher-grade ore as planned following the implementation of measures to manage geotechnical events in FY2023. This was partially offset by planned lower cathode production, as a result of prioritising concentrator throughput in prior years. Deployment of autonomous trucks began in the Escondida Norte pit in the second half of FY2024 and will ramp up to approximately 50 autonomous trucks over the next three years.
In FY2024, the largest capacity cable-powered shovel available in the market commenced operations at Escondida, the first in Latin America and third in the world. This and further planned high-capacity shovel deployments will unlock further efficiency in the truck loading process enabling incremental system performance and lower unit cost.
Escondida successfully completed negotiations for a new collective agreement with the Union N°1 of Operators and Maintainers, effective for 36 months from 2 August 2024.
29
Table of Contents
Pampa Norte
Overview
Pampa Norte (BHP ownership: 100 per cent) consists of two assets in the Atacama Desert in northern Chile – Spence and Cerro Colorado.
Spence produces copper cathodes and copper concentrate, with by-products including gold, silver and molybdenum.
Cerro Colorado produced copper cathodes up until the asset entered temporary care and maintenance in December 2023.
Key developments in FY2024
Spence copper production increased by 6 per cent to 255 kt, driven by improved concentrator performance and feed grades. Record concentrate production was partially offset by lower cathode production, in line with an expected decline in stacked feed grade.
In March 2024, Spence achieved fully autonomous mine haulage operations (ahead of the Q4 FY2024 target date) and has deployed a total of 33 autonomous trucks.
The concentrator plant modification, which commenced in August 2022, was completed in June 2024.
In December 2023, Spence achieved gender balance across its total workforce and leadership roles ahead of BHP’s aspirational goal to achieve a minimum of 40 per cent female representation by the end of FY2025. During FY2024, Spence successfully completed negotiations for a new collective agreement with Union 2 of Supervisors, effective for 36 months from 1 December 2023 and with Union 1 of Operators and Maintainers effective for 36 months from 1 June 2024.
As disclosed in the Q2 FY2024 Operational Review, changes to the original Spence tailings storage facility (TSF) design were approved and are currently in execution. As we progress execution, we continue to closely monitor the previously identified anomalies to ensure safe operational conditions and studies are ongoing to assess whether further works are required. Production guidance at Spence remains subject to the remediation of the TSF anomalies.
Cerro Colorado transitioned to temporary closure in December 2023, after producing 11 kt in the period. We are assessing the application of novel leaching technologies to utilise latent capacity and allow for a potential restart of operations early next decade.
Potash
Jansen potash project
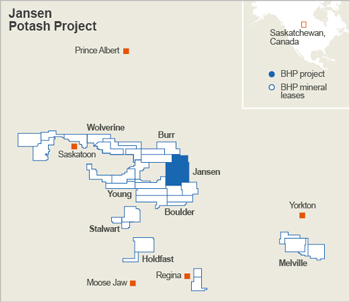
Overview
The Jansen potash project (BHP ownership: 100 per cent) is located about 140 kilometres east of Saskatoon, Canada.
Jansen’s large resource provides the opportunity to develop the project in stages, with Jansen Stage 1 (Jansen S1) expected to produce approximately 4.15 Mt of potash per annum on completion and first production is expected in late CY2026. Approval of the 4.36 Mtpa Jansen Stage 2 (Jansen S2) has increased planned production to approximately 8.5 Mtpa, with further brownfield expansions up to 8 Mtpa (approximately 4 Mtpa per stage).
BHP holds mineral leases covering around 9,600 square kilometres in the Saskatchewan potash basin.
Key developments in FY2024
Jansen S1 is ahead of the original schedule and was 52 per cent complete as at 30 June 2024. During FY2024, we successfully commissioned Jansen’s permanent power substation, while also advancing steelwork and equipment installation for surface and underground. Port construction transitioned from ground improvement to civil and concrete works.
In October 2023, BHP approved an investment of US$4.9 billion for Jansen S2, following completion of the feasibility study, in line with plan. Execution of Jansen S2 commenced and is expected to take approximately six years, with first production targeted for FY2029, followed by a three-year ramp-up period.
30
Table of Contents
Copper
Non-operated minerals joint ventures
Antamina
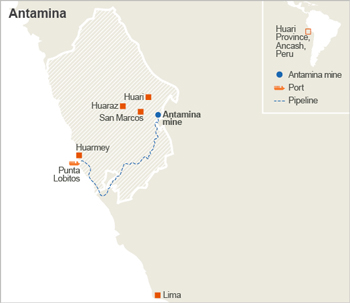
Overview
Antamina (BHP ownership: 33.75 per cent), located in north central Peru, is a large, low-cost copper and zinc mine with by-products including molybdenum and silver. Antamina is operated independently by Compañía Minera Antamina S.A.
Key developments in FY2024
Antamina copper production increased by 4 per cent to 144 kt (BHP share) as a result of record concentrator throughput offsetting lower planned feed grades. Zinc production was 17 per cent lower at 103 kt (BHP share) reflecting planned lower feed grades.
In FY2024, Peruvian authorities approved Antamina’s Modification of the Environmental Impact Assessment (MEIA), extending the life of Antamina from CY2028 to CY2036.
Resolution Copper
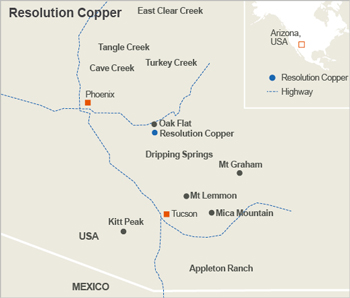
Overview
Resolution Copper (BHP ownership: 45 per cent), located in the US State of Arizona, is one of the largest undeveloped copper projects in the world and has the potential to become one of the largest copper producers in North America. Resolution Copper is operated by Rio Tinto (55 per cent ownership).
Key developments in FY2024
During FY2024, Resolution Copper continued the engineering and permitting phase of the project. The project is subject to a Final Environmental Impact Statement (FEIS), which is a federal permitting process led by the US Forest Service. The US Forest Service published a FEIS in January 2021, which was rescinded in March 2021 to allow additional environmental analysis and consultation with Native American Tribes. The US Forest Service has indicated there is no timeline for republication of the FEIS, which is subject to three lawsuits filed against the US Forest Service on behalf of Native American Tribe members and non-government organisations. Resolution Copper has publicly stated its commitment to deepening ongoing engagement with Native American Tribes and other stakeholders while collaborating to create shared value opportunities. As part of the permitting process, the US Government has continued to consult with Native American Tribes resulting in the identification of mitigation strategies for cultural heritage areas in the project area.
31
Table of Contents
Iron ore
Non-operated minerals joint venture
Samarco
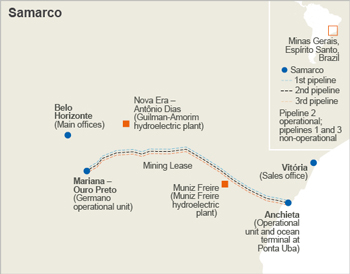
Overview
Samarco (BHP ownership: 50 per cent) comprises a mine and three concentrators located in the Brazilian state of Minas Gerais, and four pellet plants and a port located in Anchieta in the state of Espírito Santo. Three 400-kilometre pipelines connect the mine site to the pelletising facilities. Samarco is operated independently by Samarco Mineração S.A. Samarco’s main product is iron ore pellets, which are independently marketed by Samarco and sold to customers around the world.
Samarco’s operations were suspended in November 2015 after the Fundão dam failure. Since resuming operations in December 2020, 80 per cent of the tailings generated are filtrated and dry stacked, and 20 per cent are deposited in a confined pit enabling Samarco to operate without a conventional tailings dam structure.
Key developments in FY2024
Samarco increased iron ore pellets and ore fines production in FY2024 by 5 per cent to 4.7 Mt (BHP share). Samarco is currently operating at 31 per cent of its total 26 Mtpa (100 per cent basis) production capacity and has shipped more than 29 Mt (100 per cent basis) of pellets and fines since the resumption of operations in December 2020. In June 2023, Samarco Board of Directors approved investment to increase production to approximately 60 per cent of its full capacity through restarting the second concentrator and third pelletising plant, expanding the existing filtration plant and increasing the mine fleet. Project execution is on track with first production expected in early CY2025.
In December 2023, Samarco completed a restructure of its debts under the Judicial Reorganisation process, which included payments to employees and suppliers and the issue of new unsecured debt to Samarco’s financial creditors. The restructure provides Samarco with a stable financial position to continue to rebuild its operations and strengthen its ability to meet its remediation and compensation obligations related to the Fundão dam failure. This also benefits neighbouring communities through job creation, investment and taxes.
Samarco has been progressively decommissioning its upstream tailings dam structures in accordance with Brazilian legislation. Decommissioning works for the smaller of the two tailings dams, the Germano Pit dam, were completed during FY2023 and formally approved by state authorities in FY2024. The progressive decommissioning of the remaining upstream tailings dam structure, the Germano Main dam, is on track for completion by FY2029. These structures have been certified as stable by independent third parties and are compliant with local stability and monitoring requirements. In addition, Samarco is now fully compliant with the Global Industry Standards on Tailings Management (GISTM) requirements.
Samarco is continuing broader studies to review solutions to operate without tailings dams beyond FY2030.
For more information on the Fundão dam failure and the response refer to OFR 7
5.4 Commercial
BHP’s Commercial function seeks to maximise commercial and social value while minimising costs across the end-to-end supply chain. The function is organised around core activities in our value chain, supported by risk governance and analytics.
Sales and Marketing
The Sales and Marketing team connects BHP to the market through commercial expertise, sales and operations planning, customer insights and proactive risk management. It presents a single face to market across multiple assets, with a view to realising maximum value and supporting sustainability initiatives in our value chain.
Maritime and Supply Chain Excellence
The Maritime and Supply Chain Excellence team manages BHP’s enterprise-wide maritime transportation strategy and the chartering of ocean freight to meet BHP’s inbound and outbound transportation needs. It focuses on supply chain excellence and sourcing cost-efficient marine freight in addition to engaging within the maritime ecosystem with a view to uplifting overall safety standards in the industry, promoting seafarer welfare and supporting GHG emissions intensity reduction initiatives. It also seeks to manage supply chain risk by vetting the safety performance of the ships loading BHP cargo and partnering with reliable vessel owners with excellent operational and safety standards.
Procurement
Our global Procurement team connects asset teams and suppliers to procure the goods and services used by our projects, operated assets and functions globally. Procurement partners with our suppliers to optimise safety, equipment performance, reduce operating costs, optimise working capital and generate social value. Through innovation, we work with our suppliers to support opportunities to reduce the GHG emissions intensity of inbound goods and services and the operational GHG emissions of our operated assets. Procurement manages supply chain risk, fosters supplier innovation and looks to develop positive and enduring relationships with global suppliers and local businesses in the communities where we operate.
32
Table of Contents
Market Analysis and Economics
Our Market Analysis and Economics team develops BHP’s proprietary view on the outlook for commodity demand and prices, as well as our input costs, the world economy and financial markets, and the potential impact of climate change in those contexts. The team works with our Procurement, Maritime and Sales and Marketing sub-functions to help optimise end-to-end commercial value and with the Portfolio Strategy and Development and External Affairs functions to identify and respond to long-run strategic changes in our operating environment.
Global Business Services
The Global Business Services team integrates repeatable process activity across the Group into a single shared services operation. With the BHP Operating System and process transformation capabilities at its core, the team has the mandate to aggregate, operate and improve end-to-end processes on behalf of assets and functions to drive operational excellence.
33
Table of Contents
6 Sustainability
Sustainability is key to our purpose of bringing people and resources together to build a better world and is core to our strategy.
>For more information on BHP’s approach to and definition of sustainability refer to OFR 6 and Additional information 10.4
6.1 Safety
Protecting the safety and wellbeing of our workforce and the communities where we operate is of the highest importance at BHP and is underpinned by Our Values.
In January 2024, a valued contracting colleague, Luke O’Brien, was fatally injured at our BMA Coal operations in Queensland in a vehicle-related event. The investigation findings were shared internally with relevant stakeholders to broaden and inform operational learning and improvement. Our investigation into the previous year’s fatal event, involving Nathan Scholz at Olympic Dam, is being finalised while external review processes are ongoing.
These tragic events reinforce the need to continue to deepen our understanding of the causes of fatal incidents so we can strengthen our controls. We continue to focus proactively on integrating safety in the way work is performed through our BHP Operating System (BOS) and strive to improve the quality of our global Field Leadership Program and uplift safety leadership capability across our organisation.
We believe a positive workplace culture built on care and trust will enable us to understand more about the work conditions that increase risk to our workforce and influence how work is executed. We also believe learning from those who perform the work and are closest to the risks gives us greater insight into how we can improve fatal risk control verification. This approach recognises that work is complex due to the interactions that occur between people, equipment/tools, processes, systems and culture, and how they influence one another can impact safety outcomes.
Leaders play an instrumental role in shaping our organisation’s culture. Our General Managers Integrated Leadership Forum is an example of how we are growing organisational capability and embedding BOS principles. The forum promotes strong safety leadership discussions, reinforcing ‘felt leadership’, collaboration and connection as we seek better ways to learn and improve together.
Our safety performance
In FY2024 we recorded:1
| • | one fatal incident involving a vehicle, where a valued colleague undertaking contract work lost their life |
| • | a 36 per cent decrease in the high-potential injury frequency rate from FY2023. The highest number of events with the potential for one or more fatalities was related to vehicle and mobile equipment incidents. We closely monitor high-potential injury trends and focus on identifying the contributing factors to help inform fatality risk control improvements |
| • | a 5 per cent increase in total recordable injury frequency (TRIF) from FY2023. The highest number of recordable injuries related to slips, trips and falls for employees and contractors. The second-highest number of injuries for employees related to being hit by a moving object and for contractors related to being caught between objects |
| • | an increase in field leadership activities compared to FY2023 performance, at a frequency rate of 9,868 activities per million hours worked with over 1.8 million activities completed. We understand the importance and value of sustaining the quality of these engagements and we continue to promote coaching, a key element of our scheduled work routines, as an important tool for achieving this. The field leadership coaching rate was 42 per cent for Layered Audits and Critical Control Observations, remaining on par with the previous year |
This section includes FY2024 safety data and information relating to the former OZ Minerals operations that form part of our Copper South Australia asset and the West Musgrave Project (acquired as part of BHP’s acquisition of OZ Minerals on 2 May 2023) unless expressly stated otherwise.
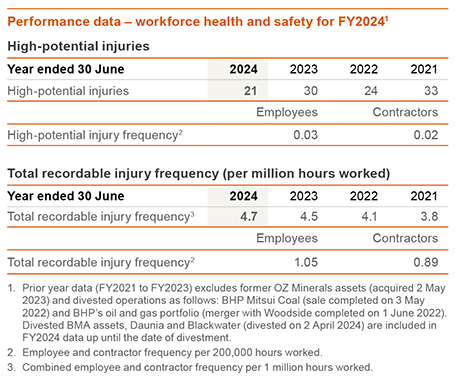
34
Table of Contents
As we learn year on year, we continue to look for opportunities to improve the application of the following programs and systems as outlined in the sections below:
| • | Fatality Elimination Program – asset-based fatality risk control implementation plans aimed at eliminating fatalities at our operations by having effective controls in place |
| • | Field Leadership – enabling a culture of care, standard setting and supporting risk control verification |
| • | Contractor Management – helping to protect the health and safety of our contractors is an important element of asset-based health and safety management systems |
Fatality Elimination Program
It is paramount that we continue to learn, improve and focus on opportunities to verify and strengthen our critical risk control framework to more effectively manage and prevent fatality risks.
We developed and introduced the Fatality Elimination Program (FEL) program in 2020. The FEL program requires our assets to implement fatal risk controls across their respective material safety risk profiles. The FEL program remains a high priority across BHP, with an intended completion of asset FEL control implementation plans in FY2025. Asset implementation plan progress against the FEL program is measured and tracked by the Executive Leadership Team and BHP scorecard to ensure visibility at the highest level. Post FY2025, ongoing asset control implementation and improvements will be managed via the existing risk evaluation process.
We will continue to evolve our approach to safety risk management and our understanding of what conditions and factors influence the cause of incidents and the verification and validation of fatal risk controls.
In FY2024:
| • | On average, assets achieved over 90 per cent compliance for FEL program controls implemented according to the plan for this financial year. |
| • | We continued implementation of the five-year fatality elimination roadmap, including the recommended sequencing of strengthened controls based on effort, cost and near-miss reduction impact. |
| • | We continued to undertake data analysis and insights into our high-potential near-miss and actual events, moving from three-monthly to six-monthly reviews, to identify more meaningful themes over a longer sampling period. This included a continued focus on the relevant risks, controls and conditions that may increase the likelihood of incidents. |
| • | We identified ongoing FEL program fatal risk control verification and improvement opportunities via regional-focused assurance activities. |
| • | We continued to review the Fatal Risk Control Management Framework to improve how we manage single-fatality occupational safety risk, with vehicle and mobile equipment remaining our highest risk. This ongoing work involves deepening our organisational understanding of risk and what causes incidents, improved performance standards and the quality of our fatal risk control verification and assurance programs. |
Field Leadership Program
Leaders spending time in the field fosters a culture of care, which helps to maintain safe operations. Our global Field Leadership Program encourages the workforce to provide feedback to their leaders about safety issues and concerns, and may also include sharing insights into safer ways of working. It involves leaders having quality two-way conversations with workers in the field and drives a common approach to improving health, safety and environment (HSE) performance. The program helps verify that critical safety controls are in place, being applied and are effective in managing risks that have the potential to result in fatalities.
The global field leadership tools include Layered Audits, Critical Control Observations, Planned Task Confirmations and Take Time Talks, and are supported by coaching routines.
In FY2024 we continued to:
| • | improve the quality of field leadership activities by increasing training and coaching, and delivering field leadership engagements across all levels of the organisation |
| • | conduct field leadership activities to support the verification of risks that have the potential to result in injuries or illnesses and fatalities across our operated assets |
| • | embed the global field leadership procedure, which is designed to increase the effectiveness of field leadership activities across the business |
35
Table of Contents
Contractor management
Our commitment to safety includes helping to protect the many thousands of contractors who represent a significant part of our total workforce.
Our approach to contractor management is intended to make it safer and easier for contractors to work with us and designed to support an inclusive, respectful and caring workplace culture. We have an asset-focused approach to contractor management, with our contract owners playing a significant role in helping us improve our partnerships with BHP service providers. Contract owners work collaboratively with contractors to deliver work safely under the conditions of their contract and in accordance with our mandatory minimum requirements for contractor management and the respective asset safety management plans and systems.
In FY2024 we:
| • | simplified our mandatory minimum requirements for contractor management under an asset-focused model |
| • | undertook internal assurance and audit activities at an asset level |
| • | Transitioned the Integrated Contractor Management (ICM) project, which included facilitating contractor mobilisation to an asset-led model |
>For more information on safety refer to bhp.com/safety
36
Table of Contents
6.2 Our sustainability approach
The way we produce our commodities and how we responsibly manage our sustainability-related impacts is critical to our future. Our stakeholders and partners are increasingly focused on our sustainability performance and use it as a key metric in assessing BHP and our industry.
We define our approach to sustainability through our purpose and Our Values, which are governed through our Global Standards. These standards describe our mandatory minimum performance requirements and provide the foundation for sustainability performance at our operated assets and in our functions.
Our social value framework expands on and deepens our long-standing commitment to sustainability.
>For information on our approach to social value, including the aspirational goals and associated metrics we have set for ourselves, refer to OFR 6.5
>For information on our governance of sustainability, including the FY2024 improvement project for our internal Group-wide standards, refer to OFR 6.3
There are a number of voluntary global sustainability frameworks, standards, benchmarks and initiatives that we seek to comply with. We continue to report against the Global Reporting Initiative (GRI) Standards, the Sustainability Accounting Standards Board (SASB) Mining and Metals Standards and the recommendations of the Taskforce on Climate-related Financial Disclosures (TCFD) in addition to engaging on consultations relating to the International Sustainability Standards Board (ISSB) standards. During FY2024, the trend towards mandatory sustainability-related frameworks increased, and we continue to monitor these developments for their potential application to BHP, including the proposed Australian Sustainability Reporting Standards (ASRS), the EU Corporate Sustainability Reporting Directive (CSRD) and the EU Corporate Sustainability Due Diligence Directive (CSDDD).
>For information on our engagement with climate-specific regulatory developments refer to OFR 6.9
In FY2024, we continued our commitment to a number of responsible production and sourcing standards, which require self-assessment and third-party verification of management systems and performance at an asset, operation or facility level. These standards, such as the International Council on Mining and Metals (ICMM) Performance Expectations, Towards Sustainable Mining and the Copper Mark, require disclosure of our performance against detailed requirements across a broad range of sustainability topics.
Details of the voluntary sustainability standards that we have reported against for FY2024 are set out in the BHP ESG Standards and Databook 2024.
>The BHP ESG Standards and Databook 2024 is available at bhp.com/ESGStandards2024
Our Modern Slavery Statement 2024 is prepared under the Australian Modern Slavery Act 2018 and UK Modern Slavery Act 2015 and outlines our management of modern slavery risks. In May 2024, BHP Canada Inc. published its first modern slavery statement under Canada’s newly enacted Fighting Against Forced Labour and Child Labour in Supply Chains Act for the financial year 1 July 2022 to 30 June 2023.
>The BHP Group Modern Slavery Statement 2024 is available at bhp.com/MSS2024
Treatment of former OZ Minerals and divestment of Daunia and Blackwater coal mines
This Report includes FY2024 sustainability-related data and information relating to the former OZ Minerals operations that form part of our Copper South Australia asset and the West Musgrave Project (acquired as part of BHP’s acquisition of OZ Minerals on 2 May 2023), unless expressly stated otherwise in the relevant section. Prior year sustainability-related data and information has not been adjusted and restated unless expressly stated otherwise. Former OZ Minerals Brazil sustainability-related data and information has been excluded from this Report unless otherwise expressly stated. Where OZ Minerals Brazil data is included as required to meet legal and regulatory requirements or as necessary to meet applicable voluntary standards and benchmarks, that data has been prepared in accordance with former OZ Minerals standards due to ongoing strategic review of these assets by BHP.
This Report includes sustainability-related data and information relating to BMA’s Daunia and Blackwater coal mines up to completion of their divestment on 2 April 2024, unless expressly stated otherwise in the relevant section.
6.3 Sustainability governance
The BHP Board has oversight of our sustainability approach and performance and is supported by each of its Committees.
>For information on BHP’s governance structure, including the work of the Board and each Committee refer to the Corporate Governance Statement
>For information on the governance of climate change refer to OFR 6.9 and the BHP Climate Transition Action Plan 2024 available at bhp.com/ CTAP2024
During FY2024, we launched our new Global Controlled Documents suite following an improvement project to streamline the mandatory minimum performance requirements set in our internal Group-wide standards. This included updates across the suite of sustainability-related Global Standards (previously Our Requirements standards) relating to Climate Change, Environment, Community and Indigenous Peoples and the introduction of a new Social Value and Sustainability Global Standard. These improvements seek to make our requirements and our ways of working easier for our people to understand and apply.
37
Table of Contents
>External versions of key sustainability-related elements of these Global Standards are available at bhp.com/about/operating-ethically/corporate-governance
Our management-level Sustainability and ESG Steering Committee (ESG SteerCo) undertakes review of a range of cross-functional and strategic issues relating to key sustainability and ESG topics. Issues under the remit of the ESG SteerCo are driven by regular assessment of materiality and relative priority and determined in line with BHP’s social value framework pillars. In FY2024, the membership of the ESG SteerCo included the Chief Legal, Governance and External Affairs Officer, the Chief Operations Officer, the Chief Commercial Officer, the Chief Financial Officer and the Presidents of Minerals Americas and Minerals Australia from the Executive Leadership Team (ELT) as well as sustainability and ESG leaders within BHP. Matters considered by the ESG SteerCo may also be subject to review or approval by the ELT and the Board or its Committees, in accordance with their remits.
The ESG SteerCo met four times during FY2024. They discussed topics including our community and human rights impact and opportunity assessments, nature-positive plans to support progress against our 2030 Healthy environment goal, environmental performance, sustainability standards strategy and implementation, and preparation of our Climate Transition Action Plan 2024.
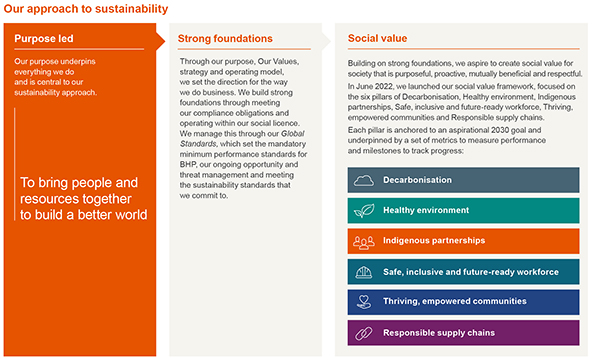
6.4 Material topics for sustainability reporting
Annual sustainability materiality assessment
Each year we determine which sustainability topics are considered most material to our business, partners and stakeholders for the purpose of our sustainability-related reporting (which may differ from the materiality standards applied by other reporting regimes) by undertaking an impact materiality assessment in alignment with the recommendations of the GRI. These topics are referred to as our material sustainability topics. The findings of this assessment help us determine the information our stakeholders are seeking and therefore the material sustainability topics for disclosure in OFR 6. In FY2024 we have consolidated the material topics within OFR 6 compared to FY2023 and we have reported on value chain sustainability and tailings storage facilities within OFR 6.4, sexual harassment within OFR 6.6, and digital security and data privacy within OFR 8.1.
Our materiality assessment considers our potential and actual positive and negative impacts by an assessment of a broad range of inputs, including BHP’s material risk profile (refer to OFR 8), information recorded in our internal event management system, our social value framework, topics raised at our Annual General Meeting (AGM) and industry standards and guidance. Our assessment aims to capture our external partners’ and stakeholders’ perspectives through incorporating consideration of issues raised at our AGM and investor roundtables, industry sustainability standards and guidance, sustainability-related regulatory focus areas, and relevant media articles about our impacts. Sustainability-related impacts can arise from our direct operational activities, such as managing tailings storage facilities, or result from activities within our value chain, such as procuring goods and services from our suppliers. We aim to address this in our materiality assessment by considering a broad range of inputs and perspectives. Our material sustainability topics are reviewed by the Sustainability Committee annually.
>For more information on our materiality assessment for sustainability reporting refer to bhp.com/sustainability
The material sustainability topics identified in this assessment are shown against our social value pillars, as illustrated in the table on page 39 together with the sections of OFR 6 that address these topics and the most relevant risk factors as described in OFR 8.1, and are largely consistent with FY2023.
>For more information on the process by which we identify and manage risk at BHP and our risk factors, which include sustainability-related risks, refer to OFR 8
38
Table of Contents
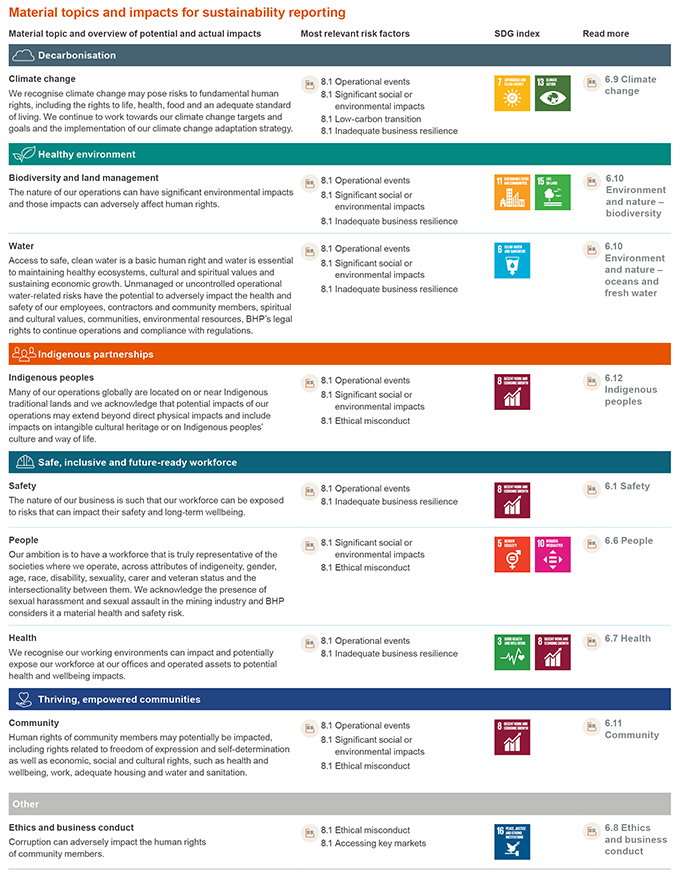
Respecting human rights
We recognise we have the potential to cause, contribute to or be directly linked to human rights impacts through our operations and supply chain primarily relating to workplace health and safety, labour rights, activities of security providers, land access and use, water and sanitation, community wellbeing, and Indigenous peoples’ rights relating to culture, identity, traditions and customs.
Our Human Rights Policy Statement and relevant standards outline our commitment and approach to respecting human rights and the principles by which we conduct our human rights due diligence. This involves taking a rights-based approach for our own operations and for modern slavery-related risks in our supply chain to identify and assess actual and potential impacts, considering how impacts may affect people, integrating and acting upon the findings, monitoring effectiveness, and communicating how actual and potential impacts are addressed.
In FY2023, BHP developed and commenced implementation of a globally consistent methodology for our community and human rights impact and opportunity assessments (CHRIOAs), which identified potential impacts and risks to local communities where we operate. The methodology design incorporated consideration of relevant human rights in accordance with our Human Rights Policy Statement, views from our stakeholders and the United Nation Guiding Principles on Business and Human Rights (UNGPs) approach to identifying and prioritising salient human rights issues. During FY2024, an external human rights expert reviewed the approach and provided feedback on the CHRIOA process to further strengthen our approach to identifying potential human rights impacts, which we will seek to incorporate in FY2025. The methodology is described in more detail in OFR 6.11.
39
Table of Contents
Responsible sourcing and production standards performance
We recognise there are sustainability-related opportunities and impacts across our value chain. BHP has voluntarily committed to the adoption of a set of external standards for the responsible production and sourcing of minerals and metals, as outlined in OFR 6.2. Our performance is assured against these standards by an independent third party and this allows us to more transparently demonstrate to our stakeholders our intent to be a responsible actor within the mining and metals industry and within global value chains for our products. This also helps us align with sustainability-related requirements set out by national mining associations, industry associations, commodity exchanges and relevant emerging regulations.
Relevant Australian operated assets continued to progress implementation of the Towards Sustainable Mining framework, as part of the three-year implementation phase and in preparation for public reporting by the end of CY2025.
Our Escondida and Spence operations in Chile and Olympic Dam operations in Australia were previously assured against The Copper Mark Criteria Guide (reference 24 January 2020) and continue work to prepare for their next assessments. The Copper Mark is a voluntary assurance framework that independently assesses participants against 32 performance criteria across environmental, social and governance dimensions.
During FY2024, Escondida, Spence, Olympic Dam and Nickel West (which produced brands listed on the London Metal Exchange (LME)) successfully completed third-party verification for the FY2023 period against the Joint Due Diligence Standard (JDDS) as an OECD-aligned and LME-approved standard. For Escondida, Spence and Olympic Dam, JDDS certificates were issued under the broader Copper Mark certification while Nickel West was issued a standalone JDDS certificate by The Copper Mark.
Our Responsible Minerals Program (RMP) is our minerals and metals supply chain due diligence program that applies to minerals and metals that we source from third parties (either for feedstock or third-party trading purposes). The RMP has been designed to align with the OECD’s Due Diligence Guidance for Responsible Supply Chains of Minerals from Conflict-Affected and High-Risk Areas. We are currently undertaking a project to develop and integrate an expanded scope of environmental risks that will seek to align the due diligence undertaken within the RMP with the OECD’s Handbook on Environmental Due Diligence in Mineral Supply Chains.
Under the Responsible supply chains pillar of our social value framework, we seek to create sustainable, ethical and transparent supply chains together with our partners. One of the FY2024 short-term milestones within the Responsible Supply Chains pillar outlined in OFR 6.5 that we met was to determine ethical supplier improvement plans with partners, where required. The Ethical Supply Chain and Transparency (ESCT) team within Compliance reviews audit reports prepared by our third-party audit provider and monitors corrective action taken by suppliers in response to audit findings.
>For more information on our supplier due diligence approach refer to the Summary of FY2024 audits in the BHP Group Modern Slavery Statement 2024 available at bhp.com/ MSS2024
>For more information on our Responsible Minerals Program refer to our Responsible Minerals Program Report 2024 available at bhp.com/-/media/documents/environment/2024/240827_BHPResponsibleMineralsProgramReport2024
>For more information on our approach to value chain sustainability refer to bhp.com/sustainability/valuechainsustainability
Global Industry Standard on Tailings Management
As an ICMM member, BHP has committed to achieving alignment with the Global Industry Standard on Tailings Management (GISTM) for all BHP-operated tailings storage facilities (TSFs). BHP is focused on safety and the integrity of TSFs at our operated assets to protect people and the environment. In August 2023, we disclosed an overview of our conformance against the GISTM for our TSFs with a GISTM classification of Very High or Extreme rated facilities as at 31 July 2023 (excluding the four TSFs introduced to the BHP portfolio by the acquisition of OZ Minerals in May 2023), based on a self-assessment. Our August 2024 public disclosure is an update of the 2023 disclosure, and also includes the results of third-party validation of 10 of these TSFs and the remainder will be included in future disclosures.
In accordance with the timeline for members of the ICMM, work towards GISTM conformance has been progressed for the 49 remaining BHP-operated TSFs and we plan to disclose an overview of our conformance in August 2025. Further detail is reported in the GISTM public disclosure document.
>For our Global Industry Standard on Tailings Management Public Disclosure 2024 refer to bhp.com/sustainability
>For more information on tailings storage facilities refer to bhp.com/sustainability/tailings-storage-facilities
6.5 2030 goals
Our social value scorecard
Our social value framework, 2030 goals and social value scorecard were first published in June 2022. Since then, we have worked to embed social value into our decision-making through processes and systems, such as:
| • | carrying out social value assessments for our operated assets to identify social value priorities ahead of the annual planning cycle |
| • | utilising our non-economically quantifiable impact (NEQI) framework to systematically identify, consistently evaluate and transparently present actual and potential social value impacts for consideration in our investment decisions where applicable |
We provide progress on our 2030 goals through our social value scorecard. The scorecard is intended to evolve over time as our plans mature and to keep pace, as appropriate, with our internal and external environment. Our performance in FY2024 against the scorecard and our new FY2025 milestones are provided on page 41 to demonstrate our progress towards our 2030 goals.
> For more information on how the metrics and milestones support progress towards our 2030 goals and the methods we use to measure progress refer to the BHP ESG Standards and Databook 2024 available at bhp.com/ ESGStandards2024
40
Table of Contents
Social investment
Guided by our social value framework, our social investment aims to make a meaningful contribution to addressing the sustainable development challenges of most relevance to our business, partners and stakeholders.
In FY2024, our voluntary social investment totalled US$136.7 million. This investment consisted of US$102.4 million in direct funding for initiatives in line with our social value framework, US$15.2 million to non-operated joint venture social investment programs, and US$1.8 million under the BHP Matched Giving Program. Administrative costs to facilitate social investment activities totalled US$12.5 million and US$6.4 million supported the operations of the BHP Foundation.
>For more information on our social investment, including case studies and performance against our global social investment indicators, refer to bhp.com/sustainability/approach/social-investment
>For more information on the BHP Foundation refer to bhp-foundation.org
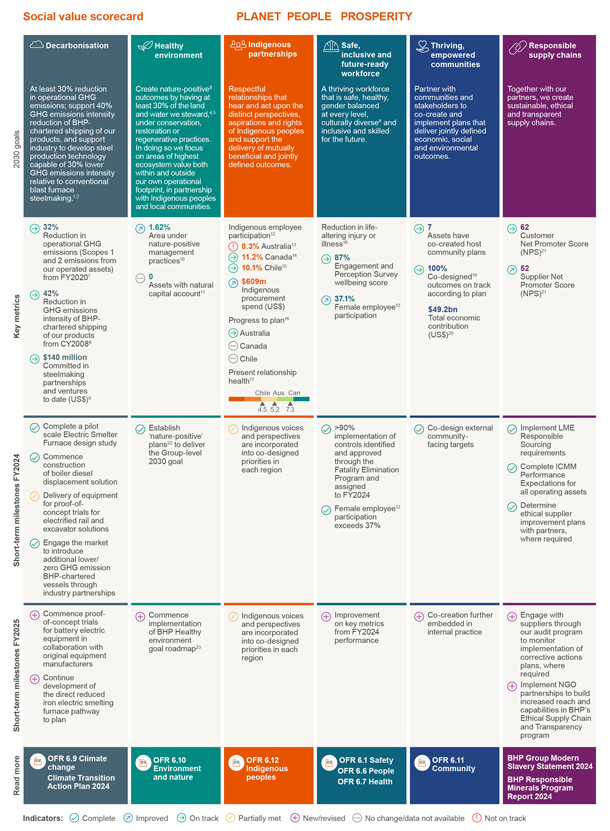
Footnotes
| 1. | With widespread adoption expected post-2030. We have revised the language used in our medium-term goal for steelmaking to provide greater clarity and reflect the range of steelmaking process routes that now form part of our strategy. This is due to technology advances as well as the evolution of our strategy. For more information refer to the BHP Climate Transition Action Plan 2024 available at bhp.com/CTAP2024. |
41
Table of Contents
| 2. | For the definition of the terms used to express these positions, including ‘target’, ‘goal’, ‘net zero’, ‘carbon neutral’ and ‘operational GHG emissions’ refer to Additional information 10.4. For more information on the essential definitions, assumptions and adjustments for our targets and goals refer to Metrics, targets and goals in OFR 6.9. |
| 3. | Nature-positive is defined by the TNFD Glossary version 1.0 as ‘A high-level goal and concept describing a future state of nature (e.g. biodiversity, ecosystem services and natural capital) which is greater than the current state’. We understand it to include land and water management practices that halt and reverse nature loss – that is, supporting healthy, functioning ecosystems. BHP intends to review this definition in FY2025, in light of the recently revised TNFD Glossary version 2.0 (June 2024) definition of nature-positive. |
| 4. | Excluding areas we hold under greenfield exploration licences (or equivalent tenements), which are outside the area of influence of our existing mine operations. 30 per cent will be calculated based on the areas of land and water that we steward at the end of FY2030. For more information refer to the BHP ESG Standards and Databook 2024 available at bhp.com/sustainability. For an overview of the operational area (i.e. disturbed area) and non-operational area within our own operational footprint that is the boundary of our 2030 Healthy environment goal, and their size and relativity to one another refer to the infographic in OFR 6.10. |
| 5. | For our FY2024 key metric, while some of the land related to the Daunia and Blackwater mines is pending transfer following BMA’s divestment of these mines on 2 April 2024, these areas are no longer under BMA’s control or operated for BMA’s benefit so have been excluded from the areas of land and water we stewarded at 30 June 2024. |
| 6. | Cultural diversity in our workforce will be measured based on our substantive progress towards reflecting the cultural diversity of the societies where we operate. |
| 7. | Baseline year and performance data adjusted; for the adjustments we make, refer to Climate-related metrics, targets and goals beginning on page 52 in the BHP Annual Report 2024. |
| 8. | CY2008 was selected as the baseline year for this goal to align with the base year for the International Maritime Organisation’s CY2030 emission intensity goal and its corresponding reasoning and strategy. Baseline and performance data have been adjusted to only include voyages associated with the transportation of commodities currently in BHP’s portfolio due to the data availability challenges of adjusting by asset or operation for CY2008 and subsequent year data. GHG emissions intensity calculations currently include the transportation of copper, iron ore, steelmaking coal, energy coal, molybdenum, uranium and nickel. Baseline and performance data have also been adjusted for a methodology change to use maritime transport emission factors from EU Regulation 2023/1805, after The British Standards Institution EN 16258 standard (the source of the emission factors we previously used) was withdrawn in CY2023. |
| 9. | Excluding in-kind contributions. |
| 10. | Area under stewardship that has a formal management plan that includes conservation, restoration or regenerative practices. 1.62 per cent is calculated based on the areas of land and water that we stewarded at 30 June 2024, as per footnote 4. For more information refer to the BHP ESG Standards and Databook 2024 available at bhp.com/sustainability. |
| 11. | Natural capital accounts are a way to measure the amount, condition and value of environmental assets in a given area. They help describe changes in ecosystems and how these impact wellbeing and economies. |
| 12. | Point in time data at 30 June 2024. |
| 13. | 8.3 per cent refers to Indigenous employee participation at Minerals Australia operations. Total Indigenous employee participation in Australia, including non-operational roles (1.9 per cent), was 7.5 per cent at 30 June 2024. |
| 14. | 11.2 per cent refers to Indigenous employee participation at the Jansen potash project and operation in Canada. |
| 15. | 10.1 per cent refers to Indigenous employee participation at Minerals Americas operations in Chile. |
| 16. | Since publishing our FY2023 scorecard, we have updated the methodology we use to track our ‘Progress to plan’ key metric and this change is reflected in our FY2024 performance against this metric. We had previously intended the metric would be Indigenous partner-measured (using a traffic light score) on satisfaction in relation to the milestones agreed in relevant partnerships, as co-designed in our regional Indigenous Peoples Plans. This update clarifies our intention to report on ‘Progress to plan’ in relation to our progress against the current or planned regional Indigenous Peoples Plans in Australia, Canada and Chile. The updated methodology for this metric aligns with the reporting methodology for the finalised regional plans, including the Australian Reconciliation Action Plan (RAP) published in May 2023 and the Canada Indigenous Partnerships Plan (CIPP) approved in June 2024 and published in August 2024, both of which will report on progress against the milestones co-designed in each plan. Australia is the only region with data available to report on its first year of progress against the RAP in FY2024, therefore the social value scorecard metric for Australia is considered ‘on track’ for FY2024. The first progress report for Canada on our co-designed CIPP will be made in our Annual Report 2025. We are still developing our regional Indigenous Peoples Plan for Chile. We have retained the Indigenous partner-measured methodology for measuring the ‘Present relationship health’ key metric. For more information refer to OFR 6.12 and the BHP ESG Standards and Databook 2024 available at bhp.com/ESGStandards2024. |
| 17. | Indigenous partners who participated in the relationship health check project in FY2024 considered and provided feedback on social, cultural and commercial aspects of their relationship with BHP and provided a rating on a 0–10 scale on the present health of their relationship with BHP – 0 is very poor, 5 is average and 10 is very good. For more information refer to OFR 6.12. |
| 18. | Reduction in life-altering injury or illness includes life-altering or long-term permanent disabling injuries and illnesses as defined by BHP’s Risk Framework. Since we commenced measuring our life-altering injury and illness metric, we have learned that a longer measurement period is required for analysis to allow for the classification of more chronic conditions. Therefore, it will not be reported on in this Report or included as a key metric in the social value scorecard in FY2025. This reflects a change from what we proposed in our FY2023 social value scorecard and so we have retained this metric in our FY2024 scorecard (without reporting against it) to explain the change in approach. The two main illness and injury types that influence life-altering injury or illness for BHP are musculoskeletal cases and noise-induced hearing loss cases, both of which we report on in OFR 6.7. |
42
Table of Contents
| 19. | Co-design requires meaningful engagement and contribution to the plan from a variety of interested stakeholders. For an overview of our approach to co-design and co-creation (terms which we use interchangeably) refer to OFR 6.11. |
| 20. | This includes contribution to suppliers, wages and benefits for employees, dividends, taxes, royalties and voluntary social investment. For more information refer to the BHP Economic Contribution Report 2024. |
| 21. | Net Promoter Scores (NPS) show respective feedback from our customers and suppliers, and measure the willingness of our customers/suppliers to recommend BHP to others. NPS is used as a proxy for gauging overall satisfaction. |
| 22. | This milestone was achieved by developing a Group-level framework for nature-positive plans to achieve the 2030 Healthy environment goal (BHP Healthy environment goal roadmap). |
| 23. | Refer to OFR 6.10 for more information regarding the BHP Healthy environment goal roadmap. |
6.6 People
Our more than 90,000 employees and contractors around the world are the foundation of our business. We aim to attract and retain the best people and our distinctive way of working through the BHP Operating System (BOS) seeks to empower our people to bring the best of themselves to improve their work every day.
Our Values set the tone for our culture and are a unique part of our competitive advantage. Our Values are a declaration of what we stand for and are designed to guide our behaviour and decision-making, as we work together in the pursuit of delivering on our purpose. In today’s dynamic, uncertain world, anchoring our decision- making to a clear set of values remains as important as ever. In FY2024, we engaged with employees, partners and other stakeholders as we sought to redefine Our Values in a way that builds upon our rich history, while also reflecting BHP today. Our refreshed Values were launched in May 2024. They are simple and designed to enable our people to be ready to move quickly and deliberately to create and act on opportunities and navigate challenges as they arise. Our refreshed Values are:
Do what’s right
A sustainable future starts with safety and integrity, building trust with those around us.
Seek better ways
Listening to learn and inspiring challenge is how we drive progress.
Make a difference
The accountability to act, create value and have impact is on each of us, every day.
Developing our capabilities and an enabled culture
We invest in the development of our people to build capability and drive stronger performance.
In support of work to deliver the capabilities for today and tomorrow, BHP’s FutureFit Academy (located in Western Australia and Queensland) provides a pathway for new employees, some of whom have never worked in our industry before, to join Minerals Australia through an accredited maintenance and production traineeship or a trade apprenticeship. Once trained and qualified, employees move to one of our Australian assets. The strong partnership between vocational educational institutions and our FutureFit Academy facilitates the provision of nationally accredited qualifications and is a unique attraction and retention lever for BHP.
The FutureFit Academy is designed as an inclusive learning environment, welcoming employees who are new to the industry and providing permanent employment from day one. As at the end of FY2024, our student cohort included 80 per cent female participation and was made up of over 20 per cent Indigenous intake.
The FutureFit Academy expanded in FY2024 to provide a larger footprint in Perth, Western Australia, moving to a purpose-built learning centre that includes fabrication and auto electrical trades in addition to the core mechanical fitting and heavy diesel programs. A satellite FutureFit Academy was also established in Newman, Western Australia, providing a belt splicing program for experienced students.
Our intern and graduate programs also serve to attract and develop emerging talent for critical skills we need for the future. In FY2024, we had 60 first-year university students participate as part of our First-Year Internship Program across Australia. The program aims to boost enrolments in Australian resource-related tertiary degrees by exposing science and engineering students to mining careers. In FY2024, an additional 147 university students joined the BHP Internship Program for five to 24 weeks to gain experience in their chosen field of study through on-the-job learning, working on mine sites alongside technical professionals. Our selected interns have early access to apply for our annual graduate program intakes. In FY2024, we onboarded 177 employees into our graduate program across Australia, Chile, Canada, Singapore and the United States, to meet the needs for future skills across our operations and functions in those regions.
43
Table of Contents
To support our focus to build leader capability and drive stronger performance, we conduct multi-level leadership development programs. The Senior Leadership Forum is intended to develop senior leaders through shared goals and context. In FY2024, this forum was delivered quarterly with a summit held in late FY2024 to further engage our senior leaders in relation to our purpose, strategy and operating system, and to launch the refreshed Our Values. Additionally, we also continue to facilitate an Integrated Leadership Forum for general managers on a quarterly basis to align this next critical cohort of leaders. Further, around 2,000 leaders including supervisors, superintendents and managers attended BHP Distinctive Leaders programs in FY2024, focused on developing their ability to lead inclusively, ethically and through complexity.
We ask our employees and contractors about their experiences working with BHP via an Engagement and Perception Survey twice a year. After each survey, our team leaders assess what is working well and what they can learn from others before taking action to address improvement areas. Additionally, this survey is used to measure progress against a wellbeing metric within the Safe, inclusive and future-ready workforce pillar in our social value scorecard. In March 2024, we had a response rate of 82 per cent of employees, with 24,000 contractors also providing feedback. We achieved a strong result, with 80 per cent of participants responding favourably to questions related to their engagement and connection to BHP and 87 per cent to questions related to their wellbeing.
Inclusion and diversity
We believe an inclusive and diverse workforce promotes engagement, safety and productivity, and is valued by prospective employees as well as our current workforce.
Our Inclusion and Diversity Position Statement confirms our vision, commitment and contributions to inclusion, equity and diversity. Since 2016, we have been embedding flexible working, ensuring our facilities and equipment are purpose-fit by partnering with our supply chain partners, and undertaking work to mitigate bias in our systems with the aim of creating workplaces that are safe and inclusive for a diverse range of people.
Our goal is to attract and retain a workforce that is representative of society. We do this by implementing measures designed to address the barriers and impacts of bias and discrimination experienced by people within underrepresented groups, through listening to their experience and gaining insights from our engagement surveys and our voluntary self-identification survey, ‘Tell Us About You’. As of February 2024, over 11,000 of our employees had completed the survey.
We also recognise pay is a critical mechanism for creating gender equality. To help mitigate gender pay disparities and prevent the creation of pay gaps, we continue to drive improvements in our systems and processes to remove systemic bias. As an example, our recruitment processes include a ‘blind reward’ process, which is designed to reduce potential bias in remuneration offers at the time of hire. We use global best practice methodologies to calculate the pay gap between men and women in like-for-like or comparable roles. We analyse our pay data and conduct gender pay equity reviews at least annually. The results of the pay equity reviews are reported to the BHP People and Remuneration Committee. Our FY2024 employee remuneration data, including a breakdown by gender, is available in the ESG Standards and Databook 2024.
Gender balance1
In CY2016, we announced our aspiration to achieve gender balance within our employee workforce globally by the end of CY2025, which we define as a minimum 40 per cent women and 40 per cent men. This has also been included as one of the key metrics we measure progress against our Safe, inclusive and future-ready workforce pillar in our social value scorecard.
We increased the participation of women working at BHP in FY2024 by 1.9 percentage points compared to FY2023, with around 10,500 more female employees at the end of FY2024 than FY2016. As at 30 June 2024, women represented 37.1 per cent of our employee workforce. Since we first set our gender balance aspiration in 2016, BHP has more than doubled the participation of women (from 17.6 per cent to 37.1 per cent). We also reached a significant milestone during FY2024 achieving over 40 per cent participation of women in our employee workforce across the Minerals Americas operations in Chile, and as at 30 June 2024 this was 40.9 per cent.
The gender breakdown of new hires in FY2024 was 48.1 per cent men and 51.9 per cent women. We improved our participation of women in leadership in FY2024 by 2.0 per cent compared to FY2023. As at 30 June 2024, 31.7 per cent of people leaders were women and of our senior executives 40.9 per cent were women and 59.1 per cent were men.
For operational teams, a focus on roster and job redesign is designed to support greater female participation. Our Bamboo flexible work program is an example of this.
Footnotes
| 1. | Based on a ‘point in time’ snapshot of employees as at 30 June 2024, including employees on extended absence, as used in internal management reporting for the purposes of monitoring progress against our goals. New hires is based on a 12-month period from 1 July 2023 to 30 June 2024. ‘People leaders’ are defined as employees with one or more direct reports. ‘Senior executives’ are defined as employees in the Executive Leadership Team (ELT) and direct reports to the ELT in grade 15 and above roles. Figures reported do not include employees of BHP Mitsubishi Alliance’s Blackwater and Daunia operations, sold to Whitehaven Coal during FY2024. |
Case study – Bamboo flexible work program
In FY2024, our Bamboo flexible work program was a finalist in the Chamber of Minerals and Energy of Western Australia Women in Resources Awards. Founded in 2019 at Newman Operations, the Bamboo program is a residential gender diversity initiative that supports the attraction and retention of women in historically male-dominated roles. The Bamboo program is targeting an 80 per cent female intake from the Newman township, creating an opportunity for new-to-industry and existing workers to have flexible work options with reduced shift hours, enabling them to actively maintain a career in mining production, specifically haul truck operations.
44
Table of Contents
>For more information on the Bamboo flexible work program refer to bhp.com/people
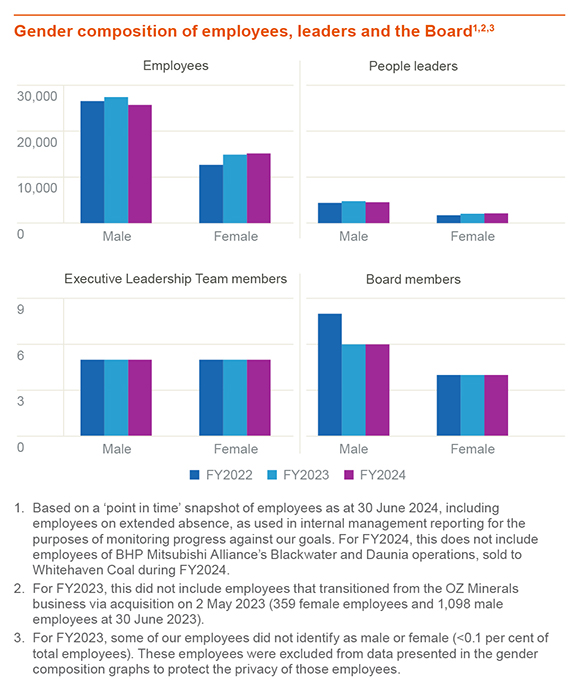
Indigenous employment
Indigenous peoples are critical partners of BHP across our operations. We recognise, as part of our global Indigenous Peoples Policy Statement, we can contribute to the economic empowerment of Indigenous peoples by providing opportunities for employment, training and procurement and by supporting Indigenous enterprises.
We have set targets to increase Indigenous employment in our Minerals Australia operations, Minerals Americas operations in Chile and our Jansen potash project in Canada.
45
Table of Contents
Indigenous employee participation1
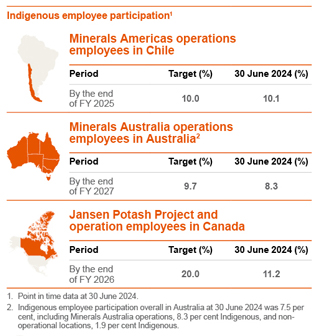
>For more information on our 2030 goals related to Indigenous partnerships refer to 6.12
Racial equity program
There is no place for racism at BHP or anywhere in the community. We recognise and acknowledge racism impacts our people’s sense of identity, value, feelings of respect and psychological safety. We are taking action to better understand the prevalence of racism at BHP to promote racial awareness and equity in our workplace, and we recognise there is more still to do.
We continue to take action to increase awareness of and promote reporting, response and investigations in relation to racial harassment matters. In FY2024, across our global operations and offices:
| • | 109 reports of racial harassment were received into BHP’s reporting channels for raising misconduct concerns. |
| • | 42 per cent of the reports received were logged by leaders, on behalf of others. |
| • | 23 investigated cases of racial harassment conduct were established as having occurred. |
| • | Of the 23 established cases, 21 individuals responsible had their employment terminated (or were removed from site if a contractor) or resigned. |
| • | 19 reports of racial harassment were dealt with by a non-investigative resolution pathway at the impacted person’s request. |
Our racial equity working group is led by Chief Financial Officer Vandita Pant as the executive sponsor and oversees work with a focus on eliminating racism and striving to create an environment free from racial discrimination. As part of its work, this group works alongside our Indigenous engagement teams in Australia, Chile, Canada and the United States.
Throughout FY2024, we continued to progress our work in identifying and addressing structural barriers to equity, and in building awareness and capability in our leaders. We also continued to improve our grievance processes to better support people who tell us when they have experienced racism. Our work in FY2024 included:
| • | commencing the refresh of a central online platform called RespectHub, including the development of a new virtual assistant RespectChat, aimed at providing information and tools to our workforce to prevent and respond to racism, including support options, response pathways and reporting |
46
Table of Contents
| • | launching new chapters of EmBRace (Employees Beyond Race), our employee resource group focused on discussions around race and racial diversity. Local chapters have now been set up in Canada and South Australia, in addition to existing chapters in Western Australia, Queensland, Singapore and Manila |
| • | continuing our internal and external global awareness and communication campaign, the ‘people of BHP’ series, which aims to celebrate our diversity |
| • | recording and launching a four-part podcast series on racial awareness, with a series of BHP leaders in conversation with external subject matter experts, to continue to support our people to develop a racially aware mindset |
| • | signing up to the RISE Project run by Diversity Council Australia, to commence work in FY2025 to implement organisational change interventions that will help address systemic and organisational barriers for women from culturally and racially marginalised (CARM) backgrounds |
LGBT+ inclusion
Our LGBT+ ally employee inclusion group, Jasper, established in 2017, is a natural extension of our inclusion and diversity aspirations. Its membership base grew to around 2,900 at the end of FY2024, with 16 chapters globally.
In FY2024, we continued to advocate for LGBT+ inclusion and partner with charities throughout the communities where we operate, to help our LGBT+ employees develop a strong sense of belonging inside and outside of our offices and our mine sites.
In FY2024, BHP in Chile was recognised by the Human Rights Campaign (HRC) with certification under the HRC Equidad CL program as one of the ‘Best Places to Work LGBTI+ 2024’. The certification in Chile is delivered by HRC, Pride Connection and Iguales Foundation and is awarded based on a benchmark assessment of a company’s measurable workplace equality and inclusion efforts for the LGBTI+ community.
Disability
To foster a workplace where people with a disability can fully participate and thrive, during FY2024 we progressed the development of our first global Disability Action Plan, which is expected to be launched during the first half of FY2025. The plan seeks to address three strategic pillars – people, culture, systems – to encourage, recognise and promote an active commitment to improving accessibility and disability inclusion.
Though we are early in this journey, recognising that everyone has unique needs and strengths, our ambition is to address and remove barriers so that people with a disability can equitably participate in our workforce.
Employee relations
In Australia, the Federal Government has introduced several tranches of significant industrial relations legislative reforms. In June 2023, this included the introduction of changes to the enterprise bargaining framework with multi-enterprise bargaining. During FY2024, the Federal Government enacted the ‘same job same pay’ policy, enhanced workplace delegates’ rights and empowered the Fair Work Commission to make workplace determinations in the case of intractable bargaining. Not all the legislative reforms have fully commenced operation and we will continue to monitor how they are applied to further our assessment of impacts on BHP and our contracting partners, including the potential to increase labour costs.
In Chile, the 40-hour week regulation was enacted in April 2023 and requires a gradual implementation over the next five-year period to move from 45 to 40 working hours per week. During FY2024, implementation commenced for the collective agreements that were completed, which now include mandatory shift reductions to 42-hour weeks in April 2026 and 40-hour weeks by April 2028. We continue navigating and monitoring progress on a number of legal developments that may have implications for employee relations in Chile, for example, pension reform and branch negotiation regulation.
During FY2024, Minerals Australia participated in 11 collective bargaining processes, with seven enterprise agreements completed (with 23 presently in operation) and four subject to ongoing negotiations as at 30 June 2024. In Minerals Australia, there was one round of collective bargaining where protected industrial action occurred during FY2024 (BMACo OCO Enterprise).
Minerals Americas participated in four collective bargaining processes during FY2024, with three completed prior to 30 June 2024 and one concluded subsequent to 30 June 2024. No protected industrial action occurred during FY2024 at our Minerals Americas operations in Chile.
Payroll review
Review of employee allowances and entitlements
In FY2023, we identified and disclosed two issues with certain allowances and entitlements affecting some current and former employees in Australia. We self-reported these issues to Australia’s Fair Work Ombudsman (FWO) and engaged Protiviti, a global assurance firm, to undertake a review of our payroll systems. We are sorry that this has happened and we are working to make this right.
47
Table of Contents
We continue to progress historical remediation of both issues. We have a dedicated hotline and secure online portal in place to support impacted current and former employees and facilitate remediation payments. We encourage any former employees who think they may be impacted by these issues to contact us via the hotline or portal.
> Refer to our website bhp.com/payroll-review
The first issue involves certain rostered employees having leave incorrectly deducted on public holidays. OZ Minerals was affected by a similar issue before being acquired by BHP in May 2023. At the end of July 2024, we had identified approximately 35,500 current and former employees who are affected by this issue, dating back to 2010. Progress on remediation includes:
| • | recrediting leave hours to approximately 19,000 current employees, including employees who had been affected by a similar leave deduction issue at OZ Minerals, before it was acquired by BHP in May 2023 |
| • | payments made to approximately 7,500 former employees impacted by this issue, including those who had been affected during a prior period of employment at OZ Minerals |
| • | ongoing endeavours to connect with approximately 9,000 former employees who we have identified as eligible for a payment but have not yet been able to locate with the contact information we have |
We aim to complete the majority of public holiday leave deduction payments by the end of FY2025.
The second issue involves current and former employees at Port Hedland in Western Australia Iron Ore (WAIO) who are entitled to additional allowances due to an error with their employing entity in their employment documentation. Following detailed analysis, we have identified approximately 230 current and former employees affected by this issue, dating back to 2013. We are continuing to pay additional allowances to affected current employees. We are also progressing payments to affected current and former employees for historical impacts.
Based on the currently available information, the cost of remediating the leave issue and the employing entity issue, incorporating on-costs, including associated superannuation and interest payments (BHP share), remains in line with the previously recognised US$280 million pre-tax, as reflected in the Group’s FY2023 financial results.
Improving our payroll systems and processes
In FY2023 we engaged Protiviti to conduct a review of BHP’s payroll systems and framework, including governance, processes, controls and systems. Protiviti’s review is ongoing. We are progressing a range of work to improve our global payroll systems and processes, including embedding stronger governance, controls and processes and continuing to invest in the right capabilities to meet the needs of our broad operations and workforce into the future. We expect this work to continue over the next few years.
We will continue to engage with the FWO and other relevant government agencies as we progress this work.
The Board and CEO have taken these issues seriously and a range of consequences have been implemented for employees in connection with these issues. Specifically, the Board has determined that the CEO’s FY2024 CDP outcome will include a 4.3 percentage point reduction to reflect his ultimate accountability for BHP’s payroll systems. This CDP reduction for the CEO in FY2024 is US$185,000 and is equivalent to 25 per cent of the CEO’s target annual short term incentive pro-rated for the portion of the relevant period that he was CEO. For others with accountability for BHP’s payroll issues (including current and prior ELT members) there have been reductions determined in the variable remuneration outcomes ranging between 25 per cent to 100 per cent of relevant annual target variable pay.
Other consequences have ranged from letters of warning, remuneration consequences and termination of employment.
Further detail is provided in the Remuneration Report.
48
Table of Contents
Sexual harassment
The safety of our employees and contractors is paramount. Our priority is to ensure our workplaces are safe and inclusive for all and to enact our culture of care. This includes the elimination of sexual harassment, which we recognise is unequivocally unacceptable. We encourage our people to be active bystanders through education and leadership role modelling and to report incidents so we can provide appropriate support and more effectively address and eliminate sexual harassment at BHP.
In FY2024, BHP’s strategy to eliminate sexual harassment was underpinned by the Australian Human Rights Commission Guidelines for Complying with the Positive Duty under the Sex Discrimination Act 1984 (Cth). Our strategy was also informed by external experts, such as Kristin Hilton, Kate Jenkins AO along with Queensland University of Technology. The strategy seeks to prevent sexual harassment by addressing the drivers and risk factors and enhancing our response to incidents, early intervention and taking a person-centred response by increasing support and agency for impacted persons. We acknowledge how sexual harassment interacts or combines with other psychosocial hazards and we have sought to address this in the way we approach prevention through holistic risk management.
Risk management
Sexual harassment has been defined as a material health and safety risk at BHP since CY2018. Our risk management approach includes conducting risk assessments to identify scenarios in which sexual or gendered harassment may arise, their potential causes and the controls we can implement to prevent and reduce harm. This recognises the high intersectionality with other psychosocial risks, which can increase the likelihood of sexual harassment occurring and the severity of harm it can cause. We acknowledge there are factors that contribute to the likelihood of workplace sexual harassment that are more pronounced in the mining industry. This includes isolated or remote working locations, a historically male-dominated workforce and accommodation villages, roles and equipment design as well as factors that are common across all industries and workplaces.
Our FY2024 focus was on implementing additional prevention controls informed by our data and organisational learnings across all assets and offices, including review and recommendations from third-party experts. Our sexual harassment prevention controls are associated with further education and maintaining respectful behaviours; leadership and culture; recruitment processes; security measures at accommodation villages; contractor and third-party engagement; data transparency and action; person-centred care for impacted persons; accessible confidential reporting; trauma-informed response and investigations, including multiple resolution options and pathways; and appropriate and proportionate disciplinary action.
Culture, knowledge and leadership
We are committed to fostering a positive culture that is safe, respectful and inclusive for all workers (employees and contractors) and supports gender equality and diversity at all levels and across all areas. Gender balance is a key protective factor for sexual harassment prevention and BHP aspires to have a gender-balanced employee workforce by end of CY2025.
In FY2024, we continued to engage and empower our entire workforce to take action as active bystanders by enhancing their capabilities to identify and call out disrespectful behaviour through scenario-based learning. BHP strives to ensure leaders understand their obligations to prevent sexual harassment and are visibly committed to safe, respectful and inclusive workplaces through setting clear expectations and role modelling respectful behaviours.
Support and reporting
We encourage our workforce to report any concerns relating to potential sexual harassment, including by providing centralised and confidential reporting tools and mandatory reporting requirements for line leaders. Impacted persons are offered a range of support options throughout and beyond the process to resolution.
Investigations of reports of sexual harassment are conducted by our specialised Response and Investigations team, which is independent from our other business units. This team includes experts trained in a person-centred, trauma-informed approach to help place the impacted person at the centre of decisions made during the investigation process and to minimise the risk of further harm to that individual.
Alternatively, resolution pathways can be used in certain cases. This process only occurs where the resolution pathway is proportionate to the nature of the conduct and with the agreement of the impacted person. The resolution pathways include supported conversations with respondents, additional training, monitoring or awareness raising on BHP’s expectations of respectful behaviours in the workplace. We continue to monitor and review the use of our resolution pathways to assess whether they are meeting the needs of impacted people and to improve reporting to support organisational lessons learned.
Measuring
We measure our progress against our initiatives and key metrics for sexual harassment prevention and response, such as training completion, risk management, control implementation and effectiveness, engagement results and misconduct reporting data, and are committed to continually improving our approach. De-identified information and trend analysis data on the number of complaints, nature of complaints, resolution pathways, outcomes and timelines are provided to senior leadership and the Board to raise awareness and support continuous improvement of how we prevent and mitigate the impacts of sexual harassment at BHP.
>For more information on how we are improving our approach to the prevention of and response to sexual harassment refer to bhp.com/sustainability/safety-health/sexual-harassment
49
Table of Contents
Reports of sexual harassment
There were 417 reports of sexual harassment in FY2024. These behaviours are unacceptable and we are working to eliminate them at BHP by increasing awareness and promoting reporting, response and investigations in relation to these matters. Since October 2020, BHP managers and leaders have been required to enter any misconduct concerns raised directly with them into BHP’s misconduct reporting channels1 (with the impacted person remaining anonymous if requested). In FY2024, 42 per cent of sexual harassment reports received into BHP’s misconduct reporting channels were logged by managers or leaders on behalf of their direct reports.
During FY2024, across BHP’s global operations (including off site) and offices, 100 investigated cases of sexual harassment 2 conduct were established as having occurred through an investigation.3
Of the 100 established cases:
| • | 1 involved a sexual assault |
| • | 22 involved sexualised and indecent touching |
| • | 32 involved sexually aggressive comments, stalking, grooming or image-based harassment |
| • | 45 involved other forms of sexual harassment, including sexualised conversations or jokes |
| • | 103 individuals responsible had their employment terminated (or were removed from site if a contractor) or resigned |
In addition to the matters listed above, in FY2024 60 reports of sexual harassment were dealt with by way of non-investigative resolution pathways, instead of an investigation being conducted. In addition to non-investigative resolution pathways, there are cases of sexual harassment that cannot be investigated due to insufficient information or the wishes of the impacted person. Examples include anonymous reports and non-participation of the impacted person. However, all cases are assessed for safety and impacts as part of preliminary investigative actions and all participants (if identified) are offered support irrespective of whether the matter can be formally investigated.
>For more information on how we are improving our approach to the prevention, response, support and measuring of sexual harassment refer to bhp.com/sustainability/safety-health/sexual-harassment
Footnotes
| 1. | BHP’s channels to raise misconduct concerns comprise an online portal and 24-hour multilingual call service. Reporting channels are confidential and accessible to all, including external partners and stakeholders and the public, to report conduct that may be unethical, illegal or inconsistent with Our Code of Conduct. |
| 2. | Sexual harassment is, as defined in the Sex Discrimination Act 1984 (Cth), an unwelcome sexual advance, unwelcome request for sexual favours or other unwelcome conduct of a sexual nature, in circumstances where a reasonable person would have anticipated the possibility that the person harassed would be offended, humiliated and/or intimidated. Sexual harassment encompasses a range of conduct, including displaying sexually graphic images, sexually suggestive comments, suggestive or inappropriate looks, gestures or staring, non-consensual touching or acts of a sexual nature and sexual assault. We note the definition of sexual harassment may vary in different jurisdictions. |
| 3. | The calculation is based on reports closed in FY2024, containing one or more established allegations. Not all reports resulted in a finding. This can occur if there is insufficient information, the respondent is not able to be identified or was previously terminated, or the impacted person did not wish to proceed. This figure includes cases opened in FY2024 and prior to FY2024 that were closed during the reporting period. When referring to cases closed during FY2024 this excludes cases that were still open at the end of the reporting period. |
6.7 Health
We set mandatory minimum standards to identify, assess and manage health risks and their potential impacts, and monitor the health of our employees and contractors.
Occupational exposures
BHP follows the hierarchy of controls to reduce occupational exposures to as low as reasonably practicable. Our mandatory minimum performance requirements for risk management and our Risk Framework support the identification and management of occupational exposures. Where there is a potential for our employees and contractors to be exposed to chemical and physical hazards in workplace atmospheres, we implement controls intended to prevent, minimise, and/or mitigate the likelihood and severity of potential associated health impacts. These actions may include the use of respiratory protective equipment until appropriate, higher-order controls have been identified, implemented and verified to consistently reduce exposure below occupational exposure limits. Occupational exposure limits indicate the level of permissible exposure for a length of time (usually eight hours) to a chemical or physical hazard that is not likely to affect the health of a worker. Occupational exposure limits for our most material exposures are set according to the latest scientific evidence.
Exposure data in this Report in all cases is presented without considering protection from the use of personal protective equipment where required, as outlined in our Health Global Standard.
In FY2024, for our most material exposures of diesel particulate matter (DPM) and respirable silica, we had a 46 per cent reduction in the number of employees and contractors potentially exposed compared to our FY2023 exposure profile. More specifically, we have recorded a 23 per cent reduction in the number of employees and contractors with potential exposure to DPM and 54 per cent reduction in the number of employees and contractors potentially exposed to respirable crystalline silica. When exposure reduction is considered over the last six years, we have achieved a 78 per cent reduction to our most material exposures. We continue to have zero employees and contractors routinely exposed to coal mine dust above the occupational exposure limit. We are currently undertaking a baseline exposure monitoring program at the former OZ Minerals Australian assets and will provide a comparable exposure profile in FY2025.
50
Table of Contents
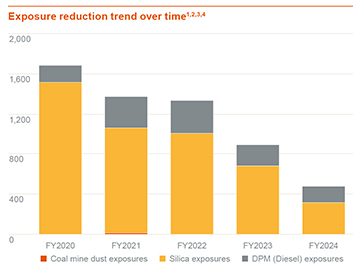
Footnotes
| 1. | Data excludes Discontinued operations as follows: BHP Mitsui Coal (sale completed on 3 May 2022) and BHP’s oil and gas portfolio (merger with Woodside completed on 1 June 2022). Prior years’ data (FY2020 to FY2022) has been re-stated to exclude these operations. Divested DMA assets, Daunia and Bllackwater (divested on 2 April 2024) are included in FY2024 data up until the date of divestment. |
| 2. | Occupational exposures data excludos Projects. |
| 3. | Occupational exposure data excludes assets acquired as part of the OZ Minerals acquisition. We are currently undertaking baselining of exposure data to provide comparable exposure profile in FY2025. |
| 4 | As of FY2021, the occupational exposure limit for Coal was reduced to 1.5 mg/m² compared to 2.0mg/m³ in previous years. |
We are committed to having no AL4 (fatalities and life-threatening illnesses) events and a reduction in life-altering injuries and illnesses. Due to the latency between initial exposure and diagnosis of disease for our most material airborne contaminant exposures, we must demonstrate ongoing exposure reduction and effectiveness of controls, where exposures may remain elevated. In FY2023, reduction plans were developed at the asset level across operations for implementation with priority afforded to the asset’s most material exposures. The implementation of these exposure reduction plans commenced in FY2024 and will continue to be a focus in FY2025.
Welding fume exposure control has been a particular focus for several assets across BHP throughout FY2024. Additional controls, including on-torch extraction systems and portable local exhaust ventilation systems have been implemented at Olympic Dam. Control effectiveness testing has been carried out by the local Occupational Hygiene team, indicating a 50 per cent reduction in welding fume exposure since September 2022. Due to the success of this project, additional similar controls are now being trialled in some of our other operations, including WAIO, at Mining Area C, Jimblebar and Mt Whaleback.
Occupational exposure hazard awareness and training is provided at induction and periodically, including during fit testing for hearing protection and respiratory protective devices. Wherever workers take part in occupational exposure assessment programs, they receive written feedback on their results and anonymised data is provided to line management.
We have implemented real-time monitoring at several of our Minerals Australia and Minerals Americas operated assets to support further exposure reduction of silica and DPM. Fixed-position monitors identify dusty conditions in real time enabling immediate controls, such as increased ventilation or water sprays, to be deployed. Data from portable monitors is made available at the end of shifts, rather than when results of samples sent to the laboratory for analysis become available. This enables prompt action to be taken if real-time monitoring demonstrates an increasing trend in potential exposure.
Occupational illness
The reported occurrence of occupational illness for employees in FY2024 was 270, which was 3.77 per million hours worked. This represented a 13 per cent decrease in incidence compared with FY2023, which was 4.35 per million hours worked. For our contractor workforce, the reported occupational illness in FY2024 was 216, which was 1.79 per million hours worked, representing a 10 per cent decrease in incidence compared with FY2023, which was 1.99 per million hours worked.
As noted in our FY2024 performance against our social value scorecard provided in OFR 6.5, BHP is committed to reducing life-altering injury or illness and we continue to track the number of life-altering injuries and illnesses internally. Since we commenced measuring our life-altering injury and illness metric, we have learned that a longer measurement period is required for analysis to allow for the classification of more chronic conditions. Therefore, it will not be reported on in this Report or included as a key metric in the social value scorecard in FY2025. The two main illness types that influence the number of life-altering illnesses are musculoskeletal cases and noise-induced hearing loss cases, both of which we continue to report on annually. Information relating to injuries can be found in section 6.1.
51
Table of Contents
Musculoskeletal illness is the predominant occupational illness category for BHP employees and contractors, representing 68 per cent of our workforce illnesses in FY2024. These conditions include damage to bones, joints, ligaments, tendons and soft tissues, caused by repetitive heavy work, muscular strain, or maintaining poor postures for extended periods of time.
Noise-induced hearing loss represents 8 per cent of occupational illnesses in FY2024. Employees and contractors exposed to noise levels above the defined workplace exposure limits in our Health Global Standard participate in hearing conservation programs, which include a periodic hearing test and hearing protection fit testing. We have established design recommendations that seek to eliminate or reduce high or prolonged noise exposures by focusing on noise source.
Heat stress contributed to 4 per cent of our reported occupational illnesses in FY2024. Elevated temperatures and strenuous activity place some of our workforce at an increased risk of heat illness. High-risk work groups are identified, and a range of controls are in place to manage heat stress. In FY2024, a new heat awareness online learning module was released for workers across Minerals Australia to provide workers with the knowledge to identify signs of heat illness and how to manage the risks associated with working in the heat. Hydration testing has also been made available at several operations with high heat risk.
Recognising climate change may exacerbate existing temperature related risks, in FY2024 we piloted an approach at Olympic Dam to better understand and quantify the potential impact of heat stress on our workforce under different future climate scenarios. Modelling was based on climate data and temperatures within the underground mine to determine potential productivity and health impacts caused by heat stress under different scenarios. The findings of this assessment will assist in the identification of additional controls that may be required to ensure our workforce can perform their roles safely under changing climatic conditions.
Coal mine dust lung disease
In FY2024, 21 cases of coal mine dust lung disease (CMDLD)1 were reported to the Workers’ Compensation Regulatory Services.2 Of the 13 accepted claims in FY2024, two were current BHP employees, while the remaining 11 were former employees. For cases involving current employees, we offer counselling, medical support, and redeployment options where relevant. Former employees are eligible for workers’ compensation insurance and associated care is managed externally to BHP.
We have controls in place across all our relevant operated assets with the goal of ensuring none of our employees and contractors are exposed to respirable CMD above the occupational exposure limit (OEL). We continue to identify and progress projects, such as real-time dust monitoring, to facilitate our recognition and action when the working environment may present a health hazard and seek to implement high order controls, such as engineering controls to eliminate or reduce exposures rather than continued reliance on lower order controls, such as respiratory protection. We have observed consistent control of CMD exposures with no employees or contractors potentially exposed to CMD above the OEL since FY2021.
Footnotes
| 1. | CMDLD is the name given to the lung diseases related to exposure to coal mine dust and includes coal workers’ pneumoconiosis, silicosis, mixed dust pneumoconiosis and chronic obstructive pulmonary disease. |
| 2. | Cases reported to Workers’ Compensation Regulatory Services are not an indication that the CMDLD was related to work. BHP evaluates each case for work-relatedness and where identified, the case will be included in occupational illness reporting. |
Physical and mental health
The physical and psychological health and wellbeing of our workforce is of paramount importance as we continue to work towards enhancing the inclusivity and future-readiness of our employees and contractors. In FY2024, we continued efforts to make meaningful and positive improvement to employee health and wellbeing by building stronger relationships via our active collaborations with industry partners. We engaged with initiatives such as the ‘Minding Mining Minds’ (MMM), which aims to develop tools and evidence-based models and share learnings across industry, the Building Safe and Respectful Workplaces (BSRW) which aims to help eliminate disrespectful behaviour in the resources industry including sexual harassment, bullying and racism and we have an active partnership with the Global Business Collaboration for better mental health.
Our focus internally has been on embedding our learnings. In FY2024, we embedded the BSRW principles into our global onboarding. A Global Wellness Committee was also established, bringing together asset and corporate office Wellness Committees into a global forum to collaborate on initiatives, implement strategic improvements and share learnings. The Committee aims to build mental health literacy, increase awareness and benefit overall physical and mental wellbeing, and has maintained a strong ongoing participation in global health campaigns, such as BHP Mental Health Month, RUOK? day and Movember.
In FY2024, the Group Health team introduced the Women Can initiative to promote women’s physical and mental health. The Women Can initiative ran during March, aiming to lift the profile and importance of women’s health and wellbeing. Through prestart education packs, personal shares and panel discussions held with senior female leaders, including our Chief People Officer, and Group HSS Officer, BHP provided education and an opportunity for safe and impactful conversations on the importance of self-care, health screening, menopause and providing a safe and inclusive workplace. During this campaign, BHP formed a formal partnership with Menopause Friendly Australia and is working towards achieving accreditation as a menopause friendly employer where we aim to raise awareness, educate staff and engage in training and policy and process change to address women’s health and menopause in the workplace.
Psychosocial risk management
We continue to integrate psychosocial hazard identification and management into the way we work. Our employees and contractors are encouraged to identify and call out disrespectful behaviours that may contribute to psychological harm, including bullying and sexual harassment, as well as other psychosocial hazards.
Our Psychosocial Risk Assessment Program was established in FY2023 and initially focused on our operated assets. In FY2024, we completed psychosocial risk assessments across our global functions. From this work we have developed an organisation-wide psychosocial risk profile across five evidence-informed BHP-specific Psychosocial Hazard Domains – in interpersonal; traumatic; physical (distance and fatigue); organisational and job-inherent hazards. We will deploy these Hazard Domains to categorise and rank psychosocial hazards and identify controls for our most significant psychosocial hazards.
In FY2024, we developed and commenced the introduction of the BHP Psychosocial Health Index, which we will complete in FY2025. This is an assessment tool and confidential platform for employees and contractors to provide feedback on how they experience the physical and psychological aspects of their work environments, the social aspects of their job and the design and management of work, together with an associated measure of physical and mental health that helps us determine where harm may be occurring.
52
Table of Contents
As part of our Psychosocial Risk Assessment Program, we have also expanded our support options, including providing additional pathways for employees and contractors to seek information and support on preventing and managing psychosocial hazards when they occur. We also expanded and simplified our tools and guidelines in FY2024, centralising them in one easily accessible hub and enabled ‘in the moment’ interactive support via a new digital tool.
Support for employees affected by family and domestic violence
BHP has a Family and Domestic Violence Assistance Program, which was updated in FY2024, that aims to provide employees with support for their health, safety, wellbeing and independence if they are experiencing family and domestic violence.
As part of the program, employees can access up to 10 days’ additional paid leave if they are affected by family and domestic violence or supporting someone who is.
Support also includes emergency accommodation, emergency financial help and access to safety and security plans. These supports consider safety measures, such as transport to and from work, changing location of work, setting up new phone numbers, screening/blocking calls and emails, and supporting access to legal advice.
6.8 Ethics and business conduct
Our conduct
Our Code of Conduct (Our Code) is designed to help us make the right decisions every day and deliver on our purpose to bring people and resources together to build a better world. It applies to everyone who works for us, with us or on our behalf. To assist our employees and contractors understand how Our Code applies, regular training is undertaken. Breaching Our Code can result in serious consequences and depending on the severity of the breach this could include counselling, warnings and even termination of employment. We encourage people to speak up where a decision or action is not in line with Our Code or Our Values.
BHP requires reports of business conduct concerns to be treated with appropriate confidentiality and has policies in place intended to prohibit any kind of retaliation against people who make or may make a report, or who cooperate with an investigation. These may also include reports made to regulators. We consider all forms of retaliation to be misconduct and grounds for disciplinary action, up to and including termination. We have a number of key policy and process documents to support a safe to speak up culture, including our BHP Whistleblower Policy.
>Our Code is available in five languages and accessible at bhp.com/about/operating-ethically/our-code#/
| >Our BHP Whistleblower Policy sets out additional information, including protections available to persons who make eligible disclosures under Australian law and accessible at bhp.com/-media/documents/ourapproach/operatingwithintegrity/taxandtransparency/240523_bhpwhistleblowerpolicy |
Reports received are assessed by the Ethics and Investigations team to determine an appropriate response, which may include an investigation or other resolution. In assessing the appropriate response, BHP applies a proportionate and person-centred approach to the report considering all participants. People impacted by reports of sexual harassment and racism are offered specialised support by the Ethics Support Service, which enables people impacted to have input into BHP’s response. The impacted person’s preferences as well as the type and severity of the alleged misconduct are considered in determining the appropriate response, which may include an investigation, training, facilitated conversations and line leader intervention. Quarterly reporting on the most serious reports is provided to senior leaders and the Risk and Audit Committee, which has representation of Board members, and includes reported case metrics, outcomes and insights. The reporting supports leadership awareness and informs priorities for ongoing improvement. Feedback is obtained regularly from stakeholders, including case participants, external experts and management, to continually improve our response to reports.
53
Table of Contents
In FY2024, 5,087 reports regarding business conduct were received directly into BHP’s channels to raise misconduct concerns.1 Out of the total misconduct reports, 25 per cent were raised by leaders on behalf of someone else. There continues to be a great focus on health and wellbeing in the workplace, and we have seen a 6 per cent decrease of bullying and harassment cases from 3,067 in FY2023 to 2,870 in FY2024.
Of the business conduct reports received, 41 per cent were made anonymously.1 Of the total business conduct reports closed during FY2024, 41 per cent contained one or more established allegations.2,3
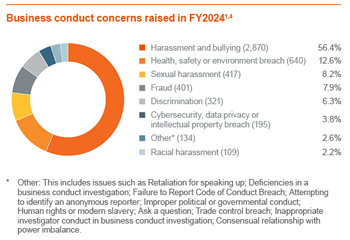
Footnotes
| 1. | This excludes reports not containing a business conduct concern and excludes reports logged by leaders on behalf of others. |
| 2. | The calculation is based on reports closed in FY2024, containing one or more established allegations. Not all reports resulted in a finding. This can occur if there is insufficient information, the respondent is not able to be identified, was previously terminated, or the impacted person did not wish to proceed. This figure includes cases opened in FY2024 and prior to FY2024 that were closed during the reporting period. When referring to cases closed during FY2024, it excludes cases that were still open at the end of the reporting period. |
| 3. | As the established rate reflects the number of cases established out of all business conduct concerns closed during the reporting period, the parameter has been updated to better reflect the cases that are considered business conduct concerns at closure (i.e. the investigation category). Additionally, calculating the established rate based on investigation category provides a more stable measure since case attributes can vary whilst the investigation is underway and unlikely to change once the investigation has concluded and case is closed. |
| 4. | FY2024 data includes all former OZ Minerals assets in Australia and Brazil. |
Employees and contractors can raise their concerns through a number of channels (including anonymously) or through leaders. Anyone, including external partners, stakeholders and the public, can lodge a concern in the form of a report, either online in our channels to raise misconduct concerns or via the 24-hour, multilingual call service.
Anti-corruption
We continue our commitment to contribute to the global fight against corruption in the resources industry. Our commitment to anti-corruption is embodied in Our Charter and Our Code.
As part of this commitment, we prohibit authorising, offering, giving or promising anything of value directly or indirectly to anyone to influence them in their role, or to encourage them to perform their work disloyally or otherwise improperly. We also prohibit facilitation payments, which are payments to government officials for routine government actions. Our people must take care that third parties acting on our behalf do not violate anti-corruption laws. Disciplinary action, including dismissal or termination of contractual relationships, may follow from a breach of these requirements.
To manage corruption risk, we work to achieve optimal resource allocation to areas of our business with the highest exposure to corruption risks. The identification, assessment and management of corruption risks associated with growth opportunities remains a significant area of focus for our Compliance function, via a sub-team dedicated to supporting functions that are responsible for initiating transactions and growth opportunities in countries with higher corruption risks.
Activities that potentially involve higher exposure to corruption risk require review or approval by our Compliance function, as documented in our anti-corruption compliance framework. In FY2024, we continued conducting monitoring focused on verifying the operation of anti-corruption controls in relation to higher risk relationships and activities, including the provision of community donations and sponsorships, identification and management of corruption risks relating to government officials and community leaders in the context of local procurement, and sole source procurement decisions.
We regularly review our anti-corruption framework for compliance with the requirements of the US Foreign Corrupt Practices Act, the UK Bribery Act, the Australian Criminal Code and the applicable laws and regulatory developments of all places where we do business. These laws are consistent with the standards of the OECD Convention on Combating Bribery of Foreign Public Officials in International Business Transactions.
Our Compliance function is independent of our assets and regions and reports to the Chief Legal, Governance and External Affairs Officer. Our Chief Compliance Officer also reports quarterly to the Risk and Audit Committee on compliance issues and meets at least annually with the Risk and Audit Committee Chair.
54
Table of Contents
The Compliance function also participates in anti-corruption risk assessments in respect of our operated assets or functions, our interests in non-operated assets and new business opportunities that we consider are exposed to material anti-corruption risks. In FY2024, the function provided input into 27 anti-corruption risk assessments.
Building employee awareness remains critical to the effective management of corruption risk across BHP. Anti-corruption training is required to be provided to all employees and contractors as part of mandatory regular training on Our Code. Our Compliance function also regularly communicates and engages with identified higher-risk roles and provides additional risk-based anti-corruption training for employees, contractors and employees of some of our business partners and community partners. In FY2024, we revised our anti-corruption electronic learning module to incorporate new scenarios designed to reinforce understanding and support learning. The new e-learning module is expected to be made available in early FY2025.
>For more information on ethics and business conduct refer to bhp.com/ethics
Transparency and accountability
We support initiatives by governments of the countries where we operate to publicly disclose the content of our licences or contracts for the development and production of minerals that form the basis of our payments to government, as outlined in the Extractive Industries Transparency Initiative (EITI) Standard.
Other initiatives include our work with Transparency International chapters, representation on the Board of the EITI, financial support for and Steering Committee membership of the Bribery Prevention Network (in Australia) and funding of the BHP Foundation, including its Natural Resource Governance Global Program.
We believe knowing who ultimately controls and benefits from a company helps to reduce risk and strengthen accountability. In FY2024, we continued our active and public support for ultimate beneficial ownership transparency. We maintained information on how we use beneficial ownership information as part of our anti-corruption due diligence on investments, partners, contractors and suppliers. We also continued to make clear via published statements, including in Our Code and web content, that we do not partner or contract with entities that are assessed as presenting a high corruption risk that decline to provide beneficial ownership information as part of our due diligence process. In parallel with these steps, we continued to publish our list of entities in which BHP Group Limited’s effective interest is 100 per cent and certain entities in which BHP Group Limited’s effective interest is less than 100 per cent, including all controlled subsidiaries operating in the mining sectors, all mining operations joint ventures generating material revenue for BHP (and available information in relation to the other legal owners in these joint ventures) and entities in which we hold a partial interest (with some exclusions – refer to bhp.com/sustainability/ethics-business-conduct).
These efforts are complementary to the BHP Foundation’s partnership with EITI and Open Ownership to support governments to transform the availability and use of beneficial ownership data for effective governance in the extractive sector.
6.9 Climate change
We believe the warming of the climate is unequivocal, human influence is clear and physical climate-related impacts are unavoidable. We recognise the role we play in supporting the net zero transition the world must make.
>For our full position on climate change refer to bhp.com/climate
Climate-related governance
Climate change and climate transition planning is a material governance and strategic issue for our Board and management. Additional details concerning our climate-related governance for FY2024 have been made in our Climate Transition Action Plan (CTAP 2024).
Our CTAP 2024 was approved by the Board, with its development and ongoing implementation governed by the Board and its Committees and management.
>Our Board, Committees and management structure and roles as they apply to climate-related matters, the skills and experience of the Board and management and remuneration incentives for management are disclosed in Enabling delivery – Our governance on page 50 and Enabling delivery – Our management, remuneration and organisational capability on page 51 of our CTAP 2024 available at bhp.com/CTAP2024
>For information on the role and composition of the Board and its Committees and each Committee’s key activities in FY2024, including in relation to climate-related matters, as well as the Board skills matrix, the process for Board evaluation and director training, induction and development, refer to our Corporate Governance Statement 3, 4 and 5 on pages 122-135, later in this Report
Our disclosures and approach to reporting
Climate Transition Action Plan
In August 2024, we published our second Climate Transition Action Plan, which sets out our strategic approach and plans for achieving our operational and value chain greenhouse gas (GHG) emissions targets and goals, as well as our response to climate-related risks (threats and opportunities). This follows on from our first CTAP, which we published in CY2021.
55
Table of Contents
Our CTAP 2024 is primarily a forward-looking plan and set of actions, while this Report discloses in:
| • | This OFR 6.9: Progress in FY2024 against our climate change strategy, GHG emissions targets and goals, commitments and key metrics |
| • | Governance: An overview of governance structures, activities and remuneration incentives, including those that relate to our climate change strategy (additional detail concerning our governance around climate-related risks is set out in in our CTAP 2024) |
| • | Financial Statements: Potential financial statement impacts, where material or relevant, of the assumptions, plans and actions of our climate change strategy and the consideration of climate-related risks in the assessment of significant areas of judgement and estimation required for the presentation of the financial statements |
>Our CTAP 2024 is available at bhp.com/CTAP2024
Given the global nature of our business, customers and supply chain, the development of our CTAP 2024 considered the goals of the Paris Agreement and the commitments and policy settings of relevant key jurisdictions at this time. Our global headquarters are located in Australia, which has a Long-Term Emissions Reduction Plan and legislated national targets to reduce Australia’s net GHG emissions to 43 per cent below CY2005 levels by CY2030, and to achieve net zero GHG emissions by CY2050.
We continue to monitor and take into consideration the evolving policy and regulatory landscape applicable to our operations as part of the periodic review by management and the Board of the appropriateness of and our progress towards our GHG emissions targets and goals.
Navigating our disclosures
| Our response | ||||||||
| TCFD recommended disclosures | This Report: Operating and Financial Review | This Report: Governance | This Report: Statements | Climate Transition Action Plan 2024 | ||||
Governance: Disclose the organisation’s governance around climate-related risks and opportunities. | ||||||||
a) Describe the board’s oversight of climate-related risks and opportunities | Page 55 | Pages 121 to 142 | – | Page 50 | ||||
| ||||||||
b) Describe management’s role in assessing and managing climate-related risks and opportunities | – | Pages 135 to 142 | – | Page 51 | ||||
| ||||||||
Strategy: Disclose the actual and potential impacts of climate-related risks and opportunities on the organisation’s businesses, strategy, and financial planning where such information is material. | ||||||||
| ||||||||
a) Describe the climate-related risks and opportunities the organisation has identified over the short, medium, and long term | Pages 59 to 62 Pages 87 to 98 | – | Pages F-42 to F-46 | Pages 10 to 30 Page 52 | ||||
| ||||||||
b) Describe the impact of climate-related risks and opportunities on the organisation’s businesses, strategy, and financial planning | Pages 55 to 69 Pages 87 to 98 | – | Pages F-42 to F-46 | Pages 10 to 54 | ||||
| ||||||||
c) Describe the resilience of the organisation’s strategy, taking into consideration different climate-related scenarios, including a 2°C or lower scenario | Pages 60 to 62 | – | Pages F-42 to F-46 | Pages 31 to 38 Pages 42 to 45 Pages 61 and | ||||
| ||||||||
Risk Management: Disclose how the organisation identifies, assesses, and manages climate-related risks. | ||||||||
| ||||||||
a) Describe the organisation’s processes for identifying and assessing climate-related risks | Pages 58 and 59 Pages 85 to 87 | – | – | Page 52 | ||||
| ||||||||
b) Describe the organisation’s processes for managing climate-related risks | Pages 59 to 62 Pages 85 to 87 | – | – | Page 52 | ||||
| ||||||||
c) Describe how processes for identifying, assessing, and managing climate-related risks are integrated into the organisation’s overall risk management | Pages 85 to 87 | – | – | Page 52 | ||||
| ||||||||
Metrics and Targets: Disclose the metrics and targets used to assess and manage relevant climate-related risks and opportunities where such information is material. | ||||||||
| ||||||||
a) Disclose the metrics used by the organisation to assess climate-related risks and opportunities in line with its strategy and risk management process | – | Pages 148 to 162 | – | Page 51 | ||||
| ||||||||
b) Disclose Scope 1, Scope 2, and, if appropriate, Scope 3 GHG emissions, and the related risks | – | – | – | Pages 10 to 30 | ||||
| ||||||||
c) Describe the targets used by the organisation to manage climate-related risks and opportunities and performance against targets | – | – | – | Pages 10 to 30 Pages 57 to 60 | ||||
| ||||||||
56
Table of Contents
Operational GHG emissions (Scopes 1 and 2 emissions from
| Value chain GHG emissions (Scope 3 emissions) – Overall
| |
Medium-term target: Reduce operational GHG emissions (Scopes 1 and 2 emissions from our operated assets) by at least 30 per cent by FY2030 from an FY2020 baseline.
Long-term net zero goal: Achieve net zero operational GHG emissions (Scopes 1 and 2 emissions from our operated assets) by CY2050.
| Long-term net zero goal: We have a long-term goal of net zero Scope 3 GHG emissions by CY2050. Achievement of this goal is uncertain, particularly given the challenges of a net zero pathway for our customers in steelmaking, and we cannot ensure the outcome alone. | |
>For more information on the essential definitions, assumptions, GHG emissions boundaries, measurement approach and adjustments for this medium-term target and these long-term net zero goals, including the potential use of offsetting, refer to Climate-related metrics, targets and goals on pages 52 to 59, in the BHP Annual Report 2024
| ||
TCFD-consistent disclosures
In accordance with the UK Listing Rules as set by the UK Financial Conduct Authority, we believe our disclosures are consistent with the four recommendations and 11 recommended disclosures of the Task Force on Climate-related Financial Disclosures (TCFD).
The ‘Navigating our disclosures’ table on the previous page sets out the TCFD’s recommended disclosures, grouped under the four recommendations and where our aligned disclosures can be found within this Report and our CTAP 2024.
Because our CTAP 2024 is our primary publication this year for disclosing significant detail on our climate change plan for the climate transition and our climate change strategy, we have included certain TCFD-recommended disclosures in our CTAP 2024 to enable them to be read in that broader context. We do not repeat them in this Report to avoid duplication. TCFD recommended disclosures for FY2024 that have been published in our CTAP 2024 are:
| • | TCFD Strategy recommended disclosures (a) and (b): Our detailed strategy and areas of focus for reducing operational GHG emissions (Scopes 1 and 2 emissions from our operated assets), including our industry collaboration and our material sources of operational GHG emissions (i.e. electricity, diesel and fugitive methane emissions). |
>These disclosures have been published in Operational GHG emissions on pages 10 to 18 in our CTAP 2024 available at bhp.com/CTAP2024
| • | TCFD Strategy recommended disclosures (a) and (b): Our detailed strategy for supporting the reduction of value chain GHG emissions (Scope 3 emissions). |
>These disclosures have been published in Value chain GHG emissions on pages 19 to 30 in our CTAP 2024 available at bhp.com/CTAP2024
| • | TCFD Strategy recommended disclosure (b) and (c): Detailed information on our strategy for our commodity and asset portfolio, as well as the resilience of our strategy and portfolio in our 1.5°C scenario |
>These disclosures have been published in Portfolio on pages 31 to 38, Additional information – Our 1.5°C scenario assumptions and the signposts we monitor on page 61 and Additional information – Our 1.5°C scenario compared to benchmarks on page 62 in our CTAP 2024 available at bhp.com/CTAP2024
| • | TCFD Governance recommended disclosures (a) and (b): Detailed information on our Board, Committees and management structure and roles as they apply to climate-related matters, the skills and experience of Board and management. |
| • | TCFD Metrics and Targets recommended disclosure (a): The climate-related remuneration incentives for management, separate to the Remuneration Report in this Report. |
>These disclosures have been published in Enabling delivery – Our governance on page 50 and Enabling delivery – Our management, remuneration and organisational capability on page 51 in our CTAP 2024 available at bhp.com/CTAP2024
>For more information on our alignment with other sustainability and ESG standards, including the Climate Action 100+ Net Zero Company Benchmark and GHG Protocol series of standards, refer to our BHP ESG Standards and Databook 2024 available at bhp.com/climate
Capital allocation
Capital allocation towards operational GHG emissions reduction initiatives is considered as part of the maintenance capital category within our Capital Allocation Framework. For FY2024, our capital (incremental) and operating expenditure on initiatives associated with operational GHG emission reductions was US$61 million.
>For more information on actual and planned expenditure to support operational GHG emission reductions refer to Financial Statements note 16 ‘Climate change’ on pages F-42 to F-46 in this Report
57
Table of Contents
Value chain GHG emissions (Scope 3 emissions) – Steelmaking
| Value chain GHG emissions (Scope 3 emissions) – Direct suppliers
| |
Medium-term goal: Support industry to develop steel production technology capable of 30 per cent lower GHG emissions intensity relative to conventional blast furnace steelmaking, with widespread adoption expected post-CY2030.
| Long-term net zero target: Achieve net zero by CY2050 for the operational GHG emissions (Scopes 1 and 2 emissions) of our direct suppliers. | |
We have revised the language used in our medium-term goal for steelmaking to provide greater clarity and to reflect the range of steelmaking process routes that now form part of our strategy. This is due to technology advances as well as the evolution of our strategy.
>For more information on how and why we revised the language used in our medium-term goal, refer to Value chain GHG emissions – Steelmaking: Our Scope 3 emissions goal to support capability for GHG emissions intensity reduction on pages 24 and 25 of our CTAP 2024 available at bhp.com/CTAP2024
>For more information on the essential definitions, assumptions, GHG emissions boundaries, measurement approach and adjustments for these medium-term goals, including the potential use of offsetting, refer to Climate-related metrics, targets and goals on pages 52 to 59, in the BHP Annual Report 2024
| ||
Value chain GHG emissions (Scope 3 emissions) – Shipping
| Value chain GHG emissions (Scope 3 emissions) – Shipping
| |
Medium-term goal: Support 40 per cent GHG emissions intensity reduction of BHP-chartered shipping of BHP products by CY2030, from a CY2008 baseline. | Long-term net zero target: Achieve net zero by CY2050 for the GHG emissions from all shipping of BHP products.
| |
>For more information on the essential definitions, assumptions, GHG emissions boundaries, measurement approach and adjustments for this medium-term goal and this long-term net zero target, including the potential use of offsetting, refer to Climate-related metrics, targets and goals on pages 52 to 59, in the BHP Annual Report 2024
| ||
Climate-related risk management
How we identify and manage climate-related risk
At BHP, we take an enterprise approach to risk management and operate under one Risk Framework for all risks, including climate-related risks (threats and opportunities). Our Risk Framework requires the identification and management of risks to be embedded in business activities and provides requirements and guidance on the tools and processes to manage current and emerging risks. Our mandatory minimum performance requirements for risk management and the Climate Change Global Standard set the minimum requirements to manage climate-related risks and apply across our operated assets and functions, and to decision-making processes for sales, marketing and procurement.
To support the identification and management of climate-related risks at BHP, we monitor and interpret external signals, events and trends associated with transition risk and physical climate-related risk, which may include existing and emerging scientific, policy, legal and regulatory, reputational, and market developments.
Risk owners of climate-related risks must assess physical and transition climate-related risks, considering potential impacts, including to safety, productivity and cost across operated assets, value chains, infrastructure and services, and host communities.
The Climate Change Global Standard also sets mandatory minimum requirements for assessing physical climate-related risks (refer to Physical climate-related risks and adaptation in this OFR 6.9, for our progress to date), as well as for asset-level climate change plans and the value chain climate adaptation plan owned by our Commercial function. A number of these assessments and plans are still underway, and they are also regularly reviewed and revised to ensure continued relevance.
When assessing the materiality of climate-related risks (as for all risks identified through our Risk Framework), we consider the likelihood (by reference to timeframes) and severity of potential impacts (including to health and safety, the environment, communities, human rights and social value) by estimating the maximum foreseeable loss (MFL) if that risk were to materialise. The MFL is the estimated impact to BHP in a worst-case scenario without regard to probability and assuming all controls are ineffective. This supports us to prioritise and understand the significance of climate-related risks in relation to other risks.
>For more information on how we manage risk (including climate-related risk) and our risk factors refer to OFR 8 on pages 87 to 98 in this Report
We recognise a changing climate can influence or exacerbate risks across our risk profile, including those associated with asset integrity, pricing of inputs, access to markets, changes to regulation and access to funding. Decisions on the prioritisation of actions to manage climate-related threats or pursue climate-related opportunities are made consistent with our standard risk management, planning and investment processes applicable to all risks identified under our Risk Framework. Using a consistent approach allows us to consider climate-related risks across our business to focus our actions on those that are material and integrate management of them into our core activities and business plans. We continue to embed climate-related risk across our risk profile and to improve the controls required to manage threats or enhance opportunities. We also continue to review our climate-related risk profile periodically, seeking to identify, assess and manage new or evolving climate-related risks.
58
Table of Contents
Climate-related risks
In setting and monitoring the delivery of our strategy, we consider identified climate-related risks (threats and opportunities), both physical and transition (as applicable and to the extent their potential impacts are sufficiently understood) across the following time horizons:
| • | short-term (zero to two years), aligning with our two-year budget process |
| • | medium-term (two to five years), defining supportive actions and initiatives that sit outside of our two-year budget process in order to support our long-term strategy |
| • | long-term (five to 30 years, or longer in certain cases), given our supply, demand and pricing forecasts and our scenarios for portfolio analysis extend to CY2050 and in some cases beyond |
Climate-related risks are broadly categorised as:
| • | Transition risks, which arise from existing and emerging policy, regulatory, legal, technological, market and other societal responses to the challenges posed by climate change and the transition to a net zero economy |
>For detailed disclosures on the management of transition risks refer to Transition to a net zero economy on page 60 in this OFR 6.9, and in Portfolio on pages 31 to 38 in our CTAP available at bhp.com/CTAP2024
| • | Physical risks, which refer to acute risks that are event-driven (including increased severity and frequency of extreme weather events) and chronic risks resulting from longer-term changes in climate patterns |
>For detailed disclosures about the studies we are undertaking to assess our exposure to physical climate-related risks refer to Physical climate-related risks and adaptation on page 61 in this OFR 6.9
Relevant BHP Group risk factors | Climate-related risk | Potential influence of climate-related issues on BHP Group risk factors over time1 | ||||||||||||
| Short-term (0 to 2 years) | Medium-term (2 to 5 years) | Long-term (5 to at least 30 years) | ||||||||||||
Transition risk | ||||||||||||||
| Operational events | • Technological solutions to reduce GHG emissions | Low | Low to medium | High | ||||||||||
| Significant social or environmental impacts | • Engaging in or association with activities with actual or perceived adverse climate-related impacts • Failure to meet evolving stakeholder expectations • Political, regulatory or judicial developments | Low | Low to medium | High | ||||||||||
| Low-carbon transition | • Low to zero GHG emission technologies or changes in customer preferences altering demand for our products • Perceptions of climate-related financial risk reducing access to capital and/or insurance for BHP or our customers or suppliers • Reputational damage and litigation • Adverse market, legal or regulatory responses | Low | Low | High | ||||||||||
| Adopting technologies and maintaining digital security | • Technological solutions to reduce GHG emissions | Low | Low | High | ||||||||||
| Optimising growth and portfolio returns | • Failure to achieve expected commercial objectives due to climate-related impacts | Low | Low | High | ||||||||||
| Accessing key markets | • Legal or regulatory changes, with respect to carbon-intensive industries and exports | Low | Low | High | ||||||||||
| Inadequate business resilience | • Geopolitical, global economic, regional or local developments or adverse events | Low | Low | High | ||||||||||
| Physical risk | ||||||||||||||
| Operational events | • Extreme weather and other climate-related events that may impact production | Low | Low | Medium | ||||||||||
| Significant social or environmental impacts | • Failure to adequately identify or to appropriately manage physical climate-related risks | Low | Low to medium | Medium | ||||||||||
| Inadequate business resilience | • Acute and chronic physical climate-related impacts, event-driven and longer-term changes in climate patterns | Low | Low | Medium | ||||||||||
Climate change and climate-related risks have the potential to influence or exacerbate risks across our operations and functions and are required to be considered and, where applicable, integrated in accordance with our Risk Framework into our asset risk profiles to be managed across each of these time horizons (see the table above). The linkage of these time horizons to our planning processes and activities and strategy formation informs our decision-making and enables us to take appropriate and timely risk management actions.
Footnote
| 1 | The estimated potential (i) change to the level of influence of relevant climate-related issues and their associated risk factors on BHP’s existing risk exposure and/or (ii) degree to which they may exacerbate existing risks within our risk profile, based on currently available information and noting that some assessments are preliminary and/or incomplete (particularly in relation to physical climate-related risk) and may change significantly. |
59
Table of Contents
>For more information on BHP’s Risk Framework, how we manage climate-related risks and the potential impact to BHP operations refer to OFR 8 on pages 87 to 98 in this Report
Transition to a net zero economy
Our portfolio’s resilience
We continue to seek to maximise our exposure to products that enable and support decarbonisation and electrification, urbanisation and a growing population, and to minimise the risk that capital may be stranded in a rapidly decarbonising world. To support this outcome, we consider a range of inputs, including our 1.5°C scenario, when testing the resilience of our portfolio and making investment decisions.
Our CTAP 2024 analyses our portfolio’s resilience in our new 1.5°C scenario and describes key input assumptions, analytical methods, outputs and sensitivities we used in or derived from this scenario.
We use our planning range (our long-term forecast of demand, supply and price across our commodities) for operational planning. It is comprised of three unique, independent planning cases: a ‘most likely’ base case, and an upside case and downside case that provide the range’s boundaries. These three cases reflect proprietary forecasts for the global economy and associated sub-sectors (i.e. energy, transport, agriculture, steel) and the resulting market outlook for our core commodities. The assessments of future states are not explicitly climate scenarios designed to test the resilience of our portfolio to different global climate action trajectories. However, in all three future state estimates, while the global gross domestic product assumptions and pace and drivers of decarbonisation policy and technology diffusion vary, most developed economies reach net zero around CY2050, with other developing economies reaching net zero in CY2060 and CY2070. The modelled output of our planning range results in global CO2 emission pathways implying a projected global temperature increase of around 2°C by CY2100.
Our planning range’s demand, supply and price forecasts for key commodities are used to inform data inputs into our operational modelling and drive operational planning. Our planning range is also used for strategy formation and investment decisions.
We use our 1.5°C scenario to derive commodity price sensitivities to assess potential impacts on portfolio value compared with our base case valuations using our planning range. Our modelling indicates our portfolio remains resilient under our 1.5°C scenario. The value of our copper, potash and nickel assets increases relative to the base case of our planning range, and offsets the effect to our portfolio from some downside risk to steelmaking coal. The net present value of our portfolio under our 1.5°C scenario is approximately the same as under the current base case of our planning range, indicating we would be resilient in an accelerated transition to a 1.5°C outcome. Western Australia Nickel’s temporary suspension (see below) has not altered our scenario analysis, which includes nickel in our portfolio.
As described elsewhere in this Report, as well as in our CTAP 2024, we continue to reposition our portfolio towards commodities that can enable and support megatrends, such as global decarbonisation and electrification. Our actions to enable and support include BMA’s divestment of the Blackwater and Daunia mines as a further step to concentrate our coal portfolio on the higher-quality (grade) coals increasingly preferred by steelmaking customers and the acquisition of OZ Minerals in FY2023 to support the creation of a South Australia copper basin. We expect such actions to further enhance the overall resilience of our portfolio over time.
In July 2024, we announced our Nickel West operations and West Musgrave project (Western Australia Nickel) would be temporarily suspended from October 2024. Over the longer term, our 1.5°C scenario and the base case of our planning range see nickel demand growing in response to the transition. However, the decision to temporarily suspend operations follows oversupply in the global nickel market. At the time of our announcement, forward consensus nickel prices over the next half of the decade had fallen sharply reflecting strong growth of alternative low-cost nickel supply.
>For more analysis of our portfolio’s resilience in our new 1.5°C scenario and more information about the three planning cases in our planning range and their use refer to Portfolio on pages 31 to 38 of our CTAP 2024, available at bhp.com/CTAP2024
>For key assumptions and metrics for our new 1.5°C scenario and a comparison with other 1.5°C scenarios refer to Additional information – Our 1.5°C scenario assumptions and the signposts we monitor on page 61 and Additional information – Our 1.5°C scenario compared to benchmarks on page 62 of our CTAP 2024 available at bhp.com/CTAP2024
>For disclosures related to potential financial statement impacts in our new 1.5°C scenario refer to Financial Statements note 16 ‘Climate change’ on pages F-42 to F-46 in this Report
Impact on our business, strategy and capital alignment and allocation
The final (or sufficiently resolved) results of our climate-related risk assessments across our short-, medium- and long-term time horizons (as described on page 58 to 59), as well as our 1.5°C scenario, are considered and integrated into our strategy and as a sensitivity in our capital allocation processes. This enables us to test the extent to which our business and capital allocation are aligned with a rapidly decarbonising global economy.
We are undertaking our studies of physical climate-related risks to progressively identify, assess and quantify the potential future impacts to site operations, productivity and estimated cost for our operated assets. Once the results of the risk quantification studies for our operated assets are completed, we propose to use the results to inform updates to our risk profile, including new risk management activities, inform corporate planning, identify areas where we should focus our assessment of new or strengthened controls or adaptation responses, and assess the financial and social value of adaptation measures.
>For an overview of how climate-related issues have impacted our operational activities and our approach with respect to our value chain refer to Operational GHG emissions (Scopes 1 and 2 emissions from our operated assets) on pages 57 and Value chain GHG emissions (Scope 3 emissions) on pages 58 in this OFR 6.9
60
Table of Contents
>For more information on potential financial statement impacts due to climate-related risks, refer to Financial Statements note 16 ‘Climate change’ on pages F-42 to F-46 in this Report
> For more information on the studies we are undertaking to assess our exposure to physical climate-related risks refer to Physical climate-related risk and adaptation on page 51 in the BHP Annual Report 2024
>For more information on our commodity production, revenue and expenditure refer to Climate-related metrics, targets and goals on pages 52 to 59 in the BHP Annual Report 2024
Carbon pricing
We embed carbon prices within our planning range and planning cases that inform asset planning, asset valuations and operational decision-making, including the prioritisation of operational GHG emission reduction projects.
>For our qualitative and quantitative disclosures related to carbon pricing refer to Financial Statements note 16 ‘Climate change’ on pages F-42 to F-46 in this Report
Equitable change and transition
We seek meaningful, long-term, mutually beneficial relationships that respect local cultures. We aim to support the development of diversified and resilient local communities and economies that contribute to wellbeing that continues beyond the life of our operated assets.
>For information on the work we are undertaking to leave a positive legacy from our mining in the Hunter Valley as we move towards the planned closure of Mt Arthur Coal refer to Equitable change and transition on pages 46 to 48 of our CTAP 2024 available at bhp.com/CTAP2024
Climate policy advocacy
We believe governments around the world should adopt and progress policies aligned with the goals of the Paris Agreement to limit the increase in the global average temperature by CY2100 to well below 2°C above pre-industrial levels and pursue efforts to limit the increase to 1.5°C. We commit to conducting our climate policy advocacy consistent with these goals in our direct advocacy and our indirect advocacy. Our Climate Policy Principles show how we intend this commitment to be translated into action.
>Our Climate Policy Principles, the approach we take to our direct and indirect advocacy, and our latest advocacy disclosures are available at bhp.com/sustainability/climate-change/advocacy-on-climate-policy and bhp.com/about/operating-ethically/industry-associations
>For more information on our policy advocacy refer to Climate policy advocacy on pages 39 to 41 of our CTAP 2024 available at bhp.com/CTAP2024
Physical climate-related risks and adaptation
A changing climate can exacerbate and create physical climate-related risks, which include:
| • | Acute physical climate-related risks: Extreme climatic events, such as floods, cyclones and heatwaves, that may be more severe or more frequent because of a changing climate |
| • | Chronic physical climate-related risks: The incremental worsening of conditions, such as the gradual increase in the number of extreme heat days over the years, or rising sea levels |
The mining sector is exposed to both acute and chronic physical climate-related risks because of its remote outdoor operations with labour and physical capital exposed to the elements, and because of its dependency on global value chains. The long lives of mining assets mean they could encounter deteriorating conditions in later decades. Geographically dispersed sites and value chains increase the diversity of physical climate-related impacts we could encounter.
We are undertaking studies to assess our exposure to physical climate-related risks that draw on science-based climate data. We are working to complete these studies and continue verification and review of results in FY2025. Our approach to evaluating our operational physical climate-related risks is illustrated in the ‘Our approach to physical climate-related risk’ diagram.
61
Table of Contents
Our approach to physical climate-related risk
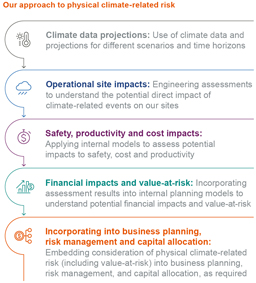
Climate modelling
We commissioned WTW (one of our insurance advisors) to develop a climate dataset covering our operated assets and some key value chain locations, to develop a more holistic understanding of the potential parameters of our physical climate-related risk exposure and how it may change over time.
This climate dataset is based on the publicly available Shared Socioeconomic Pathways (SSP) scenarios used by the Intergovernmental Panel on Climate Change, and includes latest generation (Coupled Model Intercomparison Project Phase 6 (CMIP6)) and CMIP5 climate models, applied to our operated assets. The dataset covers more than 20 climate-related hazards potentially relevant to our global operations, such as average temperature, extreme precipitation, and cyclones, which can represent physical climate-related risks. Alongside this we apply local observational climate data and other sources of climate projections. This approach allows us to develop a localised view of potential impacts, including changes in rainfall patterns, average and maximum temperatures and sea level rise.
The climate dataset includes a baseline (CY2001 to CY2020) and projections for three future time horizons (CY2026 to CY2045, CY2046 to CY2065, CY2066 to CY2085) for the following Intergovernmental Panel on Climate Change SSP-based GHG emission scenarios:1
| • | Low-case: Estimated average global temperature increase of 1.8°C by CY2100 (SSP1-2.6) |
| • | Mid-case: Estimated average global temperature increase of 2.7°C by CY2100 (SSP2-4.5) |
| • | High-case: Estimated average global temperature increase of 4.4°C by CY2100 (SSP5-8.5) |
The table ‘Potential physical climate-related risks at our operated assets and in their value chains’ on this page shows the physical climate-related risks that our studies to date indicate could have potential impact for our operated assets (including via impacts in our value chain). The first stage of our analysis looks at our operated assets that are currently producing (excluding NSWEC and former OZ Minerals sites) and our Jansen potash project. We plan to include currently producing former OZ Minerals sites and to expand and adapt our approach to incorporate our legacy assets and NSWEC in FY2025.
Footnote
| 1. | Table SPM.1, Summary for Policymakers. In: Climate Change 2021: The Physical Science Basis. Contribution of Working Group I to the Sixth Assessment Report of the Intergovernmental Panel on Climate Change. IPCC, CY2021 |
| Potential physical climate-related risks at our operated assets and in their value chains | ||
| Climate hazard | Potential operational site impacts | |
| ||
| Extreme precipitation and/or flooding | Inundation of mines and/or key production infrastructure | |
| ||
| Disruption and/or damage to water supply infrastructure | ||
| ||
| Exacerbation of tailings storage facility failure risk | ||
| ||
| Coastal hazards (including higher sea levels, cyclones, storm surge and changes in marine ecosystems) | Disruption and/or damage to port and coastal infrastructure and operations | |
| ||
| Extreme temperatures | Disruption and/or damage to electrical infrastructure | |
| ||
| Changes in rainfall, temperature and/or evaporation patterns | Water shortages for operational activities | |
| ||
| Workforce health and safety incidents | ||
| ||
| Extreme weather events (including extreme heat, extreme precipitation and/or flooding, cyclones) | Disruption in the supply of critical production inputs, and access to supply chain infrastructure | |
| ||
62
Table of Contents
>For more information on our approach to physical climate-related risk quantification studies, existing risk controls and potential adaptation responses refer to Physical risk and adaptation on pages 42 to 45 of our CTAP 2024 available at bhp.com/CTAP2024
>For more information on how physical climate-related risk has been considered in asset carrying values refer to Financial Statements note 16 ‘Climate change’ on pages F-42 to F-46 in this Report
The role of our commodities in the transition
We continue to engage with investors, industry and standard setters to explore ways of establishing clear methodologies for classification and measurement of ‘green revenue’1 and associated capital expenditure within the resources sector. We note that, at present, there are still divergent and evolving views globally on what constitutes green revenue, with no clear definition or expectations for other sustainability indicators for the resources sector.
Traceability of end use for many commodities, such as copper and nickel, remains a challenge as they undergo multiple stages of processing and have a diverse range of end uses. Given this continued uncertainty, we have presented multiple classifications of certain of our commodities to reflect a view on their actual or potential contribution to the transition to a net zero economy.
The classification we have given to our commodities (described in the table below) is intended to be an indicative approach pending clear and resolved methodologies for identifying key transition materials that contribute to the transition to a net zero economy and the calculation of the revenues they generate. We also acknowledge the classification focuses on the theme of enabling the transition to a net zero economy to mitigate climate change, and broader sustainability indicators in relation to how these commodities are produced are also important to consider.
| Classification | Definition | Commodities | ||||
| ||||||
| Climate Action 100+ Net Zero Standard for Diversified Mining, September 2023 | Key transition materials | Copper, nickel | ||||
| ||||||
| FTSE Russell’s Green Revenues Classification System, v1.1, January 2024 | Key raw minerals and metals | Uranium | ||||
| ||||||
| BHP | Future-facing commodities2 | Copper, nickel, potash | ||||
| ||||||
We believe steelmaking materials like iron ore and steelmaking coal also have an important role to play in the global transition to net zero. We expect the blast furnace with carbon capture, utilisation and storage (CCUS) to be an important part of the journey towards the end-state objective of widespread near zero emission steel, and it requires higher-quality steelmaking coal as an input. External analysis, such as the International Energy Agency’s net zero by 2050 scenario,3 supports this view.
>Our view on steelmaking materials and their role in the transition to net zero is described in Portfolio - Steelmaking, iron ore and steelmaking coal in our 1.5°C scenario on pages 37 and 38 of our CTAP 2024 available at bhp.com/CTAP2024
Footnotes
| 1. | ‘Green revenue’ is a label referenced externally, including by standard setters and in investor-led benchmarks, which is intended as a measure of the extent to which products and services contribute to the transition to a net zero, resource efficient and socially inclusive economy. For more information refer to unep.org/regions/asia-and-pacific/regional-initiatives/supporting-resource-efficiency/green-economy |
| 2. | Commodities that we determine to be positively leveraged in the energy transition and broader global response to climate change, with potential for decades-long demand growth to support emerging mega-trends like electrification and decarbonisation. |
| 3. | International Energy Agency’s World Energy Outlook 2023, iea.org/reports/world-energy-outlook-2023 |
63
Table of Contents
Operational GHG emissions (Scopes 1 and 2 emissions from our operated assets) medium-term target and long-term net zero goal definitions, assumptions, adjustments and additional key details
| Medium-term target | Long-term net zero goal | |||
| Description | Reduce operational GHG emissions by at least 30 per cent from FY2020 levels by FY2030 | Achieve net zero operational GHG emissions by CY2050 | ||
| ||||
| Baseline year or reference year and period | Baseline year: FY2020 Period: FY2020 to FY2030 | Reference year: FY2020. FY2020 is used as a reference year to track progress towards our goal, but is not a baseline year for achieving our goal. Period: FY2020 to CY2050 | ||
| ||||
| Type and reduction | Type: Absolute Reduction: Gross; At least 30 per cent | Type: Absolute Reduction: Net; 100 per cent (where we currently estimate up to around an 85 per cent gross operational GHG emissions reduction against FY2020 levels by CY2050 without the use of carbon credits for offsetting) | ||
| ||||
| Boundary | Inventory boundary: Scopes 1 and 2 emissions: Operational control | |||
| ||||
| Exclusions | Non-operated assets and equity investments (included in our value chain GHG emissions (Scope 3 emissions) long-term net zero goal) | |||
| ||||
| GHGs included | CO2, CH4, N2O, HFC, PFC, SF6 | |||
| ||||
| Offsetting | Our plan is to achieve our medium-term target through structural GHG emissions abatement instead of offsetting our operational GHG emissions. We will not use regulatory carbon credits (i.e. those used for compliance under regulatory schemes such as Australia’s Safeguard Mechanism) to meet our target. In our projected pathway, we have not planned to use voluntary carbon credits to meet our medium-term target, but if there is an unanticipated shortfall in our pathway, we may use voluntary carbon credits that meet our integrity standards to close the performance gap. | Planned, to close the performance gap beyond our current estimate of up to around an 85 per cent gross operational GHG emissions reduction against FY2020 levels by CY2050 without the use of carbon credits for offsetting. | ||
| ||||
| Measurement approach | Scope 1 emissions are calculated using emission factors and methodologies required under mandatory local regulatory programs where BHP operates, including the National Greenhouse Energy and Reporting (NGER) scheme for Australian operations, Green Tax legislation (referencing Intergovernmental Panel on Climate Change (IPCC) emission factors) for Chilean operations and Canadian Greenhouse Gas Reporting Program (referencing IPCC emission factors) for our Jansen potash project. In the absence of mandatory local regulatory programs, the Australian NGER scheme emission factors and methodology is used. Scope 2 emissions are calculated using the market-based method using electricity emission factors sourced directly from the supplier where available, as evidenced by Renewable Energy Certificates and/or supplier-provided documentation. Where supplier-specific emission factors are not available, a default location-based emission factor for electricity, as published in local regulations or industry frameworks, is used. | |||
| ||||
64
Table of Contents
| Key adjustments made to baseline year or reference year and subsequent data | Baseline year (for our target) and reference year (for our goal) and performance data have been adjusted for divestment of our interest in BMC (completed on 3 May 2022), divestment of our Petroleum business (merger with Woodside completed on 1 June 2022), BMA’s divestment of the Blackwater and Daunia mines (completed on 2 April 2024), our acquisition of OZ Minerals (completed on 2 May 2023) and for methodology changes (use of IPCC Assessment Report 5 (AR5) Global Warming Potentials and the transition to a facility-specific GHG emission calculation methodology for fugitives at Caval Ridge and Saraji South). | |||
| ||||
| Performance, adjusted | FY2020: 13.6 MtCO2-e | FY2021: 13.8 MtCO2-e | FY2022: 10.2 MtCO2-e | FY2023: 9.1 MtCO2-e | FY2024: 9.2 MtCO2-e | |||
| ||||
| Target or goal setting method | Our target is measured on a cumulative GHG emission basis against an overall carbon budget. The target percentage reduction was established in FY2020 by applying the same rate of reduction to BHP’s GHG emissions as the rate at which the world’s GHG emissions would have to contract in order to meet the Paris Agreement goal to hold global average temperature increase to well below 2°C above pre-industrial levels (known as the ‘absolute contraction method’). | Our goal was developed with the ambition to achieve net zero for our operational GHG emissions by CY2050. Our progress against this goal will be measured on an absolute basis. | ||
| ||||
| Target or goal derived using a sectoral decarbonisation approach | No, our target was derived using the absolute contraction method specified earlier. At the time of setting the target, there were no mining sector-specific pathways for jurisdictions where we operate. | No, however our goal is consistent with the global net zero ambition. | ||
| ||||
| Process for reviewing the setting of the target or goal | The Board approves BHP’s significant social, community and sustainability policies (upon recommendation from the Nomination and Governance Committee), including those related to climate change and climate transition planning, public sustainability goals and targets (including for GHG emission reductions). We review our GHG emissions targets and goals as part of the periodic development of an updated CTAP, or more frequently if required. | |||
| ||||
| Process for monitoring progress towards the target or goal | Monitored on an annual basis through our business planning processes, which forecast operational GHG emissions and identify planned, proposed or potential GHG emission reduction projects out to CY2050. As part of this process, an internal GHG emissions target is set for the relevant financial year and monitored through our annual reporting processes, with progress reviewed by management and the Board as part of publication of our annual reporting disclosures. Our target is also monitored on a six-monthly basis through our social value scorecard framework, with progress reviewed by management and the Board as part of publication of our half-year results (as well as annual reporting disclosures), or more frequently if required. | |||
| ||||
| Third-party validation of our target or goal | No, but we obtain reasonable assurance over our externally reported performance against our target and goal. | |||
| ||||
| Carbon budget for target or goal period | 126.9 MtCO2-e (FY2020 to FY2030). This reflects a linear reduction between our baseline year and the target year. In the interim years before FY2030, we periodically refer to our carbon budget to assess our cumulative GHG emissions against our carbon budget to FY2030. This enables us to determine if we are on track to achieve our medium-term target or whether we anticipate potential use of voluntary carbon credits to close any performance gap by FY2030 (which we do not currently anticipate). | For the period FY2020 to FY2030, refer to the carbon budget for our target. We do not currently use a carbon budget for the period beyond FY2030. | ||
| ||||
| Expected progression | Progress towards our target and goal is expected to be non-linear and will be affected by organic changes in our production of commodities. | |||
| ||||
65
Table of Contents
Value chain GHG emissions (Scope 3 emissions) medium-term goals definitions assumptions, adjustments and additional key details
| Steelmaking medium-term goal | Shipping medium-term goal | |||
Description | Support industry to develop steel production technology capable of 30 per cent lower GHG emissions intensity relative to conventional blast furnace steelmaking, with widespread adoption expected post-CY2030. | Support 40 per cent GHG emissions intensity reduction of BHP-chartered shipping of BHP products | ||
| Baseline year or reference year, and period | Reference year: CY2020 (global average GHG emissions intensity for conventional blast furnace steelmaking as at CY2020, being 2.2 tonnes of CO2 per tonne of crude steel. Source: IEA Iron and Steel Technology Roadmap (October 2020)). CY2020 is used as a reference year to assess the potential of collaborative partnerships and venture capital investments to which we may commit funding (refer to ‘measurement approach’ later in this table), but is not a baseline year for achieving our goal. Period: FY2020 to CY2030. | Baseline year: CY2008 (reflecting International Maritime Organisation (IMO) objectives for the shipping industry) Period: CY2008 to CY2030 | ||
Type and reduction | Type: Not applicable Reduction: Not applicable | Type: Intensity Reduction: Gross; 40 per cent | ||
Boundary | Not applicable | – GHG emissions from maritime transportation not owned or operated by BHP, but chartered and paid for by BHP, where the transportation was of BHP-produced products sold by BHP. In some cases, the goal’s boundary may differ from the boundaries under mandatory reporting.
– Inventory boundary: Scope 3 emissions, Category 4, shipping of BHP products only. | ||
Exclusions | Not applicable | – GHG emissions from maritime transportation owned, operated and/or chartered and paid for by a third party, where the transportation was of BHP-produced products sold by BHP.
– GHG emissions from maritime transportation not owned or operated by BHP, but chartered and paid for by BHP, where the transportation was of third-party-produced products sold by BHP (pursuant to our third-party trading activity).
– GHG emissions from maritime transportation not owned or operated by BHP, but chartered and paid for by BHP or a third party, where the transportation was of products purchased by BHP. | ||
GHGs included | Not applicable | CO2, CH4, N2O | ||
Offsetting | Not applicable | Not planned but will be periodically assessed | ||
Measurement approach | Committed funding (US$) for collaborative partnerships and venture capital investments with the aim to support industry to develop steel production technology capable of 30 per cent lower GHG emissions intensity relative to conventional blast furnace steelmaking. | Average gCO2-e per deadweight tonne per nautical mile (gCO2-e/dwt/nm), weighted based on IMO defined vessel size ranges utilised by BHP during the time period, using a well-to-wake CO2-e emission factor from EU Regulation 2023/1805. | ||
| Key adjustments made to baseline year and subsequent data | Not applicable | Baseline year and performance data have been adjusted to only include voyages associated with the transportation of commodities currently in BHP’s portfolio due to the data availability challenges of adjusting by asset or operation for CY2008 and subsequent year data. GHG emissions intensity calculations currently include the transportation of copper, iron ore, steelmaking coal, energy coal, molybdenum, uranium and nickel. Baseline year and performance data have also been adjusted for a methodology change to use maritime transport emission factors from EU Regulation 2023/1805, after The British Standards Institution EN 16258 standard (the source of the emission factors we previously used) was withdrawn in CY2023. | ||
66
Table of Contents
Goal setting method | Qualitative. Tracked based on the funding (US$) we commit in collaborative partnerships and venture capital investments with the aim to support industry to develop steel production technology capable of 30 per cent lower GHG emissions intensity relative to conventional blast furnace steelmaking. | Set as a point in time, i.e. with the specific date of ‘by CY2030’ for our goal to support a 40 per cent GHG emissions intensity reduction of BHP-chartered shipping of BHP products, while reflecting the challenges and uncertainty and our inability (as BHP alone) to ensure Scope 3 emission reductions. As a result, the goal is not based on a trajectory and does not imply a specific carbon budget, and so Scope 3 emissions may fluctuate (with some increases and/or non-linear decreases) during the period before the goal date. | ||
| Goal derived using a sectoral decarbonisation approach | Not applicable | No, although our goal is generally consistent with the IMO’s CY2030 emissions intensity goal for the international shipping sector and we selected CY2008 as our goal’s baseline year to align with the base year for the IMO’s CY2030 goal and its corresponding reasoning and strategy. | ||
| Process for reviewing the setting of the goal | The Board approves BHP’s significant social, community and sustainability policies (upon recommendation from the Nomination and Governance Committee), including those related to climate change and climate transition planning, public sustainability goals and targets (including for GHG emission reductions). We review our GHG emissions targets and goals as part of the periodic development of an updated CTAP, or more frequently if required. | |||
| Process for monitoring progress towards the goal | Monitored on a six-monthly basis through our social value scorecard framework, with progress reviewed by management and the Board as part of publication of our half-year results and annual reporting disclosures, or more frequently if required. | |||
Third-party validation of our goal | No, but we obtain limited assurance over our externally reported performance against our goals. | |||
Carbon budget for goal period | Not applicable | Our goal is not based on a trajectory and does not imply a specific carbon budget. | ||
Expected progression | Not applicable | Progress towards our goal is expected to be non-linear and affected by organic changes in our production of commodities and associated increases in vessel chartering, due to the dependence on the availability of GHG emission reduction solutions more broadly across the shipping industry. | ||
67
Table of Contents
Value chain GHG emissions (Scope 3 emissions) long-term net zero targets and goal definitions assumptions, adjustments and additional key details
| Value chain long-term net zero goal | Shipping long-term net zero target | Direct suppliers long-term net zero target | ||||
Description | We have a long-term goal of net zero Scope 3 GHG emissions by CY2050. Achievement of this goal is uncertain, particularly given the challenges of a net zero pathway for our customers in steelmaking, and we cannot ensure the outcome alone | Target net zero by CY2050 for the GHG emissions from all shipping of BHP products. Ability to achieve the target is subject to the widespread availability of carbon neutral solutions to meet our requirements, including low to zero GHG emission technologies, fuels, goods and services | Target net zero by CY2050 for the operational GHG emissions of our direct suppliers. Ability to achieve the target is subject to the widespread availability of carbon neutral solutions to meet our requirements, including low to zero GHG emissions technologies, fuels, goods and services | |||
Reference year, and period | Reference year: FY2020. FY2020 is used as a reference year to track progress towards our targets and goal, but is not a baseline year for achieving our targets or goal. Period: FY2020 to CY2050 | |||||
Type and reduction | Type: Absolute Reduction: Net; 100 per cent | |||||
Boundary | – Total reported Scope 3 emissions are estimated on an equity basis for downstream GHG emissions. For the upstream GHG emissions component, the boundary is defined on a category-by-category basis due to data limitations.
– Inventory boundary: Scope 3 emissions. | – GHG emissions from maritime transportation not owned or operated by BHP where the transportation was of BHP-produced products sold by BHP. May be BHP-chartered or third-party-chartered. In some cases, the target’s boundary may differ from the boundaries under mandatory reporting.
– Inventory boundary: Scope 3 emissions, Categories 4 and 9, shipping of BHP products only. | – Scopes 1 and 2 emissions of our direct suppliers included in BHP’s reported Scope 3 emissions reporting categories of purchased goods and services (including capital goods), fuel- and energy-related activities, business travel and employee commuting. In some cases, the target’s boundary may differ from the boundaries under mandatory reporting.
– Inventory boundary: Scope 3 emissions, Categories 1, 3, 6 and 7 (subset) emissions are being used as a proxy for the Scopes 1 and 2 emissions of our direct suppliers. | |||
Exclusions | Refer to exclusions for our shipping and suppliers’ targets. | – GHG emissions from maritime transportation not owned or operated by BHP, but chartered and paid for by BHP, where the transportation was of third-party-produced products sold by BHP (pursuant to our third-party-trading activity).
– GHG emissions from maritime transportation not owned or operated by BHP, but chartered and paid for by BHP or a third-party, where the transportation was of products purchased by BHP. | Scope 3 emissions (for our direct suppliers) associated with our purchased goods and services (including capital goods), fuel- and energy-related activities, business travel and employee commuting. | |||
GHGs included | Defined by the available data, which differs by Scope 3 emissions category. We intend to continue to improve our GHG emission calculations over time to encompass specific greenhouse gases as data becomes available. | CO2, CH4, N2O | Defined by the available data, which differs by Scope 3 emissions category. We intend to continue to improve our GHG emission calculations over time to encompass specific greenhouse gases as data becomes available. | |||
Offsetting | We anticipate offsetting by our customers, suppliers and other third parties will play a role in meeting our long-term net zero goal (and potentially our long-term net zero targets), particularly for residual GHG emissions in steelmaking which are not currently expected to reach zero by CY2050. Where third parties offset their GHG emissions that appear in our reported Scope 3 emissions inventory, we plan to recognise and report the net GHG emissions after offsetting. Carbon credits sourced by third parties in our value chain and associated with GHG emissions that appear in our reported Scope 3 emissions inventory would need to be high-integrity before we recognised that offsetting in our reporting. | |||||
Measurement approach | Description of the calculation methodology used for each Scope 3 emissions category can be found in the BHP GHG Emissions Calculation Methodology 2024, available at bhp.com/climate | Vessel- and voyage-specific GHG emissions calculated using maritime transport emission factors from EU Regulation 2023/1805. | As a proxy for measurement of the Scopes 1 and 2 emissions of our direct suppliers, progress is currently measured using Categories 1, 3, 6 and 7 emissions data using a mix of spend-based and activity-based methodology. | |||
68
Table of Contents
| Value chain long-term net zero goal | Shipping long-term net zero target | Direct suppliers long-term net zero target | ||||
| Key adjustments made to reference year and subsequent data | Category 1, Category 3, Category 4 (maritime component), Category 9 (maritime component), Category 10, Category 11 and Category 15 GHG emissions in reference year and performance data have been adjusted for the divestment of our interest in Cerrejón (with an effective economic date of 31 December 2020), divestment of our interest in BMC (completed on 3 May 2022), divestment of our interest in the Rhourde Ouled Djemma (ROD) Integrated Development (completed in April 2022), divestment of our Petroleum business (merger with Woodside completed on 1 June 2022), BMA’s divestment of the Blackwater and Daunia mines (completed on 2 April 2024) and acquisition of OZ Minerals (completed on 2 May 2023). The remaining categories have not been adjusted due to their immateriality to our long-term net zero goal. | Category 4 (maritime component) and Category 9 (maritime component) GHG emissions in reference year and performance data have been adjusted for a methodology change to use maritime transport emission factors from EU Regulation 2023/1805, after The British Standards Institution (BSI) EN 16258 standard (the source of the emission factors we previously used) was withdrawn in CY2023, and have been adjusted for the divestment of our interest in BMC (completed on 3 May 2022), divestment of our Petroleum business (merger with Woodside completed on 1 June 2022), BMA’s divestment of the Blackwater and Daunia mines (completed on 2 April 2024) and acquisition of OZ Minerals (completed on 2 May 2023). | Category 1 and Category 3 GHG emissions in reference year and performance data have been adjusted for the divestment of our interest in BMC (completed on 3 May 2022), divestment of our Petroleum business (merger with Woodside completed on 1 June 2022), BMA’s divestment of the Blackwater and Daunia mines (completed on 2 April 2024) and acquisition of OZ Minerals (completed on 2 May 2023). Categories 6 and 7 were not adjusted due to their immateriality to our long-term net zero target. | |||
Target/goal setting method | Set as a point in time, i.e. with the specific date of ‘by CY2050’ to reach the target or goal of net zero, while reflecting the challenges and uncertainty and our inability (as BHP alone) to ensure Scope 3 emission reductions. As a result, the target or goal is not based on a trajectory and does not imply a specific carbon budget, and Scope 3 emissions may fluctuate (with some increases and/or non-linear decreases) during the period before the target or goal date. | |||||
| Target/goal derived using a sectoral decarbonisation approach | No | |||||
| Process for reviewing the setting of the target/goal | The Board approves BHP’s significant social, community and sustainability policies (upon recommendation from the Nomination and Governance Committee), including those related to climate change and climate transition planning, public sustainability goals and targets (including for GHG emission reductions). We review our GHG emissions targets and goals as part of the periodic development of an updated CTAP, or more frequently if required. | |||||
| Process for monitoring progress towards the target/goal | Monitored on a yearly basis through our annual reporting processes, with progress reviewed by management and the Board as part of publication of our annual reporting disclosures, or more frequently if required. | |||||
| Third-party validation of our target/goal | No, but we obtain limited assurance over our externally reported performance against our targets and goal. | |||||
| Carbon budget for target/goal period | Our targets and goal are not based on trajectories and do not imply specific carbon budgets. | |||||
| Expected progression | Progress towards our targets and goal is expected to be non-linear and affected by organic changes in our production of commodities. | |||||
69
Table of Contents
6.10 Environment and nature
We acknowledge nature, including biodiversity, is deteriorating worldwide at unprecedented rates. We are supportive of global efforts to halt and reverse nature loss in the coming decade, following adoption of the Kunming-Montreal Global Biodiversity Framework during the Conference of the Parties to the Convention on Biological Diversity in December 2022. We recognise that to help enable the energy transition, critical minerals production will need to increase, and it will be essential that this production meets high standards of environmental stewardship. BHP’s business, our suppliers and customers, Indigenous peoples and the local communities where we operate, all depend on and enjoy nature and the ecosystem services it provides. We acknowledge the nature of our operations and our environmental performance can impact the natural environment, including the provision of ecosystem services.
Our Environment Global Standard outlines the minimum requirements for managing our environmental risks and complying with our environmental obligations using environmental management systems aligned to ISO14001. We are working to enable these systems to better support our approach to environmental management and performance. The Environment Global Standard also describes our requirement to apply the mitigation hierarchy (avoid, mitigate, rehabilitate, compensatory actions) in our approach to managing environmental risks. Our Risk Framework supports how we seek to identify, assess and manage environmental risks, as well as our strategic decision-making.
>For more information on BHP’s approach to water stewardship, biodiversity and land, including associated strategies refer to the following sections and bhp.com/water and bhp.com/biodiversity
What do we mean by nature and its associated terms?
| • | The Recommendations of the Taskforce on Nature-related Financial Disclosures (TNFD Recommendations), which were finalised in September 2023, describe nature as having four major components or realms: land, fresh water, ocean and atmosphere – each of which interact with people and society. Biodiversity is a characteristic of all four realms. At BHP, we are continuing to evolve our sustainability-related reporting to align with this concept of nature. |
| • | BHP adopts the definitions as outlined in the TNFD Glossary version 1.0 for the following key nature-related terms: Nature, Nature-positive, Natural Capital, Biodiversity, Realm, Ecosystem function and Ecosystem services. We intend to review these definitions in FY2025, in light of the recently revised TNFD Glossary Version 2.0 (June 2024). |
Biodiversity is an essential characteristic of adaptable, resilient and functional ecosystems, which provides society with ecosystem services on which we rely – clean water, fresh air, productive soils, pollination, climate regulation and climate physical risk mitigation; and services through which we enjoy recreation, amenity, spiritual connection and wellbeing.
For definitions refer to Additional information 10.4 and the TNFD’s version 1.0 glossary at tnfd.global/publication/glossary/
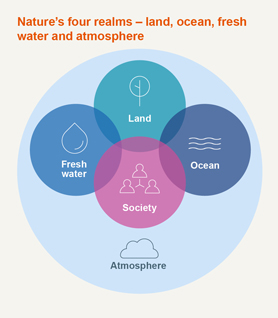
Nature-related goal and targets
We have set, and are now focusing on the steps required to achieve, our 2030 Healthy environment goal and our context-based water targets (refer to the Fresh water and oceans section later in OFR 6.10) that are designed as part of our contribution towards the global efforts to reduce and/or reverse nature loss.
70
Table of Contents
Our 2030 Healthy environment goal, announced in 2022, is to create nature-positive1 outcomes by having at least 30 per cent of the land and water we steward2 under conservation, restoration or regenerative practices by the end of FY2030. Our focus is on areas of highest ecosystem value, both within and outside our own operational footprint, in partnership with Indigenous peoples and local communities.
Our 2030 Healthy environment goal was developed in anticipation of the Kunming-Montreal Global Biodiversity Framework. We focus our activities in support of achieving this goal on the large areas of non-operational land we steward, as this land offers the greatest opportunity for us to apply conservation, restoration or regenerative practices at a larger scale. Our Healthy environment goal and the mitigation hierarchy are considered as part of the factors we use to inform management approaches for our operational and non-operational areas.
To meet the FY2024 short-term milestone for the Healthy environment pillar of our social value scorecard, we have developed a Group-level framework for nature-positive plans to achieve the 2030 Healthy environment goal (BHP Healthy environment goal roadmap).4 We intend to assess the potential opportunities identified in the BHP Healthy environment goal roadmap to inform business decisions designed to enable BHP to progress towards our 2030 Healthy environment goal.
As at 30 June 2024, we had 83,012 hectares or 1.62 per cent5 of the land and water that we steward2,7 under nature-positive management practices3 compared to 79,718 hectares or 1.56 per cent at the end of FY2023.6 The FY2024 area under nature-positive management practices3 has increased by 3,295 hectares (or 4.13 per cent) since FY2023.
The increase in area under nature-positive management practices in FY2024 compared to FY2023 is due to: the inclusion of areas under nature-positive management practice at the former OZ Minerals operation Carrapateena and the West Musgrave project, not included in our FY2023 reporting; an additional regulatory conservation area at one of BMA’s assets in FY2024; and BMA’s divestment of the Blackwater and Daunia mines,7 resulting in these areas, including some areas reported in FY2023 as under nature-positive management practices,3 being excluded from the land and water we steward.2
The calculation for the area under nature-positive management practices includes areas under regulatory and voluntary conservation and restoration, and regenerative agriculture. A breakdown of this can be found in the BHP ESG Standards and Databook 2024. We plan to continue to assess, validate and disclose material information regarding the Healthy environment goal calculation methodology, in consideration of evolving external frameworks and stakeholder expectations.
>For more information on our Healthy environment goal methodology and natural capital metrics framework, how the BHP Healthy environment goal roadmap was developed using a targeted version of the TNFD’s LEAP approach, and examples of areas under nature-positive management practice refer to bhp.com/environment
>For more information on our 2030 goals refer to OFR 6.5
>For more information on how we manage risk refer to OFR 8
Footnotes
| 1. | Nature-positive is defined by the TNFD Glossary version 1.0 as ‘A high-level goal and concept describing a future state of nature (e.g. biodiversity, ecosystem services and natural capital) which is greater than the current state’. We understand it includes land and water management practices that halt and reverse nature loss – that is, supporting healthy, functioning ecosystems. BHP intends to review this definition in FY2025, in light of the recently revised TNFD Glossary version 2.0 (June 2024) definition of nature positive. |
| 2. | This excludes areas we hold under greenfield exploration licences (or equivalent tenements), which are outside the area of influence of our existing mine operations. 30 per cent will be calculated based on the areas of land and water that we steward at the end of FY2030. |
| 3. | Nature-positive management practices refer to an area under stewardship that has a formal management plan that includes conservation, restoration or regenerative practices. For more information refer to the BHP ESG Standards and Databook 2024, available at bhp.com/sustainability. |
| 4. | The BHP Healthy environment goal roadmap is intended to apply to our operated assets in Australia, Chile and Canada. Due to the acquisition of OZ Minerals and prioritisation of activities based on risks and impacts, Carrapateena, Prominent Hill, West Musgrave and legacy assets are currently out of scope for the roadmap; with the exception of West Musgrave, these assets are planned to be incorporated into the roadmap in FY2025. Incorporation of West Musgrave into the BHP Healthy environment goal roadmap will be reviewed following the decision to temporarily suspend the Western Australia Nickel operations. |
| 5. | 1.62 per cent is calculated based on the areas of land and water that we stewarded (excluding areas we hold under greenfield exploration licences (or equivalent tenements) and subject to footnote 7) at 30 June 2024 – which was approximately 5,125,935 hectares; an increase of approximately 18,750 hectares compared to approximately 5,107,185 hectares at 30 June 2023. |
| 6. | FY2023 values are a restatement of our previously reported 1.3 per cent and 82,132 hectares. The restatement from 82,132 to 79,718 hectares under nature-positive management practices for FY2023 is due to a change in our methodology and associated definitions; with FY2023 values being reported based on GRI Biodiversity 2016 304-3 definitions. The restatement from 1.3 per cent to 1.56 per cent area under nature-positive management practices3 is primarily due to approximately 1.5 million hectares of greenfield exploration licences, which are located outside the area of influence of our existing mine operations, being incorrectly assigned to ‘the land and water we steward’2 component of the Healthy environment goal calculation in FY2023. |
| 7. | While some of the land related to the Daunia and Blackwater mines is pending transfer following BMA’s divestment of these mines on 2 April 2024, these areas are no longer under BMA’s control or operated for BMA’s benefit so have been excluded from the areas of land and water we stewarded at 30 June 2024. |
71
Table of Contents
Nature-related risk and impact management
Our approach to biodiversity and nature recognises the five key drivers of nature loss (changes in land and sea use, direct exploitation of natural resources, pollution, climate change, invasive species), as outlined by the United Nations Environment Programme (UNEP).
Our primary approach to preventing or minimising our adverse impacts to nature (including air, fresh water and oceans, land and biodiversity) within our operational footprint is to apply the mitigation hierarchy. For an example of how we apply the ‘avoid’ pillar refer to our environmental-related commitments below.
>For more information on governance of sustainability topics, including nature, refer to OFR 6.3.
Our environmental-related commitments are:
| • | We do not explore or extract resources within the boundaries of World Heritage listed properties. |
| • | We do not explore or extract resources adjacent to World Heritage listed properties, unless the proposed activity is compatible with the outstanding universal values for which the World Heritage property is listed. |
| • | We do not explore or extract resources within or adjacent to the boundaries of the International Union for Conservation of Nature (IUCN) Protected Areas Categories I to IV, unless a plan is implemented that meets regulatory requirements, takes into account stakeholder and partner (including Indigenous peoples) expectations and contributes to the values for which the protected area is listed. |
| • | We do not operate where there is a risk of direct impacts to ecosystems that could result in the extinction of an IUCN Red List Threatened Species in the wild. |
| • | We do not dispose of mined waste rock or tailings into a river or marine environment. |
| • | We do not use aqueous film forming foams (AFFF) containing per- and poly-fluoroalkyl substances (PFAS) at our operated assets. We replace with fluorine free foam products. |
The requirement to apply the mitigation hierarchy, our environmental-related commitments and other Group-wide approaches to environmental management are set out in our Environment Global Standard and in mandatory minimum performance requirements for risk management. We released an updated Environment Global Standard in April 2024 and key changes include:
| • | an increased focus on risk and impact management: |
| I. | extends requirements for identifying and assessing nature-related risks to include those within BHP’s supply chain |
| II. | requires consideration of impacts and dependencies, physical risks, systemic risks and transition risks when assessing nature-related risk |
| III. | emphasises application of the mitigation hierarchy when identifying, assessing and implementing environment-related controls |
| • | a new requirement to develop and implement asset-level nature-positive activities and to include these activities within the BHP Healthy environment goal roadmap |
| • | a new environmental-related commitment to cease use of aqueous film forming foams (AFFF) that contain per- and poly-fluoroalkyl substances (PFAS) (a key FY2024 action to reduce our impact associated with one of the five major drivers of nature loss, pollution) |
| • | enhanced rehabilitation planning commitments |
We are prioritising managing our nature-related risks (including impacts, dependencies, threats and opportunities) within the land and waters we steward. In FY2024, BHP commissioned work to improve our process for how we understand and manage nature-related risk in the value chain.
In FY2024, BHP also introduced a new Global Land Use Permitting (GLUP) system. GLUP is a global software solution developed inhouse to support the internal end-to-end compliance requirements of our Land Use Permit process, which is a key control to manage land use disturbance risks and support application of the avoid and minimise steps of the mitigation hierarchy. This solution was designed to support the Land Use Permit owners and contributors to better understand their obligations and how to manage BHP’s risk to cultural heritage, environment and biodiversity through a simple, transparent and collaborative global technology system.
>For more information on the updated list of nature-related impacts and dependencies that have been evaluated as part of the development of the BHP Healthy environment goal roadmap refer to bhp.com/environment
>For more information on the water-related risks (including impacts, dependencies, threats and opportunities) we take to seek to prevent, mitigate or enhance them refer to bhp.com/water
>For our overarching approach to risk management refer to OFR 8
>For more information on our environmental approach refer to the Environment Global Standard and our nature-related management and governance processes at bhp.com/environment
72
Table of Contents
Fresh water and oceans
Water is integral to what we do and vital to the longevity of BHP. We depend on access to water and cannot operate without it. Our Water Stewardship Position Statement outlines our vision for a water secure world by 2030, an aim consistent with the United Nations Sustainable Development Goal 6, and considers ecosystem health, cultural and spiritual values, human rights, communities, Indigenous peoples and economic growth among other factors. Our position statement is supported by our Water Stewardship Strategy, which focuses on understanding and managing water-related risk, disclosure, contributing to the resolution of shared water challenges, valuing water and sharing innovations and learning.
Water data and accounting relies on a variety of data sources, including from water modelling, direct measurement and estimation techniques based on available known methodologies (e.g. estimation of evaporation from water storages). Recognising that the water models, water balances and assumptions used in our water accounting approach contain inherent uncertainty; and in line with our commitment to continuous improvement; we continue to review the assumptions and refine our methodology of our water accounts and data.
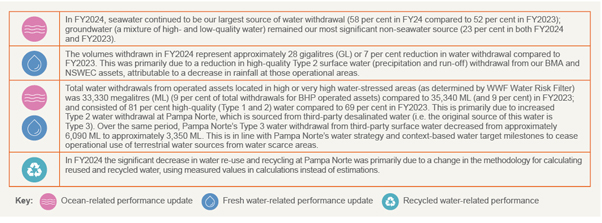
We continue to seek opportunities to source our water from lower-grade sources rather than use high-quality water resources from the catchments where we operate. Key insights from our FY2024 water performance are outlined above.1
In FY2024, we commenced review and refinement of our water accounts and model at our Western Australia Nickel asset, completing a review at Mount Keith. Updates to Leinster’s water model are planned to be rolled out in FY2025. The continuation of this program will be subject to review, and there is no current plan to disclose water data from West Musgrave in the future, following the announcement of temporary suspension of operations at Western Australia Nickel. In FY2025, we also intend to align Prominent Hill and Carrapateena to ICMM’s Water Reporting, Good Practice Guide (2nd Ed) and the Minerals Council of Australia’s Water Accounting Framework, to enable disclosure of water data from these operations from FY2026.
Context-based water targets
In our Water Stewardship Position Statement, we committed to develop context-based water targets (CBWTs). These targets were informed by BHP’s view of water-related risks in the relevant catchment and by the shared water challenges identified in the Water Resource Situational Analysis (WRSA). A WRSA is a holistic assessment and summary of the sustainability, governance, and social, cultural, spiritual, environmental and economic values of water (fresh or marine) within a defined catchment area, which provides a rounded understanding of the shared water challenges and collective action opportunities for the catchment. The CBWTs aim to improve our internal BHP water management and contribute to collective benefit and shared approaches to water management in the regions where we operate. Our CBWTs support BHP’s 2030 Healthy environment goal and are expected to contribute to the protection or restoration of water-dependent ecosystems in the vicinity of our operated assets. The CBWTs are underpinned by a series of milestones and we delivered all asset-level CBWT2 FY2024 short-term milestones except one at West Australia Nickel, as summarised above.
In FY2024, we engaged third parties (e.g. universities) to undertake a WRSA at NSWEC, including to review publicly available information and engage with partners and stakeholders (e.g. communities, Indigenous groups, policymakers and other private corporations within our catchment areas). Shared water challenges were identified through a WRSA. NSWEC’s WRSA was released in August 2024. CBWTs for NSWEC and one of our legacy assets are planned to be released in FY2025.
Footnotes
| 1. | Water performance data does not include Carrapateena or Prominent Hill operations. |
| 2. | CBWTs are intended to apply at the asset level for our operated assets. Due to the previous divestment review of NSWEC, along with CBWTs for our legacy assets in the United States and Canada, CBWTs for NSWEC and at least one legacy asset area are planned to be released in FY2025. BHP plans to review the suitability of the existing Olympic Dam WRSA and CBWTs during FY2025, following the creation of the Copper South Australia asset, inclusive of Olympic Dam, Carrapateena and Prominent Hill. We expect to review the need to revise or create CBWTs when there are substantial changes to our portfolio or one of our projects moves into the operational phase. The Western Australia Nickel context-based water targets do not include the West Musgrave Project. |
73
Table of Contents
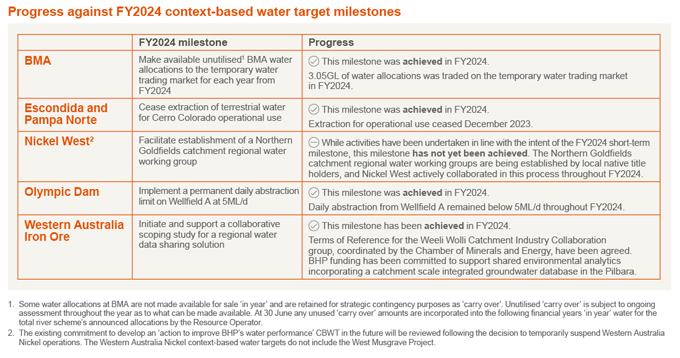
Beyond BHP’s footprint, we made voluntary contributions to support environmental resilience across the regions where we operate, including through thought leadership and action on the ground. For example, in FY2024:
| • | We continued to collaborate with the University of Notre Dame to develop a framework for corporations and policymakers to consider the human right to water to support social equity and reduce corporate risk. During FY2024, work continued to make the framework more practical by developing decision support tools and case studies. |
| • | We continued to progress with the Groundwater Modelling Decision Support Initiative (GDMSI) with partner organisations Rio Tinto and Flinders University to help promote the application of advances in groundwater modelling for environmental and water management decisions. During FY2024, the initiative reviewed the application of numerical groundwater modelling in environmental assessments and delivered a discussion paper on some of the challenges associated with disclosing and addressing technical uncertainty in decisions. |
| • | BMA has been a member of the Fitzroy Partnership for River Health and Mackay Whitsunday Isaac Healthy Rivers to Reef Partnership since 2020 and 2022 respectively, contributing over A$0.55 million to these partnerships in FY2024. One of the key goals of these partnerships is to provide a more complete picture of river and marine health – providing funding, resources and contributing water quality and ecosystem health monitoring data through data-sharing arrangements. In FY2024, the Mackay Whitsunday Isaac Healthy Rivers to Reef ‘Project Blueprint’, water quality monitoring and engagement in the Whitsundays, was expanded to include direct Traditional Owner participation. Project Blueprint has completed over 12 trips and analysed over 360 samples. |
>>For more information on the Fitzroy Partnership for River Health and Mackay Whitsunday Isaac Healthy Rivers to Reef Partnership, including annual report reports, refer to riverhealth.org.au and healthyriverstoreef.org.au
74
Table of Contents
>For more information on WRSAs and CBWTs, including progress against the targets and longer-term CBWT milestones, refer to bhp.com/water and bhp.com/sustainability/environment/water/shared-water-challenges
> NSWEC’s WRSA is available at bhp.com/sustainability/environment/water/shared-water-challenges/what-is-wrsa
>Detailed information on water accounting and reporting of metrics required by the ICMM Guidance is available at bhp.com/water
>For more information on our water performance in FY2024 and case studies on activities we are undertaking to progress towards meeting our water stewardship vision refer to bhp.com/water
Biodiversity
In accordance with the 2022 Kunming-Montreal Global Biodiversity Framework BHP acknowledges biodiversity is fundamental to human wellbeing, a healthy planet, and economic prosperity for all people.
We have a Group-level biodiversity strategy that outlines our purpose and strategic priorities, and is designed to inform operational decision-making across the full lifecycle of mining operations at our operated assets. The Group-level strategy provides a clear direction that enables alignment of asset-level biodiversity and land objectives and supports delivery of the 2030 Healthy environment goal. The focus areas in the biodiversity strategy are valuing natural capital, innovation and collaboration, and nature-related disclosures.
Our work on understanding and managing the value of nature to our business and to the communities where we operate continues to progress following the completion of our pilot natural capital accounting (NCA) case study at our Beenup site in Western Australia in FY2023. Further NCA piloting was performed in FY2024 at our Olympic Dam operation, as part of a broader project led by Cooperative Research Centre for Transformations in Mining Economies (CRC TiME) and CSIRO, with input from the Australian Government Department of Climate Change, Energy, the Environment and Water, and other CRC TiME partners. This project provided inputs to a suite of new resources that has been released to support the mining industry adopting NCA – a way of accounting for impacts on nature over the life of projects. The Olympic Dam pilot case study provided new insights into what is possible using industry data at an operating asset and revealed the need for a clear underlying rationale to inform the design of decision-useful natural capital accounts.
The BHP Healthy environment goal roadmap includes a preliminary natural capital metrics framework, which considers the ecological status and socio-economic value of natural capital assets that we impact and/or depend on. It was applied in FY2024 to establish the initial metrics that are intended to be used to measure the impact of BHP’s nature-positive management practices.
Beyond BHP’s footprint, we made voluntary contributions to support environmental resilience across the regions where we operate, including through on-ground action. For example:
| • | In FY2024, we finalised our four-year coral reef restoration project with the Woppaburra Traditional Owners, who are the custodians of Sea Country adjacent to our BMA operations in the southern Great Barrier Reef. The project was co-designed by Woppaburra people with some attaining qualifications in coral aquaculture techniques that have led to employment opportunities. Our pilot of the Seascape Framework, which is one of the world’s largest Indigenous created and managed marine conservation initiatives, continued with Conservation International in Lau, Fiji. |
| • | In FY2024, we renewed our fourth extension of the Bush Blitz Project for a further five years to the end of FY2030. Bush Blitz is Australia’s largest nature discovery program – a unique multi-million-dollar partnership between BHP, the Australian Government and Earthwatch Australia to document plants and animals across the country. Since the program began in 2009, Bush Blitz has discovered more than 2,100 new species and has added thousands of species records to what is already known. Phase 3 of the program, from 1 June 2018 to April 2024, involved 15 field expeditions, which covered 2,966,495 hectares of land and almost 62 square kilometres of sea, making a major contribution to the understanding and conservation of Australia’s biodiversity. During these expeditions, Bush Blitz scientists – supported by BHP employees and educators serving as field research assistants – discovered 311 species new to science. The surveys also engaged hundreds of Indigenous rangers, Traditional Owners, park rangers and other land managers. In particular, Bush Blitz has undertaken research on Indigenous-managed properties, creating positive cultural exchange and learning opportunities for rangers and scientists. |
| • | Since FY2021, we have partnered with Curtin University on the use of environmental DNA (eDNA) as a novel biomonitoring tool to enable the development of ecosystem condition indices. We have supported five pilot studies that focus on protected species (e.g. the Pilbara olive python), subterranean conservation research, functional ecology of the Chilean wetlands of the Altiplano, and studies to develop new assays that can be used to detect invasive marine species. This work was extended in FY2024 to include research into sampling eDNA from soil and air. In terms of impact, the research has produced 22 scientific publications, supported six post-graduate students, sequenced the first complete genome of the Pilbara olive python, added 391 marine sequences to GenBank, and assembled over 150 new mitochondrial genomes. A Funding Agreement for a further four years of ongoing eDNA research with Curtin University was signed in FY2024. |
75
Table of Contents
>For more information on our 2030 goals refer to OFR 6.5 and for information on our biodiversity strategy refer to bhp.com/biodiversity
>For more information on our approach to biodiversity and land management and case studies on activities we are undertaking to progress towards meeting our biodiversity aims refer to bhp.com/biodiversity
>For more information on the CRC TiME and CSIRO NCA project and resources refer to crctime.com.au/blog/media-release-new-reports-to-help-test-applicability-of-natural-capital-accounting-in-australias-mining-sector/
Land
As at 30 June 2024, BHP owned, leased or managed approximately 8,874,555 hectares of land compared to approximately 8,038,027 hectares as at 30 June 2023. The approximately 836,528-hectare increase is primarily due to the incorporation of former OZ Minerals Australian land holdings. Approximately 2 per cent (approximately 144,634 hectares) of this area has been disturbed for mining operation purposes and approximately 16 per cent (approximately 22,885 hectares) of land we have disturbed is currently rehabilitated.
Most of the area we steward is located in Australia and is for non-operational land uses, such as pastoral leases or land set aside for conservation. BHP’s approach to environmental management is tailored to different area types in our portfolio. See Figure below for a visualisation of this.
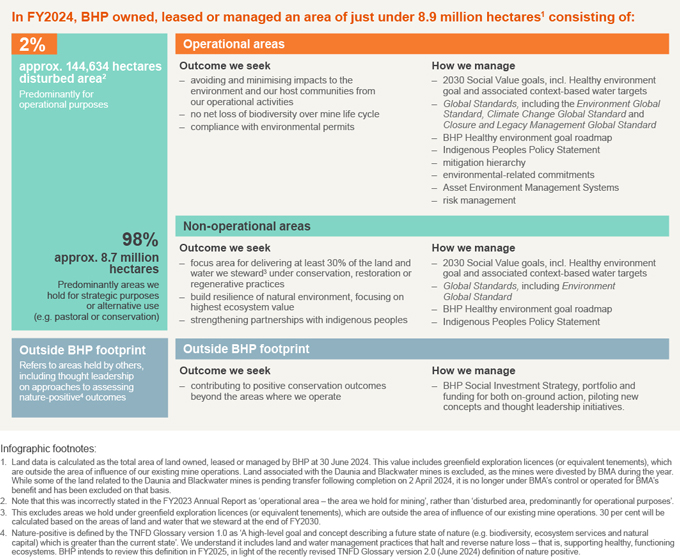
Atmosphere and air quality
Clean air is crucial for the health of our people, our host communities and the surrounding ecosystems. We are actively working to improve air quality management, with a focus on managing emissions of particulate matter from our operations.
76
Table of Contents
Our emission of nitrous oxides, particulates and sulphur dioxide is considered non-material in comparison to global emissions as determined by the GRI materiality assessment process. We have extensive particulate monitoring and management programs at some of our operated assets. We report air emissions (such as nitrous oxides) as part of the BHP ESG Standards and Databook 2024, available at bhp.com/sustainability, and discuss our approach and management to these on our environment webpage at bhp.com/environment.
>For more information on our approach to air quality refer to the Pilbara Air Quality Program case study at bhp.com/sustainability/environment
Environmental legal cases
We have settled ongoing legal cases involving environmental matters for our operated assets. Examples for Lagunillas (Cerro Colorado) and Monturaqui (Escondida) are described below.
Nine fines were issued and paid in FY2024 in relation to environmental laws and regulations at our operated assets. For more information refer to the 2024 ESG Standards and Databook.
Lagunillas (Cerro Colorado)
In 2021, an individual filed an environmental damage claim against Cerro Colorado (CMCC) before the First Environment Court of Antofagasta, alleging CMCC’s water extraction from the Lagunillas aquifer had damaged the aquifer, as well as a nearby lagoon and wetlands. The substantive case was heard in FY2022. In November 2023, the Environmental Court approved the settlement submitted by the parties, concluding that the environmental remediation measures in the agreement are adequate.
Monturaqui (Escondida)
In March 2022, the Chilean Environmental Regulator (SMA) sanctioned Escondida, concluding it had breached its environmental permit causing irreparable environmental damage due to its water extraction from the Monturaqui aquifer. In March 2022, the SMA imposed a fine of approximately US$8.3 million. In February 2023, Escondida filed an appeal before the First Environmental Court seeking to annul the SMA decision. The appeal is pending.
Shortly after the March 2022 SMA decision, two related environmental damage claims were filed in the First Environment Court of Antofagasta. Following a hearing in July 2023, the Court is now in a position to render a ruling on the claims’ merits, which we expect could occur within the next 12 months.
Engagement
Beyond our operational activities, we engage across communities, Indigenous peoples’ representatives, government, industry association memberships, our customers and suppliers, business and civil society on a range of topics related to environmental management.
Through our engagement in industry associations, we have provided input into their advocacy with governments on behalf of industry. In FY2024, our focus within industry has been on streamlining approvals and permits whilst maintaining environmental standards; recognising environmental, social and economic factors must be considered in these processes. Specific examples include:
| • | direct and indirect engagement, via the Minerals Council of Australia, with the Australian Government on its Nature Positive law reforms, outlining our alignment with the government’s intent to reform the current national environmental laws so they achieve the right balance between better outcomes for the environment and supporting economic growth, investment and job creation |
| • | indirect advocacy via the Chilean Mining Council, in relation to a Bill that strengthens environmental management instruments, deepening citizen participation, and providing greater certainty and reduced processing times. We also advocate for the reduction of processing times without weakening environmental standards |
We also partner with others to advance the thinking in our priority areas of action. As an International Council on Mining and Metals (ICMM) member, we have worked with industry peers to develop the ICMM’s nature position statement with associated commitments, which was adopted by ICMM members in January 2024.
>For more information on the ICMM nature position statement refer to icmm.com/en-gb/our-principles/position-statements/nature
6.11 Community
Through our business activities and the social, economic and environmental initiatives that accompany them, we can make a significant contribution to communities where we operate and to society more broadly. Our operations can also generate impacts for host communities that need to be carefully identified, monitored and addressed. This tension challenges us to look for inclusive, innovative and integrated solutions that meet the constantly evolving performance expectations that communities and society hold for us. This means the voice of our community stakeholders remains a critical input into our short-term response and our long-term vision around community engagement, partnership and investment.
In FY2024, we continued to manage relevant risks (threats and opportunities) and impacts as well as progressed development of our longer-term strategic approach to community engagement. This includes an increased focus on seeking to adopt a ‘co-creation’ approach – involving and providing agency for our partners to shape selected initiatives.
Co-creation
Co-creation, or co-design, in essence, is a strategic approach involving the integration of diverse partners’ resources, knowledge and networks to resolve complex collective challenges or realise more enhanced outcomes through collaboration. It places BHP within a larger ecosystem where stakeholders actively participate in project development and delivery. Stakeholders act as valuable contributors to each design process and ideas generated via co-creation become integral to a company’s decision-making process. Throughout this Report we use the terms co-creation and co-design interchangeably.
77
Table of Contents
For the Thriving, empowered communities (TEC) pillar of the social value scorecard, BHP’s experience and learning from external sources have demonstrated that integrating a co-creation approach is an opportunity, when adopted in the right circumstances, to generate outcomes that are more valued by Indigenous peoples, communities, governments and civil society through an enhanced sense of ownership and benefit. There are also business benefits to this approach, including enhanced social value outcomes and impact. As such, the TEC pillar focuses on the adoption of the practice of co-designed targets within the 2030 scorecard. In FY2024, we increased our focus on co-creation within our general community approach. This includes commencing the development of criteria that provide guidance on co-design practices, processes and assessments against the social value targets within the TEC pillar of our social value framework.
>For more information on our social value scorecard, including our co-creation metrics and milestones, refer to OFR 6.5
Understanding communities
Our approach to community engagement and research includes:
| • | Community perception surveys – snapshots of the communities where we operate and stakeholders’ perspectives on their community priorities and of sector and BHP performance, completed on a regular basis. As at 30 June 2024, field work for the latest community perceptions survey was underway. |
| • | Community baseline studies – desktop assessments that provide quantitative and qualitative data on social, cultural, economic and political characteristics of the communities where we operate. The most recent baselines were completed in FY2023 and included all operated and legacy assets and our exploration regions at that time. The former OZ Minerals operations will be included in future community baseline studies. |
| • | Community and human rights impact and opportunity assessments (CHRIOAs) – analysis of surveys, baseline studies and community stakeholder feedback against asset plans to identify and prioritise potential and actual risks, impacts and opportunities related to local communities where we operate (see the following section for more details). |
| • | Community engagement and social investment indicators – data collected related to community engagements (e.g. number of community concerns and use of operational grievance mechanisms) and social investment partnerships (e.g. outcome indicators of a particular project) that provide insights to the communities’ relationships with us. |
We continue to track and report instances of community concerns, complaints and grievances received through our operational grievance mechanisms and other feedback avenues. In FY2024, there were 600 community concerns and complaints received across our operated assets globally. Of note, 462 of these related to a mass submission of email communications received in relation to potential impacts of the BMA Caval Ridge Horse Pit Extension project during the public disclosure period. The nature of the concerns raised were the same in each submission and included potential impacts to flora and fauna, impacts on ground and surface water and the final landform of the project.
The majority of remaining concerns and complaints related to operational issues, such as dust, road and rail impacts, lighting and noise. Asset complaint volumes remained relatively stable from last year’s figures with the exception of BMA (attributed to the Horse Pit Extension project submission as detailed above) and a 57 per cent decrease in complaints at NSWEC, through the resolution of an ongoing issue with a single community stakeholder. Ten complaints were made by Indigenous communities in Chile which we are seeking to address through ongoing dialogue with those communities. Concerns, complaints and grievances from communities connected to the former OZ Minerals assets are expected to be incorporated in the BHP Annual Report from FY2025.
In FY2024, we implemented a new enterprise-wide stakeholder management system that enables us to maintain improved records of community engagements and our commitments. This system also incorporates an updated external facing complaints and grievance portal designed to improve accessibility for community members to provide direct feedback to us. We intend to launch the enhanced portal for the system in FY2025. We also updated our internal standards, designed to provide improved guidance for community engagement and social performance leading practice as well as to enhance integration with our existing business processes, such as asset planning and risk assessments.
>For more information on stakeholder concerns reflecting entries received through our local grievance mechanisms, local stakeholder engagement and ongoing community research, including community perception surveys, refer to the BHP ESG Standards and Databook 2024 at bhp.com/ESGStandards2024
We recognise many of the communities where we operate rely on mining and associated activities to support their livelihoods. We aim to ensure change and transitions are equitable and deliberately considered across the lifecycle of our business and for the communities where we operate.
>For information on our approach to equitable change and transition, including equitable change and transition at our Mt Arthur coal mine, refer to the BHP Climate Transition Action Plan 2024 available at bhp.com/CTAP2024
Community and human rights impact and opportunity assessments
In FY2024, building on the results of the community and human rights baseline studies completed for all operated assets and certain exploration regions in FY2023, we developed and commenced implementation of a globally consistent methodology for community and human rights impact and opportunity assessments (CHRIOAs), which identified and prioritised potential impacts, risks and opportunities related to the local communities where we operate. The approach was trialled at all our operated assets (excluding the former OZ Minerals assets) and selected exploration regions. This enabled identification of the potential community and human rights impacts and opportunities most prevalent to each region while also supporting a global view of recurring issues, which can help us identify potential opportunities for company-wide action or collaboration. The identified risks, impacts and opportunities are being evaluated and are expected to be embedded within asset and relevant functions’ FY2025 risk profiles. The highest priority areas for each operating region are detailed in the map below, with US legacy assets and Exploration prioritising water access and pollution as the key CHRIOA priority risk areas. In FY2025, we plan to further embed the CHRIOA process through the integration of identified risks (threats and opportunities) into asset risk profiles to enable action. We also expect to include the former OZ Minerals assets in this process in future years.
78
Table of Contents
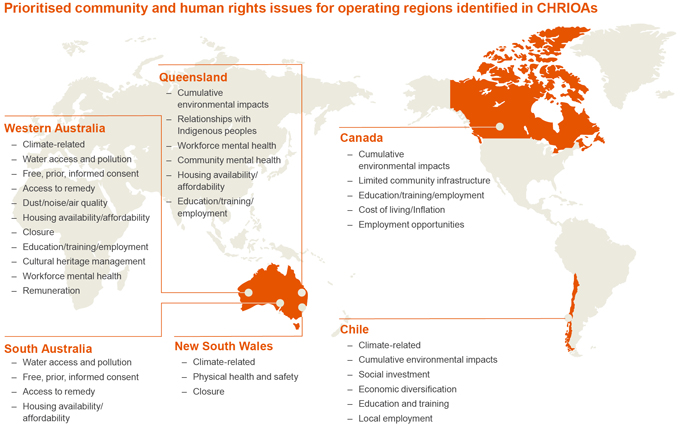
As we acquire assets in new areas, we may be exposed to additional human rights risks. For information on our approach to addressing modern slavery risks in our operations and supply chains, refer to the BHP Group Modern Slavery Statement 2024.
>For more information on our approach to community refer to bhp.com/communities
6.12 Indigenous peoples
Indigenous peoples are important partners for BHP’s activities. Across our Minerals Australia and Minerals Americas activities, BHP operates on or close to the traditional lands of Indigenous peoples and we have a deep respect for their distinct cultures, rights, perspectives and aspirations. BHP is committed to working collaboratively with Indigenous peoples to develop long-term partnerships based on trust and mutual benefit as set out in our Indigenous Peoples Policy Statement. It is through this commitment that we aim to support reconciliation with Indigenous peoples and contribute to improved social, economic and environmental outcomes.
In FY2024, we developed and introduced procedures for projects and new operations to identify and assess the severity of potential adverse impacts to Indigenous peoples’ and to engage and consult Indigenous peoples to understand how we can seek to avoid and mitigate adverse impacts, with the intention of substantially addressing potentially impacted Indigenous peoples’ ambitions and concerns. We have also introduced new procedures for projects and new operations to engage with and seek to obtain ‘free, prior and informed consent’ (FPIC) from potentially impacted Indigenous peoples in accordance with the approach set out in our Indigenous Peoples Policy Statement. Where gaps exist between the host government’s laws and regulations about consultation with Indigenous peoples and BHP’s approach to FPIC, our policies require that BHP apply the higher standard. All projects and proposed new operations are required to submit progress reports to senior management across the project lifecycle to report on progress or any challenges to satisfying BHP’s FPIC procedures. In FY2025, we aim to continue to strengthen our internal systems for collecting and reporting on the global management of risks to Indigenous peoples and FPIC processes with Indigenous peoples.
During FY2024, we progressed work in relation to further developing how we will approach Indigenous Cultural and Intellectual Property (ICIP) and Data Sovereignty in line with the principle set out in our Indigenous Peoples Policy Statement. We plan to continue this work into FY2025, which we expect to inform the design of our standards and processes for the collection, access and reuse of cultural information that pertains to Indigenous peoples.
79
Table of Contents
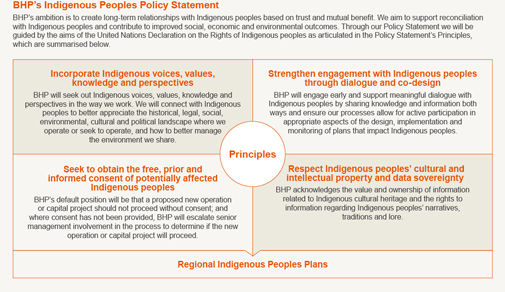
Indigenous partnerships
Under the Indigenous partnerships pillar of our social value framework, we have set ourselves the goal of delivering respectful relationships that hear and act upon the distinct perspectives, aspirations and rights of Indigenous peoples and support the delivery of mutually beneficial and jointly defined outcomes (refer to OFR 6.5). We have committed to report annually on metrics for Indigenous employee representation, Indigenous procurement, our ‘progress to plan’ against the co-designed Indigenous Peoples Plans in each region where we operate, and about actions to improve the health of our relationships with those Indigenous peoples.
Relationship health
In FY2024, we completed an inaugural assessment of the health of our relationships with a range of our Indigenous partners. We engaged global research firm, Ipsos, to independently gather feedback on a confidential basis from a number of BHP’s Indigenous partners in Australia, Canada and Chile where we operate our assets. In total, representatives from 17 of 26 Indigenous partner organisations who were contacted to take part in the inaugural assessment agreed to participate. All organisations that were contacted for the inaugural assessment have current agreements with BHP or are located on or near our operations. The feedback indicated that relationships had been strained in the past. While BHP is making some progress in its relationships with Indigenous partners, there is still more to do to achieve our goal of delivering respectful relationships that hear and act upon the distinct perspectives, aspirations and rights of Indigenous peoples and support the delivery of mutually beneficial and jointly defined outcomes. Recommendations for improvement include more resourcing and empowerment of BHP’s Indigenous Engagement teams, and greater involvement for Indigenous partners in BHP decision-making around employment, procurement and community initiatives to ensure opportunities are available to Indigenous peoples at the community level. The feedback also indicated that some Indigenous partners desire a greater level of involvement from BHP in community engagements, such as in cultural events and informal meetings. The relationship health results varied across the different countries covered in the assessment and is broadly summarised as:
Canada: The five Canadian Indigenous organisations that participated reported a positive trajectory in their relationship health with BHP and expressed the most optimism in their feedback on the future potential of relationships. Key personnel at BHP were seen to instigate respectful, meaningful and genuine engagements with Indigenous communities. This has helped create trust in BHP’s commitment to deliver positive outcomes through community investments and initiatives. Some areas of concern included past instances of cultural disrespect and that proactive steps to understand Indigenous history and culture were not always consistently applied. In some instances, there was frustration expressed about communications and transparency, as well as present levels of Indigenous employment representation. The feedback indicates desire to see more two-way dialogue with decision-makers established. Looking to the future, Canadian Indigenous partners expressed a high degree of optimism at the economic opportunities at the Jansen operation. To maintain this optimism, partners in Canada seek increased Indigenous representation in decision-making processes and positions and expect a stronger focus on training and upskilling so that Indigenous peoples may increase their employability to work for BHP.
Australia: The six Australian Indigenous organisations that participated indicated there had been an improvement in relationship health from the past to the present. Many of the improvements in overall relationship health were attributed to key personnel at BHP who advocate strongly for Indigenous partners and who conduct their engagements respectfully with long-term goals of Indigenous advancement in mind. The establishment of Indigenous Engagement and Cultural Heritage teams and greater direct engagement from BHP senior leaders in Australia were seen as improvements. However, the feedback also indicates only marginal improvement from the present to the future for our relationships in Australia. Some Indigenous partners reported that relationships can still feel transactional and lacked continuity. In some instances, there was a view expressed that BHP could provide more commercial and employment opportunities to Indigenous partners and improve the accessibility of its systems and processes. These factors contributed to a less optimistic outlook about the future state of the relationship compared to the other jurisdictions. There was a desire expressed by Australian Indigenous partners to see more Indigenous peoples advancing to more senior roles in BHP. Partners also expressed a desire to see more social investment initiatives that benefit more groups. These changes, along with more frequent engagement with decision-makers, were seen as necessary steps to build trust and to help move towards more respectful relationships based on mutual benefit in the future.
80
Table of Contents
Chile: The six Chilean Indigenous organisations that participated indicated they had seen modest improvement in relationship health from the past to the present and were more optimistic in their view on the future. Indigenous partners in Chile perceive inadequacies in the opportunities and operational and environmental protections offered by the national legal system and they expect BHP to set a higher standard. There was a perception that BHP had prioritised commercial outcomes in the past and there had, in some cases, been inadequate recognition and understanding of Chilean culture and values. Some partners continue to perceive protections as inadequate in managing environmental impacts and want to see BHP enhance cultural protections, improve access to areas that hold cultural meaning and implement measures to minimise the health impacts of mining on communities. More generally, partners expressed a desire to see BHP be more proactive in engagement with a broader range of the community, including those that are not recognised by Chilean legal structures. Partners believe employment and training opportunities could be better geared to Indigenous staff and skillsets in the community to improve levels of Indigenous employment. There appears to be an openness from Indigenous partners to continue engaging to improve relationships with BHP in Chile.

Each interview was structured around one theme: How would you rate the overall health of the organisation/entity’s relationship with BHP over three time periods in considering the past, present and future of the relationship? Responses were recorded as a rating from zero to 10. Our regional Indigenous Peoples Plans are being considered in light of the partner feedback received and to identify areas of focus within the actions set under those plans.
Progress to plan
We are making progress with our commitments in the global Indigenous Peoples Policy Statement and the social value framework to incorporate ‘Indigenous voices and perspectives’ into co-designed priorities, as set out in the Indigenous Peoples Plans in each region where we operate.
We ‘partially met’ our FY2024 social value scorecard short-term milestone ‘Indigenous voices and perspectives are incorporated into co-designed priorities in each region’ as two out of three countries have published a co-designed regional Indigenous Peoples Plan that has incorporated the voices and perspectives of Indigenous peoples. Australia published its Reconciliation Action Plan (RAP) in FY2023. Canada approved its Canada Indigenous Partnerships Plan (CIPP) in FY2024. Chile is still developing its regional Indigenous Peoples Plan and hopes to publish it in FY2026.
Australia: Minerals Australia released its RAP in FY2023.1 There were 25 RAP targets that were due to be achieved in FY2024; of this, 21 targets were completed in full and we also completed our reforms to embed four ongoing RAP targets into standard business requirements. RAP targets have been embedded in BHP’s business planning process and performance is measured regularly through a new RAP performance dashboard with live data and scorecards. The BHP RAP Governance and Accountability Framework has seen the development of the BHP Australian Indigenous Peoples Working Group (AIPWG) that is attended by the Minerals Australia Business President and Chief Legal, External Affairs and Governance Officer.
Canada: Minerals Americas approved its first Canada Indigenous Partnerships Plan (CIPP) in FY2024. The plan assists BHP to operationalise our global Indigenous Peoples Policy Statement and respond to the Truth & Reconciliation Call to Action 92 for businesses in Canada. The CIPP signifies the journey towards greater co-creation and to develop impactful partnerships, deliver on Indigenous employment and procurement targets, as well as support the wellbeing of Indigenous peoples through internal cultural awareness training and social investment activities. Implementation of the CIPP is expected to begin in Q1 of FY2025.
Chile: In FY2024, Minerals Americas designed the process for developing an Indigenous Peoples Plan for Chile and is expected to commence consultations with Indigenous peoples in FY2025 to start to co-design the plan. We aim to publish the plan in FY2026.
Indigenous procurement and employee participation
We are making progress against our social value scorecard metrics for Indigenous employee participation and Indigenous procurement. Indigenous employment teams developed and implemented Indigenous workforce initiatives in FY2024 to help provide pathways to employment, support our Indigenous workforce, build a more culturally capable non-Indigenous workforce and meet our employment metrics. In Australia, our Indigenous employment was at 8.3 per cent in FY2024, down from 8.6 per cent in FY2023, and our target is to reach 9.7 per cent by FY2027. In Chile, our Indigenous employment was at 10.1 per cent in FY2024, up from 9.7 per cent in FY2023, and we surpassed our target to reach 10 per cent by FY2025. In Canada, our Indigenous employment was at 11.2 per cent in FY2024, up from 7.7 per cent in FY2023, and our target is to reach 20 per cent by FY2026.
81
Table of Contents
> For more information on our employee data and approach refer to OFR 6.6
In FY2024, we continued to improve engagement with Indigenous businesses across all our operating locations.2 Compared to FY2023, our direct global spend with Indigenous businesses increased by 83 per cent to US$609 million in FY2024 and the number of Indigenous vendors engaged rose by 20 per cent to 263. Through this effort, we have seen continued growth in spend with Indigenous businesses across our Australian assets with FY2024 direct spend of US$458 million up from US$267.5 million in FY2023 in line with our Reconciliation Action Plan (RAP) commitments. In Canada, spend with Indigenous business partnerships during FY2024 totalled US $151 million continuing the focus on these opportunities since the sanctioning of Jansen Stage 1.
Footnotes
| 1. | For more information about the Australian RAP refer to bhp.com/-/media/project/bhp1ip/bhp-com-en/documents/careers/indigenous-peoplesand- bhp/200921_bhpreconciliationactionplan.pdf. |
| 2. | For definitions for Indigenous businesses in each operating location refer to the ESG Standards and Databook 2024. |
Minerals Australia
BHP held its second annual Traditional Owners’ Forum in Brisbane in November 2023 with strong representation from Traditional Owner groups from around Australia. BHP sought input from Traditional Owners to co-create the 2023 agenda, and the themes of discussion provided an opportunity to reflect and speak honestly on BHP’s performance and delivery in the context of Traditional Owner experiences.
We have undertaken consultation in FY2024 to understand the elements of an effective and sustainable model for an Indigenous advisory body in Minerals Australia, and, once developed, the advisory body will shape BHP’s understanding and implementation of commitments in the RAP, until the end of FY2027.
A Cultural Heritage Standard that was developed in FY2023 by the Minerals Australia Cultural Heritage team was embedded in all BHP operated assets in Minerals Australia in FY2024. This Standard considers leading international and national frameworks and aims to enable mining activity while simultaneously encouraging the voices of relevant First Nations/Indigenous peoples to be at the forefront of decision-making processes on heritage matters through the mining lifecycle.
In FY2024, one new Heritage Agreement and 11 new Cultural Heritage Management Plans were successfully negotiated with Indigenous communities. These Cultural Heritage Management Plans mainly covered existing operations at WAIO and BMA to modernise existing government approvals. In line with our social value approach, new heritage protection areas were also agreed through the Cultural Heritage Management Plans and projects supported with communities to culturally map these places for knowledge transfer and wider community benefits.
Minerals Americas
Chile
In FY2024, Escondida developed a new Indigenous partnership strategy, which aims to build a stable, long-term relationship, based on trust and mutual benefits, with the five Indigenous communities of Borde Sur: Peine, Talabre, Socaire, Camar and Toconao. The strategy is focused on resolving past grievances, honoring commitments and creating opportunities for regular and structured dialogue between Escondida and Indigenous communities that will contribute to improved relationships, build greater trust and proactively address community concerns. In FY2024, Escondida updated its Community Relationship Strategy with the Indigenous community of Peine, which is focused on building and maintaining a long-term relationship. Meetings have been held with Peine to help inform the project of progressive closure of the Monturaqui well field.
Our Cerro Colorado operation is planning the execution of several projects for the next five to seven years, including: care and maintenance activities, closure works on the Parca Slope, geo/hydro physical drillings and the Cerro Colorado Life Extension (CCLE) project. All projects will be executed on the Cerro Colorado mine site and surrounding territories, which are on lands that are neighbouring the villages of Parca, Iquiuca, Quipisca and Mamiña, among others. These areas are under a Chilean state’s special administrative regime (Área de Desarrollo Indígena) and are subject to territorial claims by different Indigenous organisations. We are engaging with Indigenous peoples to include their voices during the study phases for these projects. Despite experiencing challenges with some engagements, Cerro Colorado is working on an update of the strategy with Indigenous communities, aimed at reaching agreements with as many communities/associations as possible.
Canada
In FY2024, we started to operationalise two draft milestones in the Canadian Indigenous Partnership Plan (CIPP) while it was under development. The recommended review and refresh of our internal Indigenous awareness training that is delivered to all employees and contractors that work at our Jansen site is underway and will include Indigenous perspectives in the Effective Leadership training. Additionally, Human Resources conducted an external review of the human resources policies to support Indigenous inclusion. A new employee resource group for Indigenous employees located in Canada, Indigenous@BHP Canada, was created in FY2024 and has been meeting regularly to determine how best to support recruitment, retention and advancement for current and future Indigenous employees.
Legacy assets
BHP owns more than 20 former copper, uranium and other mine sites, called legacy assets, in the US southwest and across Canada. Many of these sites are in the traditional territories of Native American Tribes and First Nations. The legacy assets are in a state of closure or post-closure and focused on tailings and water management, risk mitigation and technical studies, closure and environmental remediation projects, and general site care and maintenance. We recognise closure is a long-term process, and that Indigenous peoples have an interest in seeing the sites returned to as close to a natural state as possible. BHP engages with Indigenous groups near our legacy assets and is in varying stages of resetting or establishing collaborative working relationships and partnerships.
Resolution Copper
Resolution Copper Mining is owned by Rio Tinto (55 per cent) and BHP (45 per cent), and managed by Rio Tinto. We acknowledge the Resolution Copper project area includes areas of cultural significance for Native American Tribes and their members, and is the subject of ongoing litigation. Development of the project continues to be studied and remains subject to regulatory reviews by federal, state and local governments. Resolution Copper Mining continues to cooperatively engage in these regulatory processes and has publicly stated its commitment to deepening ongoing engagement with Native American Tribes and stakeholders to understand and seek to mitigate potential adverse impacts, while also collaborating to create shared value opportunities. We are monitoring Resolution Copper Mining’s engagement, FPIC and agreement-making processes.
82
Table of Contents
6.13 Independent Assurance Report to the Management and Directors of BHP Group Limited (‘BHP’)
Not required for US reporting.
83
Table of Contents
7 Samarco
Fundão dam failure
As a result of the Fundão dam failure in November 2015, a significant volume of tailings (39.2 million cubic metres) resulting from the iron ore beneficiation process was released. Tragically, 19 people died as a result of the failure. The communities of Bento Rodrigues, Paracatu de Baixo and Gesteira were flooded and other communities and the environment downstream in the Doce River basin were also affected.
Samarco restarted its operations at a reduced production level in December 2020 and is currently operating at 31 per cent of its production capacity.
>For information on Samarco’s operations refer to OFR 5.3
Our response and support for the Foundation
Following the dam failure, BHP Brasil1 has been and remains fully committed to supporting the extensive ongoing remediation and compensation efforts of Renova Foundation in Brazil. BHP Brasil’s commitment to collectively seek solutions for a full, fair and definitive response remains unwavering.
In March 2016, a Framework Agreement entered into between Samarco, Vale, BHP Brasil and relevant Brazilian authorities established the Renova Foundation, a not-for-profit, private foundation responsible for implementing 42 remediation and compensatory programs. BHP Brasil, along with Samarco and Vale, provide support and funding to the Renova Foundation, including through representation in its governance structures.
As of 30 June 2024, the Renova Foundation has spent R$37 billion (approximately US$7.7 billion) on remediation and compensation programs, of which approximately US$2.6 billion has been provided by BHP Brasil.
Renova Foundation
Compensation and financial assistance
The Renova Foundation continues to provide compensation to people impacted by the dam failure, oversees an extensive community resettlement program and manages measures to remediate the environment affected.
Compensation and financial assistance of approximately R$17.5 billion (approximately US$3.5 billion)2 as of 30 June has been paid to support approximately 430,000 people affected by the dam failure. This includes:
| • | Approximately R$12.2 billion (approximately US$2.5billion)2 paid to approximately 110,000 people under the court-mandated simplified indemnity system (known as the Novel system). The Novel system was designed to provide compensation for informal workers who have had difficulty proving the damages they suffered, such as cart drivers, sand miners, artisanal miners and street vendors. The court determined the closure of the Novel system for new entries in September 2023. |
| • | Approximately 33,000 people received emergency financial assistance. |
| • | Approximately 39,000 people received general damages (including for loss of life, injury, property damage, business impacts, loss of income and moral damages) and more than 290,000 people have been paid a total of approximately R$305.6 million (approximately US$69 million)2 for temporary water interruption. |
>For updates on reparation progress refer to bhp.com/what-we-do/global-locations/brazil/samarco-reparations
Resettlement
A key priority for the Renova Foundation is the resettlement of the communities of Novo Bento Rodrigues, Paracatu and Gesteira. For Novo Bento Rodrigues and Paracatu, priority efforts included construction of houses and private property, such as small businesses and churches, as well as infrastructure and public services, including roads, power, water and sewer networks, health and services centres and schools. At Gesteira, pursuant to an agreement finalised in May 2023 and ratified by the court, families and the public authorities have opted to receive compensation instead of building a new community.
As at 30 June 2024, approximately 91 per cent of resettlement cases have been completed, either via completion of construction (with families moving in or handover to families in progress) or cash payment for those families who have opted for this option instead of the other resettlement solutions offered by the Renova Foundation. More than 260 families are now living in their new homes in Novo Bento Rodrigues and Paracatu, as well as other locations.3
Footnotes
| 1. | BHP Billiton Brasil Ltda (BHP Brasil) and Vale S.A. (Vale) are 50:50 shareholders in Samarco Mineração S.A. (Samarco), the independent operator of Samarco. |
| 2. | USD amount is calculated based on actual transactional (historical) exchange rates related to Renova funding. |
| 3. | For those families who chose not to join the resettlement with their previous community and instead resettled elsewhere. |
Novo Bento Rodrigues and Paracatu are now functioning communities. Water treatment stations, a health centre, a church, a football field, as well as multiple businesses are operating, including supermarkets, restaurants, bars, retail shops and service stations. Additionally, community-led traditional festivities, such as Carnival and other religious events, are taking place regularly in both towns.
The resettlements have involved ongoing engagement and consultation with a large number of stakeholders, including the affected community members, their technical advisers, state prosecutors, municipal leaders, regulators and other interested parties.
The new towns were designed on land chosen by the communities to be as close as possible to the previous layout, addressing the wishes and needs of the families and communities while also meeting permitting requirements. Each family receives access to an architect to design their house within size parameters, which is then finalised and built by the Renova Foundation.
Mandated COVID-19 workforce restrictions and suspensions of works on-site from 2020 to 2022, increases to the technical scope for resettlement of the communities and permitting delays have impacted the timeline for completion. Ongoing efforts to accelerate completions while maintaining the safety requirements continued throughout FY2024.
84
Table of Contents
>For updates on reparation progress refer to bhp.com/what-we-do/global-locations/brazil/samarco-reparations
Other socio-economic programs
The Renova Foundation continues to implement a wide range of socio-economic programs in addition to compensation and resettlement programs. These programs cover health and infrastructure projects in the Doce River basin, promotion of economic development in the impacted communities and sewage treatment facilities to further improve the water quality in the Doce River.
Regarding infrastructure projects, the Risoleta Neves Hydroelectric Power Plant (Candonga), which was shut down after the Fundão dam failure, restarted its operations in the state of Minas Gerais in March 2023. Additionally, 18 new water pipelines have been built in the Doce River, including one to serve the population of Governador Valadares, the biggest city in the river basin, and 19 water treatment supply systems have been upgraded to provide alternative water sources.
Environmental remediation
Since December 2019, the impacted riverbanks and floodplains have been vegetated, river margins stabilised and in general, water quality and sediment qualities have returned to historic levels. The Renova Foundation continues implementing long-term monitoring and compensatory initiatives.
The Brazilian Water Agency, a federal body responsible for the implementation of Brazilian water resources, has classified the water from the Doce River as Class II, which means the water can be used for human consumption after conventional treatment, the protection of aquatic habitats and primary contact recreation, such as swimming, water skiing and diving, among other things. This is supported by approximately 1.5 million pieces of data generated annually along the Doce River by the largest watercourse monitoring system in Brazil, which is led by the Renova Foundation together with six public agencies, including the National Water and Sanitation Agency. Additionally, according to information provided by municipalities and water supply institutions, since December 2015 most of the population in the Doce River basin is using and consuming the river water after conventional treatment.
To further improve water quality in the Doce River, as compensation, the Renova Foundation has made R$840 million (approximately US$174 million) available for sanitation projects to prevent pollution from untreated sewage, given approximately 270 million cubic metres of untreated sewage is deposited into the Doce River every year – approximately six times the volume of non-toxic tailings that was released from Fundão. Additionally, R$1.7 billion (approximately US$352 million) was made available for forest recovery. It is intended that in total 40,000 hectares and 5,000 springs will be fully restored in a partnership with approximately 2,000 rural properties.
A ban on fishing activities along the coast of Espírito Santo and a precautionary conservation restriction preventing fishing for native fish species in the Doce River in Minas Gerais remain in place. The Renova Foundation continues to engage with authorities with the goal of lifting the restrictions.
>For updates on reparation progress refer to bhp.com/what-we-do/global-locations/brazil/samarco-reparations
Legal proceedings
BHP Group Limited, BHP Group (UK) Ltd (formerly BHP Group Plc) and BHP Brasil are involved in legal proceedings relating to the Fundão dam failure.
BHP Brasil, Samarco, Vale and several public authorities have been engaging in negotiations to seek a definitive and substantive settlement of certain claims relating to the Fundão dam failure.
>For information on the significant legal proceedings and settlement negotiation process involving BHP refer to Additional information 8
8 How we manage risk
Risk management helps us to protect and create value, and is central to achieving our purpose and strategic objectives. Our Risk Framework has four pillars: risk strategy, risk governance, risk process and risk intelligence.
Risks associated with the organisations, businesses or assets that we acquire are transitioned to BHP’s Risk Framework as part of integration activities, which generally involves a transitional period. Risk integration of our OZ Minerals assets (excluding the OZ Minerals Brazil assets which are subject to ongoing strategic review) remains on track for completion by the end of CY2024.
Risk strategy
Risk classification
We classify all risks to which BHP is exposed using our Group Risk Architecture. This is a tool designed to identify, analyse, monitor and report risk, which provides a platform to understand and manage risks. Similar risks are considered together in groups and categories. This is designed to give the Board and management visibility over the aggregate exposure to risks on a Group-wide basis and support performance monitoring and reporting against BHP’s risk appetite.
85
Table of Contents
Risk appetite
BHP’s Risk Appetite Statements, aligned to our Group Risk Architecture, are approved by the Board and are a foundational element of our Risk Framework. They provide guidance to management on the amount and type of risk we seek to take in pursuing our objectives.
Key risk indicators
Key risk indicators (KRIs) are set by management to help monitor performance against our risk appetite. They also support decision-making by providing management with information about financial and non-financial risk exposure at a Group level. Each KRI has a target, or optimal level of risk we seek to take, as well as upper and lower limits. Where either limit is exceeded, management will review potential causes to understand if BHP may be taking too little or too much risk and to identify whether further action is required.
Risk culture
Our risk management approach is underpinned by a risk culture that supports decision-making in accordance with BHP’s values, objectives and risk appetite. We use a common foundation across BHP to build the tools and capabilities required to enable us to understand, monitor and manage our risk culture. These include the risk-culture assessments undertaken as part of our internal audit plan.
Strategic business decisions
Strategic business decisions and the pursuit of our strategic objectives can inform, create or affect risks to which BHP is exposed. These risks may represent opportunities as well as threats. Our Risk Appetite Statements and KRIs assist in determining whether a proposed course of action is consistent with BHP’s risk appetite.
Our focus when managing risks associated with strategic business decisions is to enable the pursuit of high-reward strategies. Therefore, as well as having controls designed to protect BHP from threats, we seek to implement controls to enable and/or enhance opportunities.
Risk governance
Three lines model
BHP uses the ‘three lines model’ to define the role of different teams across the organisation in managing risk. This approach sets clear accountabilities for risk management and provides appropriate ‘checks and balances’ to support us in protecting and growing value.
The first line is provided by our frontline staff, operational management and people in functional roles – anyone who makes decisions, deploys resources or contributes to an outcome is responsible for identifying and managing the associated risks.
The Risk team and other second-line teams are responsible for providing expertise, support, monitoring and challenge on risk-related matters, including by defining Group-wide minimum standards.
The third line, our Internal Audit team, is responsible for providing independent and objective assurance over the control environment (governance, risk management and internal controls) to the Board (including applicable Board Committees) and Executive Leadership Team. Additional assurance may also be provided by external providers, such as our External Auditor.
The Risk team and Internal Audit team are led by the Chief Risk and Audit Officer. This structure facilitates overall effectiveness of both teams, including through alignment of second- and third-line assurance activities across BHP, while maintaining the independence of our Internal Audit team through appropriate safeguards.
BHP Board and Committees
The Board reviews and monitors the effectiveness of the Group’s systems of financial and non-financial risk management and internal control. The broad range of skills, experience and knowledge of the Board assists in providing a diverse view on risk management. The Risk and Audit Committee (RAC) and Sustainability Committee assist the Board by reviewing and considering BHP’s material risk profile (covering operational, strategic and emerging risks) on a biannual basis.
Risk management performance is monitored and reported to the RAC, as well as the Sustainability Committee for health, safety, environment and community matters, supporting the Board to challenge and hold management to account.
For information on other Board Committee activities that support risk governance at BHP refer to Corporate Governance Statement 5
Risk process
Our Risk Framework requires identification and management of risks (both threats and opportunities) to be embedded in business activities through the following process:
| • | Risk identification – threats and opportunities are identified and each is assigned an owner or accountable individual. |
| • | Risk assessments – risks are assessed using appropriate and internationally recognised techniques to determine their potential impacts and likelihood, prioritise them and inform risk treatment options. |
| • | Risk treatment – controls are implemented to prevent, minimise and/or mitigate threats, and enable and/or enhance opportunities. |
| • | Monitoring and review – risks and controls are reviewed periodically and on an ad hoc basis (including where there are high-potential events or changes in the external environment) to evaluate performance. |
| • | Communication – relevant information is recorded in our enterprise risk management system to support continuous improvement and share risk intelligence across the Group. |
Our Risk Framework includes requirements and guidance on the tools and processes to manage current and emerging risks.
86
Table of Contents
Current risks
Current risks are risks that could impact BHP today or in the near future and comprise current operational risks (risks that have their origin inside BHP or occur as a result of our activities) and current strategic risks (risks that may enhance or impede the achievement of our strategic objectives).
Current risks include material and non-material risks (as defined by our Risk Framework). The materiality of a current risk is determined by estimating the maximum foreseeable loss (MFL) if that risk were to materialise. The MFL is the estimated impact to BHP in a worst-case scenario without regard to probability and assuming all controls, including insurance and hedging contracts, are ineffective.
For more information on our risk factors refer to OFR 8.1
Our focus for current risks is to prevent their occurrence or minimise their impact should they occur, but we also consider how to maximise possible benefits that might be associated with strategic risks (as described in the Risk strategy section). Current material risks are required to be evaluated once a year at a minimum to determine whether our exposure to the risk is within our target range.
Emerging risks
Emerging risks are newly developing or changing risks that are highly uncertain and difficult to quantify. They are generally driven by external influences and often cannot be prevented by BHP.
BHP maintains a ‘watch list’ of emerging themes and monitors associated signals to interpret external events and trends, providing an evolving view of the changing external environment and how it might impact our business. We use the watch list and signal monitoring to support the identification and management of emerging risks, as well as to inform and test our corporate strategy.
Once identified, our focus for emerging risks is on structured monitoring of the external environment, advocacy efforts to reduce the likelihood of the threats manifesting and identifying options to increase our resilience to these threats.
Risk intelligence
The Risk team provides the RAC, Sustainability Committee and senior management with insights on risk management across BHP. Risk reports may include trends, aggregate exposure and performance for our most significant risks, updates on the Risk Framework and risk management priorities, an overview of (and material changes in) BHP’s material risk profile and updates on emerging risk themes and signals.
We maintain a risk insights dashboard designed to provide current, data-driven and actionable risk intelligence to our people at all levels of the business to support decision-making. This tool empowers the business to manage risks more effectively, with increased accuracy and transparency.
The Board, RAC and Sustainability Committee also receive other reports to support the Board to review and monitor the effectiveness of BHP’s systems of financial and non-financial risk management. Examples of these include internal audit reports, ethics and investigations reports, compliance reports and the Chief Executive Officer’s report.
For information on our risk factors refer to OFR 8.1
8.1 Risk factors
Our risk factors are described below and may occur as a result of our activities globally, including in connection with our operated and non-operated assets, third parties engaged by BHP or through our value chain. These risks, individually or collectively, could threaten our strategy, business model, future performance, solvency or liquidity and reputation. They could also materially and adversely affect the health and safety of our people or members of the public, the environment, the communities where we or our third-party partners and providers operate, or the interests of our partners and stakeholders, which could in each case lead to litigation, regulatory investigations or enforcement actions (including class actions or actions arising from contractual, legacy or other liabilities associated with divested assets), or a loss of partner, stakeholder and/or investor confidence. References to ‘financial performance’ include our financial condition and liquidity, including due to decreased profitability or increased operating costs, capital spend, remediation costs or contingent liabilities. BHP may also be exposed to risks that we currently believe to be immaterial that may materially affect our business if they occur.
Risk factor: Operational events
Risks associated with operational events in connection with our activities globally, resulting in significant adverse impacts on our people, communities, the environment or our business.
Why is this important to BHP?
We engage in activities that have previously caused and have the potential to further cause harm to our people and assets, communities, other stakeholders and/or the environment, including serious injuries, illness and fatalities, loss of infrastructure, amenities and livelihood, and damage to sites of cultural significance. An operational event at our operated or non-operated assets or through our value chain could also cause damage or disruptions to our assets and operations, impact our financial performance, result in litigation or class actions and cause long-term damage to our licence to operate and reputation. Potential physical climate-related impacts could increase the likelihood and/or severity of risks associated with operational events. Impacts of operational events may also be amplified if one event triggers another (for example, a geotechnical instability event that causes a failure in a nearby tailings storage facility) or if we fail to respond to any events in a way that is consistent with our corporate values and partner and stakeholder expectations.
Examples of potential threats
| • | Air, land (road and rail) and marine transportation events (such as aircraft crashes or vessel collisions, groundings or hydrocarbon release) that occur while transporting people, supplies or products, including to or from exploration, operation or customer locations. These locations may be in or require travel through areas of cultural significance or remote and environmentally sensitive areas, including in Australia, South America, Asia, the United States, Canada and Sweden. |
87
Table of Contents
| • | Failure of a water or tailings storage facility, such as the tragic failure of the Fundão dam at Samarco in 2015 or a failure at one of our other facilities in Australia, Chile, Peru, the United States, Canada or Brazil. |
| • | Unplanned fire events or explosions (on the surface or underground). |
| • | Geotechnical instability events (such as failure of underground excavations, which may be subject to greater risk than surface mines, unexpected large wall instabilities in our open-pit mines, or potential interaction between our mining activities and community infrastructure or natural systems), including at our mines in Australia, Chile, Peru, the United States, Canada or Brazil. |
| • | Critical infrastructure, equipment, or hazardous materials containment failures, other occupational or process safety events or workplace exposures. |
| • | Operational events experienced by third parties, which may also result in unavailability of shared critical infrastructure (such as railway lines or ports) or transportation routes (such as the Port Hedland channel in Western Australia). |
| • | An operational event that may adversely affect our people and assets, communities, other stakeholders and/or the environment, including serious injuries, illness and fatalities, loss of infrastructure and damage to sites of cultural significance. |
| • | Our operations, workforce, communities, supply chains, customers and third-party partners and providers may be increasingly exposed to changes in the frequency, intensity and/or duration of intense storms, drought, flooding, wildfire and other extreme weather or weather-related events and patterns (such as extreme heat). |
Risk factor: Significant social or environmental impacts
Risks associated with significant impacts of our operations on and contributions to communities and environments throughout the life cycle of our assets and across our value chain.
Why is this important to BHP?
The long-term viability of our business is closely connected to the wellbeing of the communities and environments where we have a presence and our business is subject to increasing, complex and changing regulatory and stakeholder expectations. At any stage of the asset life cycle, our activities and operations may have or be perceived to have significant adverse impacts on communities and environments. In these circumstances, we may fail to meet the evolving expectations of our partners and stakeholders (including investors, governments, employees, suppliers, customers and Indigenous peoples and other community members) whose support is needed to realise our strategy and purpose. This could lead to loss of partner or stakeholder support or regulatory approvals, increased taxes and regulation, enforcement action, litigation (including class actions), or otherwise impact our licence to operate and adversely affect our reputation, ability to attract and retain talent, ability to access capital, operational continuity and financial performance.
Examples of potential threats
| • | Engaging in or being associated with activities (including through non-operated joint ventures and our value chain) that have or are perceived to have individual or cumulative adverse impacts on nature (including biodiversity, land, waters and air), climate change, supply chain or responsible sourcing requirements, human rights or Indigenous peoples’ rights or cultural heritage. |
| • | Failing to meet evolving partner or stakeholder expectations in connection with our alignment with global frameworks and societal goals, our strategic decisions, legal and regulatory obligations, acceptability of mining activities, relationships with Indigenous peoples, community wellbeing and the way we invest in communities or our approach to nature (including biodiversity, land, waters and air), climate change, supply chain or responsible sourcing requirements, human rights, Indigenous peoples’ rights or cultural heritage priorities. |
| • | Political, regulatory and judicial developments (such as legislation to enact policy positions on climate change, nature-related risk or human rights) could increase uncertainty in relation to our operating environment, and/or require us to adjust our business plans or strategy. For example, changes to regulations may require us to modify mine plans, limit our access to reserves and resources, alter the timing or increase costs associated with exploration and development of and production from, or closure and rehabilitation of, our assets, increase sourcing costs or expose BHP to unanticipated environmental or other legacy liabilities. |
| • | Failing to adequately identify or to appropriately manage physical climate-related risks and/or nature-related risks to biodiversity and ecosystems. For example, loss of important biodiversity and/or ecosystems as a result of operational activities (e.g. unauthorised clearing of vegetation) could result in land access restrictions, a decrease in demand for our products or limit our access to new opportunities. |
Risk factor: Optimising growth and portfolio returns
Risks associated with our ability to position our asset portfolio to generate returns and value for shareholders, including through acquisitions, mergers and divestments.
Why is this important to BHP?
We make decisions and take actions in pursuit of our strategy to optimise our asset portfolio and to secure and create growth options in future-facing commodities (such as copper, nickel and potash). These may include active portfolio changes such as the recent sale of the Daunia and Blackwater mines in Queensland, the acquisition of OZ Minerals and, if completed, the proposed acquisition of Filo Corp and agreement to form a joint venture with Lundin Mining. These may also include supporting innovative early-stage mineral exploration companies (including for example through our accelerator program, BHP Xplor), and maturing and developing organic growth options across our existing portfolio. A strategy that does not support BHP’s objectives and/or ill-timed execution of our strategy, or other circumstances, may lead to a loss of value that impacts our ability to deliver returns to shareholders and fund our investment and growth opportunities. It may also result in our asset portfolio being less resilient to climate-related risks or movements in commodity prices, or inflationary pressures and other macroeconomic factors. In the short term, adverse movements in commodity prices may reduce our cash flow, ability to access capital or pay dividends. A failure to optimise our asset portfolio for structural movements in commodity prices (including those arising from climate-related risks) over the long term may result in asset impairments and could adversely affect the results of our operations, financial performance and returns to investors.
88
Table of Contents
Examples of potential threats
| • | Commodity prices have historically been and may continue to be subject to significant volatility, including due to global economic and geopolitical factors, industrial activity, commodity supply (including the development of new resources and supply chain disruptions) and demand (including inventory levels), technological change, product substitution, tariffs, interest rate movements and exchange rate fluctuations. Our usual policy and practice is to sell our products at prevailing market prices and, as such, movements in commodity prices may affect our financial performance. Long-term price volatility, sustained low prices or increases in costs may adversely impact our financial performance as we do not generally have the ability to offset costs through price increases. |
| • | Failure to optimise our portfolio through effective and efficient acquisitions, exploration, large project delivery, mergers, divestments or expansion of existing or acquired assets (including due to sub-optimal capital prioritisation) may adversely impact our performance and/or returns to investors. |
| • | Failure to identify potential changes in commodity attractiveness and missed entry or commodity exit opportunities may result in decreased return on capital spend for, or overpayment to acquire or invest in, new assets or projects, stranded assets or reduced divestment proceeds. |
| • | Failure to achieve expected commercial objectives from assets or investments, such as cost savings, increased revenues or improved operational performance (including as a result of inaccurate commodity price assumptions or resources and reserves estimates), may result in returns that are lower than anticipated and loss of value. This could be exacerbated by impacts from factors such as climate-related risks, supply chain disruptions (for example, disruption in the energy sector impacting our end-user markets), labour shortages, inflationary pressures and unfavourable exchange rates, creating operational headwinds and challenging on-time and on-budget project delivery. |
| • | Renegotiation or nullification of permits, inability to secure new permits or approvals, increased royalties, such as the Queensland Government’s increase in coal royalty tax in June 2022, fiscal or monetary policy instability or changes may increase our costs or adversely impact our ability to achieve expected commercial objectives from assets or investments, access reserves, develop, maintain or operate our assets, enter new jurisdictions, or otherwise optimise our portfolio. |
| • | Inability to predict long-term trends in the supply, demand and price of commodities and optimise our asset portfolio accordingly may restrict our ability to generate long-term returns from the portfolio. For example, slowing economic growth in China, political and trade tensions, market volatility or the global transition to a low-carbon economy may result in lower demand and prices for some of our products, which may in turn adversely impact our portfolio returns. |
| • | Partnering with companies for growth may also damage our reputation and lead to increased potential for litigation if those companies or associated activities are misaligned with our values, standards or stakeholder expectations, particularly in circumstances in which we do not operate the asset or have a controlling interest in the venture. |
Risk factor: Low-carbon transition
Risks associated with the transition to a low-carbon economy.
Why is this important to BHP?
| • | Transition risks arise from existing and emerging policy, regulatory, legal, technological, market and other societal responses to the challenges posed by climate change and the transition to a low-carbon economy. As a world-leading resources company, BHP is exposed to a range of transition risks that could affect the execution of our strategy or our operational efficiency, asset values and growth options, resulting in a material adverse impact on our financial performance, share price or reputation, including increased potential for litigation. The complex and pervasive nature of climate change means transition risks are interconnected with and may amplify our other risk factors. Additionally, the inherent uncertainty of potential societal responses to climate change may create a systemic risk to the global economy and our business. |
Examples of potential threats
| • | Introduction or improvement of low-carbon technologies or changes in customer preference for products that support the transition to a low-carbon economy may decrease demand for some of our products, increase our costs or decrease the availability of key inputs to production. For example: |
| • | Rapid shift to alternative steelmaking technology pathways (including electric arc furnace (EAF) and direct reduced iron (DRI) steelmaking) may reduce anticipated demand for our steelmaking coal and may result in the early closure or divestment of our steelmaking coal mines. |
| • | Increased recovery and reuse rates of commodities may reduce demand for our products. |
| • | New battery technologies that use no or less nickel could enter the market and reduce demand for our nickel products. |
| • | Adverse macroeconomic changes, such as a decline in global economic activity and/or security, could be exacerbated by the transition to a low-carbon economy and reduce anticipated demand for our future-facing commodities, such as copper and nickel. |
| • | Perceptions of climate-related financial risk and/or social concerns around climate change may result in investors divesting our securities or changing their expectations or requirements for investment in our securities, cause financial institutions not to provide financing or other products (such as insurance cover) to BHP or to our suppliers or customers, affect our suppliers’ willingness to provide goods or services, and affect our customers’ wish to procure our commodities. In turn, these factors could increase our costs and adversely impact our ability to optimise our portfolio and pursue growth opportunities. |
| • | Perceived or actual misalignment of BHP’s climate actions (goals, targets and performance) with societal and investor expectations, or a failure to deliver our climate actions, may result in damage to our reputation, reduced investor confidence, climate-related litigation (including class actions) or give rise to other adverse regulatory, legal or market responses. |
89
Table of Contents
| • | Sub-optimal selection, quality, implementation or effectiveness of technology and related low-carbon supplies that are intended to contribute towards the delivery of our climate targets, goals and strategies, or unavailability of that technology and related low-carbon supplies (including due to the failure of trials of new technology, a failure of external equipment manufacturers or suppliers to deliver on schedule or competition for limited supply) could prevent, limit, delay or increase costs in achieving our plans for operational decarbonisation. |
| • | Changes or ambiguity in laws, regulations, policies, obligations, government actions and our ability to anticipate and respond to such changes or accurately interpret the ambiguity, including GHG emission targets and schemes, restrictive licensing, carbon taxes, carbon offsetting regulations, border adjustments or the addition or removal of subsidies, may give rise to adverse regulatory, legal or market responses. For example, the implementation of regulations intended to reduce GHG emissions in the steel industry in China could adversely impact demand for our steelmaking coal or iron ore. In addition, inadequate market supply of credible carbon credits or price volatility in carbon markets could increase our operating costs or result in adverse social value or compliance implications. Inconsistent or developing regulatory regimes globally may increase the likelihood of an inadvertent failure to or inability to comply with some regulations and exacerbate the impacts of transition risks. |
Risk factor: Accessing key markets
Risks associated with market concentration and our ability to sell and deliver products into existing and future key markets, impacting our economic efficiency.
Why is this important to BHP?
We rely on the sale and delivery of the commodities we produce to customers around the world. Changes to laws, international trade arrangements, contractual terms or other requirements and/or geopolitical developments could result in physical, logistical or other disruptions to our operations in or the sale or delivery of our commodities to key markets. These disruptions could affect sales volumes or prices obtained for our products, adversely impacting our financial performance, results of operations and growth prospects.
Examples of potential threats
| • | Government actions, including economic sanctions, tariffs or other trade restrictions, imposed by or on countries where we operate or into which we sell or deliver our products may prevent BHP from selling or make it more difficult for BHP to sell in key markets. |
| • | Physical disruptions to the delivery of our products to customers in key markets, including due to the disruption of shipping routes, closure or blockage of ports or land logistics (road or rail), armed conflict or criminality and organised crime. In some cases, physical disruptions may be driven or intensified by weather and climate variability, including as potentially exacerbated or affected by climate change. Our operations are located in remote and environmentally sensitive areas, which may be particularly exposed to climate-related disruptions. |
| • | Legal or regulatory changes (such as new or increased royalties or taxes; government-mandated price caps; port, export or import restrictions or customs requirements; shipping/maritime regulatory changes; restrictions on movements or imposition of quarantines; or changing environmental restrictions or regulations, including measures with respect to carbon-intensive industries or imports) and commercial changes (such as changes to the standards, preferences and requirements of customers) may adversely impact our ability to sell, deliver or realise full market value for our products. |
| • | Failure to maintain strong relationships with customers or changes to customer demands for our products may reduce our market share or adversely impact our financial performance. |
| • | Increasing geopolitical tensions (including the Russia-Ukraine and Middle Eastern conflicts) may adversely affect our strategic and business planning decisions and/or increase the time it takes us to manage our access to key markets, particularly if we fail to detect or anticipate deviations in the geopolitical environment in a timely manner. |
Risk factor: Adopting technologies and maintaining digital security
Risks associated with adopting and implementing new technologies, and maintaining the effectiveness of our existing digital landscape (including cyber defences) across our value chain.
Why is this important to BHP?
Our business and operational processes are increasingly dependent on the effective application and adoption of technology, which we use as a lever to deliver on our current and future operational, financial and social objectives. This exposes BHP to risks originating from adopting or implementing new technologies, or failing to take appropriate action to position BHP for the digital future, which may impact the capabilities we require, the effectiveness and efficiency of our operations and our ability to compete effectively. New technology adopted in our business may not perform as anticipated and may result in unintended impacts on our operations. We may also fail to maintain the effectiveness of our existing and future digital landscape, including cyber defences, exposing us to technology availability, reliability and cybersecurity risks. These could lead to operational events, commercial disruption (such as an inability to process or ship our products), corruption or loss of system data, misappropriation or loss of funds, unintended loss or disclosure of commercial or personal information, enforcement action or litigation, which could also impact the environment and partners, suppliers and stakeholders across our value chain. Additionally, an inability to adequately maintain existing technology or implement critical new technology, or any sustained disruption to our existing technology may adversely affect our licence to operate, reputation, results of operations and financial performance.
Examples of potential threats
| • | Cybersecurity events or attacks on our information or operational technology systems, including on third-party partners and providers (such as our cloud service providers), may result in a failure of business-critical technology systems at one or more of our assets, which may reduce operational productivity, result in environmental damage, fines, penalties, litigation, regulatory or governmental investigations, workforce disruption, prolonged negative media attention and/or adversely impact safety and financial performance. We have experienced cybersecurity threats in the past and may experience them in the future and, as our dependence on information systems, including those of our third-party partners and providers, grows, we may become more vulnerable to an increasing threat of continually evolving cybersecurity risks. |
90
Table of Contents
| • | Failure to invest in appropriate technologies or to keep pace with advancements in technology that support the pursuit of our objectives may adversely impact the effectiveness or efficiency of our business and erode our competitive advantage. For example, a failure to implement appropriate technologies that support our assets to produce higher-grade commodities or less waste from existing resources (such as ongoing initiatives to incorporate new technologies and data analytics to leaching processes) could limit our ability to sell our commodities or reduce costs. |
| • | Failure to identify, access and secure necessary infrastructure and key inputs (including electricity, internet bandwidth, data, software, licences or other rights in intellectual property, hardware and talent) to support new technology innovations and advanced technologies may adversely affect our ability to adopt, operate or retain access to those technologies. This includes Artificial Intelligence (AI) and machine learning, process automation, robotics, data analytics, cloud computing, smart devices and remote working solutions. For example, adopting new technology to reduce GHG emissions using alternative energy sources may require new infrastructure, while effective implementation of new digital technologies (such as machine learning) may be heavily dependent on access to data. In addition, the use of Al and machine learning may increase our exposure to cybersecurity risks and additional risks relating to the protection of data, including increased exposure of confidential or otherwise protected information to unauthorised recipients, which could result in liability under or termination of our contracts with third parties, misuse of our intellectual property or other unintended consequences. |
| • | Failure to adopt or successfully integrate new technology, technology enhancements or technology acquired through inorganic growth (such as through acquisition of a company with different types and standards of securities, technologies and systems) may result in impacts to our business and operations. This could lead to operational stoppage events, commercial disruption (such as an inability to pay or accept payment), inability to disclose accurately or an inability to adequately maintain existing technology. |
| • | Failure or outage of our information or operational technology systems. |
Risk factor: Ethical misconduct
Risks associated with actual or alleged deviation from societal or business expectations of ethical behaviour (including breaches of laws or regulations) and wider or cumulative organisational cultural failings, resulting in significant reputational impacts.
Why is this important to BHP?
Actual or alleged conduct of BHP or our people or third-party partners and providers that deviates from the standard of ethical behaviour required or expected of us could result in reputational damage or a breach of law or regulations. Such conduct includes fraud, corruption, anti-competitive behaviour, money laundering, breaching trade or financial sanctions, market manipulation, privacy breaches, ethical misconduct, failure to comply with regulatory requirements and wider organisational cultural failings. A failure to act ethically or legally may result in negative publicity, investigations, public inquiries, regulatory enforcement action, litigation or other civil or criminal proceedings, other forms of compensation or remediation, or increased regulation. It could also threaten the validity of our tenements or permits, or adversely impact our reputation, results of operations, financial performance or share price. Impacts may be amplified if our senior leaders fail to uphold BHP’s values or address actual or alleged misconduct in a way that is consistent with societal, partner and stakeholder expectations. Our workplace culture may also be eroded, adversely affecting our ability to attract and retain talent. Risks and impacts are also heightened by the complex and continuously evolving legal and regulatory frameworks that apply to the jurisdictions where we operate and potentially conflicting obligations under different national laws.
Examples of potential threats
| • | Failing to prevent breaches of international standards, laws, regulations or other legal, regulatory, ethical, environmental, governance or compliance obligations, such as external misstatements, inaccurate financial or operational reporting or a breach of our continuous disclosure obligations. |
| • | Corruption (for example, in connection with the acquisition of early-stage options in a country with weaker governance standards), market misconduct or anti-competitive behaviour, including in relation to our joint venture operations. |
| • | Failing to comply with trade or financial sanctions (which are complex and subject to rapid change and may potentially result in conflicting obligations), health, safety and environmental laws and regulations, native title and other land rights or tax or royalty obligations. |
| • | Failing to protect our people from harm (including to mental and physical health) due to misconduct that takes place in connection with their work, such as discrimination or sexual harassment. |
| • | Failing to uphold BHP’s values or address actual or alleged misconduct may adversely impact workplace culture and may expose BHP to regulatory action or litigation, adversely impacting our reputation and ability to attract and retain talent. |
Risk factor: Inadequate business resilience
Risks associated with unanticipated or unforeseeable adverse events and a failure of planning and preparedness to respond to, manage and recover from adverse events (including potential physical climate-related impacts).
Why is this important to BHP?
In addition to the threats described in our other risk factors, our business could experience unanticipated, unforeseeable or other adverse events (internal or external) that could harm our people, disrupt our operations or value chain or damage our assets or corporate offices, including our non-operated assets in which BHP has a non-controlling interest. A failure to identify or understand exposure, adequately prepare for these events (including maintaining business continuity plans) or build wider organisational resilience may inhibit our (or our third-party partners and providers’) ability to respond and recover in an effective and efficient manner. This includes a failure to build resilience to physical climate-related risks. Material adverse impacts on our business include reduced ability to access resources, markets and the operational or other inputs required by our business, reduced production or sales of or demand for, our commodities, or increased regulation, which could adversely impact our financial performance, share price or reputation and could lead to litigation (including class actions).
91
Table of Contents
Examples of potential threats
| • | Geopolitical, global economic, regional or local developments or adverse events, such as social unrest, strikes, work stoppages, labour disruptions, social activism, terrorism, bomb threats, economic slowdown, acts of war or other significant disruptions in areas where we operate or have interests. |
| • | Extreme weather and climate-related events, such as heatwaves, extreme precipitation and flooding, hurricanes, cyclones and fires. For example, production at our steelmaking coal asset, BMA, was partly impacted in H1 FY2024 due to depleted inventory positions that arose from extended weather impacts on the east coast of Australia. |
| • | Other natural events, including earthquakes, tsunamis, wildfires, solar flares and pandemics. |
| • | Potential physical climate-related impacts, such as acute risks that are event driven (including increased frequency and severity of extreme weather events) and chronic risks resulting from longer-term changes in climate patterns. Climate hazards may include changes in precipitation patterns, water shortages, rising sea levels, increased storm intensity, prolonged extreme temperatures and increased drought, fire and flooding. |
| • | Failure by suppliers, contractors or joint venture partners to perform existing contracts or obligations (including due to insolvency), such as construction of large projects or supply of key inputs to our business (for example, consumables for our mining equipment). |
| • | Failure of our risk management or other processes (including controls) to prepare for or manage any of the risks discussed in this Risk factors section may inhibit our (or our third-party partners and providers’) ability to manage any resulting adverse events and may disrupt our operations or adversely impact our financial performance or reputation. This includes unknown pre-existing failures in organisations, businesses or assets that we acquire through non-organic growth, as well as any failures that occur during their integration to our business (for example, due to different standards or systems). |
8.2 Management of risks
Each risk factor may present opportunities as well as threats. We take certain risks for strategic reward in the pursuit of our strategy and purpose, including to grow our asset portfolio and develop the right capabilities for the future of our business. Some of the potential threats and opportunities associated with each of our risk factors are described below, along with the key controls to manage them. These controls are not exhaustive and many Group-wide controls (such as Our Code of Conduct, Risk Framework, mandatory minimum performance requirements for risk management, health, safety and other matters, dedicated non-operated joint venture teams and our Contractor Management Framework) help to support effective and efficient management of all risks in line with our risk appetite. While we implement preventative and/or mitigating controls designed to reduce the likelihood of a threat from occurring and minimise the impacts if it does, these may not always be effective.
Risk factor: Operational events
Examples of potential opportunities
| • | Our commitment to our communities, the environment and the safety and wellbeing of our people may increase operational resilience as well as partner and stakeholder confidence, enhancing our ability to attract and retain talent and access (or lower the cost of) capital. |
| • | Collaborating with industry peers and relevant organisations on minimum standards (such as the internationally recognised Flight Safety Foundation’s Basic Aviation Risk Standard, Global Industry Standard on Tailings Management, Large Open Pit Project guidelines on open-pit mining design and management, and the Cave Mining 2040 Consortium on deep mining design and management) supports improvements to wider industry management of operational risks and may also identify opportunities to improve our own practices. |
Key management actions
| • | Planning, designing, constructing, operating, maintaining and monitoring surface and underground mines, water and tailings storage facilities, and other infrastructure and equipment in a manner designed to maintain structural integrity, prevent incidents and protect our people, assets, communities, the environment and other stakeholders. |
| • | Specifying minimum requirements and technical specifications, such as for transportation (including high-occupancy vehicles, fixed and rotary wing aircraft and their operators) and geotechnical (including characterisation, design, ground control and monitoring), and focusing on compliance with operating specifications, industry codes and other relevant standards, including BHP’s mandatory minimum performance requirements. |
| • | Continuing to focus on improving our management of safety risks, including through investigation and response to the recent fatal incidents across our operations, and through programs such as the Fatality Elimination and Field Leadership Programs. |
| • | Defining key governance roles, such as a dam owner (an internal BHP individual who is accountable for maintaining effective governance and integrity of each tailings storage facility) and providing training and qualifications for our people. |
| • | Inspections, technical reviews, audits and other assurance activities, such as independent dam safety reviews and geotechnical review boards. |
| • | Maintaining evacuation routes, supporting equipment, crisis and emergency response plans and business continuity plans. |
| • | Incorporating future climate projections into risks associated with operational events through ongoing assessment of physical climate-related risks. |
92
Table of Contents
FY2024 insights
Our exposure to risks associated with operational events remained broadly stable in FY2024. BHP achieved conformance to the Global Industry Standard on Tailings Management for ‘Very High’ and ‘Extreme’ rated facilities in H1 FY2024, supporting our continued focus to further improve the safety and integrity of all facilities across our operated and closed assets.
For more information refer to
| • | OFR 6.1 – Safety |
| • | OFR 6.4 – Material topics for sustainability reporting |
| • | OFR 6.6 – People |
| • | OFR 6.7 – Health |
| • | OFR 6.9 – Climate change |
| • | OFR 6.10 – Environment and nature |
| • | OFR 6.11 – Community |
| • | OFR 6.12 – Indigenous peoples |
| • | OFR 7 – Samarco |
| • | bhp.com/sustainability |
Risk factor: Significant social or environmental impacts
Examples of potential opportunities
| • | Our support for responsible stewardship of natural resources may enhance the resilience of the environments and communities where we operate to threats (including potential physical climate-related impacts and nature loss). |
| • | Strong social performance, including sustainable mining and a focus on the wellbeing of communities, could generate competitive advantage in the jurisdictions where we operate. |
| • | Our global social value framework and projects funded through social investment may improve partner and stakeholder relations, enhance community trust and increase investor confidence and demand for our commodities. |
| • | Greater clarity, transparency and standards associated with regulatory regimes that support and protect communities and the environment may increase requirements across our sector, generating competitive advantage for companies that have already invested in social and environmental performance. |
Key management actions
| • | The Community Global Standard, the Environment Global Standard, the Climate Change Global Standard and our mandatory minimum performance requirements for water, closure and legacy management, and social value and sustainability are designed to set out our targets, goals, commitments and/or approach to these matters, strengthening our social, human rights and environmental performance. |
| • | Engaging in regular, open and transparent dialogue with partners and stakeholders to better understand their expectations, concerns and interests, undertaking research to better understand partner and stakeholder perceptions, and taking those considerations into account in planning and execution activities. |
| • | Continuing to operationalise our Indigenous Peoples Policy Statement, including by introducing procedures for projects and assets to identify and assess potential adverse impacts to Indigenous peoples, and to engage and consult with them to better understand how we can avoid, mitigate and/or substantially address any adverse impacts. |
| • | Building social value into our decision-making process, along with financial considerations, including through our social value framework and 2030 goals. |
| • | Building partner and stakeholder trust and contributing to environmental and community resilience, including through collaborating on shared challenges (such as climate change and nature), enhanced external reporting of our operated assets’ potential impacts on nature, and maximising the value of social investments (including contributing to climate-related initiatives) through our social investment strategy. |
| • | Conducting regular research and impact assessments for operated assets to better understand the social, environmental, human rights and economic context. This supports us to identify and analyse potential partner, stakeholder, community and human rights impacts, including modern slavery risks and emerging issues. We also complete risk-based due diligence screening on suppliers through our Ethical Supply Chain and Transparency program. |
| • | Integrating closure into our planning, decision-making and other activities through the life cycle of our operated assets, as set out in our mandatory minimum performance requirements for closure and legacy management. |
FY2024 insights
Our exposure to risks with potentially significant social or environmental impacts steadily increased in FY2024 due to greater external stakeholder expectations for corporate social and environmental performance, including aspects of climate change and nature. The intersections between climate change, nature, Indigenous peoples and human rights are becoming more widely understood by civil society, contributing to an evolving and increasingly complex risk landscape. To support effective management of these risks, we continue to monitor and seek to better understand the intersecting risk landscape and integrate controls into our management systems.
93
Table of Contents
For more information refer to
| • | OFR 6.5 – 2030 goals |
| • | OFR 6.6 – People |
| • | OFR 6.9 – Climate change |
| • | OFR 6.10 – Environment and nature |
| • | OFR 6.11 – Community |
| • | OFR 6.12 – Indigenous peoples |
| • | bhp.com/sustainability |
Risk factor: Optimising growth and portfolio returns
Examples of potential opportunities
| • | Acquisition of new resources or acceleration of organic growth options in future-facing commodities may strengthen and diversify our portfolio and protect and grow value over the long term. |
| • | Ability to predict long-term commodity demand, supply and price trends may lead to BHP being able to identify and acquire new future-facing commodities and assets ahead of our competitors or exit from declining commodities in a timely manner, strengthening our portfolio and leading to long-term, higher portfolio returns. |
| • | BHP may be perceived as a welcome and valued or preferred partner for the development of new resource opportunities, enabling us to secure new assets or exploration opportunities to create long-term optionality in the portfolio. |
Key management actions
| • | Further developing strategies, processes and frameworks to grow and protect our portfolio and to assist in delivering ongoing returns to shareholders, including: |
| • | our Capital Allocation Framework, corporate planning processes and investment management processes |
| • | annual reviews (including resilience testing) of portfolio valuations |
| • | our exploration, ventures (such as BHP Ventures), accelerators (such as BHP Xplor) and business development programs, which focus on replenishing our resource base and enhancing our portfolio (including creating and securing more options in future-facing commodities) |
| • | our long-term strategic outlook and ongoing strategic processes to assess our competitive advantage and enable the identification of threats to or opportunities for our portfolio through forecasting and scenario modelling |
| • | monitoring signals to interpret external events and trends, and designing commodity strategies and price protocols that are reviewed by management and the Board |
| • | our balance sheet and liquidity framework, which is designed to maintain a robust balance sheet with sufficient liquidity and access to diverse sources of funding, to enable us to be ready to pursue growth opportunities as and when they arise |
| • | Pursuing a considered approach to new country entry, including further building our capability to operate in higher-risk jurisdictions, in order to support portfolio opportunities. |
| • | Further developing BHP’s social value proposition to position BHP as a preferred partner for the development of resource opportunities in line with the expectations of local communities, host governments and other global stakeholders. |
FY2024 insights
Our exposure to risks associated with optimising growth and portfolio returns remained stable in FY2024 as we continued to implement a growth agenda focused on aligning the portfolio towards future-facing commodities. In particular, in FY2024 we completed the sale of the Daunia and Blackwater mines in Queensland to Whitehaven Coal, approved an investment in stage two of the Jansen potash project in Canada, and continued to pursue options to build our portfolio in future-facing commodities. We also made the decision to temporarily suspend Western Australia Nickel as a result of oversupply in the global nickel market. Forecast nickel prices for the next half of the decade have fallen sharply due to strong growth in alternative, low-cost nickel supply.
For more information refer to
| • | OFR 3 – Positioning for growth |
| • | OFR 9 – Performance by commodity |
94
Table of Contents
Risk factor: Low-carbon transition
Examples of potential opportunities
| • | Our copper, nickel, iron ore, steelmaking coal and uranium provide essential building blocks for existing and new renewable energy infrastructure and alternative power generation and electric vehicles, and can play an important part in the transition to a low-carbon economy. |
| • | Our potash fertiliser options, once operational, have the potential to promote more efficient and profitable agriculture and help alleviate the increased competition for arable land, including due to implementation of nature-based solutions to help address climate change and global population growth. |
| • | Increased collaboration with customers, suppliers and original equipment manufacturers, such as BHP’s partnerships with ArcelorMittal, BlueScope, China Baowu, HBIS Group, JFE, POSCO and Tata Steel to explore technologies to reduce GHG emissions across the steel value chain, can provide opportunities for the development of new products and markets. |
Key management actions
| • | Establishing public positions on, and mandatory minimum performance requirements for, managing climate change risks (threats and opportunities), which are set out in our Climate Change Report 2020, our Climate Transition Action Plan 2024 and the Environment Global Standard and the Climate Change Global Standard. |
| • | Using climate-related scenarios, as well as our planning cases and other themes and signposts (such as monitoring policy, regulatory, legal, technological, market and other societal developments) to evaluate the resilience of our portfolio, allocate capital and inform our strategy. |
| • | Considering transition risks (including carbon prices) when making capital expenditure decisions or allocating capital through our Capital Allocation Framework, supporting the prioritisation of capital and investment approval processes. |
| • | Seeking to mitigate our exposure to risks arising from policy and regulation in our operating jurisdictions and markets by reducing our operational GHG emissions and supporting GHG emission reductions in our value chain. |
| • | Informing investors on progress to date and plans for achieving our operational and value chain GHG emissions goals and targets, for example, through investor briefings and publications, including our Climate Transition Action Plan 2024. |
| • | Advocating for the introduction of an effective, internationally aligned long-term policy framework that can deliver a measured transition to a low-carbon economy. |
FY2024 insights
Our exposure to transition risks increased during FY2024 due to continued societal expectations for accelerated decarbonisation by companies, significant regulatory developments across the globe (such as the enhanced Safeguard Mechanism enacted into law in Australia) and commitment by 130 countries at the 2023 United Nations Climate Change Conference to triple global renewable energy generation capacity by 2030. Many jurisdictions (including Australia) have implemented, are in the process of designing, or are considering, mandatory climate-related financial reporting regimes (including the introduction of the Climate-related financial disclosures Bill into the Australian Parliament) and – in some cases – broader sustainability reporting requirements. This includes the EU’s Corporate Sustainability Reporting Directive (CSRD), and a growing number of jurisdictions have announced an intention to adopt the IFRS Sustainability Disclosure Standards developed by the International Sustainability Standards Board (ISSB). There are also increased efforts by some governments to fund expansion of renewable energy generation and technologies that help enable the energy transition, which may increase the scale and pace of the low-carbon transition, and influence the availability of lower GHG emissions technology options for BHP. These external developments present both threats and opportunities for BHP as we continue to increase our portfolio exposure to future-facing commodities.
For more information refer to
| • | BHP Climate Change Report 2020 |
| • | BHP Climate Transition Action Plan 2024 |
| • | OFR 3 – Positioning for growth |
| • | OFR 6.5 – 2030 goals |
| • | OFR 6.9 – Climate change |
| • | OFR 6.10 – Environment and nature |
| • | bhp.com/sustainability/climate-change |
Risk factor: Accessing key markets
Examples of potential opportunities
| • | Monitoring macroeconomic, societal, geopolitical and policy developments and trends may reveal new markets or commodities, identify opportunities to strengthen secondary markets for existing products or identify a potential competitive advantage or price premium for existing products. |
| • | Developing strategic partnerships and strong, mutually beneficial relationships with our customers may enable us to create value. |
| • | Building a deep understanding of geopolitical threats and opportunities and their potential impacts on global trade flows and our business could enhance our strategy, business planning and response, providing a potential future competitive advantage. |
| • | Identifying the potential for weather and climate variability, including as potentially exacerbated or affected by climate change, to disrupt delivery of products and implementing management measures, may increase the resilience of our operations and value chain. |
95
Table of Contents
| • | Monitoring signals and building relationships with and understanding the perspectives of influential partners and stakeholders may improve our ability to understand and provide input to policy development, and to respond to and manage any impacts from policy changes (such as trade policies). |
Key management actions
| • | Monitoring and assessing our ability to access key markets, and maintaining sales plans, product placement and business resilience strategies and relationships with relevant partners and stakeholders. |
| • | Maintaining response plans for various scenarios (including physical disruptions of logistics) to mitigate disruptions to our ability to access key markets. |
| • | Monitoring geopolitical and macroeconomic developments and trends, including through signal monitoring and our enterprise-level watch list of emerging themes, to provide an early indication of events that could impact our ability to access or offer opportunities in relation to key markets. |
| • | Identifying weather and/or climate-related vulnerabilities and implementing controls to mitigate disruptions to our ability to physically access key markets. |
| • | Diversifying our asset and commodity portfolio, such as our ongoing investment in potash through the Jansen potash project, to reduce exposure to market concentration risks. |
FY2024 insights
Exposure to risks associated with access to key markets remained broadly stable in FY2024. We continue to observe global armed conflict, political tensions, ineffective law enforcement and governance, resource and economic nationalism, social instability, and environmental deterioration. Although we have limited influence over changes in our external environment, we continue to focus on management of these risks, including through diversifying our portfolio to reduce exposure to market concentration risk.
Risk factor: Adopting technologies and maintaining digital security
Examples of potential opportunities
| • | Applying digital solutions across our operations may unlock greater productivity and safety performance. For example, using predictive analytics to enable operations to identify asset condition and efficiencies may improve safety, production and equipment availability, and reduce maintenance and other costs. |
| • | Technology solutions to reduce GHG emissions may support BHP, our suppliers and customers in achieving climate action targets and goals. For example, BHP signed an agreement in December 2023 with HBIS Group trialling alternative steelmaking technology pathways including direct reduced iron production designed to lower blast furnace carbon emissions, with the aim of supporting the global energy transition. |
| • | Developing AI in a safe and responsible manner in exploration, mine planning, remote operation and advanced robotic technologies may identify or provide access to previously unknown or inaccessible deposits and development of end-to-end autonomous mining systems. |
| • | Using digital simulations and predictive trend modelling may enable us to optimise the deployment of new technologies, such as automation and electrification, support early identification of process variances and faults, and support the marketing of our products to customers. |
Key management actions
| • | Employing a number of measures designed to protect against, detect and respond to cyber threats, events or attacks, including BHP’s mandatory minimum performance requirements for technology and cybersecurity, cybersecurity performance requirements for suppliers, cybersecurity resilience programs, an enterprise security framework and cybersecurity standards, cybersecurity risk and control guidance, security awareness programs and training to build capability, security assessments and continuous monitoring, restricted physical access to hardware and crisis management plans. |
| • | Managing localised or project-specific exposure to technology and cyber risks at the asset, function or project level, including risks associated with business-critical technology systems. Enterprise-level risks that are specific to technology, such as those that pose a greater threat to our wider business and strategic opportunities, are generally managed by our global Technology team and other relevant stakeholders to support delivery of our technology strategy. |
| • | Maturing a Data Strategy to improve data quality and management of critical data that enhances our adoption of digital technologies. |
| • | Monitoring regulatory changes and collaborating with industry stakeholders, research partners and policymakers to design company guidelines (such as our AI Strategy and Framework, and Responsible AI principles) and to develop, implement and maintain technological solutions with appropriate guardrails and controls in place that support compliance with an evolving regulatory environment and meet societal expectations. |
FY2024 insights
Our exposure increased in FY2024 due to elevated external cybersecurity threat conditions with high-profile cyber incidents experienced by other businesses across Australia and abroad. We continue to monitor and manage the increasing exposure, including through leveraging next generation technologies. Our focus is on strengthening the management of cybersecurity risk and controls across BHP, as well as monitoring third-party events (including in relation to our third-party partners and providers) that may impact our business.
96
Table of Contents
For more information refer to
| • | OFR 2 – What differentiates us |
| • | OFR 6.9 – Climate change |
Risk factor: Ethical misconduct
Examples of potential opportunities
| • | Our capability to manage ethical misconduct risks may expand portfolio growth options by providing greater assurance that we can operate legally and ethically in high-risk jurisdictions. |
| • | Managing ethical misconduct risks in line with societal, partner and stakeholder expectations may distinguish BHP from competitors and enhance our ability to raise capital, attract and retain talent, engage with governments and communities in new jurisdictions, obtain permits, partner with external organisations or suppliers, or market our products to customers. |
| • | Playing a leading role in the management of ethical misconduct risks, such as sexual harassment risks, may help BHP to increase ethical and behavioural standards across the resources industry. |
Key management actions
| • | Setting the ‘tone from the top’ through Our Charter, which is central to our business and describes our purpose, values and how we measure success. |
| • | Implementing internal policies, standards, systems and processes for governance and compliance to support an appropriate culture and prioritise respectful behaviours at BHP, including: |
| • | Our Code of Conduct (Our Code) and BHP’s mandatory minimum performance requirements for business conduct, market disclosure and other matters |
| • | training on Our Code and in relation to anti-corruption, market conduct, trade sanctions, data privacy and competition laws |
| • | ring fencing protocols to separate potentially competing businesses within BHP |
| • | governance and compliance processes, including procurement and other internal controls, and tailored monitoring of control effectiveness |
| • | oversight and engagement with high-risk areas by our Ethics and Investigations, Compliance and Internal Audit teams, and the Risk and Audit Committee |
| • | review and endorsement by our Compliance team of the highest-risk transactions, such as gifts and hospitality, engagement of third parties, community donations and sponsorships above defined thresholds |
| • | automated counterparty and transaction screening against lists of entities subject to trade sanctions |
| • | our reporting channels for raising misconduct concerns (comprising an online portal and confidential 24-hour multilingual call service), supported by an ethics and investigations framework and central investigations team |
| • | campaigns and sessions held globally by our leaders to set expectations around racism, sexual harassment and other disrespectful behaviours, including our ‘Active Bystander’ training that is designed to empower everyone across BHP to call out disrespectful and harmful behaviours |
| • | Continuing to enforce Our Code via appropriate investigations and responses, including disciplinary action, in addition to deployment of appropriate controls to prevent harm (including to mental and physical health). |
| • | Requiring anti-corruption and human rights risks to be considered as part of our new country entry approval process. |
FY2024 insights
Our exposure to ethical misconduct risks increased in FY2024 due to heightened trade sanctions risks, including an increase in the volume and complexity of trade sanctions measures globally. Our Compliance team continues to focus on control enhancements to manage evolving threats (such as trade sanctions) and strengthen key anti-corruption and other compliance controls across the Group, including in relation to the integration of OZ Minerals. With BHP’s continued focus on portfolio growth, there is a potential for further increases in exposure to anti-corruption and other ethical misconduct risks in higher-risk jurisdictions.
For more information refer to
| • | Our Charter and Our Code of Conduct |
| • | OFR 6.6 – People |
| • | OFR 6.8 – Ethics and business conduct |
| • | OFR 6.11 – Community |
| • | OFR 6.12 – Indigenous peoples |
| • | Corporate Governance Statement |
97
Table of Contents
Risk factor: Inadequate business resilience
Examples of potential opportunities
| • | Risk identification and management supports proactive, focused and prioritised deployment of resources to reduce exposure to adverse events. It may be used to inform priorities and strategies across BHP, supporting a proportionate and cost-effective response, which could provide a competitive advantage at a regional or global level. |
| • | Building wider organisational resilience may enable us to maintain dividends to shareholders amid adverse external events and make growth-generating, counter-cyclical investments, as well as to help us mitigate the impacts of unforeseeable adverse events. |
| • | Adaptation to climate change across our operations and in our value chain could enhance the safety, productivity and climate resilience of our operated assets, position BHP as a supplier of choice and enhance our ability to consistently grow value. Support for climate-vulnerable communities and ecosystems may also improve our social value proposition. |
Key management actions
| • | Implementing Group-wide controls to enhance business resilience, including BHP’s mandatory minimum performance requirements for security, crisis and emergency management and business continuity plans, and seeking to maintain an investment grade credit rating. |
| • | Monitoring our current state of readiness (preparedness, redundancy and resilience), including through scenario analysis and business resilience exercises, supporting organisational capability in our operations, functions and senior management to effectively and efficiently respond to and recover from adverse events should they materialise. |
| • | Monitoring the external environment, including political and economic factors, through signal monitoring, our geopolitical monitoring and public policy frameworks and our enterprise-level watch list of emerging themes, to support early identification of policy changes or adverse events for which we may need to increase preparedness. |
| • | Identifying security threats that could directly or indirectly impact our operations and people in countries of interest to BHP. |
| • | Further developing and implementing our adaptation strategy with respect to physical climate-related risks, including requiring operated assets and functions to identify and progressively assess physical climate-related risks (including to our value chain) and seeking to build climate change adaptation into their plans, activities and investments. |
| • | Maintaining quality, centralised climate data covering each of our operating locations so that our people have access to appropriate data to support climate studies that can be used to inform investment decisions around enhancing our operational resilience. |
FY2024 insights
Our exposure to risks associated with inadequate business resilience increased in FY2024. The United Nations Framework Convention on Climate Change Secretariat’s NDC Synthesis Report (released in November 2023) noted national climate action plans remain insufficient to limit global temperature rises to 1.5°C and, according to the World Meteorological Organisation, CY2023 was the warmest year on record with further natural disasters and prolonged weather events experienced across the globe. Additionally, a global rise in conflict, instability and criminality in CY2023 created new security challenges. Our Security team continues to monitor the evolving external security environment to better understand how it can impact BHP and our industry and how we can manage associated exposure.
For more information refer to
| • | BHP Climate Change Report 2020 |
| • | BHP Climate Transition Action Plan 2024 |
| • | OFR 6.1 – Safety |
| • | OFR 6.7 – Health |
| • | OFR 6.9 – Climate change |
| • | OFR 6.10 – Environment and nature |
| • | bhp.com/sustainability |
98
Table of Contents
9 Performance by commodity
Management believes the following information presented by commodity provides a meaningful indication of the underlying financial and operating performance of the assets, including equity accounted investments, of each reportable segment. Information relating to assets that are accounted for as equity accounted investments is shown to reflect BHP’s share, unless otherwise noted, to provide insight into the drivers of these assets.
>For more information as to the statutory determination of our reportable segments refer to Financial Statements note 1 ‘Segment reporting’
Unit costs is one of our non-IFRS financial measures used to monitor the performance of our individual assets and is included in the analysis of each reportable segment.
>For the definition and method of calculation of our non-IFRS financial measures, including Underlying EBITDA and Unit costs, refer to OFR 10
9.1 Copper
Detailed below is financial and operating information for our Copper assets comparing FY2024 to FY2023.
Year ended 30 June US$M | 2024 | 2023 | ||||||
Revenue | 18,566 | 16,027 | ||||||
Underlying EBITDA | 8,564 | 6,653 | ||||||
Net operating assets | 36,368 | 34,229 | ||||||
Capital expenditure | 3,711 | 2,698 | ||||||
Underlying ROCE | 13% | 12% | ||||||
Total copper production (kt) | 1,865 | 1,717 | ||||||
Average realised prices | ||||||||
Copper (US$/lb) | 3.98 | 3.65 | ||||||
Unit Costs | ||||||||
Escondida (US$/lb) | 1.45 | 1.40 | ||||||
Spence (US$/lb) | 2.13 | 2.11 | ||||||
Copper South Australia (US$/lb)1 | 1.37 | – | ||||||
|
|
|
| |||||
| 1. | FY2023 comparative is not disclosed as Copper South Australia includes Olympic Dam as well as Prominent Hill and Carrapateena which were acquired on 2 May 2023 as part of the acquisition of OZL which only contributed to the performance of the business from the date of acquisition. |
Key drivers of Copper’s financial results
Price overview
Copper prices rose in H2 FY2024, with the LME official cash settlement price hitting a new record high in May on bullish investor sentiment, fuelled by expectations of lower interest rates in the United States, possible copper smelter cuts in China and the LME banning the delivery of Russian metal. However, copper prices then moderated by the end of FY2024, reflecting underlying near-term fundamentals with weak Chinese demand and rising stocks. In the near term, slowing demand growth in China due to continued weakness in the real estate sector is expected to be partially offset by more positive trends in power grid spending and consumer durable goods. We anticipate Europe will be slower to recover from weakness in manufacturing, while the United States will continue to improve more swiftly due to a more resilient underlying economy. We now expect CY2024 to be in marginal surplus, a reflection of softer demand expectations for China and higher supply. In the medium to longer term, traditional demand (such as home building, electrical equipment and household appliances) is expected to remain solid and demand from emerging sectors, such as artificial intelligence and data centres, should add to this. The decarbonisation megatrend is also expected to bolster demand. We anticipate that the cost curve required to meet that demand is likely to steepen as challenges to the development of new resources progressively increase. This implies that should deficits occur in this phase, as we expected they will, fly-up pricing may well occur and in turn this could spur inducement of new, higher cost supply in the long term.
Production
Total Copper production for FY2024 increased by 9 per cent to 1,865 kt.
Escondida copper production increased by 7 per cent to 1,125 kt primarily due to higher concentrator feed grade of 0.88 per cent, compared to 0.82 per cent in FY2023. The positive impact of the higher grade was partially offset by planned lower cathode production as a result of prioritising concentrator throughput in prior years.
Pampa Norte copper production decreased by 8 per cent to 266 kt including a record 255 kt at Spence and 11 kt at Cerro Colorado. Spence production increased 6 per cent driven by improved concentrator throughput and increases in both concentrator feed grade and recoveries, partially offset by lower cathode production in line with expected decline in stacked feed grade. Cerro Colorado entered temporary care and maintenance in December 2023.
Copper South Australia copper production increased by 39 per cent to 322 kt from the successful integration of OZ Minerals (OZL) following the acquisition in FY2023. The processing of Prominent Hill and Carrapateena concentrate at Olympic Dam resulted in annual records for cathode and gold production at Olympic Dam. The successful commissioning and ramp up of Crusher 2 led to record material mined and concentrate produced at Carrapateena.
Antamina copper production increased by 4 per cent to 144 kt, as a result of record concentrator throughput offsetting planned lower feed grades. Zinc production was 17 per cent lower at 103 kt, as a result of planned lower feed grades.
Carajás produced 8.4 kt of copper and 5.8 troy koz of gold.
99
Table of Contents
Financial results
Copper revenue increased by US$2.5 billion to US$18.6 billion in FY2024 due to higher average realised copper prices and increased sales volumes following the successful integration of OZL following the acquisition in FY2023.
Underlying EBITDA for Copper increased by US$1.9 billion to US$8.6 billion. Price impacts, net of price-linked costs, increased Underlying EBITDA by US$1.4 billion. Higher sales volumes increased Underlying EBITDA by US$0.6 billion driven by the successful integration of OZL, higher feed grade at Escondida and record concentrate production at Spence offset by planned lower cathode volumes at Spence.
Controllable cash costs increased by US$0.2 billion, primarily due to higher maintenance at Escondida and higher exploration spend at Copper South Australia (Copper SA) for drilling activities at Oak Dam.
Favourable foreign exchange rate movements increased EBITDA by US$0.3 billion.
Inflation negatively impacted Underlying EBITDA by US$0.3 billion but was offset by lower fuel, energy and consumable price movements of US$0.3 billion. An increase in Non-cash costs of US$0.3 billion related to lower stripping capitalisation at Escondida and Spence, reflecting the phase of the respective mine plans.
Outlook
Total Copper production of between 1,845 and 2,045 kt is expected in FY2025.
Escondida production of between 1,180 and 1,300 kt is expected in FY2025, reflecting both an expected increase in concentrator feed grade and throughput compared to FY2024.
Spence production of between 240 and 270 kt is expected in FY2025.
Copper South Australia production of between 310 and 340 kt is expected in FY2025.
Antamina copper production of between 115 to 135 kt due to mine sequencing resulting in lower throughput, and zinc production of between 90 and 110 kt is expected in FY2025.
Escondida unit costs in FY2025 are expected to be between US$1.30 and US$1.60 per pound (at an exchange rate of USD/CLP 842).
Spence unit costs in FY2025 are expected to be between US$2.00 and US$2.30 per pound (at an exchange rate of USD/CLP 842).
Copper South Australia unit costs in FY2025 are expected to be between US$1.30 and US$1.80 per pound (at an exchange rate of AUD/USD 0.66).
Prior year comparatives
The comparison for the year ended 30 June 2023 to 30 June 2022 has been omitted from this annual report on Form 20-F and can be found in our annual report on Form 20-F for the fiscal year ended 30 June 2023, filed on 5 September 2023.
9.2 Iron Ore
Detailed below is financial and operating information for our Iron Ore assets comparing FY2024 to FY2023.
Year ended 30 June US$M | 2024 | 2023 | ||||||
Revenue | 27,952 | 24,812 | ||||||
Underlying EBITDA | 18,913 | 16,692 | ||||||
Net operating assets | 13,812 | 16,956 | ||||||
Capital expenditure | 2,033 | 1,966 | ||||||
Underlying ROCE | 83% | 67% | ||||||
Total iron ore production (Mt) | 260 | 257 | ||||||
Average realised prices | ||||||||
Iron ore (US$/wmt, FOB) | 101.04 | 92.54 | ||||||
Unit Costs | ||||||||
WAIO (US$/t) | 18.19 | 17.79 | ||||||
|
|
|
| |||||
Key drivers of Iron Ore’s financial results
Price overview
Iron ore consumption in China was strong in CY2023. In contrast, steel output continued to contract in developed regions albeit at a slower rate than previous years. Over the next two years we expect a small improvement in global steel production with growth led by India and Southeast Asia, with some additional growth from a recovery in developed regions. After a strong CY2023, we expect Chinese blast furnace run rates to ease in CY2024, under pressure from subdued steel margins and the potential for policy-driven production controls. During H2 FY2024, iron ore prices first declined and then traded in the range of around US$100 to US$120/t. A widening surplus has emerged with Chinese port inventories rising to elevated levels. For the balance of CY2024 and into CY2025, we expect supply from low-cost major iron ore producers to grow while iron ore consumption is experiencing a modest decline. Our estimate of real-time cost support continues to sit in the US$80 – US$100/t range on a 62% Fe CFR basis. Should surpluses persist as we forecast, we would expect some high-cost suppliers may be driven out of the market over time. How quickly and effectively the Chinese policies targeted at the property sector stabilise it, and the government’s approach to regulating steel production, will both be large swing factors for the remainder of CY2024 and into CY2025. In the medium term, China’s demand for iron ore is expected to be lower than it is today as it moves beyond the crude steel production plateau and as the ratio of scrap-based steelmaking rises. We maintain our view that China’s steel production has plateaued above 1.0 and this is likely to continue across the mid-2020s. However, Chinese pig iron production is expected to decline during this period with more recycled scrap used in steelmaking. We expect demand for our products in other developing regions in Asia to offset this to a degree.
100
Table of Contents
Production
Total Iron Ore production increased by 1 per cent to a record 260 Mt.
WAIO achieved record production of 255 Mt (287 Mt on a 100 per cent basis), reflecting strong supply chain performance with increased capacity unlocked by the Port Debottlenecking Project 1 (PDP1) and record production at South Flank. These more than offset the impacts of the continued tie-in activity for the Rail Technology Programme 1 (RTP1). South Flank completed ramp up to full production capacity of 80 Mtpa (100 per cent basis) in FY2024 and following commissioning in December 2023, ramp up of PDP1 remains on track to be completed in CY2024.
Samarco production increased by 5 per cent to 4.7 Mt (BHP share), as a result of higher concentrator throughput.
Financial results
Total Iron Ore revenue increased by US$3.1 billion to US$28.0 billion in FY2024, reflecting higher average realised prices and higher sales volumes as a result of record production from strong supply chain performance with increased capacity unlocked by PDP1 and record production at South Flank.
Underlying EBITDA for Iron Ore increased by US$2.2 billion to US$18.9 billion primarily due to higher average realised prices, net of price-linked costs, of US$2.0 billion. Higher sales volumes increased Underlying EBITDA by US$0.6 billion driven by record production partially offset by US$0.2 billion of higher controllable cash costs as we ramped up South Flank and increased production. Other items, such as inflation and unfavourable foreign exchange rate impacts, were partially offset by lower fuel, energy and consumable price movements collectively reduced Underlying EBITDA by US$0.2 billion.
Outlook
WAIO production is expected to be between 250 and 260 Mt (282 and 294 Mt on a 100 per cent basis) in FY2025 as the Group ramps up the planned tie-in activities for RTP1.
WAIO unit costs in FY2025 are expected to be between US$18.00 and US$19.50 per tonne (based on an exchange rate of AUD/USD 0.66).
Samarco production is expected to be between 5 and 5.5 Mt (BHP share) in FY2025 with the second concentrator expected to come online during Q3 FY2025.
Prior year comparatives
The comparison for the year ended 30 June 2023 to 30 June 2022 has been omitted from this annual report on Form 20-F and can be found in our annual report on Form 20-F for the fiscal year ended 30 June 2023, filed on 5 September 2023.
9.3 Coal
Detailed below is financial and operating information for our Coal assets comparing FY2024 to FY2023.
Year ended 30 June US$M | 2024 | 2023 | ||||||
Revenue | 7,666 | 10,958 | ||||||
Underlying EBITDA | 2,290 | 4,998 | ||||||
Net operating assets | 6,472 | 7,266 | ||||||
Capital expenditure | 646 | 657 | ||||||
Underlying ROCE | 19% | 47% | ||||||
Total steelmaking coal production (Mt) | 22 | 29 | ||||||
Total energy coal production (Mt) | 15 | 14 | ||||||
Average realised prices | ||||||||
Steelmaking coal (US$/t) | 266.06 | 271.05 | ||||||
Hard coking coal (HCC) (US$/t) | 273.03 | 273.59 | ||||||
Weak coking coal (WCC) (US$/t) | 205.54 | 251.13 | ||||||
Thermal coal (US$/t) | 121.52 | 236.51 | ||||||
Unit Costs | ||||||||
BMA (US$/t) | 119.54 | 96.46 | ||||||
|
|
|
| |||||
101
Table of Contents
Key drivers of Coal’s financial results
Price overview
Across FY2024, steelmaking coal prices were relatively stable with an overall slight decline in prices. The demand picture was mixed with strong Indian steel production growth and recovery in the EU from the lows of CY2023, offsetting output contractions in both Northeast Asia and North America. Against this backdrop, Australian supply recovered slower than expectations, while Mongolian exports continued to surge. Notwithstanding recent supply side challenges, we still expect a modest recovery of seaborne supply in the near term. Meanwhile, availability of land borne imports into China and operational recovery of Chinese domestic mines are key uncertainties. On seaborne demand, India is expected to maintain its current strong momentum while OECD importing regions are likely to experience a gradual pickup in their steel industries. While seaborne supply in the steelmaking coal market is expected see a marginal surplus in CY2025 the supply of higher-quality coals is likely to stay relatively tight. Over the longer term, we expect that higher-quality steelmaking coals, such as those produced by our BMA assets, will be valued for their role in reducing the GHG emissions intensity of blast furnaces and, combined with the growth of the steel industry in hard coking coal importing countries such as India, will have growing and resilient demand for decades to come. With the major seaborne supply region of Queensland being currently less conducive to long-life capital investment as a result of changes to the royalty regime, the scarcity value of higher-quality steelmaking coals may well also increase over time.
Production
Steelmaking coal
BMA production decreased by 23 per cent to 22.3 Mt (44.6 Mt on a 100 per cent basis) as a result of increased stripping to improve supply chain stability and restore depleted inventory positions, which arose from extended weather impacts and labour constraints over recent years, and the divestment of Blackwater and Daunia on 2 April 2024. Production was also impacted by an extended longwall move and geotechnical faulting at Broadmeadow during H1 FY2024, and the temporary suspension of operations following the fatality of a team member at Saraji. Blackwater and Daunia produced 5 Mt (10 Mt on a 100 per cent basis) in FY2024 prior to their divestment.
Energy coal
NSWEC production increased by 8 per cent to 15.4 Mt due to strong operating performance as improved weather and labour availability enabled an uplift in truck productivity.
Financial results
Coal revenue decreased by US$3.3 billion to US$7.7 billion in FY2024 mainly due to lower average realised prices, lower volumes at BMA as a result of increased stripping to improve supply chain stability and the divestment of Blackwater and Daunia, partially offset by higher volumes at NSWEC due to strong operating performance.
Underlying EBITDA for Coal decreased by US$2.7 billion to US$2.3 billion. Price impacts, net of price-linked costs, decreased Underlying EBITDA by US$1.5 billion.
Lower sales volumes of US$1.0 billion were due to lower production at BMA, including the divestment of Blackwater and Daunia, partially offset by higher production at NSWEC. Inflation negatively impacted Underlying EBITDA by US$0.1 billion and controllable cash costs increased by US$0.1 billion from higher stripping and contractor costs to support higher production at NSWEC.
Outlook
BMA coal production for FY2025 is expected to be between 16.5 and 19 Mt (33 and 38 Mt on a 100 per cent basis), reflecting the divestment of Blackwater and Daunia and impact of elevated strip ratios as we continue to improve supply chain stability and re-establish raw coal inventory positions.
BMA unit costs in FY2025 are expected to be between US$112 and US$124 per tonne (based on an exchange rate of AUD/USD 0.66).
NSWEC coal production for FY2025 is expected to be between 13 and 15 Mt.
Prior year comparatives
The comparison for the year ended 30 June 2023 to 30 June 2022 has been omitted from this annual report on Form 20-F and can be found in our annual report on Form 20-F for the fiscal year ended 30 June 2023, filed on 5 September 2023.
9.4 Other assets
Detailed below is an analysis of Other assets’ financial and operating performance comparing FY2024 to FY2023.
Western Australia Nickel
Key drivers of Western Australia Nickel’s financial results
Price overview
The nickel industry moved into significant surplus during CY2023. Indonesia produced almost 20 per cent of global primary nickel in CY2019, and that share increased to over 50 per cent by CY2023. This came at a time of weak traditional stainless steel demand in the OECD and global battery value chain destocking. The nickel market weakness has continued into CY2024 albeit with a brief price rebound in May on supply curtailments and disruptions in Australia and New Caledonia. On the demand side, electric vehicle sales remained solid in China, but penetration rates in the OECD have slowed in parallel with weaker traditional stainless steel demand for nickel, which caused global visible nickel stocks to rise. These trends are expected to continue into CY2025 suggesting that the market will remain in surplus over that period. While voluntary curtailments continue to occur across the industry, including by BHP, these are still not near the scale that would be expected to balance the market near term. We estimate that we are still in a multi-year run of surpluses. Longer term, we see the market rebalancing in the late 2020s as we continue to believe nickel will be a core beneficiary of the electrification megatrend.
102
Table of Contents
Production
Nickel West production increased by 2 per cent to 81.6 kt, as we produced a higher proportion of the lower value matte products as a result of increased maintenance at Kwinana Refinery and severe weather events.
Financial results
Western Australia Nickel revenue decreased by US$0.5 billion to US$1.5 billion in FY2024, reflecting lower average realised prices.
Underlying EBITDA for Western Australia Nickel decreased by US$0.5 billion to a loss of US$0.3 billion. Price impacts, net of price-linked costs, decreased Underlying EBITDA by US$0.4 billion. Controllable cash costs increased by US$0.1 billion due to increased third-party ore purchases following delivery issues in FY2023.
Outlook
On 11 July 2024, we announced the temporary suspension of operations at Western Australia Nickel and that operations will be suspended by October 2024 and handover activities for temporary suspension will be completed by December 2024. BHP intends to review the decision to temporarily suspend Western Australia Nickel by February 2027.
Potash
Potash recorded an Underlying EBITDA loss of US$255 million in FY2024, compared to a loss of US$205 million in FY2023.
Jansen Stage 1 is 52 per cent complete and remains on track for first production in late CY2026 with a two-year expected ramp up period. The engineering work and execution of procurement agreements is largely complete. In FY2024, a longer than usual summer season enabled early completion of the mill’s foundation. In FY2025, underground and surface construction works will continue, including structural, mechanical and electrical activities for the mill areas. The Group also expects to complete the conversion of the service shaft headframe to a permanent structure.
Jansen Stage 2 execution activity has now commenced and is 2 per cent complete, with first production expected in FY2029, followed by an expected three-year ramp-up period. In FY2025, the focus will be on detailed engineering, procurement for major equipment and construction packages, and structural steel fabrication.
Price overview
Potash demand has been strong in CY2024, after a sharp rebound in CY2023, with global potash shipments this year estimated to return to its previous CY2020 peak level of 72 Mtpa, driven by good affordability and inventory build-up. In the medium-term existing capacity in the FSU is expected to trend back to normal operating rates, while new supply could also come from the region, including some expansion projects potentially resuming construction. Longer term, we believe that potash stands to benefit from the intersection of global megatrends: rising population, changing diets and the need for the more sustainable intensification of agriculture on the globe’s finite arable land. We consider this compelling demand picture, rising geopolitical uncertainty and the maturity of the existing production asset base to provide an attractive entry opportunity in a lower-risk supply jurisdiction such as Saskatchewan, Canada.
Prior year comparatives
The comparison for the year ended 30 June 2023 to 30 June 2022 has been omitted from this annual report on Form 20-F and can be found in our annual report on Form 20-F for the fiscal year ended 30 June 2023, filed on 5 September 2023.
9.5 Impact of changes to commodity prices
The prices we obtain for our products are a key driver of value for BHP. Fluctuations in these commodity prices affect our results, including cash flows and asset values. The estimated impact of changes in commodity prices in FY2024 on our key financial measures is set out below.
| Impact on profit after taxation (US$M) | Impact on Underlying EBITDA (US$M) | |||||||
US¢1/lb on copper price | 26 | 37 | ||||||
US$1/t on iron ore price | 163 | 233 | ||||||
US$1/t on steelmaking coal price | 7 | 10 | ||||||
US$1/t on energy coal price | 10 | 14 | ||||||
US¢1/lb on nickel price | 1 | 1 | ||||||
103
Table of Contents
10 Non-IFRS financial information
We use various non-IFRS financial information to reflect our underlying financial performance.
Non-IFRS financial information is not defined or specified under the requirements of IFRS, but is derived from the Group’s Consolidated Financial Statements prepared in accordance with IFRS. The non-IFRS financial information and the below reconciliations included in this Report are unaudited. The non-IFRS financial information presented is consistent with how management reviews financial performance of the Group with the Board and the investment community.
Sections 10.1 and 10.2 outline why we believe non-IFRS financial information is useful and the calculation methodology. We believe non-IFRS financial information provides useful information, however should not be considered as an indication of, or as a substitute for, statutory measures as an indicator of actual operating performance (such as profit or net operating cash flow) or any other measure of financial performance or position presented in accordance with IFRS, or as a measure of a company’s profitability, liquidity or financial position.
The following tables provide reconciliations between non-IFRS financial information and their nearest respective IFRS measure.
Exceptional items
To improve the comparability of underlying financial performance between reporting periods, some of our non-IFRS financial information adjusts the relevant IFRS measures for exceptional items.
>For more information on exceptional items refer to Financial Statements note 3 ‘Exceptional items’
Exceptional items are those gains or losses where their nature, including the expected frequency of the events giving rise to them, and impact is considered material to the Group’s Consolidated Financial Statements. The exceptional items included within the Group’s profit for the financial years are detailed below.
Year ended 30 June | 2024 US$M | 2023 US$M | 2022 US$M | |||||||||
Continuing operations | ||||||||||||
Revenue | – | – | – | |||||||||
Other income | 877 | – | 840 | |||||||||
Expenses excluding net finance costs, depreciation, amortisation and impairments | (139 | ) | (103 | ) | (494 | ) | ||||||
Depreciation and amortisation | – | – | – | |||||||||
Net impairments | (3,800 | ) | – | – | ||||||||
(Loss)/profit from equity accounted investments, related impairments and expenses | (3,032 | ) | 215 | (676 | ) | |||||||
|
|
|
|
|
| |||||||
Profit/(loss) from operations | (6,094 | ) | 112 | (330 | ) | |||||||
|
|
|
|
|
| |||||||
Financial expenses | (506 | ) | (452 | ) | (290 | ) | ||||||
Financial income | – | – | – | |||||||||
|
|
|
|
|
| |||||||
Net finance costs | (506 | ) | (452 | ) | (290 | ) | ||||||
|
|
|
|
|
| |||||||
Profit/(loss) before taxation | (6,600 | ) | (340 | ) | (620 | ) | ||||||
|
|
|
|
|
| |||||||
Income tax (expense)/benefit | 837 | (266 | ) | (454 | ) | |||||||
Royalty-related taxation (net of income tax benefit) | – | – | – | |||||||||
|
|
|
|
|
| |||||||
Total taxation (expense)/benefit | 837 | (266 | ) | (454 | ) | |||||||
|
|
|
|
|
| |||||||
Profit/(loss) after taxation from Continuing operations | (5,763 | ) | (606 | ) | (1,074 | ) | ||||||
|
|
|
|
|
| |||||||
Discontinued operations | ||||||||||||
Profit/(loss) after taxation from Discontinued operations | – | – | 8,159 | |||||||||
|
|
|
|
|
| |||||||
Profit/(loss) after taxation from Continuing and Discontinued operations | (5,763 | ) | (606 | ) | 7,085 | |||||||
|
|
|
|
|
| |||||||
Total exceptional items attributable to non-controlling interests | – | (107 | ) | – | ||||||||
Total exceptional items attributable to BHP shareholders | (5,763 | ) | (499 | ) | 7,085 | |||||||
|
|
|
|
|
| |||||||
Exceptional items attributable to BHP shareholders per share (US cents) | (113.7 | ) | (9.8 | ) | 140.0 | |||||||
|
|
|
|
|
| |||||||
Weighted basic average number of shares (Million) | 5,068 | 5,064 | 5,061 | |||||||||
|
|
|
|
|
| |||||||
104
Table of Contents
Non-IFRS financial information derived from Consolidated Income Statement
Underlying attributable profit
Year ended 30 June | 2024 US$M | 2023 US$M | 2022 US$M | |||||||||
Profit after taxation from Continuing and Discontinued operations attributable to BHP shareholders | 7,897 | 12,921 | 30,900 | |||||||||
Total exceptional items attributable to BHP shareholders1 | 5,763 | 499 | (7,085 | ) | ||||||||
|
|
|
|
|
| |||||||
Underlying attributable profit | 13,660 | 13,420 | 23,815 | |||||||||
|
|
|
|
|
| |||||||
| 1. | For more information refer to Financial Statements note 3 ‘Exceptional items’. |
Underlying basic earnings per share
Year ended 30 June | 2024 US cents | 2023 US cents | 2022 US cents | |||||||||
Basic earnings per ordinary share | 155.8 | 255.2 | 610.6 | |||||||||
Exceptional items attributable to BHP shareholders per share1 | 113.7 | 9.8 | (140.0 | ) | ||||||||
|
|
|
|
|
| |||||||
Underlying basic earnings per ordinary share | 269.5 | 265.0 | 470.6 | |||||||||
|
|
|
|
|
| |||||||
| 1. | For more information refer to Financial Statements note 3 ‘Exceptional items’. |
Underlying attributable profit – Continuing operations
Year ended 30 June | 2024 US$M | 2023 US$M | 2022 US$M | |||||||||
Profit after taxation from Continuing and Discontinued operations attributable to BHP shareholders | 7,897 | 12,921 | 30,900 | |||||||||
(Profit)/loss after taxation from Discontinued operations attributable to members of BHP | – | – | (10,655 | ) | ||||||||
Total exceptional items attributable to BHP shareholders1 | 5,763 | 499 | (7,085 | ) | ||||||||
Total exceptional items attributable to BHP shareholders for Discontinued operations2 | – | – | 8,159 | |||||||||
|
|
|
|
|
| |||||||
Underlying attributable profit – Continuing operations | 13,660 | 13,420 | 21,319 | |||||||||
|
|
|
|
|
| |||||||
| 1. | For more information refer to Financial Statements note 3 ‘Exceptional items’. |
| 2. | For more information refer to Financial Statements note 28 ‘Discontinued operations’. |
Underlying basic earnings per share – Continuing operations
Year ended 30 June | 2024 US$M | 2023 US$M | 2022 US$M | |||||||||
Underlying attributable profit – Continuing operations | 13,660 | 13,420 | 21,319 | |||||||||
Weighted basic average number of shares (Million) | 5,068 | 5,064 | 5,061 | |||||||||
|
|
|
|
|
| |||||||
Underlying attributable earnings per ordinary share – Continuing operations (US cents) | 269.5 | 265.0 | 421.2 | |||||||||
|
|
|
|
|
| |||||||
Underlying EBITDA
Year ended 30 June | 2024 US$M | 2023 US$M | 2022 US$M | |||||||||
Profit from operations | 17,537 | 22,932 | 34,106 | |||||||||
Exceptional items included in profit from operations1 | 6,094 | (112 | ) | 330 | ||||||||
|
|
|
|
|
| |||||||
Underlying EBIT | 23,631 | 22,820 | 34,436 | |||||||||
|
|
|
|
|
| |||||||
Depreciation and amortisation expense | 5,295 | 5,061 | 5,683 | |||||||||
Net impairments | 3,890 | 75 | 515 | |||||||||
Exceptional item included in Depreciation, amortisation and impairments1 | (3,800 | ) | – | – | ||||||||
|
|
|
|
|
| |||||||
Underlying EBITDA | 29,016 | 27,956 | 40,634 | |||||||||
|
|
|
|
|
| |||||||
| 1. | For more information refer to Financial Statements note 3 ‘Exceptional items’. |
105
Table of Contents
Underlying EBITDA – Segment
Year ended 30 June 2024 US$M | Copper | Iron Ore | Coal | Group and unallocated items/ eliminations2 | Total Group | |||||||||||||||
Profit from operations | 6,524 | 13,759 | 2,557 | (5,303 | ) | 17,537 | ||||||||||||||
Exceptional items included in profit from operations1 | – | 3,066 | (880 | ) | 3,908 | 6,094 | ||||||||||||||
Depreciation and amortisation expense | 2,023 | 2,027 | 611 | 634 | 5,295 | |||||||||||||||
Net impairments | 17 | 61 | 2 | 3,810 | 3,890 | |||||||||||||||
Exceptional item included in Depreciation, amortisation and impairments1 | – | – | – | (3,800 | ) | (3,800 | ) | |||||||||||||
|
|
|
|
|
|
|
|
|
| |||||||||||
Underlying EBITDA | 8,564 | 18,913 | 2,290 | (751 | ) | 29,016 | ||||||||||||||
|
|
|
|
|
|
|
|
|
| |||||||||||
Year ended 30 June 2023 US$M | Copper | Iron Ore | Coal | Group and unallocated items/ eliminations2 | Total Group | |||||||||||||||
Profit from operations | 4,810 | 14,847 | 4,295 | (1,020 | ) | 22,932 | ||||||||||||||
Exceptional items included in profit from operations1 | – | (176 | ) | – | 64 | (112 | ) | |||||||||||||
Depreciation and amortisation expense | 1,810 | 1,993 | 697 | 561 | 5,061 | |||||||||||||||
Net impairments | 33 | 28 | 6 | 8 | 75 | |||||||||||||||
|
|
|
|
|
|
|
|
|
| |||||||||||
Underlying EBITDA | 6,653 | 16,692 | 4,998 | (387 | ) | 27,956 | ||||||||||||||
|
|
|
|
|
|
|
|
|
| |||||||||||
Year ended 30 June 2022 US$M | Copper | Iron Ore | Coal | Group and unallocated items/ eliminations2 | Total Group | |||||||||||||||
Profit from operations | 6,330 | 18,742 | 9,582 | (548 | ) | 34,106 | ||||||||||||||
Exceptional items included in profit from operations1 | – | 729 | (849 | ) | 450 | 330 | ||||||||||||||
Depreciation and amortisation expense | 1,765 | 2,203 | 762 | 953 | 5,683 | |||||||||||||||
Net impairments | 470 | 33 | 9 | 3 | 515 | |||||||||||||||
|
|
|
|
|
|
|
|
|
| |||||||||||
Underlying EBITDA | 8,565 | 21,707 | 9,504 | 858 | 40,634 | |||||||||||||||
|
|
|
|
|
|
|
|
|
| |||||||||||
| 1. | For more information refer to Financial Statements note 3 ‘Exceptional items’. |
| 2. | Group and unallocated items includes functions, other unallocated operations including Potash, Western Australia Nickel (which comprises the Nickel West operations and, following the OZ Minerals (OZL) acquisition on 2 May 2023, the West Musgrave project), legacy assets and consolidation adjustments. |
106
Table of Contents
Year ended 30 June 2024 US$M | Profit from operations | Exceptional items included in profit from operations1 | Depreciation and amortisation | Net impairments | Exceptional items included in Depreciation, amortisation and impairments1 | Underlying EBITDA | ||||||||||||||||||
Potash | (257 | ) | – | 2 | – | – | (255 | ) | ||||||||||||||||
Western Australia Nickel2 | (4,174 | ) | 3,800 | 72 | 3,800 | (3,800 | ) | (302 | ) | |||||||||||||||
Other3 | (872 | ) | 108 | 560 | 10 | – | (194 | ) | ||||||||||||||||
|
|
|
|
|
|
|
|
|
|
|
| |||||||||||||
Total | (5,303 | ) | 3,908 | 634 | 3,810 | (3,800 | ) | (751 | ) | |||||||||||||||
|
|
|
|
|
|
|
|
|
|
|
| |||||||||||||
Year ended 30 June 2023 US$M | Profit from operations | Exceptional items included in profit from operations1 | Depreciation and amortisation | Net impairments | Exceptional items included in Depreciation, amortisation and impairments1 | Underlying EBITDA | ||||||||||||||||||
Potash | (207 | ) | – | 2 | – | – | (205 | ) | ||||||||||||||||
Western Australia Nickel2 | 55 | – | 105 | 2 | – | 162 | ||||||||||||||||||
Other3 | (868 | ) | 64 | 454 | 6 | – | (344 | ) | ||||||||||||||||
|
|
|
|
|
|
|
|
|
|
|
| |||||||||||||
Total | (1,020 | ) | 64 | 561 | 8 | – | (387 | ) | ||||||||||||||||
|
|
|
|
|
|
|
|
|
|
|
| |||||||||||||
Year ended 30 June 2022 US$M | Profit from operations | Exceptional items included in profit from operations1 | Depreciation and amortisation | Net impairments | Exceptional items included in Depreciation, amortisation and impairments1 | Underlying EBITDA | ||||||||||||||||||
Potash | (149 | ) | – | 2 | – | – | (147 | ) | ||||||||||||||||
Western Australia Nickel2 | 327 | – | 91 | 2 | – | 420 | ||||||||||||||||||
Other3 | (726 | ) | 450 | 860 | 1 | – | 585 | |||||||||||||||||
|
|
|
|
|
|
|
|
|
|
|
| |||||||||||||
Total | (548 | ) | 450 | 953 | 3 | – | 858 | |||||||||||||||||
|
|
|
|
|
|
|
|
|
|
|
| |||||||||||||
| 1. | For more information refer to Financial Statements note 3 ‘Exceptional items’. |
| 2. | Western Australia Nickel comprises the Nickel West operations and, following the OZL acquisition on 2 May 2023, the West Musgrave project. |
| 3. | Other includes functions, other unallocated operations, legacy assets and consolidation adjustments. |
Underlying EBITDA margin
Year ended 30 June 2024 US$M | Copper | Iron Ore | Coal | Group and unallocated items/ eliminations1 | Total Group | |||||||||||||||
Revenue – Group production | 16,545 | 27,927 | 7,666 | 1,470 | 53,608 | |||||||||||||||
Revenue – Third-party products | 2,021 | 25 | – | 4 | 2,050 | |||||||||||||||
|
|
|
|
|
|
|
|
|
| |||||||||||
Revenue | 18,566 | 27,952 | 7,666 | 1,474 | 55,658 | |||||||||||||||
|
|
|
|
|
|
|
|
|
| |||||||||||
Underlying EBITDA – Group production | 8,490 | 18,916 | 2,290 | (753 | ) | 28,943 | ||||||||||||||
Underlying EBITDA – Third-party products | 74 | (3 | ) | – | 2 | 73 | ||||||||||||||
|
|
|
|
|
|
|
|
|
| |||||||||||
Underlying EBITDA2 | 8,564 | 18,913 | 2,290 | (751 | ) | 29,016 | ||||||||||||||
|
|
|
|
|
|
|
|
|
| |||||||||||
Segment contribution to the Group’s Underlying EBITDA3 | 29% | 64% | 7% | 100% | ||||||||||||||||
Underlying EBITDA margin4 | 51% | 68% | 30% | 54% | ||||||||||||||||
107
Table of Contents
Year ended 30 June 2023 US$M | Copper | Iron Ore | Coal | Group and unallocated items/ eliminations1 | Total Group | |||||||||||||||
Revenue – Group production | 14,164 | 24,791 | 10,958 | 2,009 | 51,922 | |||||||||||||||
Revenue – Third-party products | 1,863 | 21 | – | 11 | 1,895 | |||||||||||||||
|
|
|
|
|
|
|
|
|
| |||||||||||
Revenue | 16,027 | 24,812 | 10,958 | 2,020 | 53,817 | |||||||||||||||
|
|
|
|
|
|
|
|
|
| |||||||||||
Underlying EBITDA – Group production | 6,635 | 16,693 | 4,998 | (387 | ) | 27,939 | ||||||||||||||
Underlying EBITDA – Third-party products | 18 | (1) | – | – | 17 | |||||||||||||||
|
|
|
|
|
|
|
|
|
| |||||||||||
Underlying EBITDA2 | 6,653 | 16,692 | 4,998 | (387 | ) | 27,956 | ||||||||||||||
|
|
|
|
|
|
|
|
|
| |||||||||||
Segment contribution to the Group’s Underlying EBITDA3 | 23% | 59% | 18% | 100% | ||||||||||||||||
Underlying EBITDA margin4 | 47% | 67% | 46% | 54% | ||||||||||||||||
Year ended 30 June 2022 US$M | Copper | Iron Ore | Coal | Group and unallocated items/ eliminations1 | Total Group | |||||||||||||||
Revenue – Group production | 13,946 | 30,748 | 15,549 | 1,860 | 62,103 | |||||||||||||||
Revenue – Third-party products | 2,903 | 19 | – | 73 | 2,995 | |||||||||||||||
|
|
|
|
|
|
|
|
|
| |||||||||||
Revenue | 16,849 | 30,767 | 15,549 | 1,933 | 65,098 | |||||||||||||||
|
|
|
|
|
|
|
|
|
| |||||||||||
Underlying EBITDA – Group production | 8,529 | 21,707 | 9,504 | 858 | 40,598 | |||||||||||||||
Underlying EBITDA – Third-party products | 36 | – | – | – | 36 | |||||||||||||||
|
|
|
|
|
|
|
|
|
| |||||||||||
Underlying EBITDA2 | 8,565 | 21,707 | 9,504 | 858 | 40,634 | |||||||||||||||
|
|
|
|
|
|
|
|
|
| |||||||||||
Segment contribution to the Group’s Underlying EBITDA3 | 22% | 54% | 24% | 100% | ||||||||||||||||
Underlying EBITDA margin4 | 61% | 71% | 61% | 65% | ||||||||||||||||
| 1. | Group and unallocated items includes functions, other unallocated operations including Potash, Western Australia Nickel (which comprises the Nickel West operations and, following the OZL acquisition on 2 May 2023, the West Musgrave project), legacy assets and consolidation adjustments. |
| 2. | We differentiate sales of our production (which may include third-party product feed) from direct sales of third-party products to better measure our operational profitability as a percentage of revenue. We may buy and sell third-party products to ensure a steady supply of product to our customers where there is occasional production variability or shortfalls from our assets. |
| 3. | Percentage contribution to Group Underlying EBITDA, excluding Group and unallocated items. |
| 4. | Underlying EBITDA margin excludes third-party products. |
108
Table of Contents
Effective tax rate
| 2024 | 2023 | 2022 | ||||||||||||||||||||||||||||||||||
Year ended 30 June | Profit before taxation US$M | Income tax expense US$M | % | Profit before taxation US$M | Income tax expense US$M | % | Profit before taxation US$M | Income tax expense US$M | % | |||||||||||||||||||||||||||
Statutory effective tax rate | 16,048 | (6,447 | ) | 40.2 | 21,401 | (7,077 | ) | 33.1 | 33,137 | (10,737 | ) | 32.4 | ||||||||||||||||||||||||
Adjusted for: | ||||||||||||||||||||||||||||||||||||
Exchange rate movements | – | (79 | ) | – | 94 | – | (233 | ) | ||||||||||||||||||||||||||||
Exceptional items1 | 6,600 | (837 | ) | 340 | 266 | 620 | 454 | |||||||||||||||||||||||||||||
|
|
|
|
|
|
|
|
|
|
|
|
|
|
|
|
|
| |||||||||||||||||||
Adjusted effective tax rate | 22,648 | (7,363 | ) | 32.5 | 21,741 | (6,717 | ) | 30.9 | 33,757 | (10,516 | ) | 31.2 | ||||||||||||||||||||||||
|
|
|
|
|
|
|
|
|
|
|
|
|
|
|
|
|
| |||||||||||||||||||
| 1. | For more information refer to Financial Statements note 3 ‘Exceptional items’. |
Non-IFRS financial information derived from Consolidated Cash Flow Statement
Capital and exploration expenditure
Year ended 30 June | 2024 US$M | 2023 US$M | 2022 US$M | |||||||||
Capital expenditure (purchases of property, plant and equipment) | 8,816 | 6,733 | 5,855 | |||||||||
Add: Exploration and evaluation expenditure | 457 | 350 | 256 | |||||||||
|
|
|
|
|
| |||||||
Capital and exploration expenditure (cash basis) – Continuing operations | 9,273 | 7,083 | 6,111 | |||||||||
|
|
|
|
|
| |||||||
Capital expenditure (purchases of property, plant and equipment) – Discontinued operations | – | – | 1,050 | |||||||||
Add: Exploration and evaluation expenditure – Discontinued operations | – | – | 384 | |||||||||
|
|
|
|
|
| |||||||
Capital and exploration expenditure (cash basis) – Discontinued operations | – | – | 1,434 | |||||||||
|
|
|
|
|
| |||||||
Capital and exploration expenditure (cash basis) – Total operations | 9,273 | 7,083 | 7,545 | |||||||||
|
|
|
|
|
| |||||||
Free cash flow
Year ended 30 June | 2024 US$M | 2023 US$M | 2022 US$M | |||||||||
Net operating cash flows from Continuing operations | 20,665 | 18,701 | 29,285 | |||||||||
Net investing cash flows from Continuing operations | (8,762 | ) | (13,065 | ) | (4,973 | ) | ||||||
|
|
|
|
|
| |||||||
Free cash flow – Continuing operations | 11,903 | 5,636 | 24,312 | |||||||||
|
|
|
|
|
| |||||||
Net operating cash flows from Discontinued operations | – | – | 2,889 | |||||||||
Net investing cash flows from Discontinued operations | – | – | (904 | ) | ||||||||
Net cash completion payment on merger of Petroleum with Woodside | – | – | (683 | ) | ||||||||
Cash and cash equivalents disposed on merger of Petroleum with Woodside | – | – | (399 | ) | ||||||||
|
|
|
|
|
| |||||||
Free cash flow – Discontinued operations | – | – | 903 | |||||||||
|
|
|
|
|
| |||||||
Free cash flow – Total operations | 11,903 | 5,636 | 25,215 | |||||||||
|
|
|
|
|
| |||||||
109
Table of Contents
Non-IFRS financial information derived from Consolidated Balance Sheet
Net debt and gearing ratio
Year ended 30 June | 2024 US$M | 2023 US$M | 2022 US$M | |||||||||
Interest bearing liabilities – Current | 2,084 | 7,173 | 2,622 | |||||||||
Interest bearing liabilities – Non-current | 18,634 | 15,172 | 13,806 | |||||||||
|
|
|
|
|
| |||||||
Total interest bearing liabilities | 20,718 | 22,345 | 16,428 | |||||||||
|
|
|
|
|
| |||||||
Comprising: | ||||||||||||
Borrowing | 17,602 | 19,326 | 13,852 | |||||||||
Lease liabilities | 3,116 | 3,019 | 2,576 | |||||||||
|
|
|
|
|
| |||||||
Less: Lease liability associated with index-linked freight contracts | 511 | 287 | 274 | |||||||||
|
|
|
|
|
| |||||||
Less: Cash and cash equivalents | 12,501 | 12,428 | 17,236 | |||||||||
|
|
|
|
|
| |||||||
Less: Net debt management related instruments1 | (1,395 | ) | (1,572 | ) | (1,688 | ) | ||||||
Less: Net cash management related instruments2 | (19 | ) | 36 | 273 | ||||||||
|
|
|
|
|
| |||||||
Less: Total derivatives included in net debt | (1,414 | ) | (1,536 | ) | (1,415 | ) | ||||||
|
|
|
|
|
| |||||||
Net debt | 9,120 | 11,166 | 333 | |||||||||
|
|
|
|
|
| |||||||
Net assets | 49,120 | 48,530 | 48,766 | |||||||||
|
|
|
|
|
| |||||||
Gearing | 15.7% | 18.7% | 0.7% | |||||||||
|
|
|
|
|
| |||||||
| 1. | Represents the net cross currency and interest rate swaps included within current and non-current other financial assets and liabilities. |
| 2. | Represents the net forward exchange contracts related to cash management included within current and non-current other financial assets and liabilities. |
Net debt waterfall
Year ended 30 June | 2024 US$M | 2023 US$M | ||||||
Net debt at the beginning of the period | (11,166 | ) | (333 | ) | ||||
|
|
|
| |||||
Net operating cash flows | 20,665 | 18,701 | ||||||
Net investing cash flows | (8,762 | ) | (13,065 | ) | ||||
Net financing cash flows | (11,669 | ) | (10,315 | ) | ||||
|
|
|
| |||||
Net increase/(decrease) in cash and cash equivalents from Continuing and Discontinued operations | 234 | (4,679 | ) | |||||
|
|
|
| |||||
Carrying value of interest bearing liability net repayments/(proceeds) | 2,236 | (4,893 | ) | |||||
|
|
|
| |||||
Carrying value of debt related instruments settlements | 321 | 677 | ||||||
|
|
|
| |||||
Carrying value of cash management related instruments proceeds | (361 | ) | (331 | ) | ||||
|
|
|
| |||||
Fair value change on hedged loans | 214 | 803 | ||||||
Fair value change on hedging derivatives | (188 | ) | (691 | ) | ||||
Foreign currency exchange rate changes on cash and cash equivalents | (159 | ) | (134 | ) | ||||
Lease additions (excluding leases associated with index-linked freight contracts) | (429 | ) | (472 | ) | ||||
Acquisition of subsidiaries and operations1 | – | (1,111 | ) | |||||
Divestment of subsidiaries and operations2 | 60 | – | ||||||
Other | 118 | (2 | ) | |||||
|
|
|
| |||||
Non-cash movements | (384 | ) | (1,607 | ) | ||||
|
|
|
| |||||
Net debt at the end of the period | (9,120 | ) | (11,166 | ) | ||||
|
|
|
| |||||
| 1. | US$1,111 million of Interest bearing liabilities were acquired on 2 May 2023 as part of the acquisition of OZL. Excludes US$104 million cash acquired which is included in Net investing cash flows. |
| 2. | Relates to leases disposed as part of the Blackwater and Daunia mines divestment completed on 2 April 2024. Refer to Financial Statements note 3 ‘Exceptional items’ for further information. |
110
Table of Contents
Net operating assets
The following table reconciles Net operating assets for the Group to Net assets on the Consolidated Balance Sheet.
Year ended 30 June | 2024 US$M | 2023 US$M | ||||||
Net assets | 49,120 | 48,530 | ||||||
Less: Non-operating assets | ||||||||
Cash and cash equivalents | (12,501 | ) | (12,428 | ) | ||||
Trade and other receivables1 | (306 | ) | (26 | ) | ||||
Other financial assets2 | (1,398 | ) | (996 | ) | ||||
Current tax assets | (314 | ) | (508 | ) | ||||
Deferred tax assets | (67 | ) | (56 | ) | ||||
|
|
|
| |||||
Add: Non-operating liabilities | ||||||||
Trade and other payables3 | 297 | 277 | ||||||
Interest bearing liabilities | 20,718 | 22,345 | ||||||
Other financial liabilities4 | 1,558 | 1,764 | ||||||
Current tax payable | 884 | 611 | ||||||
Non-current tax payable | 40 | 68 | ||||||
Deferred tax liabilities | 3,332 | 4,299 | ||||||
|
|
|
| |||||
Net operating assets | 61,363 | 63,880 | ||||||
|
|
|
| |||||
Net operating assets | ||||||||
Copper | 36,368 | 34,229 | ||||||
Iron Ore | 13,812 | 16,956 | ||||||
Coal | 6,472 | 7,266 | ||||||
Group and unallocated items5 | 4,711 | 5,429 | ||||||
|
|
|
| |||||
Total | 61,363 | 63,880 | ||||||
|
|
|
| |||||
| 1. | Represents external finance receivable, receivables related to divestment of subsidiaries and operations and accrued interest receivable included within other receivables. |
| 2. | Represents cross currency and interest rate swaps, forward exchange contracts related to cash management and investment in shares, other investments, deferred receivable from divestment of subsidiaries and operations and associated receivables contingent on outcome of future events relating to realised commodity prices. |
| 3. | Represents accrued interest payable included within other payables. |
| 4. | Represents cross currency and interest rate swaps and forward exchange contracts related to cash management. |
| 5. | Group and unallocated items includes functions, other unallocated operations including Potash, Western Australia Nickel (which comprises the Nickel West operations and, following the OZL acquisition on 2 May 2023, the West Musgrave project), legacy assets and consolidation adjustments. |
111
Table of Contents
Other non-IFRS financial information
Principal factors that affect Revenue, Profit from operations and Underlying EBITDA
The following table describes the impact of the principal factors that affected Revenue, Profit from operations and Underlying EBITDA for FY2024 and relates them back to our Consolidated Income Statement.
>For information on the method of calculation of the principal factors that affect Revenue, Profit from operations and Underlying EBITDA refer to OFR 10.2
| Revenue US$M | Total expenses, Other income and Profit/ (loss) from equity accounted investments US$M | Profit from operations US$M | Depreciation, amortisation and impairments and Exceptional Items US$M | Underlying EBITDA US$M | ||||||||||||||||
Year ended 30 June 2023 | ||||||||||||||||||||
Revenue | 53,817 | |||||||||||||||||||
Other income | 394 | |||||||||||||||||||
Expenses excluding net finance costs | (31,873 | ) | ||||||||||||||||||
| Profit/(loss) from equity accounted investments, related impairments and expenses | 594 | |||||||||||||||||||
|
| |||||||||||||||||||
| Total other income, expenses excluding net finance costs and Profit/(loss) from equity accounted investments, related impairments and expenses | (30,885 | ) | ||||||||||||||||||
|
| |||||||||||||||||||
Profit from operations | 22,932 | |||||||||||||||||||
Depreciation, amortisation and impairments1 | 5,136 | |||||||||||||||||||
| Exceptional item included in Depreciation, amortisation and impairments | – | |||||||||||||||||||
Exceptional items | (112 | ) | ||||||||||||||||||
|
| |||||||||||||||||||
Underlying EBITDA | 27,956 | |||||||||||||||||||
|
|
|
|
|
|
|
|
|
| |||||||||||
Change in sales prices | 1,476 | – | 1,476 | – | 1,476 | |||||||||||||||
Price-linked costs | – | 108 | 108 | – | 108 | |||||||||||||||
|
|
|
|
|
|
|
|
|
| |||||||||||
Net price impact | 1,476 | 108 | 1,584 | – | 1,584 | |||||||||||||||
|
|
|
|
|
|
|
|
|
| |||||||||||
Change in volumes | 55 | (45 | ) | 10 | – | 10 | ||||||||||||||
|
|
|
|
|
|
|
|
|
| |||||||||||
Operating cash costs | – | (655 | ) | (655 | ) | – | (655 | ) | ||||||||||||
Exploration and business development | – | (118 | ) | (118 | ) | – | (118 | ) | ||||||||||||
|
|
|
|
|
|
|
|
|
| |||||||||||
Change in controllable cash costs2 | – | (773 | ) | (773 | ) | – | (773 | ) | ||||||||||||
|
|
|
|
|
|
|
|
|
| |||||||||||
Exchange rates | (1 | ) | 254 | 253 | – | 253 | ||||||||||||||
Inflation on costs | – | (686 | ) | (686 | ) | – | (686 | ) | ||||||||||||
Fuel, energy and consumable price movements | – | 487 | 487 | – | 487 | |||||||||||||||
Non-cash | – | (301 | ) | (301 | ) | – | (301 | ) | ||||||||||||
One-off items | – | 316 | 316 | – | 316 | |||||||||||||||
|
|
|
|
|
|
|
|
|
| |||||||||||
Change in other costs | (1 | ) | 70 | 69 | – | 69 | ||||||||||||||
|
|
|
|
|
|
|
|
|
| |||||||||||
Asset sales | – | 38 | 38 | – | 38 | |||||||||||||||
Ceased and sold operations | (983 | ) | 473 | (510 | ) | – | (510 | ) | ||||||||||||
New and acquired operations | 918 | (390 | ) | 528 | – | 528 | ||||||||||||||
Other | 376 | (262 | ) | 114 | – | 114 | ||||||||||||||
|
|
|
|
|
|
|
|
|
| |||||||||||
Depreciation, amortisation and impairments | – | (249 | ) | (249 | ) | 249 | – | |||||||||||||
Exceptional items | – | (6,206 | ) | (6,206 | ) | 6,206 | – | |||||||||||||
|
|
|
|
|
|
|
|
|
| |||||||||||
Year ended 30 June 2024 | ||||||||||||||||||||
Revenue | 55,658 | |||||||||||||||||||
Other income | 1,285 | |||||||||||||||||||
Expenses excluding net finance costs | (36,750 | ) | ||||||||||||||||||
| (Loss)/profit from equity accounted investments, related impairments and expenses | (2,656 | ) | ||||||||||||||||||
|
| |||||||||||||||||||
| Total other income, expenses excluding net finance costs and (loss)/profit from equity accounted investments, related impairments and expenses | (38,121 | ) | ||||||||||||||||||
|
| |||||||||||||||||||
Profit from operations | 17,537 | |||||||||||||||||||
Depreciation, amortisation and impairments1 | 9,185 | |||||||||||||||||||
| Exceptional item included in Depreciation, amortisation and impairments | (3,800 | ) | ||||||||||||||||||
Exceptional items | 6,094 | |||||||||||||||||||
|
| |||||||||||||||||||
Underlying EBITDA | 29,016 | |||||||||||||||||||
|
| |||||||||||||||||||
| 1. | Depreciation and impairments that we classify as exceptional items are excluded from depreciation, amortisation and impairments. Depreciation, amortisation and impairments includes non-exceptional impairments of US$90 million (FY2023: US$75 million). |
| 2. | Collectively, we refer to the change in operating cash costs and change in exploration and business development as Change in controllable cash costs. Operating cash costs by definition do not include non-cash costs. The change in operating cash costs also excludes the impact of exchange rates and inflation, changes in fuel, energy costs and consumable costs, changes in exploration and evaluation and business development costs and one-off items. These items are excluded so as to provide a consistent measurement of changes in costs across all segments, based on the factors that are within the control and responsibility of the segment. |
112
Table of Contents
Underlying return on capital employed (ROCE)
Year ended 30 June | 2024 US$M | 2023 US$M | 2022 US$M | |||||||||
Profit after taxation from Continuing and Discontinued operations | 9,601 | 14,324 | 33,055 | |||||||||
Exceptional items1 | 5,763 | 606 | (7,085 | ) | ||||||||
|
|
|
|
|
| |||||||
Subtotal | 15,364 | 14,930 | 25,970 | |||||||||
|
|
|
|
|
| |||||||
Adjusted for: | ||||||||||||
Net finance costs | 1,489 | 1,531 | 1,128 | |||||||||
Exceptional items included within net finance costs1 | (506 | ) | (452 | ) | (290 | ) | ||||||
Income tax expense on net finance costs | (303 | ) | (342 | ) | (287 | ) | ||||||
|
|
|
|
|
| |||||||
Profit after taxation excluding net finance costs and exceptional items | 16,044 | 15,667 | 26,521 | |||||||||
|
|
|
|
|
| |||||||
Net assets at the beginning of the period | 48,530 | 48,766 | 55,605 | |||||||||
Net debt at the beginning of the period | 11,166 | 333 | 4,121 | |||||||||
|
|
|
|
|
| |||||||
Capital employed at the beginning of the period | 59,696 | 49,099 | 59,726 | |||||||||
|
|
|
|
|
| |||||||
Net assets at the end of the period | 49,120 | 48,530 | 48,766 | |||||||||
Net debt at the end of the period | 9,120 | 11,166 | 333 | |||||||||
|
|
|
|
|
| |||||||
Capital employed at the end of the period | 58,240 | 59,696 | 49,099 | |||||||||
|
|
|
|
|
| |||||||
Average capital employed | 58,968 | 54,398 | 54,413 | |||||||||
|
|
|
|
|
| |||||||
Underlying return on capital employed | 27.2% | 28.8% | 48.7% | |||||||||
|
|
|
|
|
| |||||||
| 1. | For more information refer to Financial Statements note 3 ‘Exceptional items’. |
Underlying return on capital employed (ROCE) by segment
Year ended 30 June 2024 US$M | Copper | Iron Ore | Coal | Group and unallocated items/ eliminations1 | Total Group | |||||||||||||||
| Profit after taxation excluding net finance costs and exceptional items | 4,099 | 11,877 | 1,254 | (1,186 | ) | 16,044 | ||||||||||||||
Average capital employed | 31,205 | 14,259 | 6,529 | 6,975 | 58,968 | |||||||||||||||
|
|
|
|
|
|
|
|
|
| |||||||||||
Underlying return on capital employed | 13% | 83% | 19% | – | 27.2% | |||||||||||||||
|
|
|
|
|
|
|
|
|
| |||||||||||
Year ended 30 June 2023 US$M | Copper | Iron Ore | Coal | Group and unallocated items/ eliminations1 | Total Group | |||||||||||||||
| Profit after taxation excluding net finance costs and exceptional items | 3,293 | 10,300 | 2,970 | (896) | 15,667 | |||||||||||||||
Average capital employed | 27,594 | 15,467 | 6,281 | 5,056 | 54,398 | |||||||||||||||
|
|
|
|
|
|
|
|
|
| |||||||||||
Underlying return on capital employed | 12% | 67% | 47% | – | 28.8% | |||||||||||||||
|
|
|
|
|
|
|
|
|
| |||||||||||
| 1. | Group and unallocated items includes functions, other unallocated operations including Potash, Western Australia Nickel (which comprises the Nickel West operations and, following the OZL acquisition on 2 May 2023, the West Musgrave project), legacy assets and consolidation adjustments. |
Underlying return on capital employed (ROCE) by asset
Year ended 30 June 2024 US$M | Western Australia Iron Ore | Antamina | Escondida | BHP Mitsubishi Alliance | Pampa Norte | Copper South Australia1 | Western Australia Nickel2 | Potash3 | New South Wales Energy Coal4 | Other | Total Group | |||||||||||||||||||||||||||||||||
| Profit after taxation excluding net finance costs and exceptional items | 11,939 | 440 | 2,912 | 1,038 | 296 | 671 | (369 | ) | (265 | ) | 277 | (895 | ) | 16,044 | ||||||||||||||||||||||||||||||
| Average capital employed | 19,732 | 1,404 | 10,677 | 6,731 | 4,224 | 14,578 | 1,269 | 5,303 | (364 | ) | (4,586 | ) | 58,968 | |||||||||||||||||||||||||||||||
|
|
|
|
|
|
|
|
|
|
|
|
|
|
|
|
|
|
|
|
|
| |||||||||||||||||||||||
| Underlying return on capital employed | 61% | 31% | 27% | 15% | 7% | 5% | – | – | – | – | 27.2% | |||||||||||||||||||||||||||||||||
|
|
|
|
|
|
|
|
|
|
|
|
|
|
|
|
|
|
|
|
|
| |||||||||||||||||||||||
113
Table of Contents
Year ended 30 June 2023 US$M | Western Australia Iron Ore | Antamina | Escondida | BHP Mitsubishi Alliance | Pampa Norte | Copper South Australia1 | Western Australia Nickel2 | Potash3 | New South Wales Energy Coal4 | Other | Total Group | |||||||||||||||||||||||||||||||||
| Profit after taxation excluding net finance costs and exceptional items | 10,318 | 426 | 2,808 | 1,837 | 131 | 166 | (51 | ) | (137 | ) | 1,212 | (1,043 | ) | 15,667 | ||||||||||||||||||||||||||||||
| Average capital employed | 19,420 | 1,314 | 10,183 | 6,672 | 4,278 | 11,681 | 1,635 | 4,020 | (591 | ) | (4,214 | ) | 54,398 | |||||||||||||||||||||||||||||||
|
|
|
|
|
|
|
|
|
|
|
|
|
|
|
|
|
|
|
|
|
| |||||||||||||||||||||||
| Underlying return on capital employed | 53% | 32% | 28% | 28% | 3% | 1% | (3% | ) | – | – | – | 28.8% | ||||||||||||||||||||||||||||||||
|
|
|
|
|
|
|
|
|
|
|
|
|
|
|
|
|
|
|
|
|
| |||||||||||||||||||||||
| 1. | Includes Olympic Dam as well as Prominent Hill and Carrapateena which were acquired on 2 May 2023 as part of the acquisition of OZ Minerals Ltd. |
| 2. | Western Australia Nickel comprises the Nickel West operations and, following the OZL acquisition on 2 May 2023, the West Musgrave project. Western Australia Nickel ROCE has not been shown following the Group’s decision, announced on 11 July 2024, to temporarily suspend Nickel West operations and the West Musgrave project at Western Australia Nickel. |
| 3. | Potash ROCE has not been shown because it is distorted as the asset is non-producing and in its development phase. |
| 4. | NSWEC ROCE has not been shown as it is distorted by negative capital employed due to the rehabilitation provision being the primary balance remaining on Balance Sheet following previous impairments. |
114
Table of Contents
Unit costs
Unit costs do not include the re-allocation to assets in FY2024 of the costs associated with the employee entitlements and allowances review conducted in FY2023, which were reported in Group and Unallocated in that period.
The calculation of Escondida, Spence and Copper South Australia unit costs are set out in the tables below.
| Escondida unit costs | Spence unit costs | |||||||||||||||
US$M | FY2024 | FY2023 | FY2024 | FY2023 | ||||||||||||
Revenue | 10,013 | 8,847 | 2,271 | 2,072 | ||||||||||||
Underlying EBITDA | 5,759 | 4,934 | 961 | 767 | ||||||||||||
|
|
|
|
|
|
|
| |||||||||
Gross costs | 4,254 | 3,913 | 1,310 | 1,305 | ||||||||||||
|
|
|
|
|
|
|
| |||||||||
Less: by-product credits | 523 | 459 | 105 | 137 | ||||||||||||
Less: freight | 194 | 202 | 49 | 48 | ||||||||||||
Less: royalties | 54 | – | – | – | ||||||||||||
|
|
|
|
|
|
|
| |||||||||
Net costs | 3,483 | 3,252 | 1,156 | 1,120 | ||||||||||||
|
|
|
|
|
|
|
| |||||||||
Sales (kt) | 1,087 | 1,051 | 246 | 241 | ||||||||||||
Sales (Mlb) | 2,396 | 2,317 | 543 | 531 | ||||||||||||
|
|
|
|
|
|
|
| |||||||||
Cost per pound (US$)1 | 1.45 | 1.40 | 2.13 | 2.11 | ||||||||||||
|
|
|
|
|
|
|
| |||||||||
| 1. | FY2024 based on average realised exchange rates of USD/CLP 907 (FY2023 USD/CLP 864). |
| Copper South Australia unit costs | ||||
US$M | FY2024 | |||
Revenue | 4,085 | |||
Underlying EBITDA | 1,568 | |||
|
| |||
Gross costs | 2,517 | |||
|
| |||
Less: by-product credits | 1,354 | |||
Less: freight | 57 | |||
Less: royalties | 141 | |||
Less: re-allocation of costs associated with the employee entitlements and allowances review | 14 | |||
|
| |||
Net costs | 951 | |||
|
| |||
Sales (kt) | 314 | |||
Sales (Mlb) | 692 | |||
|
| |||
Cost per pound (US$)1,2 | 1.37 | |||
|
| |||
| 1. | FY2024 based on an average realised exchange rate of AUD/USD 0.66. |
| 2. | FY2023 comparative is not disclosed as Copper South Australia includes Olympic Dam as well as Prominent Hill and Carrapateena which were acquired on 2 May 2023 as part of the acquisition of OZL which only contributed to the performance of the business from the date of acquisition. |
The calculation of WAIO unit costs is set out in the table below.
| WAIO unit costs | ||||||||
US$M | FY2024 | FY2023 | ||||||
Revenue | 27,805 | 24,678 | ||||||
Underlying EBITDA | 18,964 | 16,660 | ||||||
|
|
|
| |||||
Gross costs | 8,841 | 8,018 | ||||||
|
|
|
| |||||
Less: freight | 2,182 | 1,876 | ||||||
Less: royalties | 1,954 | 1,714 | ||||||
Less: re-allocation of costs associated with the employee entitlements and allowances review | 48 | – | ||||||
|
|
|
| |||||
Net costs | 4,657 | 4,428 | ||||||
|
|
|
| |||||
Sales (kt, equity share) | 255,977 | 248,883 | ||||||
|
|
|
| |||||
Cost per tonne (US$)1 | 18.19 | 17.79 | ||||||
|
|
|
| |||||
| 1. | FY2024 based on an average realised exchange rate of AUD/USD 0.66 (FY2023 AUD/USD 0.67). |
115
Table of Contents
The calculation of BMA unit costs is set out in the table below.
| BMA unit costs | ||||||||
US$M | FY2024 | FY2023 | ||||||
Revenue | 5,873 | 7,652 | ||||||
Underlying EBITDA | 1,914 | 3,197 | ||||||
|
|
|
| |||||
Gross costs | 3,959 | 4,455 | ||||||
|
|
|
| |||||
Less: freight | 29 | 32 | ||||||
Less: royalties | 1,260 | 1,667 | ||||||
Less: re-allocation of costs associated with the employee entitlements and allowances review | 5 | – | ||||||
|
|
|
| |||||
Net costs | 2,665 | 2,756 | ||||||
|
|
|
| |||||
Sales (kt, equity share) | 22,294 | 28,571 | ||||||
|
|
|
| |||||
Cost per tonne (US$)1 | 119.54 | 96.46 | ||||||
|
|
|
| |||||
| 1. | FY2024 based on an average realised exchange rate of AUD/USD 0.66 (FY2023 AUD/USD 0.67). |
10.1 Definition and calculation of non-IFRS financial information
| Non-IFRS financial information | Reasons why we believe the non-IFRS financial information are useful | Calculation methodology | ||
Underlying attributable profit | Allows the comparability of underlying financial performance by excluding the impacts of exceptional items.
Allows the comparability of underlying financial performance by excluding the impacts of exceptional items and the contribution of Discontinued operations and is also the basis on which our dividend payout ratio policy is applied. | Profit after taxation from Continuing and Discontinued operations attributable to BHP shareholders excluding any exceptional items attributable to BHP shareholders. | ||
Underlying attributable profit – Continuing operations | Underlying attributable profit from Continuing operations also excludes the contribution of Discontinued operations from the above metrics. | |||
Underlying basic earnings per share | On a per share basis, allows the comparability of underlying financial performance by excluding the impacts of exceptional items.
On a per share basis, allows the comparability of underlying financial performance by excluding the impacts of exceptional items and the contribution of Discontinued operations. | Underlying attributable profit divided by the weighted basic average number of shares. | ||
Underlying basic earnings per share – Continuing operations | Underlying attributable profit – Continuing operations divided by the weighted basic average number of shares. | |||
Underlying EBITDA | Used to help assess current operational profitability excluding the impacts of sunk costs (i.e. depreciation from initial investment). Each is a measure that management uses internally to assess the performance of the Group’s segments and make decisions on the allocation of resources. | Earnings before net finance costs, depreciation, amortisation and impairments, taxation expense, Discontinued operations and exceptional items. Underlying EBITDA includes BHP’s share of profit/(loss) from investments accounted for using the equity method including net finance costs, depreciation, amortisation and impairments and taxation expense/(benefit). | ||
Underlying EBITDA margin | Underlying EBITDA excluding third-party product EBITDA, divided by revenue excluding third-party product revenue. | |||
Underlying EBIT | Used to help assess current operational profitability excluding net finance costs and taxation expense (each of which are managed at the Group level) as well as Discontinued operations and any exceptional items. | Earnings before net finance costs, taxation expense, Discontinued operations and any exceptional items. Underlying EBIT includes BHP’s share of profit/(loss) from investments accounted for using the equity method including net finance costs and taxation expense/(benefit). | ||
Profit from operations | Earnings before net finance costs, taxation expense and Discontinued operations. Profit from operations includes Revenue, Other income, Expenses excluding net finance costs and BHP’s share of profit/(loss) from investments accounted for using the equity method including net finance costs and taxation expense/(benefit). | |||
Capital and exploration expenditure | Used as part of our Capital Allocation Framework to assess efficient deployment of capital. Represents the total outflows of our operational investing expenditure.
Represents the total outflows of our operational investing expenditure excluding the contribution of Discontinued operations. | Purchases of property, plant and equipment and exploration and evaluation expenditure including the contribution of Discontinued operations. | ||
Capital and exploration expenditure – Continuing operations | Purchases of property, plant and equipment and exploration and evaluation expenditure. |
116
Table of Contents
| Non-IFRS financial information | Reasons why we believe the non-IFRS financial information are useful | Calculation methodology | ||
Free cash flow | It is a key measure used as part of our Capital Allocation Framework. Reflects our operational cash performance inclusive of investment expenditure, which helps to highlight how much cash was generated in the period to be available for the servicing of debt and distribution to shareholders.
Reflects our operational cash performance inclusive of investment expenditure, but excluding the contribution of Discontinued operations. | Net operating cash flows less net investing cash flows. | ||
Free cash flow – Continuing operations | Net operating cash flows from Continuing operations less net investing cash flows from Continuing operations. | |||
Net debt | Net debt shows the position of gross debt less index-linked freight contracts offset by cash immediately available to pay debt if required and any associated derivative financial instruments. Liability associated with index-linked freight contracts, which are required to be remeasured to the prevailing freight index at each reporting date, are excluded from the net debt calculation due to the short-term volatility of the index they relate to not aligning with how the Group uses net debt for decision making in relation to the Capital Allocation Framework. Net debt includes the fair value of derivative financial instruments used to hedge cash and borrowings to reflect the Group’s risk management strategy of reducing the volatility of net debt caused by fluctuations in foreign exchange and interest rates.
Net debt, along with the gearing ratio, is used to monitor the Group’s capital management by relating net debt relative to equity from shareholders. | Interest bearing liabilities less liability associated with index-linked freight contracts less cash and cash equivalents less net cross currency and interest rate swaps less net cash management related instruments for the Group at the reporting date. | ||
Gearing ratio | Ratio of Net debt to Net debt plus Net assets. | |||
Net operating assets | Enables a clearer view of the assets deployed to generate earnings by highlighting the net operating assets of the business separate from the financing and tax balances. This measure helps provide an indicator of the underlying performance of our assets and enhances comparability between them. | Operating assets net of operating liabilities, including the carrying value of equity accounted investments and predominantly excludes cash balances, loans to associates, interest bearing liabilities, derivatives hedging our net debt, assets held for sale, liabilities directly associated with assets held for sale and tax balances. | ||
Underlying return on capital employed (ROCE) | Indicator of the Group’s capital efficiency and is provided on an underlying basis to allow comparability of underlying financial performance by excluding the impacts of exceptional items. | Profit after taxation excluding exceptional items and net finance costs (after taxation) divided by average capital employed.
Profit after taxation excluding exceptional items and net finance costs (after taxation) is profit after taxation from Continuing and Discontinued operations excluding exceptional items, net finance costs and the estimated taxation impact of net finance costs. These are annualised for a half year end reporting period.
The estimated tax impact is calculated using a prima facie taxation rate on net finance costs (excluding any foreign exchange impact).
Average capital employed is calculated as the average of net assets less net debt for the last two reporting periods. | ||
Adjusted effective tax rate | Provides an underlying tax basis to allow comparability of underlying financial performance by excluding the impacts of exceptional items. | Total taxation expense/(benefit) excluding exceptional items and exchange rate movements included in taxation expense/(benefit) divided by Profit from Continuing operations before taxation excluding exceptional items. |
117
Table of Contents
| Non-IFRS financial information | Reasons why we believe the non-IFRS financial information are useful | Calculation methodology | ||
Unit costs | Used to assess the controllable financial performance of the Group’s assets for each unit of production. Unit costs are adjusted for site specific non-controllable factors to enhance comparability between the Group’s assets. | Ratio of net costs of the assets to the equity share of sales tonnage. Net costs is defined as revenue less Underlying EBITDA and excludes freight, re-allocation of the costs associated with the employee entitlements and allowance review in FY2023, and other costs, depending on the nature of each asset. Freight is excluded as the Group believes it provides a similar basis of comparison to our peer group. The re-allocation to assets in FY2024 of the costs associated with the employee entitlements and allowances review in FY2023 are excluded in asset unit costs as these costs were already recognised in Group and Unallocated in FY2023.
Escondida, Spence and Copper South Australia unit costs exclude:
• by-product credits being the favourable impact of by-products (such as gold or silver) to determine the directly attributable costs of copper production • royalties, as these are costs that are not deemed to be under the Group’s control and the Group believes exclusion provides a similar basis of comparison to our peer group
WAIO and BMA unit costs exclude:
• royalties, as these are costs that are not deemed to be under the Group’s control and the Group believes exclusion provides a similar basis of comparison to our peer group |
118
Table of Contents
10.2 Definition and calculation of principal factors
The method of calculation of the principal factors that affect the period on period movements of Revenue, Profit from operations and Underlying EBITDA are as follows:
| Principal factor | Method of calculation | |
| Change in sales prices | Change in average realised price for each operation from the prior period to the current period, multiplied by current period sales volumes. | |
| Price-linked costs | Change in price-linked costs (mainly royalties) for each operation from the prior period to the current period, multiplied by current period sales volumes. | |
| Change in volumes | Change in sales volumes for each operation multiplied by the prior year average realised price less variable unit cost. | |
| Controllable cash costs | Total of operating cash costs and exploration and business development costs. | |
| Operating cash costs | Change in total costs, other than price-linked costs, exchange rates, inflation on costs, fuel, energy and consumable price movements, non-cash costs and one-off items as defined below for each operation from the prior period to the current period. | |
| Exploration and evaluation and business development | Exploration and evaluation and business development expense in the current period minus exploration and business development expense in the prior period. | |
| Exchange rates | Change in exchange rate multiplied by current period local currency revenue and expenses. | |
| Inflation on costs | Change in inflation rate applied to expenses, other than depreciation and amortisation, price-linked costs, exploration and business development expenses, expenses in ceased and sold operations and expenses in new and acquired operations. | |
| Fuel, energy and consumable price movements | Fuel and energy expense and price differences above inflation on consumables in the current period minus fuel and energy expense in the prior period. | |
| Non-cash | Change in net impact of capitalisation and depletion of deferred stripping from the prior period to the current period. | |
| One-off items | Change in costs exceeding a pre-determined threshold associated with an unexpected event that had not occurred in the last two years and is not reasonably likely to occur within the next two years. | |
| Asset sales | Profit/(loss) on the sale of assets or operations in the current period minus profit/(loss) on sale of assets or operations in the prior period. | |
| Ceased and sold operations | Underlying EBITDA for operations that ceased or were sold in the current period minus Underlying EBITDA for operations that ceased or were sold in the prior period. | |
| New and acquired operations | Underlying EBITDA for operations that were acquired in the current period minus Underlying EBITDA for operations that were acquired in the prior period. | |
| Share of profit/(loss) from equity accounted investments | Share of profit/(loss) from equity accounted investments for the current period minus share of profit/(loss) from equity accounted investments in the prior period. | |
| Other | Variances not explained by the above factors. |
119
Table of Contents
11 Other information
11.1 Company details
Refer to page i for further information.
11.2 Forward-looking statements
Refer to page i for further information.
This Report is made in accordance with a resolution of the Board.
Ken MacKenzie
Chair
Dated: 27 August 2024
120
Table of Contents
Corporate Governance Statement
Contents:
| 1. | Corporate governance at BHP |
| 2. | FY2024 corporate governance highlights |
| 3. | BHP’s governance structure |
| 4. | Board composition and succession |
| 5. | Board Committees |
| 6. | Management |
| 7. | Shareholders and reporting |
| 8. | Culture and conduct |
| 9. | Risk management and assurance |
| 10. | US requirements |
1. Corporate governance at BHP
Good corporate governance underpins the way we conduct business.
This Corporate Governance Statement sets out the corporate governance framework currently in place for the Group, including the key policies and practices.
BHP was fully compliant with the Recommendations of the fourth edition of the ASX Corporate Governance Council’s Corporate Governance Principles and Recommendations (ASX Fourth Edition) throughout FY2024. The ASX Fourth Edition is available at asx.com.au.
BHP is also subject to governance requirements from our London Stock Exchange (LSE) and New York Stock Exchange (NYSE) listings and our registration with the Securities and Exchange Commission (SEC) in the United States.
This Corporate Governance Statement is current as at 27 August 2024 and has been approved by the Board.
More information on our corporate governance framework and practices is available at bhp.com/governance, which includes links to our Appendix 4G and each of the publicly available documents referenced in this Corporate Governance Statement.
2. FY2024 corporate governance highlights
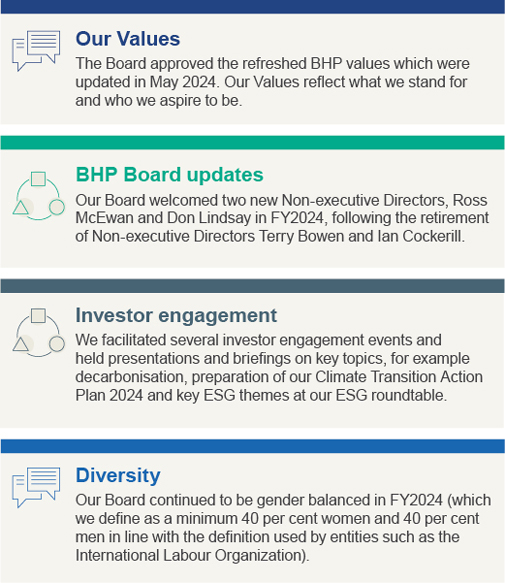
121
Table of Contents
3. BHP’s governance structure
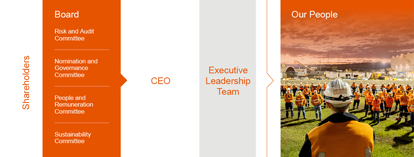
Board
The Board has ultimate responsibility for overseeing BHP’s governance. The role of the Board, as set out in the Board Governance Document, is to represent shareholders and promote and protect the interests of BHP in the short and long term.
The Board Governance Document outlines the Board’s responsibilities and processes, including the matters specifically reserved for the Board, the authority delegated to the Chief Executive Officer (CEO) and the accountability of the CEO for that authority, and provides guidance on the management of the relationship between the Board and the CEO. The Board Governance Document was updated in FY2023 and took effect from 1 July 2023.
The matters reserved for the Board as set out in the revised Board Governance Document include:
| • | appointing the CEO and determining the terms of the appointment |
| • | approving the appointment of Executive Leadership Team (ELT) members and material changes to the organisational structure involving direct reports to the CEO |
| • | succession planning for the CEO and direct reports to the CEO |
| • | monitoring the performance of the CEO and the Group |
| • | monitoring Board composition, processes and performance |
| • | approving the Group’s values, Our Code of Conduct, purpose and risk appetite |
| • | establishing, approving and assessing measurable objectives for achieving gender diversity in the composition of the Board, senior executives and workforce generally and assessing the Group’s progress in achieving those measurable objectives |
| • | approving strategy, annual budgets, balance sheet management and funding strategy |
| • | approving commitments, capital and non-capital items, acquisitions and divestments above specified limits |
| • | approving the dividend policy and determining dividends |
| • | approving significant social, community and sustainability policies, including those related to climate change and public sustainability goals and targets |
| • | reviewing and monitoring the effectiveness of the Group’s systems of principal and emerging financial and non-financial risk management and internal control, and making sure there is an appropriate risk management framework in place |
| • | determining and adopting documents (including the publication of reports and statements to shareholders) that are required by BHP’s Constitution, statute or by other external regulation |
| • | determining and approving matters that are required by BHP’s Constitution, statute or by other external regulation to be determined or approved by the Board |
>The Board Governance Document is available at bhp.com/governance
Committees
The Board has established Committees to assist it in exercising its authority, including monitoring the performance of BHP, to gain assurance that progress is being made towards our purpose within the limits delegated by the Board. There are four standing Committees: the Nomination and Governance Committee, Risk and Audit Committee, Sustainability Committee and People and Remuneration Committee.
>Each Committee is delegated authority by the Board under its Charter. These Charters are available at bhp.com/governance
>For more information on each of the Committees refer to section 5
Chair
The Chair is responsible for leading the Board and ensuring it operates to high governance standards. In particular, the Chair facilitates constructive Board relations and the effective contribution of all Non-executive Directors.
122
Table of Contents
Group Company Secretary
The Group Company Secretary is accountable to the Board and advises the Chair, the Board and individual Directors on all matters of governance process.
Chief Executive Officer
The CEO is accountable to the Board for the authority that is delegated to the CEO and for the performance of the Group. The CEO works in a constructive partnership with the Board and is required to report regularly to the Board on progress.
Access to management
The Board has extensive access to members of senior management who frequently attend Board and Committee meetings. Management makes presentations and engages in discussions with Directors, answers questions and provides input and perspective on their areas of responsibility. The Board also engages with members of management at site visits.
The Board also holds discussions in the absence of management as required.
4. Board composition and succession
4.1 Board of Directors and Company Secretary
The Board currently has 10 members. The Directors’ qualifications, experience and special responsibilities are listed below.

Ken MacKenzie BEng, FIEA, FAICD
Appointment
Independent Non-
Chair since 1 September 2017
| Skills and experience
Ken MacKenzie has global executive experience and a deeply strategic approach, with a focus on operational excellence, capital discipline and the creation of long-term shareholder value.
Ken was the Managing Director and Chief Executive Officer of Amcor Limited, a global packaging company with operations in over 40 countries, from 2005 until 2015.
Ken brings business management and leadership skills in global supply chains and governance gained during his career in developed and emerging markets in the Americas, Australia, Asia and Europe. Ken has experience in leading strategic transformation at a business and enterprise-wide level. His commitment to continuous learning and skills development provides valuable insights to Board deliberations and guidance to BHP’s leadership team in navigating the fast-changing dynamics of the global economy and markets.
Current appointments
Ken is the Chair of Melbourne Business School Limited (since June 2023), sits on the Advisory Board of American Securities Capital Partners LLC (since January 2016), and is a part-time adviser at Barrenjoey (since April 2021). |


123
Table of Contents
Mike Henry BSc (Chemistry)
Appointment
Non-independent Director since January 2020 Chief Executive Officer since 1 January 2020
| Skills and experience
Mike Henry has over 30 years’ experience in the global mining and petroleum industry, spanning operational, commercial, safety, technology and marketing roles.
Mike joined BHP in 2003 and has been a member of the Executive Leadership Team since 2011. Prior to joining BHP, Mike worked in the resources industry in Canada, Japan and Australia.
Mike brings deep operational and market knowledge across a range of commodities and a strategic approach to resource and skills development to implement BHP’s strategy and future growth options that will support global economic growth and decarbonisation. He is focused on creating a safe, high-performance culture, enabled by an inclusive workplace in which people are empowered at every level through the BHP Operating System.
Mike is committed to building strong relationships with governments, Indigenous partners, community stakeholders and business partners to ensure BHP’s activities deliver mutual benefit to these stakeholders while driving strong value for shareholders. Mike brings a disciplined approach to the Board’s considerations of capital allocation in assets, technology, commodities and risk management. |

Xiaoqun Clever-Steg Diploma in Computer Science and International Marketing, MBA
Appointment
Independent Non-executive Director since October 2020
| Skills and experience
Xiaoqun Clever-Steg has over 20 years’ experience in technology with a focus on software engineering, data and AI, cybersecurity and digitalisation.
Xiaoqun was formerly Chief Technology Officer of Ringier AG and ProSiebenSat.1 Media SE and Chief Operating Officer of Technology and Innovation at SAP and President of SAP Labs China.
Xiaoqun brings significant expertise in the development, selection and implementation of business transforming technology, innovation and assessment of opportunities and risks in digital disruption. She has knowledge and relationships across the technology and innovation start-up sector across Europe, Asia and North America and brings depth to the Board’s review of managing cybersecurity risks as well as assessment of opportunities to invest in proven and emerging technologies in the discovery of new mineral deposits, safer and more cost-effective processing, and technologies to reduce GHG emissions and support the energy transition.
Current appointments
Xiaoqun is a Non-executive Director of Amadeus IT Group SA (since June 2020), a Non-executive Director of Straumann Group (since April 2024) and on the Supervisory Board of Infineon Technologies AG (since February 2020). |


124
Table of Contents
Gary Goldberg
BS (Mining Engineering), MBA
Appointment
Independent Non- since February 2020
Senior Independent
| Skills and experience
Gary Goldberg has over 40 years’ global executive experience, including deep experience in mining, strategy, risk, commodity value chain, capital allocation discipline and public policy.
Gary was the Chief Executive Officer of Newmont Corporation (from 2013 to 2019), and prior to that, President and Chief Executive Officer of Rio Tinto Minerals. Gary has also been a non-executive Director of Port Waratah Coal Services Limited and Rio Tinto Zimbabwe, and served as Vice Chair of the World Gold Council, Treasurer of the International Council on Mining and Metals, Co-Chair of the World Economic Forum Mining and Metals Industry community and Chair of the National Mining Association in the United States.
Gary is recognised for his leadership in bringing the mining industry together to raise standards in safety and environmental performance in conjunction with community and government partnerships in America and around the world. He has management experience in implementing strategies focused on safety, decarbonisation and transformational investment for commodities with long-dated cycles, along with his contribution to policy development in environmental management globally.
Current appointments
Gary is a Director of Imperial Oil Limited (since May 2023). | |
Michelle Hinchliffe
BCom, FCA, ACA
Appointment
Independent Non- since March 2022
| Skills and experience
Michelle Hinchliffe has over 20 years’ experience as a partner in KPMG’s financial services division.
Michelle was formerly a partner of KPMG and held a number of roles, including as the UK Chair of Audit, a member of the KPMG UK Executive Committee, and led KPMG’s financial services practice in Australia and was a member of the KPMG Australia Board.
Michelle has expertise and experience in understanding the complexities of multi-national firms operating in multiple reporting and regulatory frameworks across Europe, the Americas, Asia and Africa. Her financial expertise and audit experience across a range of industries and businesses, including in Australia, bring insights to the Board on BHP’s assessment of risk, returns and its long-term capital plan to create financial strength and support BHP’s future growth.
Current appointments
Michelle is a Non-executive Director of Santander UK plc and Santander UK Group Holdings Plc (since June 2023) and Macquarie Group Limited and Macquarie Bank Limited (since March 2022). |


125
Table of Contents
Don Lindsay
BS (Hons), MBA
Appointment
Independent Non-executive Director since May 2024
| Skills and experience
Don Lindsay has more than 40 years’ global experience, including in mining and resource development, financial markets, transformational leadership, growth and value creation.
Don was the President and Chief Executive Officer of Teck Resources Limited (from 2005 to 2022) and prior to that, worked for almost 20 years with CIBC World Markets Inc., where he served as President, Head of Investment and Corporate Banking and Head of the Asia Pacific Region. Don also served as Chair of the Board of Governors for Mining and Metals for the World Economic Forum, Chair of the Business Council of Canada and Chair of the International Council on Mining and Metals.
Don brings extensive experience in global resource development as well as sustainability, community health, safety and global education and business forums. His technical and management experience across a range of commodities and mining jurisdictions brings a unique understanding of prospective resources, cost of development and operations, and the assessment of opportunities to strengthen the portfolio of world-class assets.
Current appointments
Don is Chair of the Board of Manulife Financial Corporation (since February 2023) and the Invictus Games Vancouver Whistler 2025 (since November 2022). | |
Ross McEwan
BBus
Appointment
Independent Non-executive Director since April 2024
| Skills and experience
Ross McEwan has over 30 years’ global executive experience, including in the financial services industry, with deep expertise in capital allocation, risk management and value creation in complex regulatory environments.
Ross was the CEO of National Australia Bank (from 2019 to April 2024) and Group CEO of the Royal Bank of Scotland (from 2013 to 2019). Prior to that, he held executive roles at Commonwealth Bank of Australia, First NZ Capital Securities and National Mutual Life Association of Australasia/AXA New Zealand.
Ross brings a strong focus on people and culture, technology and innovation and has extensive experience in capital allocation and value creation. He has worked closely with a wide range of stakeholders, including customers, governments and regulators and brings a global perspective. Ross has a deep understanding of organisational transformation and brings a very strong focus on the customer and technology as a driver of change.
Current appointments
Ross is currently on the Board of QinetiQ Group Plc (since March 2024) and Ruminant Biotech Corp Limited (since June 2021). |


126
Table of Contents
Christine O’Reilly
BBus
Appointment
Independent Non-executive Director since October 2020
| Skills and experience
Christine O’Reilly has over 30 years’ experience in the financial and infrastructure sectors, with deep financial and public policy expertise and experience in large-scale capital projects and transformational strategy.
Christine was the Chief Executive Officer of the GasNet Australia Group and Co-Head of Unlisted Infrastructure Investments at Colonial First State Global Asset Management, following an early career in investment banking and audit at Price Waterhouse. Christine has also served as a Non-executive Director of Medibank Private Limited (from March 2014 to November 2021), Transurban Group (from April 2012 to October 2020), CSL Limited (from February 2011 to October 2020) and Energy Australia Holdings Limited (from September 2012 to August 2018).
Christine has a deep understanding of financial drivers of the businesses and experience in capital allocation discipline across sectors that have long-dated paybacks for shareholders and stakeholders. Her insights into cost efficiency and cash flow as well as the impact of policy on innovation, investment and project development are key inputs for the Board.
Current appointments
Christine is a Non-executive Director of Australia and New Zealand Banking Group (since November 2021), Stockland Limited (since August 2018) and Infrastructure Victoria (since November 2023). | |
Catherine Tanna
LLB, Honorary Doctor of Business
Appointment
Independent Non-executive Director since April 2022
| Skills and experience
Catherine Tanna has more than 30 years’ experience in the resources, oil and gas, power generation and retailing sectors.
Catherine was formerly Managing Director of Energy Australia between 2014 and 2021. Prior to this, she held senior executive roles with Shell and BG Group with responsibility for international operations across Africa, North Asia, Russia, North America, Latin America and Australia. Catherine was also a member of the Board of the Reserve Bank of Australia (from 2011 to 2021) and a Director of the Business Council of Australia (from 2016 to 2021).
Catherine has a track record in leading cultural change and sponsoring gender equity, diversity and inclusion across business and more broadly. She brings an understanding of and contribution to complex regulatory and policy environments. Catherine’s experience in seeking to align customer and community expectations, particularly Indigenous communities, with those of the enterprise and regulators, provides unique insight and input to the Board.
Current appointments
Catherine is a Non-executive Director at Bechtel Corporation (since May 2023), Chair of Bechtel Australia (since December 2023), Senior Advisor at McKinsey & Company Inc (since April 2022) and a member of the Advisory Board of Fujitsu Australia (since February 2022). |


127
Table of Contents
Dion Weisler
BASc (Computing), Honorary Doctor of Laws
Appointment
Independent Non-
| Skills and experience
Dion Weisler has extensive global executive experience, including transformation and commercial experience in the global information technology sector, with a focus on capital discipline and stakeholder engagement.
Dion was formerly a Director and the President and Chief Executive Officer of HP Inc. (from 2015 to 2019) and continued as a Director and Senior Executive Adviser (until May 2020). He previously held senior executive roles at Lenovo Group Limited, was General Manager Conferencing and Collaboration at Telstra Corporation and held various positions at Acer Inc., including as Managing Director, Acer UK.
Dion brings experience in transforming megatrends into opportunities and growth and valuable insight on the power of innovation, technology and data. His experience also demonstrates insights into strategy development in the global energy transition, where safety, decarbonisation and stakeholder management are critical.
Current appointments
Dion is a Non-executive Director of Intel Corporation (since June 2020) and a Non-executive Director of Thermo Fisher Scientific Inc. (since March 2017). | |
Stefanie Wilkinson
BA, LLB (Hons), LLM, FGIA
Appointment
Group Company Secretary effective March 2021
| Skills and experience
Stefanie Wilkinson was appointed Group Company Secretary effective March 2021 and Group General Counsel effective 2 April 2024. Prior to joining BHP, Stefanie was a Partner at Herbert Smith Freehills, a firm she was with for 15 years, specialising in corporate law and governance for listed companies. Earlier in her career, Stefanie was a solicitor at Allen & Overy in the Middle East. Stefanie is a fellow of the Governance Institute of Australia. |


4.2 Director independence
The Board is committed to ensuring that a majority of Directors are independent.
The Board has adopted a policy that it uses to determine the independence of its Directors.
>The Policy on the Independence of Directors is available at bhp.com/governance
Determination of Director independence
The Board confirms that it considers all current Non-executive Directors, including the Chair, to be independent of management and free of any interest, position or relationship that might influence, or reasonably be perceived to influence, in a material respect their capacity to bring an independent judgement to bear on issues before the Board and to act in the best interests of BHP as a whole rather than in the interests of an individual security holder or other party.
128
Table of Contents
A determination of independence is carried out upon a Director’s appointment and re-election, annually, and when any new interests, positions or relationships are disclosed by a Director. Some Directors hold or have previously held positions in companies that BHP has commercial relationships with.
The Board has assessed the relationships between BHP and the companies in which Directors hold or held positions and has concluded that the relationships do not interfere with the Directors’ capacity to bring an independent judgement to bear on issues before the Board, or their ability to act in the best interests of BHP as a whole.
Conflicts of interest
In accordance with Australian law, if a situation arises for consideration where a Director has a material personal interest, the affected Director takes no part in decision-making unless approval is provided by the non-interested Directors. Provisions for Directors’ interests are set out in the Constitution of BHP Group Limited.
4.3 Board appointments and succession planning
BHP adopts a structured and rigorous approach to Board succession planning to guard against the consequences of unforeseen departures and facilitate the orderly replacement of current Directors and oversees the development of a diverse pipeline. This process is continuous, with the aim of allowing the Board to determine an appropriate balance on the Board between experience and fresh perspectives, and the Board continues to be fit for purpose. As part of this process, Ross McEwan was appointed to the Board in April 2024 and Don Lindsay was appointed to the Board in May 2024 following the retirements of independent Non-executive Directors, Terry Bowen in November 2023 and Ian Cockerill in April 2024.
Before the Board formally appoints a person or puts a person forward for election, the Board, with the assistance of external consultants, will conduct appropriate background and reference checks as to that person’s character, experience, education and criminal and bankruptcy history.
The Board has adopted a letter of appointment that contains the terms on which Non-executive Directors will be appointed, including the basis upon which they will be indemnified by the Group. The letter of appointment defines the role of Directors, including the expectations in terms of independence, participation, time commitment and continuous improvement. Written agreements are in place for all Non-executive Directors.
4.4 Director induction, training and development
Upon appointment, each new Non-executive Director undertakes an induction program tailored to their needs. Non-executive Directors also undertake an induction program when they join a new Committee, which is tailored to the areas specific to that Committee’s role and the Director’s previous experience.
Following the induction program, Non-executive Directors participate in continuous improvement activities through a training and development program, which is overseen by the Nomination and Governance Committee to help Directors, individually and collectively, develop and maintain the skills and knowledge to assist them in performing their role effectively. The training and development program is periodically reviewed to maximise effectiveness and to tailor the program to the Directors’ needs and the Board’s areas of focus.
Throughout the year, the Chair discusses development areas with each Director. Board Committees review and agree their needs for more briefings. The benefit of this approach is that induction and learning opportunities can be tailored to Directors’ Committee memberships, as well as the Board’s specific areas of focus. This approach is also intended to ensure a coordinated process for succession planning, Board renewal, training and development and Committee composition. In turn, these processes are relevant to the Nomination and Governance Committee’s role in identifying appropriate Non-executive Director candidates.
Examples of activities in the training and development program include:
| • | briefings and development sessions and deep dives to provide each Director with a deeper understanding of the activities, environment, key issues and direction of BHP assets, along with broader sustainability, climate-related, geopolitical and cybersecurity considerations |
| • | training on crisis management |
| • | site visits to provide insights into key issues at BHP’s sites and to provide an opportunity for direct engagement with a cross-section of workforce, community members, contractors, Indigenous and First Nations representatives and other stakeholders |
| • | engagement with external experts to discuss views on current and emerging trends and risks (threats and opportunities). |
4.5 Director skills, experience and attributes
Overarching statement of Board requirements
At BHP, we know inclusive and diverse teams are safer and more productive. This is because people in these teams feel safe to speak up, share their ideas and different points of view, and work together to solve problems and make better decisions.
The BHP Board is no different and believes its members should comprise Directors with a broad range of skills and diversity for the Board to:
| • | provide the breadth and depth of understanding necessary to effectively create long-term shareholder value |
| • | protect and promote the interests of BHP and the creation of social value |
| • | ensure the talent, capability and culture of BHP support the long-term delivery of our strategy |
Attributes and commitment to role
All Directors are expected to comply with Our Code of Conduct, act with integrity, lead by example and promote the desired culture.
129
Table of Contents
The Board believes each Non-executive Director has demonstrated the attributes of sufficient time to undertake the responsibilities of the role, honesty and integrity, and a preparedness to question, challenge and critique throughout the year through their participation in Board meetings, and the other activities they have undertaken in their roles.
Skills matrix
The Board, supported by the Nomination and Governance Committee, reviews the skills and diversity represented by the Directors on the Board and determines whether the composition and mix of those skills remains appropriate to achieve BHP’s purpose and strategy.
The Board maintains a skills matrix that identifies the skills and experience the Board needs for the next period of BHP’s development, considering BHP’s circumstances and the changing external environment.
The Board skills matrix identifies the future-facing skills the Board intends to build, acquire and retain over the medium term in anticipation of its needs as it pursues its strategy of securing growth options in future-facing commodities. The Board skills matrix not only indicates the skills the Board currently possesses, but also provides an illustration of the new skills the Board intends to acquire. An external service provider is engaged to assess the relevant skills and experience of the Directors on the Board set out in the skills matrix.
The Board collectively possesses all the skills and experience set out in the skills matrix, and each Director satisfies the Board requirements and attributes discussed above.
| Skills and attributes | Number of Directors | |
Mining Senior executive who has deep operating or technical mining experience with a large company operating in multiple countries; successfully optimised and led a suite of large, global, complex operating assets that have delivered consistent and sustaining levels of high performance (related to cost, returns and throughput); successfully led exploration projects with proven results and performance; delivered large capital projects that have been successful in terms of performance and returns; and a proven record in terms of health, safety and environmental performance and results. | 3 | |
Global experience Global experience gained from working, managing business units and residing in multiple geographies over an extended period of time, including a deep understanding of and experience with global markets, and the geopolitical and economic environment. | 9 | |
Strategy Senior executive who has had accountability for enterprise-wide strategy development and implementation in industries with long cycles and developing and leading business transformation strategies. | 10 | |
Commodity value chain and customers End-to-end value or commodity chain experience – understanding of consumers and customers, marketing demand drivers (including specific geographic markets) and other aspects of commodity chain development. | 8 | |
Financial acumen Extensive financial experience and the capability to evaluate financial statements and understand key financial drivers of the business, bringing a deep understanding of corporate finance and internal financial controls. | 10 | |
Operating risk Extensive experience with the development and oversight of complex frameworks focused on the identification, assessment and assurance of operational workplace health, safety, environment, climate and community risks. | 9 | |
Technology Recent experience and expertise with the development, selection, and implementation of leading and business transforming technology and innovation and responding to digital disruption. | 8 | |
Capital allocation and cost efficiency Extensive direct experience gained through a senior executive role in capital allocation discipline, cost efficiency and cash flow, with proven long-term performance. | 8 | |
Social value, community, and stakeholder engagement Extensive track record of positive external stakeholder engagement including in relation to community issues and social responsibility. In-depth understanding of public policy, government relations and the intersection between value generation and corporate reputation. | 7 | |
Sustainability and decarbonisation transition Understanding of, and experience with the identification and management of threats and opportunities related to sustainability, and decarbonisation transition. | 8 | |
People and talent Extensive experience in talent and capability strategies, including for development, recruitment and retention, and industrial relations, managing workforce transitions and upskilling workforce during periods of rapid change. | 8 |
4.6 Diversity
BHP has adopted an Inclusion and Diversity Position Statement, which sets out our diversity policy and our priorities to accelerate the delivery of a more inclusive work environment and to enhance overall workplace diversity.
>BHP’s Inclusion and Diversity Position Statement is available at bhp.com/careers/inclusion-diversity and is summarised in OFR 6.6
130
Table of Contents
Our aspiration is to achieve gender balance within our employee workforce globally by CY2025. We define gender balance as a minimum 40 per cent women and 40 per cent men, in line with the definitions used by entities such as the International Labour Organization.
The Board is responsible for approving the measurable objectives for achieving diversity in the composition of the Board, senior executives and workforce generally and assessing the Group’s progress in achieving those measurable objectives, which are set out below. The Nomination and Governance Committee reviews and makes recommendations to the Board on the diversity and measurable objectives for achieving diversity in the composition of the Board and reviews the progress in achieving those measurable objectives.
| Measurable objective for FY2024 | Progress in FY2024 | |
| Increase female employee representation to 40 per cent by the end of FY2025 | In FY2024, the Board approved the objective to increase the representation of women across the BHP employee workforce by 3 per cent from the FY2023 objective of 35.2 per cent. During FY2024, BHP increased the representation of women working at BHP by 1.9 percentage points, with women now representing 37.1 per cent of the global employee workforce as at 30 June 2024.1 | |
| Maintain balanced representation for the Board and senior executives (defined as ELT and direct reports to the ELT in grade 15 and above roles) | Our Board continued to be gender balanced in FY2024.
Our senior executive ranks remain consistent and represent 40.9 per cent women in FY2024. |
Footnotes:
| 1. | Progress does not include data from the Daunia and Blackwater mines which were divested during the year. |
>For more information on our focus areas for diversity during FY2024 and the respective proportions of men and women on the Board, in senior executive positions and across the employee workforce refer to OFR 6.6
>More diversity data is available in the BHP ESG Standards and Databook 2024 available at bhp.com/ESGStandards2024
The Board’s composition reflects gender balance and a diversity of experience, education and geographic background.
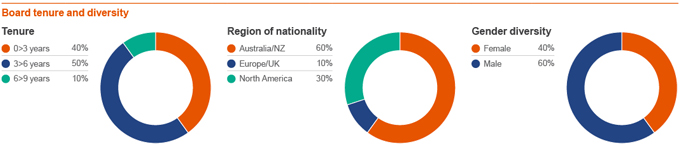
As at 30 June 2024, 40 per cent of Directors are female and the BHP Board satisfies the target in the UK Listing Rules and the guidance of having at least 30 per cent of Directors of each gender in accordance with the ASX Fourth Edition. BHP also satisfies the UK Listing Rule target of having at least one Director from a minority ethnic background on the Board.
BHP does not currently satisfy the UK Listing Rule target that at least one of the senior positions on the Board (which for BHP is the Chair, Chief Executive Officer and Senior Independent Director) is held by a woman. The UK Listing Rule target also includes the Chief Financial Officer in the category of a senior position on the Board. Vandita Pant was appointed as Chief Financial Officer in March 2024, but, in common with Australian listed company practice, the Chief Financial Officer is not a Director on the Board of BHP. As part of its succession planning, the Board reviews the skills and diversity (including gender, age, personal strengths and social and ethnic backgrounds) represented by Directors on the Board and determines whether the composition and mix of those skills and diversity remains appropriate to achieve BHP’s purpose and strategy.
The tables in Additional information 7 set out the information required under the UK Listing Rules on diversity as at 30 June 2024. The data presented in these tables was collected by requesting all members of the Board, ELT and Group Company Secretary self-report in questionnaires that include the tables prescribed by the UK Listing Rules.
4.7 Board evaluation
The Board is committed to transparency in assessing the performance of Directors. The Board conducts regular evaluations of its performance, the performance of its Committees, the Group Chair, Directors and the governance processes that support the Board’s work.
The evaluation considers the balance of skills, experience, independence and knowledge of the Group on the Board, its diversity and culture, and the operation of governance processes.
131
Table of Contents
In FY2024, an internal evaluation was conducted with the assistance of external service provider, Lintstock. An external Board evaluation is conducted approximately every three years and was last conducted in FY2023.
Review of individual Director performance
The Board has adopted a policy for all Non-executive Directors to seek re-election annually. The Board uses the results of Director performance evaluations in considering whether to nominate a Director for re-election by shareholders. In FY2024, an assessment was conducted of each Director’s performance prior to their nomination for re-election with the assistance of external service provider, Lintstock. Lintstock does not have any other connection with the Group or individual Directors.
The assessment of Directors focused on the contribution of each Director to the work of the Board and its Committees, and the expectations of Directors as set out in BHP’s governance framework. In addition, the assessment focused on how each Director contributes to Board cohesion and effective relationships with fellow Directors, commits the time required to fulfil their role and effectively performs their responsibilities. Directors were asked to comment on areas where their fellow Directors contribute the greatest value and potential areas for development.
Lintstock provided feedback received to the Chair, which was then discussed with Directors. Feedback relating to the Chair was discussed with the Chair by the Senior Independent Director. As a result of these outcomes, the review supported the Board’s decision to recommend each Director standing for re-election.
Committee assessments
Following an assessment of its work, each Committee concluded that it had met the requirements under its Charter in FY2024.
5. Board Committees
The Board has four standing Committees and has delegated a number of duties to each Committee to assist the Board in exercising its responsibilities and discharging its duties. Each Committee’s Charter sets out the Committee’s roles and responsibilities. These Charters were reviewed and updated in FY2023 as part of the governance review. The aim was to review Board and Committee responsibilities and streamline and modernise the documents in order to best support BHP’s strategy and purpose.
>The updated Charters took effect from 1 July 2023 and are available at bhp.com/governance
BHP’s Board and Committee governance structure facilitates a considered and integrated approach on key matters, for example:
| • | Climate change is a Board-level issue. The Board is responsible for the governance and oversight of climate change issues, including in relation to our strategic approach, risk management and public disclosures. The Board approves significant social, community and sustainability policies, including those related to climate change and public sustainability goals and targets, and oversees performance against our strategy, goals and targets. The Board is supported by each of its Committees: |
| • | The Nomination and Governance Committee reviews and makes recommendations to the Board on the Group’s significant social, community and sustainability policies, including those related to climate change. The Committee also reviews and makes recommendations to the Board on the Group’s public sustainability targets and goals. |
| • | The Risk and Audit Committee is responsible for assisting the Board in overseeing and reviewing emerging and principal risks facing the Group, including climate risks. The Risk and Audit Committee also reviews and recommends to the Board public financial disclosures regarding sustainability matters. |
| • | The Sustainability Committee reviews and advises the Board on the adequacy of the Group’s governance and performance in relation to climate matters. The Committee also reviews and recommends to the Board disclosures regarding sustainability matters in the Annual Report and other public documents related to the Group’s reporting on climate matters. |
| • | The People and Remuneration Committee is responsible for reviewing and recommending to the Board for approval of performance measures and performance outcomes against those performance measures for the ELT. In doing so, the Committee considers recommendations from the Sustainability Committee in relation to climate measures. |
| • | Sexual harassment is a Board-level issue, supported by the Risk and Audit Committee on the risk and compliance aspects and the Sustainability Committee on the safety, operational aspects and security controls. |
| • | Technology and cyber risk are Board-level issues, supported by the Risk and Audit Committee, which reviews emerging and principal risks facing the Group, including cyber risk. |
The Board appoints the members and Chair of each Committee. Only independent Non-executive Directors can be Committee Chairs.
The members and key roles and responsibilities of each Committee are set out below.
>For Committee attendance and members during FY2024 refer to Directors’ Report 2
132
Table of Contents
5.1 Nomination and Governance Committee
Members
Ken MacKenzie (Chair), Terry Bowen (until 1 November 2023), Gary Goldberg, Michelle Hinchliffe (from 1 November 2023), Christine O’Reilly, Catherine Tanna (from 1 July 2024)
Key responsibilities/role and focus:
The role of the Nomination and Governance Committee is to support the Board in relation to governance and nomination matters.
The Committee oversees the Group’s corporate governance framework and practices, succession planning and processes, Board and Director performance evaluation, Director training and development, and advises and makes recommendations to the Board on the Group’s existing corporate governance policies, structures or practices.
The Committee also supports the Board with sustainability-related matters that encompass issues that affect the whole of the Group, including areas of strategy, risk and reporting, people and remuneration by reviewing and recommending to the Board for approval the Group’s:
| • | significant social, community and sustainability policies, including those related to climate change, industry associations and charitable contributions |
| • | public sustainability targets and goals |
Key activities in FY2024:
Succession planning processes
| • | Board and Committee succession |
| • | Identification of suitable Non-executive Director candidates |
| • | Partnering with search firms regarding candidate searches |
Evaluation and training
| • | Board evaluation and Director performance evaluation |
| • | Director development program and training |
| • | Assessment of independence of Non-executive Directors |
Governance practices
| • | Crisis management |
| • | Review of the Climate Transition Action Plan 2024 |
5.2 Risk and Audit Committee
Members
Michelle Hinchliffe (Chair since 1 November 2023, and a member of the Committee prior to this date), Terry Bowen (Chair until 1 November 2023), Xiaoqun Clever-Steg, Ian Cockerill (until 4 April 2024), Don Lindsay (from 1 May 2024), Ross McEwan (from 3 April 2024), Christine O’Reilly
Key responsibilities/role and focus:
The role of the Risk and Audit Committee is to support and advise the Board in relation to financial reporting, external and internal audit, capital management and risk management. The Committee also oversees and assists the Board in reviewing the emerging and principal risks facing the Group, including financial and non-financial risks that could threaten the Group’s business model, future performance, solvency, liquidity or reputation.
US committee membership requirements
The Board is satisfied that Michelle Hinchliffe, who serves as Chair on the Risk and Audit Committee, meets the financial expert requirements under the US Securities and Exchange Commission (SEC) Rules and is independent under applicable NYSE rules. The Board is also satisfied that the Committee meets the independence criteria under Rule 10A-3 of the Exchange Act.
Key activities in FY2024:
Integrity of Financial Statements and funding matters
| • | Accounting matters for consideration, materiality limits, half-year and full-year results |
| • | Sarbanes-Oxley Act of 2002 (SOX) compliance |
| • | Financial governance procedures |
| • | Funding and guarantee updates |
| • | Samarco dam failure provision, including related provisions and contingent liabilities |
| • | Carrying value of BHP’s assets |
| • | Climate-related financial statement and risk disclosures |
| • | Closure and rehabilitation provisions |
| • | Disputes and litigation updates |
133
Table of Contents
External Auditor and integrity of the audit process
| • | Status and results of the external audit |
| • | Management and External Auditor closed sessions |
| • | Audit plan and review of the External Auditor’s performance |
| • | External Auditor independence and non-audit services |
Effectiveness of systems of internal control and risk management
| • | Reports on the significant risks facing the Group and the Group’s systems of risk management and internal control (including cybersecurity and data privacy) |
| • | Internal audit reports, annual internal audit plan and review of performance of the Internal Audit team |
| • | Reports on sexual harassment, racism and bullying, serious breaches of business conduct, regulatory compliance and grievance and investigation processes |
| • | Reserves and resources updates |
5.3 Sustainability Committee
Members
Catherine Tanna (Chair from 1 July 2024), Gary Goldberg (Chair until 1 July 2024), Ian Cockerill (until 4 April 2024), Don Lindsay (from 1 May 2024), Dion Weisler
Key responsibilities/role and focus:
The role of the Sustainability Committee is to support and advise the Board on sustainability matters.
The Committee oversees the Group’s health, safety, environment, climate and community performance, including implementation of the Group’s strategy, policies and processes in relation to these matters.
The Committee also reviews and advises the Board on the adequacy of the Group’s governance of health, safety, environment, climate and community matters, including consideration of emerging areas of risk related to the Group’s operations and its engagement with customers, suppliers and communities.
Key activities in FY2024:
Sustainability
| • | Operational decarbonisation, water stewardship, cultural heritage and Indigenous engagement, biodiversity, closure and rehabilitation, fatality elimination program and integrated contractor management program updates |
| • | Site visits |
| • | Reports on material health, safety, environment, climate and community risks, including tailings, occupational safety and sexual harassment |
| • | Health, safety and security function plan |
| • | Internal audit reports and annual internal audit plan related to health, safety, environment and community |
Disclosure
| • | Health, safety and environment compliance updates |
| • | Sustainability disclosures |
| • | Group Modern Slavery Statement |
| • | Disclosures for Global Industry Standard on Tailings Management |
Performance
| • | Monitor health, safety, environment, climate and community performance, including progress against 2030 goals |
| • | Safety and sustainability measures and performance outcomes for the ELT FY2024 CDP scorecard |
| • | Review health, safety and environment function and performance of the Group Health, Safety and Security Officer |
5.4 People and Remuneration Committee
Members
Christine O’Reilly (Chair), Ross McEwan (from 3 April 2024), Catherine Tanna, Dion Weisler
Key responsibilities/role and focus:
The role of the People and Remuneration Committee is to support and advise the Board on people and remuneration matters.
The Committee oversees the Group’s key strategies and policies relating to people, including for attraction, recruitment, motivation and retention, employee engagement, leadership and talent development, industrial relations and employee conduct, and monitors the effectiveness of the Group’s people and culture strategy and its alignment with the Group’s purpose and values.
The Committee oversees and monitors the remuneration framework and practices, including the adoption of incentive plans, levels of reward for the CEO and other ELT members and any major changes in employee benefits structures in the Group.
>For information on BHP’s remuneration practices and policies, including on hedging BHP shares and equity instruments, refer to the Remuneration Report
134
Table of Contents
Key activities in FY2024:
Remuneration
| • | Executive remuneration strategies |
| • | Group Chair, CEO, ELT members and Group Company Secretary remuneration |
People
| • | People culture and strategy, people policies and governance, material workforce trends |
| • | Employee engagement, leadership and talent development |
| • | Diversity and inclusion policies and measurable objectives (below Board level) |
Incentive plans
| • | BHP’s employee incentive plans |
6. Management
Below the level of the Board, key management decisions are made by the CEO, the ELT, management committees and members of management in accordance with their delegated authority.
6.1 Executive Leadership Team
| Edgar Basto, Chief Operating Officer (BSc, Metallurgy) Edgar Basto joined BHP in 1989 and was appointed Chief Operating Officer in October 2022. Edgar is responsible for Group Health, Safety and Security, the BHP Operating System (BOS) and global Performance and Improvement. Edgar’s accountability also includes Copper South Australia and its long-term growth pathway following the recent integration of the former OZ Minerals operations into our business. Edgar has previously held senior roles at BHP, including President Minerals Australia, Asset President of Western Australia Iron Ore and Asset President Escondida (Chile).
| |
| Caroline Cox, Chief Legal, Governance and External Affairs Officer (BA (Hons), MA, LLB, BCL) Caroline Cox joined BHP in 2014 and was appointed Chief Legal, Governance and External Affairs Officer in November 2020. Caroline is responsible for Legal, Governance, Ethics and Investigations, Compliance, Global Corporate Affairs and Communications and Sustainability and Social Value. Caroline has previously held senior roles at BHP, including Vice President Legal, Group General Counsel, and Group General Counsel & Company Secretary. Prior to joining BHP, Caroline was a Partner at Herbert Smith Freehills.
| |
| Brandon Craig, President Americas (BSc Engineering (Mechanical), MBL) Brandon Craig joined BHP in 1999 and was appointed President of BHP Americas effective 1 March 2024. Brandon is responsible for BHP’s copper operations in Chile, joint venture interests in the Americas, and potash operations in Canada. Immediately prior to his appointment as President Americas, Brandon was Asset President for BHP’s iron ore business in Western Australia. Brandon’s expertise with BHP extends more than 20 years, holding various leadership roles spanning the fields of maintenance, marketing and human resources.
| |
| Vandita Pant, Chief Financial Officer (BCom (Hons), MBA) Vandita Pant joined BHP in 2016 and was appointed Chief Financial Officer effective 1 March 2024. Vandita is responsible for overseeing the Group’s Reporting, Tax, Treasury, Investor Relations, Financial Planning, Risk and Internal Audit teams. Vandita has previously held senior roles at BHP, including as Chief Commercial Officer from July 2019 to 29 February 2024, Group Treasurer and Head of Europe. Prior to joining BHP, Vandita had more than 20 years’ experience in executive banking roles across India, Singapore, Japan and the United Kingdom. Vandita brings strong global financial market, commodity, strategy, capital allocation and business development experience to the role.
| |
| Catherine Raw, Chief Development Officer (MA (Cantab.), Natural Sciences, MSc, Mineral Project Appraisal, CFA) Catherine Raw joined BHP on 29 April 2024 as Chief Development Officer. Catherine is responsible for strategy, acquisitions and divestments, securing early-stage growth options and ventures. Prior to joining BHP, Catherine held senior roles in resources and finance industries, including at SSE Thermal (a business unit of SSE plc) as Managing Director, Barrick Gold Corporation as Chief Operating Officer for North America and as Chief Financial Officer, and BlackRock as Managing Director, Natural Resources Team.
| |
| Geraldine Slattery, President Australia (BSc, Physics, MSc, International Management) Geraldine Slattery joined BHP in 1994 and was appointed President Australia in October 2022. Geraldine leads BHP’s Australian operations in Western Australia, Queensland and New South Wales. Geraldine has previously held senior roles at BHP, including President Petroleum from March 2019 to 31 May 2022. Geraldine has 30 years’ experience with BHP, including as President Petroleum, Asset President Conventional and prior to that in several senior operational and business leadership roles across the Petroleum business in the United Kingdom, Australia and the United States.
|


135
Table of Contents
| Ragnar Udd, Chief Commercial Officer (BAppSc (Mining Engineering), MEng, MBA) Rag Udd joined BHP in 1997 and was appointed Chief Commercial Officer effective 1 March 2024. Rag has global accountability for Sales and Marketing, Procurement, Maritime and for developing BHP’s views on global commodities markets and macro trends. Rag has over 25 years’ experience in the global resources industry, including in Australia, Asia and North and South America. He has held senior roles at BHP in operations, logistics, projects and technology, including President Americas from November 2020 to 29 February 2024, Acting Chief Technology Officer and Asset President of BHP Mitsubishi Alliance.
| |
| Johan van Jaarsveld, Chief Technical Officer (BEng (Chem), MCom, Applied Finance, PhD (Eng), Extractive Metallurgy) Johan van Jaarsveld joined BHP in 2016 and was appointed Chief Technical Officer effective 1 March 2024. Johan is responsible for Technology, Minerals Exploration, Innovation and the Centres of Excellence for Projects, Maintenance, Resources and Engineering. Johan has previously held senior executive roles at BHP, including Chief Development Officer from September 2020 to 29 April 2024. Prior to joining BHP, Johan held executive positions in resources and finance, including at Barrick Gold Corporation, Goldman Sachs and The Blackstone Group.
| |
| Jad Vodopija, Chief People Officer (BA, PGDip (Industrial Relations and Human Resource Management), MComm) Jad Vodopija rejoined BHP in 2019 and was appointed Chief People Officer in July 2022. Jad is responsible for organisational strategy, talent and resource management, leadership development and workforce performance. Jad has previously held senior roles at BHP, including Vice President, Human Resources. Prior to rejoining BHP, Jad was Vice President Human Resources at Orica from 2016, before which she had built her career at BHP and earlier on at Ford Motor Company.
|


6.2 Senior management succession
A senior management succession process is conducted to support pipeline stability for critical roles. A talent deep dive is conducted by the Board at least once a year to evaluate these pipelines, including the diversity of the pipeline.
Senior management succession is viewed from a five-year perspective that considers the readiness of successors across time horizons, contexts and future capability demands. Select Board members are involved in the interview process for executive-level appointments one level below the CEO and occasionally for roles two levels below the CEO. Appropriate checks are undertaken before appointing a member of the ELT. BHP has a written agreement with each ELT member setting out the terms of their appointment.
In December 2023, BHP announced the following changes to the ELT:
| • | Vandita Pant was appointed as the Chief Financial Officer, effective 1 March 2024 |
| • | Ragnar Udd was appointed as the Chief Commercial Officer, effective 1 March 2024 |
| • | Brandon Craig was appointed as the President Americas, effective 1 March 2024 |
| • | Johan van Jaarsveld was appointed as the Chief Technical Officer, effective 1 March 2024 |
| • | Catherine Raw was appointed as the Chief Development Officer, effective 29 April 2024 |
Laura Tyler (the former Chief Technical Officer) retired from BHP on 29 February 2024 and David Lamont ceased as Chief Financial Officer on 29 February 2024 and commenced as Senior Executive Officer in an advisory and projects capacity, reporting directly to the CEO until February 2025.
6.3 Performance evaluation of executives
The performance of executives and other senior employees is reviewed on an annual basis. The annual performance review process considers the performance of executives against criteria designed to capture ‘what’ is achieved and ‘how’ it is achieved. All performance assessments of executives include how effective they have been in undertaking their role and what they have achieved against their specified key performance indicators.
A performance evaluation was conducted for all members of the ELT during FY2024. For the CEO, the performance evaluation was led by the Chair of the Board on behalf of all the Non-executive Directors and was discussed with the People and Remuneration Committee and considered by the Board.
7. Shareholders and reporting
7.1 Shareholder and stakeholder engagement
BHP shareholder engagement practices
BHP engages regularly with our shareholders to understand their views and feedback and we have an investor relations program to provide avenues for effective and timely two-way communication with investors.
We encourage shareholders to make their views known to us. Shareholders can contact us at any time through our Investor Relations team, with contact details available at bhp.com. In addition, shareholders can communicate with us and our registrar electronically.
136
Table of Contents
Shareholder engagement practices
| Direct engagement
We engage directly with institutional shareholders and investor representative organisations around the world to discuss strategy and governance and to enable our management, Board and Committees to regularly hear investor expectations, which can then be used to refine and develop, and continuously improve, the governance processes of BHP. We also engage directly with retail shareholders and their representatives.
| |
 | Engagement on key sustainability themes
In addition to our regular investor meetings program, in FY2024 we held direct engagement sessions with lead investors, including from Climate Action 100+, Nature Action 100 and Principles for Responsible Investment’s (PRI) Advance initiative. We also held engagement sessions on preparation of our Climate Transition Action Plan 2024 to obtain feedback from investors on our approach.
| |
| Webcasts and Q&A sessions
We provide webcasts and Q&A sessions as forums to update shareholders on results or other key announcements.
| |
| Website
All relevant corporate governance information, including our Annual Report, is available on our website at bhp.com. All ASX announcements are promptly posted to the website. BHP encourages direct contact from shareholders and our website has a ‘Contact Us’ form for contact with our Investor Relations team. Anyone who is interested in receiving news from BHP can subscribe to receive email alerts.
| |
| Chair and Non-executive Director investor meetings
The Chair and Senior Independent Director regularly meet with investors to discuss Board priorities and seek shareholder feedback. The People and Remuneration Committee Chair also meets with investors and proxy advisors to discuss remuneration.
| |
| Annual General Meeting
We facilitate and encourage shareholder participation at our Annual General Meeting (AGM). The meeting provides an opportunity for all investors to hear about BHP’s performance and to question and engage with the Board and vote on the resolutions. The External Auditor is also available to answer questions at the AGM.
>Information on our AGM is available at bhp.com/meetings
Before the AGM, shareholders are provided with all material information in BHP’s possession relevant to their decision on whether to elect or re-elect a Director. Copies of the speeches delivered by the Chair and CEO at the AGM are released to the relevant stock exchanges and posted on our website.
Proceedings at shareholder meetings are webcast live from our website. Resolutions at general meetings are decided by a poll rather than by a show of hands.
A summary of proceedings and the outcome of voting on the items of business are released to the relevant stock exchanges and posted on our website as soon as they are available.
| |


Stakeholder engagement
The Board considers effective stakeholder engagement a key element of its governance and oversight role. Our strategy, our 2030 goals, our purpose and our Risk Appetite Statement reflect the significance of external partners and stakeholders in decision-making.
There are multiple ways the views of partners and stakeholders, beyond shareholders, are brought to the Board and its Committees.
Examples of reports that are provided to the Board include Employee Perception Survey findings, gender pay gap reports and updates from the CEO and Chief People Officer. In addition, the Risk and Audit Committee and Sustainability Committee receive reports on engagement with regulators. The Risk and Audit Committee receives reports on material litigation and disputes with third parties and misconduct concerns raised through confidential reporting platforms. The Sustainability Committee receives updates on Community Perception Survey findings.
Stakeholder engagement
| Site visits
Site visits provide an opportunity for Directors to engage directly with the workforce, partners, community members, Indigenous and First Nations representatives and contractors and gain a greater understanding of the Group’s operations, culture, material risks and risk management processes, and other issues relevant to the specific site. Site visits in FY2024 included to Nickel West and BMA (November 2023), New South Wales Energy Coal (February 2024), Spence (April 2024) and Jansen (June 2024). | |

137
Table of Contents
 | Workforce
Directors also have the opportunity to engage directly with a cross-section of the workforce at Board and Committee meetings, at Director briefing sessions and during visits to our sites and offices. | |
| Presentations and briefings
Presentation materials for briefings and speeches related to financial results, strategy, decarbonisation and other key topics are available at bhp.com for all stakeholders. | |
| Events
Various events throughout the year, such as retail shareholder events in Australia and the UK and the AGM, provide opportunities for engagement with a range of partners and stakeholders, including government officials, community members, Traditional Owners and other Indigenous partners and non-government organisations. | |


7.2 Market disclosure
BHP is committed to timely and balanced disclosure of market sensitive information.
BHP’s Market Disclosure and Communications policy sets out the processes designed to ensure compliance with BHP’s relevant disclosure obligations and outlines the way in which information is communicated to shareholders, the investment community and the market. It outlines how we identify and distribute information to shareholders and market participants and sets out the role of the Disclosure Committee in managing compliance with market disclosure obligations.
The Board receives copies of material market announcements promptly after they have been released.
Where BHP gives a new and substantive investor or analyst presentation, it releases a copy of the presentation materials to the market ahead of the presentation.
>The Market Disclosure and Communications policy is available at bhp.com/governance
In addition, we have disclosure controls in place for periodic disclosures, including the Operational Review, our results announcements, debt investor documents (such as the prospectus for the Euro or Australian Medium-Term Notes) and Annual Report documents, which must comply with relevant regulatory requirements.
>More information about these verification processes can be found in the Disclosure Controls for Periodic Disclosure document available at bhp.com/governance
8. Culture and conduct
Code of Conduct
We are committed to the highest level of governance and strive to foster a culture that values and rewards exemplary ethical standards, personal and corporate integrity and respect for others.
The Board, together with management, plays a critical role in setting and reinforcing the culture of the Group.
Our Code of Conduct is approved by the Board and is based on Our Values: Do what’s right, Seek better ways and Make a difference. It applies to all our Directors, senior executives and employees.
Our Code of Conduct includes our policies on speaking up and anti-bribery and corruption, sets out standards of behaviour for our people and is an important statement of the culture at BHP.
>For more information on our policies on speaking up and our commitment against corruption refer to OFR 6.8
>Our Code of Conduct is available at bhp.com/about/operating-ethically/our-code/
BHP’s channels to raise misconduct concerns
We have mechanisms in place for anyone to raise a query about Our Code of Conduct or make a report if they feel Our Code of Conduct has been breached. BHP’s reporting channels to raise misconduct concerns comprise an online portal and 24-hour multilingual call service. These channels are confidential and accessible to all employees, contractors and external partners and stakeholders, including members of the public, to raise concerns about misconduct that may be unethical, illegal or inconsistent with Our Code of Conduct. All misconduct concerns raised through our reporting channels are reviewed and categorised by the Ethics and Investigations team. Once categorised, reports are assigned in accordance with internal policy and processes to an investigator, line leader or appropriate team for resolution. All significant Our Code of Conduct matters and key trends from investigations are reported to the Risk and Audit Committee. These are then reported to the Board as part of its report-out process.
138
Table of Contents
>For more information on ethics and business conduct refer to OFR 6.8
>More information on ethics and business conduct is available at bhp.com/ethics
9. Risk management and assurance
9.1 Risk management governance structure
Risk governance
The Risk and Audit Committee (RAC) oversees and assists the Board in risk management and reviewing the emerging and principal risks facing the Group, including financial and non-financial risks that could threaten the Group’s business model, future performance, solvency, liquidity or reputation. This includes business risk, financial reporting risk, insurance risk, tax risk, technology security and cyber risk, climate risk and ethical compliance programs. The Board requires the CEO to implement a system of control for identifying and managing risk. The Risk team is accountable for this system, known as BHP’s Risk Framework, and also supports, challenges and verifies risk management activities to give assurance to management and the Board. The Directors, with support from the RAC, monitor and, at least annually, will review the effectiveness of the Group’s systems of risk management and internal control. The RAC, in undertaking this review, makes a recommendation to the Board on whether the systems of risk management and internal control continue to be sound and whether the Group is operating with due regard to the risk appetite set by the Board.
>For more information refer to OFR 8
Internal audit
The Internal Audit team provides assurance to the Board, CEO and Executive Leadership Team on whether risk management, internal control and governance processes are adequate and functioning. The Internal Audit team is independent of the External Auditor. The RAC evaluates and, if thought fit, approves the Terms of Reference of the Internal Audit team and the annual internal audit plan and monitors the effectiveness of the internal audit activities.
The RAC approves the appointment and dismissal of the Chief Audit Officer (which is currently the Chief Risk and Audit Officer) and assesses their performance, independence and objectivity. During FY2024, the Chief Risk and Audit Officer reported directly to the RAC and functional oversight of the Internal Audit team was provided by the Chief Financial Officer.
Effectiveness of systems of internal control and risk management
In delegating authority to the CEO, the Board has established CEO limits, outlined in the Board Governance Document. These limits require the CEO to ensure there is a system of control in place for identifying and managing risk in BHP. Through the RAC, the Directors regularly review these systems for their effectiveness. These reviews include assessing whether processes continue to meet evolving external governance requirements.
The RAC oversees and reviews the internal controls and risk management systems (including procedures, processes and systems for, among other things, financial controls, financial reporting, reporting of reserves and resources, closure and rehabilitation, legal and ethical compliance, preventing fraud and serious breaches of business conduct, speak-up procedures, information technology security and cyber risk). Any material breaches of Our Code of Conduct, including breaches of our anti-bribery and corruption requirements and any material incidents reported under our speak-up procedures are reported quarterly to the RAC by the Chief Compliance Officer. These reports are then communicated to the Board through the report-out process.
During FY2024, management presented an assessment of the material risks facing BHP and the effectiveness of the Group’s systems of risk management. The reviews were overseen by the RAC, with findings and recommendations reported to the Board. In addition to considering key risks facing BHP, the Board assessed the effectiveness of internal controls over key risks identified through the work of the Board Committees.
Having carried out a review during FY2024, the Board is satisfied with the effectiveness of BHP’s risk management and internal control systems.
Environmental and social risks
BHP’s risk factors (including material exposure to environmental and social risks) and how we manage these risks are described in OFR 8.
9.2 External audit and financial reporting
Integrity of Financial Statements
The RAC assists the Board in assuring the integrity of the Financial Statements. The RAC evaluates and makes recommendations to the Board about the appropriateness of accounting policies and practices, areas of judgement, compliance with accounting standards, stock exchange and legal requirements and the results of the external audit.
139
Table of Contents
CEO and CFO assurance
For the FY2024 full year and half year, the CEO and CFO have provided a declaration that in their opinion, BHP’s financial records have been properly maintained and those Financial Statements comply with accounting standards and applicable regulatory requirements and give a true and fair view of the financial position and performance of BHP, and that the opinion was formed on the basis of a sound system of risk management and internal control, which is operating effectively. The RAC considered these certifications when recommending the Financial Statements to the Board for approval.
External Auditor
The RAC manages the relationship with the External Auditor on behalf of the Board. It considers the independence and reappointment of the External Auditor each year, as well as remuneration and other terms of engagement and makes a recommendation to the Board.
Evaluation of External Auditor and external audit process
The RAC evaluates the objectivity and independence of the External Auditor and the quality and effectiveness of the external audit arrangements, including through:
| • | reviewing the terms of engagement of the External Auditor |
| • | considering the external audit plan, in particular to gain assurance that it is tailored to reflect changes in circumstances from the prior year and reviewing the plan during the audit engagement |
| • | meeting with the audit partners, particularly the lead audit engagement partners, throughout the year and without management present |
| • | discussing with the audit engagement partners the skills and experience of the broader audit team |
| • | considering the quality of the External Auditor’s performance following the completion of the audit |
In addition, the RAC reviews the integrity, independence and objectivity of the External Auditor and assesses whether there is any element of the relationship that impairs or appears to impair the External Auditor’s judgement or independence. The External Auditor also certifies its independence to the RAC.
Non-audit services
Although the External Auditor provides some non-audit services to the Group, the objectivity and independence of the External Auditor are safeguarded through restrictions on the provision of these services with some services prohibited from being undertaken.
Pre-approved services
The RAC has adopted a policy titled Provision of Audit and Other Services by the External Auditor covering the RAC’s pre-approval policies and procedures to maintain the independence of the External Auditor.
The categories of ‘pre-approved’ services are:
| • | Audit services – work that constitutes the agreed scope of the statutory audit and includes the statutory audits of BHP and its entities (including interim reviews). The RAC monitors the audit services engagements and if necessary, approves any changes in terms and conditions resulting from changes in audit scope, Group structure or other relevant events. |
| • | Audit-related and other assurance services – work that is outside the scope of the statutory audit but is consistent with the role of the external statutory auditor. This category includes work that is reasonably related to the performance of an audit or review and is a logical extension of the audit or review scope, is of an assurance or compliance nature and is work that the external auditors must or are best placed to undertake and is permissible under the relevant applicable standard. |
| • | Tax services – identification of public subsidies and tax incentives and support regarding tax inspections by tax authorities, but only when support from the external auditor or audit firm is required by law. |
Activities outside the scope of the categories above are not ‘pre-approved’ and must be approved by the RAC prior to engagement, regardless of the dollar value involved. In addition, any engagement for other services with a value over US$250,000, even if listed as a ‘pre-approved’ service, requires the approval of the RAC.
All engagements for non-audit services, whether ‘pre-approved’ or not and regardless of the dollar value involved, are reported quarterly to the RAC. While not prohibited by BHP’s policy, any proposed engagement of the External Auditor relating to internal control requires specific prior approval from the RAC. In addition, while the categories of ‘pre-approved’ services include a list of certain pre-approved services, the use of the External Auditor to perform these services will always be subject to our overriding governance practices as articulated in the policy.
In addition, the RAC did not approve any services during the year ended 30 June 2024 pursuant to paragraph (c)(7)(i)(C) of Rule 2-01 of SEC Regulation S-X (provision of services other than audit).
Fees paid to BHP’s External Auditor during FY2024 for audit and other services were US$15.722 million, of which 71 per cent comprised audit fees (including in relation to SOX matters), 12 per cent for audit-related fees and 17 per cent for all other fees. US$10,000 fees were paid in relation to tax services. For information on the fees paid refer to Financial Statements note 36 ‘Auditor’s remuneration’.
>Our Provision of Audit and Other Services by the External Auditor policy is available at bhp.com/governance
Management’s assessment of internal control over financial reporting
Management is responsible for establishing and maintaining adequate internal control over financial reporting (as defined in Rule 13a-15(f) and Rule 15d-15(f) under the Exchange Act).
140
Table of Contents
Because of its inherent limitations, internal control over financial reporting may not prevent or detect misstatements and, even when determined to be effective, can only provide reasonable assurance with respect to financial statement preparation and presentation. Projections of any evaluation of effectiveness to future periods are subject to the risk that controls may become inadequate because of changes in conditions, or the degree of compliance with the policies or procedures may deteriorate.
Under the supervision and with the participation of our management, including our CEO and CFO, the effectiveness of BHP’s internal control over financial reporting was evaluated based on the framework and criteria established in Internal Controls – Integrated Framework (2013), issued by the Committee of the Sponsoring Organizations of the Treadway Commission. Based on this evaluation, management concluded that internal control over financial reporting was effective as at 30 June 2024. There were no material weaknesses in BHP’s internal controls over financial reporting identified by management as at 30 June 2024.
BHP has engaged independent registered public accounting firm, Ernst & Young, to issue an audit report on the effectiveness of our internal control over financial reporting for inclusion in the Annual Report on Form 20-F as filed with the SEC.
There were no changes in our internal control over financial reporting during FY2024 that materially affected or were reasonably likely to materially affect our internal control over financial reporting.
During FY2024, the RAC reviewed our compliance with the obligations imposed by SOX, including evaluating and documenting internal controls as required by section 404 of SOX.
Management’s assessment of disclosure controls and procedures
Management, with the participation of our CEO and CFO, performed an evaluation of the effectiveness of the design and operation of our disclosure controls and procedures as at 30 June 2024. Disclosure controls and procedures are designed to provide reasonable assurance that the material financial and non-financial information required to be disclosed by BHP, including in the reports it files or submits under the Exchange Act, is recorded, processed, summarised and reported on a timely basis. This information is accumulated and communicated to BHP’s management, including our CEO and CFO, as appropriate, to allow timely decisions regarding required disclosure. Based on the evaluation, management (including the CEO and CFO) concluded that as at 30 June 2024, our disclosure controls and procedures are effective in providing that reasonable assurance.
There are inherent limitations to the effectiveness of any system of disclosure controls and procedures, including the possibility of human error and the circumvention or overriding of the controls and procedures. Even effective disclosure controls and procedures can only provide reasonable assurance of achieving their control objectives.
In the design and evaluation of our disclosure controls and procedures, management was required to apply its judgement in evaluating the cost-benefit relationship of possible controls and procedures.
141
Table of Contents
Table of Contents
Directors’ Report
The information presented by the Directors in this Directors’ Report relates to BHP Group Limited and its subsidiaries. The Operating and Financial Review (OFR), the Remuneration Report and the ‘Lead Auditor’s Independence Declaration’ are incorporated by reference into and form part of this Directors’ Report.
1. Review of operations, principal activities and state of affairs
A review of the operations of BHP during FY2024, the results of those operations during FY2024 and the expected results of those operations in future financial years are set out in the OFR 1–7, 9 and 11. Information on the likely developments in BHP’s operations in future years and the expected results of those operations also appears in that section.
Our principal activities, including significant changes in the nature of BHP’s principal activities during FY2024 are disclosed in the OFR.
There were no significant changes in BHP’s state of affairs that occurred during FY2024 and no significant post balance date events other than as disclosed in the OFR and Financial Statements note 35 ‘Subsequent events’.
No other matter or circumstance has arisen since the end of FY2024 that has significantly affected or is expected to significantly affect the operations, the results of operations or state of affairs of BHP in future years.
2. Directors
The Directors who served at any time during FY2024 or up until the date of this Directors’ Report are listed in the Board and Board Committee attendance table below. Information on the current Directors, including their terms of service, qualifications, experience and special responsibilities, and directorships of other listed companies held in the last three years, is set out in the Corporate Governance Statement. This information is incorporated by reference into and forms part of this Directors’ Report.
Director attendances at meetings
The Board meets as often as required. During FY2024, the Board met 16 times.
Members of the Executive Leadership Team and other members of senior management attend meetings of the Board by invitation.
Each Board Committee provides a standing invitation for any Non-executive Director to attend Committee meetings (rather than just limiting attendance to Committee members). Committee agendas and papers are provided to all Directors concerning matters to be considered. The table below excludes the attendance of Directors at Committee meetings where they were not a Committee member.
Board and Board Committee attendance in FY2024
| Board Attended/Held | Risk and Audit Committee Attended/Held | Nomination and Governance Committee Attended/Held | People and Remuneration Committee Attended/Held | Sustainability Committee Attended/Held | ||||||||||||||||
Terry Bowen1 | 7/7 | 4/4 | 3/3 | |||||||||||||||||
Xiaoqun Clever-Steg | 16/16 | 8/8 | ||||||||||||||||||
Ian Cockerill3 | 11/11 | 8/8 | 3/3 | |||||||||||||||||
Gary Goldberg | 16/16 | 6/6 | 4/4 | |||||||||||||||||
Mike Henry | 16/16 | |||||||||||||||||||
Michelle Hinchliffe2 | 16/16 | 8/8 | 3/3 | |||||||||||||||||
Don Lindsay5 | 4/4 | 1/1 | 1/1 | |||||||||||||||||
Ken MacKenzie | 16/16 | 6/6 | ||||||||||||||||||
Ross McEwan4 | 5/5 | 1/1 | 1/1 | |||||||||||||||||
Christine O’Reilly | 16/16 | 8/8 | 6/6 | 6/6 | ||||||||||||||||
Catherine Tanna | 16/16 | 6/6 | 4/4 | |||||||||||||||||
Dion Weisler | 16/16 | 6/6 | 4/4 | |||||||||||||||||
Footnotes
| 1. | Terry Bowen served as a Non-executive Director from 1 October 2017 until his retirement on 1 November 2023 and was a member of the Risk and Audit and Nomination and Governance Committees until 1 November 2023. |
| 2. | Michelle Hinchliffe was appointed Chair of the Risk and Audit Committee and a member of the Nomination and Governance Committee from 1 November 2023. |
| 3. | Ian Cockerill served as a Non-executive Director from 1 April 2019 until his retirement on 4 April 2024 and was a member of the Risk and Audit and Sustainability Committees until 4 April 2024. |
| 4. | Ross McEwan was appointed as a Non-executive Director and a member of the Risk and Audit and People and Remuneration Committees from 3 April 2024. |
| 5. | Don Lindsay was appointed as a Non-executive Director and a member of the Risk and Audit and Sustainability Committees from 1 May 2024. |
143
Table of Contents
3. Share interests
Directors’ shareholdings
Subject to securities dealing constraints, Non-executive Directors have agreed to apply at least 25 per cent of their remuneration (base fees plus Committee fees) to the purchase of BHP shares until they achieve a minimum shareholding requirement equivalent in value to one year of remuneration (base fees plus Committee fees). Details of Directors’ shareholdings in BHP as at the date of this Directors’ Report are shown in the table below. All Directors have met the minimum shareholding requirement under their Terms of Appointment as at 30 June 2024, with the exception of Don Lindsay and Ross McEwan who joined the Board on 1 May 2024 and 3 April 2024, respectively. No rights or options over shares in BHP Group Limited are held by any of the Non-executive Directors. We have not made available to any Directors any interest in a registered scheme. No shareholder possesses voting rights that differ from those attaching to all of BHP Group Limited’s voting securities.
Director | Number of shares held1 | |||
Xiaoqun Clever-Steg | 8,539 | |||
Gary Goldberg | 18,000 | |||
Mike Henry2 | 410,001 | |||
Michelle Hinchliffe | 10,107 | |||
Don Lindsay | – | |||
Ken MacKenzie | 58,446 | |||
Ross McEwan | – | |||
Christine O’Reilly | 9,420 | |||
Catherine Tanna | 10,400 | |||
Dion Weisler | 7,544 | |||
| 1. | The number of shares held refers to shares held either directly, indirectly or beneficially by Directors as at 27 August 2024. Where applicable, the information includes shares held in the name of a spouse, superannuation fund, nominee and/or other controlled entities. |
| 2. | As at 27 August 2024, Mike Henry also holds 973,178 rights and options over shares in BHP Group Limited. For more information refer to the Equity awards section in the Remuneration Report 5.2. |
Executive Key Management Personnel
Interests held by members of the Executive Key Management Personnel (KMP) under employee equity plans as at 30 June 2024 are set out in the tables contained in the Equity awards section in the Remuneration Report 5.2.
The table below sets out the relevant interests in shares in BHP Group Limited held directly, indirectly or beneficially, as at the date of this Directors’ Report by those senior executives who were Executive KMP (other than the Executive Director) on that date.
Executive KMP member | Number of shares held1 | |||
Brandon Craig | 25,665 | |||
Vandita Pant | 170,688 | |||
Geraldine Slattery | 195,011 | |||
| 1 | The number of shares held refers to shares held either directly, indirectly or beneficially as at 27 August 2024. Where applicable, the information includes shares held in the name of a spouse, superannuation fund, nominee and/or other controlled entities. |
144
Table of Contents
4. Share capital and buy-back programs
During FY2024, we did not make any on-market or off-market purchases of BHP Group Limited ordinary shares under any share buy-back program. As at the date of this Directors’ Report, there were no current on-market buy-backs.
Some of our executives receive rights over BHP shares as part of their remuneration arrangements. Entitlements may be satisfied by the transfer of existing shares, which are acquired on-market by the Employee Share Ownership Plan Trusts or, in respect of some entitlements, by the issue of shares. During FY2024, no shares were purchased on-market for the Employee Share Ownership Plan Trusts.
As at the date of this Directors’ Report, there were 14,700,777 unvested equity awards outstanding in relation to BHP Group Limited ordinary shares held by 24,462 holders. The expiry dates of these unvested equity awards range between August 2024 and August 2028 and there is no exercise price. 5,710,261 fully paid ordinary shares in BHP Group Limited were issued as a result of the exercise of rights over unissued shares during or since the end of FY2024. No options over unissued shares or unissued interests in BHP have been granted during or since the end of FY2024 and no shares or interests were issued as a result of the exercise of an option over unissued shares or interests during or since the end of FY2024. For more information refer to Financial Statements note 26 ‘Employee share ownership plans’. For information on movements in share capital during and since the end of FY2024 refer to Financial Statements note 17 ‘Share capital’.
5. Group Company Secretary
Stefanie Wilkinson is the Group Company Secretary. For details of her qualifications and experience refer to Corporate Governance Statement 4.1. Stefanie Wilkinson has experience in a company secretariat role or other relevant fields arising from time spent advising other large-listed companies or other relevant entities.
6. Indemnities and insurance
Rule 146 of the BHP Group Limited Constitution requires the company to indemnify, to the extent permitted by law, each Officer of BHP Group Limited against liability incurred in or arising out of the conduct of the business of BHP or the discharge of the duties of the Officer. The Directors named in 4.1 of the Corporate Governance Statement, and the Company Secretary and other Officers of BHP Group Limited have the benefit of this requirement, as do individuals who formerly held one of those positions.
In accordance with this requirement, BHP Group Limited has entered into Deeds of Indemnity, Access and Insurance (Deeds of Indemnity) with its Directors.
Under BHP’s Deed Poll for Indemnification, BHP Group Limited and BHP Group (UK) Ltd (formerly BHP Group Plc) must, to the extent permitted by law, indemnify current and former employees of the Group against liability to third parties incurred in or arising out of the conduct of the business of the Group or the discharge of the duties of these employees, including where an employee performs a role at another entity at the request of the Group. The indemnity is subject to certain limitations and does not apply where the liability has arisen in circumstances involving dishonesty, recklessness, wilful misconduct or lack of good faith by the employee seeking indemnification.
In addition, as part of the arrangements to effect the demerger of South32, we agreed to indemnify certain former Officers of BHP who transitioned to South32 from certain claims and liabilities incurred in their capacity as Directors or Officers of South32.
The terms of engagement for certain services include that we must compensate and reimburse EY for and protect EY against any loss, damage, expense or liability incurred by EY in respect of third-party claims arising from a breach by BHP of any obligation under the engagement terms.
We have insured against amounts that we may be liable to pay to Directors, Company Secretaries or certain employees (including former Officers) pursuant to Rule 146 of the Constitution of BHP Group Limited or that we otherwise agree to pay by way of indemnity. The insurance policy also insures Directors, Company Secretaries and some employees (including former Officers) against certain liabilities (including legal costs) they may incur in carrying out their duties. For this Directors’ and Officers’ insurance, we paid premiums of US$17,535,690 excluding taxes during FY2024.
No indemnity in favour of a current or former Officer of BHP Group Limited or in favour of the External Auditor was called on during FY2024.
7. Dividends
A final dividend of 74 US cents per share will be paid on 3 October 2024, resulting in total cash dividends determined in respect of FY2024 of 146 US cents per share.
>For information on the dividends paid refer to Financial Statements note 19 ‘Dividends’
8. Auditors
No current Officer of BHP has held the role of director or partner of the Group’s current External Auditor.
9. Non-audit services
For information on the non-audit services undertaken by BHP’s External Auditor, including the amounts paid for non-audit services, refer to Financial Statements note 36 ‘Auditor’s remuneration’. All non-audit services were approved in accordance with the process set out in the Policy on Provision of Audit and Other Services by the External Auditor. No non-audit services were carried out that were specifically excluded by the Policy on Provision of Audit and Other Services by the External Auditor. Based on advice provided by the Risk and Audit Committee, the Directors have formed the view that the provision of non-audit services is compatible with the general standard of independence for auditors, and that the nature of non-audit services means that auditor independence was not compromised. The reason for this view is that the objectivity and independence of the External Auditor are safeguarded through restrictions on the provision of these services with some services prohibited from being undertaken.
145
Table of Contents
>For more information about our policy in relation to the provision of non-audit services by the external auditor refer to ‘External audit and financial reporting’ in our Corporate Governance Statement 9.2
10. Exploration, research and development
Companies within the Group carry out exploration and research and development necessary to support their activities.
>For more information refer to OFR 5 ‘Our assets’, OFR 9 ‘Performance by commodity’ and Additional information 6 ‘Mineral resources and mineral reserves’
11. ASIC Instrument 2016/191
BHP Group Limited is an entity to which the Australian Securities and Investments Commission (ASIC) Corporations (Rounding in Financial/Directors’ Reports) Instrument 2016/191 applies. Amounts in this Directors’ Report and the Financial Statements, except estimates of future expenditure or where otherwise indicated, have been rounded to the nearest million dollars in accordance with ASIC Instrument 2016/191.
12. Proceedings on behalf of BHP Group Limited
No proceedings have been brought on behalf of BHP Group Limited, nor has any application been made, under section 237 of the Australian Corporations Act 2001.
13. Performance in relation to environmental regulation
BHP seeks to be compliant with all applicable environmental laws and regulations relevant to its operations. We monitor compliance on a regular basis, including through external and internal means, to minimise the risk of non-compliance.
>For more information on BHP’s performance in relation to health, safety and the environment refer to OFR 6.7, 6.1, 6.9 and 6.10
For the purposes of section 299(1)(f) of the Australian Corporations Act 2001, in FY2024 BHP was levied nine fines in relation to environmental laws and regulations at our operated assets, the total amount payable being US$86,850.58.
14. Additional information
| • | BHP Group Limited has a branch registered in the United Kingdom. The Group, through various subsidiaries, has also established branches in a number of other countries. |
The Directors’ Report is approved in accordance with a resolution of the Board.
| Ken MacKenzie | Mike Henry | |
| Chair | Chief Executive Officer | |
| Dated: 27 August 2024 |
146
Table of Contents
Remuneration Report
Contents
People and Remuneration Committee Chair letter to shareholders | 148 | |||
| 151 | ||||
| 152 | ||||
| 152 | ||||
| 152 | ||||
| 155 | ||||
| 155 | ||||
| 155 | ||||
| 156 | ||||
| 160 | ||||
| 160 | ||||
| 161 | ||||
| 162 | ||||
| 162 | ||||
| 163 | ||||
4.2 Non-executive Directors’ remuneration in FY2024 and FY2025 | 163 | |||
| 164 | ||||
| 164 | ||||
| 166 | ||||
| 168 | ||||
| 169 | ||||
5.5 Prohibition on hedging of BHP shares and equity instruments | 169 | |||
| 169 | ||||
| 170 | ||||
Abbreviation | Item | Abbreviation | Item | |||
| AGM | Annual General Meeting | KMP | Key Management Personnel | |||
| CDP | Cash and Deferred Plan | LTIP | Long-Term Incentive Plan | |||
| CEO | Chief Executive Officer | MAP | Management Award Plan | |||
| DEP | Dividend equivalent payment | MSR | Minimum shareholding requirement | |||
| ELT | Executive Leadership Team | ROCE | Return on capital employed | |||
| GHG | Greenhouse gas | S&S | Safety and sustainability | |||
| HSEC | Health, safety, environment and community | TSR | Total shareholder return | |||
| IFRS | International Financial Reporting Standards | |||||
147
Table of Contents
People and Remuneration Committee Chair letter to shareholders
“Our shareholders will see that our executives’ remuneration outcomes are aligned with our business performance during FY2024.”
Dear Shareholders,
I am pleased to provide BHP’s Remuneration Report for FY2024.
Our approach and framework
During FY2024, the People and Remuneration Committee (Committee) focused on achieving remuneration outcomes that both fairly reflect the performance of BHP and the contribution of our employees while aligning with the interests of shareholders and other key stakeholders.
The objectives of our remuneration framework are to support the execution of the Group’s global strategy, encourage and sustain a culture aligned with the Group’s values and BHP’s purpose and risk appetite, and provide competitive remuneration, linked to performance, sufficient to attract, retain and motivate our executives on a global basis. This is critical to delivering the best outcomes for all BHP shareholders.
FY2024 reflections
We delivered strong operational and financial performance in FY2024. We achieved record production at Spence, Carrapateena and Western Australia Iron Ore and widened our lead as the lowest cost major iron ore producer.
The safety of our people remains our absolute priority. FY2024 was overshadowed by the fatality of Luke O’Brien, a team member working with one of our contracting partners at BMA, who was fatally injured at the Saraji mine in Queensland. We remain committed to eliminating fatalities and serious injuries at BHP. In a year where we have reported a fatality, it is important this has a flow-on impact on our performance-based remuneration framework outcomes for BHP executives, which reinforces our unwavering commitment to zero fatalities and serious injuries at BHP. Appropriately, there has been an impact on remuneration outcomes from this event.
We continued to make meaningful progress towards a more inclusive and diverse workforce, which is critical for productive and safer teams. We increased female participation across the Group to over 37 per cent, up almost 2 percentage points from last year.
In FY2023 we identified and disclosed two issues with certain allowances and entitlements affecting some current and former employees in Australia. We self-reported these issues to Australia’s Fair Work Ombudsman (FWO) and engaged Protiviti, a global assurance firm, to undertake a review of our payroll systems. The Board and CEO have taken these issues seriously. A range of consequences have been implemented for employees in connection with these issues. For the CEO, a reduction has been applied to his FY2024 CDP outcome (refer further below).
FY2024 Cash and Deferred Plan scorecard
BHP’s Cash and Deferred Plan (CDP) is an annual cash and equity incentive scheme, with awards provided as cash and deferred shares that vest in two and five years. The FY2024 CDP scorecard used to assess the CEO’s and other ELT members’ annual performance comprised stretching performance measures based on three elements – safety and sustainability, financial and personal performance elements. A key aspect of the CDP is that vesting of the five-year deferred share awards is underpinned by a holistic review of performance at the end of the five-year vesting period, including a review of safety and sustainability performance over the five-year period.
Climate change CDP measures also play a meaningful role in the determination of our remuneration outcomes for our CEO and other ELT members. Each year since FY2020, climate change scorecard targets have represented 10 per cent in BHP’s CDP scorecard. Our Climate Transition Action Plan (CTAP) 2024 provides an update on our climate strategy and our progress and plan in relation to our GHG emissions goals and targets.
FY2024 Cash and Deferred Plan outcomes for the CEO
The Committee assessed the CEO’s performance against the CDP scorecard elements, which resulted in a FY2024 CDP outcome of 71.7 per cent against a target of 100 per cent (and 47.8 per cent of the maximum). The Board and Committee believe this overall outcome is appropriately aligned with BHP’s values, the shareholder experience and the interests of the Group’s other key stakeholders.
Safety and sustainability measures have a 25 per cent total weighting. There is a 10 per cent measure for significant HSEC events. The outcome took into account the fatality at the Saraji mine in FY2024 and the 10 per cent measure for significant HSEC events was reduced to zero in FY2024 for the CEO. For other sustainability measures, good progress was made against the scorecard’s climate change targets and our outcomes with respect to Indigenous partnerships was broadly aligned to target. As a result, the CDP scorecard assessment for the safety and sustainability measures overall was 15 per cent out of a target of 25 per cent.
148
Table of Contents
For the financial measures, after fully eliminating the impacts of commodity prices during the year, operating performance at our operated assets was below the challenging internal targets set at the commencement of the year, particularly with respect to production volumes, despite achieving record production at some assets. The CDP scorecard assessment for the financial measure was 37 per cent out of a target of 50 per cent.
From a personal contribution perspective, the Committee considered Mike Henry’s performance against his Group measures. These included projects and initiatives in respect of people, performance and portfolio. The Committee considered Mike’s performance against his Group objectives was slightly below expectations and assessed it as 24 per cent against the target of 25 per cent.
This assessment against scorecard objectives gave an FY2024 CDP outcome for Mike of 76 per cent based on performance during the year. Subsequent to this assessment, the Board also took into account the CEO’s ultimate accountability for the operations of BHP, specifically payroll issues, and made the decision to reduce Mike’s overall FY2024 outcome by 4.3 percentage points from 76 per cent to 71.7 per cent.
The CDP scorecard outcomes for other ELT members and the short-term incentive pool applicable to the majority of BHP employees below the ELT level, were, like the CEO, below the 100 per cent target and, for certain executives, the CDP scorecard outcomes included downward adjustments reflecting accountability for BHP’s payroll issues.
2019 Long-Term Incentive Plan award
The vesting outcome for the 2019 Long-Term Incentive Plan (LTIP) award was 50 per cent. The LTIP performance condition is relative total shareholder return against two separate index measures – a sector peer group and the MSCI World Index. BHP outperformed both the sector peer group and the MSCI World Index requirements for threshold vesting (at which 25 per cent of the award would vest) but performance was below the requirements for maximum vesting (at which 100 per cent of the award would vest).
In considering vesting of the 2019 LTIP award, the Board and Committee have also conducted their normal holistic review of business performance over the five years since the award was granted to ensure this level of vesting was appropriate. More information on the 2019 LTIP vesting outcome is included in 3.3 FY2024 LTIP performance outcomes and 3.4 Overarching discretion and vesting underpin.
Having considered the overall remuneration outcome for the CEO carefully, the Committee concluded it was a fair reflection of performance and the experience of shareholders, and the application of any downwards discretion to the vesting of the LTIP was not warranted. More information on the overall remuneration outcomes for the CEO for the year, and how the outcomes are aligned to performance during FY2024, is provided in 3.1 FY2024 remuneration received by the CEO.
FY2025 remuneration
For FY2025, the Committee determined that the CEO’s base salary would increase by 4 per cent, effective 1 September 2024. In making this decision, we have conducted benchmarking and considered the external market demand for global senior executive talent. We benchmark the CEO’s and other executives’ remuneration against CEO and senior executive roles in other global companies of similar complexity, reach and scale. This detailed benchmarking is intended to ensure BHP’s executive remuneration remains competitive to attract, motivate and retain key talented senior executives and is consistent with the global market.
The Committee considers the CEO’s base salary increase to be appropriate in this context, and it is below the average salary increase applied for other BHP employees. Other components of the CEO’s total target remuneration (pension contributions, benefits, CDP and LTIP) remain unchanged and, where relevant, as percentages of base salary. A summary of the CEO’s arrangements for FY2025 is set out in the following table.
CEO FY2025 fixed remuneration | CEO FY2025 CDP | CEO FY2025 LTIP | ||
• Base salary US$1.893 million per annum, an increase of 4% from 1 September 2024.
• Pension contribution 10% of base salary. | • Target cash award of 80% of base salary (maximum 120%).
• Two awards of deferred shares each of equivalent value to the cash award, vesting in two and five years, respectively.
• Three performance measures:
• S&S – 25%
• Financial – 50%
• Group – 25% | • The LTIP grant is based on a face value of 200% of base salary.
• LTIP awards have challenging relative TSR performance hurdles measured over five years. |
149
Table of Contents
The majority of the CEO’s remuneration package continues to be delivered in BHP equity, not in cash. The CEO’s remuneration is linked to the performance of the business. In addition, the CEO has a minimum shareholding requirement of five times pre-tax base salary and this applies for two years post-retirement. This ensures the CEO’s remuneration is aligned to the experience of BHP’s shareholders. As at the date of this Report, the CEO’s BHP shareholding is in excess of his minimum shareholding requirement.
The Committee has also reviewed the base salaries and total target remuneration packages for other executive key management personnel. The Committee determined an increase of 8 per cent for the President Australia, reflecting performance and development in role. Given recent appointments, no other changes are being made for other executive key management personnel at this time, and this will be the subject of future reviews. It is vital that we provide competitive remuneration to attract and retain highly skilled global executive talent and our reviews are based on updated global benchmarking data. Other aspects of other executive key management personnel remuneration arrangements remain unchanged.
Remuneration outcomes for the Group Chair and Non-executive Directors
Fees for the Group Chair and Non-executive Directors are reviewed annually and are benchmarked against global companies of similar complexity, reach and scale. Following an assessment of the updated benchmarking, global market positioning and peer company relativities, a decision has been made that the Group Chair’s fee and the Non-executive Directors’ base fee will increase by 4 per cent with effect from 1 July 2024. The increases are considered appropriate given current benchmarking and the expectations, accountabilities and workloads of each of the Group Chair and Non-executive Directors. Having conducted this review, it was determined that there would be no change to the fees for other Committee roles or other allowances.
People
From 1 July 2023, the remit of the Committee expanded to include oversight of BHP’s people and culture strategy, the organisation’s alignment with the Group’s purpose and values, employee engagement, leadership and talent development.
During the year, we engaged with management on our people policies and governance, performance management system and the launch and embedment of Our refreshed Values. Committee members also monitored culture through Board visits to our sites and offices, management presentations and by considering trends and results from our Engagement and Perception Surveys. Our aspiration to achieve gender balance within our employee workforce globally by the end of CY2025 remains a key aspect of our broader focus on diversity and inclusion.
Summary
We continue to provide a significant component of executive remuneration as at-risk variable remuneration to align remuneration with performance. This year, we are confident the outcomes are consistent with the performance of BHP and the experience of our shareholders, while also recognising our critical need to attract, motivate and retain our executives in order to progress our strategic objectives and deliver the best outcomes for all of our shareholders.
We look forward to ongoing dialogue with and the support of BHP’s shareholders. As always, we welcome your feedback and comments on any aspect of this Report.
Christine O’Reilly
Chair, People and Remuneration Committee
27 August 2024
150
Table of Contents
Remuneration governance
1.1 Board oversight
The Board oversees the structure of remuneration for the Group (including the CEO) and ensures it is aligned with BHP’s values, purpose, strategy and risk appetite including in relation to non-financial risk and with the long-term interests of BHP and its shareholders.
The Board approves the remuneration framework for the Group Chair, CEO and other members of the ELT on recommendation from the Committee. The remuneration of Non-executive Directors (excluding the Group Chair) is a matter for the Group Chair and the Executive Director, and is reviewed by them each year having regard to the remuneration framework. No Director or executive is involved in deciding their own remuneration.
The objective of the remuneration framework is to:
| • | support the execution of the Group’s business strategy |
| • | encourage and sustain a culture aligned to BHP’s values, purpose and risk appetite, including in relation to non-financial risk |
| • | provide competitive remuneration, which is linked to performance, to attract, motivate and retain highly skilled executives on a global basis |
The Board approves the remuneration arrangements and outcomes for the Group Chair and CEO on recommendation from the Committee.
1.2 People and Remuneration Committee
The Board has established the Committee to support and advise the Board on people and remuneration matters, as set out in the Committee Charter available at bhp.com. Each of the Committee members are independent Non-executive Directors. The current members of the Committee are Christine O’Reilly (Chair), Ross McEwan, Catherine Tanna and Dion Weisler.
The Committee has unrestricted access to members of senior management as appropriate and invites them to attend meetings to provide reports and updates. However, members of management are not present when decisions are considered or taken concerning their own remuneration. The Committee can also draw on services from a range of external sources, including independent remuneration advisers. The Committee also receives input from other Board committees as required, in relation to financial performance and safety and sustainability matters.
The Committee makes recommendations to the Board on the remuneration framework for the Group Chair, the CEO and other members of the ELT, including Executive KMP. The Committee is briefed on and considers prevailing market and economic conditions where our Executive KMP are based, the competitive environment and the positioning and relativities of pay and employment conditions across the wider BHP workforce.
From 1 July 2023, the remit of the Committee expanded to include oversight of BHP’s people and culture strategy, the organisation’s alignment with the Group’s purpose and values, employee engagement, leadership and talent development. More information on the role and focus of the Committee can be found in Corporate Governance Statement 5.4, and details of meeting attendances can be found in Directors’ Report 2.
The Committee’s approach is that remuneration outcomes, which are linked to performance, attract, motivate and retain highly skilled executives on a global basis. Remuneration should be fair to the individual and remuneration levels should accurately reflect the CEO’s and other Executive KMP’s responsibilities and contributions, while considering the positioning and relativities of pay and employment conditions across the wider BHP workforce.
The Committee also considers shareholder views and those of the wider community when setting this remuneration framework. We proactively engage with our global institutional and investor representative shareholders regularly to discuss remuneration and governance matters. This feedback assists Directors to have a deep understanding of current shareholder and other stakeholder views when making remuneration decisions.
1.3 Engagement of independent remuneration advisers
The Committee may appoint and instruct expert advisers who are advisers solely to the Committee, including remuneration consultants, to assist the Committee with advice in relation to the Group’s remuneration strategy, framework and policies. The Committee may meet with external advisers without management being present. Potential conflicts of interest are taken into account when remuneration consultants are selected and their terms of engagement regulate their level of access to, and require their independence from, BHP’s management.
PwC was appointed to act as an independent remuneration adviser in FY2016 and is currently the only remuneration adviser appointed by the Committee. In that capacity, PwC may provide remuneration recommendations in relation to KMP, however, it did not provide any remuneration recommendations in FY2024.
151
Table of Contents
1.4 Service contracts
The terms of employment for the CEO and Executive KMP are formalised in their employment contracts. The current contracts of the CEO and Executive KMP are not fixed term. BHP may choose to terminate a contract on up to 12 months’ notice. BHP can require an executive to work through the notice period or may terminate the individual’s contract immediately by paying base salary plus pension contributions in lieu of the notice period. The CEO and Executive KMP must provide up to 12 months’ notice for voluntary resignation.
1.5 KMP for FY2024
This Remuneration Report describes the remuneration policies, practices, outcomes and governance for the KMP of BHP during FY2024. At BHP, KMP consists of the Directors (including the CEO), as well as certain members of our ELT who have authority and responsibility for planning, directing and controlling the activities of the Group directly or indirectly. In FY2024, Brandon Craig and Vandita Pant moved into new KMP roles within the BHP Group, and David Lamont and Ragnar Udd moved into new non-KMP roles within the BHP Group, all effective 1 March 2024. After due consideration, the Committee determined the Chief Operating Officer was no longer a KMP role effective 1 March 2024 as, since the successful integration of OZ Minerals into the BHP Group, the role no longer meets the threshold necessary for classification as KMP. Accordingly, for FY2024, the KMP comprised the following individuals:
| • | Mike Henry, CEO and Executive Director |
| • | Edgar Basto, Chief Operating Officer (from 1 July 2023 to 29 February 2024) |
| • | Brandon Craig, President Americas (from 1 March 2024 to 30 June 2024) |
| • | David Lamont, Chief Financial Officer (from 1 July 2023 to 29 February 2024) |
| • | Vandita Pant, Chief Financial Officer (from 1 March 2024 to 30 June 2024) |
| • | Geraldine Slattery, President Australia |
| • | Ragnar Udd, President Americas (from 1 July 2023 to 29 February 2024) |
| • | All Non-executive Directors – for details of Non-executive Directors, including dates of appointment or cessation (where relevant), refer to Directors’ Report 2 |
These individuals have held their positions and were KMP for the whole of FY2024, unless stated otherwise.
2 Executive KMP remuneration framework
BHP has an overarching remuneration framework for Executive KMP that guides the Committee’s decisions and is designed to support our strategy and reinforce our culture and values.
2.1 How the remuneration framework is set
The four principles that underpin the remuneration framework for Executive KMP are:
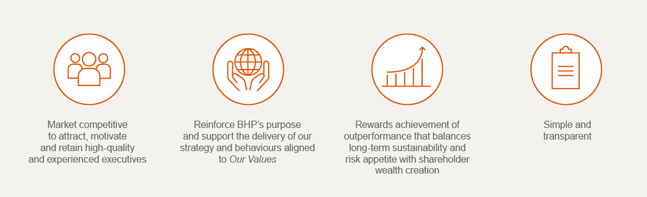
2.2 Remuneration framework operation
These principles are the same as those that apply to other employees, however, Executive KMP arrangements have a greater emphasis on and a higher proportion of remuneration that is at-risk as performance-related variable pay.
152
Table of Contents
The table below shows the key components of our remuneration framework:
Fixed remuneration | CDP | LTIP | ||||
| Purpose and link to strategy | Market competitive fixed remuneration is paid to attract, motivate and retain high-quality and experienced executives, and provide appropriate remuneration for these important roles in the Group. | The CDP is an annual cash and equity award that encourages and focuses executives’ efforts for the relevant financial year on the delivery of the Group’s strategic priorities, balancing financial and non-financial performance, to deliver short-, medium- and long-term success aligned to our purpose and Our Values, and to motivate executives to strive to achieve stretch performance objectives. | The LTIP is a long-term equity award that focuses executives’ efforts on the achievement of sustainable long-term value creation and success of the Group (including appropriate management of business risks). | |||
| Components | Base salary, pension contributions and benefits. | Cash and deferred shares. | Performance rights. | |||
| Approach and link to performance | Competitive fixed remuneration is aligned to global complexity, reach and scale, and reflects executives’ responsibilities, location, skills, performance, qualifications and experience. | Annual variable pay opportunity provided in cash and two- and five- year deferred shares with the outcome determined by the assessment of performance against a balanced scorecard linked to execution of business strategy. A balanced scorecard of short-, medium- and long-term elements including S&S (25% weighting), financial (50% weighting) and Group and individual performance measures (25% weighting) are chosen on the basis that they are expected to have a significant short-, medium- and long-term impact on the success of the Group, with appropriate targets for each measure that will appropriately motivate executives to achieve outperformance that contributes to the long-term sustainability of the Group and shareholder wealth creation. | Annual long-term variable pay opportunity allocated as awards of performance rights, which are subject to a five-year relative TSR performance condition. The performance rights are designed to align executives’ reward with sustained shareholder wealth creation in excess of relevant comparator group(s), through the relative TSR performance condition. Relative TSR has been chosen as an appropriate measure as it enables an objective external assessment over a sustained period on a basis that is familiar to shareholders. | |||
153
Table of Contents
CDP | LTIP | |||||
| Assessment of performance | A CDP award is determined based on the assessment of each scorecard measure by the Committee and the Board, with guidance provided by other relevant Board Committees (including the Sustainability Committee and Risk and Audit Committee) in respect of S&S, financial and other measures.
If performance is below the threshold level for any measure, no CDP award will be provided in respect of that portion of the CDP award opportunity.
The Committee retains discretion to adjust all or part of any CDP award in the event the Committee does not consider the outcomes to be a true reflection of the performance of the Group or considers that individual performance or other circumstances makes this an inappropriate outcome. This mitigates the risk of unintended award outcomes. | Vesting of the LTIP award is dependent on BHP’s TSR relative to the TSR of relevant comparator group(s) over a five-year performance period.
Achievement against each TSR hurdle is assessed by the Committee and the Board, based on external data reviewed and confirmed by independent remuneration consultants.
| ||||
BHP’s TSR performance
• Below the 50th percentile
• Equal to the 50th percentile
• Between the 50th percentile and the weighted 80th percentile
• Equal to, or exceeds, the 80th percentile (outperformance) | % of the LTIP award that will vest
0%
25%
Sliding scale between 25% and 100%
100% | |||||
Where the TSR performance condition is not met, there is no retesting and awards will lapse.
The Committee retains discretion to lapse any portion or all of the award where it considers the vesting outcome is not appropriate given Group or individual performance, or other circumstances apply that makes the vesting outcome an inappropriate outcome. This mitigates the risk of unintended outcomes. | ||||||
| Delivery and vesting | CDP awards are provided as cash and two awards of deferred shares, each of equivalent value to the cash award, vesting in two and five years, respectively.
Awards of deferred shares comprise rights to receive ordinary BHP shares at the end of the deferral periods subject to continued employment with BHP until the vesting date. Before the awards vest, these rights are not ordinary shares and do not carry entitlements to ordinary dividends or other shareholder rights, however, a DEP is provided on vested awards. The Committee also has a discretion to settle CDP deferred shares in cash.
Vesting of five-year deferred shares under the CDP is underpinned by a holistic review of performance at the end of the five-year vesting period, including a review of S&S performance, profitability, cash flow, balance sheet health, returns to shareholders, corporate governance and conduct over the five-year period. | LTIP awards consist of rights to receive ordinary BHP shares in the future if the performance and service conditions are met.
Before vesting, these rights are not ordinary shares and do not carry entitlements to ordinary dividends or other shareholder rights, however, a DEP is provided on vested awards. The Committee has a discretion to settle LTIP awards in cash.
Vesting of five-year performance rights under the LTIP is underpinned by a holistic review of performance at the end of the five-year performance period, including a review of S&S performance, profitability, cash flow, balance sheet health, returns to shareholders, corporate governance and conduct over the five-year period. | ||||
154
Table of Contents
CDP | LTIP | |||||
| Cessation of employment | On cessation of employment, a ‘good leaver’1 may receive a pro-rated cash award based on performance for that year. For a ‘good leaver’, their unvested CDP deferred awards generally remain on foot (wholly or in part) unless the Committee determines otherwise. If the executive is not a ‘good leaver’, all unvested CDP deferred awards will lapse. | On cessation of employment, for a ‘good leaver’1 their unvested LTIP awards generally remain on foot and are pro-rated for the portion of the vesting period served, unless the Committee determines otherwise. These awards are eligible for vesting in the ordinary course, subject to any applicable performance conditions. If the executive is not a ‘good leaver’, all unvested LTIP awards will lapse. | ||||
| Malus and clawback | In certain circumstances, including to prevent an executive obtaining an inappropriate benefit, the Committee may determine that some or all awards (including equity, cash and deferred share awards) are lapsed, forfeited or clawed back. The Committee may also suspend or delay vesting of awards if an investigation is underway, until the outcome of any investigation is known. BHP also has a Malus and Clawback Policy that applies to all equity awards. | |||||
| 1 | ‘Good leaver’ treatment may apply where the reason for the cessation of employment with BHP is due to retirement, retrenchment or redundancy, termination by mutual agreement or such other circumstances that do not constitute resignation or termination for cause. |
2.3 Remuneration mix
The diagram below provides the scenarios for the potential total remuneration of the CEO and other Executive KMP at different levels of performance.
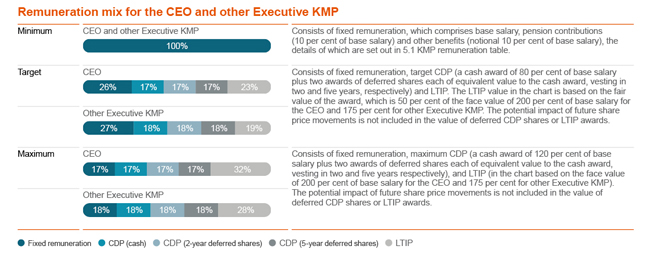
The maximum opportunity represented above is the most that could potentially be paid for each remuneration component. It does not reflect any intention by the Group to award that amount.
3 Remuneration for the CEO and other Executive KMP
The amount of remuneration actually received by the CEO and other Executive KMP each year under the CDP and LTIP depends on the achievement of business and individual performance measures. The Board and Committee applies its overarching discretion to determine fair and commensurate remuneration that reflects the objectives of the remuneration framework and takes into account shareholder expectations and market conditions.
3.1 FY2024 remuneration received by the CEO
The table below is a voluntary non-statutory disclosure of the remuneration received by the CEO during FY2024 and FY2023. This table is unaudited and differs from the audited remuneration calculated in accordance with the Australian Accounting Standards (refer to 5.1 KMP remuneration table and Financial Statements note 26 ‘Employee share ownership plans’). This table is designed to provide greater transparency for shareholders and reflects actual remuneration received, with the CDP and LTIP included below representing those amounts that have been received as a consequence of satisfying performance conditions in the relevant financial year.
155
Table of Contents
The difference between the disclosure in the table below and the remuneration disclosed in 5.1 KMP remuneration table relates to the CDP and LTIP. The remuneration calculated in accordance with Australian Accounting Standards requires the fair value of the CDP and LTIP to be calculated at the time of grant and to be amortised over the relevant vesting periods regardless of the performance outcome. This may not reflect what the executive receives. In the table below, the CDP and LTIP values relate to the performance outcomes and actual amount received each year under the CDP (i.e. against the CDP scorecard) and the LTIP (i.e. based on the LTIP vesting outcome).
Details of the components of remuneration are contained in 2 Executive KMP remuneration framework and the values in the table are explained further in the notes below.
US$(’000) | Base salary | Benefits1 | Pension2 | CDP3 | LTIP4 | Total | ||||||||||||||||||||||
Mike Henry | FY2024 | 1,808 | 35 | 181 | 3,113 | 3,376 | 8,513 | |||||||||||||||||||||
| FY2023 | 1,742 | 7 | 174 | 3,762 | 7,645 | 13,330 | ||||||||||||||||||||||
| 1. | Benefits are non-pensionable and include net movements in leave balances, private health insurance, car parking, fringe benefits tax and personal tax return preparation in required countries. |
| 2. | FY2024 and FY2023 pension contributions were provided based on 10 per cent of base salary. |
| 3. | The values shown are the full CDP value (cash and deferred shares) earned based on performance during FY2024 and FY2023. The FY2024 CDP award will be provided one-third in cash in September 2024 and two-thirds in deferred shares, with one-third due to vest at the end of FY2026 and one-third due to vest at the end of FY2029 (on the terms of the FY2024 CDP award). The FY2023 CDP award was provided one-third in cash in September 2023 and two-thirds in deferred shares, with one-third due to vest at the end of FY2025 and one-third due to vest at the end of FY2028 (on the terms of the FY2023 CDP award). |
| 4. | The LTIP award values for FY2024 and FY2023 are based on the full awards Mike Henry received in 2019 and 2018, respectively, when he was President Operations Minerals Australia (prior to becoming and with no proration applied for time as CEO), and 50 per cent of the 2019 awards vesting and 100 per cent of the 2018 awards vesting. The 2019 LTIP award value in FY2024 is an estimate calculated on the average share price for the month of July 2024 (which will be updated for the actual share price on the vesting date in the 2025 Remuneration Report); whereas the 2018 LTIP award value in FY2023 was calculated on the actual share price on the vesting date (and updated from the 2023 Remuneration Report in which the value was an estimate calculated on the average share price for the month of July 2023). |
A revised remuneration framework took effect from 1 July 2019 and significantly reduced the LTIP grant size for the CEO from 400 per cent of base salary (on a face value basis) to 200 per cent and a rebalancing to a CDP award with a long-term focus. As a result, the remuneration for Mike Henry reported above reflects the transition to this structure and includes the full amounts of the CDP award earned during FY2024 and FY2023 (i.e. irrespective that some elements of the CDP award are deferred) together with the full amounts of pre-existing LTIP awards vesting at the end of FY2024 and the pre-existing LTIP awards vesting at the end of FY2023 that were granted in 2019 and 2018, respectively. The LTIP award sizes granted in 2019 and 2018 were double the current grant size.
Had the current remuneration framework been in place when Mike’s 2019 and 2018 LTIP awards were granted and a reduced size awarded, the reported LTIP values would have been US$1.688 million for FY2024 and US$3.827 million for FY2023 (instead of US$3.376 million and US$7.645 million in the table above). The reported total remuneration would have therefore been US$6.825 million for FY2024 and US$9.512 million for FY2023 (instead of US$8.513 million and US$13.330 million in the table above).
3.2 FY2024 CDP performance outcomes
The Board and the Committee assessed the Executive KMP’s CDP outcomes in light of the Group’s performance in FY2024 and took into account performance against the measures in each Executive KMP’s CDP scorecard.
For the CEO, the Board’s and the Committee’s assessment against the CDP scorecard measures resulted in a CDP outcome for FY2024 at 76 per cent against the target of 100 per cent (or 51 per cent against maximum). As noted in the Chair letter, BHP has self-reported certain payroll issues to the FWO and is reviewing its payroll systems. The Board has determined that the CEO’s FY2024 CDP outcome will include a 4.3 percentage point reduction from 76 per cent to 71.7 per cent to reflect his ultimate accountability for BHP’s payroll systems.
The CEO’s final CDP scorecard outcome for FY2024 is summarised in the following tables, including a narrative description of each performance measure and the CEO’s level of achievement, as determined by the Committee and approved by the Board. The level of performance for each measure is determined based on a range of threshold (the minimum necessary to qualify for any reward outcome), target (where the performance requirements are met) and maximum (where the performance requirements are significantly exceeded).
156
Table of Contents
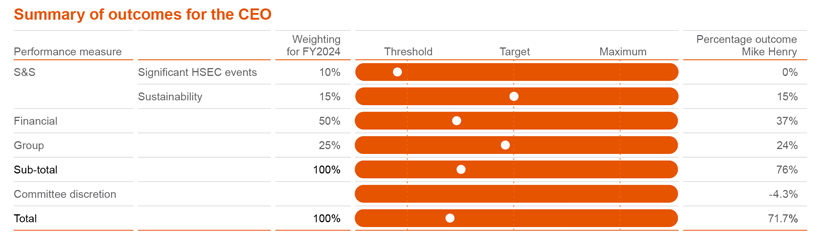
Safety and sustainability
The safety and sustainability (S&S) targets for the CEO are aligned to the Group’s 2030 goals. As it has done for several years, when assessing S&S performance against the scorecard targets, the Committee seeks guidance from the Sustainability Committee. The Committee has taken a holistic view of Group performance in critical areas, including considering any additional matters outside the scorecard targets that the Sustainability Committee has provided and considers relevant.
The performance commentary below is provided against the significant HSEC events (including fatalities) scorecard targets, which were set on the basis of operated assets only.
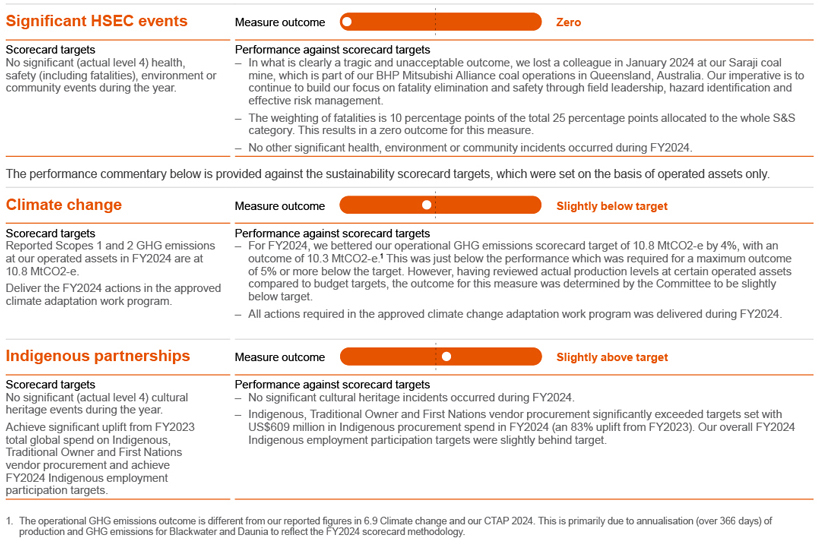
157
Table of Contents
The overall outcome against the total S&S measures for FY2024 was 15 per cent out of the target of 25 per cent, with a zero outcome against a target of 10 per cent for the significant HSEC events measure and an outcome of 15 per cent against a target of 15 per cent for sustainability measures.
Financial
ROCE is underlying profit after taxation (excluding after-taxation finance costs and exceptional items) divided by average capital employed. ROCE is the key financial measure against which CDP outcomes for our senior executives are measured and is, in our view, a relevant measure to assess the financial performance of the Group for this purpose. While ROCE excludes exceptional items, the Committee reviews each exceptional item to assess if it should be included in the result when determining the ROCE CDP outcome.
When assessing management’s performance, we make adjustments to the ROCE result to allow for changes in commodity prices, foreign exchange movements and other material items (from the levels assumed in setting the targets). This ensures the assessment appropriately measures outcomes that are within the control and influence of the Group and its executives. Of these adjustments, changes in commodity prices have historically been the most material due to volatility in prices and the impact on Group revenue and ROCE. As it has done for several years, the Committee seeks guidance each year from the Risk and Audit Committee when assessing financial performance against scorecard targets.
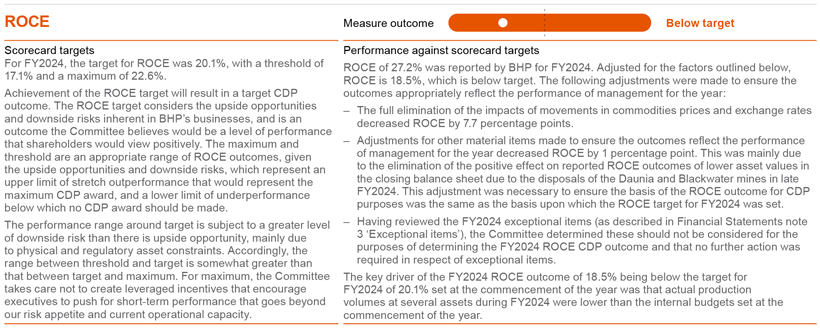
The outcome against the ROCE measure for FY2024 was 37 per cent out of the target of 50 per cent.
Group measures for the CEO
Group measures for the CEO are determined at the start of the financial year and are an important element of effective performance management. These measures seek to balance financial and non-financial performance requirements and incentivise a high-performance culture. The CEO’s group measures for FY2024 included contribution to BHP’s overall performance and the management team, and the delivery of key projects and initiatives, as set out in the table below.
158
Table of Contents
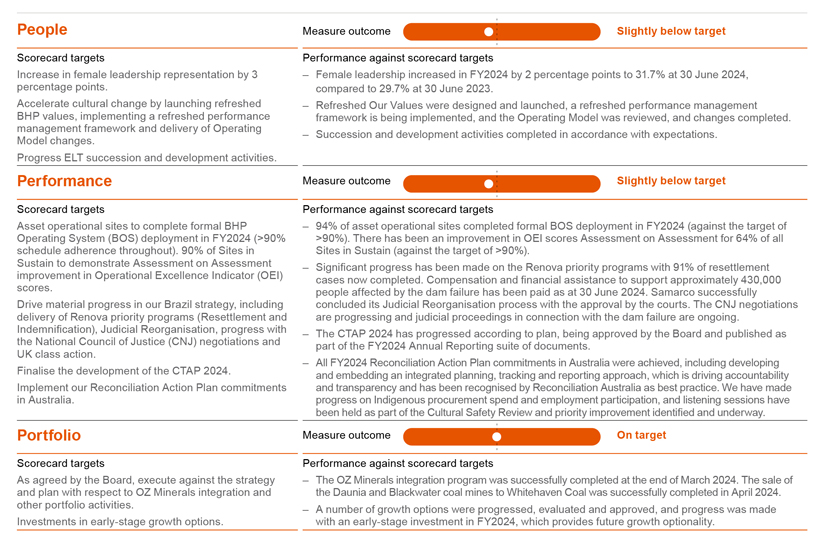
Overall, the performance of the CEO against the group measures for FY2024 was assessed as slightly below expectations and warranted an outcome of 24 per cent against the target of 25 per cent.
The CDP performance measures for other Executive KMP for FY2024 are similar to those of the CEO outlined above. However, for the other Executive KMP, the weighting of each performance measure will vary to reflect the focus required from each Executive KMP role. As with the CEO, individual performance measures are determined at the start of the financial year. These include the other Executive KMP’s contribution to the delivery of projects and initiatives within the scope of their role and the overall performance of the Group. Individual performance of other Executive KMP was reviewed against these measures by the Committee and, on average, were considered to have marginally exceeded expectations and warranted an outcome slightly above target.
The diagram below represents the FY2024 CDP weightings and outcomes against the original scorecard for other Executive KMP.
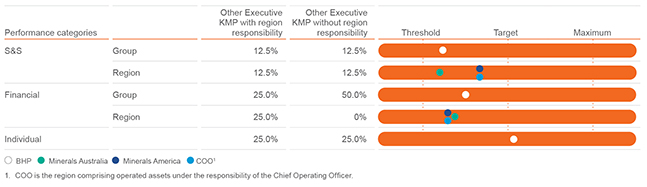
159
Table of Contents
3.3 FY2024 LTIP performance outcomes
The five-year performance period for the 2019 LTIP award for relevant Executive KMP ended on 30 June 2024. Vesting is subject to the achievement of the relative TSR performance conditions and any discretion applied by the Committee (refer to 3.4 Overarching discretion and vesting underpin).
For the 2019 LTIP award to vest in full, BHP’s TSR over the performance period from 1 July 2019 to 30 June 2024 must have been at or exceeded the 80th percentile of the Sector Group TSR and the MSCI World Index TSR (World TSR). TSR includes returns to BHP shareholders in the form of share price movements along with dividends paid and reinvested in BHP (including cash and in-specie dividends).
BHP’s TSR performance was positive 92 per cent over the five-year period from 1 July 2019 to 30 June 2024. This is above the 50th percentile of the Sector Group TSR of positive 86 per cent but below the 80th percentile of the Sector Group TSR of positive 113 per cent, and above the 50th percentile of the World TSR of positive 58 per cent but below the 80th percentile of the World TSR of positive 117 per cent over the same period. This level of performance results in 50 per cent vesting for the 2019 LTIP award. The value of the CEO’s vested 2019 LTIP award has been reported in 3.1 FY2024 remuneration received by the CEO.
The graph below shows BHP’s performance relative to comparator groups.
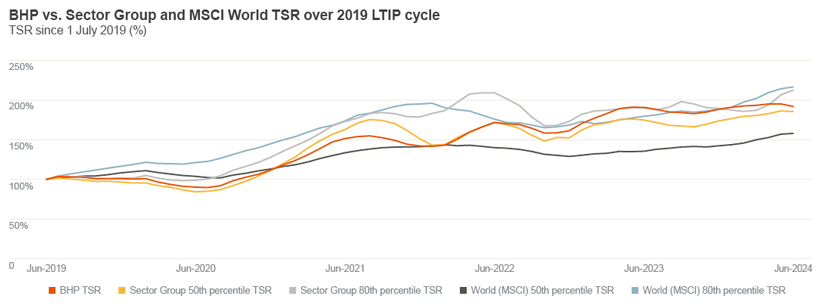
The value of the vested 2019 LTIP award is higher than the value of the vested award at the time it was granted in 2019. The share price has risen appreciably during the five-year period and there have been strong dividends. Of the value realised, 57 per cent is due to the value at the time the awards were granted and 43 per cent is due to share price appreciation and dividends. This value increment due to share price appreciation and dividends is consistent with the experience of shareholders over the period.
3.4 Overarching discretion and vesting underpin
The rules of the CDP and LTIP and the terms and conditions of the awards provide the Committee with an overarching discretion to reduce the number of awards that will vest, notwithstanding that the performance conditions or the relevant service conditions have been met.
This overarching discretion is a holistic, qualitative judgement (‘look back’) and is applied as an underpin test before final vesting is confirmed. It is an important risk management tool to ensure vesting is not simply driven by a formula or the passage of time that may give unexpected or unintended remuneration outcomes.
The Committee considers its discretion carefully each year ahead of the scheduled vesting of CDP and LTIP equity awards in August. For the five-year CDP deferred awards, it considers performance holistically over the five-year period, including a five-year ‘look back’ on S&S performance, profitability, cash flow, balance sheet health, returns to shareholders, corporate governance and conduct. For the five years from FY2020 to FY2024, the Committee noted BHP’s continued progress in S&S outcomes (noting, however, the two fatalities in FY2023 and one in FY2024 have been taken into account in determining CDP outcomes for those years), strong operational performance with improving production and cost performance, and significant returns to shareholders.
In respect of the vesting of CDP two-year deferred shares (granted in November 2022 in respect of performance in FY2022), the Committee did not identify any reason to exercise its downwards discretion.
160
Table of Contents
In respect of the vesting of the 2019 LTIP five-year performance rights, the formulaic outcome of the 2019 LTIP was 50 per cent vesting. Having undertaken the ‘look back’ review described above, the Committee concluded the vesting outcome was appropriate given Group and individual performance, and that no reasons were identified to warrant the exercise of its downwards discretion. There is no upwards discretion available to the Committee in respect of the 2019 LTIP and the overarching discretion may only reduce the number of awards that may vest.
In FY2023 BHP identified and disclosed two issues with certain allowances and entitlements affecting some current and former employees in Australia. We self-reported these issues to the FWO and engaged Protiviti, a global assurance firm, to undertake a review of our payroll systems. In August 2023, ELT members had a negative 3 percentage point impact on the FY2023 CDP outcomes due to the costs of remediating the two employee entitlements and allowances issues. We also confirmed that we would monitor the outcome of the review and engagement with the regulatory authorities and that this may impact remuneration outcomes in the future.
The Board and CEO have taken these issues seriously. A range of consequences have been implemented for employees in relation to these matters. In relation to remuneration outcomes, this year the Board has determined that the CEO’s FY2024 CDP outcome will include a 4.3 percentage point reduction to reflect his ultimate accountability for BHP’s payroll systems. This CDP reduction for the CEO in FY2024 is US$185,000 and is equivalent to 25 per cent of the CEO’s target annual short term incentive pro-rated for the portion of the relevant period that he was CEO. For others with accountability for BHP’s payroll issues (including current and prior ELT members) there have been reductions determined in variable remuneration outcomes ranging between 25 per cent to 100 per cent of relevant annual target variable pay. Accountability has been determined based on a number of factors, including tenure in relevant roles.
3.5 LTIP allocated during FY2024
Following shareholder approval at the 2023 AGM, 125,124 LTIP awards (in the form of performance rights) were granted to the CEO on 8 November 2023. The face value of the CEO’s award was 200 per cent of his base salary of US$1.820 million at the time of grant. The fair value of the awards were calculated by multiplying the face value of the award by the fair value factor of 41 per cent at the time (as determined by the independent adviser to the Committee). The 125,124 LTIP awards for the CEO was determined based on the US$ face value of the LTIP awards of US$3.640 million and calculated using the average share price and US$/A$ exchange rate over the 12 months up to and including 30 June 2023. LTIP awards granted to other Executive KMP during FY2024 were determined on the same basis as described above for the CEO, except that awards for other Executive KMP had a face value of 175 per cent of base salary.
In addition to the LTIP terms set out in 2 Executive KMP remuneration framework, the Committee determined the following terms for the 2023 LTIP:
| Performance period | • 1 July 2023 to 30 June 2028 | |
| Performance conditions | • Vesting is conditional on two relative TSR performance measures.
• An averaging period of six months will be used in the TSR calculations.
• BHP’s TSR relative to the median TSR of the MSCI World Metals and Mining Index (Sector Group TSR) and the MSCI World Index (World TSR) will determine the vesting of 67% and 33% of the award, respectively.
• For each portion of the award to vest in full, BHP’s TSR must be at or exceed the 80th percentile of the Sector Group TSR or the World TSR (as applicable). Threshold vesting (25% of each portion of the award) occurs where BHP’s TSR equals the 50th percentile (i.e. the median) of the Sector Group TSR or the World TSR (as applicable). Vesting occurs on a sliding scale between the 50th and 80th percentiles. | |
161
Table of Contents
3.6 FY2025 remuneration for the CEO and other Executive KMP
The remuneration for the CEO and other Executive KMP in FY2025 will be in accordance with the remuneration framework operation and the main elements are set out in the table below.
Base salary | CDP | LTIP | ||
Base salaries are reviewed and benchmarked annually against external market demand for senior executive talent to ensure they remain competitive. Following the review, if the Board and Committee assess and determine a base salary increase should apply to the CEO and/or other Executive KMP, the increase will be applicable from 1 September.
For FY2025, the Committee determined that the CEO’s base salary would increase by 4%, effective 1 September 2024, to US$1.893 million. The Committee has also reviewed the base salaries and total target remuneration packages for other Executive KMP. The Committee determined an increase of 8% for the President Australia, reflecting performance and development in role. Given recent appointments, no other changes are being made for other Executive KMP at this time, and this will be the subject of future reviews. | The Board and the Committee set the CDP scorecard performance categories and measures each year.
For FY2025, the balanced scorecard includes S&S measures (25% weighting) such as elimination of significant harm (including safety), climate change and Indigenous partnerships, a ROCE financial measure (50% weighting), and Group and individual measures (25% weighting) relating to projects and initiatives in respect of people, performance and portfolio. The specific Group and individual performance measures vary for Executive KMP to reflect the focus required from each of them in their role.
Notably, certain S&S, Group and individual measures have a long-term focus where they are set with a view to achieving longer-term ambitions. For example, annual GHG emission reduction targets reflect the ultimate achievement of BHP’s medium-term target of at least a 30% reduction in operational GHG emissions from FY2020 levels by FY2030, however, progress towards this is not expected to be linear. As a consequence, vesting of five-year deferred shares under the CDP is underpinned by a holistic review of performance at the end of the five-year vesting period, allowing for performance against the longer-term ambitions to be considered. | The LTIP award to be granted to the CEO in FY2025 has a maximum face value of US$3.786 million, being 200% of the CEO’s base salary at the time of grant. The number of LTIP awards expected to be granted to the CEO in FY2025 is 127,848 and has been determined using the share price and US$/A$ exchange rate over the 12 months up to and including 30 June 2024. The granting of this LTIP award is subject to the approval of shareholders at the 2024 AGM. If approved, the award will be granted following the AGM (i.e. in or around November 2024, subject to securities dealing considerations). The LTIP award granted in FY2025 will use the same performance and service conditions as the LTIP award granted in FY2024.
LTIP awards granted to other Executive KMP during FY2025 will be calculated on the same basis as described above for the CEO, except that awards for other Executive KMP will have a maximum face value of 175% of salary. |
4 Remuneration for Non-executive Directors
Our remuneration framework for Non-executive Directors aligns with the Australian Securities Exchange Corporate Governance Council’s Principles and Recommendations (4th Edition). Non-executive Directors do not have any performance-based at-risk remuneration or receive any equity awards as part of their remuneration, therefore the totals shown below are total remuneration and total fixed fees. The maximum aggregate fees payable to Non-executive Directors (including the Group Chair) were approved by shareholders at the 2008 AGMs at US$3.800 million per annum. This sum includes base fees, Committee fees and pension contributions. Travel allowances and non-monetary benefits are not included in this limit.
162
Table of Contents
4.1 Remuneration framework of Non-executive Directors
The following table shows the components for Non-executive Directors’ remuneration. Non-executive Directors are not eligible to participate in any CDP or LTIP awards.
Descriptions | ||
| Purpose and link to strategy | Competitive fees and benefits are paid to Non-executive Directors in order to attract and retain high-quality individuals, and to provide appropriate remuneration for the role undertaken. | |
| Fees | The Group Chair is paid a single fee for all responsibilities. All other Non-executive Directors are paid a base fee and relevant Committee membership fees. Committee Chairs and the Senior Independent Director are paid an additional fee to reflect their extra responsibilities.
All fee levels are reviewed annually and any changes are ordinarily effective from 1 July. Annual reviews take into account global benchmarking and advice provided by external advisers, as required.
Fee levels reflect the size and complexity of the Group and the geographies where the Group operates. The economic environment and the financial performance of the Group are taken into account. Consideration is also given to salary reviews across the rest of the Group.
Where the payment of pension contributions is required by law, these contributions are deducted from the Director’s overall fee entitlements. | |
| Benefits | BHP is a global organisation and there is a considerable travel burden required of Non-executive Directors to travel to Board meetings and site visits. Travel allowances are paid on a per trip basis.
As a consequence of our prior dual listed company structure, Non-executive Directors are required to prepare personal tax returns in Australia and the UK, regardless of whether they reside in one or neither of those countries. They are accordingly reimbursed for the costs of personal tax return preparation in whichever of the UK and/or Australia is not their place of residence (including payment of the tax cost associated with the provision of the benefit). | |
Letters of appointment
The Board has adopted a letter of appointment that contains the terms on which Non-executive Directors will be appointed, including the basis upon which they will be indemnified by the Group. The Board has adopted a policy under which all Non-executive Directors must seek re-election at the AGM each year. As a result of requiring re-election each year, Non-executive Directors do not have a fixed term in their letter of appointment.
Payments on early termination or loss of office
There are no provisions in any of the Non-executive Directors’ appointment arrangements for compensation payable on early termination of their directorship. A Non-executive Director may resign on reasonable notice. No payments are made to Non-executive Directors on loss of office.
4.2 Non-executive Directors’ remuneration in FY2024 and FY2025
The remuneration for the Non-executive Directors was paid in FY2024 and will be paid in FY2025 in accordance with the remuneration framework set out above. Fee levels for the Group Chair and the Non-executive Directors are reviewed annually and are benchmarked against peer companies of similar complexity, reach and scale with the assistance of external advisers (but not by the Committee-appointed independent remuneration adviser).
Following an assessment of the updated benchmarking, global market positioning and peer company relativities, a decision has been made that the Group Chair’s fee and the Non-executive Directors’ base fee will increase by 4 per cent with effect from 1 July 2024. The increases are considered appropriate given current benchmarking and the expectations, accountabilities and workloads of each of the Group Chair and Non-executive Directors. Having conducted this review, it was determined that there would be no change to the fees for other Committee roles or other allowances.
163
Table of Contents
The below table sets out the annualised total remuneration and total fixed fees for FY2024 and FY2025 (including the increases from 1 July 2024).
Levels of fees and travel allowances for Non-executive Directors (in US$) | FY2024 | FY2025 | ||||||
Base annual fee | 168,000 | 175,000 | ||||||
|
|
|
| |||||
Plus additional fees for: | ||||||||
| Senior Independent Director | 53,000 | 53,000 | ||||||
|
|
|
| |||||
Committee Chair: | ||||||||
Risk and Audit | 66,000 | 66,000 | ||||||
People and Remuneration | 45,000 | 45,000 | ||||||
Sustainability | 45,000 | 45,000 | ||||||
Nomination and Governance | No additional fee | No additional fee | ||||||
|
|
|
| |||||
Committee membership: | ||||||||
Risk and Audit | 32,500 | 32,500 | ||||||
People and Remuneration | 27,500 | 27,500 | ||||||
Sustainability | 27,500 | 27,500 | ||||||
Nomination and Governance | 18,000 | 18,000 | ||||||
|
|
|
| |||||
Travel allowance:1 | ||||||||
In excess of 3 hours and less than 10 hours | 7,000 | 7,000 | ||||||
10 hours or more | 15,000 | 15,000 | ||||||
|
|
|
| |||||
Group Chair’s fee2 | 925,000 | 962,000 | ||||||
|
|
|
| |||||
| 1. | In relation to travel for Board and shareholder meetings, the time thresholds relate to a flight time in excess of three hours to travel to the meeting location (i.e. one-way flight time). Only one travel allowance is paid per round trip. |
| 2. | The Group Chair is paid a single fee for all responsibilities (i.e. no base annual fee or Committee fees). |
5 Statutory KMP remuneration and other disclosures
5.1 KMP remuneration table
The table below has been prepared in accordance with relevant accounting standards. Remuneration data for KMP are for the periods of FY2023 and FY2024 that they were KMP. More information on the framework and operation of each element of remuneration is provided earlier in this Report.
Share-based payments
The figures included in the shaded columns of the statutory table below for share-based payments were not actually provided to the Executive KMP, including the CEO, during FY2023 or FY2024. These amounts are calculated in accordance with accounting standards and are the amortised IFRS fair values at grant date of equity and equity-related instruments that have been granted to the executives. For information on awards that were allocated and vested during FY2023 and FY2024, refer to 5.2 Equity awards.
| Short-term benefits | Post- employment benefits | Share-based payments | ||||||||||||||||||||||||||||||||
US$(‘000) | Financial | Base salary / fees1 | Annual cash incentive2 | Non-monetary benefits3 | Other benefits4 | Retirement benefits5 | Value of CDP awards2, 6 | Value of LTIP awards6 | Total | |||||||||||||||||||||||||
CEO | ||||||||||||||||||||||||||||||||||
Mike Henry | FY2024 | 1,808 | 1,038 | 35 | – | 181 | 2,177 | 2,096 | 7,335 | |||||||||||||||||||||||||
| FY2023 | 1,742 | 1,254 | 7 | – | 174 | 2,107 | 2,206 | 7,490 | ||||||||||||||||||||||||||
Other Executive KMP | ||||||||||||||||||||||||||||||||||
Edgar Basto7 | FY2024 | 673 | 425 | – | – | 67 | 668 | 617 | 2,450 | |||||||||||||||||||||||||
| FY2023 | 975 | 704 | 2 | – | 98 | 1,030 | 820 | 3,629 | ||||||||||||||||||||||||||
Brandon Craig8 | FY2024 | 267 | 173 | 28 | 378 | 27 | 33 | 254 | 1,160 | |||||||||||||||||||||||||
David Lamont7 | FY2024 | 673 | 425 | 1 | – | 67 | 649 | 641 | 2,456 | |||||||||||||||||||||||||
| FY2023 | 975 | 733 | 15 | – | 98 | 960 | 608 | 3,389 | ||||||||||||||||||||||||||
Vandita Pant8 | FY2024 | 340 | 223 | 29 | – | 34 | 329 | 228 | 1,183 | |||||||||||||||||||||||||
Geraldine Slattery | FY2024 | 1,013 | 592 | 26 | 297 | 101 | 1,182 | 1,049 | 4,260 | |||||||||||||||||||||||||
| FY2023 | 950 | 665 | 113 | 400 | 95 | 1,117 | 947 | 4,287 | ||||||||||||||||||||||||||
Ragnar Udd7 | FY2024 | 665 | 431 | 48 | – | 67 | 644 | 575 | 2,430 | |||||||||||||||||||||||||
| FY2023 | 917 | 711 | 49 | – | 92 | 911 | 748 | 3,428 | ||||||||||||||||||||||||||
164
Table of Contents
| Short-term benefits | Post- employment benefits | Share-based payments | ||||||||||||||||||||||||||||||||
US$(‘000) | Financial | Base salary / fees1 | Annual cash incentive2 | Non-monetary benefits3 | Other benefits4 | Retirement benefits5 | Value of CDP awards2, 6 | Value of LTIP awards6 | Total | |||||||||||||||||||||||||
Non-executive Directors | ||||||||||||||||||||||||||||||||||
Terry Bowen9 | FY2024 | 78 | – | – | – | 7 | – | – | 85 | |||||||||||||||||||||||||
| FY2023 | 241 | – | – | 40 | 17 | – | – | 298 | ||||||||||||||||||||||||||
Malcolm Broomhead9 | FY2023 | 61 | – | – | 15 | 6 | – | – | 82 | |||||||||||||||||||||||||
Xiaoqun Clever-Steg | FY2024 | 188 | – | – | 77 | 13 | – | – | 278 | |||||||||||||||||||||||||
| FY2023 | 181 | – | – | 79 | 12 | – | – | 272 | ||||||||||||||||||||||||||
Ian Cockerill9 | FY2024 | 162 | – | – | 46 | 12 | – | – | 220 | |||||||||||||||||||||||||
| FY2023 | 208 | – | – | 106 | 12 | – | – | 326 | ||||||||||||||||||||||||||
Gary Goldberg | FY2024 | 284 | – | – | 99 | – | – | – | 383 | |||||||||||||||||||||||||
| FY2023 | 284 | – | – | 101 | – | – | – | 385 | ||||||||||||||||||||||||||
Michelle Hinchliffe | FY2024 | 235 | – | – | 45 | – | – | – | 280 | |||||||||||||||||||||||||
| FY2023 | 186 | – | – | 37 | 6 | – | – | 229 | ||||||||||||||||||||||||||
Don Lindsay10 | FY2024 | 38 | – | – | – | – | – | – | 38 | |||||||||||||||||||||||||
Ken MacKenzie | FY2024 | 907 | – | – | 67 | 18 | – | – | 992 | |||||||||||||||||||||||||
| FY2023 | 863 | – | – | 63 | 17 | – | – | 943 | ||||||||||||||||||||||||||
Ross McEwan10 | FY2024 | 51 | – | – | 45 | 4 | – | – | 100 | |||||||||||||||||||||||||
John Mogford9 | FY2023 | 63 | – | – | 33 | – | – | – | 96 | |||||||||||||||||||||||||
Christine O’Reilly | FY2024 | 263 | – | – | 37 | – | – | – | 300 | |||||||||||||||||||||||||
| FY2023 | 268 | – | – | 55 | – | – | – | 323 | ||||||||||||||||||||||||||
Catherine Tanna | FY2024 | 205 | – | – | 44 | 18 | – | – | 267 | |||||||||||||||||||||||||
| FY2023 | 198 | – | – | 52 | 17 | – | – | 267 | ||||||||||||||||||||||||||
Dion Weisler | FY2024 | 205 | – | – | 22 | 18 | – | – | 245 | |||||||||||||||||||||||||
| FY2023 | 198 | – | – | 55 | 17 | – | – | 270 | ||||||||||||||||||||||||||
| 1 | Base salaries and fees shown in this table reflect the amounts paid over the 12-month period from 1 July 2023 to 30 June 2024 for each Executive KMP and Non-executive Director. In FY2024, the Executive KMP base salaries were increased from 1 September 2023 as follows: Mike Henry’s to US$1.820 million, Edgar Basto’s to US$1.020 million, David Lamont’s to US$1.020 million, Geraldine Slattery’s to US$1.020 million and Ragnar Udd’s to US$1.020 million. The other changes to Executive KMP base salaries during the year were as follows: Brandon Craig who was appointed President Americas on 1 March 2024 on an annual salary of US$0.800 million and Vandita Pant who was appointed Chief Financial Officer on 1 March 2024 on an annual salary of US$1.020 million. |
| 2 | Annual cash incentive in this table is the cash portion of CDP awards each Executive KMP earned in respect of performance during each financial year. CDP is provided one-third in cash and two-thirds in deferred shares (which are included in the share-based payments columns of the table). The cash portion of CDP awards is paid in September of the year following the relevant financial year. The minimum possible value awarded to each individual is nil, the target is 240 per cent of base salary (80 per cent in cash and 160 per cent in deferred shares) and the maximum is 360 per cent of base salary (120 per cent in cash and 240 per cent in deferred shares). For FY2024, Executive KMP earned the following CDP awards as a percentage of the target and maximum (the remaining portion has been forfeited): Mike Henry 71.7 per cent of target and 47.8 per cent of maximum, Edgar Basto 79 per cent of target and 53 per cent of maximum, Brandon Craig 81 per cent of target and 54 per cent of maximum, David Lamont 79 per cent of target and 53 per cent of maximum, Vandita Pant 82 per cent of target and 55 per cent of maximum, Geraldine Slattery 73 per cent of target and 49 per cent of maximum and Ragnar Udd 81 per cent of target and 54 per cent of maximum. |
| 3 | Non-monetary benefits are non-pensionable and include items such as net leave accruals, private family health insurance, car parking, fringe benefits tax and personal tax return preparation in required countries. |
| 4 | Other benefits are non-pensionable and for FY2024 include a one-off relocation allowance provided to Brandon Craig relating to his international relocation from Australia to Chile and one-off reimbursement to Geraldine Slattery associated with her house sale/purchase for international relocation from the United States to Australia. The majority of the amounts disclosed for benefits for Non-executive Directors are usually travel allowances: amounts of between US$ nil and US$105,000 for FY2024 and FY2023. For FY2024, amounts of between US$ nil and US$1,500 (US$ nil and US$3,000 for FY2023) are included in respect of tax return preparation, and amounts of between US$ nil and US$800 for FY2024 (US$ nil and US$1,400 for FY2023) are included in respect of the reimbursement of the tax cost associated with the provision of taxable benefits. |
| 5 | Retirement benefits for each Executive KMP in FY2023 and FY2024 were 10 per cent of base salary as per the remuneration framework. Non-executive Director fees are inclusive of minimum superannuation contributions of up to 11 per cent of remuneration for FY2024 (10.5 per cent for FY2023) in accordance with Australian superannuation legislation. No other pension contributions were paid. |
| 6 | The IFRS fair value of CDP and LTIP awards is estimated at grant date. Refer to Financial Statements note 26 ‘Employee share ownership plans’. |
165
Table of Contents
| 7 | The FY2024 remuneration reported for Edgar Basto, David Lamont and Ragnar Udd reflects services as Executive KMP up to 29 February 2024. |
| 8 | The FY2024 remuneration reported for Brandon Craig and Vandita Pant reflects services as Executive KMP from 1 March 2024. |
| 9 | The FY2024 remuneration for Terry Bowen and Ian Cockerill relates to part of the year only, as they retired from the Board on 1 November 2023 and 4 April 2024, respectively. The FY2023 remuneration for Malcolm Broomhead and John Mogford relates to part of the year only, as they retired from the Board on 10 November 2022 and 31 October 2022, respectively. |
| 10 | The FY2024 remuneration reported for Don Lindsay and Ross McEwan relates to part of the year only, as they joined the Board on 1 May 2024 and 3 April 2024, respectively. |
5.2 Equity awards
The interests held by Executive KMP under the Group’s employee equity plans are set out in the table below. Each equity award is a right to acquire one ordinary share in BHP Group Limited upon satisfaction of the vesting conditions. Our mandatory minimum performance requirements for securities dealing governs and restricts dealing arrangements and the provision of shares on vesting or exercise of awards. No interests under the Group’s employee equity plans are held by related parties of Executive KMP.
Approval from BHP’s shareholders for the issue of equity awards to the CEO under the CDP and LTIP was obtained under ASX Listing Rule 10.14 at the 2023 AGM.
DEP applies to awards provided to Executive KMP under the CDP and LTIP as detailed in 2 Executive KMP remuneration framework. No DEP is generally payable on MAP awards previously provided to Executive KMP.
Executive KMP received or will receive awards under the CDP and LTIP. The terms and conditions of CDP and LTIP awards, including the performance conditions, are described in 2 Executive KMP remuneration framework.
BHP senior management who are not KMP receive awards under the MAP. While no MAP awards were granted to Executive KMP after becoming KMP, as noted in the table below, Edgar Basto, Brandon Craig, Vandita Pant, Geraldine Slattery and Ragnar Udd hold or held MAP awards that were allocated to them prior to commencing their Executive KMP service.
| Award type | Date of grant | At 1 July 2023 | Granted | Vested | Lapsed | At 30 June 2024 | Award vesting date1 | Market price on date of: | Gain on awards (‘000)4 | DEP on awards (‘000) | ||||||||||||||||||||||||||||
| Grant2 | Vesting3 | |||||||||||||||||||||||||||||||||||||
Mike Henry | ||||||||||||||||||||||||||||||||||||||
CDP | 8-Nov-23 | – | 43,106 | – | – | 43,106 | Aug 28 | A$44.70 | – | – | – | |||||||||||||||||||||||||||
CDP | 8-Nov-23 | – | 43,106 | – | – | 43,106 | Aug 25 | A$44.70 | – | – | – | |||||||||||||||||||||||||||
CDP | 22-Nov-22 | 44,335 | – | – | – | 44,335 | Aug 27 | A$43.48 | – | – | – | |||||||||||||||||||||||||||
CDP | 22-Nov-22 | 44,335 | – | – | – | 44,335 | Aug 24 | A$43.48 | – | – | – | |||||||||||||||||||||||||||
CDP | 23-Nov-21 | 55,246 | – | – | – | 55,246 | Aug 26 | A$38.05 | – | – | – | |||||||||||||||||||||||||||
CDP | 23-Nov-21 | 55,246 | – | 55,246 | – | – | 25 Aug 23 | A$38.05 | A$43.02 | A$2,377 | A$527 | |||||||||||||||||||||||||||
CDP | 20-Oct-20 | 49,692 | – | – | – | 49,692 | Aug 25 | A$35.90 | – | – | – | |||||||||||||||||||||||||||
LTIP | 8-Nov-23 | – | 125,124 | – | – | 125,124 | Aug 28 | A$44.70 | – | – | – | |||||||||||||||||||||||||||
LTIP | 22-Nov-22 | 118,853 | – | – | – | 118,853 | Aug 27 | A$43.48 | – | – | – | |||||||||||||||||||||||||||
LTIP | 23-Nov-21 | 120,099 | – | – | – | 120,099 | Aug 26 | A$38.05 | – | – | – | |||||||||||||||||||||||||||
LTIP | 20-Oct-20 | 157,138 | – | – | – | 157,138 | Aug 25 | A$35.90 | – | – | – | |||||||||||||||||||||||||||
LTIP | 20-Nov-19 | 172,144 | – | – | – | 172,144 | Aug 24 | A$37.24 | – | – | – | |||||||||||||||||||||||||||
LTIP | 18-Dec-18 | 193,189 | – | 193,189 | – | – | 25 Aug 23 | A$33.50 | A$43.02 | A$8,311 | A$3,397 | |||||||||||||||||||||||||||
Edgar Basto5 | ||||||||||||||||||||||||||||||||||||||
CDP | 8-Nov-23 | – | 24,201 | – | – | 24,201 | Aug 28 | A$44.70 | – | – | – | |||||||||||||||||||||||||||
CDP | 8-Nov-23 | – | 24,201 | – | – | 24,201 | Aug 25 | A$44.70 | – | – | – | |||||||||||||||||||||||||||
CDP | 22-Nov-22 | 21,936 | – | – | – | 21,936 | Aug 27 | A$43.48 | – | – | – | |||||||||||||||||||||||||||
CDP | 22-Nov-22 | 21,936 | – | – | – | 21,936 | Aug 24 | A$43.48 | – | – | – | |||||||||||||||||||||||||||
CDP | 23-Nov-21 | 30,604 | – | – | – | 30,604 | Aug 26 | A$38.05 | – | – | – | |||||||||||||||||||||||||||
CDP | 23-Nov-21 | 30,604 | – | 30,604 | – | – | 25 Aug 23 | A$38.05 | A$43.02 | A$1,317 | A$292 | |||||||||||||||||||||||||||
LTIP | 8-Nov-23 | – | 61,359 | – | – | 61,359 | Aug 28 | A$44.70 | – | – | – | |||||||||||||||||||||||||||
LTIP | 22-Nov-22 | 58,237 | – | – | – | 58,237 | Aug 27 | A$43.48 | – | – | – | |||||||||||||||||||||||||||
LTIP | 23-Nov-21 | 58,725 | – | – | – | 58,725 | Aug 26 | A$38.05 | – | – | – | |||||||||||||||||||||||||||
LTIP | 20-Oct-20 | 76,835 | – | – | – | 76,835 | Aug 25 | A$35.90 | – | – | – | |||||||||||||||||||||||||||
MAP | 19-May-20 | 31,649 | – | – | – | 31,649 | Aug 24 | A$35.05 | – | – | – | |||||||||||||||||||||||||||
MAP | 19-May-20 | 31,649 | – | 31,649 | – | – | 25 Aug 23 | A$35.05 | A$43.02 | A$1,362 | – | |||||||||||||||||||||||||||
166
Table of Contents
| Award type | Date of grant | At 1 July 2023 | Granted | Vested | Lapsed | At 30 June 2024 | Award vesting date1 | Market price on date of: | Gain on awards (‘000)4 | DEP on awards (‘000) | ||||||||||||||||||||||||||||
| Grant2 | Vesting3 | |||||||||||||||||||||||||||||||||||||
Brandon Craig6 | ||||||||||||||||||||||||||||||||||||||
MAP | 8-Dec-23 | 23,600 | – | – | – | 23,600 | Aug 28 | A$47.74 | – | – | – | |||||||||||||||||||||||||||
MAP | 8-Dec-23 | 23,600 | – | – | – | 23,600 | Aug 27 | A$47.74 | – | – | – | |||||||||||||||||||||||||||
MAP | 27-Sep-23 | 23,600 | – | – | – | 23,600 | Aug 26 | A$43.49 | – | – | – | |||||||||||||||||||||||||||
MAP | 21-Sep-22 | 19,938 | – | – | – | 19,938 | Aug 25 | A$37.96 | – | – | – | |||||||||||||||||||||||||||
MAP | 29-Sep-21 | 19,945 | – | – | – | 19,945 | Aug 24 | A$36.39 | – | – | – | |||||||||||||||||||||||||||
David Lamont5 | ||||||||||||||||||||||||||||||||||||||
CDP | 8-Nov-23 | – | 25,203 | – | – | 25,203 | Aug 28 | A$44.70 | – | – | – | |||||||||||||||||||||||||||
CDP | 8-Nov-23 | – | 25,203 | – | – | 25,203 | Aug 25 | A$44.70 | – | – | – | |||||||||||||||||||||||||||
CDP | 22-Nov-22 | 24,775 | – | – | – | 24,775 | Aug 27 | A$43.48 | – | – | – | |||||||||||||||||||||||||||
CDP | 22-Nov-22 | 24,775 | – | – | – | 24,775 | Aug 24 | A$43.48 | – | – | – | |||||||||||||||||||||||||||
CDP | 23-Nov-21 | 18,009 | – | – | – | 18,009 | Aug 26 | A$38.05 | – | – | – | |||||||||||||||||||||||||||
CDP | 23-Nov-21 | 18,009 | – | 18,009 | – | – | 25 Aug 23 | A$38.05 | A$43.02 | A$775 | A$172 | |||||||||||||||||||||||||||
LTIP | 8-Nov-23 | – | 61,359 | – | – | 61,359 | Aug 28 | A$44.70 | – | – | – | |||||||||||||||||||||||||||
LTIP | 22-Nov-22 | 58,237 | – | – | – | 58,237 | Aug 27 | A$43.48 | – | – | – | |||||||||||||||||||||||||||
LTIP | 23-Nov-21 | 58,725 | – | – | – | 58,725 | Aug 26 | A$38.05 | – | – | – | |||||||||||||||||||||||||||
LTIP | 1-Dec-20 | 76,835 | – | – | – | 76,835 | Aug 25 | A$38.56 | – | – | – | |||||||||||||||||||||||||||
Vandita Pant6 | ||||||||||||||||||||||||||||||||||||||
CDP | 8-Nov-23 | 22,682 | – | – | – | 22,682 | Aug 28 | A$44.70 | – | – | – | |||||||||||||||||||||||||||
CDP | 8-Nov-23 | 22,682 | – | – | – | 22,682 | Aug 25 | A$44.70 | – | – | – | |||||||||||||||||||||||||||
CDP | 22-Nov-22 | 17,834 | – | – | – | 17,834 | Aug 27 | A$43.48 | – | – | – | |||||||||||||||||||||||||||
CDP | 22-Nov-22 | 17,834 | – | – | – | 17,834 | Aug 27 | A$43.48 | – | – | – | |||||||||||||||||||||||||||
CDP | 23-Nov-21 | 20,347 | – | – | – | 20,347 | Aug 26 | A$38.05 | – | – | – | |||||||||||||||||||||||||||
LTIP | 8-Nov-23 | 45,632 | – | – | – | 45,632 | Aug 28 | A$44.70 | – | – | – | |||||||||||||||||||||||||||
LTIP | 22-Nov-22 | 43,296 | – | – | – | 43,296 | Aug 27 | A$43.48 | – | – | – | |||||||||||||||||||||||||||
LTIP | 23-Nov-21 | 34,440 | – | – | – | 34,440 | Aug 26 | A$38.05 | – | – | – | |||||||||||||||||||||||||||
MAP | 20-Oct-20 | 27,731 | – | – | – | 27,731 | Aug 25 | A$35.90 | – | – | – | |||||||||||||||||||||||||||
MAP | 20-Nov-19 | 26,197 | – | – | – | 26,197 | Aug 24 | A$37.24 | – | – | – | |||||||||||||||||||||||||||
Geraldine Slattery | ||||||||||||||||||||||||||||||||||||||
CDP | 8-Nov-23 | – | 22,870 | – | – | 22,870 | Aug 28 | A$44.70 | – | – | – | |||||||||||||||||||||||||||
CDP | 8-Nov-23 | – | 22,870 | – | – | 22,870 | Aug 25 | A$44.70 | – | – | – | |||||||||||||||||||||||||||
CDP | 22-Nov-22 | 23,784 | – | – | – | 23,784 | Aug 27 | A$43.48 | – | – | – | |||||||||||||||||||||||||||
CDP | 22-Nov-22 | 23,784 | – | – | – | 23,784 | Aug 24 | A$43.48 | – | – | – | |||||||||||||||||||||||||||
CDP | 23-Nov-21 | 28,258 | – | – | – | 28,258 | Aug 26 | A$38.05 | – | – | – | |||||||||||||||||||||||||||
CDP | 23-Nov-21 | 28,258 | – | 28,258 | – | – | 25 Aug 23 | A$38.05 | A$43.02 | A$1,216 | A$269 | |||||||||||||||||||||||||||
CDP | 20-Oct-20 | 28,562 | – | – | – | 28,562 | Aug 25 | A$35.90 | – | – | – | |||||||||||||||||||||||||||
LTIP | 8-Nov-23 | – | 61,359 | – | – | 61,359 | Aug 28 | A$44.70 | – | – | – | |||||||||||||||||||||||||||
LTIP | 22-Nov-22 | 58,237 | – | – | – | 58,237 | Aug 27 | A$43.48 | – | – | – | |||||||||||||||||||||||||||
LTIP | 23-Nov-21 | 52,543 | – | – | – | 52,543 | Aug 26 | A$38.05 | – | – | – | |||||||||||||||||||||||||||
LTIP | 20-Oct-20 | 60,660 | – | – | – | 60,660 | Aug 25 | A$35.90 | – | – | – | |||||||||||||||||||||||||||
LTIP | 20-Nov-19 | 117,371 | – | – | – | 117,371 | Aug 24 | A$37.24 | – | – | – | |||||||||||||||||||||||||||
MAP | 21-Feb-19 | 31,965 | – | 31,965 | – | – | 25 Aug 23 | A$34.83 | A$43.02 | A$1,375 | – | |||||||||||||||||||||||||||
Ragnar Udd5 | ||||||||||||||||||||||||||||||||||||||
CDP | 8-Nov-23 | – | 24,452 | – | – | 24,452 | Aug 28 | A$44.70 | – | – | – | |||||||||||||||||||||||||||
CDP | 8-Nov-23 | – | 24,452 | – | – | 24,452 | Aug 25 | A$44.70 | – | – | – | |||||||||||||||||||||||||||
CDP | 22-Nov-22 | 22,167 | – | – | – | 22,167 | Aug 27 | A$43.48 | – | – | – | |||||||||||||||||||||||||||
CDP | 22-Nov-22 | 22,167 | – | – | – | 22,167 | Aug 24 | A$43.48 | – | – | – | |||||||||||||||||||||||||||
CDP | 23-Nov-21 | 18,415 | – | – | – | 18,415 | Aug 26 | A$38.05 | – | – | – | |||||||||||||||||||||||||||
CDP | 23-Nov-21 | 18,415 | – | 18,415 | – | – | 25 Aug 23 | A$38.05 | A$43.02 | A$792 | A$176 | |||||||||||||||||||||||||||
LTIP | 8-Nov-23 | – | 61,359 | – | – | 61,359 | Aug 28 | A$44.70 | – | – | – | |||||||||||||||||||||||||||
LTIP | 22-Nov-22 | 55,266 | – | – | – | 55,266 | Aug 27 | A$43.48 | – | – | – | |||||||||||||||||||||||||||
LTIP | 23-Nov-21 | 52,543 | – | – | – | 52,543 | Aug 26 | A$38.05 | – | – | – | |||||||||||||||||||||||||||
LTIP | 2-Nov-20 | 68,748 | – | – | – | 68,748 | Aug 25 | A$33.81 | – | – | – | |||||||||||||||||||||||||||
MAP | 21-Aug-20 | 23,790 | – | – | – | 23,790 | Aug 24 | A$38.36 | – | – | – | |||||||||||||||||||||||||||
MAP | 21-Aug-20 | 23,790 | – | 23,790 | – | – | 25 Aug 23 | A$38.36 | A$43.02 | A$1,023 | – | |||||||||||||||||||||||||||
167
Table of Contents
| 1 | Where the vesting date is not yet known, the estimated vesting month is shown. Where awards lapsed (if any), the lapse date is shown. If the vesting conditions are met, awards will vest on or as soon as practicable after the first non-prohibited period date occurring after 30 June of the preceding year, subject to the terms of the award. The year of vesting is the second (CDP two-year deferred share awards), third (MAP), fourth (MAP) or fifth (MAP, CDP five-year deferred share awards and LTIP) financial year after grant. All awards are conditional awards and have no exercise period or exercise price; instead, ordinary fully paid shares are automatically allocated upon vesting (subject to a discretion to provide cash in lieu). Where vesting conditions are not met, the conditional awards will immediately lapse. |
| 2 | The market price shown is the closing price of BHP shares on the relevant date of grant. No price is payable by the individual to receive a grant of awards. The IFRS fair value of the CDP and LTIP awards granted in FY2024 at the grant date of 8 November 2023 are as follows: CDP – A$45.95 and LTIP – A$30.33. |
| 3 | The market price shown is the closing price of BHP shares on the relevant date of vest. |
| 4 | The gain on awards is calculated using the market price on date of vesting or exercise (as applicable) less any exercise price payable. The amounts that vested for the awards during FY2024 are as follows: CDP – 100 per cent vested; LTIP – 100 per cent vested; MAP – 100 per cent vested. |
| 5 | Awards shown as held by Edgar Basto, David Lamont and Ragnar Udd at 30 June 2024 are their balances at the date they ceased being KMP, being 29 February 2024. |
| 6 | The opening balances of awards for Brandon Craig and Vandita Pant reflect their holdings on the date that each became KMP, being 1 March 2024. |
5.3 Estimated value range of equity awards
The current face value (and estimate of the maximum possible total value) of equity awards allocated during FY2024 and yet to vest are the awards as set out in the previous table multiplied by the current share price of BHP Group Limited. The minimum possible total value of the awards is nil. The actual value that may be received by participants in the future cannot be determined as it is dependent on and therefore fluctuates with the share price of BHP Group Limited at the date that any particular award vests or is exercised.
Five-year share price, dividend and earnings history
The table below provides the five-year share price history for BHP Group Limited, history of dividends paid and the Group’s earnings.
| FY2024 | FY2023 | FY2022 | FY2021 | FY2020 | ||||||||||||||||
Share price at beginning of year (A$) | 45.26 | 40.05 | 48.22 | 35.82 | 41.68 | |||||||||||||||
Share price at end of year (A$) | 42.68 | 44.99 | 41.25 | 48.57 | 35.82 | |||||||||||||||
Dividends paid (A$) | 2.35 | 3.92 | 10.18 | 1 | 2.07 | 2.13 | ||||||||||||||
Attributable profit (US$ million, as reported) | 7,897 | 12,921 | 30,900 | 11,304 | 7,956 | |||||||||||||||
| 1. | The FY2022 dividends paid includes A$5.38 in respect of the in-specie dividend associated with the merger of the Petroleum business with Woodside. |
The highest and lowest closing share price during FY2024 were A$50.72 and A$41.95 respectively.
168
Table of Contents
5.4 Ordinary shareholdings and transactions
The number of ordinary shares in BHP Group Limited held directly, indirectly or beneficially by each individual (including shares held in the name of all close members of the Director’s or Executive KMP’s family and entities over which either the Director or Executive KMP or the family member has directly or indirectly control, joint control or significant influence) is shown below. No shares are held nominally by any KMP or their related parties. These are ordinary shares held without performance conditions or restrictions and are included in MSR calculations for each individual.
| Held at 1 July 2023 | Purchased | Received as remuneration1 | Sold | Held at 30 June 2024 | ||||||||||||||||
Mike Henry | 677,218 | – | 248,435 | 515,652 | 410,001 | |||||||||||||||
Edgar Basto2 | 146,806 | – | 62,253 | 22,560 | 186,499 | |||||||||||||||
Brandon Craig3 | 25,665 | – | – | – | 25,665 | |||||||||||||||
David Lamont2 | 86,235 | – | 21,932 | 45,000 | 63,167 | |||||||||||||||
Vandita Pant3 | 170,688 | – | – | – | 170,688 | |||||||||||||||
Geraldine Slattery4 | 164,088 | – | 60,223 | 29,300 | 195,011 | |||||||||||||||
Ragnar Udd2 | 131,559 | – | 42,205 | 42,205 | 131,559 | |||||||||||||||
Terry Bowen5 | 11,000 | – | – | – | 11,000 | |||||||||||||||
Xiaoqun Clever-Steg | 8,539 | – | – | – | 8,539 | |||||||||||||||
Ian Cockerill5 | 14,299 | – | – | – | 14,299 | |||||||||||||||
Gary Goldberg4 | 16,000 | 2,000 | – | – | 18,000 | |||||||||||||||
Michelle Hinchliffe | 8,508 | 1,599 | – | – | 10,107 | |||||||||||||||
Don Lindsay6 | – | – | – | – | – | |||||||||||||||
Ken MacKenzie | 58,446 | – | – | – | 58,446 | |||||||||||||||
Ross McEwan6 | – | – | – | – | – | |||||||||||||||
Christine O’Reilly | 9,420 | – | – | – | 9,420 | |||||||||||||||
Catherine Tanna | 10,400 | – | – | – | 10,400 | |||||||||||||||
Dion Weisler | 7,544 | – | – | – | 7,544 | |||||||||||||||
| 1 | Includes DEP in the form of shares on equity awards vesting, where applicable, as disclosed in 5.2 Equity awards. |
| 2 | Shares shown as held by Edgar Basto, David Lamont and Ragnar Udd at 30 June 2024 are their balances at the date they ceased being KMP on 29 February 2024. |
| 3 | The opening balances for Brandon Craig and Vandita Pant reflect their shareholdings on the date that each became KMP being 1 March 2024. |
| 4 | The following BHP Group Limited shares were held in the form of American Depositary Shares: 2,042 for Geraldine Slattery and 9,000 for Gary Goldberg. |
| 5 | Shares shown as held by Terry Bowen and Ian Cockerill at 30 June 2024 are their balances at the date of their retirement from the Board on 1 November 2023 and 4 April 2024, respectively. |
| 6 | The opening balances for Don Lindsay and Ross McEwan reflect their shareholdings on the date they became Non-executive Directors being 1 May 2024 and 3 April 2024, respectively. |
5.5 Prohibition on hedging of BHP shares and equity instruments
The Executive KMP may not use unvested BHP equity awards as collateral or hedge the value of any unvested BHP equity awards or the value of shares and securities held as part of meeting the MSR.
Any securities that have vested and are no longer subject to restrictions, or not held as part of meeting the MSR, may be subject to hedging arrangements or used as collateral, provided that prior consent is obtained.
5.6 Share ownership guidelines and the MSR
The share ownership guidelines and the MSR help to ensure the interests of Directors, executives and shareholders remain aligned.
The CEO and other Executive KMP are expected to grow their holdings to the MSR from the scheduled vesting of their employee awards over time. The MSR is tested at the time that shares are to be sold. Shares may be sold to satisfy tax obligations arising from the granting, holding, vesting, exercise or sale of the employee awards or the underlying shares whether the MSR is satisfied at that time or not.
169
Table of Contents
For FY2024:
| • | The MSR for the CEO was five times annual pre-tax base salary. At the end of FY2024, the CEO met the MSR. |
| • | The MSR for other Executive KMP was three times annual pre-tax base salary. At the end of FY2024, the other Executive KMP met the MSR except for Brandon Craig, as he was appointed to the ELT and as Executive KMP on 1 March 2024. |
| • | No Executive KMP sold or purchased shares during FY2024, other than sales to satisfy taxation obligations, except for Mike Henry, who sold shares due to marital divorce, including reorganisation of holdings, and Ragnar Udd, who sold shares in order to partially fund the purchase of a residential dwelling. |
A two-year post-retirement shareholding requirement for the CEO applies from the date of retirement, which will be the lower of the CEO’s MSR or the CEO’s actual shareholding at the date of retirement.
Subject to securities dealing constraints, Non-executive Directors have agreed to apply at least 25 per cent of their remuneration (base fees plus Committee fees) to the purchase of BHP shares until they achieve an MSR equivalent in value to one year of remuneration (base fees plus Committee fees). Thereafter, they must maintain at least that level of shareholding throughout their tenure. At the end of FY2024, each Non-executive Director met the MSR except for Don Lindsay and Ross McEwan, as they joined the Board on 1 May 2024 and 3 April 2024, respectively.
5.7 Transactions with KMP
During the financial year, there were no transactions between the Group and its subsidiaries and KMP (including their related parties) (2023: US$ nil; 2022: US$ nil). There were no amounts payable by or loans with KMP (including their related parties) at 30 June 2024 (2023: US$ nil; 2022: US$ nil).
A number of KMP hold or have held positions in other companies (i.e. personally related entities) where it is considered they control or significantly influence the financial or operating policies of those entities. There have been no transactions with those entities and no amounts were owed by the Group to personally related entities or any other related parties (2023: US$ nil; 2022: US$ nil).
This Remuneration Report was approved by the Board on 27 August 2024 and signed on its behalf by:
| /s/ Christine O’Reilly |
| Christine O’Reilly |
| Chair, People and Remuneration Committee |
| 27 August 2024 |
170
Table of Contents
Financial Statements
Refer to the pages beginning on page F-1 in this Annual Report.
171
Table of Contents
Additional information
1 Information on mining operations
Minerals Australia
Iron ore mining operations
The following table contains additional details of our iron ore mining operations. This table should be read in conjunction with OFR 5.1 and the production table and reserves and resources tables in Additional information 4 and 6.
Mine & location | ||
WAIO | Pilbara region, Western Australia
Newman West (Mt Whaleback, Orebodies 29, 30, 31 and 35)
Newman East (Orebodies 24, 25 and 32) | |
Mt Newman joint venture | ||
| Means of access | Private road
Ore transported by Mt Newman JV-owned rail to Port Hedland (427 km) | |
| Type and amount of ownership | BHP Minerals 85%
Mitsui-ITOCHU Iron 10%
ITOCHU Minerals and Energy of Australia 5% | |
| Operator | BHP | |
| Title, leases or options and acreage involved | Mineral lease granted and held under the Iron Ore (Mount Newman) Agreement Act 1964 expires in 2030 with right to successive renewals of 21 years each
ML244SA – approximately 78,934 hectares | |
| History and stage of property | Production stage
Production began at Mt Whaleback in 1969
Production from Orebodies 24, 25, 29, 30, 31, 32 and 35 complements production from Mt Whaleback
Production from Orebodies 31 and 32 started in 2015 and 2017 respectively
Mining at Orebody 18 ceased in 2020 after depletion | |
| Mine type & mineralisation style | Open-cut
Bedded ore types classified as per host Archaean or Proterozoic iron formation, which are Brockman and Marra Mamba; also present is iron-rich detrital material | |
| Power source | Power for all mine operations in the Central and Eastern Pilbara is supplied by BHP’s natural gas-fired Yarnima power station
Power consumed in port operations is supplied via a contract with APA Group (formerly Alinta) | |
| Processing plants and other available facilities | Newman Hub: primary crusher, ore handling plant, heavy media beneficiation plant, stockyard blending facility, single cell rotary car dumper, train load out (nominal capacity 75 Mtpa)
Orebody 25: Ore processing plant (nominal capacity 12 Mtpa) ceased operation mid-FY2022 | |
Key permit conditions | State Agreement contains conditions set by the Western Australian Government, including requirements for future development proposals; environmental compliance and reporting obligations; closure and rehabilitation considerations; local procurement and community plans/initiatives/investment requirements; payment of rent, taxes and government royalties
Tenements granted by the Western Australian Government under the Mining Act 1978 (WA) (WA Mining Act)
Key permit conditions include resource reporting, environmental compliance and reporting, rehabilitation considerations and offset payments and payment of lease rentals and royalties
Registered Indigenous Land Use Agreements with conditions, including appropriate native title compensation and opportunity sharing; enshrine heritage protections and land access rights; and guarantee certain heritage, environment and consultation processes | |
172
Table of Contents
Mine & location | ||
| WAIO | Pilbara region, Western Australia | |
| Yandi joint venture | ||
| Means of access | Private road
Ore transported by Mt Newman JV-owned rail to Port Hedland (316 km)
Yandi JV’s railway spur links Yandi hub to Mt Newman JV main line | |
| Type and amount of ownership | BHP Minerals 85%
ITOCHU Minerals and Energy of Australia 8%
Mitsui Iron Ore Corporation 7% | |
| Operator | BHP | |
| Title, leases or options and acreage involved | Mining lease granted pursuant to the Iron Ore (Marillana Creek) Agreement Act 1991 expires in 2033 with 1 renewal right to a further 21 years to 2054
M270SA – approximately 30,344 hectares | |
| History and stage of property | Production stage
Production began at the Yandi mine in 1992
Capacity of Yandi hub expanded between 1994 and 2013
Yandi commenced production ramp down activity in FY2022 | |
| Mine type & mineralisation style | Open-cut
Channel iron deposits are Cainozoic fluvial sediments | |
| Power source | Power for all mine operations in the Central and Eastern Pilbara is supplied by BHP’s natural gas-fired Yarnima power station
Power consumed in port operations is supplied via a contract with APA Group (formerly Alinta) | |
| Processing plants and other available facilities | 2 primary crushers, 1 ore handling plant, stockyard blending facility and 1 train load out (nominal capacity 50 Mtpa)
Decommissioning of additional facilities, including 2 ore handling plants, 2 primary crushers and 1 train load out, is ongoing as part of planned ramp down activities | |
| Key permit conditions | State Agreement contains conditions set by the Western Australian Government, including requirements for future development proposals; environmental compliance and reporting obligations; closure and rehabilitation considerations; local procurement and community plans/initiatives/investment requirements; payment of rent, taxes and government royalties
Tenements granted by the Western Australian Government under the WA Mining Act
Key permit conditions include resource reporting, environmental compliance and reporting, rehabilitation considerations and offset payments and payment of lease rentals and royalties
Registered Indigenous Land Use Agreements with conditions, including appropriate native title compensation and opportunity sharing; enshrine heritage protections and land access rights; and guarantee certain heritage, environment and consultation processes | |
173
Table of Contents
Mine & location | ||
| WAIO | Pilbara region, Western Australia
Jimblebar
Bill’s Hill, Eastern Syncline and Mt Helen (jointly called Western Ridge deposits) | |
| Jimblebar operation* | ||
| Means of access | Private road
Jimblebar ore is transported via overland conveyor (12.4 km) and by Mt Newman JV-owned rail to Port Hedland (428 km)
The Western Ridge deposits are located close to Newman Operations and all production will be trucked and/or transported via overland conveyor | |
| Type and amount of ownership | BHP Minerals 85%
ITOCHU Minerals and Energy of Australia 8%
Mitsui & Co. Iron Ore Exploration & Mining 7%
*Jimblebar is an ‘incorporated’ venture with the above companies holding A Class Shares with rights to certain parts of mining lease 266SA held by BHP Iron Ore (Jimblebar) Pty Ltd (BHPIOJ)
BHP Minerals holds 100% of the B Class Shares, which has rights to all other Jimblebar assets | |
| Operator | BHP | |
| Title, leases or options and acreage involved | Mining lease granted pursuant to the Iron Ore (McCamey’s Monster) Agreement Authorisation Act 1972 expires in 2030 with rights to successive renewals of 21 years each
M266SA – approximately 51,756 hectares | |
| History and stage of property | Production stage
Production began in March 1989
From 2004, production was transferred to Wheelarra JV as part of the Wheelarra sublease agreement
This sublease agreement expired in March 2018
Ore was first produced from the newly commissioned Jimblebar Hub in late 2013
Jimblebar sells ore to the Newman JV proximate to the Jimblebar Hub
Production at Western Ridge commenced in FY2022 | |
| Mine type & mineralisation style | Open-cut
Bedded ore types classified as per host Archaean or Proterozoic banded iron formation, which are Brockman and Marra Mamba; also present is iron-rich detrital material | |
| Power source | Power for all mine operations in the Central and Eastern Pilbara is supplied by BHP’s natural gas-fired Yarnima power station
Power consumed in port operations is supplied via a contract with APA Group (formerly Alinta) | |
| Processing plants and other available facilities | 3 primary crushers, ore handling plant, train loadout, stockyard blending facility and supporting mining hub infrastructure (nominal capacity 71 Mtpa)
Production from the Western Ridge deposits will be processed through existing processing facility for Newman operations | |
| Key permit conditions | State Agreement contains conditions set by the Western Australian Government, including requirements for future development proposals; environmental compliance and reporting obligations; closure and rehabilitation considerations; local procurement and community plans/initiatives/investment requirements; payment of rent, taxes and government royalties
Tenements granted by the Western Australian Government under the WA Mining Act
Key permit conditions include resource reporting, environmental compliance and reporting, rehabilitation considerations and offset payments and payment of lease rentals and royalties
Registered Indigenous Land Use Agreement with conditions, including appropriate native title compensation and opportunity sharing; enshrine heritage protections and land access rights; and guarantee certain heritage, environment and consultation processes | |
174
Table of Contents
Mine & location | ||
| ||
| WAIO | Pilbara region, Western Australia
Yarrie
Nimingarra
Mining Area C
South Flank | |
| Mt Goldsworthy joint venture | ||
| Means of access | Private road
Yarrie and Nimingarra iron ore transported by Mt Goldsworthy JV-owned rail to Port Hedland (218 km)
Mining Area C iron ore transported by Mt Newman JV-owned rail to Port Hedland (360 km)
South Flank iron ore transported by overland conveyors (8–16 km) to the Mining Area C processing hub
Mt Goldsworthy JV railway spur links Mining Area C and South Flank to Yandi JV’s railway spur | |
| Type and amount of ownership | BHP Minerals 85%
Mitsui Iron Ore Corporation 7%
ITOCHU Minerals and Energy of Australia 8% | |
| Operator | BHP | |
| Title, leases or options and acreage involved | 1 mineral lease and 1 mining lease both granted pursuant to the Iron Ore (Goldsworthy – Nimingarra) Agreement Act 1972, expire in 2035, with rights to successive renewals of 21 years each. ML251SA and M263SA – approximately 15,623 hectares
A number of smaller mining leases granted under the WA Mining Act expire in 2026 with rights to successive renewals of 21 years. 5 leases – approximately 2,999 hectares
3 mineral leases granted under the Iron Ore (Mount Goldsworthy) Agreement Act 1964, which expire 2028, with rights to successive renewals of 21 years each
ML235SA, ML249SA and ML281SA – approximately 91,124 hectares | |
| History and stage of property | Production stage
Operations commenced at Mt Goldsworthy in 1966 and at Shay Gap in 1973
Original Goldsworthy mine closed in 1982
Associated Shay Gap mine closed in 1993
Mining at Nimingarra mine ceased in 2007, then continued from adjacent Yarrie area
Production commenced at Mining Area C mine in 2003
Yarrie mine operations were suspended in February 2014
First ore at South Flank commenced in May 2021 | |
| Mine type & mineralisation style | Mining Area C, South Flank, Yarrie and Nimingarra are open-cut
Bedded ore types classified as per host Archaean or Proterozoic iron formation, which are Brockman, Marra Mamba and Nimingarra; also present is iron-rich detrital material | |
| Power source | Power for Yarrie and Shay Gap is supplied by their own small diesel generating stations
Power for all remaining mine operations in the Central and Eastern Pilbara is supplied by BHP’s natural gas-fired Yarnima power station
Power consumed in port operations is supplied via a contract with APA Group (formerly Alinta) | |
| Processing plants and other available facilities | Mining Area C: 2 primary crushers, 2 ore handling plants, stockyard blending facility and train load out (nominal capacity 64 Mtpa)
South Flank: 2 primary crushers, 1 ore handling plant, stockyard and blending facility and train load out (nominal capacity 80 Mtpa) | |
175
Table of Contents
| Key permit conditions | State Agreements contain conditions set by the Western Australian Government, including requirements for future development proposals; environmental compliance and reporting obligations; closure and rehabilitation considerations; local procurement and community plans/initiatives/investment requirements; payment of rent, taxes and government royalties
Tenements granted by the Western Australian Government under the WA Mining Act
Key permit conditions include resource reporting, environmental compliance and reporting, rehabilitation considerations and offset payments and payment of lease rentals and royalties
Registered Indigenous Land Use Agreements with conditions, including appropriate native title compensation and opportunity sharing; enshrine heritage protections and land access rights; and guarantee certain heritage, environment and consultation processes |
Mine & location | ||
| WAIO | Pilbara region, Western Australia | |
| POSMAC joint venture | ||
| Means of access | Private road
POSMAC JV sells ore to Mt Goldsworthy JV at Mining Area C
Ore is transported via Mt Goldsworthy JV-owned rail and Mt Newman JV-owned rail to Port Hedland
Mt Goldsworthy JV railway spur links Mining Area C to Yandi JV’s railway spur | |
| Type and amount of ownership | BHP Minerals 65%
ITOCHU Minerals and Energy of Australia 8%
Mitsui Iron Ore Corporation 7%
POS-Ore 20% | |
| Operator | BHP | |
| Title, leases or options and acreage involved | Sublease over part of Mt Goldsworthy Mining Area C mineral lease that expires on the earlier of termination of the mineral lease or the end of the POSMAC JV
ML281SA – approximately 56,335 hectares | |
| History and stage of property | Production stage
Production commenced in October 2003
POSMAC JV sells all ore to Mt Goldsworthy JV at Mining Area C | |
| Mine type & mineralisation style | Open-cut
Bedded ore types classified as per host Archaean or Proterozoic iron formation, which is Marra Mamba | |
| Power source | Power for all mine operations in the Central and Eastern Pilbara is supplied by BHP’s natural gas-fired Yarnima power station
Power consumed in port operations is supplied via a contract with APA Group (formerly Alinta) | |
| Processing plants and other available facilities | POSMAC sells all ore to Mt Goldsworthy JV, which is then processed at Mining Area C | |
| Key permit conditions | Key permit conditions of POSMAC joint venture are captured within the Mount Goldsworthy joint venture key permit conditions outlined above | |
176
Table of Contents
Coal mining operations
The following table includes details about our mining operations as at 30 June 2024. It does not include information on the Daunia and Blackwater coal mining operations, which were divested by BMA’s owners during the year. While some of the land and tenements related to the Daunia and Blackwater mines is pending transfer following completion in April 2024, the assets are now under Whitehaven Coal’s control and operated for their benefit and have been excluded on that basis.
This table should be read in conjunction with OFR 5.1 and the production table and reserves and resources tables in Additional information 4 and 6.
Mine & location | ||
| BHP Mitsubishi Alliance | Bowen Basin, Queensland, Australia
Goonyella Riverside
Broadmeadow
Caval Ridge
Peak Downs
Saraji and Saraji South mines | |
| Central Queensland Coal Associates joint venture | ||
| Means of access | Public road
Coal transported by rail to Hay Point Coal Terminal
Distances between the mines and port are between 191 km and 212 km | |
| Type and amount of ownership | BHP 50%
Mitsubishi Development 50% | |
| Operator | BMA | |
| Title, leases or options and acreage involved | Mining leases, including undeveloped tenements, have expiry dates ranging up to 2045, renewable for further periods as Queensland Government legislation allows
Approximately 79,752 hectares excluding the tenements pending transition to Whitehaven Coal
Mining is permitted to continue under the legislation during the renewal application period
All required renewal applications were lodged and pending a decision from the Minister | |
| History and stage of property | Production stage
Goonyella mine commenced in 1971, merged with adjoining Riverside mine in 1989
Operates as Goonyella Riverside
Production commenced at:
Peak Downs in 1972
Saraji in 1974
Norwich Park in 1979
Broadmeadow (longwall operations) in 2005
Caval Ridge in 2014
Production at Saraji South (formerly Norwich Park) ceased in May 2012. Since October 2022, limited product has been sourced from Saraji South for processing at Saraji | |
| Mine type & mineralisation style | All open-cut except Broadmeadow (longwall underground)
Bituminous coal is mined from the Permian Moranbah Coal measures
Products range from premium-quality, low-volatile, high-vitrinite hard coking coal to medium-volatile hard coking coal, to weak coking coal and medium ash thermal coal as a secondary product | |
| Power source | Queensland electricity grid connection is under long-term contracts and energy purchased via Retail Agreements | |
177
Table of Contents
| Processing plants and other available facilities | On-site beneficiation processing facilities
Combined nominal capacity of 50 Mtpa | |
| Key permit conditions | Key permit conditions are contained in the various legislation set by the Queensland Government and include conditions relating to carrying out works in accordance with the environmental authority and approved development plans, payment of rents, reporting and payment of royalties. Mining leases granted under the Central Queensland Coal Associates Agreement Act 1968 place an extraction cap of 1,860 Mt |
Mine & location | ||
| New South Wales Energy Coal | Approximately 126 km northwest of Newcastle, New South Wales, Australia | |
| Mt Arthur Coal | ||
| Means of access | Public road
Coal transported by third-party rail | |
| Type and amount of ownership | BHP 100% | |
| Operator | BHP | |
| Title, leases or options and acreage involved | New South Wales Energy Coal holds 10 mining leases, 2 subleases and 1 exploration licence
Total mining leases approximately 8,750 hectares | |
| History and stage of property | Production stage
Production commenced in 2002 (previous operations dating to the early 1960s)
Approval to expand mining granted in 2010 with an additional area also granted by an approval modification in 2014
Current Development Consent expires in 2026
On 16 June 2022, BHP announced the decision to cease mining at the asset by the end of FY2030
The application to continue mining for an additional 4 years from FY2026 to FY2030 was lodged with the New South Wales Government in September 2023 and is currently under assessment | |
| Mine type & mineralisation style | Open-cut
Produces a medium rank bituminous thermal coal | |
| Power source | New South Wales electricity grid connection under a deemed long-term contract and energy purchased via a Retail Agreement | |
| Processing plants and other available facilities | Beneficiation facilities: coal handling, preparation, washing plants
Nominal capacity in excess of 23 Mtpa | |
| Key permit conditions | The project approval contains key conditions: (i) it requires MAC to be operated generally in accordance with the environmental assessment; and (ii) permits extraction of up to 36 Mtpa of run of mine coal from underground and open-cut operations, with open-cut extraction limited to 32 Mtpa | |
178
Table of Contents
Nickel mining operations
The following table contains additional details of our mining operations. This table should be read in conjunction with OFR 5.1 and the production table and reserves and resources tables in Additional information 4 and 6.
Mine & location | ||
| Nickel West | 450 km north of Kalgoorlie, Western Australia
Mt Keith Mine
Mt Keith Satellite Mine (Yakabindie) | |
| Mt Keith mine and concentrator | ||
| Means of access | Private road
Nickel concentrate transported by road to Leinster for drying and on-shipping | |
| Type and amount of ownership | BHP 100% | |
| Operator | BHP | |
| Title, leases or options and acreage involved | Mining leases granted by Western Australian Government
Key leases expire between 2029 and 2036
First renewal of 21 years is as a right. Further renewals at government discretion
Mt Keith mining leases approximately 9,240 hectares
Mt Keith satellite mining leases approximately 3,835 hectares | |
| History and stage of property | Production stage
Commissioned in 1995 by WMC
Acquired in 2005 as part of WMC acquisition
Mt Keith Satellite Mine contains 2 open-pit mines: Six Mile Well and Goliath, both in full production
Nickel West operations will be temporarily suspended from October 2024 | |
| Mine type & mineralisation style | Open-cut
Disseminated textured magmatic nickel-sulphide mineralisation associated with a metamorphosed ultramafic intrusion | |
| Power source | On-site third-party gas-fired turbines and renewable solar generation with backup from diesel engine generation
Contracts expire in December 2038
Natural gas sourced and transported under separate long-term contracts | |
| Processing plants and other available facilities | Concentration plant with a nominal capacity of 11 Mtpa of ore | |
| Key permit conditions | Use of the land for the purposes set out by the Western Australian Government under granted mining tenements and broadly comprise of submission of detailed mining proposals; payment of royalties, annual rent to the State Government; rates to relevant local governments; compliance with environmental regulations and mine closure requirements and other reporting obligations. Existing mining operations are also subject to an Indigenous Land Use Agreement (ILUA), which includes commitments for payments made to trust accounts; Indigenous employment and business opportunities; heritage and cultural protections | |
179
Table of Contents
Mine & location | ||
| Nickel West | 375 km north of Kalgoorlie, Western Australia
Venus sub-level caving operation
B11 block caving operation
Camelot open-pit mine
Rocky’s Reward open-pit mine | |
| Leinster mine complex and concentrator | ||
| Means of access | Public road
Nickel concentrate shipped by road and rail to Kalgoorlie Nickel Smelter | |
| Type and amount of ownership | BHP 100% | |
| Operator | BHP | |
| Title, leases or options and acreage involved | Mining leases granted by Western Australian Government
Key leases expire between 2025 and 2040
Renewals of principal mineral lease in accordance with State Agreement ratified by the Nickel (Agnew) Agreement Act 1974
Leinster mining leases approximately 6,325 hectares
Camelot mining leases approximately 2,353 hectares | |
| History and stage of property | Production stage
Production commenced in 1979
Acquired in 2005 as part of WMC acquisition
Leinster underground ceased operations in 2013 and recommenced operations in 2016 with Venus sub-level cave now in operation and B11 block cave developing its undercut and draw points
Rocky’s Reward open-pit mine ceased mining in 2021
Nickel West operations will be temporarily suspended from October 2024 | |
| Mine type & mineralisation style | Open-cut and underground
Steeply dipping disseminated and massive textured nickel-sulphide mineralisation associated with metamorphosed ultramafic lava flows and intrusions | |
| Power source | On-site third-party gas-fired turbines and renewable solar generation with back up from diesel engine generation
Contracts expire in December 2038
Natural gas sourced and transported under separate long-term contracts | |
| Processing plants and other available facilities | Concentration plant with a nominal capacity of 3 Mtpa of ore | |
| Key permit conditions | Use of the land for the purposes set out by the Western Australian Government in the Nickel (Agnew) Agreement Act 1974 broadly comprise of submission of detailed mining proposals and additional proposals; payment of royalties, annual rent to Western Australian Government; rates to relevant local governments; compliance with environmental regulations and mine closure requirements and other reporting obligations. Existing mining operations are also subject to an Indigenous Land Use Agreement (ILUA), which includes commitments for payments made to trust accounts; Indigenous employment and business opportunities; heritage and cultural protections | |
180
Table of Contents
Mine & location | ||
| Nickel West | 450 km north of Kalgoorlie, Western Australia | |
| Cliffs mine | ||
| Means of access | Private road
Nickel ore transported by road to Leinster or Mt Keith for further processing | |
| Type and amount of ownership | BHP 100% | |
| Operator | BHP | |
| Title, leases or options and acreage involved | Mining leases granted by Western Australian Government
Key leases expire between 2025 and 2028
First renewal of 21 years is as of right. Further renewals at government discretion
Mining leases approximately 2,675 hectares | |
| History and stage of property | Production stage
Production commenced in 2008
Acquired in 2005 as part of WMC acquisition
Nickel West operations will be temporarily suspended from October 2024 | |
| Mine type & mineralisation style | Underground
Steeply dipping massive textured nickel-sulphide mineralisation associated with metamorphosed ultramafic lava flows | |
| Power source | Supplied from Mt Keith | |
| Processing plants and other available facilities | Mine site | |
| Key permit conditions | Use of the land for the purposes set out by the Western Australian Government under granted mining tenements and broadly comprise of submission of detailed mining proposals; payment of royalties, annual rent to the State Government; rates to relevant local government; compliance with environmental regulations and mine closure requirements and other reporting obligations. Existing mining operations are also subject to an Indigenous Land Use Agreement (ILUA), which includes commitments for payments made to trust accounts; Indigenous employment and business opportunities; heritage and cultural protections | |
181
Table of Contents
Mine & location | ||
| West Musgrave Project | Musgrave Province, Western Australia | |
| Means of access | Public road | |
| Type and amount of ownership | BHP 100% | |
| Operator | BHP | |
| Title, leases or options and acreage involved | The Project contemplates 2 copper and nickel deposits (Babel pit and Nebo pit) within the West Musgrave Ranges of Western Australia
M69/149, L69/56, L69/57 and L69/44
Development Envelope of 20,852 hectares | |
| History and stage of property | Scoping studies completed in 2017
Pre-feasibility study completed by OZ Minerals and Cassini Resources Ltd in 2020
Acquired by OZ Minerals in October 2020
Final investment decision in September 2022
Acquired in 2023 as part of OZ Minerals acquisition
West Musgrave Project will be temporarily suspended from October 2024 | |
| Mine type & mineralisation style | Open-pit (still in project stage)
Magmatic nickel and copper sulphide | |
| Power source | Long-term power expected to be delivered by an off-grid hybrid power system (wind, solar, battery and thermal generation) | |
| Processing plants and other available facilities | Crushing, vertical roller mill, flotation producing separate nickel and copper concentrates (still in project stage) | |
| Key permit conditions | All key regulatory approvals in place and a Land access agreement signed with the Ngaanyatjarra people to develop 2 copper and nickel deposits (Babel pit and Nebo pit) within the West Musgrave Ranges (including mining, accommodation, an airstrip and processing facilities)
There are a number of strict conditions on cultural heritage, flora and fauna, inland waters and greenhouse gas, including:
• no more than 3,830 hectares clearing of native vegetation
• achieving net zero greenhouse gas emissions by 2040, including up to 60 megawatts (instantaneous load requirement) of fossil fuel electricity generation with the remainder of the power supply to be generated through solar or wind electricity generation
• abstraction of up to 7.5 gigalitres of groundwater per annum
• compliance with the Cultural Heritage Management Plan, including no direct disturbance of the ethnographic exclusion zones | |
Nickel smelters, refineries and processing plants
Smelter, refinery or processing plant | ||
| Nickel West | 56 km south of Kalgoorlie, Western Australia | |
| Kambalda nickel concentrator | ||
| Ownership | BHP 100% | |
Operator | BHP | |
| Title, leases or options | Mineral leases granted by Western Australian Government
Key leases expire in 2028
Mining leases approximately 242 hectares | |
182
Table of Contents
| Key permit conditions | Use of the land for the purposes set out by the Western Australian Government under granted mining tenements and broadly comprise of submission of detailed mining proposals; payment of royalties, annual rent to the State Government; rates to relevant local government; compliance with environmental regulations and mine closure requirements and other reporting obligations | |
| Product | Concentrate containing approximately 13% nickel | |
| Power source | On-site third-party gas-fired turbines supplemented by access to grid power
Contracts expire in December 2038
Natural gas sourced and transported under separate long-term contracts | |
| Nominal production capacity | 1.6 Mtpa ore
Nickel sourced through ore tolling and concentrate purchase arrangements with third parties in Kambalda and outer regions |
Smelter, refinery or processing plant | ||
| Nickel West | Kalgoorlie, Western Australia | |
| Kalgoorlie nickel smelter | ||
| Ownership | BHP 100% | |
| Operator | BHP | |
| Title, leases or options | Freehold title over the property | |
| Key permit conditions | ||
| Product | Matte containing approximately 65% nickel | |
| Power source | On-site third-party gas-fired turbines supplemented by access to grid power
Contracts expire in December 2038
Natural gas sourced and transported under separate long-term contracts | |
| Nominal production capacity | 110 ktpa nickel metal in matte | |
Smelter, refinery or processing plant | ||
| Nickel West | 30 km south of Perth, Western Australia | |
| Kwinana nickel refinery | ||
| Ownership | BHP 100% | |
| Operator | BHP | |
| Title, leases or options | Freehold title over the property | |
| Key permit conditions | ||
| Product | London Metal Exchange grade nickel briquettes, nickel powder
Also intermediate products, including copper sulphide, cobalt-nickel-sulphide, ammonium sulphate
Nickel sulphate containing approximately 22% nickel | |
| Power source | Power is sourced from the local grid, which is supplied under a retail contract, supplemented by a Power Purchase Agreement with Merredin Solar Farm for 50% of its output | |
| Nominal production capacity | 82.5 ktpa nickel metal in powder, briquettes and nickel sulphate (with approval to increase up to 90 ktpa)
99 kt–100 kt nickel sulphate (approximately 22 kt–24 kt nickel) | |
183
Table of Contents
Copper South Australia
Copper mining operations
The following table contains additional details of our mining operations. This table should be read in conjunction with OFR 5.1 and 5.2, and the production table and reserves and resources tables in Additional information 4 and 6.
Mine & location | ||
| Olympic Dam | 560 km northwest of Adelaide, South Australia | |
| Means of access | Public road
Copper cathode trucked to ports
Uranium oxide transported by road to ports
Gold bullion transported by road and plane | |
| Type and amount of ownership | BHP 100% | |
| Operator | BHP | |
| Title, leases or options and acreage involved | Mining lease granted by South Australian Government expires in 2036
Approximately 17,788 hectares
Right of extension for 50 years (subject to remaining mine life) | |
| History and stage of property | Production stage
Acquired in 2005 as part of Western Mining Corporation (WMC) acquisition
Copper production began in 1988
Nominal milling capacity raised to 9 Mtpa in 1999
Optimisation project completed in 2002
New copper solvent extraction plant commissioned in 2004
Major smelter maintenance campaigns completed in 2017 and 2022 | |
| Mine type & mineralisation style | Underground
Large poly-metallic deposit of iron oxide-copper-uranium-gold mineralisation | |
| Power source | Electricity transmitted via BHP’s 275 kV power line from Port Augusta and ElectraNet’s system upstream of Port Augusta
Power is sourced from the local grid, which is supplied under a retail contract, currently supplemented by Power Purchase Agreement with Iberdrola | |
| Processing plants and other available facilities | Underground automated train and trucking network feeding crushing, storage and ore hoisting facilities
2 grinding circuits
Nominal milling capacity of 11 Mtpa
Flash furnace produces copper anodes, which are then refined to produce copper cathodes
Electrowon copper cathode and uranium oxide concentrate produced by leaching and solvent extracting flotation tailings
Gold cyanide leach circuit and gold room producing gold bullion | |
| Key permit conditions | The Roxby Downs (Indenture Ratification) Act 1982 (Indenture Act) applies to Olympic Dam’s operations. It contains conditions from the South Australian Government, including relating to the protection and management of the environment; water; closure and rehabilitation considerations; local procurement and community plans/initiatives/project commitments; and payment of royalties. Olympic Dam also holds other relevant approvals and tenements granted by the South Australian Government, including under the Mining Act 1971 (SA) |
184
Table of Contents
Mine & location | ||
| Carrapateena | The Gawler Craton, South Australia, approximately 160 km north of Port Augusta | |
| Means of access | 60 km private access road
Copper concentrate trucked to ports | |
| Type and amount of ownership | BHP 100% | |
| Operator | BHP | |
| Title, leases or options and acreage involved | The Carrapateena Project holds a mining lease (ML 6471) and 5 miscellaneous purposes licences (MPL 149, 152, 153, 154 and 156), which were granted by the South Australian Government and expire in January 2039, with the exception of MPL 149 which expires in July 2038
Approximately 44,144 hectares in size across all 6 tenements
An application for tenement extensions can be made within 6 months of the tenement expiry date | |
| History and stage of property | 2011 – OZ Minerals acquired Carrapateena exploration project
2014 – Pre-feasibility study completed
2016 – Carrapateena scoping study completed
2017 – Feasibility study updated
2017 – Works on enabling infrastructure commenced
2018 – Project approvals completed
2018 – Construction commenced
2019 – Construction completed
2019 – First saleable concentrate produced
2019 – Block Cave expansion pre-feasibility study commenced
2020 – 4.25 Mtpa ramp up achieved
2020 – Block Cave expansion pre-feasibility study completed
2020 – Block Cave expansion approved
2020 – New 270 km transmission line to Prominent Hill via Carrapateena commissioned
2020 – Early works on Western Access Road commenced
2021 – Block Cave expansion early works underway
2022 – Cave propagated to surface
2023 – Acquired as part of OZ Minerals acquisition
2024 – Commissioning of Crusher Station 2 | |
| Mine type & mineralisation style | Underground
Iron oxide copper gold deposit | |
| Power source | Electricity transmitted via private power line operated under a Build Own Operate Maintain (BOOM) agreement with ElectraNet
Power purchased via Retail Agreement | |
| Processing plants and other available facilities | Conventional crushing, grinding and flotation on mine site
Nominal milling capacity of 5.5 Mt | |
| Key permit conditions | The SA Mining Act and associated Mining Regulations 2020 (SA) apply to the Carrapateena Project. Each tenement document (either ML or MPL) in conjunction with the operation’s Program for Environment Protection and Rehabilitation (PEPR) outlines the conditions from the South Australian Government that must be complied with including those relating to the protection and management of the environment, water, closure and rehabilitation
The Carrapateena Project is also approved by the Federal Government under the Environment Protection and Biodiversity Conservation Act 1999 (EPBC Act) and as such has further conditions regarding nationally threatened flora and fauna species |
185
Table of Contents
Mine & location | ||
| Prominent Hill | 650 km northwest of Adelaide, 130 km southeast of the town of Coober Pedy | |
| Means of access | Mine access road (45 km off Stuart Highway)
Copper concentrate (containing gold and silver) trucked to Wirrida Railway siding via dedicated Concentrate Export Road | |
| Type and amount of ownership | BHP 100% | |
| Operator | BHP | |
| Title, leases or options and acreage involved | Mining lease ML 6228 granted by South Australian Government expires in August 2041
Miscellaneous purpose licences (MPL 81, 82, 83, 84, 91, 93, 94 96, 97, 101, 112 to 117 and 119 to 122) and extractive mineral leases (EML 6234, 6236 to 6242, 6278 to 6296, 6299 to 6301) which were granted by the South Australian Government and expire in August 2041
Approximately 11,401 hectares across all 51 tenements | |
| History and stage of property | 2009 – Malu open-pit mine commissioned
2012 – Ankata underground mine expansion commissioned
2015 – Malu underground mine expansion commissioned
2017 – Expansion of the underground operation with new northern decline (Liru)
2018 – Malu open-pit mine safely closed after more than 100 Mt of ore was mined over 10 years
2019 – Underground ramp up to 4.0 Mt
2019 – Prominent Hill expansion study commenced
2021 – Wira Shaft Mine expansion investment approved
2022 – Decision to increase the electric hoisting shaft’s capacity from 6 Mtpa to 6.5 Mtpa
2023 – Acquired as part of OZ Minerals acquisition | |
| Mine type & mineralisation style | Underground
Iron oxide copper gold deposit | |
| Power source | SA power grid via a high voltage power transmission line operated under a Build Own Operate Maintain agreement
Power purchased via Retail Agreement | |
| Processing plants and other available facilities | Conventional crushing, semi-autogenous grinding (SAG) and ball mill grinding circuit and flotation processing plant on site
Nameplate capacity of 10 Mtpa | |
| Key permit conditions | MPEPR2022/137 Program for Environment Protection and Rehabilitation for Mineral Lease (ML) 6228 and Associated Extractive Minerals Leases and Miscellaneous Purpose Licences
Department for Environment and Water: Water Licences 396811 and 396809
Environment Protection Authority Licence 22764
Environment Protection Authority Licence 51429: Licence to Carry out Mining or Mineral Processing pursuant to Radiation Protection and Control Act 2021 |
186
Table of Contents
Minerals Americas
Copper mining operations
The following table contains additional details of our mining operations. This table should be read in conjunction with OFR 5.3 and the production table and reserves and resources tables in Additional information 4 and 6.
Mine & location | ||
| Escondida | Atacama Desert
170 km southeast of Antofagasta, Chile | |
| Means of access | Private road available for public use
Copper cathode transported by rail to ports at Antofagasta and Mejillones
Copper concentrate transported by Escondida-owned pipelines to its Coloso port facilities
| |
| Type and amount of ownership | BHP 57.5%
Rio Tinto 30%
JECO Corporation consortium comprising Mitsubishi, JX Nippon Mining and Metals 10%
JECO 2 Ltd 2.5% | |
| Operator | BHP | |
| Title, leases or options and acreage involved | Mining concession from Chilean Government valid indefinitely (subject to payment of annual fees)
Mining concessions (exploitation) approximately 380,000 hectares | |
| History and stage of property | Production stage
Original construction completed and production commenced in 1990
Start of operations of the third concentrator plant in 2015
Inauguration of Escondida Water Supply desalination plant (CY2018) and its extension (CY2019) | |
| Key permit conditions | Mining companies in Chile must obtain environmental approvals for their projects, issued by the Environmental Assessment Service (SEA), in order to operate
Depending on the particular characteristics and/or extension of the relevant project to be assessed, approvals can be obtained following a full Environmental Impact Study (EIA) or after a less complex Environmental Impact Declaration (DIA)
Mining companies are required to pay an annual fee for each mining concession | |
| Mine type & mineralisation style | 2 open-cut pits: Escondida and Escondida Norte
Escondida and Escondida Norte mineral deposits are adjacent but distinct supergene enriched porphyry copper deposits | |
| Power source | Electricity sourced from 100% renewable sources and certified by the Chilean Electricity Authority (Coordinador Eléctrico Nacional – CEN)
Renewable power purchase agreements (PPAs) with third parties supply approximately 99% of Escondida electricity needs with the balance supplied by Tamakaya SpA (100% owned by BHP)
Escondida-owned transmission lines connect to Chile’s northern power grid | |
| Processing plants and other available facilities | Crushing facilities feed concentrator and leaching processes
3 concentrator plants produce copper concentrate from sulphide ore by flotation extraction process (by-products: gold and silver)
2 solvent extraction and electrowinning plants produce copper cathode
Nominal capacity: 422 ktpd (nominal milling capacity) and 350 ktpa copper cathode (nominal capacity of tank house)
2 x 168 km concentrate pipelines, 167 km water pipeline
Port facilities at Coloso, Antofagasta
Desalinated water plant (total water capacity of 3,800 litres per second) | |
187
Table of Contents
Mine & location | ||
| Pampa Norte Spence | Atacama Desert
162 km northeast of Antofagasta, Chile | |
| Means of access | Public road
Copper cathode transported by rail to ports at Mejillones and Antofagasta
Copper concentrate transported by rail or trucks to port in Mejillones
Molybdenum concentrate is transported by trucks | |
| Type and amount of ownership | BHP 100% | |
| Operator | BHP | |
| Title, leases or options and acreage involved | Mining concession from Chilean Government valid indefinitely (subject to payment of annual fees)
Mining concessions (exploitation): approximately 44,000 hectares | |
| History and stage of property | Production stage
First copper produced in 2006
Spence Growth Option (i.e. new 95 ktpd copper concentrator and molybdenum plants) produced first copper in December 2020 and first molybdenum in April 2022 | |
| Key permit conditions | Mining companies in Chile must obtain environmental approvals for their projects, issued by the Environmental Assessment Service (SEA), in order to operate
Depending on the particular characteristics and/or extension of the relevant project to be assessed, approvals can be obtained following a full Environmental Impact Study (EIA) or after a less complex Environmental Impact Declaration (DIA)
Mining companies are required to pay an annual fee for each mining concession | |
| Mine type & mineralisation style | Open-cut
Enriched and oxidised porphyry copper deposit containing in situ copper oxide mineralisation that overlies a near-horizontal sequence of supergene sulphides, transitional sulphides and finally primary (hypogene) sulphide mineralisation | |
| Power source | Electricity sourced from 100% renewable sources and certified by the Chilean Electricity Authority (Coordinador Eléctrico Nacional – CEN)
Renewable power purchase agreements (PPAs) with third parties supply most of Spence electricity needs. The remainder is supplied by Tamakaya SpA (100% owned by BHP)
Spence-owned transmission lines connect to Chile’s northern power grid | |
| Processing plants and other available facilities | Crushing facilities feed concentrator and leaching processes
1 copper concentrator plant with 95 ktpd capacity (by-products: gold and silver), molybdenum plant and a 1,000 litres per second desalinated water plant under a Build Own Operate Transfer (BOOT) agreement
Dynamic leach pads, solvent extraction and electrowinning plant
Nominal capacity of tank house: 200 ktpa copper cathode | |
188
Table of Contents
Mine & location | ||
| Pampa Norte Cerro Colorado | Atacama Desert
120 km east of Iquique, Chile | |
| Means of access | Public road
Copper cathode trucked to port at Iquique | |
| Type and amount of ownership | BHP 100% | |
| Operator | BHP | |
| Title, leases or options and acreage involved | Mining concession from Chilean Government valid indefinitely (subject to payment of annual fees)
Transitioned to care and maintenance in December 2023.
Mining concessions (exploitation): approximately 34,000 hectares | |
| History and stage of property | Production stage
Commercial production commenced in 1994
Expansions in 1996 and 1998
Cerro Colorado entered temporary care and maintenance in December 2023 | |
| Key permit conditions | Mining companies in Chile must obtain environmental approvals for their projects, issued by the Environmental Assessment Service (SEA), in order to operate
Depending on the particular characteristics and/or extension of the relevant project to be assessed, approvals can be obtained following a full Environmental Impact Study (EIA) or after a less complex Environmental Impact Declaration (DIA)
Mining companies are required to pay an annual fee for each mining concession
Mining companies in Chile that enter a care and maintenance period must obtain approval of a Temporary Closure Plan, sectorial permit, from Sernageomin (Mining Authority). This permit is initially granted for a period of 2 years and is renewable for an additional period of up to 3 years | |
| Mine type & mineralisation style | Open-cut
Enriched and oxidised porphyry copper deposit containing in situ copper oxide mineralisation that overlies a near-horizontal sequence of supergene sulphides, transitional sulphides and finally primary (hypogene) sulphide mineralisation | |
| Power source | Electricity purchased from external vendors | |
| Processing plants and other available facilities | Crushing facilities, dynamic leach pads, solvent extraction plant, electrowinning plant
Nominal capacity of tank house: 130 ktpa copper cathode |
189
Table of Contents
Mine & location | ||
| Antamina | Andes mountain range, Peru
Mine: San Marcos – Ancash, 270 km northeast of Lima
Port: Huarmey – Ancash, 300 km north of Lima | |
| Means of access | Public road
Copper and zinc concentrates transported by Antamina-owned pipeline to its Punta Lobitos port
Molybdenum and lead/bismuth concentrates transported by truck | |
| Type and amount of ownership | BHP 33.75%
Glencore 33.75%
Teck 22.5%
Mitsubishi 10% | |
| Operator | Compañía Minera Antamina S.A. | |
| Title, leases or options and acreage involved | Mining rights from Peruvian Government held indefinitely, subject to payment of annual fees and supply of information on investment and production
Total acreage: approximately 6,600 hectares | |
| History and stage of property | Production stage
Commercial production commenced in 2001 | |
| Key permit conditions | During FY2024, the National Environmental Certification Service (SENACE) approved Antamina’s Modification of the Environmental Impact Assessment (MEIA), enabling Antamina to extend its life from CY2028 to CY2036, maintaining annual production volumes within its current operational footprint | |
| Mine type & mineralisation style | Open-cut
Zoned porphyry and skarn deposit with central copper dominated ores and an outer band of copper-zinc dominated ores | |
| Power source | Contracts with individual power producers | |
| Processing plants and other available facilities | Primary crusher, concentrator, copper and zinc flotation circuits, bismuth/moly cleaning circuit
Nominal milling capacity 145 ktpd
304 km concentrate pipeline
Port facilities at Huarmey | |
190
Table of Contents
Mine & location | ||
| Resolution | Superior/Project: Pinal – Arizona, 100 km east of Phoenix, United States | |
| Means of access | Public road | |
| Type and amount of ownership | BHP 45%
Rio Tinto 55% (operator) | |
| Operator | Resolution Copper Mining LLC | |
| Title, leases or options and acreage involved | Private land, patented and unpatented mining claims
Total acreage: approximately 46,000 acres | |
| History and stage of property | Exploration stage
The Resolution deposit is within the footprint of and adjacent to the historical Magma Copper Mine
The Resolution non-operated joint venture (NOJV) was formed in 2004 with Rio Tinto as operator | |
| Key permit conditions | The Resolution Copper Project is subject to a federal permitting process pursuant to the National Environmental Policy Act (NEPA) and other US legislation, including requirements for consultation, coordination and collaboration with Native American Tribes
The NEPA process is led by the US Forest Service
The Resolution Copper Project is also required to obtain several state and local permits, including air quality and groundwater protection permits | |
| Mine type & mineralisation style | Underground
Porphyry copper and molybdenum deposit | |
| Power source | 115 kV power lines to East and West Plant sites with supply contract with Salt River Project | |
| Processing plants and other available facilities | Water treatment and reverse osmosis plant, 2 active underground shafts with associated support infrastructure, including hoisting, ventilation and cooling, and a rail corridor connecting the site to the national rail network | |
191
Table of Contents
Iron ore mining operations
The following table contains additional details of our mining operations. This table should be read in conjunction with OFR 5.3 and the production table and reserves and resources tables in Additional information 4 and 6.
Mine & location | ||
| Samarco | Southeast Brazil
Samarco Mine: Mariana – Minas Gerais, 130 km southeast of Belo Horizonte
Port: Anchieta – Espírito Santo, 520 km east of Belo Horizonte | |
| Means of access | Public road
Iron ore pellets exported via Samarco port facilities – Ubu Port | |
| Type and amount of ownership | BHP Brasil 50%
Vale S.A. 50% | |
| Operator | Samarco Mineração S.A. | |
| Title, leases or options and acreage involved | Mining concessions granted by Brazilian Government subject to compliance with the mine plan
Samarco recommenced iron ore pellet production in December 2020, having met licensing requirements to restart operations at its Germano complex in Minas Gerais and its Ubu complex in Espírito Santo
Mining rights for approximately 1,605 hectares | |
| History and stage of property | Production stage
Production began at Germano mine in 1977 and at Alegria complex in 1992
Second pellet plant built in 1997
Third pellet plant, second concentrator and second pipeline built in 2008
Fourth pellet plant, third concentrator and third pipeline built in 2014 | |
| Key permit conditions | Samarco has an operating licence (LOC – Corrective Operating License) obtained for the return of operations
For the continuity of operations, it has a long-term licensing plan that includes expansion of the mining area and new structures for the disposal of waste and tailings | |
| Mine type & mineralisation style | Open-cut
Itabirites (metamorphic quartz-hematite rock) and friable hematite ores | |
| Power source | Samarco holds interests in 2 hydroelectric power plants, which supply part of its electricity needs. The remainder is purchased from the free (non-regulated) electricity market | |
| Processing plants and other available facilities | Facilities currently operating include 1 concentrator, a system of tailings disposal combining a confined pit and filtration plant for dry stacking of sandy tailings, beneficiation plants, pipelines, 1 pellet plant and port facilities
Following Samarco’s plan to gradually restart operations, the restart of a second concentrator and pelletising plant, and expansion of the existing filtration plant are expected to be in operation by early CY2025 | |
192
Table of Contents
Other mining operations
The following table contains additional details of our mining operations. This table should be read in conjunction with OFR 5.3 and the production table and reserves and resources tables in Additional information 4 and 6.
Mine & location | ||
| Jansen (under construction) | Province of Saskatchewan, approximately 140 km east of Saskatoon, Canada | |
| Means of access | Public road
Muriate of Potash (MOP) to be transported by rail to the port at Westshore Terminal in Delta, British Columbia, Canada
| |
| Type and amount of ownership | BHP 100% | |
| Operator | BHP | |
| Title, leases or options and acreage involved | The total area of the Jansen lease is approximately 1,120 square km
All surface lands have been acquired | |
| History and stage of property | Development stage
Stage 1 is currently under construction
Stage 2 was sanctioned and execution commenced in FY2024 | |
| Key permit conditions | The Jansen Project received Ministerial approval under the Saskatchewan Environmental Assessment Act
Following approval, various federal, provincial and municipal permits have been or will be obtained for construction and operation of facilities | |
| Mine type & mineralisation style | Underground
The Lower Patience Lake (LPL) sub-member is the potash horizon targeted for Jansen. The LPL sub-member is a bedded evaporite composed of sylvite (KCl), halite (NaCl) with variable amounts of disseminated insoluble and clay seams | |
| Power source | Electricity transmitted via BHP’s 230 kV substation and upstream provincial power utility system | |
| Processing plants and other available facilities | Mill, buildings and other facilities and infrastructure are under construction | |
193
Table of Contents
Mine & location | ||
| Pedra Branca | Água Azul do Norte, Pará
Approximately 160 km from Marabá and 900 km from Belém in the state of Pará, Brazil | |
| Means of access | Public road
From Água Azul to Parauapebas from highway (PA 150) to be transported by train to the port of Itaqui in São Luiz, state of Maranhão, Brazil | |
| Type and amount of ownership | BHP 100% | |
| Operator | OZ Minerals Brasil | |
| Title, leases or options and acreage involved | The property belongs to OZ Minerals Brasil | |
| History and stage of property | 2018 – OZ Minerals acquired mine operator Avanco Resources – including projects in the Carajás Copper Region and the Gurupi Greenstone Belt
2019 – Construction commenced
2020 – First developmental ore sent to Antas for processing
2021 – Commencement of underground mining in Pedra Branca and inaugural resource identification announcement in Santa Lúcia
2022 – Ramped up to full production
2023 – Acquisition of OZ Minerals by BHP
2024 – Santa Lucia project permitting process granted by SEMAS—environment Agency of Pará State | |
| Key permit conditions | The closure plan to be updated in accordance with requirement from ANM (n° 68/2021) when the life of mine changes
Annual environmental report (RIAA) required to be submitted in accordance with the activities developed for the mine production | |
| Mine type & mineralisation style | Underground
Iron oxide copper gold deposit. High grade zones of semi-massive and breccia style mineralisation. Dominant chalcopyrite (copper mineralisation) | |
| Power source | 3MW required to operate mine coming from power lines from north of state (Tucurui hydroelectric plant). The expansion required is in progress with new lines to achieve 7MW | |
| Processing plants and other available facilities | The material is processed in Antas Norte Plant located in the municipality of Curionópolis
Plant capacity is 800 ktpa and the tailings are deposited in the exhausted mine existing on site
Mill, buildings and other facilities and infrastructure are in the Curionópolis municipality | |
194
Table of Contents
2 Financial information summary
We prepare our Consolidated Financial Statements in accordance with International Financial Reporting Standards (IFRS), as issued by the International Accounting Standards Board. We publish our Consolidated Financial Statements in US dollars. All Consolidated Income Statement, Consolidated Balance Sheet and Consolidated Cash Flow Statement information below has been derived from audited Financial Statements. For more information refer to the Financial Statements.
Some information in this section has been presented on a Continuing operations basis to exclude the contribution from Discontinued operations.
Year ended 30 June US$M | 2024 | 2023 | 2022 | 2021 | 2020 | |||||||||||||||
Consolidated Income Statement (Financial Statements 1.1) | ||||||||||||||||||||
Revenue | 55,658 | 53,817 | 65,098 | 56,921 | 38,924 | |||||||||||||||
Profit from operations | 17,537 | 22,932 | 34,106 | 25,515 | 13,683 | |||||||||||||||
Profit after taxation from Continuing operations | 9,601 | 14,324 | 22,400 | 13,676 | 8,628 | |||||||||||||||
Profit/(loss) after taxation from Discontinued operations | – | – | 10,655 | (225 | ) | 108 | ||||||||||||||
Profit after taxation from Continuing and Discontinued operations attributable to BHP shareholders (Attributable profit) | 7,897 | 12,921 | 30,900 | 11,304 | 7,956 | |||||||||||||||
Profit after taxation from Continuing operations attributable to BHP shareholders | 7,897 | 12,921 | 20,245 | 11,529 | 7,848 | |||||||||||||||
Dividends per ordinary share – paid during the period (US cents) | 152.0 | 265.0 | 350.0 | 156.0 | 143.0 | |||||||||||||||
Dividends per ordinary share – determined in respect of the period (US cents) | 146.0 | 170.0 | 325.0 | 301.0 | 120.0 | |||||||||||||||
In specie dividend on merger of Petroleum with Woodside (US cents) | – | – | 386.4 | – | – | |||||||||||||||
Basic earnings per ordinary share (US cents)1 | 155.8 | 255.2 | 610.6 | 223.5 | 157.3 | |||||||||||||||
Diluted earnings per ordinary share (US cents)1 | 155.5 | 254.7 | 609.3 | 223.0 | 157.0 | |||||||||||||||
Basic earnings from Continuing operations per ordinary share (US cents)1 | 155.8 | 255.2 | 400.0 | 228.0 | 155.2 | |||||||||||||||
Diluted earnings from Continuing operations per ordinary share (US cents)1 | 155.5 | 254.7 | 399.2 | 227.5 | 154.8 | |||||||||||||||
|
|
|
|
|
|
|
|
|
| |||||||||||
Number of ordinary shares (million)1 | ||||||||||||||||||||
- At period end | 5,072 | 5,066 | 5,062 | 5,058 | 5,058 | |||||||||||||||
- Weighted average | 5,068 | 5,064 | 5,061 | 5,057 | 5,057 | |||||||||||||||
- Diluted | 5,077 | 5,073 | 5,071 | 5,068 | 5,069 | |||||||||||||||
|
|
|
|
|
|
|
|
|
| |||||||||||
Consolidated Balance Sheet (Financial Statements 1.3)2 | ||||||||||||||||||||
Total assets | 102,362 | 101,296 | 95,166 | 108,927 | 105,733 | |||||||||||||||
Net assets | 49,120 | 48,530 | 48,766 | 55,605 | 52,175 | |||||||||||||||
Share capital (including share premium) | 4,899 | 4,737 | 4,638 | 2,686 | 2,686 | |||||||||||||||
Total equity attributable to BHP shareholders | 44,811 | 44,496 | 44,957 | 51,264 | 47,865 | |||||||||||||||
|
|
|
|
|
|
|
|
|
| |||||||||||
Consolidated Cash Flow Statement (Financial Statements 1.4) | ||||||||||||||||||||
Net operating cash flows3 | 20,665 | 18,701 | 32,174 | 27,234 | 15,706 | |||||||||||||||
Capital and exploration expenditure4,5 | 9,273 | 7,083 | 7,545 | 7,120 | 7,640 | |||||||||||||||
|
|
|
|
|
|
|
|
|
| |||||||||||
Other financial information (OFR 10) | ||||||||||||||||||||
Net debt5 | 9,120 | 11,166 | 333 | 4,121 | 12,044 | |||||||||||||||
Underlying attributable profit5 | 13,660 | 13,420 | 23,815 | 17,077 | 9,060 | |||||||||||||||
Underlying attributable profit – Continuing operations5 | 13,660 | 13,420 | 21,319 | 16,985 | 8,948 | |||||||||||||||
Underlying EBITDA5 | 29,016 | 27,956 | 40,634 | 35,073 | 19,870 | |||||||||||||||
Underlying EBIT5 | 23,631 | 22,820 | 34,436 | 29,853 | 15,130 | |||||||||||||||
Underlying basic earnings per share (US cents)5 | 269.5 | 265.0 | 470.6 | 337.7 | 179.2 | |||||||||||||||
Underlying basic earnings per share – Continuing operations (US cents)5 | 269.5 | 265.0 | 421.2 | 335.9 | 176.9 | |||||||||||||||
Underlying return on capital employed (per cent)5 | 27.2 | 28.8 | 48.7 | 32.5 | 16.9 | |||||||||||||||
|
|
|
|
|
|
|
|
|
| |||||||||||
| 1. | For more information on earnings per share refer to Financial Statements note 7 ‘Earnings per share’. |
| 2. | The Consolidated Balance Sheet for comparative periods includes the associated assets and liabilities in relation to Blackwater and Daunia mines (disposed in FY2024), Petroleum (merger with Woodside in FY2022), BMC and Cerrejón (both disposed in FY2022) as IFRS 5 ‘Non-current Assets Held for Sale and Discontinued Operations’ does not require the Consolidated Balance Sheet to be restated for comparative periods. |
| 3. | Net operating cash flows are after dividends received, net interest paid, proceeds and settlements of cash management related instruments, net taxation paid and includes Net operating cash flows from Discontinued operations. |
| 4. | Capital and exploration and evaluation expenditure is presented on a cash basis and represents purchases of property, plant and equipment plus exploration and evaluation expenditure from the Consolidated Cash Flow Statement and includes purchases of property, plant and equipment plus exploration and evaluation expenditure from Discontinued operations. For more information refer to Financial Statements note 28 ‘Discontinued operations’. Exploration and evaluation expenditure is capitalised in accordance with our accounting policies, as set out in Financial Statements note 11 ‘Property, plant and equipment’. |
| 5. | We use non-IFRS financial information to reflect the underlying performance of the Group. Underlying attributable profit, Underlying basic earnings per share and Underlying return on capital employed includes Continuing and Discontinued operations. Refer to OFR 10 for a reconciliation of non-IFRS financial information to their respective IFRS measure. Refer to OFR 10.1 for the definition and method of calculation of non-IFRS financial information. Refer to Financial Statements note 21 ‘Net debt’ for the composition of Net debt. |
195
Table of Contents
3 Financial information by commodity
Management believes the following financial information presented by commodity provides a meaningful indication of the underlying financial performance of the assets, including equity accounted investments, of each reportable segment. Information relating to assets that are accounted for as equity accounted investments is shown to reflect BHP’s share, unless otherwise noted, to provide insight into the drivers of these assets.
For the purposes of this financial information, segments are reported on a statutory basis in accordance with IFRS 8/AASB 8 ‘Operating Segments’. The tables for each commodity include an ‘adjustment for equity accounted investments’ to reconcile the equity accounted results to the statutory segment results.
For a reconciliation of non-IFRS financial information to respective IFRS measures and an explanation as to the use of Underlying EBITDA in assessing our performance refer to OFR 10. For the definition and method of calculation of non-IFRS financial information refer to OFR 10.1. For more information as to the statutory determination of our reportable segments refer to Financial Statements note 1 ‘Segment reporting’.
Year ended 30 June 2024 US$M | Revenue2 | Underlying EBITDA3 | Underlying EBIT3 | Exceptional items4 | Net operating assets3 | Capital expenditure | Exploration gross | Exploration to profit5 | ||||||||||||||||||||||||
Copper | ||||||||||||||||||||||||||||||||
Escondida | 10,013 | 5,759 | 4,821 | 13,113 | 1,806 | |||||||||||||||||||||||||||
Pampa Norte6 | 2,375 | 896 | 468 | 4,843 | 721 | |||||||||||||||||||||||||||
Antamina7 | 1,478 | 968 | 746 | 1,498 | 437 | |||||||||||||||||||||||||||
Copper South Australia8 | 4,085 | 1,568 | 928 | 16,498 | 1,048 | |||||||||||||||||||||||||||
Other7 | 72 | (176 | ) | (228 | ) | 416 | 136 | |||||||||||||||||||||||||
|
|
|
|
|
|
|
|
|
|
|
|
|
|
|
| |||||||||||||||||
Total Copper from Group production | 18,023 | 9,015 | 6,735 | – | 36,368 | 4,148 | ||||||||||||||||||||||||||
|
|
|
|
|
|
|
|
|
|
|
|
|
|
|
| |||||||||||||||||
Third-party products | 2,021 | 74 | 74 | – | – | – | ||||||||||||||||||||||||||
|
|
|
|
|
|
|
|
|
|
|
|
|
|
|
| |||||||||||||||||
Total Copper | 20,044 | 9,089 | 6,809 | – | 36,368 | 4,148 | 216 | 215 | ||||||||||||||||||||||||
|
|
|
|
|
|
|
|
|
|
|
|
|
|
|
| |||||||||||||||||
Adjustment for equity accounted investments7 | (1,478 | ) | (525 | ) | (285 | ) | – | – | (437 | ) | (3 | ) | (2 | ) | ||||||||||||||||||
|
|
|
|
|
|
|
|
|
|
|
|
|
|
|
| |||||||||||||||||
Total Copper statutory result | 18,566 | 8,564 | 6,524 | – | 36,368 | 3,711 | 213 | 213 | ||||||||||||||||||||||||
|
|
|
|
|
|
|
|
|
|
|
|
|
|
|
| |||||||||||||||||
Iron Ore | ||||||||||||||||||||||||||||||||
Western Australia Iron Ore | 27,805 | 18,964 | 16,902 | 20,597 | 2,026 | |||||||||||||||||||||||||||
Samarco9 | – | – | – | (6,606 | ) | – | ||||||||||||||||||||||||||
Other | 122 | (48 | ) | (74 | ) | (179 | ) | 7 | ||||||||||||||||||||||||
|
|
|
|
|
|
|
|
|
|
|
|
|
|
|
| |||||||||||||||||
Total Iron Ore from Group production | 27,927 | 18,916 | 16,828 | (3,066 | ) | 13,812 | 2,033 | |||||||||||||||||||||||||
|
|
|
|
|
|
|
|
|
|
|
|
|
|
|
| |||||||||||||||||
Third-party products | 25 | (3 | ) | (3 | ) | – | – | – | ||||||||||||||||||||||||
|
|
|
|
|
|
|
|
|
|
|
|
|
|
|
| |||||||||||||||||
Total Iron Ore | 27,952 | 18,913 | 16,825 | (3,066 | ) | 13,812 | 2,033 | 86 | 41 | |||||||||||||||||||||||
|
|
|
|
|
|
|
|
|
|
|
|
|
|
|
| |||||||||||||||||
Adjustment for equity accounted investments | – | – | – | – | – | – | – | – | ||||||||||||||||||||||||
|
|
|
|
|
|
|
|
|
|
|
|
|
|
|
| |||||||||||||||||
Total Iron Ore statutory result | 27,952 | 18,913 | 16,825 | (3,066 | ) | 13,812 | 2,033 | 86 | 41 | |||||||||||||||||||||||
|
|
|
|
|
|
|
|
|
|
|
|
|
|
|
| |||||||||||||||||
Coal | ||||||||||||||||||||||||||||||||
BHP Mitsubishi Alliance10 | 5,873 | 1,914 | 1,394 | 6,725 | 533 | |||||||||||||||||||||||||||
New South Wales Energy Coal11 | 1,945 | 502 | 408 | (211 | ) | 100 | ||||||||||||||||||||||||||
Other | – | (27 | ) | (50 | ) | (42 | ) | 14 | ||||||||||||||||||||||||
|
|
|
|
|
|
|
|
|
|
|
|
|
|
|
| |||||||||||||||||
Total Coal from Group production | 7,818 | 2,389 | 1,752 | 880 | 6,472 | 647 | ||||||||||||||||||||||||||
|
|
|
|
|
|
|
|
|
|
|
|
|
|
|
| |||||||||||||||||
Third-party products | – | – | – | – | – | – | ||||||||||||||||||||||||||
|
|
|
|
|
|
|
|
|
|
|
|
|
|
|
| |||||||||||||||||
Total Coal | 7,818 | 2,389 | 1,752 | 880 | 6,472 | 647 | 14 | 3 | ||||||||||||||||||||||||
|
|
|
|
|
|
|
|
|
|
|
|
|
|
|
| |||||||||||||||||
Adjustment for equity accounted investments11 | (152 | ) | (99 | ) | (75 | ) | – | – | (1 | ) | – | – | ||||||||||||||||||||
|
|
|
|
|
|
|
|
|
|
|
|
|
|
|
| |||||||||||||||||
Total Coal statutory result | 7,666 | 2,290 | 1,677 | 880 | 6,472 | 646 | 14 | 3 | ||||||||||||||||||||||||
|
|
|
|
|
|
|
|
|
|
|
|
|
|
|
| |||||||||||||||||
Group and unallocated items | ||||||||||||||||||||||||||||||||
Potash | – | (255 | ) | (257 | ) | 6,138 | 1,090 | 1 | 1 | |||||||||||||||||||||||
Western Australia Nickel12 | 1,473 | (302 | ) | (374 | ) | (6 | ) | 1,254 | 50 | 58 | ||||||||||||||||||||||
Other13 | 1 | (194 | ) | (764 | ) | (1,421 | ) | 82 | 93 | 93 | ||||||||||||||||||||||
|
|
|
|
|
|
|
|
|
|
|
|
|
|
|
| |||||||||||||||||
Total Group and unallocated items | 1,474 | (751 | ) | (1,395 | ) | (3,908 | ) | 4,711 | 2,426 | 144 | 152 | |||||||||||||||||||||
|
|
|
|
|
|
|
|
|
|
|
|
|
|
|
| |||||||||||||||||
Inter-segment adjustment | – | – | – | – | – | – | – | – | ||||||||||||||||||||||||
|
|
|
|
|
|
|
|
|
|
|
|
|
|
|
| |||||||||||||||||
Total Group | 55,658 | 29,016 | 23,631 | (6,094 | ) | 61,363 | 8,816 | 457 | 409 | |||||||||||||||||||||||
|
|
|
|
|
|
|
|
|
|
|
|
|
|
|
| |||||||||||||||||
196
Table of Contents
Year ended 30 June 2023 US$M | Revenue2 | Underlying EBITDA3 | Underlying EBIT3 | Exceptional items4 | Net operating assets3 | Capital expenditure | Exploration gross | Exploration to profit | ||||||||||||||||||||||||
Copper | ||||||||||||||||||||||||||||||||
Escondida | 8,847 | 4,934 | 4,070 | 12,207 | 1,351 | |||||||||||||||||||||||||||
Pampa Norte6 | 2,491 | 754 | 244 | 4,487 | 647 | |||||||||||||||||||||||||||
Antamina7 | 1,468 | 998 | 824 | 1,430 | 374 | |||||||||||||||||||||||||||
Copper South Australia8 | 2,806 | 703 | 251 | 15,782 | 641 | |||||||||||||||||||||||||||
Other7 | 20 | (209 | ) | (228 | ) | 323 | 59 | |||||||||||||||||||||||||
|
|
|
|
|
|
|
|
|
|
|
|
|
|
|
| |||||||||||||||||
Total Copper from Group production | 15,632 | 7,180 | 5,161 | – | 34,229 | 3,072 | ||||||||||||||||||||||||||
|
|
|
|
|
|
|
|
|
|
|
|
|
|
|
| |||||||||||||||||
Third-party products | 1,863 | 18 | 18 | – | – | – | ||||||||||||||||||||||||||
|
|
|
|
|
|
|
|
|
|
|
|
|
|
|
| |||||||||||||||||
Total Copper | 17,495 | 7,198 | 5,179 | – | 34,229 | 3,072 | 151 | 148 | ||||||||||||||||||||||||
|
|
|
|
|
|
|
|
|
|
|
|
|
|
|
| |||||||||||||||||
Adjustment for equity accounted investments7 | (1,468 | ) | (545 | ) | (369 | ) | – | – | (374 | ) | (6 | ) | (3 | ) | ||||||||||||||||||
|
|
|
|
|
|
|
|
|
|
|
|
|
|
|
| |||||||||||||||||
Total Copper statutory result | 16,027 | 6,653 | 4,810 | – | 34,229 | 2,698 | 145 | 145 | ||||||||||||||||||||||||
|
|
|
|
|
|
|
|
|
|
|
|
|
|
|
| |||||||||||||||||
| Iron Ore | ||||||||||||||||||||||||||||||||
Western Australia Iron Ore | 24,678 | 16,660 | 14,663 | 20,438 | 1,956 | |||||||||||||||||||||||||||
Samarco9 | – | – | – | (3,382 | ) | – | ||||||||||||||||||||||||||
Other | 113 | 33 | 9 | (100 | ) | 10 | ||||||||||||||||||||||||||
|
|
|
|
|
|
|
|
|
|
|
|
|
|
|
| |||||||||||||||||
Total Iron Ore from Group production | 24,791 | 16,693 | 14,672 | 176 | 16,956 | 1,966 | ||||||||||||||||||||||||||
|
|
|
|
|
|
|
|
|
|
|
|
|
|
|
| |||||||||||||||||
Third-party products | 21 | (1 | ) | (1 | ) | – | – | – | ||||||||||||||||||||||||
|
|
|
|
|
|
|
|
|
|
|
|
|
|
|
| |||||||||||||||||
Total Iron Ore | 24,812 | 16,692 | 14,671 | 176 | 16,956 | 1,966 | 96 | 52 | ||||||||||||||||||||||||
|
|
|
|
|
|
|
|
|
|
|
|
|
|
|
| |||||||||||||||||
Adjustment for equity accounted investments | – | – | – | – | – | – | – | – | ||||||||||||||||||||||||
|
|
|
|
|
|
|
|
|
|
|
|
|
|
|
| |||||||||||||||||
Total Iron Ore statutory result | 24,812 | 16,692 | 14,671 | 176 | 16,956 | 1,966 | 96 | 52 | ||||||||||||||||||||||||
|
|
|
|
|
|
|
|
|
|
|
|
|
|
|
| |||||||||||||||||
| Coal | ||||||||||||||||||||||||||||||||
BHP Mitsubishi Alliance10 | 7,652 | 3,197 | 2,572 | 7,545 | 488 | |||||||||||||||||||||||||||
New South Wales Energy Coal11 | 3,455 | 1,953 | 1,868 | (243 | ) | 156 | ||||||||||||||||||||||||||
Other | – | (39 | ) | (57 | ) | (36 | ) | 13 | ||||||||||||||||||||||||
|
|
|
|
|
|
|
|
|
|
|
|
|
|
|
| |||||||||||||||||
Total Coal from Group production | 11,107 | 5,111 | 4,383 | – | 7,266 | 657 | ||||||||||||||||||||||||||
|
|
|
|
|
|
|
|
|
|
|
|
|
|
|
| |||||||||||||||||
Third-party products | – | – | – | – | – | – | ||||||||||||||||||||||||||
|
|
|
|
|
|
|
|
|
|
|
|
|
|
|
| |||||||||||||||||
Total Coal | 11,107 | 5,111 | 4,383 | – | 7,266 | 657 | 13 | 6 | ||||||||||||||||||||||||
|
|
|
|
|
|
|
|
|
|
|
|
|
|
|
| |||||||||||||||||
Adjustment for equity accounted investments11 | (149 | ) | (113 | ) | (88 | ) | – | – | – | – | – | |||||||||||||||||||||
|
|
|
|
|
|
|
|
|
|
|
|
|
|
|
| |||||||||||||||||
Total Coal statutory result | 10,958 | 4,998 | 4,295 | – | 7,266 | 657 | 13 | 6 | ||||||||||||||||||||||||
|
|
|
|
|
|
|
|
|
|
|
|
|
|
|
| |||||||||||||||||
| Group and unallocated items | ||||||||||||||||||||||||||||||||
Potash | – | (205 | ) | (207 | ) | 4,469 | 647 | 1 | 1 | |||||||||||||||||||||||
Western Australia Nickel12 | 2,009 | 162 | 55 | 2,255 | 683 | 52 | 48 | |||||||||||||||||||||||||
Other13 | 11 | (344 | ) | (804 | ) | (1,295 | ) | 82 | 43 | 42 | ||||||||||||||||||||||
|
|
|
|
|
|
|
|
|
|
|
|
|
|
|
| |||||||||||||||||
Total Group and unallocated items | 2,020 | (387 | ) | (956 | ) | (64 | ) | 5,429 | 1,412 | 96 | 91 | |||||||||||||||||||||
|
|
|
|
|
|
|
|
|
|
|
|
|
|
|
| |||||||||||||||||
Inter-segment adjustment | – | – | – | – | – | – | – | – | ||||||||||||||||||||||||
|
|
|
|
|
|
|
|
|
|
|
|
|
|
|
| |||||||||||||||||
Total Group | 53,817 | 27,956 | 22,820 | 112 | 63,880 | 6,733 | 350 | 294 | ||||||||||||||||||||||||
|
|
|
|
|
|
|
|
|
|
|
|
|
|
|
| |||||||||||||||||
| 1. | Group profit before taxation comprised Underlying EBITDA of US$29,016 million (FY2023: US$27,956 million), exceptional items, depreciation, amortisation and impairments of US$11,479 million (FY2023: US$5,024 million) and net finance costs of US$1,489 million (FY2023: US$1,531 million). |
| 2. | Total revenue from thermal coal sales, including BMA and NSWEC, was US$1,873 million (FY2023: US$3,528 million). |
| 3. | For more information on the reconciliation of non-IFRS financial information to our statutory measures, reasons for usefulness and calculation methodology, please refer OFR 10 ‘Non-IFRS financial information’. |
| 4. | Excludes exceptional items relating to Net finance costs US$506 million and Income tax benefit US$837 million (FY2023: Net finance costs US$452 million and Income tax expense US$266 million). |
| 5. | Includes US$10 million (FY2023:US$ nil) of exploration expenditure previously capitalised, written off as impaired (included in depreciation and amortisation). |
| 6. | Includes Spence and Cerro Colorado. Cerro Colorado entered temporary care and maintenance in December 2023. |
| 7. | Antamina, SolGold and Resolution (the latter two included in Other) are equity accounted investments and their financial information presented above with the exception of net operating assets reflects BHP Group’s share. Group and Copper level information is reported on a statutory basis which reflects the application of the equity accounting method in preparing the Group financial statements – in accordance with IFRS. Underlying EBITDA of the Group and the Copper segment, includes D&A, net finance costs and taxation expense of US$525 million (FY2023: US$545 million) related to equity accounted investments. |
197
Table of Contents
| 8. | Includes Olympic Dam as well as Prominent Hill and Carrapateena which were acquired on 2 May 2023 as part of the acquisition of OZL. |
| 9. | Samarco is an equity accounted investment. With the exception of net operating assets, the financial information presented reflects BHP Billiton Brasil Ltda’s share. All financial impacts following the Samarco dam failure have been reported as exceptional items in both reporting periods. |
| 10. | On 2 April 2024 BHP and Mitsubishi Development Pty Ltd (MDP) completed the divestment of the Blackwater and Daunia mines (which were part of the BHP Mitsubishi Alliance (BMA) to Whitehaven Coal. This resulted in a net after tax gain of US$674 million that has been recognised as an exceptional item. BHP continued to report its share of profit and loss within the Coal Segment and asset tables until that date. Refer to Financial Statements Note 3 ‘Exceptional items’ for further information. |
| 11. | Includes Newcastle Coal Infrastructure Group (NCIG) which is an equity accounted investment and its financial information presented above, with the exception of net operating assets, reflects BHP Group’s share. Total Coal statutory result excludes contribution related to NCIG until future profits exceed accumulated losses. |
| 12. | Western Australia Nickel comprises the Nickel West operations and, following the OZL acquisition on 2 May 2023, the West Musgrave project. |
| 13. | Other includes functions, other unallocated operations including legacy assets and consolidation adjustments. Revenue not attributable to reportable segments comprises the sale of freight and fuel to third parties, as well as revenues from unallocated operations. Exploration and technology activities are recognised within relevant segments. |
4 Production
The table below details our mineral and derivative product production for all operations for the three years ended 30 June 2024, 2023 and 2022. Unless otherwise stated, the production numbers represent our share of production and include BHP’s share of production from which profit is derived from our equity accounted investments. Production information for equity accounted investments is included to provide insight into the operational performance of these entities.
For information on minerals pricing during the past three years refer to OFR 9
| BHP interest % | BHP share of production1 Year ended 30 June | |||||||||||||||
| 2024 | 2023 | 2022 | ||||||||||||||
Copper2 | ||||||||||||||||
Payable metal in concentrate (kt) | ||||||||||||||||
Escondida, Chile3 | 57.5 | 926.7 | 832.7 | 802.6 | ||||||||||||
Pampa Norte, Chile4 | 100 | 150.3 | 125.3 | 111.2 | ||||||||||||
Copper South Australia, Australia5 | 100 | 106.3 | 19.9 | |||||||||||||
Antamina, Peru6 | 33.75 | 143.9 | 138.4 | 149.9 | ||||||||||||
Carajás, Brazil7 | 100 | 8.4 | 1.6 | |||||||||||||
|
|
|
|
|
| |||||||||||
Total | 1,335.6 | 1,117.9 | 1,063.7 | |||||||||||||
|
|
|
|
|
| |||||||||||
Cathode (kt) | ||||||||||||||||
Escondida, Chile3 | 57.5 | 198.6 | 222.6 | 201.4 | ||||||||||||
Pampa Norte, Chile4 | 100 | 115.3 | 163.5 | 170.0 | ||||||||||||
Copper South Australia, Australia5 | 100 | 215.7 | 212.5 | 138.4 | ||||||||||||
|
|
|
|
|
| |||||||||||
Total | 529.6 | 598.6 | 509.8 | |||||||||||||
|
|
|
|
|
| |||||||||||
Total copper (kt) | 1,865.2 | 1,716.5 | 1,573.5 | |||||||||||||
|
|
|
|
|
| |||||||||||
Lead | ||||||||||||||||
Payable metal in concentrate (t) | ||||||||||||||||
Antamina, Peru6 | 33.75 | 332 | 657 | 1,118 | ||||||||||||
|
|
|
|
|
| |||||||||||
Total | 332 | 657 | 1,118 | |||||||||||||
|
|
|
|
|
| |||||||||||
198
Table of Contents
| BHP interest % | BHP share of production1 Year ended 30 June | |||||||||||||||
| 2024 | 2023 | 2022 | ||||||||||||||
Zinc | ||||||||||||||||
Payable metal in concentrate (t) | ||||||||||||||||
Antamina, Peru6 | 33.75 | 103,392 | 125,048 | 123,200 | ||||||||||||
|
|
|
|
|
| |||||||||||
Total | 103,392 | 125,048 | 123,200 | |||||||||||||
|
|
|
|
|
| |||||||||||
Gold | ||||||||||||||||
Payable metal in concentrate (troy oz) | ||||||||||||||||
Escondida, Chile3 | 57.5 | 181,061 | 189,095 | 166,972 | ||||||||||||
Pampa Norte, Chile4 | 100 | 13,280 | 26,811 | 28,870 | ||||||||||||
Copper South Australia, Australia5 | 100 | 163,061 | 32,736 | |||||||||||||
Carajás, Brazil7 | 100 | 5,813 | 1,153 | |||||||||||||
|
|
|
|
|
| |||||||||||
Total | 363,215 | 249,795 | 195,842 | |||||||||||||
|
|
|
|
|
| |||||||||||
| Refined gold (troy oz) | ||||||||||||||||
Copper South Australia, Australia5 | 100 | 207,123 | 186,029 | 119,517 | ||||||||||||
|
|
|
|
|
| |||||||||||
Total | 207,123 | 186,029 | 119,517 | |||||||||||||
|
|
|
|
|
| |||||||||||
Total gold (troy oz) | 570,338 | 435,824 | 315,359 | |||||||||||||
|
|
|
|
|
| |||||||||||
Silver | ||||||||||||||||
Payable metal in concentrate (troy koz) | ||||||||||||||||
Escondida, Chile3 | 57.5 | 5,446 | 5,074 | 5,334 | ||||||||||||
Pampa Norte, Chile4 | 100 | 1,654 | 1,318 | 1,011 | ||||||||||||
Copper South Australia, Australia5 | 100 | 1,134 | 201 | |||||||||||||
Antamina, Peru6 | 33.75 | 3,359 | 3,885 | 5,078 | ||||||||||||
|
|
|
|
|
| |||||||||||
Total | 11,593 | 10,478 | 11,423 | |||||||||||||
|
|
|
|
|
| |||||||||||
Refined silver (troy koz) | ||||||||||||||||
Copper South Australia, Australia5 | 100 | 995 | 1,089 | 743 | ||||||||||||
|
|
|
|
|
| |||||||||||
Total | 995 | 1,089 | 743 | |||||||||||||
|
|
|
|
|
| |||||||||||
Total silver (troy koz) | 12,588 | 11,567 | 12,166 | |||||||||||||
|
|
|
|
|
| |||||||||||
Uranium | ||||||||||||||||
Payable metal in concentrate (t) | ||||||||||||||||
Copper South Australia, Australia5 | 100 | 3,603 | 3,406 | 2,375 | ||||||||||||
|
|
|
|
|
| |||||||||||
Total | 3,603 | 3,406 | 2,375 | |||||||||||||
|
|
|
|
|
| |||||||||||
Molybdenum | ||||||||||||||||
Payable metal in concentrate (t) | ||||||||||||||||
Pampa Norte, Chile4 | 100 | 794 | 990 | 71 | ||||||||||||
Antamina, Peru6 | 33.75 | 1,822 | 1,172 | 798 | ||||||||||||
|
|
|
|
|
| |||||||||||
Total | 2,616 | 2,162 | 869 | |||||||||||||
|
|
|
|
|
| |||||||||||
Iron Ore | ||||||||||||||||
Production (kt)8 | ||||||||||||||||
Newman Joint Venture, Australia | 85 | 58,102 | 56,945 | 57,041 | ||||||||||||
Area C Joint Venture, Australia | 85 | 105,868 | 107,375 | 94,431 | ||||||||||||
Yandi Joint Venture, Australia | 85 | 17,855 | 21,410 | 38,922 | ||||||||||||
Jimblebar, Australia9 | 85 | 73,111 | 66,801 | 58,782 | ||||||||||||
Total Western Australia Iron Ore | 254,936 | 252,531 | 249,176 | |||||||||||||
Samarco, Brazil6 | 50 | 4,748 | 4,512 | 4,071 | ||||||||||||
|
|
|
|
|
| |||||||||||
Total iron ore | 259,684 | 257,043 | 253,247 | |||||||||||||
|
|
|
|
|
| |||||||||||
199
Table of Contents
| BHP interest % | BHP share of production1 Year ended 30 June | |||||||||||||||
| 2024 | 2023 | 2022 | ||||||||||||||
Steelmaking coal | ||||||||||||||||
Production (kt)10 | ||||||||||||||||
Blackwater, Australia 11 | 50 | 3,572 | 5,055 | 5,834 | ||||||||||||
Goonyella Riverside, Australia | 50 | 6,434 | 8,310 | 8,360 | ||||||||||||
Peak Downs, Australia | 50 | 4,217 | 5,480 | 4,944 | ||||||||||||
Saraji, Australia | 50 | 3,287 | 4,596 | 4,614 | ||||||||||||
Daunia, Australia11 | 50 | 1,513 | 1,989 | 1,491 | ||||||||||||
Caval Ridge, Australia | 50 | 3,252 | 3,590 | 3,899 | ||||||||||||
Total BHP Mitsubishi Alliance (BMA) | 22,275 | 29,020 | 29,142 | |||||||||||||
|
|
|
|
|
| |||||||||||
South Walker Creek, Australia12 | 80 | – | – | 4,941 | ||||||||||||
|
|
|
|
|
| |||||||||||
Poitrel, Australia12 | 80 | – | – | 2,981 | ||||||||||||
|
|
|
|
|
| |||||||||||
Total BHP Mitsui Coal12 | – | – | 7,922 | |||||||||||||
|
|
|
|
|
| |||||||||||
Total steelmaking coal | 22,275 | 29,020 | 37,064 | |||||||||||||
|
|
|
|
|
| |||||||||||
Energy coal | ||||||||||||||||
Production (kt) | ||||||||||||||||
New South Wales Energy Coal, Australia | 100 | 15,368 | 14,172 | 13,701 | ||||||||||||
|
|
|
|
|
| |||||||||||
Cerrejón, Colombia6,13 | 33.3 | — | – | 4,236 | ||||||||||||
|
|
|
|
|
| |||||||||||
Total energy coal | 15,368 | 14,172 | 17,937 | |||||||||||||
|
|
|
|
|
| |||||||||||
Nickel | ||||||||||||||||
Saleable production (kt) | ||||||||||||||||
Western Australia Nickel, Australia14, 15 | 100 | 81.6 | 80.0 | 76.8 | ||||||||||||
|
|
|
|
|
| |||||||||||
Total | 81.6 | 80.0 | 76.8 | |||||||||||||
|
|
|
|
|
| |||||||||||
Cobalt | ||||||||||||||||
Saleable production (t) | ||||||||||||||||
Western Australia Nickel, Australia14, 15 | 100 | 734 | 752 | 632 | ||||||||||||
|
|
|
|
|
| |||||||||||
Total | 734 | 752 | 632 | |||||||||||||
|
|
|
|
|
| |||||||||||
200
Table of Contents
| 1. | BHP share of production includes the Group’s share of production for which profit is derived from our equity accounted investments, unless otherwise stated. |
| 2. | Metal production is reported on the basis of payable metal. |
| 3. | Shown on 100 per cent basis. BHP interest in saleable production is 57.5 per cent. |
| 4. | Includes Spence for the full year and Cerro Colorado which entered temporary care and maintenance in December 2023. |
| 5. | The year ended 30 June 2024 includes Olympic Dam, Prominent Hill and Carrapateena. The year ended 30 June 2023 includes Olympic Dam and two months of production from Prominent Hill and Carrapateena from 1 May 2023, following the acquisition of OZ Minerals on 2 May 2023. |
| 6. | For statutory financial reporting purposes, this is an equity accounted investment. We have included production numbers from our equity accounted investments as the level of production and operating performance from these operations impacts Underlying EBITDA of the Group. Our use of Underlying EBITDA is explained in OFR 4.3. |
| 7. | The year ended 30 June 2023 includes two months of production from 1 May 2023, following the acquisition of OZ Minerals on 2 May 2023. |
| 8. | Iron ore production is reported on a wet tonnes basis. |
| 9. | Shown on 100 per cent basis. BHP interest in saleable production is 85 per cent. |
| 10. | Steelmaking coal production is reported on the basis of saleable product. Production figures may include some thermal coal. |
| 11. | BHP completed the sale of the Blackwater and Daunia mines on 2 April 2024. Production reported until their divestment on 2 April 2024. |
| 12. | Shown on 100 per cent basis. BHP completed the sale of its 80 per cent interest in BHP Mitsui Coal (BMC) on 3 May 2022. Production reported until 30 April 2022. |
| 13. | BHP completed the sale of our 33.3 per cent interest in Cerrejón on 11 January 2022. Production for Cerrejón reported until 31 December 2021. |
| 14. | Nickel contained in matte and refined nickel metal, including briquette, powder, nickel sulphate and by-product streams. |
| 15. | On 11 July 2024, we announced the temporary suspension of operations at Western Australia Nickel from October 2024, with a transition period to commence from July 2024. |
5 Major projects
Jansen Stage 1 (JS1) is 52 per cent complete and remains on track for first production in late CY2026 with a two year ramp up period. The engineering work and execution of procurement agreements is largely complete. In FY2025, underground and surface construction works will continue, including structural, mechanical and electrical activities for the mill areas. We also expect to complete the conversion of the service shaft headframe to a permanent structure. In FY2025, we estimate capex of US$1.3 billion for JS1 (FY2024: US$0.9 billion).
In October 2023, we approved an investment of US$4.9 billion for Jansen Stage 2 (JS2), which when combined with JS1, will increase our total planned potash production capacity to approximately 8.5 Mtpa representing around 10 per cent of the estimated market when fully ramped up. JS2 execution activity has now commenced and is 2 per cent complete, with first production expected in FY2029, followed by a three year ramp up period. In FY2025, the focus will be on detailed engineering, procurement for major equipment and construction packages, and structural steel fabrication. In FY2025, we estimate capex of US$0.5 billion for JS2 (FY2024: US$0.2 billion).
| Commodity | Project and ownership | Project scope/capacity | Capital US$M | First production target date | Progress | |||||||
Potash | Jansen Stage 1 (Canada) | Design, engineering and construction of an underground potash mine and surface infrastructure, with capacity to produce 4.15 Mtpa | 5,723 | End-CY2026 | | Project is 52 complete | %
| |||||
Potash | Jansen Stage 2 (Canada) | Development of additional mining districts, completion of the second shaft hoist infrastructure, expansion of processing facilities and addition of rail cars to facilitate production of an incremental 4.36 Mtpa | 4,859 | FY2029 | | Project is 2 complete | %
| |||||
Capital and exploration expenditure was US$9.3 billion in FY2024. This was made up of investment in organic development of US$5.9 billion, which includes approximately US$2.7 billion on copper projects and approximately US$1.1 billion at Jansen, plus an exploration spend of US$0.5 billion primarily at Copper South Australia; and maintenance1 and decarbonisation expenditure of US$3.0 billion with US$1.2 billion sustaining capital at WAIO to support our medium-term goal of producing >305 Mtpa. In July this year, we signed an agreement with Lundin Mining to jointly acquire Filo Corp. and to enter a joint venture with the intent of developing the Filo del Sol and Josemaria copper projects.
Capital and exploration expenditure of approximately US$10 billion is expected for FY2025, including approximately US$0.5 billion of exploration. In FY2026 and the medium term,2 capital and exploration expenditure of approximately US$11 billion per annum on average is expected. We have flexibility to adjust capital spend and phasing of projects to accommodate market dynamics and cash flow generation. Guidance is subject to exchange rate movements.
| 1. | Maintenance capital includes non-discretionary spend for the following purposes: deferred development and production stripping; risk reduction, compliance and asset integrity. |
| 2. | Average for FY2027–FY2029. |
201
Table of Contents
6 Mineral resources and mineral reserves
Our mineral resources and mineral reserves presented in this annual report have been prepared in accordance with US Securities and Exchange Commission (SEC) regulations Subpart 1300 of Regulation S-K (S-K 1300).
Mineral resource is a concentration or occurrence of material of economic interest in or on the Earth’s crust in such form, grade or quality, and quantity that there are reasonable prospects for economic extraction. A mineral resource is a reasonable estimate of mineralisation, taking into account relevant factors such as cut-off grade, likely mining dimensions, location or continuity, that, with the assumed and justifiable technical and economic conditions, is likely to, in whole or in part, become economically extractable. It is not merely an inventory of all mineralisation drilled or sampled.
Our mineral resources have been classified as measured, indicated or inferred depending on the level of geological certainty and confidence in the estimates, as defined in Item 1300 of S-K 1300.
Mineral reserve is an estimate of tonnage and grade or quality of indicated and measured mineral resources that, in the opinion of the qualified person, can be the basis of an economically viable project. More specifically, it is the economically mineable part of a measured or indicated mineral resource, which includes diluting materials and allowances for losses that may occur when the material is mined or extracted.
Our mineral reserves have been classified as proven and probable depending on the mineral resource classification and level of confidence in the assumptions, as defined in Item 1300 of S-K 1300.
To estimate mineral reserves, assumptions are required about a range of technical and economic factors, including quantities, qualities, production and processing techniques, recovery efficiency, production and transport costs, commodity supply and demand, commodity prices and exchange rates. Estimating the quantity and/or quality of mineral reserves requires the size, shape and depth of ore bodies to be determined by analysing geological data such as drilling samples and geophysical survey interpretations. Economic assumptions used to estimate reserves may change from period to period as additional technical, financial and operational data becomes available.
Our mineral resources and mineral reserves are constrained to tenure that we have rights to. Our mineral leases are of sufficient duration (or convey a legal right to renew for sufficient duration) to enable all reserves on the leased properties to be mined in accordance with current production schedules. Reserves may include areas where some additional approvals remain outstanding, however it is anticipated these approvals will be obtained within the timeframe required by the current life of mine schedules.
Presentation of mineral resources and mineral reserves
Mineral resources and mineral reserves are presented at the proportion attributable to our economic interest and represent estimates as at 30 June 2024. Mineral resources are presented exclusive of mineral reserves. The specific point of reference and commodity prices defining the mineral resources and mineral reserves estimates are provided in the footnotes associated with each of the mineral resources and mineral reserves tables. Quantities of mineral reserves and mineral resources are reported in million metric tonnes (Mt). Tonnes are reported as dry metric tonnes (unless otherwise stated). All tonnes and quality information have been rounded, small differences may be present in the totals. Refer to the glossary for definitions of technical terms relating to mineral resources, mineral reserves, geology, mining or related matters and abbreviations.
Our mineral resources and mineral reserves presented in this annual report differ from the Mineral Resources and Ore Reserves we report in our home jurisdiction of Australia. The jurisdiction of Australia requires reporting in accordance with the Australian Stock Exchange (ASX) listing rules and the Australasian Code for reporting of Exploration Results, Mineral Resources and Ore Reserves, December 2012 (the JORC Code).
A key difference in the estimation of our resources and reserves pursuant to the ASX listing rules and S-K 1300 are the economic inputs, commodity prices and cost assumptions. Estimates we report in accordance with the ASX listing rules are generally based on cost forecasts and internally-generated, projected long-term commodity prices and current operating costs or costs used in studies for development projects.
S-K 1300 requires mineral resources and mineral reserves estimates to be based on reasonable and justifiable commodity prices selected by a qualified person. Further, the prices must provide a reasonable basis for establishing the prospects of economic extraction for mineral resources. Commodity price estimates included in this report are based on historical average commodity prices, which may differ from the price estimates used in the estimation of our resources and reserves pursuant to the ASX listing rules. Our mineral resources are based on the third-quartile average monthly prices over the timeframe of 1 July 2020 to 30 June 2023, unless otherwise stated. Our mineral reserves are based on the second-quartile average monthly prices over the timeframe of 1 July 2020 to 30 June 2023, unless otherwise stated. Exceptions are described in the footnotes associated with each of the mineral resources or mineral reserves tables below.
202
Table of Contents
Unless otherwise stated, the estimates included in this report are based on average costs over the timeframe of 1 July 2020 to 30 June 2023 for production-stage properties or, for development-stage properties, costs are determined from first principles.
For non-operated properties that we have an economic interest in, the commodity prices and costs used are as the operator has advised.
The qualified persons consider that the use of historic prices and costs are appropriate to demonstrate economic viability of the mineral resources and mineral reserves. The prices are factual and the time interval is of sufficient duration to consider a range of price fluctuations. The commodity prices used to estimate the mineral resources and mineral reserves are included as footnotes to the mineral resources and mineral reserves tables below.
Internal controls and assurance programs
We have internal controls over our mineral resources and mineral reserves estimation efforts that are designed to produce reasonable and reliable estimates aligned with industry practice and our regulatory reporting requirements. The governance for our estimation efforts is located at both the asset and the BHP Group level within our Resource Centre of Excellence, an internal assurance team independent of our qualified persons and BHP employees who are responsible for the estimations. The assets provide first line assurance on estimates through peer review and validation processes. The Resource Centre of Excellence is responsible for assurance over the processes implemented by the assets as they relate to mineral resources and mineral reserves estimations and the compiling of the mineral resources and mineral reserves estimates to be reported in accordance with S-K 1300.
Our internal controls utilise management systems, including, but not limited to, formal quality assurance and quality control processes, standardised procedures, workflow processes, data security covering record keeping, chain of custody and data storage, supervision and management approval, reconciliations, internal and external reviews and audits.
Our internal requirements and standards provide the basis for the governance over the estimation and reporting of mineral resources and mineral reserves and provide technical guidance to all reporting assets. These internal requirements and standards are periodically reviewed and updated for alignment with industry practice and reporting regulations.
Our internal controls for exploration data, as they relate to mineral resources and mineral reserves estimations are managed by our operating assets with assurance provided by the Resource Centre of Excellence. These controls include, but are not limited to:
| • | Documented procedures and standards defining minimum requirements on critical aspects to support exploration and resource development programs. |
| • | Peer review of data collection including staged sign off by reviewers. |
| • | Quality control checks on drill hole positions, collar and down hole surveys. |
| • | Geological logs verified by either peer review or cross validation from other data sources, such as, sample analysis, downhole geophysical logging, core photography or scanning technologies. |
| • | Sample security protocols at all stages of handling, from sample collection, transportation, preparation and analysis, including the storage of core or pulps post analysis. |
| • | Industry standard practices for sample analysis quality control. Insertion of standards, duplicates, and blanks into sample batches at a frequency to enable the assessment of analytical data quality. |
| • | Commercial or internal laboratories site inspected periodically and their internal quality control data is reviewed. From time to time a selection of samples are analysed at alternate laboratories to monitor laboratory performance. |
| • | Quality control data reviewed at regular intervals to verify deviations to enable timely remediation. |
| • | Quality assurance and quality control data validation and verification processes in place to support database integrity. This is based on automatic routines inbuilt into the geological databases. Inconsistencies are reviewed, verified and where required rectified by the responsible geologist. |
| • | Geological databases periodically audited from source data. |
| • | Geological data is stored on servers in accordance with BHP security standards, which include controls relating to access and backup routines. |
| • | Geological models, including interpretation and mineralisation domains, internally peer reviewed prior to estimation. |
Our internal controls for mineral resources and mineral reserves estimations include, but are not limited to:
| • | Source data review from database extracts, using exploratory data statistical analysis prior to use in the estimation of mineral resources. Identification of data to exclude, outliers and visual checks against estimation domains. |
| • | Peer reviews of the estimation inputs based on statistical studies and estimation parameters as applied in industry standard estimation software. |
203
Table of Contents
| • | Visual and statistical validation of the estimates against source data and where available reconciliation to previous models, operational models and production data. |
| • | Peer review of the classification applied, considering quantitative measures and qualitative considerations. |
| • | Peer review of assumptions applied that convert resources to reserves. |
| • | Independent audits or reviews for new or materially changed mineral resources and mineral reserves. |
Operating assets manage internal risk registers relating to uncertainties in the mineral resources and mineral reserves estimates to direct future work programs or estimation updates. These may include but are not limited to:
| • | Areas of uncertainty in the estimates impacting local interpretations. |
| • | Bulk density assumptions, based on sample test work or operational results. |
| • | Metallurgical recovery assumptions, based on test work or plant performance. |
| • | Changes in commodity prices, costs and exchange rate assumptions. |
| • | Geotechnical and hydrogeological considerations impacting on underground or open cut mining assumptions. |
| • | Ore loss and dilution, mining selectivity and production rate assumptions. |
| • | Cut-off value changes to meet product specifications. |
| • | Changes in environmental, permitting and social license to operate assumptions. |
Further to assurance activities by the assets specifically relating to the estimation of mineral resources and mineral reserves, the Resource Centre of Excellence with subject matter experts have developed standards and guidelines across BHP for reviewing and documenting the information supporting our mineral resources and mineral reserves estimates, describing the methods used and verifying the reliability of such estimates. These activities are supported by the following controls:
| • | The reporting of mineral resources and mineral reserves estimates are required to follow BHP’s standard procedures for public reporting in accordance with current regulatory requirements. |
| • | Annual risk reviews are conducted with qualified persons and BHP employees on all mineral resources and mineral reserves to be reported. Including year on year change impact assessment, reconciliation performance metrics for the operating mines and control assessment for the estimation inputs. The information and supporting documentation is prepared by the applicable qualified persons relating to the estimates and is evaluated for compliance with BHP’s internal controls. Based on these reviews, recommendations of endorsement are provided to our senior management for the use and reporting of the mineral resources and mineral reserves estimates. |
| • | Periodic internal technical ‘deep dive’ assessments of mineral resources and mineral reserves estimates are conducted on a frequency that is informed by asset materiality and outcomes of the annual risk reviews. |
| • | Management and closure reviews of actions assigned to qualified persons and BHP employees resulting from the annual risk reviews and technical ‘deep dive’ assessments are conducted. |
| • | Assurance is undertaken over the reporting documentation provided by qualified persons for public release and management and verification of inputs into BHP mineral resources and mineral reserves reporting database. |
The Resource Centre of Excellence also provides an annual update on assurance activities and changes relating to our mineral resources and mineral reserves estimation efforts to the Risk and Audit Committee (RAC) in connection with the RAC’s responsibility over the effectiveness of systems of internal control and risk management of BHP.
Inherent risks in the estimation of mineral resources and mineral reserves
The estimation of our mineral resources and mineral reserves are largely based on historical average prices of the commodities we produce or intend to produce, primarily iron ore, copper, coal and potash. Estimated annual cash flows from our future operations, estimated production schedules, estimated capital expenditure and operating costs, estimated site closure costs, estimated royalty and tax costs, valuation assumptions and interpretations of geologic data obtained from drill holes and other exploration techniques, all of which may not necessarily be indicative of future results. The assumptions and interpretations used to estimate our mineral resources and mineral reserves may change from period to period, and, because additional geological data generated during the course of our operations may not be consistent with the data on which we based our mineral resources and mineral reserves, such estimates may change from period to period or may need to be revised. No assurance can be given that our mineral resources or mineral reserves presented in this report will be recovered at the grade, quality or quantities presented or at all.
There are numerous uncertainties inherent in the estimation of mineral resources and mineral reserves. Areas of uncertainty that may materially impact our mineral resources or mineral reserves estimates may include, but are not limited to: (i) changes to long-term commodity prices, external market factors, foreign exchange rates and other economic assumptions; (ii) changes in geological interpretations of mineral deposits and geological modelling, including estimation input parameters and techniques; (iii) changes to metallurgical or process recovery assumptions which adversely affect the volume, grade or qualities of our commodities produced (for example, processing that results in higher deleterious elements that result in penalties) or other changes to mining method assumptions; (iv) changes to input assumptions used to derive the potentially mineable shapes applicable to the assumed underground or open pit mining methods used to constrain the estimates; (v) changes to life of mine or production rate assumptions; (vi) changes to dilution and mining recovery assumptions; (vii) changes to cut-off grades applied to the estimates; (viii) changes to geotechnical data, structures, rock mass strength, stress regime, hydrogeological, hydrothermal or geothermal factors; (ix) changes to infrastructure supporting the operations of or access to the applicable mine site; (x) changes to mineral, surface, water or other natural resources rights; (xi) changes to royalty, taxes, environmental, permitting and social license assumptions in the jurisdictions in which we operate; and (xii) changes in capital or operating costs.
204
Table of Contents
Additionally, the term “mineral resources” does not indicate recoverable proven and probable mineral reserves pursuant to S-K 1300. Estimates of mineral resources are subject to further exploration and evaluation of development and operating costs, grades, recoveries and other material factors, and, therefore, are subject to considerable uncertainty. Mineral resources do not meet the threshold for mineral reserve modifying factors, such as engineering, legal or economic feasibility, that would allow for the conversion to mineral reserves. Accordingly, no assurance can be given that our mineral resources not included in mineral reserves will become recoverable proven and probable mineral reserves.
Refer to “Forward-looking statements” and the risk factors set out in OFR 8.1 for other factors that may affect our mineral resources and mineral reserves estimates.
205
Table of Contents
6.1 Copper
Mineral resources
As at 30 June 2024
Copper1,2 | Mining method | Measured Mineral Resources | Indicated Mineral Resources | Measured + Indicated Mineral Resources | Inferred Mineral Resources | |||||||||||||||||||||||||||||||||||||||||||||||||||||||||||||||||||||||||||||||
| Tonnage | Qualities | Tonnage | Qualities | Tonnage | Qualities | Tonnage | Qualities | |||||||||||||||||||||||||||||||||||||||||||||||||||||||||||||||||||||||||||||
| Mt | %Cu | g/tAu | Mt | %Cu | g/tAu | Mt | %Cu | g/tAu | Mt | %Cu | g/tAu | |||||||||||||||||||||||||||||||||||||||||||||||||||||||||||||||||||||||||
Chile |
| |||||||||||||||||||||||||||||||||||||||||||||||||||||||||||||||||||||||||||||||||||
Escondida3,4,5,6,7 | ||||||||||||||||||||||||||||||||||||||||||||||||||||||||||||||||||||||||||||||||||||
Oxide | OC | 15 | 0.38 | – | – | – | 6.0 | 0.53 | – | – | – | 21 | 0.42 | – | – | – | 1.0 | 0.51 | – | – | – | |||||||||||||||||||||||||||||||||||||||||||||||||||||||||||||||
Mixed | OC | – | – | – | – | – | 16 | 0.48 | – | – | – | 16 | 0.48 | – | – | – | 12 | 0.45 | – | – | – | |||||||||||||||||||||||||||||||||||||||||||||||||||||||||||||||
Sulphide | OC | 296 | 0.43 | – | – | – | 1,420 | 0.54 | – | – | – | 1,720 | 0.52 | – | – | – | 5,510 | 0.53 | – | – | – | |||||||||||||||||||||||||||||||||||||||||||||||||||||||||||||||
|
|
|
|
|
|
|
|
|
|
|
|
|
|
|
|
|
|
|
|
|
|
|
|
|
|
|
|
|
|
|
|
|
|
|
|
|
|
|
| |||||||||||||||||||||||||||||||||||||||||||||
Escondida Total | 311 | 0.43 | – | – | – | 1,450 | 0.54 | – | – | – | 1,760 | 0.52 | – | – | – | 5,520 | 0.53 | – | – | – | ||||||||||||||||||||||||||||||||||||||||||||||||||||||||||||||||
|
|
|
|
|
|
|
|
|
|
|
|
|
|
|
|
|
|
|
|
|
|
|
|
|
|
|
|
|
|
|
|
|
|
|
|
|
|
|
| |||||||||||||||||||||||||||||||||||||||||||||
Pampa Norte8 | OC | 402 | 0.42 | – | – | – | 634 | 0.44 | – | – | – | 1,040 | 0.43 | – | – | – | 835 | 0.41 | – | – | – | |||||||||||||||||||||||||||||||||||||||||||||||||||||||||||||||
Brazil |
| |||||||||||||||||||||||||||||||||||||||||||||||||||||||||||||||||||||||||||||||||||
Pedra Branca9 | UG | 0.26 | 1.48 | 0.46 | 3.1 | 1.58 | 0.41 | 3.4 | 1.58 | 0.42 | 5.1 | 1.48 | 0.37 | |||||||||||||||||||||||||||||||||||||||||||||||||||||||||||||||||||||||
| Australia | Mt | %Cu | kg/tU3O8 | g/tAu | g/tAg | Mt | %Cu | kg/tU3O8 | g/tAu | g/tAg | Mt | %Cu | kg/tU3O8 | g/tAu | g/tAg | Mt | %Cu | kg/tU3O8 | g/tAu | g/tAg | ||||||||||||||||||||||||||||||||||||||||||||||||||||||||||||||||
Olympic Dam10 | UG | 527 | 1.32 | 0.36 | 0.54 | 2 | 372 | 1.30 | 0.36 | 0.47 | 3 | 899 | 1.31 | 0.36 | 0.51 | 2 | 190 | 1.44 | 0.41 | 0.63 | 3 | |||||||||||||||||||||||||||||||||||||||||||||||||||||||||||||||
| Mt | %Cu | g/tAu | g/tAg | Mt | %Cu | g/tAu | g/tAg | Mt | %Cu | g/tAu | g/tAg | Mt | %Cu | g/tAu | g/tAg | |||||||||||||||||||||||||||||||||||||||||||||||||||||||||||||||||||||
Prominent Hill & Carrapateena11 | UG | 80 | 0.86 | 0.39 | 3 | – | 430 | 0.50 | 0.25 | 2 | – | 510 | 0.56 | 0.28 | 2 | – | 360 | 0.37 | 0.26 | 2 | – | |||||||||||||||||||||||||||||||||||||||||||||||||||||||||||||||
| Peru | Mt | %Cu | %Zn | g/tAg | ppmMo | Mt | %Cu | %Zn | g/tAg | ppmMo | Mt | %Cu | %Zn | g/tAg | ppmMo | Mt | %Cu | %Zn | g/tAg | ppmMo | ||||||||||||||||||||||||||||||||||||||||||||||||||||||||||||||||
Antamina12 | | OC & UG | | 77 | 0.76 | 0.38 | 10 | 180 | 150 | 0.87 | 0.70 | 12 | 190 | 227 | 0.83 | 0.59 | 11 | 190 | 400 | 1.03 | 0.57 | 11 | 170 | |||||||||||||||||||||||||||||||||||||||||||||||||||||||||||||
|
|
|
|
|
|
|
|
|
|
|
|
|
|
|
|
|
|
|
|
|
|
|
|
|
|
|
|
|
|
|
|
|
|
|
|
|
|
|
| |||||||||||||||||||||||||||||||||||||||||||||
Total copper | 1,400 | 0.81 | – | – | – | 3,040 | 0.62 | – | – | – | 4,440 | 0.68 | – | – | – | 7,310 | 0.56 | – | – | – | ||||||||||||||||||||||||||||||||||||||||||||||||||||||||||||||||
|
|
|
|
|
|
|
|
|
|
|
|
|
|
|
|
|
|
|
|
|
|
|
|
|
|
|
|
|
|
|
|
|
|
|
|
|
|
|
| |||||||||||||||||||||||||||||||||||||||||||||
| 1 | Mineral resources are reported in this report in accordance with S-K 1300 and are presented for the portion attributable to BHP’s economic interest. All tonnes and quality information have been rounded, small differences may be present in the totals. |
| 2 | Mineral resources are presented exclusive of mineral reserves. |
| 3 | Escondida, in which BHP has a 57.5% interest, is considered a material property for purposes of Item 1304 of S-K 1300. |
| 4 | Escondida point of reference for the mineral resources was mine gate. |
| 5 | Escondida mineral resources estimates were based on a copper price of US$4.29/lb. |
| 6 | Escondida mineral resources cut-off criteria used was Oxide ≥ 0.20% soluble Cu; Mixed ≥ 0.30% Cu; Sulphide ≥ 0.25% Cu for mineralisation assigned to be processed via leaching or ≥ 0.30% Cu for mineralisation assigned to be processed via the concentrator. |
| 7 | Escondida metallurgical recoveries were Oxide 62%; Mixed 42%; Sulphide 42% for material processed by sulphide leach, Sulphide 77% for material processed by Full Sal and Sulphider 85% for material processed via the concentrator. |
| 8 | Pampa Norte, in which BHP has a 100% interest, includes Cerro Colorado and Spence deposits. The mineral resources estimates were based on a copper price of US$4.29/lb. The point of reference for the mineral resources was mine gate. |
| 9 | Pedra Branca mineral resources, in which BHP has a 100% interest, were based on historic asset determined prices with a copper price of US$4.13/lb and gold price of US$1,650/oz. The point of reference for the mineral resources was in situ. |
| 10 | Olympic Dam mineral resources estimates, in which BHP has a 100% interest, were based on a copper price of US$4.29/lb, uranium oxide price of US$49.74/lb, gold price of US$1,899/troy oz and silver price of US$25.33/troy oz. The point of reference for the mineral resources was mine gate, ex-processing. |
| 11 | Prominent Hill & Carrapateena mineral resources estimates, in which BHP has a 100% interest, were based on historic asset determined prices with a copper price of US$3.40/lb, gold price of US$1450/troy oz and silver price of US$19/troy oz. The point of reference for the mineral resources was in situ. |
| 12 | Antamina mineral resources estimates, in which BHP has a 33.75% interest, were based on a copper price of US$3.50/lb, zinc price of US$1.30/lb, silver price of US$24.60/troy oz and molybdenum price of US$13.30/lb. The point of reference for the mineral resources was in situ. |
206
Table of Contents
Mineral reserves
As at 30 June 2024
Copper1 | Mining method | Proven Mineral Reserves | Probable Mineral Reserves | Total Mineral Reserves | ||||||||||||||||||||||||||||||||||||||||||||||||||||||||||||
| Tonnage | Qualities | Tonnage | Qualities | Tonnage | Qualities | |||||||||||||||||||||||||||||||||||||||||||||||||||||||||||
| Mt | %Cu | Mt | %Cu | Mt | %Cu | |||||||||||||||||||||||||||||||||||||||||||||||||||||||||||
Chile | ||||||||||||||||||||||||||||||||||||||||||||||||||||||||||||||||
Escondida2,3,4,5,6 | ||||||||||||||||||||||||||||||||||||||||||||||||||||||||||||||||
Full SaL | OC | 113 | 0.77 | – | – | – | 13 | 0.68 | – | – | – | 126 | 0.76 | – | – | – | ||||||||||||||||||||||||||||||||||||||||||||||||
Sulphide | OC | 1,860 | 0.64 | – | – | – | 690 | 0.54 | – | – | – | 2,550 | 0.61 | – | – | – | ||||||||||||||||||||||||||||||||||||||||||||||||
Sulphide Leach | OC | 701 | 0.39 | – | – | – | 152 | 0.40 | – | – | – | 853 | 0.39 | – | – | – | ||||||||||||||||||||||||||||||||||||||||||||||||
|
|
|
|
|
|
|
|
|
|
|
|
|
|
|
|
|
|
|
|
|
|
|
|
|
|
|
|
|
| |||||||||||||||||||||||||||||||||||
Escondida Total | 2,670 | 0.58 | – | – | – | 855 | 0.52 | – | – | – | 3,530 | 0.57 | – | – | – | |||||||||||||||||||||||||||||||||||||||||||||||||
|
|
|
|
|
|
|
|
|
|
|
|
|
|
|
|
|
|
|
|
|
|
|
|
|
|
|
|
|
| |||||||||||||||||||||||||||||||||||
Pampa Norte7 | OC | 607 | 0.54 | – | – | – | 383 | 0.51 | – | – | – | 990 | 0.53 | – | – | – | ||||||||||||||||||||||||||||||||||||||||||||||||
| Brazil | Mt | %Cu | g/tAu | Mt | %Cu | g/tAu | Mt | %Cu | g/tAu | |||||||||||||||||||||||||||||||||||||||||||||||||||||||
|
|
|
|
|
|
|
|
|
|
|
|
|
|
|
|
|
| |||||||||||||||||||||||||||||||||||||||||||||||
Pedra Branca8 | UG | 0.31 | 1.65 | 0.49 | – | – | 2.6 | 2.07 | 0.53 | – | – | 2.9 | 2.03 | 0.52 | – | – | ||||||||||||||||||||||||||||||||||||||||||||||||
| Australia | Mt | %Cu | kg/tU3O8 | g/tAu | g/tAg | Mt | %Cu | kg/tU3O8 | g/tAu | g/tAg | Mt | %Cu | kg/tU3O8 | g/tAu | g/tAg | |||||||||||||||||||||||||||||||||||||||||||||||||
Olympic Dam9 | UG | 283 | 1.97 | 0.61 | 0.74 | 5 | 268 | 1.73 | 0.57 | 0.59 | 3 | 551 | 1.85 | 0.59 | 0.67 | 4 | ||||||||||||||||||||||||||||||||||||||||||||||||
| Mt | %Cu | g/tAu | g/tAg | Mt | %Cu | g/tAu | g/tAg | Mt | %Cu | g/tAu | g/tAg | |||||||||||||||||||||||||||||||||||||||||||||||||||||
Prominent Hill & Carrapateena10 | UG | 23 | 1.18 | 0.54 | 3 | – | 162 | 1.21 | 0.53 | 4 | – | 185 | 1.21 | 0.52 | 4 | – | ||||||||||||||||||||||||||||||||||||||||||||||||
| Peru | Mt | %Cu | %Zn | g/tAg | ppmMo | Mt | %Cu | %Zn | g/tAg | ppmMo | Mt | %Cu | %Zn | g/tAg | ppmMo | |||||||||||||||||||||||||||||||||||||||||||||||||
Antamina11 | OC | 39 | 0.92 | 0.49 | 10 | 290 | 27 | 1.01 | 0.95 | 13 | 230 | 66 | 0.96 | 0.68 | 11 | 270 | ||||||||||||||||||||||||||||||||||||||||||||||||
|
|
|
|
|
|
|
|
|
|
|
|
|
|
|
|
|
|
|
|
|
|
|
|
|
|
|
|
|
| |||||||||||||||||||||||||||||||||||
Total copper | 3,620 | 0.69 | – | – | – | 1,700 | 0.78 | – | – | – | 5,320 | 0.72 | – | – | – | |||||||||||||||||||||||||||||||||||||||||||||||||
|
|
|
|
|
|
|
|
|
|
|
|
|
|
|
|
|
|
|
|
|
|
|
|
|
|
|
|
|
| |||||||||||||||||||||||||||||||||||
| 1 | Mineral reserves are reported in this report in accordance with S-K 1300 and are presented for the portion attributable to BHP’s economic interest. All tonnes and quality information have been rounded, small differences may be present in the totals. |
| 2 | Escondida, in which BHP has a 57.5% interest, is considered a material property for purposes of Item 1304 of S-K 1300. |
| 3 | Escondida point of reference for the mineral reserves was mine gate. |
| 4 | Escondida mineral reserves estimates were based on a copper price of US$4.03/lb. |
| 5 | Escondida mineral reserves cut-off criteria used was Full SaL ≥ 0.20% soluble Cu. For Sulphide ≥ 0.30% Cu and where greater than the variable cut-off of the concentrator. Sulphide ore is processed in the concentrator plants as a result of an optimised mine plan with consideration of technical and economic parameters in order to maximise net present value. Sulphide Leach ≥ 0.25% Cu and 70% or less of copper contained in chalcopyrite and lower than the variable cut-off grade. Sulphide leach ore is processed in the leaching plant as an alternative to the concentrator process. |
| 6 | Escondida metallurgical recoveries for Full SaL 76% (Oxide 62%, Mixed 42%, Sulphide 77%); Sulphide Leach 42%; Sulphide 85% for material processed via the concentrator. |
| 7 | Pampa Norte, in which BHP has a 100% interest, includes Spence deposit. The mineral reserves estimates were based on a copper price of US$4.03/lb. The point of reference for the mineral reserves was mine gate. |
| 8 | Pedra Branca mineral reserves estimates, in which BHP has a 100% interest, were based on historic asset determined prices with a copper price of US$7,960/t and gold price of US$1,550/oz. The point of reference for the mineral reserves was mine gate. |
| 9 | Olympic Dam mineral reserves estimates, in which BHP has a 100% interest, were based on a copper price of US$4.03/lb, uranium oxide price of US$44.46/lb, gold price of US$1839/troy oz and silver price of US$23.88/troy oz. The point of reference for the mineral reserves was mine gate, ex-processing. |
| 10 | Prominent Hill & Carrapateena, in which BHP has a 100% interest, were based on historic asset determined prices with a copper price of US$3.40/lb, gold price of US$1450/troy oz and silver price of US$19/troy oz. The point of reference for the mineral reserves was mine gate, ex-processing. |
| 11 | Antamina mineral reserves estimates, in which BHP has a 33.75% interest, were based on a copper price of US$3.50/lb, zinc price of US$1.10/lb, silver price of US$21.50/troy oz and molybdenum price of US$11.10/lb. The point of reference for the mineral reserves was delivery to processing plant. |
207
Table of Contents
6.2 Escondida individual property disclosure
6.2.1 Property description
Escondida copper mine (Escondida) is a production stage property operated by Minera Escondida Limitada (MEL) consisting of Escondida and Escondida Norte deposits located in the Atacama Desert of northern Chile, approximately 170 km south-east of Antofagasta at an elevation of approximately 3,100 m above sea level.
The location of the operations centred upon the two pits are listed and shown below.
| • | Escondida: Latitude 24°16’ S, Longitude 69° 04’ W |
| • | Escondida Norte: Latitude 24°13’ S, Longitude 69° 03’ W |
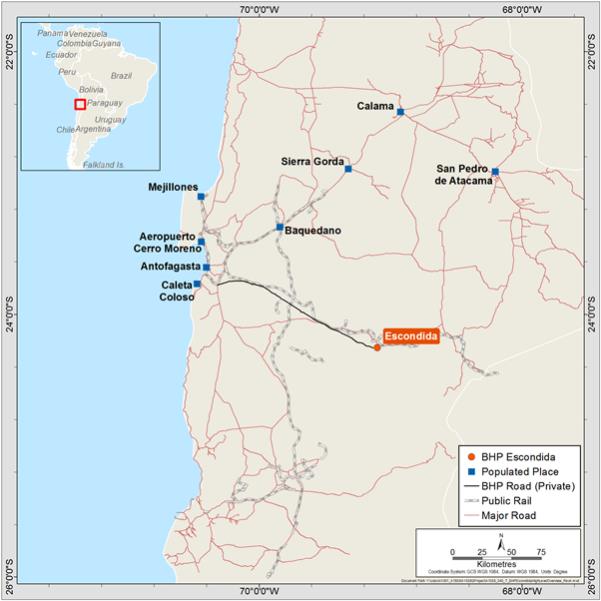
6.2.2 Infrastructure
All required infrastructure supporting the current mine plan including roads, rail and port, power and water supply is in place. Access to the property is via a company maintained private road available for public use from Antofagasta. The city of Antofagasta is serviced by the regional airport.
The site infrastructure, centred on the two pits, includes three sulphide concentrator plants, two leaching process facilities, associated cathode production plant, tailings storage facility, along with support and service facilities.
208
Table of Contents
The nearby Coloso port facility receives copper concentrate via a pipeline from the mine site and processes this to a dry concentrate ready for stockpiling and loading via a dedicated concentrate ship loading facility. Both concentrate pipeline and port facilities are owned and operated by MEL.
Additional third-party owned port infrastructure is located at Antofagasta, including rail, train unloading and ship loading facilities.
Escondida utilises an existing privately owned railway system to transport copper cathode product from site and consumables to site through the ports of Antofagasta and Mejillones. Escondida owns a minor rail spur connecting the mine site into the publicly owned railway.
The source of water for the mine, processing plants and supporting infrastructure is provided from two seawater desalination plants located at Punta Coloso, and pumping facilities to site via two pipelines. Water is recovered from the tailings dam for re-use in the concentrator plants.
From January FY22 the total energy consumption of Escondida comes from renewable sources. This energy is provided through the current contracts of Enel and Colbún with an annual available consumption of 5.8 TWh/year. From FY25 onwards, Escondida is expected to have an available energy consumption of 6.0 TWh/year, due to the extension of the Colbún contract, which delivers energy from 100% renewable sources, supporting our goals to reduce CO2 emissions.
The workforce is a combination of employees and contractors supporting the operations. Operational personnel reside on site in MEL accommodation and are sourced from Antofagasta or from other parts of Chile.
6.2.3 Mineral tenure
MEL holds a total of 764 mining concessions covering an area of 406,018 ha. There are 18 principal mining concessions that provide MEL with the right to explore and mine indefinitely, subject to payment of annual license fees. All leases were obtained through the legally established process in which judicial requests are presented to the Chilean state.
Lease name | Registered tenement holder | Expiry date | Surface area (ha) | Annual rent and rate (UTM)1 | ||||||||
Alexis 1/1424 | Minera Escondida Ltda. | Permanent | 7,059 | 705.9 | ||||||||
Amelia 1/1049 | Minera Escondida Ltda. | Permanent | 5,235 | 523.5 | ||||||||
Catita 1/376 | Minera Escondida Ltda. | Permanent | 1,732 | 173.2 | ||||||||
Claudia 1/70 | Minera Escondida Ltda. | Permanent | 557 | 55.7 | ||||||||
Colorado 501/977 | Minera Escondida Ltda. | Permanent | 2,385 | 238.5 | ||||||||
Costa 1/1861 | Minera Escondida Ltda. | Permanent | 9,159 | 915.9 | ||||||||
Donaldo 1/612 | Minera Escondida Ltda. | Permanent | 3,060 | 306.0 | ||||||||
Ela 1/100 | Minera Escondida Ltda. | Permanent | 500 | 50.0 | ||||||||
Gata 1 1/100 | Minera Escondida Ltda. | Permanent | 400 | 40.0 | ||||||||
Gata 2 1/50 | Minera Escondida Ltda. | Permanent | 200 | 20.0 | ||||||||
Guillermo 1/368 | Minera Escondida Ltda. | Permanent | 1,785 | 178.5 | ||||||||
Hole 14 | Minera Escondida Ltda. | Permanent | 1 | 0.1 | ||||||||
Naty 1/46 | Minera Escondida Ltda. | Permanent | 230 | 23.0 | ||||||||
Paola 1/3000 | Minera Escondida Ltda. | Permanent | 15,000 | 1,500.0 | ||||||||
Pista 1/22 | Minera Escondida Ltda. | Permanent | 22 | 2.2 | ||||||||
Pistita 1/5 | Minera Escondida Ltda. | Permanent | 9 | 0.9 | ||||||||
Ramón 1/640 | Minera Escondida Ltda. | Permanent | 3,200 | 320.0 | ||||||||
Rola 1/1680 | Minera Escondida Ltda. | Permanent | 8,400 | 840.0 | ||||||||
|
|
|
| |||||||||
Total | 58,934 | 5,893.0 | ||||||||||
|
|
|
| |||||||||
| 1 | Unidad Tributaria Mensual (UTM) is a Chilean state tax unit valued in Chilean pesos (CLP) per hectare. The 2024 rate is 0.1 UTM. Annual payments are made at the end of the Chilean tax year (end of March) for concessions. |
In addition to mining concessions, Chilean law also regulates, independently of mining concessions, the rights to the use of the land surface. MEL owns 155,000 ha of surface rights and these are also renewable on an annual basis. These rights are also obtained through legal process presented to the Chilean state and potentially to other third party owners, including the Chilean “Consejo de Defensa del Estado” as required, MEL’s main surface rights cover operational activities such as pits, dumps, leach pads, plant and other infrastructure.
209
Table of Contents
Infrastructure | Surface rights identifier1 | Surface area (ha) | ||||||||||
Folio | Number | Year | Register | Regional office | ||||||||
Pits, waste dumps, leach pads, plants | 619 V | 964 | 1984 | Hipotecas y Gravámenes | Bienes Raíces Antofagasta | 22,084 | ||||||
Energy transmission lines, aqueducts, mineral pipelines, roads | 1121 V | 1117 | 2018 | Hipotecas y Gravámenes | Bienes Raíces Antofagasta | 26,988 | ||||||
| 1 | As defined by Chilean legal requirements |
MEL also holds maritime concessions for the Coloso port facilities. These concessions are requested through submission of the proposed project to the Chilean Ministry of Defence and are awarded by legal decree.
6.2.4 Registrant interest
BHP does not hold any royalty in the Escondida property in addition to its economic interest of 57.5%.
6.2.5 Present condition of property
Escondida is a production-stage property actively operating two open cut mines, Escondida and Escondida Norte.
Continuous resource definition activities are ongoing to upgrade mineral resources understanding to support the mine plans and to develop mineral reserves. These activities include drilling and in-pit mapping. Geological understanding of the two deposits is supported by a total of approximately 2,732 km of drilling undertaken in a total of approximately 8,737 drill holes.
Surface mining is by drilling and blasting along with shovel/excavator loading and truck haulage from each of the two open pits. Extracted sulphide ore undergoes crushing prior to processing in one of three concentrators with concentrate piped to the Coloso port for drying. Lower grade sulphide ore is directly dumped onto leach pads and is processed by biological leaching. Oxide and transitional ores are processed using heap leaching. Leached products are converted to copper cathode then railed to Antofagasta port.
6.2.6 Physical condition
Construction commenced on the Escondida property in 1988 with first production in 1990. A number of expansion phases followed from 1993 onwards which included the development of additional infrastructure to increase production. Key milestones subsequent to first production in 1990 relating to the development of the operations were:
| • | 1998 Acid heap leaching of oxides commenced |
| • | 2002 Second concentrator (Phase 4) inaugurated |
| • | 2005 Mining commenced at Escondida Norte |
| • | 2006 Dump bio-leaching of sulphides commenced |
| • | 2007 First desalination plant commenced pumping |
| • | 2016 Third concentrator inaugurated |
| • | 2017 Second desalination plant commenced pumping |
| • | 2020 Operation converted to 100% use of desalination water |
The operations undertake planned maintenance programs and implement scheduled replacement of mine fleet and infrastructure components that is intended to maintain the continued reliable operating of equipment, facilities and infrastructure to meet operational requirements.
6.2.7 Book value
The total book value for the Escondida property and its associated plant and equipment was US$11.8 billion as of 30 June 2024.
6.2.8 History of previous operations
Utah International Inc. (Utah) and Getty Oil Co. (Getty) commenced geochemical exploration in the region in 1978 which led to the discovery of Escondida deposit in 1981. In 1984 through corporate acquisitions, BHP acquired the Escondida property. Ownership changed in 1985 to a joint venture between BHP (57.5%), Rio Tinto Zinc (30%), JECO Corporation (10%) and World Bank (2.5%). The joint venture undertook all the subsequent exploration and development work to bring Escondida into operation in 1990. Current ownership, since 2010, is BHP (57.5%), Rio Tinto (30%), JECO Corporation (10%) and JECO 2 Limited (2.5%). Minera Escondida Limitada operates Escondida.
210
Table of Contents
6.2.9 Significant encumbrances
Minera Escondida holds the licenses to operate pursuant to the current mine plan. BHP is not aware of any material encumbrances that would impact the current mineral resources or mineral reserves.
6.2.10 Geology and mineralisation
The Escondida and Escondida Norte copper deposits lie in the Escondida-Sierra de Varas shear lens of the Domeyko Fault System. The deposits are supergene-enriched copper porphyries with primary sulphide mineralisation associated with multiple phase intrusions of monzonite to granodiorite composition into host volcanics.
Primary mineralisation has undergone secondary supergene leaching and enrichment with associated local formation of copper oxide mineralisation, predominately brochantite. Supergene enrichment generated laterally-continuous and sub-horizontal high-grade sulphide mineralisation zones across the deposit, predominately chalcocite and covellite. The primary hypogene mineralisation, present in the deepest parts of the deposits is chalcopyrite with bornite.
6.2.11 Mineral resources and mineral reserves
Tables of mineral resources and mineral reserves for Escondida reported by ore type are included in section 6.1 above.
6.2.12 Changes to mineral resources and mineral reserves
Total mineral resources as at 30 June 2024 were 7,280 Mt, compared to the previous year as at 30 June 2023 which were 7,540 Mt, a decrease of 3% (-260 Mt). The changes were mainly due to mine factors and inclusion of additional drilling results to the estimate.
Total mineral reserves as at 30 June 2024 were 3,530 Mt, compared to the previous year as at 30 June 2023 which were 3,540 Mt, a decrease of less than 1% (-10 Mt). The changes were mainly due to depletion and increases in operating costs, partially offset by increase in commodity price.
6.2.13 Material assumptions and criteria
Material assumptions in the estimation of mineral resources are:
| • | Resources estimated using Ordinary Kriging |
| • | The sample data preparation including data capping |
| • | The pit optimisation used to determine the resources that have reasonable prospects of economic extraction |
| • | Commodity price |
Material assumptions in the estimation of mineral reserves are:
| • | The classified resource model |
| • | Variable cut-off grade strategy that maximises throughput for the concentrator, smelter and refinery |
| • | Mining dilution and mining recovery |
| • | Processing plant throughput and yields |
| • | The exchange rate |
| • | The geotechnical parameters |
| • | Commodity prices, operating and capital costs |
Details of the material assumptions are described in the Technical Report Summary (effective 30 June 2022) incorporated as an exhibit to this Annual Report by reference to the exhibit to the Annual Report on Form 20-F for the year ended 30 June 2023, sections 11 Mineral Resource Estimates, 12 Mineral Reserve Estimates, 13 Mining Methods, 14 Processing and Recovery Methods and 18 Capital and Operating Costs.
211
Table of Contents
| 6.3 | Iron ore |
Mineral resources
As at 30 June 2024
Iron ore1,2 | Mining method | Measured Mineral Resources | Indicated Mineral Resources | Measured + Indicated Mineral Resources | Inferred Mineral Resources | |||||||||||||||||||||||||||||||||||||||||||||||||||||||||||||||||||||||||||||||||||||||||||||||
| Tonnage | Qualities | Tonnage | Qualities | Tonnage | Qualities | Tonnage | Qualities | |||||||||||||||||||||||||||||||||||||||||||||||||||||||||||||||||||||||||||||||||||||||||||||
| Mt | %Fe | %P | %SiO2 | %Al2O3 | %LOI | Mt | %Fe | %P | %SiO2 | %Al2O3 | %LOI | Mt | %Fe | %P | %SiO2 | %Al2O3 | %LOI | Mt | %Fe | %P | %SiO2 | %Al2O3 | %LOI | |||||||||||||||||||||||||||||||||||||||||||||||||||||||||||||||||||||||||||||
Australia |
| |||||||||||||||||||||||||||||||||||||||||||||||||||||||||||||||||||||||||||||||||||||||||||||||||||
WAIO3,4,5,6,7,8 | ||||||||||||||||||||||||||||||||||||||||||||||||||||||||||||||||||||||||||||||||||||||||||||||||||||
Mt Newman | OC | 240 | 61.3 | 0.10 | 3.0 | 2.2 | 6.3 | 1,120 | 60.2 | 0.13 | 4.5 | 2.7 | 6.0 | 1,360 | 60.4 | 0.12 | 4.2 | 2.6 | 6.1 | 1,820 | 59.6 | 0.12 | 4.8 | 2.6 | 6.5 | |||||||||||||||||||||||||||||||||||||||||||||||||||||||||||||||||||||||||||
Goldsworthy9 | OC | 90 | 57.7 | 0.11 | 7.0 | 3.1 | 6.8 | 460 | 59.5 | 0.07 | 5.4 | 2.9 | 5.9 | 550 | 59.2 | 0.07 | 5.6 | 2.9 | 6.0 | 3,870 | 60.0 | 0.10 | 5.0 | 2.3 | 6.3 | |||||||||||||||||||||||||||||||||||||||||||||||||||||||||||||||||||||||||||
Yandi | OC | 360 | 58.4 | 0.11 | 4.7 | 2.3 | 8.8 | 1,270 | 59.4 | 0.14 | 4.5 | 2.3 | 7.5 | 1,630 | 59.2 | 0.14 | 4.5 | 2.3 | 7.8 | 1,850 | 58.0 | 0.13 | 5.4 | 2.6 | 8.2 | |||||||||||||||||||||||||||||||||||||||||||||||||||||||||||||||||||||||||||
Jimblebar | OC | 70 | 57.7 | 0.20 | 6.4 | 3.6 | 6.0 | 130 | 57.0 | 0.14 | 6.6 | 4.2 | 6.6 | 200 | 57.3 | 0.16 | 6.5 | 4.0 | 6.4 | 220 | 58.3 | 0.10 | 6.1 | 3.4 | 6.2 | |||||||||||||||||||||||||||||||||||||||||||||||||||||||||||||||||||||||||||
BHP (Non-JV)10 | OC | 220 | 60.0 | 0.13 | 5.1 | 2.6 | 5.9 | 110 | 58.0 | 0.11 | 6.8 | 2.9 | 6.7 | 340 | 59.3 | 0.12 | 5.6 | 2.7 | 6.2 | 2,020 | 58.9 | 0.13 | 4.8 | 2.8 | 7.1 | |||||||||||||||||||||||||||||||||||||||||||||||||||||||||||||||||||||||||||
|
|
|
|
|
|
|
|
|
|
|
|
|
|
|
|
|
|
|
|
|
|
|
|
|
|
|
|
|
|
|
|
|
|
|
|
|
|
|
|
|
|
|
|
|
|
|
| |||||||||||||||||||||||||||||||||||||||||||||||||||||
WAIO Total | 980 | 59.4 | 0.12 | 4.7 | 2.5 | 7.2 | 3,090 | 59.6 | 0.12 | 4.8 | 2.6 | 6.7 | 4,070 | 59.5 | 0.12 | 4.8 | 2.6 | 6.8 | 9,780 | 59.3 | 0.12 | 5.0 | 2.6 | 6.9 | ||||||||||||||||||||||||||||||||||||||||||||||||||||||||||||||||||||||||||||
|
|
|
|
|
|
|
|
|
|
|
|
|
|
|
|
|
|
|
|
|
|
|
|
|
|
|
|
|
|
|
|
|
|
|
|
|
|
|
|
|
|
|
|
|
|
|
| |||||||||||||||||||||||||||||||||||||||||||||||||||||
Brazil |
| Mt | %Fe | %Pc | Mt | %Fe | %Pc | Mt | %Fe | %Pc | Mt | %Fe | %Pc | |||||||||||||||||||||||||||||||||||||||||||||||||||||||||||||||||||||||||||||||||||||||
|
|
|
|
|
|
|
|
|
|
|
|
|
|
|
|
|
|
|
|
|
|
|
| |||||||||||||||||||||||||||||||||||||||||||||||||||||||||||||||||||||||||||||
Samarco11 | OC | 1,210 | 38.3 | 0.05 | – | – | – | 753 | 36.8 | 0.05 | – | – | – | 1,960 | 37.7 | 0.05 | – | – | – | 210 | 37.4 | 0.06 | – | – | – | |||||||||||||||||||||||||||||||||||||||||||||||||||||||||||||||||||||||||||
|
|
|
|
|
|
|
|
|
|
|
|
|
|
|
|
|
|
|
|
|
|
|
|
|
|
|
|
|
|
|
|
|
|
|
|
|
|
|
|
|
|
|
|
|
|
|
| |||||||||||||||||||||||||||||||||||||||||||||||||||||
Total iron ore | 2,190 | 47.7 | – | – | – | – | 3,840 | 55.1 | – | – | – | – | 6,030 | 52.4 | – | – | – | – | 9,990 | 58.8 | – | – | – | – | ||||||||||||||||||||||||||||||||||||||||||||||||||||||||||||||||||||||||||||
|
|
|
|
|
|
|
|
|
|
|
|
|
|
|
|
|
|
|
|
|
|
|
|
|
|
|
|
|
|
|
|
|
|
|
|
|
|
|
|
|
|
|
|
|
|
|
| |||||||||||||||||||||||||||||||||||||||||||||||||||||
| 1 | Mineral resources are reported in this report in accordance with S-K 1300 and are presented for the portion attributable to BHP’s economic interest in the respective joint venture. All tonnes and quality information have been rounded, small differences may be present in the totals. |
| 2 | Mineral resources are presented exclusive of mineral reserves. |
| 3 | WAIO is considered a material property for purposes of Item 1304 of S-K 1300. BHP interest is 85% for all joint ventures except BHP (Non-JV) where it is 100%. |
| 4 | WAIO mineral resources qualities are presented as in situ mass percentage on a dry weight basis and tonnage as wet tonnes. Moisture content is based on deposit types, Brockman (BKM) – 3%; Marra Mamba (MM) – 4%; Channel Iron Deposit (CID) – 8% and Detrital Iron Deposits (DID) – 4%. |
| 5 | WAIO point of reference for the mineral resources was in situ. |
| 6 | WAIO mineral resources estimates were based on an iron ore price of US$116/dmt for Platts 62% Fe Fines Index free on board (FOB) Port Hedland basis. Based on the median three-year monthly average price over a timeframe of 1 July 2020 to 30 June 2023. |
| 7 | WAIO mineral resource estimates cut-off criteria was based on deposit types identified in the joint venture. These are BKM and MM 54% Fe; CID 52% Fe and DID 58% Fe and less than 6% Al2O3. |
| 8 | WAIO is predominantly a producer of direct shipping ore and the metallurgical recovery was assumed as 100% for the purpose of reporting all mineral resources. |
| 9 | Goldsworthy joint venture includes 0.1 Mt indicated mineral resources from the POSMAC joint venture in which BHP has a 65% economic interest. |
| 10 | BHP (Non-JV) mineral resources are those that are wholly attributable to BHP. |
| 11 | Samarco mineral resources estimates, in which BHP has a 50% interest, were based on an iron price of US$130.18. The point of reference for the mineral resources was in situ. |
212
Table of Contents
Mineral reserves
As at 30 June 2024
Iron ore1 | Mining method | Proven Mineral Reserves | Probable Mineral Reserves | Total Mineral Reserves | ||||||||||||||||||||||||||||||||||||||||||||||||||||||||||||||||||||||||
| Tonnage | Qualities | Tonnage | Qualities | Tonnage | Qualities | |||||||||||||||||||||||||||||||||||||||||||||||||||||||||||||||||||||||
| Mt | %Fe | %P | %SiO2 | %Al2O3 | %LOI | Mt | %Fe | %P | %SiO2 | %Al2O3 | %LOI | Mt | %Fe | %P | %SiO2 | %Al2O3 | %LOI | |||||||||||||||||||||||||||||||||||||||||||||||||||||||||||
Australia |
| |||||||||||||||||||||||||||||||||||||||||||||||||||||||||||||||||||||||||||
WAIO2,3,4,5,6,7 | ||||||||||||||||||||||||||||||||||||||||||||||||||||||||||||||||||||||||||||
Mt Newman | OC | 190 | 62.9 | 0.12 | 3.6 | 2.0 | 3.5 | 490 | 61.3 | 0.12 | 3.9 | 2.3 | 5.4 | 680 | 61.7 | 0.12 | 3.8 | 2.2 | 4.9 | |||||||||||||||||||||||||||||||||||||||||||||||||||||||||
Goldsworthy8 | OC | 840 | 61.7 | 0.10 | 3.5 | 1.9 | 5.8 | 910 | 60.9 | 0.08 | 4.1 | 1.9 | 6.4 | 1,750 | 61.3 | 0.09 | 3.8 | 1.9 | 6.1 | |||||||||||||||||||||||||||||||||||||||||||||||||||||||||
Jimblebar | OC | 710 | 61.4 | 0.11 | 3.9 | 2.6 | 4.9 | 580 | 60.4 | 0.12 | 4.7 | 2.7 | 5.4 | 1,290 | 61.0 | 0.12 | 4.3 | 2.7 | 5.1 | |||||||||||||||||||||||||||||||||||||||||||||||||||||||||
|
|
|
|
|
|
|
|
|
|
|
|
|
|
|
|
|
|
|
|
|
|
|
|
|
|
|
|
|
|
|
|
|
|
|
| |||||||||||||||||||||||||||||||||||||||||
WAIO Total | 1,740 | 61.7 | 0.11 | 3.7 | 2.2 | 5.2 | 1,980 | 60.9 | 0.10 | 4.2 | 2.2 | 5.9 | 3,720 | 61.3 | 0.10 | 4.0 | 2.2 | 5.5 | ||||||||||||||||||||||||||||||||||||||||||||||||||||||||||
|
|
|
|
|
|
|
|
|
|
|
|
|
|
|
|
|
|
|
|
|
|
|
|
|
|
|
|
|
|
|
|
|
|
|
| |||||||||||||||||||||||||||||||||||||||||
Brazil |
| Mt | %Fe | %Pc | Mt | %Fe | %Pc | Mt | %Fe | %Pc | ||||||||||||||||||||||||||||||||||||||||||||||||||||||||||||||||||
|
|
|
|
|
|
|
|
|
|
|
|
|
|
|
|
|
| |||||||||||||||||||||||||||||||||||||||||||||||||||||||||||
Samarco9 | OC | 49 | 40.7 | 0.07 | – | – | – | 376 | 43.0 | 0.05 | – | – | – | 425 | 42.7 | 0.06 | – | – | – | |||||||||||||||||||||||||||||||||||||||||||||||||||||||||
|
|
|
|
|
|
|
|
|
|
|
|
|
|
|
|
|
|
|
|
|
|
|
|
|
|
|
|
|
|
|
|
|
|
|
| |||||||||||||||||||||||||||||||||||||||||
Total iron ore | 1,790 | 61.1 | – | – | – | – | 2,360 | 58.0 | – | – | – | – | 4,150 | 59.4 | – | – | – | – | ||||||||||||||||||||||||||||||||||||||||||||||||||||||||||
|
|
|
|
|
|
|
|
|
|
|
|
|
|
|
|
|
|
|
|
|
|
|
|
|
|
|
|
|
|
|
|
|
|
|
| |||||||||||||||||||||||||||||||||||||||||
| 1 | Mineral reserves are reported in this report in accordance with S-K 1300 and are presented for the portion attributable to BHP’s economic interest in the respective joint ventures. All tonnes and quality information have been rounded, small differences may be present in the totals. |
| 2 | WAIO is considered a material property for purposes of Item 1304 of S-K 1300. BHP interest is 85% for all joint ventures included in this table. |
| 3 | WAIO mineral reserves qualities are presented as in situ mass percentage on a dry weight basis and tonnage as wet tonnes. Moisture content is based on deposit types, Brockman (BKM) – 3% and Marra Mamba (MM) – 4%. |
| 4 | WAIO point of reference for the mineral reserves was as delivered to the ore handling/process plant. |
| 5 | WAIO mineral reserves estimates were based on an iron ore price of US$116/dmt for Platts 62% Fe Fines Index and US$123/dmt for lump, both FOB Port Hedland basis. |
| 6 | WAIO joint ventures include Brockman (BKM) and Marra Mamba (MM) deposit types. All mineral reserves estimates applied a cut-off criteria of 58% Fe. |
| 7 | WAIO is predominantly a producer of direct shipping ore and the metallurgical recovery was assumed as 99% for Mt Newman and 100% for Goldsworthy and Jimblebar joint ventures. |
| 8 | Goldsworthy joint venture includes 1 Mt proven and 0.4 Mt of probable mineral reserves from the POSMAC joint venture in which BHP has a 65% economic interest. |
| 9 | Samarco mineral reserves, in which BHP has a 50% interest, were based on an iron price of US$126.68. The point of reference for the mineral reserves was to the ore handling/process plant. |
213
Table of Contents
6.4 WAIO individual property disclosure
6.4.1 Property description
WAIO is a production-stage property with mines located in the Pilbara iron ore province in the north-west of Western Australia (WA), Australia and is centred on the regional town of Newman located approximately 1,000 km north of WA’s capital city Perth. The property is accessible from Perth by road via the Great Northern Highway and by air via regular commercial flights to Newman.
Mines, processing facilities, railways and port facilities comprising WAIO are spread over a geographical area of 350 km N-S and 250 km E-W between Port Hedland and Newman towns in the Pilbara region.
The geographic coordinates of the central points of the five mines are provided below and their locations shown below.
| • | Newman: Latitude: 23°21’40” S, Longitude: 119°40’15” E |
| • | Jimblebar: Latitude: 23°22’40” S, Longitude: 120°07’45” E |
| • | Mining Area C: Latitude: 22°55’30” S, Longitude: 118°58’55” E |
| • | South Flank: Latitude: 22°59’35” S, Longitude: 118°59’45” E |
| • | Yandi: Latitude: 22°43’15” S, Longitude: 119°05’15” E |
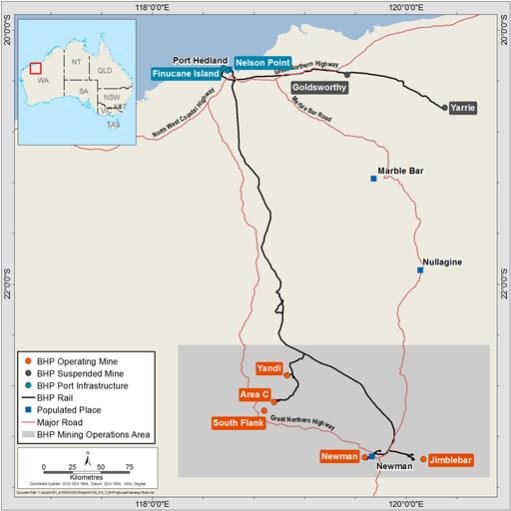
214
Table of Contents
6.4.2 Infrastructure
Most of the infrastructure required for WAIO to support the current mining operations including roads, airport, rail and port, power and water supply is in place. These have been developed by BHP gradually over the last six decades in pace with staged expansion of production capacity.
WAIO’s mines (Newman, Jimblebar, Mining Area C, South Flank and Yandi) and processing hubs (Newman, Jimblebar, Mining Area C and Yandi) are connected to its two ports (Nelson Point and Finucane Island) located at Port Hedland by a network of more than 1,000 km of rail infrastructure.
The mines have a network of BHP owned roads to service the mining operations and connect to the Great Northern Highway.
Water is sourced from ground water supplies for all WAIO mines, process plants and mine camps. These water supplies are drawn from BHP managed bore fields around mine sites established by WAIO under license for its operations and mine camps. Port Hedland operations are supplied water under contract from the municipal provider, sourced from nearby coastal aquifers.
WAIO has a natural gas-fired power plant (Yarnima Power Station, in Newman town), with an installed generator capacity for 190 megawatt. The plant supplies the entire power requirement for all its mining, processing facilities and mine camps. Power consumed for WAIO’s port operations at Port Hedland is purchased via a power purchase agreement with APA Energy (formerly Alinta Energy), a large energy supplier in Australia.
BHP has set up its own accommodation villages / camps at the mines to accommodate its fly-in-fly-out (FIFO) personnel. In addition to the commercial airport at Newman, BHP has set up private airports at mine sites and operates regular charter flights from Perth directly to transport FIFO workforce.
WAIO relies mainly on FIFO workforce sourced primarily from within Western Australia (Perth and other regional towns) and to a lesser extent from other states in Australia.
6.4.3 Mineral tenure
BHP and its joint venture partners hold mineral rights in 66 mineral titles covering a total area of approximately 4,683 km2. Of this, approximately 2,845 km2 is contributed by eight mineral titles held pursuant to five State Agreement Acts of the state of Western Australia and the remaining area (1,838 km2) by 58 mineral titles held pursuant to the Mining Act, 1978 (Western Australia).
The five State Agreement Acts (incorporating agreements between BHP along with its joint venture partners and the state of Western Australia) are ratified by the parliament of Western Australia and provide WAIO long-term tenure security for mineral development. These acts and details of mining titles held pursuant to each State Agreement are provided in the list and table below.
| 1. | Iron Ore (Mount Newman) Agreement Act 1964 (WA) - ML244SA held by the Mount Newman Joint Venture. |
| 2. | Iron Ore (Mount Goldsworthy) Agreement Act 1964 (WA) - ML235SA, ML249SA and ML281SA held by the Mount Goldsworthy Joint Venture. |
| 3. | Iron Ore (Goldsworthy-Nimingarra) Agreement Act 1972 (WA) -M263SA and ML251SA held by the Mount Goldsworthy Joint Venture. |
| 4. | Iron Ore (McCamey’s Monster) Agreement Authorisation Act 1972 (WA) - M266SA held by BHP Iron Ore (Jimblebar) Pty Ltd. |
| 5. | Iron Ore (Marillana Creek) Agreement Act 1991 (WA) - M270SA held by the Yandi Joint Venture. |
Lease number | Registered tenement holders1 / interest | Grant date | Expiry date2 | Legal area (km2) | Rent and rate4 (AU$) | |||||||||
M263SA | BHP (85%), Itochu (8%), Mitsui (8%) | 22/01/1989 | 21/09/2035 | 143.23 | 355,540.25 | |||||||||
M266SA | BHPIOJ (100%) (3) | 11/10/1988 | 10/10/2030 | 526.06 | 130,412.06 | |||||||||
M270SA | BHP (85%), Itochu (8%), Mitsui (8%) | 4/09/1991 | 3/09/2033 | 303.44 | 1,957,254.44 | |||||||||
ML235SA | BHP (85%), Itochu (8%), Mitsui (8%) | 5/08/1965 | 4/08/2028 | 41.42 | 3,109.11 | |||||||||
ML244SA | BHP (85%), M-Itochu (10%), Itochu (5%) | 7/04/1967 | 6/04/2030 | 789.34 | 123,629.35 | |||||||||
ML249SA | BHP (85%), Itochu (8%), Mitsui (8%) | 8/05/1974 | 4/08/2028 | 306.47 | 24,364.41 | |||||||||
ML251SA | BHP (85%), Itochu (8%), Mitsui (8%) | 22/09/1972 | 21/09/2035 | 171.30 | 86,058.00 | |||||||||
ML281SA | BHP (85%), Itochu (8%), Mitsui (8%) | 26/04/2002 | 4/08/2028 | 563.35 | 158,201.82 | |||||||||
| 1 | Full legal entity names of the registered tenement holders are: (i) BHP: BHP Billiton Minerals Pty Ltd, (ii) M-Itochu: Mitsui-Itochu Iron Pty Ltd, (iii) Itochu: Itochu Minerals & Energy of Australia Pty Ltd, (iv) Mitsui: Mitsui Iron Ore Corporation Pty Ltd and (v) BHPIOJ: BHP Iron Ore (Jimblebar) Pty Ltd. |
215
Table of Contents
| 2 | All State Agreement Act leases, except M270SA, have right to successive renewals of 21 years each. M270SA has right to only two renewals, each for 21 years ultimately expiring in 2054, from which point the lease would revert to a Mining Act lease, subject to prior renegotiation between BHP and the State Government. |
| 3 | M266SA is held by BHP Iron Ore (Jimblebar) Pty Ltd, a subsidiary of BHP Minerals Pty Ltd (BHP). In 2013, BHP entered into an incorporated Joint Venture (Jimblebar IJV) with Itochu and Mitsui in respect of the Jimblebar mining hub, owned by BHP Iron Ore (Jimblebar) Pty Ltd (BHPIOJ). The Jimblebar IJV is structured so that BHP, Itochu and Mitsui hold A Class Shares in BHPIOJ, which confer an 85:8:7 economic interest, respectively in the “Jimblebar Assets”, being certain assets of BHPIOJ including the Jimblebar mine. BHPIOJ also owns other assets, called “Excluded Assets”, in which BHP alone holds a 100% economic interest through B Class Shares in BHPIOJ. |
| 4 | Statutory Rents and Rates are payable annually to the State Government and the Local Government/Shire respectively. |
As at 30 June 2024, all of WAIO’s mineral reserves and 85% of mineral resources (exclusive of mineral reserves) were located on the eight mineral titles held pursuant to the five State Agreement Acts. The remaining 15% of mineral resources are located across the 58 tenements held pursuant to the Mining Act. All mineral development and extraction activities are currently being undertaken only within tenements held pursuant to the State Agreement Acts. Activities within the Mining Act tenements are currently limited to exploration work aimed at defining mineral resources.
6.4.4 Registrant interest
In addition to being the majority owner of the property, BHP holds one royalty stream which entitles BHP to earn royalty income in relation to ore produced only from Mining Area C and South Flank. This royalty stream contributed 0.1% of free on board (FOB) revenue in FY2024.
6.4.5 Present condition of property
WAIO is a production-stage property with a large base of mineral reserves and mineral resources.
Exploration activities have been ongoing on the property since the 1950s. Drilling is the primary method for exploration and sampling. From the 1950s to December 2023, WAIO had completed over 152,000 exploration drill holes for a total of 12,070 km, including 8,870 km reverse circulation and 809 km diamond core drilling, across its tenements for the purpose of resource identification and definition, resource characterization, modelling of geotechnical and hydrogeological parameters, and geometallurgical test work. For the past 15 years, annually 400 to 600 km of drilling was carried out.
The exploration activities have occurred in areas adjacent to operating mines (brownfield areas) to replenish mineral resources depleted by mine production. In addition, some exploration activities have been completed in strategic greenfield areas to provide optionality for future development.
All mines are open cut, with ore extracted using excavator and truck. After extraction, the ore is crushed before train loading and transporting to the port for direct shipping.
6.4.6 Physical condition
Production on the WAIO property started in late 1960s from one mine. Currently there are five operating mines, Newman, Yandi, Mining Area C, Jimblebar and South Flank, started in 1969, 1992, 2003, 2013 and 2021, respectively.
Yandi mine has started its end-of-life production ramp down, closure and decommissioning of associated infrastructure commenced in July 2021.
The operations undertake planned maintenance programs and implement scheduled replacement of equipment and infrastructure that is required to maintain the continued reliable operation of the mines and supporting services such as power, port facilities, water supplies and rail.
Modernisation of rail operations and automation of haul trucks are currently in progress.
216
Table of Contents
6.4.7 Book value
The total book value of the WAIO property and its associated plant and equipment was US$16.0 billion on equity ownership basis, as of 30 June 2024.
6.4.8 History of previous operations
Since the 1950s, BHP has been continuously exploring, developing and extracting iron ore at gradually increasing rates of production to keep pace with global sea-borne market demands.
In 1966, BHP’s joint venture partner Goldsworthy Mining Limited (GML) was the first company to develop an iron ore mine in the Pilbara. The mine, Mount Goldsworthy ceased operations in 1982 with production entirely for export purposes. BHP was initially a joint venture partner in GML and acquired the full ownership of GML in 1990.
In 1969, BHP developed the Mount Whaleback deposit at Newman entirely for export purposes as a part of the Mount Newman Mining Joint Venture (NJV). The majority ownership of NJV was acquired by BHP in 1986.
In 1991, BHP developed the Yandi deposit and in 1992 acquired the Jimblebar deposits. In the 1990s, subleases tied to ore purchase agreements by a Chinese consortium over part of the Jimblebar deposits and by South Korea’s POSCO for C Deposit at Mining Area C increased BHP’s annual production.
Since the 1990s to present day, BHP has been expanding production from its five mining hubs, Newman, Jimblebar, Mining Area C, South Flank and Yandi. South Flank commenced production in May 2021 to replace Yandi production. Yandi is decreasing production towards closure and decommissioning of infrastructure.
6.4.9 Significant encumbrances
BHP is not aware of any significant encumbrances to the property, including current and future permitting requirements and associated timelines or permit conditions.
6.4.10 Geology and mineralisation
The WAIO iron ore deposits are hosted in the late Archaean to early Proterozoic-age banded iron formations of the Hamersley Group in the Pilbara region of Western Australia. The two main hosts for bedrock mineralisation in the Hamersley Group are the Brockman and Marra Mamba iron formations.
Brockman Iron Formation tends to have higher phosphorous and alumina concentration (both deleterious elements) with a lower loss-on ignition than the Marra Mamba Iron Formation. These compositional differences are one of reasons for dividing the ore by stratigraphy. The bedded iron deposits are further subdivided in terms of their genesis and mineralogy into hypogene martite-microplaty hematite and supergene martite-geothite ores.
Widespread detrital sequences occur adjacent to the bedded iron deposits in the form of colluvial-alluvial fans. The detrital deposits economic value depends on the size and concentration and are mostly exploited when associated with bedrock deposits.
In addition, mineralisation is found in fluviatile channel iron deposits of the late Eocene to early Miocene age. The iron content in the channel iron deposits tends to be lower than the bedrock mineralisation, however, they tend to be lower in phosphorous and alumina.
The primary iron bearing minerals are hematite and goethite which vary in concentration within the deposits.
Mineralisation extends over strike lengths of 5-10 km for most deposits, however, may extend for up to 50-60 km. The width of mineralisation at surface typically ranges from about 200 m up to 1500 m. Mineralisation extends to depths of between 100 m and 400 m and deposits typically have some form of surface expression.
6.4.11 Mineral resources and mineral reserves
Tables of mineral resources and mineral reserves for WAIO reported by joint venture are included in section 6.3 above.
6.4.12 Changes to mineral resources and mineral reserves
Total mineral resources as at 30 June 2024 were 13,850 Mt compared to the previous year as at 30 June 2023 which were 14,890 Mt, a decrease of 7% (-1,040 Mt). The changes were mainly due to conversion of resources to reserves and reasonable prospect of economic extraction assessment.
217
Table of Contents
Total mineral reserves as at 30 June 2024 were 3,720 Mt compared to the previous year as at 30 June 2023 which were 3,440 Mt, an increase of 8% (280 Mt). The changes were mainly due to conversion of resources to reserves.
6.4.13 Material assumptions and criteria
Mineral resources estimated for WAIO’s active mines and undeveloped deposits consider the following assumptions:
| • | Resources estimated using ordinary kriging and inverse distance weighted methods. |
| • | Resources are reported exclusive of mineral reserves and are presented as in situ estimates. |
| • | Resources are reported on a wet tonnage basis for all deposit types associated with the joint ventures. |
| • | Standard open cut practices are assumed for all ore extraction. |
| • | Resources are excluded from reporting as appropriate for heritage, environmental, hydrological, tenure, and infrastructure purposes to minimise any potential impacts. |
Mineral reserves are estimated for WAIO’s active mining areas and considers the following assumptions:
| • | The latest and approved resource models and mineral resource estimates have been used for mine planning and conversion to mineral reserves by application of all relevant modifying factors. |
| • | The resource models are converted to mining models (WAIO equivalent of a “reserve” model) by regularising the resource model blocks to SMU-sized blocks |
| • | The average of the previous three years (FY2021 to FY2023) actual yearly operating and capital costs are used to estimate the cut-off grades and mineral reserves. |
| • | The median of the three-year trailing calendar monthly average iron ore prices from July 2020 to June 2023 are used to estimate the cut-off grades and mineral reserves. |
| • | Mineral reserves are estimated using conventional open-cut mining method involving drill and blast with load and haul activities. |
| • | Pit optimisations are completed to determine economic pit limits using industry standard Lerch-Grossman algorithm. |
| • | Mine designs including pit, waste dumps and haul roads are generated in industry standard CAD software. The designs incorporate the minimum mining width based on the equipment and slope design parameters from geotechnical models. |
| • | WAIO’s run-of-mine (ROM) ore is direct shipping ore without the need of concentration or beneficiation. The processing method involves simple crushing and screening of the ore to produce lump and fines products. |
Details of the material assumptions are described in the Technical Report Summary (effective 30 June 2022) incorporated as an exhibit to the Annual Report by reference to the exhibit to the Annual Report on Form 20-F for the year ended 30 June 2023, sections 11 Mineral Resource Estimates, 12 Mineral Reserve Estimates, 13 Mining Methods, 14 Processing and Recovery Methods and 18 Capital and Operating Costs.
218
Table of Contents
6.5 Steelmaking coal
Coal resources1
As at 30 June 2024
| Measured Coal Resources | Indicated Coal Resources | Measured + Indicated Coal Resources | Inferred Coal Resources | |||||||||||||||||||||||||||||||||||||||||||||||||||||||||||||||||
Steelmaking coal2,3 | Mining method | Tonnage Mt | %Ash | Qualities %VM | %S | Tonnage Mt | %Ash | Qualities %VM | %S | Tonnage Mt | %Ash | Qualities %VM | %S | Tonnage Mt | %Ash | Qualities %VM | %S | |||||||||||||||||||||||||||||||||||||||||||||||||||
Australia | ||||||||||||||||||||||||||||||||||||||||||||||||||||||||||||||||||||
BMA4,5,6 | OC & UG | 1,023 | 9.9 | 18.6 | 0.59 | 544 | 10.7 | 18.0 | 0.67 | 1,567 | 10.1 | 18.3 | 0.62 | 438 | 11.1 | 19.1 | 0.66 | |||||||||||||||||||||||||||||||||||||||||||||||||||
|
|
|
|
|
|
|
|
|
|
|
|
|
|
|
|
|
|
|
|
|
|
|
|
|
|
|
|
|
|
|
| |||||||||||||||||||||||||||||||||||||
Total steelmaking coal | 1,023 | 9.9 | 18.6 | 0.59 | 544 | 10.7 | 18.0 | 0.67 | 1,567 | 10.1 | 18.3 | 0.62 | 438 | 11.1 | 19.1 | 0.66 | ||||||||||||||||||||||||||||||||||||||||||||||||||||
|
|
|
|
|
|
|
|
|
|
|
|
|
|
|
|
|
|
|
|
|
|
|
|
|
|
|
|
|
|
|
| |||||||||||||||||||||||||||||||||||||
| 1 | Coal resources is used as an equivalent term to mineral resources. |
| 2 | Coal resources are reported in this report in accordance with S-K 1300 and are presented for the portion attributable to BHP’s economic interest in the respective joint venture. All tonnes and quality information have been rounded, small differences may be present in the totals. |
| 3 | Coal resources are presented exclusive of coal reserves. |
| 4 | BMA mineral resources, in which BHP has a 50% interest, includes Goonyella Complex, Caval Ridge, Peak Downs, Saraji and Saraji South deposits. |
| 5 | The point of reference for the coal resources tonnage estimates was in situ. Coal qualities are reported for a clean coal simulated product on an air-dried basis. |
| 6 | Coal resources estimates comprise 95% metallurgical and 5% thermal coal product categories. Coal resources prices used for each of the coal categories were hard coking coal US$353.09/t and thermal coal US$331.41/t. |
Coal reserves1
As at 30 June 2024
| Proven Coal Reserves | Probable Coal Reserves | Total Coal Reserves | Proven Marketable Coal Reserves | Probable Marketable Coal Reserves | Total Marketable Coal Reserves | |||||||||||||||||||||||||||||||||||||||||||||||||||||||||||
Steelmaking coal2 | Mining Method | Tonnage Mt | Tonnage Mt | Tonnage Mt | Tonnage Mt | %Ash | Qualities %VM | %S | Tonnage Mt | %Ash | Qualities %VM | %S | Tonnage Mt | %Ash | Qualities %VM | %S | ||||||||||||||||||||||||||||||||||||||||||||||||
Australia | ||||||||||||||||||||||||||||||||||||||||||||||||||||||||||||||||
BMA3,4,5,6 | OC & UG | 741 | 114 | 855 | 480 | 9.9 | 21.2 | 0.58 | 66 | 10.4 | 22.8 | 0.69 | 545 | 10.0 | 21.4 | 0.59 | ||||||||||||||||||||||||||||||||||||||||||||||||
|
|
|
|
|
|
|
|
|
|
|
|
|
|
|
|
|
|
|
|
|
|
|
|
|
|
|
|
|
| |||||||||||||||||||||||||||||||||||
Total steelmaking coal | 741 | 114 | 855 | 480 | 9.9 | 21.2 | 0.58 | 66 | 10.4 | 22.8 | 0.69 | 545 | 10.0 | 21.4 | 0.59 | |||||||||||||||||||||||||||||||||||||||||||||||||
|
|
|
|
|
|
|
|
|
|
|
|
|
|
|
|
|
|
|
|
|
|
|
|
|
|
|
|
|
| |||||||||||||||||||||||||||||||||||
| 1 | Coal reserves is used as an equivalent term to mineral reserves. |
| 2 | Coal reserves are reported in this report in accordance with S-K 1300 and presented for the portion attributable to BHP’s economic interest in the respective joint venture. All tonnes and quality information have been rounded, small differences may be present in the totals. |
| 3 | BMA mineral reserves, in which BHP has a 50% interest, includes Goonyella Complex, Caval Ridge, Peak Downs, Saraji and Saraji South deposits. |
| 4 | Total coal reserves were at a 4% moisture content when mined. Total marketable reserves were at a product specification moisture content (9.5-10% Goonyella Complex; 10.5% Peak Downs; 10.5% Caval Ridge; 10.1% Saraji; 10-11% Saraji South) and at an air-dried quality basis for sale after the beneficiation of the total coal reserves. |
| 5 | The point of reference for the coal reserves was delivery to the coal handling and processing plants. |
| 6 | Coal reserves estimates comprise 98% hard coking coal and 2% thermal coal product categories. Coal reserves prices used for each of the coal categories were hard coking coal US$253.58/t and thermal coal US$174.04/t. These prices were converted from nominal to real basis aligned to the valuation date and site-specific factors were applied, based on changes in forecast quality over time, before coal reserves were estimated. |
219
Table of Contents
6.6 Energy coal
Coal resources1
As at 30 June 2024
| Measured Coal Resources | Indicated Coal Resources | Measured + Indicated Coal Resources | Inferred Coal Resources | |||||||||||||||||||||||||||||||||||||||||||||||||||||||||||||||||||||||||||||||||
| Mining | Tonnage | Qualities | Tonnage | Qualities | Tonnage | Qualities | Tonnage | Qualities | ||||||||||||||||||||||||||||||||||||||||||||||||||||||||||||||||||||||||||||
Energy coal2,3 | method | Mt | %Ash | %VM | %S | Kcal/kgCV | Mt | %Ash | %VM | %S | Kcal/kgCV | Mt | %Ash | %VM | %S | Kcal/kgCV | Mt | %Ash | %VM | %S | Kcal/kgCV | |||||||||||||||||||||||||||||||||||||||||||||||||||||||||||||||
Australia | ||||||||||||||||||||||||||||||||||||||||||||||||||||||||||||||||||||||||||||||||||||
NSWEC4,5,6,7 | OC | 5.5 | 19.0 | 29.6 | 0.66 | 6,170 | 0.1 | 19.7 | 29.3 | 0.54 | 6,060 | 5.6 | 19.2 | 29.5 | 0.63 | 6,130 | 6.5 | 23.3 | 28.8 | 0.49 | 5,700 | |||||||||||||||||||||||||||||||||||||||||||||||||||||||||||||||
|
|
|
|
|
|
|
|
|
|
|
|
|
|
|
|
|
|
|
|
|
|
|
|
|
|
|
|
|
|
|
|
|
|
|
|
|
|
|
| |||||||||||||||||||||||||||||||||||||||||||||
Total energy coal | 5.5 | 19.0 | 29.6 | 0.66 | 6,170 | 0.1 | 19.7 | 29.3 | 0.54 | 6,060 | 5.6 | 19.2 | 29.5 | 0.63 | 6,130 | 6.5 | 23.3 | 28.8 | 0.49 | 5,700 | ||||||||||||||||||||||||||||||||||||||||||||||||||||||||||||||||
|
|
|
|
|
|
|
|
|
|
|
|
|
|
|
|
|
|
|
|
|
|
|
|
|
|
|
|
|
|
|
|
|
|
|
|
|
|
|
| |||||||||||||||||||||||||||||||||||||||||||||
| 1 | Coal resources is used as an equivalent term to mineral resources. |
| 2 | Coal resources are reported in this report in accordance with S-K 1300 and are presented for the portion attributable to BHP’s economic interest. All tonnes and quality information have been rounded, small differences may be present in the totals. |
| 3 | Coal resources are presented exclusive of coal reserves. |
| 4 | NSWEC, in which BHP has a 100% interest, includes Mt Arthur Coal deposit. |
| 5 | Coal qualities are reported on an air-dried in situ basis. Tonnages are reported as in situ. |
| 6 | The point of reference for the coal resources was in situ. |
| 7 | Coal resources estimates were based on the average three-year historic thermal coal price of US$331.41/t specification Newcastle Free On Board (FOB), 6,000 kcal/t net as received. |
Coal reserves1
As at 30 June 2024
| Proven Coal Reserves | Probable Coal Reserves | Total Coal Reserves | Proven Marketable Coal Reserves | Probable Marketable Coal Reserves | Total Marketable Coal Reserves | |||||||||||||||||||||||||||||||||||||||||||||||||||||||||||||||||||||||
| Mining | Tonnage | Tonnage | Tonnage | Tonnage | Qualities | Tonnage | Qualities | Tonnage | Qualities | |||||||||||||||||||||||||||||||||||||||||||||||||||||||||||||||||||
Energy coal2 | Method | Mt | Mt | Mt | Mt | %Ash | %VM | %S | Kcal/kgCV | Mt | %Ash | %VM | %S | Kcal/kgCV | Mt | %Ash | %VM | %S | Kcal/kgCV | |||||||||||||||||||||||||||||||||||||||||||||||||||||||||
Australia | ||||||||||||||||||||||||||||||||||||||||||||||||||||||||||||||||||||||||||||
NSWEC3,4,5,6 | OC | 69 | 35 | 104 | 51 | 15.5 | 30.5 | 0.51 | 5,910 | 26 | 15.5 | 30.3 | 0.51 | 5,910 | 77 | 15.5 | 30.4 | 0.51 | 5,910 | |||||||||||||||||||||||||||||||||||||||||||||||||||||||||
|
|
|
|
|
|
|
|
|
|
|
|
|
|
|
|
|
|
|
|
|
|
|
|
|
|
|
|
|
|
|
|
|
|
|
| |||||||||||||||||||||||||||||||||||||||||
Total energy coal | 69 | 35 | 104 | 51 | 15.5 | 30.5 | 0.51 | 5,910 | 26 | 15.5 | 30.3 | 0.51 | 5,910 | 77 | 15.5 | 30.4 | 0.51 | 5,910 | ||||||||||||||||||||||||||||||||||||||||||||||||||||||||||
|
|
|
|
|
|
|
|
|
|
|
|
|
|
|
|
|
|
|
|
|
|
|
|
|
|
|
|
|
|
|
|
|
|
|
| |||||||||||||||||||||||||||||||||||||||||
| 1 | Coal reserves is used as an equivalent term to mineral reserves. |
| 2 | Coal reserves are reported in this report in accordance with S-K 1300 and are presented for the portion attributable to BHP’s economic interest. All tonnes and quality information have been rounded, small differences may be present in the totals. |
| 3 | NSWEC, in which BHP has a 100% interest, includes Mt Arthur Coal deposit. |
| 4 | Coal qualities are presented as a potential product on an air-dried basis. Tonnages for the coal reserves are reported on an in situ moisture basis. Moisture when mined was 8.5% and for marketable reserves was 9.5%. |
| 5 | The point of reference for the coal reserves was as delivered to the coal handling process plant. |
| 6 | Coal reserves estimates were based on the average three-year historic thermal coal price of US$170.04/t specification Newcastle FOB, 6,000 kcal/t net as received. |
220
Table of Contents
6.7 Potash
Mineral resources
As at 30 June 2024
| Measured Mineral Resources | Indicated Mineral Resources | Measured + Indicated Mineral Resources | Inferred Mineral Resources | |||||||||||||||||||||||||||||||||||||||||||||||||||||||||||||||||
Potash1,2 | Mining method | Tonnage Mt | %K2O | Qualities %Insol. | %MgO | Tonnage Mt | %K2O | Qualities %Insol. | %MgO | Tonnage Mt | %K2O | Qualities %Insol. | %MgO | Tonnage Mt | %K2O | Qualities %Insol. | %MgO | |||||||||||||||||||||||||||||||||||||||||||||||||||
Canada | ||||||||||||||||||||||||||||||||||||||||||||||||||||||||||||||||||||
Jansen3,4,5,6,7,8,9 | ||||||||||||||||||||||||||||||||||||||||||||||||||||||||||||||||||||
LPL | UG | – | – | – | – | – | – | – | – | – | – | – | – | 1,280 | 25.6 | 7.7 | 0.08 | |||||||||||||||||||||||||||||||||||||||||||||||||||
|
|
|
|
|
|
|
|
|
|
|
|
|
|
|
|
|
|
|
|
|
|
|
|
|
|
|
|
|
|
|
| |||||||||||||||||||||||||||||||||||||
Total potash | – | – | – | – | – | – | – | – | – | – | – | – | 1,280 | 25.6 | 7.7 | 0.08 | ||||||||||||||||||||||||||||||||||||||||||||||||||||
|
|
|
|
|
|
|
|
|
|
|
|
|
|
|
|
|
|
|
|
|
|
|
|
|
|
|
|
|
|
|
| |||||||||||||||||||||||||||||||||||||
| 1 | Mineral resources are reported in this report in accordance with S-K 1300 and are presented for the portion attributable to BHP’s economic interest. All tonnes and quality information have been rounded, small differences may be present in the totals. |
| 2 | Mineral resources are presented exclusive of mineral reserves. |
| 3 | Jansen, in which BHP has a 100% interest, is considered a material property for the purposes of Item 1304 of S-K 1300. |
| 4 | The point of reference for the mineral resources was in situ. |
| 5 | Mineral resources estimates were based on a potash price of US$391/t (real basis). The primary basis was Nutrien’s quarterly published offshore and onshore realised price from 2008 to 2023. |
| 6 | Mineral resources are stated for the Lower Patient Lake (LPL) potash unit and using a seam thickness of 3.96 m from the top of 406 clay seam. |
| 7 | Mineral resources are based on the expected metallurgical recovery of 88%. |
| 8 | Potash or sylvite (KCl) content of the deposit is reported in potassium oxide form (K2O). The conversion from KCl to K2O uses a mineralogical conversion factor of 1.583. |
| 9 | Mineral resources tonnages are reported on an in situ moisture content basis and was estimated to be 0.3%. |
Mineral reserves
As at 30 June 2024
| Proven Mineral Reserves | Probable Mineral Reserves | Total Mineral Reserves | ||||||||||||||||||||||||||||||||||||||||||||||||||
Potash1 | Mining method | Tonnage Mt | %K2O | Qualities %Insol. | %MgO | Tonnage Mt | %K2O | Qualities %Insol. | %MgO | Tonnage Mt | %K2O | Qualities %Insol. | %MgO | |||||||||||||||||||||||||||||||||||||||
Canada | ||||||||||||||||||||||||||||||||||||||||||||||||||||
Jansen2,3,4,5,6,7,8 | ||||||||||||||||||||||||||||||||||||||||||||||||||||
LPL | UG | – | – | – | – | 1,070 | 24.9 | 7.5 | 0.10 | 1,070 | 24.9 | 7.5 | 0.10 | |||||||||||||||||||||||||||||||||||||||
|
|
|
|
|
|
|
|
|
|
|
|
|
|
|
|
|
|
|
|
|
|
|
| |||||||||||||||||||||||||||||
Total potash | – | – | – | – | 1,070 | 24.9 | 7.5 | 0.10 | 1,070 | 24.9 | 7.5 | 0.10 | ||||||||||||||||||||||||||||||||||||||||
|
|
|
|
|
|
|
|
|
|
|
|
|
|
|
|
|
|
|
|
|
|
|
| |||||||||||||||||||||||||||||
| 1 | Mineral reserves are reported in this report in accordance with S-K 1300 and are presented for the portion attributable to BHP’s economic interest. All tonnes and quality information have been rounded, small differences may be present in the totals. |
| 2 | Jansen, in which BHP has a 100% interest, is considered a material property for the purposes of Item 1304 of S-K 1300. |
| 3 | The point of reference for the mineral reserves was ore as delivered to the mill for processing. |
| 4 | Mineral reserves estimates were based on a potash price of US$391/t (real basis). The primary basis was Nutrien’s quarterly published offshore and onshore realised price from 2008 to 2023. |
| 5 | Mineral reserves estimates cut-off is a function of mining parameters and seam thickness. The calculated cut-off grade from economic modelling where the mine plan would be break-even is 8.1% K2O. |
| 6 | Mineral reserves are based on the expected metallurgical recovery of 88%. |
| 7 | Potash or sylvite (KCl) content of the deposit is reported in potassium oxide form (K2O). The conversion from KCl to K2O uses a mineralogical conversion factor of 1.583. |
| 8 | Mineral reserves tonnages are reported on an in situ moisture content basis and was estimated to be 0.3%. |
221
Table of Contents
6.8 Jansen individual property disclosure
6.8.1 Property description
The Jansen potash project is located in the rural municipalities of Leroy and Prairie Rose in the province of Saskatchewan, Canada, approximately 150 kilometres east of the city of Saskatoon.
The geographic coordinate location for the service shaft is Latitude 51°53’56.62“N and Longitude 104°42’53.44“W.
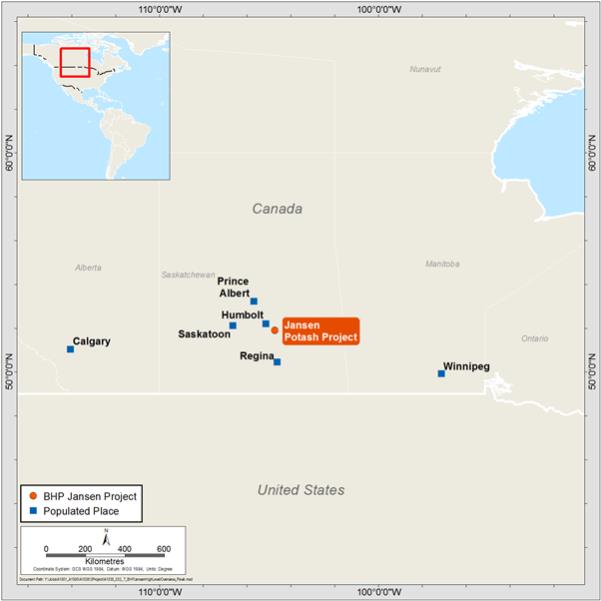
6.8.2 Infrastructure
The site is accessed by road from provincial Highway 16 approximately 12 kilometres to the south and Highway 5 approximately 32 kilometres to the north. Access to the mine site from these highways uses upgraded secondary and/or primary roads from the village of Jansen to the south and the town of Leroy to the north. The nearest commercial airport is in the city of Saskatoon.
Communications, power, water, and natural gas are provided by provincial crown corporations. The pipeline connection to the Saskatoon South East Water Supply system for Jansen’s primary water use is complete. The natural gas supply pipeline has been installed. The permanent 230 kV power supply has been constructed and commissioned.
The Jansen site has two mine shafts, the service shaft and the production shaft. The service shaft permanent headframe, hoist houses, and collar house are constructed. The production shaft sinking headframe and ground mounted drum winders are installed and in use.
A third-party rail provider is expected to transport the potash produced from the Jansen site to the port terminal, located in Delta, British Columbia, Canada, which is owned and operated by a third-party provider. The port facility will unload the railcars, store the product, and load shipping vessels.
222
Table of Contents
The processing facilities to be constructed at Jansen include:
| • | Raw ore handling, storage and crushing; |
| • | Process mill building wet area comprising attrition scrubbing, de-sliming, flotation and de-brining; |
| • | Process mill building dry area comprising drying, screening, compaction and glazing; |
| • | Tailings processing and reagents; |
| • | Product handling, storage and load out. |
Employees of Jansen mine are anticipated to reside in several existing communities located in the area.
6.8.3 Mineral tenure
The total area of the Jansen project lease is approximately 1,156 km2. Most mineral rights parcels are owned by the Saskatchewan Crown, the remaining mineral parcels are owned by individuals or corporations. To gain access to the potash within mineral parcels owned by individuals or corporations (‘freehold mineral lease’), BHP must either purchase the mineral parcels or negotiate mineral lease agreement(s) with the registered owner(s) of the mineral parcel(s). The freehold mineral leases secured by BHP have a term of 21 years and are renewable at the option of BHP for successive terms of 21 years. An annual rental payment of CA$4.94/hectare is also paid to keep these leases in good standing.
All surface lands that form part of the Jansen mine operations footprint have been acquired by BHP Canada.
On 23 November 2012, the Government of Saskatchewan and BHP Canada entered into Potash Lease Special Agreement KLSA 011. This agreement gives BHP Canada the exclusive right to search for, dig, work, mine, extract, recover, process, and carry away subsurface minerals under or within all of the Saskatchewan Crown mineral parcels of KLSA 011. The lease pertains to two categories of lands, ‘KLSA 011 Core Lands’ comprising primarily the mineral reserves and ‘KLSA 011 Expansion Lands’, and additional area outside mineral reserves that includes the primarily inferred resources.
During the first three years of KLSA 011, BHP was required to complete CA$12 million of work on the lease area. This work commitment has been met.
Lease description | Area (ha) | % | Expiry date | Annual lease payment1 | ||||||||||||
Jansen project total lease area | 115,638 | 100 | ||||||||||||||
KLSA 011 Core lands | 63,939.43 | 55 | 22/11/2033 | 1,056,623.66 | ||||||||||||
KLSA 011 Expansion lands | 41,724.73 | 36 | 22/11/2033 | |||||||||||||
BHP acquired freehold mineral rights | 8,997.56 | 8 | Not applicable | |||||||||||||
|
|
|
| |||||||||||||
Total of Core, Expansion, and acquired freehold mineral rights | 114,661.72 | 99 | ||||||||||||||
|
|
|
| |||||||||||||
| 1 | Annual lease payment in CA$ |
6.8.4 Registrant interest
BHP does not hold any royalty in Jansen in addition to its economic interest of 100%.
6.8.5 Present condition of property
Jansen is currently in construction phase. A substantial portion of the site grading, drainage and road network is in place. The site is connected to natural gas supply, permanent electrical power, communication fibre and non-potable water. A 2,600 person construction camp has been constructed and in use. The service shaft and the production shaft have been excavated and hydrostatically lined. The service shaft permanent headframe, hoist houses, and collar house are constructed. The production shaft sinking headframe and ground mounted drum winders are installed and in use.
6.8.6 Physical condition
Jansen is a development stage property that is in the process of construction with board approval to proceed with Stage 2 announced in October 2023. Some permanent infrastructure is in place including site facilities, service and production shafts, along with temporary construction infrastructure. BHP has a construction program to complete all the necessary requirements such as installation of processing, underground development, mining equipment, rail and port facilities to enable the mine to commence operations.
6.8.7 Book value
The total book value for the Jansen property and its associated plant and equipment was US$6.5 billion as of 30 June 2024.
223
Table of Contents
6.8.8 History of previous operations
There is no history of previous operations on the Jansen project area.
6.8.9 Significant encumbrances
There have been no significant encumbrances to the property identified as of the date of this report. Federal, provincial, municipal permits and approval for construction and operation have been received. All material permits that have been applied for to-date have been received.
6.8.10 Geology and mineralisation
The Jansen potash deposit is located within the Williston Basin, a large, intracratonic, and horizontally bedded sedimentary basin that has not been subject to structural deformation, either faulting or folding.
The potash beds are hosted within the Prairie Evaporite Formation, in regionally extensive, horizontal layers created by the repeated, cyclical evaporation of a shallow, inland sea during the Devonian period. The potash deposit extends from east to west in the province and are relatively uniform, except where there are anomalies due to local alterations or disruption of the potash beds.
In the Jansen area, the potash is at a depth of 800 to 1,050 metres. Two potash members are present the Patience Lake and Belle Plaine members. The Patience Lake Member is further subdivided into Upper Patience Lake and Lower Patience Lake sub-members. The Lower Patience Lake sub-member is the potash horizon targeted for Jansen. The Lower Patience Lake sub-member is composed of sylvite (KCl), halite (NaCl) with variable amounts of disseminated insolubles and clay seams. Carnallite (KCl.MgCl2.6H2O), a mineral which can impact processing and ground stability, occasionally occurs in place of sylvite within the potash layer. Large carnallite zones can typically be mapped using 3D seismic survey information.
The Dawson Bay Formation includes the Second Red Beds Member and the Dawson Bay carbonate members which overlay the Prairie Evaporite Formation. The Dawson Bay Formation in the Jansen area is expected to have low permeability or relatively low inflow deliverability potential.
Approximately 400 metres below the Prairie Evaporite Formation are the Cambrian-Ordovician Winnipeg and Deadwood formations. Sediments of these formations were deposited in near shore, shallow water marine environments on top of the Precambrian rocks. The coarse to fine sands of the formations, host a vast deep saline aquifer that is used for brine disposal.
6.8.11 Mineral resources and mineral reserves
Tables of mineral resources and mineral reserves for Jansen reported by ore type are included in section 6.7 above.
6.8.12 Changes to mineral resources and mineral reserves
Total mineral resources as at 30 June 2024 has not changed from previous year, as at 30 June 2023 (1,280 Mt).
Total mineral reserves as at 30 June 2024 has not changed from previous year, as at 30 June 2023 (1,070 Mt).
6.8.13 Material assumptions and criteria
The key assumptions in the estimation of mineral resources are summarised as:
| • | Cut-off parameter of 3.96 m from the top of the 406 clay seam contact with the top of Lower Patience Lake sub-member, aligned with the mining equipment requirements. |
| • | Geological anomalies identification including collapses representing potential water ingress hazards, carnallite anomalies impacting extraction and processing and no potash zones creating additional dilution. |
| • | Exclusion zones sterilising sections of the reserves due to lease boundaries and around drill holes. |
| • | Brine and solid salt waste estimate for disposal modelling into the aquifer and tailings management area. |
The key assumptions in the estimation of mineral reserves are summarised as:
| • | The mining method will be continuous mining using long room and pillar method. |
| • | Extraction ratios to reduce stress and provide room stability. |
| • | Thickness of the roof salt beam (horizon) as potential planes of weakness, impacting amount of ground support or dilution estimates. |
| • | Mine design layout maximising the Mineral Resource extraction based on estimated thicknesses, avoiding anomalies (collapse, massive carnallite and no potash zones) and salt beam modelling. |
| • | Commodity price and operating costs. |
224
Table of Contents
Details of the material assumptions are described in the Technical Report Summary (effective 30 June 2024), incorporated as an exhibit to this Annual Report on Form 20-F for the year ended 30 June 2024, sections 11 Mineral Resource Estimates, 12 Mineral Reserve Estimates, 13 Mining Methods, 14 Processing and Recovery Methods and 18 Capital and Operating Costs.
7 People – performance data1,2,3
Table 1 – Workforce data and diversity by region FY2024
| Employees by gender number and % | ||||||||||||||||||||||||||||||||
| Region | Number and % of employees | Average number and % of contractors2 | Male | Male % | Female | Female % | ||||||||||||||||||||||||||
Asia | 1,651 | 4.0 | 4,335 | 8.5 | 625 | 37.9 | 1,026 | 62.1 | ||||||||||||||||||||||||
Australia | 31,155 | 76.2 | 18,737 | 36.9 | 20,501 | 65.8 | 10,654 | 34.2 | ||||||||||||||||||||||||
Europe | 84 | 0.2 | 9 | 0.0 | 38 | 45.2 | 46 | 54.8 | ||||||||||||||||||||||||
North America | 693 | 1.7 | 1,537 | 3.0 | 362 | 52.2 | 331 | 47.8 | ||||||||||||||||||||||||
South America | 7,289 | 17.8 | 26,097 | 51.5 | 4,186 | 57.4 | 3,103 | 42.6 | ||||||||||||||||||||||||
Total | 40,872 | 100.0 | 50,715 | 100.0 | 25,712 | 62.9 | 15,160 | 37.1 | ||||||||||||||||||||||||
Table 2 – Employees by category and diversity for FY2024
| Gender | Region | |||||||||||||||||||||||||||||||||||
| Employment category | Total | % of Total | Male | Female | Asia | Australia | Europe | North America | South America | |||||||||||||||||||||||||||
Full time | 38,962 | 95.3 | 25,054 | 13,908 | 1,613 | 29,601 | 77 | 676 | 6,995 | |||||||||||||||||||||||||||
Part time | 1,132 | 2.8 | 444 | 688 | 3 | 1,121 | 3 | 5 | 0 | |||||||||||||||||||||||||||
Fixed term full time | 672 | 1.6 | 182 | 490 | 35 | 327 | 4 | 12 | 294 | |||||||||||||||||||||||||||
Fixed term part time | 11 | 0.0 | 3 | 8 | 0 | 11 | 0 | 0 | 0 | |||||||||||||||||||||||||||
Casual | 95 | 0.2 | 29 | 66 | 0 | 95 | 0 | 0 | 0 | |||||||||||||||||||||||||||
Total | 40,872 | 100.0 | 25,712 | 15,160 | 1,651 | 31,155 | 84 | 693 | 7,289 | |||||||||||||||||||||||||||
Table 3 – Employees by category and diversity for FY2024
| Gender | Gender % | Age group % | ||||||||||||||||||||||||||||||||||
| Category | Total | Male | Female | Male % | Female % | Under 30 | 30–39 | 40–49 | 50+ | |||||||||||||||||||||||||||
Senior leaders | 262 | 158 | 104 | 60.3 | 39.7 | 0.0 | 6.9 | 51.9 | 41.2 | |||||||||||||||||||||||||||
Managers | 1,369 | 828 | 541 | 60.5 | 39.5 | 0.4 | 23.4 | 51.2 | 25.1 | |||||||||||||||||||||||||||
Supervisory and professional | 18,070 | 10,723 | 7,347 | 59.3 | 40.7 | 9.2 | 39.3 | 32.9 | 18.6 | |||||||||||||||||||||||||||
Operators and general support | 21,171 | 14,003 | 7,168 | 66.1 | 33.9 | 20.1 | 28.7 | 25.2 | 26.0 | |||||||||||||||||||||||||||
Total | 40,872 | 25,712 | 15,160 | 62.9 | 37.1 | 14.5 | 33.0 | 29.7 | 22.8 | |||||||||||||||||||||||||||
225
Table of Contents
Board and executive management diversity
In accordance with UK Listing Rule 14.3.30(2), these tables set out the Board and executive management diversity data as at 30 June 2024.
Gender identity
| Number of Board members | Percentage of the Board | Number of senior positions on the Board (CEO, CFO, SID and Chair)4 | Number in executive management5 | Percentage of executive management5 | ||||||||||||||||
Men | 6 | 60 | % | 3 | 5 | 45 | % | |||||||||||||
Women | 4 | 40 | % | – | 6 | 55 | % | |||||||||||||
Not specified/prefer not to say | 0 | 0 | % | – | 0 | 0 | % | |||||||||||||
Ethnic background
| Number of Board members | Percentage of the Board | Number of senior positions on the Board4 | Number in executive management5 | Percentage of executive management5 | ||||||||||||||||
White British or other White (including minority-white groups) | 8 | 80 | % | 2 | 7 | 64 | % | |||||||||||||
Mixed/Multiple ethnic groups | 1 | 10 | % | 1 | 3 | 27 | % | |||||||||||||
Asian/Asian British | 1 | 10 | % | – | 1 | 9 | % | |||||||||||||
Black/African/Caribbean/Black British | 0 | 0 | % | – | 0 | 0 | % | |||||||||||||
Other ethnic group | 0 | 0 | % | – | 0 | 0 | % | |||||||||||||
Not specified/prefer not to say | 0 | 0 | % | – | 0 | 0 | % | |||||||||||||
| 1. | Based on a ‘point-in-time’ snapshot of employees as at 30 June 2024, including employees on extended absence, which was 1,146 in FY2024. There is no significant seasonal variation in employment numbers. |
| 2. | Contractor data is collected from internal organisation systems. Contractor data is averaged for a 10-month period, July 2023 to April 2024. |
| 3. | Figures reported do not include employees and contractors of BHP Billiton Mitsubishi Alliance Blackwater and Daunia operations, sold to Whitehaven Coal during FY2024. Figures reported do not include employees and contractors of the operations located in Brazil, that were acquired as part of the OZ Minerals acquisition completed during FY2023. |
| 4. | These tables are set out in the format prescribed by the UK Listing Rules. For BHP, the senior Board positions are the CEO, Senior Independent Director and Chair as the CFO is not a member of the Board, in line with market practice for Australian listed companies. |
| 5. | In accordance with the UK Listing Rules, executive management includes the Executive Leadership Team (the most senior executive body below the Board) and the Group Company Secretary, excluding administrative and support staff. |
226
Table of Contents
8 Legal proceedings
The Group is involved from time to time in legal proceedings and government investigations, including claims and pending actions against it seeking damages or clarification or prosecution of legal rights and regulatory inquiries regarding business practices. Insurance or other indemnification protection may offset the financial impact on the Group of a successful claim.
This section summarises the significant legal proceedings, investigations, and associated matters in which the Group is currently involved or has finalised since our last Annual Report.
Legal proceedings relating to the failure of the Fundão tailings dam at the Samarco iron ore operations in Minas Gerais and Espírito Santo (Samarco dam failure)
The Group is engaged in numerous legal proceedings relating to the Samarco dam failure. While there has been progress in priority areas, such as individual compensation and indemnification for the damage caused by the dam failure, it is not possible at this time to provide a range of possible outcomes for all proceedings or a reliable estimate of potential future exposures. BHP Billiton Brasil Ltda. (BHP Brasil) is a party to approximately 42 ongoing public civil claims, of which 20 are suspended. The most significant of these proceedings are summarised in this section Additional information 8. There are numerous additional lawsuits against Samarco relating to the dam failure to which the Group is not a party.
Public civil actions brought by federal prosecutors and agreements
Several legal proceedings have been brought by government authorities and civil associations claiming environmental and socioeconomic damages and a number of specific remediation measures as a result of the Samarco dam failure, including proceedings in which BHP Brasil is a defendant. Among the claims brought against BHP Brasil are:
| • | the public civil action brought by the Federal Government of Brazil, states of Espírito Santo and Minas Gerais and other public authorities against Samarco and its shareholders, BHP Brasil and Vale S.A. (Vale) in November 2015, seeking their joint liability for the full reparation of environmental and socioeconomic damages arising from the Samarco dam failure, in the amount of R$20 billion (approximately US$3.6 billion1) (the R$20 billion Public Civil claim) |
227
Table of Contents
| • | the public civil action brought by the Brazilian Federal Public Prosecutors’ Office against Samarco, BHP Brasil and Vale, as well as other public entities in May 2016, seeking R$155 billion (approximately US$27.9 billion1) for reparation, compensation and social, individual and collective moral damages in relation to the Samarco dam failure (the R$155 billion Federal Public Prosecutors’ Office claim) |
A number of other proceedings to which BHP Brasil is a party are currently suspended due to their connection with the R$20 billion Public Civil claim and R$155 billion Federal Public Prosecutors’ Office claim.
Samarco, Vale, BHP Brasil, and other public authorities have entered into agreements for the remediation of damages resulting from the Samarco dam failure.
| • | In March 2016, Samarco, BHP Brasil and Vale (Companies), entered into a Framework Agreement with the Federal Government of Brazil, the states of Espírito Santo and Minas Gerais and certain other public authorities to establish a foundation (Renova Foundation) to develop and execute environmental and socioeconomic programs (Programs) to remediate and provide compensation for damages caused by the Samarco dam failure. The term of the Framework Agreement is 15 years, renewable for periods of one year successively until all obligations under the Framework Agreement have been performed. Under the Framework Agreement, Samarco is responsible, as a primary obligor, for funding Renova Foundation’s annual calendar year budget for the duration of the Framework Agreement. The amount of funding for each calendar year will depend on the remediation and compensation projects to be undertaken in a particular year and judicial decisions. To the extent that Samarco does not meet its funding obligations under the Framework Agreement, BHP Brasil and Vale have funding obligations under the Framework Agreement, as secondary obligors, each in proportion to its 50 per cent shareholding in Samarco in this section Additional Information 8. |
| • | In June 2018, Samarco, BHP Brasil, Vale, the other parties to the Framework Agreement, the Public Prosecutors’ Office2 and the Public Defense Office3 entered into a Governance Agreement (ratified by the Court on 8 August 2018), which settled the merits of the R$20 billion Public Civil claim and established a process to renegotiate the Programs over two years to progress settlement of the R$155 billion Federal Public Prosecutors’ Office claim. Under the Governance Agreement, renegotiation of the Programs is based on certain agreed principles, including full reparation consistent with Brazilian law, the requirement for a technical basis for any proposed changes, consideration of findings from experts appointed by Samarco, BHP Brasil and Vale, consideration of findings from experts appointed by prosecutors and consideration of feedback from impacted communities. |
In February 2021, the Minas Gerais State Prosecutor filed a public civil action against Samarco, BHP Brasil, Vale and Renova Foundation seeking the dissolution of Renova Foundation. The plaintiffs are seeking R$10 billion (approximately US$1.8 billion1) for moral damages. An injunction for the immediate intervention in Renova Foundation was also sought, alleging the need to preserve information and documents produced by Renova Foundation to evaluate criminal and civil responsibilities. A ruling on the merits is pending.
Since 7 January 2020, the Federal Court has issued several decisions creating 14 enforcement proceedings and ruled on several proceedings linked to the R$20 billion Public Civil claim and R$155 billion Federal Public Prosecutors’ Office claim, including dismissal without prejudice of some of the requests and proceedings. Issues covered by these proceedings include, for example, environmental recovery, tailings management, human health risk and ecological risk, resettlement of affected communities, infrastructure and development, registration of certain impacted individuals under the Programs, monthly emergency financial aid, loss of profit and indemnities for people impacted by the Samarco dam failure, resumption of economic activities, water supply for human consumption and hiring of technical advisers to impacted people, Renova Foundation’s governance and management system, and new areas allegedly affected by the dam failure, including freezing orders requests.
In October 2023, the Federal Court judge rendered a decision determining that the Interfederative Committee (IFC), which is an external and independent body responsible for supervising Renova Foundation and its programs, holds the final authority to determine technical issues concerning the reparation. This decision was confirmed by the Federal Court of Appeals in April 2024, which upheld that Renova Foundation and the Companies must comply with all IFC’s directions, which are presumed to be valid and must prevail, unless the Companies and Renova Foundation can present clear proof that they are illegal. In January 2024, the Federal Court rendered a decision (25 January decision) that found Samarco, Vale and BHP Brasil jointly and severally liable to pay collective moral damages in the amount of R$47.6 billion (approximately US$8.6 billion1) (to be adjusted for interest and inflation). The decision ordered that no payment should occur until the decision is final and unappealable. In March 2024, the Federal Court found that the correct historical amount due of collective moral damages is R$46.7 billion (instead of R$47.6 billion). Samarco, Vale, and BHP Brasil appealed the decision challenging the merits and amount of damages. In May 2024, the various government parties filed interlocutory appeals to the 25 January decision seeking increased damages and the ability to enforce the judgment prior to it becoming final. The Federal Court judge and the Federal Court of Appeals issued rulings denying the requests for early enforcement. On 27 June 2024, the Federal Court judge dismissed without prejudice certain claims directed at the Companies in the R$155 billion Federal Public Prosecutors’ Office claim, on the grounds that they are already covered by previous agreements and decisions (such as the Framework Agreement). This decision did not dismiss the collective moral damages decision outlined above and is subject to appeal.
Footnotes
| 1. | Based on the exchange rate as at 30 June 2024. |
| 2. | The Public Prosecutors’ Office includes the Federal, State of Minas Gerais and State of Espírito Santo public prosecutors’ offices. |
| 3. | The Public Defense Office includes the Federal, State of Minas Gerais and State of Espírito Santo public defense offices. |
In June 2024, the Public Prosecutors’ Office and the Public Defense Office filed a public civil claim against the Companies and Renova Foundation for alleged gender discrimination against women in the reparation process. They requested certain changes in Renova Foundation’s registration program, damages and an injunctive relief to implement emergency measures. On 14 August 2024, the Federal Court partially granted the injunctive relief request and ordered Renova Foundation to allow the review of the registration of all women who are either registered or have pending registration applications in Renova Foundation. The decision is subject to appeal.
228
Table of Contents
The parties have been engaging in negotiations to seek a definitive and substantive settlement of claims relating to the Samarco dam failure. The negotiations are ongoing and the outcome is uncertain. The potential liabilities resulting from current and future claims, lawsuits, proceedings, enforcement actions and Framework Agreement obligations relating to the Samarco dam failure, together with the potential cost of implementing remedies sought in the various proceedings, cannot be estimated with certainty at this time and there is a risk that outcomes may be materially higher or lower than amounts reflected in BHP Brasil’s provision and contingencies for the Samarco dam failure.
For more information on BHP Brasil’s provision and contingencies for the Samarco dam failure refer to Financial Statements note 4 ‘Significant events – Samarco dam failure’
Civil public actions commenced by the State Prosecutors’ Office in the state of Minas Gerais (Mariana CPA cases)
The State Prosecutors of Mariana have commenced several civil public actions (CPAs) against Samarco, BHP Brasil and Vale.
On 10 December 2015, the State Prosecutors’ Office in the state of Minas Gerais filed a CPA against Samarco, BHP Brasil and Vale before the State Court in Mariana claiming indemnification (amount not specified) for moral and material damages to an unspecified group of individuals affected by the Samarco dam failure, including the payment of costs for housing and social and economic assistance (CPA Mariana I).
On 2 October 2018, the parties reached a settlement dismissing the claim, which was ratified by the Court. Under this settlement, Renova Foundation has reached more than 100 individual agreements with impacted families in Mariana for the payment of damages.
In connection with CPA Mariana I, the State Prosecutors (Minas Gerais) started enforcement proceedings against Samarco, BHP Brasil and Vale. There are six enforcement proceedings under way, which among other things seek (i) to set a deadline for completion of resettlement of the residents of Mariana’s districts and for fines to be imposed for delays to resettlement; (ii) to set the final term that will allow new households to join the resettlement; (iii) payment of compensation to affected individuals for delivery of houses below standard; (iv) to guarantee access to water sources for the families of the collective resettlements; (v) payment of fines for alleged delays in presenting proposals and making payments to affected individuals; and (vi) payment of compensation to impacted individuals who allege they have not yet received compensation and a penalty for the alleged delays in making such payments.
In addition to CPA Mariana I, the State Prosecutors (Minas Gerais) commenced other CPAs in Mariana against Samarco, BHP Brasil, Vale and, in some cases, Renova Foundation. The claims presented in those CPAs are related to damages that, according to the State Prosecutors, are not covered by CPA Mariana I.
As to those CPAs, there are proceedings that (i) have been settled by the parties, including BHP Brasil, (ii) have been dismissed or (iii) are still pending (9 in total). Renova Foundation is responsible for any pending obligations set forth in the settlement agreements relating to the CPAs and for complying with future awards eventually rendered in the remaining CPAs.
Civil public action commenced by Associations concerning the use of Tanfloc for water treatment (R$120 billion Associations claim)
On 28 October 2021, the Vila Lenira Residents Association, State of Espírito Santo Rural Producers and Artisans Association, Colatina Velha Neighbourhood Residents Association, and United for the Progress of Palmeiras Neighbourhood Association filed a lawsuit against Samarco, BHP Brasil and Vale and others, including the State of Minas Gerais, the State of Espírito Santo and the Federal Government. The plaintiffs allege the defendants carried out a clandestine study on the citizens of the locations affected by the Samarco dam failure, using Tanfloc, a tannin-based flocculant/coagulant that is currently used for wastewater treatment applications. The plaintiffs claim this product allegedly put the population at risk due to its alleged experimental qualities.
On 17 November 2023, the Federal Court dismissed the lawsuit without prejudice due to the Associations’ lack of standing to sue and the defectiveness of the complaint. The Associations filed a motion for clarification and the decision is still subject to appeal.
Indigenous Communities – Civil public action for partial nullity of agreements
In February 2024, the Federal Prosecutor’s Office filed a collective lawsuit against the Companies, alleging that the settlement agreements entered into between Renova Foundation and the Indigenous communities of Tupiniquim Guarani, Mboapy Pindó, and Comboios contain nullities regarding the release of monthly Emergency Subsistence Aid (ASE), and requested an injunction ordering the Companies to continue to pay ASE to the Indigenous Peoples of the Tupiniquim, Comboios, and Caieiras Velha II, in the Indigenous Lands of Aracruz, State of Espírito Santo in Brazil, following certain new rules, including an increase in the monthly payment amount. On 4 March 2024, the Federal Court granted the Federal Prosecutor’s request for a preliminary injunction, which was later overturned in April 2024. As of 30 June 2024, a final decision on the merits is pending.
229
Table of Contents
Other civil proceedings in Brazil
As noted above, BHP Brasil has been named as a defendant in numerous lawsuits relating to the Samarco dam failure. In addition, government inquiries and investigations relating to the Samarco dam failure have been commenced by the Brazilian Government’s representatives and are ongoing, including studies regarding impact of the dam failure.
BHP Brasil’s potential liabilities, if any, resulting from other pending and future claims, lawsuits and enforcement actions relating to the Samarco dam failure, together with the potential cost of implementing remedies sought in the various proceedings, cannot be reliably estimated at this time. Ultimately, these could have a material adverse impact on BHP’s business, competitive position, cash flows, prospects, liquidity and shareholder returns.
For more information on the Samarco dam failure refer to OFR 7
As of 30 June 2024, Samarco had been named as a defendant in more than 87,200 small claims for moral damages in which people argue their public water service was interrupted for between five and 10 days, of which approximately 38,000 claims are still active. BHP Brasil is a co-defendant in more than 24,300 of these cases.
The Brazilian Code of Civil Procedure provides that repetitive claims can be settled through a proceeding known as the Resolution of Repetitive Demands Procedure (IRDR). Under the IRDR, a court will hear a ‘pilot case’ representative of such recurring legal matters and the judgment in that decision will set a precedent for the resolution of similar cases in that jurisdiction. An IRDR has been established in Minas Gerais and the court in the pilot case has ruled that the mandatory parameter for resolution of claims will be the payment of R$2,000 (approximately US$4001) per individual claim for moral damages due to the suspension of public water supply. Appeals before higher courts were filed. Meanwhile, as of 30 June 2024, Samarco has reached settlement in more than 18,200 individual cases. On 21 May 2024, the Superior Court of Justice granted the State Prosecutor of Minas Gerais request to declare null the IRDR due to the alleged failure to satisfy the procedural requirements necessary for its formal admissibility.
Samarco’s judicial reorganisation
On 9 April 2021, Samarco filed for judicial reorganisation (JR) with the Second Business State Court for the Belo Horizonte District of Minas Gerais (JR Court). On 28 July 2023, Samarco and one of its supporting creditors filed a consensual plan (Consensual Plan), which provided, among other things, that the agreements entered into between Samarco and Brazilian public authorities in connection with the Samarco dam failure will not be impaired by the Consensual Plan and Samarco will continue to have the primary obligation to fund Renova Foundation. In addition, pursuant to the Consensual Plan, between 2024 and full payment of the debt owed by Samarco to the holders of the senior notes, Samarco is permitted to fund remediation activities to Renova Foundation up to a US$1 billion cap. This means that BHP Brasil and Vale will pay directly or fund Samarco in the form of common equity in respect of remediation obligations, including payments to Renova Foundation, in excess of the US$1 billion cap. The JR Court confirmed the Consensual Plan on 1 September 2023. Following the confirmation of the Consensual Plan and satisfaction of other conditions precedent set forth therein, the definitive documentation formalising the consummation of Samarco’s financial debt restructuring was executed on 1 December 2023. Samarco has paid the majority of labour claims, suppliers and other non-financial creditors as provided in the Consensual Plan. BHP Brasil participated in Samarco’s JR proceeding in its capacities as a shareholder and creditor of Samarco.
Class or group action claims
BHP Group Limited and certain of its subsidiaries have been named as defendants in class or group action claims related to the Samarco dam failure. The most significant of those claims are summarised in the bullets below.
| • | BHP Group Limited is named as a defendant in a shareholder class action in the Federal Court of Australia on behalf of persons who acquired shares in BHP Group Limited or BHP Group Plc (now BHP Group (UK) Ltd) in periods prior to the Samarco dam failure. The amount of damages sought in the class action is unspecified. A trial is scheduled to commence in September 2025. |
| • | BHP Group (UK) Ltd (formerly BHP Group Plc) and BHP Group Limited are named as defendants in group action claims for damages filed in the courts of England. These claims were filed on behalf of certain individuals, municipalities, businesses and communities in Brazil allegedly impacted by the Samarco dam failure. The amount of damages sought in these claims is unspecified. In December 2022, the BHP parties filed their defence and a contribution claim against Vale. The contribution claim contended that if the BHP parties’ defence is not successful and they are ordered to pay damages to the claimants, Vale should contribute to any amount payable. A trial in relation to the BHP parties’ liability for the dam failure is set to commence in October 2024. |
| • | In January 2024, the BHP parties were served with a new group action filed in the courts of England on behalf of additional individuals and businesses in Brazil allegedly impacted by the Samarco dam failure. The new action makes broadly the same claims as the original action and the amount of damages sought in these claims is unspecified. |
In March 2024, a claim was filed in the Netherlands against Vale S.A. and a Dutch subsidiary of Samarco for compensation relating to the Fundão dam failure. The claim filed in the Netherlands indicates that these claims were filed on behalf of certain individuals, municipalities, businesses, associations, and faith-based institutions allegedly impacted by the Samarco dam failure who are not also claimants in the UK group action claims referred to above. BHP is not a defendant in the Netherlands proceedings.
230
Table of Contents
In July 2024, BHP Group Limited, BHP Group (UK) Ltd, BHP Brasil Ltda and Vale S.A. entered into an agreement – without any admission of liability in any proceedings – whereby: (i) Vale will pay 50 per cent of any amounts that may be payable by the BHP Defendants to the claimants in the UK group action claims (or by the BHP Defendants, BHP Brasil or their related parties to claimants in any other proceedings in Brazil, England or the Netherlands covered by the agreement); and (ii) BHP Brasil will pay 50 per cent of any amounts that may be payable by Vale to the claimants in the Netherlands proceedings (or by Vale or its related parties to claimants in any other proceedings in Brazil, England or the Netherlands covered by the agreement). The agreement reinforces the terms of the Framework Agreement entered into in 2016 which require BHP Brasil and Vale to each contribute 50 per cent to the funding of the Renova Foundation for compensation of persons impacted by the Fundão dam failure where Samarco is unable to contribute that funding. The BHP Defendants withdrew the contribution claim against Vale in England as it is no longer necessary given this agreement.
Criminal charges
On 20 October 2016, the Federal Prosecutors’ Office in Brazil filed criminal charges against Samarco, BHP Brasil, Vale and certain of their employees and former employees in the Federal Court of Ponte Nova, Minas Gerais. On 3 March 2017, BHP Brasil and the charged employees and former employees of BHP Brasil (Affected Individuals) filed their preliminary defences. The Federal Court granted Habeas Corpus petitions in favour of all eight Affected Individuals, terminating the charges against those individuals. The Federal Prosecutors’ Office appealed seven of the decisions with hearings of the appeals still pending. BHP Brasil remains a defendant in the criminal proceeding. The evidentiary phase has been concluded and Federal Prosecutors and defendants are expected to present written closing arguments by August 2024. BHP Brasil rejects the charges against BHP Brasil and the Affected Individuals and expects to defend against the charges and fully support each of the Affected Individuals in their defences of the charges.
In several civil proceedings the Federal Court has stated that Renova Foundation has allegedly obstructed the adoption of reparation measures. The judge ordered an official notice to be sent to the Prosecutor’s Office to communicate his view on the need for an investigation into Renova Foundation’s conduct. On 10 May 2024 the Public Prosecutor’s Office publicly announced that they will conduct an investigation into Renova Foundation, without specifying if civil or criminal liability for Renova Foundation, BHP Brasil, Vale, Samarco or any individual will be sought.
Legal proceedings unrelated to the Samarco dam failure
South African class action claim
On 14 August 2023, an application to commence a class action was filed in the High Court of South Africa on behalf of current and former mineworkers (and the dependants of certain mineworkers). The mineworkers are alleged to have contracted coal mine dust lung disease and to have worked on specified coal mines in South Africa between 1965 and the filing date. ‘BHP Billiton Plc Incorporated’ is named as a respondent, alongside South32 SA Holdings Limited and Seriti Power (Proprietary) Limited. The claims against the BHP entity relate to the period from 1999 to 2015. The relevant businesses were divested in 2015 as part of the demerger of South32 Limited.
The matter is currently at the certification stage whereby the South African Court must first grant permission for a class action to proceed. BHP, South32 and Seriti have filed notices opposing certification. The amount of damages sought by the Applicants on behalf of the putative class is unspecified. BHP has notified South32 that it considers any liability to the Applicants arising from the class action to be indemnified under the terms of the Separation Deed agreed as part of the demerger of South32 in 2015.
9 Shareholder information
9.1 History and development
BHP Group Limited (formerly BHP Billiton Limited, before then BHP Limited and, before that, The Broken Hill Proprietary Company Limited) was incorporated in 1885 and is registered in Australia with ABN 49 004 028 077.
9.2 Markets
As at the date of this Annual Report, BHP Group Limited has a primary listing on the Australian Securities Exchange (ASX) (ticker BHP) in Australia, an international secondary listing on the London Stock Exchange (LSE) (ticker BHP), a secondary listing on the Johannesburg Stock Exchange (ticker BHG) and is listed on the New York Stock Exchange (NYSE) in the United States.
Trading on the NYSE is in the form of American Depositary Receipts (ADRs) evidencing American Depositary Shares (ADSs), with each ADS representing two ordinary shares of BHP Group Limited. Citibank N.A. (Citibank) is the Depositary for the ADS program. BHP Group Limited’s ADSs have been listed for trading on the NYSE (ticker BHP) since 28 May 1987.
231
Table of Contents
9.3 Organisational structure
BHP Group Limited is the ultimate parent company of all subsidiaries within the BHP Group.
From June 2001 to January 2022, BHP operated under a Dual Listed Company (DLC) structure, with two separate parent companies (BHP Group Limited and BHP Group Plc (now BHP Group (UK) Limited) and their respective subsidiaries operating as a single unified economic entity run by a unified Board and senior executive management team.
On 31 January 2022, BHP unified its DLC structure, following which BHP Group Plc (now BHP Group (UK) Limited) became a subsidiary of BHP Group Limited.
9.4 Constitution
This section sets out a summary of BHP Group Limited’s Constitution, as well as other related arrangements under applicable laws and regulations.
Provisions of the Constitution of BHP Group Limited can be amended only where such amendment is approved by special resolution. A special resolution is a resolution that is passed by at least 75 per cent (i.e. at least three quarters) of the votes cast by BHP shareholders entitled to vote being in favour of the resolution.
Board
The Board may exercise all powers of BHP, other than those that are reserved for BHP shareholders to exercise in a general meeting.
Power to issue securities
Under the Constitution, the Board has the power to issue any BHP shares or other securities (including redeemable shares) with preferred, deferred or other special rights, obligations or restrictions. The Board may issue shares on any terms it considers appropriate, provided that:
| • | the issue does not affect any special rights of shareholders |
| • | if required, the issue is approved by shareholders |
| • | if the issue is of a class other than ordinary shares, the rights attaching to the class are expressed at the date of issue |
Restrictions on voting by Directors
A Director may not vote in respect of any contract or arrangement or any other proposal in which they have a material personal interest except in certain prescribed circumstances, including (subject to applicable laws) where the material personal interest:
| • | arises because the Director is a shareholder of BHP and is held in common with the other shareholders of BHP |
| • | arises in relation to the Director’s remuneration as a Director of BHP |
| • | relates to a contract BHP is proposing to enter into that is subject to approval by the shareholders and will not impose any obligation on BHP if it is not approved by the shareholders |
| • | arises merely because the Director is a guarantor or has given an indemnity or security for all or part of a loan, or proposed loan, to BHP |
| • | arises merely because the Director has a right of subrogation in relation to a guarantee or indemnity referred to above |
| • | relates to a contract that insures or would insure the Director against liabilities the Director incurs as an officer of BHP, but only if the contract does not make BHP or a related body corporate the insurer |
| • | relates to any payment by BHP or a related body corporate in respect of an indemnity permitted by law, or any contract relating to or containing such an indemnity, or |
| • | is in a contract or proposed contract with or for the benefit of or on behalf of a related body corporate and arises merely because the Director is a director of a related body corporate |
If a Director has a material personal interest and is not entitled to vote on a proposal, they will not be counted in the quorum for any vote on a resolution concerning the material personal interest.
Loans by Directors
Any Director may lend money to BHP at interest with or without security or may, for a commission or profit, guarantee the repayment of any money borrowed by BHP and underwrite or guarantee the subscription of shares or securities of BHP or of any corporation in which BHP may be interested without being disqualified as a Director and without being liable to account to BHP for any commission or profit.
232
Table of Contents
Appointment and retirement of Directors
Appointment of Directors
The Constitution provides that a person may be appointed as a Director of BHP Group Limited by the existing Directors of BHP or may be elected by the shareholders in a general meeting.
Any person appointed as a Director of BHP Group Limited by the existing Directors will hold office only until the next general meeting that includes an election of Directors.
A person may be nominated by shareholders as a Director of BHP Group Limited if:
| • | a shareholder provides a valid written and signed notice of the nomination |
| • | the person nominated by the shareholder satisfies candidature for the office and provides written and signed notice of their willingness to be elected as a Director |
and the nomination is provided at least 40 business days before the date of the general meeting. The person nominated as a Director may be elected to the Board by ordinary resolution passed in a general meeting.
Retirement of Directors
The Board has adopted a policy under which all Non-executive Directors must, if they wish to remain on the Board, seek re-election by shareholders annually. This policy took effect in 2011 and replaced the previous system that required Non-executive Directors to submit themselves to shareholders for re-election at least every three years.
A Director may be removed from the Board in accordance with applicable law and must vacate their office as a Director in certain circumstances set out in the Constitution. There is no requirement for a Director to retire on reaching a certain age.
Rights attaching to shares
Dividend rights
Under Australian law, dividends on shares may be paid only if the company’s assets exceed its liabilities immediately before the dividend is determined and the excess is sufficient for payment of the dividend, the payment of the dividend is fair and reasonable to the company’s shareholders as a whole and the payment of the dividend does not materially prejudice the company’s ability to pay its creditors.
The Constitution provides that payment of any dividend may be made in any manner, by any means and in any currency determined by the Board.
All unclaimed dividends may be invested or otherwise used by the Board for the benefit of BHP until claimed or otherwise disposed of according to law. BHP Group Limited is governed by the Victorian unclaimed monies legislation, which requires BHP to pay to the State Revenue Office any unclaimed dividend payments of A$20 or more that have remained unclaimed for over 12 months.
Voting rights
For the purposes of determining which shareholders are entitled to attend or vote at a meeting of BHP Group Limited and how many votes such shareholder may cast, the Notice of Meeting specifies when a shareholder must be entered on the Register of Shareholders in order to have the right to attend or vote at the meeting. The specified time must be not more than 48 hours before the time of the meeting.
Shareholders who wish to appoint a proxy to attend, vote or speak at a meeting of BHP Group Limited on their behalf must deposit the form appointing a proxy so that it is received not less than 48 hours before the time of the meeting.
Rights to share in profits
The rights attached to shares of BHP Group Limited, as regards the participation in the profits available for distribution that the Board determines to distribute, are as follows:
| • | The holders of any preference shares will be entitled, in priority to any payment of dividend to the holders of any other class of shares, to a preferred right to participate as regards dividends up to but not beyond a specified amount in distribution. |
| • | Any surplus remaining after payment of the distributions above will be payable to the holders of ordinary shares in equal amounts per share. |
Rights on return of assets on liquidation
On a return of assets on liquidation of BHP Group Limited, the assets of BHP Group Limited remaining available for distribution among shareholders after the payment of all prior ranking amounts owed to all creditors and holders of preference shares, and to all prior ranking statutory entitlements, are to be applied on an equal priority with any amount paid to the holders of BHP Group Limited ordinary shares. Any surplus remaining is to be applied in making payments solely to the holders of BHP Group Limited ordinary shares in accordance with their entitlements.
233
Table of Contents
Redemption of preference shares
If BHP Group Limited at any time proposes to create and issue any preference shares, the terms of the preference shares may give either or both of BHP Group Limited and the holder the right to redeem the preference shares.
The preference shares’ terms may also give the holder the right to convert the preference shares into ordinary shares.
Under the Constitution, the preference shares must give the holders:
| • | the right (on redemption and on a winding-up) to payment in cash in priority to any other class of shares of (i) the amount paid or agreed to be considered as paid on each of the preference shares; and (ii) the amount, if any, equal to the aggregate of any dividends accrued but unpaid and of any arrears of dividends |
| • | the right, in priority to any payment of dividend on any other class of shares, to the preferential dividend |
Capital calls
Subject to the terms on which any shares may have been issued, the Board may make calls on the shareholders in respect of all monies unpaid on their shares. BHP Group Limited has a lien on every partly paid share for all amounts payable in respect of that share. Each shareholder is liable to pay the amount of each call in the manner, at the time and at the place specified by the Board (subject to receiving at least 14 days’ notice specifying the time and place for payment). A call is considered to have been made at the time when the resolution of the Board authorising the call was passed.
Borrowing powers
Subject to relevant law, the Directors may exercise all powers of BHP to borrow money and to mortgage or charge its undertaking, property, assets (both present and future) and all uncalled capital or any part or parts thereof, and to issue debentures and other securities, whether outright or as collateral security for any debt, liability or obligation of BHP or of any third party.
Variation of class rights
Rights attached to any class of shares issued by BHP Group Limited can only be varied where such variation is approved by:
| • | the company as a special resolution, and |
| • | the holders of the issued shares of the affected class, either by a special resolution passed at a separate meeting of the holders of the issued shares of the class affected, or with the written consent of members with at least 75 per cent of the votes of that class |
Annual General Meetings
The Annual General Meeting (AGM) provides a forum to facilitate the sharing of shareholder views and is an important event in the BHP calendar. The meeting provides an update for shareholders on our performance and offers an opportunity for shareholders to ask questions and vote. To vote at an AGM, a shareholder must be a registered holder of BHP Group Limited shares at a designated time before the relevant AGM.
Key members of management, including the Chief Executive Officer (CEO) and Chief Financial Officer, are present and available to answer questions. The External Auditor will also be available to answer questions.
Proceedings at AGMs are webcast live from our website. Copies of the speeches delivered by the Chair and CEO to the AGM are released to the relevant stock exchanges and posted on our website. The outcome of voting on the items of business are released to the relevant stock exchanges and posted on our website as soon as they are available following completion of the AGM and finalisation of the polls.
More information on our AGMs is available at bhp.com/meetings
Conditions governing general meetings
The Board may, and must on requisition in accordance with applicable laws, call a general meeting of the shareholders at the time and place or places and in the manner determined by the Board. No shareholder may convene a general meeting of BHP Group Limited except where entitled under law to do so. Any Director may convene a general meeting whenever the Director thinks fit. General meetings can also be adjourned, cancelled or postponed where permitted by law or the Constitution. Notice of a general meeting must be given to each shareholder entitled to vote at the meeting and such notice of meeting may be given in the form and manner in which the Board thinks fit subject to any applicable law. Five shareholders of the company present in person or by proxy constitute a quorum for a general meeting. A shareholder who is entitled to attend and cast a vote at a general meeting of BHP Group Limited may appoint a person as a proxy to attend and vote for the shareholder in accordance with applicable law. All provisions of the Constitution relating to general meetings apply with any necessary modifications to any special meeting of any class of shareholders that may be held.
234
Table of Contents
Limitations of rights to own securities
There are no limitations under the Constitution restricting the right to own BHP shares or other securities. The Australian Foreign Acquisitions and Takeovers Act 1975 imposes a number of conditions that restrict foreign ownership of Australian-based companies.
For information on share control limits imposed by relevant laws refer to Additional information 9.8
Documents on display
Documents filed by BHP Group Limited on the Australian Securities Exchange (ASX) are available at asx.com.au and documents filed on the London Stock Exchange (LSE) are available at data.fca.org.uk/#/nsm/nationalstoragemechanism. Documents filed on the ASX or on the LSE are not incorporated by reference into this Annual Report. The documents referred to in this Annual Report as being available on our website, bhp.com, are not incorporated by reference and do not form part of this Annual Report.
BHP Group Limited files Annual Reports and other reports and information with the US Securities and Exchange Commission (SEC). These filings are available on the SEC website at sec.gov
9.5 Share ownership
Share capital
The details of the share capital for BHP Group Limited are presented in Financial Statements note 17 ‘Share capital’ and remain current as at 16 July 2024.
Substantial shareholders in BHP Group Limited
BHP Group Limited is not directly or indirectly controlled by another corporation or by any government. No shareholder possesses voting rights that differ from those attaching to all of BHP Group Limited’s voting securities.
The following table shows holdings of 5 per cent or more of voting rights in BHP Group Limited’s shares as notified to BHP Group Limited under the Australian Corporations Act 2001 (Cth), Section 671B as at 16 July 2024.
Date of last notice | ||||||||||||||
Title of class | Identity of person or group | Date received | Date of change | Number owned | % of total voting rights1 | |||||||||
Ordinary shares | BlackRock Group2 | 03 February 2022 | 31 January 2022 | 347,008,470 | 6.85 | % | ||||||||
Ordinary shares | Citigroup Global Markets Australia Pty Limited | 26 April 2022 | 21 April 2022 | 318,921,856.17 | 6.2999 | % | ||||||||
Ordinary shares | State Street Corporation | 15 May 2024 | 13 May 2024 | 310,604,627 | 6.12 | % | ||||||||
Ordinary shares | The Vanguard Group Inc. | 13 September 2022 | 07 September 2022 | 253,318,530 | 5.001 | % | ||||||||
| 1. | The percentages quoted are based on the voting rights provided in the last substantial shareholders’ notice. |
| 2. | In addition, on 3 February 2022, BlackRock Group notified that, as of 31 January 2022, it owned 4,152,969 American Depositary Receipts, with a voting power of 0.08 per cent. Each American Depositary Receipt represents two fully paid ordinary shares in BHP Group Limited. |
235
Table of Contents
Twenty largest shareholders as at 16 July 2024 (as named on the Register of Shareholders)1
| BHP Group Limited | Number of fully paid shares | % of issued capital | ||||||||
| 1. | HSBC Custody Nominees (Australia) Limited 2 | 1,385,528,644 | 27.32 | |||||||
| 2. | J P Morgan Nominees Australia Pty Limited | 909,805,343 | 17.94 | |||||||
| 3. | Citicorp Nominees Pty Ltd | 379,203,501 | 7.48 | |||||||
| 4. | Citicorp Nominees Pty Limited <Citibank NY ADR DEP A/C> | 289,613,351 | 5.71 | |||||||
| 5. | Computershare Clearing Pty Ltd <CCNL DI A/C>3 | 230,277,141 | 4.54 | |||||||
| 6. | South Africa Control A/C\C4 | 186,947,112 | 3.69 | |||||||
| 7. | BNP Paribas Nominees Pty Ltd <Agency Lending A/C> | 104,509,093 | 2.06 | |||||||
| 8. | National Nominees Limited | 75,964,078 | 1.50 | |||||||
| 9. | BNP Paribas Noms Pty Ltd | 68,456,596 | 1.35 | |||||||
| 10. | Citicorp Nominees Pty Limited <Colonial First State Inv A/C> | 45,222,045 | 0.89 | |||||||
| 11. | HSBC Custody Nominees (Australia) Limited <Nt-Comnwlth Super Corp A/C> | 36,674,802 | 0.72 | |||||||
| 12. | BNP Paribas Nominees Pty Ltd <Clearstream> | 24,925,705 | 0.49 | |||||||
| 13. | Computershare Nominees CI Ltd <ASX Shareplus Control A/C> | 22,796,591 | 0.45 | |||||||
| 14. | BNP Paribas Nominees Pty Ltd <HUB24 Custodial Serv Ltd> | 18,864,475 | 0.37 | |||||||
| 15. | Netwealth Investments Limited <Wrap Services A/C> | 15,707,723 | 0.31 | |||||||
| 16. | Australian Foundation Investment Company Limited | 13,413,159 | 0.26 | |||||||
| 17. | HSBC Custody Nominees (Australia) Limited | 12,593,578 | 0.25 | |||||||
| 18. | Argo Investments Limited | 9,990,464 | 0.20 | |||||||
| 19. | BNP Paribas Noms (NZ) Ltd | 5,759,220 | 0.11 | |||||||
| 20. | HSBC Custody Nominees (Australia) Limited <Euroclear Bank SA NV A/C> | 5,574,343 | 0.11 | |||||||
|
|
|
| |||||||
| 3,841,826,964 | 75.75 | |||||||||
|
|
|
| |||||||
| 1. | Many of the 20 largest shareholders shown for BHP Group Limited hold shares as a nominee or custodian. In accordance with the reporting requirements, the tables reflect the legal ownership of shares and not the details of the underlying beneficial holders. |
| 2. | HSBC Custody Nominees (Australia) Limited is listed twice in the above table as they are registered separately under the same name on the share register. |
| 3. | Computershare Clearing Pty Ltd <CCNL DI A/C> represents the Depositary Interest Register (UK). |
| 4. | South Africa Control A/C\C represents the South African branch register. |
236
Table of Contents
US share ownership as at 16 July 2024
| BHP Group Limited | ||||||||||||||||
| Number of shareholders | % | Number of fully paid shares | % of issued capital | |||||||||||||
Classification of holder | ||||||||||||||||
Registered holders of voting securities | 1,737 | 0.28 | 4,354,308 | 0.09 | ||||||||||||
ADR holders | 1,851 | 0.30 | 289,590,736 | 1 | 5.71 | |||||||||||
| 1 | The number of shares corresponds to 144,795,368 ADRs. |
Distribution of shareholdings by size as at 16 July 2024
| BHP Group Limited | ||||||||||||||||
| Number of shareholders | % | Number of shares1 | % | |||||||||||||
Size of holding | ||||||||||||||||
1 – 5002 | 299,724 | 48.57 | 58,313,947 | 1.15 | ||||||||||||
501 – 1,000 | 107,646 | 17.44 | 82,278,812 | 1.62 | ||||||||||||
1,001 – 5,000 | 165,585 | 26.83 | 372,175,995 | 7.34 | ||||||||||||
5,001 – 10,000 | 26,637 | 4.32 | 187,925,361 | 3.71 | ||||||||||||
10,001 – 25,000 | 13,366 | 2.17 | 200,493,124 | 3.95 | ||||||||||||
25,001 – 50,000 | 2,787 | 0.45 | 95,487,981 | 1.88 | ||||||||||||
50,001 – 100,000 | 912 | 0.15 | 62,785,184 | 1.24 | ||||||||||||
100,001 – 250,000 | 312 | 0.05 | 44,593,549 | 0.88 | ||||||||||||
250,001 – 500,000 | 73 | 0.01 | 23,970,370 | 0.47 | ||||||||||||
500,001 – and over | 73 | 0.01 | 3,943,506,494 | 77.76 | ||||||||||||
|
|
|
|
|
|
|
| |||||||||
Total | 617,115 | 100 | 5,071,530,817 | 100 | ||||||||||||
|
|
|
|
|
|
|
| |||||||||
| 1. | One ordinary share entitles the holder to one vote. |
| 2. | The number of BHP Group Limited shareholders holding less than a marketable parcel (A$500) based on the market price of A$43.08 as at 16 July 2024 was 7,576. |
237
Table of Contents
9.6 Dividends
Policy
The Group adopted a dividend policy in February 2016 that provides for a minimum 50 per cent payout of Underlying attributable profit (Continuing operations) at every reporting period.
For information on Underlying attributable profit (Continuing operations) for FY2024 refer to OFR 4.2 and OFR 10
The Board will assess, at each reporting period, the ability to pay amounts additional to the minimum payment, in accordance with the Capital Allocation Framework, as described in OFR 2.
In FY2024, we determined our dividends and other distributions in US dollars as it is our main functional currency.
Payments
BHP Group Limited shareholders may have their cash dividends paid directly into their bank account in Australian dollars, UK pounds sterling, New Zealand dollars, South African rand or US dollars, provided they have submitted direct credit details and if required, a valid currency election nominating a financial institution to the BHP Share Registrar no later than close of business on the dividend reinvestment plan election date. BHP Group Limited shareholders who do not provide their direct credit details will receive dividend payments by way of a cheque in Australian dollars. BHP Group Limited shareholders who reside in New Zealand must provide valid direct credit details to receive their dividend payment.
Dividend reinvestment plan
BHP offers a dividend reinvestment plan to registered shareholders, which provides shareholders the opportunity to reinvest dividends to purchase additional BHP shares in the market, rather than receiving dividends in cash. Participation in the plan is entirely optional and is subject to the terms and conditions of the plan, which can be found at bhp.com/DRP.
9.7 American Depositary Receipts fees and charges
We have an American Depositary Receipts (ADR) program for BHP Group Limited which has a 2:1 ordinary shares to American Depositary Share (ADS) ratio.
Depositary fees
Citibank serves as the depositary bank for our ADR program. ADR holders agree to the terms in the deposit agreement filed with the SEC for depositing ordinary shares or surrendering ADSs for cancellation and for certain services as provided by Citibank. Holders are required to pay certain fees for general depositary services provided by Citibank, as set out in the tables below.
Standard depositary fees
Depositary service | Fee payable by the ADR holders | |
| Issuance of ADSs upon deposit of shares | Up to US$5.00 per 100 ADSs (or fraction thereof) issued | |
| Delivery of Deposited Securities against surrender of ADSs | Up to US$5.00 per 100 ADSs (or fraction thereof) surrendered | |
| Distribution of Cash Dividends | Up to US$1.50 per 100 ADSs (or fraction thereof) held | |
Corporate actions depositary fees
Depositary service | Fee payable by the ADR holders | |
| Cash Distributions other than Cash Dividends (i.e. sale of rights, other entitlements, return of capital) | Up to US$2.00 per 100 ADSs (or fraction thereof) held | |
| Distribution of ADSs pursuant to exercise of rights to purchase additional ADSs. Excludes stock dividends and stock splits | Up to US$5.00 per 100 ADSs (or fraction thereof) held | |
| Distribution of securities other than ADSs or rights to purchase additional ADSs (i.e., spin-off shares) | Up to US$5.00 per 100 ADSs (or fraction thereof) held | |
| Distribution of ADSs pursuant to an ADR ratio change in which shares are distributed | No fee | |
238
Table of Contents
Fees payable by the Depositary to the Issuer
Citibank has provided a BHP net reimbursement of US$2,512,358.75 in FY2024 for ADR program-related expenses for BHP’s ADR program. ADR program-related expenses include legal and accounting fees, listing fees, expenses related to investor relations in the United States, fees payable to service providers for the distribution of material to ADR holders, expenses of Citibank as administrator of the ADS Direct Plan and expenses to remain in compliance with applicable laws.
Citibank has further agreed to waive other ADR program-related expenses for FY2024, amounting to US$5,812.12, which are associated with the administration of the ADR program.
The ADSs issued under our ADR program trade on the NYSE under the stock ticker BHP. As of 16 July 2024, there were 144,795,368 ADSs on issue and outstanding in the BHP Group Limited ADR program.
Charges
Holders are also required to pay the following charges in connection with depositing of ordinary shares and surrendering ADSs for cancellation and for the purpose of withdrawing deposited securities: taxes and other governmental charges, registration fees, transmission and delivery expenses, expenses and charges incurred by the depositary in the conversion of foreign currency, fees and expenses of the depositary in connection with compliance with exchange control regulations and other regulatory requirements and fees and expenses incurred by the depositary or other nominee in connection with servicing or delivery of deposit securities.
9.8 Supplemental cybersecurity disclosures for US reporting
Our approach to managing material risks from cyber threats is integrated into our overall risk management processes. Cybersecurity risks are addressed by BHP’s Risk Framework, a system of control for identifying and managing risks, implemented by the CEO.
For information on our Risk Framework refer to OFR 8
We employ a number of measures designed to protect against, detect and respond to cyber threats, events or attacks, including BHP’s mandatory minimum performance requirements for technology and cybersecurity, cybersecurity performance requirements for suppliers and cybersecurity resilience programs. In addition, cybersecurity standards, cybersecurity risk and control guidance, security awareness programs and training to build capability, security assessments and continuous monitoring, restricted physical access to hardware and crisis management plans are also in place to manage cybersecurity.
We utilise dedicated internal and external cybersecurity personnel to focus on assessing, detecting, identifying, managing, preventing and responding to cyber threats, events and attacks. We have a dedicated cybersecurity team, which has been in place since 2016 and has 24/7 monitoring and response capability that leverages core in-house capability and external service providers. Our assets, functions and projects are responsible for managing localised or project-specific exposure to technology and cyber risks, including risks associated with business-critical technology systems, with guidance provided by our cybersecurity team. Enterprise-level risks that are specific to technology, such as those that pose a greater threat to our wider business and strategic opportunities, are managed by our global Technology team and other relevant stakeholders.
We regularly evaluate and assess the threat landscape and our security controls, including through audits and assessments, regular network and endpoint monitoring, vulnerability testing, penetration testing and tabletop exercises that include members of BHP’s management team. To assess the design and effectiveness of our cybersecurity controls, we engage with assessors, consultants, auditors or other third parties, including through independent third-party reviews of our information technology security program conducted on a periodic basis. We have processes in place to consider and remediate any findings from these reviews and assessments as required. We also have processes to oversee and identify material cybersecurity risks associated with our use of third-party service providers, including performing diligence on certain third parties that have access to our systems, data or facilities that store such systems or data and we continually monitor cybersecurity risks identified through such diligence. We also utilise contractual clauses to manage cybersecurity risks, including by requiring certain agreements to be subject to periodic cybersecurity audits.
We have experienced targeted and non-targeted cybersecurity threats in the past; however, no prior cybersecurity incident has materially affected our business strategy, results of operations or financial condition.
For information on our risk factors refer to OFR 8.1
Governance
The Board, supported by the Risk and Audit Committee (RAC), is responsible for oversight of emerging and principal risks facing the Group. The Board and the RAC receive updates on the Group’s cybersecurity position, and the Group has policies in place through the Group’s disclosure process that are designed to escalate material incidents.
239
Table of Contents
For information on other Board Committee activities that support risk governance at BHP refer to the above ‘Risk governance’ disclosures and the Corporate Governance Statement 5
The CEO is responsible for the effectiveness of BHP’s Risk Framework with oversight from the Board. Primary responsibility for Technology and Systems Group Risk (which includes the cybersecurity risks), rests with the Chief Technical Officer under authority delegated by the CEO.
The Chief Technical Officer is accountable for and establishes the risk appetite for Technology and Systems, while the Vice President (VP) Technology Secure & Architecture is responsible for overseeing the performance of cybersecurity risks in the Technology and Systems Group Risk category within that risk appetite, and provides reports concerning these matters to the Chief Technical Officer.
Our VP Technology Secure & Architecture oversees the prevention, detection, mitigation and remediation of cybersecurity incidents through their management of, and participation in, our cybersecurity risk management and cybersecurity strategy processes described above.
Our VP Technology Secure & Architecture leads the BHP cybersecurity team involved in monitoring and managing our cyber security threat risk and assurance process. That team includes personnel with significant information technology experience. During FY2024, two individuals held the role of VP Technology Secure & Architecture, each of whom has more than 25 years of experience in the information technology and information security field, including serving as chief information security officer (CISO) and deputy CISO at other large companies. Our current VP Technology Secure & Architecture holds a number of qualified technical expert certifications, including Certified Information Systems Security Professional (CISSP) since 2001 and various cybersecurity-related technical certifications, in addition to Master in Information Technology (specialising in Information Security) and Master in Business Administration degrees, and is active in various cybersecurity industry collaboration groups internationally.
9.9 Government regulations
Our business is subject to a broad range of laws and regulations imposed by governments and regulatory bodies. These laws and regulations touch all aspects of our business, including how we extract, process and explore for minerals and how we conduct our operations, including laws and regulations governing matters such as environmental protection, land rehabilitation, occupational health and safety, human rights, cultural heritage, the rights and interests of Indigenous peoples, competition, foreign investment, export, marketing of minerals, and taxes.
The ability to extract and process minerals is fundamental to BHP. In most jurisdictions, the rights to extract mineral deposits are owned by the government. We obtain the right to access the land and extract the product by entering into licences or leases with the government that owns the mineral deposit. We also rely on governments to grant the rights necessary to transport and treat the extracted material to prepare it for sale. The terms of the lease or licence, including the time period of the lease or licence, vary depending on the laws and regulations of the relevant jurisdiction or terms negotiated with the relevant government.
Generally, we own the product we extract and we are required to pay royalties or other taxes to the government. In Australia and Chile, recent reforms to mining royalties laws have been adopted. For example, from 1 July 2022, a progressive system of coal royalties in the State of Queensland was adopted, resulting in higher royalty rates as the price of coal passes certain monetary thresholds. In May 2024, the Queensland Government introduced new legislation to Parliament which, if passed, would prevent future governments from reversing these higher royalty rates without parliamentary approval. Similarly, in September 2023, the State of New South Wales introduced a new coal royalty scheme, replacing the emergency domestic coal cap and reservation measures. This increase took effect on 1 July 2024, increasing the royalty rate payable for different methods of extraction by 2.6 percentage points. In May 2023, the Chilean Congress approved a mining royalty bill to establish a new regulatory tax framework for copper mining activities, which, in general terms, established that mining operators are subject to an ad-valorem component plus a margin component, with a maximum tax rate of 46.5 per cent. The new Chilean mining royalties took effect from 1 January 2024, subject to existing tax stability agreements. In most instances, the rights to explore for minerals are granted to us by the government that owns the natural resources we wish to explore. Usually, the right to explore carries with it the obligation to spend a defined amount of money on the exploration, or to undertake particular exploration activities.
Environmental protection, mine closure, land rehabilitation, cultural heritage and occupational health and safety are principally regulated by governments and to a lesser degree, if applicable, by conditions under leases or licences. These obligations often require us to make substantial expenditures to minimise or remediate the environmental impact of our assets and to ensure the safety of our employees, contractors and the communities where we operate.
In many of the jurisdictions where we or our suppliers or customers operate, legislation and regulations are increasingly being enacted in response to the potential impacts of climate change and to implement international environmental commitments. For example, as a result of the Paris Agreement a number of governments, including Australia, Chile, Canada and the United States, have submitted Nationally Determined Contributions to reduce national greenhouse gas emissions (GHG). Further, the governments in a number of regions where we or our suppliers or customers operate have advanced targets and goals to reduce GHGs. In Australia, the National Greenhouse and Energy Reporting Act 2007 (Cth) imposes requirements for corporations meeting a certain threshold to register and report company information about GHGs and energy production and consumption as part of a single, national reporting scheme and establishes the Safeguard Mechanism to keep certain GHG emissions at or below legislated limits, known as baselines, for Australia’s largest industrial facilities. On 1 July 2023, amendments to the Safeguard Mechanism commenced operation, which require facility baselines for Scope 1 GHG emissions at Australia’s largest industrial facilities to be decreased in accordance with a set decline rate, with a view to achieving consistent and gradual emission reductions on a trajectory consistent with achieving Australia’s GHG emission reduction targets of 43 per cent below 2005 levels by 2030 and net zero by 2050. Facilities that exceed their progressively declining legislated baselines may apply credits to meet the compliance obligations.
240
Table of Contents
Regulations setting emissions standards for fuels used to power vehicles and equipment at our assets and the modes of transport used in our supply chains can also have a substantial impact, both directly and indirectly, on the markets for these products, with flow-on impacts on our costs.
A number of governments and regulators in relevant jurisdictions for BHP have proposed or foreshadowed disclosure rules that would require enhanced climate-related and broader sustainability-related disclosures. For example, in Australia, the Federal Government has proposed legislation that would implement a new mandatory climate-related financial disclosure regime and associated auditing and assurance requirements, intended to be phased in from 1 January 2025. There is also growing focus on mandatory corporate due diligence and reporting for climate- and broader sustainability-related issues in the value chain. For example, the new European Union (EU) Corporate Sustainability Due Diligence Directive requires in-scope companies to conduct human rights and environmental due diligence on the company’s own operations and their business partners’ chain of activities (largely upstream). While it is not yet possible to reasonably estimate the exact nature, extent, timing and cost or other impacts of any future climate-related or broader sustainability-related regulatory programs or future legislative action that may be enacted, we anticipate we will be required to dedicate more resources to address legislative or regulatory changes.
In Australia, national environmental law is currently undergoing review with the potential for significant reform, including an emphasis on addressing environmental decline and achieving nature-positive outcomes, although timing, scope and outcome remain uncertain. Aspects of heritage protection laws in Australia have also been reviewed. For example, in November 2023, the Western Australian parliament repealed the Aboriginal Cultural Heritage Act 2021 (WA) and reverted to the previous Aboriginal Cultural Heritage Act 1972 (WA) (with limited amendments).
Our business is also subject to a number of regulations and legal developments relating to employee relations.
From time to time, certain trade sanctions are adopted by the United Nations (UN) Security Council and/or various governments, including in the United Kingdom, the United States, the European Union (EU), China and Australia against certain countries, entities or individuals, that may restrict our ability to sell extracted minerals or other products to and/or our ability to purchase goods or services from, these countries, entities or individuals.
Shareholding limits
Under current Australian legislation, the payment of any dividends, interest or other payments by BHP Group Limited to non-resident holders of BHP Group Limited’s shares is not restricted by exchange controls or other limitations, except that in certain circumstances, BHP Group Limited may be required to withhold Australian taxes.
From time to time, certain sanctions are adopted by the UN Security Council and/or various governments, including in the United Kingdom, the United States, the EU and Australia. Those sanctions prohibit, or in some cases impose, certain approval and reporting requirements on transactions involving sanctioned countries, entities and individuals and/or assets controlled or owned by them. Certain transfers into or out of Australia of amounts greater than A$10,000 in any currency may also be subject to reporting requirements.
The Australian Foreign Acquisitions and Takeovers Act 1975 (the FATA) restricts certain acquisitions of interests in securities in Australian companies, including BHP Group Limited. Generally, under the FATA, the prior approval of the Australian Treasurer must be obtained for proposals by a foreign person (either alone or together with its associates) to acquire 20 per cent or more of the voting power or issued securities in an Australian company. Lower approval thresholds apply in certain circumstances, including for acquisitions of interests in entities that operate a ‘national security business’, and acquisitions of interests by foreign government investors of voting power or issued securities in an Australian company.
The FATA also empowers the Treasurer to make certain orders prohibiting acquisitions by foreign persons in Australian companies, including BHP Group Limited (and requiring divestiture if the acquisition has occurred) where the Treasurer considers the acquisition to be contrary to national security or the national interest.
Except for the restrictions under the FATA, there are no limitations, either under Australian law or under the Constitution of BHP Group Limited, on the right of non-residents to hold or vote BHP Group Limited ordinary shares.
241
Table of Contents
Post-unification requirements under FATA
The Treasurer gave approval under the FATA for the actions taken as part of implementation of the unification of BHP’s DLC structure on the conditions set out below:
| • | BHP Group Limited remains an Australian resident company, incorporated under the Corporations Act, that is listed on the ASX under the name ‘BHP Group Limited’ and trades under that name. |
| • | BHP Group Limited remains the ultimate holding company of and continues to ultimately manage and control the companies conducting the businesses that are presently conducted by the subsidiaries of BHP Group Limited, including the Minerals and Services businesses, for so long as those businesses form part of the BHP Group. |
| • | The headquarters of BHP Group Limited (including the BHP Group’s corporate head offices) are in Australia. |
| • | The Chief Executive Officer of BHP Group Limited has their principal office in Australia. |
| • | The centre of administrative and practical management of BHP Group Limited is in Australia and BHP Group Limited’s corporate head office activities, of the kind presently carried on in Australia, continue to be managed in Australia. |
| • | The headquarters of BHP Group Limited is publicly acknowledged as being in Australia in significant public announcements and in all public documents. |
| • | The Chief Executive Officer of BHP Group Limited has their principal place of residence in Australia. |
| • | The majority of all regularly scheduled Board meetings of BHP Group Limited in any calendar year occurs in Australia. |
242
Table of Contents
9.10 Taxation
The taxation discussion below describes the material Australian and US federal income tax consequences to a US holder owning BHP Group Limited ordinary shares or ADSs.
The following discussion is not relevant to non-US holders of BHP Group Limited ordinary shares or ADSs. By its nature, the commentary below is of a general nature and we recommend that holders of ordinary shares or ADSs consult their own tax advisers regarding the Australian and US federal, state and local tax and other tax consequences of owning and disposing of ordinary shares and ADSs in their particular circumstances.
For purposes of this commentary, a US holder is a beneficial owner of ordinary shares or ADSs who is, for US federal income tax purposes:
| • | a citizen or resident alien of the US; |
| • | a corporation (or other entity treated as a corporation for US federal income tax purposes) that is created or organised under the laws of the US or any political subdivision thereof; |
| • | an estate, the income of which is subject to US federal income taxation regardless of its source; or |
| • | a trust: |
| (a) | if a court within the US is able to exercise primary supervision over its administration and one or more US persons have the authority to control all of its substantial decisions; or |
| (b) | that has made a valid election to be treated as a US person for tax purposes. |
This discussion of material tax consequences for US holders is based on the Australian and US laws currently in effect, the published practice of tax authorities in those jurisdictions and the double taxation treaties and conventions currently in existence. These laws are subject to change, possibly on a retroactive basis.
(a) Australian taxation
Dividends
Dividends (including other distributions treated as dividends for Australian tax purposes) paid by BHP Group Limited to a US holder that is not an Australian resident for Australian tax purposes will generally not be subject to Australian withholding tax if they are fully franked (broadly, where a dividend is franked, tax paid by BHP Group Limited is imputed to the shareholders).
Dividends paid to such US holders, which are not fully franked, will generally be subject to Australian withholding tax not exceeding 15 per cent only to the extent (if any) that the dividend is neither:
| • | franked; nor |
| • | declared by BHP Group Limited to be conduit foreign income. Broadly, this means that the relevant part of the dividend is declared to have been paid out of foreign source amounts received by BHP Group Limited that are not subject to tax in Australia, such as dividends remitted to Australia by foreign subsidiaries. |
The Australian withholding tax outcome described above applies to US holders who are eligible for benefits under the Tax Convention between Australia and the US as to the Avoidance of Double Taxation (the Australian Tax Treaty) that are not companies that directly hold at least 10 per cent of the voting power of BHP Group Limited. If a US holder is not eligible for benefits under the Australian Tax Treaty, the rate of Australian withholding tax may be 30 per cent. If a US holder is eligible for benefits under the Australian Tax Treaty and is a company that directly holds at least 10 per cent of the voting power of BHP Group Limited, the rate is 5 per cent.
In contrast, dividends (including other distributions treated as dividends for Australian tax purposes) paid by BHP Group Limited to a US holder may instead be taxed by assessment in Australia if the US holder:
| • | is considered to be also an Australian resident for Australian tax purposes. In this case, any franking credits attached to the distribution will be creditable against their Australian income tax liability, and if the US holder is eligible for benefits under the Australian Tax Treaty as a treaty resident of the US, any remaining Australian tax will generally be capped at 15 per cent of the gross dividend; or |
| • | carries on business in Australia through a permanent establishment as defined in the Australian Tax Treaty, or performs personal services from a fixed base in Australia, and the shareholding in respect of which the dividend is paid is effectively connected with that permanent establishment or fixed base. However, in such a case any franking credits may be creditable against the Australian income tax liability. |
The treatment of dividends outlined above may be modified where the shareholding in BHP Group Limited is held through a trust, limited partnership, limited liability company, pension fund, sovereign wealth fund or other investment vehicle. Affected US holders should seek their own advice in relation to such arrangements.
Sale of ordinary shares and ADSs
Gains made by US holders on the sale of ordinary shares or ADSs will generally not be taxed in Australia.
However, the precise Australian tax treatment of gains made by US holders on the sale of ordinary shares or ADSs generally depends on whether or not the gain is an Australian sourced gain of an income nature for Australian income tax purposes.
243
Table of Contents
Where the gain is of an income nature, a US holder will generally only be liable to Australian income tax on an assessment basis (whether or not they are also an Australian resident for Australian tax purposes) if:
| • | they are not eligible for benefits under the Australian Tax Treaty and the gain is sourced in Australia for Australian tax purposes; or |
| • | they are eligible for benefits under the Australian Tax Treaty but the gain constitutes any of the following (in which case the gain will be deemed to have an Australian source): |
| – | business profits of an enterprise attributable to a permanent establishment situated in Australia through which the enterprise carries on business in Australia; or |
| – | income or gains from the alienation of property that form part of the business property of a permanent establishment of an enterprise that the US holder has in Australia, or pertain to a fixed base available to the US holder in Australia for the purpose of performing independent personal services; or |
| – | income derived from the disposition of shares in a company, the assets of which consist wholly or principally of real property (which includes rights to exploit or to explore for natural resources) situated in Australia, whether such assets are held directly or indirectly through one or more interposed entities. |
Where the gain is not taxed as Australian sourced income, the US holder will generally only be liable to Australian capital gains tax on an assessment basis if they acquired (or are deemed to have acquired) their shares or ADSs after 19 September 1985 and one or more of the following applies:
| • | the US holder is an Australian resident for Australian tax purposes; or |
| • | the ordinary shares or ADSs have been used by the US holder in carrying on a business through a permanent establishment in Australia; or |
| • | the ordinary shares or ADSs constitute an ‘indirect Australian real property interest’ for Australian capital gains tax (CGT) purposes. This will generally be the case if the US holder (either alone or together with associates) directly or indirectly owns or owned 10 per cent or more of the issued share capital of BHP Group Limited at the time of the disposal or throughout a 12-month period during the two years prior to the time of disposal and, at the time of the disposal, the sum of the market values of BHP Group Limited’s assets that are taxable Australian real property (held directly or through interposed entities) exceeds the sum of the market values of BHP Group Limited’s assets (held directly or through interposed entities) that are not taxable Australian real property (which, for these purposes includes mining, quarrying or prospecting rights in respect of minerals, petroleum or quarry materials situated in Australia); or |
| • | the US holder is an individual who is not eligible for benefits under the Australian Tax Treaty as a treaty resident of the US and elected on becoming a non-resident of Australia to continue to have the ordinary shares or ADSs subject to Australian capital gains tax. |
In certain circumstances, if the ordinary shares or ADSs constitute an ‘indirect Australian real property interest’ for Australian CGT purposes, the purchaser may be required to withhold under the non-resident CGT withholding regime an amount equal to 12.5 per cent of the purchase price in situations including where the acquisition is undertaken by way of an off-market transfer. Affected US holders should seek their own advice in relation to how this withholding regime may apply to them.
The comments above on the sale of ordinary shares and ADSs do not apply:
| • | to temporary residents of Australia who should seek advice that is specific to their circumstances; or |
| • | if the Investment Management Regime (IMR) applies to the US holder, which exempts from Australian income tax and CGT gains made on disposals by certain categories of non-resident funds (called IMR entities) of portfolio interests in Australian public companies (subject to a number of conditions). The IMR exemptions broadly apply to widely held IMR entities in relation to their direct investments and indirect investments made through an independent Australian fund manager. The exemptions apply to gains made by IMR entities that are treated as companies for Australian tax purposes as well as gains made by non-resident investors in IMR entities that are treated as trusts and partnerships for Australian tax purposes. |
Stamp duty, gift, estate and inheritance tax
Australia does not impose any stamp duty, gift, estate or inheritance taxes in relation to transfers or gifts of shares or ADSs or upon the death of a shareholder.
(b) US taxation
This section describes the material US federal income tax consequences to a US holder of owning ordinary shares or ADSs. It applies only to ordinary shares or ADSs that are held as capital assets for tax purposes. This discussion addresses only US federal income taxation and does not discuss all of the tax consequences that may be relevant to US holders in light of their individual circumstances, including foreign, state or local tax consequences, estate and gift tax consequences, and tax consequences arising under the Medicare contribution tax on net investment income. This section does not apply to a holder of ordinary shares or ADSs that is a member of a special class of holders subject to special rules, including a dealer in securities, a trader in securities that elects to use a mark-to-market method of accounting for its securities holdings, a tax-exempt organisation, a life insurance company, a person liable for alternative minimum tax, a person who actually or constructively owns 10 per cent or more of the combined voting power of the voting stock or of the total value of the stock of BHP Group Limited, a person that holds ordinary shares or ADSs as part of a straddle or a hedging or conversion transaction, a person that purchases or sells ordinary shares or ADSs as part of a wash sale for tax purposes, or a person whose functional currency is not the US dollar.
244
Table of Contents
If an entity or arrangement that is treated as a partnership for US federal income tax purposes holds the ordinary shares or ADSs, the US federal income tax treatment of a partner generally will depend on the status of the partner and the tax treatment of the partnership. A partner in a partnership holding the ordinary shares or ADSs should consult its tax adviser with regard to the US federal income tax treatment of an investment in the ordinary shares or ADSs.
This section is based on the Internal Revenue Code of 1986, as amended, its legislative history, existing and proposed regulations, published rulings and court decisions, and the Australian Tax Treaty, all as currently in effect. These authorities are subject to change, possibly on a retroactive basis.
This section is in part based on the representations of the Depositary and the assumption that each obligation in the deposit agreement and any related agreement will be performed in accordance with its terms.
In general, for US federal income tax purposes, a holder of ADSs will be treated as the owner of the ordinary shares represented by those ADSs. Exchanges of ordinary shares for ADSs, and ADSs for ordinary shares, generally will not be subject to US federal income tax.
Dividends
Under US federal income tax laws and subject to the Passive Foreign Investment Company (PFIC) rules discussed below, a US holder must include in its gross income the amount of any dividend paid by BHP Group Limited out of its current or accumulated earnings and profits (as determined for US federal income tax purposes) plus any Australian tax withheld from the dividend payment even though the holder does not receive it. The dividend is taxable to the holder when the holder, in the case of ordinary shares, or the Depositary, in the case of ADSs, actually or constructively receives the dividend.
Dividends paid to a non-corporate US holder on shares or ADSs will be taxable at the preferential rates applicable to long-term capital gains provided the US holder holds the shares or ADSs for more than 60 days during the 121-day period beginning 60 days before the ex-dividend date and does not enter into certain risk reduction transactions with respect to the shares or ADSs during the abovementioned holding period. However, a non-corporate US holder that elects to treat the dividend income as ‘investment income’ pursuant to Section 163(d)(4) of the US Internal Revenue Code will not be eligible for such preferential rates. In the case of a corporate US holder, dividends on shares and ADSs are taxed as ordinary income and will not be eligible for the dividends received deduction generally allowed to US corporations in respect of dividends received from other US corporations.
Distributions in excess of current and accumulated earnings and profits, as determined for US federal income tax purposes, will be treated as a non-taxable return of capital to the extent of the holder’s tax basis, determined in US dollars, in the ordinary shares or ADSs and thereafter as a capital gain. However, BHP Group Limited does not expect to calculate earnings and profits in accordance with US federal income tax principles. Accordingly, holders should expect to generally treat distributions made by BHP Group Limited as dividends.
The amount of any cash distribution paid in any foreign currency will be equal to the US dollar value of such currency, calculated by reference to the spot rate in effect on the date such distribution is received by the US holder or, in the case of ADSs, by the Depositary, regardless of whether and when the foreign currency is in fact converted into US dollars. If the foreign currency is converted into US dollars on the date received, the US holder generally should not recognise foreign currency gain or loss on such conversion. If the foreign currency is not converted into US dollars on the date received, the US holder will have a basis in the foreign currency equal to its US dollar value on the date of the distribution, and generally will recognise foreign currency gain or loss on a subsequent conversion or other disposal of such currency. Such foreign currency gain or loss generally will be treated as ordinary income or loss ineligible for the preferential tax rate applicable to dividend income and generally will be income or loss from US sources for foreign tax credit limitation purposes.
Subject to certain limitations, Australian tax withheld in accordance with the Australian Tax Treaty and paid over to Australia will be creditable against an individual’s US federal income tax liability. Special rules apply in determining the foreign tax credit limitation with respect to dividends that are taxed at the preferential rates applicable to long-term capital gains. To the extent a reduction or refund of the tax withheld is available to a US holder under Australian law or under the Australian Tax Treaty, the amount of tax withheld that could have been reduced or that is refundable will not be eligible for credit against the holder’s US federal income tax liability. A US holder that does not elect to claim a US foreign tax credit may instead claim a deduction for Australian income tax withheld, but only for a taxable year in which the US holder elects to do so with respect to all foreign income taxes paid or accrued in such taxable year.
Dividends will be income from sources outside the US, and generally will be ‘passive category’ income for the purpose of computing the foreign tax credit allowable to a US holder. In general, a taxpayer’s ability to use foreign tax credits may be limited and is dependent on the particular circumstances. US holders should consult their tax advisers with respect to these matters.
Sale of ordinary shares and ADSs
Subject to the PFIC rules discussed below, a US holder who sells or otherwise disposes of ordinary shares or ADSs will recognise a capital gain or loss for US federal income tax purposes equal to the difference between the US dollar value of the amount realised and the holder’s tax basis, determined in US dollars, in those ordinary shares or ADSs. The gain or loss will generally be income or loss from sources within the US for foreign tax credit limitation purposes. The capital gain of a non-corporate US holder is generally taxed at preferential rates where the holder has a holding period greater than 12 months in the shares or ADSs sold. There are limitations on the deductibility of capital losses.
The US dollar value of any foreign currency received upon a sale or other disposition of ordinary shares or ADSs will be calculated by reference to the spot rate in effect on the date of sale or other disposal (or, in the case of a cash basis or electing accrual basis taxpayer, on the settlement date). A US holder will have a tax basis in the foreign currency received equal to that US dollar amount, and generally will recognise foreign currency gain or loss on a subsequent conversion or other disposal of the foreign currency. This foreign currency gain or loss generally will be treated as US source ordinary income or loss for foreign tax credit limitation purposes.
245
Table of Contents
Passive Foreign Investment Company rules
We do not believe that the BHP Group Limited ordinary shares or ADSs will be treated as stock of a PFIC for US federal income tax purposes, but this conclusion is a factual determination that was made at the end of FY2024 and thus may be subject to change. If BHP Group Limited were treated as a PFIC, any gain realised on the sale or other disposition of ordinary shares or ADSs would in general not be treated as a capital gain. Instead, a US holder would be treated as if it had realised such gain and certain ‘excess distributions’ ratably over its holding period for the ordinary shares or ADSs and would be taxed at the highest tax rate in effect for each such year to which the gain was allocated, together with an interest charge in respect of the tax attributable to each such year. In addition, dividends received with respect to ordinary shares or ADSs would not be eligible for the preferential tax rates applicable to dividend income if BHP Group Limited were a PFIC either in the taxable year of the distribution or the preceding taxable year, but instead would be taxable at rates applicable to ordinary income. Assuming the shares or ADSs are ‘marketable stock’, a US holder may mitigate the adverse tax consequences described above by electing to be taxed annually on a mark-to-market basis with respect to such shares or ADSs.
246
Table of Contents
10. Glossary
10.1 Mining-related terms
3D
Three dimensional.
APEGS
Association of Professional Engineers and Geoscientists of Saskatchewan.
ASPB
Alberta Society of Professional Biologists
AusIMM
The Australasian Institute of Mining and Metallurgy.
Beneficiation
The process of physically separating ore from waste material prior to subsequent processing of the improved ore.
Bituminous
Coal of intermediate rank with relatively high carbon content.
Block cave
An area resulting from an underground mining method where the orebody is undermined to make it collapse under its own weight.
Brownfield
The development or exploration located inside the area of influence of existing mine operations which can share infrastructure/management.
Coal reserves
Equivalent to mineral reserves, but specifically concerning coal.
Coal resources
Equivalent to mineral resources, but specifically concerning coal.
Coking coal
Used in the manufacture of coke, which is used in the steelmaking process by virtue of its carbonisation properties. Coking coal may also be referred to as metallurgical coal.
Copper cathode
Electrolytically refined copper that has been deposited on the cathode of an electrolytic bath of acidified copper sulphate solution. The refined copper may also be produced through leaching and electrowinning.
Cut-off grade
Cut-off grade is the grade (i.e., the concentration of metal or mineral in rock) that determines the destination of the material during mining. For purposes of establishing “prospects of economic extraction,” the cut-off grade is the grade that distinguishes material deemed to have no economic value (it will not be mined in underground mining or if mined in surface mining, its destination will be the waste dump) from material deemed to have economic value (its ultimate destination during mining will be a processing facility). Other terms used in similar fashion as cut-off grade include net smelter return, pay limit, and break-even stripping ratio.
Development stage
Development stage, as used in “Additional Information — Information on mining operations”, refers to a property that has mineral reserves disclosed, pursuant to S-K 1300, but no material extraction.
Economically viable
Economically viable, when used in the context of mineral reserve determination, means that the qualified person has determined, using a discounted cash flow analysis, or has otherwise analytically determined, that extraction of the mineral reserve is economically viable under reasonable investment and market assumptions.
Electrowinning/electrowon
An electrochemical process in which metal is recovered by dissolving a metal within an electrolyte and plating it onto an electrode.
Energy coal
Used as a fuel source in electrical power generation, cement manufacture and various industrial applications. Energy coal may also be referred to as steaming or thermal coal.
247
Table of Contents
Exploration stage
Exploration stage, as used in “Additional Information — Information on mining operations”, refers to a property that has no mineral reserves disclosed.
Feasibility study
Feasibility study is a comprehensive technical and economic study of the selected development option for a mineral project, which includes detailed assessments of all applicable modifying factors, together with any other relevant operational factors, and detailed financial analysis that are necessary to demonstrate, at the time of reporting, that extraction is economically viable. The results of the study may serve as the basis for a final decision by a proponent or financial institution to proceed with, or finance, the development of the project.
First principles
First principles refers to building up the costs for a piece of work considering all the parts and activities needed to put it together.
Flotation
A method of selectively recovering minerals from finely ground ore using a froth created in water by specific reagents. In the flotation process, certain mineral particles are induced to float by becoming attached to bubbles of froth and the unwanted mineral particles sink.
Full SaL
A processing technology which allows the extraction of copper using chlorine-assisted leaching predominantly for sulphidic material.
Grade or Quality
Any physical or chemical measurement of the characteristics of the material of interest in samples or product.
Greenfield
The development or exploration located outside the area of influence of existing mine operations/infrastructure.
Hypogene Sulphide
Hypogene mineralisation is formed by fluids at high temperature and pressure derived from magmatic activity. Copper in Hypogene Sulphide is mainly provident from the copper bearing mineral chalcopyrite and higher metal recoveries are achieved via grinding/flotation concentration processes.
Indicated mineral resources
Indicated mineral resource is that part of a mineral resource for which quantity, grade or quality are estimated on the basis of adequate geological evidence and sampling. The level of geological certainty associated with an indicated mineral resource is sufficient to allow a qualified person to apply modifying factors in in sufficient detail to support mine planning and evaluation of the economic viability of the deposit. Because an indicated mineral resource has a lower level of confidence than the level of confidence of a measured mineral resource, an indicated mineral resource may only be converted to a probable mineral reserve.
Inferred mineral resources
Inferred mineral resource is that part of a mineral resource for which quantity and grade or quality are estimated on the basis of limited geological evidence and sampling. The level of geological uncertainty associated with an inferred mineral resource is too high to apply relevant technical and economic factors likely to influence the prospects of economic extraction in a manner useful for evaluation of economic viability. Because an inferred mineral resource has the lowest level of geological confidence of all mineral resources, which prevents the application of the modifying factors in a manner useful for evaluation of economic viability, an inferred mineral resource may not be considered when assessing the economic viability of a mining project, and may not be converted to a mineral reserve.
In situ
Situated in the original place.
JORC
The Australasian Joint Ore Reserves Committee.
JORC Code
A set of minimum standards, recommendations and guidelines for public reporting in Australasia of Exploration Results, Mineral Resources and Ore Reserves. The guidelines are defined by JORC, which is sponsored by the Australian mining industry and its professional organisations.
Leaching
The process by which a soluble metal can be economically recovered from minerals in ore by dissolution.
Limited geological evidence
Limited geological evidence, when used in the context of mineral resource determination, means evidence that is only sufficient to establish that geological and grade or quality continuity are more likely than not.
LOI (loss on ignition)
A measure of the percentage of volatile matter (liquid or gas) contained within a mineral or rock. LOI is determined to calculate loss in mass when subjected to high temperatures.
248
Table of Contents
Marketable coal reserves
Tonnes of coal available, at specified moisture content and air-dried qualities, for sale after the beneficiation of coal reserves.
Material of economic interest
Material of economic interest, when used in the context of mineral resource determination, includes mineralisation, including dumps and tailings, mineral brines, and other resources extracted on or within the earth’s crust. It does not include oil and gas resources resulting from oil and gas producing activities, gases (e.g., helium and carbon dioxide), geothermal fields, and water.
Measured mineral resources
Measured mineral resource is that part of a mineral resource for which quantity, grade or quality are estimated on the basis of conclusive geological evidence and sampling. The level of geological certainty associated with a measured mineral resource is sufficient to allow a qualified person to apply modifying factors in sufficient detail to support detailed mine planning and final evaluation of the economic viability of the deposit. Because a measured mineral resource has a higher level of confidence than the level of confidence of either an indicated mineral resource or an inferred mineral resource, a measured mineral resource may be converted to a proven mineral reserve or to a probable mineral reserve.
Metallurgical coal
A broader term than coking coal, which includes all coals used in steelmaking, such as coal used for the pulverised coal injection process.
Mineral resources
A mineral resource is a concentration or occurrence of material of economic interest in or on the Earth’s crust in such form, grade or quality, and quantity that there are reasonable prospects for economic extraction. A mineral resource is a reasonable estimate of mineralisation, taking into account relevant factors such as cut-off grade, likely mining dimensions, locations or continuity, that, with the assumed and justifiable technical and economic conditions, is likely to, in whole or in part, become economically extractable. It is not merely an inventory of all mineralisation drilled or sampled.
Mineralisation
Any single mineral or combination of minerals occurring in a mass, or deposit, of economic interest.
Mineral reserve
Mineral reserve is an estimate of tonnage and grade or quality of indicated and measured mineral resources that, in the opinion of the qualified person, can be the basis of an economically viable project. More specifically, it is the economically mineable part of a measured or indicated mineral resource, which includes diluting materials and allowances for losses that may occur when the material is mined or extracted.
Mixed (ore type)
Mixed ore type is a term used to describe the zone of mineralisation that is a gradation between Supergene Sulphide and Hypogene Sulphide resulting from the incomplete development of the former as it overprints the latter. This results in a more irregular distribution of the three main copper bearing minerals and is amenable to both grinding/flotation concentration and leaching processes.
Modifying Factors
Modifying factors are the factors that a qualified person must apply to indicated and measured mineral resources and then evaluate in order to establish the economic viability of mineral reserves. A qualified person must apply and evaluate modifying factors to convert measured and indicated mineral resources to proven and probable mineral reserves. These factors include, but are not restricted to: Mining; processing; metallurgical; infrastructure; economic; marketing; legal; environmental compliance; plans, negotiations, or agreements with local individuals or groups; and governmental factors. The number, type and specific characteristics of the modifying factors applied will necessarily be a function of and depend upon the mineral, mine, property, or project.
Open cut (OC)
Surface working in which the working area is kept open to the sky, equivalent term is open pit.
Probable mineral reserve
Probable mineral reserve is the economically mineable part of an indicated and, in some circumstances, a measured mineral resource.
Production stage
Production stage, as used in “Additional Information—Information on mining operations”, refers to a property with material extraction of mineral reserves.
Proven mineral reserve
Proven mineral reserve is the economically mineable part of a measured mineral resource and can only result from conversion of a measured mineral resource.
Qualified Person
Defined by US SEC as an individual who is both (1) a mineral industry professional with at least five years of relevant experience in the type of mineralisation and type of deposit under consideration and in the specific type of activity that person is undertaking on behalf of the registrant; and (2) an eligible member or licensee in good standing of a recognised professional organisation at the time the technical report is prepared.
249
Table of Contents
ROM (run of mine)
Run of mine product mined in the course of regular mining activities. Tonnes include allowances for diluting materials and for losses that occur when the material is mined.
Smelting
The process of extracting metal from its ore by heating and melting.
Solvent extraction
A method of separating one or more metals from a leach solution by treating with a solvent that will extract the required metal, leaving the others. The metal is recovered from the solvent by further treatment.
Sub-level cave
An area within an underground mine which uses the sub-level cave method. This is where an orebody is extracted from the upper horizons first and mining progresses downwards level by level.
Supergene Sulphide
Supergene is a term used to describe near-surface processes and their products, formed at low temperature and pressure by the activity of meteoric or surface water. Copper in Supergene Sulphide is mainly provident from the copper bearing minerals chalcocite and covellite and is amenable to both grinding/flotation concentration and leaching processes.
Tailings
Those portions of washed or milled ore that are too poor to be treated further or remain after the required metals and minerals have been extracted.
Total mineral resources
The sum of inferred, indicated and measured mineral resources.
Troy oz
Troy ounce is a unit of measure of precious metals.
TSF
Tailings storage facility/facilities.
Underground (UG)
Below the surface mining activities.
Wet tonnes
Production is usually quoted in terms of wet metric tonnes (wmt). To adjust from wmt to dry metric tonnes (dmt) a factor is applied based on moisture content.
Yield
The percentage of material of interest that is extracted during mining and/or processing.
250
Table of Contents
10.2 Terms used in reserves and resources
| Ag | silver | |
| Al2O3 | alumina | |
| Ash | inorganic material remaining after combustion | |
| Au | gold | |
| Cu | copper | |
| CV | calorific value | |
| Fe | iron | |
| Insol. | insolubles | |
| K2O | potassium oxide | |
| KCl | potassium chloride | |
| KCl.MgCl2.6H2O | carnallite | |
| LOI | loss on ignition | |
| LPL | Lower Patience Lake (stratigraphic unit) | |
| MgO | magnesium oxide | |
| Mo | molybdenum | |
| Ni | nickel | |
| P | phosphorous | |
| Pc | phosphorous in concentrate | |
| S | sulphur | |
| SiO2 | silica | |
| Th | thermal coal | |
| U3O8 | uranium oxide | |
| VM | volatile matter | |
| Zn | zinc | |
251
Table of Contents
10.3 Units of measure
| % | percentage or per cent | |
| CO2-e | carbon-dioxide equivalent | |
| dmt | dry metric tonne | |
| Gj | gigajoule | |
| g/t | grams per tonne | |
| ha | hectare | |
| kcal/kg | kilocalories per kilogram | |
| kg/tonne or kg/t | kilograms per tonne | |
| km | kilometre | |
| ktoz | thousand troy ounces | |
| kt | kilotonnes | |
| ktpa | kilotonnes per annum | |
| ktpd | kilotonnes per day | |
| kV | kilovolt | |
| kW | kilowatt | |
| kWh | kilowatt hour | |
| lb | pound | |
| m | metre | |
| m3 | cubic metre | |
| ML | megalitre | |
| Mt | million tonnes | |
| MtCO2-e | million tonnes of carbon dioxide equivalent | |
| Mtpa | million tonnes per annum | |
| MW | megawatt | |
| oz | troy ounce | |
| ppm | parts per million | |
| t | tonne | |
| tCO2-e | tonnes of carbon dioxide equivalent | |
| tpa | tonnes per annum | |
| tpd | tonnes per day | |
| TW | terawatt | |
| TWh | terawatt hour | |
| wmt | wet metric tonnes | |
252
Table of Contents
10.4 Other terms
2030 goals
Our aspirational goals for FY2030 under the pillars of our 2030 social value scorecard: Decarbonisation; Healthy environment; Indigenous partnerships; Safe, inclusive and future-ready workforce, Thriving, empowered communities and Responsible supply chains.
AASB (Australian Accounting Standards Board)
Accounting standards as issued by the Australian Accounting Standards Board.
Activity data (in relation to greenhouse gas (GHG) emissions data)
A quantitative measure of a level of activity that results in GHG emissions. Activity data is multiplied by an energy and/or emissions factor to derive the energy consumption and GHG emissions associated with a process or an operation. Examples of activity data include kilowatt-hours of electricity used, quantity of fuel used, output of a process, hours equipment is operated, distance travelled and floor area of a building.
Adjusted/unadjusted (in respect to GHG emissions data)
Adjusted means calculated to present the GHG emissions data for a time period (such as a baseline year or reporting year) as though relevant changes took effect from the start of that period even though they occurred during or not until after the end of the period. Unless expressly stated otherwise, relevant changes are all acquisitions, divestments and/or GHG emission calculation methodology changes. For example, when we adjust the FY2020 baseline year for our operational GHG emission target and goal to compare our adjusted FY2024 performance data against it:
| • | the FY2020 data is presented with Scopes 1 and 2 emissions for operated assets that have been acquired or divested by BHP added or removed (respectively), and applying methodology changes that took effect, between 1 July 2019 and 30 June 2024; and |
| • | the FY2024 data is presented as though any acquisitions, divestments and/or methodology changes that occurred during the year took effect from the start of the year |
This enables a ‘like for like’ comparison that provides the information most relevant to assessing progress against our GHG emissions targets and goals.
Unadjusted means calculated to present the GHG emissions data for a reporting year so that any relevant changes that occurred during the year (including acquisitions, divestments and/or methodology changes) are applied only from the date they took effect.
Adjustments (in respect of our GHG emissions targets and goals)
Calculations to present GHG emissions data on an adjusted basis.
ADR (American Depositary Receipt)
An instrument evidencing American Depositary Shares or ADSs, which trades on a stock exchange in the United States.
ADS (American Depositary Share)
A share issued under a deposit agreement that has been created to permit US-resident investors to hold shares in non-US companies and, if listed, trade them on the stock exchanges in the United States. ADSs are evidenced by American Depositary Receipts, or ADRs, which are the instruments that, if listed, trade on a stock exchange in the United States.
ASIC (Australian Securities and Investments Commission)
The Australian Government agency that enforces laws relating to companies, securities, financial services and credit in order to protect consumers, investors and creditors.
253
Table of Contents
Assets
Assets are a set of one or more geographically proximate operations (including open-cut mines and underground mines). Assets include our operated and non-operated assets.
ASX (Australian Securities Exchange)
ASX is a multi-asset class vertically integrated exchange group that functions as a market operator, clearing house and payments system facilitator. It oversees compliance with its listing and operating rules, promotes standards of corporate governance among Australia’s listed companies and helps educate retail investors.
Baseline/baseline year (in relation to GHG emissions targets and goals)
A year used as a basis to compare and measure performance of future years.
BHP
BHP Group Limited and its subsidiaries.
BHP Group Limited
BHP Group Limited.
BHP Group Limited share
A fully paid ordinary share in the capital of BHP Group Limited.
BHP Group Limited shareholders
The holders of BHP Group Limited shares.
BHP Group Plc
BHP Group Plc (now known as BHP Group (UK) Ltd) and its subsidiaries.
BHP Group Plc share
A fully paid ordinary share in the capital of BHP Group Plc (now known as BHP Group (UK) Ltd).
BHP Group Plc shareholders
The holders of BHP Group Plc shares (prior to unification of the DLC structure).
BHP Group (UK) Ltd
BHP Group (UK) Ltd (formerly known as BHP Group Plc) and its subsidiaries.
BHP Healthy environment goal roadmap
Our Group-level framework for nature-positive plans to achieve the 2030 Healthy environment goal under our social value scorecard, which is intended to apply to our operated assets in Australia, Chile and Canada.
BHP shareholders
In the context of BHP’s financial results, BHP shareholders refers to the holders of shares in BHP Group Limited.
Biofuel
A fuel, usually a liquid fuel, produced from renewable biological feedstock sources, such as plant material, vegetation or agricultural waste.
Biodiversity
The variability among living organisms from all sources, including, inter alia, terrestrial, marine and other aquatic ecosystems and the ecological complexes of which they are part; this includes diversity within species, between species and of ecosystems. (Convention on Biological Diversity (1992) Article 2).
BMA
The BHP Mitsubishi Alliance.
Board
The Board of Directors of BHP.
BOS
BHP Operating System.
CAF
BHP’s Capital Allocation Framework.
254
Table of Contents
Carbon credit
The reduction or removal of carbon dioxide, or the equivalent amount of a different GHG, using a process that measures, tracks and captures GHGs to compensate for an entity’s GHG emissions emitted elsewhere. Credits may be generated through projects in which GHG emissions are avoided, reduced, removed from the atmosphere or permanently stored (sequestration). Carbon credits are generally created and independently verified in accordance with either a voluntary program or under a regulatory program. The purchaser of a carbon credit can ‘retire’ or ‘surrender’ it to claim the underlying reduction towards their own GHG emissions reduction targets or goals or to meet legal obligations, which is also referred to as carbon offsetting or offsetting.
We define regulatory carbon credits to mean carbon credits used to offset GHG emissions for regulatory compliance in our operational locations (such as the Safeguard Mechanism in Australia).
We define voluntary carbon credits to mean carbon credits generated through projects that reduce or remove GHG emissions outside the scope of regulatory compliance (including Australian Carbon Credit Units not used for regulatory compliance).
Carbon dioxide equivalent
The universal unit of measurement to indicate the global warming potential (GWP) of each GHG, expressed in terms of the GWP of one unit of carbon dioxide. It is used to evaluate releasing (or avoiding releasing) different GHGs against a common basis.
Carbon neutral
Making or resulting in no net release of GHG emissions into the atmosphere, including as a result of offsetting. Carbon neutral includes all those GHG emissions as defined for BHP reporting purposes.
CBWT (context-based water targets)
Context-based water targets aim to address the water challenges shared by BHP and other stakeholders in the regions where we operate. These targets are based on what we heard from others and our own assessment of water-related risks and opportunities.
CMD
Coal mine dust.
CEO Water Mandate
The CEO Water Mandate is a UN Global Compact initiative that mobilises business leaders on water, sanitation, and the Sustainable Development Goals. Companies that endorse the CEO Water Mandate commit to continuous progress against six core elements of their water stewardship practice and in so doing, better understand and manage their own water risks. The six core areas are: Direct Operations, Supply Chain & Watershed Management, Collective Action, Public Policy, Community Engagement and Transparency. BHP is an active signatory of the Mandate.
Commercial
Our Commercial function seeks to maximise commercial and social value across our end-to-end supply chain. It provides effective and efficient service levels to our assets and customers through world-class insights and market intelligence, deep subject-matter expertise, simple processes and centralised standard activities. The function is organised around the core activities in our inbound and outbound value chains, supported by credit and market risk management, and strategy and planning activities.
Community concern
Broadly classified as any communication to a BHP representative by a member of the community where an issue has not yet necessarily occurred but has the potential/likelihood to escalate into a formal complaint.
Community complaint
A verbal or written notification made directly to a BHP representative by a member of the community relating to an alleged adverse impact on the community arising from BHP’s activities and/or employee or contractor behaviour in part or in whole.
Company
BHP Group Limited and its subsidiaries.
Continuing operations
Assets/operations/entities that are owned and/or operated by BHP, excluding assets/operations/ entities classified as Discontinued operations.
Convention of Biological Diversity
The Convention on Biological Diversity (CBD) is the international legal instrument for ‘the conservation of biological diversity, the sustainable use of its components and the fair and equitable sharing of the benefits arising out of the utilisation of genetic resources’ that has been ratified by 196 nations.
CTAP 2024
BHP’s second Climate Transition Action Plan, published on 27 August 2024.
Directions (Directions for Coal Mines)
The New South Wales Government Coal Market Price Emergency Directions.
Discontinued operations
Assets/operations/entities that have either been disposed of or are classified as held for sale in accordance with IFRS 5/AASB 5 Non-current Assets Held for Sale and Discontinued operations.
255
Table of Contents
Dividend record date
The date, determined by a company’s board of directors, by when an investor must be recorded as an owner of shares in order to qualify for a forthcoming dividend.
DLC (Dual Listed Company)
BHP’s Dual Listed Company structure had two parent companies (BHP Group Limited and BHP Group Plc (now known as BHP Group (UK) Ltd)) operating as a single economic entity as a result of the DLC merger. The DLC structure was unified on 31 January 2022.
DLC merger
The Dual Listed Company merger between BHP Group Limited and BHP Group Plc (now known as BHP Group (UK) Ltd) on 29 June 2001.
ECR (Economic Contribution Report)
BHP’s Economic Contribution Report for the year ended 30 June 2024.
Ecosystem
A dynamic complex of plant, animal and microorganism communities and the non-living environment, interacting as a functional unit. (Convention on Biological Diversity (1992) Article 2; Intergovernmental Science-Policy Platform on Biodiversity and Ecosystem Services (2019) Global Assessment Report on Biodiversity and Ecosystem Services).
Ecosystem function
The flow of energy and materials through the biotic and abiotic components of an ecosystem. This includes many processes such as biomass production, trophic transfer through plants and animals, nutrient cycling, water dynamics and heat transfer. (Intergovernmental Science-Policy Platform on Biodiversity and Ecosystem Services (2019) Global Assessment Report on Biodiversity and Ecosystem Services).
Ecosystem services
The contributions of ecosystems to the benefits that are used in economic and other human activity. (United Nations et al. (2021) System of Environmental-Economic Accounting—Ecosystem Accounting).
ELT (Executive Leadership Team)
The Executive Leadership Team directly reports to the Chief Executive Officer and is responsible for the day-to-day management of BHP and leading the delivery of our strategic objectives.
Emission factor
A factor that converts activity data into GHG emissions data (e.g. kg CO2-e emitted per GJ of fuel consumed, kg CO2-e emitted per KWh of electricity used).
Energy (in relation to BHP)
Energy means all forms of energy products where ‘energy products’ means combustible fuels, heat, renewable energy, electricity or any other form of energy from operations that are owned or controlled by BHP. The primary sources of energy consumption come from fuel consumed by haul trucks at our operated assets, as well as purchased electricity used at our operated assets.
Energy content factor
The energy content of a fuel is an inherent chemical property that is a function of the number and types of chemical bonds in the fuel.
Entrained water
Entrained water includes water incorporated into product and/or waste streams, such as tailings, that cannot be easily recovered.
Equity share approach (in relation to GHG emissions data)
A consolidation approach whereby a company accounts for GHG emissions from operations according to its share of equity in the operation. The equity share reflects economic interest, which is the extent of rights a company has to the risks and rewards flowing from an operation. Also see the definition for Operational control approach.
ESG
Environmental, social and governance.
Executive KMP (Key Management Personnel)
Executive Key Management Personnel includes the Executive Director (our CEO), the Chief Financial Officer, President Australia, President Americas, and the Chief Operating Officer. It does not include the Non-executive Directors (on our Board).
Fatality Elimination Program (FEL)
The Fatality Elimination Program involves all Assets developing control implementation plans. These plans identify the relevant controls required to address their respective operations fatality risks, including timeframes for when control implementation is possible. Progress against these plans is monitored monthly via the BHP FEL dashboard. The aim is to implement and sustain as many ‘hard’ controls as possible, whilst also recognising that to build a robust control framework it will rely on all elements of the hierarchy of control being available, including soft/administrative controls (i.e. human-dependent controls).
256
Table of Contents
Fugitive methane emissions
Methane emissions that are not physically controlled but result from the intentional or unintentional releases of methane from coal mining.
Functions
Functions operate along global reporting lines to provide support to all areas of the organisation. Functions have specific accountabilities and deep expertise in areas such as finance, legal, governance, technology, human resources, corporate affairs, health, safety and community.
Future-facing commodity
A commodity that BHP determines to be positively leveraged in the energy transition and broader global response to climate change, with potential for decades-long demand growth to support emerging megatrends like electrification and decarbonisation. Currently, the major commodities in the BHP portfolio that fall within this criterion include copper, nickel and potash.
GBF (Kunming-Montreal Global Biodiversity Framework)
The Kunming-Montreal Global Biodiversity Framework is a set of targets and goals adopted by the 15th Conference of Parties (COP15) to the United Nations Convention on Biological Diversity (CBD) in December 2022 that aims to address the loss of biodiversity and restore natural ecosystems by 2030.
Gearing ratio
The ratio of net debt to net debt plus net assets.
GHG (greenhouse gas)
For BHP reporting purposes, these are the aggregate anthropogenic carbon dioxide equivalent emissions of carbon dioxide (CO2), methane (CH4), nitrous oxide (N2O), hydrofluorocarbons (HFCs), perfluorocarbons (PFCs) and sulphur hexafluoride (SF6). Nitrogen trifluoride (NF3) GHG emissions are currently not relevant for BHP reporting purposes. GHG emissions in this report are presented in tonnes CO2-e or its multiples, unless otherwise stated.
GISTM
Global Industry Standards on Tailings Management.
Global goal for nature
The global goal for nature defines what is needed to halt and reverse today’s current state of loss of nature. It is supported by a number of organisations that ask governments to adopt the goal at the international level, which each country, the private sector, communities and others can contribute to achieving.
Goal (for BHP with respect to GHG emissions)
An ambition to seek an outcome for which there is no current pathway(s), but for which efforts are being or will be pursued towards addressing that challenge, subject to certain assumptions or conditions. Such efforts may include the resolution of existing potential or emerging pathways.
Goals of the Paris Agreement
The central objective of the Paris Agreement is its long-term temperature goal to hold the global average temperature increase to well below 2°C above pre-industrial levels and pursue efforts to limit the temperature increase to 1.5°C above pre-industrial levels.
Grievance
An event or community complaint relating to an adverse impact/event that has escalated to the point where a third-party intervention or adjudication is required to resolve.
GRI (Global Reporting Initiative)
The Global Reporting Initiative works with businesses and governments to understand and communicate their impact on critical sustainability issues.
Groundwater
Water beneath the earth’s surface, including beneath the seabed, which fills pores or cracks between porous media, such as soil, rock, coal, and sand, often forming aquifers. Groundwater may be abstracted for use from bore fields or accessed via dewatering to access ore. For accounting purposes, water that is entrained in the ore can be considered as groundwater.
Group
BHP Group Limited and its subsidiaries.
GWP (global warming potential)
A factor describing the radiative forcing impact (degree of harm to the atmosphere) of one unit of a given GHG relative to one unit of CO2. BHP currently uses GWP from the Intergovernmental Panel on Climate Change (IPCC) Assessment Report 5 (AR5) based on a 100-year timeframe.
HPI (high-potential injuries)
High-potential injuries are recordable injuries and first aid cases where there was the potential for a fatality.
ICMM (International Council on Mining and Metals)
The International Council on Mining and Metals is an international organisation dedicated to a safe, fair and sustainable mining and metals industry.
257
Table of Contents
IFRS (International Financial Reporting Standards)
Accounting standards as issued by the International Accounting Standards Board.
Indigenous Peoples Policy Statement
Articulates BHP’s approach to engaging with and supporting Indigenous peoples.
IPCC (Intergovernmental Panel on Climate Change)
The Intergovernmental Panel on Climate Change is the United Nations body for assessing the science related to climate change.
IUCN (International Union for Conservation of Nature)
The International Union for Conservation of Nature is an international organisation working in the field of nature conservation and sustainable use of natural resources.
KMP (Key Management Personnel)
Key Management Personnel includes the roles which have the authority and responsibility for planning, directing and controlling the activities of BHP. These are Non-executive Directors, the CEO, the Chief Financial Officer, the President Australia, the President Americas.
KPI (key performance indicator)
Used to measure the performance of the Group, individual businesses and executives in any one year.
Legacy assets
Legacy assets refer to those BHP operated assets, or part thereof, located in the Americas that are in the closure phase.
LME (London Metal Exchange)
A major futures exchange for the trading of industrial metals.
Location-based reporting (in relation to GHG emissions data)
Scope 2 emissions based on average energy generation emission factors for defined geographic locations, including local, subnational, or national boundaries (i.e. grid factors). In the case of a direct line transfer, the location-based emissions are equivalent to the market-based emissions.
Lower GHG emission(s) (for shipping)
Capable of between 5 per cent to 80 per cent lower GHG emissions intensity (gCO2 -e/joule) on a well-to-wake basis compared to conventional fossil fuels used in shipping.
Lower GHG emission(s) (other than shipping fuels)
Capable of lower absolute GHG emissions or GHG emissions intensity than the current state or the conventional or incumbent technology, as applicable.
Low to zero GHG emission(s) (for shipping)
Capable of between 81 per cent to 100 per cent lower GHG emissions intensity (gCO2 -e/joule) on a well-to-wake basis compared to conventional fossil fuels used in shipping.
Low to zero GHG emission(s) (for energy products other than shipping fuels)
Capable of between 90 per cent to 100 per cent lower GHG emissions intensity during generation and/or combustion (as applicable) compared to conventional fossil fuel generation and/or combustion.
Market-based method/reporting (in relation to GHG emissions data)
Scope 2 emissions based on the generators (and therefore the generation fuel mix from which the reporter contractually purchases electricity and/or is directly provided electricity via a direct line transfer).
MFL (Maximum Foreseeable Loss)
The MFL is the estimated impact to BHP if a risk were to materialise in a worst-case scenario without regard to probability and assuming all controls are ineffective.
Nature
The natural world, with an emphasis on the diversity of living organisms (including people) and their interactions among themselves and with their environment. (Adapted from Díaz, S et al. (2015) The IPBES Conceptual Framework – Connecting Nature and People).
Nature-positive
A high-level goal and concept describing a future state of nature (e.g. biodiversity, ecosystem services and natural capital) which is greater than the current state. This definition comes from the Taskforce on Nature-related Financial Disclosures (TNFD) Framework – Beta release v0.1.
Near zero emissions (for steelmaking or ironmaking)
0.40 tonnes of CO2 -e per tonne of crude steel for 100 per cent ore-based production (no scrap), as defined by the International Energy Agency (IEA) and implemented in ResponsibleSteel International Standard V2.0 (‘near zero’ performance level 4 threshold). IEA (2022), Achieving Net Zero Heavy Industry Sectors in G7 Members, IEA, Paris, License: CC BY 4.0, which also describes the boundary for the emission intensity calculation (including in relation to upstream emissions).
258
Table of Contents
Net zero (for a BHP GHG emissions target, goal or pathway, or similar)
Net zero includes the use of carbon credits as governed by BHP’s approach to carbon offsetting, available at bhp.com/climate.
Net zero (for industry sectors, the global economy, transition or future, or similar)
Net zero refers to a state in which the GHGs (as defined in this Glossary) going into the atmosphere are balanced by removal out of the atmosphere.
NGER (National Greenhouse and Energy Reporting Scheme)
The Australian National Greenhouse and Energy Reporting scheme is a single national framework for reporting and disseminating company information about GHG emissions, energy production, energy consumption and other information specified under the National Greenhouse and Energy Reporting Act 2007.
NOJV (non-operated asset/non-operated joint venture)
Non-operated assets/non-operated joint ventures are our interests in assets that are owned as a joint venture but not operated by BHP. References in this Annual Report to a ‘joint venture’ are used for convenience to collectively describe assets that are not wholly owned by BHP. Such references are not intended to characterise the legal relationship between the owners of the asset.
NSWEC
New South Wales Energy Coal.
Occupational illness
An illness that occurs as a consequence of work-related activities or exposure. It includes acute or chronic illnesses or diseases, which may be caused by inhalation, absorption, ingestion or direct contact.
OELs (occupational exposure limits)
An OEL is an upper limit on the acceptable concentration of a hazardous substance in workplace air for a particular material or class of materials. OELs may also be set for exposure to physical agents such as noise, vibration or radiation.
Offsetting (in relation to GHG emissions)
The use of carbon credits. Refer to the definition of carbon credit.
OFR
BHP’s Operating and Financial Review for the year ended 30 June 2024.
Onshore US
BHP’s Petroleum asset (divested in the year ended 30 June 2019) in four US shale areas (Eagle Ford, Permian, Haynesville and Fayetteville), where we produced oil, condensate, gas and natural gas liquids.
Operated assets
Operated assets are our assets (including those under exploration, projects in development or execution phases, sites and operations that are closed or in the closure phase) that are wholly owned and operated by BHP or that are owned as a BHP-operated joint venture. References in this Annual Report to a ‘joint venture’ are used for convenience to collectively describe assets that are not wholly owned by BHP. Such references are not intended to characterise the legal relationship between the owners of the asset.
Operational control approach (in relation to GHG emissions data)
A consolidation approach whereby a company accounts for 100 per cent of the GHG emissions over which it has operational control (a company is considered to have operational control over an operation if it or one of its subsidiaries has the full authority to introduce and implement its operating policies at the operation). It does not account for GHG emissions from operations in which it owns an interest but does not have operational control. Also see the definition for Equity share approach.
Operational GHG emissions
Our operational GHG emissions are the Scope 1 emissions and Scope 2 emissions from our operated assets.
Operations
Open-cut mines, underground mines and processing facilities, which in the case of BHP are within our operated assets.
Other (with respect to water consumption volumes)
This includes water volumes used for purposes such as potable water consumption and amenity facilities at our operated assets.
Paris Agreement
The Paris Agreement is an agreement between countries party to the United Nations Framework Convention on Climate Change to strengthen efforts to combat climate change and adapt to its effects, with enhanced support to assist developing countries to do so.
259
Table of Contents
Petroleum (asset group)
A group of oil and gas assets formerly operated by BHP before its merger with Woodside in June 2022. Petroleum’s core production operations were located in the US Gulf of Mexico, Australia and Trinidad and Tobago. Petroleum produced crude oil and condensate, gas and natural gas liquids.
PPA (power purchasing agreement)
An agreement between a vendor and purchaser for the sale of electricity, which may be wholly or partially renewable or other low to zero GHG emissions energy and either physically supplied directly to the purchaser or for supply from an electricity grid.
PPE (personal protective equipment)
PPE means anything used or worn to minimise risk to a worker’s health and safety, including air supplied respiratory equipment.
Physical climate-related risk
Acute risks that are event-driven, including increased severity and frequency of extreme weather events and chronic risks resulting from longer-term changes in climate patterns.
Reference year (for a BHP GHG emissions target or goal)
A year used to track progress towards GHG emissions targets and goals. It is not a baseline for GHG emissions targets and goals.
Residual mix
The mix of energy generation resources and associated attributes, such as GHG emissions in a defined geographic boundary left after contractual instruments have been claimed/retired/cancelled. The residual mix can provide an emission factor for companies without contractual instruments to use in a market-based method calculation. A residual mix is currently unavailable to account for voluntary purchases and this may result in double counting between electricity consumers.
Safeguard Mechanism
A mechanism established in Australia under the National Greenhouse and Energy Reporting Act 2007 to keep certain GHG emissions at or below legislated limits, known as baselines, for Australia’s largest industrial facilities. Reforms to the Safeguard Mechanism that applied from 1 July 2023 are intended to reduce Scope 1 emissions at Australia’s largest industrial facilities on a trajectory consistent with achieving Australia’s GHG emission reduction targets of 43 per cent below 2005 levels by 2030 and net zero by 2050. Facilities that exceed their progressively declining legislated baselines may apply Australian Carbon Credit Units to meet the compliance obligations.
SASB (Sustainability Accounting Standards Board)
The Sustainability Accounting Standards Board is a non-profit organisation that develops standards focused on the financial impacts of sustainability.
Scope 1 emissions (GHG emissions)
Scope 1 emissions are direct GHG emissions from operations that are owned or controlled by the reporting company. For BHP, these are primarily GHG emissions from fuel consumed by haul trucks at our operated assets, as well as fugitive methane emissions from coal production at our operated assets.
Scope 2 emissions (GHG emissions)
Scope 2 emissions are indirect GHG emissions from the generation of purchased or acquired electricity, steam, heat or cooling that is consumed by operations that are owned or controlled by the reporting company. BHP’s Scope 2 emissions have been calculated using the market-based method unless otherwise specified.
Scope 3 emissions (GHG emissions)
Scope 3 are all other indirect GHG emissions (not included in Scope 2 emissions) that occur in the reporting company’s value chain. For BHP, these are primarily emissions resulting from our customers using and processing the commodities we sell, as well as upstream emissions associated with the extraction, production and transportation of the goods, services, fuels and energy we purchase for use at our operations; emissions resulting from the transportation and distribution of our products; and operational emissions (on an equity basis) from our non-operated joint ventures.
SEC (United States Securities and Exchange Commission)
The US regulatory commission that aims to protect investors, maintain fair, orderly and efficient markets and facilitate capital formation.
Senior manager
An employee who has responsibility for planning, directing or controlling the activities of the entity or a strategically significant part of it. In the OFR, senior manager includes senior leaders and any persons who are directors of any subsidiary company even if they are not senior leaders.
Shareplus
BHP’s all-employee share purchase plan.
Social investment
Social investment is our voluntary contribution towards projects or donations with the primary purpose of contributing to the resilience of the communities where we operate and the environment, aligned with our broader business priorities.
260
Table of Contents
Social value
Our positive contribution to society through the creation of mutual benefit for BHP, our shareholders, Indigenous partners and the broader community.
South32
During FY2015, BHP demerged a selection of our alumina, aluminium, coal, manganese, nickel, silver, lead and zinc assets into a new company – South32 Limited.
Steelmaking coal
Metallurgical coal of a sufficient high quality (grade) that it is suitable for use in steelmaking. Refer to Additional information 10.1 for the definition of metallurgical coal and coking coal.
Surface water
All water naturally open to the atmosphere, including rivers, lakes and creeks and external water dams but excluding water from oceans, seas and estuaries (e.g. precipitation and runoff, including snow and hail).
Sustainability (including sustainable and sustainably)
We describe our approach to sustainability and its governance in this Report, including OFR 6. Our references to sustainability (including sustainable and sustainably) in this Report and our other disclosures do not mean we will not have any adverse impact on the economy, the environment or society, and do not imply we will necessarily give primacy to consideration of or achieve any absolute outcome in relation to, any one economic, environmental or social issue (such as zero GHG emissions or other environmental effects).
Structural GHG emissions abatement
Actions taken at a source of GHG emissions to avoid generating GHG emissions. For BHP, this includes contractual power purchase agreements.
Target (for BHP with respect to GHG emissions)
An intended outcome in relation to which we have identified one or more pathways for delivery of that outcome, subject to certain assumptions or conditions.
TCFD (Task Force on Climate-Related Financial Disclosures)
The task force created by the Financial Stability Board to improve and increase reporting of climate-related financial information, which has released recommendations designed to help companies provide better information to investors and others about how they think about and assess climate-related risks and opportunities.
Third-party water
Water supplied by an entity external to the operational facility. Third-party water may contain water from three sources, surface water, groundwater and seawater.
Tier 1 asset
An asset that we believe is large, long life and low cost.
TNFD (Taskforce on Nature-related Financial Disclosures)
The Taskforce on Nature-Related Financial Disclosures is a global, market-led initiative that aims to develop a risk management and disclosure framework for organisations to report and act on evolving nature-related dependencies, impacts, risks and opportunities.
Transition risk (climate-related)
Risks that arise from existing and emerging policy, regulatory, legal, technological, market and other societal responses to the challenges posed by climate change and the transition to a net zero global economy.
TRIF (total recordable injury frequency)
The sum of (fatalities + lost-time cases + restricted work cases + medical treatment cases) x 1,000,000 ÷ actual hours worked. Stated in units of per million hours worked. BHP adopts the US Government Occupational Safety and Health Administration guidelines for the recording and reporting of occupational injury and illnesses. TRIF statistics exclude non-operated assets.
TSR (total shareholder return)
Measures the return delivered to shareholders over a certain period through the movements in share price and dividends paid (which are assumed to be reinvested). It is the measure used to compare BHP’s performance to that of other relevant companies under the Long-Term Incentive Plan.
Underlying attributable profit
Profit/(loss) after taxation attributable to BHP shareholders excluding any exceptional items attributable to BHP shareholders as described in Financial Statements note 3 ‘Exceptional items’. For more information refer to OFR 10.
Underlying EBIT
Earnings before net finance costs, taxation expense, Discontinued operations and any exceptional items. Underlying EBIT includes BHP’s share of profit/(loss) from investments accounted for using the equity method including net finance costs and taxation expense/(benefit). For more information refer to OFR 10.
261
Table of Contents
Underlying EBITDA
Earnings before net finance costs, depreciation, amortisation and impairments, taxation expense, Discontinued operations and any exceptional items. Underlying EBITDA includes BHP’s share of profit/(loss) from investments accounted for using the equity method including net finance costs, depreciation, amortisation and impairments and taxation expense/(benefit). For more information refer to OFR 10.
Unification
The unification of BHP’s corporate structure under BHP Group Limited as effected on 31 January 2022.
Unit costs
One of the financial measures BHP uses to monitor the performance of individual assets. Unit costs are calculated as ratio of net costs of the assets to the equity share of sales tonnage. Net costs is defined as revenue less Underlying EBITDA and excluding freight, and other costs, depending on the nature of each asset. For information on the method of calculation of the unit costs refer to OFR 10.1.
United Nations SDGs (Sustainable Development Goals)
The Sustainable Development Goals, also known as the Global Goals, were adopted by the United Nations in 2015 as a universal call to action to end poverty, protect the planet, and ensure that by 2030 all people enjoy peace and prosperity.
Value chain GHG emissions
Scope 3 emissions in our reported GHG emissions inventory.
WAF (Water Accounting Framework)
A common mining and metals industry approach to water accounting in Australia.
Water quality – Type 1
Water of high quality that would require minimal (if any) treatment to meet drinking water standards. This water is considered high quality/high grade in the ICMM ‘Good Practice’ Guide (2nd Edition) (2021).
Water quality – Type 2
Water of medium quality that would require moderate treatment to meet drinking water standards (it may have a high salinity threshold of no higher than 5,000 milligrams per litre total dissolved solids and other individual constituents). This water is considered high quality/high grade in the ICMM ‘Good Practice’ Guide (2nd Edition) (2021).
Water quality – Type 3
Water of low quality that would require significant treatment to meet drinking water standards. It may have individual constituents with high values of total dissolved solids, elevated levels of metals or extreme levels of pH. This type of water also includes seawater. This water is considered low quality/low grade in the ICMM ‘Good Practice’ Guide (2nd Edition) (2021).
Well-to-wake basis
Inclusive of the GHG emissions across the entire process of fuel production, delivery and use onboard vessels.
WRSA (Water Resource Situational Analysis)
A Water Resource Situational Analysis is a holistic assessment of the water situation where an operated asset operates. The process is designed to describe the water challenges that partners and stakeholders share and the opportunities for collective action to address those challenges. The WRSA is prepared by a credible third party and draws on publicly available information and direct partner and stakeholder input. Within a defined area that includes the water resources that BHP interacts with, each WRSA includes assessment of:
| • | the ongoing stability of the volume and quality of the water resources, taking into account interactions of all other parties and any related environmental, social or cultural values and climate change forecasts |
| • | the state of water infrastructure, water access, sanitation and hygiene of local communities |
| • | the environmental health of the water catchments that feed the water resources taking into account the extent of vegetation, runoff, and any conservation of the area |
| • | external water governance arrangements and their effectiveness |
262
Table of Contents
Exhibits
Exhibits marked “*” have been filed as exhibits to this annual report on Form 20-F. Remaining exhibits have been incorporated by reference as indicated.
The agreements and other documents filed as exhibits to this report are not intended to provide factual information or other disclosure other than with respect to the terms of the agreements or other documents themselves, and you should not rely on them for that purpose. Some agreements and other documents contain representations and warranties by each of the parties to the applicable agreement. These representations and warranties have been made solely for the benefit of the other parties to the applicable agreement or other arrangement and (i) should not be treated as categorical statements of fact, but rather as a way of allocating the risk to one of the parties if those statements prove to be inaccurate; (ii) may have been qualified by disclosures that were made to the other party in connection with the negotiation of the applicable agreement, which disclosures are not necessarily reflected in the agreement; (iii) may apply standards of materiality in a way that is different from what may be viewed as material to you or other investors; and (iv) were made only as of the date of the applicable agreement or document or such other date or dates as may be specified in the agreement and are subject to more recent developments. Accordingly, these representations and warranties may not describe the actual state of affairs as of the date they were made or at any other time.
263
Table of Contents
Footnotes
| (1) | Furnished only. |
The total amount of long-term debt securities of BHP Group Limited and its subsidiaries authorised under instruments other than those listed above does not exceed 10% of the total assets of BHP Group Limited and its subsidiaries on a consolidated basis. The company agrees to furnish copies of any such instruments to the Commission upon request.
264
Table of Contents
SIGNATURE
The registrant hereby certifies that it meets all of the requirements for filing on Form 20-F and that it has duly caused and authorised the undersigned to sign this annual report on its behalf.
BHP GROUP LIMITED
| By: | /s/ Vandita Pant |
Name: Vandita Pant
Title: Chief Financial Officer
Date: 30 August 2024
Table of Contents
1 | F-1 | |||
| F-1 | ||||
| F-2 | ||||
| F-3 | ||||
| F-4 | ||||
| F-5 | ||||
| F-9 | ||||
1A | F-78 | |||
2 | F- 8 3 | |||
3 | F- 8 4 | |||
4 | F-8 5 | |||
5 | F-8 5 | |||
1 | F-9 | |||
2 | F-12 | |||
3 | F-13 | |||
4 | F-16 | |||
5 | F-24 | |||
6 | F-25 | |||
7 | F-28 | |||
8 | F-29 | |||
9 | F-29 | |||
10 | F-30 | |||
11 | F-30 | |||
12 | F-33 | |||
13 | F-34 | |||
14 | F-37 | |||
15 | F-39 | |||
16 | F-42 | |||
17 | F-47 | |||
18 | F-48 | |||
19 | F-49 | |||
20 | F-49 | |||
21 | F-50 | |||
22 | F-53 | |||
23 | F-55 | |||
24 | F-56 | |||
25 | F-62 | |||
26 | F-62 | |||
27 | F-65 | |||
28 | F-67 | |||
29 | F-69 | |||
30 | F-70 | |||
31 | F-71 | |||
32 | F-74 | |||
33 | F-74 | |||
34 | F-75 | |||
35 | F-75 | |||
36 | F-76 | |||
37 | F-76 | |||
38 | F-76 | |||
39 | F-77 | |||
2024 | 2023 | 2022 | ||||||||||||||
| Notes | US$M | US$M | US$M | |||||||||||||
Continuing operations | ||||||||||||||||
| Revenue | 2 | 55,658 | 53,817 | 65,098 | ||||||||||||
| Other income | 5 | 1,285 | 394 | 1,398 | ||||||||||||
| Expenses excluding net finance costs | 5 | (36,750 | ) | (31,873 | ) | (32,371 | ) | |||||||||
| (Loss)/profit from equity accounted investments, related impairments and expenses | 31 | (2,656 | ) | 594 | (19 | ) | ||||||||||
Profit from operations | 17,537 | 22,932 | 34,106 | |||||||||||||
| Financial expenses | (2,198 | ) | (2,060 | ) | (1,050 | ) | ||||||||||
| Financial income | 709 | 529 | 81 | |||||||||||||
| Net finance costs | 23 | (1,489 | ) | (1,531 | ) | (969 | ) | |||||||||
Profit before taxation | 16,048 | 21,401 | 33,137 | |||||||||||||
| Income tax expense | (6,015 | ) | (6,691 | ) | (10,430 | ) | ||||||||||
| Royalty-related taxation (net of income tax benefit) | (432 | ) | (386 | ) | (307 | ) | ||||||||||
| Total taxation expense | 6 | (6,447 | ) | (7,077 | ) | (10,737 | ) | |||||||||
Profit after taxation from Continuing operations | 9,601 | 14,324 | 22,400 | |||||||||||||
Discontinued operations | ||||||||||||||||
| Profit/(loss) after taxation from Discontinued operations | 28 | – | – | 10,655 | ||||||||||||
Profit after taxation from Continuing and Discontinued operations | 9,601 | 14,324 | 33,055 | |||||||||||||
Attributable to non-controlling interests | 1,704 | 1,403 | 2,155 | |||||||||||||
| Attributable to BHP shareholders | 7,897 | 12,921 | 30,900 | |||||||||||||
| Basic earnings per ordinary share (cents) | 7 | 155.8 | 255.2 | 610.6 | ||||||||||||
| Diluted earnings per ordinary share (cents) | 7 | 155.5 | 254.7 | 609.3 | ||||||||||||
| Basic earnings from Continuing operations per ordinary share (cents) | 7 | 155.8 | 255.2 | 400.0 | ||||||||||||
| Diluted earnings from Continuing operations per ordinary share (cents) | 7 | 155.5 | 254.7 | 399.2 | ||||||||||||
2024 | 2023 | 2022 | ||||||||||||||
| Notes | US$M | US$M | US$M | |||||||||||||
Profit after taxation from Continuing and Discontinued operations | 9,601 | 14,324 | 33,055 | |||||||||||||
Other comprehensive income | ||||||||||||||||
Items that may be reclassified subsequently to the income statement: | ||||||||||||||||
| Hedges: | ||||||||||||||||
| (Losses)/gains taken to equity | (33 | ) | 95 | (914 | ) | |||||||||||
| Losses/(gains) transferred to the income statement | 49 | (148 | ) | 881 | ||||||||||||
| Loss transferred to initial carrying amount of hedged item | – | 35 | – | |||||||||||||
| Exchange fluctuations on translation of foreign operations taken to equity | – | – | (5 | ) | ||||||||||||
| Exchange fluctuations on translation of foreign operations transferred to income statement | – | – | (54 | ) | ||||||||||||
| Tax recognised within other comprehensive income | 6 | (5 | ) | 5 | 10 | |||||||||||
| Total items that may be reclassified subsequently to the income statement | 11 | (13 | ) | (82 | ) | |||||||||||
Items that will not be reclassified to the income statement: | ||||||||||||||||
Re-measurement gains/(losses) on pension and medical schemes | 41 | (18 | ) | 24 | ||||||||||||
| Equity investments held at fair value | (30 | ) | 17 | (8 | ) | |||||||||||
| Tax recognised within other comprehensive income | 6 | (13 | ) | 7 | (9 | ) | ||||||||||
| Total items that will not be reclassified to the income statement | (2 | ) | 6 | 7 | ||||||||||||
| Total other comprehensive income/(loss) | 9 | (7 | ) | (75 | ) | |||||||||||
Total comprehensive income | 9,610 | 14,317 | 32,980 | |||||||||||||
Attributable to non-controlling interests | 1,708 | 1,400 | 2,160 | |||||||||||||
| Attributable to BHP shareholders | 7,902 | 12,917 | 30,820 | |||||||||||||
2024 | 2023 | |||||||||||
| Notes | US$M | US$M | ||||||||||
ASSETS | ||||||||||||
Current assets | ||||||||||||
| Cash and cash equivalents | 21 | 12,501 | 12,428 | |||||||||
| Trade and other receivables | 8 | 5,169 | 4,594 | |||||||||
| Other financial assets | 24 | 381 | 470 | |||||||||
| Inventories | 10 | 5,828 | 5,220 | |||||||||
| Current tax assets | 314 | 508 | ||||||||||
| Other | 145 | 131 | ||||||||||
Total current assets | 24,338 | 23,351 | ||||||||||
Non-current assets | ||||||||||||
| Trade and other receivables | 8 | 170 | 148 | |||||||||
| Other financial assets | 24 | 1,229 | 1,115 | |||||||||
| Inventories | 10 | 1,211 | 1,403 | |||||||||
| Property, plant and equipment | 11 | 71,629 | 71,818 | |||||||||
| Intangible assets | 12 | 1,718 | 1,610 | |||||||||
| Investments accounted for using the equity method | 31 | 1,662 | 1,620 | |||||||||
| Deferred tax assets | 14 | 67 | 56 | |||||||||
| Other | 338 | 175 | ||||||||||
Total non-current assets | 78,024 | 77,945 | ||||||||||
Total assets | 102,362 | 101,296 | ||||||||||
LIABILITIES | ||||||||||||
Current liabilities | ||||||||||||
| Trade and other payables | 9 | 6,719 | 6,296 | |||||||||
| Interest bearing liabilities | 21 | 2,084 | 7,173 | |||||||||
| Other financial liabilities | 24 | 512 | 402 | |||||||||
| Current tax payable | 884 | 611 | ||||||||||
| Provisions | 4,15,20,27 | 4,007 | 4,514 | |||||||||
| Deferred income | 90 | 47 | ||||||||||
Total current liabilities | 14,296 | 19,043 | ||||||||||
Non-current liabilities | ||||||||||||
| Trade and other payables | 9 | 45 | 4 | |||||||||
| Interest bearing liabilities | 21 | 18,634 | 15,172 | |||||||||
| Other financial liabilities | 24 | 1,759 | 2,157 | |||||||||
Non-current tax payable | 40 | 68 | ||||||||||
| Deferred tax liabilities | 14 | 3,332 | 4,299 | |||||||||
| Provisions | 4,15,20,27 | 15,088 | 11,973 | |||||||||
| Deferred income | 48 | 50 | ||||||||||
Total non-current liabilities | 38,946 | 33,723 | ||||||||||
Total liabilities | 53,242 | 52,766 | ||||||||||
Net assets | 49,120 | 48,530 | ||||||||||
EQUITY | ||||||||||||
| Share capital | 17 | 4,899 | 4,737 | |||||||||
| Treasury shares | 17 | (36 | ) | (41 | ) | |||||||
| Reserves | 18 | (15 | ) | 13 | ||||||||
| Retained earnings | 39,963 | 39,787 | ||||||||||
Total equity attributable to BHP shareholders | 44,811 | 44,496 | ||||||||||
Non-controlling interests | 18 | 4,309 | 4,034 | |||||||||
Total equity | 49,120 | 48,530 | ||||||||||
Ken MacKenzie | Mike Henry | |
| Chair | Chief Executive Officer |
2024 | 2023 | 2022 | ||||||||||||||
| Notes | US$M | US$M | US$M | |||||||||||||
Operating activities | ||||||||||||||||
| Profit before taxation from Continuing operations | 16,048 | 21,401 | 33,137 | |||||||||||||
| Adjustments for: | ||||||||||||||||
| Depreciation and amortisation expense | 5,295 | 5,061 | 5,683 | |||||||||||||
| Impairments of property, plant and equipment, financial assets and intangibles | 3,890 | 75 | 515 | |||||||||||||
| Net finance costs | 1,489 | 1,531 | 969 | |||||||||||||
| Loss/(profit) from equity accounted investments, related impairments and expenses | 2,656 | (594 | ) | 19 | ||||||||||||
| Other | (243 | ) | 546 | (350 | ) | |||||||||||
| Changes in assets and liabilities: | ||||||||||||||||
| Trade and other receivables | (290 | ) | 867 | (703 | ) | |||||||||||
| Inventories | (530 | ) | (44 | ) | (865 | ) | ||||||||||
| Trade and other payables | (27 | ) | (1,086 | ) | 727 | |||||||||||
| Provisions and other assets and liabilities | (469 | ) | 131 | (248 | ) | |||||||||||
| Cash generated from operations | 27,819 | 27,888 | 38,884 | |||||||||||||
| Dividends received | 397 | 347 | 1,018 | |||||||||||||
| Interest received | 724 | 545 | 58 | |||||||||||||
| Interest paid | (1,680 | ) | (1,090 | ) | (657 | ) | ||||||||||
| Proceeds of cash management related instruments | 361 | 331 | 378 | |||||||||||||
| Net income tax and royalty-related taxation refunded | 547 | 232 | 105 | |||||||||||||
| Net income tax and royalty-related taxation paid | (7,503 | ) | (9,552 | ) | (10,501 | ) | ||||||||||
Net operating cash flows from Continuing operations | 20,665 | 18,701 | 29,285 | |||||||||||||
| Net operating cash flows from Discontinued operations | 28 | – | – | 2,889 | ||||||||||||
Net operating cash flows | 20,665 | 18,701 | 32,174 | |||||||||||||
Investing activities | ||||||||||||||||
| Purchases of property, plant and equipment | (8,816 | ) | (6,733 | ) | (5,855 | ) | ||||||||||
| Exploration and evaluation expenditure | (457 | ) | (350 | ) | (256 | ) | ||||||||||
| Exploration and evaluation expenditure expensed and included in operating cash flows | 399 | 294 | 199 | |||||||||||||
| Investment in subsidiaries, operations and joint operations, net of cash | 29 | – | (5,868 | ) | – | |||||||||||
| Net investment and funding of equity accounted investments | (701 | ) | (557 | ) | (266 | ) | ||||||||||
| Proceeds from sale of assets | 149 | 444 | 221 | |||||||||||||
| Proceeds from sale of subsidiaries, operations and joint operations net of their cash | 1,072 | 82 | 1,255 | |||||||||||||
| Other investing | (408 | ) | (377 | ) | (271 | ) | ||||||||||
Net investing cash flows from Continuing operations | (8,762 | ) | (13,065 | ) | (4,973 | ) | ||||||||||
| Net investing cash flows from Discontinued operations | 28 | – | – | (904 | ) | |||||||||||
| Net cash completion payment on merger of Petroleum with Woodside | 28 | – | – | (683 | ) | |||||||||||
| Cash and cash equivalents disposed on merger of Petroleum with Woodside | 28 | – | – | (399 | ) | |||||||||||
Net investing cash flows | (8,762 | ) | (13,065 | ) | (6,959 | ) | ||||||||||
Financing activities | ||||||||||||||||
| Proceeds from interest bearing liabilities | 5,091 | 8,182 | 1,164 | |||||||||||||
| Settlements of debt related instruments | (321 | ) | (677 | ) | – | |||||||||||
| Repayment of interest bearing liabilities | (7,327 | ) | (3,289 | ) | (3,358 | ) | ||||||||||
| Distributions to non-controlling interests | (13 | ) | – | – | ||||||||||||
| Purchase of shares by Employee Share Ownership Plan (ESOP) Trusts | – | (88 | ) | (149 | ) | |||||||||||
| Dividends paid | (7,675 | ) | (13,268 | ) | (17,851 | ) | ||||||||||
Dividends paid to non-controlling interests | (1,424 | ) | (1,175 | ) | (2,540 | ) | ||||||||||
Net financing cash flows from Continuing operations | (11,669 | ) | (10,315 | ) | (22,734 | ) | ||||||||||
| Net financing cash flows from Discontinued operations | 28 | – | – | (33 | ) | |||||||||||
Net financing cash flows | (11,669 | ) | (10,315 | ) | (22,767 | ) | ||||||||||
Net increase/(decrease) in cash and cash equivalents from Continuing operations | 234 | (4,679 | ) | 1,578 | ||||||||||||
Net increase in cash and cash equivalents from Discontinued operations | – | – | 1,952 | |||||||||||||
| Net cash completion payment on merger of Petroleum with Woodside | – | – | (683 | ) | ||||||||||||
| Cash and cash equivalents disposed on merger of Petroleum with Woodside | – | – | (399 | ) | ||||||||||||
| Cash and cash equivalents, net of overdrafts, at the beginning of the financial year | 12,423 | 17,236 | 15,246 | |||||||||||||
| Foreign currency exchange rate changes on cash and cash equivalents | (159 | ) | (134 | ) | (458 | ) | ||||||||||
Cash and cash equivalents, net of overdrafts, at the end of the financial year | 21 | 12,498 | 12,423 | 17,236 | ||||||||||||
Attributable to BHP shareholders | ||||||||||||||||||||||||||||
BHP Group Limited | ||||||||||||||||||||||||||||
US$M | Share capital | Treasury shares | Reserves | Retained earnings | Total equity attributable to BHP shareholders | Non- controlling interests | Total equity | |||||||||||||||||||||
Balance as at 1 July 2023 | 4,737 | (41 | ) | 13 | 39,787 | 44,496 | 4,034 | 48,530 | ||||||||||||||||||||
Total comprehensive income | – | – | (18 | ) | 7,920 | 7,902 | 1,708 | 9,610 | ||||||||||||||||||||
Transactions with owners: | ||||||||||||||||||||||||||||
| Shares issued | 162 | (162 | ) | – | – | – | – | – | ||||||||||||||||||||
| Purchase of shares by ESOP Trusts | – | – | – | – | – | – | – | |||||||||||||||||||||
| Employee share awards exercised net of employee contributions net of tax | – | 167 | (134 | ) | (33 | ) | – | – | – | |||||||||||||||||||
| Vested employee share awards that have lapsed, been cancelled or forfeited | – | – | (1 | ) | 1 | – | – | – | ||||||||||||||||||||
| Accrued employee entitlement for unexercised awards net of tax | – | – | 129 | – | 129 | – | 129 | |||||||||||||||||||||
| Dividends | – | – | – | (7,712 | ) | (7,712 | ) | (1,424 | ) | (9,136 | ) | |||||||||||||||||
| Distribution to non-controlling interests | – | – | (4 | ) | – | (4 | ) | (9 | ) | (13 | ) | |||||||||||||||||
Balance as at 30 June 2024 | 4,899 | (36 | ) | (15 | ) | 39,963 | 44,811 | 4,309 | 49,120 | |||||||||||||||||||
| Balance as at 1 July 2022 | 4,638 | (31 | ) | 12 | 40,338 | 44,957 | 3,809 | 48,766 | ||||||||||||||||||||
| Total comprehensive income | – | – | 4 | 12,913 | 12,917 | 1,400 | 14,317 | |||||||||||||||||||||
| Transactions with owners: | ||||||||||||||||||||||||||||
| Shares issued | 99 | (99 | ) | – | – | – | – | – | ||||||||||||||||||||
| Purchase of shares by ESOP Trusts | – | (88 | ) | – | – | (88 | ) | – | (88 | ) | ||||||||||||||||||
| Employee share awards exercised net of employee contributions net of tax | – | 177 | (132 | ) | (45 | ) | – | – | – | |||||||||||||||||||
| Vested employee share awards that have lapsed, been cancelled or forfeited | – | – | (1 | ) | 1 | – | – | – | ||||||||||||||||||||
| Accrued employee entitlement for unexercised awards net of tax | – | – | 130 | – | 130 | – | 130 | |||||||||||||||||||||
| Dividends | – | – | – | (13,420 | ) | (13,420 | ) | (1,175 | ) | (14,595 | ) | |||||||||||||||||
| Balance as at 30 June 2023 | 4,737 | (41 | ) | 13 | 39,787 | 44,496 | 4,034 | 48,530 | ||||||||||||||||||||
| Attributable to BHP shareholders | ||||||||||||||||||||||||||||||||||||
| Share capital | Treasury shares | Reserves | Retained earnings | Total equity attributable to BHP shareholders | ||||||||||||||||||||||||||||||||
| US$M | BHP Group Limited | BHP Group Plc | BHP Group Limited | BHP Group Plc | Non- controlling interests | Total equity | ||||||||||||||||||||||||||||||
| Balance as at 1 July 2021 | 1,111 | 1,057 | (32 | ) | (1 | ) | 2,350 | 46,779 | 51,264 | 4,341 | 55,605 | |||||||||||||||||||||||||
| Total comprehensive income | – | – | – | – | (90 | ) | 30,910 | 30,820 | 2,160 | 32,980 | ||||||||||||||||||||||||||
| Transactions with owners: | ||||||||||||||||||||||||||||||||||||
| BHP Group Limited shares issued | 172 | – | (172 | ) | – | – | – | – | – | – | ||||||||||||||||||||||||||
| Purchase of shares by ESOP Trusts | – | – | (148 | ) | (1 | ) | – | – | (149 | ) | – | (149 | ) | |||||||||||||||||||||||
| Employee share awards exercised net of employee contributions net of tax | – | – | 321 | 2 | (207 | ) | (116 | ) | – | – | – | |||||||||||||||||||||||||
| Vested employee share awards that have lapsed, been cancelled or forfeited | – | – | – | – | (30 | ) | 30 | – | – | – | ||||||||||||||||||||||||||
| Accrued employee entitlement for unexercised awards net of tax | – | – | – | – | 143 | – | 143 | – | 143 | |||||||||||||||||||||||||||
| Corporate structure unification | 3,355 | (1,057 | ) | – | – | (2,298 | ) | – | – | – | – | |||||||||||||||||||||||||
| Dividends | – | – | – | – | – | (17,720 | ) | (17,720 | ) | (2,540 | ) | (20,260 | ) | |||||||||||||||||||||||
| In specie dividend on merger of Petroleum with Woodside | – | – | – | – | – | (19,559 | ) | (19,559 | ) | – | (19,559 | ) | ||||||||||||||||||||||||
| Divestment of subsidiaries, operations and joint operations | – | – | – | – | – | – | – | (157 | ) | (157 | ) | |||||||||||||||||||||||||
| Transfers within equity on divestment of subsidiaries, operations and joint operations | – | – | – | – | (14 | ) | 14 | – | – | – | ||||||||||||||||||||||||||
| Equity contributed net of tax | – | – | – | – | 158 | – | 158 | 5 | 163 | |||||||||||||||||||||||||||
| Balance as at 30 June 2022 | 4,638 | – | (31 | ) | – | 12 | 40,338 | 44,957 | 3,809 | 48,766 | ||||||||||||||||||||||||||
| • | Group’s current year results |
| • | impact of significant changes in the Group’s business or |
| • | aspects of the Group’s operations that are important to future performance |
| • | are a consolidated general purpose financial report |
| • | have been prepared in accordance with the requirements of: |
¡ | the Australian Corporations Act 2001 (Corporations Act 2001) |
¡ | Australian Accounting Standards and other authoritative pronouncements of the Australian Accounting Standards Board (AASB) and International Financial Reporting Standards as issued by the International Accounting Standards Board (IASB) (collectively referred to as IFRS) |
| • | are prepared on a going concern basis as the Directors: |
¡ | have made an assessment of the Group’s ability to continue as a going concern for the 12 months from the date of this report |
¡ | consider it appropriate to adopt the going concern basis of accounting in preparing the Group’s Financial Statements |
| • | measure items on the basis of historical cost principles, except for the following items: |
¡ | derivative financial instruments and certain other financial assets and liabilities, which are carried at fair value |
¡ | non-current assets or disposal groups that are classified asheld-for-sale held-for-distribution, |
| • | include material accounting policies in the notes to the Financial Statements, specifically where accounting policy choices have been made in relation to the recognition and measurement basis used and are relevant to an understanding of the Financial Statements |
| • | apply a presentation currency of US dollars, consistent with the predominant functional currency of the Group’s operations. Amounts are rounded to the nearest million dollars, unless otherwise stated, in accordance with ASIC (Rounding in Financial/Directors’ Reports) Instrument 2016/191 |
| • | present reclassified comparative information where required for consistency with the current year’s presentation |
| • | adopt all new and amended standards and interpretations under IFRS that are mandatory for application in periods beginning on 1 July 2023. None had a significant impact on the Financial Statements. Refer note 39 ‘New and amended accounting standards and interpretations and changes to accounting policies’ for details |
| • | have not early adopted any standards and interpretations that have been issued or amended but are not yet effective, other than as outlined in note 39 ‘New and amended accounting standards and interpretations and changes to accounting policies’ |
| • | has power over the investee |
| • | is exposed to, or has rights to, variable returns from its involvement with the entity |
| • | has the ability to affect those returns through its power to direct the activities of the entity |
| • | Joint operations: |
| • | Joint ventures: |
| • | has over 20 per cent but less than 50 per cent of the voting rights of an entity, unless it can be clearly demonstrated that this is not the case or |
| • | holds less than 20 per cent of the voting rights of an entity; however, has the power to participate in the financial and operating policy decisions affecting the entity |
Significant judgements and estimates | ||
The Group’s accounting policies require the use of judgement, estimates and assumptions. All judgements, estimates and assumptions are based on the most current facts and circumstances and are reassessed on an ongoing basis. Actual results in future reporting periods may differ for these estimates under different assumptions and conditions. | ||
| Further information regarding the Group’s significant judgements and key estimates and assumptions, being those where changes may materially affect financial results and the carrying amount of assets and liabilities to be reported in the next reporting period, are embedded within the following notes: | ||
Note | ||
| 4 | Significant events – Samarco dam failure | |
| 6 | Taxation | |
| 11 | Overburden removal costs | |
| 11 | Depreciation of property, plant and equipment | |
| 13 | Impairment of non-current assets | |
| 15 | Closure and rehabilitation provisions | |
| 22 | Leases | |
| 29 | Business combinations | |
Additional information including sensitivity analysis, where appropriate, has been provided in the relevant notes to enhance an understanding of the impact of key estimates and assumptions on the Group’s financial position and performance. | ||
Reserve estimates | ||
| Estimates are used in the determination of stripping ratios and mineral reserves by component. For purposes of the Group’s Financial Statements, reserves estimates are based on internally generated, projected long-term commodity prices and current operating costs used in studies for development projects. In order to estimate reserves, assumptions are required about a range of technical and economic factors, including quantities, qualities, production techniques, recovery efficiency, production and transport costs, commodity supply and demand, commodity and carbon prices and exchange rates. | ||
Estimating the quantity and/or quality of reserves requires the size, shape and depth of ore bodies to be determined by analysing geological data, such as drilling samples and geophysical survey interpretations. Economic assumptions used to estimate reserves change from period-to-period | ||
Reserve impact on financial reporting | ||
Estimates of reserves may change from period-to-period | ||
| • asset carrying values may be affected due to changes in estimated future production levels | ||
| • depreciation, depletion and amortisation charged to the income statement may change where such charges are determined on the units of production basis, or where the useful economic lives of assets change | ||
| • overburden removal costs recorded on the balance sheet or charged to the income statement may change due to changes in stripping ratios or the units of production basis of depreciation | ||
| • closure and rehabilitation provisions may change where changes in estimated reserves affect expectations about the timing or cost of these activities | ||
| • the carrying amount of deferred tax assets may change due to changes in estimates of the likely recovery of the tax benefits | ||
Reportable segment | Principal activities | |
| Copper | Mining of copper, uranium, gold, zinc, molybdenum and silver | |
| Iron Ore | Mining of iron ore | |
| Coal | Mining of steelmaking coal and energy coal | |
Year ended 30 June 2024 US$M | Copper | Iron Ore | Coal | Group and unallocated items/ eliminations | Group total | |||||||||||||||
| Revenue | 18,566 | 27,952 | 7,666 | 1,474 | 55,658 | |||||||||||||||
| Inter-segment revenue | – | – | – | – | – | |||||||||||||||
Total revenue | 18,566 | 27,952 | 7,666 | 1,474 | 55,658 | |||||||||||||||
Underlying EBITDA | 8,564 | 18,913 | 2,290 | (751 | ) | 29,016 | ||||||||||||||
| Depreciation and amortisation | (2,023 | ) | (2,027 | ) | (611 | ) | (634 | ) | (5,295 | ) | ||||||||||
Impairment losses 1 | (17 | ) | (61 | ) | (2 | ) | (10 | ) | (90 | ) | ||||||||||
Underlying EBIT | 6,524 | 16,825 | 1,677 | (1,395 | ) | 23,631 | ||||||||||||||
Exceptional items 2 | – | (3,066 | ) | 880 | (3,908 | ) | (6,094 | ) | ||||||||||||
| Net finance costs | (1,489 | ) | ||||||||||||||||||
Profit before taxation | 16,048 | |||||||||||||||||||
Capital expenditure (cash basis) | 3,711 | 2,033 | 646 | 2,426 | 8,816 | |||||||||||||||
(Loss)/profit from equity accounted investments, related impairments and expenses | 377 | (3,032 | ) | – | (1 | ) | (2,656 | ) | ||||||||||||
Investments accounted for using the equity method | 1,573 | – | – | 89 | 1,662 | |||||||||||||||
Total assets | 42,145 | 25,569 | 9,528 | 25,120 | 102,362 | |||||||||||||||
Total liabilities | 5,777 | 11,757 | 3,056 | 32,652 | 53,242 | |||||||||||||||
Year ended 30 June 2023 US$M | Copper | Iron Ore | Coal | Group and unallocated items/ eliminations | Group total | |||||||||||||||
| Revenue | 16,027 | 24,812 | 10,958 | 2,020 | 53,817 | |||||||||||||||
| Inter-segment revenue | – | – | – | – | – | |||||||||||||||
| Total revenue | 16,027 | 24,812 | 10,958 | 2,020 | 53,817 | |||||||||||||||
| Underlying EBITDA | 6,653 | 16,692 | 4,998 | (387 | ) | 27,956 | ||||||||||||||
| Depreciation and amortisation | (1,810 | ) | (1,993 | ) | (697 | ) | (561 | ) | (5,061 | ) | ||||||||||
Impairment losses 1 | (33 | ) | (28 | ) | (6 | ) | (8 | ) | (75 | ) | ||||||||||
| Underlying EBIT | 4,810 | 14,671 | 4,295 | (956 | ) | 22,820 | ||||||||||||||
Exceptional items 2 | – | 176 | – | (64 | ) | 112 | ||||||||||||||
| Net finance costs | (1,531 | ) | ||||||||||||||||||
| Profit before taxation | 21,401 | |||||||||||||||||||
| Capital expenditure (cash basis) | 2,698 | 1,966 | 657 | 1,412 | 6,733 | |||||||||||||||
| (Loss)/profit from equity accounted investments, related impairments and expenses | 383 | 215 | – | (4 | ) | 594 | ||||||||||||||
| Investments accounted for using the equity method | 1,530 | – | – | 90 | 1,620 | |||||||||||||||
| Total assets | 39,864 | 25,527 | 11,087 | 24,818 | 101,296 | |||||||||||||||
| Total liabilities | 5,635 | 8,571 | 3,821 | 34,739 | 52,766 | |||||||||||||||
Year ended 30 June 2022 US$M | Copper | Iron Ore | Coal | Group and unallocated items/ eliminations | Group total | |||||||||||||||
| Revenue | 16,849 | 30,767 | 15,549 | 1,933 | 65,098 | |||||||||||||||
| Inter-segment revenue | – | – | – | – | – | |||||||||||||||
| Total revenue | 16,849 | 30,767 | 15,549 | 1,933 | 65,098 | |||||||||||||||
| Underlying EBITDA | 8,565 | 21,707 | 9,504 | 858 | 40,634 | |||||||||||||||
| Depreciation and amortisation | (1,765 | ) | (2,203 | ) | (762 | ) | (953 | ) | (5,683 | ) | ||||||||||
Impairment losses 1 | (470 | ) | (33 | ) | (9 | ) | (3 | ) | (515 | ) | ||||||||||
| Underlying EBIT | 6,330 | 19,471 | 8,733 | (98 | ) | 34,436 | ||||||||||||||
Exceptional items 2 | – | (729 | ) | 849 | (450 | ) | (330 | ) | ||||||||||||
| Net finance costs | (969 | ) | ||||||||||||||||||
| Profit before taxation | 33,137 | |||||||||||||||||||
| Capital expenditure (cash basis) | 2,528 | 1,848 | 621 | 858 | 5,855 | |||||||||||||||
| (Loss)/profit from equity accounted investments, related impairments and expenses | 658 | (676 | ) | – | (1 | ) | (19 | ) | ||||||||||||
| Investments accounted for using the equity method | 1,415 | – | – | 5 | 1,420 | |||||||||||||||
| Total assets | 32,693 | 24,682 | 11,524 | 26,267 | 95,166 | |||||||||||||||
| Total liabilities | 5,248 | 7,884 | 3,874 | 29,394 | 46,400 | |||||||||||||||
| 1 | Impairment losses exclude exceptional items of US$3,800 million (2023: US$ |
| 2 | Exceptional items reported in Group and unallocated include Samarco dam failure related costs of US$(105) million (2023: US$(64) million; 2022: US$(13) million). Refer to note 3 ‘Exceptional items’ for further information. |
Revenue by location of customer | ||||||||||||
2024 | 2023 | 2022 | ||||||||||
US$M | US$M | US$M | ||||||||||
| Australia | 2,393 | 1,702 | 1,649 | |||||||||
| Europe | 1,702 | 1,961 | 2,129 | |||||||||
| China | 34,752 | 31,205 | 36,618 | |||||||||
| Japan | 4,557 | 6,971 | 8,401 | |||||||||
| India | 3,371 | 3,447 | 5,215 | |||||||||
| South Korea | 3,069 | 2,997 | 4,786 | |||||||||
| Rest of Asia | 3,749 | 3,583 | 4,303 | |||||||||
| North America | 1,601 | 1,382 | 1,282 | |||||||||
| South America | 464 | 569 | 715 | |||||||||
55,658 | 53,817 | 65,098 | ||||||||||
Non-current assets by location of assets | ||||||||||||
2024 | 2023 | 2022 | ||||||||||
US$M | US$M | US$M | ||||||||||
| Australia | 48,991 | 51,961 | 43,250 | |||||||||
| North America | 6,979 | 5,081 | 3,964 | |||||||||
| South America | 19,927 | 19,047 | 18,280 | |||||||||
| Rest of world | 831 | 685 | 150 | |||||||||
Unallocated assets 1 | 1,296 | 1,171 | 858 | |||||||||
78,024 | 77,945 | 66,502 | ||||||||||
| 1 | Unallocated assets comprise deferred tax assets and other financial assets. |
2024 | 2023 | 2022 | ||||||||||
US$M | US$M | US$M | ||||||||||
| Escondida | 10,013 | 8,847 | 9,500 | |||||||||
| Pampa Norte | 2,375 | 2,491 | 2,670 | |||||||||
Copper South Australia 1 | 4,085 | 2,806 | 1,776 | |||||||||
| Third-party products | 2,021 | 1,863 | 2,903 | |||||||||
| Other | 72 | 20 | – | |||||||||
Total Copper 2 | 18,566 | 16,027 | 16,849 | |||||||||
| Western Australia Iron Ore | 27,805 | 24,678 | 30,632 | |||||||||
| Third-party products | 25 | 21 | 19 | |||||||||
| Other | 122 | 113 | 116 | |||||||||
Total Iron Ore | 27,952 | 24,812 | 30,767 | |||||||||
| BHP Mitsubishi Alliance | 5,873 | 7,652 | 10,254 | |||||||||
| New South Wales Energy Coal | 1,793 | 3,306 | 3,035 | |||||||||
Other 3 | – | – | 2,260 | |||||||||
Total Coal 4 | 7,666 | 10,958 | 15,549 | |||||||||
Group and unallocated items 5 | 1,474 | 2,020 | 1,933 | |||||||||
| Inter-segment adjustment | – | – | – | |||||||||
Total revenue | 55,658 | 53,817 | 65,098 | |||||||||
| 1 | Includes Olympic Dam as well as Prominent Hill and Carrapateena since acquisition on 2 May 2023. |
| 2 | Total Copper revenue includes: copper US$17,229 million (2023: US$14,902 million; 2022: US$15,992 million) and other US$1,337 million (2023: US$1,125 million; 2022: US$857 million). Other consists of direct sales of uranium, gold, zinc, molybdenum and silver. |
| 3 | FY2022 includes revenue related to BHP Mitsui Coal (BMC) divested in May 2022. |
| 4 | Total Coal revenue includes: steelmaking coal US$5,793 million (2023: US$7,430 million; 2022: US$11,990 million) and energy coal US$1,873 million (2023: US$3,528 million; 2022: US$3,559 million). |
| 5 | Group and unallocated items revenue includes: Western Australia Nickel US$1,473 million (2023: US$2,009 million; 2022: US$1,926 million) and other revenue US$1 million (2023: US$11 million; 2022: US$7 million). |
| • | expected consideration is not adjusted for the effects of the time value of money if the period between the delivery and when the customer pays for the promised good or service is one year or less |
| • | no disclosure is provided for information relating to unfulfilled performance obligations, either due to the expected duration of the contract term being one year or less, or for longer term contracts, because the entity has a right to consideration (and can recognise revenue) for goods delivered |
Year ended 30 June 2024 | Gross | Tax | Net | |||||||||
US$M | US$M | US$M | ||||||||||
Exceptional items by category | ||||||||||||
| Samarco dam failure | (3,677 | ) | (85 | ) | (3,762 | ) | ||||||
| Impairment of Western Australia Nickel assets | (3,800 | ) | 1,125 | (2,675 | ) | |||||||
| Blackwater and Daunia gain on divestment | 877 | (203 | ) | 674 | ||||||||
Total | (6,600 | ) | 837 | (5,763 | ) | |||||||
Attributable to non-controlling interests | – | – | – | |||||||||
| Attributable to BHP shareholders | (6,600 | ) | 837 | (5,763 | ) | |||||||
Year ended 30 June 2024 | US$M | |||
| Expenses excluding net finance costs: | ||||
| Costs incurred directly by BHP Brasil and other BHP entities in relation to the Samarco dam failure | (139 | ) | ||
| (Loss)/profit from equity accounted investments, related impairments and expenses: | ||||
| Samarco dam failure provision | (2,833 | ) | ||
| Fair value change on forward exchange derivatives | (199 | ) | ||
| Net finance costs | (506 | ) | ||
| Income tax expense | (85 | ) | ||
Total 1 | (3,762 | ) | ||
| 1 | Refer to note 4 ‘Significant events – Samarco dam failure’ for further information. |
US$M | ||||
Assets | ||||
| Inventories | 113 | |||
| Property, plant and equipment | 1,453 | |||
| Intangible assets | 45 | |||
| Other | 3 | |||
Total assets | 1,614 | |||
Liabilities | ||||
| Interest bearing liabilities | 60 | |||
| Other financial liabilities | 43 | |||
| Provisions | 691 | |||
Total liabilities | 794 | |||
Net assets disposed | 820 | |||
| Cash consideration – BHP share | 1,072 | |||
Deferred and contingent consideration 1 | 690 | |||
| Transaction and other directly attributable costs | (65 | ) | ||
| Income tax expense | (203 | ) | ||
Gain on divestment | 674 | |||
| 1 | Includes the fair value of contingent payments based on 35% revenue share to BMA, subject to average realised prices achieved by the Assets exceeding thresholds of US$159/tonne in the 12 month period12 months post completion, US$134/tonne in the12 month period24 months post completion and US$134/tonne in the12 month period36 months post completion. |
| Year ended 30 June 2023 | Gross | Tax | Net | |||||||||
| US$M | US$M | US$M | ||||||||||
Exceptional items by category | ||||||||||||
| Samarco dam failure | (340 | ) | 17 | (323 | ) | |||||||
| Chilean tax reform | – | (283 | ) | (283 | ) | |||||||
| Total | (340 | ) | (266 | ) | (606 | ) | ||||||
Attributable to non-controlling interests | – | (107 | ) | (107 | ) | |||||||
| Attributable to BHP shareholders | (340 | ) | (159 | ) | (499 | ) | ||||||
| Year ended 30 June 2023 | US$M | |||
| Expenses excluding net finance costs: | ||||
| Costs incurred directly by BHP Brasil and other BHP entities in relation to the Samarco dam failure | (103 | ) | ||
| (Loss)/profit from equity accounted investments, related impairments and expenses: | ||||
| Samarco dam failure provision | (256 | ) | ||
| Fair value change on forward exchange derivatives | 471 | |||
| Net finance costs | (452 | ) | ||
| Income tax benefit | 17 | |||
Total 1 | (323 | ) | ||
| 1 | Refer to note 4 ‘Significant events – Samarco dam failure’ for further information. |
| Year ended 30 June 2022 | Gross | Tax | Net | |||||||||
| US$M | US$M | US$M | ||||||||||
Exceptional items by category | ||||||||||||
| Samarco dam failure | (1,032 | ) | (31 | ) | (1,063 | ) | ||||||
| Impairment of US deferred tax assets | – | (423 | ) | (423 | ) | |||||||
| Corporate structure unification costs | (428 | ) | – | (428 | ) | |||||||
| BHP Mitsui Coal (BMC) gain on disposal | 840 | – | 840 | |||||||||
| Total | (620 | ) | (454 | ) | (1,074 | ) | ||||||
Attributable to non-controlling interests | – | – | – | |||||||||
| Attributable to BHP shareholders | (620 | ) | (454 | ) | (1,074 | ) | ||||||
| Year ended 30 June 2022 | US$M | |||
| Expenses excluding net finance costs: | ||||
| Costs incurred directly by BHP Brasil and other BHP entities in relation to the Samarco dam failure | (66 | ) | ||
| (Loss)/profit from equity accounted investments, related impairments and expenses: | ||||
| Samarco dam failure provision | (595 | ) | ||
| Fair value change on forward exchange derivatives | (81 | ) | ||
| Net finance costs | (290 | ) | ||
| Income tax expense | (31 | ) | ||
Total 1 | (1,063 | ) | ||
| 1 | Refer to note 4 ‘Significant events – Samarco dam failure’ for further information. |
| Details of the gain on disposal is as follows: | US$M | |||
| BHP share of net assets disposed | 631 | |||
| Gross consideration | 1,318 | |||
| Transaction and other directly applicable costs | (69 | ) | ||
| Income tax expense | – | |||
| Deferred consideration | 222 | |||
| Gain on disposal | 840 | |||
Financial impacts of Samarco dam failure | 2024 | 2023 | 2022 | |||||||||
US$M | US$M | US$M | ||||||||||
Income statement | ||||||||||||
| Expenses excluding net finance costs: | ||||||||||||
Costs incurred directly by BHP Brasil and other BHP entities in relation to the Samarco dam failure 1 | (139 | ) | (103 | ) | (66 | ) | ||||||
| (Loss)/profit from equity accounted investments, related impairments and expenses: | ||||||||||||
Samarco dam failure provision 2 | (2,833 | ) | (256 | ) | (595 | ) | ||||||
Fair value change on forward exchange derivatives 3 | (199 | ) | 471 | (81 | ) | |||||||
| (Loss)/profit from operations | (3,171 | ) | 112 | (742 | ) | |||||||
Net finance costs 4 | (506 | ) | (452 | ) | (290 | ) | ||||||
| Loss before taxation | (3,677 | ) | (340 | ) | (1,032 | ) | ||||||
Income tax (expense)/benefit 5 | (85 | ) | 17 | (31 | ) | |||||||
Loss after taxation | (3,762 | ) | (323 | ) | (1,063 | ) | ||||||
Balance sheet movement | ||||||||||||
Other financial assets 6 | (280 | ) | 337 | (160 | ) | |||||||
| Trade and other payables | (4 | ) | (6 | ) | (1 | ) | ||||||
| Tax liabilities | (85 | ) | 17 | (31 | ) | |||||||
| Provisions | (2,824 | ) | (260 | ) | (629 | ) | ||||||
Net (increase)/decrease in liabilities | (3,193 | ) | 88 | (821 | ) | |||||||
2024 | 2023 | 2022 | ||||||||||||||||||||||
US$M | US$M | US$M | ||||||||||||||||||||||
Cash flow statement | ||||||||||||||||||||||||
| Loss before taxation | (3,677 | ) | (340 | ) | (1,032 | ) | ||||||||||||||||||
Adjustments for: | ||||||||||||||||||||||||
Samarco dam failure provision 2 | 2,833 | 256 | 595 | |||||||||||||||||||||
Fair value change on forward exchange derivatives 3 | 199 | (471 | ) | 81 | ||||||||||||||||||||
| Proceeds of cash management related instruments | 218 | 134 | 79 | |||||||||||||||||||||
Net finance costs 4 | 506 | 452 | 290 | |||||||||||||||||||||
Changes in assets and liabilities: | ||||||||||||||||||||||||
| Trade and other payables | 4 | 6 | 1 | |||||||||||||||||||||
Net operating cash flows | 83 | 37 | 14 | |||||||||||||||||||||
Net investment and funding of equity accounted investments 7 | (640 | ) | (448 | ) | (256 | ) | ||||||||||||||||||
Net investing cash flows | (640 | ) | (448 | ) | (256 | ) | ||||||||||||||||||
Net decrease in cash and cash equivalents | (557 | ) | (411 | ) | (242 | ) | ||||||||||||||||||
| 1 | Includes legal and advisor costs incurred. |
| 2 | US$3,700 million (2023: US$(33) million; 2022: US$691 million) change in estimate and US$(867) million (2023: US$289 million; 2022: US$(96) million) exchange translation. |
| 3 | The Group enters into forward exchange contracts to limit the Brazilian reais exposure on the dam failure provision. While not applying hedge accounting, the fair value changes in the forward exchange instruments are recorded within (Loss)/profit from equity accounted investments, related impairments and expenses in the Income Statement. |
| 4 | Amortisation of discounting of provision. |
| 5 | Includes tax on forward exchange derivatives and other taxes incurred during the period. |
| 6 | Includes forward exchange contracts described in item 3 above, and Senior notes issued by Samarco as part of its Judicial Reorganisation. |
| 7 | Includes US$(515) million (2023: US$(448) million; 2022: US$(256) million) utilisation of the Samarco dam failure provision and US$(125) million provided to Samarco following approval of the Judicial Reorganisation (2023:US$ nil; 2022: US$ |
2024 | 2023 | |||||||||||||||
US$M | US$M | |||||||||||||||
| At the beginning of the financial year | 3,681 | 3,421 | ||||||||||||||
| Movement in provision | 2,824 | 260 | ||||||||||||||
Comprising: | ||||||||||||||||
| Utilised | (515 | ) | (448 | ) | ||||||||||||
| Adjustments charged to the income statement: | ||||||||||||||||
| Change in cost estimate | 3,700 | (33 | ) | |||||||||||||
| Amortisation of discounting impacting net finance costs | 506 | 452 | ||||||||||||||
| Exchange translation | (867 | ) | 289 | |||||||||||||
At the end of the financial year | 6,505 | 3,681 | ||||||||||||||
| Comprising: | ||||||||||||||||
| Current | 1,500 | 1,876 | ||||||||||||||
Non-current | 5,005 | 1,805 | ||||||||||||||
At the end of the financial year | 6,505 | 3,681 | ||||||||||||||
Item | Provision | Contingent liability | ||
Samarco dam failure – Framework Agreement | ✔ | X | ||
On 2 March 2016, BHP Brasil, Samarco and Vale S.A. (Vale) entered into a Framework Agreement with the Federal Government of Brazil, the states of Espirito Santo and Minas Gerais, and certain other public authorities to establish a foundation (Fundação Renova) that is developing and executing environmental and socio-economic programs (Programs) to remediate and provide compensation for damage caused by the Samarco dam failure (the Framework Agreement). Key P rograms include those for financial assistance and compensation of impacted persons and those for remediation of impacted areas and resettlement of impacted communities.Uncertainty exists around the scope and cost of the Programs, including as a result of ongoing legal actions in relation to the number of individuals eligible for compensation and the amount of damages to which they are entitled. Further information on the key areas of estimation uncertainty is provided in the ‘Key judgements and estimates’ section below. Samarco has primary responsibility for funding Fundação Renova with each of BHP Brasil and Vale having secondary funding obligations in proportion to their 50 per cent shareholding in Samarco. While Samarco has recommenced operations, Samarco’s long-term cash flow generation remains highly sensitive to factors including returning to full production capacity, commodity prices and foreign exchange rates. Further, under the Samarco Judicial Reorganisation (refer to Samarco Judicial Reorganisation (JR) below), Samarco’s funding of obligations to remediate and compensate the damages resulting from the dam failure, including funding Fundação Renova, is capped at US$1 billion for the period CY2024 to CY2030. Notwithstanding this cap, and subject to certain conditions, to the extent that Samarco each year has a positive cash balance after meeting its various obligations, during this period Samarco’s shareholders are able to direct 50 per cent of Samarco’s year end excess cash balance to fund remediation and compensation obligations. Execution of the Programs is a key component in the resolution of the reparation process, including the Federal Public Prosecution Office claim and, therefore, the expected cost of executing the Programs and Samarco’s potential ability to contribute to remediation and compensation obligations have been considered when determining BHP Brasil’s provision in relation to the Samarco dam failure at 30 June 2024 (as outlined below). | ||||
| Item | Provision | Contingent liability | ||
Federal Public Prosecution Office claim | ✔ | X | ||
BHP Brasil is among the defendants named in a claim brought by the Brazilian Federal Public Prosecution Office on 3 May 2016, seeking R$155 billion (approximately US$28 billion) for reparation, compensation and moral damages in relation to the Samarco dam failure. Since early CY2021, BHP Brasil, Samarco and Vale have been engaging in negotiations with the Brazilian State and Federal Government and other public entities to seek a settlement of obligations under the Framework Agreement, the Federal Public Prosecution Office Claim, and other claims by government entities relating to the Samarco dam failure (the ‘Settlement Negotiations’). The Settlement Negotiations are ongoing and the outcome is uncertain. As at 30 June 2023, the Group disclosed a contingent liability in relation to the Federal Public Prosecution Office claim as, given the status of the claim and ongoing settlement negotiations, it was not possible to reliably estimate the potential outcomes of the claim beyond the estimated costs of completing the Programs under the Framework Agreement, which are being executed in relation to financial assistance and compensation of impacted persons, remediation of impacted areas and resettlement of impacted communities. On 25 January 2024, the Federal Court of Brazil issued a decision in relation to the Federal Public Prosecution Office Claim finding Samarco, Vale and BHP Brasil jointly and severally liable to pay collective moral damages arising from the Samarco dam failure in the amount of R$47.6 billion (US$8.6 billion) (to be adjusted for interest and inflation). The decision also determined that payment will only occur when any and all appeals are finally determined. In March 2024, the Federal Court found that the correct historical amount due of collective moral damages is R$46.7 billion (instead of R$47.6 billion). In April and May 2024, Samarco, Vale, BHP Brasil and various governmental parties appealed the decision. The appeal process is estimated to take approximately two to five years. The Federal Court issued rulings on 8 May 2024 and 20 May 2024 denying the requests for early enforcement. On 27 June 2024, the Federal Court dismissed without prejudice certain claims directed at the Companies in the Federal Public Prosecution Office Claim, on the grounds that they are already covered by previous agreements and decisions (such as the Framework Agreement). This decision did not dismiss the collective moral damages decision outlined above and is also subject to appeal. In June 2024, the Public Prosecutors’ Office and the Public Defense Office filed a public civil claim against Samarco, BHP Brasil, Vale and Fundação Renova for alleged gender discrimination against women in the reparation process. They requested certain changes in Fundação Renova’s registration program, damages and an injunctive relief to implement emergency measures. On 14 August 2024, the Federal Court partially granted the injunctive relief request and ordered Fundação Renova to allow the review of the registration of all women who are either registered or have pending registration applications in Fundação Renova. The decision is subject to appeal. The Group has considered the additional information available from the status of the Settlement Negotiations (including all offers made by BHP Brasil, Samarco and Vale to date), updates to the estimated costs of executing the Framework Agreement Programs, the extent to which Samarco may be in a position to fund any future outflows and the judicial decision regarding collective moral damages to increase the provision related to the Samarco dam failure to US$6,505 million at 30 June 2024. The provision at 30 June 2024 reflects the Group’s best estimate of outflows required to resolve all aspects of the Federal Public Prosecution Office claim, being reparation, compensation and moral damages, and the Framework Agreement. Significant uncertainty remains around the resolution of the Federal Public Prosecution Office Claim and the Framework Agreement obligations, and there is a risk that outcomes may be materially higher or lower than amounts reflected in BHP Brasil’s provision for the Samarco dam failure. Key areas of uncertainty include the terms of any potential future outcome of the Settlement Negotiations, the extent to which Samarco is able to directly fund any future obligations relating to reparation, compensation and moral damages and the outcomes of appeals relating to the judicial decision regarding collective moral damages. Further information on the key areas of estimation uncertainty is provided in the ‘Key judgements and estimates’ section below. BHP Brasil, Samarco and Vale continue to maintain security, as required by a Governance Agreement, ratified on 8 August 2018, with the security currently comprising insurance bonds and a charge over certain Samarco assets. | ||||
Australian class action complaint | X | ✔ | ||
BHP Group Limited is named as a defendant in a shareholder class action filed in the Federal Court of Australia on behalf of persons who acquired shares in BHP Group Limited or BHP Group Plc (now BHP Group (UK) Ltd) in periods prior to the Samarco dam failure. The amount of damages sought is unspecified.A trial is scheduled to commence in September 2025. | ||||
Item | Provision | Contingent liability | ||
United Kingdom group action complaint and Vale and Samarco’s Netherlands collective action complaint | X | ✔ | ||
BHP Group (UK) Ltd (formerly BHP Group Plc) and BHP Group Limited (BHP Defendants) are named as defendants in group action claims for damages filed in the courts of England. These claims were filed on behalf of certain individuals, municipalities, businesses, faith-based institutions and communities in Brazil allegedly impacted by the Samarco dam failure. The amount of damages sought in these claims is unspecified. A trial in relation to the BHP Defendants’ liability for the dam failure is listed to commence in October 2024 and therefore a present obligation in relation to this matter is yet to be determined. In December 2022, the BHP Defendants filed their defence and a contribution claim against Vale. The contribution claim contended that if the BHP Defendants’ defence is not successful and the BHP Defendants are ordered to pay damages to the claimants, Vale should contribute to any amount payable. Vale contested the jurisdiction of the English courts to determine the contribution claim, with those challenges ultimately dismissed in December 2023. In January 2024, the BHP Defendants were served with a new group action filed in the courts of England on behalf of additional individuals and businesses in Brazil allegedly impacted by the Samarco dam failure. The new action makes broadly the same claims as the original action and the amount of damages sought in these claims is unspecified. In March 2024, a collective action complaint was filed in the Netherlands against Vale and a Dutch subsidiary of Samarco for compensation relating to the Fundão Dam failure. The claim filed in the Netherlands indicates that these claims were filed on behalf of certain individuals, municipalities, businesses, associations and faith-based institutions allegedly impacted by the Samarco dam failure who are not also claimants in the UK group action claims referred to above. BHP is not a defendant in the Netherlands proceedings. In July 2024, the BHP Defendants, BHP Brasil and Vale entered into an agreement – without any admission of liability in any proceedings – whereby: (i) Vale will pay 50% of any amounts that may be payable by the BHP Defendants to the claimants in the UK group action claims (or by the BHP Defendants, BHP Brasil or their related parties to claimants in any other proceedings in Brazil, England or the Netherlands covered by the agreement); and (ii) BHP Brasil will pay 50% of any amounts that may be payable by Vale to the claimants in the Netherlands proceedings (or by Vale or its related parties to claimants in any other proceedings in Brazil, England or the Netherlands covered by the agreement). The agreement reinforces the terms of the Framework Agreement entered into in 2016 which require BHP Brasil and Vale to each contribute 50% to the funding of the Renova Foundation for compensation of persons impacted by the Fundão Dam failure where Samarco is unable to contribute that funding. The BHP Defendants withdrew the contribution claim against Vale in England as it is no longer necessary given this agreement. | ||||
Criminal charges | X | ✔ | ||
The Federal Prosecutors’ Office has filed criminal charges against BHP Brasil, Samarco and Vale and certain employees and former employees of BHP Brasil (Affected Individuals) in the Federal Court of Ponte Nova, Minas Gerais. BHP Brasil rejects outright the charges against the company and the Affected Individuals and is defending itself from all charges while fully supporting each of the Affected Individuals in their defence of the charges. | ||||
Civil public action commenced by Associations concerning the use of TANFLOC for water treatment | X | ✔ | ||
The Vila Lenira Residents Association, State of Espirito Santo Rural Producers and Artisans Association, Colatina Velha Neighbourhood Residents Association, and United for the Progress of Palmeiras Neighbourhood Association have filed a lawsuit against Samarco, BHP Brasil and Vale and others, including the State of Minas Gerais, the State of Espirito Santo and the Federal Government. The plaintiffs allege that the defendants carried out a clandestine study on the citizens of the locations affected by the Fundão Dam Failure, using TANFLOC – a tannin-based flocculant/coagulant – that is currently used for wastewater treatment applications. The plaintiffs claim that this product allegedly put the population at risk due to its alleged experimental qualities. The plaintiffs are seeking multiple kinds of relief – material damages, moral damages, loss of profits – and that the defendants should pay for water supply in all locations where there is no water source other than the Doce River. On 17 November 2023, the Federal Court dismissed the lawsuit without prejudice considering the Association’s lack of standing to sue and the defectiveness of the complaint. The Associations filed a motion for clarification and the decision is still subject to appeal. | ||||
Other claims | X | ✔ | ||
BHP Brasil is among the companies named as defendants in a number of legal proceedings initiated by individuals, non-governmental organisations, corporations and governmental entities in Brazilian Federal and State courts following the Samarco dam failure. The other defendants include Vale, Samarco and Fundação Renova.The lawsuits include claims for compensation, environmental reparation and violations of Brazilian environmental and other laws, among other matters. The lawsuits seek various remedies including reparation costs, compensation to injured individuals and families of the deceased, recovery of personal and property losses, moral damages and injunctive relief. Certain of these legal proceedings are outside the scope of the negotiations currently in progress aimed at resolving all aspects of the Federal Public Prosecution Office BRL$155 billion claim and Framework Agreement obligations. In addition, government inquiries, studies and investigations relating to the Samarco dam failure have been commenced by numerous agencies and individuals of the Brazilian government and are ongoing. Additional lawsuits and government investigations relating to the Samarco dam failure could be brought against BHP Brasil and other Group entities in Brazil or other jurisdictions. The outcomes of these claims, investigations and proceedings remain uncertain and continue to be disclosed as contingent liabilities. | ||||
| • | the terms of any potential future settlement agreement seeking a definitive and substantive settlement of claims relating to the Samarco dam failure, including amounts payable, obligations of the parties to perform ongoing Programs of work in relation to reparation and compensation, and the period of time over which any settlement amounts may be payable. A one year increase or decrease, in isolation, to the period over which amounts payable have been estimated to be settled would result in a change to the dam failure provision of approximately US$125 million; |
| • | the scope and cost of executing the Programs under the Framework Agreement, including as a result of ongoing legal actions in relation to the number of people eligible for compensation and the amount of damages to which they are entitled; |
| • | the outcomes of appeals relating to the judicial decision regarding collective moral damages, including any appeals that may be lodged by the Brazilian Federal Public Prosecution Office; and |
| • | the extent to which Samarco is able to directly fund any future obligations relating to reparation, compensation or moral damages. Samarco’s long-term cash flow generation remains highly sensitive to factors including its ability to return to full production capacity, commodity prices and foreign exchange rates. |
| The following section provides disclosure of matters to which Samarco (and not the Group) is a party. |
Samarco |
Dam failure related provision and contingencies |
In addition to its provisions in relation to the Framework Agreementand the Federal Public Prosecution Office claim as at 30 June 2024, Samarco has recognisedprovisions of US$0.4 billion (30 June 2023: US$0.4 billion), based on currently available information, in relation to other dam failure related matters to which BHP Brasil is not a party . The magnitude, scope and timing of these additional costs are subject to a high degree of uncertainty and Samarco has indicated that it anticipates that it will incur future costs beyond those provided. These uncertainties are likely to continue for a significant period and changes to key assumptions could result in a material change to the amount of the provision in future reporting periods. Any such unrecognised obligations are therefore contingent liabilities and, at present, it is not practicable to estimate their magnitude or possible timing of payment. Accordingly, it is also not possible to provide a range of possible outcomes or a reliable estimate of total potential future exposures at this time. |
Samarco is also named as a defendant in a number of other legal proceedings initiated by individuals, non-governmental organisations, corporations and governmental entities in Brazilian Federal and State courts following the Samarco dam failure. The lawsuits include claims for compensation, environmental rehabilitation and violations of Brazilian environmental and other laws, among other matters. The lawsuits seek various remedies including rehabilitation costs, compensation to injured individuals and families of the deceased, recovery of personal and property losses, moral damages and injunctive relief. In addition, government inquiries and investigations relating to the Samarco dam failure have been commenced by numerous agencies of the Brazilian government and are ongoing. Given the status of proceedings it is not possible to provide a range of possible outcomes or a reliable estimate of total potential future exposures to Samarco. |
| Additional lawsuits and government investigations relating to the Samarco dam failure could be brought against Samarco. |
| Samarco has also identified a number of individually immaterial tax-related uncertainties which have been reflected, where appropriate, in the Group’s share of associate and joint venture contingent liabilities presented in note 34 ‘Contingent liabilities’. |
Samarco insurance |
Samarco has standalone insurance policies in place with Brazilian and global insurers. Insurers’ loss adjusters or claims representatives continue to investigate and assist with the claims process for matters not yet settled. As at 30 June 2024, an insurance receivable has not been recognised by Samarco in respect of ongoing matters. Samarco non-dam failure related provisions and contingent liabilities |
The following non-dam failure related matterspre-date and are unrelated to the Samarco dam failure. Samarco is currently contesting aspects of both of these matters in the Brazilian courts. Given the status of these tax matters, the timing of resolution and potential economic outflow for Samarco is uncertain. |
Brazilian Social Contribution Levy |
Samarco has received tax assessments for the alleged non-payment of Brazilian Social Contribution Levy for the calendar years 2007-2014. Based on its assessment of currently available information as at 30 June 2024, Samarco recognised gross provisions of US$0.4 billion, US$0.2 billion net of US$0.2 billion court deposits paid (30 June 2023: gross provisions of US$1.1 billion, US$0.9 billion net of US$0.2 billion court deposits paid) and disclosed contingent liabilities of US$0.2 billion (30 June 2023: US $0.2 billion). As at 30 June 2024, BHP Brasil’s 50% share of the impact of the provision recognised by Samarco is reflected in the Group’s equity accounting for Samarco. |
Brazilian corporate income tax rate |
| Samarco has received tax assessments, and disclosed contingent liabilities, for alleged incorrect calculation of Corporate Income Tax (IRPJ) in respect of the 2000-2003 and 2007-2014 income years totalling approximately US$1.0 billion (30 June 2023: US$1.1 billion). |
2024 | 2023 | 2022 | ||||||||||
US$M | US$M | US$M | ||||||||||
| Employee benefits expense: | ||||||||||||
| Wages and salaries | 4,633 | 4,539 | 4,197 | |||||||||
| Employee share awards | 112 | 97 | 109 | |||||||||
| Social security costs | 5 | 4 | 4 | |||||||||
| Pension and other post-retirement obligations | 374 | 339 | 338 | |||||||||
| Less employee benefits expense classified as exploration and evaluation expenditure | (49 | ) | (35 | ) | (30 | ) | ||||||
| Changes in inventories of finished goods and work in progress | (289 | ) | 301 | (774 | ) | |||||||
| Raw materials and consumables used | 6,536 | 6,710 | 5,991 | |||||||||
| Freight and transportation | 2,270 | 2,299 | 2,319 | |||||||||
| External services | 5,795 | 4,768 | 4,525 | |||||||||
| Third-party commodity purchases | 1,977 | 1,878 | 2,959 | |||||||||
| Net foreign exchange losses/(gains) | 23 | (197 | ) | (326 | ) | |||||||
Fair value change on derivatives 1 | 84 | 135 | (29 | ) | ||||||||
| Government royalties paid and payable | 3,571 | 3,841 | 4,014 | |||||||||
| Exploration and evaluation expenditure incurred and expensed in the current period | 399 | 294 | 199 | |||||||||
| Depreciation and amortisation expense | 5,295 | 5,061 | 5,683 | |||||||||
| Net impairments: | ||||||||||||
| Property, plant and equipment | 3,833 | 73 | 515 | |||||||||
| Goodwill and other intangible assets | 57 | 2 | – | |||||||||
| All other operating expenses | 2,124 | 1,764 | 2,677 | |||||||||
Total expenses | 36,750 | 31,873 | 32,371 | |||||||||
(Gain)/loss on disposal of subsidiaries and operations 2 | (915 | ) | (8 | ) | (840 | ) | ||||||
Dividend income 3 | (1 | ) | (19 | ) | (241 | ) | ||||||
Other income 4 | (369 | ) | (367 | ) | (317 | ) | ||||||
Total other income | (1,285 | ) | (394 | ) | (1,398 | ) | ||||||
| 1 | Fair value change on derivatives is principally related to commodity price contracts, foreign exchange contracts and embedded derivatives used in the ordinary course of business as well as derivatives used as part of the funding of dividends. |
| 2 | Mainly relates to the divestment of Blackwater and Daunia mines in FY2024 and BMC in FY2022. Refer to note 3 ‘Exceptional items’ for further information. |
| 3 | During FY2022, the Group received dividends of US$238 million from Cerrejón. On 11 January 2022, BHP completed the sale of its 33.33 per cent interest in Cerrejón to joint venture partner, Glencore plc. In accordance with the sale agreement, the final sale proceeds were adjusted for the dividends received to a final number of US$50 million. |
| 4 | Other income is generally income earned from transactions outside the course of the Group’s ordinary activities and may include certain management fees from non-controlling interests and joint arrangements, royalties and commission income. |
2024 | 2023 | 2022 | ||||||||||
US$M | US$M | US$M | ||||||||||
Total taxation expense comprises: | ||||||||||||
| Current tax expense | 7,435 | 6,690 | 10,673 | |||||||||
| Deferred tax (benefit)/expense | (988 | ) | 387 | 64 | ||||||||
Total taxation expense | 6,447 | 7,077 | 10,737 | |||||||||
2024 | 2023 | 2022 | ||||||||||
US$M | US$M | US$M | ||||||||||
Factors affecting income tax expense for the year | ||||||||||||
| Income tax expense differs to the standard rate of corporation tax as follows: | ||||||||||||
| Profit before taxation | 16,048 | 21,401 | 33,137 | |||||||||
| Tax on profit at Australian prima facie tax rate of 30 per cent | 4,814 | 6,420 | 9,941 | |||||||||
Tax effect of (loss)/profit from equity accounted investments, related impairments and expenses 1 | 737 | (37 | ) | (19 | ) | |||||||
Derecognition of deferred tax assets and current year tax losses 2 | 666 | 526 | 1,087 | |||||||||
| Tax on remitted and unremitted foreign earnings | 224 | 137 | 441 | |||||||||
| Amounts (over)/under provided in prior years | (25 | ) | (18 | ) | (80 | ) | ||||||
| Foreign exchange adjustments | (79 | ) | 94 | (233 | ) | |||||||
| Recognition of previously unrecognised tax assets | (110 | ) | (109 | ) | (3 | ) | ||||||
| Impact of tax rates applicable outside of Australia | (556 | ) | (558 | ) | (801 | ) | ||||||
| Other | 344 | 236 | 97 | |||||||||
Income tax expense | 6,015 | 6,691 | 10,430 | |||||||||
Royalty-related taxation (net of income tax benefit) 3 | 432 | 386 | 307 | |||||||||
Total taxation expense | 6,447 | 7,077 | 10,737 | |||||||||
| 1 | This item removes the prima facie tax effect on (loss)/profit from equity accounted investments, related impairments and expenses that are net of tax, with the exception of the Samarco forward exchange derivatives described in note 4 ‘Significant events – Samarco dam failure’, which are taxable. |
| 2 | Includes the tax impacts related to the exceptional impairments of US deferred tax assets in the year ended 30 June 2022 as presented in note 3 ‘Exceptional items’. |
| 3 | Includes the revaluation of deferred tax balances in the year ended 30 June 2023, following the substantive enactment of the Chilean Royalty Bill, as presented in note 3 ‘Exceptional items’. |
2024 | 2023 | 2022 | ||||||||||
US$M | US$M | US$M | ||||||||||
Income tax effect of: | ||||||||||||
Items that may be reclassified subsequently to the income statement: | ||||||||||||
| Hedges: | ||||||||||||
| (Losses)/gains taken to equity | 10 | (29 | ) | 274 | ||||||||
| Losses/(gains) transferred to the income statement | (15 | ) | 45 | (264 | ) | |||||||
| Others | – | (11 | ) | – | ||||||||
| Income tax (charge)/credit relating to items that may be reclassified subsequently to the income statement | (5 | ) | 5 | 10 | ||||||||
Items that will not be reclassified to the income statement: | ||||||||||||
Re-measurement gains/(losses) on pension and medical schemes | (13 | ) | 7 | (9 | ) | |||||||
| Income tax (charge)/credit relating to items that will not be reclassified to the income statement | (13 | ) | 7 | (9 | ) | |||||||
Total income tax (charge)/credit relating to components of other comprehensive income 1 | (18 | ) | 12 | 1 | ||||||||
| 1 | Included within total income tax relating to components of other comprehensive income is US$(18) million relating to deferred taxes and US$ nil relating to current taxes (2023: US$12 million and US$ |
Current tax | Deferred tax | Royalty-related taxation | ||
| Current tax is the expected tax on the taxable income for the year, using tax rates and laws enacted or substantively enacted at the reporting date, and any adjustments to tax payable in respect of previous years. | Deferred tax is the tax expected to be payable or recoverable on differences between the carrying amounts of assets and liabilities in the Financial Statements and the corresponding tax bases used in the computation of taxable profit, and is accounted for in accordance with IAS 12/AASB 112 ‘Income Taxes’ (IAS 12). Deferred tax is generally provided on temporary differences arising between the tax bases of assets and liabilities and their carrying amounts in the Financial Statements. Deferred tax assets are recognised to the extent that it is probable that future taxable profits will be available against which the temporary differences can be utilised. Deferred tax is not recognised for temporary differences relating to: • initial recognition of goodwill • initial recognition of assets or liabilities in a transaction that is not a business combination and that affects neither accounting nor taxable profit, except where the transaction gives rise to equal and offsetting taxable and deductible temporary differences • investment in subsidiaries, associates and jointly controlled entities where the Group is able to control the timing of the reversal of the temporary difference and it is probable that they will not reverse in the foreseeable future Deferred tax is measured at the tax rates that are expected to be applied when the asset is realised or the liability is settled, based on the laws that have been enacted or substantively enacted at the reporting date. Current and deferred tax assets and liabilities are offset when the Group has a legally enforceable right to offset and when the tax balances are related to taxes levied by the same tax authority and the Group intends to settle on a net basis, or realise the asset and settle the liability simultaneously. | Royalties are treated as taxation arrangements (impacting income tax expense/(benefit)) when they are imposed under government authority and the amount payable is calculated by reference to revenue derived (net of any allowable deductions) after adjustment for temporary differences. Obligations arising from royalty arrangements that do not satisfy these criteria are recognised as current liabilities and included in expenses. |
| - | determining the amount of deferred tax assets to be recognised based on the likely timing and the level of future taxable profits; |
| - | assessing whether changes in tax regimes or applicable tax rates are substantively enacted at the reporting date; |
| - | recognising deferred tax liabilities arising from temporary differences in investments. These deferred tax liabilities caused principally by retained earnings held in foreign tax jurisdictions are recognised unless repatriation of retained earnings can be controlled and is not expected to occur in the foreseeable future. |
2024 | 2023 | 2022 | ||||||||||
Earnings attributable to BHP shareholders (US$M) | ||||||||||||
| - Continuing operations | 7,897 | 12,921 | 20,245 | |||||||||
| - Total | 7,897 | 12,921 | 30,900 | |||||||||
Weighted average number of shares (Million) | ||||||||||||
| - Basic | 5,068 | 5,064 | 5,061 | |||||||||
| - Diluted | 5,077 | 5,073 | 5,071 | |||||||||
Basic earnings per ordinary share (US cents) | ||||||||||||
| - Continuing operations | 155.8 | 255.2 | 400.0 | |||||||||
| - Total | 155.8 | 255.2 | 610.6 | |||||||||
Diluted earnings per ordinary share (US cents) | ||||||||||||
| - Continuing operations | 155.5 | 254.7 | 399.2 | |||||||||
| - Total | 155.5 | 254.7 | 609.3 | |||||||||
Headline earnings per ordinary share (US cents) | ||||||||||||
| - Basic | 195.9 | 256.1 | 439.0 | |||||||||
| - Diluted | 195.6 | 255.7 | 438.1 | |||||||||
2024 | 2023 | 2022 | ||||||||||
US$M | US$M | US$M | ||||||||||
Earnings attributable to BHP shareholders | 7,897 | 12,921 | 30,900 | |||||||||
Adjusted for: | ||||||||||||
| (Gain)/loss on sales of property, plant and equipment, intangibles and investments | (29 | ) | (9 | ) | (95 | ) | ||||||
| Impairments of property, plant and equipment and intangibles | 3,905 | 75 | 515 | |||||||||
| Gain on disposal of subsidiaries and operations | (915 | ) | – | (840 | ) | |||||||
| Gain on merger of Petroleum | – | – | (8,167 | ) | ||||||||
| Tax effect of above adjustments | (928 | ) | (17 | ) | (97 | ) | ||||||
| Subtotal of adjustments | 2,033 | 49 | (8,684 | ) | ||||||||
Headline earnings | 9,930 | 12,970 | 22,216 | |||||||||
Diluted headline earnings | 9,930 | 12,970 | 22,216 | |||||||||
2024 | 2023 | |||||||
US$M | US$M | |||||||
| Trade receivables | 3,687 | 3,418 | ||||||
| Other receivables | 1,652 | 1,324 | ||||||
Total | 5,339 | 4,742 | ||||||
| Comprising: | ||||||||
| Current | 5,169 | 4,594 | ||||||
Non-current | 170 | 148 | ||||||
2024 | 2023 | |||||||
US$M | US$M | |||||||
| Trade payables | 5,338 | 4,893 | ||||||
| Other payables | 1,426 | 1,407 | ||||||
Total | 6,764 | 6,300 | ||||||
| Comprising: | ||||||||
| Current | 6,719 | 6,296 | ||||||
Non-current | 45 | 4 | ||||||
2024 | 2023 | Definitions | ||||||||
US$M | US$M | |||||||||
| Raw materials and consumables | 2,305 | 2,106 | Spares, consumables and other supplies yet to be utilised in the production process or in the rendering of services. | |||||||
| Work in progress | 3,516 | 3,514 | Commodities currently in the production process that require further processing by the Group to a saleable form. | |||||||
| Finished goods | 1,218 | 1,003 | Commodities ready-for-sale | |||||||
Total 1 | 7,039 | 6,623 | ||||||||
| Comprising: | Inventories classified as non-current are not expected to be utilised or sold within 12 months after the reporting date or within the operating cycle of the business. | |||||||||
| Current | 5,828 | 5,220 | ||||||||
Non-current | 1,211 | 1,403 | ||||||||
| 1 | Inventory write-downs of US$69 million were recognised during the year (2023: US$100 million; 2022: US$163 million). Inventory write-downs of US$19 million made in previous periods were reversed during the year (2023: US$37 million; 2022: US$23 million). |
Land and buildings | Plant and equipment | Other mineral assets | Assets under construction | Exploration and evaluation | Total | |||||||||||||||||||
US$M | US$M | US$M | US$M | US$M | US$M | |||||||||||||||||||
Net book value – 30 June 2024 | ||||||||||||||||||||||||
| At the beginning of the financial year | 8,140 | 36,654 | 13,304 | 13,481 | 239 | 71,818 | ||||||||||||||||||
Additions 1 | 27 | 1,206 | 795 | 8,840 | 58 | 10,926 | ||||||||||||||||||
Remeasurements of index-linked freight contracts 2 | – | 230 | – | – | – | 230 | ||||||||||||||||||
| Depreciation for the year | (637 | ) | (4,287 | ) | (264 | ) | – | – | (5,188 | ) | ||||||||||||||
Impairments for the year 3 | (88 | ) | (1,440 | ) | (930 | ) | (1,365 | ) | (10 | ) | (3,833 | ) | ||||||||||||
| Disposals | (1 | ) | (15 | ) | – | – | – | (16 | ) | |||||||||||||||
Divestment of subsidiaries and operations 4 | (293 | ) | (1,093 | ) | (23 | ) | (44 | ) | – | (1,453 | ) | |||||||||||||
| Transfers and other movements | 417 | 3,249 | (655 | ) | (3,815 | ) | (51 | ) | (855 | ) | ||||||||||||||
At the end of the financial year 5 | 7,565 | 34,504 | 12,227 | 17,097 | 236 | 71,629 | ||||||||||||||||||
| – Cost | 15,180 | 86,989 | 19,900 | 19,106 | 1,035 | 142,210 | ||||||||||||||||||
| – Accumulated depreciation and impairments | (7,615 | ) | (52,485 | ) | (7,673 | ) | (2,009 | ) | (799 | ) | (70,581 | ) | ||||||||||||
| Net book value – 30 June 2023 | ||||||||||||||||||||||||
| At the beginning of the financial year | 8,079 | 35,500 | 8,494 | 9,031 | 191 | 61,295 | ||||||||||||||||||
Additions 1 | 194 | 1,024 | 842 | 6,332 | 56 | 8,448 | ||||||||||||||||||
Acquisition of subsidiaries and operations 6 | 88 | 2,256 | 4,612 | 720 | – | 7,676 | ||||||||||||||||||
Remeasurements of index-linked freight contracts 2 | – | 53 | – | – | – | 53 | ||||||||||||||||||
| Depreciation for the year | (586 | ) | (4,156 | ) | (225 | ) | – | – | (4,967 | ) | ||||||||||||||
Impairments for the year 3 | – | (73 | ) | – | – | – | (73 | ) | ||||||||||||||||
| Disposals | (2 | ) | (6 | ) | – | – | – | (8 | ) | |||||||||||||||
| Transfers and other movements | 367 | 2,056 | (419 | ) | (2,602 | ) | (8 | ) | (606 | ) | ||||||||||||||
At the end of the financial year 5 | 8,140 | 36,654 | 13,304 | 13,481 | 239 | 71,818 | ||||||||||||||||||
| – Cost | 15,258 | 85,394 | 19,420 | 14,245 | 1,029 | 135,346 | ||||||||||||||||||
| – Accumulated depreciation and impairments | (7,118 | ) | (48,740 | ) | (6,116 | ) | (764 | ) | (790 | ) | (63,528 | ) | ||||||||||||
| 1 | Includes change in estimates and net foreign exchange gains/(losses) related to the closure and rehabilitation provisions for operating sites. Refer to note 15 ‘Closure and rehabilitation provisions’. |
| 2 | Relates to remeasurements of index-linked freight contracts including continuous voyage charters (CVCs). Refer to note 22 ‘Leases’. |
| 3 | Refer to note 13 ‘Impairment of non-current assets’ for information on impairments. |
| 4 | Relates to the divestment of the Blackwater and Daunia mines completed on 2 April 2024. Refer to note 3 ‘Exceptional items’ for more information. |
| 5 | Includes the carrying value of the Group’s right-of-use right-of-use |
| 6 | Relates to the acquisition of OZL on 2 May 2023. Refer to note 29 ‘Business combinations’ for more information. |
| • | the exploration and evaluation activity is within an area of interest that was previously acquired as an asset acquisition or in a business combination and measured at fair value on acquisition or |
| • | the existence of a commercially viable mineral deposit has been established |
| • | capitalised exploration, evaluation and development expenditure for assets in production |
| • | mineral rights acquired |
| • | capitalised development and production stripping costs |
Production stripping activity | ||||
Benefits of stripping activity | Extraction of ore (inventory) in current period. | Improved access to future ore extraction. | ||
Period benefited | Current period | Future period(s) | ||
Recognition and measurement criteria | When the benefits of stripping activities are realised in the form of inventory produced; the associated costs are recorded in accordance with the Group’s inventory accounting policy. | When the benefits of stripping activities are improved access to future ore; production costs are capitalised when all the following criteria are met: • the production stripping activity improves access to a specific component of the ore body and it is probable that economic benefits arising from the improved access to future ore production will be realised • the component of the ore body for which access has been improved can be identified • costs associated with that component can be measured reliably | ||
Allocation of costs | Production stripping costs are allocated between the inventory produced and the production stripping asset using a life-of-component waste-to-ore life-of-component | |||
Asset recognised from stripping activity | Inventory | Other mineral assets within property, plant and equipment. | ||
Depreciation basis | Not applicable | On a component-by-component | ||
Category | Buildings | Plant and equipment | Mineral rights | Capitalised exploration, evaluation and development expenditure | ||||||||
| Typical depreciation methodology | SL | SL | UoP | UoP | ||||||||
| Depreciation rate | 25-50 years | 3-30 years | Based on the rate of depletion of reserves | Based on the rate of depletion of reserves | ||||||||
2024 | 2023 | |||||||||||||||||||||||
Goodwill | Other intangibles | Total | Goodwill | Other intangibles | Total | |||||||||||||||||||
US$M | US$M | US$M | US$M | US$M | US$M | |||||||||||||||||||
Net book value | ||||||||||||||||||||||||
| At the beginning of the financial year | 1,389 | 221 | 1,610 | 1,197 | 172 | 1,369 | ||||||||||||||||||
| Additions | – | 101 | 101 | – | 51 | 51 | ||||||||||||||||||
Acquisition of subsidiaries and operations 1 | – | – | – | 192 | – | 192 | ||||||||||||||||||
| Amortisation for the year | – | (107 | ) | (107 | ) | – | (94 | ) | (94 | ) | ||||||||||||||
Impairments for the year 2 | (50 | ) | (7 | ) | (57 | ) | – | (2 | ) | (2 | ) | |||||||||||||
| Disposals | – | (12 | ) | (12 | ) | – | (15 | ) | (15 | ) | ||||||||||||||
Divestment of subsidiaries and operations 3 | – | (45 | ) | (45 | ) | – | – | – | ||||||||||||||||
| Transfers and other movements | 2 | 226 | 228 | – | 109 | 109 | ||||||||||||||||||
At the end of the financial year | 1,341 | 377 | 1,718 | 1,389 | 221 | 1,610 | ||||||||||||||||||
| – Cost | 1,391 | 1,798 | 3,189 | 1,389 | 1,529 | 2,918 | ||||||||||||||||||
| – Accumulated amortisation and impairments | (50 | ) | (1,421 | ) | (1,471 | ) | – | (1,308 | ) | (1,308 | ) | |||||||||||||
| 1 | Relates to the acquisition of OZL on 2 May 2023. Refer to note 29 ‘Business combinations’ for more information. |
| 2 | Refer to note 13 ‘Impairment of non-current assets’ for information on impairments. |
| 3 | Relates to the divestment of the Blackwater and Daunia mines completed on 2 April 2024. Refer to note 3 ‘Exceptional items’ for more information. |
2024 | ||||||||||||||||||
Cash generating unit | Segment | Property, plant and equipment | Goodwill and other intangibles | Equity- accounted investment | Total | |||||||||||||
US$M | US$M | US$M | US$M | |||||||||||||||
| Western Australia Nickel | Group and unallocated | 3,744 | 56 | – | 3,800 | |||||||||||||
| Other | Various | 89 | 1 | – | 90 | |||||||||||||
Total impairment of non-current assets | 3,833 | 57 | – | 3,890 | ||||||||||||||
| Reversal of impairment | – | – | – | – | ||||||||||||||
Net impairment of non-current assets | 3,833 | 57 | – | 3,890 | ||||||||||||||
| 2023 | ||||||||||||||||||
Cash generating unit | Segment | Property, plant and equipment | Goodwill and other intangibles | Equity- accounted investment | Total | |||||||||||||
| US$M | US$M | US$M | US$M | |||||||||||||||
| Other | Various | 73 | 2 | – | 75 | |||||||||||||
Total impairment of non-current assets | 73 | 2 | – | 75 | ||||||||||||||
| Reversal of impairment | – | – | – | – | ||||||||||||||
Net impairment of non-current assets | 73 | 2 | – | 75 | ||||||||||||||
Cash generating unit | 2024 | 2023 | ||||||
US$M | US$M | |||||||
| Olympic Dam | – | 1,010 | ||||||
| OZ Minerals Limited provisional goodwill | – | 192 | ||||||
| Copper SA | 1,154 | – | ||||||
| Other | 187 | 187 | ||||||
Total goodwill | 1,341 | 1,389 | ||||||
| • | US$144 million to the Copper SA group of CGUs; and |
| • | US$50 million to Western Australia Nickel CGU, which was written off at 31 December 2023 as part of the impairment of Western Australia Nickel assets. |
Copper SA goodwill | ||
Impairment test conclusion | The Group performed an impairment test of the Copper SA Group of CGUs, including goodwill, as at 30 June 2024 and an impairment charge was not required. | |
How did the goodwill arise? | Goodwill of US$1,010 million and US$144 million in relation to the acquisitions of WMC Resources Ltd (2005) and OZ Minerals Ltd (2023), respectively. | |
Segment | Copper SA is part of the Copper reportable segment. | |
How were the valuations calculated? | FVLCD methodology using DCF techniques has been applied in determining the recoverable amount of Copper SA. | |
Significant assumptions and sensitivities | The valuation of Copper SA exceeded its carrying amount by approximately US$8.4 billion and is most sensitive to changes in copper commodity price, production volumes, operating costs and discount rates. It is considered that there are no reasonably possible changes in these key assumptions that would, in isolation, result in the estimated recoverable amount being equal to the carrying amount. The valuation applied a post-tax real discount rate of 7.0 per cent. Key judgements and estimates that have been applied in the FVLCD valuation are disclosed further below. | |
2024 | 2023 | 2022 | ||||||||||
US$M | US$M | US$M | ||||||||||
Net deferred tax (liability)/asset | ||||||||||||
| At the beginning of the financial year | (4,243 | ) | (3,007 | ) | (1,402 | ) | ||||||
Acquisition of subsidiaries and operations 1 | – | (867 | ) | – | ||||||||
Income tax credit/(charge) recorded in the income statement 2,3,4 | 988 | (387 | ) | (125 | ) | |||||||
| Income tax (charge)/credit recorded directly in equity | (6 | ) | 6 | (42 | ) | |||||||
Divestment of subsidiaries and operations 5 | (3 | ) | – | (1,439 | ) | |||||||
| Other movements | (1 | ) | 12 | �� | 1 | |||||||
At the end of the financial year | (3,265 | ) | (4,243 | ) | (3,007 | ) | ||||||
1 | Relates to the acquisition of OZL on 2 May 2023. Refer to note 29 ‘Business combinations’ for more information. |
| 2 | Includes US$1,125 million income tax credit in the year ended 30 June 2024 as a result of an impairment of Western Australia Nickel Assets. |
| 3 | Includes US$(283) million revaluation of deferred tax balances in the year ended 30 June 2023, following the substantive enactment of the Chilean Royalty Bill. Refer to note 3 ‘Exceptional items’ for more information. |
| 4 | Includes Discontinued operations income tax charge to the income statement in 2022 of US$(61) million. |
| 5 | Relates to the divestment of BMC and merger of Petroleum with Woodside in 2022. Refer to notes 3 ‘Exceptional items’ and 28 ‘Discontinued operations’ for more information. |
Deferred tax assets | Deferred tax liabilities | (Credited)/charged to the income statement | ||||||||||||||||||||||||||
2024 | 2023 | 2024 | 2023 | 2024 | 2023 | 2022 | ||||||||||||||||||||||
US$M | US$M | US$M | US$M | US$M | US$M | US$M | ||||||||||||||||||||||
Type of temporary difference | ||||||||||||||||||||||||||||
Depreciation 1 | (756 | ) | (629 | ) | 5,221 | 6,259 | (894 | ) | 452 | 554 | ||||||||||||||||||
| Exploration expenditure | 14 | 11 | – | (1 | ) | (2 | ) | (2 | ) | 13 | ||||||||||||||||||
| Employee benefits | 23 | 27 | (407 | ) | (425 | ) | 6 | (94 | ) | 20 | ||||||||||||||||||
| Closure and rehabilitation | 155 | 143 | (1,770 | ) | (1,753 | ) | (29 | ) | (296 | ) | 24 | |||||||||||||||||
| Resource rent tax | – | – | – | – | – | – | (129 | ) | ||||||||||||||||||||
| Other provisions | 55 | 64 | (196 | ) | (210 | ) | 23 | 4 | 49 | |||||||||||||||||||
| Deferred income | – | 14 | (23 | ) | – | (9 | ) | 37 | (31 | ) | ||||||||||||||||||
| Deferred charges | (55 | ) | (82 | ) | 522 | 644 | (148 | ) | 85 | 7 | ||||||||||||||||||
| Investments, including foreign tax credits | 274 | 225 | 411 | 370 | (6 | ) | (54 | ) | (298 | ) | ||||||||||||||||||
| Foreign exchange gains and losses | (9 | ) | (14 | ) | 80 | 190 | (115 | ) | 42 | 33 | ||||||||||||||||||
| Tax losses | 364 | 276 | (84 | ) | (214 | ) | 40 | 37 | 28 | |||||||||||||||||||
Lease liability 1 | 9 | 18 | (730 | ) | (767 | ) | 45 | (83 | ) | (10 | ) | |||||||||||||||||
| Other | (7 | ) | 3 | 308 | 206 | 101 | 259 | (135 | ) | |||||||||||||||||||
Total | 67 | 56 | 3,332 | 4,299 | (988 | ) | 387 | 125 | ||||||||||||||||||||
| 1 | Includes deferred tax associated with the recognition of right-of-use |
2024 | 2023 | |||||||
US$M | US$M | |||||||
Unrecognised deferred tax assets | ||||||||
Tax losses and tax credits 1 | 9,126 | 8,572 | ||||||
Investments in subsidiaries 2 | 1,533 | 1,661 | ||||||
Mineral rights 3 | 3,216 | 3,287 | ||||||
Other deductible temporary differences 4 | 1,978 | 1,912 | ||||||
Total unrecognised deferred tax assets | 15,853 | 15,432 | ||||||
Unrecognised deferred tax liabilities | ||||||||
Investments in subsidiaries 2 | 2,307 | 2,179 | ||||||
Total unrecognised deferred tax liabilities | 2,307 | 2,179 | ||||||
| 1 | At 30 June 2024, the Group had income and capital tax losses with a tax benefit of US$5,589 million (2023: US$5,709 million) and tax credits of US$3,537 million (2023: US$2,863 million), which are not recognised as deferred tax assets, because it is not probable that future taxable profits or capital gains will be available against which the Group can utilise the benefits. |
Year of expiry | 2024 | 2023 | ||||||
US$M | US$M | |||||||
Income tax losses | ||||||||
| Not later than one year | 28 | 22 | ||||||
| Later than one year and not later than two years | 10 | 5 | ||||||
| Later than two years and not later than five years | 43 | 47 | ||||||
| Later than five years and not later than 10 years | 652 | 549 | ||||||
| Later than 10 years and not later than 20 years | 1,003 | 1,317 | ||||||
| Unlimited | 5,620 | 4,889 | ||||||
7,356 | 6,829 | |||||||
Capital tax losses | ||||||||
| Not later than one year | – | – | ||||||
| Later than two years and not later than five years | – | – | ||||||
| Unlimited | 13,494 | 13,870 | ||||||
Gross amount of tax losses not recognised | 20,850 | 20,699 | ||||||
Tax effect of total losses not recognised | 5,589 | 5,709 | ||||||
| Of the US$3,537 million of tax credits, US$2,792 million expires not later than 10 years (2023: US$2,405 million) and US$745 million expires later than 10 years and not later than 20 years (2023: US$458 million). |
| 2 | The Group has deferred tax assets and deferred tax liabilities associated with undistributed earnings of subsidiaries that have not been recognised because the Group is able to control the timing of the reversal of the temporary differences and it is not probable that these differences will reverse in the foreseeable future. Where the Group has undistributed earnings held by associates and joint interests, the deferred tax liability will be recognised as there is no ability to control the timing of the potential distributions. |
| 3 | The Group has deductible temporary differences relating to mineral rights for which deferred tax assets have not been recognised because it is not probable that future capital gains will be available against which the Group can utilise the benefits. The deductible temporary differences do not expire under current tax legislation. |
| 4 | The Group has other deductible temporary differences for which deferred tax assets have not been recognised because it is not probable that future taxable profits will be available against which the Group can utilise the benefits. The deductible temporary differences do not expire under current tax legislation. |
2024 | 2023 | |||||||
US$M | US$M | |||||||
| At the beginning of the financial year | 9,887 | 8,689 | ||||||
| Capitalised amounts for operating sites: | ||||||||
| Change in estimate | 463 | 510 | ||||||
| Exchange translation | (58 | ) | (50 | ) | ||||
| Adjustments charged/(credited) to the income statement: | ||||||||
| Change in estimate | 85 | 12 | ||||||
| Exchange translation | (47 | ) | (8 | ) | ||||
| Other adjustments to the provision: | ||||||||
| Amortisation of discounting impacting net finance costs | 556 | 839 | ||||||
Acquisition of subsidiaries and operations 1 | – | 168 | ||||||
Divestment of subsidiaries and operations 2 | (652 | ) | – | |||||
| Expenditure on closure and rehabilitation activities | (395 | ) | (273 | ) | ||||
| Other movements | (2 | ) | – | |||||
At the end of the financial year | 9,837 | 9,887 | ||||||
| Comprising: | ||||||||
| Current | 610 | 520 | ||||||
Non-current | 9,227 | 9,367 | ||||||
| Operating sites | 6,349 | 7,366 | ||||||
| Closed sites | 3,488 | 2,521 | ||||||
| 1 | Relates to the acquisition of OZL on 2 May 2023. Refer to note 29 ‘Business combinations’ for more information. |
| 2 | Relates to the divestment of the Blackwater and Daunia mines completed on 2 April 2024. Refer to note 3 ‘Exceptional items’ for more information. |
Proportion of the Group’s undiscounted forecast cashflows | 2024 % | 2023 % | ||||||
| In one year or less | 3 | 3 | ||||||
| In more than one year but not more than two years | 3 | 4 | ||||||
| In more than two years but not more than five years | 8 | 8 | ||||||
| In more than five years but not more than ten years | 15 | 14 | ||||||
| In more than ten years | 71 | 71 | ||||||
Total | 100 | 100 | ||||||
| • | the removal of all unwanted infrastructure associated with an operation |
| • | the return of disturbed areas to a safe, stable and self-sustaining condition, consistent with the agreed post-closure land use |
| • | it has a present legal or constructive obligation as a result of past events |
| • | it is more likely than not that an outflow of resources will be required to settle the obligation |
| • | the amount can be reliably estimated |
Initial recognition and measurement | Subsequent measurement | |
Closure and rehabilitation provisions are initially recognised when an environmental disturbance first occurs. The individual site provisions are an estimate of the expected value of future cash flows required to close the relevant site using current standards and techniques and taking into account risks and uncertainties. Individual site provisions are discounted to their present value using currency specific discount rates aligned to the estimated timing of cash outflows. When provisions for closure and rehabilitation are initially recognised, the corresponding cost is capitalised as an asset, representing part of the cost of acquiring the future economic benefits of the operation. | The closure and rehabilitation asset, recognised within property, plant and equipment, is depreciated over the life of the operations. The value of the provision is progressively increased over time as the effect of discounting unwinds, resulting in an expense recognised in net finance costs. The closure and rehabilitation provision is reviewed at each reporting date to assess if the estimate continues to reflect the best estimate of the obligation. If necessary, the provision is remeasured to account for factors such as: • additional disturbance during the period • revisions to estimated reserves, resources and lives of operations including any changes to expected operating lives arising from the Group’s latest assessment of the potential impacts of climate change and the transition to a low-carbon economy• developments in technology • changes to regulatory requirements and environmental management strategies • changes in the estimated extent and costs of anticipated activities, including the effects of inflation and movements in foreign exchange rates • movements in interest rates affecting the discount rate applied Changes to the closure and rehabilitation estimate for operating sites are added to, or deducted from, the related asset and amortised on a prospective basis over the remaining life of the operation, generally applying the units of production method. Costs arising from unforeseen circumstances, such as the contamination caused by unplanned discharges, are recognised as an expense and liability when the event gives rise to an obligation that is probable and capable of reliable estimation. |
| • | the extent (due to legal or constructive obligations) of potential activities required for the removal of infrastructure, decharacterisation of tailings storage facilities and rehabilitation activities |
| • | costs associated with future closure activities |
| • | the extent and period of post-closure monitoring and maintenance, including water management |
| • | applicable discount rates |
| • | the timing of cash flows and ultimate closure of operations |
| • | building a portfolio to support the megatrends shaping our world, including future-facing commodities (copper, nickel and potash) and steelmaking materials (iron ore and steelmaking coal) |
| • | reducing operational (Scopes 1 and 2 from operated assets) greenhouse gas (GHG) emissions |
| • | investing in low to zero GHG emissions technologies |
| • | supporting Scope 3 GHG emissions reductions in the Group’s value chain and promoting product stewardship |
| • | managing climate-related risks |
| • | working with others to enhance the global policy and market response |
Phase | Areas of potential Financial Statement impact | |
Exploration and acquisition | • Financial impact of portfolio decisions | |
Development and mining / Process and logistics | • Impact of transition risks on asset carrying values • Physical climate-related risks and asset carrying values • Application of carbon pricing assumptions and acquisition of carbon credits • Useful economic lives of property, plant and equipment • Expenditure on operational (Scopes 1 and 2 from operated assets) decarbonisation | |
Sales, marketing and procurement | • Expenditure to support value chain (Scope 3) decarbonisation | |
Closure and rehabilitation | • Timing, scope and expected cost of closure and rehabilitation activities |
| • | sanctioning of the Jansen Stage 2 potash investment (following approval of Jansen Stage 1 in FY2022) |
| • | further consolidation of the Group’s steelmaking coal portfolio to concentrate on the higher-quality (grade) coals (which enable steelmakers to be more efficient and operate with a lower GHG emissions intensity) through the divestment of Blackwater and Daunia mines from the BHP Mitsubishi Alliance (BMA) (following the divestment of the Group’s interest in BHP Mitsui Coal in FY2022) |
| • | completed the acquisition of OZ Minerals in FY2023 to support the creation of a South Australia copper basin |
| • | completed the divestment of the Group’s Petroleum business through its merger with Woodside in FY2022 |
| • | divested the Group’s interest in the Cerrejón non-operated energy coal joint venture in FY2022 |
US$ real (July 2024) per tCO 2 -e | FY2030 Low | FY2030 High | FY2050 Low | FY2050 High | ||||||||||||
| Australia | 28 | 83 | 166 | 248 | ||||||||||||
| Brazil | 6 | 55 | 138 | 221 | ||||||||||||
| Chile | 9 | 44 | 166 | 248 | ||||||||||||
| Canada | 71 | 110 | 221 | 248 | ||||||||||||
Key customer countries 1 | 1 | 193 | 28 | 276 | ||||||||||||
1 | Maximum low and high values found across China, India, European Union, United States, Japan, Korea, Indonesia, South Africa, Other Latin and Central America and Other Asia. |
| • | Inventory – where the intended use is uncertain or the carbon credit is available for trading purposes (either separately or ‘bundled’ with sale of a commodity); or |
| • | Intangible asset – held for regulatory or voluntary surrender |
| • | Approximately US$23 million in carbon credits within intangible assets (with no carbon credits classified as inventory). |
| • | A n obligation of US$17 million, representing the FY2024 requirement to surrender eligible carbon credits under the Safeguard Mechanism. The Group intends to satisfy this liability through the surrender of carbon credits in FY2025. |
• | US$44 million of lease liabilities, with associated right of use assets (2023: US$ nil ) |
• | financial derivatives with a fair value of approximately US$92 million (2023: US$ 50 million) |
• | Acknowledging the wide range of potential energy transition impacts for steelmaking coal demand and the impact of any significant changes in demand on mine lives, for illustrative purposes only, a one-year change in the mine life of the Group’s steelmaking coal assets would, in isolation, change the closure and rehabilitation provisions for those assets by approximately US$40 million. |
• | The Group announced in FY2022 the planned closure of NSWEC by FY2030. As such, while the provision is subject to estimation and assumptions, the timing of closure is no longer considered materially susceptible to potential long-term climate-related transition risks. |
Price source | CY2030 Price (real, US$/tonne) | CY2050 Price (real, US$/tonne) | ||||||
| Wood Mackenzie Net Zero (1.5°C) Scenario (June 2024) | 180 | 143 | ||||||
BHP Group Limited | BHP Group Plc | |||||||||||||||
2024 shares | 2023 shares | 2022 shares | 2022 shares | |||||||||||||
Share capital issued | ||||||||||||||||
| Opening number of shares | 5,065,820,556 | 5,062,323,190 | 2,945,851,394 | 2,112,071,796 | ||||||||||||
| Issue of shares | 5,710,261 | 3,497,366 | 4,400,000 | – | ||||||||||||
Corporate structure unification 1 | – | – | 2,112,071,796 | (2,112,071,796 | ) | |||||||||||
| Purchase of shares by ESOP Trusts | (5,687,667 | ) | (6,442,571 | ) | (8,704,669 | ) | (63,567 | ) | ||||||||
| Employee share awards exercised following vesting | 5,841,767 | 6,081,843 | 8,522,684 | 77,748 | ||||||||||||
| Movement in treasury shares under Employee Share Plans | (154,100 | ) | 360,728 | 181,985 | (14,181 | ) | ||||||||||
Closing number of shares | 5,071,530,817 | 5,065,820,556 | 5,062,323,190 | – | ||||||||||||
| Comprising: | ||||||||||||||||
| Shares held by the public | 5,070,273,143 | 5,064,408,782 | 5,061,272,144 | – | ||||||||||||
| Treasury shares | 1,257,674 | 1,411,774 | 1,051,046 | – | ||||||||||||
| 1 | As a result of the corporate structure unification on 31 January 2022, 2,112,071,796 fully paid ordinary shares in BHP Group Limited were issued to BHP Group Plc shareholders in a one for one exchange of their BHP Group Plc ordinary shares, resulting in BHP Group Limited becoming the sole parent company of the Group with a single set of shareholders. |
Ordinary shares fully paid | Treasury shares | |
| Each fully paid ordinary share of BHP Group Limited carries the right to one vote at a meeting of the Company. | Treasury shares are fully paid ordinary shares of BHP Group Limited that are held by the ESOP Trusts for the purpose of issuing shares to employees under the Group’s Employee Share Plans. Treasury shares are recognised at cost and deducted from equity, net of any income tax effects. When the treasury shares are subsequently sold or reissued, any consideration received, net of any directly attributable costs and income tax effects, is recognised as an increase in equity. Any difference between the carrying amount and the consideration, if reissued, is recognised in retained earnings. |
2024 | 2023 | 2022 | Recognition and measurement | |||||||||||
US$M | US$M | US$M | ||||||||||||
| Common control reserve | (1,603 | ) | (1,603 | ) | (1,603 | ) | The common control reserve arose on unification of the Group’s corporate structure and represents the residual on consolidation between BHP Group Ltd’s investment in BHP Group Plc (now known as BHP Group (UK) Ltd) and BHP Group Plc’s share capital, share premium and capital redemption reserve at the time of unification. | |||||||
| Employee share awards reserve | 166 | 171 | 174 | The employee share awards reserve represents the accrued employee entitlements to share awards that have been charged to the income statement and have not yet been exercised. Once exercised, the difference between the accumulated fair value of the awards and their historical on-market purchase price is recognised in retained earnings. | ||||||||||
| Cash flow hedge reserve | 27 | 10 | 41 | The cash flow hedge reserve represents hedging gains and losses recognised on the effective portion of cash flow hedges. The cumulative deferred gain or loss on the hedge is recognised in the income statement when the hedged transaction impacts the income statement, or is recognised as an adjustment to the cost of non-financial hedged items. The hedging reserve records the portion of the gain or loss on a hedging instrument in a cash flow hedge that is determined to be an effective hedge relationship. | ||||||||||
| Cost of hedging reserve | (7 | ) | (1 | ) | (19 | ) | The cost of hedging reserve represents the recognition of certain costs of hedging for example, basis adjustments, which have been excluded from the hedging relationship and deferred in other comprehensive income until the hedged transaction impacts the income statement. | |||||||
| Foreign currency translation reserve | (14 | ) | (14 | ) | (14 | ) | The foreign currency translation reserve represents exchange differences arising from the translation of non-US dollar functional currency operations within the Group into US dollars. | |||||||
| Equity investments reserve | (21 | ) | 9 | (8 | ) | The equity investment reserve represents the revaluation of investments in shares recognised through other comprehensive income. Where a revalued financial asset is sold, the relevant portion of the reserve is transferred to retained earnings. | ||||||||
Non-controlling interest contribution reserve | 1,437 | 1,441 | 1,441 | The non-controlling interest contribution reserve represents the excess of consideration received over the book value of net assets attributable to equity instruments when acquired bynon-controlling interests. | ||||||||||
Total reserves | (15 | ) | 13 | 12 | ||||||||||
2024 | 2023 | |||||||||||||||||||||||
US$M | Minera Escondida Limitada | Other individually immaterial subsidiaries | Total | Minera Escondida Limitada | Other individually immaterial subsidiaries | Total | ||||||||||||||||||
Group share (per cent) | 57.5 | 57.5 | ||||||||||||||||||||||
| Current assets | 3,683 | 3,144 | ||||||||||||||||||||||
Non-current assets | 12,639 | 12,160 | ||||||||||||||||||||||
| Current liabilities | (2,484 | ) | (1,598 | ) | ||||||||||||||||||||
Non-current liabilities | (4,989 | ) | (5,413 | ) | ||||||||||||||||||||
| Net assets | 8,849 | 8,293 | ||||||||||||||||||||||
Net assets attributable to NCI | 3,761 | 548 | 4,309 | 3,525 | 509 | 4,034 | ||||||||||||||||||
| Revenue | 10,013 | 8,847 | ||||||||||||||||||||||
| Profit after taxation | 2,894 | 2,365 | ||||||||||||||||||||||
| Other comprehensive income | 13 | (8 | ) | |||||||||||||||||||||
| Total comprehensive income | 2,907 | 2,357 | ||||||||||||||||||||||
Profit after taxation attributable to NCI | 1,230 | 474 | 1,704 | 1,005 | 398 | 1,403 | ||||||||||||||||||
Other comprehensive income attributable to NCI | 6 | (2 | ) | 4 | (3 | ) | – | (3 | ) | |||||||||||||||
Net operating cash flow | 4,180 | 3,168 | ||||||||||||||||||||||
Net investing cash flow | (1,806 | ) | (1,351 | ) | ||||||||||||||||||||
Net financing cash flow | (2,415 | ) | (1,620 | ) | ||||||||||||||||||||
Dividends paid to NCI | 993 | 431 | 1,424 | 712 | 463 | 1,175 | ||||||||||||||||||
Year ended 30 June 2024 | Year ended 30 June 2023 | Year ended 30 June 2022 | ||||||||||||||||||||||
Per share | Total | Per share | Total | Per share | Total | |||||||||||||||||||
US cents | US$M | US cents | US$M | US cents | US$M | |||||||||||||||||||
Dividends paid during the period | ||||||||||||||||||||||||
| Prior year final dividend | 80 | 4,065 | 175 | 8,858 | 200 | 10,119 | ||||||||||||||||||
| Interim dividend | 72 | 3,647 | 90 | 4,562 | 150 | 7,601 | ||||||||||||||||||
152 | 7,712 | 265 | 13,420 | 350 | 17,720 | |||||||||||||||||||
2024 | 2023 | 2022 | ||||||||||
US$M | US$M | US$M | ||||||||||
| Franking credits as at 30 June | 9,165 | 7,953 | 7,007 | |||||||||
| Franking credits arising on the future payment/(refund) of taxes relating to the period | 83 | (261 | ) | 2,043 | ||||||||
Total franking credits available 1 | 9,248 | 7,692 | 9,050 | |||||||||
| 1 | The payment of the final 2024 dividend determined after 30 June 2024 will reduce the franking account balance by US$1,608 million. |
2024 | 2023 | |||||||
US$M | US$M | |||||||
| At the beginning of the financial year | 769 | 674 | ||||||
Acquisition of subsidiaries and operations 1 | – | 61 | ||||||
| Dividends determined | 7,712 | 13,420 | ||||||
| Charge/(credit) for the year: | ||||||||
| Underlying | 180 | 156 | ||||||
| Discounting | 2 | 2 | ||||||
| Exchange variations | (42 | ) | (161 | ) | ||||
| Released during the year | (120 | ) | (62 | ) | ||||
| Utilisation | (92 | ) | (35 | ) | ||||
| Dividends paid | (7,675 | ) | (13,268 | ) | ||||
| Transfers and other movements | (24 | ) | (18 | ) | ||||
At the end of the financial year | 710 | 769 | ||||||
| Comprising: | ||||||||
| Current | 220 | 384 | ||||||
Non-current | 490 | 385 | ||||||
| 1 | Relates to the acquisition of OZL on 2 May 2023. Refer to note 29 ‘Business combinations’ for more information. |
2024 | 2023 | |||||||||||||||
US$M | Current | Non-current | Current | Non-current | ||||||||||||
Interest bearing liabilities | ||||||||||||||||
| Bank loans | 540 | 2,070 | 5,310 | 2,192 | ||||||||||||
| Notes and debentures | 848 | 14,084 | 1,337 | 10,482 | ||||||||||||
| Lease liabilities | 686 | 2,430 | 521 | 2,498 | ||||||||||||
| Bank overdraft and short-term borrowings | 3 | – | 5 | – | ||||||||||||
| Other | 7 | 50 | – | – | ||||||||||||
Total interest bearing liabilities | 2,084 | 18,634 | 7,173 | 15,172 | ||||||||||||
Less: Lease liability associated with index-linked freight contracts | 267 | 244 | 114 | 173 | ||||||||||||
Less: Cash and cash equivalents | ||||||||||||||||
| Cash | 8,150 | – | 7,206 | – | ||||||||||||
| Short-term deposits | 4,351 | – | 5,222 | – | ||||||||||||
Less: Total cash and cash equivalents | 12,501 | – | 12,428 | – | ||||||||||||
Less: Derivatives included in net debt | ||||||||||||||||
Net debt management related instruments 1 | (171 | ) | (1,224 | ) | (113 | ) | (1,459 | ) | ||||||||
Net cash management related instruments 2 | (19 | ) | – | 36 | – | |||||||||||
Less: Total derivatives included in net debt | (190 | ) | (1,224 | ) | (77 | ) | (1,459 | ) | ||||||||
Net debt | 9,120 | 11,166 | ||||||||||||||
Net assets | 49,120 | 48,530 | ||||||||||||||
Gearing | 15.7 | % | 18.7 | % | ||||||||||||
| 1 | Represents the net cross currency and interest rate swaps designated as effective hedging instruments included within current and non-current other financial assets and liabilities. |
| 2 | Represents the net forward exchange contracts included within current and non-current other financial assets and liabilities. |
2024 | 2023 | 2022 | ||||||||||
US$M | US$M | US$M | ||||||||||
| Total cash and cash equivalents | 12,501 | 12,428 | 17,236 | |||||||||
| Bank overdrafts and short-term borrowings | (3 | ) | (5 | ) | – | |||||||
Total cash and cash equivalents, net of overdrafts | 12,498 | 12,423 | 17,236 | |||||||||
Interest bearing liabilities | Cash and cash equivalents | |||||||||||||||
2024 | 2023 | 2024 | 2023 | |||||||||||||
US$M | US$M | US$M | US$M | |||||||||||||
| USD | 15,203 | 16,289 | 4,445 | 5,925 | ||||||||||||
| EUR | 2,440 | 3,050 | 5 | 544 | ||||||||||||
| GBP | 1,613 | 1,587 | 711 | 674 | ||||||||||||
| AUD | 1,265 | 1,233 | 3,840 | 1,797 | ||||||||||||
| CAD | 5 | 7 | 3,259 | 3,362 | ||||||||||||
| Other | 192 | 179 | 241 | 126 | ||||||||||||
Total | 20,718 | 22,345 | 12,501 | 12,428 | ||||||||||||
2024 US$M | Bank loans, debentures and other loans | Expected future interest payments | Derivatives related to debentures | Other financial liabilities | Obligations under lease liabilities | Trade and other payables 1 | Total | |||||||||||||||||||||
Due for payment: | ||||||||||||||||||||||||||||
| In one year or less or on demand | 1,402 | 884 | 485 | 333 | 836 | 6,618 | 10,558 | |||||||||||||||||||||
| In more than one year but not more than two years | 1,362 | 827 | 171 | 67 | 591 | 15 | 3,033 | |||||||||||||||||||||
| In more than two years but not more than five years | 4,960 | 1,923 | 377 | 233 | 1,012 | 27 | 8,532 | |||||||||||||||||||||
| In more than five years | 10,999 | 4,784 | 1,131 | 163 | 1,761 | 3 | 18,841 | |||||||||||||||||||||
Total | 18,723 | 8,418 | 2,164 | 796 | 4,200 | 6,663 | 40,964 | |||||||||||||||||||||
Carrying amount | 17,602 | – | 1,513 | 758 | 3,116 | 6,663 | 29,652 | |||||||||||||||||||||
2023 US$M | Bank loans, debentures and other loans | Expected future interest payments | Derivatives related to debentures | Other financial liabilities | Obligations under lease liabilities | Trade and other payables 1 | Total | |||||||||||||||||||||
| Due for payment: | ||||||||||||||||||||||||||||
| In one year or less or on demand | 6,659 | 757 | 536 | 257 | 658 | 6,175 | 15,042 | |||||||||||||||||||||
| In more than one year but not more than two years | 1,399 | 595 | 388 | 126 | 538 | 4 | 3,050 | |||||||||||||||||||||
| In more than two years but not more than five years | 4,058 | 1,410 | 399 | 267 | 1,031 | – | 7,165 | |||||||||||||||||||||
| In more than five years | 8,093 | 3,693 | 1,020 | 211 | 1,846 | – | 14,863 | |||||||||||||||||||||
| Total | 20,209 | 6,455 | 2,343 | 861 | 4,073 | 6,179 | 40,120 | |||||||||||||||||||||
| Carrying amount | 19,326 | – | 1,755 | 804 | 3,019 | 6,179 | 31,083 | |||||||||||||||||||||
| 1 | Excludes input taxes of US$101 million (2023: US$121 million) included in other payables. |
2024 | 2023 | |||||||
US$M | US$M | |||||||
| At the beginning of the financial year | 3,019 | 2,576 | ||||||
| Additions | 593 | 542 | ||||||
Acquisition of subsidiaries and operations 1 | – | 423 | ||||||
| Remeasurements of index-linked freight contracts | 230 | 53 | ||||||
| Lease payments | (837 | ) | (706 | ) | ||||
| Foreign exchange movement | (16 | ) | 12 | |||||
| Amortisation of discounting | 181 | 130 | ||||||
Divestment of subsidiaries and operations 2 | (60 | ) | – | |||||
| Transfers and other movements | 6 | (11 | ) | |||||
At the end of the financial year | 3,116 | 3,019 | ||||||
| Comprising: | ||||||||
| Current liabilities | 686 | 521 | ||||||
Non-current liabilities | 2,430 | 2,498 | ||||||
| 1 | Relates to the acquisition of OZL on 2 May 2023. Refer to note 29 ‘Business combinations’ for more information. |
| 2 | Relates to the divestment of the Blackwater and Daunia mines completed on 2 April 2024. Refer to note 3 ‘Exceptional items’ for more information. |
Lease liability | 2024 | 2023 | ||||||
US$M | US$M | |||||||
Due for payment: | ||||||||
| In one year or less or on demand | 836 | 658 | ||||||
| In more than one year but not more than two years | 591 | 538 | ||||||
| In more than two years but not more than five years | 1,012 | 1,031 | ||||||
In more than five years 1 | 1,761 | 1,846 | ||||||
Total | 4,200 | 4,073 | ||||||
Carrying amount | 3,116 | 3,019 | ||||||
| 1 | Includes US$738 million (2023: US$808 million) due for payment in more than ten years. |
2024 | 2023 | |||||||||||||||||||||||
Land and buildings | Plant and equipment | Total | Land and buildings | Plant and equipment | Total | |||||||||||||||||||
US$M | US$M | US$M | US$M | US$M | US$M | |||||||||||||||||||
Net book value | ||||||||||||||||||||||||
| At the beginning of the financial year | 573 | 2,236 | 2,809 | 452 | 1,909 | 2,361 | ||||||||||||||||||
| Additions | 26 | 567 | 593 | 192 | 350 | 542 | ||||||||||||||||||
| Acquisition of subsidiaries and operations | – | – | – | – | 423 | 423 | ||||||||||||||||||
| Remeasurements of index-linked freight contracts | – | 230 | 230 | – | 53 | 53 | ||||||||||||||||||
| Depreciation expensed during the period | (79 | ) | (638 | ) | (717 | ) | (71 | ) | (462 | ) | (533 | ) | ||||||||||||
| Impairments for the year | – | (140 | ) | (140 | ) | – | – | – | ||||||||||||||||
Divestment of subsidiaries and operations 1 | (30 | ) | (40 | ) | (70 | ) | – | – | – | |||||||||||||||
| Transfers and other movements | – | 3 | 3 | – | (37 | ) | (37 | ) | ||||||||||||||||
At the end of the financial year | 490 | 2,218 | 2,708 | 573 | 2,236 | 2,809 | ||||||||||||||||||
| – Cost | 742 | 4,479 | 5,221 | 758 | 4,088 | 4,846 | ||||||||||||||||||
| – Accumulated depreciation and impairments | (252 | ) | (2,261 | ) | (2,513 | ) | (185 | ) | (1,852 | ) | (2,037 | ) | ||||||||||||
| 1 | Relates to the divestment of the Blackwater and Daunia mines completed on 2 April 2024. Refer to note 3 ‘Exceptional items’ for more information. |
2024 | 2023 | 2022 | Included within | |||||||||||
US$M | US$M | US$M | ||||||||||||
Income statement | ||||||||||||||
Depreciation of right-of-use | 717 | 533 | 964 | Profit from operations | ||||||||||
Short-term, low-value and variable lease costs1 | 916 | 795 | 847 | Profit from operations | ||||||||||
| Interest on lease liabilities | 181 | 130 | 119 | Financial expenses | ||||||||||
Cash flow statement | ||||||||||||||
| Principal lease payments | 656 | 576 | 1,130 | Cash flows from financing activities | ||||||||||
| Lease interest payments | 181 | 130 | 119 | Cash flows from operating activities | ||||||||||
| 1 | Relates to US$792 million of variable lease costs (2023: US$714 million; 2022: US$585 million), US$96 million of short-term lease costs (2023: US$47 million; 2022: US$222 million) and US$28 million of low-value lease costs (2023: US$34 million; 2022: US$40 million). Variable lease costs include contracts for hire of mining service equipment, drill rigs and transportation services. These contracts contain variable lease payments based on usage and asset performance. |
Key judgements and estimates Judgements: |
Where a contract includes the provision of non-lease services, judgement is required to identify the lease andnon-lease components. |
Estimates: right-of-use |
The Group estimates stand-alone prices, where such prices are not readily observable, in order to allocate the contractual payments between lease and non-lease components. |
2024 | 2023 | 2022 | ||||||||||
US$M | US$M | US$M | ||||||||||
Financial expenses | ||||||||||||
Interest expense using the effective interest rate method: | ||||||||||||
| Interest on bank loans, overdrafts and all other borrowings | 1,467 | 997 | 491 | |||||||||
Interest capitalised at 6.82% (2023: 5.71%; 2022: 2.90%) 1 | (530 | ) | (271 | ) | (113 | ) | ||||||
| Interest on lease liabilities | 181 | 130 | 119 | |||||||||
| Discounting on provisions and other liabilities | 1,064 | 1,293 | 645 | |||||||||
Other gains and losses: | ||||||||||||
| Fair value change on hedged loans | (214 | ) | (803 | ) | (1,286 | ) | ||||||
| Fair value change on hedging derivatives | 188 | 691 | 1,277 | |||||||||
| Exchange variations on net debt | 27 | 9 | (99 | ) | ||||||||
| Other | 15 | 14 | 16 | |||||||||
Total financial expenses | 2,198 | 2,060 | 1,050 | |||||||||
Financial income | ||||||||||||
| Interest income | (709 | ) | (529 | ) | (81 | ) | ||||||
Net finance costs | 1,489 | 1,531 | 969 | |||||||||
| 1 | Interest has been capitalised at the rate of interest applicable to the specific borrowings financing the assets under construction or, where financed through general borrowings, at a capitalisation rate representing the average interest rate on such borrowings. Tax relief for capitalised interest is approximately US$159 million (2023: US$81 million; 2022: US$34 million). |
Activity | Key risk management processes | |
1 Risk mitigation On an exception basis, hedging for the purposes of mitigating risk related to specific and significant expenditure on investments or capital projects will be executed if necessary to support the Group’s strategic objectives. | Execution of transactions within approved mandates. | |
2 Economic hedging of commodity sales, operating costs, short-term cash deposits, other monetary items and debt instruments | ||
| Where Group commodity production is sold to customers on pricing terms that deviate from the relevant index target and where a relevant derivatives market exists, financial instruments may be executed as an economic hedge to align the revenue price exposure with the index target and US dollars. | Measuring and reporting the exposure in customer commodity contracts and issued debt instruments. | |
| Where debt is issued in a currency other than the US dollar and/or at a fixed interest rate, fair value and cash flow hedges may be executed to align the debt exposure with the Group’s functional currency of US dollars and/or to swap to a floating interest rate. | Executing hedging derivatives to align the total group exposure to the index target. | |
| Where short-term cash deposits and other monetary items are denominated in a currency other than US dollars, derivative financial instruments may be executed to align the foreign exchange exposure to the Group’s functional currency of US dollars. | Execution of transactions within approved mandates. | |
3 Strategic financial transactions | ||
| Opportunistic transactions may be executed with financial instruments to capture value from perceived market over/under valuations. | Execution of transactions within approved mandates. | |
| • | translational exposure in respect of non-functional currency monetary items |
| • | transactional exposure in respect of non-functional currency expenditure and revenues |
Net financial (liabilities)/assets - by currency of denomination | 2024 | 2023 | ||||||
US$M | US$M | |||||||
| AUD | (3,850 | ) | (4,168 | ) | ||||
| CAD | (543 | ) | (312 | ) | ||||
| CLP | (150 | ) | (74 | ) | ||||
| GBP | 323 | 353 | ||||||
| EUR | 239 | 217 | ||||||
| Other | 43 | 355 | ||||||
Total | (3,938 | ) | (3,629 | ) | ||||
| • | the Group’s purpose, or business model, for holding the financial asset |
| • | whether the financial asset’s contractual terms give rise to cash flows that are solely payments of principal and interest |
Contractual cash flows | Business model | Category | ||
| Solely principal and interest | Hold in order to collect contractual cash flows | Amortised cost | ||
| Solely principal and interest | Hold in order to collect contractual cash flows and sell | Fair value through other comprehensive income | ||
| Solely principal and interest | Hold in order to sell | Fair value through profit or loss | ||
| Other | Any of those mentioned above | Fair value through profit or loss | ||
IFRS 13 Fair value hierarchy | Level 1 | Level 2 | Level 3 | |||
| Valuation inputs | Based on quoted prices (unadjusted) in active markets for identical financial assets and liabilities. | Based on inputs other than quoted prices included within Level 1 that are observable for the financial asset or liability, either directly (i.e. as unquoted prices) or indirectly (i.e. derived from prices). | Based on inputs not observable in the market using appropriate valuation models, including discounted cash flow modelling. |
IFRS 13 Fair value hierarchy Level 1 | IFRS 9 Classification | 2024 US$M | 2023 US$M | |||||||||
Current cross currency and interest rate swaps 2 | 2 | Fair value through profit or loss | 5 | 34 | ||||||||
Current other derivative contracts 3 | 2,3 | Fair value through profit or loss | 118 | 407 | ||||||||
Current other financial assets 4 | Amortised cost | 234 | – | |||||||||
Current other investments 5 | 1,2 | Fair value through profit or loss | 24 | 29 | ||||||||
Non-current cross currency and interest rate swaps2 | 2 | Fair value through profit or loss | 113 | 149 | ||||||||
Non-current other derivative contracts3 | 2,3 | Fair value through profit or loss | 103 | 228 | ||||||||
Non-current other financial assets6 | 3 | Fair value through profit or loss | 195 | 246 | ||||||||
Non-current other financial assets4,7 | Amortised cost | 398 | – | |||||||||
Non-current investment in shares | 1,3 | Fair value through other comprehensive income | 201 | 224 | ||||||||
Non-current other investments5 | 1,2 | Fair value through profit or loss | 219 | 268 | ||||||||
| Total other financial assets | 1,610 | 1,585 | ||||||||||
| Cash and cash equivalents | Amortised cost | 12,501 | 12,428 | |||||||||
Trade and other receivables 8 | Amortised cost | 1,597 | 1,506 | |||||||||
| Provisionally priced trade receivables | 2 | Fair value through profit or loss | 3,250 | 2,705 | ||||||||
Total financial assets | 18,958 | 18,224 | ||||||||||
Non-financial assets | 83,404 | 83,072 | ||||||||||
| Total assets | 102,362 | 101,296 | ||||||||||
Current cross currency and interest rate swaps 2 | 2 | Fair value through profit or loss | 176 | 147 | ||||||||
| Current other derivative contracts | 2 | Fair value through profit or loss | 241 | 176 | ||||||||
Current other financial liabilities 9 | Amortised cost | 95 | 79 | |||||||||
Non-current cross currency and interest rate swaps2 | 2 | Fair value through profit or loss | 1,337 | 1,608 | ||||||||
Non-current other derivative contracts3 | 2,3 | Fair value through profit or loss | 54 | 82 | ||||||||
Non-current other financial liabilities9 | Amortised cost | 368 | 467 | |||||||||
| Total other financial liabilities | 2,271 | 2,559 | ||||||||||
Trade and other payables 10 | Amortised cost | 6,049 | 5,338 | |||||||||
| Provisionally priced trade payables | 2 | Fair value through profit or loss | 614 | 841 | ||||||||
Bank overdrafts and short-term borrowings 11 | Amortised cost | 3 | 5 | |||||||||
Bank loans 11 | Amortised cost | 2,610 | 7,502 | |||||||||
Notes and debentures 11 | Amortised cost | 14,932 | 11,819 | |||||||||
Lease liabilities 12 | 3,116 | 3,019 | ||||||||||
Other 11 | Amortised cost | 57 | – | |||||||||
Total financial liabilities | 29,652 | 31,083 | ||||||||||
Non-financial liabilities | 23,590 | 21,683 | ||||||||||
| Total liabilities | 53,242 | 52,766 | ||||||||||
| 1 | All of the Group’s financial assets and financial liabilities recognised at fair value were valued using market observable inputs categorised as Level 2 unless specified otherwise in the following footnotes. |
| 2 | Cross currency and interest rate swaps are valued using market data including interest rate curves and foreign exchange rates. A discounted cash flow approach is used to derive the fair value of cross currency and interest rate swaps at the reporting date. |
| 3 | Includes net other derivative assets of US$92 million related to power purchase contract agreements that are categorised as Level 3 (2023: US$46 million). |
| 4 | Includes deferred consideration of US$495 million in relation to the divestment of the Blackwater and Daunia mines. |
| 5 | Includes investments held by BHP Foundation which are restricted and not available for general use by the Group of US$243 million (2023: US$290 million) of which other investments (mainly US Treasury Notes) of US$134 million categorised as Level 1 (2023: US$138 million). |
| 6 | Includes receivables contingent on future realised coal price of US$195 million (2023: US$246 million receivables contingent on outcome of future events relating to mining and regulatory approvals). |
| 7 | Includes Senior notes of US$137 million relating to Samarco with a maturity date of 30 June 2031 (refer to note 4 ‘Significant events – Samarco dam failure’ for further information). |
| 8 | Excludes input taxes of US$492 million (2023: US$531 million) included in other receivables. |
| 9 | Includes the discounted settlement liability in relation to the cancellation of power contracts at the Group’s Escondida operations. |
| 10 | Excludes input taxes of US$101 million (2023: US$121 million) included in other payables. |
| 11 | All interest bearing liabilities, excluding lease liabilities, are unsecured. |
| 12 | Lease liabilities are measured in accordance with IFRS 16/AASB 16 ‘Leases’. |
| • | Fair value hedges – the fair value gain or loss on interest rate and cross currency swaps relating to interest rate risk, together with the change in the fair value of the hedged fixed rate borrowings attributable to interest rate risk are recognised immediately in the income statement. If the hedge no longer meets the criteria for hedge accounting, the fair value adjustment on the note or debenture is amortised to the income statement over the period to maturity using a recalculated effective interest rate. |
| • | Cash flow hedges – changes in the fair value of cross currency interest rate swaps which hedge foreign currency cash flows on the notes and debentures are recognised directly in other comprehensive income and accumulated in the cash flow hedging reserve. To the extent a hedge is ineffective, changes in fair value are recognised immediately in the income statement. |
| • | The carrying amount of the notes and debentures includes foreign exchange remeasurement to period-end rates and fair value adjustments when included in a fair value hedge. |
| • | The breakdown of the hedging derivatives includes remeasurement of foreign currency notional values at period-end rates, fair value movements due to interest rate risk, foreign currency cash flows designated into cash flow hedges, costs of hedging recognised in other comprehensive income, ineffectiveness recognised in the income statement and accruals or prepayments. |
| • | The hedged value of notes and debentures includes their carrying amounts adjusted for the offsetting derivative fair value movements due to foreign currency and interest rate risk remeasurement. |
Fair value of derivatives | ||||||||||||||||||||||||||||||||||||
2024 US$M | Carrying amount of notes and debentures | Foreign exchange notional at spot rates | Interest rate risk | Recognised in cash flow hedging reserve | Recognised in cost of hedging reserve | Recognised in the income statement 1 | Accrued and other cash flows | Total | Hedged value of notes and debentures 2 | |||||||||||||||||||||||||||
A | B | C | D | E | F | G | B to G | A + B + C | ||||||||||||||||||||||||||||
USD | 10,928 | – | 498 | – | – | 2 | (48 | ) | 452 | 11,426 | ||||||||||||||||||||||||||
GBP | 1,595 | 521 | 247 | (13 | ) | 3 | (69 | ) | (16 | ) | 673 | 2,363 | ||||||||||||||||||||||||
EUR | 2,409 | 367 | 259 | (27 | ) | 7 | (50 | ) | (286 | ) | 270 | 3,035 | ||||||||||||||||||||||||
Total | 14,932 | 888 | 1,004 | (40 | ) | 10 | (117 | ) | (350 | ) | 1,395 | 16,824 | ||||||||||||||||||||||||
| Fair value of derivatives | ||||||||||||||||||||||||||||||||||||
2023 US$M | Carrying amount of notes and debentures | Foreign exchange notional at spot rates | Interest rate risk | Recognised in cash flow hedging reserve | Recognised in cost of hedging reserve | Recognised in the income statement 1 | Accrued and other cash flows | Total | Hedged value of notes and debentures 2 | |||||||||||||||||||||||||||
| A | B | C | D | E | F | G | B to G | A + B + C | ||||||||||||||||||||||||||||
| USD | 7,245 | – | 214 | – | – | 32 | 23 | 269 | 7,459 | |||||||||||||||||||||||||||
| GBP | 1,566 | 522 | 274 | 24 | (9 | ) | (69 | ) | 35 | 777 | 2,362 | |||||||||||||||||||||||||
| EUR | 3,008 | 434 | 302 | (39 | ) | 10 | (49 | ) | (132 | ) | 526 | 3,744 | ||||||||||||||||||||||||
| Total | 11,819 | 956 | 790 | (15 | ) | 1 | (86 | ) | (74 | ) | 1,572 | 13,565 | ||||||||||||||||||||||||
| 1 | Predominantly related to ineffectiveness. |
| 2 | Includes US$532 million (2023: US$534 million) of fixed rate debt not swapped to floating rate that is not in a hedging relationship. |
2024 US$M | Cash flow hedging reserve | Cost of hedging reserve | Total | |||||||||||||||||||||||||
Gross | Tax | Net | Gross | Tax | Net | |||||||||||||||||||||||
| At the beginning of the financial year | 15 | (5 | ) | 10 | (1 | ) | – | (1 | ) | 9 | ||||||||||||||||||
| Add: Change in fair value of hedging instrument recognised in OCI | (24 | ) | 7 | (17 | ) | (9 | ) | 3 | (6 | ) | (23 | ) | ||||||||||||||||
| Less: Reclassified from reserves to financial expenses – recognised through OCI | 49 | (15 | ) | 34 | – | – | – | 34 | ||||||||||||||||||||
At the end of the financial year | 40 | (13 | ) | 27 | (10 | ) | 3 | (7 | ) | 20 | ||||||||||||||||||
2023 US$M | Cash flow hedging reserve | Cost of hedging reserve | Total | |||||||||||||||||||||||||
| Gross | Tax | Net | Gross | Tax | Net | |||||||||||||||||||||||
| At the beginning of the financial year | 59 | (18 | ) | 41 | (27 | ) | 8 | (19 | ) | 22 | ||||||||||||||||||
| Add: Change in fair value of hedging instrument recognised in OCI | 95 | (29 | ) | 66 | – | – | – | 66 | ||||||||||||||||||||
| Less: Reclassified from reserves to financial expenses – recognised through OCI | (174 | ) | 53 | (121 | ) | 26 | (8 | ) | 18 | (103 | ) | |||||||||||||||||
| Less: Loss/(gain) transferred to balance sheet related items | 35 | (11 | ) | 24 | – | – | – | 24 | ||||||||||||||||||||
| At the end of the financial year | 15 | (5 | ) | 10 | (1 | ) | – | (1 | ) | 9 | ||||||||||||||||||
Interest bearing liabilities | Derivatives (assets)/ liabilities | |||||||||||||||||||||||||||
2024 US$M | Bank loans | Notes and debentures | Lease liabilities | Bank overdraft and short-term borrowings | Other | Cross currency and interest rate swaps | Total | |||||||||||||||||||||
| At the beginning of the financial year | 7,502 | 11,819 | 3,019 | 5 | – | 1,572 | ||||||||||||||||||||||
| Proceeds from interest bearing liabilities | 400 | 4,691 | – | – | – | – | 5,091 | |||||||||||||||||||||
| Settlements of debt related instruments | – | – | – | – | – | (321 | ) | (321 | ) | |||||||||||||||||||
| Repayment of interest bearing liabilities | (5,319 | ) | (1,338 | ) | (656 | ) | – | (14 | ) | – | (7,327 | ) | ||||||||||||||||
| Change from Net financing cash flows | (4,919 | ) | 3,353 | (656 | ) | – | (14 | ) | (321 | ) | (2,557 | ) | ||||||||||||||||
| Other movements: | ||||||||||||||||||||||||||||
| Divestment of subsidiaries and operations | – | – | (60 | ) | – | – | – | |||||||||||||||||||||
| Interest rate impacts | – | (214 | ) | – | – | – | 188 | |||||||||||||||||||||
| Foreign exchange impacts | 24 | (35 | ) | (16 | ) | – | – | 35 | ||||||||||||||||||||
| Lease additions | – | – | 593 | – | – | – | ||||||||||||||||||||||
| Remeasurement of index-linked freight contracts | – | – | 230 | – | – | – | ||||||||||||||||||||||
| Other interest bearing liabilities/derivative related changes | 3 | 9 | 6 | (2 | ) | 71 | (79 | ) | ||||||||||||||||||||
At the end of the financial year | 2,610 | 14,932 | 3,116 | 3 | 57 | 1,395 | ||||||||||||||||||||||
| Interest bearing liabilities | Derivatives (assets)/ liabilities | |||||||||||||||||||||||||||
2023 US$M | Bank loans | Notes and debentures | Lease liabilities | Bank overdraft and short-term borrowings | Other | Cross currency and interest rate swaps | Total | |||||||||||||||||||||
At the beginning of the financial year | 2,472 | 11,363 | 2,576 | – | 17 | 1,688 | ||||||||||||||||||||||
Proceeds from interest bearing liabilities | 5,450 | 2,732 | – | – | – | – | 8,182 | |||||||||||||||||||||
Settlements of debt related instruments | – | – | – | – | – | (677 | ) | (677 | ) | |||||||||||||||||||
Repayment of interest bearing liabilities | (1,087 | ) | (1,610 | ) | (576 | ) | – | (16 | ) | – | (3,289 | ) | ||||||||||||||||
Change from Net financing cash flows | 4,363 | 1,122 | (576 | ) | – | (16 | ) | (677 | ) | 4,216 | ||||||||||||||||||
Other movements: | ||||||||||||||||||||||||||||
Acquisition of subsidiaries and operations | 688 | – | 423 | – | – | – | ||||||||||||||||||||||
Interest rate impacts | – | (803 | ) | – | – | – | 691 | |||||||||||||||||||||
Foreign exchange impacts | (23 | ) | 128 | 12 | – | – | (127 | ) | ||||||||||||||||||||
Lease additions | – | – | 542 | – | – | – | ||||||||||||||||||||||
Remeasurement of index-linked freight contracts | – | – | 53 | – | – | – | ||||||||||||||||||||||
Other interest bearing liabilities/derivative related changes | 2 | 9 | (11 | ) | 5 | (1 | ) | (3 | ) | |||||||||||||||||||
At the end of the financial year | 7,502 | 11,819 | 3,019 | 5 | – | 1,572 | ||||||||||||||||||||||
2024 | 2023 | 2022 | ||||||||||
US$ | US$ | US$ | ||||||||||
| Short-term employee benefits | 12,687,272 | 13,599,217 | 13,979,139 | |||||||||
| Post-employment benefits | 634,005 | 659,020 | 634,363 | |||||||||
| Share-based payments | 11,143,944 | 11,455,666 | 11,165,439 | |||||||||
Total | 24,465,221 | 25,713,903 | 25,778,941 | |||||||||
Plan | CDP | LTIP and MAP | Shareplus | |||
Type | Short-term incentive | Long-term incentive | All-employee share purchase plan | |||
Overview | The CDP is a plan for Executive KMP and members of the Executive Leadership Team who are not Executive KMP. Generally under the CDP, two thirds of the value of a participant’s short-term incentive amount is awarded as rights to receive BHP Group Limited shares at the end of the vesting period (and the remaining one third is delivered in cash). Two awards of deferred shares are granted, each of the equivalent value to the cash award, vesting betweentwo andfive years respectively. Awards of deferred shares may also be granted to members of the Executive Leadership Team as additional retention awards with vesting periods of up to five years. | The LTIP is a plan for Executive KMP and members of the Executive Leadership Team who are not Executive KMP, and awards are granted annually. The MAP is a plan for BHP senior management who are not Executive KMP. The number of share rights awarded is determined by a participant’s role and grade. | Employees may contribute up to US$5,000 to acquire shares in any plan year. On the third anniversary of the start of a plan year, the Group will match the number of acquired shares. | |||
Vesting conditions | Service conditions only for the two-year award. Vesting of the four-year awards are subject to service and individual performance conditions. Vesting of the five-year awards are subject to service conditions and also to a holistic review of performance at the end of the five-year vesting period, including a five-year view on Safety and Sustainability performance, profitability, cash flow, balance sheet health, returns to shareholders, corporate governance and conduct. | LTIP: Service and performance conditions. From FY2023 BHP’s Total Shareholder Return 1 (TSR) performance relative to two Morgan Stanley Capital International (MSCI) market indices, the MSCI World Metals and Mining Index (“Sector Group TSR”) and the MSCI World Index (“World TSR”). The Sector Group TSR over a five-year performance period determines the vesting of 67 per cent of the awards, while performance relative to the World TSR determines the vesting of 33 per cent of the awards. For awards granted prior to FY2023, TSR performance relative to a bespoke sector peer group and the MSCI World Index determines the vesting of 67 per cent and 33 per cent of the award, respectively.25 per cent of the award will vest where BHP’s TSR is equal to the median TSR of the relevant comparator group(s), as measured over the performance period. Where TSR is below the median, awards will not vest. Vesting occurs on a sliding scale when BHP’s TSR measured over the performance period is between the median TSR of the relevant comparator group(s) up to a nominated level of TSR outperformance over the relevant comparator group(s), as determined by the Committee, above which 100 per cent of the award will vest. MAP: Service conditions only. | Service conditions only. | |||
Vesting period | Between 2 and 5 years | LTIP – 5 yearsMAP – 1 to 5 years | 3 years | |||
Dividend Equivalent Payment | Yes | LTIP – YesMAP – Varies | No | |||
Exercise period | None | None | None | |||
| 1 | For LTIP awards granted prior to unification and where the five-year performance period ends after unification, the TSR at the start of the performance period is based on the weighted average of the TSRs of BHP Group Limited and BHP Group Plc and the TSR at the end of the performance period is based on the TSR of BHP Group Limited. |
2024 | Number of awards at the beginning of the financial year | Number of awards issued during the year | Number of awards vested and exercised | Number of awards lapsed | Number of awards at the end of the financial year | Weighted average remaining contractual life (years) | Weighted average share price at exercise date | |||||||||||||||||||||
| CDP awards | 968,581 | 532,680 | 219,701 | 70,071 | 1,211,489 | 2.1 | A$43.02 | |||||||||||||||||||||
| LTIP awards | 2,558,796 | 564,431 | 520,443 | 177,078 | 2,425,706 | 2.2 | A$43.02 | |||||||||||||||||||||
MAP awards 1 | 6,653,726 | 2,515,913 | 2,626,587 | 555,855 | 5,987,197 | 1.2 | A$43.33 | |||||||||||||||||||||
| Shareplus | 5,123,851 | 2,457,307 | 2,460,834 | 607,438 | 4,512,886 | 1.2 | A$44.35 | |||||||||||||||||||||
| 1 | There were 75,457 awards vested and exercisable at the end of the financial year. |
2024 | Weighted average fair value of awards granted during the year US$ | Risk-free interest rate | Estimated life of awards | Share price at grant date | Estimated volatility of share price | Dividend yield | ||||||||||||||||
CDP awards 1 | 29.71 | n/a | 2-5 years | A$44.70/A$42.75 | n/a | n/a | ||||||||||||||||
| LTIP awards | 19.51 | 4.23 | % | 5 years | A$44.70 | 33.61 | % | n/a | ||||||||||||||
MAP awards 2 | 23.95 | n/a | 1-5 years | A$43.49/A$47.74/A$45.52/A$42.75 | n/a | 5.21%/5.60%/7.44% | ||||||||||||||||
| Shareplus | 24.40 | n/a | 3 years | A$47.23 | n/a | 7.41% | ||||||||||||||||
| 1 | Includes CDP awards granted on 8 December 2023 and 20 June 2024. |
| 2 | Includes MAP awards granted on 27 September 2023, 8 December 2023, 12 April 2024 and 20 June 2024. |
| • | exercise price |
| • | expected life of the award |
| • | current market price of the underlying shares |
| • | expected volatility using an analysis of historic volatility over different rolling periods. For the LTIP, it is calculated for all sector comparators and the published MSCI World Index |
| • | expected dividends |
| • | risk-free interest rate, which is an applicable government bond rate |
| • | market-based performance hurdles |
| • | non-vesting conditions |
2024 | 2023 | |||||||
US$M | US$M | |||||||
Employee benefits 1 | 1,698 | 1,749 | ||||||
Restructuring 2 | 45 | 28 | ||||||
Post-retirement employee benefits 3 | 300 | 373 | ||||||
Total provisions | 2,043 | 2,150 | ||||||
| Comprising: | ||||||||
| Current | 1,677 | 1,734 | ||||||
Non-current | 366 | 416 | ||||||
2024 | Employee benefits | Restructuring | Post- retirement employee benefits 3 | Total | ||||||||||||
US$M | US$M | US$M | US$M | |||||||||||||
| At the beginning of the financial year | 1,749 | 28 | 373 | 2,150 | ||||||||||||
| Charge/(credit) for the year: | ||||||||||||||||
| Underlying | 1,375 | 55 | 65 | 1,495 | ||||||||||||
| Discounting | – | – | 21 | 21 | ||||||||||||
| Yield on defined benefit scheme assets | – | – | (4 | ) | (4 | ) | ||||||||||
| Exchange variations | (21 | ) | – | (45 | ) | (66 | ) | |||||||||
| Released during the year | (98 | ) | (10 | ) | (1 | ) | (109 | ) | ||||||||
| Remeasurement gains taken to retained earnings | – | – | (41 | ) | (41 | ) | ||||||||||
| Utilisation | (1,268 | ) | (27 | ) | (68 | ) | (1,363 | ) | ||||||||
Divestment of subsidiaries and operations 4 | (39 | ) | – | – | (39 | ) | ||||||||||
| Transfers and other movements | – | (1 | ) | – | (1 | ) | ||||||||||
At the end of the financial year | 1,698 | 45 | 300 | 2,043 | ||||||||||||
| 1 | The expenditure associated with total employee benefits will occur in a pattern consistent with when employees choose to exercise their entitlement to benefits. |
| 2 | Total restructuring provisions include provisions for terminations and office closures. |
| 3 | The net liability recognised in the Consolidated Balance Sheet includes US$142 million present value of funded defined benefits pension obligation (2023: US$151 million) offset by fair value of defined benefit scheme assets US$(147) million (2023: US$(159) million), US$63 million present value of unfunded defined pension and post-retirement medical benefits obligation (2023: US$79 million) and US$242 million unfunded post-employment benefits obligation in Chile (2023: US$302 million). |
| 4 | Relates to the divestment of the Blackwater and Daunia mines completed on 2 April 2024. Refer to note 3 ‘Exceptional items’ for more information. |
| • | there is a present legal or constructive obligation as a result of past events |
| • | it is more likely than not that a permanent outflow of resources will be required to settle the obligation |
| • | the amount can be reliably estimated and measured at the present value of management’s best estimate of the cash outflow required to settle the obligation at the reporting date |
Provision | Description | |
Employee benefits | Liabilities for benefits accruing to employees up until the reporting date in respect of wages and salaries, annual leave and any accumulating sick leave are recognised in the period the related service is rendered. Liabilities recognised in respect of short-term employee benefits expected to be settled within 12 months are measured at the amounts expected to be paid when the liabilities are settled. Liabilities for other long-term employee benefits, including long service leave, are measured as the present value of estimated future payments for the services provided by employees up to the reporting date. Liabilities that are not expected to be settled within 12 months are discounted at the reporting date using market yields of high-quality corporate bonds or government bonds for countries where there is no deep market for corporate bonds. The rates used reflect the terms to maturity and currency that match, as closely as possible, the estimated future cash outflows. In relation to industry-based long service leave funds, the Group’s liability, including obligations for funding shortfalls, is determined after deducting the fair value of dedicated assets of such funds. Liabilities for short and long-term employee benefits (other than unpaid wages and salaries) are disclosed within employee benefits. Other liabilities for unpaid wages and salaries related to the current period are recognised in other creditors. Review of employee allowances and entitlements On 1 June 2023, the Group disclosed the identification of two issues with certain allowances and entitlements affecting a number of current and former employees in Australia. The identified issues relate to rostered employees having leave incorrectly deducted on public holidays since 2010 (leave issue) and certain employees at Port Hedland being eligible for additional allowances due to an error with the employing entity in their employment documentation (employing entity issue). The Group self-reported the issues to the Fair Work Ombudsman in Australia. Since the date of the announcement, the Group has recredited leave hours to current employees and begun making payments to former employees who were impacted by the leave issue. The Group has also commenced making payments to current and former employees for historical impacts of the employing entity issue in the first quarter of FY2025. The Group’s best estimate of the remaining cost of remediating the two issues, incorporating on-costs, including associated superannuation and interest payments (BHP share) is reflected in employee benefit provisions at 30 June 2024.There remains a risk that other instances of non-compliance requiring remediation may be identified through the Group’s review processes and associated provisions may be recognised in future reporting periods. | |
Restructuring | Restructuring provisions are recognised when: • the Group has developed a detailed formal plan identifying the business or part of the business concerned, the location and approximate number of employees affected, a detailed estimate of the associated costs, and an appropriate timeline • the restructuring has either commenced or been publicly announced and can no longer be withdrawn Payments that are not expected to be settled within 12 months of the reporting date are measured at the present value of the estimated future cash payments expected to be made by the Group. | |
Provision | Description | |
Post-retirement employee benefits | Defined contribution pension schemes and multi-employer pension schemes For defined contribution schemes or schemes operated on an industry-wide basis where it is not possible to identify assets attributable to the participation by the Group’s employees, the pension charge is calculated on the basis of contributions payable. The Group contributed US$368 million during the financial year (2023: US$358 million; 2022: US$324 million) to defined contribution plans and multi-employer defined contribution plans. These contributions are expensed as incurred. Defined benefit pension and post-retirement medical schemes The Group operates or participates in a number of defined benefit pension schemes throughout the world, all of which are closed to new entrants. The funding of the schemes complies with local regulations. The assets of the schemes are generally held separately from those of the Group and are administered by trustees or management boards. The Group also operates a number of unfunded post-retirement medical schemes in the United States, Canada and Europe. For defined benefit schemes, an asset or liability is recognised in the balance sheet based at the present value of defined benefit obligations less, where funded, the fair value of plan assets, except that any such asset cannot exceed the present value of expected refunds from and reductions in future contributions to the plan. Full actuarial valuations are prepared by local actuaries for all schemes, using discount rates based on market yields at the reporting date on high-quality corporate bonds or by reference to national government bonds if high-quality corporate bonds are not available. Where funded, scheme assets are invested in a diversified range of asset classes, predominantly comprising bonds and equities. |
| 2022 | ||||
| US$M | ||||
| Profit/(loss) after taxation from operating activities | 2,496 | |||
| Net gain on Petroleum merger with Woodside (after tax) | 8,159 | |||
| Profit/(loss) after taxation | 10,655 | |||
Attributable to non-controlling interests | – | |||
| Attributable to BHP shareholders | 10,655 | |||
| Basic earnings/(loss) per ordinary share (cents) | 210.5 | |||
| Diluted earnings/(loss) per ordinary share (cents) | 210.1 | |||
| 2022 | ||||
| US$M | ||||
| Net operating cash flows | 2,889 | |||
Net investing cash flows 1 | (904 | ) | ||
Net financing cash flows 2 | (33 | ) | ||
| Net increase/(decrease) in cash and cash equivalents from Discontinued operations | 1,952 | |||
| Net cash completion payment on merger of Petroleum with Woodside | (683 | ) | ||
| Cash and cash equivalents disposed | (399 | ) | ||
| Total cash impact | 870 | |||
| 1 | Includes purchases of property, plant and equipment and capitalised exploration related to drilling and development expenditure of US$1,144 million, proceeds from sale of subsidiaries, operations and joint operations, net of cash of US$91 million, proceeds from sale of assets of US$151 million and other investing outflows of US$2 million. |
| 2 | Represents net repayment of interest bearing liabilities of US$33 million. |
| Year ended 30 June 2022 | Gross | Tax | Net | |||||||||
| US$M | US$M | US$M | ||||||||||
Exceptional items by category | ||||||||||||
Net gain on Petroleum merger with Woodside 1 | 8,167 | (8 | ) | 8,159 | ||||||||
| Total | 8,167 | (8 | ) | 8,159 | ||||||||
Attributable to non-controlling interests | – | – | – | |||||||||
| Attributable to BHP shareholders | 8,167 | (8 | ) | 8,159 | ||||||||
| 1 | The tax expense associated with the exceptional item reflects the tax impact of transaction costs and other restructuring related activities undertaken pre-merger. There were no further tax impacts arising on the net gain on merger of our Petroleum business with Woodside as generated tax losses were either offset with capital gains in other entities in the Group, or not recognised on the basis that it is not probable that future capital gains will be available against which the Group can utilise the tax losses. |
| 2022 | ||||
| US$M | ||||
| Net assets disposed | 10,172 | |||
Fair value of Woodside shares 1 | 19,566 | |||
Net cash completion payment on merger of Petroleum with Woodside 2 | (683 | ) | ||
| Foreign currency translation reserve transferred to the income statement | 54 | |||
| Other provisions and related indemnities recognised at completion | (353 | ) | ||
| Transaction and other directly attributable costs | (245 | ) | ||
| Income tax expense | (8 | ) | ||
| Net gain on Petroleum merger with Woodside | 8,159 | |||
| 1 | Represents the consideration received being the fair value of 914,768,948 Woodside ordinary shares received using the closing ASX share price of A$29.76 on 31 May 2022 (US$21.39 equivalent based on an exchange rate of AUD/USD 0.7187). |
| 2 | Reflects the net cash flows generated by BHP Petroleum between 1 July 2021 and Completion Date adjusted for dividends Woodside would have paid on the newly issued Woodside ordinary shares, had the Merger completed on 1 July 2021. |
Final Fair value | ||||
US$M | ||||
Assets | ||||
| Cash and cash equivalents | 104 | |||
Trade and other receivables 1 | 77 | |||
| Other financial assets | 7 | |||
| Inventories | 329 | |||
| Property, plant and equipment | 7,661 | |||
| Intangible assets – goodwill | 194 | |||
| Current tax receivable | 36 | |||
| Other assets | 25 | |||
Total assets | 8,433 | |||
Liabilities | ||||
| Trade and other payables | 242 | |||
| Interest bearing liabilities | 1,111 | |||
Deferred tax liabilities 2 | 850 | |||
| Provisions | 258 | |||
Total liabilities | 2,461 | |||
Identifiable net assets acquired | 5,972 | |||
Total consideration paid 3 4 | 5,972 | |||
| Cash and cash equivalents acquired | (104 | ) | ||
Net cash consideration paid | 5,868 | |||
| 1 | This represents the gross contractual amount for trade and other receivables all of which is expected to be collected. |
| 2 | This primarily represents the difference between the fair value of the mineral rights acquired and the corresponding tax base. |
| 3 | The Group executed a forward exchange contract to hedge the foreign exchange exposure on the consideration made in AUD. On maturity of the hedging instrument, a hedge loss of US$35 million was capitalised to the cost of the acquisition. |
| 4 | The consideration paid by the Group was A$26.50 (at the average hedged exchange rate of AUD/USD 0.6681) per OZL share over 337,314,920 shares and excluded a special dividend of A$1.75 per OZL share which was paid by OZL to its shareholders immediately prior to acquisition. |
Group’s interest | ||||||||||||
Significant subsidiaries | Country of incorporation | Principal activity | 2024 % | 2023 % | ||||||||
Coal | ||||||||||||
| Hunter Valley Energy Coal Pty Ltd | Australia | Coal mining | 100 | 100 | ||||||||
Copper | ||||||||||||
| BHP Olympic Dam Corporation Pty Ltd | Australia | Copper, uranium and gold mining | 100 | 100 | ||||||||
| Compañia Minera Cerro Colorado Limitada | Chile | Copper mining | 100 | 100 | ||||||||
Minera Escondida Ltda 1 | Chile | Copper mining | 57.5 | 57.5 | ||||||||
| Minera Spence SA | Chile | Copper mining | 100 | 100 | ||||||||
| OZ Minerals Carrapateena Pty Ltd | Australia | Copper and gold mining | 100 | 100 | ||||||||
| OZ Minerals Prominent Hill Operations Pty Ltd | Australia | Copper and gold mining | 100 | 100 | ||||||||
Iron Ore | ||||||||||||
BHP Iron Ore (Jimblebar) Pty Ltd 2 | Australia | Iron ore mining | 85 | 85 | ||||||||
| BHP Iron Ore Pty Ltd | Australia | Service company | 100 | 100 | ||||||||
| BHP (Towage Service) Pty Ltd | Australia | Towing services | 100 | 100 | ||||||||
Marketing | ||||||||||||
| BHP Billiton Freight Singapore Pte Limited | Singapore | Freight services | 100 | 100 | ||||||||
| BHP Billiton Marketing AG | Switzerland | Marketing and trading | 100 | 100 | ||||||||
| BHP Billiton Marketing Asia Pte Ltd | Singapore | Marketing support and other services | 100 | 100 | ||||||||
Group and Unallocated | ||||||||||||
| BHP Billiton Finance B.V. | The Netherlands | Finance | 100 | 100 | ||||||||
| BHP Billiton Finance Limited | Australia | Finance | 100 | 100 | ||||||||
| BHP Billiton Finance (USA) Limited | Australia | Finance | 100 | 100 | ||||||||
| BHP Canada Inc. | Canada | Potash development | 100 | 100 | ||||||||
| BHP Group Operations Pty Ltd | Australia | Administrative services | 100 | 100 | ||||||||
| BHP Nickel West Pty Ltd | Australia | Nickel mining, smelting, refining and administrative services | 100 | 100 | ||||||||
| OZ Minerals Musgrave Operations Pty Ltd | Australia | Nickel and copper development | 100 | 100 | ||||||||
| WMC Finance (USA) Limited | Australia | Finance | 100 | 100 | ||||||||
| 1 | As the Group has the ability to direct the relevant activities at Minera Escondida Ltda, it has control over the entity. The assessment of the most relevant activity in this contractual arrangement is subject to judgement. The Group establishes the mine plan and the operating budget and has the ability to appoint the key management personnel, demonstrating that the Group has the existing rights to direct the relevant activities of Minera Escondida Ltda. |
| 2 | The Group has an effective interest of 92.5 per cent in BHP Iron Ore (Jimblebar) Pty Ltd; however, by virtue of the shareholder agreement with ITOCHU Iron Ore Australia Pty Ltd and Mitsui & Co. Iron Ore Exploration & Mining Pty Ltd, the Group’s interest in the Jimblebar mining operation is 85 per cent, which is consistent with the other respective contractual arrangements at Western Australia Iron Ore. |
Significant associates and joint ventures | Country of incorporation/ principal place of business | Associate or joint venture | Principal activity | Reporting date | Ownership interest | |||||||||||
2024 % | 2023 % | |||||||||||||||
| Compañía Minera Antamina S.A. (Antamina) | Peru | Associate | Copper and zinc mining | 31 December | 33.75 | 33.75 | ||||||||||
| Samarco Mineração S.A. (Samarco) | Brazil | Joint venture | Iron ore mining | 31 December | 50.00 | 50.00 | ||||||||||
Year ended 30 June 2024 US$M | Investment in associates | Investment in joint ventures | Total equity accounted investments | |||||||||
| At the beginning of the financial year | 1,620 | – | 1,620 | |||||||||
(Loss)/profit from equity accounted investments, related impairments and expenses 1 | 376 | (3,032 | ) | (2,656 | ) | |||||||
| Investment in equity accounted investments | 63 | – | 63 | |||||||||
| Dividends received from equity accounted investments | (397 | ) | – | (397 | ) | |||||||
Other 1 | – | 3,032 | 3,032 | |||||||||
At the end of the financial year | 1,662 | – | 1,662 | |||||||||
| 1 | Represents financial impacts of Samarco dam failure in the Group’s loss from equity accounted investments, related impairments and expenses. Refer to note 4 ‘Significant events – Samarco dam failure’ for further information. |
Associates | Joint ventures | |||||||||||||||||||
2024 US$M | Antamina | Individually immaterial 1 | Samarco 2 | Individually immaterial | Total | |||||||||||||||
| Current assets | 1,699 | 564 | (3) | |||||||||||||||||
Non-current assets | 6,325 | 7,214 | ||||||||||||||||||
| Current liabilities | (987 | ) | (3,266 | ) (4) | ||||||||||||||||
Non-current liabilities | (2,389 | ) | (23,211 | ) | ||||||||||||||||
| Net assets/(liabilities) – 100% | 4,648 | (18,699 | ) | |||||||||||||||||
| Net assets/(liabilities) – Group share | 1,569 | (9,349 | ) | |||||||||||||||||
| Adjustments to net assets related to accounting policy adjustments | (71 | ) | – | |||||||||||||||||
| Investment in Samarco | – | 516 | (6) | |||||||||||||||||
| Impairment of the carrying value of the investment in Samarco | – | (1,041 | ) (7) | |||||||||||||||||
| Additional share of Samarco losses | – | 7,891 | (8) | |||||||||||||||||
| Unrecognised losses | – | 1,983 | (9) | |||||||||||||||||
Carrying amount of investments accounted for using the equity method | 1,498 | 164 | – | – | 1,662 | |||||||||||||||
| Revenue – 100% | 4,381 | 1,553 | ||||||||||||||||||
| Profit/(loss) from Continuing operations – 100% | 1,353 | (6,726 | ) (10) | |||||||||||||||||
| Share of profit/(loss) of equity accounted investments | 457 | (3,363 | ) | |||||||||||||||||
| Adjustments to share of profit/(loss) related to accounting policy adjustments | 8 | (6 | ) (11) | |||||||||||||||||
| Impairment of the carrying value of the investment in Samarco | – | – | ||||||||||||||||||
| Additional share of Samarco losses | – | 506 | ||||||||||||||||||
| Fair value change on forward exchange derivatives | – | (199 | ) | |||||||||||||||||
| Movement in unrecognised losses | – | 30 | (9) | |||||||||||||||||
(Loss)/profit from equity accounted investments, related impairments and expenses | 465 | (89 | ) | (3,032 | ) | – | (2,656 | ) | ||||||||||||
| Comprehensive income – 100% | 1,353 | (6,726 | ) | |||||||||||||||||
Share of comprehensive (loss)/income – Group share in equity accounted investments | 465 | (89 | ) | (3,032 | ) | – | (2,656 | ) | ||||||||||||
Dividends received from equity accounted investments | 397 | – | – | – | 397 | |||||||||||||||
| Associates | Joint ventures | |||||||||||||||||||
2023 US$M | Antamina | Individually immaterial 1 | Samarco 2 | Individually immaterial | Total | |||||||||||||||
| Current assets | 1,519 | 537 | (3) | |||||||||||||||||
Non-current assets | 5,670 | 5,739 | ||||||||||||||||||
| Current liabilities | (774 | ) | (11,167 | ) (4) | ||||||||||||||||
Non-current liabilities | (1,944 | ) | (10,614 | ) | ||||||||||||||||
| Net assets/(liabilities) – 100% | 4,471 | (15,505 | ) | |||||||||||||||||
| Net assets/(liabilities) – Group share | 1,509 | (7,753 | ) | |||||||||||||||||
| Adjustments to net assets related to accounting policy adjustments | (79 | ) | 291 | (5) | ||||||||||||||||
| Investment in Samarco | – | 516 | (6) | |||||||||||||||||
| Impairment of the carrying value of the investment in Samarco | – | (1,041) | (7) | |||||||||||||||||
| Additional share of Samarco losses | – | 6,034 | (8) | |||||||||||||||||
| Unrecognised losses | – | 1,953 | (9) | |||||||||||||||||
Carrying amount of investments accounted for using the equity | 1,430 | 190 | – | – | 1,620 | |||||||||||||||
| Revenue – 100% | 4,350 | 1,554 | ||||||||||||||||||
| Profit/(loss) from Continuing operations – 100% | 1,571 | (3,018) | (10) | |||||||||||||||||
| Share of profit/(loss) of equity accounted investments | 530 | (1,509 | ) | |||||||||||||||||
| Adjustments to share of profit/(loss) related to accounting policy adjustments | (79 | ) | 23 | (11) | ||||||||||||||||
| Impairment of the carrying value of the investment in Samarco | – | – | ||||||||||||||||||
| Additional share of Samarco losses | – | 452 | ||||||||||||||||||
| Fair value change on forward exchange derivatives | – | 471 | ||||||||||||||||||
| Movement in unrecognised losses | – | 778 | (9) | |||||||||||||||||
| Profit/(loss) from equity accounted investments, related impairments and expenses | 451 | (72 | ) | 215 | – | 594 | ||||||||||||||
| Comprehensive income – 100% | 1,571 | (3,018) | ||||||||||||||||||
Share of comprehensive income/(loss) – Group share in accounted investments | 451 | (72 | ) | 215 | – | 594 | ||||||||||||||
| Dividends received from equity accounted investments | 327 | 1 | – | – | 328 | |||||||||||||||
| Associates | Joint ventures | |||||||||||||||||||
2022 US$M | Antamina | Individually immaterial | Samarco 2 | Individually immaterial | Total | |||||||||||||||
| Revenue – 100% | 5,264 | 1,670 | ||||||||||||||||||
| Profit/(loss) from Continuing operations – 100% | 2,133 | (528 | ) (10) | |||||||||||||||||
| Share of profit/(loss) of equity accounted investments | 720 | (276 | ) | |||||||||||||||||
| Impairment of the carrying value of the investment in Samarco | – | – | ||||||||||||||||||
| Additional share of Samarco losses | – | 290 | ||||||||||||||||||
| Fair value change on forward exchange derivatives | – | (81 | ) | |||||||||||||||||
| Movement in unrecognised losses | – | (609 | ) (9) | |||||||||||||||||
| Profit/(loss) from equity accounted investments, related impairments and expenses | 720 | (63 | ) | (676 | ) | – | (19 | ) | ||||||||||||
| Comprehensive income – 100% | 2,133 | (528 | ) | |||||||||||||||||
| Share of comprehensive income/(loss) – Group share in equity accounted investments | 720 | (63 | ) | (676 | ) | – | (19 | ) | ||||||||||||
| Dividends received from equity accounted investments | 776 | 11 | – | – | 787 | |||||||||||||||
| 1 | The unrecognised share of gain for the period was US$41 million (2023: unrecognised share of gain for the period was US$76 million), which decreased the cumulative losses to US$100 million (2023: decrease to US$141 million). |
| 2 | Refer to note 4 ‘Significant events – Samarco dam failure’ for further information regarding the financial impact of the Samarco dam failure which occurred in November 2015 on BHP Brasil’s share of Samarco’s losses. The financial information disclosed represents the underlying financial information of Samarco updated to reflect the Group’s best estimate of the costs to resolve all aspects of the Federal Public Prosecution Office claim and Framework Agreement. |
| 3 | Includes cash and cash equivalents of US$251 million (2023: US$138 million). |
| 4 | Includes current financial liabilities (excluding trade and other payables and provisions) of US$ nil (2023: US$7,154 million). |
| 5 | Relates mainly to dividends declared by Samarco that remain unpaid at balance date and which, in accordance with the Group’s accounting policy, are recognised when received not receivable. |
| 6 | Any working capital funding provided to Samarco is capitalised as part of the Group’s investments in joint ventures and disclosed as an impairment included within the Samarco impairment expense line item. |
| 7 | In the year ended 30 June 2016 BHP Brasil adjusted its investment in Samarco to US$ |
| 8 | BHP Brasil has recognised accumulated additional share of Samarco losses of US$(7,891) million resulting from US$(6,147) million provisions relating to the Samarco dam failure and US$(1,744) million recognised as net finance costs. |
| 9 | Share of Samarco’s losses for which BHP Brasil does not have an obligation to fund. |
| 10 | Includes depreciation and amortisation of US$165 million (2023: US$144 million; 2022: US$205 million), interest income of US$43 million (2023: US$42 million; 2022: US$19 million), interest expense of US$807 million (2023: US$1,384 million; 2022: US$628 million), other finance income in relation to the Judicial Reorganisation of US$1,756 million (2023: US$ nil; 2022: US$ nil) andincome tax benefit/(expense) of US$999 million (2023: US$(213) million; 2022: US$(7) million). |
| 11 | Includes accounting policy adjustments mainly related to the removal of foreign exchange gains on excluded dividends payable. |
Group’s interest | ||||||||||||
Significant joint operations | Country of operation | Principal activity | 2024 % | 2023 % | ||||||||
Mt Goldsworthy 1 | Australia | Iron ore mining | 85 | 85 | ||||||||
Mt Newman 1 | Australia | Iron ore mining | 85 | 85 | ||||||||
Yandi 1 | Australia | Iron ore mining | 85 | 85 | ||||||||
| Central Queensland Coal Associates | Australia | Coal mining | 50 | 50 | ||||||||
| 1 | These contractual arrangements are controlled by the Group and do not meet the definition of joint operations. However, as they are formed by contractual arrangement and are not entities, the Group recognises its share of assets, liabilities, revenue and expenses arising from these arrangements. |
Group’s share | ||||||||
2024 | 2023 | |||||||
US$M | US$M | |||||||
| Current assets | 1,928 | 1,561 | ||||||
Non-current assets | 25,307 | 26,370 | ||||||
Total assets 1 | 27,235 | 27,931 | ||||||
| 1 | While the Group is unrestricted in its ability to sell a share of its interest in these joint operations, it does not have the right to sell individual assets that are used in these joint operations without the unanimous consent of the other participants. The assets in these joint operations are also restricted to the extent that they are only available to be used by the joint operation itself and not by other operations of the Group. |
| • | All transactions to/from related parties are made at arm’s length, i.e. at normal market prices and rates and on normal commercial terms. |
| • | Outstanding balances at year-end are unsecured and settlement occurs in cash. Loan amounts owing from related parties represent secured loans made to associates and joint ventures underco-funding arrangements. Such loans are made on an arm’s length basis. |
| • | No guarantees are provided or received for any related party receivables or payables. |
| • | No provision for expected credit losses has been recognised in relation to any outstanding balances and no expense has been recognised in respect of expected credit losses due from related parties. |
| • | There were no other related party transactions in the year ended 30 June 2024 (2023: US$ nil), other than those with post-employment benefit plans for the benefit of Group employees. These are shown in note 27 ‘Employee benefits, restructuring and post-retirement employee benefits provisions’. |
| • | Related party transactions with Samarco are described in note 4 ‘Significant events – Samarco dam failure’. |
Joint ventures | Associates | |||||||||||||||
2024 | 2023 | 2024 | 2023 | |||||||||||||
US$M | US$M | US$M | US$M | |||||||||||||
| Sales of goods/services | – | – | – | – | ||||||||||||
| Purchases of goods/services | – | – | 1,606.639 | 1,589.094 | ||||||||||||
| Interest income | – | – | – | – | ||||||||||||
| Interest expense | – | – | – | – | ||||||||||||
| Dividends received | – | – | 396.856 | 327.679 | ||||||||||||
| Net loans made to/(repayments from) related parties | – | – | – | – | ||||||||||||
Joint ventures | Associates | |||||||||||||||
2024 | 2023 | 2024 | 2023 | |||||||||||||
US$M | US$M | US$M | US$M | |||||||||||||
| Trade amounts owing to related parties | – | – | 246.764 | 246.239 | ||||||||||||
| Loan amounts owing to related parties | – | – | – | – | ||||||||||||
| Trade amounts owing from related parties | – | – | 0.249 | 6.730 | ||||||||||||
| Loan amounts owing from related parties | – | – | – | – | ||||||||||||
2024 | 2023 | |||||||
US$M | US$M | |||||||
Associates and joint ventures 1 | 1,492 | 1,094 | ||||||
Subsidiaries and joint operations 1 | 859 | 1,184 | ||||||
Total | 2,351 | 2,278 | ||||||
| 1 | There are a number of matters, for which it is not possible at this time to provide a range of possible outcomes or a reliable estimate of potential future exposures, and for which no amounts have been included in the table above. |
Uncertain tax and royalty matters | The Group is subject to a range of taxes and royalties across many jurisdictions, the application of which is uncertain in some regards. Changes in tax law, changes in interpretation of tax law, periodic challenges and disagreements with tax authorities, and legal proceedings result in uncertainty of the outcome of the application of taxes and royalties to the Group’s business. To the extent uncertain tax and royalty matters give rise to a contingent liability, an estimate of the potential liability is included within the table above, where it is capable of reliable measurement. | |
Samarco contingent liabilities | The table above includes contingent liabilities related to the Group’s equity accounted investment in Samarco to the extent they are capable of reliable measurement. Details of contingent liabilities related to Samarco are disclosed in note 4 ‘Significant events – Samarco dam failure’. | |
Divestments and demergers | Where the Group divests or demerges entities, it is generally agreed to provide certain indemnities to the acquiring or demerged entity. Such indemnities include those provided as part of the demerger of South32 Ltd in May 2015, divestment of Group’s Onshore US assets in September 2018 and October 2018, divestment of BMC in May 2022 and the merger of the Group’s Petroleum business with Woodside in June 2022. No material claims have been made pursuant to these indemnities as at 30 June 2024. | |
2024 | 2023 | 2022 | ||||||||||
US$M | US$M | US$M | ||||||||||
Fees payable to the Group’s auditors for assurance services | ||||||||||||
| Audit of the Group’s Annual Report | 10.558 | 9.700 | 9.816 | |||||||||
| Audit of the accounts of subsidiaries, joint ventures and associates | 0.534 | 0.551 | 0.605 | |||||||||
| Audit-related assurance services required by legislation to be provided by the auditor | 1.871 | 1.808 | 1.933 | |||||||||
| Other assurance and agreed-upon procedures under legislation or contractual arrangements | 2.261 | 1.991 | 7.938 | |||||||||
Total assurance services | 15.224 | 14.050 | 20.292 | |||||||||
Fees payable to the Group’s auditors for non-assurance services | ||||||||||||
| Other services | 0.498 | 0.180 | – | |||||||||
Total other services | 0.498 | 0.180 | – | |||||||||
Total fees | 15.722 | 14.230 | 20.292 | |||||||||
Carrying value of property, plant and equipment | ||
| Description of the Matter | As disclosed in Note 11 and Note 13 to the consolidated financial statements, the Company recorded US$71,629 million in property, plant and equipment as of 30 June 2024 and recognised an impairment charge of US$3,800 million related to the Western Australia Nickel cash generating unit (“CGU”). The Company performed impairment tests for all CGUs where there were indicators of impairment. Where such indicators existed, the Company estimated the recoverable amount to be the higher of a CGU’s value in use and its fair value less cost of disposal. | |
| Auditing management’s assessment of indicators of impairment and impairment reversal and estimate of recoverable amount was complex due to the high degree of estimation uncertainty in forecasting the future cash flows for each CGU. Specifically, estimated future cash flows are sensitive to changes in significant assumptions, such as forecast commodity prices, production quantities, discount rates, carbon price assumptions and the cost of decarbonisation projects. | ||
| How We Addressed the Matter in Our Audit | We obtained an understanding, evaluated the design, and tested the operating effectiveness of the controls over the Company’s process to assess indicators of impairment or impairment reversal and to estimate the recoverable amount of the CGU for which an indicator of impairment was identified. | |
| We performed an analysis for indicators of impairment and impairment reversal. Our procedures involved assessing the key inputs such as forecast commodity prices, production quantities, discount rates and the impact of climate change used in the assessment of indicators of impairment or impairment reversal. | ||
| We involved our valuation and climate change specialists to assist in assessing the reasonableness of commodity and carbon prices by comparing the forecasted commodity and carbon price assumptions to analyst and broker forecasts and those used by other market participants. | ||
| In addition, our valuation specialists assisted in testing the discount rates used, including a comparison to external market data and evaluating whether the valuation methodology used was consistent with industry practice. | ||
| To test the reserve quantities, we examined the information provided by the Company’s experts and we involved our mining reserve specialists to assist in the assessment of the reserve estimation methodology against the relevant industry and regulatory guidance. | ||
| With the assistance of our climate change specialists, we tested whether the Company’s forecast cash flows incorporated the costs of the Company’s decarbonisation plans. | ||
| We tested the mathematical accuracy of the models used and we assessed the competence, qualifications, and objectivity of management’s internal and external specialists. | ||
| In respect to the Western Australia Nickel CGU impairment, we performed testing of management’s estimate of the recoverable amount that included, among others, evaluating the significant assumptions used and compared the forecast cash flows against approved budgets and plans and evaluated the accuracy of prior year budgets against current year performance. | ||
| Finally, we assessed the adequacy of the disclosures within Notes 11, 13 and 16 of the consolidated financial statements. | ||
Closure and rehabilitation provisions | ||
Description of the Matter | As disclosed in Note 15 to the consolidated financial statements, the Company recorded US$9,837 million in closure and rehabilitation provisions as at 30 June 2024. | |
| Provisions for closure and rehabilitation are recognised by the Company when there is a present legal or constructive obligation, it is probable that an outflow of resources will be required to settle the obligation, and the amount can be reliably estimated. | ||
| The Company estimates the individual site provisions using the expected value of future cash flows required to close and rehabilitate the relevant site using current restoration standards and techniques and taking into account risks and uncertainties. Individual site provisions are discounted to the present value using currency specific risk-free discount rates aligned to the estimated timing of cash outflows. | ||
| Auditing management’s closure and rehabilitation provisions was complex and highly judgemental due to the significant estimation uncertainty within the key assumptions. Specifically, there was significant judgement in determining the expected life of sites including the impact of climate change, estimated cost and extent of rehabilitation activities, timing of activities, and the discount rates used. As a result of these inputs the provisions have a significant estimation uncertainty and a wide range of potential outcomes. | ||
How We Addressed the Matter in Our Audit | We obtained an understanding, evaluated the design and tested the operating effectiveness of controls over the Company’s closure and rehabilitation provision estimate process. Specifically, our procedures involved testing the controls around the significant estimates and assumptions, such as the costs associated with future closure activities, the extent and period of post-closure monitoring and maintenance, the impact of climate change, and the timing of cash flows and closure of operations. | |
| Our procedures included evaluation of the completeness and accuracy of data used within management’s estimate. | ||
We tested that the future closure and rehabilitation costs were consistent with the closure plans prepared by management’s internal specialists. We compared the expected life of sites and resulting timing of closure activities used in the provision to the life of asset plans prepared by management’s internal specialists. | ||
With the assistance of our rehabilitation specialists, we evaluated a sample of closure and rehabilitation provisions for operating and closed sites. Our testing included evaluating the closure and rehabilitation plans based on the relevant legal and regulatory requirements. In addition, we compared the timing of future cash flows and cost estimates against the closure and rehabilitation plan, environmental studies, and industrial practices. | ||
| We evaluated the discount rates used against market data. | ||
| With the assistance of both our climate change and rehabilitation specialists, we evaluated the Company’s consideration of climate change, estimates related to post closure monitoring and maintenance and the timing of closure activities impacted by mine operating lives within the closure and rehabilitation provision. | ||
We tested the mathematical accuracy of the closure and rehabilitation provision calculations and assessed the competence, qualifications, and objectivity of management’s internal and external specialists. Finally, we assessed the adequacy of the disclosures within Notes 15 and 16 to the consolidated financial statements. | ||
Samarco dam failure provisions recognised and the contingent liabilities disclosed | ||
Description of the Matter | As described in Notes 3, 4, and 34 to the consolidated financial statements, the Company recorded a loss of US$3,677 million (pre-tax) for the year ended 30 June 2024 and recognised provisions of US$6,505 million for the Samarco dam failure as of 30 June 2024. The Company recognises a provision when it has a present obligation, and an outflow of economic resources is probable, and the obligation can be reliably measured. Contingent liabilities related to the Samarco dam failure are disclosed in Note 34. | |
| Auditing management’s estimate of the Samarco dam failure provisions and contingent liabilities disclosure was complex and highly judgemental due to the significant estimation uncertainty in determining the terms of any potential future outcome of the settlement negotiations and the measurement and completeness of future cash outflows, including the quantification of costs to resolve all aspects of the Federal Public Prosecution Office claim, being reparation, compensation and moral damages and the terms of the Framework Agreement. There was also significant judgement in determining the nature and extent of remediation activities, the cost estimates for remediation, the number and categorisation of impacted people entitled to compensation and the extent to which Samarco is able to directly fund any future obligations. As a result of these inputs the provision has a significant estimation uncertainty and a wide range of potential outcomes. | ||
How We Addressed the Matter in Our Audit | We obtained an understanding, evaluated the design and tested the operating effectiveness of the Company’s controls in determining the Samarco dam failure provisions and contingent liabilities and the relevant disclosures within the consolidated financial statements. Specifically, we tested management’s controls over the significant assumptions as described above and the completeness and accuracy of data used within management’s estimates. | |
| To test the provisions, we performed audit procedures that included, amongst others, assessing methodologies and testing the significant assumptions discussed above and underlying data used by the Company in its analysis. We tested a sample of cost estimates used to source documents. We compared the nature and extent of activities included in the forecasted cash flows to the Federal Public Prosecution Office claim and the Framework Agreement. We tested the extent to which Samarco is able to directly fund any future obligations. We also tested the mathematical accuracy of the models used to calculate the provisions. To assess management’s ability to forecast, we compared the prior years forecasted cash flows to actual results and understood key differences. | ||
| To assess the status of claims and contingent liability disclosures, we held discussions with the Company’s internal legal counsel regarding ongoing Samarco dam failure litigation matters. In addition, we obtained legal confirmations and inspected communications with the Company’s external legal counsel. | ||
| We evaluated the competence, qualifications and objectivity of the Company’s experts who assisted management in estimating the provision by considering the scope of work, their professional qualifications and remuneration structure. We also assessed the adequacy and completeness of the disclosures within Notes 4 and 34 to the consolidated financial statements. | ||
| (a) | in the Directors’ opinion the Financial Statements and notes are in accordance with the Australian Corporations Act 2001 (Cth), including: |
| (i) | complying with the applicable Accounting Standards and the Australian Corporations Regulations 2001 (Cth); and |
| (ii) | giving a true and fair view of the assets, liabilities, financial position and profit or loss of BHP Group Limited and the Group as at 30 June 2024 and of their performance for the year ended 30 June 2024 |
| (b) | [Intentionally omitted] |
| (c) | the Financial Statements comply with International Financial Reporting Standards, as disclosed in the Basis of preparation to the Financial Statements |
| (d) | to the best of the Directors’ knowledge, the management report (comprising the Operating and Financial Review and Directors’ Report) includes a fair review of the development and performance of the business and the position of BHP Group Limited and the undertakings included in the consolidation taken as a whole, together with a description of the principal risks and uncertainties that the Group faces |
| (e) | in the Directors’ opinion there are reasonable grounds to believe that BHP Group Limited will be able to pay its debts as and when they become due and payable |
| (f) | as at the date of this declaration, there are reasonable grounds to believe that BHP Group Limited and each of the members of the Closed Group identified in Exhibit 8.1 - List of Subsidiaries will be able to meet any liabilities to which they are, or may become, subject because of the Deed of Cross Guarantee between BHP Group Limited and those group entities pursuant to ASIC Corporations (Wholly-owned Companies) Instrument 2016/785 and, in respect of OZ Minerals Pty Ltd, ASIC Instrument 24-0213 |
| (g) | the Directors have been given the declarations required by Section 295A of the Australian Corporations Act 2001 (Cth) from the Chief Executive Officer and Chief Financial Officer for the financial year ended 30 June 2024 |
| /s/ Ken MacKenzie |
Ken MacKenzie |
| Chair |
| /s/ Mike Henry |
Mike Henry |
| Chief Executive Officer |