
Sovereign Bancorp, Inc.
Lehman Brothers 2006
Financial Services Conference
London
May 17, 2006

Forward-Looking Statements
This presentation contains statements of Sovereign Bancorp, Inc.’s
(the “Company”) strategies, plans and objectives, estimates of
future operating results for Sovereign Bancorp, Inc. as well as
estimates of financial condition, operating efficiencies, revenue
creation and shareholder value
These statements and estimates constitute forward-looking
statements (within the meaning of the Private Securities Litigation
Reform Act of 1995) which involve significant risks and
uncertainties. Actual results may differ materially from the results
discussed in these forward-looking statements
Factors that might cause such a difference include, but are not
limited to: general economic conditions, changes in interest rates,
deposit flows, loan demand, real estate values, and competition;
changes in accounting principles, policies, or guidelines; changes in
legislation or regulation; and other economic, competitive,
governmental, regulatory, and other technological factors affecting
the Company’s operations, pricing, products and services
2

Forward-Looking Statements
In addition, this presentation and filing contains forward-looking statements within the meaning
of Section 27A of the Securities Act of 1933, as amended, and Section 21E of the Securities
Exchange Act of 1934, as amended, with respect to the financial condition, results of operations
and business of Sovereign Bancorp, Inc. and the merger of Independence Community Bank Corp.
with and into Sovereign that are subject to various factors which could cause actual results to
differ materially from such projections or estimates. Such factors include, but are not limited to,
the following: (1) the businesses of Independence Community Bank Corp. may not be combined
successfully with Sovereign’s businesses, or such combinations may take longer to accomplish
than expected; (2) expected cost savings from the merger cannot be fully realized or realized
within the expected timeframes; (3) operating costs, customer loss and business disruption
following the merger, including adverse effects on relationships with employees, may be greater
than expected; (4) governmental approvals of the merger may not be obtained, or adverse
regulatory conditions may be imposed in connection with government approvals of the merger;
(5) adverse governmental or regulatory policies may be enacted; (6) the interest rate
environment may adversely impact the expected financial benefits of the merger, and compress
margins and adversely affect net interest income; (7) the risks associated with continued
diversification of assets and adverse changes to credit quality; (8) competitive pressures from
other financial service companies in Independence Community Bank Corp.’s and Sovereign’s
markets may increase significantly; (9) the risk of an economic slowdown that would adversely
affect credit quality and loan originations; (10) other economic, competitive, governmental,
regulatory, and technological factors affecting Sovereign's operations, integrations, pricing,
products and services; and (11) acts of terrorism or domestic or foreign military conflicts; and
acts of God, including natural disasters. Other factors that may cause actual results to differ
from forward-looking statements are described in Sovereign’s filings with the Securities
& Exchange Commission.
3

Overview of Sovereign

An Exceptional Franchise Serving the
Northeastern United States
Key: Sovereign Branches
Independence Branches
Sovereign Today
18th largest bank in the
U.S. with $64 billion in
assets
665 branches &
over 1,000 ATM’s
10,000 team members
Sovereign ProForma
Remains 18th largest
bank in U.S. with $83
billion in assets
785 branches &
over 2,000 ATM’s
Approx. 12,000 team
members
Source: SNL DataSource
(1) Includes CT, MA, NH, NJ, Eastern PA and RI
ME
5

Sovereign’s Demographics
14.1
49,747
United States
77,417
13
9.1
49,924
Rhode Island
654,826
262
3.2
48,534
Pennsylvania
1,107,270
307
16.8
51,187
New York
361,733
58
14.3
63,135
New Jersey
68,523
25
1.6
59,545
New
Hampshire
431,224
122
8.3
63,171
Massachusetts
300,269
62
4.7
61,384
Maryland
170,616
45
10.0%
$63,462
Connecticut
Number of
Students4
Number of
Universities3
Hispanic
Population2
(%)
Median
Household
Income1
($)
1 Median Household Income as of 2005
2 Hispanic Population as of 2004
3 Number of degree-granting institutions as of 2004
4 Number of students enrolled in degree-granting institutions as of 2002
6

Growing and Diversified Loan Portfolio…
$26.1
$23.1
Diverse Loan Mix
24% Annual Growth*
$36.6
Balances as of December 31. 1Q06 pro forma for ICBC.
* Through year-end 2005; includes completed acquisitions.
$43.8
$57.8
7

Building Deposits for a Strong Balance
Sheet…
$27.3
$26.9
Attractive Low-Cost
Deposit Base
12% Annual Growth*
$32.6
$38.0
Balances through December 31. 1Q06 pro forma for ICBC.
* Through year-end 2005; includes completed acquisitions.
$49.8
8

Deposits ($ billion)
…through a Combination of Organic Growth
and Acquisitions
Assets ($ billion)
Source: SNL Financial
Note: Data as of December 31, 2005; organic asset and deposit data is adjusted for whole company and branch acquisitions and divestitures.
2005YE data not pro forma for pending acquisition of ICBC
$5.0
$8.7
$9.5
$12.3
$12.0
$24.5
$23.3
$26.9
$27.3
$32.6
$38.0
$8.1
$15.3
$17.7
$21.9
$26.6
$33.5
$35.5
$39.6
$43.5
$54.5
$63.7
7.8%
3.7%
1.9%
9.6%
(3.4%)
7.4%
(6.5%)
(11.0%)
(15.7%)
Organic growth
7.0%
11.0%
10.0%
7.2%
6.9%
(12.5%)
14.7%
(5.7%)
(17.8%)
Organic growth
9

Growing Footprint
Number of Branches
8% Annual Growth*
*Through year-end 2005; includes acquisitions.
(1) Pro forma for pending acquisition of ICBC
790(1)
10

Total Revenue Growth
Revenue Growth
11% Annual Growth
11

Total Expense Growth
Total Expense Growth
0% Annual Growth since 2001; 6% annual growth since 2002
Includes Provision for credit losses, G&A expense and Other Expense
12

Positive Operating Leverage
Results in Continued Improvement
in Efficiency Ratio
1.2x
Operating Leverage
15.5%
$ .9bn
$1.1bn
G&A Expenses
18.7%
$1.9bn
$2.2bn
Total Revenue
% Change
2004
2005
Efficiency ratio equals G&A expenses as a percentage of total revenue, defined as the sum of
net interest income and total fees and other income before securities transactions
13

Improving Credit Quality
Non-Performing Loans to
Total Loans
Net Charge-offs
to Average Loans
Allowance to
Non-Performing Assets
14

Consistent Growth in Operating/Cash Earnings
4-year CAGR Total EPS
GAAP Net Income – 55% 41%
Operating/Cash Earnings – 19% 7%
Operating/cash earnings excludes most non-cash, non-operating charges. Please see appendix for
reconciliation of net income to operating/cash earnings, as well as related per share amounts.
Source: 2005 annual report
15

Improving Operating Metrics
Improved Operating Return
on Average Assets
Operating/Cash Return on
Average Tangible Equity
Average Tangible Equity
($ in millions)
16

Above Average Shareholder Value Creation
04/28/06 closing price of $22.17
3-Year Stock Price Performance
Percent
Appreciation
17

Above Average Shareholder Value Creation
5-Year Stock Price Performance
04/28/06 closing price of $22.17
Percent
Appreciation
18

Above Average Shareholder Value Creation
10-Year Stock Price Performance
04/28/06 closing price of $22.17
Percent
Appreciation
19

Sovereign’s Strategy

Sovereign’s Business Strategy
Combining the best of a large bank with the best of a
smaller community bank.
Best of a Large Bank:
Products and services
Technology
Brand
Delivery channels and distribution system
Talent
Diversification
Sophistication of risk management
Best of a Small Bank:
Flat structure
Local decision making
Cross functional lines to deliver bank to customer
Treat customers as “individuals”
Active community involvement culture
21

Summary of Sovereign’s Business Model
Local community bankers with authority
to make local decisions
Community banking delivery model in
all markets
11 local markets, each with a Market
CEO
Local decision making by experienced
commercial bankers
Consumer banking emphasizes
convenience and customer service
Many markets offer 7 day banking
Appointment banking
24/7/365 phone and internet availability
Guaranteed minimum customer service
standards/”Red Carpet” service
Best-in-class customer/product makeup
Full product suite
Customer mapping/segmentation
Targeting 6+ services sold/used
Extremely attractive
franchise in one of
the most desired
geographic markets
in the world
Consistent growth in
operating/cash
earnings, improving
operating metrics
and high internal
generation of capital
22
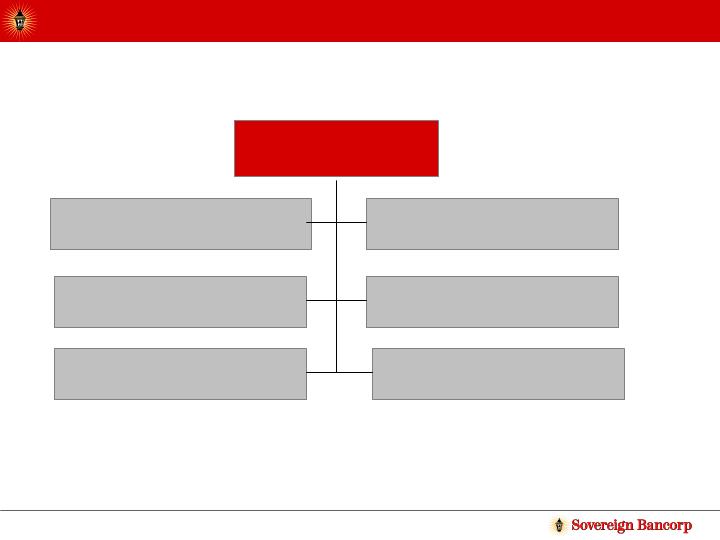
Sovereign’s Banking Structure (11 markets)
Market
CEO
Commercial Real Estate
Lenders
Commercial
Lenders
Small Business
Lenders
Financial
Consultants
Cash Management
Representatives
Retail
Branches
23

Local Market Tactics
Presidents calling on small/medium sized businesses
Small community banking, commercial real estate and C&I focus
Courier pick-up service for small businesses in many markets
Localized banking for consumers
Localized marketing compliments bank-wide brand advertising
Free checking for consumers, businesses and not-for-profit
organizations
Free bill pay
Local market private banking services
Sales results are monitored on a daily basis
24
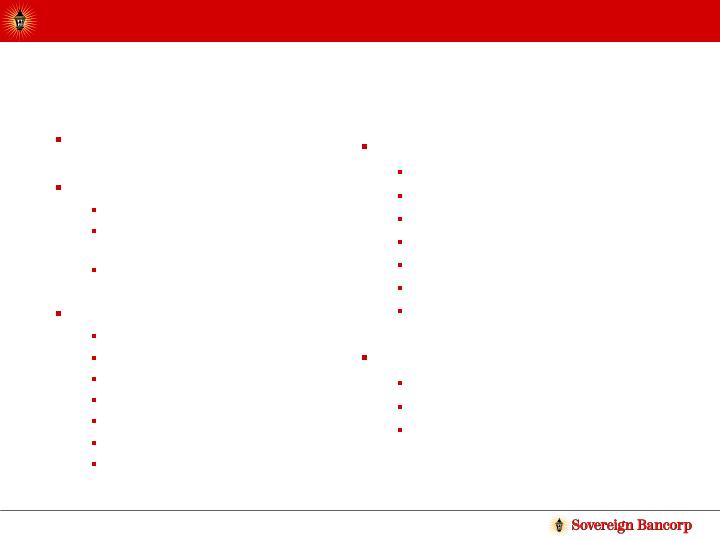
What We Measure For Each Market
Market ROA
Asset Quality:
Loan delinquency
Non-performing loans to
total loans
Net charge-offs
Interest Rate Risk:
Net interest income
Average deposits
Net loan yields
Net deposit costs
Market core margin
Coupon on new loans
Number of DDA accounts
Productivity:
Net income
Efficiency ratio
Other income vs. budget
New commitments booked
Investment services
G&A vs. budget
Fee retention
Sales & Service
Red Carpet Service
Team members
Team member retention
25

Redefining Convenience
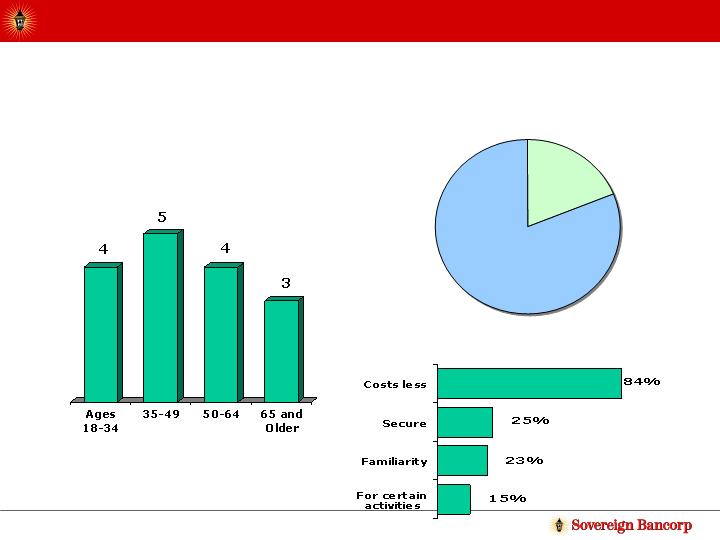
Automated Teller Machines
Most consumers use ATMs an
average of four times a month…
…and over 80% prefer to use their
banks’ machines…
Own
institution
81%
Most
convenient
19%
…because they are less expensive,
though security was a factor too.
Source: Synergistics Research Corp.
27
Sovereign ATMs in CVS/pharmacy Locations
Enables Sovereign to brand nearly 1,300 ATMs in
CVS/pharmacy locations throughout northeastern
United States including Massachusetts, Rhode Island,
northern Connecticut, New Hampshire, eastern
Pennsylvania and southern New Jersey
Opportunity exists to brand ATMs at any new
CVS/pharmacy locations within the same footprint
Surcharge-free to Sovereign customers
Significantly expands ATM network and provides huge
opportunity to attract new customers
28
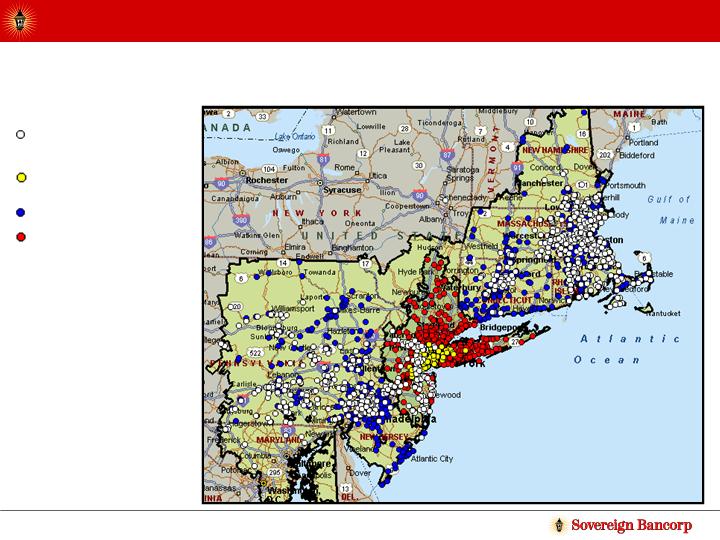
Combined ATM Branding Opportunities
Sovereign ATM sites -
905
CVS Locations - 879
ICBC ATMs sites -
237
NY/NJ CVS -
484
29
Partnership to offer payroll, tax filing and other value-
added services to small business customers
ADP will dedicate over 200 sales professionals directly
to Sovereign
Sovereign will be the first bank in the marketplace to
have a state-of-the-art, web-based, payroll product
Sovereign will become the preferred provider of
Healthcare Savings Accounts (HSAs) for ADP’s Small
Business Division throughout the nation
Additional commercial and retail opportunities for
Sovereign
Expected to add between 5,000 to 10,000 new clients per year
Highlights of the ADP Partnership
30
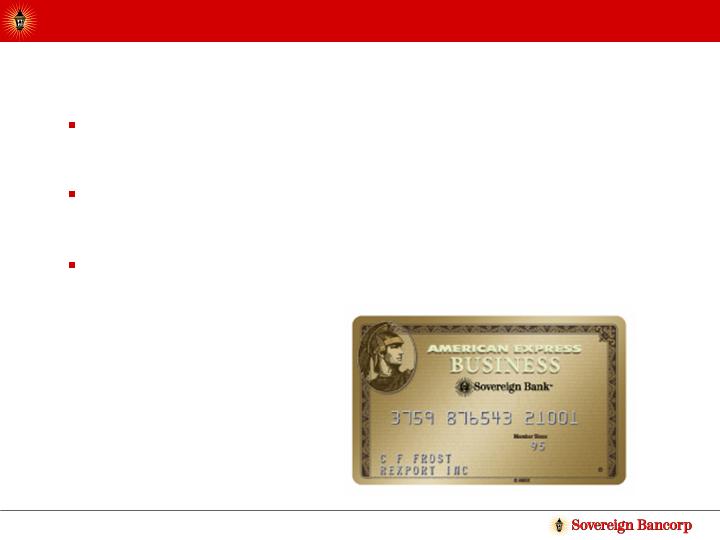
American Express Partnership
Offering American Express Rewards and co-branded
cards to Sovereign’s small business customers
Sovereign is the first bank in the Northeast to offer a
co-branded card with American Express
Objective is to leverage the American Express brand to
help generate core deposits and retain small-business
relationships
31
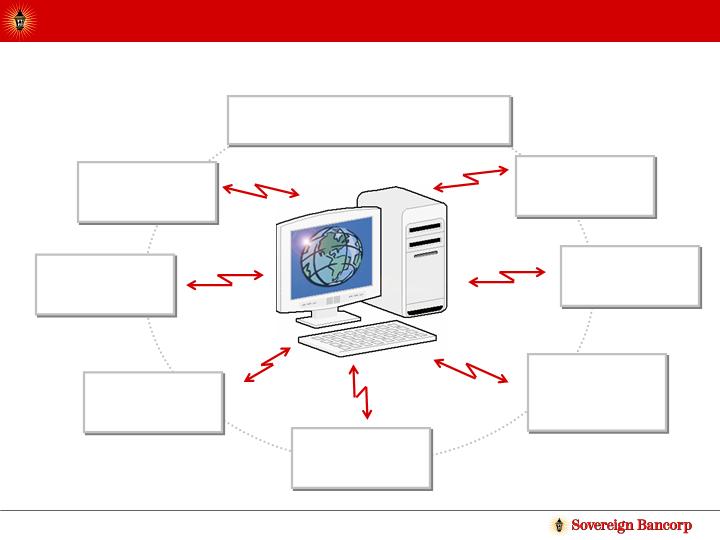
Bringing Sovereign Bank
to our business customers
Onsite
Check
Deposit
Onsite
Official
Check
Health
Savings
Accounts
Small
Business
Cash
Management
Onsite Banking
Account
Opening
Automated
Customer
Alerts
Online
Payroll
Delivery
Convenience Beyond Customers Expectations
32
Expanded Niche Lending Functions
Health Care Lending
Asset Based Lending
Automotive Finance Business
Sports Lending
Global Cash Management
33

Independence Improves
Sovereign’s Franchise
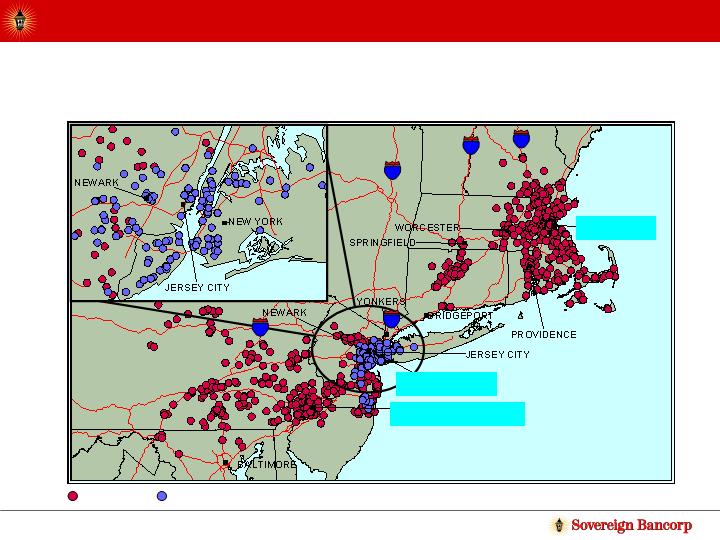
Independence Improves Sovereign’s Footprint
Sovereign
Independence Community
787
91
287
81
293
PHILADELPHIA
NEW YORK
BOSTON
35
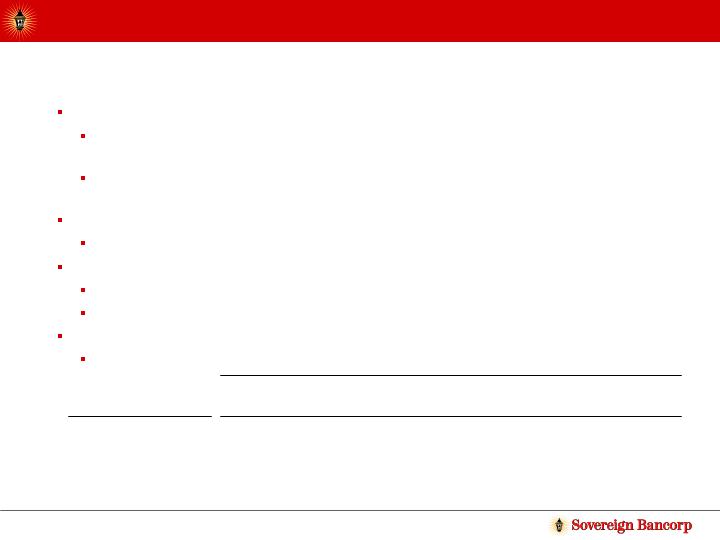
Creates a Leading Northeast-Based Bank
Improves Sovereign’s franchise value
Adds $7.9bn NY deposits and $2.6bn NJ deposits – total proforma NJ
deposits of approximately $10bn
Enhances distribution – 125 branches with an average branch size of
$84MM
Independence has attractive deposit mix
70% of deposits are non-CD deposits
Strong demographics
Serves 300,000 households
Average household income of $59.4K vs. U.S. average of $49.7K
Sovereign now a major player in the 5 largest MSAs in the Northeast
Creates a “New Fleet”
New York
Philadelphia
Boston
Providence
Hartford
MSA
18.9
5.8
4.5
1.6
1.2
222
84
175
55
30
16.2
6.8
9.3
3.2
1.3
Population
(MM)
Branches
Deposits
($Bn)
Pro Forma
36
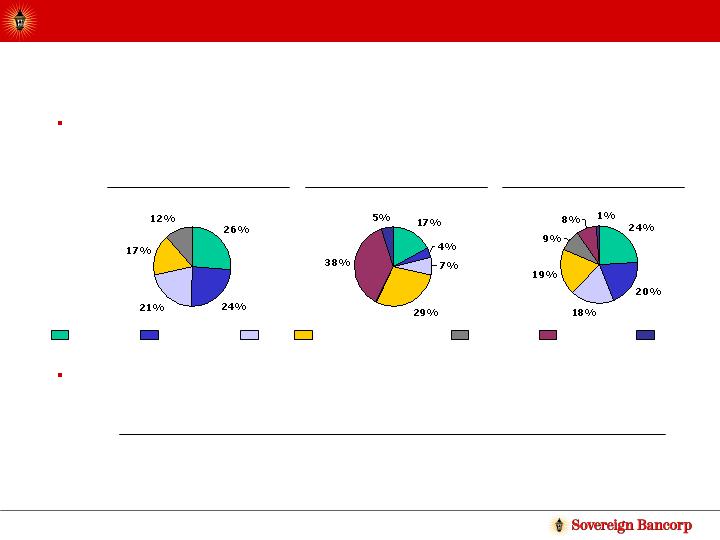
Diversifies loan mix with extension into multi-family lending –
unique relationship with Meridian Capital is strengthened through larger
balance sheet
Strong asset quality – low risk business model has produced exceptional
credit quality
Improved Asset Mix with Low Risk
Sovereign
Independence
Combined
1-4 Family
Home Equity
C&I
Commercial Real Estate
Consumer
Multi Family
Other
$42.7Bn
$12.3Bn
$55.0Bn
240%
235%
241%
Reserves/NPAs
0.16%
0.02%
0.20%
NCOs/Avg Loans
0.41%
0.35%
0.42%
NPAs/Loans+OREO
Combined
Independence
Sovereign
As of 9/30/05
37
Financially Attractive
Consistent with Sovereign’s stated acquisition criteria
Internal Rate of Return of 15%
15% cost saves vs. 29%(a) in announced New York MSA
transactions since 2001
Substantial revenue enhancements identified not assumed
Expansion of multi-family lending in Sovereign markets
(e.g., Philadelphia, Boston)
Open new markets to deliver broader array of products (cash
management, capital markets, commercial lending and
government banking)
(a) Source: SNL.
38

The Santander Partnership -
Building a Better Bank for
Shareholders, Customers
and Community
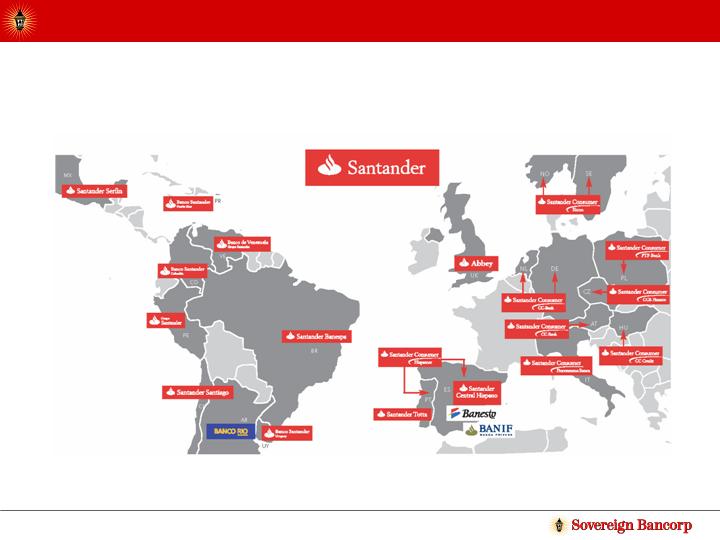
Global Footprint of Santander
40

Santander Partnership Makes Independence
Acquisition Attractive
Santander
Mkt. Cap: $80.1 bn
Independence
Mkt. Cap: $2.7 bn
Sovereign
Mkt. Cap: $9.0 bn
Cash ($2.4 bn)
Cash ($3.6 bn)
19.8% Ownership
$27.00 per SOV share
$462 million premium (1)
$1.2 bn of cash provided through
issuance of Tier 1 Capital or debt
100% Ownership
$42.00 per ICBC share
N.B. Market Cap statistics as of announcement.
1)
Based on 20-day trailing average price.
41
Benefits of the Santander Transaction
Allows Sovereign to acquire Independence, which would have
been difficult without Santander’s investment, at a premium
Access to capital; Santander has committed to “backstop”
financing
Santander partnership provides sharing of best practices and
operational know-how
Positioned for “full” price possible sale to Santander or
another party over 2-5 year period after closing
42
Examples of Opportunities to Share Best Practices
Hispanic Market
40% of Hispanics in Sovereign and Independence footprint are Puerto
Ricans, Santander has the second largest bank in Puerto Rico
Auto Finance
Santander is the largest non-captive auto finance player in Europe,
financing 1 million cars; Sovereign is a leading auto finance player in the
northeastern U.S.
Cash Management
Sovereign and Santander are discussing the outsourcing of all Santander’s
U.S. dollar cash management business to Sovereign
Funding/Access to Capital
S&P anticipates raising Sovereign’s ratings one notch following the deal
giving consideration to the foothold the Independence acquisitions
provides Sovereign in the desirable NY/NJ marketplace and Sovereign’s
commitment to rebuild capital. We hope other rating agencies will follow.
Operational Enhancements and Technology Sharing
Santander is the 9th largest bank in the world with world-class banking
related technology systems which Santander intends to share with
Sovereign and a well-respected global partner
43

Potential Shareholder
Value Creation
Clear and Consistent Strategy and Tactics for
the Future
Strong, experienced and deep management team in place
Exceptional franchise and strategy to seize superior growth
opportunities
Focus remains on superior execution and taking advantage of
“emerging markets” within the United States
As we execute, we will remain committed to our critical
success factors of:
Superior asset quality
Superior risk management
Strong sales and service culture that aligns team member
performance with a recognition and rewards system
High level of productivity through revenue growth and
efficient expense control
45
Major Goals for 2006 – 2007
Positive operating/cash earnings growth in a flat yield
curve
Achieve or exceed financial assumptions of
Independence acquisition
Embark on strategy for capturing larger share of the
Hispanic market
Maintain expense control discipline
Stable asset quality
46
Sovereign is committed to building
above-average short-term and long-term
shareholder value while building a better
bank for our customers, communities
and team members.
47

Appendix

Operating and Cash Earnings Per Share
This presentation contains financial information determined by methods
other than in accordance with U.S. Generally Accepted Accounting
Principles (“GAAP”)
Sovereign’s management uses the non-GAAP measures of Operating
Earnings and Cash Earnings in its analysis of the company’s
performance. These measures typically adjust net income determined
in accordance with GAAP to exclude the effects of special items,
including significant gains or losses that are unusual in nature or are
associated with acquiring and integrating businesses, and certain non-
cash charges
Since certain of these items and their impact on Sovereign’s
performance are difficult to predict, management believes presentations
of financial measures excluding the impact of these items provide useful
supplemental information in evaluating the operating results of
Sovereign’s core businesses
These disclosures should not be viewed as a substitute for net income
determined in accordance with GAAP, nor are they necessarily
comparable to non-GAAP performance measures, which may be
presented by other companies
49
One Non-GAAP Financial Measure
Effective in the fourth quarter of 2004, Sovereign moved to
one non-GAAP financial measure – Operating/Cash Earnings
Provides greater financial transparency
Provides useful supplemental information when evaluating
Sovereign’s core businesses
Consistent with SEC’s publicly stated desire for fewer non-GAAP
disclosures
Operating/Cash Earnings represent net income adjusted for
after-tax effects of merger-related and integration charges,
any other non-recurring charges and the amortization of
intangible assets
50
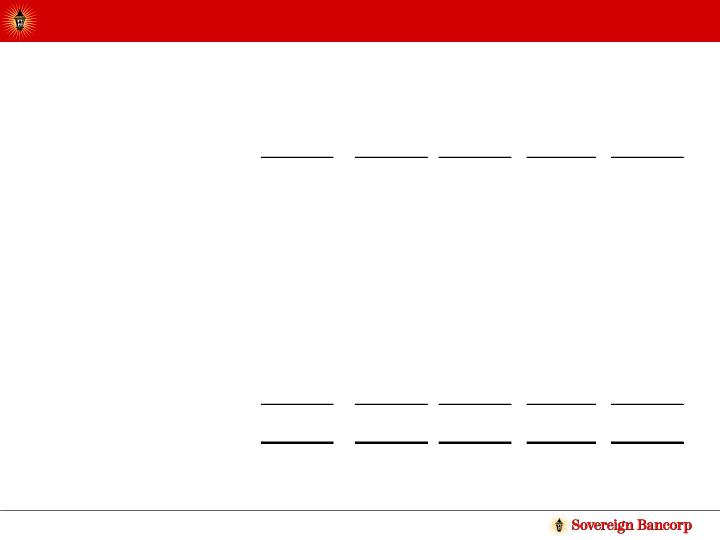
Reconciliation of Operating/Cash Earnings
to GAAP Earnings - Actual
51
(1)
(1) Net Income for EPS purposes
($ in thousands, all numbers shown net of tax)
Year Ended December 31,
2005
2004
2003
2002
2001
Net Income/(loss) as reported
701,587
$
453,552
$
401,851
$
341,985
$
116,821
$
Merger-related and
integration costs
8,284
30,134
10,316
Provision for Loan Loss
3,900
3,900
Restructuring of Balance Sheet
42,605
18,838
6,549
Restructuring Charges
2,589
5,525
Impairment Charge for FNMA and
FHLMC Preferred Stock
20,891
Financing-Related Adjustments
Non-solicitation Expense
158,106
Proxy and related professional fees
3,788
Amoritzation of Intangibles
47,984
51,186
50,100
54,121
89,408
Operating/Cash Earnings for EPS
purposes
764,232
$
602,268
$
470,789
$
410,322
$
376,409
$
Note: Further details are available on our web site at www.sovereignbank.com and in our Annual Reports to
Shareholders
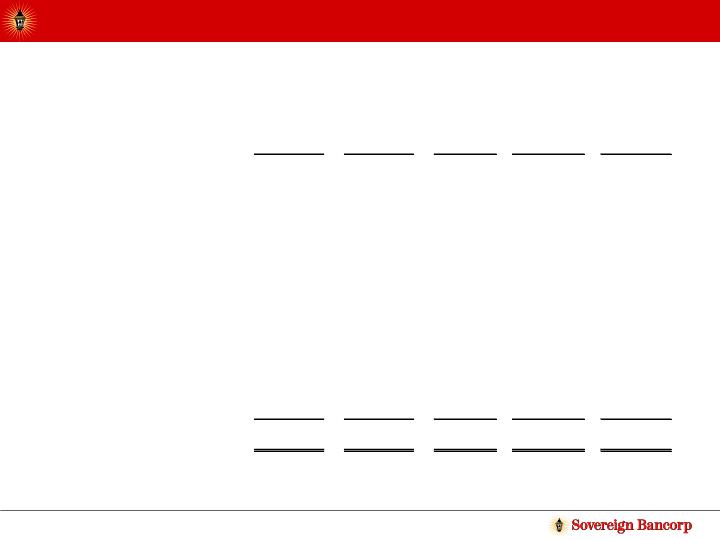
Reconciliation of Operating/Cash EPS to
GAAP EPS - Actual
52
Year Ended December 31,
2005
2004
2003
2002
2001
Diluted Earnings per Share
1.77
$
1.38
$
1.38
$
1.23
$
0.45
$
Merger-related and
integration costs
0.02
$
0.09
$
0.04
$
Provision for Loan Loss
0.01
$
0.01
$
Restructuring of Balance Sheet
0.13
$
0.07
$
0.03
$
Restructuring Charges
0.01
$
0.02
$
Impairment Charge for FNMA and
FHLMC Preferred Stock
0.06
$
Financing-Related Adjustments
Non-solicitation Expense
0.62
$
Proxy and related professional fees
0.01
$
Amoritzation of Intangibles
0.12
$
0.16
$
0.17
$
0.19
$
0.35
$
Operating/Cash Earnings per Share
1.93
$
1.83
$
1.62
$
1.47
$
1.47
$
Note: Further details are available on our web site at www.sovereignbank.com and in our Annual Reports to Shareholders

Sovereign Bancorp, Inc.


