Sovereign Bank, N.A. Investor Update June 2012

2 Disclaimer Banco Santander, S.A. (“Santander”), Santander Holdings USA, Inc. (“SHUSA”), Sovereign Bank, N.A.(“Sovereign”), and Santander Consumer USA, Inc. (“SCUSA”) caution that this presentation contains forward-looking statements within the meaning of the U.S. Private Securities Litigation Reform Act of 1995. These forward-looking statements are found in various places throughout this presentation and include, without limitation, statements concerning our future business development and economic performance. While these forward-looking statements represent our judgment and future expectations concerning the development of our business, a number of risks, uncertainties, and other important factors could cause actual developments and results to different materially from our expectations. These factors include, but are not limited to: (1) general market, macro-economic, governmental, and regulatory trends; (2) movements in local and international securities markets, currency exchange rates, and interest rates; (3) competitive pressures; (4) technological developments; and (5) changes in the financial position or credit worthiness of our customers, obligors, and counterparties. The risk factors and other key factors that we have indicated in our past and future filings and reports, including our Annual Report on Form 10-K for the year ended December 31, 2011 and other filings and reports with the Securities and Exchange Commission of the United States of America (the “SEC”), could adversely affect our business and financial performance. Other unknown and unpredictable factors could cause actual results to differ materially from those in the forward- looking statements. The information contained in this presentation is not complete. It is subject to, and must be read in conjunction with, all other publicly available information, including reports filed with or furnished to the SEC, press releases, and other relevant information. Because this information is intended only to assist investors, it does not constitute investment advice or an offer to invest or to provide management services. It is subject to correction, completion, and amendment without notice. It is not our intention to state, indicate, or imply in any manner that current or past results are indicative of future results or expectations. As with all investments, there are associated risks, and you could lose money investing. Prior to making any investment, a prospective investor should consult with its own investment, accounting, legal, and tax advisers to evaluate independently the risks, consequences, and suitability of that investment. The information in this presentation is not intended to constitute “research” as that term is defined by applicable regulations. Nothing in this presentation constitutes investment, legal, accounting, or tax advice, or a representation that any investment or strategy is suitable or appropriate to your individual circumstances, or otherwise constitutes a personal recommendation to you. Recipients of this presentation should obtain advice based on their own individual circumstances from their own tax, financial, legal, and other advisers before making an investment decision, and only make such decisions on the basis of the investor’s own objectives, experience, and resources. In making this presentation available, Santander, SHUSA, Sovereign, and SCUSA give no advice and make no recommendation to buy, sell, or otherwise deal in shares or other securities of Santander, SHUSA, Sovereign, or SCUSA, or in any other securities or investments whatsoever. No offering of Securities shall be made in the United States except pursuant to registration under the U.S. Securities Act of 1933, as amended, or an exemption there from. Nothing contained in this presentation is intended to constitute an invitation or inducement to engage in investment activity for the purposes of the prohibition on financial promotion in the U.K. Financial Services and Markets Act 2000. In this presentation, we will sometimes refer to certain non-GAAP figures or financial ratios to help illustrate certain concepts. These ratios, each of which is defined in this document, include Pre-Tax Pre-Provision Income, the Tangible Common Equity to Tangible Assets Ratio, and the Texas Ratio. This information supplements our results as reported in accordance with GAAP and should not be viewed in isolation from, or as a substitute for, our GAAP results. We believe that this additional information and the reconciliations we provide may be useful to investors, analysts, regulators and others as they evaluate the impact of these respective items on our results for the periods presented due to the extent to which the items are not indicative of our ongoing operations. Where applicable, we provide GAAP reconciliations for such additional information. Note: Nothing in this presentation should be construed as a profit forecast. Past performance should not be taken as an indication or guarantee of future performance, and no representation or warranty, express or implied, is made regarding performance. Information, opinions, and estimates contained in this presentation reflect a judgment at its original date of publication by Santander, SHUSA, Sovereign, and SCUSA and are subject to change without notice. Santander, SHUSA, Sovereign, and SCUSA have no obligation to update, modify, or amend this presentation or to otherwise notify a recipient thereof in the event that any information, opinion, or estimate set forth herein changes or subsequently becomes inaccurate. This presentation is provided for information purposes only. The numbers and financial statements included in this presentation represent the results of Sovereign Bank, N.A.– a subsidiary of Santander Holdings, USA .
3 Credit Review Overview 1Q12 Results Liquidity and Capital Agenda Appendix
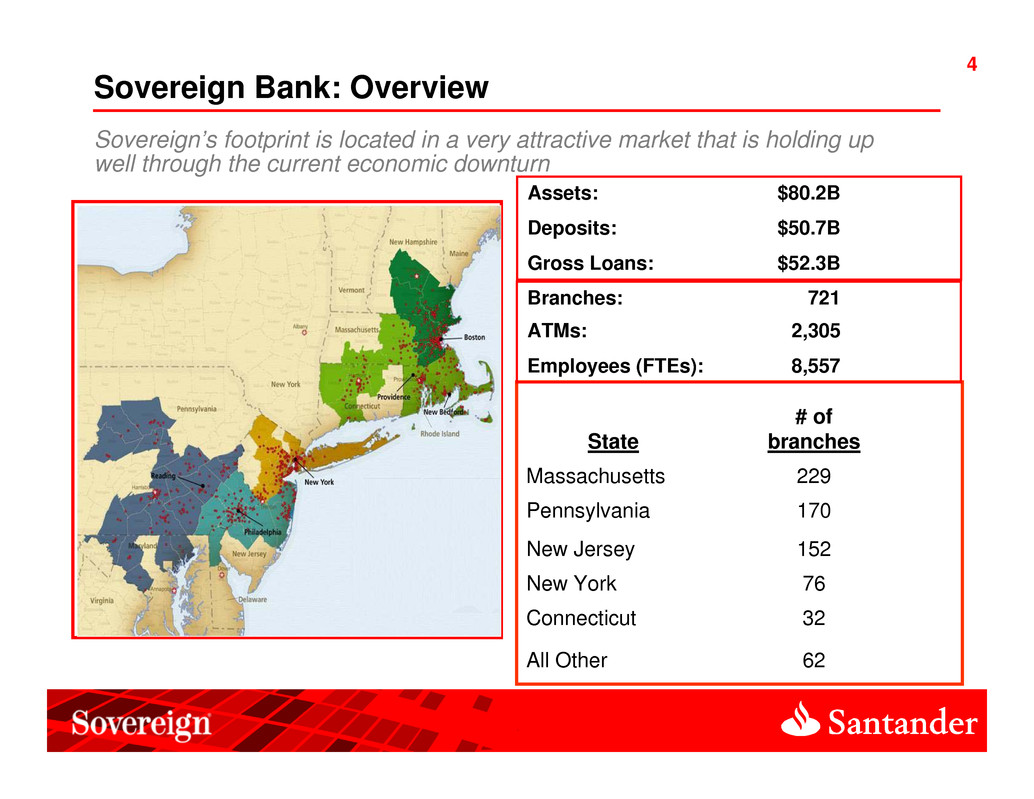
4 Sovereign Bank: Overview State # of branches Massachusetts 229 Pennsylvania 170 New Jersey 152 New York 76 Connecticut 32 All Other 62 Branches: 721 ATMs: 2,305 Employees (FTEs): 8,557 Sovereign’s footprint is located in a very attractive market that is holding up well through the current economic downturn Assets: $80.2B Deposits: $50.7B Gross Loans: $52.3B
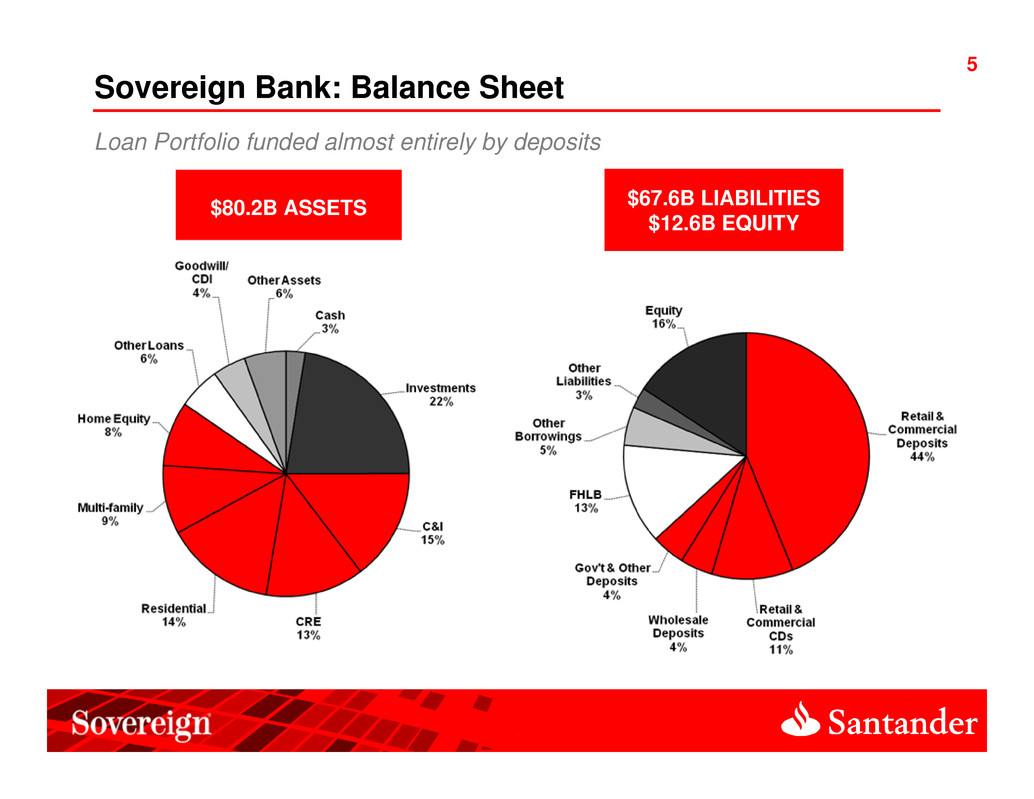
5 Sovereign Bank: Balance Sheet $67.6B LIABILITIES $12.6B EQUITY Loan Portfolio funded almost entirely by deposits $80.2B ASSETS
6 Credit Review Overview 1Q12 Results Liquidity and Capital Agenda Appendix
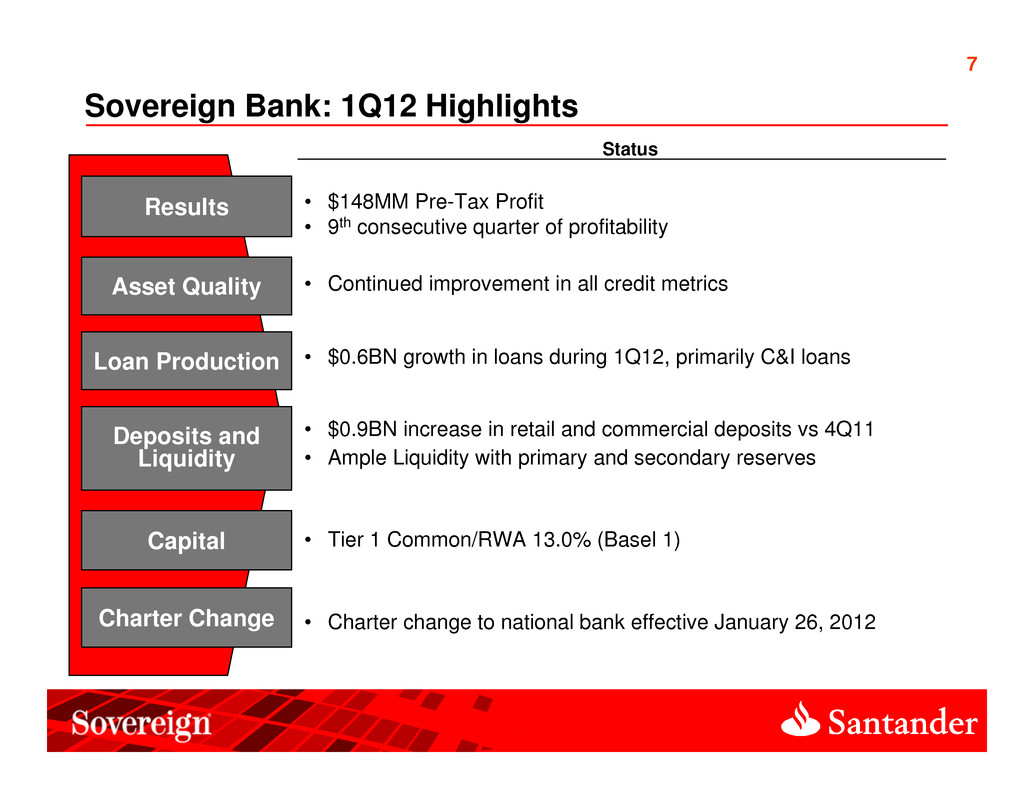
7 Sovereign Bank: 1Q12 Highlights Results • $148MM Pre-Tax Profit • 9th consecutive quarter of profitability Asset Quality Loan Production • $0.6BN growth in loans during 1Q12, primarily C&I loans • Continued improvement in all credit metrics Status Capital • Tier 1 Common/RWA 13.0% (Basel 1) Deposits and Liquidity • $0.9BN increase in retail and commercial deposits vs 4Q11 • Ample Liquidity with primary and secondary reserves Charter Change • Charter change to national bank effective January 26, 2012
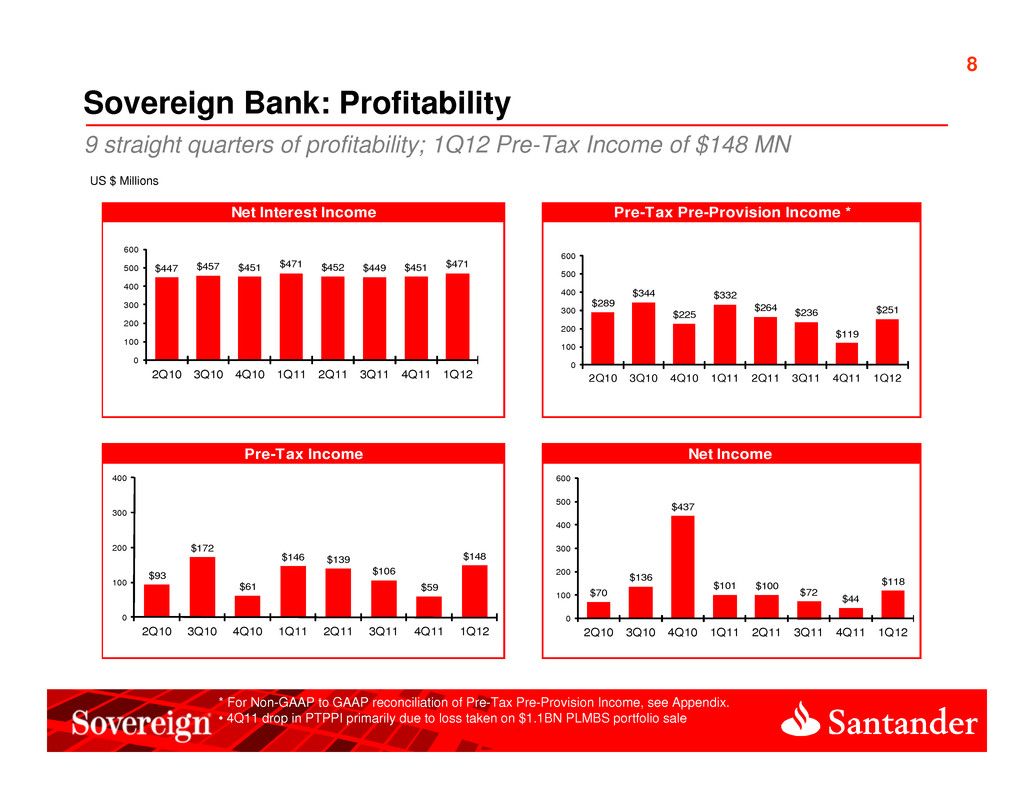
8 Sovereign Bank: Profitability 9 straight quarters of profitability; 1Q12 Pre-Tax Income of $148 MN US $ Millions * For Non-GAAP to GAAP reconciliation of Pre-Tax Pre-Provision Income, see Appendix. • 4Q11 drop in PTPPI primarily due to loss taken on $1.1BN PLMBS portfolio sale Net Interest Income Pre-Tax Pre-Provision Income * Pre-Tax Income Net Income $289 $344 $225 $332 $264 $236 $119 $251 0 100 200 300 400 500 600 2Q10 3Q10 4Q10 1Q11 2Q11 3Q11 4Q11 1Q12 $447 $457 $451 $471 $452 $449 $451 $471 0 100 200 300 400 500 600 2Q10 3Q10 4Q10 1Q11 2Q11 3Q11 4Q11 1Q12 $93 $172 $61 $146 $139 $106 $59 $148 0 100 200 300 400 2Q10 3Q10 4Q10 1Q11 2Q11 3Q11 4Q11 1Q12 $70 $136 $437 $101 $100 $72 $44 $118 0 100 200 300 400 500 600 2Q10 3Q10 4Q10 1Q11 2Q11 3Q11 4Q11 1Q12
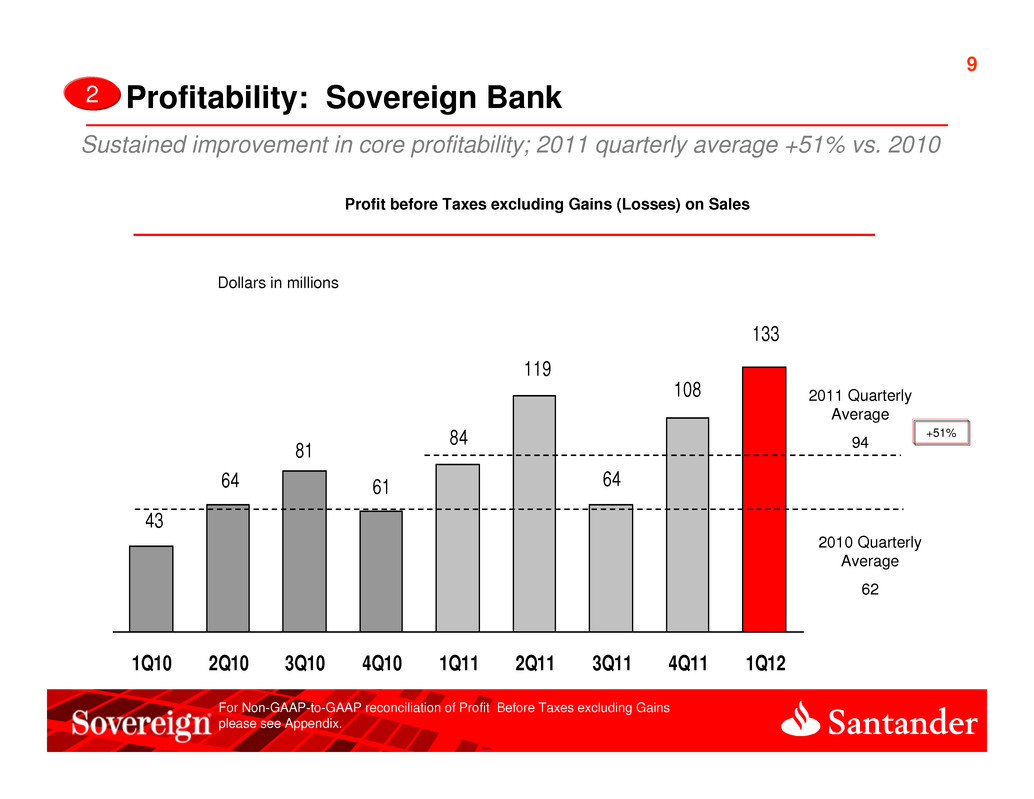
9 Profitability: Sovereign Bank Sustained improvement in core profitability; 2011 quarterly average +51% vs. 2010 Quarterly Profit before Taxes excluding Gains (Losses) on Sales 108 64 119 84 61 81 64 43 133 1Q10 2Q10 3Q10 4Q10 1Q11 2Q11 3Q11 4Q11 1Q12 2011 Quarterly Average 94 2010 Quarterly Average 62 Dollars in millions +51% 2 For Non-GAAP-to-GAAP reconciliation of Profit Before Taxes excluding Gains please see Appendix.
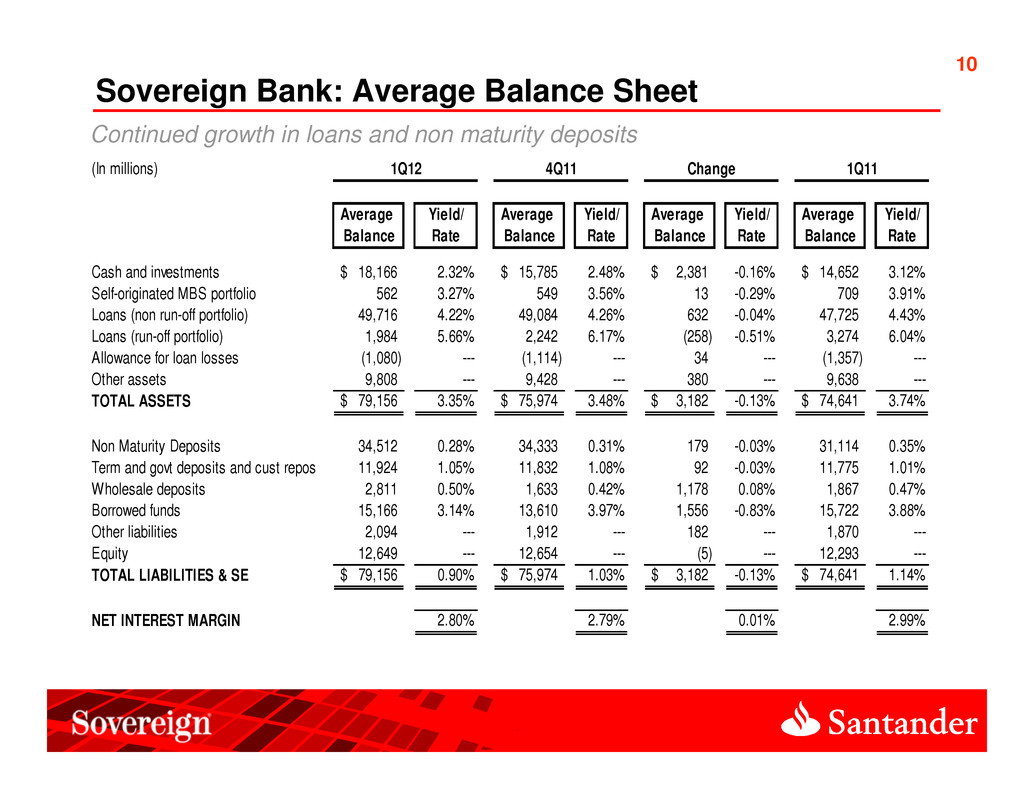
10 Sovereign Bank: Average Balance Sheet Continued growth in loans and non maturity deposits (In millions) Average Yield/ Average Yield/ Average Yield/ Average Yield/ Balance Rate Balance Rate Balance Rate Balance Rate Cash and investments 18,166$ 2.32% 15,785$ 2.48% 2,381$ -0.16% 14,652$ 3.12% Self-originated MBS portfolio 562 3.27% 549 3.56% 13 -0.29% 709 3.91% Loans (non run-off portfolio) 49,716 4.22% 49,084 4.26% 632 -0.04% 47,725 4.43% Loans (run-off portfolio) 1,984 5.66% 2,242 6.17% (258) -0.51% 3,274 6.04% Allowance for loan losses (1,080) --- (1,114) --- 34 --- (1,357) --- Other assets 9,808 --- 9,428 --- 380 --- 9,638 --- TOTAL ASSETS 79,156$ 3.35% 75,974$ 3.48% 3,182$ -0.13% 74,641$ 3.74% Non Maturity Deposits 34,512 0.28% 34,333 0.31% 179 -0.03% 31,114 0.35% Term and govt deposits and cust repos 11,924 1.05% 11,832 1.08% 92 -0.03% 11,775 1.01% Wholesale deposits 2,811 0.50% 1,633 0.42% 1,178 0.08% 1,867 0.47% Borrowed funds 15,166 3.14% 13,610 3.97% 1,556 -0.83% 15,722 3.88% Other liabilities 2,094 --- 1,912 --- 182 --- 1,870 --- Equity 12,649 --- 12,654 --- (5) --- 12,293 --- TOTAL LIABILITIES & SE 79,156$ 0.90% 75,974$ 1.03% 3,182$ -0.13% 74,641$ 1.14% NET INTEREST MARGIN 2.80% 2.79% 0.01% 2.99% 1Q12 1Q114Q11 Change
11 Credit Review Overview 1Q12 Results Liquidity and Capital Agenda Appendix
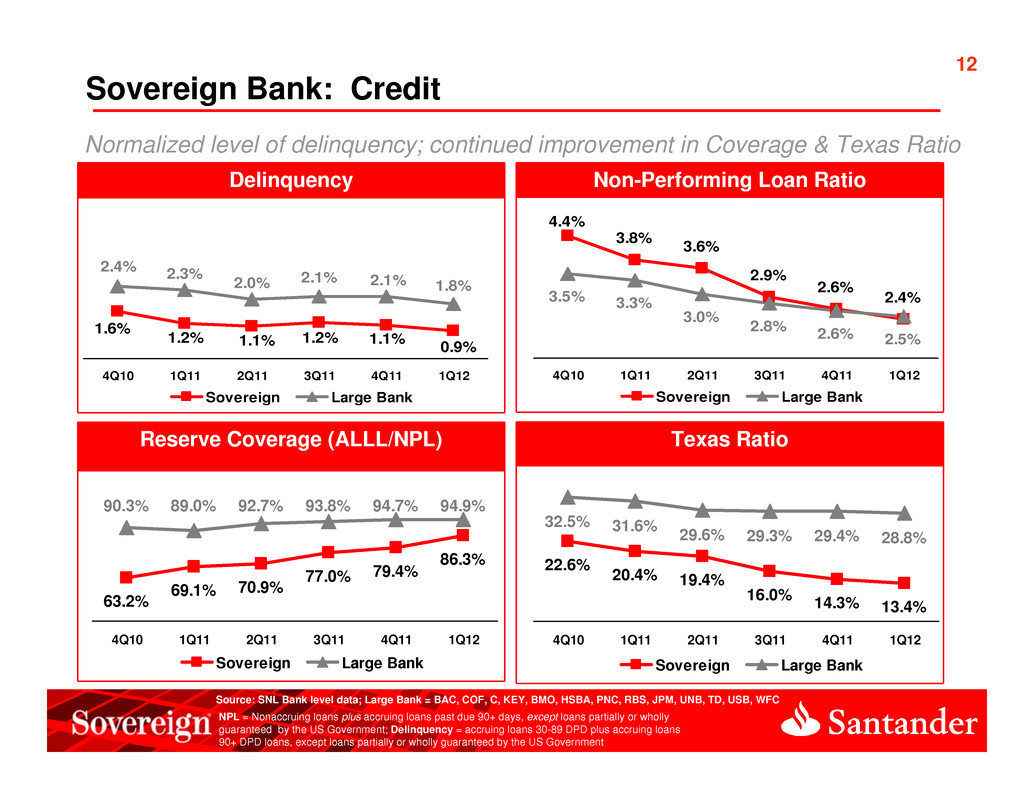
12 Non-Performing Loan RatioDelinquency Sovereign Bank: Credit Normalized level of delinquency; continued improvement in Coverage & Texas Ratio Source: SNL Bank level data; Large Bank = BAC, COF, C, KEY, BMO, HSBA, PNC, RBS, JPM, UNB, TD, USB, WFC NPL = Nonaccruing loans plus accruing loans past due 90+ days, except loans partially or wholly guaranteed by the US Government; Delinquency = accruing loans 30-89 DPD plus accruing loans 90+ DPD loans, except loans partially or wholly guaranteed by the US Government 3.8% 3.6% 2.9% 2.6% 2.4% 4.4% 3.5% 3.3% 3.0% 2.8% 2.6% 2.5% 4Q10 1Q11 2Q11 3Q11 4Q11 1Q12 Sovereign Large Bank Reserve Coverage (ALLL/NPL) 69.1% 70.9% 77.0% 79.4% 86.3% 63.2% 90.3% 89.0% 92.7% 93.8% 94.7% 94.9% 4Q10 1Q11 2Q11 3Q11 4Q11 1Q12 Sovereign Large Bank Texas Ratio 20.4% 19.4% 16.0% 14.3% 13.4% 22.6% 32.5% 31.6% 29.6% 29.3% 29.4% 28.8% 4Q10 1Q11 2Q11 3Q11 4Q11 1Q12 Sovereign Large Bank 1.2% 1.1% 1.2% 1.1% 0.9% 1.6% 2.4% 2.3% 2.0% 2.1% 2.1% 1.8% 4Q10 1Q11 2Q11 3Q11 4Q11 1Q12 Sovereign Large Bank
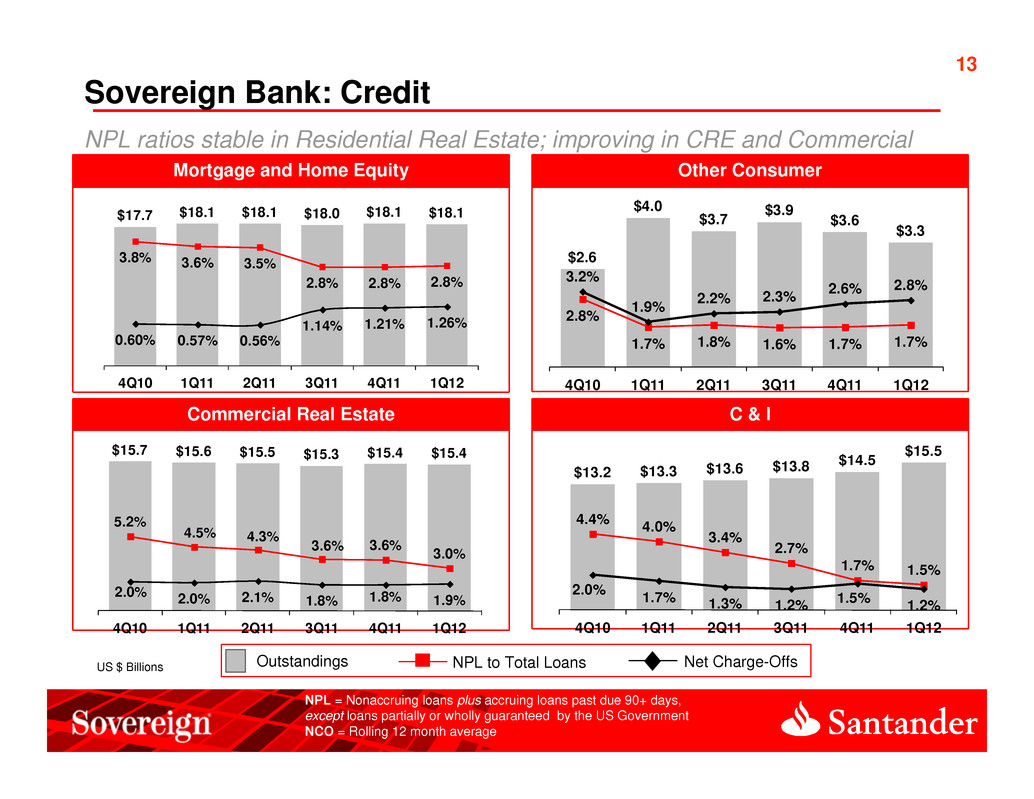
13 NPL ratios stable in Residential Real Estate; improving in CRE and Commercial US $ Billions Mortgage and Home Equity Commercial Real Estate Other Consumer C & I Outstandings NPL to Total Loans Net Charge-Offs Sovereign Bank: Credit NPL = Nonaccruing loans plus accruing loans past due 90+ days, except loans partially or wholly guaranteed by the US Government NCO = Rolling 12 month average $17.7 $18.1 $18.1 $18.0 $18.1 $18.1 3.8% 3.6% 3.5% 2.8% 2.8% 2.8% 0.60% 0.57% 0.56% 1.14% 1.21% 1.26% 4Q10 1Q11 2Q11 3Q11 4Q11 1Q12 $2.6 $4.0 $3.7 $3.9 $3.6 $3.3 2.8% 1.7% 1.8% 1.6% 1.7% 1.7% 3.2% 1.9% 2.2% 2.3% 2.6% 2.8% 4Q10 1Q11 2Q11 3Q11 4Q11 1Q12 $15.7 $15.6 $15.5 $15.3 $15.4 $15.4 5.2% 4.5% 4.3% 3.6% 3.6% 3.0% 2.0% 2.0% 2.1% 1.8% 1.8% 1.9% 4Q10 1Q11 2Q11 3Q11 4Q11 1Q12 $13.2 $13.3 $13.6 $13.8 $14.5 $15.5 4.4% 4.0% 3.4% 2.7% 1.7% 1.5% 2.0% 1.7% 1.3% 1.2% 1.5% 1.2% 4Q10 1Q11 2Q11 3Q11 4Q11 1Q12
14 Credit Review Overview 1Q12 Results Liquidity and Capital Agenda Appendix
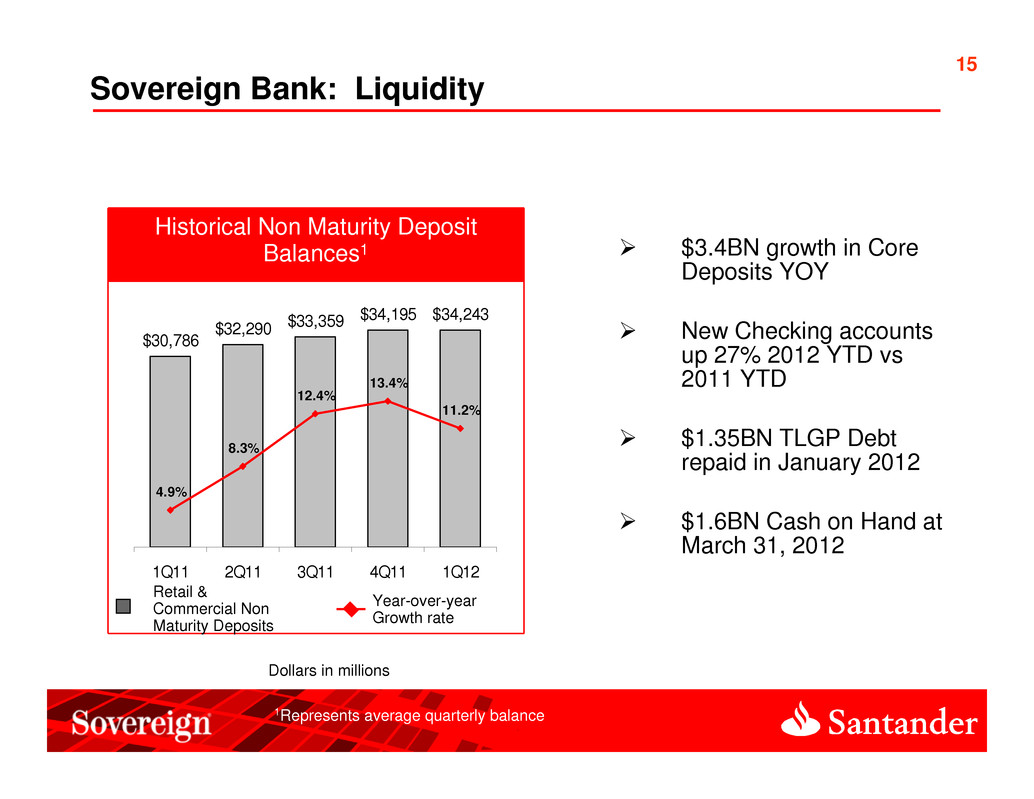
15 Historical Non Maturity Deposit Balances1 $3.4BN growth in Core Deposits YOY New Checking accounts up 27% 2012 YTD vs 2011 YTD $1.35BN TLGP Debt repaid in January 2012 $1.6BN Cash on Hand at March 31, 2012 Sovereign Bank: Liquidity $30,786 $32,290 $33,359 $34,195 $34,243 4.9% 8.3% 12.4% 13.4% 11.2% 1Q11 2Q11 3Q11 4Q11 1Q12 Year-over-year Growth rate Retail & Commercial Non Maturity Deposits 1Represents average quarterly balance Dollars in millions

16 Sovereign Bank: Capital Ratios – Basel 1 Sovereign Bank has a solid capital position Quarterly dividend from Bank to SHUSA re-established in 2Q12 Tier 1 Common Tier 1 Risk-Based Tier 1 Leverage Total Risk Based 13.5% 13.9% 14.3% 13.0%14.1% 1Q11 2Q11 3Q11 4Q11 1Q12 11.0% 11.2% 11.6% 10.6%11.2% 1Q11 2Q11 3Q11 4Q11 1Q12 13.6% 14.1% 14.4% 13.0% 14.2% 1Q11 2Q11 3Q11 4Q11 1Q12 16.0% 16.4% 16.7% 15.1%16.5% 1Q11 2Q11 3Q11 4Q11 1Q12
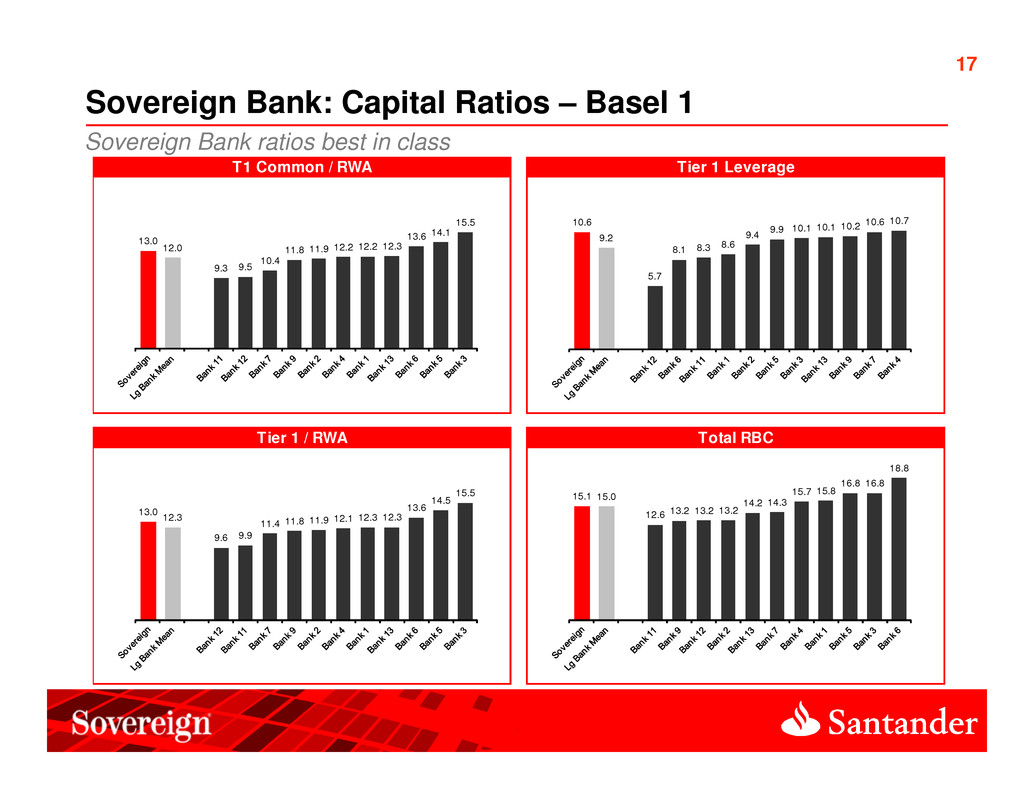
17 T1 Common / RWA Tier 1 Leverage Tier 1 / RWA Total RBC 13.0 12.0 9.3 9.5 10.4 11.8 11.9 12.2 12.2 12.3 13.6 14.1 15.5 10.6 9.2 5.7 8.1 8.3 8.6 9.4 9.9 10.1 10.1 10.2 10.6 10.7 13.0 12.3 9.6 9.9 11.4 11.8 11.9 12.1 12.3 12.3 13.6 14.5 15.5 15.1 15.0 12.6 13.2 13.2 13.2 14.2 14.3 15.7 15.8 16.8 16.8 18.8 Sovereign Bank: Capital Ratios – Basel 1 Sovereign Bank ratios best in class

18 Credit Review Overview 1Q12 Results Liquidity and Capital Agenda Appendix
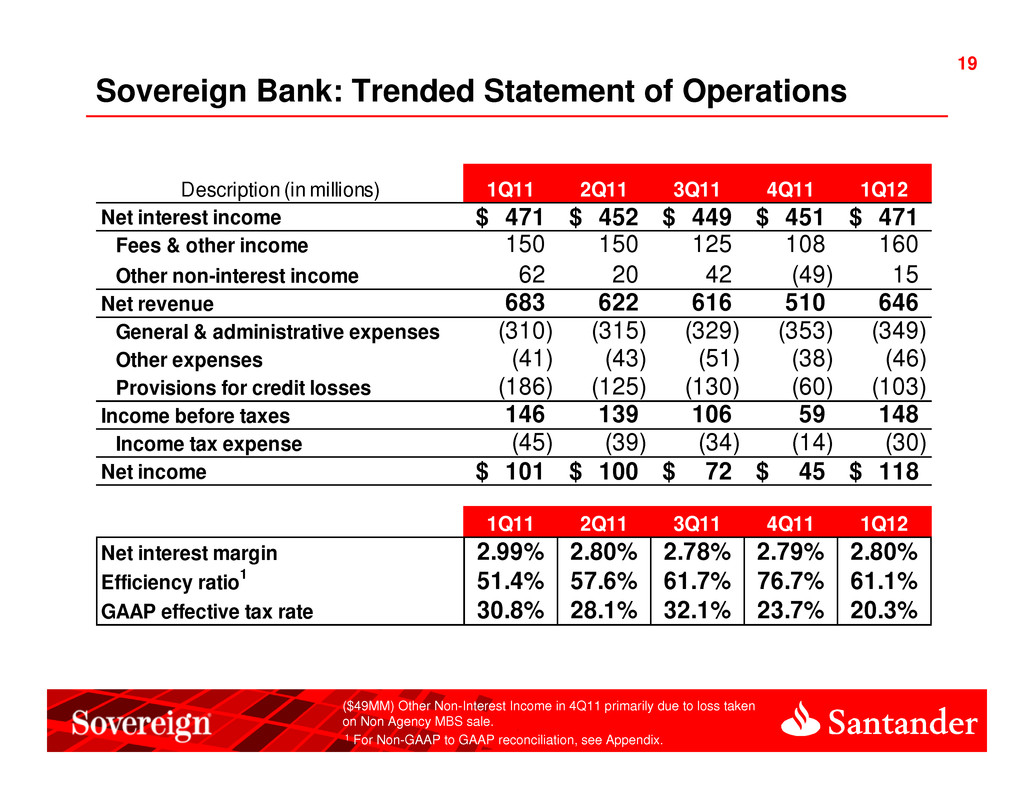
19 19 Sovereign Bank: Trended Statement of Operations 1 For Non-GAAP to GAAP reconciliation, see Appendix. ($49MM) Other Non-Interest Income in 4Q11 primarily due to loss taken on Non Agency MBS sale. Description (in millions) 1Q11 2Q11 3Q11 4Q11 1Q12 Net interest income 471$ 452$ 449$ 451$ 471$ Fees & other income 150 150 125 108 160 Other non-interest income 62 20 42 (49) 15 Net revenue 683 622 616 510 646 General & administrative expenses (310) (315) (329) (353) (349) Other expenses (41) (43) (51) (38) (46) Provisions for credit losses (186) (125) (130) (60) (103) Income before taxes 146 139 106 59 148 Income tax expense (45) (39) (34) (14) (30) Net income 101$ 100$ 72$ 45$ 118$ 1Q11 2Q11 3Q11 4Q11 1Q12 Net interest margin 2.99% 2.80% 2.78% 2.79% 2.80% Efficiency ratio1 51.4% 57.6% 61.7% 76.7% 61.1% GAAP effective tax rate 30.8% 28.1% 32.1% 23.7% 20.3%
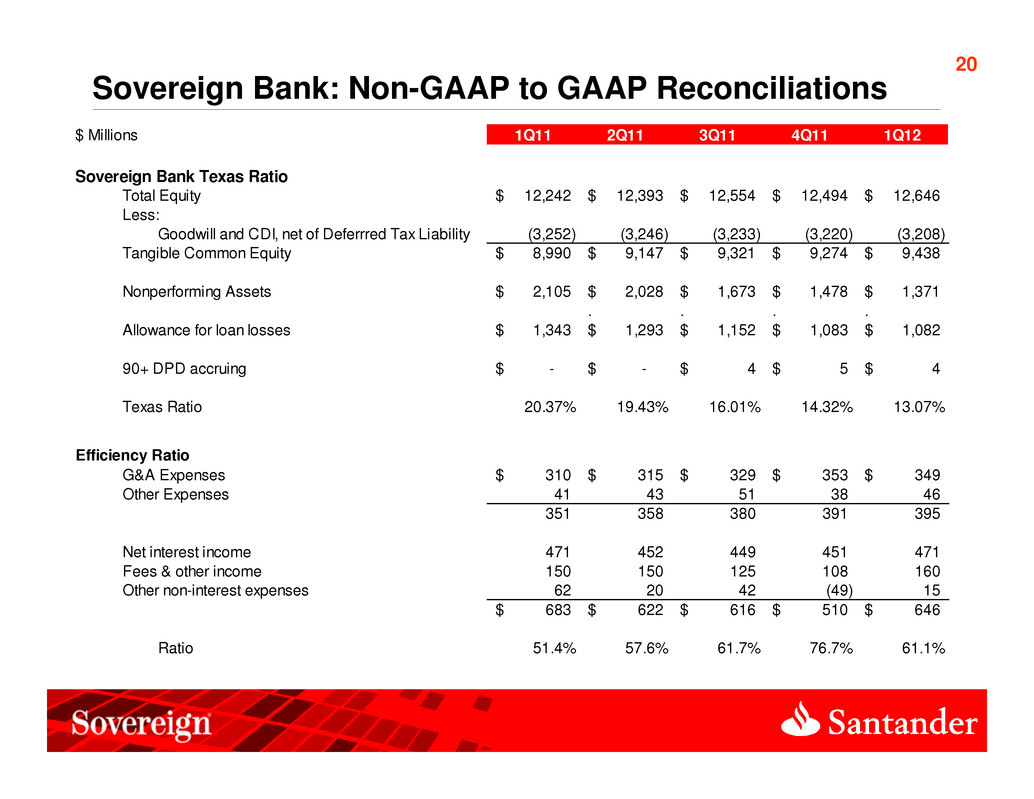
20 Sovereign Bank: Non-GAAP to GAAP Reconciliations $ Millions 1Q11 2Q11 3Q11 4Q11 1Q12 Sovereign Bank Texas Ratio Total Equity 12,242$ 12,393$ 12,554$ 12,494$ 12,646$ Less: Goodwill and CDI, net of Deferrred Tax Liability (3,252) (3,246) (3,233) (3,220) (3,208) Tangible Common Equity 8,990$ 9,147$ 9,321$ 9,274$ 9,438$ Nonperforming Assets 2,105$ 2,028$ 1,673$ 1,478$ 1,371$ . . . . Allowance for loan losses 1,343$ 1,293$ 1,152$ 1,083$ 1,082$ 90+ DPD accruing -$ -$ 4$ 5$ 4$ Texas Ratio 20.37% 19.43% 16.01% 14.32% 13.07% Efficiency Ratio G&A Expenses 310$ 315$ 329$ 353$ 349$ Other Expenses 41 43 51 38 46 351 358 380 391 395 Net interest income 471 452 449 451 471 Fees & other income 150 150 125 108 160 Other non-interest expenses 62 20 42 (49) 15 683$ 622$ 616$ 510$ 646$ Ratio 51.4% 57.6% 61.7% 76.7% 61.1%

21 Sovereign Bank: Non-GAAP to GAAP Reconciliations (cont’d) $ Millions 1Q11 2Q11 3Q11 4Q11 1Q12 Tier 1 Common to Risk Weighted Assets Tier 1 Common Capital 7,660$ 7,911$ 8,150$ 8,066$ 7,871$ Risk Weighted Assets 56,727 56,753 57,097 57,311 60,537 Ratio 13.5% 13.9% 14.3% 14.1% 13.0% Tier 1 Leverage Tier 1 Capital 7,809$ 8,060$ 8,300$ 8,216$ 7,871$ Adjusted Total Assets 71,098 72,089 71,694 73,692 74,386 Ratio 11.0% 11.2% 11.6% 11.2% 10.6% Tier 1 Risk Based Tier 1 Capital 7,809$ 8,060$ 8,300$ 8,216$ 7,871$ Low Level Recourse Deduction (69) (75) (72) (57) - 7,740 7,985 8,228 8,159 7,871 Risk Weighted Assets 56,727 56,753 57,097 57,311 60,537 Ratio 13.6% 14.1% 14.4% 14.2% 13.0% Total Risk Based Risk Based Capital 9,048$ 9,293$ 9,540$ 9,430$ 9,133$ Risk Weighted Assets 56,727 56,753 57,097 57,311 60,537 Ratio 15.9% 16.4% 16.7% 16.5% 15.1%
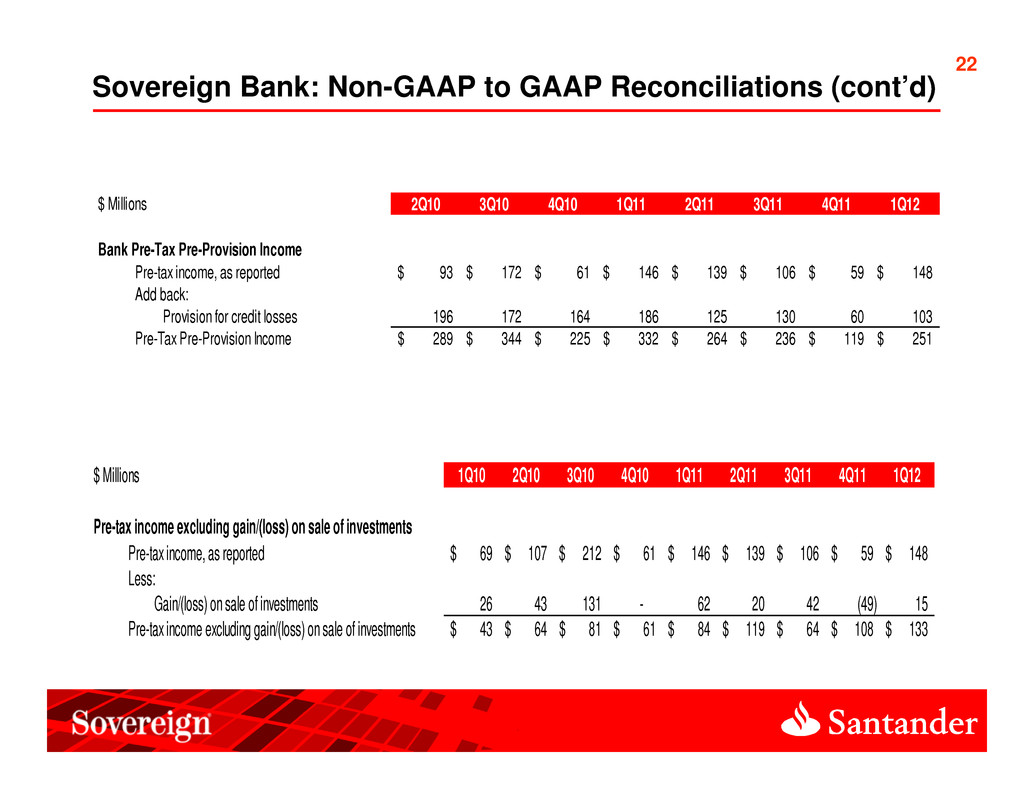
22 Sovereign Bank: Non-GAAP to GAAP Reconciliations (cont’d) $ Millions 2Q10 3Q10 4Q10 1Q11 2Q11 3Q11 4Q11 1Q12 Bank Pre-Tax Pre-Provision Income Pre-tax income, as reported 93$ 172$ 61$ 146$ 139$ 106$ 59$ 148$ Add back: Provision for credit losses 196 172 164 186 125 130 60 103 Pre-Tax Pre-Provision Income 289$ 344$ 225$ 332$ 264$ 236$ 119$ 251$ $ Millions 1Q10 2Q10 3Q10 4Q10 1Q11 2Q11 3Q11 4Q11 1Q12 Pre-tax income excluding gain/(loss) on sale of investments Pre-tax income, as reported 69$ 107$ 212$ 61$ 146$ 139$ 106$ 59$ 148$ Less: Gain/(loss) on sale of investments 26 43 131 - 62 20 42 (49) 15 Pre-tax income excluding gain/(loss) on sale of investments 43$ 64$ 81$ 61$ 84$ 119$ 64$ 108$ 133$


