Santander Holdings USA, Inc. Fixed Income Investors Update Data as of June 30, 2014 September 22, 2014
2 Disclaimer Santander Holdings USA, Inc. (“SHUSA”), and Santander Bank, N.A. (“Santander Bank”) caution that this presentation may contain forward-looking statements within the meaning of the U.S. Private Securities Litigation Reform Act of 1995. These forward-looking statements are found in various places throughout this presentation and include, without limitation, statements concerning our future business development and economic performance. While these forward-looking statements represent our judgment and future expectations concerning the development of our business, a number of risks, uncertainties, and other important factors could cause actual developments and results to differ materially from our expectations. These factors include, but are not limited to: (1) increased regulation and regulatory developments; (2) domestic and international market, macro- economic, governmental, regulatory conditions and trends; (3) movements in local and international securities markets, currency exchange rates, and interest rates; (4) competitive pressures; (5) technological developments; and (6) changes in the financial position or creditworthiness of our customers, obligors, and counterparties. The risk factors and other key factors that we have indicated in our past and future filings and reports, including our Annual Report on Form 10-K for the year ended December 31, 2013 and other filings and reports with the Securities and Exchange Commission (the “SEC”), could adversely affect our business and financial performance. Other factors could cause actual results to differ materially from those in the forward-looking statements. The information contained in this presentation is not complete. It is subject to, and must be read in conjunction with, all other publicly available information, including reports filed with or furnished to the SEC, press releases, and other relevant information. Because this information is intended only to assist investors, it does not constitute investment advice or an offer to invest, and in making this presentation available, SHUSA and Santander Bank give no advice and make no recommendation to buy, sell, or otherwise deal in shares or other securities of Banco Santander (“Santander”), SHUSA, or Santander Bank or in any other securities or investments. This presentation is subject to correction, completion, and amendment without notice. It is not our intention to state, indicate, or imply in any manner that current or past results are indicative of future results or expectations. As with all investments, there are associated risks, and you could lose money investing. Prior to making any investment, a prospective investor should consult with its own investment, accounting, legal, and tax advisers to evaluate independently the risks, consequences, and suitability of that investment. The information in this presentation is not intended to constitute “research” as that term is defined by applicable regulations. No offering of securities shall be made in the United States except pursuant to registration under the U.S. Securities Act of 1933, as amended, or an exemption therefrom. Nothing contained in this presentation is intended to constitute an invitation or inducement to engage in investment activity for the purposes of the prohibition on financial promotion in the U.K. Financial Services and Markets Act 2000. In this presentation, we may sometimes refer to certain non-GAAP figures or financial ratios to help illustrate certain concepts. These ratios, each of which is defined in this document, if utilized, may include Pre-Tax Pre-Provision Income, the Tangible Common Equity to Tangible Assets Ratio, and the Texas Ratio. This information supplements our results as reported in accordance with GAAP and should not be viewed in isolation from, or as a substitute for, our GAAP results, among others. We believe that this additional information and the reconciliations we provide may be useful to investors, analysts, regulators and others as they evaluate the impact of these items on our results for the periods presented due to the extent to which the items are indicative of our ongoing operations. Where applicable, we provide GAAP reconciliations for such additional information. This presentation is provided for information purposes only.
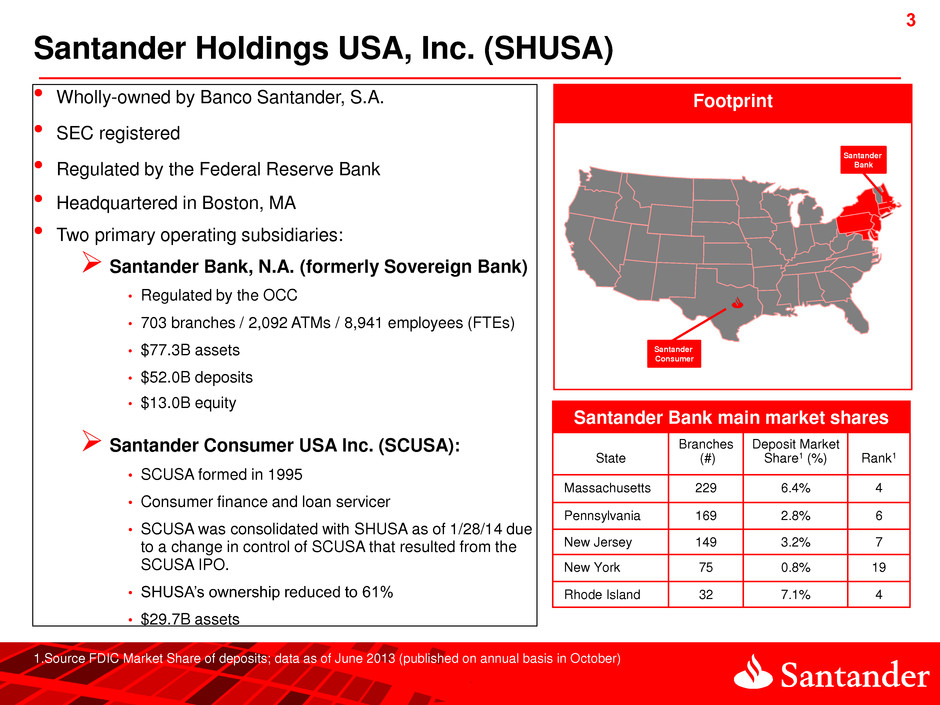
3 3 Footprint 1.Source FDIC Market Share of deposits; data as of June 2013 (published on annual basis in October) Santander Holdings USA, Inc. (SHUSA) • Wholly-owned by Banco Santander, S.A. • SEC registered • Regulated by the Federal Reserve Bank • Headquartered in Boston, MA • Two primary operating subsidiaries: Santander Bank, N.A. (formerly Sovereign Bank) • Regulated by the OCC • 703 branches / 2,092 ATMs / 8,941 employees (FTEs) • $77.3B assets • $52.0B deposits • $13.0B equity Santander Consumer USA Inc. (SCUSA): • SCUSA formed in 1995 • Consumer finance and loan servicer • SCUSA was consolidated with SHUSA as of 1/28/14 due to a change in control of SCUSA that resulted from the SCUSA IPO. • SHUSA’s ownership reduced to 61% • $29.7B assets Santander Bank main market shares State Branches (#) Deposit Market Share1 (%) Rank1 Massachusetts 229 6.4% 4 Pennsylvania 169 2.8% 6 New Jersey 149 3.2% 7 New York 75 0.8% 19 Rhode Island 32 7.1% 4 Santander Bank Santander Consumer
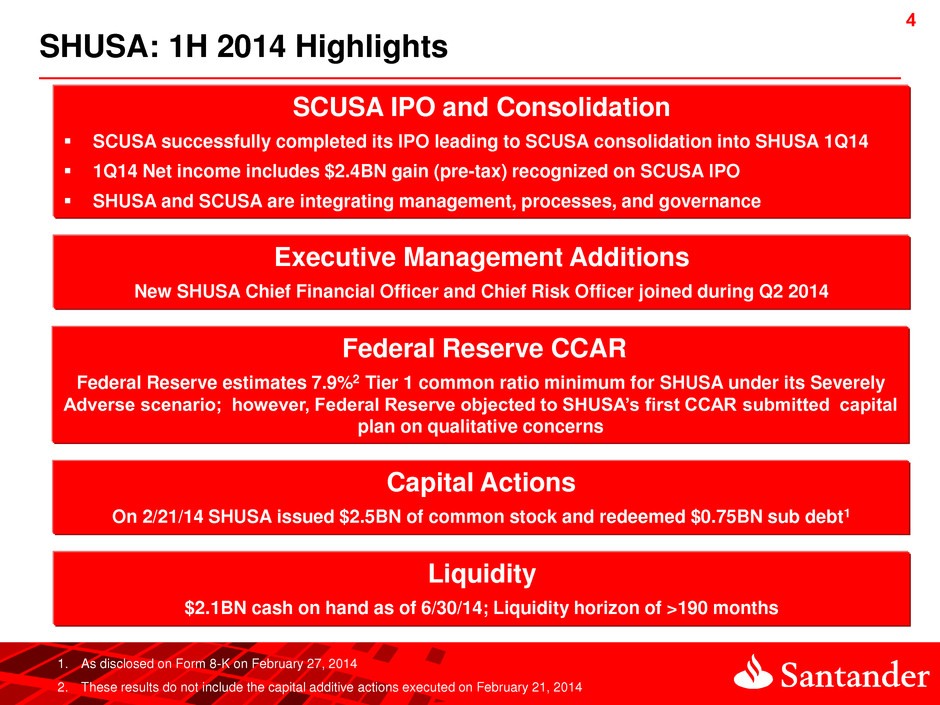
4 4 SHUSA: 1H 2014 Highlights SCUSA IPO and Consolidation SCUSA successfully completed its IPO leading to SCUSA consolidation into SHUSA 1Q14 1Q14 Net income includes $2.4BN gain (pre-tax) recognized on SCUSA IPO SHUSA and SCUSA are integrating management, processes, and governance Federal Reserve CCAR Federal Reserve estimates 7.9%2 Tier 1 common ratio minimum for SHUSA under its Severely Adverse scenario; however, Federal Reserve objected to SHUSA’s first CCAR submitted capital plan on qualitative concerns 1. As disclosed on Form 8-K on February 27, 2014 2. These results do not include the capital additive actions executed on February 21, 2014 Capital Actions On 2/21/14 SHUSA issued $2.5BN of common stock and redeemed $0.75BN sub debt1 Executive Management Additions New SHUSA Chief Financial Officer and Chief Risk Officer joined during Q2 2014 Liquidity $2.1BN cash on hand as of 6/30/14; Liquidity horizon of >190 months
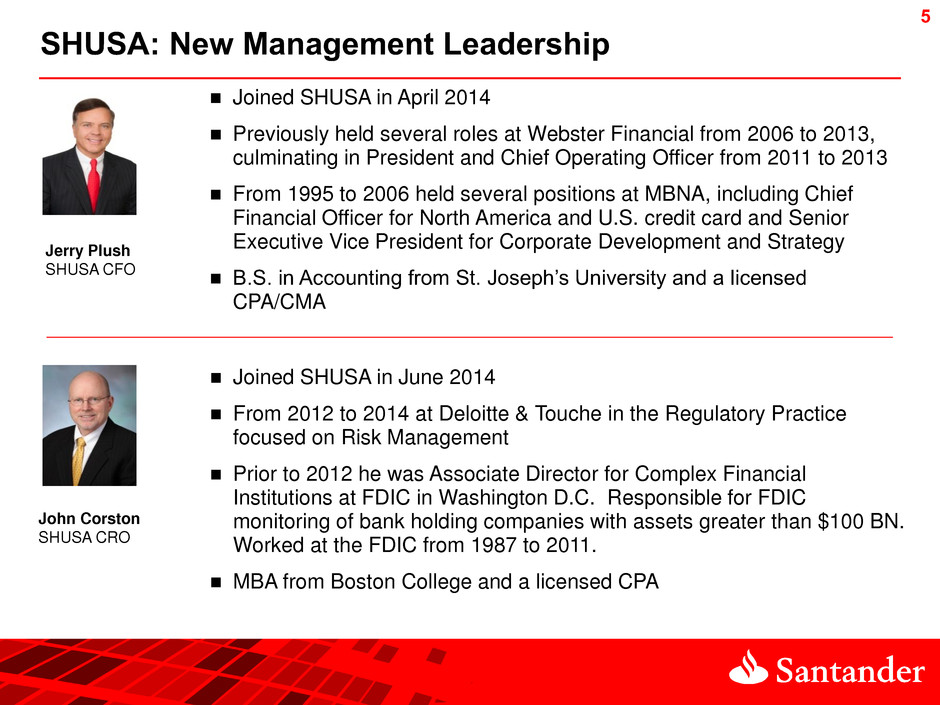
5 SHUSA: New Management Leadership Jerry Plush SHUSA CFO Joined SHUSA in June 2014 From 2012 to 2014 at Deloitte & Touche in the Regulatory Practice focused on Risk Management Prior to 2012 he was Associate Director for Complex Financial Institutions at FDIC in Washington D.C. Responsible for FDIC monitoring of bank holding companies with assets greater than $100 BN. Worked at the FDIC from 1987 to 2011. MBA from Boston College and a licensed CPA John Corston SHUSA CRO Joined SHUSA in April 2014 Previously held several roles at Webster Financial from 2006 to 2013, culminating in President and Chief Operating Officer from 2011 to 2013 From 1995 to 2006 held several positions at MBNA, including Chief Financial Officer for North America and U.S. credit card and Senior Executive Vice President for Corporate Development and Strategy B.S. in Accounting from St. Joseph’s University and a licensed CPA/CMA
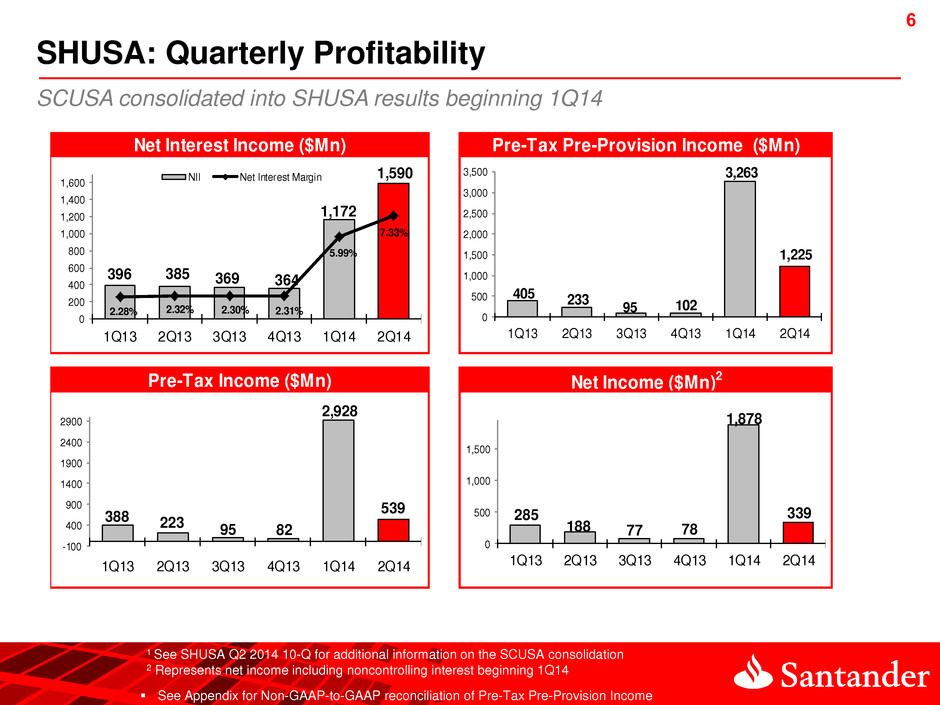
6 6 SHUSA: Quarterly Profitability 2 See Appendix for Non-GAAP-to-GAAP reconciliation of Pre-Tax Pre-Provision Income 1 See SHUSA Q2 2014 10-Q for additional information on the SCUSA consolidation 2 Represents net income including noncontrolling interest beginning 1Q14 Net Interest Income ($Mn) Pre-Tax Pre-Provision Income ($Mn) Pre-Tax Income ($Mn) Net Income ($Mn)2 405 233 95 102 3,263 1,225 0 500 1,000 1,500 2,000 2,500 3,000 3,500 1Q13 2Q13 3Q13 4Q13 1Q14 2Q14 396 385 369 364 1,172 1,590 2.28% 2.32% 2.30% 2.31% 5.99% 7.33% 0 200 400 600 800 1,000 1,200 1,400 1,600 1Q13 2Q13 3Q13 4Q13 1Q14 2Q14 NII Net Interest Margin 388 223 95 82 2,928 539 -100 400 900 1400 1900 2400 2900 1Q13 2Q13 3Q13 4Q13 1Q14 2Q14 285 188 77 78 1,878 339 0 500 1,000 1,500 1Q13 2Q13 3Q13 4Q13 1Q14 2Q14 SCUSA consolidated into SHUSA results beginning 1Q14
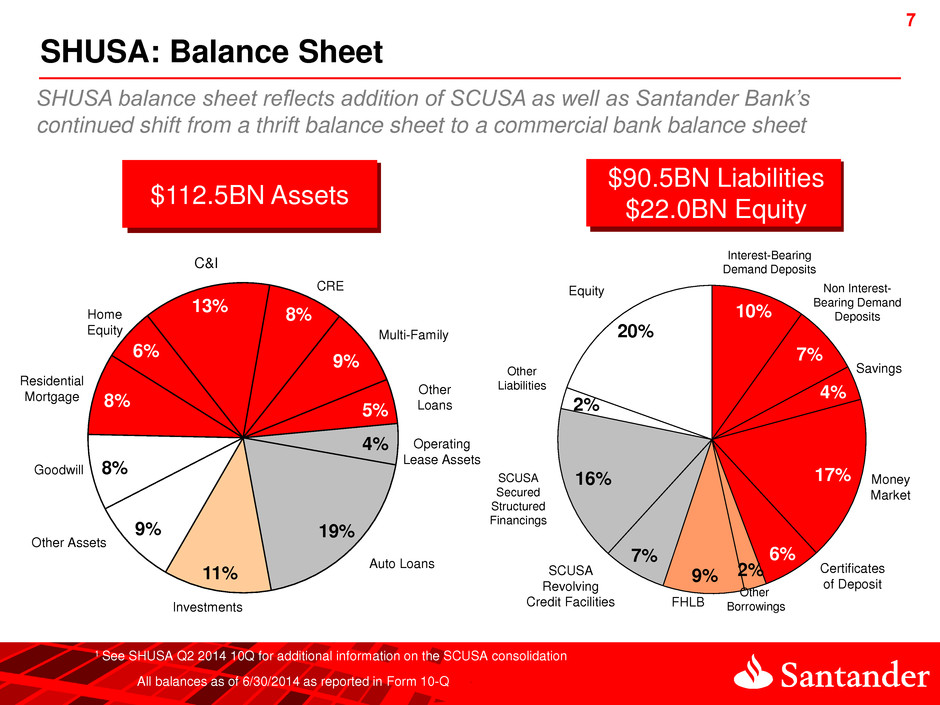
7 7 10% 7% 4% 17% 6% 2% 9% 7% 16% 2% 20% SHUSA: Balance Sheet 9% 8% 8% 6% 13% 8% 9% 5% 4% 19% 11% Investments Auto Loans Non Interest- Bearing Demand Deposits Other Assets C&I CRE Residential Mortgage Other Loans Operating Lease Assets Goodwill Home Equity Multi-Family $112.5BN Assets $90.5BN Liabilities $22.0BN Equity Interest-Bearing Demand Deposits SCUSA Secured Structured Financings Equity Other Liabilities FHLB Money Market Certificates of Deposit Savings All balances as of 6/30/2014 as reported in Form 10-Q SCUSA Revolving Credit Facilities Other Borrowings 1 See SHUSA Q2 2014 10Q for additional information on the SCUSA consolidation SHUSA balance sheet reflects addition of SCUSA as well as Santander Bank’s continued shift from a thrift balance sheet to a commercial bank balance sheet
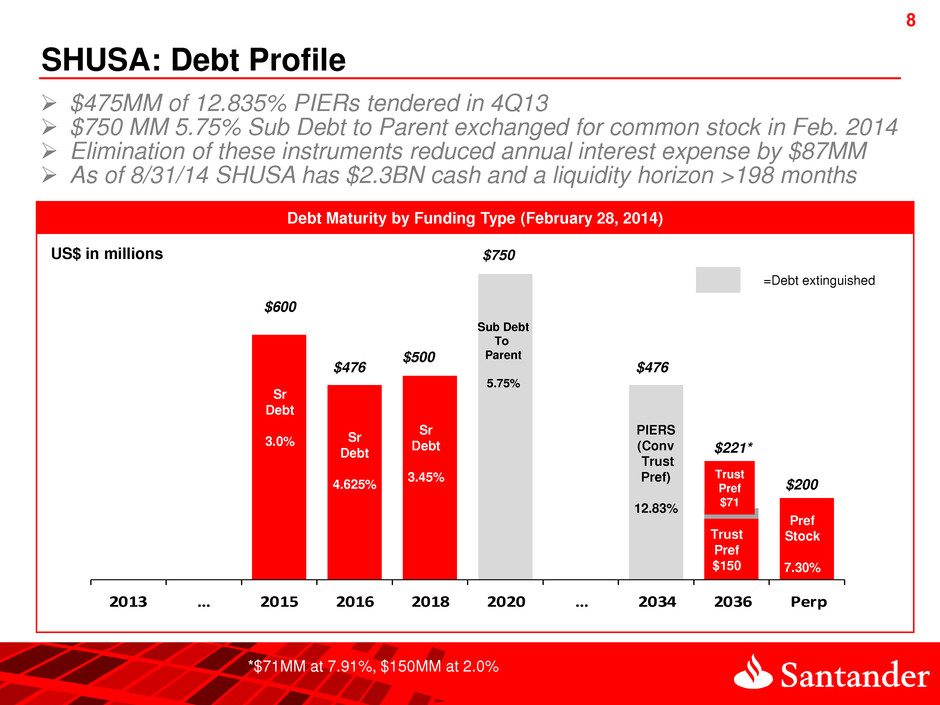
8 8 Debt Maturity by Funding Type (February 28, 2014) 2013 … 2015 2016 2018 2020 … 2034 2036 Perp SHUSA: Debt Profile Sub Debt To Parent 5.75% PIERS (Conv Trust Pref) 12.83% Trust Pref $150 Pref Stock 7.30% Sr Debt 4.625% Trust Pref $71 $476 $221* $750 $476 $200 US$ in millions $600 Sr Debt 3.0% Sr Debt 3.45% $500 $475MM of 12.835% PIERs tendered in 4Q13 $750 MM 5.75% Sub Debt to Parent exchanged for common stock in Feb. 2014 Elimination of these instruments reduced annual interest expense by $87MM As of 8/31/14 SHUSA has $2.3BN cash and a liquidity horizon >198 months *$71MM at 7.91%, $150MM at 2.0% =Debt extinguished
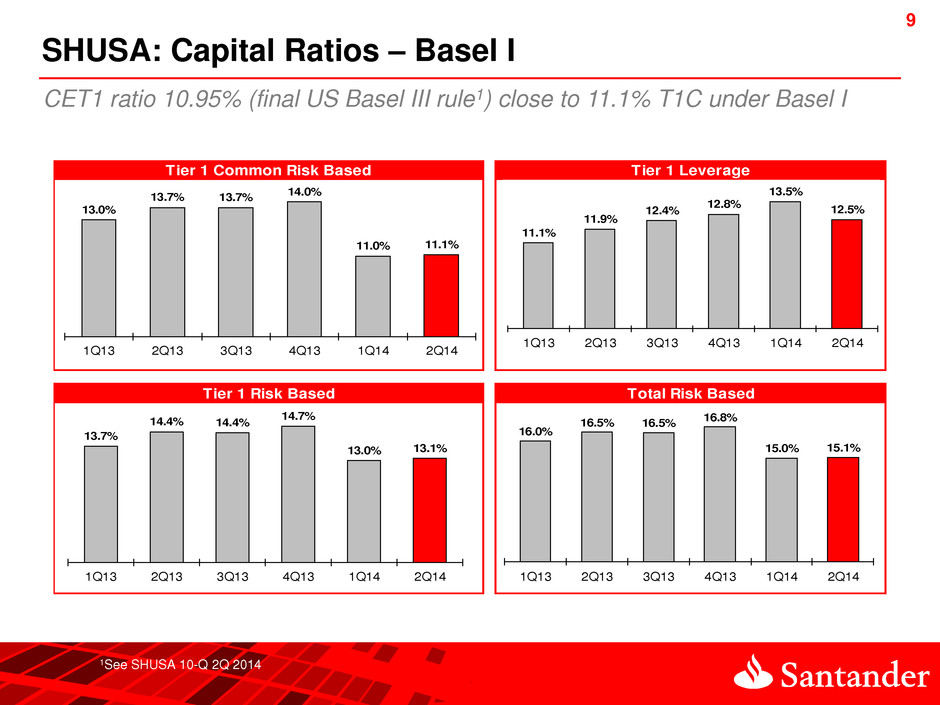
9 9 SHUSA: Capital Ratios – Basel I 1See SHUSA 10-Q 2Q 2014 CET1 ratio 10.95% (final US Basel III rule1) close to 11.1% T1C under Basel I Total Risk Based Tier 1 Common Risk Based Tier 1 Leverage Tier 1 Risk Based 13.0% 13.7% 13.7% 14.0% 11.0% 11.1% 1Q13 2Q13 3Q13 4Q13 1Q14 2Q14 11.1% 11.9% 12.4% 12.8% 13.5% 12.5% 1Q13 2Q13 3Q13 4Q13 1Q14 2Q14 13.7% 14.4% 14.4% 14.7% 13.0% 13.1% 1Q13 2Q13 3Q13 4Q13 1Q14 2Q14 16.0% 16.5% 16.5% 16.8% 15.0% 15.1% 1Q13 2Q13 3Q13 4Q13 1Q14 2Q14
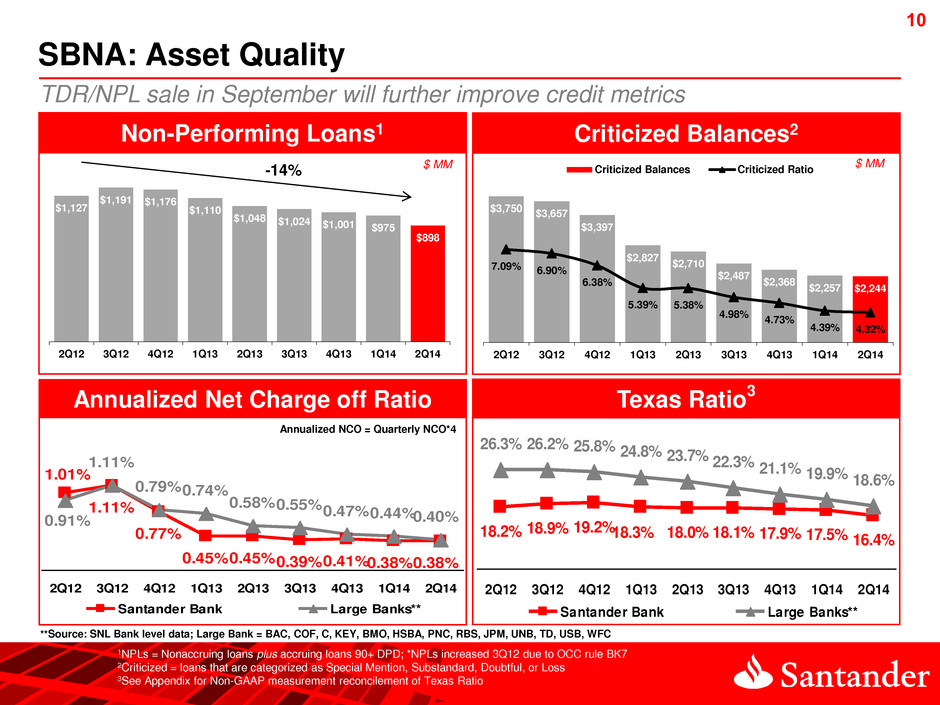
10 10 $3,750 $3,657 $3,397 $2,827 $2,710 $2,487 $2,368 $2,257 $2,244 7.09% 6.90% 6.38% 5.39% 5.38% 4.98% 4.73% 4.39% 4.32% 2Q12 3Q12 4Q12 1Q13 2Q13 3Q13 4Q13 1Q14 2Q14 Criticized Balances Criticized Ratio Criticized Balances2 $1,127 $1,191 $1,176 $1,110 $1,048 $1,024 $1,001 $975 $898 2Q12 3Q12 4Q12 1Q13 2Q13 3Q13 4Q13 1Q14 2Q14 Non-Performing Loans1 Texas Ratio3 Annualized Net Charge off Ratio 1.01% 0.41%0.38%0.39%0.45%0.45% 0.77% 1.1 % 0.38% 0.47%0.55% 0.58% 0 740.79 1.11% 0.91% 0.44%0.40% 2Q12 3Q12 4Q12 1Q13 2Q13 3Q13 4Q13 1Q14 2Q14 Santander Bank Large Banks** SBNA: Asset Quality $ MM -14% TDR/NPL sale in September will further improve credit metrics $ MM Annualized NCO = Quarterly NCO*4 **Source: SNL Bank level data; Large Bank = BAC, COF, C, KEY, BMO, HSBA, PNC, RBS, JPM, UNB, TD, USB, WFC 1NPLs = Nonaccruing loans plus accruing loans 90+ DPD; *NPLs increased 3Q12 due to OCC rule BK7 2Criticized = loans that are categorized as Special Mention, Substandard, Doubtful, or Loss 3See Appendix for Non-GAAP measurement reconcilement of Texas Ratio 21.1% 19.9% 18.6% 16.4% 18.9% 19.2%18.3% 18.0% 18.1% 17.5%17.9%18.2% 22.3% 2 .3% 26.2% 25.8% 24.8% 23.7% 2Q12 3Q12 4Q12 1 13 2 13 3 13 4 13 1Q14 2Q14 Santander Bank Large Banks**
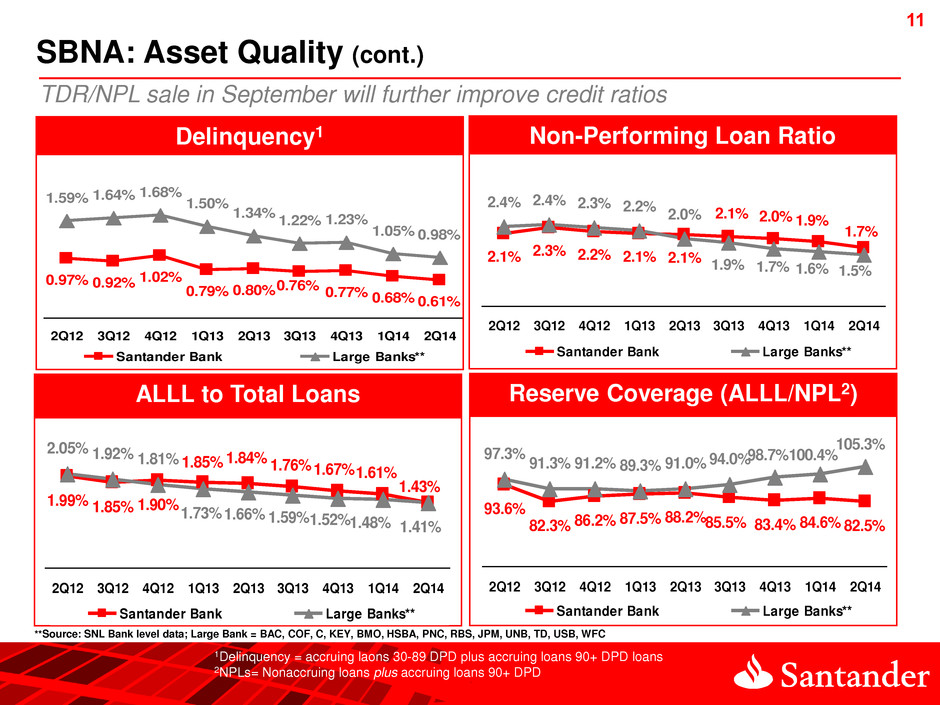
11 11 Delinquency1 Reserve Coverage (ALLL/NPL2) 93.6% 83.4% 84.6%85.5%88.2%87.5%86.2%82.3% 82.5% 98.7%94.0%91.0%89.3%91.2%91.3% 97.3% 100.4% 105.3% 2Q12 3Q12 4Q12 1Q13 2Q13 3Q13 4Q13 1Q14 2Q14 Santander Bank Large Banks** Non-Performing Loan Ratio SBNA: Asset Quality (cont.) 1.7% 2.3% 2.2% 2.1% 2.1% 2.1% 1.9%2.0% 2.1% 1.5%1.6% 2.4% 2.4% 2.3% 2.2% 2.0% 1.9% 1.7% 2Q12 3Q12 4Q12 1Q13 2Q13 3Q13 4Q13 1Q14 2Q14 Santander Bank Large Banks** **Source: SNL Bank level data; Large Bank = BAC, COF, C, KEY, BMO, HSBA, PNC, RBS, JPM, UNB, TD, USB, WFC ALLL to Total Loans 1.99% 1.67%1.61%1.76% 1.84%1.85% 1.90%1.85% 1.43% 1.52%1.59%1.66%1.73% 1.81%1.92% 2.05% 1.4 % 1.41% 2Q12 3Q12 4Q12 1Q13 2Q13 3Q13 4Q13 1Q14 2Q14 Santander Bank Large Banks** 1Delinquency = accruing laons 30-89 DPD plus accruing loans 90+ DPD loans 2NPLs= Nonaccruing loans plus accruing loans 90+ DPD 0.97% 0.77% 0.68% 0.76%0.80%0.79% 1.02%0.92% 0.61% 1.231.22% 1.34 1.50 1.68%1.64%1.59% 1.05% 0.98% 2Q12 3Q12 4Q12 1Q13 2Q13 3 13 4 13 1 14 2 14 Santander Bank Large Banks** TDR/NPL sale in September will further improve credit ratios
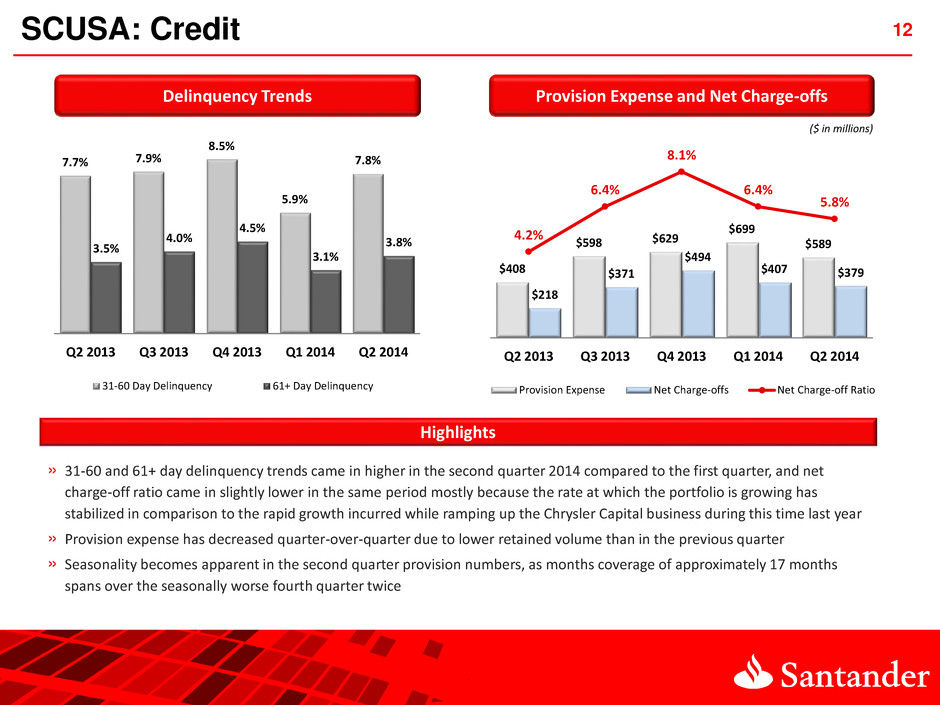
$408 $598 $629 $699 $589 $218 $371 $494 $407 $379 4.2% 6.4% 8.1% 6.4% 5.8% Q2 2013 Q3 2013 Q4 2013 Q1 2014 Q2 2014 Provision Expense Net Charge-offs Net Charge-off Ratio SCUSA: Credit 12 ($ in millions) » 31-60 and 61+ day delinquency trends came in higher in the second quarter 2014 compared to the first quarter, and net charge-off ratio came in slightly lower in the same period mostly because the rate at which the portfolio is growing has stabilized in comparison to the rapid growth incurred while ramping up the Chrysler Capital business during this time last year » Provision expense has decreased quarter-over-quarter due to lower retained volume than in the previous quarter » Seasonality becomes apparent in the second quarter provision numbers, as months coverage of approximately 17 months spans over the seasonally worse fourth quarter twice Highlights Delinquency Trends 7.7% 7.9% 8.5% 5.9% 7.8% 3.5% 4.0% 4.5% 3.1% 3.8% Q2 2013 Q3 2013 Q4 2013 Q1 2014 Q2 2014 31-60 Day Delinquency 61+ Day Delinquency Provision Expense and Net Charge-offs
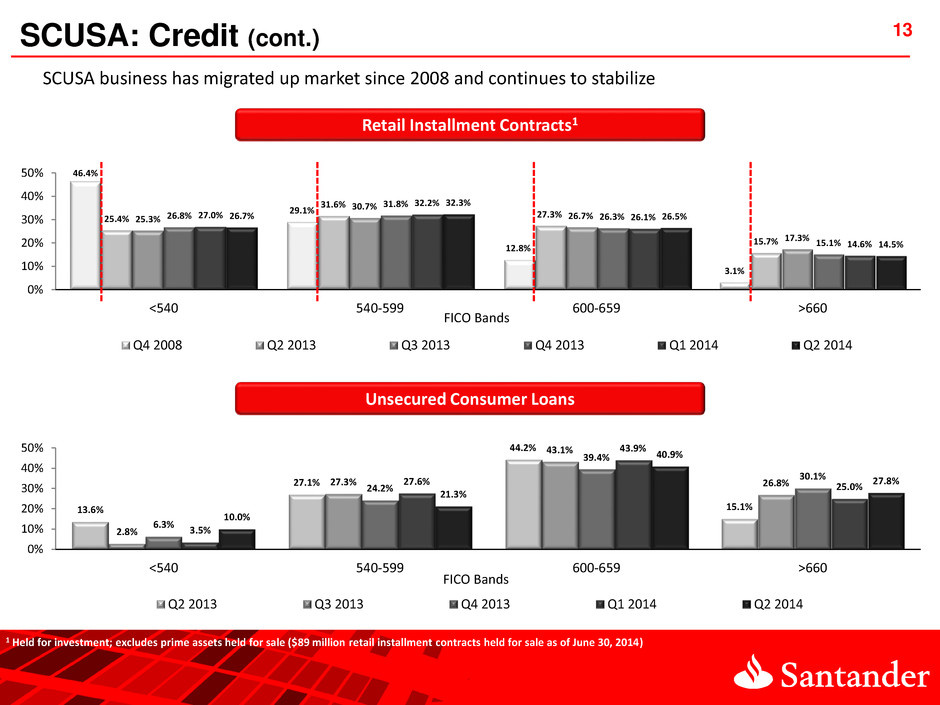
13 46.4% 29.1% 12.8% 3.1% 25.4% 31.6% 27.3% 15.7% 25.3% 30.7% 26.7% 17.3% 26.8% 31.8% 26.3% 15.1% 27.0% 32.2% 26.1% 14.6% 26.7% 32.3% 26.5% 14.5% 0% 10% 20% 30% 40% 50% <540 540-599 600-659 >660 Q4 2008 Q2 2013 Q3 2013 Q4 2013 Q1 2014 Q2 2014 Retail Installment Contracts1 FICO Bands Unsecured Consumer Loans 13.6% 27.1% 44.2% 15.1% 2.8% 27.3% 43.1% 26.8% 6.3% 24.2% 39.4% 30.1% 3.5% 27.6% 43.9% 25.0% 10.0% 21.3% 40.9% 27.8% 0% 10% 20% 30% 40% 50% <540 540-599 600-659 >660 Q2 2013 Q3 2013 Q4 2013 Q1 2014 Q2 2014 FICO Bands 1 Held for investment; excludes prime assets held for sale ($89 million retail installment contracts held for sale as of June 30, 2014) SCUSA business has migrated up market since 2008 and continues to stabilize SCUSA: Credit (cont.)
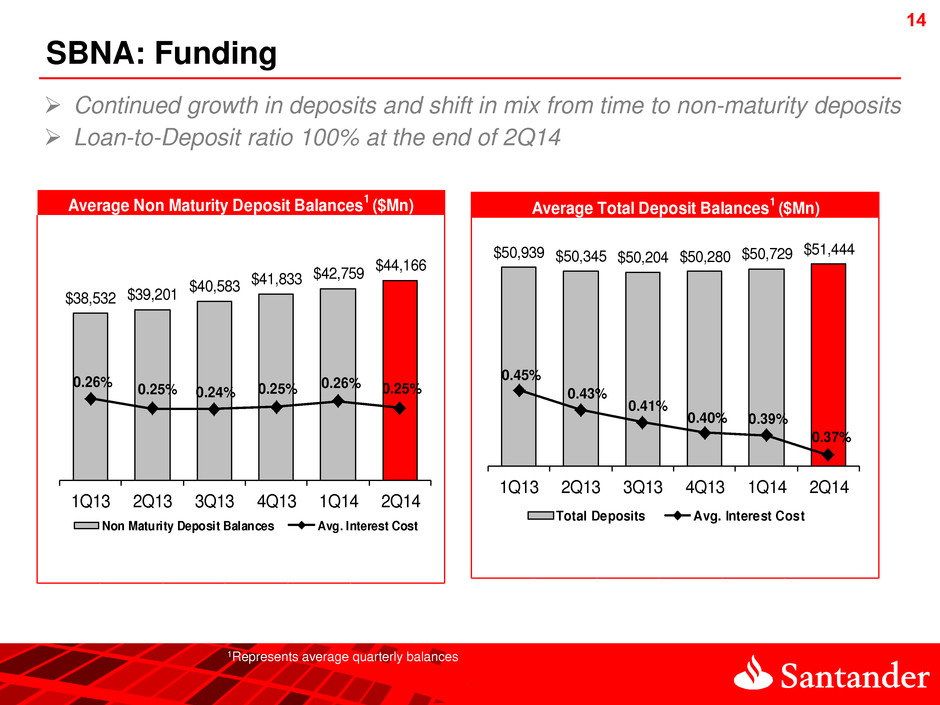
14 14 SBNA: Funding 1Represents average quarterly balances Continued growth in deposits and shift in mix from time to non-maturity deposits Loan-to-Deposit ratio 100% at the end of 2Q14 Average Non Maturity Deposit Balances 1 ($Mn) $38,532 $39,201 $40,583 $41,833 $42,759 $44,166 0.26% 0.25% 0.24% 0.25% 0.26% 0.25% 1Q13 2Q13 3Q13 4Q13 1Q14 2Q14 Non Maturity Deposit Balances Avg. Interest Cost Average Total Deposit Balances 1 ($Mn) $50,939 $50,345 $50,204 $50,280 $50,729 $51,444 0.45% 0.43% 0.41% 0.40% 0.39% 0.37% 1Q13 2Q13 3Q13 4Q13 1Q14 2Q14 Total Deposits Avg. Interest Cost
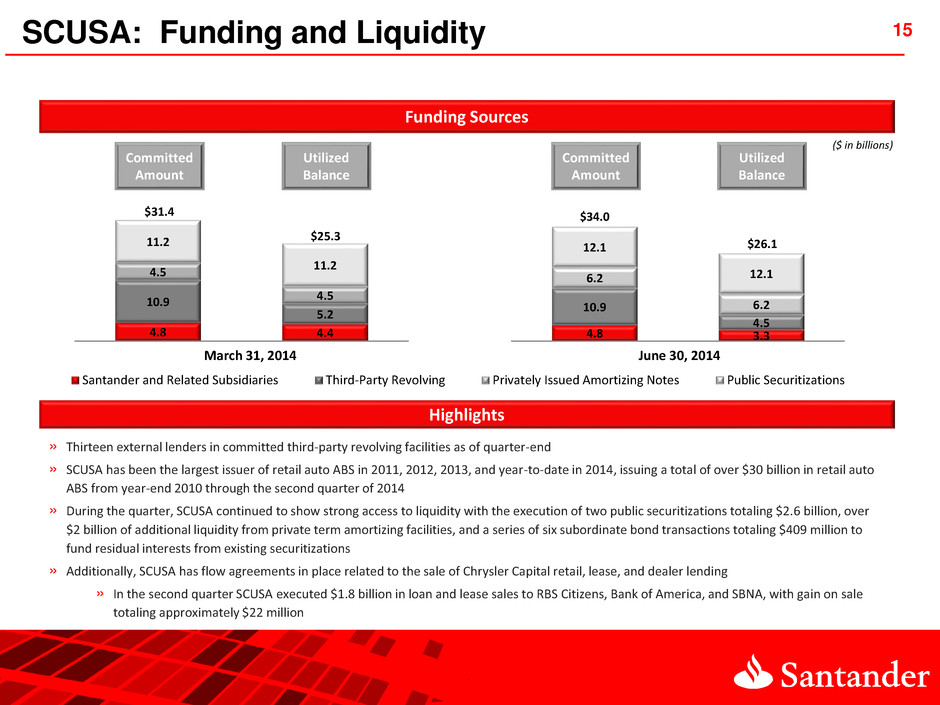
4.8 3.3 10.9 4.5 6.2 6.2 12.1 12.1 Santander and Related Subsidiaries Third-Party Revolving Privately Issued Amortizing Notes Public Securitizations SCUSA: Funding and Liquidity Funding Sources » Thirteen external lenders in committed third-party revolving facilities as of quarter-end » SCUSA has been the largest issuer of retail auto ABS in 2011, 2012, 2013, and year-to-date in 2014, issuing a total of over $30 billion in retail auto ABS from year-end 2010 through the second quarter of 2014 » During the quarter, SCUSA continued to show strong access to liquidity with the execution of two public securitizations totaling $2.6 billion, over $2 billion of additional liquidity from private term amortizing facilities, and a series of six subordinate bond transactions totaling $409 million to fund residual interests from existing securitizations » Additionally, SCUSA has flow agreements in place related to the sale of Chrysler Capital retail, lease, and dealer lending » In the second quarter SCUSA executed $1.8 billion in loan and lease sales to RBS Citizens, Bank of America, and SBNA, with gain on sale totaling approximately $22 million Highlights 15 4.8 4.4 10.9 5.2 4.5 4.5 11.2 11.2 $25.3 $31.4 Committed Amount Utilized Balance Committed Amount Utilized Balance March 31, 2014 June 30, 2014 $34.0 $26.1 ($ in billions)
Appendix
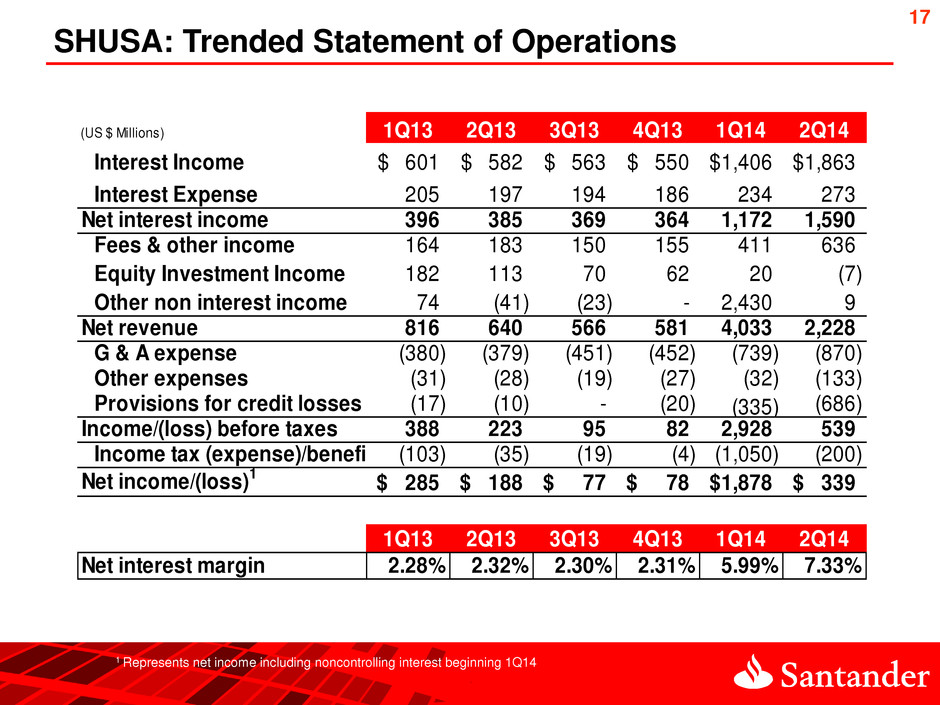
17 SHUSA: Trended Statement of Operations (US $ Millions) 1Q13 2Q13 3Q13 4Q13 1Q14 2Q14 Interest Income 601$ 582$ 563$ 550$ 1,406$ 1,863$ Interest Expense 205 197 194 186 234 273 Net interest income 396 385 369 364 1,172 1,590 Fees & other income 164 183 150 155 411 636 Equity Investment Income 182 113 70 62 20 (7) Other non interest income 74 (41) (23) - 2,430 9 Net revenue 816 640 566 581 4,033 2,228 G & A expense (380) (379) (451) (452) (739) (870) Other expenses (31) (28) (19) (27) (32) (133) Provisions for credit losses (17) (10) - (20) (335) (686) Income/(loss) before taxes 388 223 95 82 2,928 539 Income tax (expense)/benefit (103) (35) (19) (4) (1,050) (200) Net income/(loss)1 285$ 188$ 77$ 78$ 1,878$ 339$ 1Q13 2Q13 3Q13 4Q13 1Q14 2Q14 Net interest margin 2.28% 2.32% 2.30% 2.31% 5.99% 7.33% 1 Represents net income including noncontrolling interest beginning 1Q14
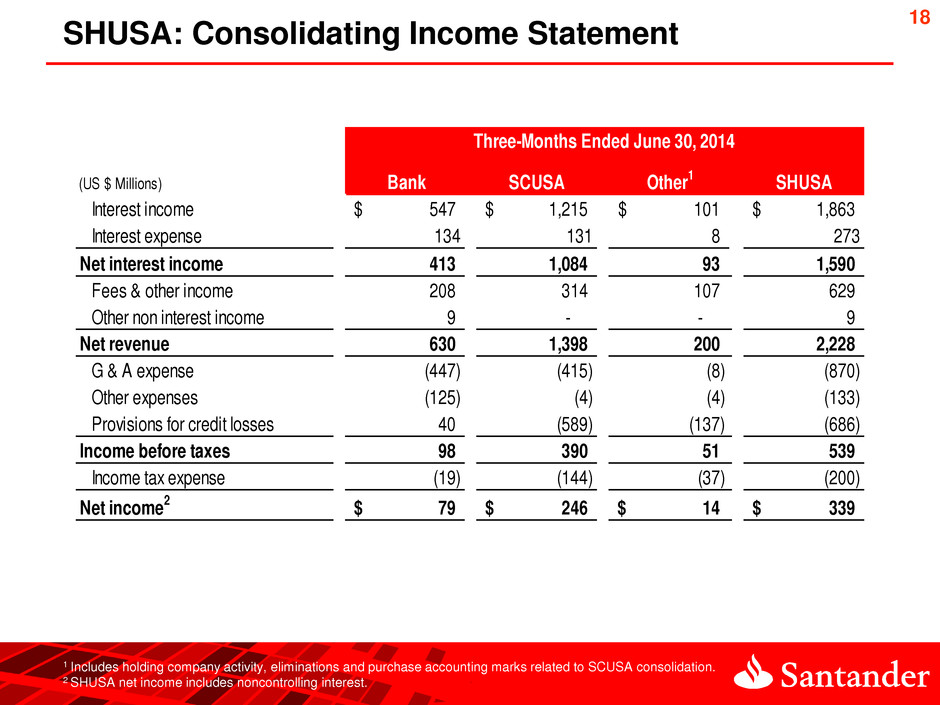
18 SHUSA: Consolidating Income Statement (US $ Millions) Bank Interest income 547$ 1,215$ 101$ 1,863$ Interest expense 134 131 8 273 Net interest income 413 1,084 93 1,590 Fees & other income 208 314 107 629 Other non interest income 9 - - 9 Net revenue 630 1,398 200 2,228 G & A expense (447) (415) (8) (870) Other expenses (125) (4) (4) (133) Provisions for credit losses 40 (589) (137) (686) Income before taxes 98 390 51 539 Income tax expense (19) (144) (37) (200) Net income 2 79$ 246$ 14$ 339$ SCUSA SHUSA Three-Months Ended June 30, 2014 Other 1 1 Includes holding company activity, eliminations and purchase accounting marks related to SCUSA consolidation. 2 SHUSA net income includes noncontrolling interest.
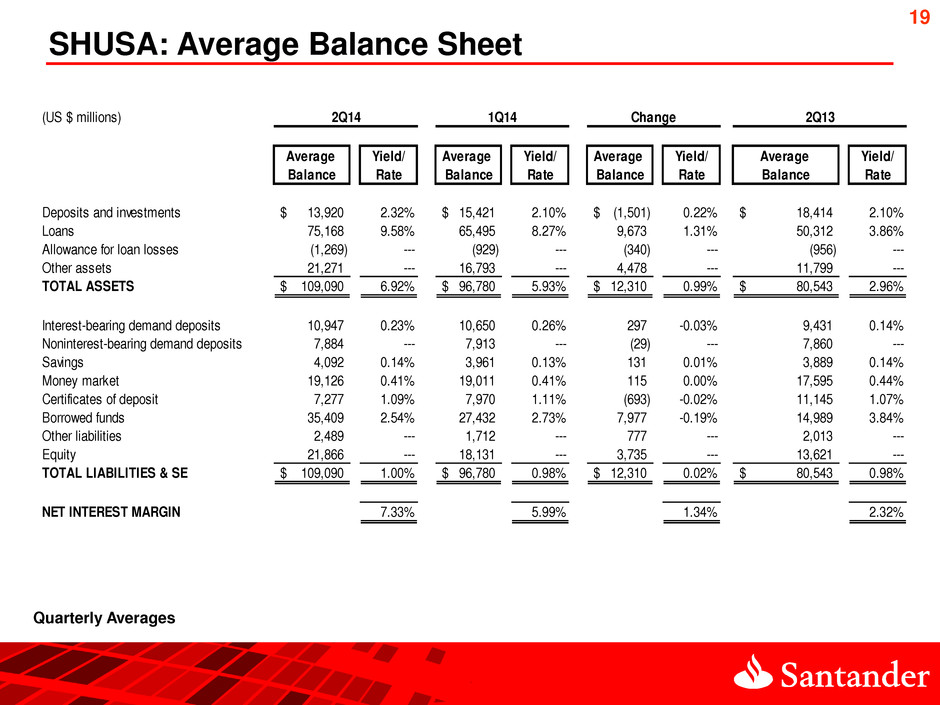
19 SHUSA: Average Balance Sheet Quarterly Averages (US $ millions) Average Yield/ Average Yield/ Average Yield/ Average Yield/ Balance Rate Balance Rate Balance Rate Balance Rate Deposits and investments 13,920$ 2.32% 15,421$ 2.10% (1,501)$ 0.22% 18,414$ 2.10% Loans 75,168 9.58% 65,495 8.27% 9,673 1.31% 50,312 3.86% Allowance for loan losses (1,269) --- (929) --- (340) --- (956) --- Other assets 21,271 --- 16,793 --- 4,478 --- 11,799 --- TOTAL ASSETS 109,090$ 6.92% 96,780$ 5.93% 12,310$ 0.99% 80,543$ 2.96% Interest-bearing demand deposits 10,947 0.23% 10,650 0.26% 297 -0.03% 9,431 0.14% Noninterest-bearing demand deposits 7,884 --- 7,913 --- (29) --- 7,860 --- Savings 4,092 0.14% 3,961 0.13% 131 0.01% 3,889 0.14% Money market 19,126 0.41% 19,011 0.41% 115 0.00% 17,595 0.44% Certificates of deposit 7,277 1.09% 7,970 1.11% (693) -0.02% 11,145 1.07% Borrowed funds 35,409 2.54% 27,432 2.73% 7,977 -0.19% 14,989 3.84% Other liabilities 2,489 --- 1,712 --- 777 --- 2,013 --- Equity 21,866 --- 18,131 --- 3,735 --- 13,621 --- TOTAL LIABILITIES & SE 109,090$ 1.00% 96,780$ 0.98% 12,310$ 0.02% 80,543$ 0.98% NET INTEREST MARGIN 7.33% 5.99% 1.34% 2.32% 2Q14 1Q14 Change 2Q13
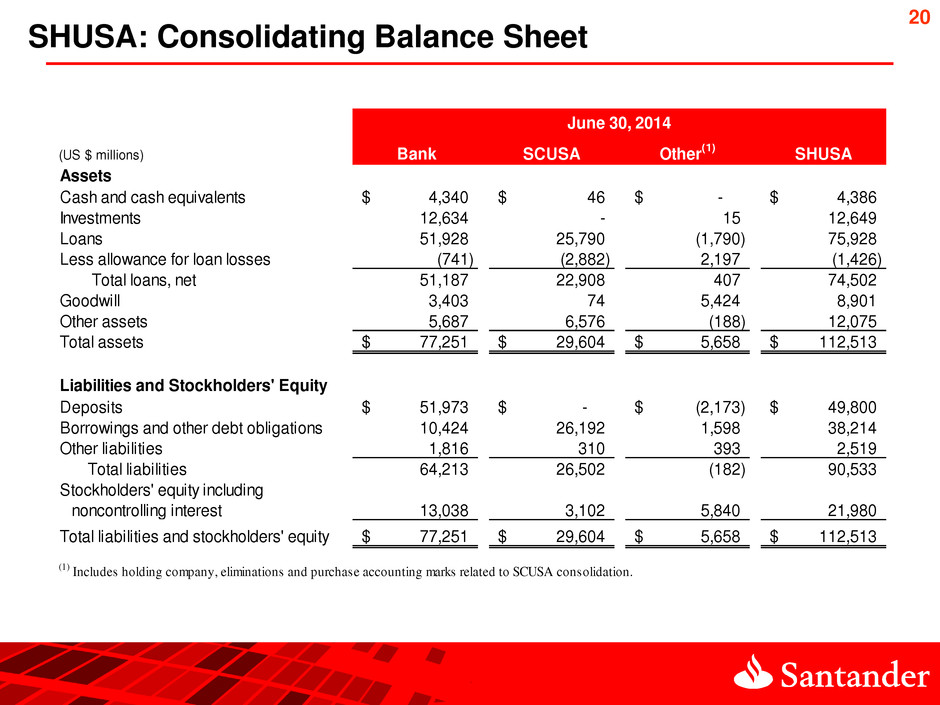
20 SHUSA: Consolidating Balance Sheet (US $ millions) Bank SCUSA Other (1) SHUSA Assets Cash and cash equivalents 4,340$ 46$ -$ 4,386$ Investments 12,634 - 15 12,649 Loans 51,928 25,790 (1,790) 75,928 Less allowance for loan losses (741) (2,882) 2,197 (1,426) Total loans, net 51,187 22,908 407 74,502 Goodwill 3,403 74 5,424 8,901 Other assets 5,687 6,576 (188) 12,075 Total assets 77,251$ 29,604$ 5,658$ 112,513$ Liabilities and Stockholders' Equity Deposits 51,973$ -$ (2,173)$ 49,800$ Borrowings and other debt obligations 10,424 26,192 1,598 38,214 Other liabilities 1,816 310 393 2,519 Total liabilities 64,213 26,502 (182) 90,533 Stockholders' equity including noncontrolling interest 13,038 3,102 5,840 21,980 Total liabilities and stockholders' equity 77,251$ 29,604$ 5,658$ 112,513$ (1) Includes holding company, eliminations and purchase accounting marks related to SCUSA consolidation. June 30, 2014
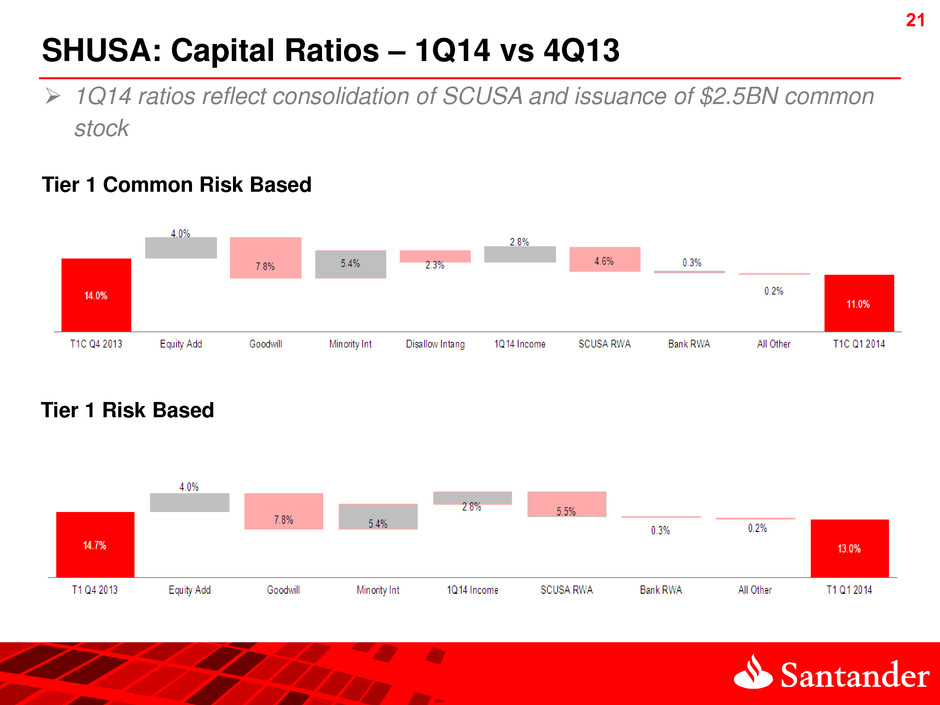
21 21 SHUSA: Capital Ratios – 1Q14 vs 4Q13 1Q14 ratios reflect consolidation of SCUSA and issuance of $2.5BN common stock Tier 1 Common Risk Based Tier 1 Risk Based
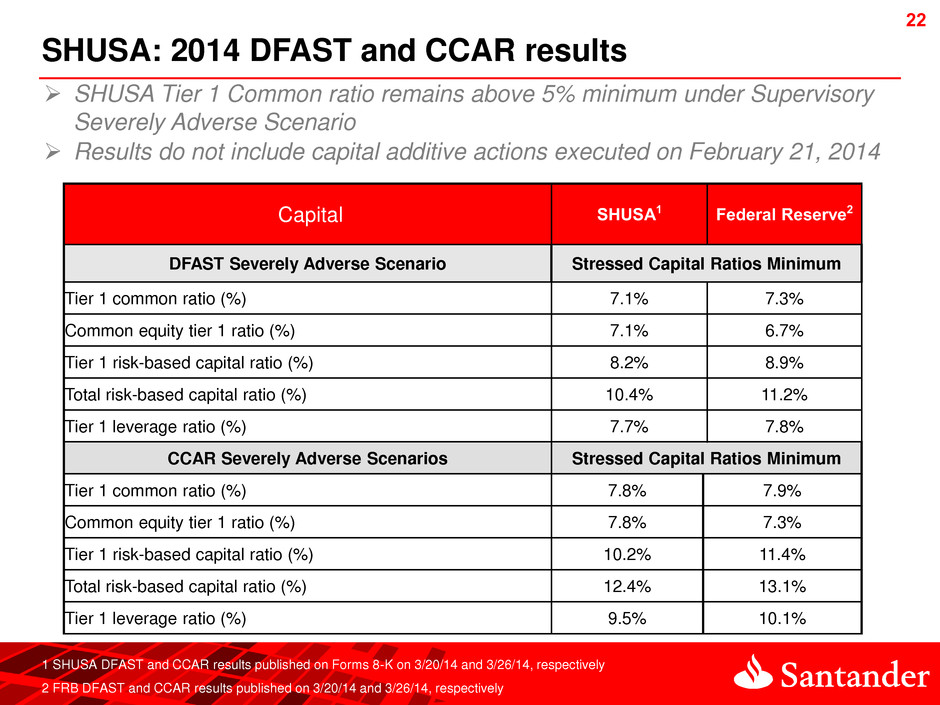
22 22 SHUSA: 2014 DFAST and CCAR results 1 SHUSA DFAST and CCAR results published on Forms 8-K on 3/20/14 and 3/26/14, respectively 2 FRB DFAST and CCAR results published on 3/20/14 and 3/26/14, respectively Capital SHUSA1 Federal Reserve2 DFAST Severely Adverse Scenario Stressed Capital Ratios Minimum Tier 1 common ratio (%) 7.1% 7.3% Common equity tier 1 ratio (%) 7.1% 6.7% Tier 1 risk-based capital ratio (%) 8.2% 8.9% Total risk-based capital ratio (%) 10.4% 11.2% Tier 1 leverage ratio (%) 7.7% 7.8% CCAR Severely Adverse Scenarios Stressed Capital Ratios Minimum Tier 1 common ratio (%) 7.8% 7.9% Common equity tier 1 ratio (%) 7.8% 7.3% Tier 1 risk-based capital ratio (%) 10.2% 11.4% Total risk-based capital ratio (%) 12.4% 13.1% Tier 1 leverage ratio (%) 9.5% 10.1% SHUSA Tier 1 Common ratio remains above 5% minimum under Supervisory Severely Adverse Scenario Results do not include capital additive actions executed on February 21, 2014
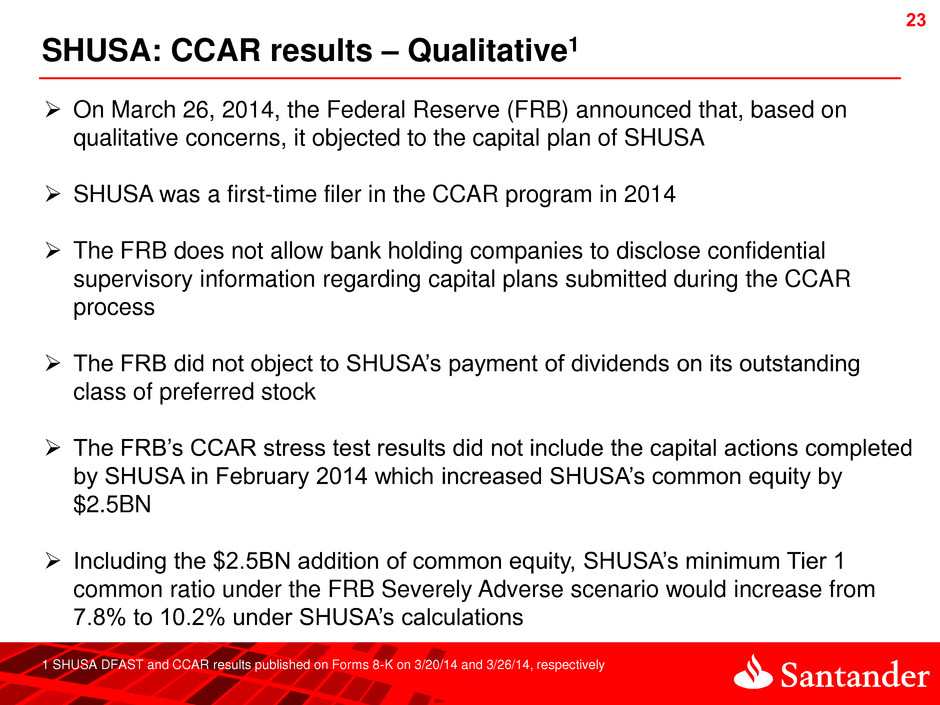
23 23 SHUSA: CCAR results – Qualitative1 On March 26, 2014, the Federal Reserve (FRB) announced that, based on qualitative concerns, it objected to the capital plan of SHUSA SHUSA was a first-time filer in the CCAR program in 2014 The FRB does not allow bank holding companies to disclose confidential supervisory information regarding capital plans submitted during the CCAR process The FRB did not object to SHUSA’s payment of dividends on its outstanding class of preferred stock The FRB’s CCAR stress test results did not include the capital actions completed by SHUSA in February 2014 which increased SHUSA’s common equity by $2.5BN Including the $2.5BN addition of common equity, SHUSA’s minimum Tier 1 common ratio under the FRB Severely Adverse scenario would increase from 7.8% to 10.2% under SHUSA’s calculations 1 SHUSA DFAST and CCAR results published on Forms 8-K on 3/20/14 and 3/26/14, respectively
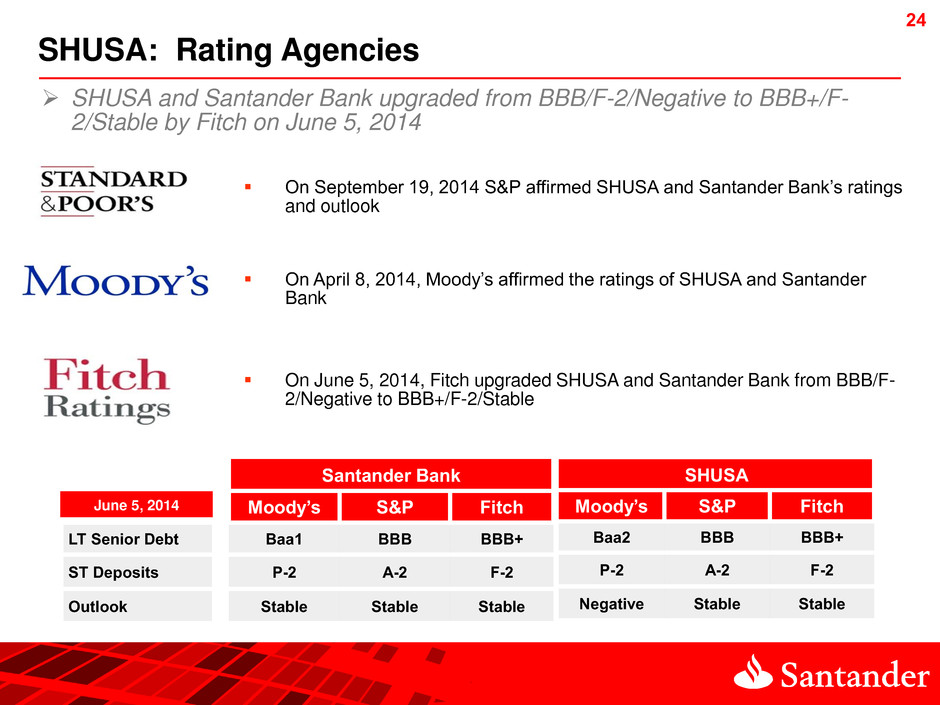
24 24 SHUSA: Rating Agencies Santander Bank Text Moody’s S&P Fitch LT Senior Debt Baa1 BBB BBB+ ST Deposits P-2 A-2 F-2 Outlook Stable Stable Stable SHUSA Moody’s S&P Fitch Baa2 BBB BBB+ P-2 A-2 F-2 Negative Stable Stable On September 19, 2014 S&P affirmed SHUSA and Santander Bank’s ratings and outlook On April 8, 2014, Moody’s affirmed the ratings of SHUSA and Santander Bank On June 5, 2014, Fitch upgraded SHUSA and Santander Bank from BBB/F- 2/Negative to BBB+/F-2/Stable June 5, 2014 SHUSA and Santander Bank upgraded from BBB/F-2/Negative to BBB+/F- 2/Stable by Fitch on June 5, 2014
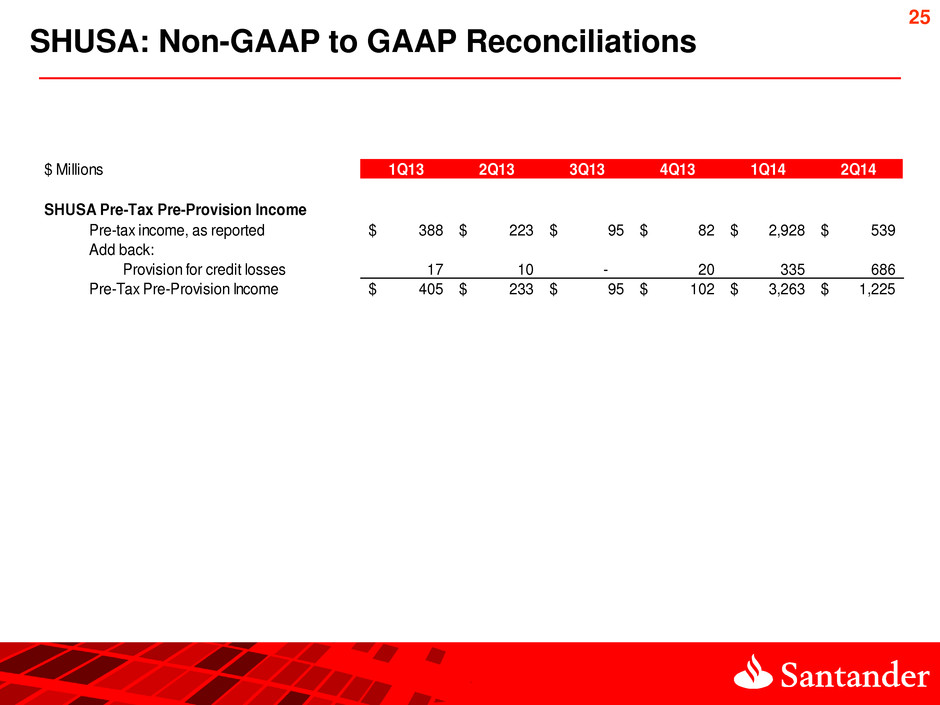
25 SHUSA: Non-GAAP to GAAP Reconciliations $ Millio s 1Q13 2Q13 3Q13 4Q13 1Q14 2Q14 SHUSA Pre-Tax Pre-Provision Income Pre-tax income, as reported 388$ 223$ 95$ 82$ 2,928$ 539$ Add back: Provision for credit losses 17 10 - 20 335 686 Pre-Tax Pre-Provision Income 405$ 233$ 95$ 102$ 3,263$ 1,225$
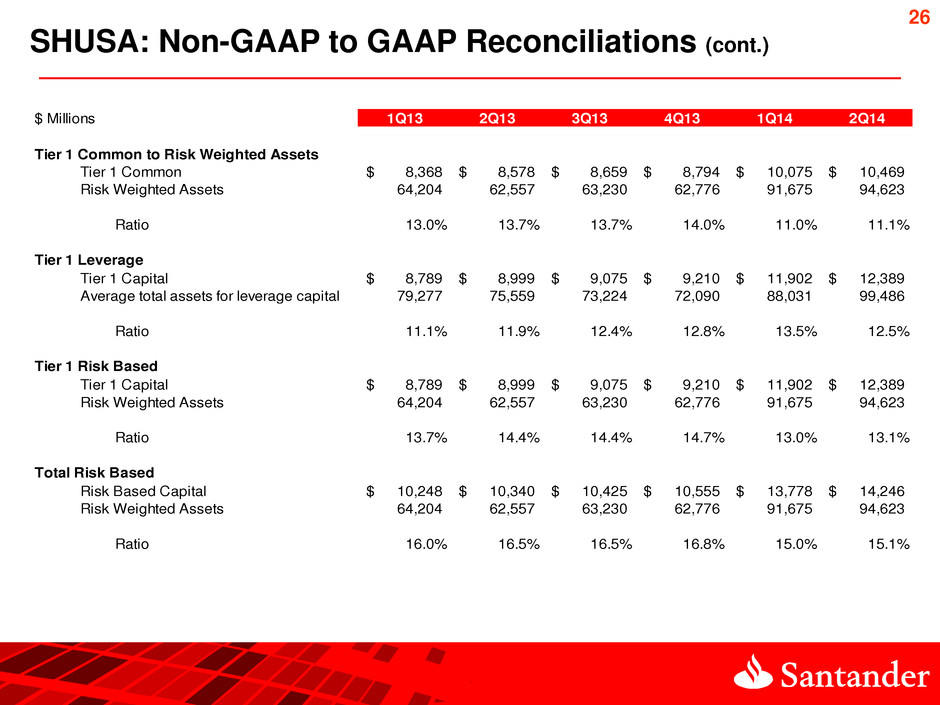
26 SHUSA: Non-GAAP to GAAP Reconciliations (cont.) $ Millions 1Q13 2Q13 3Q13 4Q13 1Q14 2Q14 Tier 1 Common to Risk Weighted Assets Tier 1 Common 8,368$ 8,578$ 8,659$ 8,794$ 10,075$ 10,469$ Risk Weighted Assets 64,204 62,557 63,230 62,776 91,675 94,623 Ratio 13.0% 13.7% 13.7% 14.0% 11.0% 11.1% Tier 1 Leverage Tier 1 Capital 8,789$ 8,999$ 9,075$ 9,210$ 11,902$ 12,389$ 79,277 75,559 73,224 72,090 88,031 99,486 Ratio 11.1% 11.9% 12.4% 12.8% 13.5% 12.5% Tier 1 Risk Based Tier 1 Capital 8,789$ 8,999$ 9,075$ 9,210$ 11,902$ 12,389$ Risk Weighted Assets 64,204 62,557 63,230 62,776 91,675 94,623 Ratio 13.7% 14.4% 14.4% 14.7% 13.0% 13.1% Total Risk Based Risk Based Capital 10,248$ 10,340$ 10,425$ 10,555$ 13,778$ 14,246$ Risk Weighted Assets 64,204 62,557 63,230 62,776 91,675 94,623 Ratio 16.0% 16.5% 16.5% 16.8% 15.0% 15.1% Average total assets for leverage capital


