Santander Bank, N.A. Fixed Income Investor Update Data as of September 30, 2014 November 19, 2014
2 Disclaimer Santander Holdings USA, Inc. (“SHUSA”), and Santander Bank, N.A. (“Santander Bank”) caution that this presentation may contain forward-looking statements within the meaning of the U.S. Private Securities Litigation Reform Act of 1995. These forward-looking statements are found in various places throughout this presentation and include, without limitation, statements concerning our future business development and economic performance. While these forward-looking statements represent our judgment and future expectations concerning the development of our business, a number of risks, uncertainties, and other important factors could cause actual developments and results to differ materially from our expectations. These factors include, but are not limited to: (1) increased regulation and regulatory developments; (2) domestic and international market, macro- economic, governmental, regulatory conditions and trends; (3) movements in local and international securities markets, currency exchange rates, and interest rates; (4) competitive pressures; (5) technological developments; and (6) changes in the financial position or creditworthiness of our customers, obligors, and counterparties. The risk factors and other key factors that we have indicated in our past and future filings and reports, including our Annual Report on Form 10-K for the year ended December 31, 2013 and other filings and reports with the Securities and Exchange Commission (the “SEC”), could adversely affect our business and financial performance. Other factors could cause actual results to differ materially from those in the forward-looking statements. The information contained in this presentation is not complete. It is subject to, and must be read in conjunction with, all other publicly available information, including reports filed with or furnished to the SEC, press releases, and other relevant information. Because this information is intended only to assist investors, it does not constitute investment advice or an offer to invest, and in making this presentation available, SHUSA and Santander Bank give no advice and make no recommendation to buy, sell, or otherwise deal in shares or other securities of Banco Santander (“Santander”), SHUSA, or Santander Bank or in any other securities or investments. This presentation is subject to correction, completion, and amendment without notice. It is not our intention to state, indicate, or imply in any manner that current or past results are indicative of future results or expectations. As with all investments, there are associated risks, and you could lose money investing. Prior to making any investment, a prospective investor should consult with its own investment, accounting, legal, and tax advisers to evaluate independently the risks, consequences, and suitability of that investment. The information in this presentation is not intended to constitute “research” as that term is defined by applicable regulations. No offering of securities shall be made in the United States except pursuant to registration under the U.S. Securities Act of 1933, as amended, or an exemption therefrom. Nothing contained in this presentation is intended to constitute an invitation or inducement to engage in investment activity for the purposes of the prohibition on financial promotion in the U.K. Financial Services and Markets Act 2000. In this presentation, we may sometimes refer to certain non-GAAP figures or financial ratios to help illustrate certain concepts. These ratios, each of which is defined in this document, if utilized, may include Pre-Tax Pre-Provision Income, the Tangible Common Equity to Tangible Assets Ratio, and the Texas Ratio. This information supplements our results as reported in accordance with GAAP and should not be viewed in isolation from, or as a substitute for, our GAAP results, among others. We believe that this additional information and the reconciliations we provide may be useful to investors, analysts, regulators and others as they evaluate the impact of these items on our results for the periods presented due to the extent to which the items are indicative of our ongoing operations. Where applicable, we provide GAAP reconciliations for such additional information. This presentation is provided for information purposes only.
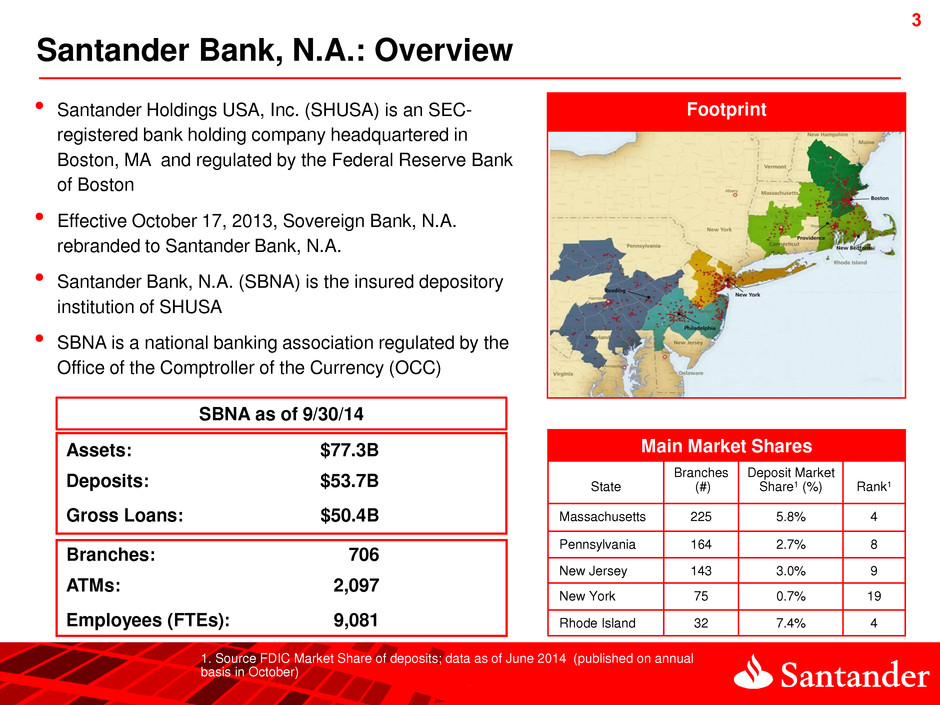
3 3 Footprint 1. Source FDIC Market Share of deposits; data as of June 2014 (published on annual basis in October) • Santander Holdings USA, Inc. (SHUSA) is an SEC- registered bank holding company headquartered in Boston, MA and regulated by the Federal Reserve Bank of Boston • Effective October 17, 2013, Sovereign Bank, N.A. rebranded to Santander Bank, N.A. • Santander Bank, N.A. (SBNA) is the insured depository institution of SHUSA • SBNA is a national banking association regulated by the Office of the Comptroller of the Currency (OCC) Main Market Shares State Branches (#) Deposit Market Share1 (%) Rank1 Massachusetts 225 5.8% 4 Pennsylvania 164 2.7% 8 New Jersey 143 3.0% 9 New York 75 0.7% 19 Rhode Island 32 7.4% 4 Santander Bank, N.A.: Overview Branches: 706 ATMs: 2,097 Employees (FTEs): 9,081 Assets: $77.3B Deposits: $53.7B Gross Loans: $50.4B SBNA as of 9/30/14
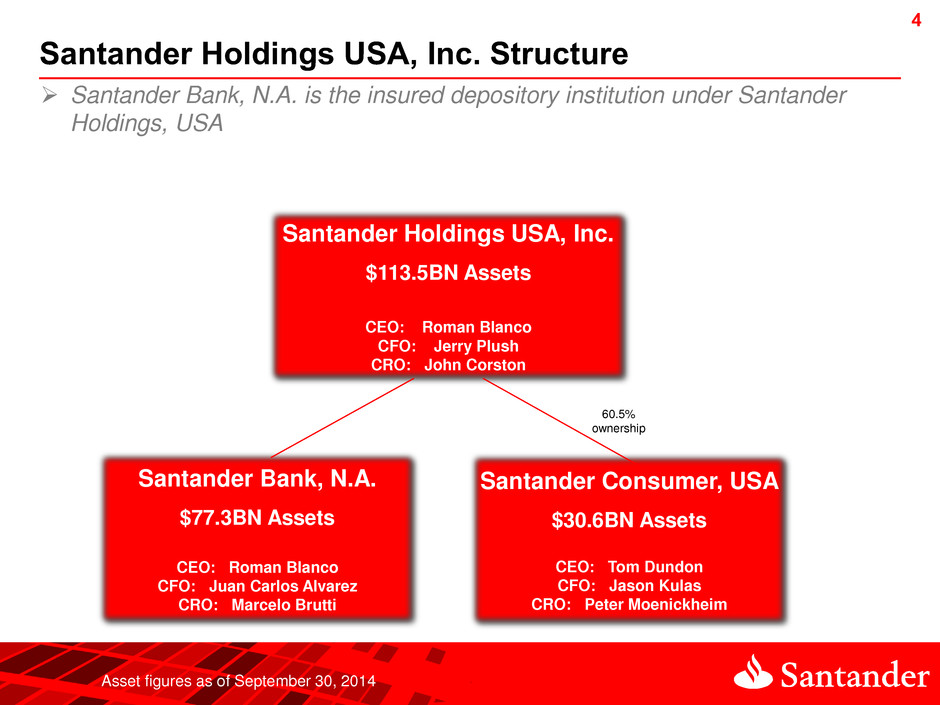
4 4 Santander Holdings USA, Inc. Structure Santander Holdings USA, Inc. $113.5BN Assets CEO: Roman Blanco CFO: Jerry Plush CRO: John Corston Santander Bank, N.A. $77.3BN Assets CEO: Roman Blanco CFO: Juan Carlos Alvarez CRO: Marcelo Brutti Santander Consumer, USA $30.6BN Assets CEO: Tom Dundon CFO: Jason Kulas CRO: Peter Moenickheim Santander Bank, N.A. is the insured depository institution under Santander Holdings, USA Asset figures as of September 30, 2014 60.5% ownership
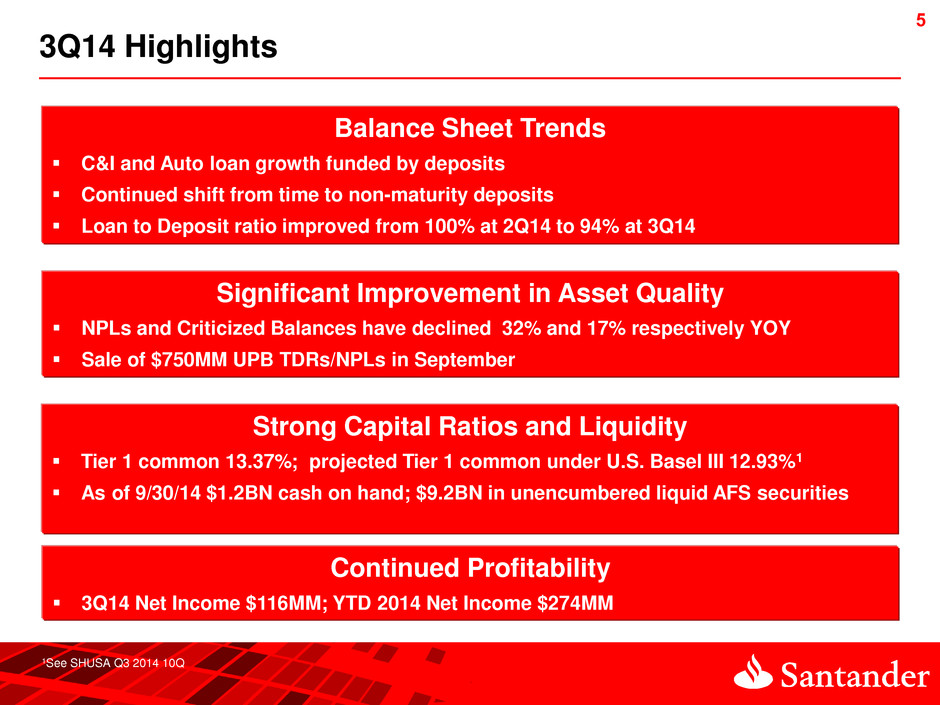
5 5 3Q14 Highlights Balance Sheet Trends C&I and Auto loan growth funded by deposits Continued shift from time to non-maturity deposits Loan to Deposit ratio improved from 100% at 2Q14 to 94% at 3Q14 Continued Profitability 3Q14 Net Income $116MM; YTD 2014 Net Income $274MM Significant Improvement in Asset Quality NPLs and Criticized Balances have declined 32% and 17% respectively YOY Sale of $750MM UPB TDRs/NPLs in September Strong Capital Ratios and Liquidity Tier 1 common 13.37%; projected Tier 1 common under U.S. Basel III 12.93%1 As of 9/30/14 $1.2BN cash on hand; $9.2BN in unencumbered liquid AFS securities 1See SHUSA Q3 2014 10Q
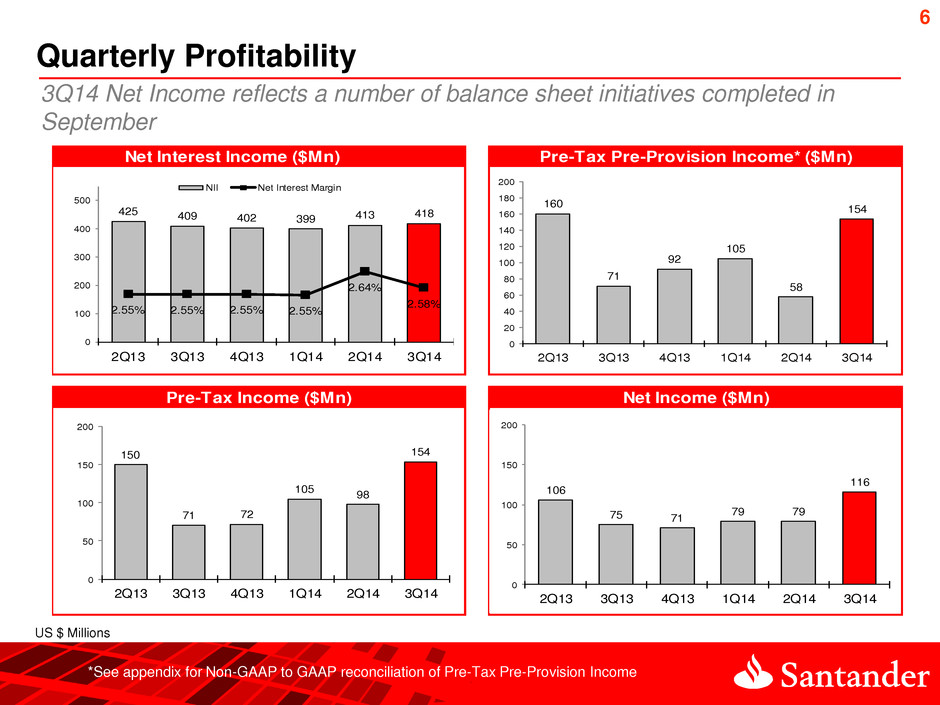
6 Quarterly Profitability US $ Millions *See appendix for Non-GAAP to GAAP reconciliation of Pre-Tax Pre-Provision Income 3Q14 Net Income reflects a number of balance sheet initiatives completed in September Net Interest Income ($Mn) Pre-Tax Pre-Provision Income* ($Mn) Net Income ($Mn)Pre-Tax Income ($Mn) 160 71 92 105 58 154 0 20 40 60 80 100 120 140 160 180 200 2Q13 3Q13 4Q13 1Q14 2Q14 3Q14 425 409 402 399 413 418 2.55% 2.55% 2.55% 2.55% 2.64% 2.58% 0 100 200 300 400 500 2Q13 3Q13 4Q13 1Q14 2Q14 3Q14 NII Net Interest Margin 150 71 72 105 98 154 0 50 100 150 200 2Q13 3Q13 4Q13 1Q14 2Q14 3Q14 106 75 71 79 79 116 0 50 100 150 200 2Q13 3Q13 4Q13 1Q14 2Q14 3Q14
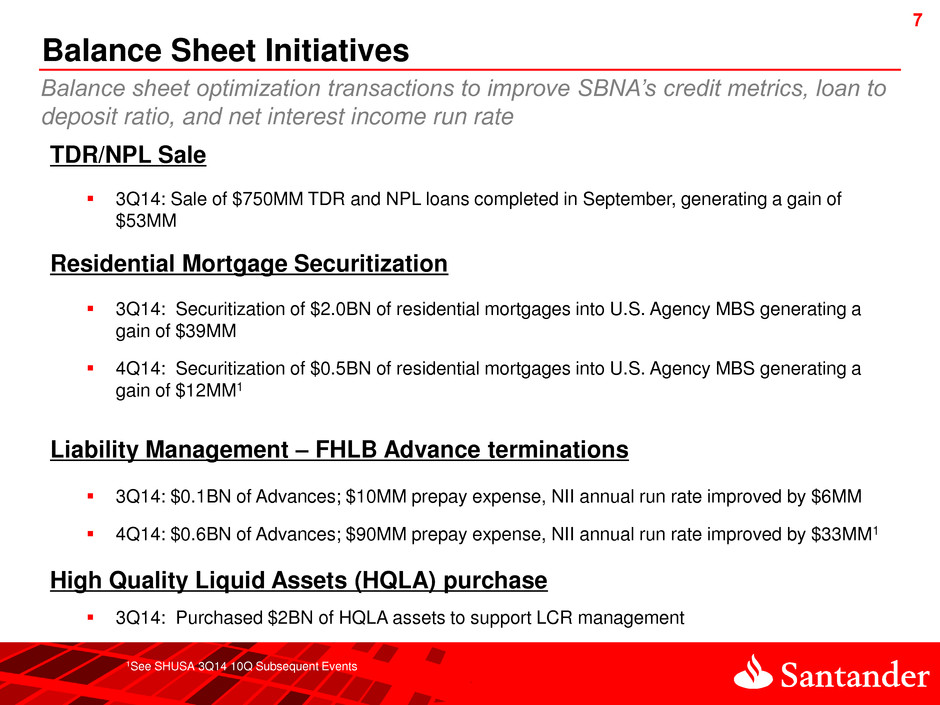
7 7 Balance Sheet Initiatives 3Q14: Sale of $750MM TDR and NPL loans completed in September, generating a gain of $53MM TDR/NPL Sale Residential Mortgage Securitization 3Q14: Securitization of $2.0BN of residential mortgages into U.S. Agency MBS generating a gain of $39MM 4Q14: Securitization of $0.5BN of residential mortgages into U.S. Agency MBS generating a gain of $12MM1 Liability Management – FHLB Advance terminations 3Q14: $0.1BN of Advances; $10MM prepay expense, NII annual run rate improved by $6MM 4Q14: $0.6BN of Advances; $90MM prepay expense, NII annual run rate improved by $33MM1 High Quality Liquid Assets (HQLA) purchase 3Q14: Purchased $2BN of HQLA assets to support LCR management Balance sheet optimization transactions to improve SBNA’s credit metrics, loan to deposit ratio, and net interest income run rate 1See SHUSA 3Q14 10Q Subsequent Events
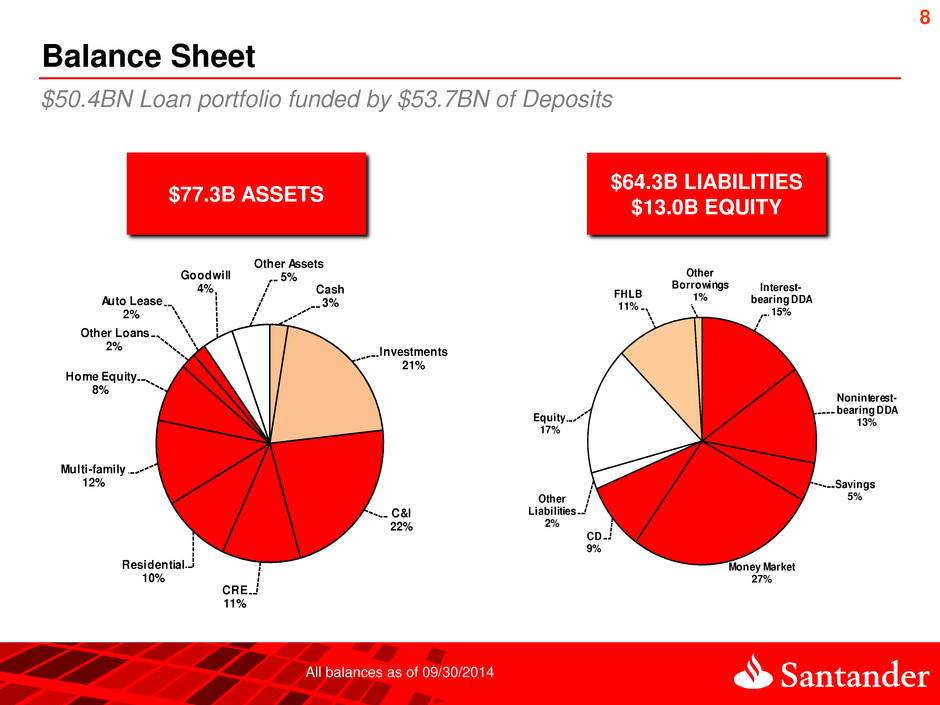
8 Balance Sheet $64.3B LIABILITIES $13.0B EQUITY $77.3B ASSETS All balances as of 09/30/2014 Cash 3% Investments 21% C&I 22% CRE 11% Residential 10% Multi-family 12% Home Equity 8% Other Loans 2% Auto Lease 2% Goodwill 4% Other Assets 5% Interest- bearing DDA 15% Noninterest- bearing DDA 13% Savings 5% Money Market 27% CD 9% Other Liabilities 2% Equity 17% FHLB 11% Other Borrowings 1% $50.4BN Loan portfolio funded by $53.7BN of Deposits
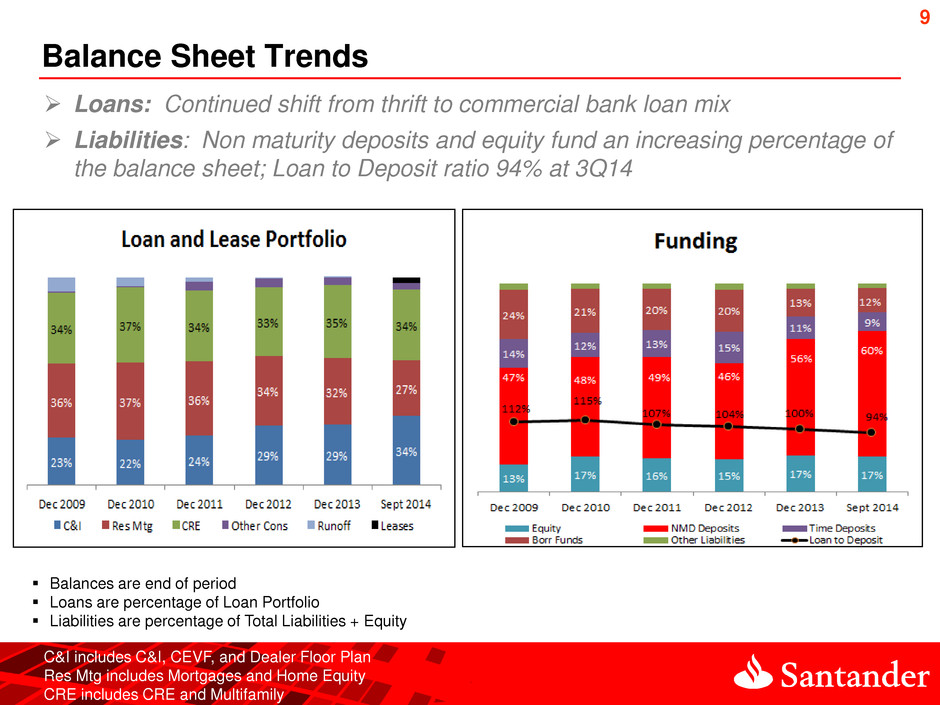
9 Balance Sheet Trends Balances are end of period Loans are percentage of Loan Portfolio Liabilities are percentage of Total Liabilities + Equity Loans: Continued shift from thrift to commercial bank loan mix Liabilities: Non maturity deposits and equity fund an increasing percentage of the balance sheet; Loan to Deposit ratio 94% at 3Q14 C&I includes C&I, CEVF, and Dealer Floor Plan Res Mtg includes Mortgages and Home Equity CRE includes CRE and Multifamily
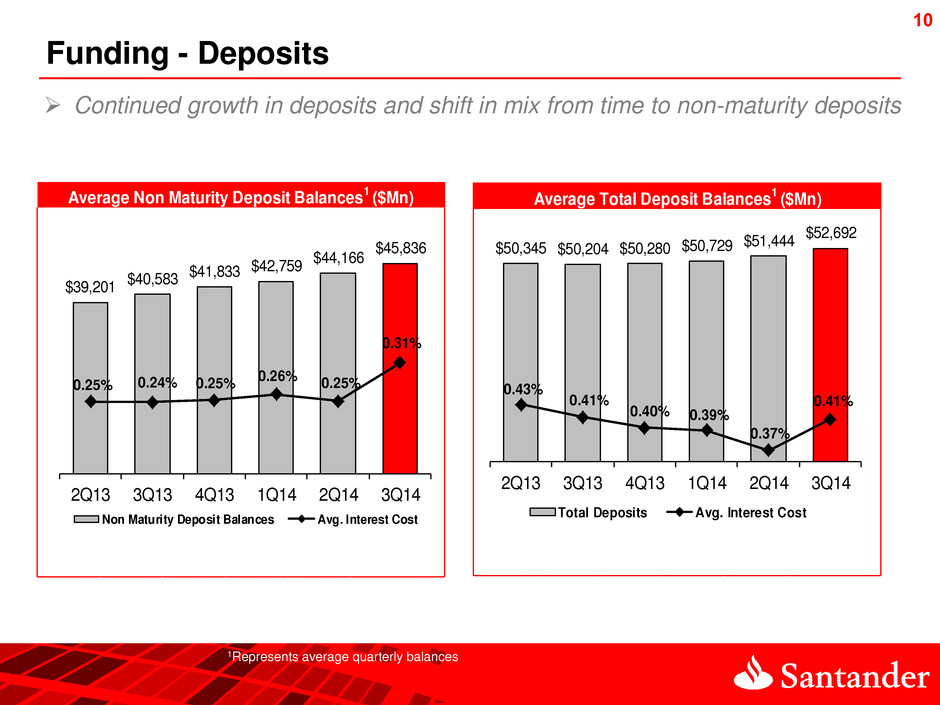
10 10 Funding - Deposits 1Represents average quarterly balances Continued growth in deposits and shift in mix from time to non-maturity deposits Average Non Maturity Deposit Balances 1 ($Mn) $39,201 $40,583 $41,833 $42,759 $44,166 $45,836 0.25% 0.24% 0.25% 0.26% 0.25% 0.31% 2Q13 3Q13 4Q13 1Q14 2Q14 3Q14 Non Maturity Deposit Balances Avg. Interest Cost Average Total Deposit Balances 1 ($Mn) $50,345 $50,204 $50,280 $50,729 $51,444 $52,692 0.43% 0.41% 0.40% 0.39% 0.37% 0.41% 2Q13 3Q13 4Q13 1Q14 2Q14 3Q14 Total Deposits Avg. Interest Cost
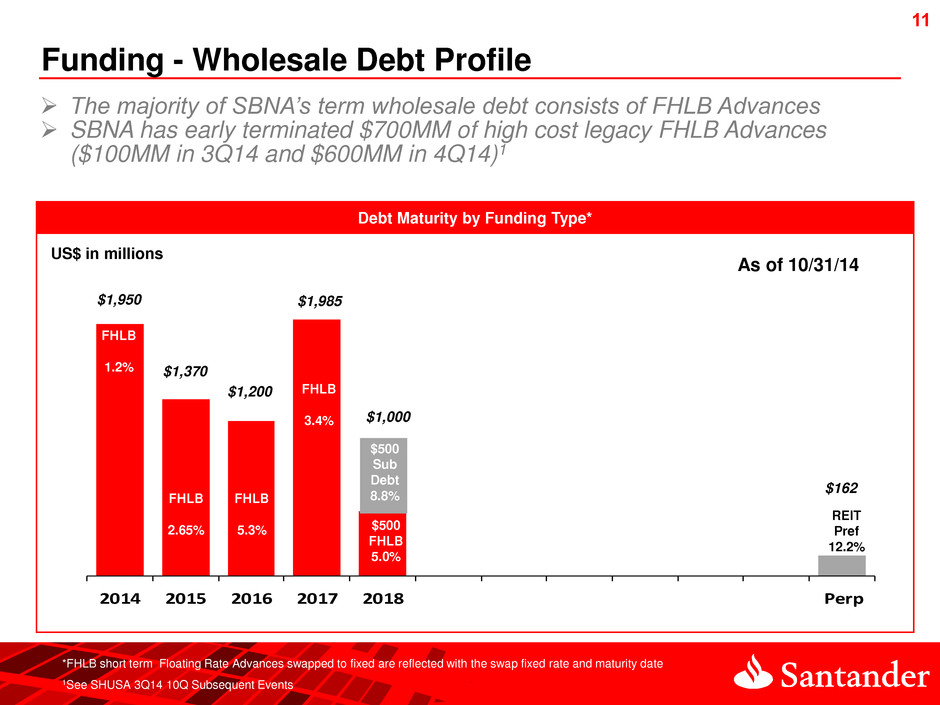
11 11 Debt Maturity by Funding Type* 2014 2015 2016 2017 2018 Perp Funding - Wholesale Debt Profile REIT Pref 12.2% $162 US$ in millions FHLB 1.2% $1,000 The majority of SBNA’s term wholesale debt consists of FHLB Advances SBNA has early terminated $700MM of high cost legacy FHLB Advances ($100MM in 3Q14 and $600MM in 4Q14)1 *FHLB short term Floating Rate Advances swapped to fixed are reflected with the swap fixed rate and maturity date 1See SHUSA 3Q14 10Q Subsequent Events FHLB 2.65% $1,950 $1,370 $1,200 FHLB 5.3% $1,985 FHLB 3.4% $500 FHLB 5.0% $500 Sub Debt 8.8% As of 10/31/14
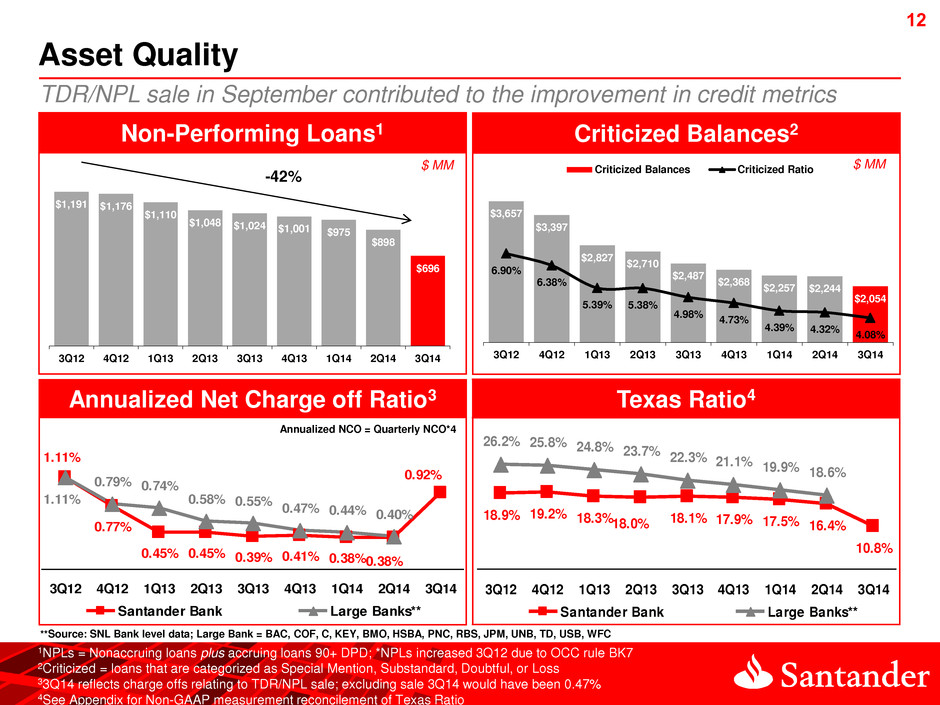
12 12 $3,657 $3,397 $2,827 $2,710 $2,487 $2,368 $2,257 $2,244 $2,054 6.90% 6.38% 5.39% 5.38% 4.98% 4.73% 4.39% 4.32% 4.08% 3Q12 4Q12 1Q13 2Q13 3Q13 4Q13 1Q14 2Q14 3Q14 Criticized Balances Criticized Ratio $1,191 $1,176 $1,110 $1,048 $1,024 $1,001 $975 $898 $696 3Q12 4Q12 1Q13 2Q13 3Q13 4Q13 1Q14 2Q14 3Q14 Criticized Balances2 Non-Performing Loans1 Texas Ratio4 Annualized Net Charge off Ratio3 1.11% 0.38%0.38%0.41%0.39% 0.45%0.45% 0.77% 0.92% 0.44%0.47% 0.55%0.58 0.740.79% 1.11% 0.40% 3Q12 4Q12 1Q13 2Q13 3Q13 4Q13 1Q14 2Q14 3Q14 Santander Bank Large Banks** Asset Quality $ MM -42% TDR/NPL sale in September contributed to the improvement in credit metrics $ MM Annualized NCO = Quarterly NCO*4 **Source: SNL Bank level data; Large Bank = BAC, COF, C, KEY, BMO, HSBA, PNC, RBS, JPM, UNB, TD, USB, WFC 1NPLs = Nonaccruing loans plus accruing loans 90+ DPD; *NPLs increased 3Q12 due to OCC rule BK7 2Criticized = loans that are categorized as Special Mention, Substandard, Doubtful, or Loss 33Q14 reflects charge offs relating to TDR/NPL sale; excluding sale 3Q14 would have been 0.47% 4See Appendix for Non-GAAP measurement reconcilement of Texas Ratio 19.9% 18.6% 10.8% 19.2% 18.3%18.0% 18.1% 17.9% 16.4%17.5% 18.9% 21.1% 26. % 25.8% 24.8% 23.7% 22.3% 3Q12 4Q12 1Q13 2 13 3 13 4 13 1 14 2Q14 3Q14 Santander Bank Large Banks**

13 13 Delinquency1 Reserve Coverage (ALLL/NPL2) 82.3% 84.6% 82.5%83.4%85.5% 88.2%87.5%86.2% 84.0% 100.4%98.7% 94.0%91.0%89.3%91.2%91.3% 105.3% 3Q12 4Q12 1Q13 2Q13 3Q13 4Q13 1Q14 2Q14 3Q14 Santander Bank Large Banks** Non-Performing Loan Ratio Asset Quality (cont.) 1.4% 2.2% 2.1% 2.1% 2.1% 2.0% 1.7% 1.9% 2.3% 1.5% 2.4% 2.3% 2.2% 2.0% 1.9% 1.7% 1.6% 3Q12 4Q12 1Q13 2Q13 3Q13 4Q13 1Q14 2Q14 3Q14 Santander Bank Large Banks** **Source: SNL Bank level data; Large Bank = BAC, COF, C, KEY, BMO, HSBA, PNC, RBS, JPM, UNB, TD, USB, WFC ALLL to Total Loans 1.85% 1.61% 1.43% 1.67% 1.76%1.8 % 1.85%1.90% 1.16% 1.48%1.52%1.59%1.66% 1.73%1.81% 1.92% 1.41% 3Q12 4Q12 1Q13 2Q13 3Q13 4Q13 1Q14 2Q14 3Q14 Santander Bank Large Banks** 1Delinquency = accruing loans 30-89 DPD plus accruing loans 90+ DPD loans 2NPLs= Nonaccruing loans plus accruing loans 90+ DPD 0.92% 0.68% 0.61% 0.77%0.76%0.80%0.79% 1.02% 0.54% 1.05% 1.23%1.22% 1.34% 1.50% 1.68%1.64% 0.98% 3Q12 4Q 2 1Q13 2Q13 3Q13 4Q13 1Q14 2Q14 3Q1 Santander Bank Large Banks** Underlying credit trends continue to improve
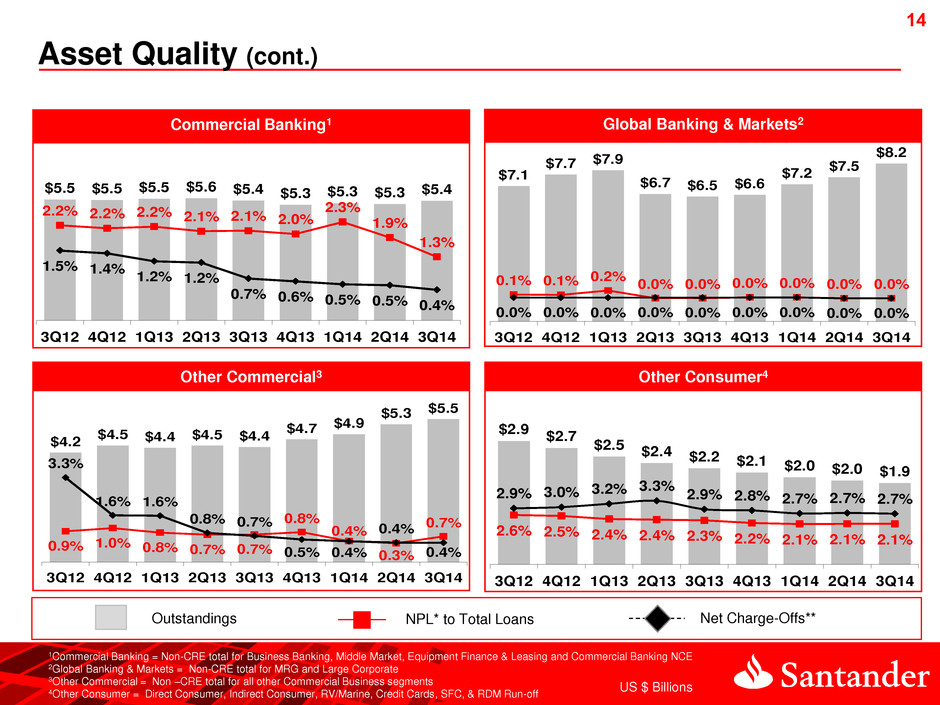
14 Global Banking & Markets2 Commercial Banking1 Other Consumer4 Other Commercial3 Outstandings NPL* to Total Loans Net Charge-Offs** Asset Quality (cont.) US $ Billions 1Commercial Banking = Non-CRE total for Business Banking, Middle Market, Equipment Finance & Leasing and Commercial Banking NCE 2Global Banking & Markets = Non-CRE total for MRG and Large Corporate 3Other Commercial = Non –CRE total for all other Commercial Business segments 4Other Consumer = Direct Consumer, Indirect Consumer, RV/Marine, Credit Cards, SFC, & RDM Run-off $5.5 $5.5 $5.5 $5.6 $5.4 $5.3 $5.3 $5.3 $5.4 2.2% 2.2% 2.2% 2.1% 2.1% 2.0% 2.3% 1.9% 1.3% 1.5% 1.4% 1.2% 1.2% 0.7% 0.6% 0.5% 0.5% 0.4% 3Q12 4Q12 1Q13 2Q13 3Q13 4Q13 1Q14 2Q14 3Q14 $7.1 $7.7 $7.9 $6.7 $6.5 $6.6 $7.2 $7.5 $8.2 0.1% 0.1% 0.2% 0.0% 0.0% 0.0% 0.0% 0.0% 0.0% 0.0% 0.0% 0.0% 0.0% 0.0% 0.0% 0.0% 0.0% 0.0% 3Q12 4Q12 Q13 2Q13 3Q 3 4Q13 1Q14 2Q14 3Q14 $4.2 $4.5 $4.4 $4.5 $4.4 $4.7 $4.9 $5.3 $5.5 0.9% 1.0% 0.8% 0.7% 0.7% 0.8% 0.4% 0.3% 0.7% 3.3% 1.6% 1.6% 0.8% 0.7% 0.5% 0.4% 0.4% 0.4% 3Q12 4Q12 1Q13 2Q13 3Q13 4Q13 1Q14 2Q14 3Q14 $2.9 $2.7 $2.5 $2.4 $2.2 $2.1 $2.0 $2.0 $1.9 2.6% 2.5% 2.4% 2.4% 2.3% 2.2% 2.1% 2.1% 2.1% 2 9 3 3.2 3.3 2.9 2.8 2.7 2.7 2.7 3Q12 4Q12 Q13 2Q13 3Q 3 4Q13 1Q14 2Q14 3Q14
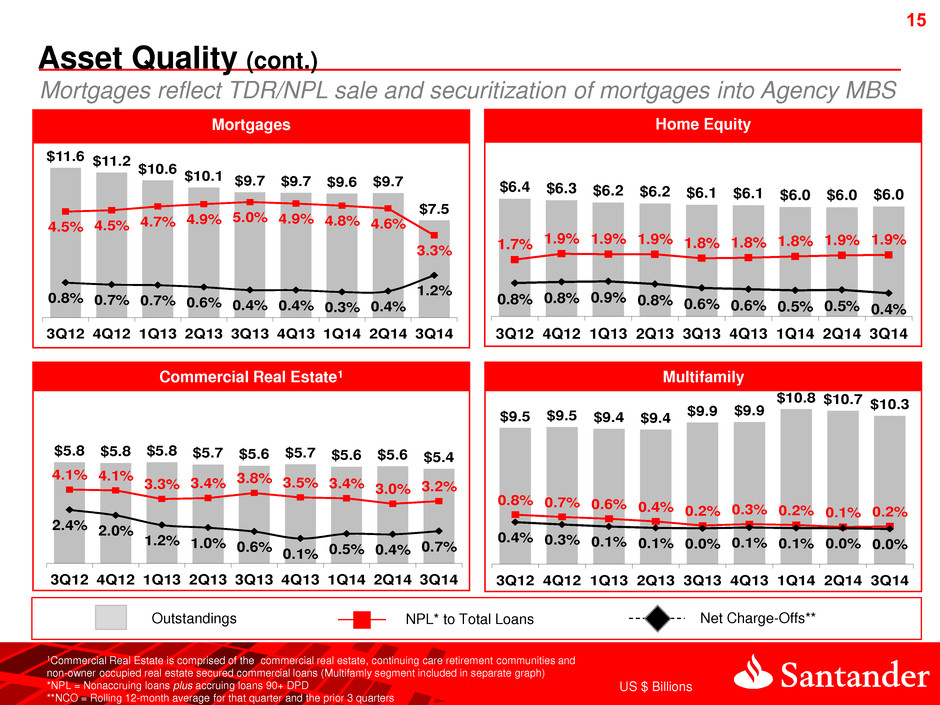
15 Commercial Real Estate1 Home Equity Mortgages Multifamily Outstandings NPL* to Total Loans Net Charge-Offs** Asset Quality (cont.) US $ Billions 1Commercial Real Estate is comprised of the commercial real estate, continuing care retirement communities and non-owner occupied real estate secured commercial loans (Multifamly segment included in separate graph) *NPL = Nonaccruing loans plus accruing loans 90+ DPD **NCO = Rolling 12-month average for that quarter and the prior 3 quarters Mortgages reflect TDR/NPL sale and securitization of mortgages into Agency MBS $11.6 $11.2 $10.6 $10.1 $9.7 $9.7 $9.6 $9.7 $7.5 4.5% 4.5% 4.7% 4.9% 5.0% 4.9% 4.8% 4.6% 3.3% 0.8% 0.7% 0.7% 0.6% 0.4% 0.4% 0.3% 0.4% 1.2% 3Q12 4Q12 1Q13 2Q13 3Q13 4Q13 1Q14 2Q14 3Q14 $6.4 $6.3 $6.2 $6.2 $6.1 $6.1 $6.0 $6.0 $6.0 1.7% 1.9% 1.9% 1.9% 1.8% 1.8% 1.8% 1.9% 1.9% 0.8% 0.8% 0.9% 0.8% 0.6% 0.6% 0.5% 0.5% 0.4% 3Q 2 4Q12 Q13 2Q13 3Q 3 4Q13 1Q14 2Q14 3Q14 $5.8 $5.8 $5.8 $5.7 $5.6 $5.7 $5.6 $5.6 $5.4 4.1% 4.1% 3.3 3.4 3.8% 3.5% 3.4% 3.0 3.2% 2.4% 2.0% 1.2% 1.0% 0.6% 0.1% 0.5% 0.4% 0.7% 3Q12 4Q12 1Q13 2Q13 3Q13 4Q13 1Q14 2Q14 3Q14 $9.5 $9.5 $9.4 $9.4 $9.9 $9.9 $10.8 $10.7 $10.3 0.8% 0.7% 0.6% 0.4% 0.2% 0.3% 0.2% 0.1% 0.2% 0.4% 0.3% 0.1% 0.1% 0.0% 0.1% 0.1% 0.0% 0.0% 3Q12 4Q12 Q13 2Q13 3Q 3 4Q13 1Q14 2Q14 3Q14
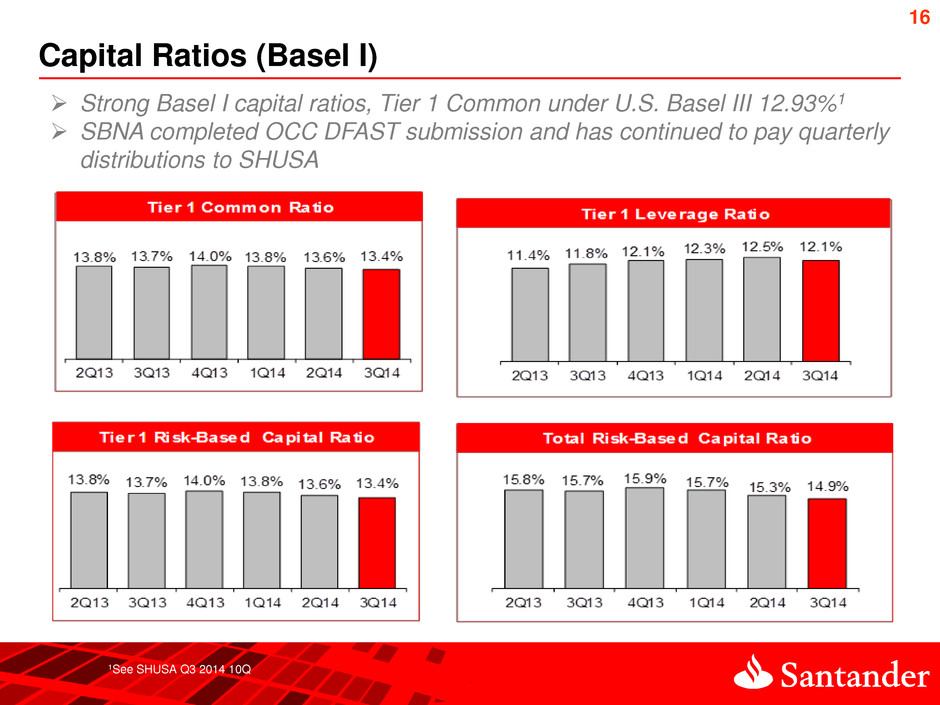
16 Capital Ratios (Basel I) 1See SHUSA Q3 2014 10Q Strong Basel I capital ratios, Tier 1 Common under U.S. Basel III 12.93%1 SBNA completed OCC DFAST submission and has continued to pay quarterly distributions to SHUSA
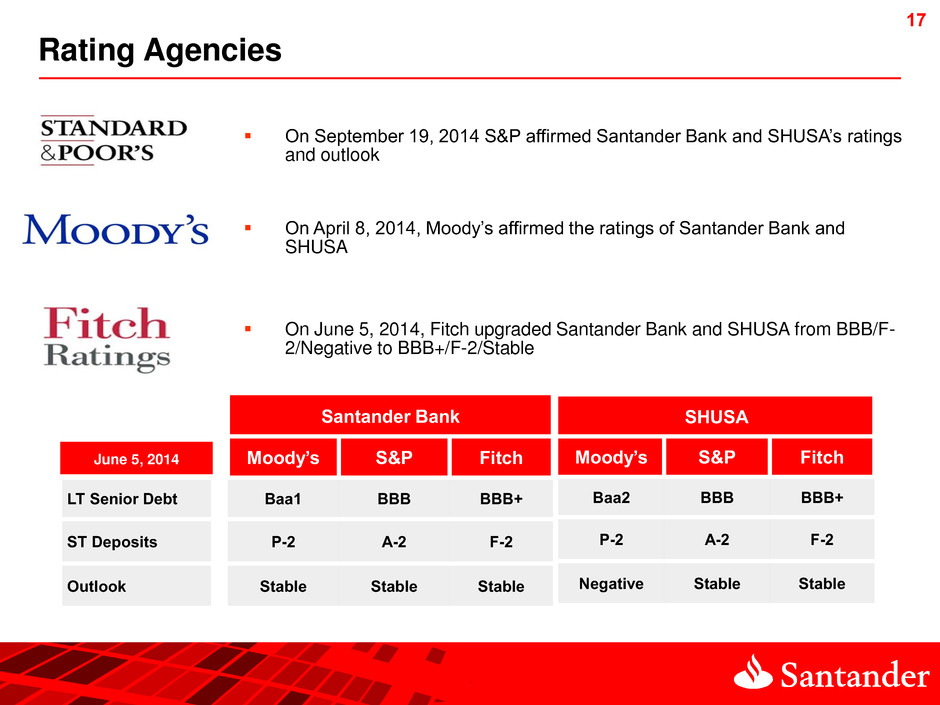
17 17 Rating Agencies Santander Bank Te Moody’s S&P Fitch LT Senior Debt Baa1 BBB BBB+ ST Deposits P-2 A-2 F-2 Outlook Stable Stable Stable SHUSA Moody’s S&P Fitch Baa2 BBB BBB+ P-2 A-2 F-2 Negative Stable Stable On September 19, 2014 S&P affirmed Santander Bank and SHUSA’s ratings and outlook On April 8, 2014, Moody’s affirmed the ratings of Santander Bank and SHUSA On June 5, 2014, Fitch upgraded Santander Bank and SHUSA from BBB/F- 2/Negative to BBB+/F-2/Stable June 5, 2014

Appendix
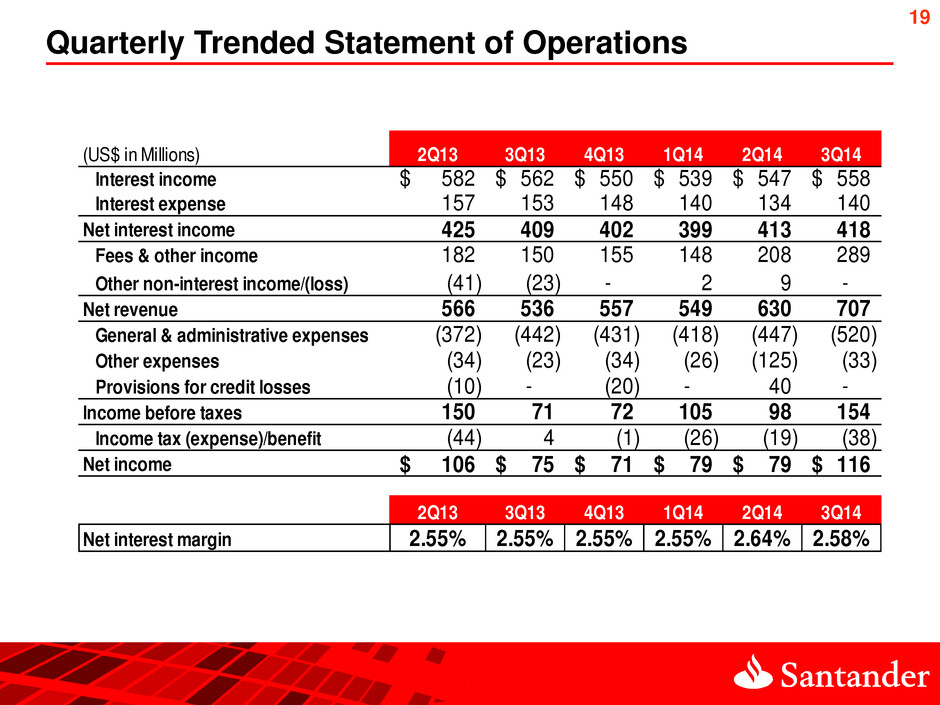
19 Quarterly Trended Statement of Operations (US$ in Millions) 2Q13 3Q13 4Q13 1Q14 2Q14 3Q14 Interest income 582$ 562$ 550$ 539$ 547$ 558$ Interest expense 157 153 148 140 134 140 Net interest income 425 409 402 399 413 418 Fees & other income 182 150 155 148 208 289 Other non-interest income/(loss) (41) (23) - 2 9 - Net revenue 566 536 557 549 630 707 General & administrative expenses (372) (442) (431) (418) (447) (520) Other expenses (34) (23) (34) (26) (125) (33) Provisions for credit losses (10) - (20) - 40 - Income before taxes 150 71 72 105 98 154 Income tax (expense)/benefit (44) 4 (1) (26) (19) (38) Net income 106$ 75$ 71$ 79$ 79$ 116$ 2Q13 3Q13 4Q13 1Q14 2Q14 3Q14 Net interest margin 2.55% 2.55% 2.55% 2.55% 2.64% 2.58%
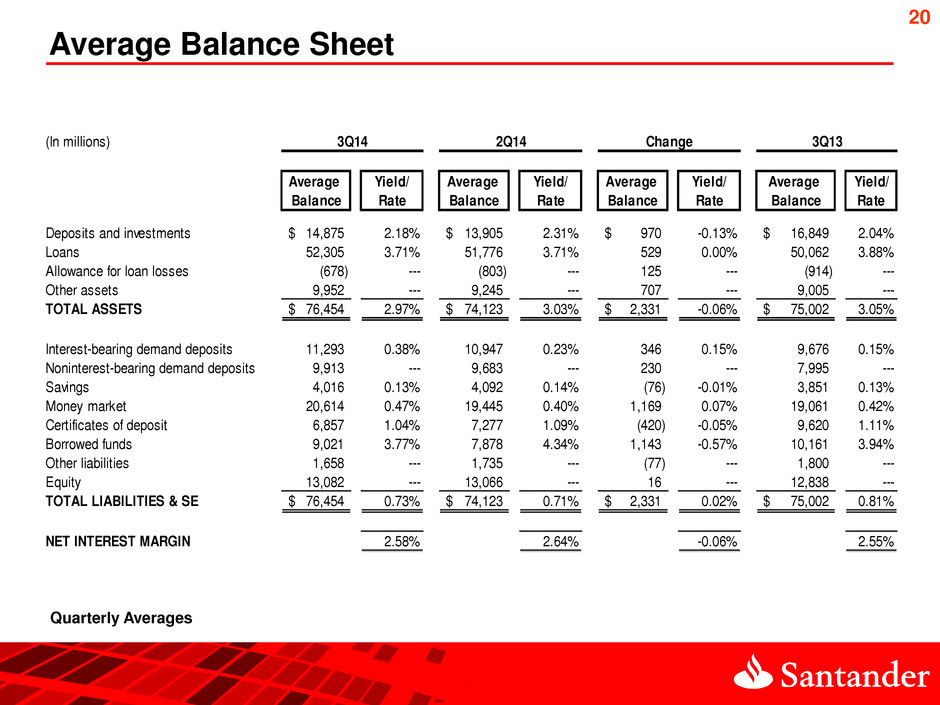
20 Average Balance Sheet Quarterly Averages (In millions) Average Yield/ Average Yield/ Average Yield/ Average Yield/ Balance Rate Balance Rate Balance Rate Balance Rate Deposits and investments 14,875$ 2.18% 13,905$ 2.31% 970$ -0.13% 16,849$ 2.04% Loans 52,305 3.71% 51,776 3.71% 529 0.00% 50,062 3.88% Allowance for loan losses (678) --- (803) --- 125 --- (914) --- Other assets 9,952 --- 9,245 --- 707 --- 9,005 --- TOTAL ASSETS 76,454$ 2.97% 74,123$ 3.03% 2,331$ -0.06% 75,002$ 3.05% Interest-bearing demand deposits 11,293 0.38% 10,947 0.23% 346 0.15% 9,676 0.15% Noninterest-bearing demand deposits 9,913 --- 9,683 --- 230 --- 7,995 --- Savings 4,016 0.13% 4,092 0.14% (76) -0.01% 3,851 0.13% Money market 20,614 0.47% 19,445 0.40% 1,169 0.07% 19,061 0.42% Certificates of deposit 6,857 1.04% 7,277 1.09% (420) -0.05% 9,620 1.11% Borrowed funds 9,021 3.77% 7,878 4.34% 1,143 -0.57% 10,161 3.94% Other liabilities 1,658 --- 1,735 --- (77) --- 1,800 --- Equity 13,082 --- 13,066 --- 16 --- 12,838 --- TOTAL LIABILITIES & SE 76,454$ 0.73% 74,123$ 0.71% 2,331$ 0.02% 75,002$ 0.81% NET INTEREST MARGIN 2.58% 2.64% -0.06% 2.55% 3Q14 3Q132Q14 Change

21 Non-GAAP to GAAP Reconciliations (1) Total assets adjusted for intangible assets and other regulatory deductions $ Millions 2Q13 3Q13 4Q13 1Q14 2Q14 3Q14 Tier 1 Common to Risk Weighted Assets Tier 1 Common Capital 8,308$ 8,331$ 8,390$ 8,591$ 8,701$ 8,748$ Risk Weighted Assets 59,994 60,607 60,091 62,168 64,153 65,444 Ratio 13.8% 13.7% 14.0% 13.8% 13.6% 13.4% Tier 1 Leverage Tier 1 Capital 8,308$ 8,331$ 8,390$ 8,591$ 8,701$ 8,748$ 72,991 70,610 69,396 70,094 69,835 72,127 Ratio 11.4% 11.8% 12.1% 12.3% 12.5% 12.1% Tier 1 Risk Based Tier 1 Capital 8,308$ 8,331$ 8,390$ 8,591$ 8,701$ 8,748$ Risk Weighted Assets 59,994 60,607 60,091 62,168 64,153 65,444 Ratio 13.8% 13.7% 14.0% 13.8% 13.6% 13.4% Total Risk Based Risk Based Capital 9,466$ 9,497$ 9,551$ 9,777$ 9,811$ 9,781$ Risk Weighted Assets 59,994 60,607 60,091 62,168 64,153 65,444 Ratio 15.8% 15.7% 15.9% 15.7% 15.3% 14.9% Average total assets for leverage capital purposes (1)

22 Non-GAAP to GAAP Reconciliations (cont.) 2Q13 3Q13 4Q13 1Q14 2Q14 3Q14 Santander Bank Pre-Tax Pre-Provision Income Pre-tax income, as reported 150$ 71$ 72$ 105$ 98$ 154$ Add back: Provision for credit losses 10 - 20 - (40) - Pre-Tax Pre-Provision Income 160$ 71$ 92$ 105$ 58$ 154$
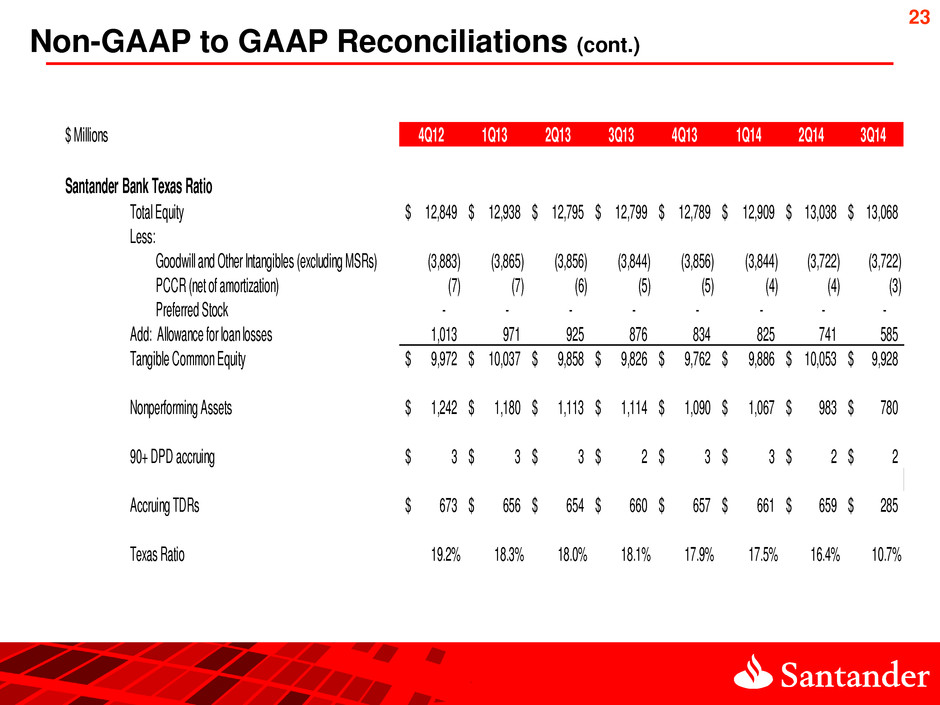
23 Non-GAAP to GAAP Reconciliations (cont.) $ Millions 4Q12 1Q13 2Q13 3Q13 4Q13 1Q14 2Q14 3Q14 Santander Bank Texas Ratio Total Equity 12,849$ 12,938$ 12,795$ 12,799$ 12,789$ 12,909$ 13,038$ 13,068$ Less: Goodwill and Other Intangibles (excluding MSRs) (3,883) (3,865) (3,856) (3,844) (3,856) (3,844) (3,722) (3,722) PCCR (net of amortization) (7) (7) (6) (5) (5) (4) (4) (3) Preferred Stock - - - - - - - - Add: Allowance for loan losses 1,013 971 925 876 834 825 741 585 Tangible Common Equity 9,972$ 10,037$ 9,858$ 9,826$ 9,762$ 9,886$ 10,053$ 9,928$ Nonperforming Assets 1,242$ 1,180$ 1,113$ 1,114$ 1,090$ 1,067$ 983$ 780$ 90+ DPD accruing 3$ 3$ 3$ 2$ 3$ 3$ 2$ 2$ Accruing TDRs 673$ 656$ 654$ 660$ 657$ 661$ 659$ 285$ Texas Ratio 19.2% 18.3% 18.0% 18.1% 17.9% 17.5% 16.4% 10.7%


