WASHINGTON, DC 20549
MANAGEMENT INVESTMENT COMPANIES
Bellingham, Washington 98225-4730
1300 N. State Street
Bellingham, Washington 98225-4730
Date of reporting period: November 30, 2006

| Additional Performance Information | Page 2 |
| Letter To Shareowners | Page 3 |
| Sextant Short-Term Bond Fund | Page 4 |
| Sextant Bond Income | Page 9 |
| Sextant Growth Fund | Page 14 |
| Sextant International Fund | Page 20 |
| Expense Examples | Page 26 |
| Notes To Financial Statements | Page 27 |
| Report of Registered Independent Public Accounting Firm | Page 29 |
| Renewal of Investment Advisory Contracts | Page 29 |
| Results of Special Shareowner Meeting | Page 30 |
| Trustees and Officers | Page 31 |
| Privacy Statement | Page 31 |
| Additional Performance Information | |||
Average Annual Returns (as of 12/31/2006) | 1-Year | 5-Year | 10-Year |
| Sextant Short-Term Bond Fund | 3.86% | 3.28% | 4.63% |
| Sextant Bond Income Fund | 3.04% | 5.11% | 6.13% |
| Sextant Growth Fund | 8.17% | 9.00% | 11.43% |
| Sextant International Fund | 22.02% | 14.06% | 10.24% |
Performance data quoted in this report represents past performance, is before any taxes payable by shareowners, and is no guarantee of future performance. Mutual fund performance changes over time and currently may be significantly higher or lower than stated. Performance and Morningstar™ rating data current to the most recent month-end is published online at www.saturna.com or available by calling toll free (800) SATURNA. Total returns are historical and include change in share value and reinvestment of dividends and capital gains, if any. Share price, yield and return will vary and you may have a gain or loss when you sell your shares. See individual Fund performance discussions for further information. Funds that invest in foreign securities may involve greater risk, including political and economic uncertainties of foreign countries as well as the risk of currency fluctuations.
Morningstar™, Inc. is an independent fund performance monitor. Rankings are determined monthly from total returns by Morningstar™, by category as determined by Morningstar™. The overall Morningstar™ rating for a fund is derived from a weighted average of the performance figures associated with its 3-, 5-, and 10-year (if applicable) Morningstar™ Rating. The average total return for a category is determined by Saturna Capital, utilizing the Morningstar™ database. Results are shown for twelve months because the Sextant Funds’ performance fees are based on the same period.
| 2 | November 30, 2006 Annual Report |
| Fellow Shareowners: | (unaudited) |
2006 was a profitable year for securities investors, marking four years in a row of moderate advances. Stocks provided solid gains, and the bond markets also provided positive returns as interest rates stabilized. We are pleased to report that both Sextant Growth Fund and Sextant International Fund provided double-digit returns for the fiscal year ending November 30, 2006. Good performance is attracting more investors, and the assets of all four Sextant funds grew in 2006 (as they did in 2005). Sextant International Fund had the largest total return (22%) and growth in assets (135%).
Buoyed by moderate spending gains in all three major sectors (consumers, business, government), liberal trade policies, and slower commodity price increases, corporate earnings continued growing in 2006. Higher interest rates stopped the real estate boom, and falling property prices and construction activity are clearly slowing the economy. Consumer confidence is waning, but the risk of a cyclical collapse appear low. Foreign economies are generally performing better than the US, a trend likely to continue.
A number of our market indicators are flagging caution, and we warn stock market investors to expect lesser returns in 2007. We expect short-term rates to remain at or above longer-term rates - usually a precursor of stock market weakness. Inflation is controlled and the Fed’s increase in short-term interest rates is near conclusion, meaning 2007 could finally be the year for bonds to shine. Slower corporate earnings growth rates will hamper stock prices, but price / earnings multiples have room to expand.
The no-load Sextant Funds are designed to address a broad spectrum of investment needs. Again in 2006, higher equity Fund returns reflected the higher risks of equities - just as expected. All Sextant Funds stress low operating expenses and employ a “fulcrum” advisory fee structure that rewards or penalizes Saturna Capital for investment results. Contrary to popular wisdom, a higher fund advisory fee that results from superior investment performance under a fulcrum advisory fee structure and consequently a higher fund expense ratio is actually in the best interests of shareowners.
For the fiscal year ended November 30, 2006, comparative total returns and percentile Morningstar™ category rankings (1 is best)† are:
| Sextant Fund | Total Return | vs. Morningstar™† | Total Return | Rank (category size) † |
| Short-Term Bond | 4.41% | Short-term Bond | 4.40% | 43 (435) |
| Bond Income | 4.73% | Long-term Bond | 6.70% | 92 (45) |
| Growth | 10.06% | Mid-Cap Growth | 10.09% | 49 (997) |
| International | 21.85% | Foreign Large Blend | 27.17% | 96 (634) |
Two important changes were implemented by the Sextant Funds in 2006. After long consideration, the Trustees recommended and the shareowners subsequently approved a Rule 12b-1 distribution plan. The Sextant Growth and Sextant International Funds are being made available at the major mutual fund supermarkets, such as Fidelity Investments and Charles Schwab, which should aid asset growth in these funds. The supermarkets provide useful services such as centralized investor accounts, but require a fee from the distributor (which now gains revenue from the 12b-1 plan) to do so. Secondly, the trustees approved a fifth Sextant fund (expected to be available this Spring) designed to simplify investing by retirement plan accounts by incorporating a balance of stocks and bonds in one fund.
Further information on each Fund is found in its section of this report. Operating expenses are well below industry averages. Perhaps uniquely, equity portfolio brokerage commission expenses are entirely borne by the adviser. Consequently, the Sextant Funds can not use portfolio brokerage to pay any expenses of the Funds or the adviser. In the footnotes, you will notice another unusual feature of the Sextant funds: on average, more than 30% of each Sextant Fund is owned by the trustees, officers, and their related accounts. Our portfolio managers welcome your comments and suggestions. We invite you to invest your money with ours.
Nicholas Kaiser, President (Manager, Sextant Growth, Sextant International) | Phelps McIlvaine, Vice President (Manager, Sextant Short-Term Bond, Sextant Bond Income) |
| November 30, 2006 Annual Report | 3 |
 Sextant Short-Term Bond Fund
| Rating* | Issuer | Coupon/Maturity | Face Amount | Market Value | Percentage |
| Cosmetics & Toiletries | |||||
| A | Avon Products Inc. | 6.55% due 8/1/2007 | $95,000 | $94,907 | 3.2% |
| Diversified Operations | |||||
| A | First Data Corp. | 4.50% due 6/15/2010 | 100,000 | 98,317 | 3.3% |
| Finance & Insurance | |||||
| AA- | HSBC Finance Corp. | 6.375% due 10/15/2011 | 100,000 | 105,196 | 3.6% |
| A+ | Lehman Brothers Holdings | 5.75% due 4/25/2011 | 100,000 | 101,443 | 3.4% |
| Subtotal | 200,000 | 206,639 | 7.0% | ||
| Food & Beverages | |||||
| BBB | Fortune Brands | 5.125% due 1/15/2011 | 120,000 | 118,515 | 4.1% |
| A+ | W M Wrigley Jr. Co. | 4.30% due 7/15/2010 | 100,000 | 97,813 | 3.3% |
| Subtotal | 220,000 | 216,328 | 7.4% | ||
| Machinery | |||||
| A | Caterpillar Inc. | 7.25% due 9/15/2009 | 100,000 | 105,684 | 3.6% |
| A- | Rockwell Automation International | 6.15% due 1/15/2008 | 95,000 | 95,376 | 3.3% |
| Subtotal | 195,000 | 201,060 | 6.9% | ||
| Medical Drugs | |||||
| A | Amgen | 6.50% due 12/1/2007 | 90,000 | 90,530 | 3.1% |
| Oil & Gas | |||||
| A- | ConocoPhillips Co. | 8.75% due 5/25/2010 | 100,000 | 111,743 | 3.8% |
| Retail-Discount & Variety | |||||
| A- | TJ X Companies Inc. | 7.45% due 12/15/2009 | 95,000 | 101,484 | 3.5% |
| Telecommunications | |||||
| BBB+ | Southwestern Bell Telephone | 6.625% due 7/15/2007 | 95,000 | 95,151 | 3.2% |
| A- | Verizon Wireless Capital | 5.375 due 12/15/2006 | 82,000 | 81,511 | 2.8% |
| Subtotal | 177,000 | 176,662 | 6.0% | ||
| U.S. Government | |||||
| AAA | U.S. Treasury Note | 4.00% due 6/15/2009 | 200,000 | 197,500 | 6.7% |
| AAA | U.S. Treasury Note | 4.00% due 4/15/2010 | 200,000 | 197,062 | 6.7% |
| Subtotal | 400,000 | 394,562 | 13.7% | ||
| U.S. Government Agency | |||||
| AAA | Federal Farm Credit Bank | 4.62% due 12/7/2009 | 100,000 | 98,908 | 3.4% |
| AAA | Federal Farm Credit Bank | 5.79% due 6/5/2013 | 200,000 | 203,402 | 6.9% |
| AAA | Federal Home Loan Bank | 4.60% due 5/18/2009 | 120,000 | 118,872 | 4.1% |
| AAA | Federal Home Loan Bank | 4.00 due 2/27/2014 | 300,000 | 297,510 | 10.1% |
| AAA | Federal Home Loan Mortgage | 4.125% due 11/6/2009 | 120,000 | 117,792 | 4.0% |
| AAA | Federal National Mortgage Association | 4.00% due 2/23/2010 | 120,000 | 119,512 | 4.1% |
| Subtotal | 960,000 | 955,996 | 32.6% | ||
| 4 | November 30, 2006 Annual Report | (The accompanying notes are an integral part of these financial statements.) |
| Rating* | Issuer | Coupon/Maturity | Face Amount | Market Value | Percentage |
| Utilities | |||||
| BBB | PSI Energy | 7.85% due 10/15/2007 | $90,000 | $91,585 | 3.1% |
| BBB+ | Scottish Power PLC | 4.91% due 3/15/2010 | 100,000 | 99,325 | 3.1% |
| Subtotal | 190,000 | 190,910 | 6.5% | ||
| Total Investments | (Cost = $2,848,892) | $2,822,000 | $2,839,138 | 96.7% | |
| Other Assets (net of liabilities) | 98,234 | 3.3% | |||
| Total Net Assets | $2,937,372 | 100.0% | |||
| (The accompanying notes are an integral part of these financial statements.) | November 30, 2006 Annual Report | 5 |
Sextant Short-Term Bond Fund| Financial Highlights | Year Ended November 30, | ||||||
| Selected data per share of capital stock outstanding throughout the year | 2006 | 2005 | 2004 | 2003 | 2002 | ||
| Net asset value at beginning of year | $4.85 | $4.97 | $5.09 | $5.07 | $5.10 | ||
| Income from investment operations | |||||||
| Net investment income | 0.16 | 0.17 | 0.19 | 0.23 | 0.27 | ||
| Net gains or losses on securities (both realized and unrealized) | 0.05 | (0.12) | (0.12) | 0.02 | (0.02) | ||
| Total from investment operations | 0.21 | 0.05 | 0.07 | 0.25 | 0.25 | ||
| Less distributions | |||||||
| Dividends (from net investment income) | (0.16) | (0.17) | (0.19) | (0.23) | (0.28) | ||
| Total distributions | (0.16) | (0.17) | (0.19) | (0.23) | (0.28) | ||
Paid-in-capital from early redemption penalties 1 | *0.00 | *0.00 | - | - | - | ||
| Net asset value at end of year | $4.90 | $4.85 | $4.97 | $5.09 | $5.07 | ||
| Total Return | 4.41% | 0.96% | 1.41% | 5.00% | 4.90% | ||
| Ratios / Supplemental Data | |||||||
| Net assets ($000), at end of year | $2,937 | $2,557 | $2,255 | $2,259 | $2,177 | ||
| Ratio of expenses to average net assets | |||||||
| Before fee waivers and custody fee credits | 1.39% | 1.23% | 1.14% | 1.17% | 1.14% | ||
| After fee waivers and custody fee credits | 0.57% | 0.59% | 0.58% | 0.60% | 0.93% | ||
| Ratio of net investment income after fee waivers and custody credits to average net assets | 3.41% | 3.35% | 3.80% | 4.47% | 5.23% | ||
| Portfolio turnover rate | 41% | 33% | 37% | 22% | 28% | ||
| 1 Redemption penalty adopted March 29, 2005 | *Amount is less than $0.01 | ||||||
| Statement of Assets and Liabilities | As of November 30, 2006 | |||
| Assets | ||||
| Bond investments (Cost $2,848,892) | $2,839,138 | |||
| Cash | 58,979 | |||
| Interest receivable | 43,096 | |||
| Receivable for Fund shares sold | 6,000 | |||
| Total Assets | $2,947,213 | |||
| Liabilities | ||||
| Payable for Fund shares redeemed | 6,900 | |||
| Other liabilities | 2,289 | |||
| Accrued 12b-1 Fees | 576 | |||
| Distribution payable | 76 | |||
| Total liabilities | 9,841 | |||
| Net Assets | $2,937,372 | |||
| Fund shares outstanding | 600,079 | |||
| Analysis of Net Assets | ||||
| Paid in Capital (unlimited shares authorized, without par value) | 2,996,083 | |||
| Undistributed net investment income | 1,660 | |||
| Accumulated net realized loss | (50,617) | |||
| Unrealized net depreciation on investments | (9,754) | |||
| Net Assets applicable to Fund shares outstanding | $2,937,372 | |||
| Net Asset Value, Offering and Redemption price per share | $4.90 | |||
| 6 | November 30, 2006 Annual Report | (The accompanying notes are an integral part of these financial statements.) |
| Statement of Changes in Net Assets | Year ended Nov. 30, 2006 | Year ended Nov. 30, 2005 | ||
| Increase in Net Assets | ||||
| From operations | ||||
| Net investment income | $87,091 | $82,195 | ||
| Net realized loss on investments | (10,889) | (6,540) | ||
| Net increase (decrease) in unrealized appreciation | 34,663 | (49,766) | ||
| Net increase in net assets | 110,885 | 25,889 | ||
| Dividends to shareowners from | ||||
| Net investment income | (85,431) | (83,151) | ||
| From Fund share transactions | ||||
| Proceeds from sales of shares | 828,422 | 570,038 | ||
| Value of shares issued in reinvestment of dividends | 84,144 | 81,918 | ||
| 912,566 | 651,956 | |||
| Early redemption penalties retained | 64 | 39 | ||
| Cost of shares redeemed | (557,227) | (293,595) | ||
| Net increase in net assets | 355,403 | 358,400 | ||
| Total increase in net assets | $380,827 | $301,138 | ||
| Net Assets | ||||
| Beginning of year | 2,556,545 | 2,255,407 | ||
| End of year | $2,937,372 | $2,556,545 | ||
| Undistributed net investment income | 1,660 | - | ||
| Shares of the Fund sold and redeemed | ||||
| Number of shares sold | 170,721 | 115,934 | ||
| Number of shares issued in reinvestment of dividends | 17,342 | 16,765 | ||
| 188,063 | 132,699 | |||
| Number of shares redeemed | (114,974) | (59,815) | ||
| Net increase in number of shares outstanding | 73,089 | 72,884 | ||
| Statement of Operations | For the year ended November 30, 2006 | |||
| Investment income | ||||
| Interest income | $101,545 | |||
| Other income | 68 | |||
| Gross investment income | $101,613 | |||
| Expenses | ||||
| Investment adviser and administration fees | 15,432 | |||
| Filing and registrations fees | 9,825 | |||
| Audit fees | 2,856 | |||
| Custodian fees | 1,531 | |||
| Chief compliance officer expenses | 1,269 | |||
| Distribution fees | 1,124 | |||
| Insurance | 1,046 | |||
| Printing and postage | 1,038 | |||
| Trustee fees | 643 | |||
| Legal fees | 420 | |||
| Total gross expenses | 35,639 | |||
| Less adviser fees waived | (19,082) | |||
| Less custodian fees waived | (2,035) | |||
| Net expenses | 14,522 | |||
| Net investment income | 87,091 | |||
| Net realized loss on investments | ||||
| Proceeds from sales | 1,001,313 | |||
| Less cost of securities sold (based on identified cost) | 1,012,212 | |||
| Realized net loss | (10,899) | |||
| Unrealized gain on investments | ||||
| End of year | (9,754) | |||
| Beginning of year | (44,417) | |||
| Increase in unrealized gain for the year | 34,663 | |||
| Net realized and unrealized gain | 23,764 | |||
| Net increase in net assets resulting from operations | $110,855 | |||
| (The accompanying notes are an integral part of these financial statements.) | November 30, 2006 Annual Report | 7 |
Sextant Short-Term Bond Fund| Ratings Established | By Adviser | By Standard & Poor's | By Moody's Investor Services |
| AAA | 46.0% | 39.3% | 42.6% |
| AA | 3.6% | 3.6% | 3.6% |
| A | 33.3% | 36.6% | 33.3% |
| BBB | 13.8% | 10.5% | 10.6% |
| Unrated | 0.0% | 6.7% | 6.6% |
| Cash | 3.3% | 3.3% | 3.3% |
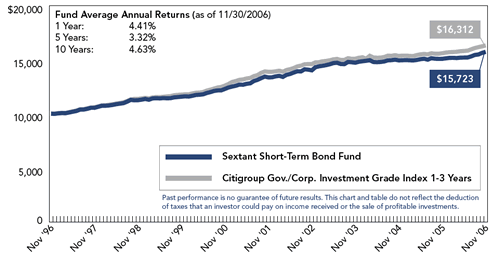
Steadying short-term interest rates helped the Fund’s total return, as bond prices increased. Expense fee waivers also helped performance, and will continue in 2007. The table (right) provides a summary of portfolio holdings by bond quality ratings as of November 30, 2006.
We plan to increase portfolio weighting in corporate bonds and reduce exposure to US Treasury and government agency positions. Globalization limits the impact of US economic inefficiencies, as substitutes are imported from less onerous foreign economies. Our expectation is another year of solid real returns for the Fund, earned without taking substantial market risks.
| Sextant Short Term Bond Fund vs. Citigroup Gov./Corp. Inv. Grade Index 1-3 Years (unaudited) |
 |
| 8 | November 30, 2006 Annual Report |

| Rating* | Issuer | Coupon/Maturity | Face Amount | Market Value | Percentage |
| Agricultural | |||||
| A | Archer Daniels Midland | 7.00% due 2/1/2031 | $100,000 | $118,933 | 3.5% |
| Automotive | |||||
| BBB | AutoZone Inc. | 5.50% due 11/15/2015 | 95,000 | 92,859 | 2.7% |
| Finance & Insurance | |||||
| A+ | CitiCorp | 7.25% due 10/15/2011 | 50,000 | 54,616 | 1.6% |
| A | Comerica Bank | 7.125% due 12/1/2013 | 50,000 | 52,621 | 1.6% |
| AA | Norwest Financial Inc. | 6.85% due 7/15/2009 | 50,000 | 51,777 | 1.5% |
| Subtotal | 150,000 | 159,014 | 4.7% | ||
| Building Products | |||||
| BBB+ | Masco | 7.125% due 8/15/2013 | 60,000 | 62,122 | 1.8% |
| Chemicals | |||||
| A | Air Products & Chemicals | 8.75% due 4/15/2021 | 50,000 | 64,492 | 1.9% |
| Diversified Financial Services | |||||
| AAA | General Electric Capital Corp. | 8.125% due 5/15/2012 | 60,000 | 68,344 | 2.0% |
| Electric Utilities | |||||
| A | Commonwealth Edison Corp. | 7.50% due 7/1/2013 | 50,000 | 54,580 | 1.6% |
| A | Florida Power & Light | 5.95 due 10/1/2033 | 100,000 | 106,259 | 3.2% |
| BBB+ | Sempra Energy Corp. | 7.95 due 3/1/2010 | 50,000 | 53,687 | 1.6% |
| Subtotal | 200,000 | 214,526 | 6.4% | ||
| Electronics | |||||
| A- | Koninlijke Phillips Electronics Corp. | 7.25% due 8/15/2013 | 50,000 | 56,149 | 1.6% |
| Food | |||||
| BBB | Conagra Inc. | 7.875% due 9/15/2010 | 33,000 | 35,745 | 1.0% |
| A+ | Hershey Foods Co. | 6.95% due 8/15/2012 | 50,000 | 54,137 | 1.6% |
| BBB | HJ Heinz Co. | 6.00% due 3/15/2012 | 75,000 | 76,644 | 2.3% |
| Subtotal | 158,000 | 166,526 | 4.9% | ||
| Insurance | |||||
| A+ | Allstate Corp. | 7.50% due 6/15/2013 | 50,000 | 56,017 | 1.7% |
| A+ | Progressive Corp. | 7.00% due 10/1/2013 | 75,000 | 81,986 | 2.4% |
| A- | XL Capital (Europe) | 6.50% due 1/15/2012 | 90,000 | 94,979 | 2.8% |
| Subtotal | 215,000 | 232,982 | 6.9% | ||
| Investment Finance | |||||
| A | Bear Stearns | 3.50% due 6/27/2008 | 154,000 | 144,467 | 4.3% |
| A+ | Morgan Stanley Dean Witter Disc. | 6.75% due 10/15/2013 | 50,000 | 53,575 | 1.6% |
| AA | Paine Webber Group | 7.625% due 2/15/2014 | 50,000 | 56,703 | 1.7% |
| Subtotal | 254,000 | 254,745 | 7.6% | ||
| (The accompanying notes are an integral part of these financial statements.) | November 30, 2006 Annual Report | 9 |
Sextant Bond Income Fund| Rating* | Issuer | Coupon/Maturity | Face Amount | Market Value | Percentage |
| Machinery | |||||
| A | Caterpillar Inc. | 9.375% due 8/15/2011 | $40,000 | $47,429 | 1.4% |
| A- | Deere & Co. | 8.10% due 5/15/2030 | 95,000 | 126,727 | 3.7% |
| Subtotal | 135,000 | 174,156 | 5.1% | ||
| Medical Supplies | |||||
| A | Becton Dickinson Corp. | 7.15% due 10/1/2009 | 40,000 | 41,471 | 1.2% |
| Oil & Gas | |||||
| A | Baker Hughes Inc. | 6.00% due 2/15/2009 | 20,000 | 20,308 | 0.6% |
| AA- | Texaco Capital | 8.625% due 6/30/2010 | 40,000 | 44,186 | 1.3% |
| Subtotal | 60,000 | 64,494 | 1.9% | ||
| Office Supplies | |||||
| A- | Avery Dennison Corp. | 6.00% due 1/15/2033 | 95,000 | 98,516 | 2.9% |
| Real Estate | |||||
| BBB+ | Archstone Smith Opr. Trust | 5.625% due 8/15/2014 | 50,000 | 49,974 | 1.5% |
| Retail | |||||
| A | Dayton Hudson Corp. (Target Stores) | 10.00% due 1/01/2011 | 50,000 | 58,291 | 1.7% |
| A | Lowe's Companies | 8.25% due 6/01/2010 | 50,000 | 54,772 | 1.6% |
| BBB | May Department Stores Co. | 8.00% due 7/15/2012 | 50,000 | 54,219 | 1.6% |
| AA | Wal-Mart Stores | 7.25% due 6/1/2013 | 45,000 | 49,949 | 1.5% |
| Subtotal | 195,000 | 217,231 | 6.4% | ||
| Transportation | |||||
| BBB+ | Southwest Airlines Co. | 6.50% due 3/01/2012 | 75,000 | 79,728 | 2.4% |
| BBB- | U.S. Freightways Corp. | 8.50% due 4/15/2010 | 50,000 | 53,531 | 1.6% |
| Subtotal | 125,000 | 133,259 | 4.0% | ||
| U.S. Government | |||||
| AAA | U.S. Treasury Bonds | 5.25% due 2/15/2029 | 277,000 | 299,897 | 8.9% |
| AAA | U.S. Treasury Bonds | 7.125% due 2/15/2023 | 110,000 | 140,491 | 4.2% |
| Subtotal | 387,000 | 440,388 | 13.1% | ||
| U.S. Government Agency | |||||
| AAA | Federal Farm Credit Bank | 5.09% due 2/17/2015 | 120,000 | 117,839 | 3.5% |
| AAA | Federal Farm Credit Bank | 6.25% due 8/18/2021 | 150,000 | 152,482 | 4.5% |
| AAA | Federal Home Loan Bank | 5.55% due 4/13/2015 | 100,000 | 99,247 | 2.9% |
| AAA | Federal Home Loan Mortgage | 5.00% due 8/26/2009 | 100,000 | 98,531 | 2.9% |
| AAA | Federal National Mortgage Assoc. | 5.00% due 4/10/2015 | 100,000 | 97,891 | 2.9% |
| Subtotal | 570,000 | 565,990 | 16.7% | ||
| Total Investments | (Cost = $3,180,425) | $3,049,000 | $3,276,441 | 96.8% | |
| Other Assets (net of liabilities) | 107,985 | 3.2% | |||
| Total Net Assets | $3,384,426 | 100.0% | |||
| 10 | November 30, 2006 Annual Report | (The accompanying notes are an integral part of these financial statements.) |
| Financial Highlights | Year Ended November 30, | ||||||
| Selected data per share of capital stock outstanding throughout the year | 2006 | 2005 | 2004 | 2003 | 2002 | ||
| Net asset value at beginning of year | $4.92 | $5.06 | $5.07 | $4.97 | $4.81 | ||
| Income from investment operations | |||||||
| Net investment income | 0.22 | 0.21 | 0.22 | 0.22 | 0.26 | ||
| Net gains or losses on securities (both realized and unrealized) | 0.00 | (0.14) | (0.01) | 0.10 | 0.16 | ||
| Total from investment operations | 0.22 | 0.07 | 0.21 | 0.32 | 0.42 | ||
| Less distributions | |||||||
| Dividends (from net investment income) | (0.22) | (0.21) | (0.22) | (0.22) | (0.26) | ||
| Total distributions | (0.22) | (0.21) | (0.22) | (0.22) | (0.26) | ||
Paid-in capital from early redemption penalties 1 | *0.00 | *0.00 | - | - | - | ||
| Net asset value at end of year | $4.92 | $4.92 | $5.06 | $5.07 | $4.97 | ||
| Total Return | 4.73% | 1.40% | 4.26% | 6.52% | 9.02% | ||
| Ratios / Supplemental Data | |||||||
| Net assets ($000), at end of year | $3,384 | $3,050 | $2,643 | $2,272 | $2,105 | ||
| Ratio of expenses to average net assets | |||||||
| Before fee waivers and custody fee credits | 1.27% | 0.97% | 0.89% | 1.15% | 1.06% | ||
| After fee waivers and custody fee credits | 0.90% | 0.94% | 0.87% | 0.97% | 0.72% | ||
| Ratio of net investment income after fee waivers and custody credits to average net assets | 4.64% | 4.26% | 4.47% | 4.29% | 5.40% | ||
| Portfolio turnover rate | 36% | 4% | 0% | 0% | 29% | ||
| 1 Redemption penalty adopted March 29, 2005 | *Amount is less than $0.01 | ||||||
| Statement of Assets and Liabilities | As of November 30, 2006 | |||
| Assets | ||||
| Bond investments (Cost $3,180,425) | $3,276,441 | |||
| Cash | 57,969 | |||
| Interest receivable | 52,931 | |||
| Insurance reserve premium | 400 | |||
| Receivables for Fund shares sold | 50 | |||
| Total Assets | $3,387,791 | |||
| Liabilities | ||||
| Accrued expenses | 2,553 | |||
| Accrued 12b-1 Fees | 676 | |||
| Distributions payable | 72 | |||
| Due to affiliates | 64 | |||
| Total liabilities | 3,365 | |||
| Net Assets | $3,384,426 | |||
| Fund shares outstanding | 687,584 | |||
| Analysis of Net Assets | ||||
| Paid in Capital (unlimited shares authorized, without par value) | $3,324,909 | |||
| Accumulated net realized loss | (36,499) | |||
| Unrealized net appreciation on investments | 96,016 | |||
| Net Assets applicable to Fund shares outstanding | $3,384,426 | |||
| Net Asset Value, Offering and Redemption price per share | $4.92 | |||
| (The accompanying notes are an integral part of these financial statements.) | November 30, 2006 Annual Report | 11 |
Sextant Bond Income Fund
| Statement of Changes in Net Assets | Year ended Nov. 30, 2006 | Year ended Nov. 30, 2005 | ||
| Increase in Net Assets | ||||
| From operations | ||||
| Net investment income | $142,386 | $126,312 | ||
| Net realized gain (loss) on investments | (14,375) | 826 | ||
| Net increase (decrease) in unrealized appreciation | 21,936 | (86,448) | ||
| Net increase in net assets | 149,947 | 40,690 | ||
| Dividends to shareowners from | ||||
| Net investment income | (142,386) | (126,361) | ||
| From Fund share transactions | ||||
| Proceeds from sales of shares | 541,154 | 787,201 | ||
| Value of shares issued in reinvestment of dividends | 141,047 | 124,959 | ||
| 682,201 | 912,160 | |||
| Early redemption penalties retained | 40 | 12 | ||
| Cost of shares redeemed | (355,481) | (418,996) | ||
| Net increase in net assets | 326,760 | 493,176 | ||
| Total increase in net assets | $334,321 | $407,505 | ||
| Net Assets | ||||
| Beginning of year | 3,050,105 | 2,642,600 | ||
| End of year | $3,384,426 | $3,050,105 | ||
| Shares of the Fund sold and redeemed | ||||
| Number of shares sold | 111,347 | 155,844 | ||
| Number of shares issued in reinvestment of dividends | 29,113 | 24,894 | ||
| 140,460 | 180,738 | |||
| Number of shares redeemed | (73,143) | (83,147) | ||
| Net increase in number of shares outstanding | 67,317 | 97,591 | ||
| Statement of Operations | For the year ended November 30, 2006 | |||
| Investment income | ||||
| Interest income | $169,882 | |||
| Other income | 25 | |||
| Gross investment income | $169,907 | |||
| Expenses | ||||
| Investment adviser and administration fees | 17,683 | |||
| Filing and registrations fees | 10,399 | |||
| Audit fees | 3,403 | |||
| Chief compliance officer expenses | 1,473 | |||
| Distribution fees | 1,325 | |||
| Insurance | 1,242 | |||
| Custodian fees | 1,128 | |||
| Printing and postage | 1,078 | |||
| Trustee fees | 656 | |||
| Legal fees | 481 | |||
| Other expenses | 86 | |||
| Total gross expenses | 38,954 | |||
| Less adviser fees waived | (9,794) | |||
| Less custodian fees waived | (1,639) | |||
| Net expenses | 27,521 | |||
| Net investment income | 142,386 | |||
| Net realized loss on investments | ||||
| Proceeds from sales | 1,067,670 | |||
| Less cost of securities sold (based on identified cost) | 1,082,045 | |||
| Realized net loss | (14,375) | |||
| Unrealized gain on investments | ||||
| End of year | 96,016 | |||
| Beginning of year | 74,080 | |||
| Increase in unrealized gain for the year | 21,936 | |||
| Net realized and unrealized gain | 7,561 | |||
| Net increase in net assets resulting from operations | $149,947 | |||
| 12 | November 30, 2006 Annual Report | (The accompanying notes are an integral part of these financial statements.) |
| Ratings Established | By Adviser | By Standard & Poor's | By Moody's Investor Services |
| AAA | 31.8% | 22.9% | 22.9% |
| AA | 6.0% | 6.0% | 12.3% |
| A | 42.5% | 44.9% | 36.2% |
| BBB | 16.5% | 14.1% | 16.5% |
| Unrated | 0.0% | 8.9% | 8.9% |
| Cash | 3.2% | 3.2% | 3.2% |
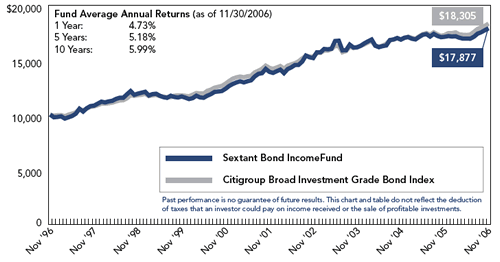
The table (right) provides a summary of portfolio holdings by bond quality ratings as of November 30, 2006.
We do not expect a prolonged yield curve inversion or a recession. We will increase purchases of investment-grade, corporate debt as opportunities allow. Use of US Treasury securities will be decreased. We expect another positive return for Bond Income Fund for the year 2007.
| Sextant Bond Income Fund vs. Citigroup Broad Investment-Grade Bond Index (unaudited) |
 |
| (The accompanying notes are an integral part of these financial statements.) | November 30, 2006 Annual Report | 13 |
 Sextant Growth Fund
| Issue | Quantity | Tax Cost | Market Value | Percentage |
| Common Stocks (96.4%) | ||||
| Automotive | ||||
| Oshkosh Truck | 3,000 | $160,448 | $144,030 | 1.1% |
| Banking | ||||
| Frontier Financial | 15,000 | 220,751 | 451,200 | 3.3% |
| Washington Banking Company | 6,250 | 83,121 | 105,313 | 0.8% |
| Washington Mutual | 6,750 | 44,124 | 294,840 | 2.1% |
| Subtotal | 347,996 | 851,353 | 6.2% | |
| Computers | ||||
| 3Com* | 30,000 | 167,836 | 125,400 | 0.9% |
| Adobe Systems* | 7,600 | 39,971 | 305,216 | 2.2% |
| Apple Inc.* | 8,000 | 67,473 | 733,280 | 5.3% |
| Hewlett-Packard | 7,000 | 157,040 | 276,220 | 2.0% |
| Intuit* | 9,000 | 197,624 | 283,680 | 2.1% |
| MapInfo* | 8,000 | 114,181 | 106,000 | 0.8% |
| Oracle* | 15,000 | 115,139 | 285,750 | 2.1% |
| Symbol Technologies | 10,092 | 122,340 | 149,563 | 1.1% |
| Subtotal | 981,604 | 2,265,109 | 16.5% | |
| Construction | ||||
| KB Home | 5,000 | 302,781 | 258,450 | 1.9% |
| Lowe's Companies | 6,500 | 109,802 | 196,040 | 1.4% |
| Weyerhaeuser | 4,200 | 246,845 | 271,656 | 2.0% |
| Subtotal | 659,428 | 726,146 | 5.3% | |
| Diversified Operations | ||||
| Honeywell International | 3,500 | 131,967 | 150,430 | 1.1% |
| Electronics | ||||
| Advanced Micro Devices* | 10,000 | 41,708 | 215,700 | 1.6% |
| Agilent Technologies* | 8,000 | 218,552 | 254,720 | 1.9% |
| Harman International Industries | 1,900 | 157,285 | 197,296 | 1.4% |
| Subtotal | 417,545 | 667,716 | 4.9% | |
| Food | ||||
| Performance Food Group* | 3,000 | 96,917 | 81,180 | 0.6% |
| PepsiCo | 4,500 | 248,326 | 278,865 | 2.0% |
| Subtotal | 345,243 | 360,045 | 2.6% | |
| Hotels & Motels | ||||
| Red Lion Hotels* | 21,000 | 150,354 | 258,300 | 1.9% |
| Investments | ||||
| Chubb | 5,000 | 224,705 | 258,800 | 1.9% |
| Schwab (Charles) | 25,000 | 79,726 | 458,500 | 3.3% |
| Subtotal | 304,431 | 717,300 | 5.2% | |
| 14 | November 30, 2006 Annual Report | (The accompanying notes are an integral part of these financial statements.) |
| Issue | Quantity | Tax Cost | Market Value | Percentage |
| Common Stocks (96.4%) | ||||
| Machinery | ||||
| Regal-Beloit | 4,000 | $104,006 | $204,520 | 1.5% |
| Lincoln Electric Holdings | 4,000 | 180,617 | 243,400 | 1.8% |
| Subtotal | 284,623 | 447,920 | 3.3% | |
| Medical | ||||
| Abott Laboratories | 4,000 | 171,114 | 186,640 | 1.3% |
| Amgen* | 3,700 | 111,703 | 262,848 | 1.9% |
| Barr Laboratories* | 4,500 | 159,489 | 229,860 | 1.7% |
| Caremark Rx | 5,000 | 139,942 | 236,500 | 1.7% |
| Genentech | 2,000 | 179,816 | 163,500 | 1.2% |
| Ligand Pharmaceuticals* | 10,000 | 112,072 | 107,200 | 0.8% |
| Lilly (Eli) | 3,500 | 249,361 | 187,565 | 1.4% |
| Pharmaceutical Product Development | 15,000 | 67,174 | 473,850 | 3.4% |
| VCA Antech* | 8,000 | 209,048 | 257,920 | 1.9% |
| Subtotal | 1,399,719 | 2,105,883 | 15.3% | |
| Metal Ores | ||||
| Alcoa | 6,000 | 189,042 | 187,020 | 1.3% |
| Phelps Dodge | 2,660 | 76,218 | 327,108 | 2.4% |
| Subtotal | 265,260 | 514,200 | 3.7% | |
| Oil & Gas Production | ||||
| Devon Energy | 3,000 | 185,020 | 220,110 | 1.6% |
| Noble Drilling | 4,000 | 125,240 | 309,000 | 2.3% |
| Subtotal | 310,260 | 529,110 | 3.9% | |
| Publishing | ||||
| Wiley (John) & Sons, Class A | 5,000 | 134,777 | 198,900 | 1.5% |
| Retail | ||||
| Amazon.com* | 5,000 | 201,410 | 201,700 | 1.5% |
| Bed Bath & Beyond* | 5,000 | 176,186 | 193,900 | 1.4% |
| Best Buy | 4,000 | 223,149 | 219,880 | 1.6% |
| Build-A-Bear Workshop* | 7,000 | 177,548 | 214,060 | 1.6% |
| Restoration Hardware* | 15,203 | 94,239 | 129,377 | 0.9% |
| Staples | 6,000 | 144,720 | 152,820 | 1.1% |
| Subtotal | 1,017,252 | 1,111,737 | 8.1% | |
| Steel | ||||
| Nucor | 4,000 | 189,851 | 239,400 | 1.7% |
| Telecommunications | ||||
| Trimble Navigation* | 7,000 | 202,081 | 335,790 | 2.5% |
| (The accompanying notes are an integral part of these financial statements.) | November 30, 2006 Annual Report | 15 |
Sextant Growth Fund| Issue | Quantity | Tax Cost | Market Value | Percentage |
| Common Stocks (96.4%) | ||||
| Transportation | ||||
| Norfolk Southern | 4,500 | $185,235 | $221,625 | 1.6% |
| UAl Corp.* | 5,500 | 183,801 | 223,190 | 1.6% |
| United Parcel Service, Cl B | 2,500 | 189,469 | 194,800 | 1.4% |
| Subtotal | 558,505 | 639,615 | 4.6% | |
| Utilities | ||||
| Duke Energy | 6,000 | 175,259 | 190,320 | 1.4% |
| FPL Group | 7,000 | 244,408 | 373,100 | 2.7% |
| IDACorp | 6,000 | 159,539 | 239,940 | 1.7% |
| Sempra Energy | 3,000 | 116,395 | 163,500 | 1.2% |
| Subtotal | 695,601 | 966,860 | 7.0% | |
| Total Investments | $8,556,945 | $13,229,844 | 96.4% | |
| Other Assets (net of liabilities) | 497,845 | 3.6% | ||
| Total Net Assets | $13,727,689 | 100.0% | ||
| Industry Allocation |
 |
| Top Ten Holdings | |
| % of Fund Assets | |
| Apple Inc. | 5.3% |
| Pharmaceutical Product Development | 3.4% |
| Schwab (Charles) | 3.3% |
| Frontier Financial | 3.3% |
| FPL Group | 2.7% |
| Trimble Navigation | 2.5% |
| Phelps Dodge | 2.4% |
| Noble Drilling | 2.3% |
| Adobe Systems | 2.2% |
| Washington Mutual | 2.1% |
| 16 | November 30, 2006 Annual Report | (The accompanying notes are an integral part of these financial statements.) |
| Financial Highlights | Year Ended November 30, | ||||||
| Selected data per share of capital stock outstanding throughout the year | 2006 | 2005 | 2004 | 2003 | 2002 | ||
| Net asset value at beginning of year | $17.11 | $14.20 | $12.91 | $10.64 | $11.90 | ||
| Income from investment operations | |||||||
| Net investment income | (0.02) | (0.02) | 0.01 | (0.04) | (0.05) | ||
| Net gains or losses on securities (both realized and unrealized) | 1.74 | 2.96 | 1.45 | 2.31 | (1.21) | ||
| Total from investment operations | 1.72 | 2.94 | 1.46 | 2.27 | (1.26) | ||
| Less distributions | |||||||
| Dividends (from net investment income) | - | *(0.00) | (0.01) | - | - | ||
| Distributions (from capital gains) | (0.17) | (0.03) | (0.16) | - | - | ||
| Total distributions | (0.17) | (0.03) | (0.17) | 0.00 | 0.00 | ||
Paid-in capital from early redemption penalties 1 | *0.00 | *0.00 | - | - | - | ||
| Net asset value at end of year | $18.66 | $17.11 | $14.20 | $12.91 | $10.64 | ||
| Total Return | 10.06% | 20.76% | 11.35% | 21.31% | (10.51)% | ||
| Ratios / Supplemental Data | |||||||
| Net assets ($000), at end of year | $13,728 | $9,006 | $5,331 | $4,732 | $3,373 | ||
| Ratio of expenses to average net assets | |||||||
| Before fee waivers and custody fee credits | 1.25% | 1.28% | 0.80% | 1.20% | 1.17% | ||
| After fee waivers and custody fee credits | 1.21% | 1.24% | 0.78% | 1.14% | 1.11% | ||
| Ratio of net investment income after fee waivers and custody credits to average net assets | (0.12)% | (0.17)% | 0.12% | (0.40)% | (0.48)% | ||
| Portfolio turnover rate | 11% | 4% | 8% | 12% | 15% | ||
| 1 Redemption penalty adopted March 29, 2005 | *Amount is less than $0.01 | ||||||
| Statement of Assets and Liabilities | As of November 30, 2006 | |||
| Assets | ||||
| Investments (Cost $8,556,945) | $13,229,844 | |||
| Cash | 502,106 | |||
| Dividends receivable | 11,711 | |||
| Receivable for Fund shares sold | 1,566 | |||
| Insurance reserve premium | 1,214 | |||
| Total Assets | $13,746,441 | |||
| Liabilities | ||||
| Accrued expenses | 9,814 | |||
| Due to affiliates | 6,927 | |||
| Distribution payable | 2,011 | |||
| Total liabilities | 18,752 | |||
| Net Assets | $13,727,689 | |||
| Fund shares outstanding | 735,599 | |||
| Analysis of Net Assets | ||||
| Paid-in capital (unlimited shares authorized, without par value) | $9,054,750 | |||
| Accumulated gains on investments | 40 | |||
| Unrealized net appreciation on investments | 4,672,899 | |||
| Net Assets applicable to Fund shares outstanding | $13,727,689 | |||
| Net Asset Value, Offering and Redemption price per share | $18.66 | |||
| (The accompanying notes are an integral part of these financial statements.) | November 30, 2006 Annual Report | 17 |
Sextant Growth Fund
| Statement of Changes in Net Assets | Year ended Nov. 30, 2006 | Year ended Nov. 30, 2005 | ||
| Increase in Net Assets | ||||
| From operations | ||||
| Net investment loss | $(16,447) | $(11,402) | ||
| Net realized gain on investments | 125,411 | 12,474 | ||
| Net increase in unrealized appreciation | 1,108,048 | 1,494,285 | ||
| Net increase in net assets | 1,217,012 | 1,495,357 | ||
| Dividends to shareowners from | ||||
| Net investment income | - | (2,289) | ||
| Capital gains distribution | (125,371) | (12,474) | ||
| (125,371) | (14,763) | |||
| From Fund share transactions | ||||
| Proceeds from sales of shares | 5,675,771 | 2,709,260 | ||
| Value of shares issued in reinvestment of dividends | 123,360 | 14,444 | ||
| 5,799,131 | 2,723,704 | |||
| Early redemption penalties retained | 1,423 | 53 | ||
| Cost of shares redeemed | (2,170,902) | (528,970) | ||
| Net increase in net assets | 3,629,652 | 2,194,787 | ||
| Total increase in net assets | $4,721,293 | $3,675,381 | ||
| Net Assets | ||||
| Beginning of year | 9,006,396 | 5,331,015 | ||
| End of year | $13,727,689 | $9,006,396 | ||
| Shares of the Fund sold and redeemed | ||||
| Number of shares sold | 323,519 | 186,540 | ||
| Number of shares issued in reinvestment of dividends | 6,611 | 844 | ||
| 330,130 | 187,384 | |||
| Number of shares redeemed | (120,843) | (36,600) | ||
| Net increase in number of shares outstanding | 209,287 | 150,784 | ||
| Statement of Operations | For the year ended November 30, 2006 | |||
| Investment income | ||||
| Dividend income | $146,289 | |||
| Gross investment income | $146,289 | |||
| Expenses | ||||
| Investment adviser and administration fees | 102,992 | |||
| Filing and registrations fees | 19,844 | |||
| Audit fees | 13,817 | |||
| Chief compliance officer expenses | 6,817 | |||
| Distribution fees | 5,693 | |||
| Insurance | 5,051 | |||
| Printing and postage | 4,600 | |||
| Custodian fees | 4,241 | |||
| Trustee fees | 2,351 | |||
| Legal fees | 2,073 | |||
| Other expenses | 447 | |||
| Total gross expenses | 167,926 | |||
| Less custodian fees waived | (5,190) | |||
| Net expenses | 162,736 | |||
| Net investment income (loss) | (16,447) | |||
| Net realized loss on investments | ||||
| Proceeds from sales | 1,372,108 | |||
| Less cost of securities sold (based on identified cost) | 1,246,697 | |||
| Realized net gain | 125,411 | |||
| Unrealized gain on investments | ||||
| End of year | 4,672,899 | |||
| Beginning of year | 3,564,851 | |||
| Increase in unrealized gain for the year | 1,108,048 | |||
| Net realized and unrealized gain | 1,233,459 | |||
| Net increase in net assets resulting from operations | $1,217,012 | |||
| 18 | November 30, 2006 Annual Report | (The accompanying notes are an integral part of these financial statements.) |
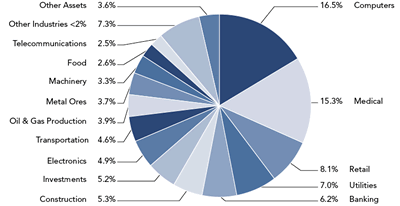
The Sextant Growth Fund seeks long-term growth through investment in common stocks of U.S. domiciled companies. It generally follows a value investment approach, favoring companies with good fundamentals and relatively low price/earnings and price/book ratios. As illustrated in the pie chart on page 16, our portfolio is overweighted with computer (largest holding Apple Computer up 35%) and medical (largest holding Pharmaceutical Product Development up 9%) issues.
Income is not a consideration in portfolio selection, but we favor companies that institute or increase dividend payouts. Our low portfolio turnover meant we realized only about 10% of our market gains this year, minimizing the taxable capital gains distribution at year-end.
A long-term approach is the best opportunity to prosper: for the last ten years, the Fund provided an 11.56% annualized total return. At that rate of growth, investments almost triple in just ten years - see the chart below..
| Sextant Growth Fund vs. S&P 500 Total Return Index (unaudited) |
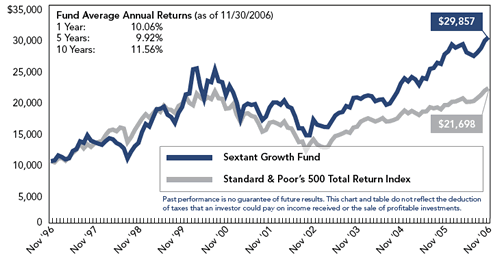 |
The line graph compares Sextant Growth Fund's performance to that of a broad-based stock market index, the Standard & Poor's 500 Total Return Index. Comparison of any mutual fund to a market index must be made bearing in mind that the index is unmanaged, and expense-free. Conversely, the fund will (1) be actively managed, (2) have an objective other than mirroring the index, such as limiting risk, (3) bear various operational costs, (4) stand ready to buy and sell its securities to shareowners on a daily basis, and (5) provide a wide range of services. The graph below compares $10,000 invested in the Fund on November 30, 1996 (ten years ago), compared to a similar amount invested in Standard & Poor's 500 Index. The graph shows that the investment in the Fund would have risen to $29,857 versus $21,698 in the Index.
| November 30, 2006 Annual Report | 19 |
 Sextant International Fund
| Issue | Quantity | Tax Cost | Market Value | Country | Percentage | |
| Common Stocks (87.9%) | ||||||
| Aircraft | ||||||
| Embraer Aircraft ADR | 3,400 | $105,058 | $141,576 | Brazil | 1.5% | |
| Automotive | ||||||
| Nissan Motor ADR | 5,500 | 106,770 | 133,595 | Japan | 1.4% | |
| Banking | ||||||
| Australia & New Zealand Banking ADS | 1,000 | 84,500 | 112,610 | Australia | 1.2% | |
| AXA ADS | 4,200 | 98,136 | 159,684 | France | 1.7% | |
| Banco Bilbao Vizcaya ADS | 7,500 | 105,518 | 181,125 | Spain | 2.0% | |
| ING Groep ADS | 4,000 | 118,530 | 171,160 | Netherlands | 1.8% | |
| Mitsubishi Financial Group ADR | 10,000 | 131,800 | 127,400 | Japan | 1.4% | |
| Nomura Holdings ADR | 10,000 | 187,836 | 174,600 | Japan | 1.9% | |
| Toronto-Dominion Bank | 2,400 | 70,709 | 140,664 | Canada | 1.5% | |
| Subtotal | 797,029 | 1,067,243 | 11.5% | |||
| Bulding Materials | ||||||
| CRH plc ADR | 4,000 | 81,159 | 153,600 | Ireland | 1.7% | |
| Hanson plc ADR | 2,100 | 88,247 | 151,536 | United Kingdom | 1.6% | |
| James Hardie Industries NV ADS | 3,000 | 83,041 | 99,750 | Netherlands | 1.1% | |
| Subtotal | 252,447 | 404,886 | 4.4% | |||
| Business Services | ||||||
| 51job ADR* | 8,000 | 117,920 | 140,000 | Cayman Islands | 1.5% | |
| Chemicals | ||||||
| Arkema ADS* | 65 | 1,857 | 3,192 | France | **0.0% | |
| BASF AG ADS | 1,700 | 120,102 | 157,437 | Germany | 1.7% | |
| Subtotal | 121,959 | 160,629 | 1.7% | |||
| Computers | ||||||
| Business Objects ADS* | 7,000 | 60,510 | 271,740 | France | 2.9% | |
| Dassault Systems ADR | 3,000 | 146,427 | 164,400 | France | 1.8% | |
| Satyam | 6,000 | 108,750 | 140,100 | India | 1.5% | |
| Subtotal | 315,687 | 576,240 | 6.2% | |||
| Consumer Products | ||||||
| Coca-Cola Femsa ADS | 4,300 | 82,844 | 153,037 | Mexico | 1.7% | |
| Cadbury Schweppes ADR | 2,500 | 102,335 | 103,775 | United Kingdom | 1.1% | |
| Subtotal | 185,179 | 256,812 | 2.8% | |||
| Electronics | ||||||
| Sony | 3,000 | 116,940 | 118,230 | Japan | 1.3% | |
| Epcos AG ADS* | 2,500 | 57,307 | 45,325 | Germany | 0.5% | |
| Infineon Technologies AG* | 5,000 | 45,900 | 64,650 | Germany | 0.7% | |
| Subtotal | 220,147 | 228,205 | 2.5% | |||
| 20 | November 30, 2006 Annual Report | (The accompanying notes are an integral part of these financial statements.) |
| Issue | Quantity | Tax Cost | Market Value | Country | Percentage | |
| Common Stocks (87.9%) | ||||||
| Hotels & Motels | ||||||
| Orient-Express Hotels Cl A | 3,500 | $110,528 | $149,240 | Bermuda | 1.6% | |
| Machinery - Electrical | ||||||
| Nidec | 5,000 | 89,122 | 97,000 | Japan | 1.1% | |
| Medical - Drugs | ||||||
| American Oriental Bioengineering* | 15,000 | 72,300 | 156,750 | China | 1.7% | |
| GlaxoSmithKline plc ADR | 3,000 | 145,938 | 159,390 | United Kingdom | 1.7% | Novartis AG ADR | 1,600 | 77,283 | 93,456 | Switzerland | 1.0% |
| Serono SA ADR | 5,000 | 88,661 | 113,000 | Switzerland | 1.2% | |
| Shire | 2,000 | 92,860 | 121,200 | United Kingdom | 1.3% | |
| Subtotal | 477,042 | 643,796 | 6.9% | |||
| Metals & Mining | ||||||
| Anglo-American plc ADR | 7,500 | 138,371 | 175,425 | United Kingdom | 1.9% | |
| Potash Corp. of Saskatchewan | 1,000 | 34,234 | 140,740 | Canada | 1.5% | |
| Rio Tinto plc ADS | 750 | 74,825 | 160,942 | United Kingdom | 1.7% | |
| Tenaris SA ADR | 2,500 | 95,290 | 117,525 | Luxembourg | 1.3% | |
| Subtotal | 342,720 | 594,632 | 6.4% | |||
| Oil & Gas Production | ||||||
| EnCana | 3,000 | 84,990 | 156,630 | Canada | 1.7% | |
| Norsk Hydro ADS | 6,000 | 122,808 | 149,460 | Norway | 1.6% | |
| Petro-Canada | 2,000 | 95,990 | 90,400 | Canada | 1.0% | |
| Repsol-YPF ADR | 3,500 | 87,962 | 126,175 | Spain | 1.4% | |
| Total Fina Elf ADR | 2,600 | 121,935 | 185,796 | France | 2.0% | |
| Subtotal | 513,685 | 708,461 | 7.7% | |||
| Paper Products | ||||||
| Metso ADS | 2,100 | 22,802 | 97,272 | Finland | 1.1% | |
| UPM-Kymmene Oyj | 3,500 | 64,384 | 87,675 | Finland | 1.0% | |
| Votorantim Celulose ADS | 8,000 | 102,000 | 159,200 | Brazil | 1.7% | |
| Subtotal | 189,186 | 344,147 | 3.8% | |||
| Photographic Equipment | ||||||
| Canon ADR | 3,300 | 95,606 | 173,679 | Japan | 1.9% | |
| Publishing - Books | ||||||
| Pearson plc ADS | 7,000 | 84,430 | 103,460 | United Kingdom | 1.1% | |
| Telecommunications | ||||||
| American Movil ADS | 6,000 | 29,725 | 266,820 | Mexico | 2.9% | |
| Audiocodes* | 8,000 | 103,899 | 76,880 | Israel | 0.8% | |
| BCE | 5,490 | 135,460 | 134,999 | Canada | 1.5% | |
| China Mobil Ltd. | 5,500 | 119,327 | 232,100 | China | 2.5% | |
| (The accompanying notes are an integral part of these financial statements.) | November 30, 2006 Annual Report | 21 |
Sextant International Fund| Issue | Quantity | Tax Cost | Market Value | Country | Percentage | |
| Common Stocks (87.9%) | ||||||
| Telecommunications (continued) | ||||||
| PT Indosat ADR | 2,500 | $64,692 | $77,900 | Indonesia | 0.8% | |
| SK Telecom ADS | 5,000 | 100,161 | 129,650 | South Korea | 1.4% | |
| Telcom Corp. New Zealand ADS | 2,500 | 76,174 | 62,050 | New Zealand | 0.7% | |
| Telefonica ADS | 2,200 | 85,949 | 134,134 | Spain | 1.4% | |
| Telefonos de Mexico ADS | 5,000 | 107,470 | 130,500 | Mexico | 1.4% | |
| Telus | 2,000 | 63,219 | 96,080 | Canada | 1.0% | |
| Subtotal | 886,346 | 1,341,113 | 14.4% | |||
| Transportation | ||||||
| Canadian Pacific | 3,200 | 109,246 | 178,304 | Canada | 1.9% | |
| Linhas Aereas Inel ADR | 6,000 | 178,560 | 170,760 | Brazil | 1.8% | |
| LAN Airlines ADS | 3,500 | 24,636 | 171,675 | Chile | 1.9% | |
| Subtotal | 312,442 | 520,739 | 5.6% | |||
| Utilities - Electric | ||||||
| Enel ADR | 1,300 | 58,877 | 66,313 | Italy | 0.7% | |
| Enersis ADR | 9,000 | 97,125 | 136,890 | Chile | 1.5% | |
| Korea Electric Power ADS | 7,000 | 120,661 | 150,430 | South Korea | 1.6% | |
| Subtotal | 276,663 | 353,633 | 3.8% | |||
| Utilities - Gas | ||||||
| Transport de Gas del Sur ADR* | 1,500 | 18,807 | 8,775 | Argentina | 0.1% | |
| Total Investments | $5,618,773 | $8,148,761 | 87.9% | |||
| Other Assets (net of liabilities) | 1,117,736 | 12.1% | ||||
| Total Net Assets | $9,266,497 | 100.0% | ||||
| *Non-income producing | **Amount is less than 0.1% | ADS = American Depositary Share | ADR = American Depositary Receipt | |||
| Industry Allocation |
 |
| Top Ten Holdings | |
| % of Fund Assets | |
| Busniess Objects ADS | 2.9% |
| America Movil ADS | 2.9% |
| China Mobil Ltd. | 2.5% |
| Total Fina Elf ADR | 2.0% |
| Banco Bilbao Vizcaya ADS | 2.0% |
| Canadian Pacific | 1.9% |
| Anglo-American plc ADS | 1.9% |
| Nomura Holdings ADR | 1.9% |
| Canon ADR | 1.9% |
| LAN Airlines | 1.9% |
| 22 | November 30, 2006 Annual Report | (The accompanying notes are an integral part of these financial statements.) |
| Financial Highlights | Year Ended November 30, | ||||||
| Selected data per share of capital stock outstanding throughout the year | 2006 | 2005 | 2004 | 2003 | 2002 | ||
| Net asset value at beginning of year | $11.22 | $9.40 | $8.05 | $6.07 | $7.24 | ||
| Income from investment operations | |||||||
| Net investment income | 0.11 | 0.05 | 0.03 | 0.05 | 0.02 | ||
| Net gains or losses on securities (both realized and unrealized) | 2.34 | 1.83 | 1.35 | 1.97 | (1.16) | ||
| Total from investment operations | 2.45 | 1.88 | 1.38 | 2.02 | (1.14) | ||
| Less distributions | |||||||
| Dividends (from net investment income) | (0.11) | (0.06) | (0.03) | (0.04) | (0.03) | ||
| Total distributions | (0.11) | (0.06) | (0.03) | (0.04) | (0.03) | ||
Paid-in capital from early redemption penalties 1 | *0.00 | *0.00 | - | - | - | ||
| Net asset value at end of year | $13.56 | $11.22 | $9.40 | $8.05 | $6.07 | ||
| Total Return | 21.85% | 19.95% | 17.11% | 33.23% | (15.80)% | ||
| Ratios / Supplemental Data | |||||||
| Net assets ($000), at end of year | $9,266 | $3,671 | $2,053 | $1,650 | $1,150 | ||
| Ratio of expenses to average net assets | |||||||
| Before fee waivers and custody fee credits | 1.09% | 1.36% | 1.22% | 1.29% | 1.36% | ||
| After fee waivers and custody fee credits | 1.02% | 1.25% | 1.10% | 1.10% | 1.17% | ||
| Ratio of net investment income after fee waivers and custody credits to average net assets | 0.94% | 0.52% | 0.31% | 0.75% | 0.20% | ||
| Portfolio turnover rate | 9% | 5% | 7% | 4% | 4% | ||
| 1 Redemption penalty adopted March 29, 2005 | *Amount is less than $0.01 | ||||||
| Statement of Assets and Liabilities | As of November 30, 2006 | |||
| Assets | ||||
| Investments (Cost $5,618,773) | $8,148,761 | |||
| Cash | 1,205,628 | |||
| Dividends receivable | 11,966 | |||
| Receivable for Fund shares sold | 1,047 | |||
| Total Assets | $9,367,402 | |||
| Liabilities | ||||
| Payable for Fund shares redeemed | 86,333 | |||
| Accrued expenses | 9,037 | |||
| Due to affiliates | 4,543 | |||
| Distribution payable | 992 | |||
| Total liabilities | 100,905 | |||
| Net Assets | $9,266,497 | |||
| Fund shares outstanding | 683,378 | |||
| Analysis of Net Assets | ||||
| Paid-in capital (unlimited shares authorized, without par value) | $6,767,423 | |||
| Undistributed net investment income | 139 | |||
| Accumulated net realizzed loss | (31,053) | |||
| Unrealized net appreciation on investments | 2,529,988 | |||
| Net Assets applicable to Fund shares outstanding | $9,266,497 | |||
| Net Asset Value, Offering and Redemption price per share | $13.56 | |||
| (The accompanying notes are an integral part of these financial statements.) | November 30, 2006 Annual Report | 23 |
Sextant International Fund
| Statement of Changes in Net Assets | Year ended Nov. 30, 2006 | Year ended Nov. 30, 2005 | ||
| Increase in Net Assets | ||||
| From operations | ||||
| Net investment income | $76,757 | $14,949 | ||
| Net realized gain on investments | 122,914 | 21,377 | ||
| Net increase in unrealized appreciation | 1,341,965 | 495,498 | ||
| Net increase in net assets from operations | 1,541,636 | 531,824 | ||
| Dividends to shareowners from | ||||
| Net investment income | (76,618) | (17,930) | ||
| From Fund share transactions | ||||
| Proceeds from sales of shares | 4,867,747 | 1,203,188 | ||
| Value of shares issued in reinvestment of dividends | 75,626 | 17,356 | ||
| 4,943,373 | 1,220,544 | |||
| Early redemption penalties retained | 80 | 45 | ||
| Cost of shares redeemed | (813,073) | (115,946) | ||
| Net increase in net assets | 4,130,380 | 1,104,643 | ||
| Total increase in net assets | $5,595,398 | $1,618,537 | ||
| Net Assets | ||||
| Beginning of year | 3,671,099 | 2,052,562 | ||
| End of year | $9,266,497 | $3,671,099 | ||
| Undistributed net investment income | 139 | - | ||
| Shares of the Fund sold and redeemed | ||||
| Number of shares sold | 415,042 | 118,463 | ||
| Number of shares issued in reinvestment of dividends | 5,577 | 1,547 | ||
| 420,619 | 120,010 | |||
| Number of shares redeemed | (64,517) | (10,994) | ||
| Net increase in number of shares outstanding | 356,102 | 109,016 | ||
| Statement of Operations | For the year ended November 30, 2006 | |||
| Investment income | ||||
| Dividend income (net of foreign tax of $20,229) | $160,467 | |||
| Gross investment income | $160,467 | |||
| Expenses | ||||
| Investment adviser and administration fees | 38,436 | |||
| Filing and registrations fees | 19,568 | |||
| Audit fees | 9,434 | |||
| Custodian fees | 5,258 | |||
| Chief compliance officer expenses | 3,749 | |||
| Distribution fees | 3,742 | |||
| Printing and postage | 2,930 | |||
| Insurance | 2,830 | |||
| Trustee fees | 1,602 | |||
| Legal fees | 1,482 | |||
| Other expenses | 301 | |||
| Total gross expenses | 89,332 | |||
| Less custodian fees waived | (5,622) | |||
| Net expenses | 83,710 | |||
| Net investment income | 76,757 | |||
| Net realized loss on investments | ||||
| Proceeds from sales | 620,135 | |||
| Less cost of securities sold (based on identified cost) | 497,221 | |||
| Realized net gain | 122,914 | |||
| Unrealized gain on investments | ||||
| End of year | 2,529,988 | |||
| Beginning of year | 1,188,023 | |||
| Increase in unrealized gain for the year | 1,341,965 | |||
| Net realized and unrealized gain | 1,464,879 | |||
| Net increase in net assets resulting from operations | $1,541,636 | |||
| 24 | November 30, 2006 Annual Report | (The accompanying notes are an integral part of these financial statements.) |
| Countries | |
| United Kingdom | 12.0% |
| Canada | 11.5% |
| France | 9.6% |
| Japan | 8.0% |
| Mexico | 6.8% |
| Brazil | 5.8% |
| Spain | 5.4% |
| China | 4.8% |
| Chile | 3.8% |
| Germany | 3.3% |
| Netherlands | 3.3% |
| Switzerland | 2.5% |
| Finland | 2.3% |
| Japan | 2.1% |
| Miscellaneous <2% | 18.8% |
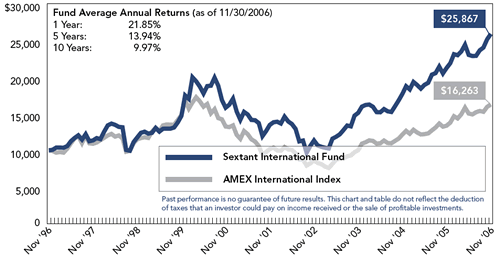
Our portfolio is most heavily invested in the UK and Canada, which have economies that benefit from higher energy prices and solid currencies and governments. After several years of strong growth, commodity prices are now falling worldwide, impacting our cyclical and resource-based issues. We held more cash during the year than normal, as new shareowners increased and caution guarded our investing. The tables on page 22 show the industry allocation and our largest holdings. Telecommunications (largest holdings America Movil up 59% and China Mobil up 77%) and banking (largest holding Banco Bilbao Vizcaya up 42%) did well. Banks did reasonably, considering higher interest rates. Oil and gas producers appreciated, in response to the rise in energy prices.
| Sextant International Fund vs. AMEX International Index (unaudited) |
 |
| November 30, 2006 Annual Report | 25 |
| Beginning Account Value (June 1, 2006) | Ending Account Value (November 30, 2006) | Expenses Paid During Period* | Annualized Expense Ratio | |
| Short-Term Bond Fund | ||||
| Actual | $1,000 | $1,035.00 | $3.06 | 0.60% |
| Hypothetical (5% return before expenses) | $1,000 | $1,022.06 | $3.04 | 0.60% |
| Bond Income Fund | ||||
| Actual | $1,000 | $1,055.40 | $4.64 | 0.90% |
| Hypothetical (5% return before expenses) | $1,000 | $1,020.56 | $4.56 | 0.90% |
| Growth Fund | ||||
| Actual | $1,000 | $1,087.90 | $3.14 | 0.60% |
| Hypothetical (5% return before expenses) | $1,000 | $1,022.06 | $3.04 | 0.60% |
| International Fund | ||||
| Actual | $1,000 | $1,124.30 | $5.96 | 1.12% |
| Hypothetical (5% return before expenses) | $1,000 | $1,019.45 | $5.67 | 1.12% |
| 26 | November 30, 2006 Annual Report |
- For each month in which either of these Funds' total investment return (change in net asset value plus all distributions reinvested) for the one year period through that month outperforms or underperforms the total return of a specified index for that period by 1% or more but less than 2%, the Base Fee is increased or decreased by the annual rate of .10% of the Fund's average daily net assets for the preceding year.
- If the outperformance or underperformance is 2% or more, then the adjustment is at the annual rate of .20%.
- For each month in which either of these Funds' total investment return (change in net asset value plus all distributions reinvested) for the one year period through that month outperforms or underperforms the total return of a specified index for that period by 1% or more but less than 2%, the Base Fee is increased or decreased by the annual
| November 30, 2006 Annual Report | 27 |
- rate of .10% of the Fund's average daily net assets for the preceding year.
- If the outperformance or underperformance is 2% or more but less than 4%, then the adjustment is at the annual rate of ..20%.
- If the outperformance or underperformance is 4% or more, the adjustment is at an annual rate of .30%.
| 2006 | 2005 | |
| Short-Term Bond Fund | ||
| Ordinary income | $85,431 | $83,151 |
| Bond Income Fund | ||
| Ordinary income | $142,386 | $126,361 |
| Growth Fund | ||
| Ordinary income | - | $2,289 |
Capital gains 1 | $125,371 | $12,474 |
| Short-Term Bond Fund | ||
| Ordinary income | $76,618 | $17,930 |
| Short-Term Bond | Bond Income | |
| Cost of investments | $2,848,892 | $3,180,425 |
| Gross tax unrealized appreciation | 10,985 | 106,740 |
| Groos tax unrealized depreciation | (20,739) | (10,724) |
| Net tax unrealized appreciation (depreciation) | (9,754) | 96,016 |
| Undistributed ordinary income | 1,660 | - |
| Undistributed long-term capital gain (loss) | (50,617) | (36,499) |
| Total distributable earnings | (48,957) | (36,499) |
| Total accumulates earnings (losses) | $(58,711) | $59,517 |
| Growth | International | |
| Cost of investments | $8,556,945 | $5,618,773 |
| Gross tax unrealized appreciation | 4,966,590 | 2,670,194 |
| Groos tax unrealized depreciation | (293,691) | (140,206) |
| Net tax unrealized appreciation (depreciation) | 4,672,899 | 2,529,988 |
| Undistributed ordinary income | - | 139 |
| Undistributed long-term capital gain (loss) | 40 | (31,053) |
| Total distributable earnings | - | (30,914) |
| Total accumulates earnings (losses) | $4,672,939 | $2,499,074 |
| 28 | November 30, 2006 Annual Report |
Saturna Investment Trust,
January 17, 2007
Tait, Weller & Baker LLP
| November 30, 2006 Annual Report | 29 |
| Nominee | For | Withhold |
| Gary A. Goldfogel* | 3,077,769 | 22,368 |
| Herbert A. Grubel | 3,080,461 | 19,677 |
| Nicholas Kaiser* | 3,093,301 | 6,836 |
| John E. Love* | 3,080,126 | 20,011 |
| John S. Moore* | 3,079,774 | 20,363 |
| For | Against | |
| Sextant Short-Term Bond Fund† | 410,150 | 22,672 |
| Sextant Bond Income Fund† | 472,268 | 43,103 |
| Sextant Growth Fund† | 575,437 | 29,465 |
| Sextant International Fund† | 596,118 | 16,164 |
- A description of the policies and procedures that the Funds use to determine how to vote proxies relating to portfolio securities is available (a) without charge, upon request, by calling Saturna Capital at 1-800 728-8762 (b) on the Funds' website at http://www.saturna. com; and (c) on the SEC's website at http://www.sec.gov.
- Information regarding how each Fund voted proxies relating to portfolio securities during the most recent 12-month period ended June 30 is available (a) without charge, upon request, by calling Saturna Capital at 1-800 728-8752; (b) on the Funds' website at http://www.saturna.com; and (c) on the SEC's website at http://www. sec.gov.
- The Sextant Funds file complete schedules of portfolio holdings with the SEC for the first and third quarters of each fiscal year on Form N-Q.
- The Funds' Forms N-Q are available on the SEC's website at http:// www.sec.gov., and at www.saturna.com.
- The Funds' Forms N-Q may be reviewed and copied at the SEC's Public Reference Room in Washington, DC. Information on the operation of the Public Reference Room may be obtained by calling 1-800-SEC-0330.
- The Funds make a complete schedule of portfolio holdings after the end of each month available to investors at http://www.saturna. com.
| 30 | November 30, 2006 Annual Report |
| Trustees and Officers (unaudited) | |||||
| Name (age) Address | Position(s) held with Trust and Length of Time Served | Principal Occupation(s) during past 5 Years | Number of Portfolios in Saturna Fund Comples overseen by Trustee | Other Directorships held by Trustee | |
| Independent Trustees | |||||
| Gary A. Goldfogel, MD (48) 1500 N. State Street Bellingham, WA 98225 | Independent Trustee (since 1995) | Medical Examiner (pathologist); Owner, Avocet Environmental Testing (laboratory) | Five | None | |
| Herbert G. Grubel (72) Apt. 1202 - 125 West Second St. North Vancouver, BC Canada V7M 1C5 | Independent Trustee (since 2005) | Senior Fellow, Fraser Institute; Professor (Emeritus) of Economics, Simon Fraser University; Author | Five | None | |
| John E. Love (74) 1002 Spokane Street Garfield, WA 99130 | Chairman; Independent Trustee (since 1987) | Owner, J.E. Love Co. (agricultural equipment manufacturer) | Five | None | |
| John S. Moore (75) 346 Bayside Road Bellingham, WA 98225 | Independent Trustee (since 1993) | Professor (now retired), College of Business and Economics, Western Washington University | Five | None | |
| Interested Trustee | |||||
| Nicholas F. Kaiser, CFA (60) 1300 N. State Street Bellingham, WA 98225 | President; Trustee† (since 1989) | President, Saturna Capital Corporation; President, Saturna Brokerage Services | Seven | Amana Mutual Funds Trust | |
| Officers Who Are Not Trustees | |||||
| Phelps S. McIlvaine (53) 1300 N. State Street Bellingham, WA 98225 | Vice President† (since 1994) | Vice President, Saturna Capital Corporation; Treasurer, Saturna Brokerage Services | N/A | N/A | |
| Christopher Fankhauser (34) 1300 N. State Street Bellingham, WA 98225 | Treasurer† (since 2002) | Manager of Operations, Saturna Capital Corporation | N/A | N/A | |
| Ethel B. Bartolome (34) 1300 N. State Street Bellingham, WA 98225 | Secretary† (since 2001) | Corporate Administrator, Saturna Capital Corporation | N/A | N/A | |
| James D. Winship, (58) 54056 Diamond Place NE Bainbridge Island, WA 98110 | Chief Compliance Officer† (since 2004) | Attorney; Adjunct Professor, University of Washington and Seattle Pacific University (1999 - 2003) | N/A | N/A | |
| November 30, 2006 Annual Report | 31 |

 | 1300 North State Street Bellingham, WA 98225 www.saturna.com sextant@saturna.com (800) SATURNA | This report is issued for the information of the shareowners of the Funds. It is not authorized for distribution to prospective investors unless it is accompanied or preceded by an effective prospectus relating to the securities of the Funds. The Sextant Funds are a series of Saturna Investment Trust. Saturna Brokerage Services, Distributor |

 Fellow Shareowners: (unaudited)
Nicholas Kaiser, President | Phelps McIlvaine, Vice President, Portfolio Manager |
| Average Annual Returns (as of 12/31/2006) | |||
| 1 Year | 3 Years | 5 Years | 10 Years |
| 3.87% | 2.64% | 4.16% | 4.48% |
| 2 | Idaho Tax-Exempt Fund Annual Report November 30, 2006 | |
| Rating* | Issue | Coupon/Maturity | Face Amount | Market Value | Percentage |
| Building | |||||
| AAA | Idaho State Building Authority | 4.50% due 9/1/2023 | $110,000 | $113,520 | 1.3% |
| Electric Power | |||||
| AAA | Idaho Falls Electric Revenue | 6.75% due 4/1/2019 | 145,000 | 146,409 | 1.7% |
| Financial Services | |||||
| AAA | Boise City General Fund Revenue | 5.20% due 12/1/2017 | 160,000 | 171,816 | 2.0% |
| AAA | Boise City General Fund Revenue | 5.25% due 12/1/2018 | 100,000 | 107,201 | 1.2% |
| Subtotal | 260,000 | 279,017 | 3.2% | ||
| General Obligation | |||||
| AA- | Ada & Canyon JSD #2 Meridian | 5.50% due 7/30/2015 | 50,000 | 56,143 | 0.6% |
| AAA | Ada & Canyon JSD #2 Meridian | 5.00% due 8/15/2020 | 165,000 | 177,863 | 2.0% |
| AAA | Ada & Canyon JSD #2 Meridian | 5.00% due 8/15/2021 | 155,000 | 166,651 | 1.9% |
| AAA | Bingham County SCD #55 Blackfoot | 4.65% due 8/1/2017 | 285,000 | 300,088 | 3.4% |
| A | Boise County SD #73 Horseshoe Bend | 5.15% due 7/31/2010 | 125,000 | 127,310 | 1.4% |
| AAA | Boundary County SCD #101 | 5.10% due 8/1/2022 | 130,000 | 139,831 | 1.6% |
| AAA | Caldwell, Idaho | 5.30% due 5/15/2014 | 150,000 | 157,719 | 1.8% |
| AAA | Canyon County SCD #139 Vallivue | 4.05% due 8/15/2016 | 80,000 | 82,702 | 0.9% |
| AAA | Canyon County SD #139 Vallivue | 4.35% due 9/15/2025 | 350,000 | 350,406 | 4.0% |
| AAA | Canyon County SCD #131 Nampa | 4.75% due 8/15/2019 | 325,000 | 340,847 | 3.9% |
| AAA | Canyon County SD #134 Middleton | 4.65% due 7/31/2016 | 170,000 | 179,953 | 2.0% |
| A | Canyon County SD #135 | 6.00% due 8/1/2007 | 50,000 | 50,020 | 0.6% |
| AAA | Idaho Housing & Finance Association | 4.80% due 6/1/2017 | 100,000 | 106,118 | 1.2% |
| AAA | Jerome Lincoln Gooding Cos. JSD #261 | 3.75% due 9/15/2018 | 125,000 | 122,760 | 1.4% |
| AAA | Jerome Lincoln Gooding Cos. JSD #261 | 5.00% due 9/15/2022 | 250,000 | 270,377 | 3.1% |
| AAA | Kootenai-Shonshone Area Library | 4.25% due 8/1/2021 | 220,000 | 223,995 | 2.5% |
| AAA | Lakeland ID JSD #272 | 4.00% due 8/15/2015 | 100,000 | 101,420 | 1.1% |
| AAA | Lehmi County | 4.20% due 8/1/2015 | 100,000 | 102,490 | 1.2% |
| AAA | Meridian Free Library District | 5.00% due 8/1/2015 | 200,000 | 199,402 | 2.3% |
| AAA | Minidoka & Jerome JSD #331 | 4.50% due 8/15/2018 | 75,000 | 78,126 | 0.9% |
| AAA | Minidoka & Jerome JSD #331 | 4.50% due 8/15/2020 | 75,000 | 77,288 | 0.9% |
| AAA | Minidoka & Jerome JSD #331 | 4.50% due 8/15/2025 | 160,000 | 162,878 | 1.9% |
| AAA | Nampa Idaho Series B | 5.00% due 8/1/2020 | 200,000 | 215,848 | 2.4% |
| AAA | Oneida County SCD #351 Malad City | 4.00% due 8/15/2015 | 150,000 | 153,651 | 1.8% |
| AAA | Owyhee & Canyon Cos. JSD #370 | 4.55% due 8/15/2016 | 160,000 | 173,426 | 2.0% |
| AAA | Payette Co. ID SCD #373 | 5.00% due 9/15/2024 | 100,000 | 107,278 | 1.2% |
| AAA | Valley & Adams Co. JSD #421 | 4.50% due 8/1/2024 | 290,000 | 295,922 | 3.4% |
| AAA | Washington & Adams Co. JSDC #432 | 4.00% due 8/15/2019 | 100,000 | 101,243 | 1.2% |
| Subtotal | 4,440,000 | 4,621,755 | 52.6% | ||
| Housing | |||||
| AA+ | Idaho Housing Agency Refunding Series A | 6.15% due 7/1/2024 | 10,000 | 9,926 | 0.1% |
| AAA | Idaho Housing Agency Single Family Mortgage Mezz-E-1 | 6.60% due 7/1/2011 | 10,000 | 9,940 | 0.1% |
| Subtotal | 20,000 | 19,866 | 0.2% | ||
| Idaho Tax-Exempt Fund Annual Report November 30, 2006 | 3 | |
| Rating* | Issue | Coupon/Maturity | Face Amount | Market Value | Percentage |
| Medical/Hospitals | |||||
| AAA | Idaho Health Facility Auth. Ref. Holy Cross Sys. Corp. Rev. | 5.25% due 12/1/2014 | $110,000 | $112,654 | 1.3% |
| AAA | Idaho Health Facility Auth. Corp. Holy Cross Rev. Refunding | 5.00% due 12/1/2022 | 115,000 | 118,335 | 1.4% |
| AAA | Madison CO Hospital COP | 5.00% due 12/1/2018 | 105,000 | 107,717 | 1.2% |
| Subtotal | 330,000 | 338,706 | 3.9% | ||
| Pollution Control | |||||
| AAA | Idaho Bond Bank Authority | 4.30% due 9/1/2022 | 135,000 | 136,662 | 1.6% |
| Real Estate | |||||
| AAA | Idaho State Building Association | 5.05% due 9/1/2018 | 95,000 | 96,683 | 1.1% |
| AAA | Idaho State Building Authority | 5.00% due 9/1/2021 | 100,000 | 102,166 | 1.2% |
| A | Jerome Urban Renewal District | 5.40% due 9/1/2013 | 200,000 | 201,638 | 2.3% |
| A | Post Falls LID | 5.00% due 5/1/2021 | 300,000 | 300,420 | 3.4% |
| Subtotal | 695,000 | 700,907 | 8.0% | ||
| Roads | |||||
| A | Post Falls ID | 7.95% due 4/15/2007 | 20,000 | 19,884 | 0.2% |
| State Education | |||||
| AAA | Boise State University Rev. | 5.00% due 4/1/2019 | 295,000 | 319,706 | 3.6% |
| AAA | Idaho State Building Authority | 4.00% due 9/1/2016 | 105,000 | 107,050 | 1.2% |
| AAA | Idaho State University Ref. & Impt. | 4.90% due 4/1/2017 | 150,000 | 153,210 | 1.7% |
| AAA | Idaho State University Rev. | 4.625% due 4/1/2024 | 220,000 | 228,712 | 2.6% |
| AAA | University of Idaho Student Fee Rev. | 5.00% due 4/1/2019 | 200,000 | 216,750 | 2.5% |
| AAA | University of Idaho Student Fee Rev. | 5.00% due 4/1/2020 | 160,000 | 173,035 | 2.0% |
| Subtotal | 1,130,000 | 1,198,463 | 13.6% | ||
| Sewer | |||||
| A | Troy ID Sewer System | 7.90% due 2/1/2007 | 15,000 | 14,901 | 0.2% |
| A | Troy ID Sewer System | 8.00% due 2/1/2008 | 15,000 | 14,902 | 0.2% |
| A | Troy ID Sewer System | 8.00% due 2/1/2009 | 20,000 | 19,872 | 0.2% |
| A | Troy ID Sewer System | 8.00% due 2/1/2010 | 20,000 | 19,879 | 0.2% |
| Subtotal | 70,000 | 69,554 | 0.8% | ||
| Urban Renewal | |||||
| AAA | Boise City Urban Renewal Agency Pk. Rev. & RA | 5.00% due 9/1/2012 | 65,000 | 66,702 | 0.8% |
| AAA | Boise City Urban Renewal Lease Revenue | 5.00% due 8/15/2020 | 190,000 | 205,700 | 2.3% |
| AAA | Boise City Urban Renewal Agency Lease Revenue | 5.00% due 8/15/2021 | 110,000 | 118,846 | 1.3% |
| Subtotal | 365,000 | 391,248 | 4.5% | ||
| Water Supply | |||||
| AAA | Blackfoot COP Series 2000 | 5.80% due 9/1/2018 | 135,000 | 145,378 | 1.7% |
| AAA | Idaho Bond Bank Authority | 5.00% due 9/15/2026 | 250,000 | 269,280 | 3.0% |
| AAA | Ketchum Water Revenue | 4.75% due 9/1/2013 | 60,000 | 60,974 | 0.7% |
| Subtotal | 445,000 | 475,632 | 5.4% | ||
| Total Investments | (Total Cost = $8,374,471) | $8,165,000 | $8,511,623 | 96.9% | |
| Other Assets (net of liabilities) | 271,150 | 3.1% | |||
| Total Net Assets | $8,782,773 | 100.0% | |||
| 4 | Idaho Tax-Exempt Fund Annual Report November 30, 2006 | |
| Financial Highlights | Year Ended November 30, | ||||||
| Selected data per share of capital stock outstanding throughout the year | 2006 | 2005 | 2004 | 2003 | 2002 | ||
| Net asset value at beginning of year | $5.27 | $5.39 | $5.46 | $5.37 | $5.28 | ||
| Income from investment operations | |||||||
| Net investment income | 0.18 | 0.19 | 0.19 | 0.21 | 0.22 | ||
| Net gains (losses) on securities (both realized and unrealized) | 0.06 | (0.10) | (0.07) | 0.09 | 0.09 | ||
| Total from investment operations | 0.24 | 0.09 | 0.12 | 0.30 | 0.31 | ||
| Less distributions | |||||||
| Dividends (from net investment income) | (0.18) | (0.19) | (0.19) | (0.21) | (0.22) | Distributions (from capital gains) | (0.01) | (0.02) | - | - | - |
| Total distributions | (0.19) | (0.21) | (0.19) | (0.21) | (0.22) | ||
Paid-in capital from early redemption penalties 1 | *0.00 | *0.00 | - | - | - | ||
| Net asset value at end of year | $5.32 | $5.27 | $5.39 | $5.46 | $5.37 | ||
| Total Return | 4.66% | 1.66% | 2.29% | 5.40% | 5.98% | ||
| Ratios / Supplemental Data | |||||||
| Net assets ($000), at end of year | $8,783 | $8,531 | $8,472 | $7,692 | $6,943 | ||
| Ratio of expenses to average net assets | |||||||
| Before fee waivers and custody fee credits | 0.87% | 0.91% | 0.95% | 0.88% | 0.88% | ||
| After fee waivers and custody fee credits | 0.83% | 0.88% | 0.93% | 0.85% | 0.80% | ||
| Ratio of net investment income after fee waivers and custody credits to average net assets | 3.40% | 3.58% | 3.56% | 3.78% | 4.14% | ||
| Portfolio turnover rate | 24% | 21% | 15% | 6% | 11% | ||
| 1 Redemption penalty adopted March 29, 2005 | *Amount is less than $0.01 | ||||||
| Statement of Assets and Liabilities | As of November 30, 2006 | |||
| Assets | ||||
| Bond investments (Cost $8,374,471) | $8,511,623 | |||
| Cash | 165,407 | |||
| Interest receivable | 122,620 | |||
| Receivable for Fund shares sold | 7,376 | |||
| Insurance reserve premium | 801 | |||
| Total Assets | $8,807,827 | |||
| Liabilities | ||||
| Distributions payable | 10,024 | |||
| Accrued expenses | 9,057 | |||
| Due to affiliates | 4,318 | |||
| Payable for Fund shares redeemed | 1,655 | |||
| Total Liabilities | 25,054 | |||
| Net Assets | $8,782,773 | |||
| Fund shares outstanding | 1,652,009 | |||
| Analysis of Net Assets | ||||
| Paid in Capital (unlimited shares authorized, without par value) | $8,645,621 | |||
| Unrealized net appreciation on investments | 137,152 | |||
| Net Assets applicable to Fund shares outstanding | $8,782,773 | |||
| Net Asset Value, Offering and Redemption price per share | $5.32 | |||
| Idaho Tax-Exempt Fund Annual Report November 30, 2006 | 5 | |
| Statement of Changes in Net Assets | Year ended Nov. 30, 2006 | Year ended Nov. 30, 2005 | ||
| Increase in Net Assets | ||||
| From operations | ||||
| Net investment income | $291,745 | $302,302 | ||
| Net realized gain on investments | 19,527 | 60,461 | ||
| Net increase (decrease) in unrealized appreciation | 67,593 | (224,149) | ||
| Net increase in net assets | 378,865 | 138,614 | ||
| Dividends to shareowners from | ||||
| Net investment income | ( 291,745) | (302,222) | ||
| Capital gains distributions | (19,527) | (25,992) | ||
| (311,272) | (328,214) | |||
| From Fund share transactions | ||||
| Proceeds from sales of shares | 1,123,133 | 1,076,370 | ||
| Value of shares issued in reinvestment of dividends | 241,424 | 264,076 | ||
| 1,364,557 | 1,340,446 | |||
| Early redemption penalties retained | 2 | 28 | ||
| Cost of shares redeemed | (1,180,827) | (1,091,850) | ||
| Net increase in net assets | 183,732 | 248,624 | ||
| Total increase in net assets | $251,325 | $59,024 | ||
| Net Assets | ||||
| Beginning of year | 8,531,448 | 8,472,424 | ||
| End of year | $8,782,773 | $8,531,448 | ||
| Undistributed net investment income | - | 80 | ||
| Shares of the Fund sold and redeemed | ||||
| Number of shares sold | 225,928 | 218,971 | ||
| Number of shares issued in reinvestment of dividends | 45,798 | 49,415 | ||
| 271,726 | 268,386 | |||
| Number of shares redeemed | (237,777) | (221,568) | ||
| Net increase in number of shares outstanding | 33,949 | 46,818 | ||
| Statement of Operations | For the year ended November 30, 2006 | |||
| Investment income | ||||
| Interest income | $392,674 | |||
| Amortization of bond premium | (30,002) | |||
| Gross investment income | $362,672 | |||
| Expenses | ||||
| Investment adviser and administration fees | 42,846 | |||
| Audit fees | 9,419 | |||
| Chief compliance officer expenses | 4,563 | |||
| Shareholder service fees | 3,744 | |||
| Insurance | 3,531 | |||
| Filing and registrations fees | 3,141 | |||
| Printing and postage | 2,381 | |||
| Custodian fees | 2,113 | |||
| Trustee fees | 1,639 | |||
| Legal fees | 940 | |||
| Other fees | 349 | |||
| Total gross expenses | 74,666 | |||
| Less custodian fees waived | (3,739) | |||
| Net expenses | 70,927 | |||
| Net investment income | 291,745 | |||
| Net realized loss on investments | ||||
| Proceeds from sales | 2,014,069 | |||
| Less cost of securities sold (based on identified cost) | 1,994,542 | |||
| Realized net gain | 19,527 | |||
| Unrealized gain on investments | ||||
| End of year | 137,152 | |||
| Beginning of year | 69,559 | |||
| Increase in unrealized gain for the year | 67,593 | |||
| Net realized and unrealized gain | 87,120 | |||
| Net increase in net assets resulting from operations | $378,865 | |||
| 6 | Idaho Tax-Exempt Fund Annual Report November 30, 2006 | |
| Ratings Established | By Adviser | By Standard & Poor's | By Moody's Investor Services |
| AAA | 87.4% | 35.0% | 85.0% |
| AA | 0.8% | 0.6% | 0.8% |
| A | 8.7% | 0.0% | 0.0% |
| BBB | 0.0% | 0.0% | 0.0% |
| Unrated | 0.0% | 61.3% | 11.1% |
| Cash | 3.1% | 3.1% | 3.1% |
| Idaho Tax-Exempt vs. Lehman Composite Municipal Bond Index (unaudited) |
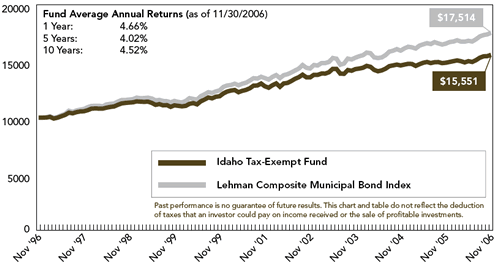 |
| Idaho Tax-Exempt Fund Annual Report November 30, 2006 | 7 | |
| Beginning Account Value [Thursday, June 1, 2006] | Ending Account Value [Thursday, November 30, 2006] | Expenses Paid During Period* | |
| Actual | $1,000.00 | $1,037.00 | $3.96 |
| Hypothetical (5% return before expenses) | $1,000.00 | $1,021.18 | $3.93 |
| 8 | Idaho Tax-Exempt Fund Annual Report November 30, 2006 | |
| 2006 | 2005 | |
| Tax-Exempt Income | $291,026 | $302,222 |
| Taxable Income | 702 | - |
Capital Gains 1 | 19,527 | 25,992 |
| Cost of investments | $8,374,471 | |
| Gross unrealized appreciation | 150,500 | |
| Gross unrealized depreciation | (13,348) | |
| Net unrealized appreciation | $137,152 | |
| Total accumulatied earnings/losses | $137,152 | |
| Idaho Tax-Exempt Fund Annual Report November 30, 2006 | 9 | |
- The Fund files a complete schedule of portfolio holdings with the SEC for the first and third quarters of each fiscal year on Form N-Q.
- The Fund's Form N-Q is available on the SEC's website at http://www. sec.gov., and at www.saturna.com.
- The Fund's Form N-Q may be reviewed and copied at the SEC's Public Reference Room in Washington, DC. Information on the operation of the Public Reference Room may be obtained by calling 1-800-SEC-0330.
- The Fund makes a complete schedule of portfolio holdings after the end of each month available to investors at http://www.saturna.com.
Report of Registered Independent Public Accounting Firm To the Shareowners and Board of Trustees of Idaho Tax-Exempt Fund: We have audited the accompanying statement of assets and liabilities of the Idaho Tax-Exempt Fund, a series of shares of the Saturna Investment Trust, including the schedules of investments as of November 30, 2006, and the related statements of operations for the year then ended, the changes in net assets for each of the two years in the period then ended, and the financial highlights for the five years in the period then ended. These financial statements and financial highlights are the responsibility of the Trust's management. Our responsibility is to express an opinion on these financial statements and financial highlights based on our audits. We conducted our audits in accordance with the standards of the Public Company Accounting Oversight Board (United States). Those standards require that we plan and perform the audits to obtain reasonable assurance about whether the financial statements and financial highlights are free of material misstatement. The Trust is not required to have, nor were we engaged to perform audits, of its internal control over financial reporting. Our audits included consideration of internal control over financial reporting as a basis for designing audit procedures that are appropriate in the circumstances, but not for the purposes of expression an opinion on the effectiveness of the Trust's internal control over financial reporting. Accordingly, we express no such opinion. Audits include examining, on a test basis, evidence supporting the amounts and disclosures in the financial statements. Our procedures included confirmation of securities owned as of November 30, 2006, by correspondence with the custodian. Audits also include assessing the accounting principles used and significant estimates made by management, as well as evaluating the overall financial statement presentation. We believe that our audits provide a reasonable basis for our opinion. In our opinion the financial statements and financial highlights referred to above present fairly, in all material respects, the financial position of Idaho Tax-Exempt Fund as of November 30, 2006, the results of its operations for the year then ended, the changes in its net assets for each of the two years in the period then ended, and the financial highlights for each of the five years in the period then ended, in conformity with accounting principles generally accepted in the United States of America. Philadelphia, Pennsylvania Tait, Weller & Baker LLP January 17, 2007 |
| 10 | Idaho Tax-Exempt Fund Annual Report November 30, 2006 | |
| Trustees and Officers (unaudited) | |||||
| Name (age) Address | Position(s) held with Trust and Length of Time Served | Principal Occupation(s) during past 5 Years | Number of Portfolios in Saturna Fund Comples overseen by Trustee | Other Directorships held by Trustee | |
| Independent Trustees | |||||
| Gary A. Goldfogel, MD (48) 1500 N. State Street Bellingham, WA 98225 | Independent Trustee (since 1995) | Medical Examiner (pathologist); Owner, Avocet Environmental Testing (laboratory) | Five | None | |
| Herbert G. Grubel (72) Apt. 1202 - 125 West Second St. North Vancouver, BC Canada V7M 1C5 | Independent Trustee (since 2005) | Senior Fellow, Fraser Institute; Professor (Emeritus) of Economics, Simon Fraser University; Author | Five | None | |
| John E. Love (74) 1002 Spokane Street Garfield, WA 99130 | Chairman; Independent Trustee (since 1987) | Owner, J.E. Love Co. (agricultural equipment manufacturer) | Five | None | |
| John S. Moore (75) 346 Bayside Road Bellingham, WA 98225 | Independent Trustee (since 1993) | Professor (now retired), College of Business and Economics, Western Washington University | Five | None | |
| Interested Trustee | |||||
| Nicholas F. Kaiser, CFA (60) 1300 N. State Street Bellingham, WA 98225 | President; Trustee† (since 1989) | President, Saturna Capital Corporation; President, Saturna Brokerage Services | Seven | Amana Mutual Funds Trust | |
| Officers Who Are Not Trustees | |||||
| Phelps S. McIlvaine (53) 1300 N. State Street Bellingham, WA 98225 | Vice President† (since 1994) | Vice President, Saturna Capital Corporation; Treasurer, Saturna Brokerage Services | N/A | N/A | |
| Christopher Fankhauser (34) 1300 N. State Street Bellingham, WA 98225 | Treasurer† (since 2002) | Manager of Operations, Saturna Capital Corporation | N/A | N/A | |
| Ethel B. Bartolome (34) 1300 N. State Street Bellingham, WA 98225 | Secretary† (since 2001) | Corporate Administrator, Saturna Capital Corporation | N/A | N/A | |
| James D. Winship, (58) 54056 Diamond Place NE Bainbridge Island, WA 98110 | Chief Compliance Officer† (since 2004) | Attorney; Adjunct Professor, University of Washington and Seattle Pacific University (1999 - 2003) | N/A | N/A | |
| Idaho Tax-Exempt Fund Annual Report November 30, 2006 | 11 | |
| 1300 North State Street Bellingham, WA 98225 www.saturna.com sextant@saturna.com (800) SATURNA |
Item 2. Code of Ethics.
Registrant has adopted a code of ethics and is included with this submission as Exhibit (a).
Item 3. Audit Committee Financial Expert.
(a)(1)(i) The Trustees of Saturna Investment Trust determined, at their quarterly meeting of September 25, 2003, that the Trust has at least one audit committee financial expert serving on its audit committee.
(a)(2)(ii) Mr. John Moore, an independent Trustee (as defined for investment companies), was deemed qualified and agreed to serve.
Item 4. Principal Accountant Fees and Services.
(a) Audit Fees
For the fiscal years ending November 30, 2006 and 2005, the aggregate audit fees billed for professional services rendered by the principal accountant were $40,000 and $24,500, respectively.
(b) Audit-Related Fees
For the fiscal years ending November 30, 2006 and 2005, the aggregate audit related fees were $38,000 and $18,500 respectively. The nature of the services are: (1) auditing of the statements of assets and liabilities, related statements of operations and changes in net assets, and the financial highlights of each of the Funds; (2) auditing and reporting on the financial statements to be included in the Amendment to the Funds' Registration Statement, Form N-1A, to be filed with the Securities and Exchange Commission; (3) review of the Amendment to the Registration Statement; and (4) issuance of a Report on Internal Control Structure for inclusion in Form N-SAR.
(c) Tax Fees
For the fiscal years ending November 30, 2006 and 2005, the aggregate tax fees billed for professional services rendered by the principal accountant were $2,000 and $6,000, respectively. Service includes preparation of the Funds' federal and state income tax returns.
(d) All Other Fees
There were no other fees billed by the principal accountant for the fiscal years ending November 30, 2006 and 2005.
(e)(1) Audit Committee Pre-Approval Policies and Procedures
The following is an excerpt from the Saturna Investment Trust Audit Committee Charter:
D. Oversight of Independent Auditors
3. Pre-approval of Audit and Non-Audit Services. Except as provided below, the Committee’s prior approval is necessary for the engagement of the independent auditors to provide any audit or non-audit services for the Trust and any non-audit services for any entity controlling, controlled by or under common control with Saturna that provides ongoing services to the Trust (Saturna and each such entity, an “Adviser Affiliate”) where the engagement relates directly to the operations or financial reporting of the Trust. Non-audit services that qualify under the de minimis exception described in the Securities Exchange Act of 1934, as amended, and applicable rules thereunder, that were not pre-approved by the Committee, must be approved by the Committee prior to the completion of the audit. Pre-approval by the Committee is not required for engagements entered into pursuant to (a) pre-approval policies and procedures established by the Committee, or (b) pre-approval granted by one or more members of the Committee to whom, or by a subcommittee to which, the Committee has delegated pre-approval authority, provided in either case, that the Committee is informed of each such service at its next regular meeting.
(e) (2) Percentages of Services
One hundred percent of the services described in each of paragraphs (b) through (d) were approved by the audit committee pursuant to paragraph (c)(7)(i)(C) of Rule 2-01 of Regulation S-X.
(f) Not applicable.
(g) Not applicable.
(h) Not applicable.
Item 5. Audit Committee of Listed Registrants.
Not applicable.
Item 6. Schedule of Investments.
The schedule is included as part of the report to shareholders filed under Item 1 of this Form.
Item 7. Disclosure of Proxy Voting Policies and Procedures for Closed-End Management Investment Companies.
Not applicable.
Item 8. Portfolio Managers of Closed-End Management Investment Companies.
Not applicable.
Item 9. Purchases of Equity Securities by Closed-End Management Investment Company and Affiliated Purchasers.
Not applicable.
Item 10. Submission of Matters to a Vote of Security Holders.
Proposals submitted to a vote by security holders are included as part of the report to shareholders under Item 1 of this Form.
Item 11. Controls and Procedures.
(a) Internal control over financial reporting is under the supervision of the principal executive and financial officers. On December 29, 2006, Mr. Nicholas Kaiser (President) and Mr. Christopher Fankhauser (Treasurer), reviewed the internal control procedures for Saturna Investment TrustFunds Trust and found them reasonable and adequate. (b) No change.
Item 12. Exhibits
Exhibits included with this filing:
(a) Code of Ethics.
(b) Certifications.
(1) Nicholas Kaiser, President, Saturna Investment Trust
(2) Christopher Fankhauser, Treasurer, Saturna Investment Trust
SIGNATURES
Pursuant to the requirements of the Securities Exchange Act of 1934 and the Investment Company Act of 1940, the registrant has duly caused this report to be signed on its behalf by the undersigned, thereunto duly authorized.
SATURNA INVESTMENT TRUST
By:
/s/ Nicholas Kaiser
Nicholas Kaiser, President
Date: January 30, 2007
Pursuant to the requirements of the Securities Exchange Act of 1934 and the Investment Act of 1940, this report has been signed below by the following persons on behalf of the registrant and in the capacities and on the dates indicated.
By:
/s/ Nicholas Kaiser
Nicholas Kaiser, President
Date: January 30, 2007
By:
/s/ Christopher Fankhouser
Christopher Fankhouser, Treasurer
Date: January 30, 2007