SECURITIES AND EXCHANGE COMMISSION
WASHINGTON, DC 20549
FORM N-CSR
CERTIFIED SHAREHOLDER REPORT OF REGISTERED
MANAGEMENT INVESTMENT COMPANIES
Investment Company Act file number: 811-05071 or 33-13247
SATURNA INVESTMENT TRUST
(Exact Name of Registrant as Specified in Charter)
1300 N. State Street
Bellingham, Washington 98225-4730
(Address of Principal Executive Offices, including ZIP Code)
Nicholas F. Kaiser
1300 N. State Street
Bellingham, Washington 98225-4730
(Name and Address of Agent for Service)
Registrant's Telephone Number- (360) 734-9900
Date of fiscal year end: November 30, 2008
Date of reporting period: November 30, 2008
Item 1. Report To Stockholders.
Performance Summary (as of December 31, 2008): (unaudited)
Comparative returns and percentile Morningstar™ category rankings (1 is best)†
| 1 Year | 3 Year | 5 Year | 10 Year | Expense Ratio¹ | |
| Sextant Short-Term Bond vs. Short-Term Bond Category | |||||
| Fund Return | 1.88% | 3.83% | 2.74% | 4.13% | 1.58% |
| Morningstar Category | -4.23% | 0.96% | 1.23% | 3.38% | N/A |
| % Rank (category size) | 19 (439) | 15 (375) | 20 (318) | 24 (164) | N/A |
| Sextant Bond Income vs. Intermediate-Term Bond Category | |||||
| Fund Return | -0.77% | 2.53% | 2.63% | 4.43% | 1.38% |
| Morningstar Category | -4.70% | 1.08% | 1.81% | 4.01% | N/A |
| % Rank (category size) | 37 (1135) | 41 (991) | 42 (857) | 37 (458) | N/A |
| Sextant Core² vs. Moderate Allocation Category | |||||
| Fund Return | -20.78% | N/A | N/A | N/A | 1.35% |
| Morningstar Category | -28.00% | -5.31% | -0.60% | 1.19% | N/A |
| % Rank (category size) | 10 (1206) | N/A | N/A | N/A | N/A |
| Sextant Growth vs. Mid-Cap Growth Category | |||||
| Fund Return | -31.93% | -6.81% | 2.25% | 4.29% | 1.32% |
| Morningstar Category | -43.77% | -10.92% | -2.44% | 0.79% | N/A |
| % Rank (category size) | 4 (934) | 12 (821) | 5 (674) | 14 (335) | N/A |
| Sextant International vs. Foreign Large Blend Category | |||||
| Fund Return | -27.02% | 1.31% | 7.34% | 6.26% | 1.50% |
| Morningstar Category | -43.99% | -7.67% | 1.21% | 0.90% | N/A |
| % Rank (category size) | 2 (778) | 1 (570) | 1 (452) | 4 (238) | N/A |
Performance data quoted above represents past performance, is before any taxes payable by shareowners, and is no guarantee of future results. Current performance may be higher or lower than that stated herein. Performance current to the most recent month-end is available by calling toll free (800) SATURNA or visiting www.saturna.com. Total returns are historical and include change in share value, and reinvestment of dividends and capital gains, if any, and do not include the potential deduction of a 2% redemption fee on shares held less than 30 days. Share price, yield, and return will vary and you may have a gain or loss when you sell your shares. Funds that invest in foreign securities may involve greater risk, including political and economic uncertainties of foreign countries as well as the risk of currency fluctuations.
Please consider an investment's objective, risks, charges, and expenses carefully before investing. To obtain a free prospectus that contains this and other important information, please call toll-free (800) SATURNA or visit www.saturna.com. Please read the prospectus carefully before investing.
¹By regulation, the expense ratios shown in this table are as of the Funds' most recent prospectus which is dated March 28, 2008, incorporates results from the fiscal year ending November 30, 2007, and differs from expense ratios shown elsewhere in this report as they represent different fiscal periods. Also by regulation, the performance in this table represents the most recent quarter-end performance rather than performance through the Funds' most recent fiscal period (shown on page 4). Average annual total returns include changes in principal value, reinvested dividends and capital gain distributions, if any.
²Sextant Core began operations March 30, 2007.
†Morningstar 12/31/2008. Morningstar, Inc. is an independent fund performance monitor. Rankings are determined monthly from total returns by Morningstar, by category as determined by Morningstar. The average total return for a category is determined by Saturna Capital, utilizing the Morningstar database. The 12-month Rank shows how each Fund ranks in its Morningstar peer category for the 12 months ended December 31, 2008. Morningstar calculates total return by taking the change in a fund's NAV, assuming the reinvestment of all income and capital gains distributions (on the actual reinvestment date used by the fund) during the period, and then dividing by the initial NAV. Unless marked as load-adjusted total returns, Morningstar does not adjust total return for sales charges or for redemption fees. (Morningstar Return™, Morningstar Risk-Adjusted Ratings™, and the load-adjusted returns do incorporate those fees.) Total returns do account for management, administra tive, and 12b-1 fees and other costs automatically deducted from fund assets.
Sextant Short-Term Bond was 77th of 439 Short-Term Bond funds in the last year, 54th of 375 funds in the last 3 years, 61st of 318 funds in the last 5 years and 37th of 164 funds in the last 10 years. Sextant Bond Income was 399th of 1135 Intermediate-Term Bond funds in the last year, 386th of 991 funds in the last 3 years, 336th of 857 funds in the last 5 years and 154nd of 458 funds in the last 10 years. Sextant Core was 97th of 1206 Moderate Allocation funds in the last year. Sextant Growth was 25th of 934 Mid-Cap Growth funds in the last year, 83rd of 821 funds in the last 3 years, 29th of 674 funds in the last 5 years and 38th of 335 funds in the last 10 years. Sextant International was 9th of 778 Foreign Large Blend funds in the last year, 1st of 570 funds in the last 3 years, 1st of 452 funds in the last 5 years and 7th of 238 funds in the last 10 years.
2 | November 30, 2008 Annual Report
Fellow Shareowners:
The past year has seen the unfolding of the worst financial crisis since the Great Depression. Fortunately, our conservative management style meant Saturna's Sextant funds did relatively well. For the Funds' fiscal year, which ended on November 30th, 2008, Sextant Growth declined 32.58%. Sextant International declined 29.56% and Sextant Core, which contains both stocks and fixed-income instruments, decreased 23.52%. Sextant Bond Income declined by 4.80% and Sextant Short-Term Bond gained a modest 0.66%. To be sure, those numbers are painful, but when measured against the relevant indices, shareowners should be able to take some solace. For the same period, the S&P shrunk by a whopping 38.09% and the AMEX International Index tumbled by 42.97%. Stocks had their worst performances since the 1930's depression.In the month of December markets recovered slightly, and the Funds' performance for the calendar year ending December 31st was a bit better. Sextant Growth declined 31.93%; Sextant International declined 27.02%. Sextant Core was off by 20.78%. Sextant Bond Income was almost even, declining by 0.77% and Sextant Short-Term Bond returned a positive 1.88%.
Sextant International Fund
As long-term investors, we know that a particular interval's gains or losses matter much less when considered over a lengthier span of time. That is why the recognition that our Funds receive for superlative longer-term performance is so important — to us and especially to our shareowners.
For the year ended December 31st, Sextant International is the number one fund (out of 189 similar funds) in Lipper's five year performance category. In this respect, Sextant International was aided by its large cash position throughout the year, which helped it avoid the precipitous decline in foreign stocks. Moreover, for the year ended December 31st, the International Fund's assets increased by 132% to $32.2 million dollars, allowing fixed costs to be spread across a larger base.
It is not solely Sextant International which has been performing well with respect to its peer group. The performance summary data on the surrounding pages provide the absolute as well as relative Morningstar category rank for each Sextant fund. Moreover, all Sextant funds stress low operating expenses and employ a "fulcrum" advisory fee structure that rewards or penalizes Saturna Capital for investment results.
Going Forward
This decline is severe, not only in terms of depth but also duration. As a massive deleveraging of the economy occurs, esoteric financial instruments are disappearing amid the changing climate. A strong stimulus program should provide the necessary momentum to an economy still shaken by the systemic
Sextant Funds stress low operating expenses and employ a "fulcrum" advisory fee structure that rewards or penalizes Saturna Capital for investment results.
panic instigated by the housing crisis. Even though a complete return to normal economic conditions is a ways off, the stock market normally leads other sectors of the economy. The darkest days appear to be over. The palpable despondency in the credit markets should give way to a timid optimism. Sophisticated investors willing to deploy a quantity of cash ("dry powder") are finding significant values from which to base tomorrow's returns. Going forward, we will continue to invest in solid companies with the strong business advantages and balance sheets needed to navigate these trying times. Please review the following pages for more detail about each Fund's financial year.
Respectfully,
(graphic omitted)
Nicholas Kaiser, President
(Manager — Sextant Growth, Sextant International)
(graphic omitted)
Phelps McIlvaine, Vice President
(Manager — Sextant Short-Term Bond, Sextant Bond Income)
(graphic omitted)
Peter Nielsen, Senior Analyst
(Manager — Sextant Core)
January 15, 2009
November 30, 2008 Annual Report | 3
Performance Review (as of November 30, 2008): (unaudited)
Comparative returns and percentile Morningstar™ category rankings (1 is best)†
| 1 Year | 3 Year | 5 Year | 10 Year | Expense Ratio¹ | |
| Sextant Short-Term Bond vs. Short-Term Bond Category | |||||
| Fund Return | 0.66% | 3.50% | 2.58% | 4.03% | 1.58% |
| Morningstar Category | -5.36% | 0.65% | 1.06% | 3.26% | N/A |
| % Rank (category size) | 21 (439) | 14 (373) | 20 (316) | 20 (162) | N/A |
| Sextant Bond Income vs. Intermediate-Term Bond Category | |||||
| Fund Return | -4.80% | 1.39% | 1.99% | 4.10% | 1.38% |
| Morningstar Category | -7.78% | 0.23% | 1.37% | 3.69% | N/A |
| % Rank (category size) | 42 (1137) | 46 (992) | 46 (856) | 40 (458) | N/A |
| Sextant Core² vs. Moderate Allocation Category | |||||
| Fund Return | -23.52% | N/A | N/A | N/A | 1.35% |
| Morningstar Category | -30.61% | -6.08% | -0.53% | 1.24% | N/A |
| % Rank (category size) | 11 (1191) | N/A | N/A | N/A | N/A |
| Sextant Growth vs. Mid-Cap Growth Category | |||||
| Fund Return | -32.58% | -6.61% | 1.81% | 5.52% | 1.32% |
| Morningstar Category | -45.15% | -11.60% | -2.81% | 1.39% | N/A |
| % Rank (category size) | 2 (950) | 8 (833) | 6 (683) | 12 (339) | N/A |
| Sextant International vs. Foreign Large Blend Category | |||||
| Fund Return | -29.56% | 1.52% | 8.01% | 6.56% | 1.50% |
| Morningstar Category | -48.59% | -8.13% | 1.23% | 0.43% | N/A |
| % Rank (category size) | 1 (767) | 1 (553) | 1 (444) | 3 (231) | N/A |
Performance data quoted above represents past performance and is no guarantee of future results. Results are shown for 12 months ending November 30, 2008 ("1 Year" column above) because the Sextant Funds' performance fees are based on the same period. Results are shown for other fiscal periods by regulation.
¹By regulation, the expense ratios shown in this table are as of the Funds' most recent prospectus dated March 28, 2008, incorporating results from the 2007 fiscal year, and differ from expense ratios shown elsewhere in this report as they represent different fiscal periods.
²Sextant Core began operations on March 30, 2007.
†Morningstar 11/30/2008. Morningstar, Inc. is an independent fund performance monitor. Rankings are determined monthly from total returns by Morningstar, by category as determined by Morningstar. The average total return for a category is determined by Saturna Capital, utilizing the Morningstar database. The 12-month Rank shows how each Fund ranks in its Morningstar peer category for the year ended May 31, 2008.
Sextant Short-Term Bond was 76th of 439 Short-Term Bond funds in the last year, 43rd of 373 funds in the last 3 years, 53rd of 316 funds in the last 5 years and 28th of 162 funds in the last 10 years. Sextant Bond Income was 408th of 1137 Intermediate-Term Bond funds in the last year, 390th of 992 funds in the last 3 years, 334th of 856 funds in the last 5 years and 152nd of 458 funds in the last 10 years. Sextant Core was 105th of 1191 Moderate Allocation funds in the last year. Sextant Growth was 14th of 950 Mid-Cap Growth funds in the last year, 55th of 833 funds in the last 3 years, 30th of 683 funds in the last 5 years and 34th of 339 funds in the last 10 years. Sextant International was 1st of 767 Foreign Large Blend funds in the last year, 1st of 553 funds in the last 3 years, 1st of 444 funds in the last 5 years and 6th of 231 funds in the last 10 years.
4 | November 30, 2008 Annual Report
Sextant Short-Term Bond Fund
Performance Summary (unaudited)
| Average Annual Returns as of November 30, 2008 | ||||
| 1 Year | 5 Years | 10 Years | Expense Ratio¹ | |
| Sextant Short-Term Bond Fund | 0.66% | 2.58% | 4.03% | 1.58% |
| Citigroup Gov./Corp. Inv. Grade Index 1-3 Years | 3.97% | 3.70% | 4.75% | N/A |
Growth of $10,000
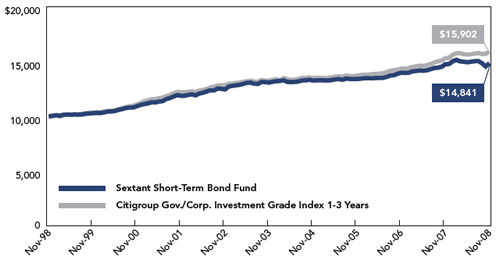 | Comparison of any mutual fund to a market index must be made bearing in mind that the index is unmanaged, and expense-free. Conversely, the fund will (1) be actively managed, (2) have an objective other than mirroring the index, such as limiting risk, (3) bear transaction and other costs, (4) stand ready to buy and sell its securities to shareowners on a daily basis, and (5) provide a wide range of services. The graph compares $10,000 invested in the Fund on November 30, 1998 to a similar amount invested in the index, which reflects the types of securities in which the Fund invests. The graph shows that an investment in the Fund would have risen to $14,841 versus $15,902 in the index. |
| Past performance does not guarantee future results. The "Growth of $10,000" graph and "Average Annual Returns" performance table assume the reinvestment of dividends and capital gains. They do not reflect the deduction of taxes that a shareowner might pay on fund distributions or the redemption of fund shares, nor do they reflect the potential deduction of a 2% redemption fee on shares held less than 30 calendar days. ¹ By regulation, the expense ratio for the Fund shown in this table is as of the Fund's most recent prospectus which is dated March 28, 2008, incorporates results for the fiscal year ending November 30, 2007, and differs from expense ratios shown elsewhere in this report as they represent different fiscal periods. | |
Fund Objective
The objectives of the Short-Term Bond Fund are capital preservation and current income.
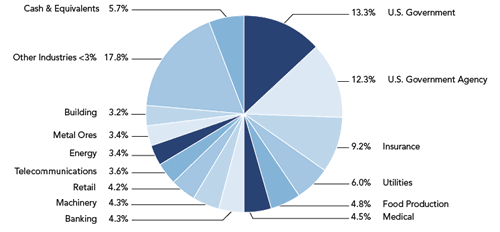
| Industry Allocation |
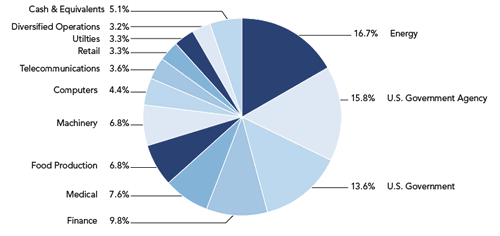 |
November 30, 2008 Annual Report | 5
Sextant Short-Term Bond Fund
Discussion of Fund Performance (unaudited)
Fiscal Year 2008
For the fiscal year ended November 30, 2008, the Sextant Short-Term Bond Fund returned 0.66%. This annual return compared favorably with that of its Morningstar Category peer group, which declined 5.36% during the same period. This ranks the Fund in the top 21st percentile of the 439 funds in its peer group.
Reflecting the year's extraordinary events, the share price moved in an unusually wide range from $5.08 to $4.76 — a maximum variation of 7%. For the five years ending November 30 2008, the Fund provided an 2.58% annualized total return; for the ten year ending November 30, 2008 the Fund provided a 4.03% annualized total return. Fund shares outstanding rose 4%. The Fund's expense ratio remained at 0.75%, reflecting Saturna Capital's voluntary actions to limit total expenses.
Factors Affecting Past Performance
We were premature in predicting that credit markets would return to normal. For the last six months of 2008, credit markets functions deteriorated significantly. For short-term issues, liquidity was often poor. Investment-grade bond prices declined significantly as investors sold at nearly any price to preserve capital. A global flight to quality drove U.S. Treasury Note returns above other short-term fixed-income assets. Yield curves steepened as the Federal Reserve Bank pushed short-term rates almost to zero in an effort to restore credit market functions. For the fiscal year ended November 30th, short-term U.S. Treasury notes appreciated 6%, while short-term investment-grade corporate bonds fell nearly 2%. Returns on all corporate bonds (regardless of maturity) declined 10%. Low quality issues with longer maturities were especially hard-hit, falling more than 19%.
Federal bailout and central bank lending programs are producing some positive results. Credit spreads are narrowing slightly; new issue underwriting is growing. Secondary market liquidity remains troublesome. In general, bond prices have recovered somewhat from November's lows.
Looking Forward
The next twelve months are going to be especially challenging. Lenders are negotiating with only the most credit-worthy borrowers. We expect global deleveraging to continue and default rates to rise. We expect short-term rates to stay low. Major debtor currency exchange rates should weaken, forcing long-term borrowing rates upward. We expect the spread between corporate and government borrowing costs to narrow as governments are forced to pay higher rates in a global competition for increasingly scarce funding. That said, we do not anticipate a quick improvement in the economy despite government stimulus plans.
For 2009, we have an historic opportunity to add high-quality investment-grade paper to the portfolio. Management will continue to selectively acquire new issues while remaining vigilant for issuer credit impairment. We expect to maintain a dollar-weighted average maturity close to three years as the search for yield intensifies.
We look forward to new opportunities to invest in creditworthy assets at historically discounted values.
Management Fee Calculations
The Sextant Short-Term Bond Fund calculates part of its management fee based on a comparison of the Fund's return to the average return of the Morningstar™ category Intermediate Term Bond. The Fund's 12-month return (0.66%) was more than four percent above the Morningstar™ average (-5.36%) at month-end November 30, 2008. Therefore, the basic performance-based annual management fee of 0.60% was increased to 0.80% for the month of December 2008. Note that the management fee and distribution expense are almost entirely waived due to the adviser's voluntary cap (0.75%) on Fund expenses.
| Bond Ratings | |||
| Ratings Established | By Adviser | By Standard & Poor's | By Moody's Investor Services |
| AAA | 35.9% | 36.0% | 36.0% |
| AA | 3.2% | 10.8% | 3.2% |
| A | 41.2% | 40.4% | 41.1% |
| BBB | 14.6% | 7.7% | 14.6% |
| Unrated | 0.0% | 0.0% | 0.0% |
| Other assets | 5.1% | 5.1% | 5.1% |
| Top Ten Holdings | |
| % of Fund Assets | |
| U.S. Treasury Note 4.00% due 4/15/2010 | 6.9% |
| Federal Farm Credit Bank 5.79% due 6/5/2013 | 6.7% |
| U.S. Treasury Note 4.00% due 6/15/2009 | 6.7% |
| Federal Home Loan Mortgage 4.35% due 2/13/2015 | 5.0% |
| Apache 5.25% due 4/15/2013 | 4.9% |
| Halliburton 5.50% due 10/15/2010 | 4.4% |
| International Business Machines 5.05% due 10/22/2012 | 4.4% |
| AstraZeneca 5.40% due 9/15/2012 | 4.3% |
| Federal National Mortage Assc. 5.00% due 2/23/2010 | 4.1% |
| Marathon Oil 6.00% due 7/1/2012 | 3.9% |
6 | November 30, 2008 Annual Report
Sextant Short-Term Bond Fund
| Investments | |||||
| Rating* | Issuer | Coupon/Maturity | Face Amount | Market Value | Percentage of Assets |
| Computers | |||||
| A+ | International Business Machines | 5.05% due 10/22/2012 | $135,000 | $134,361 | 4.4% |
| Diversified Services | |||||
| AAA | General Electric Capital | 5.25% due 10/19/2012 | 100,000 | 97,102 | 3.2% |
| Energy | |||||
| A- | Apache | 5.25% due 4/15/2013 | 150,000 | 147,980 | 4.9% |
| A | ConocoPhillips | 8.75% due 5/25/2010 | 100,000 | 105,340 | 3.5% |
| A | Halliburton | 5.50% due 10/15/2010 | 132,000 | 134,486 | 4.4% |
| BBB+ | Marathon Oil | 6.00% due 7/1/2012 | 120,000 | 117,542 | 3.9% |
| 502,000 | 505,348 | 16.7% | |||
| Finance | |||||
| AAA | Berkshire Hathaway Financial | 4.75% due 5/15/2012 | 100,000 | 101,099 | 3.3% |
| AA- | HSBC Finance | 6.375% due 10/15/2011 | 100,000 | 95,358 | 3.2% |
| BBB+ | International Lease Finance (AIG) | 5.00% due 4/15/2010 | 125,000 | 99,921 | 3.3% |
| 325,000 | 296,378 | 9.8% | |||
| Food Production | |||||
| BBB | Fortune Brands | 5.125% due 1/15/2011 | 120,000 | 114,567 | 3.8% |
| A+ | Wm. Wrigley Jr. | 4.30% due 7/15/2010 | 100,000 | 90,000 | 3.0% |
| 220,000 | 204,567 | 6.8% | |||
| Machinery | |||||
| A | Caterpillar | 7.25% due 9/15/2009 | 100,000 | 101,368 | 3.4% |
| A | Dover | 6.50% due 2/15/2011 | 100,000 | 101,453 | 3.4% |
| 200,000 | 202,821 | 6.8% | |||
| Medical | |||||
| A+ | AstraZeneca | 5.40% due 9/15/2012 | 125,000 | 129,339 | 4.3% |
| A+ | Genentech | 4.40% due 7/15/2010 | 100,000 | 100,417 | 3.3% |
| 225,000 | 229,756 | 7.6% | |||
| Retail | |||||
| A- | TJ X Companies | 7.45% due 12/15/2009 | 95,000 | 98,886 | 3.3% |
| Telecommunications | |||||
| BBB | Verizon New England | 4.75% due 10/1/2013 | 129,000 | 109,459 | 3.6% |
| U.S. Government | |||||
| AAA | U.S. Treasury Note | 4.00% due 6/15/2009 | 200,000 | 203,547 | 6.7% |
| AAA | U.S. Treasury Note | 4.00% due 4/15/2010 | 200,000 | 209,016 | 6.9% |
| 400,000 | 412,563 | 13.6% | |||
| Continued on next page. | |||||
(The accompanying notes are an integral part of these financial statements.)
November 30, 2008 Annual Report | 7
Sextant Short-Term Bond Fund
| Investments | |||||
| Rating* | Issuer | Coupon/Maturity | Face Amount | Market Value | Percentage of Assets |
| U.S. Government Agency | |||||
| AAA | Federal Farm Credit Bank | 5.79% due 6/5/2013 | $200,000 | $203,754 | 6.7% |
| AAA | Federal Home Loan Mortgage | 4.35% due 2/13/2015 | 150,000 | 150,720 | 5.0% |
| AAA | Federal National Mortage Assc. | 5.00% due 2/23/2010 | 120,000 | 124,170 | 4.1% |
| 470,000 | 478,644 | 15.8% | |||
| Utilities | |||||
| A- | Scottish Power | 4.91% due 3/15/2010 | 100,000 | 98,709 | 3.3% |
| Total investments | (Cost = $2,920,405) | $2,901,000 | 2,868,594 | 94.9% | |
| Other assets (net of liabilities) | 155,532 | 5.1% | |||
| Total net assets | $3,024,126 | 100.0% | |||
| *Ratings shown are as determined by a national bond rating agency or the Adviser. | |||||
(The accompanying notes are an integral part of these financial statements.)
8 | November 30, 2008 Annual Report
Sextant Short-Term Bond Fund
| Statement of Assets and Liabilities | ||
| As of November 30, 2008 | ||
| Assets | ||
| Investments in securities, at value (Cost $2,920,405) | $2,868,594 | |
| Cash | 119,206 | |
| Interest receivable | 37,608 | |
| Due from affiliates | 1,132 | |
| Receivable for Fund shares sold | 50 | |
| Total assets | $3,026,590 | |
| Liabilities | ||
| Other liabilities | 1,732 | |
| Payable to affiliates | 617 | |
| Distribution payable | 115 | |
| Total liabilities | 2,464 | |
| Net Assets | $3,024,126 | |
| Analysis of net assets | ||
| Paid-in capital (unlimited shares authorized, without par value) | 3,121,744 | |
| Accumlated net realized loss | (47,214) | |
| Unrealized net depreciation on investments | (51,811) | |
| Undistributed net investment income | 1,407 | |
| Net assets applicable to Fund shares outstanding | $3,024,126 | |
| Fund shares outstanding | 625,225 | |
| Net asset value, offering and redemption price per share | $4.84 | |
| Statement of Operations | ||
| For the year ended November 30, 2008 | ||
| Investment income | ||
| Interest income | $137,313 | |
| Gross investment income | $137,313 | |
| Expenses | ||
| Investment adviser and administration fees | 24,241 | |
| Filing and registration fees | 9,240 | |
| Distribution fees | 7,733 | |
| Audit fees | 2,149 | |
| Printing and postage | 1,507 | |
| Trustee fees | 1,460 | |
| Insurance | 1,335 | |
| Chief Compliance Officer expenses | 1,186 | |
| Custodian fees | 359 | |
| Other expenses | 38 | |
| Total gross expenses | 49,248 | |
| Less adviser fees waived | (25,612) | |
| Less custodian fee credits | (359) | |
| Net expenses | 23,277 | |
| Net investment income | 114,036 | |
| Net realized loss on portfolio investments | ||
| Proceeds from sales | 613,850 | |
| Less cost of securities sold (based on identified cost) | 624,105 | |
| Net realized loss on investments | (10,255) | |
| Net unrealized loss on portfolio investments | ||
| End of year | (51,811) | |
| Beginning of year | 39,906 | |
| Net decrease in unrealized appreciation | (91,717) | |
| Net realized and unrealized loss on portfolio investments | (101,972) | |
| Net increase in net assets resulting from operations | $12,064 | |
(The accompanying notes are an integral part of these financial statements.)
November 30, 2008 Annual Report | 9
Sextant Short-Term Bond Fund
| Statement of Changes in Net Assets | Year ended Nov. 30, 2008 | Year ended Nov. 30, 2007 |
| Increase in net assets | ||
| From operations | ||
| Net investment income | $114,036 | $101,564 |
| Net realized gain (loss) on investments | (10,255) | 5,698 |
| Net increase (decrease) in unrealized appreciation | (91,717) | 49,660 |
| Net increase in net assets | 12,064 | 156,922 |
| Dividends to shareowners from | ||
| Net investment income | (114,369) | (101,484) |
| From Fund share transactions | ||
| Proceeds from sales of shares | 1,130,516 | 660,050 |
| Value of shares issued in reinvestment of dividends | 111,024 | 93,006 |
| Early redemption fees retained | 79 | 16 |
| Cost of shares redeemed | (1,110,549) | (750,521) |
| Net increase in net assets | 131,070 | 2,551 |
| Total increase in net assets | $28,765 | $57,989 |
| Net assets | ||
| Beginning of year | 2,995,361 | 2,937,372 |
| End of year | $3,024,126 | $2,995,361 |
| Undistributed net investment income | 1,407 | 1,740 |
| Shares of the Fund sold and redeemed | ||
| Number of shares sold | 228,825 | 134,418 |
| Number of shares issued in reinvestment of dividends | 22,429 | 18,956 |
| Number of shares redeemed | (226,241) | (153,241) |
| Net increase in number of shares outstanding | 25,013 | 133 |
| Financial Highlights | Year ended November 30, | ||||
| Selected data per share of capital stock outstanding throughout the year: | 2008 | 2007 | 2006 | 2005 | 2004 |
| Net asset value at beginning of year | $4.99 | $4.90 | $4.85 | $4.97 | $5.09 |
| Income from investment operations | |||||
| Net investment income | 0.18 | 0.17 | 0.16 | 0.17 | 0.19 |
| Net gain (loss) on securities (both realized and unrealized) | (0.15) | 0.09 | 0.05 | (0.12) | (0.12) |
| Total from investment operations | 0.03 | 0.26 | 0.21 | 0.05 | 0.07 |
| Less distributions | |||||
| Dividends (from net investment income) | (0.18) | (0.17) | (0.16) | (0.17) | (0.19) |
| Total distributions | (0.18) | (0.17) | (0.16) | (0.17) | (0.19) |
| Paid-in capital from early redemption fees¹ | 0.00² | 0.00² | 0.00² | 0.00² | - |
| Net asset value at end of year | $4.84 | $4.99 | $4.90 | $4.85 | $4.97 |
| Total return | 0.66% | 5.51% | 4.41% | 0.96% | 1.41% |
| Ratios / supplemental data | |||||
| Net assets ($000), end of year | $3,024 | $2,995 | $2,937 | $2,557 | $2,255 |
| Ratio of expenses to average net assets | |||||
| Before fee waivers and custodian fee credits | 1.60% | 1.58% | 1.39% | 1.23% | 1.14% |
| After fee waivers and custodian fee credits | 0.75% | 0.75% | 0.57% | 0.59% | 0.58% |
| Ratio of net investment income after fee waiver and custodian fee credits to average net assets | 3.70% | 3.54% | 3.41% | 3.35% | 3.80% |
| Portfolio turnover rate | 22% | 28% | 41% | 33% | 37% |
| ¹Early redemption fee adopted March 29, 2005 | ²Amounts less than $0.01 | ||||
(The accompanying notes are an integral part of these financial statements.)
10 | November 30 2008 Annual Report
Sextant Bond Income Fund
Performance Summary (unaudited)
| Average Annual Returns as of November 30, 2008 | ||||
| 1 Year | 5 Years | 10 Years | Expense Ratio¹ | |
| Sextant Bond Income Fund | -4.80% | 1.99% | 4.10% | 1.38% |
| Citigroup Broad Investment Grade Bond Index | 3.65% | 4.60% | 5.53% | N/A |
Growth of $10,000
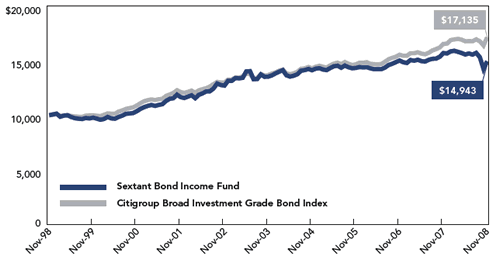 | Comparison of any mutual fund to a market index must be made bearing in mind that the index is unmanaged, and expense-free. Conversely, the fund will (1) be actively managed, (2) have an objective other than mirroring the index, such as limiting risk, (3) bear transaction and other costs, (4) stand ready to buy and sell its securities to shareowners on a daily basis, and (5) provide a wide range of services. The graph compares $10,000 invested in the Fund on November 30, 1998 to a similar amount invested in the Index, which reflects the types of securities in which the Fund invests. The graph shows that an investment in the Fund would have risen to $14,943 versus $17,135 in the index. |
| Past performance does not guarantee future results. The "Growth of $10,000" graph and "Average Annual Returns" performance table assume the reinvestment of dividends and capital gains. They do not reflect the deduction of taxes that a shareowner might pay on fund distributions or the redemption of fund shares, nor do they reflect the potential deduction of a 2% redemption fee on shares held less than 30 calendar days. ¹By regulation, the expense ratio for the Fund shown in this table is as of the Fund's most recent prospectus dated March 28, 2008, incorporating results for the 2007 fiscal year and differs from expense ratios shown elsewhere in this report as they represent different fiscal periods. | |
Fund Objective
The objective of the Bond Income Fund is current income.
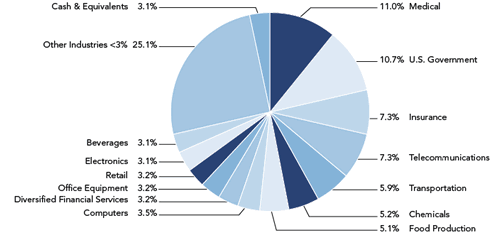
| Industry Allocation |
 |
November 30, 2008 Annual Report | 11
Sextant Bond Income Fund
Discussion of Fund Performance (unaudited)
Fiscal Year 2008
For the fiscal year ended November 30, 2008, the Sextant Bond Income Fund declined 4.80%. This annual return compared favorably with that of its Morningstar Category peer group, which declined 7.78% during the same period. This ranks the Fund in the 42nd percentile of the 1137 funds in its peer group.
Reflecting the year's extraordinary events, the share price moved in an unusually wide range from $4.97 to $4.27 — a maximum variation of 14%. For the five years ended November 30, 2008, the Fund provided a 1.99% annualized total returned; for the ten years ended November 30, 2008, the Fund provided a 4.10% annualized total return. Fund shares outstanding rose 6%. The Fund's expense ratio remained at 0.90%, reflecting Saturna Capital's voluntary actions to limit total expenses.
Factors Affecting Past Performance
We were premature in predicting that credit markets would return to normal. For the last six months of 2008, credit market functions deteriorated markedly. Liquidity for issues with longer maturities also declined significantly, as dealers, banks, and brokers lost their appetites for risk. Fund trustees and Saturna Capital closely monitored our bond valuations. Yield curves steepened as the Federal Reserve Bank pushed short-term rates down in an effort to restore credit market functions. A global flight to quality drove long U.S. Treasury bond returns above other long-term fixed-income asset classes. For the fiscal year ended November 30th, long-term U.S. Treasury bonds appreciated 13%, while long-term investment-grade corporate bonds fell more than 15%. Low quality issues with longer maturities were especially hard-hit, falling more than 19%.
Federal bailout and central bank lending programs are producing some positive results. Credit spreads are narrowing slightly; new issue underwriting is growing. Secondary market liquidity remains troublesome. In general, bond prices have recovered somewhat from November's lows.
Looking Forward
The next twelve months are going to be especially challenging. Lenders are negotiating with only the most credit-worthy borrowers. We expect global deleveraging to continue and default rates to rise. We expect short-term rates to stay low. Major debtor currency exchange rates should weaken, forcing long-term borrowing rates upward. We expect the spread between corporate and government borrowing costs to narrow as governments are forced to pay higher rates in a global competition for increasingly scarce funding. That said, we do not anticipate a quick improvement in the economy despite government stimulus plans.
For 2009, we have an historic opportunity to add high-quality investment-grade paper to the portfolio. Management will continue to selectively acquire new issues while remaining vigilant for issuer credit impairment. We expect to maintain a dollar-weighted average maturity close to ten years as the search for yield intensifies. We look forward to new opportunities to invest in creditworthy assets at historically discounted values.
Management Fee Calculations
The Sextant Bond Income Fund calculates its management fee based on a comparison of the Fund's return to the return of Morningstar's™ "Intermediate-Term Bond" category. The Fund's 12-month return (-4.80%) was more than two percent percent above the Morningstar™ average (-7.78%) at month-end November 30, 2008. Therefore, the basic performance-based annual management fee of 0.60% was increased to 0.80% for the month of December 2008. Note that the management fee and distribution expense are almost entirely waived due to the adviser's voluntary cap (0.90%) on Fund expenses.
| Bond Ratings | |||
| Ratings Established | By Adviser | By Standard & Poor's | By Moody's Investor Services |
| AAA | 27.5% | 25.5% | 23.7% |
| AA | 10.8% | 5.7% | 9.3% |
| A | 38.8% | 42.5% | 38.8% |
| BBB | 17.2% | 15.3% | 17.2% |
| Unrated | 0.0% | 5.3% | 5.3% |
| Other assets | 5.7% | 5.7% | 5.7% |
| Top Ten Holdings | |
| % of Fund Assets | |
| U.S. Treasury Bond 7.25% due 8/15/2022 | 8.0% |
| U.S. Treasury Bond 5.25% due 2/15/2029 | 5.3% |
| Federal Farm Credit Bank 6.25% due 8/18/2021 | 4.7% |
| Federal National Mortgage Assoc. 5.00% due 11/28/2017 | 4.6% |
| AT&T 7.125% due 12/15/2031 | 3.6% |
| BHP Finance U.S.A. 5.25% due 12/15/2015 | 3.4% |
| Travelers Companies 5.50% due 12/1/2015 | 3.4% |
| Pharmacia 6.50% due 12/1/2018 | 3.3% |
| Federal National Mortgage Assoc. 5.00% due 4/10/2015 | 3.0% |
| Deere & Co. 8.10% due 5/15/2030 | 3.0% |
12 | November 30, 2008 Annual Report
Sextant Bond Income Fund
| Investments | |||||
| Rating* | Issuer | Coupon/Maturity | Face Amount | Market Value | Percentage of Assets |
| Agriculture | |||||
| A | Archer Daniels Midland | 7.00% due 2/1/2031 | $100,000 | $95,661 | 2.9% |
| Automotive | |||||
| BBB | AutoZone | 5.50% due 11/15/2015 | 95,000 | 73,710 | 2.2% |
| Banking | |||||
| A+ | CitiCorp | 7.25% due 10/15/2011 | 50,000 | 48,641 | 1.5% |
| A | Comerica Bank | 7.125% due 12/1/2013 | 50,000 | 41,398 | 1.3% |
| AA+ | Norwest Financial | 6.85% due 7/15/2009 | 50,000 | 50,304 | 1.5% |
| 150,000 | 140,343 | 4.3% | |||
| Building | |||||
| A+ | Lowe's Companies | 8.25% due 6/1/2010 | 50,000 | 52,034 | 1.6% |
| BBB | Masco | 7.125% due 8/15/2013 | 60,000 | 53,188 | 1.6% |
| 110,000 | 105,222 | 3.2% | |||
| Chemicals | |||||
| A | Air Products & Chemicals | 8.75% due 4/15/2021 | 50,000 | 55,357 | 1.7% |
| Diversified Financial Services | |||||
| AAA | General Electric Capital | 8.125% due 5/15/2012 | 60,000 | 62,811 | 1.9% |
| Electronics | |||||
| A- | Koninklijke Philips Electronics | 7.25% due 8/15/2013 | 75,000 | 76,201 | 2.3% |
| Energy | |||||
| A | Baker Hughes | 6.00% due 2/15/2009 | 20,000 | 20,054 | 0.6% |
| A | Baker Hughes | 6.875% due 1/15/2029 | 100,000 | 93,845 | 2.8% |
| 120,000 | 113,899 | 3.4% | |||
| Finance | |||||
| A+ | Morgan Stanley Dean Witter | 6.75% due 10/15/2013 | 50,000 | 40,773 | 1.2% |
| AA- | Paine Webber Group | 7.625% due 2/15/2014 | 50,000 | 48,739 | 1.5% |
| 100,000 | 89,512 | 2.7% | |||
| Food Production | |||||
| BBB | ConAgra Foods | 7.875% due 9/15/2010 | 33,000 | 33,507 | 1.0% |
| A | Hershey Foods | 6.95% due 8/15/2012 | 50,000 | 53,699 | 1.6% |
| BBB | H.J. Heinz | 6.00% due 3/15/2012 | 75,000 | 73,743 | 2.2% |
| 158,000 | 160,949 | 4.8% | |||
| Insurance | |||||
| A | Allstate | 7.50% due 6/15/2013 | 50,000 | 51,132 | 1.6% |
| A+ | Progressive | 7.00% due 10/1/2013 | 75,000 | 75,956 | 2.3% |
| A- | Travelers Companies | 5.50% due 12/1/2015 | 125,000 | 112,051 | 3.4% |
| BBB+ | XL Capital | 6.50% due 1/15/2012 | 90,000 | 63,716 | 1.9% |
| 340,000 | 302,855 | 9.2% | |||
| Continued on next page. | |||||
(The accompanying notes are an integral part of these financial statements.)
November 30, 2008 Annual Report | 13
Sextant Bond Income Fund
| Investments | |||||
| Rating* | Issuer | Coupon/Maturity | Face Amount | Market Value | Percentage of Assets |
| Machinery | |||||
| A | Caterpillar | 9.375% due 8/15/2011 | $40,000 | $42,988 | 1.3% |
| A | Deere & Co. | 8.10% due 5/15/2030 | 95,000 | 99,775 | 3.0% |
| 135,000 | 142,763 | 4.3% | |||
| Medical | |||||
| A | Becton Dickinson | 7.15% due 10/1/2009 | 40,000 | 39,943 | 1.2% |
| AA+ | Pharmacia | 6.50% due 12/1/2018 | 100,000 | 109,543 | 3.3% |
| 140,000 | 149,486 | 4.5% | |||
| Metal Ores | |||||
| A+ | BHP Finance U.S.A. | 5.25% due 12/15/2015 | 125,000 | 112,254 | 3.4% |
| Office Material | |||||
| BBB | Avery Dennison | 6.00% due 1/15/2033 | 95,000 | 61,082 | 1.9% |
| Retail | |||||
| A | Dayton Hudson (Target Stores) | 10.00% due 1/1/2011 | 50,000 | 54,481 | 1.6% |
| BBB | May Department Stores | 8.00% due 7/15/2012 | 50,000 | 35,603 | 1.1% |
| AA | Wal-Mart Stores | 7.25% due 6/1/2013 | 45,000 | 49,958 | 1.5% |
| 145,000 | 140,042 | 4.2% | |||
| Telecommunications | |||||
| A | AT&T | 7.125% due 12/15/2031 | 140,000 | 117,574 | 3.6% |
| Transportation | |||||
| BBB+ | Southwest Airlines | 6.50% due 3/1/2012 | 75,000 | 73,084 | 2.2% |
| U.S. Government | |||||
| AAA | U.S. Treasury Bond | 5.25% due 2/15/2029 | 145,000 | 175,325 | 5.3% |
| AAA | U.S. Treasury Bond | 7.25% due 8/15/2022 | 195,000 | 266,830 | 8.0% |
| 340,000 | 442,155 | 13.3% | |||
| U.S. Government Agency | |||||
| AAA | Federal Farm Credit Bank | 6.25% due 8/18/2021 | 150,000 | 153,936 | 4.7% |
| AAA | Federal National Mortage Assoc. | 5.00% due 4/10/2015 | 100,000 | 100,058 | 3.0% |
| AAA | Federal National Mortage Assoc. | 5.00% due 11/28/2017 | 150,000 | 151,136 | 4.6% |
| 400,000 | 405,130 | 12.3% | |||
| Utilities | |||||
| BBB | Commonwealth Edison | 7.50% due 7/1/2013 | 50,000 | 50,375 | 1.5% |
| A | Florida Power & Light | 5.95% due 10/1/2033 | 100,000 | 98,047 | 3.0% |
| BBB+ | Sempra Energy | 7.95% due 3/1/2010 | 50,000 | 50,129 | 1.5% |
| 200,000 | 198,551 | 6.0% | |||
| Total investments | (Cost = $3,326,778) | $3,153,000 | 3,118,641 | 94.3% | |
| Other assets (net of liabilities) | 187,482 | 5.7% | |||
| Total net assets | $3,306,123 | 100.0% | |||
| *Ratings shown are as determined by a national bond rating agency or the Adviser. | |||||
(The accompanying notes are an integral part of these financial statements.)
14 | November 30, 2008 Annual Report
Sextant Bond Income Fund
| Statement of Assets & Liabilities | ||
| As of November 30, 2008 | ||
| Assets | ||
| Investments in securities, at value (Cost $3,326,778) | $3,118,641 | |
| Cash | 127,360 | |
| Interest receivable | 61,275 | |
| Insurance reserve premium | 400 | |
| Due from affiliates | 121 | |
| Receivable for Fund shares sold | 52 | |
| Total assets | $3,307,849 | |
| Liabilities | ||
| Accrued expenses | 1,386 | |
| Payable to affiliates | 221 | |
| Distributions payable | 119 | |
| Total liabilities | 1,726 | |
| Net assets | $3,306,123 | |
| Analysis of net assets | ||
| Paid-in capital (unlimited shares authorized, without par value) | 3,578,753 | |
| Accumulated net realized loss | (64,493) | |
| Unrealized net depreciation on investments | (208,137) | |
| Net assets applicable to Fund shares outstanding | $3,306,123 | |
| Fund shares outstanding | 741,780 | |
| Net asset value, offering and redemption price per share | $4.46 | |
| Statement of Operations | ||
| For the year ended November 30, 2008 | ||
| Investment income | ||
| Interest income | $190,996 | |
| Gross investment income | $190,996 | |
| Expenses | ||
| Investment adviser and administration fees | 22,777 | |
| Filing and registration fees | 9,189 | |
| Distribution fees | 8,572 | |
| Audit fees | 3,296 | |
| Printing and postage | 1,560 | |
| Chief Compliance Officer expenses | 1,386 | |
| Insurance | 969 | |
| Legal fees | 869 | |
| Trustee fees | 820 | |
| Custodian fees | 148 | |
| Other expenses | 109 | |
| Total gross expenses | 49,695 | |
| Less adviser fees waived | (18,595) | |
| Less custodian fee credits | (148) | |
| Net expenses | 30,952 | |
| Net investment income | 160,044 | |
| Net realized loss on portfolio investments | ||
| Proceeds from sales | 279,750 | |
| Less cost of securities sold (based on identified cost) | 309,271 | |
| Net realized loss on investments | (29,521) | |
| Net unrealized gain on portfolio investments | ||
| End of year | (208,137) | |
| Beginning of year | 91,317 | |
| Net decrease in unrealized appreciation | (299,454) | |
| Net realized and unrealized loss on portfolio investments | (328,975) | |
| Net decrease in net assets resulting from operations | ($168,931) | |
(The accompanying notes are an integral part of these financial statements.)
November 30, 2008 Annual Report | 15
Sextant Bond Income Fund
| Statement of Changes in Net Assets | Year ended Nov. 30, 2008 | Year ended Nov. 30, 2007 |
| Increase (decrease) in net assets | ||
| From operations | ||
| Net investment income | $160,044 | $148,530 |
| Net realized gain (loss) on investments | (29,521) | (4,203) |
| Net increase (decrease) in unrealized appreciation | (299,454) | (4,699) |
| Net increase (decrease) in net assets | (168,931) | 139,628 |
| Dividends to shareowners from | ||
| Net investment income | (160,044) | (148,530) |
| From Fund share transactions | ||
| Proceeds from sales of shares | 355,383 | 447,983 |
| Value of shares issued in reinvestment of dividends | 154,961 | 129,523 |
| Early redemption fees retained | 14 | 6 |
| Cost of shares redeemed | (287,423) | (540,873) |
| Net increase in net assets | 222,935 | 36,639 |
| Total increase (decrease) in net assets | ($106,040) | $27,737 |
| Net assets | ||
| Beginning of year | 3,412,163 | 3,384,426 |
| End of year | $3,306,123 | $3,412,163 |
| Shares of the Fund sold and redeemed | ||
| Number of shares sold | 77,146 | 92,609 |
| Number of shares issued in reinvestment of dividends | 32,872 | 26,850 |
| Number of shares redeemed | (63,078) | (112,203) |
| Net increase in number of shares outstanding | 46,940 | 7,256 |
| Financial Highlights | Year ended November 30, | ||||
| Selected data per share of capital stock outstanding throughout the year: | 2008 | 2007 | 2006 | 2005 | 2004 |
| Net asset value at beginning of year | $4.91 | $4.92 | $4.92 | $5.06 | $5.07 |
| Income from investment operations | |||||
| Net investment income | 0.22 | 0.22 | 0.22 | 0.21 | 0.22 |
| Net gain (loss) on securities (both realized and unrealized) | (0.45) | (0.01) | 0.00 | (0.14) | (0.01) |
| Total from investment operations | (0.23) | 0.21 | 0.22 | 0.07 | 0.21 |
| Less distributions | |||||
| Dividends (from net investment income) | (0.22) | (0.22) | (0.22) | (0.21) | (0.22) |
| Total distributions | (0.22) | (0.22) | (0.22) | (0.21) | (0.22) |
| Paid-in capital from early redemption fees | 0.00² | 0.00² | 0.00² | 0.00² | - |
| Net asset value at end of year | $4.46 | $4.91 | $4.92 | $4.92 | $5.06 |
| Total return | (4.80)% | 4.53% | 4.73% | 1.40% | 4.26% |
| Ratios/supplemental data | |||||
| Net assets ($000), end of year | $3,306 | $3,412 | $3,384 | $3,050 | $2,643 |
| Ratio of expenses to average net assets | |||||
| Before fee waivers and custodian fee credits | 1.45% | 1.38% | 1.27% | 0.97% | 0.89% |
| After fee waivers and custodian fee credits | 0.91% | 0.90% | 0.90% | 0.94% | 0.87% |
| Ratio of net investment income after fee waiver and custodian fee credits to average net assets | 4.68% | 4.64% | 4.64% | 4.26% | 4.47% |
| Portfolio turnover rate | 9% | 22% | 36% | 4% | 0% |
| ¹Early redemption fee adopted March 29, 2005 | ²Amount is less than $0.01 | ||||
(The accompanying notes are an integral part of these financial statements.)
16 | November 30, 2008 Annual Report
Sextant Core Fund
Performance Summary (unaudited)
| Average Annual Returns as of November 30, 2008 | ||||
| 1 Year | 5 Years | 10 Years | Expense Ratio¹ | |
| Sextant Core Fund | -23.52% | N/A | N/A | 1.35% |
| Dow Jones Moderate U.S. Portfolio Index | -28.19% | 1.94% | 3.79% | N/A |
Growth of $10,000
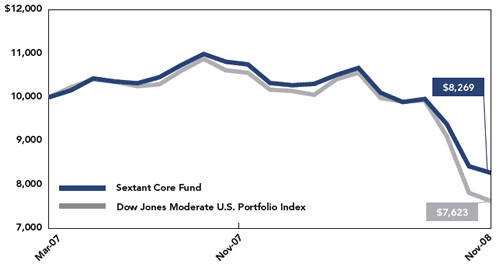 | Comparison of any mutual fund to a market index must be made bearing in mind that the index is unmanaged, and expense-free. Conversely, the fund will (1) be actively managed, (2) have an objective other than mirroring the index, such as limiting risk, (3) bear transaction and other costs, (4) stand ready to buy and sell its securities to shareowners on a daily basis, and (5) provide a wide range of services. The graph compares $10,000 invested in the Fund on March 30, 2007 to a similar amount invested in the index, which reflects the types of securities in which the Fund invests. The graph shows that an investment in the Fund would have fallen to $8,269 versus $7,623 in the index. |
| Past performance does not guarantee future results. The "Growth of $10,000" graph and "Average Annual Returns" performance table assume the reinvestment of dividends and capital gains. They do not reflect the deduction of taxes that a shareowner might pay on fund distributions or the redemption of fund shares, nor do they reflect the potential deduction of a 2% redemption fee on shares held less than 30 calendar days. ¹ By regulation, the expense ratio for the Fund shown in this table is as of the Fund's most recent prospectus dated March 28, 2008, incorporating results for the 2007 fiscal year and differs from expense ratios shown elsewhere in this report as they represent different fiscal periods. | |
Fund Objective
The objectives of the Core Fund are long-term appreciation and capital preservation. It began operations March 30, 2007.
| Industry Allocation |
 |
November 30, 2008 Annual Report | 17
Sextant Core Fund
Discussion of Fund Performance (unaudited)
Fiscal Year 2008
The 12 months during fiscal year 2008 saw a period of deteriorating financial conditions that took their toll on Fund performance in spite of its balanced allocation between fixed-income instruments and equity securities. Few market analysts properly perceived the extent of the banking crisis we are currently experiencing. Earnings estimates were (and are) too optimistic. As companies continued to revise earnings estimates lower, market values adjusted to the grim outlook. This accelerated in September and culminated on November 20 when the S&P 500 index hit a low of 752 after starting the Fund's fiscal year close to its all time high, at 1481 (a 49% decrease). The Fund itself was reasonably well positioned, being overweight in consumer staples and other defensive assets. As a consequence, the Sextant Core Fund managed to outperform its benchmark index (the Dow Jones Moderate Portfolio Index) by 4.6% for the year ended November 30, 2008.
Strategy
The Fund has a stated policy weight of 40% fixed-income and 60% equity securities. As we started the fiscal year last December, the Fund was modestly overweight in common equities. However, as the year progressed and the banking crisis deepened, the Fund increased its weight in fixed-income securities with the hope of offsetting the negative momentum experienced in the equity markets. Even this only acted to slow the rate of loss on the portfolio as credit concerns hurt corporate bond valuations. As the value of credit instruments deteriorated at a slower pace than common equity securities, the higher weight helped the Fund to outperform its benchmark. As of the fiscal year end, the Sextant Core Fund was overweight cash and fixed-income securities by 9% relative to its policy benchmark.
Looking Forward
Following the November 30 fiscal year-end, markets continued to bid up U.S. government bonds. This was driven by a continuation of the flight to quality as well as the Federal Reserves' perceived intervention into credit markets to make home mortgages more affordable. As of this writing, the 30-year U.S. government bond yields a paltry 2.9%. With investors now concerned that Treasurys are overvalued, quality corporate bonds have experienced a modest increase in liquidity, which appears to be supporting the prices of these assets. Given the environment, we took the opportunity provided by these record Treasury prices to take profits on our long dated position, lower portfolio duration, and buy shorter-dated Treasury bonds (thus decreasing portfolio volatility). While the capital markets continue to be erratic, we expect to maintain asset weights closer to the Fund's policy weights. The Fund will, however, take a cautious approach going into 2009 by continuing to maintain a defensive posture.
Management Fee Calculations
The Sextant Core Fund calculates its management fee based on a comparison of the Fund's return to the return of Morningstar's™ "Moderate-Allocation Domestic Hybrid Funds" category. The Fund's 12-month return (-23.52%) was more than four percent above the Morningstar™ category average (-30.61%) at month-end November 30, 2008. Therefore, the maximum performance increase of 0.30% was added to the basic 0.60% annual management fee for the month of December 2008.
| Bond Ratings | |||
| Ratings Established | By Adviser | By Standard & Poor's | By Moody's Investor Services |
| AAA | 16.6% | 9.3% | 16.6% |
| AA | 3.2% | 8.0% | 3.2% |
| A | 11.0% | 9.3% | 14.1% |
| BBB | 15.1% | 12.0% | 12.0% |
| Unrated | 0.0% | 7.3% | 0.0% |
| Equities | 51.0% | 51.0% | 51.0% |
| Other assets | 3.1% | 3.1% | 3.1% |
| Top Ten Holdings | |
| % of Fund Assets | |
| U.S. Treasury Bond 5.25% due 11/15/2028 | 7.3% |
| Genentech 4.40% due 7/15/2010 | 4.9% |
| U.S. Treasury Note 6.00% due 8/15/2009 | 3.4% |
| Berkley WR 5.875% due 2/15/2013 | 3.2% |
| General Electric Capital 6.00% due 6/15/2012 | 3.2% |
| Wal-Mart Stores 4.50% due 7/1/2015 | 3.2% |
| Panamerican Beverages 7.25% due 7/1/2009 | 3.1% |
| Verizon New England 6.50% due 9/15/2011 | 3.1% |
| Emerson Electric 5.375% due 10/15/2017 | 3.1% |
| E.I. du Pont de Nemours 5.25% due 12/15/2016 | 3.1% |
18 | November 30, 2008 Annual Report
Sextant Core Fund
| Investments | |||||
| Equities — 51.0% | |||||
| Issue | Number of Shares | Tax Cost | Market Value | Country¹ | Percentage of Assets |
| Aerospace | |||||
| Lockheed Martin | 300 | $31,265 | $23,133 | 0.8% | |
| Rockwell Collins | 800 | 51,631 | 27,264 | 0.9% | |
| United Technologies | 525 | 36,359 | 25,478 | 0.8% | |
| 119,255 | 75,875 | 2.5% | |||
| Automotive | |||||
| Toyota Motor ADS | 200 | 25,376 | 12,620 | Japan | 0.4% |
| Banking | |||||
| Australia & New Zealand Banking Group ADS | 1,750 | 42,755 | 16,866 | Australia | 0.5% |
| JP Morgan Chase & Co | 550 | 20,563 | 17,413 | 0.6% | |
| Nomura Holdings ADR | 700 | 14,469 | 5,096 | Japan | 0.2% |
| PNC Bank | 600 | 42,748 | 31,662 | 1.0% | |
| Toronto-Dominion Bank | 550 | 35,553 | 19,399 | Canada | 0.6% |
| 156,088 | 90,436 | 2.9% | |||
| Building | |||||
| CRH ADS | 600 | 26,439 | 13,230 | Ireland | 0.4% |
| Lowe's Companies | 900 | 28,519 | 18,594 | 0.6% | |
| Ritchie Bros. Auctioneers | 1,000 | 19,000 | 18,670 | Canada | 0.6% |
| 73,958 | 50,494 | 1.6% | |||
| Chemicals | |||||
| BASF ADS | 400 | 22,550 | 12,750 | Germany | 0.4% |
| Praxair | 700 | 44,349 | 41,335 | 1.3% | |
| RPM International | 1,000 | 23,110 | 11,990 | 0.4% | |
| 90,009 | 66,075 | 2.1% | |||
| Computer Hardware | |||||
| Taiwan Semiconductor ADS | 1,514 | 16,215 | 10,825 | Taiwan | 0.4% |
| Computers | |||||
| Adobe Systems¹ | 1,100 | 45,474 | 25,476 | 0.8% | |
| Apple² | 500 | 52,016 | 46,335 | 1.5% | |
| Hewlett-Packard | 1,000 | 41,025 | 35,280 | 1.2% | |
| 138,515 | 107,091 | 3.5% | |||
| Cosmestics & Toiletries | |||||
| Procter & Gamble | 900 | 58,842 | 57,915 | 1.9% | |
| Diversified Operations | |||||
| Honeywell International | 850 | 42,855 | 23,681 | 0.8% | |
| 3M | 600 | 50,092 | 40,158 | 1.3% | |
| Tomkins ADS | 750 | 15,945 | 5,040 | United Kingdom | 0.1% |
| 108,892 | 68,879 | 2.2% | |||
| Continued on next page. | |||||
(The accompanying notes are an integral part of these financial statements.)
November 30, 2008 Annual Report | 19
Sextant Core Fund
| Investments | |||||
| Equities — 51.0% | |||||
| Issue | Number of Shares | Tax Cost | Market Value | Country¹ | Percentage of Assets |
| Energy | |||||
| ConocoPhillips | 750 | $56,826 | $39,390 | 1.3% | |
| Noble | 1,200 | 53,183 | 32,148 | 1.1% | |
| Norsk Hydro ADS | 2,000 | 27,226 | 7,178 | Norway | 0.2% |
| StatoilHydro ADS | 603 | 15,146 | 10,263 | Norway | 0.3% |
| 152,381 | 88,979 | 2.9% | |||
| Food Production | |||||
| General Mills | 1,000 | 57,763 | 63,170 | 2.1% | |
| PepsiCo | 1,000 | 66,423 | 56,700 | 1.8% | |
| Unilever ADS | 1,600 | 51,119 | 36,640 | United Kingdom | 1.2% |
| 175,305 | 156,510 | 5.1% | |||
| Hotels & Motels | |||||
| Orient-Express Hotels Class A | 1,000 | 56,450 | 6,850 | Bermuda | 0.2% |
| Instruments — Control | |||||
| Parker Hannifin | 450 | 25,890 | 18,486 | 0.6% | |
| Insurance | |||||
| Chubb | 750 | 39,270 | 38,520 | 1.3% | |
| ING Groep ADS | 400 | 16,992 | 3,352 | Netherlands | 0.1% |
| 56,262 | 41,872 | 1.4% | |||
| Medical | |||||
| Eli Lilly | 1,000 | 54,703 | 34,150 | 1.1% | |
| GlaxoSmithKline ADS | 500 | 26,859 | 17,220 | United Kingdom | 0.6% |
| Johnson & Johnson | 700 | 43,180 | 41,006 | 1.3% | |
| Novartis ADR | 300 | 16,506 | 14,076 | Switzerland | 0.5% |
| Novo Nordisk ADS | 400 | 18,098 | 20,440 | Denmark | 0.7% |
| Pfizer | 1,900 | 48,439 | 31,217 | 1.0% | |
| UnitedHealth Group | 1,400 | 68,523 | 29,414 | 0.9% | |
| 276,308 | 187,523 | 6.1% | |||
| Metal Ores | |||||
| Alcoa | 1,400 | 49,006 | 15,064 | 0.5% | |
| Anglo American ADR | 1,119 | 33,771 | 13,350 | South Africa | 0.4% |
| BHP Billiton ADS | 650 | 31,866 | 26,013 | Australia | 0.8% |
| Freeport-McMoRan Copper & Gold Class B | 200 | 13,324 | 4,798 | 0.2% | |
| 127,967 | 59,225 | 1.9% | |||
| Office Equipment | |||||
| Canon ADS | 600 | 32,481 | 17,856 | Japan | 0.6% |
| Paper & Paper Products | |||||
| Kimberly-Clark | 625 | 43,002 | 36,119 | 1.2% | |
| Continued on next page. | |||||
(The accompanying notes are an integral part of these financial statements.)
20 | November 30, 2008 Annual Report
Sextant Core Fund
| Investments | |||||
| Equities — 51.0% | |||||
| Issue | Number of Shares | Tax Cost | Market Value | Country¹ | Percentage of Assets |
| Publishing | |||||
| McGraw-Hill | 1,000 | $58,293 | $25,000 | 0.8% | |
| Pearson ADS | 2,100 | 34,910 | 20,160 | United Kingdom | 0.7% |
| 93,203 | 45,160 | 1.5% | |||
| Real Estate | |||||
| Duke Realty | 400 | 17,416 | 3,284 | 0.1% | |
| Shoes & Related Apparel | |||||
| Nike Class B | 900 | 51,646 | 47,925 | 1.6% | |
| Steel | |||||
| Nucor | 800 | 48,085 | 28,544 | 0.9% | |
| Telecommunications | |||||
| AT&T | 900 | 35,802 | 25,704 | 0.8% | |
| China Mobile ADS | 500 | 23,058 | 22,915 | China | 0.7% |
| Harris | 550 | 28,139 | 19,184 | 0.6% | |
| Telefónica ADS | 500 | 37,082 | 30,520 | Spain | 1.0% |
| Teléfonos de México ADS Class L | 1,200 | 17,732 | 20,832 | Mexico | 0.7% |
| Telemex International | 1,200 | 25,346 | 11,628 | Mexico | 0.4% |
| 167,159 | 130,783 | 4.2% | |||
| Tools | |||||
| Black & Decker | 350 | 29,654 | 14,854 | 0.5% | |
| Transportation | |||||
| Canadian National Railway | 800 | 40,237 | 28,176 | Canada | 0.9% |
| FedEx | 400 | 42,220 | 28,260 | 0.9% | |
| LAN Airlines ADS | 4,000 | 58,373 | 34,000 | Chile | 1.1% |
| 140,830 | 90,436 | 2.9% | |||
| Utilities | |||||
| FPL Group | 600 | 36,752 | 29,256 | 0.9% | |
| IDACORP | 900 | 30,463 | 27,360 | 0.9% | |
| 67,215 | 56,616 | 1.8% | |||
| Total equities | $2,348,404 | $1,571,232 | 51.0% | ||
| Bonds — 45.9% | |||||
| Rating³ | Issuer | Maturity / Coupon | Face Value | Market Value | Percentage of Assets |
| Beverages | |||||
| BBB+ | Panamerican Beverages | 7.25% due 7/1/2009 | $94,000 | $96,102 | 3.1% |
| Chemicals | |||||
| A | E.I. du Pont de Nemours | 5.25% due 12/15/2016 | 100,000 | 94,299 | 3.1% |
| Continued on next page. | |||||
(The accompanying notes are an integral part of these financial statements.)
20 | November 30, 2008 Annual Report
Sextant Core Fund
| Bonds — 45.9% | |||||
| Rating³ | Issuer | Maturity / Coupon | Face Value | Market Value | Percentage of Assets |
| Diversified Financial Services | |||||
| AAA | General Electric Capital | 6.00% due 6/15/2012 | 100,000 | 99,445 | 3.2% |
| Electronics | |||||
| A | Emerson Electric | 5.375% due 10/15/2017 | 100,000 | 95,017 | 3.1% |
| Insurance | |||||
| BBB | Berkley WR | 5.875% due 2/15/2013 | 100,000 | 99,747 | 3.2% |
| AAA | Berkshire Hathaway Financial | 4.625% due 10/15/2013 | 85,000 | 83,022 | 2.7% |
| 182,769 | 5.9% | ||||
| Medical | |||||
| A+ | Genentech | 4.40% due 7/15/2010 | 150,000 | 150,625 | 4.9% |
| Office Equipment | |||||
| BBB | Staples | 7.375% due 10/1/2012 | 90,000 | 81,239 | 2.6% |
| Retail | |||||
| AA | Wal-Mart Stores | 4.50% due 7/1/2015 | 100,000 | 97,343 | 3.2% |
| Telecommunications | |||||
| BBB | Verizon New England | 6.50% due 9/15/2011 | 100,000 | 95,943 | 3.1% |
| Transportation | |||||
| BBB- | CSX | 6.75% due 3/15/2011 | 95,000 | 92,380 | 3.0% |
| U.S. Government | |||||
| AAA | U.S. Treasury Bond | 5.25% due 11/15/2028 | 187,000 | 225,861 | 7.3% |
| AAA | U.S. Treasury Note | 6.00% due 8/15/2009 | 100,000 | 103,602 | 3.4% |
| 329,463 | 10.7% | ||||
| Total bonds | $1,414,625 | 45.9% | |||
| Total investments | (Cost=$3,786,975) | 2,985,857 | 96.9% | ||
| Other assets (net of liabilities) | 95,865 | 3.1% | |||
| Total net assets | $3,081,722 | 100.0% | |||
| ¹Equities are issued by U.S. Domestic companies where no Country is listed. ²Non-income producing ³Ratings shown are as determined by a national bond rating agency or the Adviser. ADS: American Depositary Share | |||||
(The accompanying notes are an integral part of these financial statements.)
22 | November 30, 2008 Annual Report
Sextant Core Fund
| Statement of Assets and Liabilities | ||
| As of November 30, 2008 | ||
| Assets | ||
| Investments in securities, at value (Cost $3,786,975) | $2,985,857 | |
| Cash | 73,366 | |
| Dividends and interest receivable | 27,339 | |
| Receivable for Fund shares sold | 1,153 | |
| Total assets | $3,087,715 | |
| Liabilities | ||
| Accrued expenses | 3,829 | |
| Payable to affiliates | 1,538 | |
| Accrued 12b-1 fees | 626 | |
| Total liabilities | 5,993 | |
| Net assets | $3,081,722 | |
| Analysis of net assets | ||
| Paid-in capital (unlimited shares authorized, without par value) | 3,957,981 | |
| Unrealized net depreciation on investments | (801,118) | |
| Accumulated net realized loss | (75,141) | |
| Net assets applicable to Fund shares outstanding | $3,081,722 | |
| Fund shares outstanding | 386,858 | |
| Net asset value, offering and redemption price per share | $7.97 | |
| Statement of Operations | ||
| For the year ended November 30, 2008 | ||
| Investment income | ||
| Interest income | $72,618 | |
| Dividend income (net of foreign tax of $3,012) | 55,813 | |
| Gross investment income | $128,431 | |
| Expenses | ||
| Investment adviser and administration fee | 28,134 | |
| Distribution fees | 9,435 | |
| Filing and registration fees | 9,145 | |
| Audit fees | 3,505 | |
| Printing and postage | 1,923 | |
| Chief Compliance Officer expenses | 1,863 | |
| Trustee fees | 1,166 | |
| Insurance | 944 | |
| Legal fees | 807 | |
| Other expenses | 532 | |
| Custodian fees | 464 | |
| Total gross expenses | 57,918 | |
| Less custodian fee credits | (464) | |
| Net expenses | 57,454 | |
| Net investment income | 70,977 | |
| Net realized loss on portfolio investments | ||
| Proceeds from sales | 571,999 | |
| Less cost of securities sold (based on identified cost) | 647,140 | |
| Net realized loss on investments | (75,141) | |
| Net unrealized gain on portfolio investments | ||
| End of year | (801,118) | |
| Beginning of year | 193,643 | |
| Net decrease in unrealized appreciation | (994,761) | |
| Net realized and unrealized loss on portfolio investments | (1,069,902) | |
| Net decrease in net assets resulting from operations | $(998,925) | |
(The accompanying notes are an integral part of these financial statements.)
November 30, 2008 Annual Report | 23
Sextant Core Fund
| Statement of Changes in Net Assets | Year ended Nov. 30, 2008 | Period ended Nov. 30, 2007 |
| Increase (decrease) in net assets | ||
| From operations | ||
| Net investment income | $70,977 | $44,650 |
| Net realized gain (loss) on investments | (75,141) | 552 |
| Net increase (decrease) in unrealized appreciation | (994,761) | 193,643 |
| Net increase (decrease) in net assets | (998,925) | 238,845 |
| Dividends to shareowners from | ||
| Net investment income | (70,977) | (45,202) |
| Distribution in excess of net investment income | - | (6,089) |
| Return of capital | (788) | - |
| (71,765) | (51,291) | |
| From Fund share transactions | ||
| Proceeds from sales of shares | 616,684 | 3,687,786 |
| Value of shares issued in reinvestment of dividends | 71,765 | 51,291 |
| Early redemption fees retained | - | 0¹ |
| Cost of shares redeemed | (443,301) | (19,367) |
| Net increase in net assets | 245,148 | 3,719,710 |
| Total increase (decrease) in net assets | (825,542) | $3,907,264 |
| Net assets | ||
| Beginning of year | 3,907,264 | 0 |
| End of year | $3,081,722 | $3,907,264 |
| Shares of the Fund sold and redeemed | ||
| Number of shares sold | 64,423 | 363,080 |
| Number of shares issued in reinvestment of dividends | 9,004 | 4,807 |
| Number of shares redeemed | (52,638) | (1,818) |
| Net increase in number of shares outstanding | 20,789 | 366,069 |
| ¹Amount is less than $1.00 | ||
| Financial Highlights | Year ended November 30, | Period ended |
| Selected data per share of capital stock outstanding throughout the year: | 2008 | Nov. 30, 20074 |
| Net asset value at beginning of year | $10.67 | $10.00 |
| Income from investment operations | ||
| Net investment income | 0.19 | 0.12 |
| Net gain (loss) on securities (both realized and unrealized) | (2.70) | 0.69 |
| Total from investment operations | (2.51) | 0.81 |
| Less distributions | ||
| Dividends (from net investment income) | (0.19) | (0.12) |
| Distribution in excess (from net investment income) | - | (0.02) |
| Return of capital | 0.00¹ | - |
| Total distributions | (0.19) | (0.14) |
| Paid-in capital from early redemption fees | - | 0.00¹ |
| Net asset value at end of year | $7.97 | $10.67 |
| Total return | (23.52)% | 8.12%² |
| Ratios / supplemental data | ||
| Net assets ($000), end of year | $3,082 | $3,907 |
| Ratio of expenses to average net assets | ||
| Before custodian fee credits | 1.54% | 1.35%³ |
| After custodian fee credits | 1.53% | 1.21%³ |
| Ratio of net investment income after custodian fee credits to average net assets | 1.89% | 2.08%³ |
| Portfolio turnover rate | 16% | 7%² |
| ¹Amount is less than $0.01 ²Since inception March 30, 2007; not annualized ³Annualized 4Fund commenced operations March 30, 2007 | ||
(The accompanying notes are an integral part of these financial statements.)
24 | November 30, 2008 Annual Report
Sextant Growth Fund
Performance Summary (unaudited)
| Average Annual Returns as of November 30, 2008 | ||||
| 1 Year | 5 Years | 10 Years | Expense Ratio¹ | |
| Sextant Growth Fund | -32.58% | 1.81% | 5.52% | 1.32% |
| S&P 500 Index | -38.09% | -1.39% | -0.93% | N/A |
Growth of $10,000
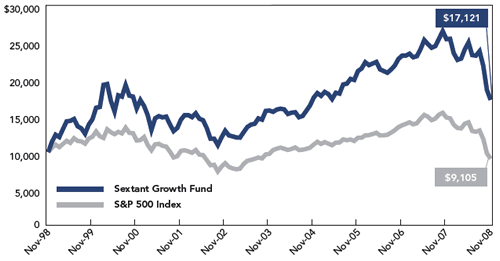 | Comparison of any mutual fund to a market index must be made bearing in mind that the index is unmanaged, and expense-free. Conversely, the fund will (1) be actively managed, (2) have an objective other than mirroring the index, such as limiting risk, (3) bear transaction and other costs, (4) stand ready to buy and sell its securities to shareowners on a daily basis, and (5) provide a wide range of services. The graph compares $10,000 invested in the Fund on November 30, 1998 to a similar amount invested in the index, which reflects the types of securities in which the Fund invests. The graph shows that an investment in the Fund would have risen to $17,121 versus $9,105 in the index. |
| Past performance does not guarantee future results. The "Growth of $10,000" graph and "Average Annual Returns" performance table assume the reinvestment of dividends and capital gains. They do not reflect the deduction of taxes that a shareowner might pay on fund distributions or the redemption of fund shares, nor do they reflect the potential deduction of a 2% redemption fee on shares held less than 30 calendar days. ¹ By regulation, the expense ratio for the Fund shown in this table is as of the Fund's most recent prospectus dated March 28, 2008, incorporating results for the 2007 fiscal year and differs from expense ratios shown elsewhere in this report as they represent different fiscal periods. | |
Fund Objective
The objective of the Growth Fund is long-term capital growth.
| Industry Allocation |
 |
November 30, 2008 Annual Report | 25
Sextant Growth Fund
Discussion of Fund Performance (unaudited)
Fiscal Year 2008
For the fiscal year ended November 30, 2008, the Sextant Growth Fund lost 32.58%. This compares favorably with the growth-oriented NASDAQ Composite Index's 41.77% loss and the broader S&P 500 Index's 38.09% drubbing. Our steady results attracted new investments, yet Fund assets still declined 24.00%. The Fund's annual expense ratio declined to 1.24%, reflecting the spreading of the Trust's fixed expenses over higher assets.
Factors Affecting Past Performance
In 2008, the U.S. economy fell into a major recession. The worst financial crisis in generations bankrupted major firms, and the grossly extended real estate and construction markets tumbled further across the land. In a frightened world, the U.S. dollar appreciated sharply during 2008, making it more difficult for domestic exporters.
The accompanying tables and graphs show the Fund's industry allocation and largest holdings. We benefited from large temporary cash and equivalents holdings. Computers and medical are our largest industries. Slowing economic activity meant commodity prices tumbled, punishing our cyclical and resource-based issues. Banks and financials did the worst, but we mostly avoided this disaster.
The Sextant Growth Fund seeks long-term growth through investment in common stocks of U.S. domiciled companies.It generally follows a value investment approach, favoring companies with good fundamentals and relatively low price/earnings and price/book ratios. Apple and Hewlett-Packard are our largest holdings in the computer sector. Barr Pharmaceticals was our largest medical holding, whose shareowners benefited from its acquistion by Teva late in the year. Charles Schwab is our largest financial holding, which held steady in a year when all five of the largest U.S. investment banks disappeared forever.
Income is not a major consideration in portfolio selection, but we favor companies that institute or increase dividend payouts. Our low portfolio turnover meant we realized few market gains, minimizing the taxable capital gains distribution at year-end.
Looking Forward
The world economy is in a deep recession, caused by 2008's financial collapse. Money for investments and purchases is scarce. Default rates on low quality debt are skyrocketing. Ponzi schemes are being exposed as new investors cannot be found. Private equity and venture capital firms are on the ropes, and their leveraged hedge funds show their basic design deficiencies. Voters sent the sitting political party to the sidelines, opting for "change" without much definition of what that means. New or old, central governments are expanding spending and pumping out stimuli. Local governments, without their own printing presses, are forced to cut expenditures as revenues decline sharply. The U.S. federal government is spending with the wildest abandon, and inflation will accelerate as a result.
Burdened by decades of overspending and borrowing, the financial systems in most countries will take years to recover. Commodity output and prices will stay weak, as the world economy stagnates. Interest rates, which fell to almost zero in 2008, will rise slowly once recovery becomes established. Europe, with its many cultures, is being pulled at the edges.
Our analysts increasingly travel the globe, believing that first-hand observations are needed when conditions are so murky. We continue our focus on larger companies, which tend to be more stable over time. Technology and health company investments should be profitable.
The volatility, risks, and returns of the stock market will continue. The poor stock market performances of 2000 through 2002 were reversed in 2003 through 2007 as stocks again provided investors with strong investment returns. The market collapse of 2008 can be reversed as well. We have considerable cash in reserve, waiting to invest at more favorable prices later this year. Investors burned from speculation may again return to the markets for quality securities.
A long-term approach is the best opportunity to prosper: For the ten years ending November 30, 2008, the Fund provided a 5.52% annualized total return. While below the averages established over many decades for stock investing, it is superior to the zero returns investors currently receive on cash, short-term equivalents, or money under the mattress.
Management Fee Calculations
The Sextant Growth Fund calculates part of its management fee based on a comparison of the Fund's return to the average return in Morningstar's "Mid-Cap Growth" category. The Fund's 12-month return (-32.58%) was more than four percent above the Morningstar™ category average (-45.15%) at month-end November 30, 2008. Therefore, the maximum performance increase of 0.30% was added to the basic 0.60% annual management fee for the month of December 2008.
| Top Ten Holdings | |
| % of Fund Assets | |
| Apple | 6.1% |
| Barr Pharmaceuticals | 4.0% |
| Charles Schwab | 3.8% |
| Pharmaceutical Product Development | 3.2% |
| FPL Group | 2.8% |
| Trimble Navigation | 2.3% |
| Chubb | 2.1% |
| Amazon.com | 2.1% |
| PepsiCo | 2.1% |
| Hewlett-Packard | 2.0% |
26 | November 30, 2008 Annual Report
Sextant Growth Fund
| Investments | ||||
| Issue | Quantity | Tax Cost | Market Value | Percentage of Assets |
| Banking | ||||
| Frontier Financial | 15,000 | $220,751 | $42,900 | 0.4% |
| Washington Banking | 6,250 | 83,121 | 52,500 | 0.4% |
| 303,872 | 95,400 | 0.8% | ||
| Building | ||||
| KB Home | 5,000 | 302,781 | 58,150 | 0.5% |
| Lowe's Companies | 6,500 | 109,802 | 134,290 | 1.1% |
| Weyerhaeuser | 4,200 | 246,845 | 158,004 | 1.3% |
| 659,428 | 350,444 | 2.9% | ||
| Computers | ||||
| 3Com¹ | 30,000 | 167,836 | 60,300 | 0.5% |
| Adobe Systems¹ | 7,600 | 39,971 | 176,016 | 1.5% |
| Apple¹ | 8,000 | 67,473 | 741,360 | 6.1% |
| Hewlett-Packard | 7,000 | 157,040 | 246,960 | 2.0% |
| Intuit¹ | 9,000 | 197,624 | 199,440 | 1.6% |
| Oracle¹ | 15,000 | 115,139 | 241,350 | 2.0% |
| 745,083 | 1,665,426 | 13.7% | ||
| Diversified Operations | ||||
| Honeywell International | 3,500 | 131,966 | 97,510 | 0.8% |
| Raytheon Company | 3,000 | 188,040 | 146,400 | 1.2% |
| 320,006 | 243,910 | 2.0% | ||
| Electronics | ||||
| Advanced Micro Devices¹ | 10,000 | 41,708 | 23,600 | 0.2% |
| Agilent Technologies¹ | 10,000 | 267,568 | 188,300 | 1.6% |
| Harman International Industries | 1,900 | 157,285 | 28,595 | 0.2% |
| Trimble Navigation¹ | 14,000 | 202,081 | 285,040 | 2.3% |
| 668,642 | 525,535 | 4.3% | ||
| Energy | ||||
| Devon Energy | 3,000 | 185,020 | 217,020 | 1.8% |
| Noble | 8,000 | 125,240 | 214,320 | 1.7% |
| Spectra Energy | 3,000 | 84,750 | 48,780 | 0.4% |
| 395,010 | 480,120 | 3.9% | ||
| Finance | ||||
| Charles Schwab | 25,000 | 79,726 | 458,250 | 3.8% |
| Food Production | ||||
| Dr. Pepper Snapple Group¹ | 8,000 | 199,365 | 129,120 | 1.1% |
| PepsiCo | 4,500 | 248,326 | 255,150 | 2.1% |
| 447,691 | 384,270 | 3.2% | ||
| Hotels & Motels | ||||
| Red Lion Hotels¹ | 21,000 | 150,354 | 54,600 | 0.4% |
| Insurance | ||||
| Chubb | 5,000 | 224,705 | 256,800 | 2.1% |
| Continued on next page. | ||||
(The accompanying notes are an integral part of these financial statements.)
27 | November 30, 2008 Annual Report
Sextant Growth Fund
| Investments | ||||
| Issue | Quantity | Tax Cost | Market Value | Percentage of Assets |
| Medical | ||||
| Abbott Laboratories | 4,000 | $171,114 | $209,560 | 1.7% |
| Amgen¹ | 3,700 | 111,703 | 205,498 | 1.7% |
| Barr Pharmaceuticals¹ | 7,500 | 273,747 | 490,425 | 4.0% |
| Eli Lilly | 3,500 | 249,361 | 119,525 | 1.0% |
| Ligand Pharmaceuticals¹ | 10,000 | 112,072 | 20,600 | 0.2% |
| Pharmaceutical Product Development | 15,000 | 67,174 | 395,100 | 3.2% |
| VCA Antech¹ | 8,000 | 209,048 | 152,400 | 1.3% |
| 1,194,219 | 1,593,108 | 13.1% | ||
| Metal Ores | ||||
| Alcoa | 6,000 | 189,042 | 64,560 | 0.5% |
| Freeport-McMoRan Copper & Gold Class B | 3,300 | 236,879 | 79,167 | 0.7% |
| 425,921 | 143,727 | 1.2% | ||
| Publishing | ||||
| John Wiley & Sons Class A | 5,000 | 134,777 | 179,800 | 1.5% |
| Retail | ||||
| Amazon.com¹ | 6,000 | 260,090 | 256,200 | 2.1% |
| Bed Bath & Beyond¹ | 5,000 | 176,186 | 101,450 | 0.8% |
| Best Buy | 4,000 | 223,149 | 82,840 | 0.7% |
| Staples | 6,000 | 144,720 | 104,160 | 0.9% |
| 804,145 | 544,650 | 4.5% | ||
| Steel | ||||
| Nucor | 4,000 | 189,851 | 142,720 | 1.2% |
| Tools | ||||
| Lincoln Electric Holdings | 4,000 | 180,617 | 182,760 | 1.5% |
| Regal-Beloit | 5,500 | 173,846 | 185,020 | 1.5% |
| 354,463 | 367,780 | 3.0% | ||
| Transportation | ||||
| Norfolk Southern | 4,500 | 185,235 | 222,615 | 1.8% |
| UAL | 15,000 | 248,965 | 168,750 | 1.4% |
| United Parcel Service Class B | 2,500 | 189,469 | 144,000 | 1.2% |
| 623,669 | 535,365 | 4.4% | ||
| Utilities | ||||
| Duke Energy | 10,000 | 172,211 | 155,600 | 1.3% |
| FPL Group | 7,000 | 244,408 | 341,320 | 2.8% |
| IDACORP | 6,000 | 159,539 | 182,400 | 1.5% |
| Sempra Energy | 3,000 | 116,395 | 140,010 | 1.1% |
| 692,553 | 819,330 | 6.7% | ||
| Total investments | $8,414,115 | 8,841,235 | 72.7% | |
| Other assets (net of liabilities) | 3,316,169 | 27.3% | ||
| Total net assets | $12,157,404 | 100% | ||
| ¹Non-income producing | ||||
(The accompanying notes are an integral part of these financial statements.)
28 | November 30, 2008 Annual Report
Sextant Growth Fund
| Statement of Assets & Liabilities | ||
| As of November 30, 2008 | ||
| Assets | ||
| Investments in securities, at value (Cost $8,414,115) | $8,841,235 | |
| Cash | 3,374,927 | |
| Dividends receivable | 15,978 | |
| Receivable for Fund shares sold | 2,429 | |
| Insurance reserve premium | 1,214 | |
| Total assets | $12,235,783 | |
| Liabilities | ||
| Payable for Fund shares redeemed | 58,267 | |
| Accrued expenses | 11,543 | |
| Payable to affiliates | 5,827 | |
| Accrued distribution fee | 2,414 | |
| Distributions payable | 328 | |
| Total liabilities | 78,379 | |
| Net assets | $12,157,404 | |
| Analysis of net assets | ||
| Paid-in capital (unlimited shares authorized, without par value) | 11,833,777 | |
| Unrealized net appreciation on investments | 427,120 | |
| Accumulated net realized loss | (108,384) | |
| Undistributed net investment income | 4,891 | |
| Net assets applicable to Fund shares outstanding | $12,157,404 | |
| Fund shares outstanding | 903,848 | |
| Net asset value, offering and redemption price per share | $13.45 | |
| Statement of Operations | ||
| For the year ended November 30, 2008 | ||
| Investment income | ||
| Dividend income | $171,070 | |
| Interest income | $36,586 | |
| Gross investment income | $207,656 | |
| Expenses | ||
| Investment adviser and administration fees | 93,090 | |
| Distribution fees | 36,133 | |
| Filing and registration fees | 18,119 | |
| Audit fees | 6,952 | |
| Chief Compliance Officer expenses | 6,783 | |
| Printing and postage | 6,205 | |
| Insurance | 6,043 | |
| Trustee fees | 4,259 | |
| Custodian fees | 1,822 | |
| Legal fees | 790 | |
| Other expenses | 358 | |
| Total gross expenses | 180,554 | |
| Less custodian fee credits | (1,822) | |
| Net expenses | 178,732 | |
| Net investment income | 28,924 | |
| Net realized loss on portfolio investments | ||
| Proceeds from sales | 12,193,012 | |
| Less cost of securities sold (based on identified cost) | 12,301,489 | |
| Realized net loss on securities sold | (108,477) | |
| Litigation gain | 93 | |
| Net realized loss on investments | (108,384) | |
| Net unrealized gain on portfolio investments | ||
| End of year | 427,120 | |
| Beginning of year | 5,633,409 | |
| Net decrease in unrealized appreciation | (5,206,289) | |
| Net realized and unrealized loss on portfolio invesments | (5,314,673) | |
| Net decrease in net assets resulting from operations | $(5,285,749) | |
(The accompanying notes are an integral part of these financial statements.)
November 30, 2008 Annual Report | 29
Sextant Growth Fund
| Statement of Changes in Net Assets | Year ended Nov. 30, 2008 | Year ended Nov. 30, 2007 |
| Increase (decrease) in net assets | ||
| From operations | ||
| Net investment income | $28,924 | $12,667 |
| Net realized gain (loss) on investments | (108,384) | 371,470 |
| Net increase (decrease) in unrealized appreciation | (5,206,289) | 960,510 |
| Net increase (decrease) in net assets | (5,285,749) | 1,344,647 |
| Dividends to shareowners from | ||
| Net investment income | (25,378) | (11,322) |
| Capital gains distributions | (220) | (371,290) |
| (25,598) | (382,612) | |
| From Fund share transactions | ||
| Proceeds from sales of shares | 2,951,558 | 2,922,513 |
| Value of shares issued in reinvestment of dividends | 25,269 | 318,873 |
| Early redemption fees retained | 319 | 440 |
| Cost of shares redeemed | (1,504,638) | (1,935,307) |
| Net increase in net assets | 1,472,508 | 1,306,519 |
| Total increase (decrease) in net assets | $(3,838,839) | $2,268,554 |
| Net assets | ||
| Beginning of year | 15,996,243 | 13,727,689 |
| End of year | $12,157,404 | $15,996,243 |
| Undistributed net investment income | $4,891 | $1,345 |
| Shares of the Fund sold and redeemed | ||
| Number of shares sold | 187,107 | 149,662 |
| Number of shares issued in reinvestment of dividends | 1,879 | 15,952 |
| Number of shares redeemed | (85,198) | (101,152) |
| Net increase in number of shares outstanding | 103,788 | 64,462 |
| Financial Highlights | |||||
| Selected data per share of capital stock outstanding throughout the year: | 2008 | 2007 | 2006 | 2005 | 2004 |
| Net asset value at beginning of year | $19.99 | $18.66 | $17.11 | $14.20 | $12.91 |
| Income from investment operations | |||||
| Net investment income (loss) | 0.04 | 0.01 | (0.02) | (0.02) | 0.01 |
| Net gains (losses) on securities (both realized and unrealized) | (6.55) | 1.80 | 1.74 | 2.96 | 1.45 |
| Total from investment operations | (6.51) | 1.81 | 1.72 | 2.94 | 1.46 |
| Less distributions | |||||
| Dividends (from net investment income) | (0.03) | (0.01) | - | (0.00)² | (0.01) |
| Distributions (from capital gains) | (0.00)² | (0.47) | (0.17) | (0.03) | (0.16) |
| Total distributions | (0.03) | (0.48) | (0.17) | (0.03) | (0.17) |
| Paid-in capital from early redemption fees¹ | 0.00² | 0.00² | 0.00² | 0.00² | - |
| Net asset value at end of year | $13.45 | $19.99 | $18.66 | $17.11 | $14.20 |
| Total return | (32.58)% | 9.74% | 10.06% | 20.76% | 11.35% |
| Ratios/supplemental data | |||||
| Net assets ($000), end of year | $12,157 | $15,996 | $13,728 | $9,006 | $5,331 |
| Ratio of expenses to average net assets | |||||
| Before custodian fee credits | 1.25% | 1.32% | 1.25% | 1.28% | 0.80% |
| After custodian fee credits | 1.24% | 1.30% | 1.21% | 1.24% | 0.78% |
| Ratio of net investment income (loss) after custodian fee credits to average net assets | 0.20% | 0.09 | (0.12)% | (0.17)% | 0.12% |
| Portfolio turnover rate | 2% | 3% | 11% | 4% | 8% |
| ¹Early redemption fee adopted March 29, 2005 | ²Amount is less than $0.01 | ||||
(The accompanying notes are an integral part of these financial statements.)
30 | November 30, 2008 Annual Report
Sextant International Fund
Performance Summary (unaudited)
| Average Annual Returns as of November 30, 2008 | ||||
| 1 Year | 5 Years | 10 Years | Expense Ratio¹ | |
| Sextant International Fund | -29.56% | 8.01% | 6.56% | 1.50% |
| AMEX International Index | -42.97% | 4.64% | 1.93% | N/A |
Growth of $10,000
 | Comparison of any mutual fund to a market index must be made bearing in mind that the Index is unmanaged, and expense-free. Conversely, the fund will (1) be actively managed, (2) have an objective other than mirroring the index, such as limiting risk, (3) bear transaction and other costs, (4) stand ready to buy and sell its securities to shareowners on a daily basis, and (5) provide a wide range of services. The graph compares $10,000 invested in the Fund on November 30, 1998 to a similar amount invested in the index, which reflects the types of securities in which the Fund invests. The graph shows that an investment in the Fund would have risen to $18,881 versus $9,519 in the index. |
| Past performance does not guarantee future results. The "Growth of $10,000" graph and "Average Annual Returns" performance table assume the reinvestment of dividends and capital gains. They do not reflect the deduction of taxes that a shareowner might pay on fund distributions or the redemption of fund shares, nor do they reflect the potential deduction of a 2% redemption fee on shares held less than 30 calendar days. ¹ By regulation, the expense ratio for the Fund shown in this table is as of the Fund's most recent prospectus dated March 28, 2008, incorporating results for the 2007 fiscal year and differs from expense ratios shown elsewhere in this report as they represent different fiscal periods. | |
Fund Objective
The objective of the International Fund is long-term capital growth.
| Industry Allocation |
 |
November 30, 2008 Annual Report | 31
Sextant International Fund
Discussion of Fund Performance (unaudited)
Fiscal Year 2008
For the fiscal year ended November 30, 2008 — one of the worst periods in the history of international investing — the Sextant International Fund lost 29.56%. The benchmark AMEX International Index did considerably worse, declining 43.04%. These results actually attracted new investors, and total Fund assets jumped 55.16%. The spreading of fixed expenses over higher assets meant the Fund's annual expense ratio decreased to 1.42%. The Fund paid a year-end income dividend of 2.8¢ per share, similar to last year's 2.9¢ income dividend.
Factors Affecting Past Performance
In a frightened world, the U.S. dollar appreciated sharply during 2008, reducing the returns that foreign investments provided U.S. investors. Fortunately, we held large amounts in temporary U.S. cash and equivalent positions which protected the Fund. The Fund is normally diversified across industries and countries, generally holding larger and more established companies that are more stable in difficult times.
Our portfolio is most heavily invested in Canada (hurt by resource and energy declines) and the UK (hurt by financial disasters). Slowing economic activity meant commodity prices tumbled, punishing our cyclical and resource-based issues. The accompanying tables and graphs show the industry allocation and our largest holdings. Other than cash and equivalents, our holdings in any one issue are small. Telecommunications is now our largest industry; resources and energy have declined so that they are of little importance. Banks and financials did the worst, and the world banking system continues in crisis.
Looking Forward
The world is in a deep recession, caused by a financial collapse in many countries. Money for investments and purchases is scarce. To react, governments are expanding spending and pumping out stimuli. Inflation will accelerate as a result. Foreign economies, especially emerging markets, seem to be suffering the most.
Sextant International Fund is broadly diversified in companies headquartered outside the United States. Many have worldwide operations, including in the U.S. Burdened by decades of overspending and borrowing, the financial systems in most countries will take years to recover. Commodity output and prices will stay weak, as the world stagnates. Interest rates, which fell to almost zero in 2008, will rise slowly once recovery becomes established. Europe, with its many cultures, is being pulled at the edges. Countries outside the U.S. generally have lower corporate taxes, which increases earnings and stock values.
Our analysts increasingly travel the globe, believing that first-hand observations are needed when conditions are so murky. We continue to focus on larger companies, which tend to be more stable over time. Technology and health company investments should be profitable.
Management Fee Calculations
The Sextant International Fund calculates part of its management fee based on a comparison of the Fund's return to the average return of the Morningstar™ "Foreign Large Blend" category. At November 30, 2008, the average one-year return for this category was -48.59%. Because the Fund's 12-month return (-29.56%) outperformed this average by more than 4% at November 30, 2008, the maximum performance increase of 0.30% was added to the basic 0.60% annual management fee for the month of December 2008.
| Top Ten Holdings | |
| % of Fund Assets | |
| U.S. Treasury Bills | 37.2% |
| Infosys ADS | 1.2% |
| Telefónica ADS | 1.1% |
| EnCana | 1.1% |
| China Mobile ADS | 1.1% |
| Copa Holdings | 1.0% |
| CRH ADS | 1.0% |
| GlaxoSmithKline ADR | 1.0% |
| BCE | 0.9% |
| LAN Airlines ADS | 0.9% |
| Countries | |
| % of Fund Assets | |
| United States | 37.2% |
| Canada | 6.3% |
| United Kingdom | 3.4% |
| Japan | 2.9% |
| France | 2.3% |
| Mexico | 2.1% |
| India | 1.9% |
| China | 1.7% |
| Chile | 1.5% |
| Spain | 1.4% |
| Ireland | 1.0% |
| Panama | 1.0% |
| South Korea | 1.0% |
| Other countries <1% | 6.1% |
| Other assets | 30.2% |
32 | November 30, 2008 Annual Report
Sextant International Fund
| Investments | |||||
| Equities - 32.6% | |||||
| Issue | Number of Shares | Tax Cost | Market Value | Country | Percentage of Assets |
| Automotive | |||||
| Nissan Motor ADS | 5,500 | $106,770 | $36,740 | Japan | 0.2% |
| Banking | |||||
| Australia & New Zealand Banking Group ADS | 5,000 | 84,500 | 48,189 | Australia | 0.2% |
| AXA ADS | 7,000 | 172,966 | 132,370 | France | 0.6% |
| Mitsubishi UFJ Financial Group ADR | 20,000 | 205,313 | 109,600 | Japan | 0.5% |
| Nomura Holdings ADR | 10,000 | 187,836 | 72,800 | Japan | 0.3% |
| Toronto-Dominion Bank | 4,000 | 147,258 | 141,080 | Canada | 0.7% |
| 797,873 | 504,039 | 2.3% | |||
| Building | |||||
| CRH ADS | 10,000 | 204,050 | 220,500 | Ireland | 1.0% |
| Ritchie Bros. Auctioneers | 9,000 | 171,741 | 168,030 | Canada | 0.8% |
| 375,791 | 388,530 | 1.8% | |||
| Business Services | |||||
| 51job ADR1 | 8,000 | 117,920 | 56,320 | Cayman Islands | 0.3% |
| Chemicals | |||||
| BASF ADS | 3,400 | 120,102 | 108,375 | Germany | 0.5% |
| Potash Corp. of Saskatchewan | 3,000 | 34,234 | 184,920 | Canada | 0.9% |
| 154,336 | 293,295 | 1.4% | |||
| Computers | |||||
| Dassault Systems ADR | 3,000 | 146,427 | 115,686 | France | 0.5% |
| Infosys ADS | 10,000 | 287,619 | 251,500 | India | 1.2% |
| Satyam Computer Services ADR | 12,000 | 194,151 | 152,760 | India | 0.7% |
| 628,197 | 519,946 | 2.4% | |||
| Electronics | |||||
| Sony ADS | 10,000 | 356,340 | 193,800 | Japan | 0.9% |
| Energy | |||||
| EnCana | 5,000 | 216,089 | 234,050 | Canada | 1.1% |
| Petro-Canada | 3,200 | 160,840 | 80,160 | Canada | 0.4% |
| Repsol YPF ADS | 3,500 | 87,962 | 67,690 | Spain | 0.3% |
| StatoilHydro ADS | 5,173 | 80,769 | 88,045 | Norway | 0.4% |
| Total ADS | 2,600 | 121,935 | 137,150 | France | 0.6% |
| 667,595 | 607,095 | 2.8% | |||
| Food Production | |||||
| Cadbury Schweppes ADS | 5,000 | 213,673 | 169,950 | United Kingdom | 0.8% |
| Coca-Cola Femsa ADS | 4,300 | 82,844 | 149,640 | Mexico | 0.7% |
| 296,517 | 319,590 | 1.5% | |||
| Hotels & Motels | |||||
| Orient-Express Hotels Class A | 21,500 | 274,420 | 147,275 | Bermuda | 0.7% |
| Continued on next page. | |||||
(The accompanying notes are an integral part of these financial statements.)
November 30, 2008 Annual Report | 33
Sextant International Fund
| Investments | |||||
| Equities - 32.6% | |||||
| Issue | Number of Shares | Tax Cost | Market Value | Country | Percentage of Assets |
| Insurance | |||||
| Aegon | 15,559 | $149,627 | $72,349 | Netherlands | 0.3% |
| ING Groep ADS | 10,000 | 223,643 | 83,800 | Netherlands | 0.4% |
| 373,270 | 156,149 | 0.7% | |||
| Machinery | |||||
| Nidec ADR | 5,000 | 89,122 | 61,900 | Japan | 0.3% |
| Medical | |||||
| American Oriental Bioengineering¹ | 23,000 | 112,688 | 130,410 | China | 0.6% |
| GlaxoSmithKline ADS | 6,000 | 265,637 | 206,640 | United Kingdom | 1.0% |
| Novartis ADR | 3,000 | 151,392 | 140,760 | Switzerland | 0.6% |
| Shire ADR | 2,000 | 92,860 | 82,000 | United Kingdom | 0.4% |
| 622,577 | 559,810 | 2.6% | |||
| Metal Ores | |||||
| Anglo American ADR | 6,825 | 138,371 | 81,422 | United Kingdom | 0.4% |
| Companhia Vale do Rio Doce ADR | 10,000 | 200,706 | 119,400 | Brazil | 0.6% |
| Rio Tinto ADS | 750 | 74,825 | 75,000 | United Kingdom | 0.3% |
| Teck Cominco | 25,000 | 123,500 | 123,000 | Canada | 0.6% |
| Tenaris ADR | 2,500 | 95,290 | 52,575 | Luxembourg | 0.2% |
| 632,692 | 451,397 | 2.1% | |||
| Office Equipment | |||||
| Canon ADS | 5,300 | 200,106 | 157,728 | Japan | 0.7% |
| Paper & Paper Products | |||||
| Metso ADS | 2,100 | 22,802 | 25,155 | Finland | 0.1% |
| UPM-Kymmene Oyj ADS | 3,500 | 64,384 | 50,185 | Finland | 0.2% |
| Votorantim Celulose e Papel ADS | 8,000 | 102,000 | 44,480 | Brazil | 0.2% |
| 189,186 | 119,820 | 0.5% | |||
| Publishing | |||||
| Pearson ADS | 10,000 | 113,258 | 96,000 | United Kingdom | 0.5% |
| Telecommunications | |||||
| América Móvil ADS | 6,000 | 29,725 | 180,000 | Mexico | 0.8% |
| BCE | 10,000 | 249,724 | 197,900 | Canada | 0.9% |
| China Mobile ADS | 5,000 | 177,303 | 229,150 | China | 1.1% |
| PT Indosat Tbk. ADR | 2,500 | 64,962 | 53,750 | Indonesia | 0.3% |
| SK Telecom ADR | 8,000 | 167,308 | 129,680 | South Korea | 0.6% |
| Telcom Corp. New Zealand ADS | 10,000 | 127,639 | 67,500 | New Zealand | 0.3% |
| Telefónica ADS | 4,000 | 224,373 | 244,160 | Spain | 1.1% |
| Teléfonos de México ADS Class L | 5,000 | 44,237 | 86,800 | Mexico | 0.4% |
| Telemex International | 5,000 | 63,233 | 48,450 | Mexico | 0.2% |
| Telus | 3,000 | 113,049 | 86,280 | Canada | 0.4% |
| Turkcell Iletisim Hizmetleri ADR | 12,000 | 136,800 | 165,360 | Turkey | 0.8% |
| 1,398,353 | 1,489,030 | 6.9% | |||
| Continued on next page. | |||||
(The accompanying notes are an integral part of these financial statements.)
34 | November 30, 2008 Annual Report
Sextant International Fund
| Investments | |||||
| Equities - 32.6% | |||||
| Issue | Number of Shares | Tax Cost | Market Value | Country | Percentage of Assets |
| Transportation | |||||
| Air France-KLM ADR | 10,000 | $333,728 | $129,428 | France | 0.6% |
| Canadian Pacific Railway | 3,200 | 109,246 | 103,040 | Canada | 0.5% |
| Copa Holdings | 10,000 | 344,980 | 221,700 | Panama | 1.0% |
| LAN Airlines ADS | 23,000 | 74,113 | 195,500 | Chile | 0.9% |
| 862,067 | 649,668 | 3.0% | |||
| Utilities | |||||
| Enersis ADS | 9,000 | 97,125 | 117,540 | Chile | 0.6% |
| Korea Electric Power ADS | 10,000 | 189,061 | 93,000 | South Korea | 0.4% |
| 286,186 | 210,540 | 1.0% | |||
| Total equities | 8,542,576 | 7,018,672 | 32.6% | ||
| Bonds - 37.2% | Face Value | Tax Cost | Market Value | Percentage of Assets | |
| U.S. Government | |||||
| U.S. Treasury Bill | 2,000,000 | 1,999,498 | 1,999,471 | 9.3% | |
| U.S. Treasury Bill | 4,000,000 | 3,999,295 | 3,999,240 | 18.6% | |
| U.S. Treasury Bill | 2,000,000 | 1,998,170 | 1,997,870 | 9.3% | |
| 7,996,963 | 7,996,581 | 37.2% | |||
| Total investments | $16,539,539 | 15,015,253 | 69.8% | ||
| Other assets (net of liabilities) | 6,481,371 | 30.2% | |||
| Total net assets | $21,496,624 | 100.0% | |||
| ¹Non-income producing ADS: American Depositary Share | |||||
(The accompanying notes are an integral part of these financial statements.)
Novmber 30, 2008 Annual Report | 35
Sextant International Fund
| Statement of Assets and Liabilities | ||
| As of November 30, 2008 | ||
| Assets | ||
| Investments in securities, at value (Cost $16,539,539) | $15,015,253 | |
| Cash | 6,399,182 | |
| Receivable for securities sold | 193,081 | |
| Receivable for Fund shares sold | 103,301 | |
| Dividends and interest receivable | 17,517 | |
| Total assets | $21,728,334 | |
| Liabilities | ||
| Payable for securities purchased | 163,890 | |
| Payable for Fund shares redeemed | 43,673 | |
| Accrued expenses | 10,549 | |
| Payable to affiliates | 9,399 | |
| Accrued distribution fee | 3,954 | |
| Distributions payable | 245 | |
| Total liabilities | 231,710 | |
| Net assets | $21,496,624 | |
| Analysis of net assets | ||
| Paid-in capital (unlimited shares authorized, without par value) | 23,053,748 | |
| Undistributed net investment income | 18,238 | |
| Accumulated net loss on investments | (51,076) | |
| Unrealized net depreciation on investments | (1,524,286) | |
| Net assets applicable to Fund shares outstanding | $21,496,624 | |
| Fund shares outstanding | 1,898,566 | |
| Net asset value, offering and redemption price per share | $11.32 | |
| Statement of Operations | ||
| For the year ended November 30, 2008 | ||
| Investment income | ||
| Dividend income (net foreign tax of $37,743) | $220,121 | |
| Interest income | 59,132 | |
| Other income | 166 | |
| Gross investment income | $279,419 | |
| Expenses | ||
| Investment adviser and administration fee | 130,024 | |
| Distribution fees | 38,477 | |
| Filing and registration fees | 18,226 | |
| Audit fees | 8,084 | |
| Chief Compliance Officer expenses | 6,773 | |
| Insurance | 5,149 | |
| Printing and postage | 5,035 | |
| Other expenses | 3,855 | |
| Legal fees | 2,623 | |
| Custodian fees | 1,727 | |
| Total gross expenses | 219,973 | |
| Less custodian fee credits | (1,727) | |
| Net expenses | 218,246 | |
| Net investment income | 61,173 | |
| Net realized loss on portfolio investments | ||
| Proceeds from sales | 23,962,073 | |
| Less cost of securities sold (based on identified cost) | 24,013,149 | |
| Net realized loss on investments | (51,076) | |
| Net unrealized gain on portfolio investments | ||
| End of year | (1,524,286) | |
| Beginning of year | 4,293,853 | |
| Net decrease in unrealized appreciation | (5,818,139) | |
| Net realized and unrealized loss on portfolio investments | (5,869,215) | |
| Net decrease in net assets resulting from operations | $(5,808,042) | |
(The accompanying notes are an integral part of these financial statements.)
36 | November 30, 20008 Annual Report
Sextant International Fund
| Statement of Changes in Net Assets | Year ended Nov. 30, 2008 | Year ended Nov. 30, 2007 |
| Increase in net assets | ||
| From operations | ||
| Net investment income | $61,173 | $34,196 |
| Net realized gain (loss) on investments | (51,076) | 359,039 |
| Net increase (decrease) in unrealized appreciation | (5,818,139) | 1,763,865 |
| Net increase (decrease) in net assets from operations | (5,808,042) | 2,157,100 |
| Dividends to shareowners from | ||
| Net investment income | (52,882) | (24,388) |
| Capital gain distributions | - | (327,986) |
| (52,882) | (352,374) | |
| From Fund share transactions | ||
| Proceeds from sales of shares | 15,921,550 | 3,873,894 |
| Value of shares issued in reinvestment of dividends | 52,600 | 295,791 |
| Early redemption fees retained | 3,546 | 87 |
| Cost of shares redeemed | (2,474,607) | (1,386,536) |
| Net increase in net assets | 13,503,089 | 2,783,236 |
| Total increase in net assets | $7,642,165 | $4,587,962 |
| Net assets | ||
| Beginning of year | 13,854,459 | 9,266,497 |
| End of year | $21,496,624 | $13,854,459 |
| Undistributed net investment income | 18,238 | 9,947 |
| Shares of the Fund sold and redeemed | ||
| Number of shares sold | 1,224,502 | 252,965 |
| Number of shares issued in reinvestment of dividends | 4,647 | 18,361 |
| Number of shares redeemed | (190,534) | (94,752) |
| Net increase in number of shares outstanding | 1,038,615 | 176,574 |
| Financial Highlights | |||||
| Selected data per share of capital stock outstanding throughout the year: | 2008 | 2007 | 2006 | 2005 | 2004 |
| Net asset value at beginning of year | $16.11 | $13.56 | $11.22 | $9.40 | $8.05 |
| Income from investment operations | |||||
| Net investment income | 0.03 | 0.04 | 0.11 | 0.05 | 0.03 |
| Net gains (losses) on securities (both realized and unrealized) | (4.79) | 2.93 | 2.34 | 1.83 | 1.35 |
| Total from investment operations | (4.76) | 2.97 | 2.45 | 1.88 | 1.38 |
| Less distributions | |||||
| Dividends (from net investment income) | (0.03) | (0.03) | (0.11) | (0.06) | (0.03) |
| Distributions (from capital gains) | - | (0.39) | - | - | - |
| Total distributions | (0.03) | (0.42) | (0.11) | (0.06) | (0.03) |
| Paid-in capital from early redemption fees¹ | 0.00² | 0.00² | 0.00² | 0.00² | - |
| Net asset value at end of year | $11.32 | $16.11 | $13.56 | $11.22 | $9.40 |
| Total return | (29.56)% | 21.90% | 21.85% | 19.95% | 17.11% |
| Ratios / supplemental data | |||||
| Net assets ($000), end of year | $21,497 | $13,854 | $9,266 | $3,671 | $2,053 |
| Ratio of expenses to average net assets | |||||
| Before custodian fee credits | 1.43% | 1.50% | 1.09% | 1.36% | 1.22% |
| After custodian fee credits | 1.42% | 1.47% | 1.02% | 1.25% | 1.10% |
| Ratio of net investment income after custodian fee credits to average net assets | 0.40% | 0.30% | 0.94% | 0.52% | 0.31% |
| Portfolio turnover rate | 10% | 8% | 9% | 5% | 7% |
| ¹Early redemption fee adopted March 29, 2005 | ²Amount is less than $0.01 | ||||
(The accompanying notes are an integral part of these financial statements.)
November 30, 2008 Annual Report | 37
Expenses
All mutual funds have operating expenses. As a Sextant shareowner, you incur ongoing costs, including management fees, distribution (or service) 12b-1 fees, and other fund expenses such as shareowner reports (like this one). Operating expenses, which are deducted from a fund's gross earnings, directly reduce the investment return of a fund. All mutual funds (unlike some other financial investments) only report their results after deduction of operating expenses.
With the Sextant Funds, unlike many other mutual funds, you do not incur sales charges (loads) on purchase payments, reinvested dividends, or other distributions. You do not incur redemption fees, exchange fees, or fees related to Saturna Individual Retirement Accounts. However, to discourage speculation, you may incur a 2% redemption fee for shares held less than 30 calender days. You may incur fees related to extra services requested by you for your account, such as a checkbook to use for redemptions or bank wires. The examples below are intended to help you understand your ongoing costs (in dollars) of investing in the Funds and to compare these costs with the ongoing costs of investing in other mutual funds.
Examples
The following example is based on an investment of $1,000 invested at the beginning of the semi-annual period and held for six months (June 1, 2008 to November 30, 2008).
Actual Expenses
The first line for each Fund provides information about actual account values and expenses. You may use the information in this line, together with the amount you have invested, to estimate the expenses you have paid over the period. Simply divide your account value by $1,000 (for example, a $8,600 account value divided by $1,000 = 8.6), then multiply the result by the number in the first line under the heading entitled "Expenses Paid During Period" to estimate the expenses you paid on your account during this period. The Funds also charge for extra services rendered on request, which you may need to add to determine your total expenses: $10 per checkbook, $25 per domestic bank wire, $35 per international bank wire, $15 per overnight courier delivery.
Hypothetical Example For Comparison Purposes
The second line for each Fund provides information about hypothetical account values and hypothetical expenses based on the Fund's actual expense ratio (based on the last six months) and an assumed rate of return of 5% per year before expenses, which is not the Fund's actual return. The hypothetical account values and expenses may not be used to estimate the actual ending balance or expenses you paid for the year. You may use this information to compare ongoing costs of investing in the Fund and other mutual funds. To do so, compare this 5% hypothetical example with the 5% hypothetical examples that appear in the shareowner reports of other mutual funds. You may wish to add other fees that are not included in the expenses shown in the table, such as IRA fees (there are no fees on Saturna Capital IRAs, ESAs or HSAs), and charges for extra services such as check writing and bank wires.
Please note that the expenses shown in the tables are meant to highlight your ongoing costs only and do not reflect any transactional costs, such as sales charges (loads), redemption fees or exchange fees (note that the Sextant Funds do not have any such transactional costs). Therefore, the "Hypothetical" line of each fund is useful in comparing ongoing costs only, and may not help you determine the relative total costs of owning different funds.
| Beginning Account Value (June 1, 2008) | Ending Account Value (November 30, 2008) | Expenses Paid During Period¹ | Annualized Expense Ratio | |
| Short-Term Bond Fund | ||||
| Actual | $1,000 | $994.00 | $3.79 | 0.76% |
| Hypothetical (5% return before expenses) | $1,000 | $1,021.20 | $3.84 | 0.76% |
| Bond Income Fund | ||||
| Actual | $1,000 | $959.70 | $4.41 | 0.90% |
| Hypothetical (5% return before expenses) | $1,000 | $1,020.50 | $4.55 | 0.90% |
| Core Fund | ||||
| Actual | $1,000 | $774.90 | $7.10 | 1.60% |
| Hypothetical (5% return before expenses) | $1,000 | $1,017.00 | $8.07 | 1.60% |
| Growth Fund | ||||
| Actual | $1,000 | $686.60 | $5.90 | 1.40% |
| Hypothetical (5% return before expenses) | $1,000 | $1,018.00 | $7.06 | 1.40% |
| International Fund | ||||
| Actual | $1,000 | $704.80 | $6.05 | 1.42% |
| Hypothetical (5% return before expenses) | $1,000 | $1,017.90 | $7.16 | 1.42% |
¹ Expenses are equal to the annualized expense ratio indicated above (based on the most recent semi-annual period of June 1, 2008 through November 30, 2008), multiplied by the average account value over the period multiplied by 183/366 (to reflect the one-half year period).
38 | November 30, 2008 Annual Report
Notes To Financial Statements
Note 1 — Organization
Saturna Investment Trust (the "Trust") was established under Washington State Law as a Business Trust on February 20, 1987. The Trust is registered as a no-load, open-end, diversified series management investment company under the Investment Company Act of 1940, as amended. Six portfolio series have been created to date: Sextant Short-Term Bond Fund, Sextant Bond Income Fund, Sextant Core Fund, Sextant Growth Fund, Sextant International Fund (the "Funds"), and Idaho Tax-Exempt Fund, which is distributed through a separate prospectus and the results of which are contained in a separate report.
Sextant Growth (known as Northwest Growth until September 28, 1995, when the investment objective of only Northwest stocks was changed) commenced operations on December 30, 1990. Sextant International and Sextant Short-Term Bond began operations September 28, 1995. Sextant Bond Income Fund (known as Washington Tax-Exempt Fund until September 28, 1995, when the investment objective of only Washington State Municipal Bonds was changed) began operations on March 2, 1993. Sextant Core Fund commenced operations March 30, 2007.
The investment goal of the Growth and International Funds is long-term capital growth. The investment goals of the Core Fund are long-term capital appreciation and preservation. The investment goal of the Bond Income and Short-Term Bond Funds is current income, with Short-Term Bond having the additional goal of capital preservation.
NOTE 2 — Significant Accounting Policies
The following is a summary of the significant accounting policies followed by the Funds.
Security valuation:
Investments in securities traded on a national securities exchange (or reported on the NASDAQ national market) are stated at the last reported sales price on the day of valuation; other securities traded in the over-the-counter market and listed securities for which no sale was reported on that date are stated at the last quoted bid price.
Unlisted securities are valued using an independent pricing service, which determines valuations by using a matrix. For unlisted ADRs, this technique considers ADR ratios (the number of shares of the underlying security represented by an ADR certificate), underlying share trading on foreign exchanges, and input from news sources and depositary banks.
Debt securities are valued using bid-side valuations provided by an independent service. The service determines valuations using a matrix. This technique considers such factors as yields or prices of bonds of comparable quality, type of issue, coupon maturity, ratings, trading activity and general market conditions.
Fixed-income debt instruments, such as commercial paper, bankers' acceptances and U.S. Treasury Bills, with a maturity of 60 days or less are valued at amortized cost, which approximates market value. Any discount or premium is accreted or amortized on a straight-line basis until maturity.
Other securities for which quotations are not readily available are valued at fair values as determined in good faith by or under the direction of the Board of Trustees.
The cost of securities is the same for accounting and Federal income tax purposes. Securities transactions are recorded on trade date. Realized gains and losses on sales of securities are recorded on the identified cost basis.
Share valuation:
The net asset value ("NAV") per share of each Fund is calculated by dividing the sum of the value of the securities held by each Fund, plus cash or other assets, minus all liabilities (including estimated accrued expenses) by the total number of shares outstanding for each Fund, rounded to the nearest cent. The Funds' shares are not priced or traded on days the NYSE is closed. The NAV is the offering and redemption price per share.
Fair value measurements:
The Funds adopted Financial Accounting Standards Board Statement of Financial Accounting Standards No. 157, "Fair Value Measurements" ("FAS 157"), effective December 1, 2007 (March 30, 2007 for Core Fund). In accordance with FAS 157, fair value is defined as the price that the Fund would receive to sell an investment or pay to transfer a liability in an orderly transaction with an independent buyer in the principal market, or in the absence of a principal market the most advantageous market for the investment or liability. FAS 157 establishes a three-tier hierarchy to distinguish between (1) inputs that reflect the assumptions market participants would use in pricing an asset or liability developed based on market data obtained from sources independent of the reporting entity (observable inputs) and (2) inputs that reflect the reporting entity's own assumptions about the assumptions market participants would use in pricing an asset or liability developed based on the best information available i n the circumstances (unobservable inputs) and to establish classification of fair value measurements for disclosure purposes. Various inputs are used in determining the value of the Fund's investments. The inputs are summarized in the three broad levels listed below.
Level 1 — quoted prices in active markets for identical investments
Level 2 — other significant observable inputs (including quoted prices for similar investments, interest rates, prepayment speeds, credit risk, etc.)
Level 3 — significant unobservable inputs (including the Fund's own assumptions in determining the fair value of investments)
The inputs or methodology used for valuing securities are not necessarily an indication of the risk associated with investing in those securities.
The following is a summary of the inputs used as of November 30, 2008 in valuing the Funds' investments carried at value:
| Short-Term Bond Fund | |||
| Level | Valuation Inputs | Investments in Securities | |
| Level 1 | Quoted Prices | $- | |
| Level 2 | Other Significant Observable Inputs | $2,868,594 | |
| Level 3 | Significant Unobservable Inputs | $- | |
| Total | $2,868,594 | ||
| Bond Income Fund | |||
| Level | Valuation Inputs | Investments in Securities | |
| Level 1 | Quoted Prices | $- | |
| Level 2 | Other Significant Observable Inputs | $3,118,641 | |
| Level 3 | Significant Unobservable Inputs | $- | |
| Total | $3,118,641 | ||
| Core Fund | |||
| Level | Valuation Inputs | Investments in Securities | |
| Level 1 | Quoted Prices | $1,529,433 | |
| Level 2 | Other Significant Observable Inputs | $1,456,424 | |
| Level 3 | Significant Unobservable Inputs | $- | |
| Total | $2,985,857 | ||
| Growth Fund | |||
| Level | Valuation Inputs | Investments in Securities | |
| Level 1 | Quoted Prices | $8,841,235 | |
| Level 2 | Other Significant Observable Inputs | $- | |
| Level 3 | Significant Unobservable Inputs | $- | |
| Total | $8,841,235 | ||
| International Fund | |||
| Level | Valuation Inputs | Investments in Securities | |
| Level 1 | Quoted Prices | $6,541,655 | |
| Level 2 | Other Significant Observable Inputs | $8,473,598 | |
| Level 3 | Significant Unobservable Inputs | $- | |
| Total | $15,015,253 | ||
November 30, 2008 Annual Report | 39
Notes To Financial Statements (continued)
Federal income taxes:
As qualified investment companies under Subchapter M of the Internal Revenue Code, the Funds are not subject to income taxes to the extent that they distribute all of their taxable income. It is the Funds' policy to meet the requirements of the Internal Revenue Code applicable to regulated investment companies and to distribute all taxable income to shareowners.
The Funds adopted the provisions of the Financial Accounting Standards Board ("FASB") Interpretation No. 48 ("FIN 48") Accounting for Uncertainty in Income Taxes on May 31, 2008 (March 30, 2007 for Core Fund). FIN 48 sets forth a minimum threshold for financial statement recognition of the benefit of a tax position taken or expected to be taken in a tax return. The implementation of FIN 48 did not result in any unrecognized tax benefits in the accompanying financial statements. If applicable, the Fund recognizes interest accrued related to unrecognized tax benefits in "Interest Expense" and penalties in "Other" expenses on the Statement of Operations. The Fund files tax returns with the U.S. Internal Revenue Service and various states. Generally, each of the tax years in the four year period ended November 30, 2008 remains subject to examination by taxing authorities.
Reclassification of capital accounts:
Accounting principles generally accepted in the United States of America require that certain components of net assets relating to permanent differences be reclassified between financial and tax reporting. These reclassifications have no effect on net assets or net asset value per share:
| Short-Term Bond | Core | |
| Undistributed net investment | $ - | $6,089 |
| Accumulated gains (losses) | 7,960 | - |
| Paid-in capital | $(7,960) | $(6,089) |
These reclassifications were due to expiration of capital loss carryforwards, return of capital distributions, and the tax treatment of distributions of short term gains.
Dividends and distributions to shareowners:
Dividends and distributions to shareowners, which are determined in accordance with income tax regulations, are recorded as income on the ex-dividend date. Withholding taxes on foreign dividends have been provided for in accordance with the Funds' understanding of the applicable country's tax rules and rates.
For the Sextant Short-Term Bond Fund and Sextant Bond Income Fund, dividends are paid daily and distributed on the last business day of each month. For the Sextant Core Fund, Sextant Growth Fund and Sextant International Fund, dividends are payable at the end of each November. Shareowners electing to reinvest dividends and distributions purchase additional shares at the net asset value on the payable date.
Use of estimates:
The preparation of financial statements in conformity with accounting principles generally accepted in the United States of America requires management to make estimates and assumptions that affect the reported amounts of assets and liabilities and disclosure of contingent assets and liabilities at the date of the financial statements and the reported amounts of increases and decreases in net assets from operations during the reporting period. Actual results could differ from those estimates.
Other:
Interest income is recognized on an accrual basis. Premiums on securities purchased are amortized and discounts are accreted over the lives of the respective securities. Cash dividends from equity securities are recorded as income on the ex-dividend date.
The Trustees have adopted certain policies and procedures with respect to frequent trading of Fund shares. The Funds are intended for long-term investment and do not permit rapid trading of their shares. To discourage speculation, shares held less than thirty calendar days, including those held in omnibus accounts at intermediaries, may be assessed a 2% early-redemption fee (payable to the Fund) when redeemed. These fees are deducted from the redemption proceeds otherwise payable to the shareowner and retained by the Funds as paid-in capital and included in the daily NAV calculation.
NOTE 3 — Transactions with Affiliated Persons
Under a contract approved by shareowners on September 28, 1995, Saturna Capital Corporation provides investment advisory services and certain other administrative and distribution services required to conduct Trust business. Expenses incurred by the Trust on behalf of the Funds (e.g., professional fees) are allocated to the Funds on the basis of relative daily average net assets. For such services, each of the Funds pays the Adviser a base Investment Advisory and Administrative Services Fee of .60% of average net assets per annum, payable monthly. The Adviser has agreed to certain limits on expenses, as described below.
The base Advisory Fee is subject to adjustment up or down depending on the investment performance of the Fund relative to a specified index.
Performance Adjustment for Sextant Short-Term Bond Fund and Sextant Bond Income Fund:
- For each month in which either of these Funds' total investment return (change in net asset value plus all distributions reinvested) for the one year period through that month outperforms or underperforms the total return of a specified index for that period by 1% or more but less than 2%, the Base Fee is increased or decreased by the annual rate of .10% of the Fund's average daily net assets for the preceding year.
- If the outperformance or underperformance is 2% or more, then the adjustment is at the annual rate of .20%.
Performance adjustment for Sextant Core, Sextant Growth Fund and Sextant International Fund:
- For each month in which these Funds' total investment return (change in net asset value plus all distributions reinvested) for the one year period through that month outperforms or underperforms the total return of a specified index for that period by 1% or more but less than 2%, the Base Fee is increased or decreased by the annual rate of .10% of the Fund's average daily net assets for the preceding year.
- If the outperformance or underperformance is 2% or more but less than 4%, then the adjustment is at the annual rate of .20%.
- If the outperformance or underperformance is 4% or more, the adjustment is at an annual rate of .30%.
The Adviser has voluntarily undertaken to limit expenses of Sextant Short-Term Bond Fund to 0.75%, and Sextant Bond Income Fund to 0.90%, through March 31, 2010. It waives its investment advisory and administrative fee to Sextant Short-Term Bond Fund and Sextant Bond Income Fund completely should assets of such Fund be less than $2 million. For the year ended November 30, 2008, Sextant Short-Term Bond and Sextant Bond Income Funds incurred advisory and administration expenses of $24,241 and $22,777 respectively. Sextant Core Fund incurred administrative and advisory expenses of $28,134. Sextant Growth Fund and Sextant International incurred advisory and administration expenses of $93,090 and $130,024, respectively. In accordance with the expense waiver noted above, for the year ended November 30, 2008, Saturna Capital waived $25,612 and $18,595 of the Sextant Short-Term Bond Fund and Sextant Bond Income Fund advisory fees, respectively. The adviser cannot recoup previously waived fees.
Saturna Brokerage Services, Inc. ("SBS"), a discount brokerage and subsidiary of Saturna Capital Corporation, is a registered as a broker-dealer and acts as distributor. On October 3, 2006, The Funds adopted a Distribution Plan in accordance with Rule 12b-1 under the 1940 Act. The plan provides that the Funds will pay a fee to SBS at an annual rate of .25% of the average net assets of the Funds. The fee is paid to SBS as reimbursement for expenses incurred for distribution-related activity. During the year ended November 30, 2008, the Trust paid the Distributor $100,350. For the year ended November 30, 2008, Sextant Short-Term Bond, Bond Income, Core, Growth and International Funds paid $7,733; $8,572; $9,435; $36,133; and $38,477 respectively, to the Distributor. SBS is the primary broker used to effect portfolio transactions for the Trust. SBS currently executes portfolio transactions for the Trust for free (no commissions). Should any change occur in this policy, shareowners would be notified.
Trustee Nicholas Kaiser, who also serves as the president of the Trust, is a director and president of the Adviser. The four independent trustees are compensated by the Trust $500 per Board or committee meeting attended, plus reimbursement of travel expenses, allocated pro-rata to
40 | November 30, 2008 Annual Report
Notes To Financial Statements (continued)
the six Funds of Saturna Investment Trust. For the year ended November 30, 2008, the Trust incurred compensation expenses of $10,300 and total accrued expenses of $13,685 for the independent Trustees.
Regulations require the Trust to designate a Chief Compliance Officer; Mr. James Winship was retained by the Trust during the year ended November 30, 2008. For this period, the Short-Term Bond, Bond Income, Core, Growth, and International incurred $1,186; $1,386; $1,863; $6,783; and $6,773 of expense, respectively, for the Chief Compliance Officer.
The officers are paid by Saturna Capital, and not the Trust, except for Mr. Winship, who is partially compensated by the Trust. On November 30, 2008, the trustees, officers, and their affiliates as a group owned 25.7%, 21.1%, 51.9%, 12.3% and 10.4% of the outstanding shares of Short-Term Bond, Bond Income, Core, Growth and International, respectively.
NOTE 4 — Distributions to Shareholders
The tax characteristics of distributions paid during the fiscal years ended November 30, 2008 and November 30, 2007 were as follows:
| Year ended Nov. 30, 2008 | Year ended Nov. 30, 2007 | |
| Short-Term Bond Fund | ||
| Ordinary income | $114,369 | $101,484 |
| Bond Income Fund | ||
| Ordinary income | 160,044 | 148,530 |
| Core Fund | ||
| Ordinary income | 70,977 | 51,291 |
| Return of capital | 788 | - |
| Growth Fund | ||
| Ordinary income | 25,378 | 11,322 |
| Capital gain¹ | 220 | 371,290 |
| International Fund | ||
| Ordinary income | 52,882 | 24,388 |
| Capital gain¹ | $- | $327,986 |
¹Long-Term Capital Gain dividend designated pursuant to Section 852(b)(3) of the Internal Revenue Code.
The cost basis of investments for federal income tax purposes at November 30, 2008 were as follows:
| Short-Term Bond | Bond Income | |
| Cost of investments | $2,920,405 | $3,326,778 |
| Gross tax unrealized appreciation | 26,712 | 62,708 |
| Gross tax unrealized depreciation | (78,523) | (270,845) |
| Net tax unrealized depreciation | $(51,811) | $(208,137) |
| Core | |
| Cost of investments | $3,786,975 |
| Gross tax unrealized appreciation | 46,098 |
| Gross tax unrealized depreciation | (847,216) |
| Net tax unrealized depreciation | $(801,118) |
| Growth | International | |
| Cost of investments | $8,414,115 | $16,539,539 |
| Gross tax unrealized appreciation | 2,747,914 | 968,378 |
| Gross tax unrealized depreciation | (2,320,794) | (2,492,664) |
| Net tax unrealized appreciation (depreciation) | $427,120 | $(1,524,286) |
As of November 30, 2008, components of distributable earnings on a tax basis were as follows:
| Short-Term Bond | Bond Income | |
| Net tax unrealized depreciation | $(51,811) | $(208,137) |
| Undistributed ordinary income | 1,407 | - |
| Undistributed long-term capital gain (loss) | (47,214) | (64,493) |
| Total distributable earnings (loss) | (45,807) | (64,493) |
| Total accumulated earnings (loss) | $(97,618) | $(272,630) |
| Core | |
| Net tax unrealized depreciation | $(801,118) |
| Undistributed ordinary income | - |
| Undistributed long-term capital gain (loss) | (75,141) |
| Total distributable earnings (loss) | (75,141) |
| Total accumulated earnings (loss) | $(876,259) |
| Growth | International | |
| Net tax unrealized appreciation (depreciation) | $427,120 | $(1,524,286) |
| Undistributed ordinary income | 4,891 | 18,238 |
| Undistributed long-term capital gain (loss) | (108,384) | (51,076) |
| Total distributable earnings (loss) | (103,493) | (32,838) |
| Total accumulated earnings (loss) | $323,627 | $(1,577,124) |
NOTE 5 — Federal Income Taxes
At November 30, 2008, Short-Term Bond had capital loss carryforwards of $47,214, of which $15,098 expires in 2009, $4,422 expires in 2012, $6,540 expires in 2013, $10,899 expires in 2014, and $10,255 expires in 2016; Bond Income had capital loss carryforwards of $64,493, of which $2,141 expires in 2009, $14,253 expires in 2010, $14,375 expires in 2014, $4,203 expires in 2015, and $29,521 expires in 2016; Core had capital loss carryforwards of which $75,141 expires in 2016; Growth had capital loss carryforwards of which $108,384 expires in 2016; and International had capital loss carryforwards of which $51,076 expires in 2016; subject to regulation. Prior to their expiration, such loss carryforwards may be used to offset future net capital gains realized for federal income tax purposes.
NOTE 6 — Investments
Investment transactions other than short-term investments for the year ended November 30, 2008 were as follows:
| Purchases | Sales | |
| Short-Term Bond | $714,774 | $613,850 |
| Bond Income | $449,904 | $279,750 |
| Core | $808,227 | $571,999 |
| Growth | $744,363 | $193,012 |
| International | $2,994,645 | $962,073 |
NOTE 7 — Custody Credits
During 2008, the Trust became increasingly concerned about the financial health of its custodian, National City Corporation headquartered in Cleveland, OH. The Trust also sought a more experienced international stock custodian. After a diligent review, the Trust selected the fund servicing arm of PNC Financial Services Group of Pittsburgh, PA as its new custodian. The cash and securities of the Trust were transferred to PNC Global Investment Servicing in the fall of 2008. Subsequently, on December 31, 2008, PNC acquired National City Corporation in a transaction assisted by the purchase of new PNC preferred stock by the U.S. Treasury.
November 30, 2008 Annual Report | 41
Notes To Financial Statements (continued)
In accordance with the Funds' custodian agreements with National City Bank Indiana and PNC Global Investment Servicing, for the year ended November 30, 2008, custodian fees for Short-Term Bond, Bond Income, Core, Growth, and International were $359; $148; $464; $1,822; and $1,727; respectively. The custodian credited these fees based on earnings credits for the current period.
Report of Independent Registered Public Accounting Firm
To the Shareholders and Board of Trustees
Saturna Investment Trust,
We have audited the accompanying statements of assets and liabilities of the Sextant Short-Term Bond Fund, Sextant Bond Income Fund, Sextant Core Fund, Sextant Growth Fund and Sextant International Fund, each a series of the Saturna Investment Trust, including the schedules of investments as of November 30, 2008, and the related statements of operations for the year then ended, and the statements of changes in net assets and the financial highlights for each of the periods indicated thereon. These financial statements and financial highlights are the responsibility of the Trust's management. Our responsibility is to express an opinion on these financial statements and financial highlights based on our audits.
We conducted our audits in accordance with the standards of the Public Company Accounting Oversight Board (United States). Those standards require that we plan and perform the audit to obtain reasonable assurance about whether the financial statements and financial highlights are free of material misstatement. The Trust is not required to have, nor were we engaged to perform, audits of its internal controls over financial reporting. Our audits included consideration of internal control over financial reporting as a basis for designing audit procedures that are appropriate in the circumstances, but not for the purpose of expressing an opinion on the effectiveness of the Trust's internal control over financial reporting. Accordingly, we express no such opinion. An audit includes examining, on a test basis, evidence supporting the amounts and disclosures in the financial statements. Our procedures included confirmation of securities owned as of November 30, 2008, by correspondence with the custodian and brokers. Our audit also includes assessing the accounting principles used and significant estimates made by management, as well as evaluating the overall financial statement presentation. We believe that our audits provide a reasonable basis for our opinion.
In our opinion the financial statements and financial highlights referred to above present fairly, in all material respects, the financial position of Sextant Short-Term Bond Fund, Sextant Bond Income Fund, Sextant Core Fund, Sextant Growth Fund, and Sextant International Fund, as of November 30, 2008, the results of their operations, the changes in their net assets and their financial highlights for each of the periods indicated above, in conformity with accounting principles generally accepted in the United States of America.
Philadelphia, Pennsylvania
January 29, 2009
(graphic omitted)
Tait, Weller & Baker LLP
Renewal of Investment Advisory Contract (unaudited)
On September 22, 2008, the Trustees of Saturna Investment Trust approved continuation of the Sextant Funds' investment advisory and administrative services agreements with Saturna Capital Corporation. In doing so, the Board considered a number of factors and made specific determinations relevant to that approval.
In addition to information provided throughout the year, the Trustees utilized a comparison of performance and fees of funds in each of the Sextant Morningstar peer categories. The Trustees found such information helpful in establishing expectations regarding the performance of the adviser and whether to continue the advisory contracts.
The Trustees found that the investment performance of the Sextant International Fund, both in absolute numbers and relative to funds in its Morningstar category, was outstanding. The investment performance of Sextant Growth Fund and Sextant Short-term Bond Funds were found to be highly satisfactory, and the Sextant Bond Income Fund to be satisfactory. The new Sextant Core Fund was also satisfactory based on its short history.
In their review, the Trustees noted that the Funds offer a full range of high-quality investor services. The Trustees reviewed Saturna's operations during the last year, continuing investments in staffing, compliance, servicing, offices and equipment, as well as Saturna's increasing assets under management. Important factors considered by the Trustees include Saturna Capital's experience, ability, and commitment to quality service through performing internally such functions as shareowner servicing, administration, accounting, marketing, and distribution. They recognized Saturna's efforts to improve compensation to attract and retain increasingly qualified, experienced, and specialized staff. The Trustees also took into consideration Saturna's continued avoidance of significant operational problems, and its culture of fully complying with investment company rules and regulations.
The Trustees reviewed the fees and expenses of the Funds. They noted that the performance-based advisory fees are unusual in the industry and fair and reasonable to shareowners. In addition, the Trustees found the expense ratios less than those of similar funds and to be advantageous to shareowners given the sizes of the funds, services provided and expenses incurred. They also considered the fees charged by the adviser to other kind of accounts and the different services provided to those accounts, as well as the ways in which Saturna's services and work done for other accounts it manages benefits the Funds.
The Trustees considered the history of the Funds under their current advisory agreements, and considered the growth of the Funds to determine whether the 12b-1 plan should be continued. The Trustees found that the Funds, though growing were still small by industry standards, and that further growth could result in greater efficiencies and lower expense ratios to the Funds. They noted that the 12b-1 plan assists in making Fund shares available in additional distribution channels, and has successfully attracted assets. They found that continuation of the 12b-1 plan is in the best interest of the shareowners in the expectation of further reductions in fees, and spreading of fixed costs across a larger base.
The Trustees reviewed Saturna's profitability with respect to the Funds as part of their evaluation of whether the fees under the advisory contract bear a reasonable relationship to the mix of services provided by Saturna, including the nature, extent and quality of such services. They valued Saturna's profits and capital reserves as protections available in the future. The Trustees also considered potential benefits to Saturna from acting as investment adviser and noted that there were no soft dollar arrangements with respect to trading in the Funds' portfolios, and that Saturna continues to voluntarily waive brokerage commissions for Fund portfolio trades, resulting in lower Fund expenses.
The Trustees concluded that the fees paid by the Funds to Saturna were reasonable in light of the services provided, comparative performance, expense and advisory fee information, costs of services provided and profits to be realized and benefits derived or to be derived by Saturna from its relationship with the Funds. The Trustees saw no need for advisory fee changes or breakpoints.
42 | November 30, 2008 Annual Report
| Trustees and Officers (unaudited) | ||||
| Name (age), address | Position(s) held with Trust and length of time served | Principal occupation(s) during past 5 Years | Number of portfolios in Saturna Fund complex overseen by Trustee | Other directorships held by Trustee |
| Independent Trustees | ||||
| Gary A. Goldfogel, MD (50) 1500 N. State Street Bellingham, WA 98225 | Independent Trustee since 1995 | Medical Examiner (pathologist); Owner, Avocet Environmental Testing (laboratory) | Six | None |
| Herbert G. Grubel, PhD (74) Apt. 1202 - 125 West Second St. North Vancouver, BC Canada V7M 1C5 | Independent Trustee† since 2005 | Professor Emeritus of Economics, Simon Fraser University; Senior Fellow, Fraser Institute | Eight | Amana Mutual Funds Trust |
| John E. Love (76) 1002 Spokane Street Garfield, WA 99130 | Chairman, Independent Trustee since 1987 | Owner, J.E. Love Co. (agricultural equipment manufacturer) | Six | None |
| John S. Moore, PhD (77) 346 Bayside Road Bellingham, WA 98225 | Independent Trustee since 1993 | Professor Emeritus, College of Business and Economics, Western Washington University | Six | None |
| Interested Trustee | ||||
| Nicholas F. Kaiser, MBA, CFA (62) 1300 N. State Street Bellingham, WA 98225 | President, Trustee† since 1991 | President, Saturna Capital Corporation; President, Saturna Brokerage Services | Eight | Amana Mutual Funds Trust |
| Officers who are not Trustees | ||||
| Phelps S. McIlvaine (55) 1300 N. State Street Bellingham, WA 98225 | Vice President since 1994 | Vice President, Saturna Capital Corporation; Treasurer, Saturna Brokerage Services | N/A | N/A |
| Christopher Fankhauser (36) 1300 N. State Street Bellingham, WA 98225 | Treasurer† since 2002 | Chief Operations Officer, Saturna Capital Corporation | N/A | N/A |
| Ethel B. Bartolome (36) 1300 N. State Street Bellingham, WA 98225 | Secretary† since 2001 | Corporate Administrator, Saturna Capital Corporation | N/A | N/A |
| James D. Winship, MBA, JD (60) 1300 N. State Street Bellingham, WA 98225 | Chief Compliance Officer† since 2004 | Attorney | N/A | N/A |
Term of Office: each Trustee serves for the lifetime of the Trust or until he dies, resigns, is removed, or not re-elected by the shareowners. Each officer serves a one-year term subject to annual reappointment by the Trustees.
The Fund's Statement of Additional Information, available without charge by calling Saturna Capital at 1-800/SATURNA, includes additional information about the Trustees.
On November 30, 2008, the trustees, officers, and their affiliates as a group owned 25.7%, 21.1%, 51.9%, 12.3% and 10.4% of the outstanding shares of Short-Term Bond, Bond Income, Core, Growth and International, respectively. Saturna Capital Corporation is the Trust's adviser and Saturna Brokerage Services, Inc. is the Trust's distributor. Mr. Kaiser is an interested person of the Trust by reason of his positions with the Trust's adviser and distributor. Moreover, he is the portfolio manager of the Sextant Growth Fund and the Sextant International Fund. Mr. McIlvaine is the portfolio manager of the Sextant Bond Income Fund and Sextant Short-Term Bond Fund. Mr. Peter Nielsen serves as portfolio manger of the Sextant Core Fund. Mr. Winship is also Chief Compliance Officer for Saturna Capital Corporation.
† Holds same position with Amana Mutual Funds Trust.
November 30, 2008 Annual Report | 43
Availability of Portfolio Information (unaudited)
- The Sextant Funds file complete schedules of portfolio holdings with the SEC for the first and third quarters of each fiscal year on Form N-Q.
- The Funds' Forms N-Q are available on the SEC's website at www.sec.gov, and at www.saturna.com.
- The Funds' Forms N-Q may be reviewed and copied at the SEC's Public Reference Room in Washington, DC. Information on the operation of the Public Reference Room may be obtained by calling 1-800-SEC-0330.
- The Funds make a complete schedule of portfolio holdings after the end of each month available to investors at www.saturna.com.
Availability of Proxy Voting Information (unaudited)
- A description of the policies and procedures that the Funds use to determine how to vote proxies relating to portfolio securities is available (a) without charge, upon request, by calling Saturna Capital at 1-800-728-8762; (b) on the Funds' website at www.saturna.com; and (c) on the SEC's website at www.sec.gov.
- Information regarding how each Fund voted proxies relating to portfolio securities during the most recent 12-month period ended June 30 is available (a) without charge, upon request, by calling Saturna Capital at 1-800-728-8752; (b) on the Funds' website at www.saturna.com; and (c) on the SEC's website at www.sec.gov.
Privacy Statement (unaudited)
At Saturna Capital, we understand the importance in maintaining the privacy of your financial information. To that end, we want to assure you that we protect the confidentiality of any personal information you share with us.
We collect personal information about you from information we receive from you on applications and other forms and from transactions or trades placed with us. We may disclose this information to an affiliated party to process transactions that you direct. We may use an agent for the purpose of mailing account statements, shareholder reports and other information about our products and services to you, in which case we may provide information, such as your name and address, to the agent solely for that purpose. We contractually require any service providers to protect the confidentiality of your information and to use the information only for the purposes for which you provided it.
We maintain our own technology resources to minimize the use of outside service providers. Additionally, Saturna Capital restricts access to personal information about you to those employees who need to know that information to provide products or services to you. We maintain physical, electronic, and procedural safeguards that comply with regulations to guard your personal information. Please be assured that except as described above, we do not disclose any personal information about our customers, or our former customers, to anyone, except as may be required by law. If you have further questions or concerns about the security or privacy of the information we receive from you, please call us at 1-800/SATURNA.
Householding Policy (unaudited)
To reduce expenses, we may mail only one copy of the Funds' prospectus and each annual and semi-annual report to those addresses shared by two or more accounts. If you wish to receive individual and/or more copies of these documents, please call us at 1-800/SATURNA or write to us at Saturna Capital/Sextant Mutual Funds, P.O. Box N, Bellingham, WA 98227. We will begin sending you individual copies thirty days after receiving your request.
If you are currently receiving multiple copies and wish to receive only one copy, please call us at 1-800/SATURNA or write to us at Saturna Capital/Sextant Mutual Funds, P.O. Box N, Bellingham, WA 98227. We will begin sending you a single copy with subsequent report mailings.
(graphic omitted)
Saturna Capital
1300 North State Street
Bellingham, WA 98225
www.saturna.com
800/SATURNA
This report is issued for the information of the shareowners of the Funds. It is not authorized for distribution to prospective investors unless it is accompanied or preceded by an effective prospectus relating to the securities of the Funds. The Sextant Funds are a series of Saturna Investment Trust.
Saturna Brokerage Services, Distributor

Performance Summary:
Average Annual Returns (for calendar years ending December 31, 2008) | |||||
| 1 Year | 3 Years | 5 Years | 10 Years | Expense Ratio¹ | |
| Idaho Tax-Exempt Fund | -1.01% | 2.20% | 2.13% | 3.45% | 0.89% |
Performance data quoted in this report represents past performance, is before any taxes payable by shareowners, and is no guarantee of future performance. Current performance may be higher or lower than that stated herein. Performance current to the most recent month-end is available by calling toll free (800) SATURNA or visiting www.saturna.com. Total returns are historical and include change in share value, and reinvestment of dividends and capital gains, if any, and do not include the potential deduction of 2% redemption fee on shares held less than 30 days. Share price, yield, and return will vary and you may have a gain or loss when you sell your shares.
¹By regulation, the expense ratio shown in this table is as of the Fund's most recent prospectus which is dated March 28, 2008, incorporates results for the fiscal year ending November 30, 2007, and differs from expense ratios shown elsewhere in this report as they represent different fiscal periods.
Please consider an investment's objectives, risks, charges and expenses carefully before investing. To obtain the Fund's prospectus that contains this and other important information please visit www.saturna.com or call toll free 1-800/SATURNA. Please read the prospectus carefully before investing.
2 | Annual Report November 30, 2008
Fellow Shareowners:
For the fiscal year ended November 30, 2008, the Idaho Tax-Exempt Fund declined 3.36%. With 2008 being the worst year for most financial and real asset prices since the 1930's, this was an exceptional achievement. The Fund's net assets increased 18% to $11.77 million, the highest total in its 21-year history. Higher assets helped reduce the annual operating expense ratio to 0.76%.
As we look to 2009, business revenues and employment are falling; home sales are dropping; and the important agriculture and resource sectors expect turbulence. Like most states, Idaho faces a significant budget deficit. Fortunately, Idaho is well prepared to maintain the credit worthiness of its state agencies and the municipal borrowers who rely on state funding. Governor Otter has announced budget holdbacks and plans to preserve Idaho's $320 million cash reserve. The legislature will look to limit funding to programs mandated by state law — with healthcare, welfare, education and total government employment subject to cuts. Idaho's government views seeking federal bailout funding as irresponsible and is not considering tax increases.
Despite 2008's disasters, Idaho bonds confirmed their role as one of the finest reservoirs of value, and the Idaho Tax-Exempt Fund fulfilled its mission to "provide income free from federal income taxes… with a secondary objective of capital preservation." While common stock and high-yield bonds lost more than 35% and losses in investment-grade corporate bonds exceeded 8%, for calendar 2008 the Idaho Fund declined just 1.01%.
For those seeking a conservative investment vehicle that may benefit from a softer U.S. economy, the Idaho Tax-Exempt Fund offers diversification and relatively stable asset values that many investors seek during uncertain markets. We believe municipal bonds today are more attractive than any time since the Great Depression, as tax-exempt yields exceed those available on taxable Treasurys and government sponsored enterprises by a significant margin. Fortunately, Idaho does not have the immense financial burdens of a state like California.
We invite you to review the advantages of the Idaho Tax-Exempt Fund, including low expenses, income free from Idaho and federal income taxes, a high-quality diversified bond portfolio, and daily supervision by professional managers. We welcome your suggestions. Only with your help can we be certain that we are meeting our primary objective — your investment needs.
Respectfully,
(graphic omitted)
Nicholas Kaiser,
President
(graphic omitted)
Phelps McIlvaine,
Vice President, Portfolio Manager
January 15, 2009
Annual Report November 30, 2008 | 3
Performance Summary (unaudited)
Average Annual Returns (as of November 30, 2008) | ||||
| 1 Year | 5 Years | 10 Years | Expense Ratio¹ | |
| Idaho Tax-Exempt Fund | -3.36% | 1.61% | 3.17% | 0.89% |
| Barclay's (Lehman) Composite Municipal Bond Index | -3.61% | 2.58% | 4.13% | N/A |
Growth of $10,000
 | Comparison of any mutual fund to a market index must be made bearing in mind that the Index is unmanaged, and expense-free. Conversely, the fund will (1) be actively managed, (2) have an objective other than mirroring the index, such as limiting risk, (3) bear transaction and other costs, (4) stand ready to buy and sell its securities to shareowners on a daily basis, and (5) provide a wide range of services. The graph compares $10,000 invested in the Fund on November 30, 1998 to a similar amount invested in the Index, which reflects the types of securities in which the Fund invests. The graph shows that an investment in the Fund would have risen to $13,664 versus $13,111 in the Barclay's Index. |
| Past performance does not guarantee future results. The "Growth of $10,000" graph and "Average Annual Returns" performance table assume the reinvestment of dividends and capital gains. They do not reflect the deduction of taxes that a shareowner might pay on fund distributions or the redemption of fund shares, nor do they reflect the potential deduction of a 2% redemption fee on shares held less than 30 calendar days. ¹ By regulation, the expense ratio for the Fund shown in this table is as of the Fund's most recent prospectus which is dated March 28, 2008, incorporates results for the fiscal year ending November 30, 2007, and differs from expense ratios shown elsewhere in this report as they represent different fiscal periods. | |
Fund Objective
Idaho Tax-Exempt Fund seeks to provide income free from federal income, federal alternative minimum and Idaho state income taxes, with a secondary objective of capital preservation.
Industry Allocation
4 | Annual Report November 30, 2008
Discussion of Fund Performance (unaudited)
For the fiscal year ending November 30, 2008 the Idaho Tax-Exempt Fund declined 3.36%. For the last five years, the Fund has provided a 1.61% annualized total return. On November 30, 2008 the thirty day SEC yield was 4.40%, up significantly from 3.55% one year ago. Reflecting the volatility of investment grade bond markets, the Fund's price fell an uncharacteristic 12.8% through October before recovering 9.5% through December. For the calendar year ended December 31, 2008, the Fund declined 1.01%.
Factors Affecting Past Performance
In 2008, global deleveraging of risk triggered mass liquidations in real estate, commodities, common stocks and bonds. Asset values collapsed as investments that retained value (such as municipal bonds) were sold at any price to offset losses on investments whose value had been destroyed (mortgage-backed securities). High quality assets were especially vulnerable because low quality assets could not be liquidated at any price. This systemic meltdown led to record price volatility, the evaporation of liquidity and a massive flight to quality in U.S. Treasury securities. The municipal bond market seized up, shutting off short-term funding, new issue bond underwriting and secondary market trading.
The Federal Reserve initiated structural easing to restore normalcy to the credit markets. The Federal government began unprecedented fiscal rescue and recovery programs with little concern for spending controls and fiscal discipline.
The value of bond insurance disappeared as the credit ratings of the insurance companies faltered. The Fund's insured bonds lost the value derived from the insurance and now trade on their underlying credit rating. Through the year, municipal yield curves steepened and management extended the dollar- weighted average maturity from 7.9 years to 10.4 years in an effort to capture the historic value in long-term Idaho bonds.
Looking Forward
Over the next year, we expect inflation will be negligible, unemployment will rise, business earnings will weaken and worldwide economic activity will contract. We expect most central banks to purchase government and agency securities to drive down mortgage rates and will keep short-term rates near zero. We see no recovery in the housing market in 2009, and expect continued threats to the solvency of many corporations and individuals through continued credit rationing.
The good news is credit markets are beginning to function again. New issue underwriting is accelerating and borrowing costs are falling. Some investors are returning to the markets, driving up municipal, corporate and mortgage bond prices. Premiums for credit default swaps are softening and positive yield curves imply improving credit conditions. The flight to quality is easing as U.S. Treasury security prices weaken. Current bond prices may already fully discount today's grim consensus forecast. We anticipate a recovery in municipal bond values in 2009 as investors recognize the historic nature of the current buying opportunity. Above all else, management remains confident in the credit worthiness of the State of Idaho and our Idaho municipal issuers.
Bond Ratings | |||
| Ratings Established | By Adviser | By Standard & Poor's | By Moody's Investor Services |
| AAA | 26.8% | 8.9% | 28.1% |
| AA | 33.4% | 16.8% | 30.9% |
| A | 36.8% | 6.9% | 27.8% |
| BBB | 0.0% | 0.0% | 3.2% |
| Unrated | 0.0% | 64.4% | 7.0% |
| Other assets | 3.0% | 3.0% | 3.0% |
| Top Ten Holdings | |
% of Fund Assets | |
| Ada & Canyon Cos. JSD #3 Kuna 5.00% due 9/15/2019 | 4.4% |
| Bonneville & Bingham Cos. JSD #93 4.50% due 9/15/2017 | 3.0% |
| Canyon County SCD #131 Nampa 4.75% due 8/15/2019 | 2.8% |
| Owyhee & Elmore Cos. JSD #365 Grand View 4.00% due 8/15/2027 | 2.8% |
| Canyon County SCD #139 4.35% due 9/15/2025 | 2.6% |
| Pocatello ID Water Revenue 4.75% due 2/01/2026 | 2.6% |
| Boise State University Revenue 5.00% due 4/1/2019 | 2.6% |
| Bingham County SCD #55 Blackfoot 4.65% due 8/1/2017 | 2.5% |
| Post Falls LID SPA 5.00% due 5/1/2021 | 2.3% |
| University of Idaho Revenue, Series A 5.00% due 4/1/2020 | 2.2% |
Annual Report November 30, 2008 | 5
| Investments | |||||
| Rating¹ | Issue | Coupon/Maturity | Face Amount | Market Value | Percentage |
| Electric Power | |||||
| AAA | Idaho Falls Electric Revenue | 6.75% due 4/1/2019 | $140,000 | $159,825 | 1.4% |
| Financial Services | |||||
| AA- | Boise City General Fund Revenue, Series A | 5.20% due 12/1/2017 | 160,000 | 165,230 | 1.4% |
| AA- | Boise City General Fund Revenue, Series A | 5.25% due 12/1/2018 | 100,000 | 102,925 | 0.9% |
| AA | Idaho Bond Bank Authority² | 4.00% due 9/15/2019 | 90,000 | 84,295 | 0.7% |
| 350,000 | 352,450 | 3.0% | |||
| General Obligation | |||||
| AA- | Ada & Canyon Cos. JSD #2 Meridian² | 5.50% due 7/30/2015 | 50,000 | 55,829 | 0.5% |
| AAA | Ada & Canyon Cos. JSD #2 Meridian | 5.00% due 8/15/2020 | 165,000 | 169,236 | 1.4% |
| AAA | Ada & Canyon Cos. JSD #2 Meridian | 5.00% due 8/15/2021 | 155,000 | 157,725 | 1.3% |
| AA- | Ada & Canyon Cos. JSD #3 Kuna | 5.00% due 9/15/2019 | 500,000 | 518,380 | 4.4% |
| AAA | Adams & Washington Cos. JSD #432 | 4.00% due 8/15/2019 | 100,000 | 99,393 | 0.8% |
| AAA | Bingham County SCD #55 Blackfoot | 4.65% due 8/1/2017 | 285,000 | 294,870 | 2.5% |
| AA | Blaine County, Idaho Series A | 4.05% due 8/1/2023 | 150,000 | 133,186 | 1.1% |
| A | Boise County SCD #73 | 5.15% due 7/31/2010 | 125,000 | 125,576 | 1.0% |
| A | Bonneville & Bingham Cos. JSD #93 | 4.50% due 9/15/2016 | 150,000 | 154,589 | 1.3% |
| A | Bonneville & Bingham Cos. JSD #93 | 4.50% due 9/15/2017 | 350,000 | 354,676 | 3.0% |
| A- | Caldwell, Idaho | 5.30% due 5/15/2014 | 150,000 | 155,116 | 1.3% |
| AA- | Canyon County SCD #139 | 4.35% due 9/15/2025 | 350,000 | 307,765 | 2.6% |
| A | Canyon County SCD #131 Nampa | 4.75% due 8/15/2019 | 325,000 | 330,454 | 2.8% |
| A | Canyon County SCD #131 Nampa | 5.00% due 8/15/2023 | 105,000 | 102,853 | 0.9% |
| A- | Canyon County SCD #134 Middleton | 4.65% due 7/31/2016 | 170,000 | 174,503 | 1.5% |
| AAA | Fremont & Madison JSD #215 St. Anthony | 4.00% due 8/15/2019 | 200,000 | 191,990 | 1.6% |
| AAA | Jefferson & Madison SCD #251 Rigby | 4.25% due 9/1/2024 | 100,000 | 89,159 | 0.8% |
| AAA | Jerome, Lincoln, & Gooding Cos. JSD #261 | 3.75% due 9/15/2018 | 125,000 | 120,811 | 1.0% |
| AAA | Jerome, Lincoln, & Gooding Cos. JSD #261 | 5.00% due 9/15/2022 | 250,000 | 253,333 | 2.1% |
| AAA | Kootenai-Shonshone Area Library | 4.25% due 8/1/2021 | 220,000 | 209,653 | 1.8% |
| AAA | Latah, Nez Perce, & Clearwater JSD #283 | 4.50% due 8/15/2027 | 190,000 | 183,916 | 1.6% |
| AA- | Lemhi County | 4.20% due 8/1/2015 | 100,000 | 101,985 | 0.9% |
| AAA | Madison County SCD #321 Rexburg | 4.50% due 8/15/2024 | 260,000 | 199,009 | 1.7% |
| AA- | Madison County SCD #321 Rexburg | 4.50% due 8/15/2026 | 250,000 | 184,965 | 1.6% |
| AA- | Meridian Free Library District | 5.00% due 8/1/2015 | 100,000 | 100,262 | 0.8% |
| A- | Minidoka & Jerome Cos. JSD #3312 | 4.50% due 8/15/2018 | 75,000 | 73,250 | 0.6% |
| A- | Minidoka & Jerome Cos. JSD #3312 | 4.50% due 8/15/2020 | 75,000 | 69,714 | 0.6% |
| A- | Minidoka & Jerome Cos. JSD #331 | 4.375% due 8/15/2024 | 225,000 | 194,875 | 1.7% |
| A- | Minidoka & Jerome Cos. JSD #331 | 4.50% due 8/15/2025 | 160,000 | 138,462 | 1.2% |
| A | Nampa Idaho, Series B | 5.00% due 8/1/2020 | 200,000 | 199,462 | 1.7% |
| AAA | Owyhee & Canyon Cos. JSD #370 Homedale | 4.55% due 8/15/2016 | 160,000 | 172,141 | 1.5% |
| AAA | Owyhee & Elmore Cos. JSD #365 Grand View | 4.00% due 8/15/2027 | 350,000 | 324,051 | 2.8% |
| AA- | Payette County SCD #373 | 5.00% due 9/15/2024 | 100,000 | 100,826 | 0.9% |
| A+ | Valley & Adams Cos. JSD #421 | 4.50% due 8/1/2024 | 290,000 | 258,993 | 2.2% |
| A+ | Valley & Adams Cos. JSD #421 | 4.50% due 8/1/2022 | 135,000 | 124,080 | 1.1% |
| 6,695,000 | 6,425,088 | 54.6% | |||
| Medical/Hospitals | |||||
| AA- | Idaho Health Facility Authority Holy Cross Revenue | 5.25% due 12/1/2014 | 110,000 | 111,035 | 0.9% |
| AA- | Idaho Health Facility Authority Holy Cross Revenue | 5.00% due 12/1/2022 | 115,000 | 114,086 | 1.0% |
| AA | Idaho Health Facility Authority Holy Cross Revenue² | 5.00% due 12/1/2028 | 50,000 | 47,210 | 0.4% |
| AA | Idaho Health Facility Authority Revenue | 6.00% due 12/1/2023 | 200,000 | 199,218 | 1.7% |
| 475,000 | 471,549 | 4.0% | |||
| Continued on next page. | |||||
(The accompanying notes are an integral part of these financial statements)
6 | Annual Report November 30, 2008
| Investments | |||||
| Rating¹ | Issue | Coupon/Maturity | Face Amount | Market Value | Percentage |
| Municipal Leases | |||||
| A | Nez Perce County COP | 4.50% due 2/1/2021 | 150,000 | 139,113 | 1.2% |
| Pollution Control | |||||
| AA | Idaho Bond Bank Authority Revenue, Series A | 4.30% due 9/1/2022 | 135,000 | 123,572 | 1.1% |
| AA | Idaho Bond Bank Authority Revenue, Series A² | 4.125% due 9/15/2023 | 75,000 | 65,591 | 0.5% |
| AAA | Moscow Idaho Sewer Revenue | 4.45% due 5/1/2028 | 200,000 | 179,678 | 1.5% |
| 410,000 | 368,841 | 3.1% | |||
| Real Estate | |||||
| AAA | Idaho Housing & Finance Association | 4.80% due 6/1/2017 | 100,000 | 93,822 | 0.8% |
| AA | Idaho State Building Authority Revenue | 4.50% due 9/1/2023 | 110,000 | 100,543 | 0.9% |
| A | Post Falls LID SPA | 5.00% due 5/1/2021 | 300,000 | 278,205 | 2.3% |
| 510,000 | 472,570 | 4.0% | |||
| Sewer | |||||
| A | Troy ID Sewer System² | 8.00% due 2/1/2009 | 20,000 | 19,897 | 0.1% |
| A | Troy ID Sewer System² | 8.00% due 2/1/2010 | 20,000 | 19,904 | 0.2% |
| 40,000 | 39,801 | 0.3% | |||
| State Education | |||||
| A+ | Boise State University Revenue | 5.00% due 4/1/2019 | 295,000 | 302,048 | 2.6% |
| A+ | Boise State University Revenue | 4.50% due 4/1/2027 | 250,000 | 218,603 | 1.9% |
| A | Idaho State University Revenue | 4.90% due 4/1/2017 | 150,000 | 150,745 | 1.2% |
| AA- | Idaho State University Revenue, Series B | 4.625% due 4/1/2024 | 220,000 | 202,715 | 1.7% |
| A+ | University of Idaho Revenue, Series A | 5.00% due 4/1/2019 | 200,000 | 201,496 | 1.7% |
| AAA | University of Idaho Revenue, Series A | 5.00% due 4/1/2020 | 260,000 | 259,314 | 2.2% |
| 1,375,000 | 1,334,921 | 11.3% | |||
| Transportation | |||||
| AA | Idaho Housing & Finance Association | 4.60% due 7/15/2023 | 250,000 | 233,653 | 2.0% |
| AA | Idaho Housing & Finance Association | 5.00% due 7/15/2024 | 200,000 | 197,430 | 1.7% |
| 450,000 | 431,083 | 3.7% | |||
| Urban Renewal | |||||
| AA- | Boise City Urban Renewal Agency Lease Revenue | 5.00% due 8/15/2020 | 160,000 | 161,987 | 1.4% |
| AA- | Boise City Urban Renewal Agency Lease Revenue² | 5.00% due 8/15/2021 | 90,000 | 89,769 | 0.7% |
| A | Jerome Urban Renewal District Revenue, Series A | 5.40% due 9/1/2013 | 200,000 | 200,808 | 1.7% |
| 450,000 | 452,564 | 3.8% | |||
| Water Supply | |||||
| A | Blackfoot, Idaho COP | 5.80% due 9/1/2018 | 135,000 | 138,793 | 1.2% |
| AA | Idaho Bond Bank Authority Revenue | 5.00% due 9/15/2026 | 250,000 | 240,852 | 2.1% |
| A | Pocatello ID Water Revenue | 4.75% due 2/01/2026 | 350,000 | 305,603 | 2.6% |
| A | Pocatello ID Water Revenue | 4.50% due 2/1/2024 | 100,000 | 86,017 | 0.7% |
| 835,000 | 771,265 | 6.6% | |||
| Total investments | (Cost=$12,143,527) | 11,880,000 | 11,419,070 | 97.0% | |
| Other assets (net of liabilities) | 354,663 | 3.0% | |||
| Total net assets | $11,773,733 | 100.0% | |||
| ¹Ratings shown are as determined by a national bond rating agency or the Adviser. ²Fair valued, see page 11. | |||||
(The accompanying notes are an integral part of these financial statements)
Annual Report November 30, 2008 | 7
| Statement of Assets and Liabilities | ||
| As of November 30, 2008 | ||
| Assets | ||
| Investments in securities, at value (Cost $12,143,527) | $11,419,070 | |
| Cash | 225,011 | |
| Interest receivable | 156,447 | |
| Receivable for Fund shares sold | 200 | |
| Insurance reserve premium | 801 | |
| Total assets | $11,801,529 | |
| Liabilities | ||
| Payable for Fund shares redeemed | 10,175 | |
| Distributions payable | 8,056 | |
| Payable to affiliates | 4,951 | |
| Accrued expenses | 4,614 | |
| Total liabilities | 27,796 | |
| Net assets | $11,773,733 | |
| Analysis of Net Assets | ||
| Paid-in capital (unlimited shares authorized, without par value) | 12,498,190 | |
| Unrealized net depreciation on investments | (724,457) | |
| Net assets applicable to Fund shares outstanding | $11,773,733 | |
| Fund shares outstanding | 2,382,966 | |
| Net asset value, offering and redemption price per share | $4.94 | |
| Statement of Operations | ||
| For the year ended November 30, 2008 | ||
| Investment income | ||
| Interest income | $510,037 | |
| Amortization of bond premium | (24,678) | |
| Gross investment income | $485,359 | |
| Expenses | ||
| Investment adviser and administration fees | 56,900 | |
| Audit fees | 9,109 | |
| Chief Compliance Officer expenses | 4,508 | |
| Insurance | 3,550 | |
| Shareowner servicing | 3,348 | |
| Printing and postage | 3,257 | |
| Trustee fees | 2,692 | |
| Legal fees | 1,649 | |
| Filing and registration fees | 1,271 | |
| Custodian fees | 551 | |
| Other expenses | 103 | |
| Total gross expenses | 86,938 | |
| Less custodian fee credits | (551) | |
| Net expenses | 86,387 | |
| Net investment income | 398,972 | |
| Net realized gain on portfolio investments | ||
| Proceeds from sales | 733,533 | |
| Less cost of securities sold (based on identified cost) | 724,059 | |
| Net realized gain on investments | 9,474 | |
| Net unrealized gain on portfolio investments | ||
| End of year | (724,457) | |
| Beginning of year | 127,018 | |
| Net decrease in unrealized appreciation | (851,475) | |
| Net realized and unrealized loss on portfolio investments | (842,001) | |
| Net decrease in net assets resulting from operations | ($443,029) | |
(The accompanying notes are an integral part of these financial statements.)
8 | Annual Report November 30, 2008
| Statement of Changes in Net Assets | Year ended Nov. 30, 2008 | Year ended Nov. 30, 2007 |
| Increase (decrease) in net assets | ||
| From operations | ||
| Net investment income | $398,972 | $309,237 |
| Net realized gain (loss) on investments | 9,474 | (8,426) |
| Net decrease in unrealized appreciation | (851,475) | (10,134) |
| Net increase (decrease) in net assets | (443,029) | 290,677 |
| Dividends to shareowners from | ||
| Net investment income | (398,972) | (309,237) |
| Capital gains distributions | (9,502) | 0 |
| Total distributions | (408,474) | (309,237) |
| From Fund share transactions | ||
| Proceeds from sales of shares | 3,900,608 | 2,331,511 |
| Value of shares issued in reinvestment of dividends | 331,494 | 246,587 |
| Early redemption fees retained | 12 | 85 |
| Cost of shares redeemed | (1,622,662) | (1,326,612) |
| Net increase in net assets | 2,609,452 | 1,251,571 |
| Total increase in net assets | $1,757,949 | $1,233,011 |
| Net assets | ||
| Beginning of year | 10,015,784 | 8,782,773 |
| End of year | $11,773,733 | $10,015,784 |
| Undistributed net investment income | $0 | $0 |
| Shares of the Fund sold and redeemed | ||
| Number of shares sold | 754,461 | 443,957 |
| Number of shares issued in reinvestment of dividends | 64,517 | 46,995 |
| Number of shares redeemed | (325,141) | (253,833) |
| Net increase in number of shares outstanding | 493,837 | 237,119 |
| Financial Highlights | For year ended November 30, | ||||
| Selected data per share of capital stock outstanding throughout the year: | 2008 | 2007 | 2006 | 2005 | 2004 |
| Net asset value at beginning of year | $5.30 | $5.32 | $5.27 | $5.39 | $5.46 |
| Income from investment operations | |||||
| Net investment income | 0.18 | 0.18 | 0.18 | 0.19 | 0.19 |
| Net gains (losses) on securities (both realized & unrealized) | (0.36) | (0.02) | 0.06 | (0.10) | (0.07) |
| Total from investment operations | (0.18) | 0.16 | 0.24 | 0.09 | 0.12 |
| Less distributions | |||||
| Dividends (from net investment income) | (0.18) | (0.18) | (0.18) | (0.19) | (0.19) |
| Distributions (from capital gains) | - | - | (0.01) | (0.02) | - |
| Total distributions | (0.18) | (0.18) | (0.19) | (0.21) | (0.19) |
| Paid-in capital from early redemption fees¹ | 0.00² | 0.00² | 0.00² | 0.00² | - |
| Net asset value at end of year | $4.94 | $5.30 | $5.32 | $5.27 | $5.39 |
| Total return | (3.36)% | 3.02% | 4.66% | 1.66% | 2.29% |
| Ratios / supplemental data | |||||
| Net assets ($000), end of year | $11,774 | $10,016 | $8,783 | $8,531 | $8,472 |
| Ratio of expenses to average net assets | |||||
| Before custodian fee credits | 0.77% | 0.89% | 0.87% | 0.91% | 0.95% |
| After custodian fee credits | 0.76% | 0.87% | 0.83% | 0.88% | 0.93% |
| Ratio of net investment income after custody credits to average net assets | 3.51% | 3.35% | 3.40% | 3.58% | 3.56% |
| Portfolio turnover rate | 7% | 6% | 24% | 21% | 15% |
| ¹Early redemption fee adopted March 29, 2005 | ²Amount is less than $0.01 | ||||
(The accompanying notes are an integral part of these financial statements.)
Annual Report November 30, 2008 | 9
Expenses (unaudited)
All mutual funds have operating expenses. As an Idaho Tax-Exempt Fund shareowner, you incur ongoing costs, including management fees and other fund expenses such as shareowner reports (like this one). Operating expenses, which are deducted from a fund's gross earnings, directly reduce the investment return of a fund. All mutual funds (unlike some other financial investments) only report their results after deduction of operating expenses.
With the Idaho Tax-Exempt Fund, unlike many mutual funds, you do not incur sales charges (loads) on purchase payments, reinvested dividends, or other distributions. You do not incur redemption fees, exchange fees, or fees related to Saturna Individual Retirement Accounts. However, to discourage speculation, you may incur a 2% fee for redemption of shares held less than 30 days. You may incur fees related to extra services requested by you for your account, such as a checkbook to use for redemptions or bank wires. The examples below are intended to help you understand your ongoing costs (in dollars) of investing in the Fund and to compare these costs with the ongoing costs of investing in other mutual funds.
Example
The following example is based on an investment of $1,000 invested at the beginning of the semi-annual period and held for six months (June 1, 2008 to November 30, 2008).
Actual Expenses
The first line provides information about actual account values and actual expenses. You may use the information in this line, together with the amount you have invested, to estimate the expenses that you paid over the period. Simply divide your account value by $1,000 (for example, a $8,600 account value divided by $1,000 = 8.6), then multiply the result by the number in the first line under the heading entitled "Expenses Paid During Period" to estimate the expenses you paid on your account during this fiscal year. The Fund also charges the following fees for extra services rendered on request, which you may need to add to determine your total expenses: $10 per checkbook, $25 per domestic bank wire, $35 per international bank wire, $15 per overnight courier delivery.
Hypothetical Example for Comparison Purposes
The second line provides information about hypothetical account values and hypothetical expenses based on the Fund's actual expense ratio (based on the last six months) and an assumed rate of return of 5% per year before expenses, which is not the Fund's actual return. The hypothetical account values and expenses may not be used to estimate the actual ending account balance or expenses you paid for the year. You may use this information to compare the ongoing costs of investing in the Fund and other mutual funds. To do so, compare this 5% hypothetical example with the 5% hypothetical examples that appear in the shareowner reports of other mutual funds. You may wish to add other fees that are not included in the expenses shown in the table, such as charges for extra services like check writing and bank wires.
Please note that the expenses shown are meant to highlight your ongoing costs only and do not reflect any transactional costs, such as sales charges (loads), redemption fees, or exchange fees. Therefore, the second line is useful in comparing ongoing costs only, and may not help you determine the relative total costs of owning different funds.
[June 1, 2008] | [November 30, 2008] | ||
| Actual | |||
| Hypothetical (5% annual return before expenses) |
¹ Expenses are equal to Idaho Tax-Exempt Bond Fund's annualized expense ratio of 0.73% (based on the most recent semi-annual period of June 1, 2008 through November 30, 2008, multiplied by the average account value of $976.90 over the period multiplied by 183/366 (to reflect the one-half year period).
10 | Annual Report November 30, 2008
Notes To Financial Statements
Note 1 — Organization
Saturna Investment Trust (the "Trust") was established under Washington State Law as a Business Trust on February 20, 1987. The Trust is registered as a no-load, open-end series investment company under the Investment Company Act of 1940, as amended. Five portfolios have been created to date in addition to Idaho Tax-Exempt Fund (the "Fund"). The other five portfolios distribute through a separate prospectus and the results of those funds are contained in a separate report.
The Idaho Tax-Exempt Fund was first authorized to sell shares of beneficial interest on September 4, 1987. The investment objective of the Fund is to provide income free from federal income, federal alternative minimum and Idaho state income taxes, with a secondary objective of capital preservation.
Note 2 — Significant Accounting Policies
The following is a summary of the significant accounting policies followed by the Fund.
Security valuation:
Debt securities are valued using bid-side valuations provided by an independent service. The service determines valuations using a matrix. This technique considers such factors as yields or prices of bonds of comparable quality, type of issue, coupon maturity, ratings, trading activity and general market conditions. In the absence of a valuation from an independent service, securities are valued at their respective fair values as determined in good faith by or under the direction of the Board of Trustees.
The cost of securities is the same for accounting and federal income tax purposes. Securities transactions are recorded on trade date. Realized gains and losses on sales of securities are recorded based on the identified cost.
Share valuation:
The net asset value ("NAV") per share of the Fund is calculated by dividing the sum of the value of the securities held by the Fund, plus cash or other assets, minus all liabilities (including estimated accrued expenses) by the total number of shares outstanding for the Fund, rounded to the nearest cent. The Fund's shares are not priced or traded on days the New York Stock Exchange is closed. The NAV is the offering and redemption price per share.
Fair value measurements:
The Fund adopted Financial Accounting Standards Board Statement of Financial Accounting Standards No. 157, "Fair Value Measurements" ("FAS 157"), effective December 1, 2007. In accordance with FAS 157, fair value is defined as the price that the Fund would receive to sell an investment or pay to transfer a liability in an orderly transaction with an independent buyer in the principal market, or in the absence of a principal market the most advantageous market for the investment or liability. FAS 157 establishes a three-tier hierarchy to distinguish between (1) inputs that reflect the assumptions market participants would use in pricing an asset or liability developed based on market data obtained from sources independent of the reporting entity (observable inputs) and (2) inputs that reflect the reporting entity's own assumptions about the assumptions market participants would use in pricing an asset or liability developed based on the best information available in the circumstances (unobservable i nputs) and to establish classification of fair value measurements for disclosure purposes. Various inputs are used in determining the value of the Fund's investments. The inputs are summarized in the three broad levels listed below.
Level 1 — quoted prices in active markets for identical investments
Level 2 — other significant observable inputs (including quoted prices for similar investments, interest rates, prepayment speeds, credit risk, etc.)
Level 3 — significant unobservable inputs (including the Fund's own assumptions in determining the fair value of investments)
The inputs or methodology used for valuing securities are not necessarily an indication of the risk associated with investing in those securities.
The following is a summary of the inputs used as of November 30, 2008 in valuing the Fund's investments carried at value:
| Level | Valuation Inputs | Investments in Securities | |
| Level 1 | Quoted prices | $ - | |
| Level 2 | Other significant observable inputs | $10,893,611 | |
| Level 3 | Significant unobservable inputs | $525,459 | |
| Total | $11,419,070 | ||
| Level 3 Roll-Forward Municipal Securities | |
| Beginning balance | $420,317 |
| Total unrealized gains or losses | $(34,648) |
| Purchases | $139,790 |
| Ending Balance | $525,459 |
Odd Lots:
The bid-side valuations provided by the independent pricing service are for institutional "round-lot" holdings ("Round Lots"). Round Lots consist of 100 bonds (approximately $100,000 each). Some of the Fund's holdings consist of less than an institutional Round Lot and are considered "Odd Lots." Odd Lots trade at a discount to Round Lots to compensate for the effect of the fixed costs associated with any trade. To reflect this discount, the Fund applies a discount to the valuation of Odd Lot holdings as shown in the following chart.
| Total Face Value | Adjustment to Price |
| Under 10,000 | -0.750% |
| 10,000-24,999 | -0.625% |
| 25,000-49,999 | -0.500% |
| 50,000-74,999 | -0.375% |
| 75,000-99,999 | -0.250% |
| 100,000 and up | none |
Income taxes:
As a qualified investment company under Subchapter M of the Internal Revenue Code, the Fund is not subject to income taxes to the extent that it distributes all of its investment income. It is the Fund's policy to meet the requirements of the Internal Revenue Code applicable to regulated investment companies and to distribute all its taxable and tax-exempt income to its shareowners. The Fund intends to meet requirements for tax-free income dividends, and requirements of the Idaho Department of Revenue for income dividends free of Idaho state income tax.
Annual Report November 30, 2008 | 11
Notes To Financial Statements (continued)
The Fund adopted the provisions of the Financial Accounting Standards Board ("FASB") Interpretation No. 48 ("FIN 48") Accounting for Uncertainty in Income Taxes on May 31, 2008. FIN 48 sets forth a minimum threshold for financial statement recognition of the benefit of a tax position taken or expected to be taken in a tax return. The implementation of FIN 48 did not result in any unrecognized tax benefits in the accompanying financial statements. If applicable, the Fund recognizes interest accrued related to unrecognized tax benefits in "Interest Expense" and penalties in "Other" expenses on the Statement of Operations. The Fund files tax returns with the U.S. Internal Revenue Service and various states. Generally, each of the tax years in the four year period ended November 30, 2008, remains subject to examination by taxing authorities.
Dividends and distributions to shareowners:
Dividends and distributions to shareowners, which are determined in accordance with income tax regulations, are recorded as income on the ex-dividend date. Dividends are paid daily and distributed on the last business day of each month. Shareowners electing to reinvest dividends and distributions purchase additional shares at the net asset value on the payable date.
Reclassification of capital accounts:
Accounting principles generally accepted in the United States of America require that certain components of net assets relating to permanent differences be reclassified between financial and tax reporting. For the year ended November 30, 2008 the following items identified have been reclassed among components of net assets:
| Accumulated net loss | $ 8,454 |
| Paid-in capital | ($8,454) |
Use of estimates:
The preparation of financial statements in conformity with accounting principles generally accepted in the United States of America requires management to make estimates and assumptions that affect the reported amounts of assets and liabilities and disclosure of contingent assets and liabilities at the date of the financial statements and the reported amounts of increases and decreases in net assets from operations during the reporting period. Actual results could differ from those estimates.
Other:
The ability of issuers of debt securities held by the Fund to meet their obligations may be affected by economic and political developments in the State of Idaho.
Interest income is recognized on an accrual basis. Discounts on securities purchased are accreted and premiums are amortized over the lives of the respective securities.
The Trustees have adopted certain policies and procedures with respect to frequent trading of Fund shares. The Fund is intended for long-term investment and do not permit rapid trading of its shares. To discourage speculation, shares held less than 30 calendar days, including those held in omnibus accounts at intermediaries, will be assessed a 2% early-redemption fee (payable to the Fund) when redeemed. These fees are deducted from the redemption proceeds otherwise payable to the shareowner and retained by the Fund as paid-in capital and included in the daily NAV.
Note 3 — Transactions with Affiliated Persons
Under a contract approved by shareowners on October 12, 1990, Saturna Capital Corporation provides investment advisory services and certain other administrative and distribution services to conduct the Fund's business. Expenses incurred by the Trust on behalf of the Fund (e.g., professional fees) are allocated to the Fund and the other Funds of the Trust on the basis of relative daily average net assets. For such services, the Fund pays an annual fee equal to 0.50% of its average daily net assets. For the year ended November 30, 2008, the Fund incurred advisory fee expenses of $56,900.
Saturna Brokerage Services, Inc. ("SBS"), a discount brokerage and subsidiary of Saturna Capital Corporation, is registered as a broker-dealer and acts as distributor for the Fund.
Saturna Capital Corporation acts as shareowner-servicing agent for the Fund, for a monthly fee plus certain expenses. For the year ended November 30, 2008, the Fund paid shareowner-servicing fees of $3,348.
Trustee Nicholas Kaiser, who also serves as the president of the Trust, is a director and president of the Adviser. The four independent trustees are compensated by the Trust $500 per Board or committee meeting attended, plus reimbursement of travel expenses, allocated pro-rata to the six Funds of Saturna Investment Trust. For the year ended November 30, 2008, the Trust incurred compensation expenses of $10,300 and total accrued expenses of $13,685 for the independent Trustees.
The officers are paid by Saturna Capital, and not the Trust, except for Mr. Winship, who is partially compensated by the Trust. On November 30, 2008, the trustees, officers and their immediate families as a group owned 2.69% of the outstanding shares of the Fund.
Note 4 — Investments
During the year ended November 30, 2008, the Fund purchased $3,401,670 of securities and sold/matured $733,533 of securities.
Note 5 — Distributions to shareowners
The tax characteristics of distributions paid during the fiscal years ended November 30, 2008, 2007 and 2006 were as follows:
| 2008 | 2007 | 2006 | |
| Tax-exempt income | $398,755 | $309,037 | $291,026 |
| Taxable income | 8,671 | 200 | 702 |
| Capital gain¹ | $1,048 | $ - | $19,527 |
¹Long-Term Capital Gain dividend designated pursuant to Section 852(b)(3) of the Internal Revenue Code.
The cost basis of investments for Federal Income Tax purposes at November 30, 2008 were as follows:
| Cost of investments | $12,143,527 |
| Gross unrealized appreciation | 55,957 |
| Gross unrealized depreciation | (780,414) |
| Net unrealized depreciation | $(724,457) |
12 | Annual Report November 30, 2008
Notes To Financial Statements (continued)
As of November 30, 2008 the components of distributable earnings on a tax basis were as follows:
| Net unrealized appreciation (depreciation) | $(724,457) |
| Total distributable earnings | - |
| Other accumulated losses | - |
| Total accumulated earnings/losses | $(724,457) |
Note 6 — Custodian
During 2008, the Trust became increasingly concerned about the financial health of its custodian, National City Corporation headquartered in Cleveland, OH. The Trust also sought a more experienced international stock custodian. After a diligent review, the Trust selected the fund servicing arm of PNC Financial Services Group of Pittsburgh, PA as its new custodian. The cash and securities of the Trust were transferred to PNC Global Investment Servicing in the fall of 2008. Subsequently, on December 31, 2008, PNC acquired National City Corporation in a transaction assisted by the U.S. Treasury's purchase of new PNC preferred stock.
In accordance with the Fund's agreement with its custodians, National City Bank of Indiana and PNC Global Investment Servicing, for the year ended November 30, 2008, custodian fees incurred by the Fund amounted to $551. The custodian waived $551 of its fees for earnings credits for the current year.
Report of Independent Registered Public Accounting Firm
To the Shareowners and Board of Trustees of Idaho Tax-Exempt Fund:
We have audited the accompanying statement of assets and liabilities of the Idaho Tax-Exempt Fund, a series of shares of the Saturna Investment Trust, including the schedule of investments as of November 30, 2008, and the related statement of operations for the year then ended, the statement of changes in net assets for each of the two years in the period then ended, and the financial highlights for each of the five years in the period then ended. These financial statements and financial highlights are the responsibility of the Trust's management. Our responsibility is to express an opinion on these financial statements and financial highlights based on our audits.
We conducted our audits in accordance with the standards of the Public Company Accounting Oversight Board (United States). Those standards require that we plan and perform the audit to obtain reasonable assurance about whether the financial statements and financial highlights are free of material misstatement. The Trust is not required to have, nor were we engaged to perform, an audit of its internal control over financial reporting. Our audit included consideration of internal control over financial reporting as a basis for designing audit procedures that are appropriate in the circumstances, but not for the purposes of expression an opinion on the effectiveness of the Trust's internal control over financial reporting. Accordingly, we express no such opinion. An audit includes examining, on a test basis, evidence supporting the amounts and disclosures in the financial statements. Our procedures included confirmation of securities owned as of November 30, 2008, by correspondence with the custodian. An audit also includes assessing the accounting principles used and significant estimates made by management, as well as evaluating the overall financial statement presentation. We believe that our audits provide a reasonable basis for our opinion.
In our opinion the financial statements and financial highlights referred to above present fairly, in all material respects, the financial position of Idaho Tax-Exempt Fund as of November 30, 2008, the results of its operations for the year then ended, the changes in its net assets for each of the two years in the period then ended, and the financial highlights for each of the five years in the period then ended, in conformity with accounting principles generally accepted in the United States of America.
Philadelphia, Pennsylvania
(graphic omitted)
Tait, Weller & Baker LLP
January 29, 2009
Annual Report November 30, 2008 | 13
| Trustees and Officers (unaudited) | ||||
| Name (age), address | Position(s) held with Trust and length of time served | Principal occupation(s) during past 5 Years | Number of portfolios in Saturna Fund complex overseen by Trustee | Other directorships held by Trustee |
| Independent Trustees | ||||
| Gary A. Goldfogel, MD (50) 1500 N. State Street Bellingham, WA 98225 | Independent Trustee since 1995 | Medical Examiner (pathologist); Owner, Avocet Environmental Testing (laboratory) | Six | None |
| Herbert G. Grubel, PhD (74) Apt. 1202 - 125 West Second St. North Vancouver, BC Canada V7M 1C5 | Independent Trustee† since 2005 | Professor Emeritus of Economics, Simon Fraser University; Senior Fellow, Fraser Institute | Eight | Amana Mutual Funds Trust |
| John E. Love (76) 1002 Spokane Street Garfield, WA 99130 | Chairman, Independent Trustee since 1987 | Owner, J.E. Love Co. (agricultural equipment manufacturer) | Six | None |
| John S. Moore, PhD (77) 346 Bayside Road Bellingham, WA 98225 | Independent Trustee since 1993 | Professor Emeritus, College of Business and Economics, Western Washington University | Six | None |
| Interested Trustee | ||||
| Nicholas F. Kaiser, MBA, CFA (62) 1300 N. State Street Bellingham, WA 98225 | President, Trustee† since 1991 | President, Saturna Capital Corporation; President, Saturna Brokerage Services | Eight | Amana Mutual Funds Trust |
| Officers who are not Trustees | ||||
| Phelps S. McIlvaine (55) 1300 N. State Street Bellingham, WA 98225 | Vice President since 1994 | Vice President, Saturna Capital Corporation; Treasurer, Saturna Brokerage Services | N/A | N/A |
| Christopher Fankhauser (36) 1300 N. State Street Bellingham, WA 98225 | Treasurer† since 2002 | Chief Operations Officer, Saturna Capital Corporation | N/A | N/A |
| Ethel B. Bartolome (36) 1300 N. State Street Bellingham, WA 98225 | Secretary† since 2001 | Corporate Administrator, Saturna Capital Corporation | N/A | N/A |
| James D. Winship, MBA, JD (60) 1300 N. State Street Bellingham, WA 98225 | Chief Compliance Officer† since 2004 | Attorney | N/A | N/A |
Term of Office: each Trustee serves for the lifetime of the Trust or until he dies, resigns, is removed, or not re-elected by the shareowners. Each officer serves a one-year term subject to annual reappointment by the Trustees.
The Fund's Statement of Additional Information, available without charge by calling Saturna Capital at 1-800/SATURNA, includes additional information about the Trustees.
On November 30, 2008, the Trustees, officers and their related accounts as a group owned 2.69% of the outstanding shares of the Fund. Saturna Capital Corporation is the Trust's adviser and Saturna Brokerage Services, Inc. is the Trust's distributor. Mr. Kaiser is an interested person of the Trust by reason of his positions with the Trust's adviser and distributor. Mr. McIlvaine is the primary manager of the Idaho Tax-Exempt Fund. Moreover, Mr. McIlvaine is the portfolio manager of the Sextant Bond Income Fund and Sextant Short-Term Bond Fund. Mr. Winship is also General Counsel and Chief Compliance Officer for Saturna Capital Corporation.
†Holds same position with Amana Mutual Funds Trust.
14 | Annual Report November 30, 2008
Renewal of Investment Advisory Contract (unaudited)
On September 22, 2008, the Trustees of Saturna Investment Trust approved continuation of Idaho Tax-Exempt Fund's investment advisory and administrative services agreement with Saturna Capital Corporation. In doing so, the board considered a number of factors and made specific determinations relevant to that approval.
In addition to information provided throughout the year, the Trustees utilized a comparison of performance and expenses of the Fund with those of other single-state tax-exempt mutual funds. The Trustees reviewed Morningstar and Lipper mutual fund category comparisons, and found that the investment performance of the Fund was strong. Specifically, Lipper found the Fund to rank in the top 1% of the "other states Muni" fund category for the twelve months ending September 5, 2008. The Trustees found such information helpful in establishing expectations regarding the performance of the adviser and whether to continue the advisory contract.
In their review, the Trustees noted that the Fund offers a full range of high-quality investor services. The Trustees reviewed Saturna's operations during the last year, continuing investments in staffing, compliance, servicing, offices and equipment, as well as Saturna's increasing assets under management. Important factors considered by the Trustees include Saturna Capital's experience, ability, and commitment to quality service through performing internally such functions as shareowner servicing, administration, accounting, marketing, and distribution. They recognized Saturna's efforts to improve compensation to attract and retain increasingly qualified, experienced, and specialized staff. The Trustees also took into consideration Saturna's continued avoidance of significant operational problems, and its culture of fully complying with investment company rules and regulations.
The Trustees reviewed Saturna's profitability with respect to the Fund as part of their evaluation of whether the fee under the advisory contract bears a reasonable relationship to the mix of services provided by Saturna, including the nature, extent and quality of such services. They considered the fees charged by the adviser to other kinds of accounts and the different services provided to those accounts. The Trustees also considered whether there are other potential benefits to Saturna from acting as investment adviser and found none. They valued Saturna's profits and capital reserves as protections available in the future. The Trustees concluded that the fee paid by the Fund to Saturna is reasonable in light of the services provided, comparative performance, expense and advisory fee information, costs of services provided and profits to be realized and benefits derived or to be derived by Saturna from its relationship with the Fund. The Trustees saw no need for advisory fee changes or breakpoints.
Privacy Statement (unaudited)
At Saturna Capital, we understand the importance of maintaining the privacy of your financial information. To that end, we want to assure you that we protect the confidentiality of any personal information you share with us.
We collect personal information about you from information we receive from you on applications and other forms and from transactions or trades placed with us. We may disclose this information to an affiliated party to process transactions that you direct. We may use an agent for the purpose of mailing account statements, shareholder reports and other information about our products and services to you, in which case we may provide information, such as your name and address, to the agent solely for that purpose. We contractually require any service providers to protect the confidentiality of your information and to use the information only for the purposes for which you provided it.
We maintain our own technology resources to minimize the use of outside service providers. Additionally, Saturna Capital restricts access to personal information about you to those employees who need to know that information to provide products or services to you. We maintain physical, electronic, and procedural safeguards that comply with regulations to guard your personal information. Please be assured that except as described above, we do not disclose any personal information about our customers, or our former customers, to anyone, except as may be required by law. If you have further questions or concerns about the security or privacy of the information we receive from you, please call us at 1-800/SATURNA.
Availability of Fund Portfolio Information (unaudited)
- The Fund files a complete schedule of portfolio holdings with the SEC for the first and third quarters of each fiscal year on Form N-Q.
- The Fund's Form N-Q is available on the SEC's website at www.sec.gov and at www.saturna.com.
- The Fund's Form N-Q may be reviewed and copied at the SEC's Public Reference Room in Washington, DC. Information on the operation of the Public Reference Room may be obtained by calling 1-800/SEC-0330.
- The Fund makes a complete schedule of portfolio holdings after the end of each month available to investors at www.saturna.com.
Householding Policy (unaudited)
To reduce expenses, we may mail only one copy of the Fund's prospectus and each annual and semi-annual report to those addresses shared by two or more accounts. If you wish to receive individual and/or more copies of these documents, please call us at 800/SATURNA or write to us at Saturna Capital/Idaho Tax-Exempt Fund, P.O. Box N, Bellingham, WA 98227. We will begin sending you individual copies thirty days after receiving your request.
If you are currently receiving multiple copies and wish to receive only one copy, please call us at 800/SATURNA or write to us at Saturna Capital/Idaho Tax-Exempt Fund, P.O. Box N, Bellingham, WA 98227. We will begin sending you a single copy with subsequent report mailings.
Annual Report November 30, 2008 | 15
(graphic omitted)
Saturna Capital
1300 N. State Street
Bellingham, WA 98225
www.saturna.com
(800) SATURNA
Item 2. Code of Ethics.
Registrant has adopted a code of ethics and is included with this submission as Exhibit (a). It may also be found on Registrant's website at http://www.saturna.com/ethicsdoc.htm.
Item 3. Audit Committee Financial Expert.
(a)(1)(i) The Trust has an audit committee financial expert serving on its audit committee.
(a)(2)(ii) Mr. John Moore, an independent Trustee (as defined for investment companies), was deemed qualified and agreed to serve.
Item 4. Principal Accountant Fees and Services.
(a) Audit Fees
For the fiscal years ending November 30, 2008 and 2007, the aggregate audit fees billed for professional services rendered by the principal accountant were $66,000 and $66,000. respectively.
(b) Audit-Related Fees
For the fiscal years ending November 30, 2008 and 2007, the aggregate audit related fees were $54,000 and $54,000 respectively. The nature of the services are: (1) auditing of the statements of assets and liabilities, related statements of operations and changes in net assets, and the financial highlights of each of the Funds; (2) auditing and reporting on the financial statements to be included in the Amendment to the Funds' Registration Statement, Form N-1A, to be filed with the Securities and Exchange Commission; (3) review of the Amendment to the Registration Statement; and (4) issuance of a Report on Internal Control Structure for inclusion in Form N-SAR.
(c) Tax Fees
For the fiscal years ending November 30, 2008 and 2007, the aggregate tax fees billed for professional services rendered by the principal accountant were $12,000 and $12,000, resepctively. Service includes preparation of the Funds' federal and state income tax returns.
(d) All Other Fees
There were no other fees billed by the principal accountant for the fiscal years ending November 30, 2008 and 2007.
(e)(1) Audit Committee Pre-Approval Policies and Procedures
The following is an excerpt from the Amana Mutual Funds Trust Audit Committee Charter:
D. Oversight of Independent Auditors
3. Pre-approval of Audit and Non-Audit Services. Except as provided below, the Committee's prior approval is necessary for the engagement of the independent auditors to provide any audit or non-audit services for the Trust and any non-audit services for any entity controlling, controlled by or under common control with Saturna that provides ongoing services to the Trust (Saturna and each such entity, an "Adviser Affiliate") where the engagement relates directly to the operations or financial reporting of the Trust. Non-audit services that qualify under the de minimis exception described in the Securities Exchange Act of 1934, as amended, and applicable rules thereunder, that were not pre-approved by the Committee, must be approved by the Committee prior to the completion of the audit. Pre-approval by the Committee is not required for engagements entered into pursuant to (a) pre-approval policies and procedures established by the Committee, or (b) pre-approval granted by one or more members of the Co mmittee to whom, or by a subcommittee to which, the Committee has delegated pre-approval authority, provided in either case, that the Committee is informed of each such service at its next regular meeting.
(e) (2) Percentages of Services
One hundred percent of the services described in each of paragraphs (b) through (d) were approved by the audit committee pursuant to paragraph (c)(7)(i)(C) of Rule 2-01 of Regulation S-X.
(f) Not applicable.
(g) Not applicable.
(h) Not applicable.
Item 5. Audit Committee of Listed Registrants.
Not applicable.
Item 6. Schedule of Investments
The schedule is included as part of the report to shareholders filed under Item 1 of this Form.
Item 7. Disclosure of Proxy Voting Policies and Procedures for Closed-End Management Investment Companies.
Not applicable.
Item 8. Portfolio Managers of Closed-End Management Investment Companies.
Not applicable.
Item 9. Purchases of Equity Securities by Closed-End Management Investment Company and Affiliated Purchasers.
Not applicable.
Item 10. Submission of Matters to a Vote of Security Holders.
Not applicable.
Item 11. Controls and Procedures.
(a) Internal control over financial reporting is under the supervision of the principal executive and financial officers. On December 29, 2008, Mr. Nicholas Kaiser (President) and Mr. Christopher Fankhauser (Treasurer), reviewed the internal control procedures for Saturna Investment Trust and found them reasonable and adequate.
(b) No change.
Item 12. Exhibits
Exhibits included with this filing:
(a) Code of Ethics.
(b) Certifications.
(1) Nicholas Kaiser, President, Saturna Investment Trust
(2) Christopher Fankhauser, Treasurer, Saturna Investment Trust
SIGNATURES
Pursuant to the requirements of the Securities Exchange Act of 1934 and the Investment Company Act of 1940, the registrant has duly caused this report to be signed on its behalf by the undersigned, thereunto duly authorized.
SATURNA INVESTMENT TRUST
By:
/s/ Nicholas Kaiser
Nicholas Kaiser, President
Date: January 29, 2009
Pursuant to the requirements of the Securities Exchange Act of 1934 and the Investment Act of 1940, this report has been signed below by the following persons on behalf of the registrant and in the capacities and on the dates indicated.
By:
/s/ Nicholas Kaiser
Nicholas Kaiser, President
Date: January 29, 2009
By:
/s/ Christopher Fankhauser
Christopher Fankhauser, Treasurer
Date: January 29, 2009