SECURITIES AND EXCHANGE COMMISSION
WASHINGTON, DC 20549
FORM N-CSR
CERTIFIED SHAREHOLDER REPORT OF REGISTERED
MANAGEMENT INVESTMENT COMPANIES
Investment Company Act file number: 811-05071 or 33-13247
SATURNA INVESTMENT TRUST
(Exact Name of Registrant as Specified in Charter)
1300 N. State Street
Bellingham, Washington 98225-4730
(Address of Principal Executive Offices, including ZIP Code)
Nicholas F. Kaiser
1300 N. State Street
Bellingham, Washington 98225-4730
(Name and Address of Agent for Service)
Registrant's Telephone Number — (360) 734-9900
Date of fiscal year end: November 30, 2011
Date of reporting period: November 30, 2011
Item 1. Annual Report.
Sextant Mutual Funds
| Short-Term Bond | Bond Income | Core | Growth | International |
Annual Report
November 30, 2011
Performance Summary (as of December 31, 2011) (unaudited)
Comparative returns and percentile Morningstar™ category rankings (1 is best)†
| Average Annual Returns vs. Category Average Returns | 10 Year | 5 Year | 3 Year | 1 Year | Expense Ratio¹ |
| Sextant Short-Term Bond vs. Short-Term Bond category | |||||
| Fund return | 3.58% | 3.87% | 3.91% | 1.95% | 1.34% |
| Morningstar category | 3.38% | 3.48% | 5.12% | 1.66% | N/A |
| % Rank (category size) | 41 (179) | 37 (322) | 69 (353) | 33 (405) | N/A |
| Sextant Bond Income vs. Intermediate-Term Bond category | |||||
| Fund return | 5.51% | 5.90% | 8.39% | 9.87% | 1.24% |
| Morningstar category | 5.22% | 5.63% | 9.22% | 5.86% | N/A |
| % Rank (category size) | 41 (582) | 52 (873) | 60 (1018) | 2 (1195) | N/A |
| Sextant Core² vs. Moderate Allocation category | |||||
| Fund return | N/A | N/A | 9.97% | 2.37% | 1.21% |
| Morningstar category | 3.93% | 1.33% | 11.54% | -0.11% | N/A |
| % Rank (category size) | N/A | N/A | 79 (843) | 20 (963) | N/A |
| Sextant Growth vs. Large Growth category | |||||
| Fund return | 4.46% | 0.11% | 10.35% | -1.81% | 1.01% |
| Morningstar category | 2.29% | 0.79% | 15.34% | -2.46% | N/A |
| % Rank (category size) | 9 (804) | 60 (1279) | 93 (1478) | 49 (1683) | N/A |
| Sextant International vs. Foreign Large Blend category | |||||
| Fund return | 7.54% | 1.40% | 7.95% | -8.76% | 1.03% |
| Morningstar category | 4.00% | -4.65% | 7.79% | -13.97% | N/A |
| % Rank (category size) | 4 (317) | 1 (563) | 49 (737) | 8 (817) | N/A |
Performance data quoted above represents past performance, is before any taxes payable by shareowners, and is no guarantee of future results. Current performance may be higher or lower than that stated herein. Performance current to the most recent month-end is available by calling toll-free (800) SATURNA or visiting www.sextantfunds.com. The investment return and principal value of an investment will fluctuate so that an investor's shares, when redeemed, may be worth more or less than their original cost. Total returns are historical and include change in share value, and reinvestment of dividends and capital gains, if any, and do not include the potential deduction of a 2% redemption fee on shares held less than 90 days. The Adviser has absorbed, currently or in the past, certain Fund expenses, without which total returns would have been lower. Funds that invest in foreign securities may involve greater risk, including political and economic uncertainties of foreign countries as well as the risk of currency fluctuations.
Please consider an investment's objective, risks, charges, and expenses carefully before investing. To obtain a free prospectus or summary prospectus that contains this and other important information, please call toll-free (800) SATURNA or visit www.sextantfunds.com. Please read the prospectus or summary prospectus carefully before investing.
¹By regulation, the expense ratios shown in this table are as of the Funds' most recent prospectus which is dated March 25, 2011, and incorporates results from the fiscal year ended November 30, 2010. Ratios presented in this table differ from the expense ratios shown elsewhere in this report as they represent different fiscal periods. Also by regulation, the performance in this table represents the most recent quarter-end performance rather than performance through the Funds' most recent fiscal period (shown on page 4). Average annual total returns include changes in principal value, reinvested dividends and capital gain distributions, if any.
²Sextant Core began operations March 30, 2007.
†Morningstar 12/31/2011. Morningstar, Inc. is an independent fund performance monitor. Rankings are determined monthly from total returns by Morningstar, by category as determined by Morningstar. The 12-month Rank shows how each Fund ranks in its Morningstar peer category for the 12 months ended Dec. 31, 2011. Morningstar calculates total return by taking the change in a fund's NAV, assuming the reinvestment of all income and capital gains distributions (on the actual reinvestment date used by the fund) during the period, and then dividing by the initial NAV. Unless marked as load-adjusted total returns, Morningstar does not adjust total return for sales charges or for redemption fees. (Morningstar Return™, Morningstar Risk-Adjusted Ratings™, and the load-adjusted returns do incorporate those fees.) Total returns do account for management, administrative, and 12b-1 fees and other costs automatically deducted from fund assets.
Sextant Short-Term Bond was 74th of 179 Short-Term Bond funds in the last 10 years, 120th of 322 funds in the last 5 years, 244th of 353 funds in the last 3 years, and 135th of 405 funds in the last year. Sextant Bond Income was 237th of 582 Intermediate-Term Bond funds in the last 10 years, 452nd of 873 funds in the last 5 years, 610th of 1018 funds in the last 3 years, and 14th of 1195 funds in the last year. Sextant Core was 669th of 843 Moderate Allocation funds in the last 3 years, and 186th of 963 funds in the last year. Sextant Growth was 71st of 804 Large Growth funds in the last 10 years, 771st of 1279 funds in the last 5 years, 1380th of 1478 funds in the last 3 years, and 817th of 1683 funds in the last year. Sextant International was 12th of 317 Foreign Large Blend funds in the last 10 years, 1st of 563 funds in the last 5 years, 363rd of 737 funds in the last 3 years, and 66th of 817 funds in the last year.
2 | November 30, 2011 Annual Report
Fellow Shareowners:
As the world worries about recession, financial crises, and spending addictions, the Sextant Funds have done relatively well. For the fiscal year ended November 30, 2011, Sextant Growth returned 3.07%, Sextant International declined just 3.31%, and Sextant Core Fund appreciated 4.42%. During the same period the S&P U.S. 500 Index returned 7.83%, while the S&P Global 1200 Index returned 1.98%.
Lack of inflation helped the bond markets over the last year. For the most safety-conscious, the low volatility Sextant Short-Term Bond Fund returned 1.42%. The longer-term Sextant Bond Income Fund returned 6.95%, garnering an exceptional top 2% performance ranking among its peers in the Morningstar Intermediate-Term Bond category.
Assets of four of the five Sextant Funds increased, with the total up 8% for the twelve months to $206.6 million. The combination of spreading fixed expenses over higher assets and the effects of Sextant's performance fee structure (based on one-year results relative to Morningstar categories) lowered annualized expense ratios for all but the Bond Income Fund, whose expenses are nonetheless capped at .90%.
Long-term Results
As long-term investors, we stress the importance of measuring performance over multiple years. This reveals how a fund performs during both good times and bad. The Performance Summary tables (for calendar years ended December 31, 2011 on the previous page, and for fiscal years ended November 30, 2011 on the next page) provide comparative returns and Morningstar category rankings, so you may review Fund performance for periods up to ten years.
Going Forward
Governments everywhere are being forced to make cuts, and economic growth is slow as worried consumers and employers hold back on spending. Central banks are printing money to support banks and sovereign debt, yet deflation appears more likely than inflation. Interest rates are at multi-generational lows, but the resulting economic stimulus is minimal due to the shyness of lenders.
This creates a mixed climate for the world's equity markets. We will continue to invest in innovative companies with the strong business advantages and balance sheets needed to navigate these trying times. We aim to avoid companies dependent on government spending, and the regions and countries that will be hurt the most in the new austerity.
Turbulent times also create opportunity, and we seek entrepreneurial companies that can grow profits. Indeed, equity investors are optimistic that better-than-expected earnings at companies from Apple to UPS mean they will be rewarded.
Sextant Funds stress low operating expenses
— the five Funds have an average expense ratio of 0.88%
We expect a long, slow transition to higher interest rates. Bondholders are being rewarded with real returns. Lowinterest rates today reflect high confidence among Americans and investors around the world that current economic storms will be survived.
Going forward, the Sextant Funds continue to offer investors a broad mix of investment vehicles: growth equities, international exposure, a blended portfolio, plus short-term and long-term fixed income options. This array of portfolios serves our investors in both bull and bear markets by continuing to provide steady, long-term growth with a focus on preservation of capital.
We are pleased to report that because of the fulcrum advisory fee structure, in combination with the adviser's extended commitment to waive fees for the Bond Income and Short-Term Bond Funds, the Sextant fund family has a 2011 dollar-weighted average expense ratio of 0.88%. We invite you to review the following pages for more in-depth information about each Fund.
Respectfully,
Nicholas Kaiser, President
(Manager — Sextant Growth, Sextant International)
Phelps McIlvaine, Vice President
(Manager — Sextant Short-Term Bond, Sextant Bond Income)
Peter Nielsen, Senior Analyst
(Manager — Sextant Core)
November 30, 2011 Annual Report | 3
Performance Summary (as of November 30, 2011) (unaudited)
Comparative returns and percentile Morningstar™ category rankings (1 is best)†
| Average Annual Returns vs. Category Average Returns | 10 Year | 5 Year | 3 Year | 1 Year | Expense Ratio¹ |
| Sextant Short-Term Bond vs. Short-Term Bond category | |||||
| Fund return | 3.57% | 3.82% | 4.34% | 1.42% | 1.34% |
| Morningstar category | 3.33% | 3.43% | 5.47% | 0.97% | N/A |
| % Rank (category size) | 38 (179) | 38 (316) | 68 (353) | 28 (402) | N/A |
| Sextant Bond Income vs. Intermediate-Term Bond category | |||||
| Fund return | 5.33% | 5.47% | 9.46% | 6.95% | 1.24% |
| Morningstar category | 5.03% | 5.29% | 10.04% | 3.83% | N/A |
| % Rank (category size) | 40 (576) | 54 (863) | 54 (1015) | 2 (1185) | N/A |
| Sextant Core² vs. Moderate Allocation category | |||||
| Fund return | N/A | N/A | 10.70% | 4.42% | 1.21% |
| Morningstar category | 3.96% | 1.41% | 12.53% | 3.62% | N/A |
| % Rank (category size) | N/A | N/A | 82 (844) | 34 (955) | N/A |
| Sextant Growth vs. Large Growth category | |||||
| Fund return | 4.91% | 0.13% | 10.80% | 3.07% | 1.01% |
| Morningstar category | 2.53% | 1.06% | 16.60% | 4.07% | N/A |
| % Rank (category size) | 8 (786) | 66 (1255) | 94 (1470) | 64 (1660) | N/A |
| Sextant International vs. Foreign Large Blend category | |||||
| Fund return | 7.94% | 2.26% | 9.20% | -3.31% | 1.03% |
| Morningstar category | 4.39% | -3.63% | 11.12% | -5.25% | N/A |
| % Rank (category size) | 5 (315) | 1 (547) | 72 (729) | 29 (808) | N/A |
Performance data quoted above represents past performance and is no guarantee of future results. Results are shown for 12 months ended November 30, 2011 ("1 Year" column above) because the Sextant Funds' performance fees are based on the same period. Results are shown for other fiscal periods by regulation. The Adviser has absorbed, currently or in the past, certain Fund expenses, without which total returns would have been lower.
¹By regulation, the expense ratios shown in this table are as of the Funds' most recent prospectus which is dated March 25, 2011, and incorporates results from the fiscal year ended November 30, 2010. Ratios presented in this table differ from expense ratios shown elsewhere in this report as they represent different fiscal periods.
²Sextant Core began operations on March 30, 2007.
†Morningstar 11/30/2011. Morningstar, Inc. is an independent fund performance monitor. Rankings are determined monthly from total returns by Morningstar, by category as determined by Morningstar. The 1 Year Rank shows how each Fund ranks in its Morningstar peer category for the year ended November 30, 2011.
Sextant Short-Term Bond was 69th of 179 Short-Term Bond funds in the last 10 years, 120th of 316 funds in the last 5 years, 240th of 353 funds in the last 3 years, and 111th of 402 funds in the last year. Sextant Bond Income was 231st of 576 Intermediate-Term Bond funds in the last 10 years, 464th of 863 funds in the last 5 years, 554th of 1015 funds in the last 3 years, and 16th of 1185 funds in the last year. Sextant Core was 694th of 844 Moderate Allocation funds in the last 3 years, and 323rd of 955 funds in the last year. Sextant Growth was 64th of 786 Large Growth funds in the last 10 years, 835th of 1255 funds in the last 5 years, 1383rd of 1470 funds in the last 3 years, and 1073rd of 1660 funds in the last year. Sextant International was 14th of 315 Foreign Large Blend funds in the last 10 years, 1st of 547 funds in the last 5 years, 530th of 729 funds in the last 3 years, and 231st of 808 funds in the last year.
4 | November 30, 2011 Annual Report
Sextant Short-Term Bond Fund
Performance Summary (unaudited)
| Average Annual Returns (as of November 30, 2011) | ||||
| 10 Year | 5 Year | 1 Year | Expense Ratio¹ | |
| Sextant Short-Term Bond Fund | 3.57% | 3.82% | 1.42% | 1.34% |
| Citigroup Gov./Corp. Inv. Grade Index 1-3 Years | 3.62% | 3.97% | 1.27% | N/A |
Growth of $10,000
 | Comparison of any mutual fund to a market index must be made bearing in mind that the index is unmanaged, and expense-free. Conversely, the fund will (1) be actively managed; (2) have an objective other than mirroring the index, such as limiting risk; (3) bear transaction and other costs; (4) stand ready to buy and sell its securities to shareowners on a daily basis; and (5) provide a wide range of services. The graph compares $10,000 invested in the Fund on November 30, 2001, to an identical amount invested in the Citigroup Gov./Corp. Investment Grade Index 1-3 Years, a broad-based index of investment grade bond prices. The graph shows that an investment in the Fund would have risen to $14,197 versus $14,273 in the index. |
| Past performance does not guarantee future results. The "Growth of $10,000" graph and "Average Annual Returns" performance table assume the reinvestment of dividends and capital gains. They do not reflect the deduction of taxes that a shareowner might pay on fund distributions or the redemption of fund shares, nor do they reflect the potential deduction of a 2% redemption fee on shares held less than 90 calendar days. The Adviser has absorbed, currently or in the past, certain Fund expenses, without which total returns would have been lower. ¹ By regulation, the expense ratio for the Fund shown in this table is as of the Fund's most recent prospectus which is dated March 25, 2011, and incorporates results for the fiscal year ended November 30, 2010. The ratio presented in this table differs from the expense ratios shown elsewhere in this report as they represent different fiscal periods and differs from the actual expense ratio which reflects the adviser's expense cap. | |
Fund Objective
The objectives of the Short-Term Bond Fund are capital preservation and current income.
| Portfolio Diversification | Top Ten Holdings | ||
| % of total net assets | |||
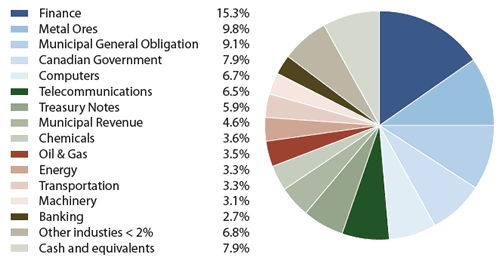 Industry weightings are shown as a percentage of total net assets. | U.S. Treasury Note 1.50% due 12/31/2013 | 5.9% | |
| Oracle 3.75% due 07/08/2014 | 4.4% | ||
| Blackrock 3.50% due 12/10/2014 | 4.4% | ||
| Deutsche Telecom Int. Fin. 5.25% due 07/22/2013 | 4.3% | ||
| Canada Government 2.375% due 09/10/2014 | 4.0% | ||
| Ontario Prov. Canada 4.10% due 06/16/2014 | 3.9% | ||
| American Express Bank Med. Term CD 4.75% due 12/24/2013 | 3.9% | ||
| PNC Funding 5.40% due 06/10/2014 | 3.6% | ||
| Clorox 5.00% due 01/15/2015 | 3.6% | ||
| Teck Resources 9.75% due 05/15/2014 | 3.5% | ||
November 30, 2011 Annual Report | 5
Sextant Short-Term Bond Fund
Discussion of Fund Performance (unaudited)
Fiscal Year 2011
For the fiscal year ended November 30, 2011, the Sextant Short-Term Bond Fund returned 1.42%. This annual return compared favorably with that of its Morningstar category peer group, which returned an average of .97% during the same period. The Fund's share price declined slightly from $5.12 to $5.10. Net investment income reflected the market's low rates, declining from 2.42% to 1.79%. For the five years ending November 30, 2011, the Fund provided a 3.82% annualized total return versus 3.43% for its Morningstar peer category group. Fund shares outstanding rose 18.9%. Fund assets rose 18.5%. Reflecting Saturna Capital's voluntary subsidies to cap operating expenses, the Fund's effective expense ratio remained at 0.75%.
Factors Affecting Past Performance
2011 was an exceptional year for U.S. bond markets. The U.S. Federal Reserve's near-zero federal funds policy and persistent global demand for high quality, short-term, interest-bearing, U.S. dollar denominated assets drove short-term yields down. Despite rising U.S. government debt, rising credit default swap premiums, and a credit downgrade, U.S. Treasury yields shorter than five years dropped below one percent; two-year note yields fell to one quarter of one percent; and Treasury Bill yields moved to, and in some cases through, zero percent. Recent volatile corporate spreads may indicate short corporate note yields are approaching a floor.
For the fiscal year ended November 30th, short BBB rated corporate bonds returned 2.2%, AAA/AA corporate paper returned 2.06%, and short U.S. Treasury notes returned just 1.47%, as investors sacrificed quality for yield. Fund investments in taxable municipal bonds and Canadian Yankee securities, and underweight positions in U.S. Treasury notes and bank paper, augmented returns. The Fund's duration remained in the middle of its range for the year.
Looking Forward
We expect the Federal Reserve Bank to keep the federal funds rate, and thereby all short-term rates, at exceptionally low levels for the coming year. Yield will be increasingly difficult to find in short markets. The federal deficit and the modest results of the 2009 American Recovery and Reinvestment Act ("ARRA") stimulus law limit the further use of fiscal stimulus in 2012. State and local spending are unlikely to boost economic growth. Any further retrenchment in business or consumer spending will put the federal government in a difficult situation with few effective countermeasures. European debt deleveraging will continue to hobble global economic growth, and will require hyper-low U.S. rates and supplemental liquidity through next year. For 2012, the most effective policy against a U.S. recession and deflation is monetary. We expect the Federal Reserve Bank to focus on growth, to keep the federal funds rate near zero, to expand eurodollar currency swaps for European banks, and to employ more quantitative easing. In an election year, we expect the Federal Reserve Bank to avoid any radical policy reversals. Considering another year of stable federal funds policy, the Fund's share net asset value may again move in a narrow range.
The Fund will continue to search for yield in investment grade securities, such as our recent commitments to Build America Bonds, Canadian, and other North American Yankee paper.
Management Fee Calculations
The Sextant Short-Term Bond Fund calculates the performance part of its management fee by comparing the Fund's return to the average return of Morningstar's™ "Short Term Bond" category. The Fund's 12-month return (1.42%) was less than one percent above the Morningstar™ average (0.97%) at month-end November 30, 2011. Therefore, the basic annual management fee of 0.60% was charged for the month of December 2011. Note that the management fee is almost entirely waived due to the adviser's voluntary cap (at 0.75%) on total Fund expenses.
| Bond Quality Diversification |
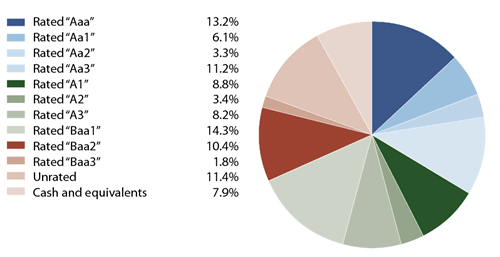 Based on total net assets as of 11/30/2011. Source: Moody's Investors Services. |
6 | November 30, 2011 Annual Report
Sextant Short-Term Bond Fund
| Schedule of Investments | ||||
| Issuer | Coupon/Maturity | Face Amount | Market Value | Percentage of Assets |
| Certificate of Deposit — 3.9% | ||||
| Finance | ||||
| American Express Bank Med. Term CD | 4.75% due 12/24/2013 | $220,000 | $235,457 | 3.9% |
| Corporate Bonds — 60.7% | ||||
| Banking | ||||
| Bank of New York Mellon | 6.375% due 04/01/2012 | 160,000 | 163,044 | 2.7% |
| Chemicals | ||||
| Clorox | 5.00% due 01/15/2015 | 200,000 | 216,721 | 3.6% |
| Computers | ||||
| International Business Machines | 5.05% due 10/22/2012 | 135,000 | 140,227 | 2.3% |
| Oracle | 3.75% due 07/08/2014 | 250,000 | 270,032 | 4.4% |
| 385,000 | 410,259 | 6.7% | ||
| Diversified Financial Services | ||||
| General Electric Capital | 5.25% due 10/19/2012 | 100,000 | 103,969 | 1.7% |
| Energy | ||||
| Noble | 5.875% due 06/01/2013 | 190,000 | 202,095 | 3.3% |
| Finance | ||||
| BlackRock | 3.50% due 12/10/2014 | 250,000 | 266,985 | 4.4% |
| PNC Funding | 5.40% due 06/10/2014 | 200,000 | 217,939 | 3.6% |
| Protective Life Secured Trust | 5.00% due 05/15/2013 | 200,000 | 207,527 | 3.4% |
| 650,000 | 692,451 | 11.4% | ||
| Food & Food Products | ||||
| Coca Cola Hellenic | 5.125% due 09/17/2013 | 100,000 | 106,163 | 1.7% |
| Insurance | ||||
| Berkshire Hathaway Financial | 4.75% due 05/15/2012 | 100,000 | 101,770 | 1.6% |
| Machinery | ||||
| Stanley Works | 4.90% due 11/01/2012 | 180,000 | 185,695 | 3.1% |
| Medical | ||||
| Express Scripts | 6.25% due 06/15/2014 | 100,000 | 109,418 | 1.8% |
| Metal Ores | ||||
| Rio Tinto Finance | 8.95% due 05/01/2014 | 150,000 | 175,452 | 2.9% |
| Teck Resources | 9.75% due 05/15/2014 | 180,000 | 212,412 | 3.5% |
| Xstrata Canada | 7.35% due 06/05/2012 | 200,000 | 206,044 | 3.4% |
| 530,000 | 593,908 | 9.8% | ||
| Continued on next page. | ||||
The accompanying notes are an integral part of these financial statements.
November 30, 2011 Annual Report | 7
Sextant Short-Term Bond Fund
| Schedule of Investments | ||||
| Issuer | Coupon/Maturity | Face Amount | Market Value | Percentage of Assets |
| Oil & Gas | ||||
| Encana | 4.75% due 10/15/2013 | $100,000 | $105,084 | 1.7% |
| Kinder Morgan Energy Partners | 5.00% due 12/15/2013 | 100,000 | 106,294 | 1.8% |
| 200,000 | 211,378 | 3.5% | ||
| Telecommunications | ||||
| Deutsche Telecom Int. Fin. | 5.25% due 07/22/2013 | 250,000 | 263,568 | 4.3% |
| Verizon New England | 4.75% due 10/01/2013 | 129,000 | 135,779 | 2.2% |
| 379,000 | 399,347 | 6.5% | ||
| Transportation | ||||
| SeaRiver Maritime | 0.00% due 09/01/2012 | 202,000 | 198,487 | 3.3% |
| Total Corporate Bonds | 3,476,000 | 3,694,705 | 60.7% | |
| Foreign Government — 7.9% | ||||
| Canadian Government | ||||
| Canada Government | 2.375% due 09/10/2014 | 230,000 | 241,705 | 4.0% |
| Ontario Prov. Canada | 4.10% due 06/16/2014 | 220,000 | 237,875 | 3.9% |
| 450,000 | 479,580 | 7.9% | ||
| Municipal Bonds — 13.7% | ||||
| General Obligation | ||||
| Commerce Charter TWP Michigan | 5.50% due 12/01/2013 | 125,000 | 134,276 | 2.2% |
| Manhattan KS | 3.276% due 12/01/2013 | 180,000 | 186,457 | 3.1% |
| Passaic NJ Taxable Pension GO | 5.00% due 02/01/2013 | 100,000 | 100,517 | 1.6% |
| Southwestern MI Comm. College | 4.875% due 05/15/2015 | 125,000 | 135,440 | 2.2% |
| 530,000 | 556,690 | 9.1% | ||
| Revenue | ||||
| Dawson Springs KY ISD Bldg.¹ | 3.60% due 08/01/2013 | 95,000 | 98,951 | 1.6% |
| Rhode Island Econ. Dev. Corp. | 4.52% due 05/15/2013 | 175,000 | 180,840 | 3.0% |
| 270,000 | 279,791 | 4.6% | ||
| Total Municipal Bonds | 800,000 | 836,481 | 13.7% | |
| U.S. Government — 5.9% | ||||
| Treasury Notes | ||||
| U.S. Treasury Note | 1.50% due 12/31/2013 | 350,000 | 358,969 | 5.9% |
| Total investments | Cost = $5,494,465 | $5,296,000 | 5,605,192 | 92.1% |
| Other assets (net of liabilities) | 481,219 | 7.9% | ||
| Total net assets | $6,086,411 | 100.0% | ||
| ¹ Indicates an odd lot. Please refer to page 40 for more information regarding odd lots. | ||||
The accompanying notes are an integral part of these financial statements.
8 | November 30, 2011 Annual Report
Sextant Short-Term Bond Fund
| Statement of Assets and Liabilities | ||
| As of November 30, 2011 | ||
| Assets | ||
| Investments in securities, at value (Cost $5,494,465) | $5,605,192 | |
| Cash | 415,183 | |
| Interest receivable | 69,982 | |
| Receivable for Fund shares sold | 1,959 | |
| Total assets | 6,092,316 | |
| Liabilities | ||
| Payable to affiliates | 3,136 | |
| Other liabilities | 1,513 | |
| Accrued distribution fee | 1,197 | |
| Distributions payable | 59 | |
| Total liabilities | 5,905 | |
| Net Assets | $6,086,411 | |
| Analysis of net assets | ||
| Paid-in capital (unlimited shares authorized, without par value) | $5,987,530 | |
| Unrealized net appreciation on investments | 110,727 | |
| Accumulated net realized loss | (13,227) | |
| Undistributed net investment income | 1,381 | |
| Net assets applicable to Fund shares outstanding | $6,086,411 | |
| Fund shares outstanding | 1,193,328 | |
| Net asset value, offering and redemption price per share | $5.10 | |
| Statement of Operations | ||
| Year ended November 30, 2011 | ||
| Investment income | ||
| Interest income | $147,196 | |
| Miscellaneous income | 5 | |
| Gross investment income | 147,201 | |
| Expenses | ||
| Investment adviser fees | 33,952 | |
| Filing and registration fees | 18,009 | |
| Distribution fees | 14,482 | |
| Retirement plan custodial fees | 4,394 | |
| Audit fees | 2,500 | |
| Trustee fees | 1,435 | |
| Printing and postage | 1,118 | |
| Chief Compliance Officer expenses | 833 | |
| Custodian fees | 264 | |
| Legal fees | 174 | |
| Total gross expenses | 77,161 | |
| Less adviser fees waived | (33,428) | |
| Less custodian fee credits | (264) | |
| Net expenses | 43,469 | |
| Net investment income | $103,732 | |
| Net realized gain from investments | $11,001 | |
| Net decrease in unrealized appreciation on investments | (25,583) | |
| Net loss on investments | ($14,582) | |
| Net increase in net assets resulting from operations | $89,150 | |
The accompanying notes are an integral part of these financial statements.
November 30, 2011 Annual Report | 9
Sextant Short-Term Bond Fund
| Statements of Changes in Net Assets | Year ended Nov. 30, 2011 | Year ended Nov. 30, 2010 |
| Increase (decrease) in net assets from operations: | ||
| From operations | ||
| Net investment income | $103,732 | $113,514 |
| Net realized gain on investments | 11,001 | 7,888 |
| Net increase (decrease) in unrealized appreciation | (25,583) | 12,990 |
| Net increase in net assets | 89,150 | 134,392 |
| Distributions to shareholders from | ||
| Net investment income | (103,724) | (113,515) |
| Capital share transactions | ||
| Proceeds from sales of shares | 2,045,149 | 1,562,715 |
| Value of shares issued in reinvestment of dividends | 102,228 | 112,390 |
| Early redemption fees retained | 41 | 165 |
| Cost of shares redeemed | (1,182,063) | (630,567) |
| Net increase in net assets | 965,355 | 1,044,703 |
| Total increase in net assets | 950,781 | 1,065,580 |
| Net assets | ||
| Beginning of year | 5,135,630 | 4,070,050 |
| End of year | 6,086,411 | 5,135,630 |
| Undistributed net investment income | $1,381 | $1,373 |
| Shares of the Fund sold and redeemed | ||
| Number of shares sold | 401,308 | 307,479 |
| Number of shares issued in reinvestment of dividends | 20,041 | 22,074 |
| Number of shares redeemed | (231,990) | (123,942) |
| Net increase in number of shares outstanding | 189,359 | 205,611 |
| Financial Highlights | For year ended November 30, | ||||
| Selected data per share of outstanding capital stock throughout each year: | 2011 | 2010 | 2009 | 2008 | 2007 |
| Net asset value at beginning of year | $5.12 | $5.10 | $4.84 | $4.99 | $4.90 |
| Income from investment operations | |||||
| Net investment income | 0.09 | 0.12 | 0.16 | 0.18 | 0.17 |
| Net gain (loss) on securities (both realized and unrealized) | (0.02) | 0.02 | 0.26 | (0.15) | 0.09 |
| Total from investment operations | 0.07 | 0.14 | 0.42 | 0.03 | 0.26 |
| Less distributions | |||||
| Dividends (from net investment income) | (0.09) | (0.12) | (0.16) | (0.18) | (0.17) |
| Total distributions | (0.09) | (0.12) | (0.16) | (0.18) | (0.17) |
| Paid-in capital from early redemption fees | 0.00¹ | 0.00¹ | 0.00¹ | 0.00¹ | 0.00¹ |
| Net asset value at end of year | $5.10 | $5.12 | $5.10 | $4.84 | $4.99 |
| Total return | 1.42% | 2.87% | 8.87% | 0.66% | 5.51% |
| Ratios / supplemental data | |||||
| Net assets ($000), end of year | $6,086 | $5,136 | $4,070 | $3,024 | $2,995 |
| Ratio of expenses to average net assets | |||||
| Before fee waivers and custodian fee credits | 1.33% | 1.34% | 1.49% | 1.60% | 1.58% |
| After fee waivers | 0.75% | 0.76% | 0.76% | 0.77% | 0.82% |
| After fee waivers and custodian fee credits | 0.75% | 0.75% | 0.75% | 0.75% | 0.75% |
| Ratio of net investment income after fee waivers and custodian fee credits to average net assets | 1.79% | 2.42% | 3.26% | 3.70% | 3.54% |
| Portfolio turnover rate | 14% | 27% | 28% | 22% | 28% |
| ¹Amount is less than $0.01 | |||||
The accompanying notes are an integral part of these financial statements.
10 | November 30, 2011 Annual Report
Sextant Bond Income Fund
Performance Summary (unaudited)
| Average Annual Returns (as of November 30, 2011) | ||||
| 10 Year | 5 Year | 1 Year | Expense Ratio¹ | |
| Sextant Bond Income Fund | 5.33% | 5.47% | 6.95% | 1.24% |
| Citigroup Broad Investment Grade Bond Index | 5.71% | 6.32% | 5.43% | N/A |
Growth of $10,000
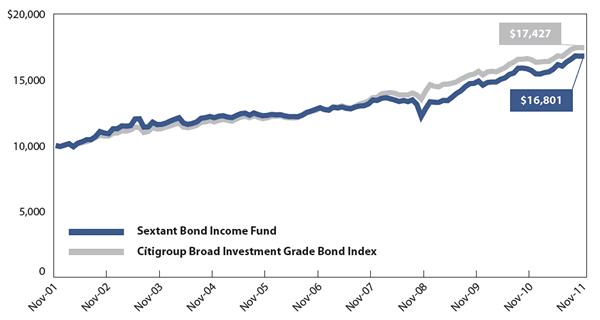 | Comparison of any mutual fund to a market index must be made bearing in mind that the index is unmanaged, and expense-free. Conversely, the fund will (1) be actively managed; (2) have an objective other than mirroring the index, such as limiting risk; (3) bear transaction and other costs; (4) stand ready to buy and sell its securities to shareowners on a daily basis; and (5) provide a wide range of services. The graph compares $10,000 invested in the Fund on November 30, 2001, to an identical amount invested in the Citigroup Broad Investment Grade Bond Index, a broad-based index of investment grade bond prices. The graph shows that an investment in the Fund would have risen to $16,801 versus $17,427 in the index. |
| Past performance does not guarantee future results. The "Growth of $10,000" graph and "Average Annual Returns" performance table assume the reinvestment of dividends and capital gains. They do not reflect the deduction of taxes that a shareowner might pay on fund distributions or the redemption of fund shares, nor do they reflect the potential deduction of a 2% redemption fee on shares held less than 90 calendar days. The Adviser has absorbed, currently or in the past, certain Fund expenses, without which total returns would have been lower. ¹ By regulation, the expense ratio for the Fund shown in this table is as of the Fund's most recent prospectus which is dated March 25, 2011, and incorporates results for the fiscal year ended November 30, 2010. The ratio presented in this table differs from the expense ratios shown elsewhere in this report as they represent different fiscal periods and differs from the actual expense ratio which reflects the adviser's expense cap. | |
Fund Objective
The objective of the Bond Income Fund is current income.
| Portfolio Diversification | Top Ten Holdings | ||
| % of total net assets | |||
 Industry weightings are shown as a percentage of total net assets. | American Municipal Power Ohio Rev. 7.20% due 02/15/2029 | 4.5% | |
| Johnson Co. KS Bldg Ls./Pr. Rev. BAB 4.60% due 09/01/2026 | 3.8% | ||
| Springville UT GO BAB 5.30% due 05/01/2031 | 3.7% | ||
| Bank of Nova Scotia Yankee 3.00% due 11/16/2026 | 3.6% | ||
| Teva Pharmaceutical Fin IV BV 3.65% due 11/10/2021 | 3.6% | ||
| Quebec Canada Yankee 7.125% due 02/09/2024 | 3.6% | ||
| Entergy Louisiana 5.40% due 11/01/2024 | 3.3% | ||
| SeaRiver Maritime 0.00% due 09/01/2012 | 3.3% | ||
| San Marcos Texas ULTD GO BAB 6.028% due 08/15/2030 | 3.2% | ||
| Dell Rapids SCD 49-3 6.257% due 01/15/2030 | 3.2% | ||
November 30, 2011 Annual Report | 11
Sextant Bond Income Fund
Discussion of Fund Performance (unaudited)
Fiscal Year 2011
For the fiscal year ended November 30, 2011, the Sextant Bond Income Fund returned 6.95%. This annual return compared favorably with that of its Morningstar Category "Intermediate- Term Bond" peer group, which returned 3.83% during the same period. The Fund's share price rose from $5.03 to $5.19, and $0.18 in income dividends were distributed during the year. For the five years ended November 30, 2011, the Fund provided an annualized total return of 5.47% versus a 5.29% annualized return for the Morningstar peer group. Net investment income declined from 3.9% to 3.6% for the year. Investor inflows during the year resulted in Fund shares outstanding rising 21.2% and total net assets rising 25.2% during fiscal 2011. The Fund's gross expense ratio increased from 1.24% to 1.26% in large part due to the Fund's fulcrum advisory fee and its outperformance relative to its benchmark. Reflecting Saturna Capital's continued voluntary subsidies to cap operating expenses, the effective expense ratio remained at 0.90%.
Factors Affecting Past Performance
2011 was an exceptional year for U.S. bond markets. Deteriorating eurozone creditworthiness and volatile equity and commodity prices drove intermediate and long U.S. interest rates substantially lower in the second half of the year. Slowing growth in Japan, Europe and China kept short-term U.S. yields near zero. Sovereign credit default swap premiums, including those of the U.S., Germany and France, expanded for a second year. The U.S. Federal Reserve Bank's "Operation Twist" amplified the decline in intermediate and long-term yields. U.S. Federal Reserve Bank policies are now designed to prevent disinflation from becoming deflation.
Intermediate U.S. Treasury and U.S. Agency paper returned about 15%. The Fund was underweight in these sectors for the year. Intermediate AAA/AA corporate bonds returned more than 10%. A-rated and BBB-rated paper returned 8.8% and 9.3%, respectively. Unusual spread volatility toward the end of the year may indicate a growing resistance to further declines in absolute corporate bond yields. The Fund's recent investments in taxable municipal Build America Bonds, as well as Canadian government, provincial, and corporate bonds, augmented the Fund's performance.
With the federal funds rate near zero for a second year, long maturities returned substantially more than intermediate maturities. The Fund will maintain an underweight position in financial and bank issues during the coming year. The Fund's less than maximum, dollar-weighted average maturity meant the Fund missed an opportunity for even higher returns.
Looking Forward
The federal deficit and the modest results of the 2009 American Recovery and Reinvestment Act ("ARRA") stimulus law limit the further use of fiscal stimulus in 2012. State and local spending are unlikely to boost economic growth. Any further retrenchment in business or consumer spending will put the federal government in a difficult situation with few effective countermeasures. European debt deleveraging will continue to hobble global economic growth and will require hyper-low U.S. rates through next year. For 2012, the most effective policy against a U.S. recession and deflation is monetary. We expect the Federal Reserve Bank to focus on growth, to keep the federal funds rate near zero, to expand eurodollar currency swaps for European banks, and employ more quantitative easing. In an election year, we expect the Federal Reserve Bank to avoid any radical policy reversals.
Stimulative fiscal and monetary policies have limits and inflationary risks. Eventually, fiscal and monetary stimuli will be reversed. At that time, bond yields may normalize (rise), pushing the Fund's share net asset value lower. However, we do not expect a cyclical "V-shaped" turning point in interest rates to happen next year. Should the U.S. and global economies weaken, U.S. yields may even decline from here. For example, Japan's ten-year government note yield is about half that of the U.S. ten-year note.
Management Fee Calculations
The Sextant Bond Income Fund calculates the performance part of its management fee by comparing the Fund's return to the return of Morningstar's™ "Intermediate-Term Bond" category. The Fund's 12-month return (6.95%) was between two and four percent above the Morningstar™ category average (3.83%) at month-end November 30, 2011. Therefore, the basic annual management fee of 0.60% was increased to 0.80% annually for the month of December 2011. Note that significant portions of the management fee and distribution expense are waived due to the adviser's voluntary cap (at 0.90%) on total Fund expenses.
| Bond Quality Diversification |
 Based on total net assets as of 11/30/2011. Source: Moody's Investors Services. |
12 | November 30, 2011 Annual Report
Sextant Bond Income Fund
| Schedule of Investments | ||||
| Issuer | Coupon/Maturity | Face Amount | Market Value | Percentage of Assets |
| Corporate Bonds — 43.6% | ||||
| Automotive | ||||
| AutoZone | 5.50% due 11/15/2015 | $95,000 | $106,004 | 1.6% |
| Banking | ||||
| Bank of Nova Scotia Yankee | 3.00% due 11/16/2026 | 250,000 | 246,442 | 3.6% |
| Building | ||||
| Masco | 7.125% due 08/15/2013 | 60,000 | 62,582 | 0.9% |
| Chemicals | ||||
| Air Products & Chemicals | 8.75% due 04/15/2021 | 50,000 | 71,434 | 1.0% |
| Electronics | ||||
| Phillips Electronics | 7.25% due 08/15/2013 | 75,000 | 82,181 | 1.2% |
| Energy | ||||
| Baker Hughes | 6.875% due 01/15/2029 | 100,000 | 133,113 | 2.0% |
| ConocoPhillips | 6.00% due 01/15/2020 | 150,000 | 182,542 | 2.7% |
| StatoilHydro | 2.90% due 10/15/2014 | 200,000 | 209,949 | 3.1% |
| 450,000 | 525,604 | 7.8% | ||
| Finance | ||||
| Morgan Stanley Dean Witter | 6.75% due 10/15/2013 | 50,000 | 52,207 | 0.8% |
| Paine Webber Group | 7.625% due 02/15/2014 | 50,000 | 54,844 | 0.8% |
| 100,000 | 107,051 | 1.6% | ||
| Food Production | ||||
| H.J. Heinz | 6.00% due 03/15/2012 | 75,000 | 76,000 | 1.1% |
| Insurance | ||||
| Allstate | 7.50% due 06/15/2013 | 50,000 | 54,051 | 0.8% |
| Progressive | 7.00% due 10/01/2013 | 75,000 | 81,457 | 1.2% |
| St. Paul Travelers | 5.50% due 12/01/2015 | 125,000 | 139,636 | 2.1% |
| 250,000 | 275,144 | 4.1% | ||
| Machinery | ||||
| Deere & Co. | 8.10% due 05/15/2030 | 95,000 | 140,771 | 2.1% |
| Medical | ||||
| Pharmacia | 6.50% due 12/01/2018 | 100,000 | 124,199 | 1.8% |
| Teva Pharmaceutical | 3.65% due 11/10/2021 | 250,000 | 245,698 | 3.6% |
| 350,000 | 369,897 | 5.4% | ||
| Metal Ores | ||||
| BHP Finance U.S.A. | 5.25% due 12/15/2015 | 125,000 | 143,286 | 2.1% |
| Continued on next page. | ||||
The accompanying notes are an integral part of these financial statements.
November 30, 2011 Annual Report | 13
Sextant Bond Income Fund
| Schedule of Investments | ||||
| Issuer | Coupon/Maturity | Face Amount | Market Value | Percentage of Assets |
| Retail | ||||
| Wal-Mart Stores | 7.25% due 06/01/2013 | $45,000 | $49,376 | 0.7% |
| Transportation | ||||
| SeaRiver Maritime | 0.00% due 09/01/2012 | 225,000 | 221,087 | 3.3% |
| Southwest Airlines | 6.50% due 03/01/2012 | 75,000 | 75,909 | 1.1% |
| 300,000 | 296,996 | 4.4% | ||
| Utilities | ||||
| Commonwealth Edison | 7.50% due 07/01/2013 | 50,000 | 54,558 | 0.8% |
| Entergy Louisiana | 5.40% due 11/01/2024 | 200,000 | 224,352 | 3.3% |
| Florida Power & Light | 5.95% due 10/01/2033 | 100,000 | 126,640 | 1.9% |
| 350,000 | 405,550 | 6.0% | ||
| Total Corporate Bonds | 2,670,000 | 2,958,318 | 43.6% | |
| Foreign Government — 3.6% | ||||
| Canadian Government | ||||
| Quebec Canada Yankee | 7.125% due 02/09/2024 | 175,000 | 241,243 | 3.6% |
| Municipal Bonds — 33.8% | ||||
| General Obligation | ||||
| City of Burlington Taxable GO 2009 Series B | 5.75% due 11/01/2028 | 160,000 | 172,378 | 2.5% |
| Dell Rapids SCD 49-3 | 6.257% due 01/15/2030 | 200,000 | 216,244 | 3.2% |
| Dupage Co. II CCD #502 | 5.50% due 01/01/2026 | 150,000 | 160,816 | 2.4% |
| Idaho Hsg. & Fin GARVEE BAB A-2 | 5.379% due 07/15/2020 | 180,000 | 200,940 | 3.0% |
| Milan Co. MI Area Schools | 6.45% due 05/01/2024 | 150,000 | 164,331 | 2.4% |
| San Marcos Texas ULTD GO BAB | 6.028% due 08/15/2030 | 200,000 | 219,160 | 3.2% |
| Springville UT GO BAB | 5.30% due 05/01/2031 | 240,000 | 251,352 | 3.7% |
| 1,280,000 | 1,385,221 | 20.4% | ||
| Revenue | ||||
| American Municipal Power Ohio Rev. | 7.20% due 02/15/2029 | 250,000 | 304,487 | 4.5% |
| Graves Co. KY SCD Bldg. Lease Rev. | 5.95% due 06/01/2024 | 150,000 | 161,669 | 2.4% |
| Johnson Co. KS Bldg Ls./Pr. Rev. BAB | 4.60% due 09/01/2026 | 250,000 | 258,282 | 3.8% |
| Oklahoma City Fin. Auth. Ed. Lease Rev. | 6.60% due 09/01/2022 | 160,000 | 185,230 | 2.7% |
| 810,000 | 909,668 | 13.4% | ||
| Total Municipal Bonds | 2,090,000 | 2,294,889 | 33.8% | |
| Total investments | Cost = $5,083,417 | $4,935,000 | 5,494,450 | 81.0% |
| Other assets (net of liabilities) | 1,291,995 | 19.0% | ||
| Total net assets | $6,786,445 | 100.0% | ||
The accompanying notes are an integral part of these financial statements.
14 | November 30, 2011 Annual Report
Sextant Bond Income Fund
| Statement of Assets and Liabilities | ||
| As of November 30, 2011 | ||
| Assets | ||
| Investments in securities, at value (Cost $5,083,417) | $5,494,450 | |
| Cash | 1,228,761 | |
| Interest receivable | 69,114 | |
| Receivable for Fund shares sold | 524 | |
| Insurance reserve premium | 401 | |
| Total assets | 6,793,250 | |
| Liabilities | ||
| Accrued expenses | 2,459 | |
| Payable to affiliates | 2,266 | |
| Accrued distribution fee | 1,334 | |
| Payable for Fund shares redeemed | 536 | |
| Distributions payable | 210 | |
| Total liabilities | 6,805 | |
| Net assets | $6,786,445 | |
| Analysis of net assets | ||
| Paid-in capital (unlimited shares authorized, without par value) | $6,415,456 | |
| Unrealized net appreciation on investments | 411,033 | |
| Accumulated net realized loss | (40,052) | |
| Undistributed net investment income | 8 | |
| Net assets applicable to Fund shares outstanding | $6,786,445 | |
| Fund shares outstanding | 1,307,332 | |
| Net asset value, offering and redemption price per share | $5.19 | |
| Statement of Operations | ||
| Year ended November 30, 2011 | ||
| Investment income | ||
| Interest income | $251,307 | |
| Miscellaneous income | 26 | |
| Gross investment income | 251,333 | |
| Expenses | ||
| Investment adviser fees | 32,672 | |
| Filing and registration fees | 15,363 | |
| Distribution fees | 14,065 | |
| Audit fees | 2,540 | |
| Retirement plan custodial fees | 1,871 | |
| Printing and postage | 1,555 | |
| Trustee fees | 1,265 | |
| Chief Compliance Officer expenses | 836 | |
| Other expenses | 273 | |
| Custodian fees | 253 | |
| Total gross expenses | 70,693 | |
| Less adviser fees waived | (19,647) | |
| Less custodian fee credits | (253) | |
| Net expenses | 50,793 | |
| Net investment income | $200,540 | |
| Net realized gain on securities sold | $27,579 | |
| Net increase in unrealized appreciation on investments | 156,904 | |
| Net gain on investments | $184,483 | |
| Net increase in net assets resulting from operations | $385,023 | |
The accompanying notes are an integral part of these financial statements.
November 30, 2011 Annual Report | 15
Sextant Bond Income Fund
| Statements of Changes in Net Assets | Year ended Nov. 30, 2011 | Year ended Nov. 30, 2010 |
| Increase (decrease) in net assets from operations: | ||
| From operations | ||
| Net investment income | $200,540 | $184,745 |
| Net realized gain on investments | 27,579 | 15,188 |
| Net increase in unrealized appreciation | 156,904 | 61,380 |
| Net increase in net assets | 385,023 | 261,313 |
| Distributions to shareholders from | ||
| Net investment income | (200,532) | (184,745) |
| Capital share transactions | ||
| Proceeds from sales of shares | 1,932,882 | 1,513,103 |
| Value of shares issued in reinvestment of dividends | 196,118 | 182,326 |
| Early redemption fees retained | 293 | 38 |
| Cost of shares redeemed | (945,687) | (304,961) |
| Net increase in net assets | 1,183,606 | 1,390,506 |
| Total increase in net assets | 1,368,097 | 1,467,074 |
| Net assets | ||
| Beginning of year | 5,418,348 | 3,951,274 |
| End of year | 6,786,445 | 5,418,348 |
| Undistributed net investment income | $8 | $ - |
| Shares of the Fund sold and redeemed | ||
| Number of shares sold | 376,910 | 306,375 |
| Number of shares issued in reinvestment of dividends | 38,887 | 36,567 |
| Number of shares redeemed | (186,715) | (62,121) |
| Net increase in number of shares outstanding | 229,082 | 280,821 |
| Financial Highlights | For year ended November 30, | ||||
| Selected data per share of outstanding capital stock throughout each year: | 2011 | 2010 | 2009 | 2008 | 2007 |
| Net asset value at beginning of year | $5.03 | $4.96 | $4.46 | $4.91 | $4.92 |
| Income from investment operations | |||||
| Net investment income | 0.18 | 0.19 | 0.21 | 0.22 | 0.22 |
| Net gain (loss) on securities (both realized and unrealized) | 0.16 | 0.07 | 0.50 | (0.45) | (0.01) |
| Total from investment operations | 0.34 | 0.26 | 0.71 | (0.23) | 0.21 |
| Less distributions | |||||
| Dividends (from net investment income) | (0.18) | (0.19) | (0.21) | (0.22) | (0.22) |
| Total distributions | (0.18) | (0.19) | (0.21) | (0.22) | (0.22) |
| Paid-in capital from early redemption fees | 0.00¹ | 0.00¹ | - | 0.00¹ | 0.00¹ |
| Net asset value at end of year | $5.19 | $5.03 | $4.96 | $4.46 | $4.91 |
| Total return | 6.95% | 5.43% | 16.33% | (4.80)% | 4.53% |
| Ratios / supplemental data | |||||
| Net assets ($000), end of year | $6,786 | $5,418 | $3,951 | $3,306 | $3,412 |
| Ratio of expenses to average net assets | |||||
| Before fee waivers and custodian fee credits | 1.26% | 1.24% | 1.70% | 1.45% | 1.38% |
| After fee waivers | 0.91% | 0.91% | 0.90% | 0.91% | 0.94% |
| After fee waivers and custodian fee credits | 0.90% | 0.90% | 0.89% | 0.91% | 0.90% |
| Ratio of net investment income after fee waivers and custodian fee credits to average net assets | 3.56% | 3.89% | 4.46% | 4.68% | 4.64% |
| Portfolio turnover rate | 14% | 10% | 38% | 9% | 22% |
| ¹Amount is less than $0.01 | |||||
The accompanying notes are an integral part of these financial statements.
16 | November 30, 2011 Annual Report
Sextant Core Fund
Performance Summary (unaudited)
| Average Annual Returns (as of November 30, 2011) | ||||
| 10 Year | 5 Year | 1 Year | Expense Ratio¹ | |
| Sextant Core Fund | N/A | N/A | 4.42% | 1.21% |
| Dow Jones Moderate U.S. Portfolio Index | 6.41% | 2.82% | 3.93% | N/A |
Growth of $10,000
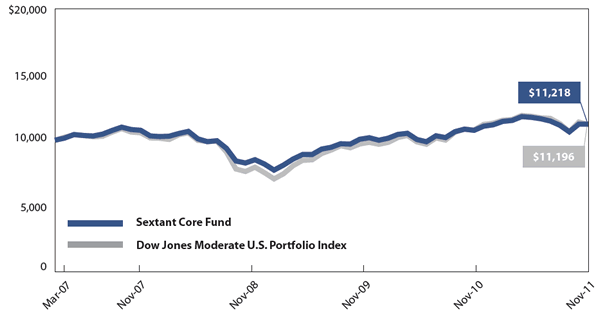 | Comparison of any mutual fund to a market index must be made bearing in mind that the index is unmanaged, and expense-free. Conversely, the fund will (1) be actively managed; (2) have an objective other than mirroring the index, such as limiting risk; (3) bear transaction and other costs; (4) stand ready to buy and sell its securities to shareowners on a daily basis; and (5) provide a wide range of services. The graph compares $10,000 invested in the Fund on March 30, 2007 to an identical amount invested in the Dow Jones Moderate Portfolio Index, a broad-based index of stock and bond prices. The graph shows that an investment in the Fund would have risen to $11,218 versus $11,196 in the index. |
| Past performance does not guarantee future results. The "Growth of $10,000" graph and "Average Annual Returns" performance table assume the reinvestment of dividends and capital gains. They do not reflect the deduction of taxes that a shareowner might pay on fund distributions or the redemption of fund shares, nor do they reflect the potential deduction of a 2% redemption fee on shares held less than 90 calendar days. ¹ By regulation, the expense ratio for the Fund shown in this table is as of the Fund's most recent prospectus which is dated March 25, 2011 and incorporates results for the fiscal year ended November 30, 2010. The ratio presented in this table differs from the expense ratios shown elsewhere in this report as they represent different fiscal periods. | |
Fund Objective
The objectives of the Core Fund are long-term appreciation and capital preservation. It began operations March 30, 2007.
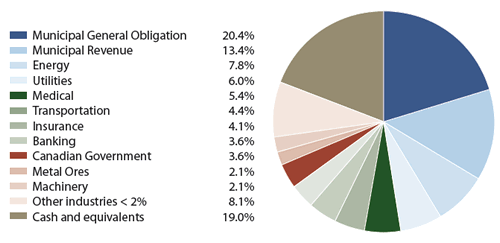
| Portfolio Diversification | Top Ten Holdings | ||
| % of total net assets | |||
 Industry weightings are shown as a percentage of total net assets. | Wilmington Trust 8.50% due 04/02/2018 | 2.1% | |
| Emerson Electric 5.375% due 10/15/2017 | 2.0% | ||
| E.I. du Pont de Nemours 5.25% due 12/15/2016 | 2.0% | ||
| Oracle 5.25% due 01/15/2016 | 2.0% | ||
| Home Depot 5.40% due 03/01/2016 | 2.0% | ||
| Branch Banking & Trust 5.625% due 09/15/2016 | 1.9% | ||
| SeaRiver Maritime 0.00% due 09/01/2012 | 1.9% | ||
| Boardwalk Pipelines 5.50% due 02/01/2017 | 1.8% | ||
| Skagit SD#1 4.613% due 12/01/2022 | 1.8% | ||
| Bellsouth 4.75% due 11/15/2012 | 1.8% | ||
November 30, 2011 Annual Report | 17
Sextant Core Fund
Discussion of Fund Performance (unaudited)
Fiscal Year 2011
Both fixed income and equity markets produced decent performance over the Sextant Core Fund's fiscal year. During the period, the S&P 500 Index produced a total return of 7.83%, and the BarCap Aggregate Bond Index produced a total return of 5.52%. Foreign markets, as proxied by the MSCI EAFE Index, returned -3.60%. As investors balanced their portfolio risk, they clearly favored U.S. securities, and bonds continued their run despite already low yields.
The Sextant Core Fund's virtue is that it provides investors with broad diversification within a single portfolio. The Fund is tasked with providing exposure to a broad range of financial assets. On the equity side, the Fund has a bias toward U.S. equities, and this supported performance in the last fiscal year. However, the Fund is also mandated to have approximately 20% of its assets invested in foreign stocks. While investors flee to the U.S. in times of uncertainty, the unpleasant externalities of foreign markets will resolve themselves at some point. Any attempt to time this, however, will likely prove impossible. In these times of heightened unknowns that present real and significant financial risks to investors, diversification continues to provide a persuasive avenue to both manage risk and retain some exposure to the capital markets.
The Core Fund's diversification provided a 4.42% total return for the fiscal year ending November 30, 2011. This was largely due to the Fund's exposure to income oriented equity securities and fixed income returns resulting, in part, from yields that continued to be bid down. In relative terms, the Fund excelled, with Morningstar reporting that the Fund was ranked in the top 20th percentile of its "Moderate Allocation" category peer group of balanced funds for the calendar year 2011.
Factors Affecting Past Performance
Equities
The Fund has maintained its overweight exposure to the Materials sector. While these stocks rallied earlier in the year, they saw significant declines in the latter half. The Fund benefited significantly from its exposure to the Energy and Health Care sectors, as crude oil inventories remained tight, and health care benefited from its defensive characteristics.
Fixed Income
The Fund increased its exposure to the Financials sector, feeling more confident investing higher up the capital structure than with equities for this sector. The Fund also increased its yield by investing in taxable municipal securities.
Looking Forward
Investors have clearly gotten religion on diversifying their exposure across asset classes. Only time will tell if that discipline sticks. The move into safer fixed income assets, and their resulting lower yields, suggests that future returns may not match or exceed that of the equity markets as they have in the recent past. However, bond markets will continue to provide returns to investors despite the headwinds of low current yields. With default rates remaining low, we are confident in expanding the Fund's exposure to lower rated, investment grade securities. As inflation appears to be of little risk at present, longer duration exposures will be modestly increased.
The equity markets are expected to remain volatile in the face of the European financial crisis and tepid economic growth. The Fund remains committed to its income orientation and will invest accordingly. As for value, many foreign stocks appear to provide better value than domestic stocks. Our conservative approach combined with a focus on income should provide investors with financial exposure that will benefit them in a low growth environment.
Management Fee Calculations
The Sextant Core Fund calculates the performance part of its management fee by comparing the Fund's return to the return of Morningstar's™ "Moderate Allocation" category. The Fund's 12-month return (4.42%) was less than one percent above the Morningstar™ category average (3.62%) as of November 30, 2011. Therefore, the basic 0.60% annual management fee was applied for the month of December 2011.
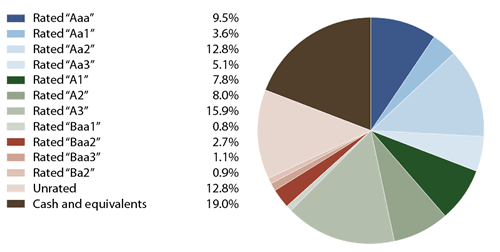
| Bond Quality Diversification |
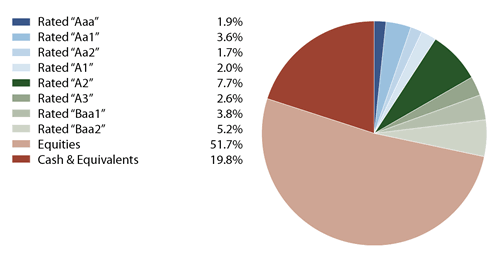 Based on total net assets as of 11/30/2011. Source: Moody's Investors Services. |
18 | November 30, 2011 Annual Report
Sextant Core Fund
| Schedule of Investments | ||||||
| Equities — 51.7% | ||||||
| Common Stocks | Symbol | Number of Shares | Cost | Market Value | Country¹ | Percentage of Assets |
| Automotive | ||||||
| Autoliv | ALV | 700 | $49,555 | $37,296 | 0.6% | |
| Banking | ||||||
| Australia & New Zealand Banking Group ADS | ANZBY | 3,000 | 67,942 | 63,000 | Australia | 1.1% |
| PNC Bank | PNC | 600 | 42,748 | 32,526 | 0.5% | |
| Toronto-Dominion Bank | TD | 550 | 35,553 | 39,000 | Canada | 0.7% |
| 146,243 | 134,526 | 2.3% | ||||
| Building | ||||||
| CRH ADS | CRH | 600 | 26,439 | 11,490 | Ireland | 0.2% |
| Lowe's | LOW | 1,400 | 39,433 | 33,614 | 0.6% | |
| 65,872 | 45,104 | 0.8% | ||||
| Chemicals | ||||||
| BASF ADS | BASFY | 400 | 22,550 | 29,124 | Germany | 0.5% |
| Praxair | PX | 700 | 44,349 | 71,400 | 1.2% | |
| RPM International | RPM | 1,000 | 23,110 | 23,600 | 0.4% | |
| 90,009 | 124,124 | 2.1% | ||||
| Computers | ||||||
| Adobe Systems² | ADBE | 1,100 | 45,474 | 30,162 | 0.5% | |
| Apple² | AAPL | 250 | 28,478 | 95,550 | 1.6% | |
| Hewlett-Packard | HPQ | 1,200 | 46,561 | 33,540 | 0.6% | |
| Intel | INTC | 3,000 | 60,480 | 74,730 | 1.3% | |
| Taiwan Semiconductor ADS | TSM | 4,534 | 39,575 | 58,579 | Taiwan | 1.0% |
| 220,568 | 292,561 | 5.0% | ||||
| Cosmetics & Toiletries | ||||||
| Procter & Gamble | PG | 900 | 58,842 | 58,113 | 1.0% | |
| Diversified Operations | ||||||
| Honeywell International | HON | 850 | 42,855 | 46,028 | 0.8% | |
| 3M | MMM | 600 | 50,092 | 48,624 | 0.8% | |
| 92,947 | 94,652 | 1.6% | ||||
| Energy | ||||||
| Cenovus | CVE | 1,000 | 28,598 | 33,390 | Canada | 0.6% |
| ConocoPhillips | COP | 1,250 | 79,855 | 89,150 | 1.5% | |
| Devon Energy | DVN | 1,200 | 81,888 | 78,552 | 1.4% | |
| NextEra Energy | NEE | 1,200 | 67,764 | 66,528 | 1.1% | |
| Statoil ADS | STO | 2,003 | 49,259 | 51,918 | Norway | 0.9% |
| Total ADS | TOT | 1,100 | 60,835 | 56,914 | France | 1.0% |
| Williams Companies | WMB | 3,000 | 48,330 | 96,840 | 1.7% | |
| 416,529 | 473,292 | 8.2% | ||||
| Continued on next page. | ||||||
The accompanying notes are an integral part of these financial statements.
November 30, 2011 Annual Report | 19
Sextant Core Fund
| Schedule of Investments | ||||||
| Equities — 51.7% | ||||||
| Common Stocks | Symbol | Number of Shares | Cost | Market Value | Country¹ | Percentage of Assets |
| Food Production | ||||||
| Companhia de Bebidas ADR | ABV | 2,000 | $60,360 | $68,760 | Brazil | 1.2% |
| General Mills | GIS | 2,000 | 57,764 | 79,900 | 1.4% | |
| Heinz (H.J.) | HNZ | 1,500 | 57,732 | 78,975 | 1.3% | |
| PepsiCo | PEP | 1,000 | 66,423 | 64,000 | 1.1% | |
| Unilever ADS | UL | 1,850 | 58,335 | 62,216 | United Kingdom | 1.1% |
| 300,614 | 353,851 | 6.1% | ||||
| Hotels & Motels | ||||||
| Orient-Express Hotels² | OEH | 1,000 | 56,450 | 7,190 | Global³ | 0.1% |
| Instruments — Control | ||||||
| Parker Hannifin | PH | 500 | 29,672 | 41,390 | 0.7% | |
| Insurance | ||||||
| Chubb | CB | 750 | 39,270 | 50,580 | 0.9% | |
| Medical | ||||||
| Eli Lilly | LLY | 1,000 | 54,703 | 37,850 | 0.7% | |
| Express Scripts² | ESRX | 1,200 | 37,116 | 54,780 | 0.9% | |
| GlaxoSmithKline ADS | GSK | 500 | 26,859 | 22,240 | United Kingdom | 0.4% |
| Humana | HUM | 1,000 | 37,627 | 88,680 | 1.5% | |
| Johnson & Johnson | JNJ | 900 | 54,760 | 58,248 | 1.0% | |
| Novartis ADR | NVS | 950 | 44,016 | 51,414 | Switzerland | 0.9% |
| Novo Nordisk ADS | NVO | 400 | 18,098 | 45,420 | Denmark | 0.8% |
| Sanofi ADR | SNY | 1,037 | 31,427 | 36,305 | France | 0.6% |
| UnitedHealth Group | UNH | 2,000 | 83,055 | 97,540 | 1.7% | |
| 387,661 | 492,477 | 8.5% | ||||
| Metal Ores | ||||||
| Alcoa | AA | 2,000 | 56,062 | 20,040 | 0.3% | |
| Anglo American ADR | AAUKY | 1,119 | 33,771 | 21,272 | South Africa4 | 0.4% |
| BHP Billiton ADS | BHP | 650 | 31,866 | 48,860 | Australia | 0.8% |
| Freeport-McMoRan Copper & Gold | FCX | 1,000 | 42,343 | 39,600 | Indonesia4 | 0.7% |
| 164,042 | 129,772 | 2.2% | ||||
| Paper & Paper Products | ||||||
| Kimberly-Clark | KMB | 925 | 61,586 | 66,110 | 1.1% | |
| Publishing | ||||||
| Pearson ADS | PSO | 3,100 | 46,698 | 56,327 | United Kingdom | 1.0% |
| Shoes & Related Apparel | ||||||
| Nike Class B | NKE | 900 | 51,646 | 86,562 | 1.5% | |
| Steel | ||||||
| Nucor | NUE | 800 | 48,085 | 31,544 | 0.6% | |
| Continued on next page. | ||||||
The accompanying notes are an integral part of these financial statements.
20 | November 30, 2011 Annual Report
Sextant Core Fund
| Schedule of Investments | ||||||
| Equities — 51.7% | ||||||
| Common Stocks | Symbol | Number of Shares | Cost | Market Value | Country¹ | Percentage of Assets |
| Telecommunications | ||||||
| AT&T | T | 2,600 | $78,553 | $75,348 | 1.3% | |
| China Mobile ADS | CHL | 500 | 23,058 | 24,835 | China | 0.4% |
| Harris | HRS | 800 | 37,077 | 28,480 | 0.5% | |
| Telefonica ADS | TEF | 2,400 | 58,784 | 45,000 | Spain | 0.8% |
| 197,472 | 173,663 | 3.0% | ||||
| Tools | ||||||
| Stanley Black & Decker | SWK | 446 | 29,654 | 29,182 | 0.5% | |
| Transportation | ||||||
| Canadian National Railway | CNI | 800 | 40,237 | 62,048 | Canada | 1.1% |
| LAN Airlines ADS | LFL | 3,500 | 48,996 | 82,145 | Chile | 1.4% |
| 89,233 | 144,193 | 2.5% | ||||
| Utilities | ||||||
| IDACORP | IDA | 1,400 | 48,938 | 57,386 | 1.0% | |
| NRG Energy² | NRG | 1,200 | 29,348 | 23,616 | 0.4% | |
| 78,286 | 81,002 | 1.4% | ||||
| Total equities | $2,720,934 | $3,003,511 | 51.7% | |||
| Bonds — 28.5% | ||||
| Issuer | Coupon/Maturity | Face Amount | Market Value | Percentage of Assets |
| Corporate Bonds — 24.9% | ||||
| Banking | ||||
| Branch Banking & Trust | 5.625% due 09/15/2016 | $100,000 | $111,438 | 1.9% |
| Wilmington Trust | 8.50% due 04/02/2018 | 100,000 | 119,210 | 2.1% |
| 200,000 | 230,648 | 4.0% | ||
| Building | ||||
| Home Depot | 5.40% due 03/01/2016 | 100,000 | 114,389 | 2.0% |
| Chemicals | ||||
| E.I. du Pont de Nemours | 5.25% due 12/15/2016 | 100,000 | 116,544 | 2.0% |
| Computers | ||||
| Oracle | 5.25% due 01/15/2016 | 100,000 | 114,706 | 2.0% |
| Diversified Operations | ||||
| General Electric Capital | 5.35% due 04/15/2022 | 101,000 | 100,906 | 1.7% |
| Electronics | ||||
| Emerson Electric | 5.375% due 10/15/2017 | 100,000 | 117,223 | 2.0% |
| Energy | ||||
| Boardwalk Pipelines | 5.50% due 02/01/2017 | 100,000 | 107,673 | 1.8% |
| Continued on next page. | ||||
The accompanying notes are an integral part of these financial statements.
November 30, 2011 Annual Report | 21
Sextant Core Fund
| Schedule of Investments | ||||
| Bonds — 28.5% | ||||
| Issuer | Coupon/Maturity | Face Amount | Market Value | Percentage of Assets |
| Finance Services | ||||
| Countrywide Home Loan | 6.73% due 04/17/2013 | $100,000 | $98,507 | 1.7% |
| Western Union | 5.93% due 10/01/2016 | 30,000 | 33,526 | 0.6% |
| 130,000 | 132,033 | 2.3% | ||
| Insurance | ||||
| Berkley WR Corp | 5.875% due 02/15/2013 | 100,000 | 103,005 | 1.8% |
| Office Equipment | ||||
| Staples | 7.375% due 10/01/2012 | 90,000 | 94,233 | 1.6% |
| Telecommunications | ||||
| Bellsouth | 4.75% due 11/15/2012 | 100,000 | 103,608 | 1.8% |
| Transportation | ||||
| SeaRiver Maritime | 0.00% due 09/01/2012 | 112,000 | 110,052 | 1.9% |
| Total corporate bonds | 1,333,000 | 1,445,020 | 24.9% | |
| Municipal Bonds — 3.6% | ||||
| General Obligation | ||||
| Lake Washington SD 414 WA BAB | 4.906% due 12/01/2027 | 100,000 | 102,242 | 1.8% |
| Skagit SD#1 | 4.613% due 12/01/2022 | 100,000 | 105,023 | 1.8% |
| $200,000 | 207,265 | 3.6% | ||
| Total investments | Cost = $4,326,233 | 4,655,796 | 80.2% | |
| Other assets (net of liabilities) | 1,146,448 | 19.8% | ||
| Total net assets | $5,802,244 | 100.0% | ||
| ¹ Country of domicile unless otherwise indicated; equities are issued from U.S. domiciled companies where no country is listed ² Non-income producing security ³ Denotes a worldwide presence, comprising an entity with exposure to many regions and countries 4 Denotes country of primary exposure ADS: American Depositary Share | ||||
The accompanying notes are an integral part of these financial statements.
22 | November 30, 2011 Annual Report
Sextant Core Fund
| Statement of Assets and Liabilities | ||
| As of November 30, 2011 | ||
| Assets | ||
| Investments in securities, at value (Cost $4,326,233) | $4,655,796 | |
| Cash | 1,120,659 | |
| Dividends and interest receivable | 29,449 | |
| Prepaid filing and registration | 4,684 | |
| Receivable for Fund shares sold | 1,882 | |
| Total assets | 5,812,470 | |
| Liabilities | ||
| Payable to affiliates | 4,545 | |
| Accrued expenses | 4,504 | |
| Accrued distribution fee | 1,177 | |
| Total liabilities | 10,226 | |
| Net assets | $5,802,244 | |
| Analysis of net assets | ||
| Paid-in capital (unlimited shares authorized, without par value) | $5,693,541 | |
| Accumulated net realized loss | (223,395) | |
| Unrealized net appreciation on investments | 329,563 | |
| Undistributed net investment income | 2,535 | |
| Net assets applicable to Fund shares outstanding | $5,802,244 | |
| Fund shares outstanding | 560,403 | |
| Net asset value, offering and redemption price per share | $10.35 | |
| Statement of Operations | ||
| Year ended November 30, 2011 | ||
| Investment income | ||
| Dividends (net of foreign tax of $3,843) | $84,496 | |
| Interest income | 66,546 | |
| Gross investment income | 151,042 | |
| Expenses | ||
| Investment adviser fees | 25,972 | |
| Filing and registration fees | 15,351 | |
| Distribution fees | 14,022 | |
| Audit fees | 2,576 | |
| Retirement plan custodial fees | 1,605 | |
| Other expenses | 1,564 | |
| Trustee fees | 1,478 | |
| Chief Compliance Officer expenses | 868 | |
| Custodian fees | 242 | |
| Legal fees | 214 | |
| Total gross expenses | 63,892 | |
| Less custodian fee credits | (242) | |
| Net expenses | 63,650 | |
| Net investment income | $87,392 | |
| Net realized loss from investments and foreign currency | ($73,727) | |
| Net increase in unrealized appreciation on investments | 220,690 | |
| Net gain on investments | $146,963 | |
| Net increase in net assets resulting from operations | $234,355 | |
The accompanying notes are an integral part of these financial statements.
November 30, 2011 Annual Report | 23
Sextant Core Fund
| Statements of Changes in Net Assets | Year ended Nov. 30, 2011 | Year ended Nov. 30, 2010 |
| Increase (decrease) in net assets from operations: | ||
| From operations | ||
| Net investment income | $87,392 | $81,532 |
| Net realized loss on investments | (73,727) | (11,776) |
| Net increase in unrealized appreciation | 220,690 | 248,687 |
| Net increase in net assets | 234,355 | 318,443 |
| Distributions to shareholders from | ||
| Net investment income | (85,118) | (81,285) |
| Capital share transactions | ||
| Proceeds from sales of shares | 771,533 | 934,199 |
| Value of shares issued in reinvestment of dividends | 85,118 | 81,285 |
| Early redemption fees retained | 211 | 11 |
| Cost of shares redeemed | (431,527) | (195,800) |
| Net increase in net assets | 425,335 | 819,695 |
| Total increase in net assets | 574,572 | 1,056,853 |
| Net assets | ||
| Beginning of year | 5,227,672 | 4,170,819 |
| End of year | 5,802,244 | 5,227,672 |
| Undistributed net investment income | $2,535 | $250 |
| Shares of the Fund sold and redeemed | ||
| Number of shares sold | 73,071 | 95,662 |
| Number of shares issued in reinvestment of dividends | 8,224 | 8,080 |
| Number of shares redeemed | (40,421) | (19,806) |
| Net increase in number of shares outstanding | 40,874 | 83,936 |
| Financial Highlights | For year ended November 30, | Period ended | |||
| Selected data per share of outstanding capital stock throughout each year: | 2011 | 2010 | 2009 | 2008 | Nov. 30, 2007¹ |
| Net asset value at beginning of year | $10.06 | $9.58 | $7.97 | $10.67 | $10.00 |
| Income from investment operations | |||||
| Net investment income | 0.15 | 0.16 | 0.13 | 0.19 | 0.12 |
| Net gain (loss) on securities (both realized and unrealized) | 0.29 | 0.48 | 1.61 | (2.70) | 0.69 |
| Total from investment operations | 0.44 | 0.64 | 1.74 | (2.51) | 0.81 |
| Less distributions | |||||
| Dividends (from net investment income) | (0.15) | (0.16) | (0.13) | (0.19) | (0.12) |
| Distribution in excess (from net investment income) | - | - | - | - | (0.02) |
| Return of capital | - | - | - | 0.00² | - |
| Total distributions | (0.15) | (0.16) | (0.13) | (0.19) | (0.14) |
| Paid-in capital from early redemption fees | 0.00² | 0.00² | - | - | 0.00² |
| Net asset value at end of year | $10.35 | $10.06 | $9.58 | $7.97 | $10.67 |
| Total return | 4.42% | 6.67% | 21.81% | (23.52)% | 8.12%³ |
| Ratios / supplemental data | |||||
| Net assets ($000), end of year | $5,802 | $5,228 | $4,171 | $3,082 | $3,907 |
| Ratio of expenses to average net assets | |||||
| Before custodian fee credits | 1.14% | 1.21% | 1.78% | 1.54% | 1.35%4 |
| After custodian fee credits | 1.13% | 1.21% | 1.78% | 1.53% | 1.21%4 |
| Ratio of net investment income after custodian fee credits to average net assets | 1.56% | 1.74% | 1.57% | 1.89% | 2.08%4 |
| Portfolio turnover rate | 13% | 13% | 40% | 16% | 7%³ |
| ¹ Fund commenced operations March 30, 2007 ² Amount is less than $0.01 ³ Since inception March 30, 2007; not annualized 4 Annualized | |||||
The accompanying notes are an integral part of these financial statements.
24 | November 30, 2011 Annual Report
Sextant Growth Fund
Performance Summary (unaudited)
| Average Annual Returns (as of November 30, 2011) | ||||
| 10 Year | 5 Year | 1 Year | Expense Ratio¹ | |
| Sextant Growth Fund | 4.91% | 0.13% | 3.07% | 1.01% |
| S&P 500 Index | 2.90% | -0.17% | 7.83% | N/A |
Growth of $10,000
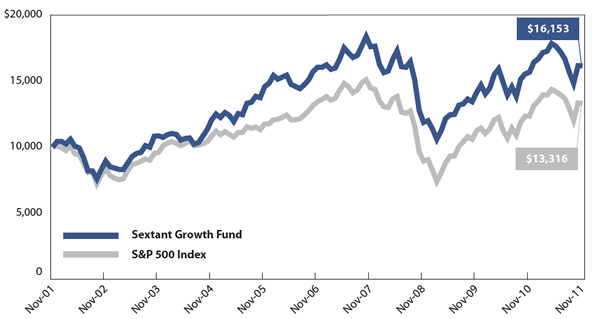 | Comparison of any mutual fund to a market index must be made bearing in mind that the index is unmanaged, and expense-free. Conversely, the fund will (1) be actively managed; (2) have an objective other than mirroring the index, such as limiting risk; (3) bear transaction and other costs; (4) stand ready to buy and sell its securities to shareowners on a daily basis; and (5) provide a wide range of services. The graph compares $10,000 invested in the Fund on November 30, 2001, to an identical amount invested in the S&P 500 Index, a broad-based stock market index. The graph shows that an investment in the Fund would have risen to $16,153 versus $13,316 in the index. |
| Past performance does not guarantee future results. The "Growth of $10,000" graph and "Average Annual Returns" performance table assume the reinvestment of dividends and capital gains. They do not reflect the deduction of taxes that a shareowner might pay on fund distributions or the redemption of fund shares, nor do they reflect the potential deduction of a 2% redemption fee on shares held less than 90 calendar days. ¹ By regulation, the expense ratio for the Fund shown in this table is as of the Fund's most recent prospectus which is dated March 25, 2011, and incorporates results for the fiscal year ended November 30, 2010. The ratio presented in this table differs from the expense ratios shown elsewhere in this report as they represent different fiscal periods. | |
Fund Objective
The objective of the Growth Fund is long-term capital growth.
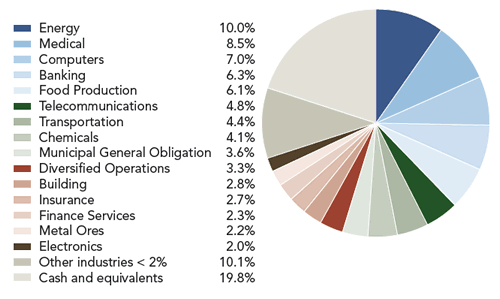
| Portfolio Diversification | Top Ten Holdings | ||
| % of total net assets | |||
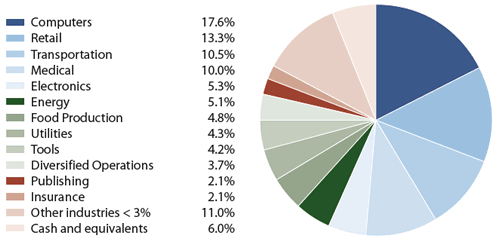 Industry weightings are shown as a percentage of total net assets. | Apple | 8.0% | |
| Amazon.com | 5.0% | ||
| Alaska Air | 3.0% | ||
| Johnson & Johnson | 2.8% | ||
| Intuit | 2.8% | ||
| Trimble Navigation | 2.7% | ||
| Oracle | 2.6% | ||
| Dr. Pepper Snapple | 2.6% | ||
| Bed Bath & Beyond | 2.4% | ||
| Honeywell International | 2.4% | ||
November 30, 2011 Annual Report | 25
Sextant Growth Fund
Discussion of Fund Performance (unaudited)
Fiscal Year 2011
For the fiscal year ended November 30, 2011, the Sextant Growth Fund returned 3.07%. This compares with the broader S&P 500 Index's 7.83% gain. Like most equity funds, the Fund suffered net withdrawals, and Fund assets decreased 5.5%. The Fund's annual expense ratio declined to 0.84% from 1.01%, resulting from the fulcrum element of the management fee. Dividends paid per share doubled to 10¢ from 5¢.
Factors Affecting Past Performance
During 2011, the U.S. economy continued to struggle. The 2008-2009 financial crisis bankrupted both firms and families, and the real estate and construction markets remain comatose. During 2011, U.S. companies benefited from exports, and finally the return of the consumer — leading many to report solid earnings.
Computers, our largest industry (17.6% of the Fund), performed well for us as our largest holding, Apple, appreciated almost 22.8%. Retail, our second largest industry (13.3% of the Fund), also outperformed as our second largest holding, Amazon.com, appreciated 9.6%. Well-run Alaska Air, our third largest holding, gained 26.2%. The volatile Finance and Building sectors hurt performance, and we sold most of these issues.
The Sextant Growth Fund seeks long-term growth through investment in common stocks of U.S. domiciled companies. It generally follows a value investment approach, favoring companies with good fundamentals and relatively low price/earnings and price/book ratios.
Income is not a major consideration in portfolio selection, but we favor companies that institute or increase dividend payouts. Our low portfolio turnover meant we realized few market gains, minimizing the taxable capital gains distribution at year-end.
Looking Forward
U.S. monetary and fiscal policies are still highly stimulative, yet the economy barely responds. New federal restrictions on banks and financial firms are reducing lending and the pace of recovery. Concerns about unconstrained costs of retirement, medical, unemployment, and other entitlement programs are all hindering the normal employment growth characteristic of past economic recoveries.
Burdened by decades of overspending and borrowing, the U.S. financial system will take years to recover. Construction, the swing economic sector, has been down for a long time. Commodity output and prices are decreasing as worldwide demand looks soft. We expect developing world economies, such as Brazil, India and China, will continue to grow faster than older and less structurally competitive countries such as Britain and the United States. Extremely low interest rates are being maintained in the U.S., although the Japanese experience shows this is no panacea. Europe, with its many cultures, is generally staggering into recession.
Our analysts increasingly travel the country and the world, believing that first-hand observations are always useful. We continue our focus on larger companies, which tend to be more stable over time. Technology and basic industry investments should be profitable. Unfortunately, the outlook for 2012 earnings growth in the U.S. is being hurt by the continuing economic doldrums. Election campaigns in 2012 will marginally boost the economy while greatly amusing the voters.
The volatility, risks, and returns of the stock market should continue. The poor stock market performances of 2000 through 2002 were reversed in 2003 through 2007 as stocks again provided investors with strong investment returns. The market collapse of 2008 was reversed in 2009 and 2010. Although 2011 had its ups and downs, the ending result was virtually even. Investors burned from speculation are often abandoning the equity markets.
A long-term approach offers the best opportunity to prosper: for the difficult decade ended December 31, 2011, the Fund provided a 4.46% annualized total return. This compares favorably with the lower 2.29% average for the 804 funds in Morningstar's "Large Growth" category. And while below the averages established over many decades for equity investing, it is superior to the zero returns investors currently receive on cash, short-term equivalents, or money under the mattress.
Management Fee Calculations
The Sextant Growth Fund calculates the performance part of its management fee by comparing the Fund's return to the average return in Morningstar's "Large Growth" category. The Fund's 12-month return (3.07%) was between one and two percent below the Morningstar™ category average (4.07%) at month-end November 30, 2011. Therefore, the basic annual management fee of 0.60% was decreased to 0.50% for the month of December 2011.
26 | November 30, 2011 Annual Report
Sextant Growth Fund
| Schedule of Investments | |||||
| Common Stocks | Symbol | Number of Shares | Cost | Market Value | Percentage of Assets |
| Building | |||||
| Lowe's | LOW | 15,000 | $295,388 | $360,150 | 1.6% |
| Computers | |||||
| Adobe Systems¹ | ADBE | 11,000 | 144,216 | 301,620 | 1.3% |
| Apple¹ | AAPL | 4,800 | 39,606 | 1,834,560 | 8.0% |
| Hewlett-Packard | HPQ | 18,000 | 525,367 | 503,100 | 2.2% |
| Intuit | INTU | 12,000 | 302,027 | 638,880 | 2.8% |
| Oracle | ORCL | 19,000 | 241,810 | 595,650 | 2.6% |
| 3D Systems¹ | DDD | 10,000 | 240,848 | 156,100 | 0.7% |
| 1,493,874 | 4,029,910 | 17.6% | |||
| Diversified Operations | |||||
| Honeywell International | HON | 10,000 | 330,476 | 541,500 | 2.4% |
| Raytheon | RTN | 6,500 | 348,174 | 296,205 | 1.3% |
| 678,650 | 837,705 | 3.7% | |||
| Electronics | |||||
| Advanced Micro Devices¹ | AMD | 20,000 | 139,886 | 113,800 | 0.5% |
| Agilent Technologies¹ | A | 13,000 | 312,921 | 487,500 | 2.1% |
| Trimble Navigation¹ | TRMB | 14,000 | 202,081 | 603,120 | 2.7% |
| 654,888 | 1,204,420 | 5.3% | |||
| Energy | |||||
| Devon Energy | DVN | 6,000 | 381,365 | 392,760 | 1.7% |
| NextEra Energy | NEE | 7,000 | 244,409 | 388,080 | 1.7% |
| Spectra Energy | SE | 13,000 | 236,250 | 382,460 | 1.7% |
| 862,024 | 1,163,300 | 5.1% | |||
| Finance | |||||
| Charles Schwab | SCHW | 25,000 | 79,726 | 299,000 | 1.3% |
| Food Production | |||||
| Dr. Pepper Snapple | DPS | 16,000 | 383,381 | 584,480 | 2.6% |
| PepsiCo | PEP | 8,000 | 459,066 | 512,000 | 2.2% |
| 842,447 | 1,096,480 | 4.8% | |||
| Hotels & Motels | |||||
| Red Lion Hotels¹ | RLH | 50,000 | 224,859 | 350,000 | 1.5% |
| Insurance | |||||
| Chubb | CB | 7,000 | 308,505 | 472,080 | 2.1% |
| Medical | |||||
| Abbott Laboratories | ABT | 7,000 | 305,488 | 381,850 | 1.7% |
| Amgen | AMGN | 3,700 | 111,703 | 214,267 | 0.9% |
The accompanying notes are an integral part of these financial statements.
November 30, 2011 Annual Report | 27
Sextant Growth Fund
| Schedule of Investments | |||||
| Common Stocks | Symbol | Number of Shares | Cost | Market Value | Percentage of Assets |
| Continued on next page. | |||||
| Medical (continued) | |||||
| AmSurg¹ | AMSG | 15,000 | $324,804 | $391,200 | 1.7% |
| Johnson & Johnson | JNJ | 10,000 | 642,017 | 647,200 | 2.8% |
| Pharmaceutical Product Development | PPDI | 15,000 | 63,420 | 498,150 | 2.2% |
| VCA Antech¹ | WOOF | 8,000 | 209,048 | 157,280 | 0.7% |
| 1,656,480 | 2,289,947 | 10.0% | |||
| Metal Ores | |||||
| Alcoa | AA | 30,000 | 394,483 | 300,600 | 1.3% |
| Publishing | |||||
| John Wiley & Sons | JW/A | 10,000 | 335,172 | 481,000 | 2.1% |
| Real Estate | |||||
| LoopNet¹ | LOOP | 20,000 | 156,091 | 361,000 | 1.6% |
| Retail | |||||
| Amazon.com¹ | AMZN | 6,000 | 260,090 | 1,153,740 | 5.0% |
| Bed Bath & Beyond¹ | BBBY | 9,000 | 331,221 | 544,590 | 2.4% |
| Best Buy | BBY | 10,000 | 454,356 | 270,900 | 1.2% |
| Costco Wholesale | COST | 3,000 | 248,150 | 255,900 | 1.1% |
| CVS Caremark | CVS | 10,000 | 339,270 | 388,400 | 1.7% |
| Guess? | GES | 8,000 | 363,777 | 224,960 | 1.0% |
| Staples | SPLS | 15,000 | 322,143 | 216,150 | 0.9% |
| 2,319,007 | 3,054,640 | 13.3% | |||
| Steel | |||||
| Nucor | NUE | 4,000 | 189,851 | 157,720 | 0.7% |
| Technology | |||||
| Qualcomm | QCOM | 7,000 | 387,599 | 383,600 | 1.7% |
| Telecommunications | |||||
| AT&T | T | 10,000 | 232,700 | 289,800 | 1.3% |
| Tools | |||||
| Lincoln Electric Holdings | LECO | 12,000 | 325,653 | 473,760 | 2.1% |
| Regal-Beloit | RBC | 5,500 | 173,846 | 289,630 | 1.3% |
| Stanley Black & Decker | SWK | 3,000 | 190,295 | 196,290 | 0.8% |
| 689,794 | 959,680 | 4.2% | |||
| Transportation | |||||
| Alaska Air¹ | ALK | 10,000 | 286,762 | 694,200 | 3.0% |
| Boeing | BA | 5,000 | 361,516 | 343,450 | 1.5% |
| Norfolk Southern | NSC | 7,000 | 318,942 | 528,780 | 2.3% |
| Union Pacific | UNP | 4,000 | 392,969 | 413,640 | 1.8% |
| Continued on next page. | |||||
The accompanying notes are an integral part of these financial statements.
28 | November 30, 2011 Annual Report
Sextant Growth Fund
| Schedule of Investments | |||||
| Common Stocks | Symbol | Number of Shares | Cost | Market Value | Percentage of Assets |
| Transportation (continued) | |||||
| United Parcel Service | UPS | 6,000 | $395,747 | $430,500 | 1.9% |
| 1,755,936 | 2,410,570 | 10.5% | |||
| Utilities | |||||
| Duke Energy | DUK | 10,000 | 172,211 | 208,500 | 0.9% |
| NRG Energy¹ | NRG | 10,000 | 234,150 | 196,800 | 0.9% |
| Piedmont Natural Gas | PNY | 8,000 | 220,875 | 263,760 | 1.1% |
| Sempra Energy | SRE | 6,000 | 276,535 | 319,140 | 1.4% |
| 903,771 | 988,200 | 4.3% | |||
| Total investments | $14,461,245 | 21,489,802 | 94.0% | ||
| Other assets (net of liabilities) | 1,378,006 | 6.0% | |||
| Total net assets | $22,867,808 | 100% | |||
| ¹ Non-income producing | |||||
The accompanying notes are an integral part of these financial statements.
November 30, 2011 Annual Report | 29
Sextant Growth Fund
| Statement of Assets and Liabilities | ||
| As of November 30, 2011 | ||
| Assets | ||
| Investments in securities, at value (Cost $14,461,245) | $21,489,802 | |
| Cash | 1,390,286 | |
| Dividends receivable | 34,816 | |
| Receivable for Fund shares sold | 6,702 | |
| Insurance reserve premium | 1,215 | |
| Total assets | 22,922,821 | |
| Liabilities | ||
| Payable to affiliates | 18,406 | |
| Accrued expenses | 16,339 | |
| Payable for Fund shares redeemed | 11,023 | |
| Accrued distribution fee | 4,644 | |
| Distributions payable | 4,601 | |
| Total liabilities | 55,013 | |
| Net assets | $22,867,808 | |
| Analysis of net assets | ||
| Paid-in capital (unlimited shares authorized, without par value) | $16,106,448 | |
| Unrealized net appreciation on investments | 7,028,557 | |
| Accumulated net realized loss | (295,225) | |
| Undistributed net investment income | 28,028 | |
| Net assets applicable to Fund shares outstanding | $22,867,808 | |
| Fund shares outstanding | 1,260,704 | |
| Net asset value, offering and redemption price per share | $18.14 | |
| Statement of Operations | ||
| Year ended November 30, 2011 | ||
| Investment income | ||
| Dividends | $348,354 | |
| Miscellaneous income | 81 | |
| Gross investment income | 348,435 | |
| Expenses | ||
| Investment adviser fees | 85,662 | |
| Distribution fees | 61,894 | |
| Filing and registration fees | 21,132 | |
| Printing and postage | 11,618 | |
| Audit fees | 9,571 | |
| Retirement plan custodial fees | 6,691 | |
| Trustee fees | 6,327 | |
| Chief Compliance Officer expenses | 3,453 | |
| Custodian fees | 1,181 | |
| Legal fees | 908 | |
| Other expenses | 244 | |
| Total gross expenses | 208,681 | |
| Less custodian fee credits | (1,181) | |
| Net expenses | 207,500 | |
| Net investment income | $140,935 | |
| Net realized loss from investments | ($263,343) | |
| Net increase in unrealized appreciation on investments | 874,209 | |
| Net gain on investments | $610,866 | |
| Net increase in net assets resulting from operations | $751,801 | |
The accompanying notes are an integral part of these financial statements.
30 | November 30, 2011 Annual Report
Sextant Growth Fund
| Statements of Changes in Net Assets | Year ended Nov. 30, 2011 | Year ended Nov. 30, 2010 |
| Increase (decrease) in net assets from operations: | ||
| From operations | ||
| Net investment income | $140,935 | $68,004 |
| Net realized gain (loss) on investments | (263,343) | 660,507 |
| Net increase in unrealized appreciation | 874,209 | 1,661,727 |
| Net increase in net assets | 751,801 | 2,390,238 |
| Distributions to shareholders from | ||
| Net investment income | (114,994) | (65,917) |
| Capital gains distribution | (15,111) | - |
| Total distributions | (130,105) | (65,917) |
| Capital share transactions | ||
| Proceeds from sales of shares | 2,455,862 | 5,126,976 |
| Value of shares issued in reinvestment of dividends | 125,504 | 63,514 |
| Early redemption fees retained | 377 | 943 |
| Cost of shares redeemed | (4,541,043) | (4,843,972) |
| Net increase (decrease) in net assets | (1,959,300) | 347,461 |
| Total increase (decrease) in net assets | (1,337,604) | 2,671,782 |
| Net assets | ||
| Beginning of year | 24,205,412 | 21,533,630 |
| End of year | 22,867,808 | 24,205,412 |
| Undistributed net investment income | $28,028 | $2,087 |
| Shares of the Fund sold and redeemed | ||
| Number of shares sold | 130,620 | 305,136 |
| Number of shares issued in reinvestment of dividends | 6,919 | 3,589 |
| Number of shares redeemed | (244,436) | (286,706) |
| Net increase (decrease) in number of shares outstanding | (106,897) | 22,019 |
| Financial Highlights | For year ended November 30, | ||||
| Selected data per share of outstanding capital stock throughout each year: | 2011 | 2010 | 2009 | 2008 | 2007 |
| Net asset value at beginning of year | $17.70 | $16.00 | $13.45 | $19.99 | $18.66 |
| Income from investment operations | |||||
| Net investment income (loss) | 0.11 | 0.05 | (0.04) | 0.04 | 0.01 |
| Net gain (loss) on securities (both realized and unrealized) | 0.43 | 1.70 | 2.59 | (6.55) | 1.80 |
| Total from investment operations | 0.54 | 1.75 | 2.55 | (6.51) | 1.81 |
| Less distributions | |||||
| Dividends (from net investment income) | (0.09) | (0.05) | (0.00)¹ | (0.03) | (0.01) |
| Distributions (from capital gains) | (0.01) | - | - | (0.00)¹ | (0.47) |
| Total distributions | (0.10) | (0.05) | (0.00)¹ | (0.03) | (0.48) |
| Paid-in capital from early redemption fees | 0.00¹ | 0.00¹ | 0.00¹ | 0.00¹ | 0.00¹ |
| Net asset value at end of year | $18.14 | $17.70 | $16.00 | $13.45 | $19.99 |
| Total return | 3.07% | 10.93% | 18.98% | (32.58)% | 9.74% |
| Ratios / supplemental data | |||||
| Net assets ($000), end of year | $22,868 | $24,205 | $21,534 | $12,157 | $15,996 |
| Ratio of expenses to average net assets | |||||
| Before custodian fee credits | 0.84% | 1.01% | 1.34% | 1.25% | 1.32% |
| After custodian fee credits | 0.84% | 1.00% | 1.34% | 1.24% | 1.30% |
| Ratio of net investment income (loss) after custodian fee credits to average net assets | 0.57% | 0.30% | (0.25)% | 0.20% | 0.09% |
| Portfolio turnover rate | 15% | 16% | 7% | 2% | 3% |
| ¹Amount is less than $0.01 | |||||
The accompanying notes are an integral part of these financial statements.
November 30, 2011 Annual Report | 31
Sextant International Fund
Performance Summary (unaudited)
| Average Annual Returns (as of November 30, 2011) | ||||
| 10 Year | 5 Year | 1 Year | Expense Ratio¹ | |
| Sextant International Fund | 7.94% | 2.26% | -3.31% | 1.03% |
| NYSE Arca International Index | 5.25% | -1.57% | 1.44% | N/A |
Growth of $10,000
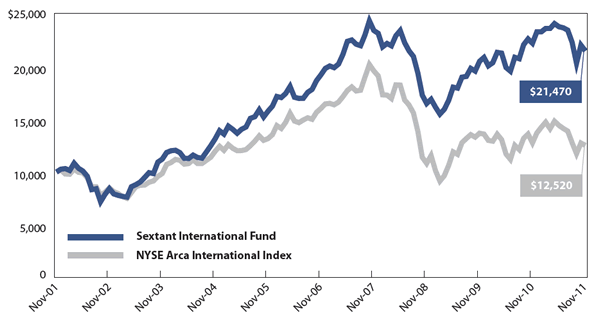 | Comparison of any mutual fund to a market index must be made bearing in mind that the index is unmanaged, and expense-free. Conversely, the fund will (1) be actively managed; (2) have an objective other than mirroring the index, such as limiting risk; (3) bear transaction and other costs; (4) stand ready to buy and sell its securities to shareowners on a daily basis; and (5) provide a wide range of services. The graph compares $10,000 invested in the Fund on November 30, 2001 to an identical amount invested in the NYSE Arca International Index, a broad-based index of international stock prices. The graph shows that an investment in the Fund would have risen to $21,470 versus $12,520 in the index. |
| Past performance does not guarantee future results. The "Growth of $10,000" graph and "Average Annual Returns" performance table assume the reinvestment of dividends and capital gains. They do not reflect the deduction of taxes that a shareowner might pay on fund distributions or the redemption of fund shares, nor do they reflect the potential deduction of a 2% redemption fee on shares held less than 90 calendar days. ¹ By regulation, the expense ratio for the Fund shown in this table is as of the Fund's most recent prospectus which is dated March 25, 2011, and incorporates results for the fiscal year ended November 30, 2010. The ratio presented in this table differs from the expense ratios shown elsewhere in this report as they represent different fiscal periods. | |
Fund Objective
The objective of the International Fund is long-term capital growth.
| Portfolio Diversification | Top Ten Holdings | ||
| % of total net assets | |||
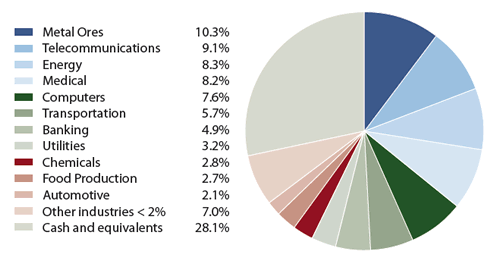 Industry weightings are shown as a percentage of total net assets. | Copa Holdings | 2.3% | |
| Teck Resources | 2.2% | ||
| Novartis ADR | 2.0% | ||
| Shire ADR | 2.0% | ||
| Barrick Gold | 1.9% | ||
| LAN Airlines ADS | 1.8% | ||
| SAP ADS | 1.8% | ||
| ASML Holdings | 1.8% | ||
| Anglo American ADR | 1.7% | ||
| Novo Nordisk ADS | 1.7% | ||
32 | November 30, 2011 Annual Report
Sextant International Fund
Discussion of Fund Performance (unaudited)
Fiscal Year 2011
For the fiscal year ended November 30, 2011, the Sextant International Fund declined 3.31%. For the previous fiscal year (2010), the Fund gained 8.43%. The Fund's benchmark, the NYSE Arca International Index of 50 global ADRs, gained 1.44% for fiscal 2011.
The Fund's annual expense ratio declined to 0.88% from 1.03%, resulting from the fulcrum element of the management fee. The Fund paid a year-end income dividend of 12.2¢ per share, up 107% from last year's 5.9¢ income dividend.
Longer-Term Results
On page two of this report are the comparative returns and percentile Morningstar category rankings as of December 31, 2011. Over the last five years, Sextant International Fund ranked in the very top (1st) percentile out of 563 funds in the Foreign Large Blend category. This long-term performance continues to attract new investors, and total Fund assets increased by 10% for fiscal 2011.
Factors Affecting Past Performance
In a world economy awash with virtually free stimulus funds, the U.S. dollar strengthened during 2011. The Fund benefited from large amounts in temporary cash and equivalent positions which protected the Fund and improved our comparative returns. The Fund is diversified across industries and countries, favoring larger and more established companies that are more stable in difficult times.
Our portfolio is largely invested in Canada (helped in 2011 by resource and energy companies), the United Kingdom, Japan, and Brazil. Economic activity, slowed by earthquakes and floods in Asia plus weak demand in the U.S. and Europe, meant commodity prices backed off. We reduced our cyclical and resource based positions, but see these sectors as attractive for the long-term. We also reduced our financial industry holdings, which performed poorly in 2011. The accompanying tables and graphs show the industry allocation and holdings. Our holdings in any one issue are small. Resources (metal ores) is our largest industry, followed by telecommunications, energy and medical. The world banking system again staggered in 2011, and faces continuing calls to increase capital, sell assets, and lend to weak sovereign entities.
Looking Forward
Asia and Latin America rebounded quickly from the recession caused by the 2008 world credit collapse. But now, governments everywhere are scaling back stimulus and spending programs as they no longer can afford the costs. Commodities are being purchased more as inflation hedges than to meet actual demand.
The Sextant International Fund is broadly diversified in companies headquartered outside the United States. Many have worldwide operations, including in the U.S. Burdened by decades of overspending and borrowing, the financial systems of most countries will take years to recover. Europe, with its many cultures, looks especially weak in 2012.
Our analysts increasingly travel the globe, believing that first-hand observations are needed when conditions are so murky. Saturna Capital established a research office in Malaysia in 2010, and looks to doing the same in Europe in 2012. We continue to focus on larger companies, which tend to provide current income and stability. We expect technology and basic industry investments to be profitable as we invest for the long-term. We prefer to hold cash rather than make risky investment bets.
Management Fee Calculations
The Sextant International Fund calculates the performance part of its management fee by comparing the Fund's return to the average return of Morningstar's™ "Foreign Large Blend" category. The Fund's 12-month return (-3.31%) was between one and two percent above the Morningstar™ category average (-5.25%) at month-end November 30, 2011. Therefore, the basic annual management fee of 0.60% was increased to 0.70% for the month of December 2011.
| Countries | |
| % of total net assets | |
| Australia | 3.9% |
| Brazil | 5.6% |
| Canada | 13.6% |
| Chile | 2.5% |
| France | 2.6% |
| Germany | 2.9% |
| India | 2.7% |
| Israel | 2.4% |
| Japan | 6.6% |
| Mexico | 3.2% |
| Panama | 2.3% |
| Spain | 2.5% |
| Switzerland | 2.0% |
| United Kingdom | 6.4% |
| Other countries <2% | 12.7% |
| Cash and equivalents | 28.1% |
November 30, 2011 Annual Report | 33
Sextant International Fund
| Schedule of Investments | ||||||
| Common Stocks | Symbol | Number of Shares | Cost | Market Value | Country¹ | Percentage of Assets |
| Automotive | ||||||
| Nissan Motor ADS | NSANY | 120,000 | $1,712,551 | $2,191,200 | Japan | 1.3% |
| Toyota Motor ADS | TM | 20,000 | 1,496,296 | 1,318,200 | Japan | 0.8% |
| 3,208,847 | 3,509,400 | 2.1% | ||||
| Banking | ||||||
| Australia & New Zealand Banking Group ADS | ANZBY | 80,000 | 1,581,457 | 1,680,000 | Australia | 1.0% |
| ICICI Bank | IBN | 60,000 | 1,941,768 | 1,746,600 | India | 1.1% |
| Mitsubishi UFJ Financial Group ADR | MTU | 400,000 | 2,185,178 | 1,736,000 | Japan | 1.0% |
| Nomura Holdings ADR | NMR | 30,000 | 351,958 | 99,000 | Japan | 0.1% |
| Toronto-Dominion Bank | TD | 40,000 | 2,302,163 | 2,836,400 | Canada | 1.7% |
| 8,362,524 | 8,098,000 | 4.9% | ||||
| Building | ||||||
| Ritchie Bros. Auctioneers | RBA | 30,000 | 634,727 | 617,100 | Canada | 0.4% |
| Chemicals | ||||||
| BASF ADS | BASFY | 25,000 | 1,649,816 | 1,820,250 | Germany | 1.1% |
| Potash Corp. of Saskatchewan | POT | 65,000 | 2,058,502 | 2,817,100 | Canada | 1.7% |
| 3,708,318 | 4,637,350 | 2.8% | ||||
| Computers | ||||||
| ASML Holdings NV | ASML | 75,000 | 3,034,157 | 2,964,750 | Netherlands | 1.8% |
| Dassault Systems ADR | DASTY | 25,000 | 1,727,827 | 2,049,250 | France | 1.2% |
| Infosys ADS | INFY | 50,000 | 2,271,519 | 2,581,000 | India | 1.6% |
| Nice Systems ADS² | NICE | 60,000 | 2,122,719 | 2,014,800 | Israel | 1.2% |
| SAP ADS | SAP | 50,000 | 2,794,738 | 2,998,000 | Germany | 1.8% |
| 11,950,960 | 12,607,800 | 7.6% | ||||
| Electronics | ||||||
| Sony ADS | SNE | 100,000 | 2,021,290 | 1,805,000 | Japan | 1.1% |
| Energy | ||||||
| BP ADS | BP | 50,000 | 2,180,675 | 2,177,500 | Britain | 1.3% |
| Cenovus Energy | CVE | 60,000 | 1,516,298 | 2,003,400 | Canada | 1.2% |
| Ente Nazionale Idrocarburi | E | 30,000 | 1,272,351 | 1,273,500 | Italy | 0.8% |
| EnCana | ECA | 40,000 | 1,097,866 | 802,000 | Canada | 0.5% |
| Petroleo Brasileiro ADR | PBR | 70,000 | 2,615,500 | 1,889,300 | Brazil | 1.1% |
| Repsol ADS² | REP | 80,000 | 2,071,573 | 2,421,600 | Spain | 1.5% |
| Statoil ADS | STO | 30,173 | 716,086 | 782,084 | Norway | 0.5% |
| Total ADS | TOT | 45,000 | 2,528,346 | 2,328,300 | France | 1.4% |
| 13,998,695 | 13,677,684 | 8.3% | ||||
| Continued on next page. | ||||||
The accompanying notes are an integral part of these financial statements.
34 | November 30, 2011 Annual Report
Sextant International Fund
| Schedule of Investments | ||||||
| Common Stocks | Symbol | Number of Shares | Cost | Market Value | Country¹ | Percentage of Assets |
| Food Production | ||||||
| Coca-Cola Femsa ADS | KOF | 27,557 | $1,357,613 | $2,504,105 | Mexico | 1.5% |
| Fomento Economico Mex ADS | FMX | 20,000 | 826,024 | 1,364,200 | Mexico | 0.8% |
| Unilever ADS | UL | 20,000 | 366,600 | 672,600 | United Kingdom | 0.4% |
| 2,550,237 | 4,540,905 | 2.7% | ||||
| Games/Hobby Production | ||||||
| Nintendo ADR | NTDOY | 17,000 | 718,849 | 323,850 | Japan | 0.2% |
| Hotels & Motels | ||||||
| Orient-Express Hotels Class A² | OEH | 170,000 | 1,507,427 | 1,222,300 | Global³ | 0.8% |
| Machinery | ||||||
| Komatsu ADS | KMTUY | 50,000 | 1,775,000 | 1,260,000 | Japan | 0.7% |
| Nidec ADR | NJ | 26,703 | 514,164 | 605,357 | China4 | 0.4% |
| 2,289,164 | 1,865,357 | 1.1% | ||||
| Medical | ||||||
| GlaxoSmithKline ADS | GSK | 50,000 | 1,935,020 | 2,224,000 | United Kingdom | 1.3% |
| Novartis ADR | NVS | 60,000 | 3,076,591 | 3,247,200 | Switzerland | 2.0% |
| Novo Nordisk ADS | NVO | 25,000 | 1,631,867 | 2,838,750 | Denmark | 1.7% |
| Shire ADR | SHPGY | 32,000 | 1,738,765 | 3,242,240 | United Kingdom | 2.0% |
| Teva Pharmaceutical Industries ADS | TEVA | 50,000 | 2,472,947 | 1,980,500 | Israel | 1.2% |
| 10,855,190 | 13,532,690 | 8.2% | ||||
| Metal Ores | ||||||
| Anglo American ADR | AAUKY | 150,000 | 2,300,535 | 2,851,500 | South Africa | 1.7% |
| Barrick Gold | ABX | 60,000 | 2,580,603 | 3,172,800 | Canada | 1.9% |
| BHP Billiton ADS | BHP | 30,000 | 1,816,059 | 2,255,100 | Australia | 1.4% |
| Newcrest Mining ADS | NCMGY | 67,301 | 2,618,682 | 2,450,429 | Australia | 1.5% |
| Teck Resources | TCK | 100,000 | 458,225 | 3,649,000 | Canada | 2.2% |
| Tenaris ADR | TS | 2,500 | 95,290 | 93,200 | Argentina4 | 0.1% |
| Vale ADR | VALE | 110,000 | 2,177,291 | 2,557,500 | Brazil | 1.5% |
| 12,046,685 | 17,029,529 | 10.3% | ||||
| Office Equipment | ||||||
| Canon ADS | CAJ | 50,000 | 2,268,340 | 2,250,500 | Japan | 1.4% |
| Paper & Paper Products | ||||||
| Fibria Celulose | FBR | 150,000 | 2,152,042 | 1,167,000 | Brazil | 0.7% |
| Metso ADS | MXCYY | 12,100 | 130,802 | 481,580 | Finland | 0.3% |
| 2,282,844 | 1,648,580 | 1.0% | ||||
| Publishing | ||||||
| Pearson ADS | PSO | 90,000 | 1,021,915 | 1,635,300 | United Kingdom | 1.0% |
| Continued on next page. | ||||||
The accompanying notes are an integral part of these financial statements.
November 30, 2011 Annual Report | 35
Sextant International Fund
| Schedule of Investments | ||||||
| Common Stocks | Symbol | Number of Shares | Cost | Market Value | Country¹ | Percentage of Assets |
| Telecommunications | ||||||
| America Movil ADS | AMX | 60,000 | $918,971 | $1,429,200 | Mexico | 0.9% |
| BCE | BCE | 60,000 | 1,414,018 | 2,351,400 | Canada | 1.4% |
| China Mobile ADS | CHL | 25,000 | 1,172,229 | 1,241,750 | China | 0.8% |
| Chorus² | CHRYY | 4,000 | 47,189 | 49,600 | New Zealand | 0.0%5 |
| Millicom | MIC SS | 10,000 | 905,668 | 1,090,325 | Global³ | 0.7% |
| PT Indosat ADR | IIT | 23,000 | 622,786 | 673,440 | Indonesia | 0.4% |
| SK Telecom ADR | SKM | 30,000 | 511,437 | 443,700 | South Korea | 0.3% |
| Telecom New Zealand ADS | NZT | 20,000 | 146,208 | 160,600 | New Zealand | 0.1% |
| Telecommunicacoes de Sao Paulo ADR | VIV | 50,000 | 1,322,495 | 1,348,500 | Brazil | 0.8% |
| Telefonica ADS | TEF | 90,000 | 1,918,697 | 1,687,500 | Spain | 1.0% |
| Telus | TU | 45,000 | 1,334,187 | 2,306,700 | Canada | 1.4% |
| Turkcell Iletisim Hizmetleri ADR² | TKC | 70,000 | 970,618 | 882,000 | Turkey | 0.5% |
| Vodaphone Group ADS | VOD | 50,000 | 963,420 | 1,357,500 | United Kingdom | 0.8% |
| 12,247,923 | 15,022,215 | 9.1% | ||||
| Transportation | ||||||
| Canadian Pacific Railway | CP | 32,000 | 1,228,587 | 1,925,760 | Canada | 1.2% |
| Copa Holdings Class A | CPA | 60,000 | 3,268,200 | 3,873,600 | Panama | 2.3% |
| LAN Airlines ADS | LFL | 130,000 | 1,191,580 | 3,051,100 | Chile | 1.8% |
| Ryanair Holdings ADS² | RYAAY | 20,000 | 623,100 | 601,800 | Ireland | 0.4% |
| 6,311,467 | 9,452,260 | 5.7% | ||||
| Utilities | ||||||
| BG Group ADS | BRGYY | 14,000 | 1,253,784 | 1,500,100 | United Kingdom | 0.9% |
| CPFL Energia ADR | CPL | 90,000 | 2,111,625 | 2,369,700 | Brazil | 1.5% |
| Enersis ADS | ENI | 65,000 | 1,024,863 | 1,155,050 | Chile | 0.7% |
| Korea Electric Power ADS² | KEP | 20,000 | 304,261 | 222,000 | South Korea | 0.1% |
| 4,694,533 | 5,246,850 | 3.2% | ||||
| Total investments | $102,679,935 | 118,722,670 | 71.9% | |||
| Other assets (net of liabilities) | 46,403,613 | 28.1% | ||||
| Total net assets | $165,126,283 | 100.0% | ||||
| ¹ Country of domicile unless otherwise indicated ² Non-income producing ³ Denotes a worldwide presence, comprising an entity with exposure to many regions and countries 4 Denotes country of primary exposure 5 Amount is less than 0.1% ADS: American Depositary Share | ||||||
The accompanying notes are an integral part of these financial statements.
36 | November 30, 2011 Annual Report
Sextant International Fund
| Statement of Assets and Liabilities | ||
| As of November 30, 2011 | ||
| Assets | ||
| Investments in securities, at value (Cost $102,679,935) | $118,722,670 | |
| Cash | 46,709,414 | |
| Dividends and interest receivable | 304,261 | |
| Receivable for Fund shares sold | 286,390 | |
| Total assets | 166,022,735 | |
| Liabilities | ||
| Payable for Fund shares redeemed | 686,038 | |
| Payable to affiliates | 91,021 | |
| Accrued expenses | 68,770 | |
| Accrued distribution fee | 33,338 | |
| Distributions payable | 17,285 | |
| Total liabilities | 896,452 | |
| Net assets | $165,126,283 | |
| Analysis of net assets | ||
| Paid-in capital (unlimited shares authorized, without par value) | $150,591,414 | |
| Unrealized net appreciation on investments | 16,042,735 | |
| Accumulated net realized loss on investments | (1,528,334) | |
| Undistributed net investment income | 20,468 | |
| Net assets applicable to Fund shares outstanding | $165,126,283 | |
| Fund shares outstanding | 11,457,517 | |
| Net asset value, offering and redemption price per share | $14.41 | |
| Statement of Operations | ||
| Year ended November 30, 2011 | ||
| Investment income | ||
| Dividends (net foreign tax of $362,863) | $2,894,419 | |
| Interest income | 2,597 | |
| Gross investment income | 2,897,016 | |
| Expenses | ||
| Investment adviser fees | 890,908 | |
| Distribution fees | 430,094 | |
| Audit fees | 57,855 | |
| Printing and postage | 37,112 | |
| Trustee fees | 32,570 | |
| Filing and registration fees | 24,240 | |
| Chief Compliance Officer expenses | 23,038 | |
| Retirement plan custodial fees | 7,373 | |
| Custodian fees | 6,514 | |
| Legal fees | 4,091 | |
| Total gross expenses | 1,513,795 | |
| Less custodian fee credits | (6,514) | |
| Net expenses | 1,507,281 | |
| Net investment income | $1,389,735 | |
| Net realized loss from investments and foreign currency | ($1,526,071) | |
| Net decrease in unrealized appreciation on investments | (6,737,002) | |
| Net loss on investments | ($8,263,073) | |
| Net decrease in net assets resulting from operations | ($6,873,338) | |
The accompanying notes are an integral part of these financial statements.
November 30, 2011 Annual Report | 37
Sextant International Fund
| Statements of Changes in Net Assets | Year ended Nov. 30, 2011 | Year ended Nov. 30, 2010 |
| Increase (decrease) in net assets from operations: | ||
| From operations | ||
| Net investment income | $1,389,735 | $600,368 |
| Net realized gain (loss) on investments | (1,526,071) | 1,594,850 |
| Net increase (decrease) in unrealized appreciation | (6,737,002) | 6,930,644 |
| Net increase (decrease) in net assets | (6,873,338) | 9,125,862 |
| Distributions to shareholders from | ||
| Net investment income | (1,389,585) | (585,559) |
| Capital gains distribution | - | (1,227,888) |
| Total distributions | (1,389,585) | (1,813,447) |
| Capital share transactions | ||
| Proceeds from sales of shares | 85,223,505 | 78,011,156 |
| Value of shares issued in reinvestment of dividends | 1,372,301 | 1,802,654 |
| Early redemption fees retained | 63,508 | 23,972 |
| Cost of shares redeemed | (64,057,958) | (32,246,915) |
| Net increase in net assets | 22,601,356 | 47,590,867 |
| Total increase in net assets | 14,338,433 | 54,903,282 |
| Net assets | ||
| Beginning of year | 150,787,850 | 95,884,568 |
| End of year | 165,126,283 | 150,787,850 |
| Undistributed net investment income | $20,468 | $17,947 |
| Shares of the Fund sold and redeemed | ||
| Number of shares sold | 5,526,541 | 5,343,193 |
| Number of shares issued in reinvestment of dividends | 95,232 | 120,017 |
| Number of shares redeemed | (4,199,243) | (2,264,418) |
| Net increase in number of shares outstanding | 1,422,530 | 3,198,792 |
| Financial Highlights | For year ended November 30, | ||||
| Selected data per share of outstanding capital stock throughout each year: | 2011 | 2010 | 2009 | 2008 | 2007 |
| Net asset value at beginning of year | $15.03 | $14.03 | $11.32 | $16.11 | $13.56 |
| Income from investment operations | |||||
| Net investment income | 0.12 | 0.06 | 0.02 | 0.03 | 0.04 |
| Net gain (loss) on securities (both realized and unrealized) | (0.63) | 1.12 | 2.72 | (4.79) | 2.93 |
| Total from investment operations | (0.51) | 1.18 | 2.74 | (4.76) | 2.97 |
| Less distributions | |||||
| Dividends (from net investment income) | (0.12) | (0.06) | (0.03) | (0.03) | (0.03) |
| Distributions (from capital gains) | - | (0.12) | - | - | (0.39) |
| Total distributions | (0.12) | (0.18) | (0.03) | (0.03) | (0.42) |
| Paid-in capital from early redemption fees | 0.01 | 0.00¹ | 0.00¹ | 0.00¹ | 0.00¹ |
| Net asset value at end of year | $14.41 | $15.03 | $14.03 | $11.32 | $16.11 |
| Total return | (3.31)% | 8.43% | 24.22% | (29.56)% | 21.90% |
| Ratios / supplemental data | |||||
| Net assets ($000), end of year | $165,126 | $150,788 | $95,885 | $21,497 | $13,854 |
| Ratio of expenses to average net assets | |||||
| Before custodian fee credits | 0.88% | 1.03% | 1.14% | 1.43% | 1.50% |
| After custodian fee credits | 0.88% | 1.03% | 1.13% | 1.42% | 1.47% |
| Ratio of net investment income after custodian fee credits to average net assets | 0.81% | 0.51% | 0.27% | 0.40% | 0.30% |
| Portfolio turnover rate | 7% | 2% | 2% | 10% | 8% |
| ¹ Amount is less than $0.01 | |||||
The accompanying notes are an integral part of these financial statements.
38 | November 30, 2011 Annual Report
Notes To Financial Statements
NOTE 1 — Organization
Saturna Investment Trust (the "Trust") was established under Washington State Law as a Business Trust on February 20, 1987. The Trust is registered as a no-load, open-end, diversified series management investment company under the Investment Company Act of 1940, as amended. Six portfolio series have been created to date: Sextant Short-Term Bond Fund, Sextant Bond Income Fund, Sextant Core Fund, Sextant Growth Fund, Sextant International Fund (the "Funds"), and Idaho Tax-Exempt Fund, which is distributed through a separate prospectus and the results of which are contained in a separate report.
Sextant Growth (previously known as Idaho Limited Maturity Tax-Exempt Fund until October 12, 1990, then Northwest Growth until September 28, 1995, when the investment objective of only Northwest stocks was changed) commenced operations as an equity fund on December 30, 1990. Sextant International and Sextant Short-Term Bond began operations September 28, 1995. Sextant Bond Income Fund (previously known as Washington Tax-Exempt Fund until September 28, 1995, when the investment objective of only Washington State Municipal Bonds was changed) began operations on March 2, 1993. Sextant Core Fund commenced operations March 30, 2007.
The investment objective of the Growth and International Funds is long-term capital growth. The investment objectives of the Core Fund are long-term capital appreciation and preservation. The investment objective of the Bond Income and Short-Term Bond Funds is current income, with Short-Term Bond having the additional objective of capital preservation.
NOTE 2 — Significant Accounting Policies
The following is a summary of the significant accounting policies, in conformity with accounting principles generally accepted in the United States of America, which are consistently followed by the Funds in preparation of their financial statements.
Security valuation:
Investments in securities traded on a national securities exchange and over-the-counter securities for which sale prices are available are valued at that price. Securities for which there are no sales are valued at latest bid price.
Fixed-income debt instruments, such as commercial paper, bankers' acceptances and U.S. Treasury Bills, with a maturity of 60 days or less are valued at amortized cost, which approximates market value. Any discount or premium is accreted or amortized on a straight-line basis until maturity.
Foreign markets may close before the time as of which the Funds' share prices are determined. Because of this, events occurring after the close and before the determination of the Funds' share prices may have a material effect on the values of some or all of the Funds' foreign securities. To account for this, the Funds may use outside pricing services for valuation of their non-U.S. securities.
In cases in which there is not a readily available market price, a fair value for such security is determined in good faith by or under the direction of the Board of Trustees.
Security transactions are recorded on trade date. Realized gains and losses on sales of securities are recorded on the identified cost basis.
Foreign currency:
Investment securities and other assets and liabilities denominated in foreign currencies are translated into U.S. dollar amounts at the date of valuation. Purchases and sales of investment securities and income and expense items denominated in foreign currencies are translated into U.S. dollar amounts on the respective dates of such transactions.
The Funds do not isolate that portion of the results of operations resulting from changes in foreign exchange rates on investments from the fluctuations arising from changes in market prices of securities held. Such fluctuations are included with the net realized and unrealized gain or loss from investments.
Reported net realized foreign exchange gains or losses arise from sales of foreign currencies, currency gains or losses realized between the trade and settlement dates on securities transactions, and the difference between the amounts of dividends, interest, and foreign withholding taxes recorded on the Funds' books and the U.S. dollar equivalent of the amounts actually received or paid. Net unrealized foreign exchange gains and losses arise from changes in the fair values of assets and liabilities, other than investments in securities at fiscal period end, resulting from changes in exchange rates.
Share valuation:
The net asset value ("NAV") per share of each Fund is calculated by dividing the sum of the value of the securities held by each Fund, plus cash or other assets, minus all liabilities (including estimated accrued expenses) by the total number of shares outstanding for each Fund, rounded to the nearest cent. The Funds' shares are not priced or traded on days the NYSE is closed. The NAV is the offering and redemption price per share.
The Trustees have adopted certain policies and procedures with respect to frequent trading of Fund shares. The Funds are intended for long-term investment and do not permit rapid trading of their shares. To discourage speculation, shares held less than ninety calendar days, including those held in omnibus accounts at intermediaries, may be assessed a 2% early redemption fee (payable to the Fund) when redeemed. These fees are deducted from the redemption proceeds otherwise payable to the shareowner and retained by the Funds as paid-in capital and included in the daily NAV calculation. The Funds cannot always identify all intermediaries, or detect or prevent trading that violates the Frequent Trading Policy through intermediaries or omnibus accounts.
Fair value measurements:
The Funds have adopted authoritative fair valuation accounting standards which establish an authoritative definition of fair value and set out a hierarchy for measuring fair value. These standards require additional disclosures about the various inputs and valuation techniques used to develop the measurements of fair value and a discussion in changes in valuation techniques and related inputs during the period. These inputs are summarized in the three broad levels listed below.
Level 1 — Unadjusted quoted prices in active markets for identical assets or liabilities that the Trust has the ability to access.
Level 2 — Observable inputs other than quoted prices in Level 1 that are observable for the asset or liability, either directly or indirectly. These inputs may include quoted prices for the identical instrument on an inactive market, prices for similar instruments, interest rates, prepayment speeds, credit risk, yield curves, default rates, and similar data.
Level 3 — Unobservable inputs for the asset or liability, to the extent relevant observable inputs are not available, representing the Trust's own assumptions about the assumptions a market participant would use in valuing the asset or liability, and would be based on the best information available.
The availability of observable inputs can vary from security to security and is affected by a wide variety of factors, including, for example, the type of security, whether the security is new and not yet established in the market place, the liquidity of markets, and other characteristics particular to the security. To the extent that valuation is based on models or inputs that are less observable or unobservable in the market, the determination of fair value requires more judgment. Accordingly, the degree of judgment exercised in determining fair value is greatest for instruments categorized in Level 3.
The inputs used to measure fair value may fall into different levels of the fair value hierarchy. In such cases, for disclosure purposes, the level in the fair value hierarchy within which the fair value measurement falls in its entirety, is determined based on the lowest level input that is significant to the fair value measurement in its entirety.
The inputs or methodology used for valuing securities are not necessarily
November 30, 2011 Annual Report | 39
Notes To Financial Statements (continued)
an indication of the risk associated with investing in those securities.
The following is a summary of the inputs used as of November 30, 2011 in valuing the Funds' investments carried at value:
| Funds | Total | Level 1 Quoted Price | Level 2 Significant Observable Input | Level 3 Significant Unobservable Input |
| Short-Term Bond | ||||
| Certificate of deposit | $235,457 | $- | $235,457 | $- |
| Corporate Bonds | $3,694,705 | $- | $3,694,705 | $- |
| U.S. Government | $358,969 | $- | $358,969 | $- |
| Foreign Government Bonds | $479,580 | $- | $479,580 | $- |
| Municipal Bonds | $836,481 | $- | $737,530 | $98,951 |
| Total Assets | $5,605,192 | $- | $5,506,241 | $98,951 |
Short-Term Bond Level 3 Roll-Forward Municipal Securities | ||||
| Beginning balance | $98,080 | |||
| Total unrealized gains or losses | $871 | |||
| Purchases | $- | |||
| Maturity | $- | |||
| Transfers in and/or out of level 3 | $- | |||
| Ending Balance | $98,951 | |||
| Bond Income | ||||
| Corporate Bonds | $2,958,318 | $- | $2,958,318 | $- |
| Foreign Government Bonds | $241,243 | $- | $241,243 | $- |
| Municipal Bonds | $2,294,889 | $- | $2,294,889 | $- |
| Total Assets | $5,494,450 | $- | $5,494,450 | $- |
| Core Fund | ||||
| Common Stocks | $3,003,511 | $3,003,511 | $- | $- |
| Corporate Bonds | $1,445,020 | $- | $1,445,020 | $- |
| Municipal Bonds | $207,265 | $- | $207,265 | $- |
| Total Assets | $4,655,796 | $3,003,511 | $1,652,285 | $- |
| Growth Fund | ||||
| Common Stocks | $21,489,802 | $21,489,802 | $- | $- |
| Total Assets | $21,489,802 | $21,489,802 | $- | $- |
| International Fund | ||||
| Common Stocks | $118,722,670 | $117,632,345 | $1,090,325 | $- |
| Total Assets | $118,722,670 | $117,632,345 | $1,090,325 | $- |
New accounting pronouncement:
In May 2011, FASB issued ASU No. 2011-04 "Amendments to Achieve Common Fair Value Measurement and Disclosure Requirements" in GAAP and the International Financial Reporting Standards ("IFRSs"). ASU No. 2011-04 amends FASB ASC Topic 820, Fair Value Measurements and Disclosures, to establish common requirements for measuring fair value and for disclosing information about fair value measurements in accordance with GAAP and IFRSs. ASU No. 2011-04 is effective for fiscal years beginning after December 15, 2011 and for interim periods within those fiscal years. Management is currently evaluating the impact these amendments may have on the Funds' financial statements.
Odd Lots:
The bid-side valuations provided by the independent pricing service are for institutional "round-lot" holdings ("Round Lots"). Round Lots consist of 100 bonds (approximately $100,000 each). Some of a Fund's holdings may consist of less than a Round Lot and are considered "Odd Lots." Odd Lot municipal bonds trade at a discount to Round Lots municipal bonds to compensate for the effect of the fixed costs associated with any trade. To reflect this discount, the Fund applies a discount to the valuation of Odd Lot municipal bonds holdings as shown in the following chart.
| Total Face Value | Adjustment to Price |
| Under 10,000 | -0.750% |
| 10,000-24,999 | -0.625% |
| 25,000-49,999 | -0.500% |
| 50,000-74,999 | -0.375% |
| 75,000-99,999 | -0.250% |
| 100,000 and up | none |
Derivative instruments and hedging activities:
The Funds have adopted the financial accounting reporting rules regulations that require enhanced disclosure that enables investors to understand how and why an entity uses derivatives, how derivatives are accounted for, and how derivative instruments affect an entity's results of operations and financial position.
During the fiscal year ended November 30, 2011, the Funds did not hold any derivative instruments.
Investment concentration:
The Funds may have deposits of cash with the custodian from time to time for one or more reasons. "Other assets (net of liabilities)" in the Funds' Schedules of Investments primarily represents cash on deposit with the custodian. Cash on deposit will vary widely over time. Accounting standards identify these items as a concentration of credit risk, requiring disclosure regardless of the degree of risk. The risk is managed by financial analysis and review of the custodian's operations, resources, and protections available to the Trust. This periodic process includes evaluation of other financial institutions providing investment company custody services.
Federal income taxes:
The Funds intend to comply with the requirements of the Internal Revenue Code necessary to qualify as a regulated investment company and to make the requisite distributions of income and capital gains to its shareowners sufficient to relieve it from all or substantially all federal income taxes. Therefore, no federal income tax provision is required.
The Funds recognize the tax benefits of uncertain tax positions only where the position is "more likely than not" to be sustained assuming examination by tax authorities. Management has analyzed the Funds' tax positions, and has concluded that no liability for unrecognized tax benefits should be recorded related to uncertain tax positions taken on returns filed for open tax years (2008 — 2010), or expected to be taken in the Funds' 2011 tax returns. The Funds identify their major tax jurisdiction as U.S. federal and foreign jurisdictions where the Funds make significant investments; however, the Funds are not aware of any tax positions for which it is reasonably possible that the total amounts of unrecognized tax benefits will change materially in the next twelve months.
Reclassification of capital accounts:
Accounting principles generally accepted in the United States of America require that certain components of net assets relating to permanent differences be reclassified between financial and tax reporting. These reclassifications have no effect on net assets or net asset value per share:
40 | November 30, 2011 Annual Report
Notes To Financial Statements (continued)
| Short-Term Bond | Bond Income | |
| Undistributed net investment income | $ - | $ - |
| Accumulated gains (losses) | - | - |
| Paid-in capital | $ - | $ - |
| Core | |
| Undistributed net investment income | $11 |
| Accumulated gains (losses) | $(11) |
| Paid-in capital | $- |
| Growth | International | |
| Undistributed net investment income | $- | $2,371 |
| Accumulated gains (losses) | $- | $(2,371) |
| Paid-in capital | $- | $- |
These reclassifications were due to the treatment of foreign currencies.
Distributions to shareowners:
For the Sextant Short-Term Bond Fund and Sextant Bond Income Fund, dividends to shareowners from net investment income are paid daily and distributed on the last business day of each month. For the Sextant Core Fund, Sextant Growth Fund, and Sextant International Fund, dividends to shareholders from net investment income are payable at the end of each November.
Distributions of capital gains, if any, are made at least annually, and as required to comply with federal excise tax requirements. Distributions to shareowners are determined in accordance with income tax regulations, and are recorded on the ex-dividend date. Dividends are paid in shares of the Funds, at the net asset value on the payable date. Shareowners may elect to take dividends in cash.
Use of estimates:
The preparation of financial statements in conformity with accounting principles generally accepted in the United States of America requires management to make estimates and assumptions that affect the reported amounts of assets and liabilities and disclosure of contingent assets and liabilities at the date of the financial statements and the reported amounts of increases and decreases in net assets from operations during the reporting period. Actual results could differ from those estimates.
Other:
Interest income is recognized on an accrual basis. Premiums on securities purchased are amortized and discounts are accreted over the lives of the respective securities. Cash dividends from equity securities are recorded as income on the ex-dividend date.
NOTE 3 — Transactions with Affiliated Persons
Under a contract approved by shareowners on September 28, 1995 (March 30, 2007, for Sextant Core Fund), Saturna Capital Corporation provides investment advisory services and certain other administrative services required to conduct Trust business. Expenses incurred by the Trust on behalf of the Funds (e.g., legal fees) are allocated to the Funds on the basis of relative daily average net assets. For such services, each of the Funds pays the Adviser a base Investment Advisory and Administrative Services Fee of .60% of average net assets per annum, payable monthly. The Adviser has agreed to certain limits on expenses, as described below.
The base Advisory Fee is subject to adjustment up or down depending on the investment performance of the Fund relative to a specified index.
Performance Adjustment for Sextant Short-Term Bond Fund and Sextant Bond Income Fund:
- For each month in which either of these Funds' total investment return (change in net asset value plus all distributions reinvested) for the one year period through that month outperforms or underperforms the total return of a specified index for that period by 1% or more but less than 2%, the Base Fee is increased or decreased by the annual rate of .10% of the Fund's average daily net assets for the preceding year.
- If the outperformance or underperformance is 2% or more, then the adjustment is at the annual rate of .20%.
Performance adjustment for Sextant Core Fund, Sextant Growth Fund, and Sextant International Fund:
- For each month in which these Funds' total investment return (change in net asset value plus all distributions reinvested) for the one year period through that month outperforms or underperforms the total return of a specified index for that period by 1% or more but less than 2%, the Base Fee is increased or decreased by the annual rate of .10% of the Fund's average daily net assets for the preceding year.
- If the outperformance or underperformance is 2% or more but less than 4%, then the adjustment is at the annual rate of .20%.
- If the outperformance or underperformance is 4% or more, the adjustment is at an annual rate of .30%.
The Adviser has voluntarily undertaken to limit expenses of Sextant Short-Term Bond Fund to 0.75%, and Sextant Bond Income Fund to 0.90%, through March 31, 2013. It waives its investment advisory and administrative fee to Sextant Short-Term Bond Fund and Sextant Bond Income Fund completely should assets of such Fund be less than $2 million. For the fiscal year ended November 30, 2011, the advisory fees incurred were as follows:
| Adviser Fees | Adviser Fees Waived | Expense Reimbursement | |
| Short-Term Bond | $33,952 | $33,428 | $ - |
| Bond Income | 32,672 | $19,647 | $ - |
| Core | 25,972 | N/A | N/A |
| Growth | 85,662 | N/A | N/A |
| International | $890,908 | N/A | N/A |
In accordance with the expense waiver noted above, for the fiscal year ended November 30, 2011, Saturna Capital waived a portion or all of the advisory fees of the Sextant Short-Term Bond Fund and Sextant Bond Income Fund. The adviser cannot recoup previously waived fees.
Saturna Brokerage Services, Inc. ("SBS"), a discount brokerage and subsidiary of Saturna Capital Corporation, is registered as a broker-dealer and acts as distributor. On October 3, 2006, The Funds adopted a Distribution Plan in accordance with Rule 12b-1 under the 1940 Act. The plan provides that the Funds will pay a fee to SBS at an annual rate of .25% of the average net assets of the Funds. During the fiscal year ended November 30, 2011, the Trust paid SBS the following amounts:
| 12b-1 fees | |
| Short-Term Bond | $14,482 |
| Bond Income | 14,065 |
| Core | 14,022 |
| Growth | 61,894 |
| International | $430,094 |
November 30, 2011 Annual Report | 41
Notes To Financial Statements (continued)
SBS is the primary broker used to effect portfolio transactions for the Trust. SBS currently executes portfolio transactions for the Trust for free (no commissions). Should any change occur in this policy, shareowners would be notified. Transactions effected through other brokers may be subject to a commission payable to that broker.
Saturna Trust Company ("STC"), a subsidiary of Saturna Capital, acts as retirement plan custodian for Fund shareowners. For the year ended November 30, 2011, the Fund paid STC the following amounts:
| Retirement plan custodial fees | |
| Short-Term Bond | $4,394 |
| Bond Income | 1,871 |
| Core | 1,605 |
| Growth | 6,691 |
| International | $7,373 |
Mr. Nicholas Kaiser serves as a trustee and president of the Trust. Also a director and the chairman of Saturna Capital, he is not compensated by the Trust. For the fiscal year ended November 30, 2011, the Trust incurred compensation expenses of $29,000 which is included in $47,279 of total expenses for the independent Trustees.
The officers of the Trust are paid by Saturna Capital, not the Trust, except the Chief Compliance Officer, who is partially compensated by the Trust. For the year ended November 30, 2011, the Short-Term Bond, Bond Income, Core, Growth, and International Funds incurred $833; $836; $868; $3,453; and $23,038 of compensation expenses, respectively, for the Chief Compliance Officers.
On November 30, 2011, the trustees, officers, and their affiliates as a group owned 32.2%, 33.7%, 43.7%, 11.4% and 2.6% of the outstanding shares of Short-Term Bond, Bond Income, Core, Growth and International, respectively.
NOTE 4 — Distributions to Shareowners
The tax characteristics of distributions paid during the fiscal years ended November 30, 2010, and 2011, were as follows:
| Year ended Nov. 30, 2011 | Year ended Nov. 30, 2010 | |
| Short-Term Bond Fund | ||
| Ordinary income | $103,724 | $113,515 |
| Bond Income Fund | ||
| Ordinary income | 200,532 | 184,745 |
| Core Fund | ||
| Ordinary income | 85,118 | 81,285 |
| Growth Fund | ||
| Ordinary income | 114,994 | - |
| Long-term capital gain¹ | 15,111 | 65,917 |
| International Fund | ||
| Ordinary income | 1,389,585 | 585,559 |
| Long-term capital gain¹ | $- | $1,227,888 |
¹ Long-term capital gain dividend designated pursuant to Section 852(b)(3) of the Internal Revenue Code.
NOTE 5 — Federal Income Taxes
The cost basis of investments for federal income tax purposes at November 30, 2011 were as follows:
| Short-Term Bond | Bond Income | |
| Cost of investments | $5,494,465 | $5,083,417 |
| Gross tax unrealized appreciation | 115,450 | 417,643 |
| Gross tax unrealized depreciation | 4,723 | 6,610 |
| Net tax unrealized appreciation | $110,727 | $411,033 |
| Core | |
| Cost of investments | $4,326,233 |
| Gross tax unrealized appreciation | 633,817 |
| Gross tax unrealized depreciation | 304,254 |
| Net tax unrealized appreciation | $329,563 |
| Growth | International | |
| Cost of investments | $14,461,245 | $102,679,935 |
| Gross tax unrealized appreciation | 8,084,917 | 23,867,010 |
| Gross tax unrealized depreciation | 1,056,360 | 7,824,275 |
| Net tax unrealized appreciation | $7,028,557 | $16,042,735 |
As of November 30, 2011, components of distributable earnings on a tax basis were as follows:
| Short-Term Bond | Bond Income | |
| Net tax unrealized appreciation | $110,727 | $411,033 |
| Undistributed ordinary income | 1,381 | 8 |
| Accumulated net realized loss | (13,227) | (40,052) |
| Total distributable loss | (11,846) | (40,044) |
| Total accumulated earnings | $98,881 | $370,989 |
| Core | |
| Net tax unrealized appreciation | $329,563 |
| Undistributed ordinary income | 2,535 |
| Accumulated net realized loss | (223,395) |
| Total distributable loss | (220,860) |
| Total accumulated earnings | $108,703 |
| Growth | International | |
| Net tax unrealized appreciation | $7,028,557 | $16,042,735 |
| Undistributed ordinary income | 28,028 | 20,468 |
| Accumulated net realized loss | (295,225) | (1,528,334) |
| Total distributable loss | (267,197) | (1,507,866) |
| Total accumulated earnings | $6,761,360 | $14,534,869 |
42 | November 30, 2011 Annual Report
Notes To Financial Statements (continued)
At November 30, 2011, the Funds had capital loss carryforwards as follows, subject to regulation:
| Carryforward | Expiration | |
| Short-Term Bond | ||
| $2,972 | 2014 | |
| 10,255 | 2016 | |
| $13,227 | ||
| Bond Income | ||
| $19,585 | 2016 | |
| $20,467 | 2017 | |
| $40,052 | ||
| Core | ||
| $74,883 | 2016 | |
| $62,995 | 2017 | |
| $11,779 | 2018 | |
| $73,738 | 2019 | |
| $223,395 | ||
| Growth | ||
| $295,225 | 2019 | |
| $295,225 | ||
| International | ||
| $1,528,334 | 2019 | |
| $1,528,334 | ||
Prior to their expiration, such loss carryforwards may be used to offset future net capital gains realized for federal income tax purposes.
NOTE 6 — Investments
Investment transactions other than short-term investments for the fiscal year ended November 30, 2011, were as follows:
| Purchases | Sales | |
| Short-Term Bond | $1,671,145 | $716,969 |
| Bond Income | 1,171,630 | 705,879 |
| Core | 614,513 | 1,104,024 |
| Growth | 3,531,574 | 4,130,435 |
| International | $42,243,735 | $7,786,257 |
NOTE 7 — Custodian
Under agreements in place with BNY Mellon, custody fees are reduced by credits for cash balances. Such reductions for the fiscal year ended November 30, 2011, were as follows:
| Custodian Fee Credits | |
| Short-Term Bond | $264 |
| Bond Income | 253 |
| Core | 242 |
| Growth | 1,181 |
| International | $6,514 |
NOTE 8 — Subsequent Events
In preparing these financial statements, the Funds have evaluated events and transactions for potential recognition or disclosure through the date the financial statements were issued. There were no events or transactions during the period that materially impacted the amounts or disclosures in the Funds' financial statements.
November 30, 2011 Annual Report | 43
Report of Independent Registered Public Accounting Firm
To the Shareholders and Board of Trustees
Saturna Investment Trust,
We have audited the accompanying statements of assets and liabilities of the Sextant Short-Term Bond Fund, Sextant Bond Income Fund, Sextant Core Fund, Sextant Growth Fund and Sextant International Fund, each a series of the Saturna Investment Trust (the "Trust"), including the schedules of investments as of November 30, 2011, the related statements of operations for the year then ended, the statements of changes in net assets for each of the two years in the period then ended, and the financial highlights for each of the five years in the period then ended and with respect to the Sextant Core Fund, the financial highlights for each of the four years in the period then ended and for the period March 30, 2007 (commencement of operations) to November 30, 2007. These financial statements and financial highlights are the responsibility of the Trust's management. Our responsibility is to express an opinion on these financial statements and financial highlights based on our audits.
We conducted our audits in accordance with the standards of the Public Company Accounting Oversight Board (United States). Those standards require that we plan and perform the audit to obtain reasonable assurance about whether the financial statements and financial highlights are free of material misstatement. The Trust is not required to have, nor were we engaged to perform, an audit of its internal control over financial reporting. Our audits included consideration of internal control over financial reporting as a basis for designing audit procedures that are appropriate in the circumstances, but not for the purpose of expressing an opinion on the effectiveness of the Trust's internal control over financial reporting. Accordingly, we express no such opinion. An audit includes examining, on a test basis, evidence supporting the amounts and disclosures in the financial statements, assessing the accounting principles used and significant estimates made by management, as well as evaluating the overall financial statement presentation. Our procedures included confirmation of securities owned as of November 30, 2011, by correspondence with the custodian. We believe that our audits provide a reasonable basis for our opinion.
In our opinion the financial statements and financial highlights referred to above present fairly, in all material respects, the financial position of Sextant Short-Term Bond Fund, Sextant Bond Income Fund, Sextant Core Fund, Sextant Growth Fund, and Sextant International Fund, as of November 30, 2011, the results of their operations for the year then ended, the changes in their net assets for each of the two years in the period then ended, and their financial highlights for each of the periods indicated above, in conformity with accounting principles generally accepted in the United States of America.
Philadelphia, Pennsylvania
January 13, 2011
Tait, Weller & Baker LLP
44 | November 30, 2011 Annual Report
Expenses (unaudited)
All mutual funds have operating expenses. As a Sextant Fund shareowner, you incur ongoing costs, including management fees, distribution (or service) 12b-1 fees, and other fund expenses such as shareowner reports (like this one). Operating expenses, which are deducted from a fund's gross earnings, directly reduce the investment return of a fund. Mutual funds (unlike other financial investments) only report their results after deduction of operating expenses.
With the Sextant Funds, unlike many other mutual funds, you do not incur sales charges (loads) on purchases, reinvested dividends, or other distributions. You do not incur redemption fees, exchange fees, or fees related to Saturna Individual Retirement Accounts. However, to discourage speculation, you may incur a 2% redemption fee for shares held less than 90 calendar days. You may incur fees related to extra services requested by you for your account, such as a checkbook to use for redemptions or bank wires. The examples below are intended to help you understand your ongoing costs (in dollars) of investing in the Funds and to compare these costs with the ongoing costs of investing in other mutual funds.
Examples
The following example is based on an investment of $1,000 invested at the beginning of the period and held for the entire period (June 1, 2011 to November 30, 2011).
Actual Expenses
The first line for each Fund provides information about actual account values and actual expenses. You may use the information in this line, together with the amount you have invested, to estimate the expenses you paid over the period. Simply divide your account value by $1,000 (for example, an $8,600 account value divided by $1,000 = 8.6), then multiply the result by the number in the first line under the heading entitled "Expenses Paid During Period" to estimate the expenses you paid on your account during this period. The Funds also charge for extra services rendered on request, which you may need to add to determine your total expenses, for example $10 per checkbook, $25 per domestic bank wire, $35 per international bank wire, or overnight courier delivery charges.
Hypothetical Example For Comparison Purposes
The second line for each Fund provides information about hypothetical account values and hypothetical expenses based on the Fund's actual expense ratio (based on the last six months) and an assumed rate of return of 5% per year before expenses, which is not the Fund's actual return. The hypothetical account values and expenses may not be used to estimate the actual ending balance or expenses you paid for the period. You may use this information to compare ongoing costs of investing in the Fund and other mutual funds. To do so, compare this 5% hypothetical example with the 5% hypothetical examples that appear in the shareowner reports of other mutual funds. You may wish to add other fees assessed by custodians other than Saturna Trust Company that are not included in the expenses shown in the table, such as IRA fees (there are no fees on Saturna IRAs, ESAs or HSAs with the Sextant Funds), and charges for extra services such as check writing and bank wires.
Please note that the expenses shown in the tables are meant to highlight your ongoing costs only and do not reflect any transactional costs, such as sales charges (loads), redemption fees or exchange fees (note that the Sextant Funds do not charge any such transactional costs, with the exception of a redemption fee on shares held less than 90 calendar days). Therefore, the "Hypothetical" line of each fund is useful in comparing ongoing costs only, and may not help you determine the relative total costs of owning different funds.
| Beginning Account Value (June 1, 2011) | Ending Account Value (November 30, 2011) | Expenses Paid During Period¹ | Annualized Expense Ratio | |
| Short-Term Bond Fund | ||||
| Actual | $1,000 | $1,006.40 | $3.72 | 0.74% |
| Hypothetical (5% return before expenses) | $1,000 | $1,021.36 | $3.75 | 0.74% |
| Bond Income Fund | ||||
| Actual | $1,000 | $1,040.30 | $4.60 | 0.90% |
| Hypothetical (5% return before expenses) | $1,000 | $1,020.56 | $4.56 | 0.90% |
| Core Fund | ||||
| Actual | $1,000 | $955.80 | $5.59 | 1.14% |
| Hypothetical (5% return before expenses) | $1,000 | $1,019.35 | $5.77 | 1.14% |
| Growth Fund | ||||
| Actual | $1,000 | $916.30 | $4.13 | 0.86% |
| Hypothetical (5% return before expenses) | $1,000 | $1,020.76 | $4.36 | 0.86% |
| International Fund | ||||
| Actual | $1,000 | $903.70 | $4.10 | 0.86% |
| Hypothetical (5% return before expenses) | $1,000 | $1,020.76 | $4.36 | 0.86% |
¹ Expenses are equal to the annualized expense ratio indicated above (based on the most recent semi-annual period of June 1, 2011, through November 30, 2011), multiplied by the average account value over the period multiplied by 183/365 (to reflect the one-half year period).
November 30, 2011 Annual Report | 45
| Trustees and Officers (unaudited) | ||||
| Name (age), address | Position(s) held with Trust and length of time served | Principal occupation(s) during past 5 Years | Number of portfolios in Saturna Fund complex overseen by Trustee | Other directorships held by Trustee |
| Independent Trustees | ||||
| Gary A. Goldfogel, MD (53) 1500 N. State Street Bellingham, WA 98225 | Independent Trustee since 1995 | Medical Examiner (pathologist); Owner, Avocet Environmental Testing (laboratory) | Six | None |
| Herbert G. Grubel, PhD (77) Apt. 1202 — 125 West Second St. North Vancouver, BC Canada V7M 1C5 | Independent Trustee¹ since 2005 | Professor Emeritus of Economics, Simon Fraser University; Senior Fellow, Fraser Institute | Nine | Amana Mutual Funds Trust |
| John E. Love (79) 1002 Spokane Street Garfield, WA 99130 | Chairman, Independent Trustee since 1987 | Owner, J.E. Love Co. (agricultural equipment manufacturer) | Six | None |
| Ronald H. Fielding, MBA, CFA (62) 42 Surfsong Rd. Kiawah Island, SC 29455 | Independent Trustee since 2009 | Retired (2009); Senior Vice President & Portfolio Manager, Oppenheimer Funds Rochester Division | Six | ICI Mutual Insurance |
| Interested Trustee | ||||
| Nicholas F. Kaiser, MBA, CFA (65) 1300 N. State Street Bellingham, WA 98225 | President, Trustee¹ since 1990 | Chairman (retired president 2009), Saturna Capital Corporation | Nine | Amana Mutual Funds Trust |
| Officers who are not Trustees | ||||
| Phelps S. McIlvaine (58) 1300 N. State Street Bellingham, WA 98225 | Vice President since 1994 | Vice President, Saturna Capital Corporation; Treasurer, Saturna Brokerage Services | N/A | N/A |
| Christopher Fankhauser (40) 1300 N. State Street Bellingham, WA 98225 | Treasurer¹ since 2002 | Chief Operations Officer, Saturna Capital Corporation; Vice President and Chief Operations Officer, Saturna Brokerage Services | N/A | N/A |
| Ethel B. Bartolome (39) 1300 N. State Street Bellingham, WA 98225 | Secretary¹ since 2001 | Corporate Administrator, Saturna Capital Corporation | N/A | N/A |
| JoAnne Langhäuser (52) 1300 N. State Street Bellingham, WA 98225 | Chief Compliance Officer¹ since 2011 | Chief Compliance Officer, Saturna Capital Corporation and Funds; Senior Compliance Manager, Edge Asset Management, Inc.; Assistant Vice President, WM Advisors, Inc. | N/A | N/A |
Term of Office: each Trustee serves for the lifetime of the Trust or until he dies, resigns, is removed, or not re-elected by the shareowners. Each officer serves a one-year term subject to annual reappointment by the Trustees.
The Fund's Statement of Additional Information, available without charge upon request by calling Saturna Capital at 1-800/SATURNA and on the Funds' website, www.sextantfunds.com, includes additional information about the Trustees.
On November 30, 2011, the trustees, officers, and their affiliates as a group owned 32.2%, 33.7%, 43.7%, 11.4% and 2.6% of the outstanding shares of Short-Term Bond, Bond Income, Core, Growth and International Funds, respectively. Saturna Capital Corporation is the Trust's adviser and Saturna Brokerage Services, Inc. is the Trust's distributor. Mr. Kaiser is the portfolio manager of the Sextant Growth Fund and the Sextant International Fund. He is an interested person of the Trust by reason of his positions with the Trust's adviser and distributor, and with the Amana Mutual Funds Trust. Mr. McIlvaine is the portfolio manager of the Sextant Bond Income Fund, Sextant Short-Term Bond Fund and Idaho Tax-Exempt Fund. He is an interested person of the Trust by reason of his positions with the Trust's adviser and distributor. Mr. Fankhauser, Mrs. Bartolome, and Ms. Langhäuser are also interested persons of the Trust by reason of their positions with Trust's adviser and distributor, and with Amana Mutual Funds Trust.
¹Holds same position with Amana Mutual Funds Trust.
46 | November 30, 2011 Annual Report
Renewal of Investment Advisory Contract (unaudited)
During their meeting of September 19, 2011, the Trustees of Saturna Investment Trust discussed the Trust's various operating agreements related to the Sextant Funds (Short-Term Bond Fund, Bond Income Fund, Core Fund, Growth Fund, and International Fund) ("Funds"). The Trustees focused on renewing the Investment Advisory and Administration Agreements between the Funds and Saturna Capital Corporation ("Saturna"), and discussed the nature, extent, and quality of the services provided by Saturna. The Trustees discussed Saturna's experience, ability, and commitment to quality service through performing internally such functions as shareowner servicing, administration, retirement plan and trust services, accounting, marketing, and distribution — in addition to investment management.
The Trustees took into consideration Saturna's continued avoidance of significant operational problems, plus its substantial investments in premises, personnel, training, and equipment to meet investor needs. They recognized Saturna's efforts to recruit and retain increasingly qualified, experienced, and specialized staff, and to improve the capital base on which Saturna operates, which the Trustees believe is important to the long-term success of the Funds.
The Trustees found that the investment performance of the Sextant International Fund, both in absolute numbers and relative to funds in its Morningstar category, was outstanding. Performance of both Sextant Growth Fund and Sextant Core Fund was very good. The Trustees also judged the performance of Sextant Short-Term Bond Fund and the Sextant Bond Income Fund as quite satisfactory, particularly considering the quality focus of their portfolios, which is not universally the case among bond funds, many of which incur greater risk in the name of performance. The Trustees found such information helpful in establishing expectations regarding the performance of the adviser and whether to continue the advisory contract.
The Trustees reviewed the fees and expenses of the Funds. They noted that the Funds' performance-based advisory fees are reasonable and fair to the shareowners, and unusual in the industry. The Trustees found the expense ratios to be highly competitive given the sizes of the Funds, services provided, and expenses incurred.
The Trustees reviewed Saturna's financial information and discussed the issue of profitability related to management and administration of the Funds as part of their evaluation of whether the fees under the advisory contract bear a reasonable relationship to the mix of services provided by Saturna, including the nature, extent, and quality of such services. The Trustees noted Saturna's sharing of its revenues to pay marketing and distribution costs of the Funds.
The Trustees considered the increasing assets of the Funds, and the extent to which advisory fees reflected economies of scale. The Trustees noted that, although the assets of the Funds generally have grown, the Funds remain small, and there has been no opportunity for Saturna to demonstrate economies of scale. In fact, Saturna continues to operate the Funds at significant cost to itself. The Trustees also considered whether there are other potential benefits to Saturna from acting as investment adviser and found none.
In considering other potential benefits to Saturna from acting as investment adviser, the Trustees noted that there were no soft dollar arrangements with respect to trading in the Funds' portfolios. Indeed, Saturna voluntarily waives brokerage commissions for Fund portfolio trades executed through its affiliated broker at a considerable cost to Saturna, which results in savings to Fund shareowners.
The Trustees considered the fees charged by Saturna to other kinds of accounts and the different services provided to those accounts, as well as the ways in which Saturna's service and work done for other accounts it manages benefit the Funds.
The Trustees concluded that the fees paid by the Funds to Saturna were reasonable in light of the services provided, comparative performance, expense and advisory fee information, costs of services provided and profits to be realized and benefits derived or to be derived by Saturna from its relationship with the Funds. Following this discussion, the Trustees unanimously agreed to renew the Investment Advisory and Administration Agreements between Saturna and each of Sextant Bond Income, Sextant Short Term Bond, Sextant Core, Sextant Growth, and Sextant International Funds.
November 30, 2011 Annual Report | 47
Availability of Quarterly Portfolio Information
(1) The Sextant Funds file complete schedules of portfolio holdings with the SEC for the first and third quarters of each fiscal year on Form N-Q.
(2) The Funds' Forms N-Q are available on the SEC's website at www.sec.gov, and at www.sextantfunds.com.
(3) The Funds' Forms N-Q may be reviewed and copied at the SEC's Public Reference Room in Washington, DC. Information on the operation of the Public Reference Room may be obtained by calling 1-800-SEC-0330.
(4) The Funds make a complete schedule of portfolio holdings after the end of each month available to investors at www.sextantfunds.com.
Availability of Proxy Voting Information
(1) A description of the policies and procedures that the Funds use to determine how to vote proxies relating to portfolio securities is available (a) without charge, upon request, by calling Saturna Capital at 1-800-728-8762; (b) on the Funds' website at www. sextantfunds.com; and (c) on the SEC's website at www.sec.gov.
(2) Information regarding how each Fund voted proxies relating to portfolio securities during the most recent 12-month period ended June 30 is available (a) without charge, upon request, by calling Saturna Capital at 1-800-728-8762; (b) on the Funds' website at www.sextantfunds.com; and (c) on the SEC's website at www.sec.gov.
Privacy Statement
At Saturna Capital and the Sextant Mutual Funds, we understand the importance of maintaining the privacy of your financial information. We want to assure you that we protect the confidentiality of any personal information that you share with us. In addition, we do not sell information about our current or former customers.
In the course of our relationship, we gather certain nonpublic information about you, including your name, address, investment choices, and account information. We do not disclose your information to unaffiliated third parties unless it is necessary to process a transaction; service your account; deliver your account statements, shareholder reports and other information; or as required by law. When we disclose information to unaffiliated third parties, we require a contract to restrict the companies' use of customer information and from sharing or using it for any purposes other than performing the services for which they were required.
We may share information within the Saturna Capital family of companies in the course of informing you about products or services that may address your investing needs.
We maintain our own technology resources to minimize the need for any third party services, and restrict access to information within Saturna. We maintain physical, electronic, and procedural safeguards to guard your personal information. If you have any questions or concerns about the security or privacy of your information please call us at 1-800/SATURNA (1-800-728-8762)
Householding Policy
To reduce expenses, we may mail only one copy of the Funds' prospectus, each annual and semi-annual report, and proxy statements when necessary, to those addresses shared by two or more accounts. If you wish to receive individual and/or more copies of these documents, please call us at 1-800/SATURNA or write to us at Saturna Capital/Sextant Mutual Funds, P.O. Box N, Bellingham, WA 98227. We will begin sending you individual copies 30 days after receiving your request.
If you are currently receiving multiple copies and wish to receive only one copy, please call us at 1-800/SATURNA or write to us at Saturna Capital/Sextant Mutual Funds, P.O. Box N, Bellingham, WA 98227. We will begin sending you a single copy with subsequent report mailings.
www.sextantfunds.com
Saturna Capital (logo omitted)
1300 North State Street
Bellingham, WA 98225
www.saturna.com
800/SATURNA
This report is issued for the information of the shareowners of the Funds. It is not authorized for distribution to prospective investors unless it is accompanied or preceded by an effective prospectus relating to the securities of the Funds. The Sextant Funds are series of Saturna Investment Trust.
Saturna Brokerage Services, Distributor

IDAHO TAX-EXEMPT FUND
ANNUAL REPORT
November 30, 2011
Performance Summary: (unaudited)
| Average Annual Returns (for calendar years ended December 31, 2011) | |||||
| 10 Years | 5 Years | 3 Years | 1 Year | Expense Ratio¹ | |
| Idaho Tax-Exempt Fund | 4.31% | 4.46% | 6.56% | 7.97% | 0.74% |
| S&P Idaho Municipal Bond Index | 5.75% | 5.08% | 10.48% | 10.85% | N/A |
| "Muni Single State Long" Category Average | 4.49% | 3.66% | 9.78% | 10.20% | N/A |
| Morningstar™ Ratings² | |||||
| "Muni Single State Long" Category | Overall | 10 Years | 5 Years | 3 Years | 1 Year |
| Morningstar Rating™ | * * | * * | * * * * | * | n/a |
| % Rank in category | n/a | 68 | 26 | 98 | 93 |
| Absolute Rank/Funds in category | n/a | 184/271 | 78/305 | 312/318 | 309/332 |
Performance data quoted in this report represents past performance, is before any taxes payable by shareowners, and is no guarantee of future performance. Current performance may be higher or lower than that stated herein. Performance current to the most recent month-end is available by calling toll-free (800) SATURNA or visiting www.idahotaxexemptfund.com. The investment return and principal value of an investment will fluctuate so that an investor's shares, when redeemed, may be worth more or less than their original cost. Total returns are historical and include change in share value and reinvestment of dividends and capital gains, if any, and do not include the potential deduction of 2% redemption fee on shares held less than 90 calendar days.
¹ By regulation, the expense ratio shown in this table is as of the Fund's most recent prospectus which is dated March 25, 2011, and incorporates results for the fiscal year ended November 30, 2010. The ratio presented in this table differs from expense ratios shown elsewhere in this report as they represent different fiscal periods.
² Source: Morningstar December 31, 2011. Morningstar, Inc. is an independent fund performance monitor. For each fund with at least a three-year history, Morningstar calculates a Morningstar Rating™ based on a Morningstar Risk-Adjusted Return measure that accounts for variation in a fund's monthly performance (including the effects of sales charges, loads, and redemption fees), placing more emphasis on downward variations and rewarding consistent performance. The top 10% in each category receive 5 stars, the next 22.5% 4 stars, the next 35% 3 stars, the next 22.5% 2 stars and the bottom 10% receive 1 star. The Overall Morningstar Rating for a fund is derived from a weighted average of performance figures associated with its 3, 5 and 10 year (if applicable) Morningstar Rating metrics.
% Rank in Category: This is the fund's total-return percentile rank for the specified time period relative to all funds that have the same Morningstar category. The highest (or most favorable) percentile rank is 1 and the lowest (or least favorable) percentile rank is 100. The top-performing fund in a category will always receive a rank of 1. Percentile ranks within categories are most useful in those categories that have a large number of funds.
Please consider an investment's objectives, risks, charges and expenses carefully before investing. To obtain the Fund's prospectus or summary prospectus which contains this and other important information please visit www.idahotaxexemptfund.com or call toll free 1-800/SATURNA. Please read the prospectus or summary prospectus carefully before investing.
2 | November 30, 2011 Annual Report
Fellow Shareowners:
For the six months ended November 30, 2011, Idaho Tax-Exempt Fund returned 2.79%. For the twelve months ended November 30, the Fund returned 4.91%. Over the one year period, the Fund's outstanding shares increased 4.32% to 2.92 million, while net assets rose 5.8% to $16.1 million. Fund NAV ended the year at $5.51, $0.06 below its high for the year.
Idaho's 2011 credit upgrade to AA+ by Standard and Poors' demonstrates how the state has managed to improve its creditworthiness despite the most difficult economic environment since the Depression.
The 2010 U.S. Census shows Idaho's population grew 21% in the last decade, the fourth highest in the nation. As the economy recovers, Idaho's economic prospects are improving as well. According to 2011 ALEC-Laffer State Economic Competitiveness Index, Idaho's Economic Outlook Rank is fifth best in the nation. However, even as Idaho's unemployment fell from 9.7% in March to 8.5% in November, total nonfarm employment was still flat for the year.
Looking ahead, Idaho faces more local and federal funding challenges. Pension liabilities and uncertain health care mandates cloud the outlook further. On balance, we expect Idaho's credit rating outlook to remain stable, and state economic growth to at least equal national economic growth. We forecast positive growth for the U.S. even if other regions such as Europe and Japan stagnate or contract.
Despite continuing anxiety over state budget deficits, economic growth, unemployment, and real estate prices, investors still choose tax-exempt bond funds with less volatile prices and investment grade credit ratings to weather today's "risk off" marketplace. Only a handful of states, including Idaho, can offer the additional comfort of a 2011 credit rating upgrade.
For those seeking a conservative investment vehicle, the Idaho Tax-Exempt Fund offers a diversified portfolio of high-grade, 100% Idaho issues that provide income exempt from federal income and alternative minimum taxes as well as Idaho state income tax.
We invite you to review the advantages of the Idaho Tax- Exempt Fund, and we welcome your suggestions. For more information, please read our white paper entitled Idaho Municipal Bonds: The Gem State Shines at idahotaxexemptfund.com. Only with your help can we be certain that we are meeting our primary objective — fulfilling your investment needs.
Respectfully,
(graphic omitted)
(graphic omitted)
Nicholas Kaiser,
President
(graphic omitted)
Phelps McIlvaine,
Vice President, Portfolio Manager
Annual Report November 30, 2011 | 3
Bond Spotlight: Your Investment At Work
When you invest in Idaho Tax-Exempt Fund, you entrust us with growing your investment and providing value to you. Idaho bonds have continued to confirm their role as one of the finest reservoirs of value.
Bad news makes good headlines, or so it seems. The onslaught of alarmist media reports about the potential for widespread municipal defaults has subsided, but some investors harbor a lingering impression of municipal bonds that tends to overstate their risk. High profile defaults, such as Jefferson County in Alabama, seem to bolster the impression. As with any investment, the details are key. In reality, very few states and municipalities are on the verge of default. Some, like Idaho, are actually doing relatively well, and offer proof that while the near-term U.S. economic outlook may not generate a lot of positive news, municipal markets continue to offer attractive investment opportunities.
With your investment in the Idaho Tax-Exempt Fund, you help state and local governments finance capital projects which, in turn, stimulates the economy and creates jobs. The income generated by the municipal bonds in which the Fund invests are free from Idaho state and U.S. federal income tax, which can also benefit you.
Below are details of just a few of the bond issues held by the Idaho Tax-Exempt Fund.
Bruneau-Grand View School District — Rimrock Junior Senior High School
Owyhee & Elmore Cos. ID JSD #365 (4.00% due 08/15/2027)
Rimrock Junior Senior High School underwent extensive renovations to its aging building in 2008, with upgrades to electrical, roofing, and HVAC systems. The renovations included a "safe student area" addition with benches, phones, and shelter from the elements.
(graphics omitted)
4 | November 30, 2011 Annual Report
Kuna School District — Silver Trail Elementary
Ada & Canyon Cos. ID JSD #3 Kuna (5.00% due 09/15/2019)
Silver Trail Elementary is a brand new school that opened in the fall of 2011. Named after the wagon route miners used to haul ore from Silver City to Boise, Silver Trail Elementary is the seventh elementary school in the Kuna School District. It serves more than 470 of the district's approximately 5,500 students.
(graphics omitted)
Annual Report November 30, 2011 | 5
Performance Summary (unaudited)
| Average Annual Returns (as of November 30, 2011) | ||||
| 10 Years | 5 Years | 1 Year | Expense Ratio¹ | |
| Idaho Tax-Exempt Fund | 4.07% | 4.12% | 4.91% | 0.74% |
| S&P Idaho Municipal Bond Index | 5.47% | 4.74% | 7.28% | N/A |
Growth of $10,000
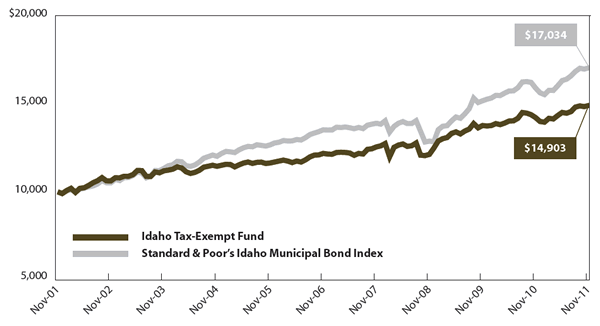 | Comparison of any mutual fund to a market index must be made bearing in mind that the Index is unmanaged, and expense-free. Conversely, the fund will (1) be actively managed; (2) have an objective other than mirroring the index, such as limiting risk; (3) bear transaction and other costs; (4) stand ready to buy and sell its securities to shareowners on a daily basis; and (5) provide a wide range of services. The graph compares $10,000 invested in the Fund on November 30, 2001, to an identical amount invested in the Standard & Poor's Idaho Municipal Bond Index, a broad-based index of Idaho municipal bond prices. The graph shows that an investment in the Fund would have risen to $14,903 versus $17,034 in the S&P Idaho Municipal Bond Index. |
| Past performance does not guarantee future results. The "Growth of $10,000" graph and "Average Annual Returns" performance table assume the reinvestment of dividends and capital gains. They do not reflect the deduction of taxes that a shareowner might pay on fund distributions or the redemption of fund shares, nor do they reflect the potential deduction of a 2% redemption fee on shares held less than 90 calendar days. ¹ By regulation, the expense ratio for the Fund shown in this table is as of the Fund's most recent prospectus which is dated March 25, 2011, and incorporates results for the fiscal year ending November 30, 2011. The ratio presented in this table differs from expense ratios shown elsewhere in this report as they represent different fiscal periods. | |
Fund Objective
Idaho Tax-Exempt Fund seeks to provide income free from federal income, federal alternative minimum and Idaho state income taxes. Preservation of capital is a secondary objective.
| Portfolio Diversification | Top Ten Holdings | ||
| % of Fund Assets | |||
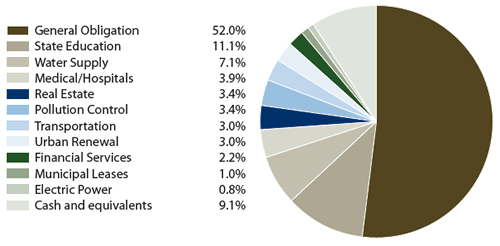 Industry weightings are shown as a percentage of total net assets. | Ada & Canyon Cos. ID JSD #3 Kuna 5.00% due 09/15/2019 | 3.5% | |
| Madison Co. ID SCD #321 Rexburg 4.50% due 08/15/2024 | 2.7% | ||
| Boise State University Revenues 5.00% due 04/01/2034 | 2.5% | ||
| Payette Co. ID SCD #373 5.00% due 09/15/2024 | 2.4% | ||
| Owyhee & Elmore Cos. ID JSD #365 4.00% due 08/15/2027 | 2.4% | ||
| Pocatello ID Water Revenue 4.75% due 02/01/2026 | 2.3% | ||
| Canyon Co. ID SCD #139 Vallivue 4.35% due 09/15/2025 | 2.3% | ||
| Canyon Co. ID SCD #131 Nampa 4.75% due 08/15/2019 | 2.2% | ||
| Valley & Adams Cos. ID JSD #421 4.50% due 08/01/2024 | 1.9% | ||
| Clark Co. ID SCD #161 Dubois 2.50% due 08/01/2016 | 1.8% | ||
6 | November 30, 2011 Annual Report
Discussion of Fund Performance (unaudited)
For the six months ended November 30, 2011, Idaho Tax- Exempt Fund returned 2.79%. For the twelve months ended November 30, 2011, Fund returned 4.91%. The Fund's operating expense ratio declined to 0.61% from 0.73% the previous year. For the year, the Fund's net assets rose 5.8% to $16.1 million, a record high. In a volatile year, the Fund's NAV moved in a six percent range from $5.57 to $5.24.
Factors Affecting Past Performance
A 30% drop in tax-free bond supply supported prices in 2011. Chronic volatility, default anxiety, and near zero interest rates created an appetite for high quality, income-producing assets. Municipal bonds outperformed many other assets in the second half of the year when economic growth slowed and cyclical asset prices faltered.
Heavy constraints on Idaho general fund spending will continue for the foreseeable future. With American Recovery and Reinvestment Act ("ARRA") funds exhausted, Idaho can expect further reductions in federal funding in 2013, and beyond. Pension and federally mandated health care liabilities may also limit expenditures on other state funded activities.
Idaho’s state tax revenues rose 4.2% in 2011, but total state spending still remains $300 million below 2009. Idaho gross state product, total employment, and personal income have all started to rise. Notably, Idaho is a business friendly state with few impediments to future growth. This is reflected in the 2011 American Legislative Exchange Council “State Economic Outlook Ranking” which ranks Idaho fifth best in the nation.
Looking Forward
The U.S. economy will grow modestly. We expect employment, personal income, and tax revenues to show slight improvement. Public sector retrenchment and soft housing prices will dampen growth. We expect Idaho’s growth to at least equal national growth. Congressional gridlock will continue to cloud decision-making and delay growth.
The Fund has produced positive annual returns sixteen of the last nineteen years. Over that time period, U.S. interest rates have been falling steadily, driving bond prices higher. A portion of the Fund’s positive annual total returns is the direct result of this rate decline.
As the private sector and individuals continue to pay down debt, the U.S. government has increased borrowing and spending in an effort to avoid another recession. This fiscal stimulus has limits. The U.S. Federal Reserve Bank will continue its monetary stimulus in the form of a near zero federal funds rate, quantitative easing, and “Operation Twist” for another year. The policies are intended to promote growth through low borrowing costs and sufficient liquidity. These monetary policies also have limits and inflationary risks. Eventually, these policies will be reversed. Inflation and bond yields may normalize (rise), pushing the Fund’s net asset value lower. However, we do not expect a cyclical “V-shaped” turning point for interest rates to happen next year. Should the economy weaken, rates may even decline further.
| Bond Quality Diversification |
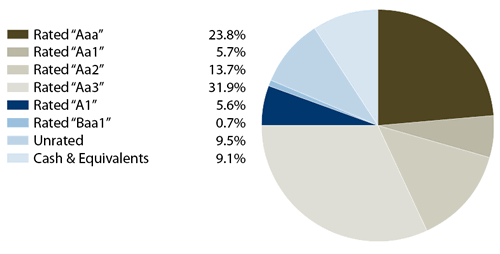 Based on total net assets as of November 30, 2011. Source: Moody's Investors Services. |
Annual Report November 30, 2011 | 7
| Schedule of Investments | ||||
| Municipal Bonds — 90.9% | ||||
| Issuer | Coupon/Maturity | Face Amount | Market Value | Percentage |
| Electric Power | ||||
| Idaho Falls ID Electric Revenue | 6.75% due 04/01/2019 | $120,000 | $132,582 | 0.8% |
| Financial Services | ||||
| Boise City General Fund Revenue, Series A | 5.20% due 12/01/2017 | 160,000 | 160,000 | 1.0% |
| Boise City General Fund Revenue, Series A | 5.25% due 12/01/2018 | 100,000 | 100,000 | 0.6% |
| Idaho Bond Bank Authority¹ | 4.00% due 09/15/2019 | 90,000 | 100,523 | 0.6% |
| 350,000 | 360,523 | 2.2% | ||
| General Obligation | ||||
| Ada & Canyon Cos. ID JSD #2 Meridian | 5.00% due 08/15/2020 | 165,000 | 183,661 | 1.1% |
| Ada & Canyon Cos. ID JSD #2 Meridian | 5.00% due 08/15/2021 | 155,000 | 171,885 | 1.1% |
| Ada & Canyon Cos. ID JSD #2 Meridian¹ | 5.50% due 07/30/2015 | 50,000 | 57,589 | 0.4% |
| Ada & Canyon Cos. ID JSD #3 Kuna | 5.00% due 09/15/2019 | 500,000 | 561,375 | 3.5% |
| Adams & Washington Cos. ID JSD #432 | 4.00% due 08/15/2019 | 100,000 | 108,612 | 0.7% |
| Bingham Co. ID SCD #52 Snake HS | 4.00% due 09/01/2020 | 250,000 | 279,362 | 1.7% |
| Bingham Co. ID SCD #52 Snake HS | 4.00% due 09/01/2027 | 200,000 | 209,622 | 1.3% |
| Bingham Co. ID SCD #55 Blackfoot | 4.65% due 08/01/2017 | 285,000 | 293,208 | 1.8% |
| Blaine County ID Series A | 4.05% due 08/01/2023 | 150,000 | 160,957 | 1.0% |
| Bonneville & Bingham Cos. ID JSD #93 | 4.50% due 09/15/2016 | 150,000 | 167,284 | 1.0% |
| Boundary County ID SCD #101 | 4.00% due 08/15/2021 | 240,000 | 260,184 | 1.6% |
| Canyon Co. ID SCD #131 Nampa | 4.75% due 08/15/2019 | 325,000 | 348,790 | 2.2% |
| Canyon Co. ID SCD #131 Nampa | 5.00% due 08/15/2023 | 105,000 | 112,668 | 0.7% |
| Canyon Co. ID SCD #134 Middleton | 4.65% due 07/31/2016 | 170,000 | 181,880 | 1.1% |
| Canyon Co. ID SCD #139 Vallivue | 4.35% due 09/15/2025 | 350,000 | 364,063 | 2.3% |
| Clark Co. ID SCD #161 Dubois | 2.50% due 08/01/2016 | 280,000 | 294,350 | 1.8% |
| Fremont & Madison Cos. ID JSD #215 | 4.125% due 09/01/2024 | 130,000 | 140,036 | 0.9% |
| Fremont & Madison Cos. ID JSD #215 | 4.00% due 08/15/2019 | 200,000 | 224,554 | 1.4% |
| Jefferson & Madison Cos. ID JSD #251 Rigby | 4.25% due 09/01/2024 | 100,000 | 108,482 | 0.7% |
| Jerome, Lincoln & Gooding Cos. ID JSD #261 | 3.75% due 09/15/2018 | 125,000 | 136,338 | 0.8% |
| Jerome, Lincoln & Gooding Cos. ID JSD #261 | 5.00% due 09/15/2022 | 250,000 | 277,665 | 1.7% |
| Kootenai-Shoshone ID Area Libraries | 4.25% due 08/01/2021 | 220,000 | 233,286 | 1.4% |
| Latah, Nez Perce & Clearwater Cos. ID JSD #283 | 4.50% due 08/15/2027 | 190,000 | 205,962 | 1.3% |
| Lemhi County ID | 4.20% due 08/01/2015 | 100,000 | 102,510 | 0.6% |
| Madison Co. ID SCD #321 Rexburg | 4.50% due 08/15/2024 | 410,000 | 430,894 | 2.7% |
| Madison Co. ID SCD #321 Rexburg | 4.50% due 08/15/2026 | 250,000 | 259,720 | 1.6% |
| Meridian ID Free Library District | 5.00% due 08/01/2015 | 100,000 | 100,697 | 0.6% |
| Minidoka & Jerome Cos. ID JSD #331 | 4.375% due 08/15/2024 | 225,000 | 234,236 | 1.5% |
| Minidoka & Jerome Cos. ID JSD #331 | 4.50% due 08/15/2025 | 160,000 | 166,232 | 1.0% |
| Minidoka & Jerome Cos. ID JSD #331¹ | 4.50% due 08/15/2018 | 75,000 | 81,415 | 0.5% |
| Minidoka & Jerome Cos. ID JSD #331¹ | 4.50% due 08/15/2020 | 75,000 | 79,735 | 0.5% |
| Nampa ID Series B | 5.00% due 08/1/2020 | 200,000 | 214,892 | 1.3% |
| Owyhee & Canyon Cos. ID JSD #370 | 4.55% due 08/15/2016 | 160,000 | 183,525 | 1.1% |
| Owyhee & Elmore Cos. ID JSD #365 | 4.00% due 08/15/2027 | 350,000 | 379,316 | 2.4% |
| Payette Co. ID SCD #373 | 5.00% due 09/15/2024 | 350,000 | 379,789 | 2.4% |
| Twin Falls & Gooding Cos. ID JSD #412 | 4.125% due 09/01/2023 | 100,000 | 112,951 | 0.7% |
| Twin Falls Co. ID SCD #411 | 4.30% due 09/15/2025 | 120,000 | 126,563 | 0.8% |
| Valley & Adams Cos. ID JSD #421 | 4.50% due 08/01/2024 | 290,000 | 305,277 | 1.9% |
| Valley & Adams Cos. ID JSD #421 | 4.50% due 08/01/2022 | 135,000 | 143,853 | 0.9% |
| 7,790,000 | 8,383,418 | 52.0% | ||
| Medical/Hospitals | ||||
| Idaho Health Facility Authority Holy Cross Revenue | 5.25% due 12/01/2014 | 110,000 | 110,344 | 0.7% |
| Idaho Health Facility Authority Holy Cross Revenue | 5.00% due 12/01/2022 | 115,000 | 115,338 | 0.7% |
| Continued on next page. | ||||
The accompanying notes are an integral part of these financial statements.
8 | November 30, 2011 Annual Report
| Schedule of Investments | ||||
| Municipal Bonds — 90.9% | ||||
| Issuer | Coupon/Maturity | Face Amount | Market Value | Percentage |
| Medical/Hospitals (continued) | ||||
| Idaho Health Facility Authority Holy Cross Revenue¹ | 5.00% due 12/01/2028 | $50,000 | $ 49,841 | 0.3% |
| Idaho Health Facility Authority Revenue | 6.00% due 12/01/2023 | 200,000 | 230,626 | 1.4% |
| Idaho Health Facility Authority Revenue | 6.25% due 12/01/2033 | 115,000 | 129,002 | 0.8% |
| 590,000 | 635,151 | 3.9% | ||
| Municipal Leases | ||||
| Nez Perce County ID COPS | 4.50% due 02/01/2021 | 150,000 | 155,366 | 1.0% |
| Pollution Control | ||||
| Caldwell ID Sewer Revenue | 4.50% due 09/01/2019 | 100,000 | 115,122 | 0.7% |
| Idaho Bond Bank Authority | 4.30% due 09/01/2022 | 135,000 | 140,661 | 0.9% |
| Idaho Bond Bank Authority¹ | 4.125% due 09/15/2023 | 75,000 | 79,743 | 0.5% |
| Moscow ID Sewer Revenue | 4.45% due 05/01/2028 | 200,000 | 210,226 | 1.3% |
| 510,000 | 545,752 | 3.4% | ||
| Real Estate | ||||
| Idaho Housing & Finance Association | 4.80% due 06/01/2017 | 100,000 | 102,222 | 0.7% |
| Idaho Housing & Finance Association¹ | 5.00% due 07/15/2027 | 50,000 | 53,131 | 0.3% |
| Idaho Housing & Finance Association¹ | 5.65% due 07/02/2028 | 50,000 | 51,416 | 0.3% |
| Idaho State Building Authority Revenue | 4.50% due 09/01/2023 | 110,000 | 112,808 | 0.7% |
| Post Falls ID LID SPA | 5.00% due 05/01/2021 | 240,000 | 229,908 | 1.4% |
| 550,000 | 549,485 | 3.4% | ||
| State Education | ||||
| Boise State University Revenues | 4.50% due 04/01/2027 | 250,000 | 261,662 | 1.6% |
| Boise State University Revenues | 5.00% due 04/01/2034 | 385,000 | 406,206 | 2.5% |
| Idaho State University Revenues | 4.90% due 04/01/2017 | 150,000 | 151,925 | 1.0% |
| Idaho State University Revenues | 4.625% due 04/01/2024 | 220,000 | 228,387 | 1.4% |
| University of Idaho Revenues | 5.00 % due 04/02/2028 | 225,000 | 241,772 | 1.5% |
| University of Idaho Revenues | 5.00% due 04/01/2019 | 200,000 | 215,838 | 1.4% |
| University of Idaho Revenues | 5.00% due 04/01/2020 | 260,000 | 278,273 | 1.7% |
| 1,690,000 | 1,784,063 | 11.1% | ||
| Transportation | ||||
| Idaho Housing & Finance Association | 4.60% due 07/15/2023 | 250,000 | 267,163 | 1.7% |
| Idaho Housing & Finance Association | 5.00% due 07/15/2024 | 200,000 | 213,544 | 1.3% |
| 450,000 | 480,707 | 3.0% | ||
| Urban Renewal | ||||
| Boise City ID Urban Renewal Agency Lease Revenue | 5.00% due 08/15/2020 | 160,000 | 178,704 | 1.1% |
| Boise City ID Urban Renewal Agency Lease Revenue¹ | 5.00% due 08/15/2021 | 90,000 | 99,749 | 0.6% |
| Jerome ID Urban Renewal District | 5.40% due 09/01/2013 | 200,000 | 201,588 | 1.3% |
| 450,000 | 480,041 | 3.0% | ||
| Water Supply | ||||
| Blackfoot ID COPS | 5.80% due 09/01/2018 | 135,000 | 135,345 | 0.8% |
| Chubbuck ID Water Revenue | 4.00% due 09/01/2025 | 155,000 | 163,307 | 1.0% |
| Idaho Bond Bank Authority | 4.00% due 09/15/2024 | 100,000 | 104,994 | 0.7% |
| Idaho Bond Bank Authority | 5.00% due 09/15/2026 | 250,000 | 268,402 | 1.7% |
| Pocatello ID Water Revenue | 4.50% due 02/01/2024 | 100,000 | 104,532 | 0.6% |
| Pocatello ID Water Revenue | 4.75% due 02/01/2026 | 350,000 | 368,669 | 2.3% |
| 1,090,000 | 1,145,249 | 7.1% | ||
| Total investments | (Cost=$13,994,199) | $13,740,00 | 14,652,337 | 90.9% |
| Other assets (net of liabilities) | 1,465,085 | 9.1% | ||
| Total net assets | $16,117,422 | 100.0% | ||
| ¹ Indicates an odd lot. Please refer to page 13 for more information regarding odd lots. | ||||
The accompanying notes are an integral part of these financial statements.
Annual Report November 30, 2011 | 9
| Statement of Assets and Liabilities | ||
| As of November 30, 2011 | ||
| Assets | ||
| Investments in securities, at value (Cost $13,994,199) | $14,652,337 | |
| Cash | 1,327,772 | |
| Interest receivable | 182,157 | |
| Insurance reserve premium | 801 | |
| Total assets | 16,163,067 | |
| Liabilities | ||
| Accrued expenses | 14,572 | |
| Payable for Fund shares redeemed | 13,522 | |
| Distributions payable | 10,585 | |
| Payable to affiliates | 6,966 | |
| Total liabilities | 45,645 | |
| Net assets | $16,117,422 | |
| Analysis of net assets | ||
| Paid-in capital (unlimited shares authorized, without par value) | $15,455,442 | |
| Unrealized net appreciation on investments | 658,138 | |
| Undistributed tax-free income | 3,842 | |
| Net assets applicable to Fund shares outstanding | $16,117,422 | |
| Fund shares outstanding | 2,926,804 | |
| Net asset value, offering and redemption price per share | $5.51 | |
| Statement of Operations | ||
| Year ended November 30, 2011 | ||
| Investment income | ||
| Interest income | $586,799 | |
| Gross investment income | 586,799 | |
| Expenses | ||
| Investment adviser fees | 75,621 | |
| Audit fees | 4,607 | |
| Trustee fees | 4,204 | |
| Printing and postage | 3,052 | |
| Chief Compliance Officer expenses | 2,106 | |
| Filing and registration fees | 1,666 | |
| Shareholder servicing | 823 | |
| Legal fees | 519 | |
| Custodian fees | 713 | |
| Retirement plan custodial fees | 127 | |
| Total gross expenses | 93,438 | |
| Less custodian fee credits | (713) | |
| Net expenses | 92,725 | |
| Net investment income | $494,074 | |
| Net realized gain from investments | $11,379 | |
| Net increase in unrealized appreciation on investments | 199,602 | |
| Net gain on investments | $210,981 | |
| Net increase in net assets resulting from operations | $705,055 | |
The accompanying notes are an integral part of these financial statements.
10 | November 30, 2011 Annual Report
| Statements of Changes of Net Assets | Year ended Nov. 30, 2011 | Year ended Nov. 30, 2010 |
| Increase (decrease) in net assets from operations: | ||
| From operations | ||
| Net investment income | $494,074 | $485,264 |
| Net realized gain on investments | 11,379 | - |
| Net increase (decrease) in unrealized appreciation | 199,602 | (10,068) |
| Net increase in net assets | 705,055 | 475,196 |
| Distributions to shareholders from | ||
| Net investment income | (494,074) | (481,474) |
| Capital gains distributions | (11,396) | (2,357) |
| Total distributions | (505,470) | (483,831) |
| Capital share transactions | ||
| Proceeds from sales of shares | 2,156,201 | 1,740,420 |
| Value of shares issued in reinvestment of dividends | 396,674 | 375,933 |
| Early redemption fees retained | - | 106 |
| Cost of shares redeemed | (1,864,860) | (1,487,732) |
| Net increase in net assets | 688,015 | 628,727 |
| Total increase in net assets | 887,600 | 620,092 |
| Net assets | ||
| Beginning of year | 15,229,822 | 14,609,730 |
| End of year | 16,117,422 | 15,229,822 |
| Undistributed tax-free income | $3,842 | $3,842 |
| Shares of the Fund sold and redeemed | ||
| Number of shares sold | 399,005 | 319,277 |
| Number of shares issued in reinvestment of dividends | 73,111 | 68,783 |
| Number of shares redeemed | (350,738) | (271,856) |
| Net increase in number of shares outstanding | 121,378 | 116,204 |
| Financial Highlights | For Year Ended November 30, | ||||
| Selected data per share of outstanding capital stock throughout each year: | 2011 | 2010 | 2009 | 2008 | 2007 |
| Net asset value at beginning of year | $5.43 | $5.43 | $4.94 | $5.30 | $5.32 |
| Income from investment operations | |||||
| Net investment income | 0.18 | 0.17 | 0.17 | 0.18 | 0.18 |
| Net gain (loss) on securities (both realized & unrealized) | 0.08 | - | 0.49 | (0.36) | (0.02) |
| Total from investment operations | 0.26 | 0.17 | 0.66 | (0.18) | 0.16 |
| Less distributions | |||||
| Dividends (from net investment income) | (0.18) | (0.17) | (0.17) | (0.18) | (0.18) |
| Distributions (from capital gains) | 0.00¹ | 0.00¹ | - | - | - |
| Total distributions | (0.18) | (0.17) | (0.17) | (0.18) | (0.18) |
| Paid-in capital from early redemption fees | 0.00¹ | 0.00¹ | 0.00¹ | 0.00¹ | 0.00¹ |
| Net asset value at end of year | $5.51 | $5.43 | $5.43 | $4.94 | $5.30 |
| Total return | 4.91% | 3.26% | 13.46% | (3.36)% | 3.02% |
| Ratios / supplemental data | |||||
| Net assets ($000), end of year | $16,117 | $15,230 | $14,610 | $11,774 | $10,016 |
| Ratio of expenses to average net assets | |||||
| Before custodian credits | 0.62% | 0.74% | 0.85% | 0.77% | 0.89% |
| After custodian credits | 0.61% | 0.73% | 0.84% | 0.76% | 0.87% |
| Ratio of net investment income after custodian credits to average net assets | 3.27% | 3.23% | 3.19% | 3.51% | 3.35% |
| Portfolio turnover rate | 4% | 2% | 3% | 7% | 6% |
| ¹ Amount is less than $0.01 | |||||
The accompanying notes are an integral part of these financial statements.
Annual Report November 30, 2011 | 11
Notes To Financial Statements
Note 1 — Organization
Saturna Investment Trust (the "Trust") was established under Washington State Law as a business trust on February 20, 1987. The Trust is registered as a no-load, open-end series investment company under the Investment Company Act of 1940, as amended. Five portfolios have been created to date in addition to Idaho Tax-Exempt Fund (the "Fund"). The other five portfolios are distributed through a separate prospectus and the results of those funds are contained in a separate report.
The Idaho Tax-Exempt Fund was first authorized to sell shares of beneficial interest on September 4, 1987. The investment objective of the Fund is to provide income free from federal income, federal alternative minimum and Idaho state income taxes. Preservation of capital is a secondary objective.
Note 2 — Significant Accounting Policies
The following is a summary of the significant accounting policies, in conformity with accounting principles generally accepted in the United States of America, which are consistently followed by the Fund in the preparation of its financial statements.
Security valuation:
Debt securities are valued using bid-side valuations provided by an independent service. The service determines valuations using a matrix. This technique considers such factors as yields or prices of bonds of comparable quality, type of issue, coupon maturity, ratings, trading activity, and general market conditions. In the absence of a valuation from an independent service for a security, a fair value for such security is determined in good faith by or under the direction of the Board of Trustees.
Share valuation:
The net asset value ("NAV") per share of the Fund is calculated by dividing the sum of the value of the securities held by the Fund, plus cash or other assets, minus all liabilities (including estimated accrued expenses) by the total number of shares outstanding for the Fund, rounded to the nearest cent. The Fund's shares are not priced or traded on days the New York Stock Exchange is closed. The NAV is the offering and redemption price per share.
The Trustees have adopted certain policies and procedures with respect to frequent trading of Fund shares. The Fund is intended for long-term investment and does not permit rapid trading of its shares. To discourage speculation, shares held less than 90 calendar days, including those held in omnibus accounts at intermediaries, will be assessed a 2% early-redemption fee (payable to the Fund when redeemed). These fees are deducted from the redemption proceeds otherwise payable to the shareowner and retained by the Fund as paid-in capital and included in the daily NAV. The Fund cannot always identify all intermediaries, or detect or prevent trading that violates the Frequent Trading Policy through intermediaries or omnibus accounts.
Fair value measurements:
The Fund has adopted authoritative fair valuation accounting standards which establish an authoritative definition of fair value and set out a hierarchy for measuring fair value. These standards require additional disclosures about the various inputs and valuation techniques used to develop the measurements of fair value and a discussion of changes in valuation techniques and related inputs during the period. These inputs are summarized in the three broad levels listed below.
Level 1 — Unadjusted quoted prices in active markets for identical assets or liabilities that the Trust has the ability to access.
Level 2 — Observable inputs other than quoted prices in Level 1 that are observable for the asset or liability, either directly or indirectly. These inputs may include quoted prices for the identical instrument on an inactive market, prices for similar instruments, interest rates, prepayment speeds, credit risk, yield curves, default rates, and similar data.
Level 3 — Unobservable inputs for the asset or liability, to the extent relevant observable inputs are not available, representing the Trust's own assumptions about the assumptions a market participant would use in valuing the asset or liability, and would be based on the best information available.
The availability of observable inputs can vary from security to security and is affected by a wide variety of factors, including, for example, the type of security, whether the security is new and not yet established in the market place, the liquidity of markets, and other characteristics particular to the security. To the extent that valuation is based on models or inputs that are less observable or unobservable in the market, the determination of fair value requires more judgement. Accordingly, the degree of judgement exercised in determining fair value is greatest for instruments categorized in Level 3.
The inputs used to measure fair value may fall into different levels of the fair value hierarchy. In such cases, for disclosure purposes, the level in the fair value hierarchy within which the fair value measurement falls in its entirety, is determined based on the lowest level input that is significant to the fair value measurement in its entirety.
The inputs or methodology used for valuing securities are not necessarily an indication of the risk associated with investing in those securities.
The table below is a summary of the inputs used as of November 30, 2011, in valuing the Fund's investments carried at value.
| Fair Value Inputs | Total | Level 1 Quoted Price | Level 2 Significant Observable Input | Level 3 Significant Unobservable Input |
| Municipal Bonds | $14,652,337 | $- | $13,999,195 | $653,142 |
| Total Assets | $14,652,337 | $- | $13,999,195 | $653,142 |
12 | November 30, 2011 Annual Report
Notes To Financial Statements (continued)
| Level 3 Roll-Forward Municipal Securities | |
| Beginning balance | $683,176 |
| Total unrealized gains or losses | 9,966 |
| Purchases | - |
| Maturity/call | (40,000) |
| Transfers into (out of) Level 3 | - |
| Ending balance | $653,142 |
New accounting pronouncement:
In May 2011, FASB issued ASU No. 2011-04 "Amendments to Achieve Common Fair Value Measurement and Disclosure Requirements" in GAAP and the International Financial Reporting Standards ("IFRSs"). ASU No. 2011-04 amends FASB ASC Topic 820, Fair Value Measurements and Disclosures, to establish common requirements for measuring fair value and for disclosing information about fair value measurements in accordance with GAAP and IFRSs. ASU No. 2011-04 is effective for fiscal years beginning after December 15, 2011, and for interim periods within those fiscal years. Management is currently evaluating the impact these amendments may have on the Fund's financial statements.
Odd Lots:
The bid-side valuations provided by the independent pricing service are for institutional "round-lot" holdings ("Round Lots"). Round Lots consist of 100 bonds (approximately $100,000 each). Some of the Fund's holdings consist of less than a Round Lot and are considered "Odd Lots." Odd Lots trade at a discount to Round Lots to compensate for the effect of the fixed costs associated with any trade. To reflect this discount, the Fund applies a discount to the valuation of Odd Lot holdings as shown in the following chart.
| Total Face Value | Adjustment to Price |
| Under 10,000 | -0.750% |
| 10,000-24,999 | -0.625% |
| 25,000-49,999 | -0.500% |
| 50,000-74,999 | -0.375% |
| 75,000-99,999 | -0.250% |
| 100,000 and up | none |
Income taxes:
As a qualified investment company under Subchapter M of the Internal Revenue Code, the Fund is not subject to income taxes to the extent that it distributes all of its investment income. It is the Fund's policy to meet the requirements of the Internal Revenue Code applicable to regulated investment companies and to distribute all its taxable and tax-exempt income to its shareowners. As the Fund intends to meet requirements for tax-free income dividends, and the requirements of the Idaho Department of Revenue for income dividends free of Idaho state income tax, no income tax provisions are required.
There is no tax liability resulting from unrecognized tax benefits relating to uncertain income tax positions taken or expected to be taken on the tax return for the fiscal year-end November 30, 2011, or for any other tax years which are open for exam. As of November 30, 2011, open tax years include the tax years ended November 30, 2008 through 2010. The Fund recognizes interest and penalties, if any, related to unrecognized tax benefits as income tax expense in the Statement of Operations. During the period, the Fund did not incur any interest or penalties.
Derivative instruments and hedging activities:
The Fund has adopted the financial reporting rules and regulations that require enhanced disclosure that enables investors to understand how and why an entity uses derivatives, how derivatives are accounted for, and how derivative instruments affect an entity's results of operations and financial position.
During the fiscal year ended November 30, 2011, the Fund did not hold any derivative instruments.
Distributions to shareowners:
The Fund's dividends to shareowners from net investment income are paid daily and distributed on the last business day of each month.
Distributions of capital gains, if any, are made at least annually, and as required to comply with federal excise tax requirements. Distributions to shareowners are determined in accordance with income tax regulations, and are recorded on the ex-dividend date. Dividends are paid in shares of the Funds, at the net asset value on payable date. Shareowners may elect to take dividends in cash.
Use of estimates:
The preparation of financial statements in conformity with accounting principles generally accepted in the United States of America requires management to make estimates and assumptions that affect the reported amounts of assets and liabilities and disclosure of contingent assets and liabilities at the date of the financial statements and the reported amounts of increases and decreases in net assets from operations during the reporting period. Actual results could differ from those estimates.
Reclassification of capital accounts:
Accounting principles generally accepted in the United States of America require that certain components of net assets relating to permanent differences be reclassified between financial and tax reporting. These reclassifications have no effect on net assets or net asset value per share:
| Accumulated gain (loss) | $17 |
| Paid-in capital | $(17) |
Other:
The ability of issuers of debt securities held by the Fund to meet their obligations may be affected by economic and political developments in the state of Idaho.
Interest income is recognized on an accrual basis. Discounts on securities purchased are accreted and premiums are amortized over the lives of the respective securities.
Annual Report November 30, 2011 | 13
Notes To Financial Statements (continued)
Security transactions are recorded on trade date. Realized gains and losses on sales of securities are recorded on the identified cost basis.
Note 3 — Transactions with Affiliated Persons
Under contracts approved annually by the Fund's independent trustees, Saturna Capital Corporation provides investment advisory services and certain other administrative and distribution services to conduct the Fund's business. For such services, the Fund pays an annual fee equal to 0.50% of its average daily net assets. For the fiscal year ended November 30, 2011, the Fund incurred advisory fee expenses of $75,621. Expenses incurred by the Trust on behalf of the Fund (e.g., legal fees) are allocated to the Fund and the other Funds of the Trust on the basis of relative daily average net assets.
Saturna Capital also acts as transfer agent for the Fund, for which it was paid $823 for the year ended November 30, 2011. Recently, Saturna Capital voluntarily elected to waive the transfer agent fee for an indefinite period, which may cease at Saturna Capital's election, to reduce the Fund's operating expenses.
Saturna Brokerage Services, Inc. ("SBS"), a discount brokerage and subsidiary of Saturna Capital, is registered as a broker-dealer and acts as distributor for the Fund.
Saturna Trust Company ("STC"), a subsidiary of Saturna Capital, acts as a retirement plan custodian for Fund shareowners. For the year ended November 30, 2011, the Fund incurred retirement plan custodial fees of $127.
Mr. Nicholas Kaiser serves as a trustee and president of the Trust. Also a director and the chairman of Saturna Capital, he is not compensated by the Trust. For the fiscal year ended November 30, 2011, the Trust incurred compensation expenses of $29,000 which is included in $47,279 of total expenses for the independent Trustees. Idaho Tax-Exempt Fund paid $4,204 of these total expenses.
The officers of the Trust are paid by Saturna Capital, not the Trust, except the Chief Compliance Officer, who is partially compensated by the Trust. For the fiscal year ended November 30, 2011, the Fund paid $2,106 in compensation for such services.
On November 30, 2011, the trustees, officers, and their immediate families as a group directly or indirectly owned 9.08% of the outstanding shares of the Fund.
Note 4 — Investments
During the fiscal year ended November 30, 2011, the Fund purchased $568,648 of securities and sold/matured $671,847 of securities.
Note 5 — Distributions to Shareowners
The tax characteristics of distributions paid during the fiscal years ended November 30, 2011, and 2010 were as follows:
| 2011 | 2010 | |
| Tax-exempt income | $493,850 | $480,495 |
| Taxable income | 224 | 679 |
| Capital gain¹ | $11,396 | $2,357 |
¹Long-Term Capital Gain dividend designated pursuant to Section 852(b)(3) of the Internal Revenue Code.
The cost basis of investments for federal income tax purposes at November 30, 2011 were as follows:
| Cost of investments | $13,994,199 |
| Gross tax unrealized appreciation | 673,232 |
| Gross tax unrealized depreciation | 15,094 |
| Net tax unrealized appreciation | $658,138 |
As of November 30, 2011, the components of distributable earnings on a tax bases were as follows:
| Net unrealized appreciation | $658,138 |
| Undistributed tax-free income | 3,842 |
| Total distributable earnings | 3,842 |
| Total accumulated earnings | $661,980 |
Note 6 — Custodian
Under the agreement in place with BNY Mellon, custody fees are reduced by credits for cash balances. Such reduction for the fiscal year ended November 30, 2011, amounted to $713.
Note 7 — Subsequent Events
In preparing these financial statements, the Fund has evaluated events and transactions for potential recognition or disclosure through the date the financial statements were issued. There were no events or transactions during the period that materially impacted the amounts or disclosures in the Fund's financial statements.
14 | November 30, 2011 Annual Report
Report of Independent Registered Public Accounting Firm
To the Shareholders and Board of Trustees
Saturna Investment Trust,
We have audited the accompanying statements of assets and liabilities of Idaho Tax-Exempt Fund, a series of the Saturna Investment Trust (the "Trust"), including the schedule of investments as of November 30, 2011, and the related statement of operations for the year then ended, and the statements of changes in net assets for each of the two years in the period then ended, and the financial highlights for each of the five years in the period then ended. These financial statements and financial highlights are the responsibility of the Trust's management. Our responsibility is to express an opinion on these financial statements and financial highlights based on our audits.
We conducted our audits in accordance with the standards of the Public Company Accounting Oversight Board (United States). Those standards require that we plan and perform the audits to obtain reasonable assurance about whether the financial statements and financial highlights are free of material misstatement. The Trust is not required to have, nor were we engaged to perform, an audit of its internal control over financial reporting. Our audits included consideration of internal control over financial reporting as a basis for designing audit procedures that are appropriate in the circumstances, but not for the purpose of expressing an opinion on the effectiveness of the Trust's internal control over financial reporting. Accordingly, we express no such opinion. An audit includes examining, on a test basis, evidence supporting the amounts and disclosures in the financial statements, assessing the accounting principles used and significant estimates made by management, as well as evaluating the overall financial statement presentation. Our procedures included confirmation of securities owned as of November 30, 2011, by correspondence with the custodian. We believe that our audits provide a reasonable basis for our opinion.
In our opinion the financial statements and financial highlights referred to above present fairly, in all material respects, the financial position of Idaho Tax-Exempt Fund as of November 30, 2011, the results of its operations for the year then ended, the changes in its net assets for each of the two years in the period then ended, and its financial highlights for each of the five years in the period then ended, in conformity with accounting principles generally accepted in the United States of America.
Philadelphia, Pennsylvania
January 13, 2011
Tait, Weller & Baker LLP
Annual Report November 30, 2011 | 15
Expenses (unaudited)
All mutual funds have operating expenses. As an Idaho Tax-Exempt Fund shareowner, you incur ongoing costs, including management fees and other fund expenses such as shareowner reports (like this one). Operating expenses, which are deducted from a fund's gross earnings, directly reduce the investment return of a fund. Mutual funds (unlike other financial investments) only report their results after deduction of operating expenses.
With the Idaho Tax-Exempt Fund, unlike many mutual funds, you do not incur sales charges (loads) on purchases, reinvested dividends, or other distributions. You do not incur redemption fees, exchange fees, or fees related to Saturna Individual Retirement Accounts. However, to discourage speculation, you may incur a 2% fee for redemption of shares held less than 90 calendar days. You may incur fees related to extra services requested by you for your account, such as a checkbook to use for redemptions or bank wires. The examples below are intended to help you understand your ongoing costs (in dollars) of investing in the Fund and to compare these costs with the ongoing costs of investing in other mutual funds.
Example
The following example is based on an investment of $1,000 invested at the beginning of the period and held for the entire period (June 1, 2011, to November 30, 2011).
Actual Expenses
The first line provides information about actual account values and actual expenses. You may use the information in this line, together with the amount you have invested, to estimate the expenses that you paid over the period. Simply divide your account value by $1,000 (for example, an $8,600 account value divided by $1,000 = 8.6), then multiply the result by the number in the first line under the heading entitled "Expenses Paid During Period" to estimate the expenses you paid on your account during this period. The Fund also charges the following fees for extra services rendered on request, which you may need to add to determine your total expenses: $10 per checkbook, $25 per domestic bank wire, $35 per international bank wire, or overnight courier delivery charges.
Hypothetical Example for Comparison Purposes
The second line provides information about hypothetical account values and hypothetical expenses based on the Fund's actual expense ratio (based on the last six months) and an assumed rate of return of 5% per year before expenses, which is not the Fund's actual return. The hypothetical account values and expenses may not be used to estimate the actual ending account balance or expenses you paid for the year. You may use this information to compare the ongoing costs of investing in the Fund and other mutual funds. To do so, compare this 5% hypothetical example with the 5% hypothetical examples that appear in the shareowner reports of other mutual funds. You may wish to add other fees that are not included in the expenses shown in the table, such as charges for extra services like check writing and bank wires.
Please note that the expenses shown are meant to highlight your ongoing costs only and do not reflect any transactional costs, such as sales charges (loads), redemption fees, or exchange fees (note that the Idaho Tax-Exempt Fund does not charge any such transactional costs, with the exception of a redemption fee on shares held less than 90 calendar days). Therefore, the second line is useful in comparing ongoing costs only, and may not help you determine the relative total costs of owning different funds.
| Beginning Account Value [June 1, 2011] | Ending Account Value [November 30, 2011] | Expenses Paid During Period¹ | |
| Actual | $1,000.00 | $1,027.90 | $3.05 |
| Hypothetical (5% return before expenses) | $1,000.00 | $1,022.06 | $3.04 |
¹ Expenses are equal to Idaho Tax-Exempt Bond Fund's annualized expense ratio of 0.60% (based on the most recent semi-annual period of June 1, 2011 through November 30, 2011, multiplied by the average account value over the period multiplied by 183/365 (to reflect the one-half year period).
16 | November 30, 2011 Annual Report
| Trustees and Officers (unaudited) | ||||
| Name (age), address | Position(s) held with Trust and length of time served | Principal occupation(s) during past 5 Years | Number of portfolios in Saturna Fund complex overseen by Trustee | Other directorships held by Trustee |
| Independent Trustees | ||||
| Gary A. Goldfogel, MD (53) 1500 N. State Street Bellingham, WA 98225 | Independent Trustee since 1995 | Medical Examiner (pathologist); Owner, Avocet Environmental Testing (laboratory) | Six | None |
| Herbert G. Grubel, PhD (77) Apt. 1202 — 125 West Second St. North Vancouver, BC Canada V7M 1C5 | Independent Trustee¹ since 2005 | Professor Emeritus of Economics, Simon Fraser University; Senior Fellow, Fraser Institute | Nine | Amana Mutual Funds Trust |
| John E. Love (79) 1002 Spokane Street Garfield, WA 99130 | Chairman, Independent Trustee since 1987 | Owner, J.E. Love Co. (agricultural equipment manufacturer) | Six | None |
| Ronald H. Fielding, MBA, CFA (62) 42 Surfsong Rd. Kiawah Island, SC 29455 | Independent Trustee since 2009 | Retired (2009); Senior Vice President & Portfolio Manager, Oppenheimer Funds Rochester Division | Six | ICI Mutual Insurance |
| Interested Trustee | ||||
| Nicholas F. Kaiser, MBA, CFA (65) 1300 N. State Street Bellingham, WA 98225 | President, Trustee¹ since 1990 | Chairman (retired president 2009), Saturna Capital Corporation | Nine | Amana Mutual Funds Trust |
| Officers who are not Trustees | ||||
| Phelps S. McIlvaine (58) 1300 N. State Street Bellingham, WA 98225 | Vice President since 1994 | Vice President, Saturna Capital Corporation; Treasurer, Saturna Brokerage Services | N/A | N/A |
| Christopher Fankhauser (40) 1300 N. State Street Bellingham, WA 98225 | Treasurer¹ since 2002 | Chief Operations Officer, Saturna Capital Corporation; Vice President and Chief Operations Officer, Saturna Brokerage Services | N/A | N/A |
| Ethel B. Bartolome (39) 1300 N. State Street Bellingham, WA 98225 | Secretary¹ since 2001 | Corporate Administrator, Saturna Capital Corporation | N/A | N/A |
| JoAnne Langhäuser (52) 1300 N. State Street Bellingham, WA 98225 | Chief Compliance Officer¹ since 2011 | Chief Compliance Officer, Saturna Capital Corporation and Funds; Senior Compliance Manager, Edge Asset Management, Inc.; Assistant Vice President, WM Advisors, Inc. | N/A | N/A |
Term of Office: each Trustee serves for the lifetime of the Trust or until he dies, resigns, is removed, or not re-elected by the shareowners. Each officer serves a one-year term subject to annual reappointment by the Trustees.
The Fund's Statement of Additional Information, available without charge upon request by calling Saturna Capital at 1-800/SATURNA and on the Fund's website, www.idahotaxexemptfund.com, includes additional information about the Trustees.
On November 30, 2011, the Trustees, officers and their related accounts as a group owned 9.08% of the outstanding shares of the Fund. Saturna Capital Corporation is the Trust's adviser and Saturna Brokerage Services, Inc. is the Trust's distributor. Mr. Kaiser is an interested person of the Trust by reason of his positions with the Trust's adviser and distributor, and with Amana Mutual Funds Trust. Mr. McIlvaine is the primary manager of the Idaho Tax-Exempt Fund and is the portfolio manager of the Sextant Bond Income Fund and Sextant Short-Term Bond Fund. He is an interested person of the Trust by reason of his positions with the Trust's adviser and distributor. Mr. Fankhauser, Mrs. Bartolome, and Ms. Langhäuser are also interested persons of the Trust by reason of their positions with Trust's adviser and distributor, and with Amana Mutual Funds Trust.
¹Holds same position with Amana Mutual Funds Trust.
Annual Report November 30, 2011 | 17
Renewal of Investment Advisory Contract
During their meeting of September 19, 2011, the Trustees of Saturna Investment Trust discussed the question of renewing the Investment Advisory and Administration Agreement between Idaho Tax-Exempt Fund ("Fund") and Saturna Capital Corporation ("Saturna"), and discussed the nature, extent, and quality of the services provided by Saturna. The Trustees took into consideration that the Fund offers a full range of high-quality investor services. The Trustees discussed Saturna's experience, ability, and commitment to quality service through performing internally such functions as shareowner servicing, administration, accounting, marketing, and distribution — in addition to investment management.
The Trustees took into consideration Saturna's continued avoidance of significant operational problems, plus its substantial investments in premises, personnel, training, and equipment to meet investor needs. They recognized Saturna's efforts to recruit and retain increasingly qualified, experienced, and specialized staff, and improve the capital base on which Saturna operates, which the Trustees believe is important to the long-term success of any mutual fund.
In addition to information provided throughout the year, the Trustees utilized a September 2011 comparison of performance and expenses of the Fund with those of 321 other municipal bond mutual funds in Morningstar's "Muni Single State Long" category and found the Fund's performance good. The Trustees found such information helpful in establishing expectations regarding the performance of the adviser and whether to continue the advisory contract.
The Trustees reviewed the fees and expenses of the Fund. The Trustees found the declining expense ratio acceptable and to be advantageous to shareowners given the size of the Fund, services provided, and expenses incurred.
The Trustees reviewed Saturna's financial information and discussed the issue of profitability related to management and administration of the Fund as part of their evaluation of whether the fees under the advisory contract bear a reasonable relationship to the mix of services provided by Saturna, including the nature, extent, and quality of such services. The Trustees noted Saturna's sharing of its revenues to pay marketing and distribution costs of the Fund.
The Trustees noted that, although the assets of the Fund have grown, the Fund remains small, and there has been no opportunity for Saturna to demonstrate economies of scale. In fact, Saturna continues to operate the Fund at significant cost to itself. The Trustees also considered whether there are other potential benefits to Saturna from acting as investment adviser and found none.
The Trustees considered the fees charged by Saturna to other kinds of accounts and the different services provided to those accounts, as well as the ways in which Saturna's service and work done for other accounts it manages, benefit the Fund.
The Trustees concluded that the fees paid by the Fund to Saturna were reasonable in light of the services provided, comparative performance, expense and advisory fee information, costs of services provided and profits to be realized and benefits derived or to be derived by Saturna from its relationship with the Fund. Following this discussion, the Trustees unanimously agreed to renew the Fund's advisory agreement with Saturna.
18 | November 30, 2011 Annual Report
Availability of Quarterly Portfolio Information
(1) The Fund files a complete schedule of portfolio holdings with the SEC for the first and third quarters of each fiscal year on Form N-Q.
(2) The Fund's Form N-Q is available on the SEC's website at www.sec.gov and at www.idahotaxexemptfund.com.
(3) The Fund's Form N-Q may be reviewed and copied at the SEC's Public Reference Room in Washington, DC. Information on the operation of the Public Reference Room may be obtained by calling 1-800/SEC-0330.
(4) The Fund makes a complete schedule of portfolio holdings after the end of each month available to investors at www.idahotaxexemptfund.com.
Availability of Proxy Voting Information
(1) A description of the policies and procedures that the Fund uses to determine how to vote proxies relating to portfolio securities is available (a) without charge, upon request, by calling Saturna Capital at 1-800-728-8762; (b) on the Funds' website at www. idahotaxexemptfund.com; and (c) on the SEC's website at www.sec.gov.
(2) Information regarding how the Fund voted proxies relating to portfolio securities during the most recent 12-month period ended June 30 is available (a) without charge, upon request, by calling Saturna Capital at 1-800-728-8762; (b) on the Funds' website at www.idahotaxexemptfund.com; and (c) on the SEC's website at www.sec.gov.
Privacy Statement
At Saturna Capital and the Idaho Tax-Exempt Fund, we understand the importance of maintaining the privacy of your financial information. We want to assure you that we protect the confidentiality of any personal information that you share with us. In addition, we do not sell information about our current or former customers.
In the course of our relationship, we gather certain nonpublic information about you, including your name, address, investment choices, and account information. We do not disclose your information to unaffiliated third parties unless it is necessary to process a transaction; service your account; deliver your account statements, shareholder reports and other information; or as required by law. When we disclose information to unaffiliated third parties, we require a contract to restrict the companies' use of customer information and from sharing or using it for any purposes other than performing the services for which they were required.
We may share information within the Saturna Capital family of companies in the course of informing you about products or services that may address your investing needs.
We maintain our own technology resources to minimize the need for any third party services, and restrict access to information within Saturna. We maintain physical, electronic, and procedural safeguards to guard your personal information. If you have any questions or concerns about the security or privacy of your information please call us at 1-800/SATURNA (1-800-728-8762).
Householding Policy
To reduce expenses, we may mail only one copy of the Fund's prospectus and each annual and semi-annual report to those addresses shared by two or more accounts. If you wish to receive individual and/or more copies of these documents, please call us at 800/SATURNA or write to us at Saturna Capital/Idaho Tax-Exempt Fund, P.O. Box N, Bellingham, WA 98227. We will begin sending you individual copies thirty days after receiving your request.
If you are currently receiving multiple copies and wish to receive only one copy, please call us at 800/SATURNA or write to us at Saturna Capital/Idaho Tax-Exempt Fund, P.O. Box N, Bellingham, WA 98227. We will begin sending you a single copy with subsequent report mailings.
Annual Report November 30, 2011 | 19
www.idahotaxexemptfund.com
This report is issued for the information of the shareowners of the Idaho Tax-Exempt Fund. It is not authorized for distribution to prospective investors unless it is accompanied or preceded by an effective prospectus relating to the securities of the Fund, a series of Saturna Investment Trust.
(logo omitted)
Saturna Capital
1300 N. State Street
Bellingham, WA 98225
www.saturna.com
(800) SATURNA
Saturna Brokerage Services, Distributor
Item 2. Code of Ethics.
Registrant has adopted a code of ethics and is included with this submission as Exhibit (a). It may also be found on Registrant's website at http://www.saturna.com/codeofethics.shtml.
Item 3. Audit Committee Financial Expert.
(a)(1)(i) The Trust has an audit committee financial expert serving on its audit committee.
(a)(2)(ii) As of November 30, 2011, Mr. Ronald H. Fielding, an independent Trustee (as defined for investment companies), was deemed qualified and agreed to serve.
Item 4. Principal Accountant Fees and Services.
(a) Audit Fees
For the fiscal years ending November 30, 2011 and 2010, the aggregate audit fees billed for professional services rendered by the principal accountant were $80,000 and $76,100. respectively.
(b) Audit-Related Fees
There were no fees billed by the principal accountant for assurance and related services that were not included under paragraph (a) for the fiscal years ending November 30, 2011 and 2010.
(c) Tax Fees
For the fiscal years ending November 30, 2011 and 2010, the aggregate tax fees billed for professional services rendered by the principal accountant were $14,000 and $13,100, resepctively. Service includes preparation of the Funds' federal and state income tax returns.
(d) All Other Fees
There were no other fees billed by the principal accountant for the fiscal years ending November 30, 2011 and 2010.
(e)(1) Audit & Compliance Committee Pre-Approval Policies and Procedures
The following is an excerpt from the Saturna Investment Trust Audit & Compliance Committee Charter:
C. Oversight of Independent Auditors
3. Pre-approval of Audit and Non-Audit Services. Except as provided below, the Committee's prior approval is necessary for the engagement of the independent auditors to provide any audit or non-audit services for the Trust and any non-audit services for any entity controlling, controlled by or under common control with Saturna that provides ongoing services to the Trust (Saturna and each such entity, an "Adviser Affiliate") where the engagement relates directly to the operations or financial reporting of the Trust. Non-audit services that qualify under the de minimis exception described in the Securities Exchange Act of 1934, as amended, and applicable rules thereunder, that were not pre-approved by the Committee, must be approved by the Committee prior to the completion of the audit. Pre-approval by the Committee is not required for engagements entered into pursuant to (a) pre-approval policies and procedures established by the Committee, or (b) pre-approval granted by one or more members of the Committee to whom, or by a subcommittee to which, the Committee has delegated pre-approval authority, provided in either case, that the Committee is informed of each such service at its next regular meeting.
(e) (2) Percentages of Services
One hundred percent of the services described in each of paragraphs (b) through (d) were approved by the audit committee pursuant to paragraph (c)(7)(i)(C) of Rule 2-01 of Regulation S-X.
(f) Not applicable.
(g) Not applicable.
(h) Not applicable.
Item 5. Audit Committee of Listed Registrants.
Not applicable.
Item 6. Schedule of Investments.
The schedule is included as part of the report to shareholders filed under Item 1 of this Form.
Item 7. Disclosure of Proxy Voting Policies and Procedures for Closed-End Management Investment Companies.
Not applicable.
Item 8. Portfolio Managers of Closed-End Management Investment Companies.
Not applicable.
Item 9. Purchases of Equity Securities by Closed-End Management Investment Company and Affiliated Purchasers.
Not applicable.
Item 10. Submission of Matters to a Vote of Security Holders.
Not applicable.
Item 11. Controls and Procedures.
(a) Internal control over financial reporting is under the supervision of the principal executive and financial officers. On December 27, 2011, Mr. Nicholas Kaiser (President) and Mr. Christopher Fankhauser (Treasurer), reviewed the internal control procedures for Saturna Investment Trust and found them reasonable and adequate.
(b) No change.
Item 12. Exhibits
Exhibits included with this filing:
(a) Code of Ethics.
(b) Certifications.
(1) Nicholas Kaiser, President, Saturna Investment Trust
(2) Christopher Fankhauser, Treasurer, Saturna Investment Trust
SIGNATURES
Pursuant to the requirements of the Securities Exchange Act of 1934 and the Investment Company Act of 1940, the registrant has duly caused this report to be signed on its behalf by the undersigned, thereunto duly authorized.
SATURNA INVESTMENT TRUST
By:
/s/ Nicholas Kaiser
Nicholas Kaiser, President
Date: January 27, 2012
Pursuant to the requirements of the Securities Exchange Act of 1934 and the Investment Act of 1940, this report has been signed below by the following persons on behalf of the registrant and in the capacities and on the dates indicated.
By:
/s/ Nicholas Kaiser
Nicholas Kaiser, President
Date: January 27, 2012
By:
/s/ Christopher Fankhauser
Christopher Fankhauser, Treasurer
Date: January 27, 2012