SECURITIES AND EXCHANGE COMMISSION
WASHINGTON, DC 20549
FORM N-CSRS
CERTIFIED SHAREHOLDER REPORT OF REGISTERED
MANAGEMENT INVESTMENT COMPANIES
Investment Company Act file number: 811-05071 / 33-13247
SATURNA INVESTMENT TRUST
(Exact Name of Registrant as Specified in Charter)
1300 N. State Street
Bellingham, Washington 98225-4730
(Address of Principal Executive Offices, including ZIP Code)
Nicole Trudeau, Esq.
1300 N. State Street
Bellingham, Washington 98225-4730
(Name and Address of Agent for Service)
Registrant's Telephone Number – (360) 734-9900
Date of fiscal year end: November 30, 2019
Date of reporting period: May 31, 2019
Item 1. Report To Shareowners
| Expense Ratio1 | ||||||||||||||||||||||||||||||||
Average Annual Total Returns as of June 30, 2019 | YTD | 1 Year | 3 Year | 5 Year | 10 Year | 15 Year | Gross | Net | ||||||||||||||||||||||||
Sextant Short-Term Bond Fund(STBFX) | 2.89% | 4.33% | 1.46% | 1.35% | 1.68% | 2.30% | 0.91% | 0.60% | ||||||||||||||||||||||||
FTSE USBIG Govt/Corp1-3 Year Index | 2.69% | 4.20% | 1.57% | 1.42% | 1.55% | 2.44% | n/a | |||||||||||||||||||||||||
Morningstar Short-Term Bond Category | 3.20% | 4.19% | 1.97% | 1.60% | 2.48% | 2.60% | n/a | |||||||||||||||||||||||||
Sextant Bond Income Fund(SBIFX) | 7.41% | 8.74% | 2.56% | 3.22% | 4.40% | 4.14% | 0.84% | 0.65% | ||||||||||||||||||||||||
FTSE US Broad Investment-Grade Bond Index | 6.14% | 7.91% | 2.33% | 2.95% | 3.83% | 4.34% | n/a | |||||||||||||||||||||||||
Morningstar Long-Term Bond Category | 13.18% | 13.09% | 4.42% | 5.38% | 7.77% | 6.56% | n/a | |||||||||||||||||||||||||
Sextant Core Fund(SCORX) | 12.77% | 9.77% | 7.40% | 4.15% | 6.87% | n/a | 0.88% | |||||||||||||||||||||||||
Dow Jones Moderate US Portfolio Index | 12.03% | 5.71% | 7.96% | 5.32% | 8.71% | 6.69% | n/a | |||||||||||||||||||||||||
Morningstar Allocation–50% to 70% Equity Category | 12.21% | 5.73% | 7.79% | 5.04% | 8.93% | 6.20% | n/a | |||||||||||||||||||||||||
Sextant Global High Income Fund(SGHIX) | 9.86% | 8.60% | 10.45% | 4.24% | n/a | n/a | 0.97% | 0.75% | ||||||||||||||||||||||||
S&P Global 1200 Index | 16.88% | 6.96% | 12.57% | 7.27% | 11.29% | 7.71% | n/a | |||||||||||||||||||||||||
Morningstar World Allocation Category | 10.40% | 3.05% | 6.23% | 2.72% | 7.13% | 5.98% | n/a | |||||||||||||||||||||||||
Sextant Growth Fund Investor Shares(SSGFX) | 22.30% | 14.77% | 16.43% | 9.28% | 12.29% | 9.15% | 0.92% | |||||||||||||||||||||||||
Sextant Growth Fund Z Shares(SGZFX) | 22.50% | 15.13% | n/a | n/a | n/a | n/a | 0.70% | |||||||||||||||||||||||||
S&P 500 Index | 18.54% | 10.42% | 14.22% | 10.72% | 14.70% | 8.75% | n/a | |||||||||||||||||||||||||
Morningstar Large Growth Category | 21.11% | 10.02% | 16.97% | 11.33% | 14.71% | 9.07% | n/a | |||||||||||||||||||||||||
Sextant International Fund Investor Shares(SSIFX) | 21.18% | 17.88% | 14.96% | 6.00% | 6.94% | 7.67% | 1.05% | |||||||||||||||||||||||||
Sextant International Fund Z Shares(SIFZX) | 21.30% | 18.14% | n/a | n/a | n/a | n/a | 0.84% | |||||||||||||||||||||||||
MSCI EAFE Index | 14.49% | 1.60% | 9.66% | 2.74% | 7.40% | 5.84% | n/a | |||||||||||||||||||||||||
Morningstar Foreign Large Growth Category | 18.29% | 2.25% | 9.63% | 4.09% | 8.20% | 6.18% | n/a | |||||||||||||||||||||||||
Performance data quoted above represents past performance, is before any taxes payable by shareowners, and is no guarantee of future results. Current performance may be higher or lower than that stated herein. Performance current to the most recentmonth-end is available by calling toll-free1-800-728-8762 or visiting www.sextantfunds.com. Average annual total returns are historical and include change in share value as well as reinvestment of dividends and capital gains, if any. The investment return and principal value of an investment will fluctuate so that an investor’s shares, when redeemed, may be worth more or less than their original cost. Funds that invest in foreign securities may involve greater risk, including political and economic uncertainties of foreign countries as well as the risk of currency fluctuations.
Z Shares of Sextant Growth and International Funds began operations June 2, 2017.
A note about risk: Please see Notes to Financial Statements beginning on page 50 for a discussion of investment risks. For a more detailed discussion of the risks associated with each Fund, please see the Funds’ prospectus or each Fund’s summary prospectus.
A Fund’s30-Day Yield, sometimes referred to as “standardized yield” or “SEC yield,” is expressed as an annual percentage rate using a method of calculation adopted by the Securities and Exchange Commission (SEC). The30-Day Yield provides an estimate of a Fund’s investment income rate, but may not equal the actual income distribution rate.
| 1 | By regulation, expense ratios shown in this table are as stated in the Funds’ most recent prospectus, which is dated March 27, 2019, and incorporate results for the fiscal year ended November 30, 2018. Ratios presented in this table differ from the expense ratios shown elsewhere in this report as they represent different periods. Also by regulation, the performance in this table represents the most recentquarter-end performance rather than performance through the Funds’ most recent fiscal period. |
The S&P 500 Index is an index comprised of 500 widely held common stocks considered to be representative of the US stock market in general. The MSCI EAFE Index is an international index focused on Europe, Australasia, and the Far East. The S&P Global 1200 Index is a global stock market index covering nearly 70% of the world’s equity markets. The Dow Jones Moderate Portfolio Index is a broad-based index of stock and bond prices. The FTSE USBIG Govt/Corp Index1-3 Year is a broad-based index of shorter-term investment grade US government and corporate bond prices. The FTSE US Broad Investment-Grade Bond Index is a broad-based index of medium and long-term investment grade bond prices. Investors cannot invest directly in the indices.
Please consider an investment’s objectives, risks, charges, and expenses carefully before investing. To obtain this and other important information about the Sextant Funds in a prospectus or summary prospectus, ask your financial advisor, visit www.sextantfunds.com, or call toll-free1-800-728-8762. Please read the prospectus or summary prospectus carefully before investing.
| 2 | May 31, 2019 | Semi-Annual Report | ||||
Fellow Shareowners:
For thesix-month period ended May 31, 2019, overall assets of the Sextant Funds were up 15.81% to $167.3 million. For theone-year period ended May 31, 2019, all of our equity and hybrid funds outperformed their respective Morningstar categories (see page 7 for more details).
Securities markets provided positive returns over the six months ended May 31, 2019, and the Sextant Funds performed respectably compared to their indices. For the period, Sextant Growth Fund Investor Shares gained 3.97%, outperforming the S&P 500 Index’s return of 0.74%. The Sextant International Fund Investor Shares gained 11.57%, well outperforming the MSCI EAFE Index’s return of 2.83%. Sextant Core Fund gained 3.25%, outperforming the Dow Jones Moderate US Portfolio Index’s return of 3.02%. The Sextant Global High Income Fund gained 2.93%, outperforming the S&P Global 1200 Index which returned 1.68%, but underperforming the Bloomberg Barclays Global High Yield Corporate Index which returned 5.03%. The Sextant Bond Income Fund was up 7.12%, outperforming the FTSE USBIG Bond Index’s gain of 6.79%. The Sextant Short-Term Bond Fund gained 2.91%, modestly outperforming the FTSE USBIG Government/Corporate1-3 Year Index which gained 2.89%.
The annualized expense ratios of the sixno-12b-1 fee Sextant Fund share classes range from 0.60% to 0.87%. Saturna Capital helped by paying to cap expenses for the Sextant Global High Income, Sextant Short-Term, and Sextant Bond Income Funds.
Strong 2019 Following Mixed 2018
Markets swung with abandon during the year, as euphoria melting to caution brought volatility and doubt. Emerging markets, led by China, suffered as the dollar surged and trade battles commenced. Wars were mostly fought with money, not arms. Global prices for carbon fuels (coal, oil, gas) are weak, as US shale production surges and demand softens. Lower taxes and interest rates are stimulating high employment, especially in technology, while the global supply chain is being rattled by trade revamps.
While it’s impossible to predict the future, we believe our portfolios are well-positioned for positive or negative economic developments given our focus on low debt, cash generative, high quality companies led by excellent management teams. Such characteristics can be defensive in the event of a downturn.
Morningstar Awards Sextant Top Sustainability Ratings
The Morningstar Sustainability Rating™ for funds gives investors around the world a way to compare fund portfolios based on a standardized measure of sustainability. These ratings are calculated using fund holdings data underpinned with company-level environmental, social, and governance (ESG) information from Sustainalytics, a leading provider of ESG research. Of the four Sextant funds Morningstar rated, Sextant International received the top “5 Globe” Sustainability Rating, while Sextant Growth, Sextant Core, and Sextant Short-Term Bond each received a “4 Globe” above average rating, reflecting Saturna Capital’s emphasis on sustainability when making portfolio investment decisions. Investors are cautioned, however, that more than 200 vendors offer “sustainable” investments data, and that no single global measurement prevails. See page 5 for the details.
At Saturna, we’ve developed a proprietary algorithm based on similar criteria. We believe this internal research further separates the companies we invest in from the fray. It seems to us (and is evidenced by the performance) that companies with long-view game plans serve all stakeholders, and especially long-term investors, better than their short-term, quarterly-return-obsessed competitors.
Going Forward
The 1960s and the 1990s were decades of nearly uninterrupted economic growth and the 2010s are now looking to stake their longevity claim. The last time the economy contracted for two consecutive quarters (the standard definition of a recession) was in the first two quarters of 2009, and current conditions appear

| May 31, 2019 | Semi-Annual Report | 3 | ||||
buoyant. Despite record low unemployment rates, inflation remains subdued, while corporate profitability and consumer confidence are robust.
At this point, the greatest risk to continued economic buoyancy appears to be trade friction, a development that could spin out of control or be contained rather easily with greater flexibility. Economic policies can and do change frequently.
An extraordinary era of low interest rates fueled upward moves in economies and markets. The US economy is in a “goldilocks” phase, with employment for those who want it, and little need for more government stimulus. We must be vigilant in the coming months for signs of a recession – we believe a riskier period looms ahead.
The Sextant Funds continue to offer investors a broad mix of investment vehicles: growth equities, international exposure, and a blended portfolio, plus global high-income, short-term, and long-termfixed-income options. This array of portfolios serves our investors in both bull and bear markets by seeking to provide steady, long-term growth with a focus on preservation of capital. Please review the following pages for morein-depth information about each Fund.
Respectfully,
(photo omitted)
Jane Carten,
President
(photo omitted)
Gary Goldfogel,
Independent Board Chairman
| Sextant Funds Portfolio Management | ||||||||||
| (photo omitted) | Nicholas KaiserMBA, CFA®
Sextant International Fund Portfolio Manager | (photo omitted) | Phelps McIlvaine
Sextant Short-Term Bond Fund Sextant Bond Income Fund Sextant Core Fund Portfolio Manager | |||||||
| (photo omitted) | Scott Klimo CFA®
Sextant Growth Fund Portfolio Manager Sextant International Fund Deputy Portfolio Manager | (photo omitted) | Bryce FegleyCFA®, CIPM®
Sextant Global High Income Fund Portfolio Manager | |||||||
| (photo omitted) | Patrick Drum MBA, CFA®, CFP®
Sextant Short-Term Bond Fund Sextant Bond Income Fund Sextant Global High Income Fund Deputy Portfolio Manager | (photo omitted) | Christopher Paul MBA, CFA®
Sextant Core Fund Portfolio Manager | |||||||
| 4 | May 31, 2019 | Semi-Annual Report | ||||
| Morningstar Sustainability Ratings™ | As of May 31, 2019 |
At Saturna Capital, we describe ourselves as value and values-based investors. We believe our approach improves the likelihood of achieving superior investment results over the long term. Our approach also leads to investment portfolios we can be proud of from the perspective of Environmental, Social, and Governance (ESG) issues. Morningstar partners with leading ESG research firm Sustainalytics to publish the Morningstar Sustainability Rating™ – here are Sextant Funds’ recent results:
Sextant International Fund | Sextant Short-Term Bond Fund | |||||||
Investor Shares (SSIFX) | Ø Ø Ø Ø Ø | STBFX | Ø Ø Ø Ø Ø | |||||
Z Shares (SIFZX) | Ø Ø Ø Ø Ø | |||||||
| 4th percentile among 398 Foreign Large Blend Funds | 20th percentile among 481 Short-Term Bond Funds | |||||||
Sextant Growth Fund | Sextant Core Fund | |||||||
Investor Shares (SSGFX) | Ø Ø Ø Ø Ø | SCORX | Ø Ø Ø Ø Ø | |||||
Z Shares (SGZFX) | Ø Ø Ø Ø Ø | |||||||
| 20th percentile among 1,229 Large Growth Funds | 19th percentile among 688 Allocation50%-70% Equity Funds | |||||||
The Sextant Bond Income and Sextant Global High Income Funds were not rated by Morningstar for the period. | ||||||||
The Morningstar Sustainability Rating™ gives investors across the globe a way to compare fund portfolios based on a standard measure of sustainability. The rating is a holdings-based calculation using company-level environmental, social, and governance (ESG) analytics from Sustainalytics. | ||||||||
The Morningstar Sustainability Rating and the Morningstar Portfolio Sustainability Score are not based on fund performance and are not equivalent to the Morningstar Rating (“Star Rating”).
© 2019 Morningstar®.All rights reserved. Morningstar, Inc. is an independent fund performance monitor. The information contained herein: (1) is proprietary to Morningstar and/or its content providers; (2) may not be copied or distributed; and (3) is not warranted to be accurate, complete, or timely. Neither Morningstar nor its content providers are responsible for any damages or losses arising from any use of this information.
Morningstar Sustainability Ratings and Portfolio Sustainability Scores are as of May 31, 2019. The Morningstar Sustainability Rating™ is intended to measure how well the issuing companies of the securities within a fund’s portfolio are managing their environmental, social, and governance (“ESG”) risks and opportunities relative to the fund’s Morningstar category peers. The Morningstar Sustainability Rating calculation is atwo-step process. First, each fund with at least 50% of assets covered by a company-level ESG score from Sustainalytics receives a Morningstar Portfolio Sustainability Score™. The Morningstar Portfolio Sustainability Score is an asset-weighted average of normalized company-level ESG scores with deductions made for controversial incidents by the issuing companies, such as environmental accidents, fraud, or discriminatory behavior. The Morningstar Sustainability Rating is then assigned to all scored funds within Morningstar Categories in which at least ten (10) funds receive a Portfolio Sustainability Score and is determined by each fund’s rank within the following distribution: High (highest 10%), Above Average (next 22.5%), Average (next 35%), Below Average (next 22.5%), and Low (lowest 10%). The Morningstar Sustainability Rating is depicted by globe icons where High equals 5 globes and Low equals 1 globe. A Sustainability Rating is assigned to any fund that has more than half of its underlying assets rated by Sustainalytics and is within a Morningstar Category with at least 10 scored funds; therefore, the rating it is not limited to funds with explicit sustainable or responsible investment mandates. Morningstar updates its Sustainability Ratings monthly. Portfolios receive a Morningstar Portfolio Sustainability Score and Sustainability Rating one month and six business days after their reportedas-of date based on the most recent portfolio. As part of the evaluation process, Morningstar uses Sustainalytics’ ESG scores from the same month as the portfolioas-of date.
The Funds were rated on the following percentages of Assets Under Management:
| Sextant International Fund | 76% | |
| Sextant Core Fund | 76% | |
| Sextant Short-Term Bond Fund | 68% | |
| Sextant Growth Fund | 99% |
The Funds’ portfolios are actively managed and are subject to change, which may result in different Morningstar Sustainability Scores and Ratings.
% Rank in Category is the fund’s percentile rank for the specified time period relative to all funds that have the same Morningstar category. The highest (or most favorable) percentile rank is 1 and the lowest (or least favorable) percentile rank is 100. Thetop-performing fund in a category will always receive a rank of 1. Percentile ranks within categories are most useful in those categories that have a large number of funds.
| May 31, 2019 | Semi-Annual Report | 5 | ||||
| Morningstar Carbon Metrics | As of March 31, 2019 |
Sextant Growth Fund | Sextant International Fund | |||||||
|
| |||||||
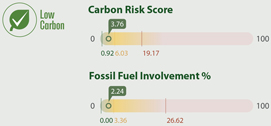
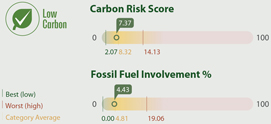
Morningstar carbon metrics are asset-weighted portfolio calculations based on their Sustainalytics subsidiary’s carbon-risk research. Based on two of these metrics – Carbon Risk Score and Fossil Fund Involvement % – funds may receive the Low Carbon designation, which allows investors to easily identify low-carbon funds within the global universe.
The portfolio Carbon Risk Score is a number between 0 and 100 (a lower score is better). A portfolio’s Carbon Risk Score is the asset-weighted sum of the carbon risk scores of its holdings, averaged over the trailing 12 months. The carbon risk of a company is Sustainalytics’ evaluation of the degree to which a firm’s activities and products are aligned with the transition to a low-carbon economy. The assessment includes carbon intensity, fossil fuel involvement, stranded assets exposure, mitigation strategies, and green product solutions.
Fossil Fuel Involvement % is the portfolio’s asset-weighted percentage exposure to fossil fuels, averaged over the trailing 12 months. Companies with fossil fuel involvement are defined as these in the following subindustries: Thermal Coal Extraction, Thermal Coal Power Generation, Oil & Gas Production, Oil & Gas Power Generation, and Oil and Gas Products and Services.
To receive the Low Carbon designation a fund must have Carbon Risk Score below 10 and a Fossil Fuel Involvement % of less than 7% of assets. For these metrics to be calculated, at least 67% of a portfolio’s assets must be covered by Sustainalytics company carbon-risk research. All Morningstar carbon metrics are calculated quarterly.
Sextant Growth Fund was rated on 94% and Sextant International Fund was rated on 88% of assets under management.
(photo omitted)
On the cover:Mo’orea, French Polynesia.
Photo by Elizabeth Alm.
| 6 | May 31, 2019 | Semi-Annual Report | ||||
| Expense Ratio1 | ||||||||||||||||||||||||||||||||
Average Annual Total Returns as of May 31, 2019 | YTD | 1 Year | 3 Year | 5 Year | 10 Year | 15 Year | Gross | Net | ||||||||||||||||||||||||
Sextant Short-Term Bond Fund(STBFX) | 2.14% | 3.48% | 1.37% | 1.18% | 1.62% | 2.26% | 0.91% | 0.60% | ||||||||||||||||||||||||
FTSE USBIG Govt/Corp1-3 Year Index | 2.14% | 3.65% | 1.58% | 1.30% | 1.51% | 2.40% | n/a | |||||||||||||||||||||||||
Morningstar Short-Term Bond Category | 2.58% | 3.58% | 1.99% | 1.49% | 2.50% | 2.57% | n/a | |||||||||||||||||||||||||
Sextant Bond Income Fund(SBIFX) | 5.54% | 6.25% | 2.95% | 2.87% | 4.43% | 4.06% | 0.84% | 0.65% | ||||||||||||||||||||||||
FTSE US Broad Investment-Grade Bond Index | 4.84% | 6.41% | 2.51% | 2.71% | 3.77% | 4.30% | n/a | |||||||||||||||||||||||||
Morningstar Long-Term Bond Category | 9.93% | 9.11% | 4.78% | 4.88% | 7.85% | 6.43% | n/a | |||||||||||||||||||||||||
Sextant Core Fund(SCORX) | 7.58% | 4.23% | 5.85% | 3.47% | 6.37% | n/a | 0.88% | |||||||||||||||||||||||||
Dow Jones Moderate US Portfolio Index | 7.29% | 0.97% | 6.71% | 4.80% | 8.27% | 6.50% | n/a | |||||||||||||||||||||||||
Morningstar Allocation–50% to 70% Equity Category | 7.61% | 1.37% | 6.40% | 4.46% | 8.51% | 6.00% | n/a | |||||||||||||||||||||||||
Sextant Global High Income Fund(SGHIX) | 5.07% | 3.59% | 9.84% | 3.59% | n/a | n/a | 0.97% | 0.75% | ||||||||||||||||||||||||
S&P Global 1200 Index | 9.68% | 0.19% | 9.91% | 6.28% | 10.50% | 7.39% | n/a | |||||||||||||||||||||||||
Morningstar World Allocation Category | 6.06% | -1.72% | 5.02% | 2.15% | 6.79% | 5.87% | n/a | |||||||||||||||||||||||||
Sextant Growth Fund Investor Shares(SSGFX) | 13.20% | 7.18% | 12.75% | 7.94% | 11.46% | 8.62% | 0.92% | |||||||||||||||||||||||||
Sextant Growth Fund Z Shares(SGZFX) | 13.36% | 7.50% | n/a | n/a | n/a | n/a | 0.70% | |||||||||||||||||||||||||
S&P 500 Index | 10.74% | 3.78% | 11.72% | 9.65% | 13.93% | 8.39% | n/a | |||||||||||||||||||||||||
Morningstar Large Growth Category | 13.46% | 3.77% | 13.86% | 10.38% | 13.97% | 8.72% | n/a | |||||||||||||||||||||||||
Sextant International Fund Investor Shares(SSIFX) | 16.42% | 11.83% | 13.35% | 6.04% | 6.46% | 7.58% | 1.05% | |||||||||||||||||||||||||
Sextant International Fund Z Shares(SIFZX) | 16.54% | 12.16% | n/a | n/a | n/a | n/a | 0.84% | |||||||||||||||||||||||||
MSCI EAFE Index | 8.05% | -5.26% | 6.35% | 1.75% | 6.71% | 5.59% | n/a | |||||||||||||||||||||||||
Morningstar Foreign Large Growth Category | 11.33% | -5.13% | 6.76% | 3.07% | 7.35% | 5.83% | n/a | |||||||||||||||||||||||||
Performance data quoted above represents past performance, is before any taxes payable by shareowners, and is no guarantee of future results. Current performance may be higher or lower than that stated herein. Performance current to the most recentmonth-end is available by calling toll-free1-800-728-8762 or visiting www.sextantfunds.com. Average annual total returns are historical and include change in share value as well as reinvestment of dividends and capital gains, if any. The investment return and principal value of an investment will fluctuate so that an investor’s shares, when redeemed, may be worth more or less than their original cost. Funds that invest in foreign securities may involve greater risk, including political and economic uncertainties of foreign countries as well as the risk of currency fluctuations.
| 1 | By regulation, expense ratios shown in this table are as stated in the Funds’ most recent prospectus, which is dated March 27, 2019, and incorporate results for the fiscal year ended November 30, 2018. Ratios presented in this table differ from the expense ratios shown elsewhere in this report as they represent different periods. |
| May 31, 2019 | Semi-Annual Report | 7 | ||||
| Sextant Short-Term Bond Fund |  |
Performance Summary |
Average Annual Total Returns as of May 31, 2019 |
| |||||||||||||||
| 1 Year | 5 Year | 10 Year | Expense Ratio1 | |||||||||||||
Sextant Short-Term Bond Fund | 3.48% | 1.18% | 1.62% | 0.91% | ||||||||||||
FTSE USBIG Govt/Corp1-3 Year Index | 3.65% | 1.30% | 1.51% | n/a | ||||||||||||
Growth of $10,000
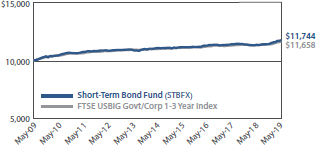 | Comparison of any mutual fund to a market index must be made bearing in mind that the index is expense-free. Conversely, the fund will (1) be actively managed; (2) have an objective other than mirroring the index, such as limiting risk; (3) bear transaction and other costs; (4) stand ready to buy and sell its securities to shareowners on a daily basis; and (5) provide a wide range of services. The graph compares $10,000 invested in the Fund on November 30, 2008, to an identical amount invested in the FTSE USBIG Govt/Corp1-3 Year Index, a broad-based index of shorter-term investment grade US government and corporate bond prices. The graph shows that an investment in the Fund would have risen to $11,744 versus $11,658 in the index. |
Past performance does not guarantee future results.The “Growth of $10,000” graph and “Average Annual Returns” performance table assume the reinvestment of dividends and capital gains. They do not reflect the deduction of taxes that a shareowner might pay on fund distributions or the redemption of fund shares.
| 1 | By regulation, the expense ratio shown in this table is as stated in the Fund’s most recent prospectus which is dated March 27, 2019, and incorporates results for the fiscal year ended November 30, 2018, before fee waivers. The actual expense ratio, shown in the most recent prospectus after fee waivers was 0.60%. The ratio presented in this table differs from expense ratios shown elsewhere in this report as they represent different periods. |
Fund Objective
The objectives of the Short-Term Bond Fund are capital preservation and current income.
Top 10 Holdings |
| |||
| % of Total Net Assets | ||||
United States Treasury Note(3.625% due 02/15/2021) | 8.6% | |||
United States Treasury Note(2.50% due 08/15/2023) | 4.8% | |||
United States Treasury Note(2.875% due 10/31/2020) | 4.7% | |||
McCormick & Co.(2.70% due 08/15/2022) | 4.7% | |||
Honeywell International(4.25% due 03/01/2021) | 4.3% | |||
Burlington Northern Santa Fe(3.05% due 09/01/2022) | 3.8% | |||
AvalonBay Communities(2.85% due 03/15/2023) | 3.8% | |||
Gilead Sciences(2.55% due 09/01/2020) | 3.7% | |||
3M(2.00% due 06/26/2022) | 3.7% | |||
Qualcomm(2.60% due 01/30/2023) | 3.7% | |||
Portfolio Diversification |
| % of Total Net Assets |
| |||||||||||||||
US Treasury Notes | 24.3% | ∎ |  | |||||||||||||
Technology | 15.2% | ∎ | ||||||||||||||
Health Care | 13.3% | ∎ | ||||||||||||||
Financials | 12.1% | ∎ | ||||||||||||||
Consumer Staples | 10.4% | ∎ | ||||||||||||||
Industrials | 10.1% | ∎ | ||||||||||||||
Consumer Discretionary | 5.6% | ∎ | ||||||||||||||
Materials | 3.7% | ∎ | ||||||||||||||
Other Assets (net of liabilities) | 5.3% | ∎ | ||||||||||||||
| 8 | May 31, 2019 | Semi-Annual Report | ||||
| Sextant Short-Term Bond Fund | |
| Schedule of Investments | As of May 31, 2019 | |||||||||||||||||
| Corporate Bonds – 70.4% | Coupon / Maturity | Face Amount | Market Value | Percentage of Assets | ||||||||||||||
| Consumer Discretionary | ||||||||||||||||||
Alibaba Holding Group | 3.125% due 11/28/2021 | $350,000 | $353,369 | 3.3% | ||||||||||||||
Ford Motor Credit | 3.157% due 08/04/2020 | 250,000 | 249,701 | 2.3% | ||||||||||||||
| 603,070 | 5.6% | |||||||||||||||||
| Consumer Staples | ||||||||||||||||||
Church & Dwight | 2.875% due 10/01/2022 | 260,000 | 262,175 | 2.4% | ||||||||||||||
Estee Lauder | 2.35% due 08/15/2022 | 350,000 | 349,484 | 3.3% | ||||||||||||||
McCormick & Co. | 2.70% due 08/15/2022 | 500,000 | 499,502 | 4.7% | ||||||||||||||
| 1,111,161 | 10.4% | |||||||||||||||||
| Financials | ||||||||||||||||||
AvalonBay Communities | 2.85% due 03/15/2023 | 400,000 | 402,818 | 3.8% | ||||||||||||||
Camden Property Trust | 4.625% due 06/15/2021 | 275,000 | 284,274 | 2.6% | ||||||||||||||
Jefferies Group | 8.50% due 07/15/2019 | 265,000 | 266,626 | 2.5% | ||||||||||||||
Paccar Financial | 2.05% due 11/13/2020 | 350,000 | 348,810 | 3.2% | ||||||||||||||
| 1,302,528 | 12.1% | |||||||||||||||||
| Health Care | ||||||||||||||||||
AbbVie | 2.50% due 05/14/2020 | 250,000 | 249,366 | 2.3% | ||||||||||||||
Astrazeneca | 2.375% due 01/16/2020 | 155,000 | 154,693 | 1.4% | ||||||||||||||
Celgene | 2.25% due 08/15/2021 | 300,000 | 298,078 | 2.8% | ||||||||||||||
Gilead Sciences | 2.55% due 09/01/2020 | 400,000 | 400,403 | 3.7% | ||||||||||||||
Teva Pharmaceutical | 3.65% due 11/10/2021 | 350,000 | 327,250 | 3.1% | ||||||||||||||
| 1,429,790 | 13.3% | |||||||||||||||||
| Industrials | ||||||||||||||||||
Burlington Northern Santa Fe | 3.05% due 09/01/2022 | 400,000 | 406,433 | 3.8% | ||||||||||||||
CSX Corporation | 4.25% due 06/01/2021 | 350,000 | 360,057 | 3.4% | ||||||||||||||
Emerson Electric | 4.875% due 10/15/2019 | 310,000 | 312,394 | 2.9% | ||||||||||||||
| 1,078,884 | 10.1% | |||||||||||||||||
| Materials | ||||||||||||||||||
3M | 2.00% due 06/26/2022 | 400,000 | 397,334 | 3.7% | ||||||||||||||
| 397,334 | 3.7% | |||||||||||||||||
Continued on next page.
| The accompanying notes are an integral part of these financial statements. | Semi-Annual Report | May 31, 2019 | 9 | |||||
| Sextant Short-Term Bond Fund | |
| Schedule of Investments | As of May 31, 2019 | |||||||||||||||||
| Corporate Bonds – 70.4% | Coupon / Maturity | Face Amount | Market Value | Percentage of Assets | ||||||||||||||
| Technology | ||||||||||||||||||
Adobe Systems | 4.75% due 02/01/2020 | $379,000 | $384,323 | 3.6% | ||||||||||||||
Honeywell International | 4.25% due 03/01/2021 | 450,000 | 464,547 | 4.3% | ||||||||||||||
Juniper Networks | 4.60% due 03/15/2021 | 375,000 | 387,781 | 3.6% | ||||||||||||||
Qualcomm | 2.60% due 01/30/2023 | 400,000 | 396,315 | 3.7% | ||||||||||||||
| 1,632,966 | 15.2% | |||||||||||||||||
| Total Corporate Bonds | 7,519,000 | 7,555,733 | 70.4% | |||||||||||||||
| Government Bonds – 24.3% | Coupon / Maturity | Face Amount | Market Value | Percentage of Assets | ||||||||||||||
| United States Treasury Notes | ||||||||||||||||||
United States Treasury Note | 2.875% due 10/31/2020 | $500,000 | $505,410 | 4.7% | ||||||||||||||
United States Treasury Note | 2.625% due 05/15/2021 | 355,000 | 359,424 | 3.4% | ||||||||||||||
United States Treasury Note | 3.625% due 02/15/2021 | 900,000 | 924,047 | 8.6% | ||||||||||||||
United States Treasury Note | 2.50% due 08/15/2023 | 500,000 | 511,426 | 4.8% | ||||||||||||||
United States Treasury Note | 2.00% due 09/30/2020 | 300,000 | 299,543 | 2.8% | ||||||||||||||
| 2,599,850 | 24.3% | |||||||||||||||||
| Total investments | (Cost = 10,133,267) | 10,155,583 | 94.7% | |||||||||||||||
| Other assets (net of liabilities) | 571,352 | 5.3% | ||||||||||||||||
| Total net assets | $10,726,935 | 100.0% | ||||||||||||||||
Bond Quality Diversification | ||||||||||||||||
| % of Total Net Assets |
| |||||||||||||||
Rated “AAA” | 24.3% | ∎ |  | |||||||||||||
Rated“AA-” | 3.7% | ∎ | ||||||||||||||
Rated “A+” | 13.6% | ∎ | ||||||||||||||
Rated “A” | 14.5% | ∎ | ||||||||||||||
Rated“A-” | 9.8% | ∎ | ||||||||||||||
Rated “BBB+” | 9.8% | ∎ | ||||||||||||||
Rated “BBB” | 13.4% | ∎ | ||||||||||||||
Rated“BBB-” | 2.5% | ∎ | ||||||||||||||
Rated “BB” | 3.1% | ∎ | ||||||||||||||
Other assets (net of liabilities) | 5.3% | ∎ | ||||||||||||||
Credit ratings are the lesser of S&P Global Ratings or Moody’s Investors Service. If neither S&P nor Moody’s rate a particular security, that security is categorized as not rated (except for US Treasury securities and securities issued or backed by US agencies which inherit the credit rating for the US government). Ratings range from AAA (highest) to D (lowest). Bonds rated BBB or above are considered investment grade. Credit ratings BB and below are lower-rated securities (junk bonds). Ratings apply to the creditworthiness of the issuers of the underlying securities and not the Fund or its shares. Ratings may be subject to change.
| 10 | May 31, 2019 | Semi-Annual Report | The accompanying notes are an integral part of these financial statements. | |||||
| Sextant Short-Term Bond Fund | |
Statement of Assets and Liabilities
| As of May 31, 2019 |
| |||
| ||||
Assets | ||||
Investments in securities, at value (Cost $10,133,267) | $10,155,583 | |||
Cash | 491,082 | |||
Interest receivable | 83,353 | |||
Prepaid expenses | 4,844 | |||
Receivable for Fund shares sold | 1,115 | |||
Total assets | 10,735,977 | |||
Liabilities | ||||
Payable for Fund shares redeemed | 5,000 | |||
Accrued advisory fees | 2,241 | |||
Accrued retirement plan custodial fees | 1,430 | |||
Accrued Chief Compliance Officer expenses | 322 | |||
Distributions payable | 49 | |||
Total liabilities | 9,042 | |||
Net Assets | $10,726,935 | |||
Analysis of net assets | ||||
Paid-in capital (unlimited shares authorized, without par value) | $10,722,664 | |||
Total distributable earnings | 4,271 | |||
Net assets applicable to Fund shares outstanding | $10,726,935 | |||
Fund shares outstanding | 2,128,039 | |||
Net asset value, offering, and redemption price per share | $5.04 | |||
Statement of Operations
| Period ended May 31, 2019 |
| |||
| ||||
Investment income | ||||
Interest income | $123,347 | |||
Total investment income | 123,347 | |||
Expenses | ||||
Investment adviser fees | 26,244 | |||
Filing and registration fees | 9,662 | |||
Audit fees | 3,412 | |||
Retirement plan custodial fees | 1,768 | |||
Chief Compliance Officer expenses | 1,310 | |||
Trustee fees | 1,236 | |||
Printing and postage | 1,040 | |||
Other expenses | 660 | |||
Legal fees | 338 | |||
Custodian fees | 224 | |||
Total gross expenses | 45,894 | |||
Less adviser fees waived | (14,070 | ) | ||
Less custodian fee credits | (185 | ) | ||
Net expenses | 31,639 | |||
Net investment income | $91,708 | |||
| ||||
Net realized loss from investments | $(4,122 | ) | ||
Net increase in unrealized appreciation on investments | 221,591 | |||
Net gain on investments | $217,469 | |||
Net increase in net assets resulting from operations | $309,177 | |||
| The accompanying notes are an integral part of these financial statements. | Semi-Annual Report | May 31, 2019 | 11 | |||||
| Sextant Short-Term Bond Fund | |
Statements of Changes in Net Assets | Period ended May 31, 2019 | Year ended Nov. 30, 2018 | ||||||
Increase (decrease) in net assets from operations | ||||||||
From operations | ||||||||
Net investment income | $91,708 | $147,275 | ||||||
Net realized loss on investment | (4,122 | ) | (16,794 | ) | ||||
Net increase (decrease) in unrealized appreciation | 221,591 | (110,471 | ) | |||||
Net increase in net assets | 309,177 | 20,010 | ||||||
Distributions to shareowners | (91,708 | ) | (150,192 | ) | ||||
Capital share transactions | ||||||||
Proceeds from sales of shares | 722,666 | 974,206 | ||||||
Value of shares issued in reinvestment of dividends | 91,239 | 150,567 | ||||||
Cost of shares redeemed | (580,035 | ) | (1,423,649 | ) | ||||
Total capital share transactions | 233,870 | (298,876 | ) | |||||
Total increase (decrease) in net assets | 451,339 | (429,058 | ) | |||||
Net assets | ||||||||
Beginning of period | 10,275,596 | 10,704,654 | ||||||
End of period | $10,726,935 | $10,275,596 | ||||||
Shares of the Fund sold and redeemed | ||||||||
Number of shares sold | 145,008 | 196,541 | ||||||
Number of shares issued in reinvestment of dividends | 18,213 | 30,411 | ||||||
Number of shares redeemed | (116,347 | ) | (286,428 | ) | ||||
Net increase (decrease) in number of shares outstanding | 46,874 | (59,476 | ) | |||||
Financial Highlights | For period ended | For year ended November 30, | ||||||||||||||||||||||
Selected data per share of outstanding capital stock throughout each period: | May 31, 2019 | 2018 | 2017 | 2016 | 2015 | 2014 | ||||||||||||||||||
Net asset value at beginning of period | $4.94 | $5.00 | $5.02 | $5.02 | $5.04 | $5.05 | ||||||||||||||||||
Income from investment operations | ||||||||||||||||||||||||
Net investment income | 0.04 | 0.07 | 0.06 | 0.05 | 0.05 | 0.06 | ||||||||||||||||||
Net gains (losses) on securities (both realized and unrealized) | 0.10 | (0.06 | ) | (0.02 | ) | 0.00 | A | (0.02 | ) | (0.01 | ) | |||||||||||||
Total from investment operations | 0.14 | 0.01 | 0.04 | 0.05 | 0.03 | 0.05 | ||||||||||||||||||
Less distributions | ||||||||||||||||||||||||
Dividends (from net investment income) | (0.04 | ) | (0.07 | ) | (0.06 | ) | (0.05 | ) | (0.05 | ) | (0.06 | ) | ||||||||||||
Capital gains distribution | - | (0.00 | )A | - | - | - | - | |||||||||||||||||
Total distributions | (0.04 | ) | (0.07 | ) | (0.06 | ) | (0.05 | ) | (0.05 | ) | (0.06 | ) | ||||||||||||
Net asset value at end of period | $5.04 | $4.94 | $5.00 | $5.02 | $5.02 | $5.04 | ||||||||||||||||||
Total returnB | 2.91% | 0.26% | 0.87% | 1.06% | 0.67% | 0.94% | ||||||||||||||||||
Ratios / supplemental data | ||||||||||||||||||||||||
Net assets ($000), end of period | $10,727 | $10,276 | $10,705 | $10,326 | $7,488 | $7,674 | ||||||||||||||||||
Ratio of expenses to average net assets | ||||||||||||||||||||||||
Before fee waivers and custodian fee creditsC | 0.87% | 0.91% | 1.01% | 1.15% | 1.21% | 1.29% | ||||||||||||||||||
After fee waiversC | 0.61% | 0.61% | 0.68% | 0.76% | 0.76% | 0.76% | ||||||||||||||||||
After fee waivers and custodian fee creditsC | 0.60% | 0.60% | 0.68% | 0.75% | 0.75% | 0.75% | ||||||||||||||||||
Ratio of net investment income after fee waivers and custodian fee credits to average net assetsC | 1.75% | 1.44% | 1.26% | 1.05% | 1.06% | 1.14% | ||||||||||||||||||
Portfolio turnover rateB | 11% | 36% | 31% | 11% | 13% | 14% | ||||||||||||||||||
| A | Amount is less than $0.01 |
| B | Not Annualized for periods less than one year. |
| C | Annualized for periods less than one year. |
| 12 | May 31, 2019 | Semi-Annual Report | The accompanying notes are an integral part of these financial statements. | |||||
| Sextant Bond Income Fund |  |
Performance Summary |
Average Annual Total Returns as of May 31, 2019 |
| |||||||||||||||
| 1 Year | 5 Year | 10 Year | Expense Ratio1 | |||||||||||||
Sextant Bond Income Fund | 6.25% | 2.87% | 4.43% | 0.84% | ||||||||||||
FTSE US Broad Investment-Grade Bond Index | 6.41% | 2.71% | 3.77% | n/a | ||||||||||||
Growth of $10,000
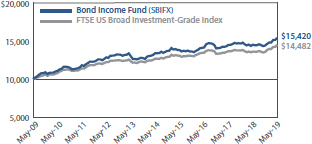 | Comparison of any mutual fund to a market index must be made bearing in mind that the index is expense-free. Conversely, the fund will (1) be actively managed; (2) have an objective other than mirroring the index, such as limiting risk; (3) bear transaction and other costs; (4) stand ready to buy and sell its securities to shareowners on a daily basis; and (5) provide a wide range of services. The graph compares $10,000 invested in the Fund on November 30, 2008, to an identical amount invested in the FTSE US Broad Investment-Grade Bond Index, a broad-based index of medium and long-term investment grade bond prices. The graph shows that an investment in the Fund would have risen to $15,420 versus $14,482 in the index. |
Past performance does not guarantee future results.The “Growth of $10,000” graph and “Average Annual Returns” performance table assume the reinvestment of dividends and capital gains. They do not reflect the deduction of taxes that a shareowner might pay on fund distributions or the redemption of fund shares.
| 1 | By regulation, the expense ratio shown in this table is as stated in the Fund’s most recent prospectus which is dated March 27, 2019, and incorporates results for the fiscal year ended November 30, 2018, before fee waivers. The expense ratio shown in the most recent prospectus after fee waivers was 0.65%. The ratio presented in this table differs from expense ratios shown elsewhere in this report as they represent different periods. |
Fund Objective
The objective of the Bond Income Fund is current income.
Top 10 Holdings | ||||
| % of Total Net Assets | ||||
United States Treasury Note(3.625% due 02/15/2021) | 9.4% | |||
United States Treasury Bond(5.375% due 02/15/2031) | 4.7% | |||
Apple(4.50% due 02/23/2036) | 3.4% | |||
Microsoft(4.20% due 11/03/2035) | 3.4% | |||
Intel(4.00% due 12/15/2032) | 3.4% | |||
Burlington Northern Santa Fe(5.05% due 03/01/2041) | 3.2% | |||
United States Treasury Note(2.125% due 06/30/2021) | 2.9% | |||
United Technologies Corp(6.05% due 06/01/2036) | 2.7% | |||
United States Treasury Bond(6.125% due 08/15/2029) | 2.7% | |||
Puget Sound Energy(7.02% due 12/01/2027) | 2.7% | |||
Portfolio Diversification | ||||||||||||
| % of Total Net Assets | ||||||||||||
Government Bonds | 26.3% | ∎ |  | |||||||||
Health Care | 12.1% | ∎ | ||||||||||
Municipal Bonds | 11.7% | ∎ | ||||||||||
Technology | 10.2% | ∎ | ||||||||||
Industrials | 9.5% | ∎ | ||||||||||
Financials | 6.6% | ∎ | ||||||||||
Energy | 6.1% | ∎ | ||||||||||
Utilities | 5.8% | ∎ | ||||||||||
Consumer Discretionary | 4.7% | ∎ | ||||||||||
Consumer Staples | 2.2% | ∎ | ||||||||||
Other assets (net of liabilities) | 4.8% | ∎ | ||||||||||
| Semi-Annual Report | May 31, 2019 | 13 | ||||
| Sextant Bond Income Fund | |
| Schedule of Investments | As of May 31, 2019 | |||||||||||||||||
| Corporate Bonds – 57.2% | Coupon / Maturity | Face Amount | Market Value | Percentage of Assets | ||||||||||||||
| Consumer Discretionary | ||||||||||||||||||
Lowe’s | 5.80% due 10/15/2036 | $250,000 | $291,120 | 2.5% | ||||||||||||||
VF | 6.00% due 10/15/2033 | 200,000 | 249,269 | 2.2% | ||||||||||||||
| 540,389 | 4.7% | |||||||||||||||||
| Consumer Staples | ||||||||||||||||||
Unilever Capital | 5.90% due 11/15/2032 | 200,000 | 256,513 | 2.2% | ||||||||||||||
| 256,513 | 2.2% | |||||||||||||||||
| Energy | ||||||||||||||||||
Baker Hughes | 6.875% due 01/15/2029 | 100,000 | 124,441 | 1.1% | ||||||||||||||
Canadian Natural Resources | 6.45% due 06/30/2033 | 225,000 | 277,187 | 2.4% | ||||||||||||||
Statoil | 7.15% due 01/15/2029 | 224,000 | 297,314 | 2.6% | ||||||||||||||
| 698,942 | 6.1% | |||||||||||||||||
| Financials | ||||||||||||||||||
Affiliated Managers Group | 3.50% due 08/01/2025 | 250,000 | 255,974 | 2.2% | ||||||||||||||
Bank Of New York Mellon MTN | 3.30% due 08/23/2029 | 250,000 | 251,190 | 2.2% | ||||||||||||||
UBS AG Stamford CT | 7.75% due 09/01/2026 | 200,000 | 248,103 | 2.2% | ||||||||||||||
| 755,267 | 6.6% | |||||||||||||||||
| Health Care | ||||||||||||||||||
Becton Dickinson | 6.70% due 08/01/2028 | 240,000 | 287,754 | 2.5% | ||||||||||||||
Johnson & Johnson | 4.95% due 05/15/2033 | 226,000 | 274,211 | 2.4% | ||||||||||||||
Medtronic Inc | 4.375% due 03/15/2035 | 260,000 | 288,968 | 2.5% | ||||||||||||||
Merck & Co. | 6.50% due 12/01/2033 | 215,000 | 295,137 | 2.6% | ||||||||||||||
Teva Pharmaceutical | 3.65% due 11/10/2021 | 250,000 | 233,750 | 2.1% | ||||||||||||||
| 1,379,820 | 12.1% | |||||||||||||||||
| Industrials | ||||||||||||||||||
Boeing | 6.125% due 02/15/2033 | 215,000 | 275,614 | 2.4% | ||||||||||||||
Burlington Northern Santa Fe | 5.05% due 03/01/2041 | 310,000 | 361,012 | 3.2% | ||||||||||||||
Deere & Co. | 8.10% due 05/15/2030 | 95,000 | 133,059 | 1.2% | ||||||||||||||
United Technologies | 6.05% due 06/01/2036 | 250,000 | 309,911 | 2.7% | ||||||||||||||
| 1,079,596 | | 9.5% | | |||||||||||||||
Continued on next page.
| 14 | May 31, 2019 | Semi-Annual Report | The accompanying notes are an integral part of these financial statements. | |||||
| Sextant Bond Income Fund | |
| Schedule of Investments | As of May 31, 2019 | |||||||||||||||||
| Corporate Bonds – 57.2% | Coupon / Maturity | Face Amount | Market Value | Percentage of Assets | ||||||||||||||
| Technology | ||||||||||||||||||
Apple | 4.50% due 02/23/2036 | $350,000 | $392,635 | 3.4% | ||||||||||||||
Intel | 4.00% due 12/15/2032 | 360,000 | 382,639 | 3.4% | ||||||||||||||
Microsoft | 4.20% due 11/03/2035 | 350,000 | 390,344 | 3.4% | ||||||||||||||
| 1,165,618 | 10.2% | |||||||||||||||||
| Utilities | ||||||||||||||||||
Entergy Louisiana | 5.40% due 11/01/2024 | 200,000 | 226,674 | 2.0% | ||||||||||||||
Florida Power & Light | 5.95% due 10/01/2033 | 100,000 | 129,280 | 1.1% | ||||||||||||||
Puget Sound Energy | 7.02% due 12/01/2027 | 237,000 | 301,838 | 2.7% | ||||||||||||||
| 657,792 | 5.8% | |||||||||||||||||
| Total Corporate Bonds | $6,533,937 | 57.2% | ||||||||||||||||
| Government Bonds – 26.3% | Coupon / Maturity | Face Amount | Market Value | Percentage of Assets | ||||||||||||||
| Foreign Government Bonds | ||||||||||||||||||
Quebec Canada Yankee | 7.125% due 02/09/2024 | $175,000 | $211,775 | 1.8% | ||||||||||||||
| 211,775 | 1.8% | |||||||||||||||||
| United States Treasury Bonds | ||||||||||||||||||
United States Treasury Bond | 5.25% due 02/15/2029 | 170,000 | 216,046 | 1.9% | ||||||||||||||
United States Treasury Bond | 6.125% due 08/15/2029 | 225,000 | 306,642 | 2.7% | ||||||||||||||
United States Treasury Bond | 6.25% due 05/15/2030 | 75,000 | 104,748 | 0.9% | ||||||||||||||
United States Treasury Bond | 5.375% due 02/15/2031 | 400,000 | 531,344 | 4.7% | ||||||||||||||
United States Treasury Bond | 3.125% due 11/15/2041 | 145,000 | 160,451 | 1.4% | ||||||||||||||
United States Treasury Bond | 3.375% due 11/15/2048 | 60,000 | 69,867 | 0.6% | ||||||||||||||
| 1,389,098 | 12.2% | |||||||||||||||||
| United States Treasury Notes | ||||||||||||||||||
United States Treasury Note | 3.625% due 02/15/2021 | 1,040,000 | 1,067,787 | 9.4% | ||||||||||||||
United States Treasury Note | 2.125% due 06/30/2021 | 330,000 | 331,212 | 2.9% | ||||||||||||||
| 1,398,999 | 12.3% | |||||||||||||||||
| Total Government Bonds | $2,999,872 | 26.3% | ||||||||||||||||
Continued on next page.
| The accompanying notes are an integral part of these financial statements. | Semi-Annual Report | May 31, 2019 | 15 | |||||
| Sextant Bond Income Fund | |
| Schedule of Investments | As of May 31, 2019 | |||||||||||||||||
| Municipal Bonds – 11.7% | Coupon / Maturity | Face Amount | Market Value | Percentage of Assets | ||||||||||||||
| General Obligation | ||||||||||||||||||
Blaine Co. ID SCD #61 Hailey | 5.25% due 08/01/2020 | $250,000 | $258,310 | 2.3% | ||||||||||||||
Idaho Hsg & Fin GARVEE BABA-2 | 5.379% due 07/15/2020 | 180,000 | 185,137 | 1.6% | ||||||||||||||
San Marcos Texas ULTD GO BAB | 6.028% due 08/15/2030 | 200,000 | 208,298 | 1.8% | ||||||||||||||
Springville UT GO BAB | 5.30% due 05/01/2031 | 240,000 | 246,262 | 2.2% | ||||||||||||||
| 898,007 | 7.9% | |||||||||||||||||
| Municipal Leases | ||||||||||||||||||
Johnson Co KS Bldg Ls/Pr RevBAB | 4.60% due 09/01/2026 | 250,000 | 255,042 | 2.2% | ||||||||||||||
Oklahoma City Fin Auth Ed Lease Rev | 6.60% due 09/01/2022 | 160,000 | 179,946 | 1.6% | ||||||||||||||
| 434,988 | 3.8% | |||||||||||||||||
| Total Municipal Bonds | $1,332,995 | 11.7% | ||||||||||||||||
| Total investments | (Cost = $10,482,444) | $10,866,804 | 95.2% | |||||||||||||||
| Other assets (net of liabilities) | 547,186 | 4.8% | ||||||||||||||||
| Total net assets | $11,413,990 | 100.0% | ||||||||||||||||
Bond Quality Diversification |
| |||||||||||
| % of Total Net Assets | ||||||||||||
Rated “AAA” | 32.5% | ∎ |  | |||||||||
Rated “AA+” | 3.4% | ∎ | ||||||||||
Rated “AA” | 8.9% | ∎ | ||||||||||
Rated“AA-” | 4.4% | ∎ | ||||||||||
Rated “A+” | 8.8% | ∎ | ||||||||||
Rated “A” | 14.6% | ∎ | ||||||||||
Rated“A-” | 8.2% | ∎ | ||||||||||
Rated “BBB+” | 9.8% | ∎ | ||||||||||
Rated “BBB” | 2.5% | ∎ | ||||||||||
Rated “BB” | 2.1% | ∎ | ||||||||||
Other assets (net of liabilities) | 4.8% | ∎ | ||||||||||
Credit ratings are the lesser of S&P Global Ratings or Moody’s Investors Service. If neither S&P nor Moody’s rate a particular security, that security is categorized as not rated (except for US Treasury securities and securities issued or backed by US agencies which inherit the credit rating for the US government). Ratings range from AAA (highest) to D (lowest). Bonds rated BBB or above are considered investment grade. Credit ratings BB and below are lower-rated securities (junk bonds). Ratings apply to the creditworthiness of the issuers of the underlying securities and not the Fund or its shares. Ratings may be subject to change. |
| |||||||||||
| 16 | May 31, 2019 | Semi-Annual Report | The accompanying notes are an integral part of these financial statements. | |||||
| Sextant Bond Income Fund | |
Statement of Assets and Liabilities
| As of May 31, 2019 |
| |||
| ||||
Assets | ||||
Investments in securities, at value | $10,866,804 | |||
Cash | 822,057 | |||
Interest receivable | 126,640 | |||
Prepaid expenses | 4,872 | |||
Receivable for Fund shares sold | 1,581 | |||
Insurance reserve premium | 401 | |||
Total assets | 11,822,355 | |||
Liabilities | ||||
Payable for security purchases | 402,848 | |||
Accrued advisory fees | 3,769 | |||
Accrued retirement plan custodial fees | 1,207 | |||
Accrued Chief Compliance Officer expenses | 274 | |||
Distributions Payable | 262 | |||
Payable for Fund shares redeemed | 5 | |||
Total liabilities | 408,365 | |||
Net assets | $11,413,990 | |||
Analysis of net assets | ||||
Paid-in capital (unlimited shares authorized, without par value) | $11,068,221 | |||
Total distributable earnings | 345,769 | |||
Net assets applicable to Fund shares outstanding | $11,413,990 | |||
Fund shares outstanding | 2,213,616 | |||
Net asset value, offering, and redemption price per share | $5.16 | |||
Statement of Operations
| Period ended May 31, 2019 |
| |||||||
| ||||||||
Investment income | ||||||||
Interest income | $196,105 | |||||||
Total investment income | 196,105 | |||||||
Expenses | ||||||||
Investment adviser fees | 29,853 | |||||||
Filing and registration fees | 6,333 | |||||||
Audit fees | 3,187 | |||||||
Retirement plan custodial fees | 1,444 | |||||||
Chief Compliance Officer expenses | 1,251 | |||||||
Trustee fees | 1,222 | |||||||
Printing and postage | 1,055 | |||||||
Other expenses | 798 | |||||||
Legal fees | 309 | |||||||
Custodian fees | 229 | |||||||
Total gross expenses | 45,681 | |||||||
Less adviser fees waived | (11,351 | ) | ||||||
Less custodian fee credits | (188 | ) | ||||||
Net expenses | 34,142 | |||||||
Net investment income | $161,963 | |||||||
Net realized gain from investments | $7,550 | |||||||
Net increase in unrealized appreciation on investments | 566,126 | |||||||
Net gain on investments | $573,676 | |||||||
Net increase in net assets resulting from operations | $735,639 | |||||||
| The accompanying notes are an integral part of these financial statements. | Semi-Annual Report | May 31, 2019 | 17 | |||||
| Sextant Bond Income Fund | |
Statements of Changes in Net Assets | Period ended May 31, 2019 | Year ended November 30, 2018 | ||||||
Increase in net assets from operations | ||||||||
From operations | ||||||||
Net investment income | $161,963 | $309,853 | ||||||
Net realized loss on Investments | 7,550 | - | ||||||
Net increase (decrease) in unrealized appreciation | 566,126 | (480,051 | ) | |||||
Net increase (decrease) in net assets | 735,639 | (170,198 | ) | |||||
Distributions to shareowners | (161,963 | ) | (309,851 | ) | ||||
Capital share transactions | ||||||||
Proceeds from sales of shares | 1,004,887 | 3,232,820 | ||||||
Value of shares issued in reinvestment of dividends | 160,372 | 306,251 | ||||||
Cost of shares redeemed | (1,257,984 | ) | (1,621,814 | ) | ||||
Total capital share transactions | (92,725 | ) | 1,917,257 | |||||
Total increase in net assets | 480,951 | 1,437,208 | ||||||
Net assets | ||||||||
Beginning of period | 10,933,039 | 9,495,831 | ||||||
End of period | $11,413,990 | $10,933,039 | ||||||
Shares of the Fund sold and redeemed | ||||||||
Number of shares sold | 198,954 | 650,577 | ||||||
Number of shares issued in reinvestment of dividends | 31,793 | 61,384 | ||||||
Number of shares redeemed | (253,001 | ) | (322,372 | ) | ||||
Net increase (decrease) in number of shares outstanding | (22,254 | ) | 389,589 | |||||
Financial Highlights | For period ended | For year ended November 30, | ||||||||||||||||||||||
Selected data per share of outstanding capital stock throughout each period: | May 31, 2019 | 2018 | 2017 | 2016 | 2015 | 2014 | ||||||||||||||||||
| �� | ||||||||||||||||||||||||
Net asset value at beginning of period | $4.89 | $5.14 | $5.07 | $5.07 | $5.26 | $5.05 | ||||||||||||||||||
Income from investment operations | ||||||||||||||||||||||||
Net investment income | 0.08 | 0.16 | 0.16 | 0.15 | 0.17 | 0.16 | ||||||||||||||||||
Net gains (losses) on securities (both realized and unrealized) | 0.27 | (0.25 | ) | 0.07 | 0.00 | A | (0.19 | ) | 0.21 | |||||||||||||||
Total from investment operations | 0.35 | (0.09 | ) | 0.23 | 0.15 | (0.02 | ) | 0.37 | ||||||||||||||||
Less distributions | ||||||||||||||||||||||||
Dividends (from net investment income) | (0.08 | ) | (0.16 | ) | (0.16 | ) | (0.15 | ) | (0.17 | ) | (0.16 | ) | ||||||||||||
Total distributions | (0.08 | ) | (0.16 | ) | (0.16 | ) | (0.15 | ) | (0.17 | ) | (0.16 | ) | ||||||||||||
Net asset value at end of period | $5.16 | $4.89 | $5.14 | $5.07 | $5.07 | $5.26 | ||||||||||||||||||
Total returnB | 7.12% | (1.78 | )% | 4.51% | 2.91% | (0.47 | )% | 7.40% | ||||||||||||||||
Ratios / supplemental data | ||||||||||||||||||||||||
Net assets ($000), end of period | $11,414 | $10,933 | $9,496 | $9,703 | $7,998 | $7,967 | ||||||||||||||||||
Ratio of expenses to average net assets | ||||||||||||||||||||||||
Before fee waivers and custodian fee creditsC | 0.86% | 0.84% | 0.98% | 1.01% | 1.03% | 1.27% | ||||||||||||||||||
After fee waiversC | 0.64% | 0.66% | 0.78% | 0.89% | 0.90% | 0.91% | ||||||||||||||||||
After fee waivers and custodian fee creditsC | 0.64% | 0.65% | 0.78% | 0.88% | 0.90% | 0.90% | ||||||||||||||||||
Ratio of net investment income after fee waivers and custodian fee credits to average net assetsC | 3.04% | 3.20% | 3.05% | 2.85% | 3.21% | 3.07% | ||||||||||||||||||
Portfolio turnover rateB | 7% | 0% | 4% | 11% | 4% | 13% | ||||||||||||||||||
| A | Amount is less than $0.01 |
| B | Not Annualized |
| C | Annualized |
| 18 | May 31, 2019 | Semi-Annual Report | The accompanying notes are an integral part of these financial statements. | |||||
| Sextant Core Fund |  |
Performance Summary | ||||||||
Average Annual Total Returns as of May 31, 2019 |
| |||||||||||||||
| 1 Year | 5 Year | 10 Year | Expense Ratio1 | |||||||||||||
Sextant Core Fund | 4.23% | 3.47% | 6.37% | 0.88% | ||||||||||||
Dow Jones Moderate US Portfolio Index | 0.97% | 4.80% | 8.27% | n/a | ||||||||||||
Growth of $10,000
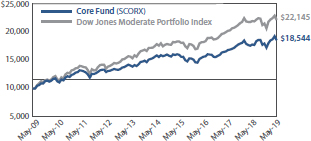 | Comparison of any mutual fund to a market index must be made bearing in mind that the index is expense-free. Conversely, the fund will (1) be actively managed; (2) have an objective other than mirroring the index, such as limiting risk; (3) bear transaction and other costs; (4) stand ready to buy and sell its securities to shareowners on a daily basis; and (5) provide a wide range of services. The graph compares $10,000 invested in the Fund on November 30, 2008, to an identical amount invested in the Dow Jones Moderate US Portfolio Index, a broad-based index of stock and bond prices. The graph shows that an investment in the Fund would have risen to $18,544 versus $22,145 in the index. |
Past performance does not guarantee future results. The “Growth of $10,000” graph and “Average Annual Returns” performance table assume the reinvestment of dividends and capital gains. They do not reflect the deduction of taxes that a shareowner might pay on fund distributions or the redemption of fund shares.
| 1�� | By regulation, the expense ratio shown in this table is as stated in the Fund’s most recent prospectus, which is dated March 27, 2019, and incorporates results for the fiscal year ended November 30, 2018. The ratio presented in this table differs from expense ratios shown elsewhere in this report as they represent different periods. |
Fund Objective
The objectives of the Core Fund are long-term appreciation and capital preservation.
Portfolio Diversification | ||||||||
| % of Total Net Assets | ||||||||
Sectors | Equity | Fixed Income | ||||||
Technology | 13.7% | 2.2% | ||||||
Government Bonds | n/a | 14.1% | ||||||
Health Care | 10.5% | 3.5% | ||||||
Financials | 7.9% | 5.1% | ||||||
Industrials | 5.8% | 5.0% | ||||||
Consumer Discretionary | 7.0% | 2.5% | ||||||
Consumer Staples | 4.6% | n/a | ||||||
Materials | 3.7% | 0.7% | ||||||
Communications | 1.8% | 1.3% | ||||||
Municipal Bonds | n/a | 3.1% | ||||||
Energy | 2.4% | n/a | ||||||
Utilities | 1.4% | n/a | ||||||
Total | 58.8% | 37.5% | ||||||
Top 10 Holdings | ||||
| % of Total Net Assets | ||||
US Treasury Bond(6.25% due 08/15/2023) | 3.6% | |||
Welltower(4.25% due 04/15/2028) | 2.6% | |||
United States Treasury Note(2.75% due 11/15/2023) | 2.5% | |||
Gilead Sciences(3.70% due 04/01/2024) | 1.8% | |||
Boeing(5.875% due 02/15/2040) | 1.8% | |||
United States Treasury Note(2.00% due 11/30/2022) | 1.8% | |||
Lowe’s(4.25% due 09/15/2044) | 1.7% | |||
Union Pacific Corp(3.375% due 02/01/2035) | 1.7% | |||
Toronto-Dominion Bank | 1.6% | |||
Qualcomm(3.25% due 05/20/2027) | 1.5% | |||
Asset Allocation | ||||||||||||
| % of Total Net Assets | ||||||||||||
Equity Securities | 58.8% | ∎ |
|
|
| |||||||
Fixed Income Securities | 37.5% | ∎ | ||||||||||
Other assets (net of liabilities) | 3.7% | ∎ | ||||||||||

| Semi-Annual Report | May 31, 2019 | 19 | ||||
| Sextant Core Fund | |
| Schedule of Investments | As of May 31, 2019 | |||||||||||||||||||||
| Common Stocks – 58.8% | Number of Shares | Cost | Market Value | Country1 | Percentage of Assets | |||||||||||||||||
| Communications | ||||||||||||||||||||||
| Internet Media | ||||||||||||||||||||||
Alphabet, Class A2 | 100 | $77,588 | $110,650 | United States | 0.8% | |||||||||||||||||
| Telecom Carriers | ||||||||||||||||||||||
BCE | 3,300 | 140,233 | 148,599 | Canada | 1.0% | |||||||||||||||||
| 217,821 | 259,249 | 1.8% | ||||||||||||||||||||
| Consumer Discretionary | ||||||||||||||||||||||
| Apparel, Footwear & Accessory Design | ||||||||||||||||||||||
VF | 1,600 | 86,484 | 131,008 | United States | 0.9% | |||||||||||||||||
| Auto Parts | ||||||||||||||||||||||
Garrett Motion2 | 4,100 | 47,582 | 63,058 | United States | 0.4% | |||||||||||||||||
| Automobiles | ||||||||||||||||||||||
Subaru ADR | 11,700 | 130,741 | 134,901 | Japan | 1.0% | |||||||||||||||||
| Home Products Stores | ||||||||||||||||||||||
Home Depot | 600 | 114,158 | 113,910 | United States | 0.8% | |||||||||||||||||
Lowe’s | 1,400 | 86,638 | 130,592 | United States | 0.9% | |||||||||||||||||
| 200,796 | 244,502 | 1.7% | ||||||||||||||||||||
| Specialty Apparel Stores | ||||||||||||||||||||||
Industria de Diseno Textil | 12,000 | 152,848 | 159,480 | Spain | 1.1% | |||||||||||||||||
Ross Stores | 1,750 | 125,298 | 162,733 | United States | 1.1% | |||||||||||||||||
TJX Companies | 2,200 | 109,838 | 110,638 | United States | 0.8% | |||||||||||||||||
| 387,984 | 432,851 | 3.0% | ||||||||||||||||||||
| 853,587 | 1,006,320 | 7.0% | ||||||||||||||||||||
| Consumer Staples | ||||||||||||||||||||||
| Beverages | ||||||||||||||||||||||
PepsiCo | 1,350 | 139,207 | 172,800 | United States | 1.2% | |||||||||||||||||
| Household Products | ||||||||||||||||||||||
Procter & Gamble | 1,150 | 93,040 | 118,347 | United States | 0.8% | |||||||||||||||||
Unilever ADR | 2,900 | 132,633 | 176,639 | United Kingdom | 1.3% | |||||||||||||||||
| 225,673 | 294,986 | 2.1% | ||||||||||||||||||||
| Packaged Food | ||||||||||||||||||||||
Nestle ADR | 1,900 | 147,925 | 188,404 | Switzerland | 1.3% | |||||||||||||||||
| 512,805 | 656,190 | 4.6% | ||||||||||||||||||||
Continued on next page.
| 20 | May 31, 2019 | Semi-Annual Report | The accompanying notes are an integral part of these financial statements. | |||||
| Sextant Core Fund | |
| Schedule of Investments | As of May 31, 2019 | |||||||||||||||||||||
| Common Stocks – 58.8% | Number of Shares | Cost | Market Value | Country1 | Percentage of Assets | |||||||||||||||||
| Energy | ||||||||||||||||||||||
| Exploration & Production | ||||||||||||||||||||||
ConocoPhillips | 1,490 | $71,757 | $87,850 | United States | 0.6% | |||||||||||||||||
| Integrated Oils | ||||||||||||||||||||||
Equinor ADR | 6,500 | $113,335 | $124,475 | Norway | 0.9% | |||||||||||||||||
Total ADR | 2,582 | 138,694 | 132,973 | France | 0.9% | |||||||||||||||||
| 252,029 | 257,448 | 1.8% | ||||||||||||||||||||
| 323,786 | 345,298 | 2.4% | ||||||||||||||||||||
| Financials | ||||||||||||||||||||||
| Banks | ||||||||||||||||||||||
PNC Financial Services Group | 1,690 | 129,314 | 215,070 | United States | 1.5% | |||||||||||||||||
Toronto-Dominion Bank | 4,165 | 175,741 | 227,617 | Canada | 1.6% | |||||||||||||||||
| 305,055 | 442,687 | 3.1% | ||||||||||||||||||||
| Consumer Finance | ||||||||||||||||||||||
Ally Financial | 7,100 | 147,875 | 204,977 | United States | 1.4% | |||||||||||||||||
| Diversified Banks | ||||||||||||||||||||||
Citigroup | 1,900 | 138,144 | 118,085 | United States | 0.8% | |||||||||||||||||
JP Morgan Chase | 1,850 | 164,687 | 196,026 | United States | 1.4% | |||||||||||||||||
| 302,831 | 314,111 | 2.2% | ||||||||||||||||||||
| P&C Insurance | ||||||||||||||||||||||
Chubb | 1,130 | 151,600 | 165,059 | Switzerland | 1.2% | |||||||||||||||||
| 907,361 | 1,126,834 | 7.9% | ||||||||||||||||||||
| Health Care | ||||||||||||||||||||||
| Biotech | ||||||||||||||||||||||
Amgen | 1,100 | 179,932 | 183,370 | United States | 1.3% | |||||||||||||||||
| Large Pharma | ||||||||||||||||||||||
Bristol-Myers Squibb | 3,300 | 168,719 | 149,721 | United States | 1.0% | |||||||||||||||||
GlaxoSmithKline ADR | 3,400 | 139,166 | 131,376 | United Kingdom | 0.9% | |||||||||||||||||
Johnson & Johnson | 1,600 | 142,381 | 209,840 | United States | 1.5% | |||||||||||||||||
Novo Nordisk ADR | 1,850 | 48,138 | 87,320 | Denmark | 0.6% | |||||||||||||||||
Pfizer | 4,700 | 157,335 | 195,144 | United States | 1.4% | |||||||||||||||||
| 655,739 | 773,401 | 5.4% | ||||||||||||||||||||
| Managed Care | ||||||||||||||||||||||
UnitedHealth Group | 800 | 189,963 | 193,440 | United States | 1.4% | |||||||||||||||||
| Medical Devices | ||||||||||||||||||||||
Abbott Laboratories | 2,700 | 97,630 | 205,551 | United States | 1.4% | |||||||||||||||||
| Medical Equipment | ||||||||||||||||||||||
Koninklijke Philips ADR | 3,800 | 137,793 | 150,556 | Netherlands | 1.0% | |||||||||||||||||
| 1,261,057 | 1,506,318 | 10.5% | ||||||||||||||||||||
Continued on next page.
| The accompanying notes are an integral part of these financial statements. | Semi-Annual Report | May 31, 2019 | 21 | |||||
| Sextant Core Fund | |
| Schedule of Investments | As of May 31, 2019 | |||||||||||||||||||||
| Common Stocks – 58.8% | Number of Shares | Cost | Market Value | Country1 | Percentage of Assets | |||||||||||||||||
| Industrials | ||||||||||||||||||||||
| Commercial & Residential Building Equipment & Systems | ||||||||||||||||||||||
Honeywell International | 1,000 | $49,532 | $164,310 | United States | 1.2% | |||||||||||||||||
Johnson Controls International | 3,450 | 125,504 | 132,894 | United States | 0.9% | |||||||||||||||||
| 175,036 | 297,204 | 2.1% | ||||||||||||||||||||
| Electrical Components | ||||||||||||||||||||||
Sensata Technologies Holding2 | 2,870 | 120,959 | 122,520 | United States | 0.8% | |||||||||||||||||
| Flow Control Equipment | ||||||||||||||||||||||
Parker Hannifin | 850 | 81,847 | 129,472 | United States | 0.9% | |||||||||||||||||
| Industrial Distribution & Rental | ||||||||||||||||||||||
Fastenal | 4,500 | 108,145 | 137,655 | United States | 1.0% | |||||||||||||||||
| Rail Freight | ||||||||||||||||||||||
Canadian National Railway | 1,600 | 49,410 | 141,744 | Canada | 1.0% | |||||||||||||||||
| 535,397 | 828,595 | 5.8% | ||||||||||||||||||||
| Materials | ||||||||||||||||||||||
| Basic & Diversified Chemicals | ||||||||||||||||||||||
Linde | 1,000 | 79,815 | 180,550 | Ireland | 1.3% | |||||||||||||||||
| Non Wood Building Materials | ||||||||||||||||||||||
Carlisle | 550 | 56,954 | 73,320 | United States | 0.5% | |||||||||||||||||
| Specialty Chemicals | ||||||||||||||||||||||
PPG Industries | 1,300 | 138,435 | 136,045 | United States | 1.0% | |||||||||||||||||
RPM International | 2,400 | 67,251 | 128,448 | United States | 0.9% | |||||||||||||||||
| 205,686 | 264,493 | 1.9% | ||||||||||||||||||||
| 342,455 | 518,363 | 3.7% | ||||||||||||||||||||
Continued on next page.
| 22 | May 31, 2019 | Semi-Annual Report | The accompanying notes are an integral part of these financial statements. | |||||
| Sextant Core Fund | |
| Schedule of Investments | As of May 31, 2019 | |||||||||||||||||||||
| Common Stocks – 58.8% | Number of Shares | Cost | Market Value | Country1 | Percentage of Assets | |||||||||||||||||
| Technology | ||||||||||||||||||||||
| Application Software | ||||||||||||||||||||||
Open Text Corp ADR | 3,900 | $146,122 | $154,908 | Canada | 1.1% | |||||||||||||||||
| Communications Equipment | ||||||||||||||||||||||
Apple | 900 | 85,044 | 157,563 | United States | 1.1% | |||||||||||||||||
| Computer Hardware & Storage | ||||||||||||||||||||||
HP | 3,300 | 49,083 | 61,644 | United States | 0.4% | |||||||||||||||||
| Infrastructure Software | ||||||||||||||||||||||
Micro Focus International | 6,304 | 96,708 | 151,107 | United Kingdom | 1.0% | |||||||||||||||||
Microsoft | 900 | 112,498 | 111,312 | United States | 0.8% | |||||||||||||||||
Oracle | 3,100 | 124,402 | 156,860 | United States | 1.1% | |||||||||||||||||
| 333,608 | 419,279 | 2.9% | ||||||||||||||||||||
| IT Services | ||||||||||||||||||||||
Amdocs Limited | 3,000 | 196,205 | 178,260 | United States | 1.3% | |||||||||||||||||
| Semiconductor Devices | ||||||||||||||||||||||
Infineon Technologies ADR | 3,275 | 59,576 | 58,197 | Germany | 0.4% | |||||||||||||||||
Intel | 3,200 | 117,841 | 140,928 | United States | 1.0% | |||||||||||||||||
Microchip Technology | 1,200 | 90,091 | 96,036 | United States | 0.7% | |||||||||||||||||
Micron Technology2 | 2,100 | 82,354 | 68,481 | United States | 0.5% | |||||||||||||||||
NXP Semiconductors | 1,200 | 87,444 | 105,792 | Netherlands | 0.7% | |||||||||||||||||
Qualcomm | 1,900 | 106,927 | 126,958 | United States | 0.9% | |||||||||||||||||
Xilinx | 1,700 | 68,621 | 173,927 | United States | 1.2% | |||||||||||||||||
| 612,854 | 770,319 | 5.4% | ||||||||||||||||||||
| Semiconductor Manufacturing | ||||||||||||||||||||||
Applied Materials | 2,200 | 81,912 | 85,118 | United States | 0.6% | |||||||||||||||||
Taiwan Semiconductor ADR | 3,500 | 37,159 | 134,225 | Taiwan | 0.9% | |||||||||||||||||
| 119,071 | 219,343 | 1.5% | ||||||||||||||||||||
| 1,541,987 | 1,961,316 | 13.7% | ||||||||||||||||||||
| Utilities | ||||||||||||||||||||||
| Integrated Utilities | ||||||||||||||||||||||
NextEra Energy | 1,000 | 72,153 | 198,210 | United States | 1.4% | |||||||||||||||||
| 72,153 | 198,210 | 1.4% | ||||||||||||||||||||
| Total Common Stocks | $6,568,409 | $8,406,693 | 58.8% | |||||||||||||||||||
Continued on next page.
| The accompanying notes are an integral part of these financial statements. | Semi-Annual Report | May 31, 2019 | 23 | |||||
| Sextant Core Fund | |
| Schedule of Investments | As of May 31, 2019 | |||||||||||||||||
| Corporate Bonds – 20.3% | Coupon / Maturity | Face Amount | Market Value | Percentage of Assets | ||||||||||||||
| Communications | ||||||||||||||||||
Bellsouth Capital Funding | 7.875% due 02/15/2030 | $150,000 | $187,157 | 1.3% | ||||||||||||||
| 187,157 | 1.3% | |||||||||||||||||
| Consumer Discretionary | ||||||||||||||||||
Lowe’s | 4.25% due 09/15/2044 | 250,000 | 244,181 | 1.7% | ||||||||||||||
Stanford University | 4.013% due 05/01/2042 | 100,000 | 110,341 | 0.8% | ||||||||||||||
| 354,522 | 2.5% | |||||||||||||||||
| Financials | ||||||||||||||||||
General Electric Capital | 5.35% due 04/15/2022 | 101,000 | 106,403 | 0.7% | ||||||||||||||
HSBC Holdings | 4.25% due 03/14/2024 | 150,000 | 154,969 | 1.1% | ||||||||||||||
PartnerRe FinanceB | 5.50% due 06/01/2020 | 100,000 | 102,672 | 0.7% | ||||||||||||||
Welltower | 4.25% due 04/15/2028 | 350,000 | 368,569 | 2.6% | ||||||||||||||
| 732,613 | 5.1% | |||||||||||||||||
| Health Care | ||||||||||||||||||
Becton Dickinson | 3.125% due 11/08/2021 | 100,000 | 100,840 | 0.7% | ||||||||||||||
Celgene | 2.875% due 08/15/2020 | 140,000 | 140,702 | 1.0% | ||||||||||||||
Gilead Sciences | 3.70% due 04/01/2024 | 250,000 | 260,411 | 1.8% | ||||||||||||||
| 501,953 | 3.5% | |||||||||||||||||
| Industrials | ||||||||||||||||||
Boeing | 5.875% due 02/15/2040 | 200,000 | 255,682 | 1.8% | ||||||||||||||
Legrand France Yankee | 8.50% due 02/15/2025 | 170,000 | 213,353 | 1.5% | ||||||||||||||
Union Pacific | 3.375% due 02/01/2035 | 250,000 | 239,520 | 1.7% | ||||||||||||||
| 708,555 | 5.0% | |||||||||||||||||
| Materials | ||||||||||||||||||
Air Products & Chemicals | 4.375% due 08/21/2019 | 100,000 | 100,357 | 0.7% | ||||||||||||||
| 100,357 | 0.7% | |||||||||||||||||
| Technology | ||||||||||||||||||
Cisco Systems | 2.90% due 03/04/2021 | 100,000 | 100,747 | 0.7% | ||||||||||||||
Qualcomm | 3.25% due 05/20/2027 | 220,000 | 219,625 | 1.5% | ||||||||||||||
| 320,372 | 2.2% | |||||||||||||||||
| Total Corporate Bonds | $2,905,529 | 20.3% | ||||||||||||||||
Continued on next page.
| 24 | May 31, 2019 | Semi-Annual Report | The accompanying notes are an integral part of these financial statements. | |||||
| Sextant Core Fund | |
| Schedule of Investments | As of May 31, 2019 | |||||||||||||||||
| Government Bonds – 14.1% | Coupon / Maturity | Face Amount | Market Value | Percentage of Assets | ||||||||||||||
| United States Treasury Bonds | ||||||||||||||||||
United States Treasury Bond | 6.25% due 08/15/2023 | $438,000 | $513,949 | 3.6% | ||||||||||||||
United States Treasury Bond | 4.50% due 02/15/2036 | 137,000 | 178,619 | 1.2% | ||||||||||||||
United States Treasury Bond | 3.625% due 02/15/2044 | 155,000 | 185,401 | 1.3% | ||||||||||||||
| 877,969 | 6.1% | |||||||||||||||||
| United States Treasury Notes | ||||||||||||||||||
United States Treasury Note | 1.50% due 06/15/2020 | 150,000 | 148,887 | 1.0% | ||||||||||||||
United States Treasury Note | 2.125% due 08/31/2020 | 204,000 | 203,984 | 1.4% | ||||||||||||||
United States Treasury Note | 2.00% due 11/30/2022 | 250,000 | 250,703 | 1.8% | ||||||||||||||
United States Treasury Note | 1.625% due 04/30/2023 | 106,000 | 104,803 | 0.7% | ||||||||||||||
United States Treasury Note | 2.75% due 11/15/2023 | 350,000 | 361,990 | 2.5% | ||||||||||||||
United States Treasury Note | 2.00% due 05/31/2024 | 80,000 | 80,266 | 0.6% | ||||||||||||||
| 1,150,633 | 8.0% | |||||||||||||||||
| Total Government Bonds | $2,028,602 | 14.1% | ||||||||||||||||
| Municipal Bonds – 3.1% | Coupon / Maturity | Face Amount | Market Value | Percentage of Assets | ||||||||||||||
| General Obligation | ||||||||||||||||||
Lake Washington SD 414 WA BAB | 4.906% due 12/01/2027 | $100,000 | $102,834 | 0.7% | ||||||||||||||
Skagit SD #1 | 4.613% due 12/01/2022 | 100,000 | 104,084 | 0.8% | ||||||||||||||
| 206,918 | 1.5% | |||||||||||||||||
| State Education | ||||||||||||||||||
New York City Housing Dev | 2.65% due 05/01/2021 | 100,000 | 100,545 | 0.7% | ||||||||||||||
| 100,545 | 0.7% | |||||||||||||||||
| Utility Networks | ||||||||||||||||||
Tacoma WA Elec Sys Revenue | 5.966% due 01/01/2035 | 100,000 | 130,575 | 0.9% | ||||||||||||||
| 130,575 | 0.9% | |||||||||||||||||
| Total Municipal Bonds | $438,038 | 3.1% | ||||||||||||||||
| Total investments | (Cost = $11,823,509) | 13,778,862 | 96.3% | |||||||||||||||
| Other assets (net of liabilities) | 522,072 | 3.7% | ||||||||||||||||
| Total net assets | $14,300,934 | 100.0% | ||||||||||||||||
| 1 | Country of domicile |
| 2 | Non-income producing security |
ADR: American Depositary Receipt
| The accompanying notes are an integral part of these financial statements. | Semi-Annual Report | May 31, 2019 | 25 | |||||
| Sextant Core Fund | |
Statement of Assets and Liabilities |
| |||
As of May 31, 2019 |
| |||
| ||||
Assets | ||||
Investments in securities, at value | $13,778,862 | |||
Cash | 435,057 | |||
Dividends and interest receivable | 80,555 | |||
Receivable for Fund shares sold | 11,221 | |||
Prepaid expenses | 5,058 | |||
Total assets | 14,310,753 | |||
Liabilities | ||||
Accrued advisory fees | 6,160 | |||
Accrued retirement plan custodial fees | 1,127 | |||
Accrued audit expenses | 754 | |||
Accrued trustee expenses | 566 | |||
Accrued Chief Compliance Officer expenses | 470 | |||
Accrued printing expenses | 390 | |||
Accrued other expenses | 352 | |||
Total liabilities | 9,819 | |||
Net assets | $14,300,934 | |||
Analysis of net assets | ||||
Paid-in capital (unlimited shares authorized, without par value) | $12,059,617 | |||
Total distributable earnings | 2,241,317 | |||
Net assets applicable to Fund shares outstanding | $14,300,934 | |||
Fund shares outstanding | 1,094,852 | |||
Net asset value, offering, and redemption price per share | $13.06 | |||
Statement of Operations
| Period ended May 31, 2019 |
| |||
| ||||
Investment income | ||||
Dividends (net of foreign tax of $8,081) | $104,060 | |||
Interest income | 77,146 | |||
Total investment income | 181,206 | |||
Expenses | ||||
Investment adviser fees | 39,802 | |||
Filing and registration fees | 9,258 | |||
Audit fees | 3,688 | |||
Chief Compliance Officer expenses | 1,672 | |||
Retirement plan custodial fees | 1,479 | |||
Trustee fees | 1,332 | |||
Printing and postage | 1,079 | |||
Other expenses | 690 | |||
Legal fees | 382 | |||
Custodian fees | 292 | |||
Total gross expenses | 59,674 | |||
Less custodian fee credits | (244 | ) | ||
Net expenses | 59,430 | |||
Net investment income | $121,776 | |||
| ||||
Net realized gain from investments and foreign currency | $192,138 | |||
Net increase in unrealized appreciation on investments and foreign currency | 132,495 | |||
Net gain on investments | $324,633 | |||
Net increase in net assets resulting from operations | $446,409 | |||
| 26 | May 31, 2019 | Semi-Annual Report | The accompanying notes are an integral part of these financial statements. | |||||
| Sextant Core Fund | |
Statements of Changes in Net Assets | Period ended May 31, 2019 | Year ended Nov. 30, 2018 | ||||||
Increase (decrease) in net assets from operations | ||||||||
From operations | ||||||||
Net investment income | $121,776 | $175,436 | ||||||
Net realized gain on investment | 192,138 | 145,000 | ||||||
Net increase (decrease) in unrealized appreciation | 132,495 | (280,915 | ) | |||||
Net increase in net assets | 446,409 | 39,521 | ||||||
Distributions to shareowners | (179,879 | ) | (166,943 | ) | ||||
Capital share transactions |
| |||||||
Proceeds from sales of shares | 1,759,866 | 2,728,274 | ||||||
Value of shares issued in reinvestment of dividends | 179,879 | 166,943 | ||||||
Cost of shares redeemed | (756,636 | ) | (2,896,024 | ) | ||||
Total capital share transactions | 1,183,109 | (807 | ) | |||||
Total increase (decrease) in net assets | 1,449,639 | (128,229 | ) | |||||
Net assets | ||||||||
Beginning of period | 12,851,295 | 12,979,524 | ||||||
End of period | $14,300,934 | $12,851,295 | ||||||
Shares of the Fund sold and redeemed | ||||||||
Number of shares sold | 137,620 | 211,487 | ||||||
Number of shares issued in reinvestment of dividends | 14,891 | 12,931 | ||||||
Number of shares redeemed | (58,924 | ) | (222,368 | ) | ||||
Net increase in number of shares outstanding | 93,587 | 2,050 | ||||||
Financial Highlights | For period ended | For year ended November 30, | ||||||||||||||||||||||
Selected data per share of outstanding capital stock throughout each period: | May 31, 2019 | 2018 | 2017 | 2016 | 2015 | 2014 | ||||||||||||||||||
Net asset value at beginning of period | $12.84 | $12.99 | $11.45 | $11.25 | $12.43 | $11.78 | ||||||||||||||||||
Income from investment operations | ||||||||||||||||||||||||
Net investment income | 0.11 | 0.18 | 0.16 | 0.18 | 0.18 | 0.21 | ||||||||||||||||||
Net gains (losses) on securities (both realized and unrealized) | 0.25 | (0.16 | ) | 1.55 | 0.02 | (0.72 | ) | 0.78 | ||||||||||||||||
Total from investment operations | 0.36 | 0.02 | 1.71 | 0.20 | (0.54 | ) | 0.99 | |||||||||||||||||
Less distributions | ||||||||||||||||||||||||
Dividends (from net investment income) | (0.14 | ) | (0.17 | ) | (0.17 | ) | - | (0.18 | ) | (0.21 | ) | |||||||||||||
Distributions (from capital gains) | - | - | - | - | (0.46 | ) | (0.13 | ) | ||||||||||||||||
Total distributions | (0.14 | ) | (0.17 | ) | (0.17 | ) | - | (0.64 | ) | (0.34 | ) | |||||||||||||
Net asset value at end of period | $13.06 | $12.84 | $12.99 | $11.45 | $11.25 | $12.43 | ||||||||||||||||||
Total returnA | 3.25% | 0.16% | 15.15% | 1.78% | (4.38 | )% | 8.41% | |||||||||||||||||
Ratios / supplemental data | ||||||||||||||||||||||||
Net assets ($000), end of period | $14,301 | $12,851 | $12,980 | $8,563 | $8,435 | $8,656 | ||||||||||||||||||
Ratio of expenses to average net assets | ||||||||||||||||||||||||
Before custodian fee creditsB | 0.87% | 0.88% | 0.84% | 1.05% | 1.02% | 1.17% | ||||||||||||||||||
After custodian fee creditsB | 0.86% | 0.87% | 0.83% | 1.04% | 1.01% | 1.16% | ||||||||||||||||||
Ratio of net investment income after custodian fee credits to average net assetsB | 1.77% | 1.41% | 1.52% | 1.52% | 1.44% | 1.88% | ||||||||||||||||||
Portfolio turnover rateA | 11% | 30% | 34% | 39% | 24% | 14% | ||||||||||||||||||
| A | Not Annualized |
| B | Annualized |
| The accompanying notes are an integral part of these financial statements. | Semi-Annual Report | May 31, 2019 | 27 | |||||
| Sextant Global High Income Fund |  |
Performance Summary |
Average Annual Total Returns as of May 31, 2019 | ||||||||||||||||
| 1 Year | 5 Year | 10 Year | Expense Ratio1 | |||||||||||||
Sextant Global High Income Fund2 | 3.59% | 3.59% | n/a | 0.97% | ||||||||||||
S&P Global 1200 Index | 0.19% | 6.28% | 10.50% | n/a | ||||||||||||
Growth of $10,000
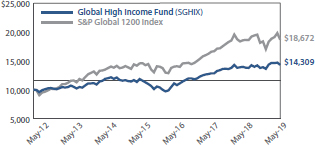 | Comparison of any mutual fund to a market index must be made bearing in mind that the index is expense-free. Conversely, the fund will (1) be actively managed; (2) have an objective other than mirroring the index, such as limiting risk; (3) bear transaction and other costs; (4) stand ready to buy and sell its securities to shareowners on a daily basis; and (5) provide a wide range of services. The graph compares $10,000 invested in the Fund on March 30, 2012 (the Fund’s inception), to an identical amount invested in the S&P Global 1200 Index, a global stock market index covering nearly 70% of the world’s equity markets. The graph shows that an investment in the Fund would have risen to $14,309 versus $18,672 in the index. |
Past performance does not guarantee future results.The “Growth of $10,000” graph and “Average Annual Returns” performance table assume the reinvestment of dividends and capital gains. They do not reflect the deduction of taxes that a shareowner might pay on fund distributions or the redemption of fund shares.
| 1 | By regulation, the expense ratio shown in this table is as stated in the Fund’s most recent prospectus, which is dated March 27, 2019, and incorporates results for the fiscal year ended November 30, 2018, before fee waivers. The expense ratio shown in the most recent prospectus after fee waivers was 0.75%. The ratio presented in this table differs from expense ratios shown elsewhere in this report as they represent different periods. |
| 2 | The Sextant Global High Income Fund began operations on March 30, 2012. |
Fund Objective
The objective of the Global High Income Fund is high income, with a secondary objective of capital preservation.
Portfolio Diversification | ||||||||
| % of Total Net Assets | ||||||||
Sectors | Equity | Fixed Income | ||||||
Government Bonds | n/a | 26.3% | ||||||
Financials | 4.0% | 8.7% | ||||||
Energy | 8.5% | 1.3% | ||||||
Technology | 8.5% | 1.1% | ||||||
Communications | 6.3% | 2.7% | ||||||
Materials | 4.3% | 2.6% | ||||||
Consumer Discretionary | 1.6% | 4.5% | ||||||
Industrials | 3.1% | 2.3% | ||||||
Health Care | 3.8% | n/a | ||||||
Municipal Bonds | n/a | 2.9% | ||||||
Consumer Staples | n/a | 2.1% | ||||||
Total | 40.1% | 54.5% | ||||||
Top 10 Holdings |
| |||||||
% of Total Net Assets | ||||||||
United States Treasury Bill(0.00% due 06/25/2019) | 10.0% | |||||||
United States Treasury Bond(6.125% due 11/15/2027) | 5.3% | |||||||
Mexico Bonos Desarrollo(6.50% due 06/10/2021) | 4.3% | |||||||
Microchip Technology | 2.9% | |||||||
Jefferies Group(5.125% due 01/20/2023) | 2.7% | |||||||
T-Mobile(6.50% due 01/15/2026) | 2.7% | |||||||
Royal Dutch Shell ADR, Class A | 2.4% | |||||||
Burlington Northern Santa Fe(5.05% due 03/01/2041) | 2.3% | |||||||
Applied Materials | 2.3% | |||||||
Equinor ADR | 2.3% | |||||||
Asset Allocation | ||||||||||||
| % of Total Net Assets | ||||||||||||
Equity Securities | 40.1% | ∎ |
|
|
| |||||||
Fixed Income Securities | 54.5% | ∎ | ||||||||||
Other assets (net of liabilities) | 5.4% | ∎ | ||||||||||

| 28 | May 31, 2019 | Semi-Annual Report | ||||
| Sextant Global High Income Fund | |
| Schedule of Investments | As of May 31, 2019 | |||||||||||||||||||||
| Common Stocks – 40.1% | Number of Shares | Cost | Market Value | Country1 | Percentage of Assets | |||||||||||||||||
| Communications | ||||||||||||||||||||||
| Telecom Carriers | ||||||||||||||||||||||
AT&T | 7,500 | $229,195 | $229,350 | United States | 2.3% | |||||||||||||||||
Orange ADR | 12,500 | 188,424 | 187,875 | France | 1.9% | |||||||||||||||||
SK Telecom ADR | 9,000 | 149,321 | 209,070 | Korea | 2.1% | |||||||||||||||||
| 566,940 | 626,295 | 6.3% | ||||||||||||||||||||
| Consumer Discretionary | ||||||||||||||||||||||
| Automobiles | ||||||||||||||||||||||
Subaru ADR | 13,601 | 157,273 | 156,820 | Japan | 1.6% | |||||||||||||||||
| 157,273 | 156,820 | 1.6% | ||||||||||||||||||||
| Consumer Discretionary | ||||||||||||||||||||||
| Exploration & Production | ||||||||||||||||||||||
CNOOC Limited ADR | 1,100 | 155,570 | 178,607 | China | 1.8% | |||||||||||||||||
Goodrich Petroleum2 | 200 | 2,314 | United States | 0.0% | 3 | |||||||||||||||||
| 155,570 | 180,921 | 1.8% | ||||||||||||||||||||
| Integrated Oils | ||||||||||||||||||||||
Equinor ADR | 12,000 | 218,810 | 229,800 | Norway | 2.3% | |||||||||||||||||
Royal Dutch Shell ADR, Class A | 3,800 | 241,426 | 234,878 | Netherlands | 2.4% | |||||||||||||||||
Total ADR | 3,800 | 202,606 | 195,700 | France | 2.0% | |||||||||||||||||
| 662,842 | 660,378 | 6.7% | ||||||||||||||||||||
| 818,412 | 841,299 | 8.5% | ||||||||||||||||||||
| Financials | ||||||||||||||||||||||
| Banks | ||||||||||||||||||||||
Skandinaviska Enskilda Banken, Class A | 20,000 | 198,047 | 176,856 | Sweden | 1.8% | |||||||||||||||||
| Diversified Banks | ||||||||||||||||||||||
Itau Unibanco Holding ADR, Class A | 25,000 | 144,759 | 222,500 | Brazil | 2.2% | |||||||||||||||||
| 342,806 | 399,356 | 4.0% | ||||||||||||||||||||
| Health Care | ||||||||||||||||||||||
| Health Care Supplies | ||||||||||||||||||||||
Alcon Inc2 | 380 | 13,238 | 22,108 | Switzerland | 0.2% | |||||||||||||||||
| Large Pharma | ||||||||||||||||||||||
GlaxoSmithKline ADR | 5,000 | 216,373 | 193,200 | United Kingdom | 2.0% | |||||||||||||||||
Novartis ADR | 1,900 | 96,814 | 162,716 | Switzerland | 1.6% | |||||||||||||||||
| 313,187 | 355,916 | 3.6% | ||||||||||||||||||||
| 326,425 | 378,024 | 3.8% | ||||||||||||||||||||
Continued on next page.
| The accompanying notes are an integral part of these financial statements. | Semi-Annual Report | May 31, 2019 | 29 | |||||
| Sextant Global High Income Fund | |
| Schedule of Investments | �� | As of May 31, 2019 | ||||||||||||||||||||
| Common Stocks – 40.1% | Number of Shares | Cost | Market Value | Country1 | Percentage of Assets | |||||||||||||||||
| Industrials | ||||||||||||||||||||||
| Infrastructure Construction | ||||||||||||||||||||||
CCR | 45,000 | $130,047 | $153,442 | Brazil | 1.5% | |||||||||||||||||
Hopewell Highway Infrastructure | 325,000 | 168,010 | 155,440 | Hong Kong | 1.6% | |||||||||||||||||
| 298,057 | 308,882 | 3.1% | ||||||||||||||||||||
| Materials | ||||||||||||||||||||||
| Base Metals | ||||||||||||||||||||||
South32 ADR | 19,000 | 134,773 | 220,210 | Australia | 2.2% | |||||||||||||||||
| Steel Raw Material Suppliers | ||||||||||||||||||||||
BHP Biliton ADR | 4,000 | 155,038 | 207,640 | Australia | 2.1% | |||||||||||||||||
| 289,811 | 427,850 | 4.3% | ||||||||||||||||||||
| Technology | ||||||||||||||||||||||
| Computer Hardware & Storage | ||||||||||||||||||||||
Western Digital | 5,000 | 212,770 | 186,100 | Singapore | 1.9% | |||||||||||||||||
| Infrastructure Software | ||||||||||||||||||||||
Micro Focus International plc Spons | 5,807 | 99,433 | 139,194 | United Kingdom | 1.4% | |||||||||||||||||
| Semiconductor Devices | ||||||||||||||||||||||
Microchip Technology | 3,500 | 111,383 | 280,105 | United States | 2.9% | |||||||||||||||||
| Semiconductor Manufacturing | ||||||||||||||||||||||
Applied Materials | 6,000 | 210,256 | 232,140 | United States | 2.3% | |||||||||||||||||
| 633,842 | 837,539 | 8.5% | ||||||||||||||||||||
| Total Common Stock | $3,433,566 | $3,976,065 | 40.1% | |||||||||||||||||||
| Corporate Bonds – 25.3% | Coupon / Maturity | Face Amount | Market Value | Country1 | Percentage of Assets | |||||||||||||||||
| Communications | ||||||||||||||||||||||
T-Mobile | 6.50% due 01/15/2026 | $250,000 | $263,750 | United States | 2.7% | |||||||||||||||||
| 263,750 | 2.7% | |||||||||||||||||||||
| Consumer Discretionary | ||||||||||||||||||||||
ADT | 4.125% due 06/15/2023 | 150,000 | 145,312 | United States | 1.5% | |||||||||||||||||
GAP | 5.95% due 04/12/2021 | 100,000 | 103,647 | United States | 1.0% | |||||||||||||||||
Rent-A-Center | 6.625% due 11/15/2020 | 200,000 | 199,000 | United States | 2.0% | |||||||||||||||||
| 447,959 | 4.5% | |||||||||||||||||||||
| Consumer Staples | ||||||||||||||||||||||
Grupo Bimbo | 4.875% due 06/27/2044 | 200,000 | 204,879 | Mexico | 2.1% | |||||||||||||||||
| 204,879 | 2.1% | |||||||||||||||||||||
Continued on next page
| 30 | May 31, 2019 | Semi-Annual Report | The accompanying notes are an integral part of these financial statements. | |||||
| Sextant Global High Income Fund | |
| Schedule of Investments | As of May 31, 2019 | |||||||||||||||||||
| Corporate Bonds – 25.3% | Coupon / Maturity | Face Amount | Market Value | Country1 | Percentage of Assets | |||||||||||||||
| Energy | ||||||||||||||||||||
Petrobras International Finance | 6.875% due 01/20/2040 | $50,000 | $51,410 | Brazil | 0.5% | |||||||||||||||
Petrobras International Finance | 6.75% due 01/27/2041 | 80,000 | 81,641 | Brazil | 0.8% | |||||||||||||||
| 133,051 | 1.3% | |||||||||||||||||||
| Financials | ||||||||||||||||||||
Canadian Imperial Bank | 3.42% due 01/26/2026 | CAD 250,000 | 188,269 | Canada | 1.9% | |||||||||||||||
Jefferies Group | 5.125% due 01/20/2023 | 250,000 | 265,708 | United States | 2.7% | |||||||||||||||
Lincoln National (3 month LIBOR plus 2.04%)4 | 6.05% due 04/20/2067 | 250,000 | 195,000 | United States | 2.0% | |||||||||||||||
Royal Bank of Scotland | 6.125% due 12/15/2022 | 200,000 | 213,267 | United Kingdom | 2.1% | |||||||||||||||
| 862,244 | 8.7% | |||||||||||||||||||
| Industrials | ||||||||||||||||||||
Burlington Northern Santa Fe | 5.05% due 03/01/2041 | 200,000 | 232,911 | United States | 2.3% | |||||||||||||||
| 232,911 | 2.3% | |||||||||||||||||||
| Materials | ||||||||||||||||||||
Allegheny Technologies | 7.875% due 08/15/2023 | 150,000 | 157,457 | United States | 1.6% | |||||||||||||||
AngloGold Ashanti Holdings | 5.375% due 04/15/2020 | 100,000 | 101,582 | South Africa | 1.0% | |||||||||||||||
| 259,039 | 2.6% | |||||||||||||||||||
| Technology | ||||||||||||||||||||
Hewlett Packard | 4.65% due 12/09/2021 | 100,000 | 104,699 | United States | 1.1% | |||||||||||||||
| 104,699 | 1.1% | |||||||||||||||||||
| Total Corporate Bonds | $2,508,532 | 25.3% | ||||||||||||||||||
Continued on next page.
Bond Quality Diversification |
| |||||||||||
| % of Total Net Assets |
| |||||||||||
Rated “AAA” | 15.3% | ∎ |
|
|
| |||||||
Rated “A+” | 2.3% | ∎ | ||||||||||
Rated“A-” | 4.3% | ∎ | ||||||||||
Rated “BBB” | 7.1% | ∎ | ||||||||||
Rated“BBB-” | 4.1% | ∎ | ||||||||||
Rated “BB+” | 2.0% | ∎ | ||||||||||
Rated “BB” | 6.8% | ∎ | ||||||||||
Rated“BB-” | 4.2% | ∎ | ||||||||||
Rated “B” | 3.5% | ∎ | ||||||||||
Rated“B-” | 2.0% | ∎ | ||||||||||
Rated “C” | 0.8% | ∎ | ||||||||||
Not Rated | 2.1% | ∎ | ||||||||||
Equity | 40.1% | ∎ | ||||||||||
Other assets (net of liabilities) | 5.4% | ∎ | ||||||||||
| Credit ratings are the lesser of S&P Global Ratings or Moody’s Investors Service. If neither S&P nor Moody’s rate a particular security, that security is categorized as not rated (except for US Treasury securities and securities issued or backed by US agencies which inherit the credit rating for the US government). Ratings range from AAA (highest) to D (lowest). Bonds rated BBB or above are considered investment grade. Credit ratings BB and below are lower-rated securities (junk bonds). Ratings apply to the creditworthiness of the issuers of the underlying securities and not the Fund or its shares. Ratings may be subject to change. |
| |||||||||||

| The accompanying notes are an integral part of these financial statements. | Semi-Annual Report | May 31, 2019 | 31 | |||||
| Sextant Global High Income Fund | |
| Schedule of Investments | As of May 31, 2019 | |||||||||||||||||||
| Government Bonds - 26.3% | Coupon / Maturity | Face Amount | Market Value | Country1 | Percentage of Assets | |||||||||||||||
| Foreign Government Bonds | ||||||||||||||||||||
Colombia Republic | 8.375% due 02/15/2027 | $125,000 | $141,057 | Colombia | 1.4% | |||||||||||||||
Federal Republic of Brazil | 12.50% due 01/05/2022 | BRL 500,000 | 143,396 | Brazil | 1.4% | |||||||||||||||
Federal Republic of Brazil | 8.50% due 01/05/2024 | BRL 750,000 | 195,989 | Brazil | 2.0% | |||||||||||||||
Mexico Bonos Desarrollo | 6.50% due 06/10/2021 | MXN 85,000 | 422,087 | Mexico | 4.3% | |||||||||||||||
Republic of Argentina - Global Bond | 7.50% due 04/22/2026 | 250,000 | 187,125 | Argentina | 1.9% | |||||||||||||||
| 1,089,654 | 11.0% | |||||||||||||||||||
| United States Treasury Bonds | ||||||||||||||||||||
United States Treasury Bond | 6.125% due 11/15/2027 | 400,000 | 523,734 | United States | 5.3% | |||||||||||||||
| 523,734 | 5.3% | |||||||||||||||||||
| United States Treasury Bills | ||||||||||||||||||||
U.S. Treasury Bill2 | 0.00% due 06/25/2019 | 1,000,000 | 998,601 | United States | 10.0% | |||||||||||||||
| 998,601 | 10.0% | |||||||||||||||||||
| Total Government Bonds | $2,611,989 | 26.3% | ||||||||||||||||||
| Municipal Bonds – 2.9% | Coupon / Maturity | Face Amount | Market Value | Country1 | Percentage of Assets | |||||||||||||||
| Revenue | ||||||||||||||||||||
Colony TX NFM Sales Tax Revenue | 7.00% due 10/01/2027 | $100,000 | $102,222 | United States | 1.0% | |||||||||||||||
Colony TX NFM Sales Tax Revenue | 7.25% due 10/01/2033 | 50,000 | 51,112 | United States | 0.5% | |||||||||||||||
Colony TX NFM Sales Tax Revenue | 7.625% due 10/01/2042 | 50,000 | 54,302 | United States | 0.6% | |||||||||||||||
| 207,636 | 2.1% | |||||||||||||||||||
| Water Supply | ||||||||||||||||||||
Puerto Rico Aqueduct & Sewer | 5.00% due 07/01/2019 | 85,000 | 84,894 | United States | 0.8% | |||||||||||||||
| 84,894 | 0.8% | |||||||||||||||||||
| Total Municipal Bonds | $292,530 | 2.9% | ||||||||||||||||||
| Warrants – 0.0% | Number of Shares | Cost | Market Value | Country1 | Percentage of Assets | |||||||||||||||
| Energy | ||||||||||||||||||||
| Exploration & Production | ||||||||||||||||||||
Goodrich Petroleum Warrants 2 | 1,707 | $- | $- | United States | 0.0% | |||||||||||||||
| $- | $- | 0.0% | ||||||||||||||||||
| Total investments | (Cost = $8,962,855) | 9,389,116 | 94.6% | |||||||||||||||||
| Other assets (net of liabilities) | 532,577 | 5.4% | ||||||||||||||||||
| Total net assets | $9,921,693 | 100.0% | ||||||||||||||||||
| 1 | Country of domicile |
| 2 | Non-income producing |
| 3 | Amount is less than 0.05% |
| 4 | Variable rate security. The interest rate represents the rate in effect at November 30, 2018 and resets periodically based on the parenthetically disclosed reference rate and spread. |
ADR: American Depositary Receipt
| 32 | May 31, 2019 | Semi-Annual Report | The accompanying notes are an integral part of these financial statements. | |||||
| Sextant Global High Income Fund | |
| Schedule of Investments | As of May 31, 2019 | |||||||||||||
Countries | ||||
|
| |||
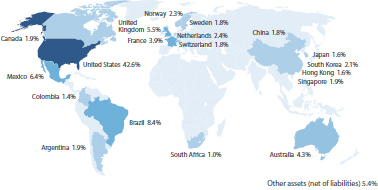 |
| |||
| Weightings shown are a percentage of total net assets. |
| |||
| The accompanying notes are an integral part of these financial statements. | Semi-Annual Report | May 31, 2019 | 33 | |||||
| Sextant Global High Income Fund | |
Statement of Assets and Liabilities | ||||
| As of May 31, 2019 |
| |||
| ||||
Assets | ||||
Investments in securities, at value | $9,389,116 | |||
Cash | 1,408,579 | |||
Dividends and interest receivable | 105,189 | |||
Receivable for Fund shares sold | 10,237 | |||
Prepaid expenses | 9,026 | |||
Total assets | 10,922,147 | |||
Liabilities | ||||
Payable for securities purchased | 998,613 | |||
Accrued advisory fees | 893 | |||
Accrued retirement plan custodial fees | 630 | |||
Accrued Chief Compliance Officer expenses | 318 | |||
Total liabilities | 1,000,454 | |||
Net assets | $9,921,693 | |||
Analysis of net assets | ||||
Paid-in capital (unlimited shares authorized, without par value) | $9,299,754 | |||
Total distributable earnings | 621,939 | |||
Net assets applicable to Fund shares outstanding | $9,921,693 | |||
Fund shares outstanding | 903,783 | |||
Net asset value, offering and redemption price per share | $10.98 | |||
Statement of Operations
| Period ended May 31, 2019 |
| |||
| ||||
Investment income | ||||
Interest income | $125,015 | |||
Dividend Income (net of foreign tax of $15,272) | 104,577 | |||
Total investment income | 229,592 | |||
Expenses | ||||
Investment adviser fees | 33,053 | |||
Filing and registration fees | 9,636 | |||
Audit fees | 3,647 | |||
Chief Compliance Officer expenses | 1,420 | |||
Trustee fees | 1,180 | |||
Printing and postage | 1,033 | |||
Retirement plan custodial fees | 803 | |||
Other expenses | 570 | |||
Custodian fees | 413 | |||
Legal fees | 310 | |||
Total gross expenses | 52,065 | |||
Less adviser fees waived | (15,856 | ) | ||
Less custodian fee credits | (381 | ) | ||
Net expenses | 35,828 | |||
Net investment income | $193,764 | |||
| ||||
Net realized gain from investments and foreign currency | $34,623 | |||
Net increase in unrealized appreciation on investments and foreign currency | 26,608 | |||
Net gain on investments | $61,231 | |||
Net increase in net assets resulting from operations | $254,995 | |||
| 34 | May 31, 2019 | Semi-Annual Report | The accompanying notes are an integral part of these financial statements. | |||||
| Sextant Global High Income Fund | |
Statements of Changes in Net Assets | Period ended May 31, 2019 | Year ended Nov. 30, 2018 | ||||||
Increase (decrease) in net assets from operations | ||||||||
From operations | ||||||||
Net investment income | $193,764 | $318,693 | ||||||
Net realized gain on investment | 34,623 | 151,626 | ||||||
Net increase (decrease) in unrealized appreciation | 26,608 | (267,907 | ) | |||||
Net increase in net assets | 254,995 | 202,412 | ||||||
Distributions to shareowners | (311,447 | ) | (253,597 | ) | ||||
Capital share transactions | ||||||||
Proceeds from sales of shares | 1,579,441 | 564,016 | ||||||
Value of shares issued in reinvestment of dividends | 305,589 | 249,322 | ||||||
Cost of shares redeemed | (734,297 | ) | (1,307,655 | ) | ||||
Total capital share transactions | 1,150,733 | (494,317 | ) | |||||
Total increase (decrease) in net assets | 1,094,281 | (545,502 | ) | |||||
Net assets | ||||||||
Beginning of period | 8,827,412 | 9,372,914 | ||||||
End of period | $9,921,693 | $8,827,412 | ||||||
Shares of the Fund sold and redeemed | ||||||||
Number of shares sold | 142,703 | 50,613 | ||||||
Number of shares issued in reinvestment of dividends | 29,440 | 22,707 | ||||||
Number of shares redeemed | (66,085 | ) | (118,123 | ) | ||||
Net increase (decrease) in number of shares outstanding | 106,058 | (44,803 | ) | |||||
Financial Highlights | For period ended | For Year ended November 30, | ||||||||||||||||||||||
Selected data per share of outstanding capital stock throughout each period: | May 31, 2019 | 2018 | 2017 | 2016 | 2015 | 2014 | ||||||||||||||||||
Net asset value at beginning of period | $11.07 | $11.12 | $10.11 | $8.89 | $10.57 | $10.51 | ||||||||||||||||||
Income from investment operations | ||||||||||||||||||||||||
Net investment income | 0.21 | 0.40 | 0.35 | 0.45 | 0.52 | 0.48 | ||||||||||||||||||
Net gains (losses) on securities (both realized and unrealized) | 0.09 | (0.15 | ) | 1.11 | 0.77 | (1.68 | ) | 0.07 | ||||||||||||||||
Total from investment operations | 0.30 | 0.25 | 1.46 | 1.22 | (1.16 | ) | 0.55 | |||||||||||||||||
Less distributions | ||||||||||||||||||||||||
Dividends (from net investment income) | (0.39 | ) | (0.30 | ) | (0.45 | ) | - | (0.52 | ) | (0.49 | ) | |||||||||||||
Total distributions | (0.39 | ) | (0.30 | ) | (0.45 | ) | - | (0.52 | ) | (0.49 | ) | |||||||||||||
Net asset value at end of period | $10.98 | $11.07 | $11.12 | $10.11 | $8.89 | $10.57 | ||||||||||||||||||
Total returnA | 2.93% | 2.31% | 15.01% | 13.72% | (11.01 | )% | 5.27% | |||||||||||||||||
Ratios / supplemental data | ||||||||||||||||||||||||
Net assets ($000), end of period | $9,922 | $8,827 | $9,373 | $7,570 | $6,952 | $7,707 | ||||||||||||||||||
Ratio of expenses to average net assets | ||||||||||||||||||||||||
Before fee waiversB | 1.09% | 0.97% | 1.18% | 1.17% | 1.06% | 1.41% | ||||||||||||||||||
After fee waiversB | 0.76% | 0.75% | 0.83% | 0.91% | 0.90% | 0.91% | ||||||||||||||||||
After fee waivers and custodian fee creditsB | 0.75% | 0.75% | 0.82% | 0.90% | 0.89% | 0.90% | ||||||||||||||||||
Ratio of net investment income after fee waivers and custodian fee credits to average net assetsB | 4.07% | 3.43% | 3.34% | 4.78% | 4.87% | 4.75% | ||||||||||||||||||
Portfolio turnover rateA | 11% | 10% | 8% | 26% | 40% | 11% | ||||||||||||||||||
| A | Not Annualized |
| B | Annualized |
| The accompanying notes are an integral part of these financial statements. | Semi-Annual Report | May 31, 2019 | 35 | |||||
| Sextant Growth Fund |  |
Performance Summary
| ||||||||||||||||
Average Annual Total Returns as of May 31, 2019 |
| |||||||||||||||
| 1 Year | 5 Year | 10 Year | Expense Ratio1 | |||||||||||||
Sextant Growth Fund Investor Shares (SSGFX) | 7.18% | 7.94% | 11.46% | 0.92% | ||||||||||||
Sextant Growth Fund Z Shares (SGZFX)2 | 7.50% | n/a | n/a | 0.70% | ||||||||||||
S&P 500 Index | 3.78% | 9.65% | 13.93% | n/a | ||||||||||||
Growth of $10,000
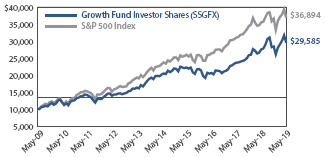 | Comparison of any mutual fund to a market index must be made bearing in mind that the index is expense-free. Conversely, the fund will (1) be actively managed; (2) have an objective other than mirroring the index, such as limiting risk; (3) bear transaction and other costs; (4) stand ready to buy and sell its securities to shareowners on a daily basis; and (5) provide a wide range of services. The graph compares $10,000 invested in Investor Shares of the Fund on November 30, 2008, to an identical amount invested in the S&P 500 Index, an index comprised of 500 widely held common stocks considered to be representative of the US stock market in general. The graph shows that an investment in the Investor Shares of the Fund would have risen to $29,585 versus $36,894 in the index. |
Past performance does not guarantee future results. The “Growth of $10,000” graph and “Average Annual Returns” performance table assume the reinvestment of dividends and capital gains. They do not reflect the deduction of taxes that a shareowner might pay on fund distributions or the redemption of fund shares.
| 1 | By regulation, the expense ratio shown in this table is as stated in the Fund’s most recent prospectus, which is dated March 27, 2019, and incorporates results for the fiscal year ended November 30, 2018. The ratio presented in this table differs from expense ratios shown elsewhere in this report as they represent different periods. |
| 2 | Sextant Growth Fund Z Shares (SGZFX) began operations June 2, 2017. |
Fund Objective
The objective of the Growth Fund is long-term capital growth.
Top 10 Holdings | ||||
| % of Total Net Assets | ||||
Amazon.com | 7.0% | |||
Adobe Inc. | 6.5% | |||
Apple | 6.2% | |||
Microsoft | 6.0% | |||
Mastercard, Class A | 5.8% | |||
Alphabet, Class A | 5.7% | |||
Abbott Laboratories | 4.1% | |||
Worldpay, Class A | 3.8% | |||
Costco Wholesale | 3.0% | |||
Ecolab | 3.0% | |||
Portfolio Diversification | ||||||||||||
| % of Total Net Assets |
| |||||||||||
Consumer Finance | 12.1% | ∎ | |  | | |||||||
Medical Devices | 8.0% | ∎ | ||||||||||
Application Software | 7.6% | ∎ | ||||||||||
Infrastructure Software | 7.5% | ∎ | ||||||||||
E-Commerce Discretionary | 7.0% | ∎ | ||||||||||
Communications Equipment | 6.2% | ∎ | ||||||||||
Internet Media | 5.7% | ∎ | ||||||||||
Home Products Stores | 5.0% | ∎ | ||||||||||
Semiconductor Devices | 4.5% | ∎ | ||||||||||
Specialty Apparel Stores | 4.2% | ∎ | ||||||||||
Other Commercial Services | 3.0% | ∎ | ||||||||||
Mass Merchants | 3.0% | ∎ | ||||||||||
Industries < 3% | 24.9% | ∎ | ||||||||||
Other Assets (net of liabilities) | 1.3% | ∎ | ||||||||||
| 36 | May 31, 2019 | Semi-Annual Report | ||||
| Sextant Growth Fund | |
| Schedule of Investments | As of May 31, 2019 | |||||||||||||||||
| Common Stock – 98.7% | Number of Shares | Cost | Market Value | Percentage of Assets | ||||||||||||||
| Communications | ||||||||||||||||||
| Internet Based Services | ||||||||||||||||||
Booking Holdings1 | 400 | $761,890 | $662,488 | 1.7% | ||||||||||||||
| Internet Media | ||||||||||||||||||
Alphabet, Class A1 | 1,998 | 1,175,995 | 2,210,787 | 5.7% | ||||||||||||||
| 1,937,885 | 2,873,275 | 7.4% | ||||||||||||||||
| Consumer Discretionary | ||||||||||||||||||
| Airlines | ||||||||||||||||||
Alaska Air | 7,422 | 129,600 | 431,960 | 1.1% | ||||||||||||||
| Apparel, Footwear & Accessory Design | ||||||||||||||||||
Nike, Class B | 10,276 | 528,776 | 792,691 | 2.0% | ||||||||||||||
| E-Commerce Discretionary | ||||||||||||||||||
Amazon.com1 | 1,529 | 278,191 | 2,714,082 | 7.0% | ||||||||||||||
| Home Improvement | ||||||||||||||||||
Stanley Black & Decker | 8,684 | 795,475 | 1,104,778 | 2.9% | ||||||||||||||
| Home Products Stores | ||||||||||||||||||
Home Depot | 4,800 | 564,733 | 911,280 | 2.3% | ||||||||||||||
Lowe’s | 11,200 | 794,834 | 1,044,736 | 2.7% | ||||||||||||||
| 1,359,567 | 1,956,016 | 5.0% | ||||||||||||||||
| Other Commercial Services | ||||||||||||||||||
Ecolab | 6,243 | 704,507 | 1,149,274 | 3.0% | ||||||||||||||
| Restaurants | ||||||||||||||||||
Starbucks | 14,674 | 610,056 | 1,116,105 | 2.9% | ||||||||||||||
| Specialty Apparel Stores | ||||||||||||||||||
Ross Stores | 11,600 | 742,559 | 1,078,684 | 2.8% | ||||||||||||||
TJX Companies | 11,078 | 330,472 | 557,113 | 1.4% | ||||||||||||||
| 1,073,031 | 1,635,797 | 4.2% | ||||||||||||||||
| 5,479,203 | 10,900,703 | 28.1% | ||||||||||||||||
| Consumer Staples | ||||||||||||||||||
| Mass Merchants | ||||||||||||||||||
Costco Wholesale | 4,883 | 599,638 | 1,169,869 | 3.0% | ||||||||||||||
| 599,638 | 1,169,869 | 3.0% | ||||||||||||||||
Continued on next page.
| The accompanying notes are an integral part of these financial statements. | Semi-Annual Report | May 31, 2019 | 37 | |||||
| Sextant Growth Fund | |
| Schedule of Investments | As of May 31, 2019 | |||||||||||||||||
| Common Stock – 98.7% | Number of Shares | Cost | Market Value | Percentage of Assets | ||||||||||||||
| Financials | ||||||||||||||||||
| Consumer Finance | ||||||||||||||||||
Ally Financial | 34,000 | $777,141 | $981,580 | 2.5% | ||||||||||||||
Mastercard, Class A | 8,914 | 806,925 | 2,241,782 | 5.8% | ||||||||||||||
Worldpay, Class A1 | 12,000 | 1,004,896 | 1,459,680 | 3.8% | ||||||||||||||
| 2,588,962 | 4,683,042 | �� | 12.1% | |||||||||||||||
| Diversified Banks | ||||||||||||||||||
JP Morgan Chase | 8,367 | 501,267 | 886,567 | 2.3% | ||||||||||||||
| 3,090,229 | 5,569,609 | 14.4% | ||||||||||||||||
| Health Care | ||||||||||||||||||
| Biotech | ||||||||||||||||||
Amgen | 1,980 | 25,949 | 330,066 | 0.9% | ||||||||||||||
| Large Pharma | ||||||||||||||||||
Bristol-Myers Squibb | 15,600 | 722,502 | 707,772 | 1.8% | ||||||||||||||
| Medical Devices | ||||||||||||||||||
Abbott Laboratories | 20,799 | 646,854 | 1,583,428 | 4.1% | ||||||||||||||
Edwards Lifesciences1 | 5,700 | 546,521 | 972,990 | 2.5% | ||||||||||||||
Stryker | 3,000 | 374,100 | 549,720 | 1.4% | ||||||||||||||
| 1,567,475 | 3,106,138 | 8.0% | ||||||||||||||||
| 2,315,926 | 4,143,976 | 10.7% | ||||||||||||||||
| Industrials | ||||||||||||||||||
| Commercial & Residential Building Equipment & Systems | ||||||||||||||||||
Honeywell International | 5,000 | 753,256 | 821,550 | 2.1% | ||||||||||||||
| Electrical Components | ||||||||||||||||||
Sensata Technologies Holding1 | 8,500 | 453,176 | 362,865 | 0.9% | ||||||||||||||
TE Connectivity | 6,000 | 549,196 | 505,380 | 1.3% | ||||||||||||||
| 1,002,372 | 868,245 | 2.2% | ||||||||||||||||
| Measurement Instruments | ||||||||||||||||||
Trimble1 | 24,000 | 833,189 | 957,600 | 2.5% | ||||||||||||||
| 2,588,817 | 2,647,395 | 6.8% | ||||||||||||||||
| Materials | ||||||||||||||||||
| Specialty Chemicals | ||||||||||||||||||
RPM International | 18,000 | 737,644 | 963,360 | 2.5% | ||||||||||||||
| 737,644 | 963,360 | 2.5% | ||||||||||||||||
Continued on next page.
| 38 | May 31, 2019 | Semi-Annual Report | The accompanying notes are an integral part of these financial statements. | |||||
| Sextant Growth Fund | |
| Schedule of Investments | As of May 31, 2019 | |||||||||||||||||
| Common Stock – 98.7% | Number of Shares | Cost | Market Value | Percentage of Assets | ||||||||||||||
| Technology | ||||||||||||||||||
| Application Software | ||||||||||||||||||
Adobe Systems1 | 9,300 | $92,094 | $2,519,370 | 6.5% | ||||||||||||||
Take-Two Interactive Software1 | 4,000 | 405,004 | 432,600 | 1.1% | ||||||||||||||
| 497,098 | 2,951,970 | 7.6% | ||||||||||||||||
| Communications Equipment | ||||||||||||||||||
Apple | 13,720 | 16,172 | 2,401,960 | 6.2% | ||||||||||||||
| Infrastructure Software | ||||||||||||||||||
Microsoft | 18,920 | 872,435 | 2,340,026 | 6.0% | ||||||||||||||
Oracle | 11,300 | 550,082 | 571,780 | 1.5% | ||||||||||||||
| 1,422,517 | 2,911,806 | 7.5% | ||||||||||||||||
| Semiconductor Devices | ||||||||||||||||||
Qualcomm | 6,000 | 405,540 | 400,920 | 1.1% | ||||||||||||||
Texas Instruments | 3,600 | 386,981 | 375,516 | 1.0% | ||||||||||||||
Xilinx | 9,200 | 853,942 | 941,252 | 2.4% | ||||||||||||||
| 1,646,463 | 1,717,688 | 4.5% | ||||||||||||||||
| 3,582,250 | 9,983,424 | 25.8% | ||||||||||||||||
| Total investments | $20,331,592 | 38,251,611 | 98.7% | |||||||||||||||
| Other assets (net of liabilities) | 501,878 | 1.3% | ||||||||||||||||
| Total net assets | $38,753,489 | 100.0% | ||||||||||||||||
| 1 | Non-income producing security |
| The accompanying notes are an integral part of these financial statements. | Semi-Annual Report | May 31, 2019 | 39 | |||||
| Sextant Growth Fund | |
Statement of Assets and Liabilities
| As of May 31, 2019 |
| |||
| ||||
Assets | ||||
Investments in securities, at value | $38,251,611 | |||
Cash | 472,859 | |||
Dividends receivable | 29,245 | |||
Prepaid expenses | 13,692 | |||
Receivable for Fund shares sold | 7,399 | |||
Insurance reserve premium | 1,214 | |||
Total assets | 38,776,020 | |||
Liabilities | ||||
Accrued advisory fees | 17,176 | |||
Accrued trustee expenses | 3,267 | |||
Accrued Chief Compliance Officer expenses | 1,265 | |||
Accrued distribution fee | 823 | |||
Total liabilities | 22,531 | |||
Net assets | $38,753,489 | |||
Analysis of net assets | ||||
Paid-in capital (unlimited shares authorized, without par value) | $20,787,864 | |||
Total distributable earnings | 17,965,625 | |||
Net assets applicable to Fund shares outstanding | $38,753,489 | |||
Net asset value per Investor Share | SSGFX | |||
Net assets, at value | $3,604,474 | |||
Shares outstanding | 127,003 | |||
Net asset value, offering and redemption price per share | $28.38 | |||
Net asset value per Z Share | SGZFX | |||
Net assets, at value | $35,149,015 | |||
Shares outstanding | 1,243,711 | |||
Net asset value, offering and redemption price per share | $28.26 | |||
Statement of Operations
| Period ended May 31, 2019 |
| |||
| ||||
Investment income | ||||
Dividend income | $216,153 | |||
Total investment income | 216,153 | |||
Expenses | ||||
Investment adviser fees | 132,254 | |||
Filing and registration fees | 10,775 | |||
Audit fees | 7,857 | |||
Chief Compliance Officer expenses | 5,385 | |||
Distribution fees - Investor Shares | 4,791 | |||
Retirement plan custodial fees | ||||
Investor Shares | 7 | |||
Z Shares | 3,481 | |||
Trustee fees | 3,089 | |||
Printing and postage | 1,693 | |||
Other expenses | 1,347 | |||
Legal fees | 1,221 | |||
Custodian fees | 820 | |||
Total gross expenses | 172,720 | |||
Less custodian fee credits | (690 | ) | ||
Net expenses | 172,030 | |||
Net investment income | $44,123 | |||
| ||||
Net realized gain from investments | $8,061 | |||
Net increase in unrealized appreciation on investments | 1,469,089 | |||
Net gain on investments | $1,477,150 | |||
Net increase in net assets resulting from operations | $1,521,273 | |||
| 40 | May 31, 2019 | Semi-Annual Report | The accompanying notes are an integral part of these financial statements. | |||||
| Sextant Growth Fund | |
Statements of Changes in Net Assets | Period ended May 31, 2019 | Year ended Nov. 30, 2018 | ||||||
Increase (decrease) in net assets from operations | ||||||||
From operations | ||||||||
Net investment income | $44,123 | $175,267 | ||||||
Net realized gain on investment | 8,061 | 1,640,036 | ||||||
Net increase in unrealized appreciation | 1,469,089 | 1,967,640 | ||||||
Net increase in net assets | 1,521,273 | 3,782,943 | ||||||
Distributions to shareowners | ||||||||
Net distribution to shareholders – Investor Shares | (169,456 | ) | (294,960 | ) | ||||
Net distribution to shareholders – Z Shares | (1,652,425 | ) | (1,773,166 | ) | ||||
Total distributions | (1,821,881 | ) | (2,068,126 | ) | ||||
Capital share transactions | ||||||||
Proceeds from sales of shares | ||||||||
Investor Shares | 129,016 | 328,352 | ||||||
Z Shares | 755,289 | 2,305,904 | ||||||
Value of shares issued in reinvestment of dividends | ||||||||
Investor Shares | 128,694 | 294,403 | ||||||
Z Shares | 1,612,686 | 1,721,116 | ||||||
Cost of shares redeemed | ||||||||
Investor Shares | (1,625,847 | ) | (1,820,640 | ) | ||||
Z Shares | (1,173,614 | ) | (3,295,790 | ) | ||||
Total capital share transactions | (173,776 | ) | (466,655 | ) | ||||
Total increase (decrease) in net assets | (474,384 | ) | 1,248,162 | |||||
Net assets | ||||||||
Beginning of period | 39,227,873 | 37,979,711 | ||||||
End of period | $38,753,489 | $39,227,873 | ||||||
Shares of the Fund sold and redeemed | ||||||||
Investor Shares (SSGFX) | ||||||||
Number of shares sold | 4,584 | 11,092 | ||||||
Number of shares issued in reinvestment of dividends and distributions | 5,181 | 11,215 | ||||||
Number of shares redeemed | (58,295 | ) | (63,545 | ) | ||||
Net decrease in number of shares outstanding | (48,530 | ) | (41,238 | ) | ||||
Z Shares (SGZFX) | ||||||||
Number of shares sold | 27,628 | 82,395 | ||||||
Number of shares issued in reinvestment of dividends and distributions | 65,291 | 65,817 | ||||||
Number of shares redeemed | (42,562 | ) | (119,008 | ) | ||||
Net increase in number of shares outstanding | 50,357 | 29,204 | ||||||
| The accompanying notes are an integral part of these financial statements. | Semi-Annual Report | May 31, 2019 | 41 | |||||
| Sextant Growth Fund:Financial Highlights | |
Investor Shares (SSGFX) | For period ended | For year ended November 30, | ||||||||||||||||||||||
Selected data per share of outstanding capital stock throughout each period: | May 31, 2019 | 2018 | 2017 | 2016 | 2015 | 2014 | ||||||||||||||||||
Net asset value at beginning of period | $28.70 | $27.51 | $22.52 | $24.03 | $26.36 | $23.92 | ||||||||||||||||||
Income from investment operations | ||||||||||||||||||||||||
Net investment income | (0.01 | )A | 0.07 | A | 0.15 | A | 0.11 | 0.03 | 0.02 | |||||||||||||||
Net gains (losses) on securities (both realized and unrealized) | 0.97 | 2.53 | 4.93 | (0.88 | ) | (0.25 | ) | 3.88 | ||||||||||||||||
Total from investment operations | 0.96 | 2.60 | 5.08 | (0.77 | ) | (0.22 | ) | 3.90 | ||||||||||||||||
Less distributions | ||||||||||||||||||||||||
Dividends (from net investment income) | (0.04 | ) | (0.07 | ) | (0.09 | ) | (0.02 | ) | (0.04 | ) | (0.01 | ) | ||||||||||||
Distributions (from capital gains) | (1.24 | ) | (1.34 | ) | - | (0.72 | ) | (2.07 | ) | (1.45 | ) | |||||||||||||
Total distributions | (1.28 | ) | (1.41 | ) | (0.09 | ) | (0.74 | ) | (2.11 | ) | (1.46 | ) | ||||||||||||
Net asset value at end of period | $28.38 | $28.70 | $27.51 | $22.52 | $24.03 | $26.36 | ||||||||||||||||||
Total returnB | 3.97% | 9.95% | 22.64% | (3.22 | )% | (0.87 | )% | 16.29% | ||||||||||||||||
Ratios / supplemental data | ||||||||||||||||||||||||
Net assets ($000), end of period | $3,604 | $5,037 | $5,962 | $34,561 | $55,867 | $45,863 | ||||||||||||||||||
Ratio of expenses to average net assets | ||||||||||||||||||||||||
Before custodian fee creditsC | 1.19% | 0.92% | 0.76% | 0.76% | 0.90% | 1.05% | ||||||||||||||||||
After custodian fee creditsC | 1.18% | 0.92% | 0.76% | 0.76% | 0.90% | 1.05% | ||||||||||||||||||
Ratio of net investment income after custodian fee credits to average net assetsC | (0.07 | )% | 0.25% | 0.60% | 0.39% | 0.13% | 0.07% | |||||||||||||||||
Portfolio turnover rateB | 7% | 17% | 18% | 25% | 68% | 23% | ||||||||||||||||||
Z Shares (SGZFX) | For period ended | Year ended | Period ended | |||||||||
Selected data per share of outstanding capital stock throughout each period: | May 31, 2019 | November 30, 2018 | November 30, 2017 | B | ||||||||
Net asset value at beginning of period | $28.65 | $27.50 | $25.54 | |||||||||
Income from investment operations | ||||||||||||
Net investment income | 0.04 | A | 0.13 | A | 0.16 | A | ||||||
Net gains on securities (both realized & unrealized) | 0.96 | 2.53 | 1.82 | |||||||||
Total from investment operations | 1.00 | 2.66 | 1.98 | |||||||||
Less distributions | ||||||||||||
Dividends (from net investment income) | (0.15 | ) | (0.17 | ) | (0.02 | ) | ||||||
Distributions (from capital gains) | (1.24 | ) | (1.34 | ) | - | |||||||
Total distributions | (1.39 | ) | (1.51 | ) | (0.02 | ) | ||||||
Net asset value at end of period | $28.26 | $28.65 | $27.50 | |||||||||
Total returnB | 4.16% | 10.20% | 7.73% | C | ||||||||
Ratios / supplemental data | ||||||||||||
Net assets ($000), end of period | $35,149 | $34,191 | $32,017 | |||||||||
Ratio of expenses to average net assets | ||||||||||||
Before custodian fee creditsC | 0.87% | 0.70% | 0.51% | D | ||||||||
After custodian fee creditsC | 0.87% | 0.70% | 0.51% | D | ||||||||
Ratio of net investment income after custodian fee credits to average net assetsC | 0.26% | 0.47% | 0.89% | D | ||||||||
Portfolio turnover rateB | 7% | 17% | 18% | C | ||||||||
| A | Calculated using average shares outstanding |
| B | Not annualized for periods of less than one year |
| C | Annualized for periods of less than one year |
| D | Operations commenced on June 2, 2017 |
| 42 | May 31, 2019 | Semi-Annual Report | The accompanying notes are an integral part of these financial statements. | |||||
| Sextant International Fund |  |
Performance Summary
Average Annual Total Returns as of May 31, 2019 |
| |||||||||||||||
| 1 Year | 5 Year | 10 Year | Expense Ratio1 | |||||||||||||
Sextant International Fund Investor Shares (SSIFX) | 11.83% | 6.04% | 6.46% | 1.05% | ||||||||||||
Sextant International Fund Z Shares (SIFZX)2 | 12.16% | n/a | n/a | 0.84% | ||||||||||||
MSCI EAFE Index | -5.26% | 1.75% | 6.71% | n/a | ||||||||||||
Growth of $10,000
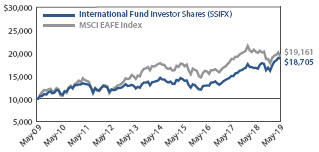 | Comparison of any mutual fund to a market index must be made bearing in mind that the index is unmanaged, and expense-free. Conversely, the fund will (1) be actively managed; (2) have an objective other than mirroring the index, such as limiting risk; (3) bear transaction and other costs; (4) stand ready to buy and sell its securities to shareowners on a daily basis; and (5) provide a wide range of services. The graph compares $10,000 invested in Investor Shares of the Fund on November 30, 2008, to an identical amount invested in the MSCI EAFE Index, an international index focused on Europe, Australasia, and the Far East. The graph shows that an investment in Investor Shares of the Fund would have risen to $18,705 versus $19,161 in the Index. |
Past performance does not guarantee future results. The “Growth of $10,000” graph and “Average Annual Returns” performance table assume the reinvestment of dividends and capital gains. They do not reflect the deduction of taxes that a shareowner might pay on fund distributions or the redemption of fund shares.
| 1 | By regulation, the expense ratio shown in this table is as stated in the Fund’s most recent prospectus, which is dated March 27, 2019, and incorporates results for the fiscal year ended November 30, 2018. The ratio presented in this table differs from expense ratios shown elsewhere in this report as they represent different periods. |
| 2 | Sextant International Fund Z Shares (SIFZX) began operations June 2, 2017. |
Fund Objective
The objective of the International Fund is long-term capital growth.
Top 10 Holdings |
| |||
| % of Total Net Assets | ||||
Wolters Kluwer | 8.4% | |||
MercadoLibre | 6.9% | |||
NICE Systems ADR | 6.8% | |||
Dassault Systemes ADR | 6.2% | |||
ASML | 4.6% | |||
Unilever ADR | 3.7% | |||
Novartis ADR | 3.4% | |||
Fomento Economico Mexico ADR | 3.4% | |||
Toronto-Dominion Bank | 3.3% | |||
Copa Holdings, Class A | 3.3% | |||
Portfolio Diversification | ||||||||||||
| % of Total Net Assets |
| |||||||||||
Application Software | 13.0% | ∎ | |  | | |||||||
Information Services | 8.4% | ∎ | ||||||||||
E-Commerce Discretionary | 6.9% | ∎ | ||||||||||
Large Pharma | 6.3% | ∎ | ||||||||||
Banks | 5.2% | ∎ | ||||||||||
Telecom Carriers | 5.0% | ∎ | ||||||||||
Semiconductor Manufacturing | 4.6% | ∎ | ||||||||||
Airlines | 4.4% | ∎ | ||||||||||
Household Products | 3.7% | ∎ | ||||||||||
Beverages | 3.4% | ∎ | ||||||||||
Basic & Diversified Chemicals | 3.2% | ∎ | ||||||||||
Industries < 3.0% | 10.3% | ∎ | ||||||||||
Other Assets (net of liabilities) | 25.6% | ∎ | ||||||||||
| Semi-Annual Report | May 31, 2019 | 43 | ||||
| Sextant International Fund | |
| Schedule of Investments | As of May 31, 2019 | |||||||||||||||||||||
| Common Stocks –74.4% | Number of Shares | Cost | Market Value | Country1 | Percentage of Assets | |||||||||||||||||
| Communications | ||||||||||||||||||||||
| Telecom Carriers | ||||||||||||||||||||||
BCE | 50,000 | $1,164,294 | $2,251,500 | Canada | 2.7% | |||||||||||||||||
Telus | 50,000 | 710,476 | 1,844,500 | Canada | 2.3% | |||||||||||||||||
| 1,874,770 | 4,096,000 | 5.0% | ||||||||||||||||||||
| Consumer Discretionary | ||||||||||||||||||||||
| Airlines | ||||||||||||||||||||||
Air Canada2 | 32,000 | 573,924 | 945,920 | Canada | 1.1% | |||||||||||||||||
Copa Holdings, Class A | 30,000 | 1,766,222 | 2,688,300 | Panama | 3.3% | |||||||||||||||||
| 2,340,146 | 3,634,220 | 4.4% | ||||||||||||||||||||
| Automobiles | ||||||||||||||||||||||
Subaru ADR | 25,000 | 362,500 | 288,250 | Japan | 0.4% | |||||||||||||||||
Toyota Motor ADR | 10,000 | 748,148 | 1,175,800 | Japan | 1.4% | |||||||||||||||||
| 1,110,648 | 1,464,050 | 1.8% | ||||||||||||||||||||
| E-Commerce Discretionary | ||||||||||||||||||||||
MercadoLibre | 10,000 | 829,340 | 5,705,200 | Argentina | 6.9% | |||||||||||||||||
| Specialty Apparel Stores | ||||||||||||||||||||||
Industria de Diseno Textil | 30,000 | 1,139,258 | 799,141 | Spain | 1.0% | |||||||||||||||||
| 5,419,392 | 11,602,611 | 14.1% | ||||||||||||||||||||
| Consumer Staples | ||||||||||||||||||||||
| Beverages | ||||||||||||||||||||||
Fomento Economico Mexico ADR | 30,000 | 1,614,722 | 2,791,800 | Mexico | 3.4% | |||||||||||||||||
| Household Products | ||||||||||||||||||||||
Unilever ADR | 50,000 | 1,315,509 | 3,045,500 | United Kingdom | 3.7% | |||||||||||||||||
| 2,930,231 | 5,837,300 | 7.1% | ||||||||||||||||||||
| Energy | ||||||||||||||||||||||
| Integrated Oils | ||||||||||||||||||||||
Total ADR | 34,096 | 1,833,763 | 1,755,944 | France | 2.1% | |||||||||||||||||
| 1,833,763 | 1,755,944 | 2.1% | ||||||||||||||||||||
| Financials | ||||||||||||||||||||||
| Banks | ||||||||||||||||||||||
Australia & New Zealand Banking Group ADR | 80,000 | 1,581,456 | 1,545,600 | Australia | 1.9% | |||||||||||||||||
Toronto-Dominion Bank | 50,000 | 1,250,872 | 2,732,500 | Canada | 3.3% | |||||||||||||||||
| 2,832,328 | 4,278,100 | 5.2% | ||||||||||||||||||||
| Diversified Banks | ||||||||||||||||||||||
Mitsubishi UFJ Financial Group ADR | 200,000 | 960,000 | 918,000 | Japan | 1.1% | |||||||||||||||||
| 3,792,328 | 5,196,100 | 6.3% | ||||||||||||||||||||
Continue on next page.
| 44 | May 31, 2019 | Semi-Annual Report | The accompanying notes are an integral part of these financial statements. | |||||
| Sextant International Fund | |
| Schedule of Investments | As of May 31, 2019 | |||||||||||||||||||||
| Common Stocks – 74.4% | Number of Shares | Cost | Market Value | Country1 | Percentage of Assets | |||||||||||||||||
| Health Care | ||||||||||||||||||||||
| Health Care Supplies | ||||||||||||||||||||||
Alcon2 | 6,600 | $203,580 | $383,988 | Switzerland | 0.5% | |||||||||||||||||
| Health Care Supply Chain | ||||||||||||||||||||||
Sinopharm Group | 250,000 | 798,792 | 936,940 | China | 1.1% | |||||||||||||||||
| Large Pharma | ||||||||||||||||||||||
Novartis ADR | 33,000 | 1,488,814 | 2,826,120 | Switzerland | 3.4% | |||||||||||||||||
Novo Nordisk ADR | 50,000 | 612,798 | 2,360,000 | Denmark | 2.9% | |||||||||||||||||
| 2,101,612 | 5,186,120 | 6.3% | ||||||||||||||||||||
| Medical Equipment | ||||||||||||||||||||||
Koninklijke Philips ADR | 21,905 | 814,100 | 867,876 | Netherlands | 1.1% | |||||||||||||||||
| 3,918,084 | 7,374,924 | 9.0% | ||||||||||||||||||||
| Materials | ||||||||||||||||||||||
| Agricultural Chemicals | ||||||||||||||||||||||
| �� | Nutrien | 15,600 | 914,639 | 760,344 | Canada | 0.9% | ||||||||||||||||
| Basic & Diversified Chemicals | ||||||||||||||||||||||
BASF ADR | 160,000 | 2,888,666 | 2,630,400 | Germany | 3.2% | |||||||||||||||||
| Steel Raw Material Suppliers | ||||||||||||||||||||||
Rio Tinto ADR | 10,000 | 532,838 | 579,300 | United Kingdom | 0.7% | |||||||||||||||||
| 4,336,143 | 3,970,044 | 4.8% | ||||||||||||||||||||
| Technology | ||||||||||||||||||||||
| Application Software | ||||||||||||||||||||||
Dassault Systemes ADR | 34,153 | 1,224,632 | 5,065,573 | France | 6.2% | |||||||||||||||||
NICE Systems ADR | 40,000 | 1,468,919 | 5,594,000 | Israel | 6.8% | |||||||||||||||||
| 2,693,551 | 10,659,573 | 13.0% | ||||||||||||||||||||
| Information Services | ||||||||||||||||||||||
Wolters Kluwer | 100,000 | 1,869,506 | 6,958,858 | Netherlands | 8.4% | |||||||||||||||||
| Semiconductor Manufacturing | ||||||||||||||||||||||
ASML | 20,000 | 697,516 | 3,761,000 | Netherlands | 4.6% | |||||||||||||||||
| 5,260,573 | 21,379,431 | 26.0% | ||||||||||||||||||||
| Total investments | $29,365,284 | 61,212,354 | 74.4% | |||||||||||||||||||
| Other assets (net of liabilities) | 21,009,983 | 25.6% | ||||||||||||||||||||
| Total net assets | $82,222,337 | 100.0% | ||||||||||||||||||||
| 1 | Country of domicile |
| 2 | Non-income producing security |
ADR: American Depository Receipt
| The accompanying notes are an integral part of these financial statements. | Semi-Annual Report | May 31, 2019 | 45 | |||||
| Sextant International Fund |  |
| Schedule of Investments | As of May 31, 2019 | |||||||||||||
Countries | ||||
|
| |||
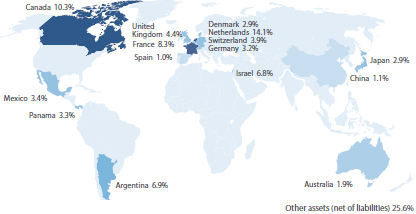 |
| |||
| Weightings shown are a percentage of total net assets. |
| |||
| 46 | May 31, 2019 | Semi-Annual Report | The accompanying notes are an integral part of these financial statements. | |||||
| Sextant International Fund | |
Statement of Assets and Liabilities
| As of May 31, 2019 |
| |||
| ||||
Assets | ||||
Investments in securities, at value | $61,212,354 | |||
Cash | 18,619,421 | |||
Prepaid insurance expenses | 2,179,511 | |||
Dividends receivable | 357,497 | |||
Prepaid expenses | 12,835 | |||
Total assets | 82,381,618 | |||
Liabilities | ||||
Payable for Fund shares redeemed | 108,433 | |||
Accrued advisory fees | 30,969 | |||
Accrued distribution fee | 10,218 | |||
Accrued audit expenses | 3,906 | |||
Accrued retirement plan custodial fees | 3,453 | |||
Accrued Chief Compliance Officer expenses | 1,494 | |||
Accrued other expenses | 808 | |||
Total liabilities | 159,281 | |||
Net assets | $82,222,337 | |||
Analysis of net assets | ||||
Paid-in capital (unlimited shares authorized, without par value) | $47,145,705 | |||
Total distributable earnings | 35,076,632 | |||
Net assets applicable to Fund shares outstanding | $82,222,337 | |||
Net asset value per Investor Share | SSIFX | |||
Net assets, at value | 57,660,364 | |||
Shares outstanding | 3,319,472 | |||
Net asset value, offering and redemption price per share | $17.37 | |||
Net asset value per Z Share | SIFZX | |||
Net assets, at value | $24,561,973 | |||
Shares outstanding | 1,411,794 | |||
Net asset value, offering and redemption price per share | $17.40 | |||
Statement of Operations
| Period ended May 31, 2019 |
| |||
| ||||
Investment income | ||||
Dividend income (net of foreign tax $158,065) | $794,508 | |||
Total investment income | 794,508 | |||
Expenses | ||||
Investment adviser fees | 229,896 | |||
Distribution fees - Investor Shares | 54,582 | |||
Audit fees | 17,716 | |||
Filing and registration fees | 14,575 | |||
Chief Compliance Officer expenses | 7,987 | |||
Trustee fees | 7,394 | |||
Printing and postage | 5,160 | |||
Other expenses | 3,079 | |||
Custodian fees | 2,256 | |||
Retirement plan custodial fees | ||||
Investor Shares | 7 | |||
Z Shares | 2,097 | |||
Legal fees | 1,451 | |||
Total gross expenses | 346,200 | |||
Less custodian fee credits | (2,033 | ) | ||
Net expenses | 344,167 | |||
Net investment income | $450,341 | |||
| ||||
Net realized gain from investments and foreign currency | $2,785,777 | |||
Net increase in unrealized appreciation on investments and foreign currency | 3,976,180 | |||
Net gain on investments | $6,761,957 | |||
Net increase in net assets resulting from operations | $7,212,298 | |||
| The accompanying notes are an integral part of these financial statements. | Semi-Annual Report | May 31, 2019 | 47 | |||||
| Sextant International Fund | |
Statements of Changes in Net Assets | Period ended May 31, 2019 | Year ended Nov. 30, 2018 | ||||||
Increase (decrease) in net assets from operations | ||||||||
From operations | ||||||||
Net investment income | $450,341 | $623,611 | ||||||
Net realized gain on investment | 2,785,777 | 3,896,894 | ||||||
Net increase (decrease) in unrealized appreciation | 3,976,180 | (3,361,106 | ) | |||||
Net increase in net assets | 7,212,298 | 1,159,399 | ||||||
Distributions to shareowners | ||||||||
Net distribution to shareholders - Investor Shares | (2,929,551 | ) | (3,595,584 | ) | ||||
Net distribution to shareholders - Z Shares | (1,596,893 | ) | (1,678,906 | ) | ||||
Total distributions | (4,526,444 | ) | (5,274,490 | ) | ||||
Capital share transactions | ||||||||
Proceeds from sales of shares | ||||||||
Investor Shares | 16,613,289 | 4,219,098 | ||||||
Z Shares | 3,379,974 | 1,332,045 | ||||||
Value of shares issued in reinvestment of dividends | ||||||||
Investor Shares | 2,886,627 | 3,545,645 | ||||||
Z Shares | 1,555,608 | 1,619,175 | ||||||
Cost of shares redeemed | ||||||||
Investor Shares | (5,288,759 | ) | (9,575,271 | ) | ||||
Z Shares | (1,990,024 | ) | (1,998,163 | ) | ||||
Total capital share transactions | 17,156,715 | (857,471 | ) | |||||
Total increase (decrease) in net assets | 19,842,569 | (4,972,562 | ) | |||||
Net assets | ||||||||
Beginning of period | 62,379,768 | 67,352,330 | ||||||
End of period | $82,222,337 | $62,379,768 | ||||||
Shares of the Fund sold and redeemed | ||||||||
Investor Shares (SSIFX) | ||||||||
Number of shares sold | 975,730 | 247,089 | ||||||
Number of shares issued in reinvestment of dividends and distributions | 195,174 | 211,176 | ||||||
Number of shares redeemed | (329,025 | ) | (556,311 | ) | ||||
Net increase (decrease) in number of shares outstanding | 841,879 | (98,046 | ) | |||||
Z Shares (SIFZX) | ||||||||
Number of shares sold | 204,357 | 77,828 | ||||||
Number of shares issued in reinvestment of dividends and distributions | 105,108 | 96,380 | ||||||
Number of shares redeemed | (124,107 | ) | (115,999 | ) | ||||
Net increase in number of shares outstanding | 185,358 | 58,209 | ||||||
| 48 | May 31, 2019 | Semi-Annual Report | The accompanying notes are an integral part of these financial statements. | |||||
| Sextant International Fund:Financial Highlights | |
Investor Shares (SSIFX) | For period ended | For year ended November 30, | ||||||||||||||||||||||
Selected data per share of outstanding capital stock throughout each period: | May 31, 2019 | 2018 | 2017 | 2016 | 2015 | 2014 | ||||||||||||||||||
Net asset value at beginning of period | $16.83 | $17.98 | $14.37 | $14.35 | $15.47 | $15.80 | ||||||||||||||||||
Income from investment operations | ||||||||||||||||||||||||
Net investment income | 0.09 | A | 0.15 | A | 0.16 | A | 0.22 | 0.25 | 0.65 | |||||||||||||||
Net gains (losses) on securities (both realized & unrealized) | 1.64 | 0.14 | 3.65 | (0.15 | ) | (1.11 | ) | (0.35 | ) | |||||||||||||||
Total from investment operations | 1.73 | 0.29 | 3.81 | 0.07 | (0.86 | ) | 0.30 | |||||||||||||||||
Less distributions | ||||||||||||||||||||||||
Dividends (from net investment income) | (0.15 | ) | (0.17 | ) | (0.20 | ) | (0.05 | ) | (0.25 | ) | (0.63 | ) | ||||||||||||
Distributions (from capital gains) | (1.04 | ) | (1.27 | ) | ||||||||||||||||||||
Distributions (from return of capital) | - | - | - | - | (0.01 | ) | - | |||||||||||||||||
Total distributions | (1.19 | ) | (1.44 | ) | (0.20 | ) | (0.05 | ) | (0.26 | ) | (0.63 | ) | ||||||||||||
Net asset value at end of period | $17.37 | $16.83 | $17.98 | $14.37 | $14.35 | $15.47 | ||||||||||||||||||
Total returnB | 11.57% | 1.63% | 26.76% | 0.49% | (5.58 | )% | 1.88% | |||||||||||||||||
Ratios / supplemental data | ||||||||||||||||||||||||
Net assets ($000), end of period | $57,660 | $41,688 | $46,321 | $62,412 | $78,296 | $103,450 | ||||||||||||||||||
Ratio of expenses to average net assets | ||||||||||||||||||||||||
Before custodian fee creditsC | 1.13% | 1.05% | 1.04% | 1.00% | 1.05% | 0.80% | ||||||||||||||||||
After custodian fee creditsC | 1.12% | 1.04% | 1.04% | 1.00% | 1.04% | 0.79% | ||||||||||||||||||
Ratio of net investment income after custodian fee credits to average net assetsC | 1.27% | 0.89% | 1.00% | 1.36% | 1.49% | 3.58% | ||||||||||||||||||
Portfolio turnover rateB | 0% | 2% | 2% | 0% | 0% | 3% | ||||||||||||||||||
Z Shares (SIFZX) | For period ended | Year ended | Period ended | |||||||||
Selected data per share of outstanding capital stock throughout each period: | May 31, 2019 | November 30, 2018 | November 30, 2017 | D | ||||||||
Net asset value at beginning of period | $16.87 | $18.00 | $16.55 | |||||||||
Income from investment operations | ||||||||||||
Net investment income | 0.12 | A | 0.19 | A | 0.13 | A | ||||||
Net gains on securities (both realized & unrealized) | 1.64 | 0.14 | 1.41 | |||||||||
Total from investment operations | 1.76 | 0.33 | 1.54 | |||||||||
Less distributions | ||||||||||||
Dividends (from net investment income) | (0.19 | ) | (0.19 | ) | (0.09 | ) | ||||||
Distributions (from capital gains) | (1.04 | ) | (1.27 | ) | - | |||||||
Total distributions | (1.23 | ) | (1.46 | ) | (0.09 | ) | ||||||
Net asset value at end of period | $17.40 | $16.87 | $18.00 | |||||||||
Total returnB | 11.76% | 1.83% | 9.32% | C | ||||||||
Ratios / supplemental data | ||||||||||||
Net assets ($000), end of period | $24,562 | $20,692 | $21,031 | |||||||||
Ratio of expenses to average net assets | ||||||||||||
Before custodian fee creditsC | 0.88% | 0.84% | 0.79% | D | ||||||||
After custodian fee creditsC | 0.88% | 0.82% | 0.78% | D | ||||||||
Ratio of net investment income after custodian fee credits to average net assetsC1.53% | 1.13% | 0.53% | D | |||||||||
Portfolio turnover rateB | 0% | 2% | 2% | C | ||||||||
| A | Calculated using average shares outstanding |
| B | Not annualized for periods of less than one year |
| C | Annualized for periods of less than one year |
| D | Operations commenced on June 2, 2017 |
| The accompanying notes are an integral part of these financial statements. | Semi-Annual Report | May 31, 2019 | 49 | |||||
| Notes to Financial Statements |
NOTE 1 – Organization
Saturna Investment Trust (the “Trust”) was established under Washington State Law as a business trust on February 20, 1987. The Trust is registered as anopen-end, diversified management company under the Investment Company Act of 1940, as amended. Nine portfolio series have been created to date: Sextant Short-Term Bond Fund, Sextant Bond Income Fund, Sextant Core Fund, Sextant Global High Income Fund, Sextant Growth Fund, Sextant International Fund (each, a “Fund”, and collectively, the “Funds”), IdahoTax-Exempt Fund, Saturna Sustainable Equity Fund, and Saturna Sustainable Bond Fund. IdahoTax-Exempt Fund, Saturna Sustainable Equity Fund, and Saturna Sustainable Bond Fund are offered through separate prospectuses, the results of which are contained in separate reports.
Sextant Growth Investor Shares (previously known as Idaho Limited MaturityTax-Exempt Fund until October 12, 1990, then Northwest Growth Fund until September 28, 1995, when the investment objective of only Northwest stocks was changed) commenced operations as an equity fund on December 30, 1990. Sextant Growth Fund Z Shares began operations June 2, 2017. Sextant International Investor Shares began operations September 28, 1995 and Sextant International Fund Z Shares began operations on June 2, 2017. Sextant Short-Term Bond began operations September 28, 1995. Sextant Bond Income Fund (previously known as WashingtonTax-Exempt Fund until September 28, 1995, when the investment objective of only Washington State Municipal Bonds was changed) began operations on March 1, 1993. Sextant Core Fund commenced operations March 30, 2007. Sextant Global High Income Fund commenced operations March 30, 2012.
Each Fund is an investment company and accordingly follows the investment company accounting and reporting guidance of the Financial Accounting Standards Board (FASB) Accounting Standard Codification Topic 946 “Financial Services - Investment Companies”.
Each class of shares of a Fund represents an interest in the same portfolio of investments of the Fund and has in all respects the same rights and obligations as each other class of the Fund, except that each class bears its own class expenses, and each class has exclusive voting rights. Each class of shares may be subject to different investment minimums and other conditions of eligibility as may be described in the prospectus for the particular class of shares, as from time to time in effect.
Income, realized and unrealized capital gains and losses, and expenses to be paid by a Fund and not allocated to a particular class as provided below, shall be allocated to each class on the basis of relative net assets. Expenses allocable to a specific class are expenses specifically incurred by or for such class including the following:
| • | Distribution fees; |
| • | Retirement plan custodial fees; and |
| • | Any applicable service fees. |
Net investment income dividends and capital gain distributions paid by the Fund on each class of its shares will be calculated in the same manner on the same day and at the same time.
Investment risks:
Growth,International,Core, Short-Term Bond, Bond Income, andGlobal High Income Funds: The value of each Fund’s shares rises and falls as the value of the securities in which the Fund invests goes up and down. Fund share prices, yields, and total returns will change with market fluctuations as well as the fortunes of the countries, industries, and companies in which the Fund invests. The Funds do not use derivatives to hedge currency, interest rate, or credit risk.
Liquidity risk exists when particular investments are difficult to sell. If a Fund holds illiquid investments, its portfolio may be more difficult to value, especially in changing markets. Investments by a Fund in foreign securities and those that are thinly traded, such as lower quality issuers and smaller companies, tend to involve greater liquidity risk. If a Fund is forced to sell or unwind these investments to meet redemptions or for other cash needs, the Fund may suffer a penalty. Additionally, the market for certain investments may become illiquid under adverse market or economic conditions independent of any specific adverse changes in the conditions of a particular issuer. In such cases, the Fund, due to limitations on investments in illiquid securities and the difficulty in purchasing and selling such securities, may be unable to achieve its investment objective.
Growth andCore Funds: Smaller companies involve higher investment risks in that they often have limited product lines, markets, and resources, or their securities may trade less frequently and have greater price fluctuation than those of larger companies.
Growth stocks, which can be priced on future expectations rather than current results, may decline substantially when expectations are not met.
International,Core, Short-Term Bond, Bond Income, andGlobal High Income Funds: Foreign investing involves risks not normally associated with investing in US securities. These include fluctuations in currency exchange rates, less public information about securities, less governmental market supervision, and the lack of uniform financial, social, and political standards. Foreign investing heightens the risk of confiscatory taxation, seizure or nationalization of assets, currency controls, or adverse political or social developments that affect investments. The risks of investing in foreign securities are typically greater in less developed or emerging countries.
Core Fund: The Core Fund has the risks of growth stocks, foreign securities, credit, and interest rates — but these risks are mitigated by spreading its investments in both stocks and bonds, and by favoring income-producing securities and those of larger, more seasoned companies.
Short-Term Bond,Bond Income,Global High Income,and Core Funds: Bonds entail credit risk, which is the possibility that a bond will not be able to pay interest or principal when due. If the credit quality of a bond is perceived to decline, investors will demand a higher yield, which means a lower price on that bond to compensate for the higher level of risk.
Interest rate fluctuations affect bond prices and a Fund’s net asset value, but not the income received by the Fund from its portfolio securities. Because prices and yields on debt securities vary over time, a Fund’s yield also varies. Bonds with embedded callable options also contain an element of prepayment risk. When interest rates decline, issuers can retire their debt and reissue bonds at a lower interest rate. This hurts investors because yields available for reinvestment will have declined and upward price mobility on callable bonds is generally limited by the call price.
Global High Income Fund: Issuers of high-yield securities are generally not as strong financially as those issuing higher quality securities. These issuers are more likely to encounter financial difficulties and are more vulnerable to changes in the relevant economy, such as a recession or a sustained period of rising interest rates, that could affect their ability to make interest, principal, and dividend payments as expected. The prices of high-yield securities generally fluctuate more than those of higher quality. High-yield securities are generally more illiquid (harder to sell) and harder to value.
The Funds may invest substantially in one or more sectors, which can increase volatility and exposure to issues specific to a particular sector or industry.
| 50 | May 31, 2019 | Semi-Annual Report | ||||
| Notes to Financial Statements(continued) |
NOTE 2 – Unaudited Information
The information in this interim report has not been subjected to independent audit.
NOTE 3 – Significant Accounting Policies
The following is a summary of the significant accounting policies, in conformity with accounting principles generally accepted in the United States of America, which are consistently followed by the Funds in preparation of their financial statements.
Security valuation:
Investments in securities traded on a national securities exchange andover-the-counter securities for which sale prices are available are valued at that price. Securities for which there are no sales are valued at the latest bid price.
Debt securities are valued usingbid-side valuations provided by an independent service. The service determines valuations using factors such as yields or prices of bonds of comparable quality, type of issue, coupon maturity, ratings, trading activity, and general market conditions.
Fixed-income debt instruments, such as commercial paper, bankers’ acceptances and US Treasury Bills, with a maturity of 60 days or less are valued at amortized cost, which approximates market value. Any discount or premium is accreted or amortized on a straight-line basis until maturity.
Foreign markets may close before the time as of which the Funds’ share prices are determined. Because of this, events occurring after the close and before the determination of the Funds’ share prices may have a material effect on the values of some or all of the Funds’ foreign securities. To account for this, the Funds may use outside pricing services for valuation of theirnon-US securities.
In cases in which there is not a readily available market price, a fair value for such security is determined in good faith by or under the direction of the Board of Trustees.
Security transactions are recorded on the trade date. Realized gains and losses on sales of securities are recorded on the identified cost basis.
Foreign currency:
Investment securities and other assets and liabilities denominated in foreign currencies are translated into US dollar amounts at the date of valuation. Purchases and sales of investment securities and income and expense items denominated in foreign currencies are translated into US dollar amounts on the respective dates of such transactions.
The Funds do not isolate that portion of the results of operations resulting from changes in foreign exchange rates on investments from the fluctuations arising from changes in market prices of securities held. Such fluctuations are included with the net realized and unrealized gain or loss from investments.
Reported net realized foreign exchange gains or losses arise from sales of foreign currencies, currency gains or losses realized between the trade and settlement dates on securities transactions, and the difference between the amounts of dividends, interest, and foreign withholding taxes recorded on the Funds’ books and the US dollar equivalent of the amounts actually received or paid. Net unrealized foreign exchange gains and losses arise from changes in the fair values of assets and liabilities, other than investments in securities at the fiscal period end, resulting from changes in exchange rates.
Share valuation:
The net asset value (“NAV”) per share of each Fund is calculated by dividing the sum of the value of the securities held by each Fund, plus cash and other assets, minus all liabilities (including estimated accrued expenses) by the total number of shares outstanding for each Fund, rounded to the nearest cent. The Funds’ shares are not priced or traded on days the New York Stock Exchange is closed. The NAV is the offering and redemption price per share.
Fair value measurements:
Accounting Standards Codification (ASC) 820 establishes a three-tier framework for measuring fair value based on a hierarchy of inputs. The hierarchy distinguishes between market data obtained from independent sources (observable inputs) and the Funds’ own market assumptions (unobservable inputs). These inputs are used in determining the value of the Funds’ investments and are summarized below.
| Level 1 — | Unadjusted quoted prices in active markets for identical assets or liabilities that the Trust has the ability to access. |
| Level 2 — | Observable inputs other than quoted prices in Level 1 that are observable for the asset or liability, either directly or indirectly. These inputs may include quoted prices for the identical instrument on an inactive market, prices for similar instruments, interest rates, prepayment speeds, credit risk, yield curves, default rates, and similar data. |
| Level 3 — | Unobservable inputs for the asset or liability, to the extent relevant observable inputs are not available, representing the Trust’s own assumptions about the assumptions a market participant would use in valuing the asset or liability, and would be based on the best information available. |
The availability of observable inputs can vary from security to security and is affected by a wide variety of factors, including, for example, the type of security, whether the security is new and not yet established in the marketplace, the liquidity of markets, and other characteristics particular to the security. To the extent that valuation is based on models or inputs that are less observable or unobservable in the market, the determination of fair value requires more judgment. Accordingly, the degree of judgment exercised in determining fair value is greatest for instruments categorized in Level 3.
The inputs used to measure fair value may fall into different levels of the fair value hierarchy. In such cases, for disclosure purposes, the level in the fair value hierarchy within which the fair value measurement falls in its entirety, is determined based on the lowest level input that is significant to the fair value measurement in its entirety.
The inputs or methodology used for valuing securities are not necessarily an indication of the risk associated with investing in those securities.
| Semi-Annual Report | May 31, 2019 | 51 | ||||
| Notes to Financial Statements(continued) |
The following is a summary of the inputs used as of May 31, 2019, in valuing the Funds’ investments carried at value:
| Funds | Level 1 | Level 2 | Level 3 | Total | ||||||||||||
Short-Term Bond | ||||||||||||||||
Corporate Bonds1 | $- | $7,555,733 | $- | $7,555,733 | ||||||||||||
Government Bonds1 | $- | $2,599,850 | $- | $2,599,850 | ||||||||||||
Total | $- | $10,155,583 | $- | $10,155,583 | ||||||||||||
Bond Income | ||||||||||||||||
Corporate Bonds1 | $- | $6,533,937 | $- | $6,533,937 | ||||||||||||
Government Bonds1 | $- | $2,999,872 | $- | $2,999,872 | ||||||||||||
Municipal Bonds1 | $- | $1,332,995 | $- | $1,332,995 | ||||||||||||
Total | $- | $10,866,804 | $- | $10,866,804 | ||||||||||||
Core | ||||||||||||||||
Common Stocks1 | $8,406,693 | $- | $- | $8,406,693 | ||||||||||||
Corporate Bonds1 | $- | $2,905,529 | $- | $2,905,529 | ||||||||||||
Government Bonds1 | $- | $2,028,602 | $- | $2,028,602 | ||||||||||||
Municipal Bonds1 | $- | $438,038 | $- | $438,038 | ||||||||||||
Total | $8,406,693 | $5,372,169 | $- | $13,778,862 | ||||||||||||
Global High Income | ||||||||||||||||
Common Stocks | ||||||||||||||||
Communications | $626,295 | $- | $- | $626,295 | ||||||||||||
Consumer Discretionary | 156,820 | - | - | 156,820 | ||||||||||||
Energy | 841,299 | - | - | 841,299 | ||||||||||||
Financials | 222,500 | 176,856 | - | 399,356 | ||||||||||||
Health Care | 378,024 | - | - | 378,024 | ||||||||||||
Industrials | - | 308,882 | - | 308,882 | ||||||||||||
Materials | 427,850 | - | - | 427,850 | ||||||||||||
Technology | 837,539 | - | - | 837,539 | ||||||||||||
Total Common Stocks | $3,490,327 | $485,738 | $- | $3,976,065 | ||||||||||||
Corporate Bonds1 | $- | $2,508,532 | $- | $2,508,532 | ||||||||||||
Government Bonds1 | $- | $2,611,989 | $- | $2,611,989 | ||||||||||||
Municipal Bonds1 | $- | $292,530 | $- | $292,530 | ||||||||||||
Warrants1 | $- | $- | $- | $- | ||||||||||||
Total | $3,490,327 | $5,898,789 | $- | $9,389,116 | ||||||||||||
Growth | ||||||||||||||||
Common Stocks1 | $38,251,611 | $- | $- | $38,251,611 | ||||||||||||
Total | $38,251,611 | $- | $- | $38,251,611 | ||||||||||||
International | ||||||||||||||||
Common Stocks | ||||||||||||||||
Communications | $4,096,000 | $- | $- | $4,096,000 | ||||||||||||
Consumer Discretionary | $10,803,470 | $799,141 | $- | $11,602,611 | ||||||||||||
Consumer Staples | $5,837,300 | $- | $- | $5,837,300 | ||||||||||||
Energy | $1,755,944 | $- | $- | $1,755,944 | ||||||||||||
Financials | $5,196,100 | $- | $- | $5,196,100 | ||||||||||||
Health Care | $6,437,984 | $936,940 | $- | $7,374,924 | ||||||||||||
Materials | $3,970,044 | $- | $- | $3,970,044 | ||||||||||||
Technology | $14,420,573 | $6,958,858 | $- | $21,379,431 | ||||||||||||
Total | $52,517,415 | $8,694,939 | $- | $61,212,354 | ||||||||||||
During the period ended May 31, 2019, no Fund had transfers between Level 1, Level 2, or Level 3.
| 1 | See Schedule of Investments for industry breakout. |
| 52 | May 31, 2019 | Semi-Annual Report | ||||
| Notes to Financial Statements(continued) |
Investment concentration:
The Funds may have deposits of cash with the custodian from time to time for one or more reasons. “Other assets (net of liabilities)” in the Funds’ Schedules of Investments primarily represents cash on deposit with the custodian. Cash on deposit will vary widely over time. Accounting Standards Codification (“ASC”) 825,“Financial Instruments,” identifies these items as a concentration of credit risk. The risk is managed by careful financial analysis and review of the custodian’s operations, resources, and protections available to the Trust. This process includes evaluation of other financial institutions providing investment company custody services.
Federal income taxes:
The Funds intend to comply with the requirements of the Internal Revenue Code necessary to qualify as a regulated investment company and to make the requisite distributions of income and capital gains to its shareowners sufficient to relieve it from all or substantially all federal income taxes. Therefore, no federal income tax provision is required.
The Funds recognize the tax benefits of uncertain tax positions only where the position is “more likely than not” to be sustained assuming examination by tax authorities. Management has analyzed the Funds’ tax positions and has concluded that no liability for unrecognized tax benefits should be recorded related to uncertain tax positions taken on returns filed for open tax years (2015 – 2017) or expected to be taken in the Funds’ 2018 tax returns. The Funds identify their major tax jurisdictions as US federal and foreign jurisdictions where the Funds make significant investments; however, the Funds are not aware of any tax positions for which it is reasonably possible that the total amounts of unrecognized tax benefits will change materially in the next twelve months.
Reclassification of capital accounts:
Accounting principles generally accepted in the United States of America require that certain components of net assets relating to permanent differences be reclassified between financial and tax reporting. These reclassifications have no effect on net assets or net asset value per share. As of November 30, 2018, the reclassification of capital accounts were as follows:
| Growth | International | |||||||
Distributable earnings | $(6,464 | ) | $(5,482 | ) | ||||
Paid-in capital | $6,464 | $5,482 | ||||||
These reclassifications were due to the treatment of foreign currencies, expiring capital loss carryforwards, and investments in real estate investment trusts (REITs) and partnerships.
Distributions to shareowners:
For the Sextant Short-Term Bond Fund and Sextant Bond Income Fund, dividends to shareowners from net investment income are paid daily and distributed on the last business day of each month. For the Sextant Core Fund, Sextant Global High Income Fund, Sextant Growth Fund, and Sextant International Fund, dividends to shareowners from net investment income are payable annually, typically by the end of the year. Distributions of capital gains, if any, are made at least annually, and as required to comply with federal excise tax requirements. Distributions to shareowners are determined in accordance with income tax regulations and are recorded on theex-dividend date. Dividends are paid in shares of the Funds, at the net asset value on the payable date. Shareowners may elect to take distributions if they total $10 or more in cash.
Use of estimates:
The preparation of financial statements in conformity with accounting principles generally accepted in the United States of America requires management to make estimates and assumptions that affect the reported amounts of assets and liabilities and disclosure of contingent assets and liabilities at the date of the financial statements and the reported amounts of increases and decreases in net assets from operations during the reporting period. Actual results could differ from those estimates.
Foreign taxes:
Withholding taxes on foreign dividends are paid (a portion of which may be reclaimable) or provided for in accordance with the applicable country’s tax rules and rates and are disclosed in the Statement of Operations. Withholding tax reclaims are filed in certain countries to recover a portion of the amounts previously withheld. The Funds record a reclaim receivable based on a number of factors, including a jurisdiction’s legal obligation to pay reclaims as well as payment history and market convention.
Other:
Interest income is recognized on an accrual basis. Premiums on securities purchased are amortized, and discounts are accreted over the lives of the respective securities. Dividends from equity securities are recorded as income on theex-dividend date.
Recent accounting pronouncements:
As of November 5, 2018, pursuant to the SEC Release#33-10532 “Disclosure Update and Simplification”, funds are no longer required to disclose whether the distributions from earnings are either from net investment income or net realized capital gains. The presentation for the year ended November 30, 2017, has been adjusted for this change in the Statement of Changes in Net Assets.
In March 2017, FASB issued Accounting Standards UpdateNo. 2017-08, “Receivables—Nonrefundable Fees and Other Costs (Subtopic310-20), Premium Amortization on Purchased Callable Debt Securities” (“ASU2017-08”). ASU2017-08 shortens the amortization period to the earliest call date for certain purchased callable debt securities held at a premium. The guidance is effective for fiscal years, and interim periods within those fiscal years, beginning after December 15, 2018. Management is currently evaluating the impact of applying this guidance.
In August 2018, FASB issued Accounting Standards UpdateNo. 2018-13, “Fair Value Measurement (Topic 820: Disclosure Framework—Changes to the Disclosure Requirements for Fair Value Measurement” (“ASU2018-13”). ASU2018-13 eliminates the requirement to disclose the amount of and reasons for transfers between Level 1 and Level 2 of the fair value hierarchy, the timing of transfers between levels of the fair value hierarchy and the valuation processes for Level 3 fair value measurements. ASU2018-13 will require the need to disclose the range and weighted average used to develop significant unobservable inputs for Level 3 fair value measurements and the changes in unrealized gains and losses for recurring Level 3 fair value measurements. ASU2018-13 will also require that information is provided about the measurement uncertainty of Level 3 fair value measurements as of the reporting date. The guidance is effective for fiscal years, and interim periods within those fiscal years, beginning after December 15, 2019, and allows for early adoption of either the entire standard or only the provisions that eliminate or modify the requirements. Management has elected to adopt early the provisions that eliminate the disclosure requirements. Management is still currently evaluating the impact of applying the rest of the guidance.
| Semi-Annual Report | May 31, 2019 | 53 | ||||
| Notes to Financial Statements(continued) |
NOTE 4 – Transactions with Affiliated Persons
Under contracts approved annually by the Trust’s independent trustees, Saturna Capital Corporation provides investment advisory services and certain other administrative services required to conduct Trust business. Expenses incurred by the Trust on behalf of the Funds (e.g., legal fees) are allocated to the Funds on the basis of relative daily average net assets. For such services, each of the Funds pays the adviser a base Investment Advisory and Administrative Services Fee of 0.50% of average net assets per annum, payable monthly for each of the Funds. In addition, the adviser has agreed to certain limits on other expenses, as described below.
The base Advisory Fee is subject to adjustment up or down depending on the investment performance of the Fund relative to a specified index.
| • | For each month in which the Fund’s total investment return (change in net asset value plus all distributions reinvested) for the one year period through that month outperforms or underperforms the total return of a specified index for that period by 1% or more but less than 2%, the Base Fee is increased or decreased by the annual rate of .10% of the Fund’s average daily net assets for the preceding year. |
| • | If the outperformance or underperformance is 2% or more, then the adjustment is at the annual rate of ..20%. |
For the period ended May 31, 2019, due to the performance adjustment the Advisory Fee amounts charged or reduced in addition to the Base Fee were as follows:
| Base Fees | Performance Fee | Adviser Fee | ||||||||||
Short-Term Bond | $26,244 | $- | $26,244 | |||||||||
Bond Income | 29,961 | (108 | ) | 29,853 | ||||||||
Core | 32,267 | 7,535 | 39,802 | |||||||||
Global High Income | 23,782 | 9,271 | 33,053 | |||||||||
Growth | 95,833 | 36,421 | 132,254 | |||||||||
International | $165,825 | $64,071 | $229,896 | |||||||||
The adviser has undertaken to limit expenses through March 31, 2020 of Sextant Short-Term Bond Fund to 0.60%, Sextant Bond Income Fund to 0.65%, and Sextant Global High Income to 0.75%. For the period ended May 31, 2019, the advisory fees incurred were as follows:
| Adviser Fees | Adviser Fees Waived | Expense Reimbursement | ||||||||||
Short-Term Bond | $26,244 | $(14,070 | ) | $- | ||||||||
Bond Income | 29,853 | (11,351 | ) | - | ||||||||
Core | 39,802 | - | - | |||||||||
Global High Income | 33,053 | (15,856 | ) | - | ||||||||
Growth | 132,254 | - | - | |||||||||
International | $229,896 | $- | $- | |||||||||
In accordance with the expense limitation noted above, for the period ended May 31, 2019, Saturna Capital waived a portion of the advisory fees of the Sextant Short-Term Bond Fund, Sextant Bond Income Fund, and Sextant Global High Income Fund. The adviser cannot recoup previously waived fees.
Saturna Brokerage Services, Inc. (“SBS”), a discount brokerage and subsidiary of Saturna Capital Corporation, is registered as a broker-dealer and acts as distributor. On October 3, 2006, The Funds adopted a Distribution Plan in accordance with Rule12b-1 under the 1940 Act. The plan provides that the Funds will pay a fee to SBS at an annual rate of 0.25% of the average net assets of the Funds. On June 2, 2017,12b-1 fees were terminated for all Funds except Sextant Growth Investor Shares and Sextant International Investor Shares.
During the fiscal year ended May 31, 2019, the Trust paid SBS the following amounts:
| Distribution (12b-1) Fees | ||||
Short-Term Bond | n/a | |||
Bond Income | n/a | |||
Core | n/a | |||
Global High Income | n/a | |||
GrowthInvestor Shares (SSGFX) | $4,791 | |||
GrowthZ Shares (SGZFX) | n/a | |||
InternationalInvestor Shares (SSIFX) | $54,582 | |||
InternationalZ Shares (SIFZX) | n/a | |||
SBS is used to effect portfolio transactions for the Trust. SBS currently executes portfolio transactions without commission. Transactions effected through other brokers are subject to commissions payable to that broker.
Saturna Trust Company (“STC”), a subsidiary of Saturna Capital, acts as retirement plan custodian for Fund shareowners. Each Fund pays an annual fee of $10 per account for retirement plan services to Saturna Trust Company. For the period ended May 31, 2019, the Funds incurred the following amounts:
| Retirement plan custodial fees | ||||
Short-Term Bond | $1,768 | |||
Bond Income | 1,444 | |||
Core | 1,479 | |||
Global High Income | 803 | |||
GrowthInvestor Shares (SSGFX) | 7 | |||
GrowthZ Shares (SGZFX) | 3,481 | |||
InternationalInvestor Shares (SSIFX) | 7 | |||
InternationalZ Shares (SIFZX) | $2,097 | |||
Mrs. Jane Carten serves as a trustee and president of the Trust. She is also a director and president of Saturna Capital and vice president of Saturna Trust Company. Mrs. Carten is not compensated by the Trust. For the period ended May 31, 2019, the Trust incurred compensation expenses of $17,000 which is included in $35,206 of total expenses for the independent Trustees.The Sextant Funds paid $26,199 of these total expenses.
The officers of the Trust are paid by Saturna Capital, not the Trust, except the Chief Compliance Officer, who may be partially compensated by the Trust. For the period ended May 31, 2019, the Funds paid the following compensation expenses for the Chief Compliance Officer:
| Chief Compliance Officer | ||||
Short-Term Bond | $1,310 | |||
Bond Income | 1,251 | |||
Core | 1,672 | |||
Global High Income | 1,420 | |||
Growth | 5,385 | |||
International | $7,987 | |||
On May 31, 2019, the trustees, officers, and their affiliates as a group owned 35.08%, 27.72%, 44.88%, 53.57%, 0.10%, 19.01%, 0.00%, and 29.86% of the outstanding shares of Short-Term Bond Fund, Bond Income Fund, Core Fund, Global High Income Fund, Growth Fund Investor Shares, Growth Fund Z Shares, International Fund Investor Shares, and International Fund Z Shares, respectively.
| 54 | May 31, 2019 | Semi-Annual Report | ||||
| Notes to Financial Statements(continued) |
NOTE 5 – Distributions to Shareowners
The tax characteristics of distributions paid during the period ended May 31, 2019, and and the fiscal year ended November 30, 2018, were as follows:
| Period ended May 31, 2019 | Year ended Nov. 30, 2018 | |||||||
Short-Term Bond Fund | ||||||||
Ordinary income | $91,708 | $145,570 | ||||||
Long-term capital gain1 | - | 4,622 | ||||||
Bond Income Fund | ||||||||
Ordinary income | 161,963 | 309,851 | ||||||
Core Fund | ||||||||
Ordinary income | 179,879 | 166,943 | ||||||
Global High Income Fund | ||||||||
Ordinary income | 311,447 | 253,597 | ||||||
Growth Fund | ||||||||
Ordinary income | 181,466 | 290,653 | ||||||
Long-term capital gain1 | 1,640,415 | 1,777,473 | ||||||
International Fund | ||||||||
Ordinary income | 627,004 | 643,299 | ||||||
Long-term capital gain1 | $3,899,440 | $4,631,191 | ||||||
| 1 | Long-Term Capital Gain dividend designated at 20% rate pursuant to Section 852(b)(3) of the Internal Revenue Code. |
NOTE 6 – Federal Income Taxes
The cost basis of investments for federal income tax purposes at May 31, 2019 was as follows:
| Short-Term Bond | Bond Income | |||||||
Cost of investments | $10,133,267 | $10,482,444 | ||||||
Gross tax unrealized appreciation | 72,882 | 418,240 | ||||||
Gross tax unrealized depreciation | (50,566 | ) | (33,880 | ) | ||||
Net tax unrealized appreciation (depreciation) | $22,316 | $384,360 | ||||||
| Core | Global High Income | |||||||
Cost of investments | $11,823,509 | $8,962,855 | ||||||
Gross tax unrealized appreciation | 2,064,409 | 767,115 | ||||||
Gross tax unrealized depreciation | (109,056 | ) | (340,854 | ) | ||||
Net tax unrealized appreciation (depreciation) | $1,955,353 | $426,261 | ||||||
| Growth | International | |||||||
Cost of investments | $20,331,592 | $29,365,284 | ||||||
Gross tax unrealized appreciation | 18,313,747 | 33,304,493 | ||||||
Gross tax unrealized depreciation | (393,728 | ) | (1,457,423 | ) | ||||
Net tax unrealized appreciation (depreciation) | $17,920,019 | $31,847,070 | ||||||
As of November 30, 2018, components of distributable earnings on a tax basis were as follows:
| Short-Term Bond | ||||
Undistributed ordinary income | $2,871 | |||
Tax accumulated earnings | 2,871 | |||
Accumulated capital losses | (16,794 | ) | ||
Unrealized depreciation | (199,275 | ) | ||
Total accumulated earnings | $(213,198 | ) | ||
| Bond Income | ||||
Undistributed ordinary income | $26 | |||
Tax accumulated earnings | 26 | |||
Accumulated capital losses | (46,167 | ) | ||
Unrealized depreciation | (181,766 | ) | ||
Total accumulated earnings | $(227,907 | ) | ||
| Core | ||||
Undistributed ordinary income | $175,481 | |||
Tax accumulated earnings | 175,481 | |||
Accumulated capital losses | (23,538 | ) | ||
Unrealized appreciation | 1,822,846 | |||
Other unrealized losses | (2 | ) | ||
Total accumulated earnings | $1,974,787 | |||
| Global High Income | ||||
Undistributed ordinary income | $311,375 | |||
Tax accumulated earnings | 311,375 | |||
Accumulated capital losses | (32,326 | ) | ||
Unrealized appreciation | 400,022 | |||
Other unrealized losses | (680 | ) | ||
Total accumulated earnings | $678,391 | |||
| Growth | ||||
Undistributed ordinary income | $175,267 | |||
Accumulated capital gains | 1,640,036 | |||
Tax accumulated earnings | 1,815,303 | |||
Unrealized appreciation | 16,450,930 | |||
Total accumulated earnings | $18,266,233 | |||
| International | ||||
Undistributed ordinary income | $621,093 | |||
Accumulated capital gains | 3,899,325 | |||
Tax accumulated earnings | 4,520,418 | |||
Unrealized appreciation | 27,870,753 | |||
Other unrealized losses | (393 | ) | ||
Total accumulated earnings | $32,390,778 | |||
| Semi-Annual Report | May 31, 2019 | 55 | ||||
| Notes to Financial Statements(continued) |
As of November 30, 2018, the Funds had capital loss carryforwards as follows, subject to regulation.
| Carryforward | Expiration | |||||||
Short-Term Bond | ||||||||
Long-term loss carryforward | $16,794 | Unlimited | ||||||
| $16,794 | ||||||||
Bond Income | ||||||||
Long-term loss carryforward | $46,167 | Unlimited | ||||||
| $46,167 | ||||||||
Core | ||||||||
Short-term loss carryforward | $23,538 | Unlimited | ||||||
| $23,538 | ||||||||
Global High Income | ||||||||
Short-term loss carryforward | $3 | Unlimited | ||||||
Long-term loss carryforward | $32,323 | Unlimited | ||||||
| $32,326 | ||||||||
NOTE 7 – Investments
Investment transactions other than short-term investments for the period ended May 31, 2019, were as follows:
| Purchases | Sales | |||||||
Short-Term Bond | $1,254,172 | $1,193,668 | ||||||
Bond Income | 748,680 | 962,961 | ||||||
Core | 2,452,217 | 1,434,851 | ||||||
Global High Income | 3,169,717 | 2,045,767 | ||||||
Growth | 2,632,021 | 4,074,071 | ||||||
International | $- | $4,245,000 | ||||||
NOTE 8 – Custodian
Under agreements in place with the Trust’s custodian, UMB Bank, custody fees are reduced by credits for cash balances. Such reductions for the period year ended May 31, 2019, were as follows:
| Custodian Fee Credits | ||||
Short-Term Bond | $185 | |||
Bond Income | 188 | |||
Core | 244 | |||
Global High Income | 381 | |||
Growth | 690 | |||
International | $2,033 | |||
NOTE 9 – Subsequent Events
In preparing these financial statements, the Funds have evaluated events and transactions for potential recognition or disclosure through the date the financial statements were issued.
There were no other events or transactions during the period that materially impacted the amounts or disclosures in the Funds’ financial statements.
| 56 | May 31, 2019 | Semi-Annual Report | ||||
| Expenses |
All mutual funds have operating expenses. As a Sextant Fund shareowner, you incur ongoing costs, including management fees, distribution (or service)12b-1 fees, and other fund expenses such as shareowner reports (such as this one). Operating expenses, which are deducted from a fund’s gross earnings, directly reduce the investment return of a fund. Mutual funds (unlike other financial investments) only report their results after deduction of operating expenses.
With the Sextant Funds, unlike many other mutual funds, you do not incur sales charges (loads) on purchases, reinvested dividends, or other distributions. You do not incur redemption fees or exchange fees. You may incur fees related to extra services requested by you for your account, such as bank wires. The examples below are intended to help you understand your ongoing costs (in dollars) of investing in the Funds and to compare these costs with the ongoing costs of investing in other mutual funds.
Examples
The following example is based on an investment of $1,000 invested at the beginning of the period and held for the entire period (December 1, 2018, to May 31, 2019).
Actual Expenses
The first line for each Fund provides information about actual account values and actual expenses. You may use the information in this line, together with the amount you have invested, to estimate the expenses you paid over the period. Simply divide your account value by $1,000 (for example, an $8,600 account value divided by $1,000 = 8.6), then multiply the result by the number in the first line under the heading entitled “Expenses Paid During Period” to estimate the expenses you paid on your account during this period. The Funds may charge for extra services (such as domestic bank wires, international bank wires, or overnight courier delivery of redemption checks) rendered on request, which you may need to estimate to determine your total expenses.
Hypothetical Example For Comparison Purposes
The second line provides information about hypothetical account values and hypothetical expenses based on the Fund’s actual expense ratio (based on the last six months) and an assumed rate of return of 5% per year before expenses, which is not the Fund’s actual return. The hypothetical account values and expenses may not be used to estimate the actual ending balance or expenses you paid for the period. You may use this information to compare ongoing costs of investing in the Fund and other mutual funds. To do so, compare this 5% hypothetical example with the 5% hypothetical examples that appear in the shareowner reports of other mutual funds. You may wish to add other fees that are not included in the expenses shown in the table, such as charges for extra services like bank wires.
Please note that the expenses shown in the tables are meant to highlight your ongoing costs only and do not reflect any transactional costs, such as sales charges (loads), redemption fees or exchange fees (note that the Sextant Funds do not charge any such transactional costs). Therefore, the “Hypothetical” line of each fund is useful in comparing ongoing costs only, and may not help you determine the relative total costs of owning different funds.
| | Beginning Account Value (December 1, 2018) | | | Ending Account Value (May 31, 2019) | | | Expenses Paid During Period1 | | | Annualized Expense Ratio | | |||||
Short-Term Bond Fund | $1,000 | $1,029.10 | $3.05 | 0.60% | ||||||||||||
Hypothetical (5% return before expenses) | 1,000 | 1,021.93 | 3.04 | 0.60% | ||||||||||||
Bond Income Fund | 1,000 | 1,071.20 | 3.31 | 0.64% | ||||||||||||
Hypothetical (5% return before expenses) | 1,000 | 1,021.73 | 3.23 | 0.64% | ||||||||||||
Core Fund | 1,000 | 1,032.50 | 4.37 | 0.86% | ||||||||||||
Hypothetical (5% return before expenses) | 1,000 | 1,020.63 | 4.34 | 0.86% | ||||||||||||
Global High Income Fund | 1,000 | 1,029.30 | 3.81 | 0.75% | ||||||||||||
Hypothetical (5% return before expenses) | 1,000 | 1,021.18 | 3.79 | 0.75% | ||||||||||||
Growth FundInvestor Shares | 1,000 | 1,039.70 | 6.00 | 1.18% | ||||||||||||
Hypothetical (5% return before expenses) | 1,000 | 1,019.05 | 5.94 | 1.18% | ||||||||||||
Growth FundZ Shares | 1,000 | 1,041.60 | 4.41 | 0.87% | ||||||||||||
Hypothetical (5% return before expenses) | 1,000 | 1,020.61 | 4.36 | 0.87% | ||||||||||||
International FundInvestor Shares | 1,000 | 1,115.70 | 5.91 | 1.12% | ||||||||||||
Hypothetical (5% return before expenses) | 1,000 | 1,019.35 | 5.64 | 1.12% | ||||||||||||
International FundZ Shares | 1,000 | 1,117.60 | 4.64 | 0.88% | ||||||||||||
Hypothetical (5% return before expenses) | $1,000 | $1,020.55 | $4.42 | 0.88% | ||||||||||||
| 1 | Expenses are equal to the annualized expense ratio indicated above (based on the most recent semi-annual period of December 1, 2018, through May 31, 2019), multiplied by the average account value over the period, multiplied by 183/365 (to reflect theone-half year period). |
| May 31, 2019 | Semi-Annual Report | 57 | ||||
Availability of Portfolio Information
| (1) | The Sextant Funds file complete schedules of portfolio holdings with the SEC for the first and third quarters of each fiscal year on FormN-Q. |
| (2) | The Funds’ FormsN-Q are available on the SEC’s website at www. sec.gov and at www.sextantfunds.com. |
| (3) | The Funds’ FormsN-Q may be reviewed and copied at the SEC’s Public Reference Room in Washington, DC. Information on the operation of the Public Reference Room may be obtained by calling1-800-SEC-0330. |
| (4) | The Funds make a complete schedule of portfolio holdings after the end of each month available to investors at www. sextantfunds.com. |
Householding Policy
To reduce expenses, we may mail only one copy of the Funds’ prospectus, each annual and semi-annual report, and proxy statements when necessary, to those addresses shared by two or more accounts. If you wish to receive individual and/or more copies of these documents, please call us at1-800-728-8762 or write to us at Saturna Capital/Sextant Mutual Funds, P.O. Box N, Bellingham, WA 98227. We will begin sending you individual copies 30 days after receiving your request.
If you are currently receiving multiple copies and wish to receive only one copy, please call us at1-800-728-8762 or write to us at Saturna Capital/Sextant Mutual Funds, P.O. Box N, Bellingham, WA 98227. We will begin sending you a single copy with subsequent report mailings.
| 58 | May 31, 2019 | Semi-Annual Report | ||||
Availability of Proxy Voting Information
| (1) | A description of the policies and procedures that the Funds use to determine how to vote proxies relating to portfolio securities is available (a) without charge, upon request, by calling Saturna Capital at1-800-728-8762; (b) on the Funds’ website at www. sextantfunds.com; and (c) on the SEC’s website at www.sec.gov. |
| (2) | Information regarding how each Fund voted proxies relating to portfolio securities during the most recent12-month period ended June 30 is available (a) without charge, upon request, by calling Saturna Capital at1-800-728-8762; (b) on the Funds’ website at www.sextantfunds.com; and (c) on the SEC’s website at www.sec.gov. |
Privacy Statement
At Saturna Capital and Saturna Investment Trust, we understand the importance of maintaining the privacy of your financial information. We want to assure you that we protect the confidentiality of any personal information that you share with us. In addition, we do not sell information about our current or former customers.
In the course of our relationship, we gather certain nonpublic information about you, including your name, address, investment choices, and account information. We do not disclose your information to unaffiliated third parties unless it is necessary to process a transaction; service your account; deliver your account statements, shareowner reports and other information; or as required by law. When we disclose information to unaffiliated third parties, we require a contract to restrict the companies’ use of customer information and from sharing or using it for any purposes other than performing the services for which they were required.
We may share information within the Saturna Capital family of companies in the course of informing you about products or services that may address your investing needs.
We maintain our own technology resources to minimize the need for any third party services, and restrict access to information within Saturna. We maintain physical, electronic, and procedural safeguards to guard your personal information. If you have any questions or concerns about the security or privacy of your information, please call us at1-800-728-8762.
| May 31, 2019 | Semi-Annual Report | 59 | ||||
Performance Summary(as of June 30, 2019)
Average Annual Returns(before any taxes paid by shareowners) |
| |||||||||||||||||||||||
| Expense Ratio1 | ||||||||||||||||||||||||
| 1 Year | 3 Year | 5 Year | 10 Year | Gross | Net | |||||||||||||||||||
Sustainable Equity Fund (SEEFX) | 10.76% | 12.87% | n/a | n/a | 1.27% | 0.75% | ||||||||||||||||||
S&P Global 1200 Index | 6.96% | 12.57% | 7.27% | 11.29% | n/a | n/a | ||||||||||||||||||
| ||||||||||||||||||||||||
Sustainable Bond Fund (SEBFX) | 3.58% | 2.31% | n/a | n/a | 0.77% | 0.65% | ||||||||||||||||||
FTSE WorldBIG Index | 5.85% | 1.76% | 1.24% | 2.75% | n/a | n/a | ||||||||||||||||||
Performance data quoted in this report represents past performance, is before any taxes payable by shareowners, and is no guarantee of future results. Current performance may be higher or lower than that stated herein. Performance current to the most recentmonth-end is available by calling toll-free1-800-728-8762 or visiting www.saturnasustainable.com. Average annual total returns are historical and include change in share value as well as reinvestment of dividends and capital gains, if any. The investment return and principal value of an investment will fluctuate so that an investor’s shares, when redeemed, may be worth more or less than their original cost. Funds that invest in foreign securities may involve greater risk, including political and economic uncertainties of foreign countries as well as the risk of currency fluctuations.
A note about risk:Please see Notes to Financial Statements beginning on page 19 for a discussion of investment risks. For a more detailed discussion of the risks associated with each Fund, please see the Funds’ prospectus or each Fund’s summary prospectus.
A Fund’s30-Day Yield, sometimes referred to as “standardized yield” or “SEC yield,” is expressed as an annual percentage rate using a method of calculation adopted by the Securities and Exchange Commission (SEC). The30-Day Yield provides an estimate of a Fund’s investment income rate, but may not equal the actual income distribution rate.
| 1 | By regulation, expense ratios shown in these tables are as stated in the Funds’ most recent Prospectus, dated March 27, 2019, and incorporate results for the fiscal year ended November 30, 2018. Ratios presented in this table differ from the expense ratios shown elsewhere in this report as they represent different periods. Also by regulation, the performance in this table represents the most recentquarter-end performance rather than performance through the Funds’ most recent fiscal period. Saturna Capital, the Fund’s adviser, has voluntarily capped actual expenses of the Sustainable Equity Fund at 0.75% and actual expenses of the Sustainable Bond Fund at 0.65% through March 31, 2020. |
The S&P Global 1200 Index is a global stock market index covering nearly 70% of the world’s equity markets. The FTSE WorldBIG Index is a multi-asset, multi-currency benchmark, which provides a broad-based measure of the global fixed income markets.Investors cannot invest directly in the indices.
The Saturna Sustainable Funds limit the securities they purchase to those consistent with sustainable principles. This limits opportunities and may affect performance.
(photo omitted)
On the cover: Vogelsang Peak in
Yosemite National Park, Photo by
Elizabeth Alm.
Please consider an investment’s objectives, risks, charges, and expenses carefully before investing. To obtain this and other important information about the Saturna Sustainable Funds in a prospectus or summary prospectus, ask your financial advisor, visit www.saturnasustainable.com, or call toll-free1-800-728-8762. Please read the prospectus or summary prospectus carefully before investing.
| 2 | May 31, 2019 | Semi-Annual Report | ||||
Fellow Shareowners:
At May 31, 2018, assets of the two Funds reached $36.14 million up from $32.53 million the previous May. The following pages provide details of the assets and operations of the two Funds.
Markets swung with abandon during the year, as euphoria melting to caution brought volatility and doubt. Emerging markets, led by China, suffered as the dollar surged and trade battles commenced. Wars were mostly fought with money, not arms. Global prices for carbon fuels (coal, oil, gas) are weak, as US shale production surges and demand softens. Lower taxes and interest rates are stimulating high employment, especially in technology, while the global supply chain is being rattled by trade revamps. While it’s impossible to predict the future, we believe our portfolios are well-positioned for positive or negative economic developments given our focus on low debt, cash generative, high quality companies led by excellent management teams. We believe such characteristics are defensive in the event of a downturn, while the low debt focus should also be an advantage in the event economies gain momentum.
Saturna Sustainable Funds seek sustainable investments with low risks in areas of the
environment, social responsibility, and governance (ESG).
The 1960s and the 1990s were decades of nearly uninterrupted economic growth and the 2010s are now looking to stake their longevity claim. The last time the economy contracted for two consecutive quarters (the standard definition of a recession) was in the first two quarters of 2009, and current conditions appear buoyant. Despite record low unemployment rates, inflation remains subdued, while corporate profitability and consumer confidence are robust.
The trend toward adoption of ESG and sustainable investing strategies continued as more firms added products labeled to appeal to thoughtful investors. Upon closer inspection, however, a high profileblow-up revealed that not all products labeled as ESG or “fossil-fuel free” actually were (one fund claimed “fossil-fuel free” but owned refineries while any S&P 500 Index fund or ETF likely owns both oil producers and refiners, along with weapons manufacturers).
At this point, the greatest risk to continued economic buoyancy appears to be trade friction, a development that could spin out of control or be contained rather easily with greater flexibility. Economic policies can and do change frequently.
An extraordinary era of low interest rates fueled upward moves in economies and markets. The US economy is in a “goldilocks” phase, with employment for those who want it, and little need for more government stimulus. We must be vigilant in the coming months for signs of a recession – we believe a riskier period looms ahead.
| May 31, 2019 | Semi-Annual Report | 3 | ||||
Morningstar Awards Saturna Sustainable Funds Top Sustainability Ratings
The Morningstar Sustainability Rating™ gives investors across the globe a way to compare fund portfolios based on a standard measure of sustainability. The rating is a holdings-based calculation using company-level environmental, social, and governance (ESG) analytics from Sustainalytics.
We are pleased to note that as of May 31, 2019, Saturna Sustainable Equity Fund ranked in the fifth percentile of 718 funds in the World Large Stock category, earning the top “Five Globe” Sustainability Rating. Morningstar did not issue a Sustainability Rating for the Saturna Sustainable Bond Fund for the period.
Going forward, Saturna’s values-based approach to investing seeks to provide firsthand insight into the risk mitigation dimensions of sustainable investing. We stand ready to serve you in both bull and bear markets by seeking to provide steady, long-term growth with a focus on preservation of capital.
Respectfully,
(photo omitted)
Jane Carten,
President
(photo omitted)
Gary Goldfogel,
Independent Board Chairman
| Saturna Sustainable Funds Portfolio Management | ||||||||||
| (photo omitted) | Jane CartenMBA
Saturna Sustainable Equity Fund Portfolio Manager | (photo omitted) | Patrick Drum MBA, CFA®, CFP®
Saturna Sustainable Bond Fund Portfolio Manager | |||||||
| (photo omitted) | Nicholas Kaiser MBA, CFA®
Saturna Sustainable Equity Fund Deputy Portfolio Manager | (photo omitted) | Elizabeth Alm CFA®
Saturna Sustainable Bond Fund Deputy Portfolio Manager
| |||||||
| 4 | May 31, 2019 | Semi-Annual Report | ||||
| Morningstar Sustainability Rating™ & Carbon Metrics™ |
At Saturna Capital, we have long described ourselves as value and values-based investors. We believe our approach improves the likelihood of achieving superior investment results over the long term. Our approach also leads to investment portfolios we can be proud of from the perspective of Environmental, Social, and Governance (ESG) issues. Morningstar partners with leading ESG research firm Sustainalytics to publish the Morningstar Sustainability Rating™ and Carbon Metrics™. Here are Saturna Sustainable Equity Fund’s fiscal period-end results (Saturna Sustainable Bond Fund was not rated for the period).
| Saturna Sustainable Equity Fund | ||||||||
| As of May 31, 2019 | ||||||||
| Ø Ø Ø Ø Ø | |||||||
| Ranked in 5th percentile among 718 World Large Stock Funds | ||||||||
| As of March 31, 2019 | ||||||||
| ||||||||
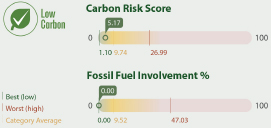
The Morningstar Sustainability Rating, Low Carbon designation, Carbon Risk Score, and Fossil Fuel Involvement % are not based on fund performance and are not equivalent to the Morningstar Rating (“Star Rating”).
© 2019 Morningstar®.All rights reserved. Morningstar, Inc. is an independent fund performance monitor. The information contained herein: (1) is proprietary to Morningstar and/or its content providers; (2) may not be copied or distributed; and (3) is not warranted to be accurate, complete, or timely. Neither Morningstar nor its content providers are responsible for any damages or losses arising from any use of this information.
Morningstar Sustainability Rating is as of May 31, 2019. The Morningstar Sustainability Rating™ is intended to measure how well the issuing companies of the securities within a fund’s portfolio are managing their environmental, social, and governance (“ESG”) risks and opportunities relative to the fund’s Morningstar category peers. The Morningstar Sustainability Rating calculation is atwo-step process. First, each fund with at least 50% of assets covered by a company-level ESG score from Sustainalytics receives a Morningstar Portfolio Sustainability Score™. The Morningstar Portfolio Sustainability Score is an asset-weighted average of normalized company-level ESG scores with deductions made for controversial incidents by the issuing companies, such as environmental accidents, fraud, or discriminatory behavior. The Morningstar Sustainability Rating is then assigned to all scored funds within Morningstar Categories in which at least ten (10) funds receive a Portfolio Sustainability Score and is determined by each fund’s rank within the following distribution: High (highest 10%), Above Average (next 22.5%), Average (next 35%), Below Average (next 22.5%), and Low (lowest 10%). The Morningstar Sustainability Rating is depicted by globe icons where High equals 5 globes and Low equals 1 globe.
A Sustainability Rating is assigned to any fund that has more than half of its underlying assets rated by Sustainalytics and is within a Morningstar Category with at least 10 scored funds; therefore, the rating it is not limited to funds with explicit sustainable or responsible investment mandates. Morningstar updates its Sustainability Ratings monthly. Portfolios receive a Morningstar Portfolio Sustainability Score and Sustainability Rating one month and six business days after their reportedas-of date based on the most recent portfolio. As part of the evaluation process, Morningstar uses Sustainalytics’ ESG scores from the same month as the portfolioas-of date.
Saturna Sustainable Equity Fund was rated on 91% of Assets Under Management.
% Rank in Category is the fund’s percentile rank for the specified time period relative to all funds that have the same Morningstar category. The highest (or most favorable) percentile rank is 1 and the lowest (or least favorable) percentile rank is 100. Thetop-performing fund in a category will always receive a rank of 1. Percentile ranks within categories are most useful in those categories that have a large number of funds.
Morningstar Carbon Metrics are as of March 31, 2019.Morningstar carbon metrics are asset-weighted portfolio calculations based on their Sustainalytics subsidiary’s carbon-risk research. Based on two of these metrics – Carbon Risk Score and Fossil Fund Involvement % – funds may receive the Low Carbon designation, which allows investors to easily identifylow-carbon funds within the global universe.
The portfolio Carbon Risk Score is a number between 0 and 100 (a lower score is better). A portfolio’s Carbon Risk Score is the asset-weighted sum of the carbon risk scores of its holdings, averaged over the trailing 12 months. The carbon risk of a company is Sustainalytics’ evaluation of the degree to which a firm’s activities and products are aligned with the transition to alow-carbon economy. The assessmemt includes carbon intensity, fossil fuel involvement, stranded assets exposure, mitigation strategies, and green product solutions.
Fossil Fuel Involvement % is the portfolio’s asset-weighted percentage exposure to fossil fuels, averaged over the trailing 12 months. Companies with fossil fuel involment are defined as these in the following subindustries: Thermal Coal Extraction, Thermal Coal Power Generation, Oil & Gas Production, Oil & Gas Power Generation, and Oil and Gas Products and Services.
To receive the Low Carbon designation a fund must have Carbon Risk Score below 10 and a Fossil Fuel Involvement % of less than 7% of assets. For these metrics to be calculated, at least 67% of a portfolio’s assets must be covered by Sustainalytics company carbon-risk research. All Morningstar carbon metrices are calculated quarterly.
Saturna Sustainable Equity Fund was rated on 90% of Assets Under Management.
The Funds’ portfolios are actively managed and are subject to change, which may result in different Morningstar Sustainability Ratings and Carbon Metrics over time.
| May 31, 2019 | Semi-Annual Report | 5 | ||||
| Saturna Sustainable Equity Fund:Performance Summary |  |
Average Annual Returns as of May 31, 2019 |
| |||||||||||||||
| 1 Year | 5 Year | 10 Year | Expense Ratio1 | |||||||||||||
Sustainable Equity Fund (SEEFX)2 | 3.98% | n/a | n/a | 1.27% | ||||||||||||
S&P Global 1200 Index | 0.19% | 6.28% | 10.50% | n/a | ||||||||||||
Growth of $10,000
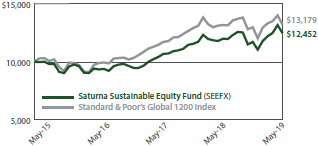 | Comparison of any mutual fund to a market index must be made bearing in mind that the index is expense-free. Conversely, the fund will (1) be actively managed; (2) have an objective other than mirroring the index, such as limiting risk; (3) bear transaction and other costs; (4) stand ready to buy and sell its securities to shareowners on a daily basis; and (5) provide a wide range of services. The graph compares $10,000 invested in the Fund on March 27, 2015, to an identical amount invested in the Standard & Poor’s Global 1200 Index, a global stock market index covering nearly 70% of the world’s equity markets. The graph shows that an investment in the Fund would have risen to $12,452 versus $13,179 in the index. |
Past performance does not guarantee future results.The “Growth of $10,000” graph and “Average Annual Returns” performance table assume the reinvestment of dividends and capital gains. They do not reflect the deduction of taxes that a shareowner might pay on fund distributions or the redemption of fund shares.
| 1 | By regulation, the expense ratio shown in this table is as stated in the Fund’s most recent prospectus which is dated March 27, 2019, and incorporates results for the fiscal year ended November 30, 2018, before fee waivers. The expense ratio shown in the most recent prospectus after fee waivers was 0.75%. The ratio presented in this table differs from expense ratios shown elsewhere in this report as they represent different periods. |
| 2 | Operations commenced on March 27, 2015. |
Fund Objective
The objective of the Sustainable Equity Fund is capital appreciation.
Top 10 Holdings |
| |||
| % of Total Net Assets | ||||
Adobe Inc. | 4.7% | |||
Dassault Systemes ADR | 3.8% | |||
Mastercard, Class A | 3.6% | |||
Church & Dwight | 3.1% | |||
Microsoft | 3.1% | |||
Apple | 3.0% | |||
Unilever | 2.8% | |||
Home Depot | 2.8% | |||
Accenture, Class A | 2.8% | |||
Toronto-Dominion Bank | 2.6% | |||
Portfolio Diversification |
| |||||||||||
| % of Total Net Assets |
| |||||||||||
Household Products | 10.0% | ∎ |  | |||||||||
Application Software | 8.5% | ∎ | ||||||||||
Home Products Stores | 4.0% | ∎ | ||||||||||
Specialty Apparel Stores | 4.0% | ∎ | ||||||||||
IT Services | 3.7% | ∎ | ||||||||||
Consumer Finance | 3.6% | ∎ | ||||||||||
Infrastructure Software | 3.1% | ∎ | ||||||||||
Life Insurance | 3.1% | ∎ | ||||||||||
Automobiles | 3.0% | ∎ | ||||||||||
Communications Equipment | 3.0% | ∎ | ||||||||||
Semiconductor Devices | 3.0% | ∎ | ||||||||||
Banks | 2.6% | ∎ | ||||||||||
Specialty Chemicals | 2.6% | ∎ | ||||||||||
Medical Equipment | 2.5% | ∎ | ||||||||||
Industries < 2.5% | 34.6% | ∎ | ||||||||||
Other assets (net of liabilities) | 8.7% | ∎ | ||||||||||
| 6 | May 31, 2019 | Semi-Annual Report | ||||
| Saturna Sustainable Equity Fund:Schedule of Investments | As of May 31, 2019 | |
| Common Stocks – 91.3% | Number of Shares | Cost | Market Value | Country1 | Percentage of Assets | |||||||||||||||||
| Communications | ||||||||||||||||||||||
| Cable & Satellite | ||||||||||||||||||||||
MultiChoice Group2 | 200 | $1,106 | $1,665 | South Africa | 0.0% | 3 | ||||||||||||||||
| Entertainment Content | ||||||||||||||||||||||
Walt Disney Company | 500 | 53,704 | 66,020 | United States | 1.2% | |||||||||||||||||
| Internet Media | ||||||||||||||||||||||
Naspers ADR | 1,000 | 57,214 | 44,970 | South Africa | 0.8% | |||||||||||||||||
| Telecom Carriers | ||||||||||||||||||||||
Telekomunikasi Indonesia ADR | 2,000 | 65,178 | 53,940 | Indonesia | 0.9% | |||||||||||||||||
| 177,202 | 166,595 | 2.9% | ||||||||||||||||||||
| Consumer Discretionary | ||||||||||||||||||||||
| Apparel, Footwear & Accessory Design | ||||||||||||||||||||||
adidas ADR | 800 | 93,431 | 114,292 | Germany4 | 2.0% | |||||||||||||||||
| Automobiles | ||||||||||||||||||||||
Subaru ADR | 5,000 | 69,810 | 57,650 | Japan | 1.0% | |||||||||||||||||
Toyota Motor ADR | 1,000 | 107,633 | 117,580 | Japan | 2.0% | |||||||||||||||||
| 177,443 | 175,230 | 3.0% | ||||||||||||||||||||
| E-Commerce Discretionary | ||||||||||||||||||||||
Amazon.com2 | 60 | 103,132 | 106,504 | United States | 1.8% | |||||||||||||||||
| Home Products Stores | ||||||||||||||||||||||
Home Depot | 850 | 100,842 | 161,373 | United States | 2.8% | |||||||||||||||||
Lowe’s | 750 | 80,222 | 69,960 | United States | 1.2% | |||||||||||||||||
| 181,064 | 231,333 | 4.0% | ||||||||||||||||||||
| Other Commercial Services | ||||||||||||||||||||||
Ecolab | 723 | 82,096 | 133,097 | United States | 2.3% | |||||||||||||||||
| Restaurants | ||||||||||||||||||||||
Starbucks | 1,713 | 102,502 | 130,291 | United States | 2.2% | |||||||||||||||||
| Specialty Apparel Stores | ||||||||||||||||||||||
Industria de Diseno Textil | 3,000 | 92,121 | 79,914 | Spain | 1.4% | |||||||||||||||||
TJX Companies | 3,000 | 103,932 | 150,870 | United States | 2.6% | |||||||||||||||||
| 196,053 | 230,784 | 4.0% | ||||||||||||||||||||
| Toys & Games | ||||||||||||||||||||||
Hasbro | 600 | 56,958 | 57,084 | United States | 1.0% | |||||||||||||||||
| 992,679 | 1,178,615 | 20.3% | ||||||||||||||||||||
| Consumer Staples | ||||||||||||||||||||||
| Food & Drug Stores | ||||||||||||||||||||||
Clicks Group ADR | 1,500 | 38,630 | 38,752 | South Africa | 0.7% | |||||||||||||||||
Continued on next page.
| The accompanying notes are an integral part of these financial statements. | May 31, 2019 | Semi-Annual Report | 7 | |||||
| Saturna Sustainable Equity Fund:Schedule of Investments | As of May 31, 2019 | |
| Common Stocks – 91.3% | Number of Shares | Cost | Market Value | Country1 | Percentage of Assets | |||||||||||||||||
| Consumer Staples(continued) | ||||||||||||||||||||||
| Household Products | ||||||||||||||||||||||
Church & Dwight | 2,400 | $104,866 | $178,584 | United States | 3.1% | |||||||||||||||||
Kimberly-Clark de Mexico, Class A | 13,000 | 22,070 | 23,448 | Mexico | 0.4% | |||||||||||||||||
L’Oreal ADR | 2,200 | 98,743 | 117,722 | United States4 | 2.0% | |||||||||||||||||
Reckitt Benckiser Group ADR | 6,250 | 100,292 | 100,875 | United Kingdom | 1.7% | |||||||||||||||||
Unilever | 2,700 | 116,609 | 162,324 | Netherlands | 2.8% | |||||||||||||||||
| 442,580 | 582,953 | 10.0% | ||||||||||||||||||||
| Packaged Food | ||||||||||||||||||||||
Nestle ADR | 1,000 | 86,610 | 99,160 | Switzerland | 1.7% | |||||||||||||||||
| 567,820 | 720,865 | 12.4% | ||||||||||||||||||||
| Energy | ||||||||||||||||||||||
| Renewable Energy Equipment | ||||||||||||||||||||||
Siemens Gamesa Renewable Energy | 3,500 | 51,922 | 54,147 | Spain | 0.9% | |||||||||||||||||
Vestas Wind Systems | 900 | 65,551 | 73,089 | Denmark | 1.3% | |||||||||||||||||
| 117,473 | 127,236 | 2.2% | ||||||||||||||||||||
| Financials | ||||||||||||||||||||||
| Banks | ||||||||||||||||||||||
Toronto-Dominion Bank | 2,800 | 131,011 | 153,020 | Canada | 2.6% | |||||||||||||||||
| Consumer Finance | ||||||||||||||||||||||
Mastercard, Class A | 824 | 74,155 | 207,228 | United States | 3.6% | |||||||||||||||||
| Diversified Banks | ||||||||||||||||||||||
Banco Santander ADR | 10,081 | 50,683 | 43,651 | Spain | 0.7% | |||||||||||||||||
| Islamic Banking | ||||||||||||||||||||||
BIMB Holdings | 104,800 | 107,265 | 115,399 | Malaysia | 2.0% | |||||||||||||||||
| Life Insurance | ||||||||||||||||||||||
AIA Group | 11,600 | 67,861 | 108,959 | Hong Kong | 1.9% | |||||||||||||||||
Aviva PLC ADR | 7,000 | 93,166 | 72,170 | United States | 1.2% | |||||||||||||||||
| 161,027 | 181,129 | 3.1% | ||||||||||||||||||||
| P&C Insurance | ||||||||||||||||||||||
Chubb | 700 | 77,224 | 102,249 | Switzerland | 1.8% | |||||||||||||||||
| 601,365 | 802,676 | 13.8% | ||||||||||||||||||||
| Health Care | ||||||||||||||||||||||
| Health Care Facilities | ||||||||||||||||||||||
Ramsay Health Care | 2,308 | 103,089 | 111,375 | Australia | 1.9% | |||||||||||||||||
| Large Pharma | ||||||||||||||||||||||
Novo Nordisk ADR | 1,569 | 86,408 | 74,057 | Denmark | 1.3% | |||||||||||||||||
| Medical Equipment | ||||||||||||||||||||||
Koninklijke Philips ADR | 3,588 | 101,701 | 142,157 | Netherlands | 2.5% | |||||||||||||||||
| 291,198 | 327,589 | 5.7% | ||||||||||||||||||||
Continued on next page.
| 8 | May 31, 2019 | Semi-Annual Report | The accompanying notes are an integral part of these financial statements. | |||||
| Saturna Sustainable Equity Fund:Schedule of Investments | As of May 31, 2019 | |
| Common Stocks – 91.3% | Number of Shares | Cost | Market Value | Country1 | Percentage of Assets | |||||||||||||||||
| Industrials | ||||||||||||||||||||||
| Commercial and Residential Building Equipment | ||||||||||||||||||||||
Legrand | 700 | $39,602 | $46,939 | France | 0.8% | |||||||||||||||||
| Electrical Components | ||||||||||||||||||||||
TE Connectivity | 351 | 22,755 | 29,565 | Switzerland | 0.5% | |||||||||||||||||
| Electrical Power Equipment | ||||||||||||||||||||||
Siemens ADR | 1,000 | 66,086 | 56,760 | Germany | 1.0% | |||||||||||||||||
| Rubber & Plastic | ||||||||||||||||||||||
Hartalega Holdings | 80,000 | 63,885 | 99,335 | Malaysia | 1.7% | |||||||||||||||||
| 192,328 | 232,599 | 4.0% | ||||||||||||||||||||
| Materials | ||||||||||||||||||||||
| Precious Metal Mining | ||||||||||||||||||||||
Barrick Gold | 3,064 | 48,731 | 38,055 | Canada | 0.6% | |||||||||||||||||
| Specialty Chemicals | ||||||||||||||||||||||
Johnson Matthey | 2,031 | 86,775 | 79,109 | United Kingdom | 1.4% | |||||||||||||||||
Koninklijke DSM | 600 | 62,437 | 67,142 | Netherlands | 1.2% | |||||||||||||||||
| 149,212 | 146,251 | 2.6% | ||||||||||||||||||||
| 197,943 | 184,306 | 3.2% | ||||||||||||||||||||
| Technology | ||||||||||||||||||||||
| Application Software | ||||||||||||||||||||||
Adobe Systems2 | 1,000 | 108,410 | 270,900 | United States | 4.7% | |||||||||||||||||
Dassault Systemes ADR | 1,506 | 119,029 | 223,370 | France | 3.8% | |||||||||||||||||
| 227,439 | 494,270 | 8.5% | ||||||||||||||||||||
| Communications Equipment | ||||||||||||||||||||||
Apple | 1,000 | 113,474 | 175,070 | United States | 3.0% | |||||||||||||||||
| Electronics Components | ||||||||||||||||||||||
Murata Manufacturing | 3,000 | 133,698 | 127,917 | Japan | 2.2% | |||||||||||||||||
| Information Services | ||||||||||||||||||||||
Wolters Kluwer | 1,000 | 46,595 | 69,589 | Netherlands | 1.2% | |||||||||||||||||
| Infrastructure Software | ||||||||||||||||||||||
Microsoft | 1,438 | 62,724 | 177,852 | United States | 3.1% | |||||||||||||||||
| IT Services | ||||||||||||||||||||||
Accenture, Class A | 900 | 89,878 | 160,263 | Ireland | 2.8% | |||||||||||||||||
CGI Group, Class A2 | 750 | 48,570 | 54,645 | Canada | 0.9% | |||||||||||||||||
| 138,448 | 214,908 | 3.7% | ||||||||||||||||||||
| Semiconductor Devices | ||||||||||||||||||||||
NXP Semiconductors | 1,300 | 127,836 | 114,608 | Netherlands | 2.0% | |||||||||||||||||
STMicroelectronics | 3,800 | 84,537 | 57,152 | Switzerland | 1.0% | |||||||||||||||||
| 212,373 | 171,760 | 3.0% | ||||||||||||||||||||
Continued on next page.
| The accompanying notes are an integral part of these financial statements. | May 31, 2019 | Semi-Annual Report | 9 | |||||
| Saturna Sustainable Equity Fund:Schedule of Investments | As of May 31, 2019 | |
| Common Stocks – 91.3% | Number of Shares | Cost | Market Value | Country1 | Percentage of Assets | |||||||||||||||||
| Technology(continued) | ||||||||||||||||||||||
| Semiconductor Manufacturing | ||||||||||||||||||||||
Taiwan Semiconductor ADR | 3,250 | $78,323 | $124,637 | Taiwan | 2.1% | |||||||||||||||||
| 1,013,074 | 1,556,003 | 26.8% | ||||||||||||||||||||
| Total investments | $4,151,082 | 5,296,484 | 91.3% | |||||||||||||||||||
| Other assets (net of liabilities) | 505,695 | 8.7% | ||||||||||||||||||||
| Total net assets | $5,802,179 | 100.0% | ||||||||||||||||||||
| 1 | Country of domicile unless otherwise indication |
| 2 | Non-income producing security |
| 3 | Less than 0.05% |
| 4 | Denotes a country of primary exposure |
ADR: American Depositary Receipt
Countries | ||||
| ||||
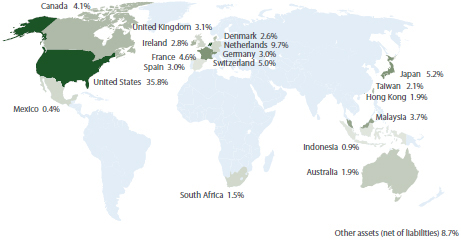 |
| |||
| Weightings shown are a percentage of total net assets. |
| |||
| 10 | May 31, 2019 | Semi-Annual Report | The accompanying notes are an integral part of these financial statements. | |||||
| Saturna Sustainable Equity Fund | |
Statement of Assets and Liabilities
| As of May 31, 2019 |
| |||
| ||||
Assets | ||||
Investments in securities, at value | $5,296,484 | |||
Cash | 482,402 | |||
Dividends receivable | 19,488 | |||
Receivable from adviser | 3,457 | |||
Prepaid expenses | 845 | |||
Receivable for security sales | 129 | |||
Total assets | 5,802,805 | |||
Liabilities | ||||
Accrued retirement plan custodial fees | 424 | |||
Accrued Chief Compliance Officer expenses | 202 | |||
Total liabilities | 626 | |||
Net assets | $5,802,179 | |||
Analysis of net assets | ||||
Paid-in capital (unlimited shares authorized, without par value) | $4,880,414 | |||
Total distributable earnings | 921,765 | |||
Net assets applicable to Fund shares outstanding | $5,802,179 | |||
Fund shares outstanding | 477,792 | |||
Net asset value, offering, and redemption price per share | $12.14 | |||
Statement of Operations
| Period ended May 31, 2019 |
| |||
| ||||
Investment income | ||||
Dividend income | $54,428 | |||
Total investment income | 54,428 | |||
Expenses | ||||
Investment adviser fees | 18,293 | |||
Filing and registration fees | 18,278 | |||
Audit fees | 3,666 | |||
Printing and postage | 1,296 | |||
Chief Compliance Officer expenses | 892 | |||
Trustee fees | 873 | |||
Retirement plan custodial fees | 596 | |||
Other expenses | 446 | |||
Custodian fees | 347 | |||
Legal fees | 314 | |||
Total gross expenses | 45,001 | |||
Less adviser fees waived | (23,462 | ) | ||
Less custodian fee credits | (327 | ) | ||
Net expenses | 21,212 | |||
Net investment income | $33,216 | |||
| ||||
Net realized gain from investments and foreign currency | $33,209 | |||
Net increase in unrealized appreciation on investments and foreign currency | 279,437 | |||
Net gain on investments and foreign currency | $312,646 | |||
Net increase in net assets resulting from operations | $345,862 | |||
| The accompanying notes are an integral part of these financial statements. | May 31, 2019 | Semi-Annual Report | 11 | |||||
| Saturna Sustainable Equity Fund | |
Statements of Changes of Net Assets | Period ended May 31, 2019 | Year ended November 30, 2018 | ||||||
Increase in net assets from operations | ||||||||
From operations | ||||||||
Net investment income | $33,216 | $45,439 | ||||||
Net realized gain (loss) on investment and foreign currency | 33,209 | (24,490 | ) | |||||
Net increase in unrealized appreciation on investments and foreign currencies | 279,437 | 23,969 | ||||||
Net increase in net assets resulting from operations | 345,862 | 44,918 | ||||||
Distributions to shareowners | (46,186 | ) | (40,318 | ) | ||||
Capital share transactions | ||||||||
Proceeds from sales of shares | 332,493 | 1,036,069 | ||||||
Value of shares issued in reinvestment of dividends | 46,187 | 40,318 | ||||||
Cost of shares redeemed | (534,331 | ) | (407,062 | ) | ||||
Total capital share transactions | (155,651 | ) | 669,325 | |||||
Total increase in net assets | 144,025 | 673,925 | ||||||
Net assets | ||||||||
Beginning of year | 5,658,154 | 4,984,229 | ||||||
End of year | $5,802,179 | $5,658,154 | ||||||
Shares of the Fund sold and redeemed | ||||||||
Number of shares sold | 27,881 | 87,399 | ||||||
Number of shares issued in reinvestment of dividends | 4,325 | 3,500 | ||||||
Number of shares redeemed | (46,073 | ) | (34,886 | ) | ||||
Net increase (decrease) in number of shares outstanding | (13,867 | ) | 56,013 | |||||
Financial Highlights | Period endedA | For year ended November 30, | Period endedA | |||||||||||||||||
Selected data per share of outstanding capital stock throughout each period: | May 31, 2019 | 2018 | 2017 | 2016 | Nov. 30, 2015 | |||||||||||||||
Net asset value at beginning of period | $11.51 | $11.44 | $9.43 | $9.73 | $10.00 | |||||||||||||||
Income from investment operations | ||||||||||||||||||||
Net investment income | 0.06 | 0.09 | 0.09 | 0.06 | 0.02 | |||||||||||||||
Net gains (losses) on securities (both realized & unrealized) | 0.67 | 0.07 | 1.97 | (0.36 | ) | (0.28 | ) | |||||||||||||
Total from investment operations | 0.73 | 0.16 | 2.06 | (0.30 | ) | (0.26 | ) | |||||||||||||
Less distributions | ||||||||||||||||||||
Dividends (from net investment income) | (0.10 | ) | (0.09 | ) | (0.05 | ) | - | (0.01 | ) | |||||||||||
Total distributions | (0.10 | ) | (0.09 | ) | (0.05 | ) | - | (0.01 | ) | |||||||||||
Net asset value at end of period | $12.14 | $11.51 | $11.44 | $9.43 | $9.73 | |||||||||||||||
Total returnB | 6.42% | 1.39% | 22.01% | (3.08 | )% | (2.60 | )% | |||||||||||||
Ratios / supplemental data | ||||||||||||||||||||
Net assets ($000), end of period | $5,802 | $5,658 | $4,984 | $3,343 | $3,423 | |||||||||||||||
Ratio of expenses to average net assets | ||||||||||||||||||||
Before fee waiversC | 1.60% | 1.27% | 1.48% | 1.65% | 1.23% | |||||||||||||||
After fee waiversC | 0.77% | 0.76% | 0.88% | 1.00% | 1.00% | |||||||||||||||
After fee waivers and custodian fee creditsC | 0.75% | 0.75% | 0.86% | 0.99% | 0.99% | |||||||||||||||
Ratio of net investment income after fee waivers and custodian fee credits to average net assetsC | 1.18% | 0.82% | 0.95% | 0.67% | 0.29% | |||||||||||||||
Portfolio turnover rateB | 5% | 8% | 12% | 48% | 53% | |||||||||||||||
| A | Operations commenced on March 27, 2015 |
| B | Not annualized for periods of less than one year |
| C | Annualized for periods of less than on year |
| 12 | May 31, 2019 | Semi-Annual Report | The accompanying notes are an integral part of these financial statements. | |||||
| Saturna Sustainable Bond Fund:Performance Summary |  |
Average Annual Returns as of May 31, 2019 | ||||||||
| 1 Year | 5 Year | 10 Year | Expense Ratio1 | |||||||||||||
Sustainable Bond Fund (SEBFX)2 | 1.80% | n/a | n/a | 0.77% | ||||||||||||
FTSE WorldBIG Index | 3.30% | 0.93% | 2.56% | n/a | ||||||||||||
Growth of $10,000
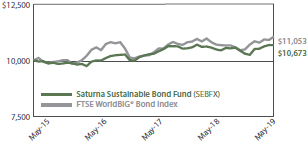 | Comparison of any mutual fund to a market index must be made bearing in mind that the index is expense-free. Conversely, the fund will (1) be actively managed; (2) have an objective other than mirroring the index, such as limiting risk; (3) bear transaction and other costs; (4) stand ready to buy and sell its securities to shareowners on a daily basis; and (5) provide a wide range of services. The graph compares $10,000 invested in the Fund on March 27, 2015, to an identical amount invested in the FTSE WorldBIG® Bond Index, a multi-asset, multi-currency benchmark, which provides a broad-based measure of the global fixed income markets. The graph shows that an investment in the Fund would have risen to $10,673 versus rising to $11,053 in the index. |
Past performance does not guarantee future results.The “Growth of $10,000” graph and “Average Annual Returns” performance table assume the reinvestment of dividends and capital gains. They do not reflect the deduction of taxes that a shareowner might pay on fund distributions or the redemption of fund shares.
| 1 | By regulation, the expense ratio shown in this table is as stated in the Fund’s most recent prospectus which is dated March 27, 2019, and incorporates results for the fiscal year ended November 30, 2018, before fee waivers. The expense ratio shown in the most recent prospectus after fee waivers was 0.65%. The ratio presented in this table differs from expense ratios shown elsewhere in this report as they represent different periods. |
| 2 | Operations commenced March 27, 2015. |
Fund Objective
The objectives of the Sustainable Bond Fund are current income and capital preservation.
Top 10 Holdings |
| |||
| % of Total Net Assets | ||||
United States Treasury Bond(4.50% due 05/15/2038) | 6.6% | |||
First Abu Dhabi Bank(3.00% due 03/30/2022) | 4.1% | |||
Lincoln National(4.643% due 02/12/2047) | 4.1% | |||
Koninklijke DSM(1.00% due 04/09/2025) | 3.9% | |||
Telus(3.20% due 04/05/2021) | 3.7% | |||
Telecom Italia(7.175% due 06/18/2019) | 3.3% | |||
KFW(2.00% due 11/30/2021) | 3.3% | |||
Nokia(3.375% due 06/12/2022) | 3.3% | |||
Mexico Bonos Desarrollo(6.50% due 06/10/2021) | 3.3% | |||
Iron Mountain(5.75% due 08/15/2024) | 3.3% | |||
Portfolio Diversification |
| |||||||||||
| % of Total Net Assets |
| |||||||||||
Financials | 27.2% | ∎ |
|
|
| |||||||
Government Bonds | 24.0% | ∎ | ||||||||||
Communications | 10.4% | ∎ | ||||||||||
Consumer Discretionary | 9.5% | ∎ | ||||||||||
Technology | 6.5% | ∎ | ||||||||||
Health Care | 6.3% | ∎ | ||||||||||
Materials | 3.9% | ∎ | ||||||||||
Energy | 2.9% | ∎ | ||||||||||
Consumer Staples | 1.1% | ∎ | ||||||||||
Industrials | 0.8% | ∎ | ||||||||||
Other assets (net of liabilities) | 7.4% | ∎ | ||||||||||

| May 31, 2019 | Semi-Annual Report | 13 | ||||
| Saturna Sustainable Bond Fund:Schedule of Investments | As of May 31, 2019 | |
| Corporate Bonds – 68.6% | Coupon / Maturity | Face Amount | Market Value | Country1 | Percentage of Assets | |||||||||||||||
| Communications | ||||||||||||||||||||
America Movil2 | 6.00% due 06/09/2019 | MXN 15,00,000 | $764,360 | Mexico | 2.5% | |||||||||||||||
Telecom Italia | 7.175% due 06/18/2019 | $1,000,000 | 1,001,250 | Luxembourg | 3.3% | |||||||||||||||
Telus | 3.20% due 04/05/2021 | CAD 1,500,000 | 1,129,606 | Canada | 3.7% | |||||||||||||||
Vodafone Group | 4.375% due 03/16/2021 | 250,000 | 257,249 | United Kingdom | 0.9% | |||||||||||||||
| 3,152,465 | 10.4% | |||||||||||||||||||
| Consumer Discretionary | ||||||||||||||||||||
Barry Callebaut3 | 5.50% due 06/15/2023 | 500,000 | 535,392 | Belgium | 1.8% | |||||||||||||||
Barry Callebaut2 | 5.50% due 06/15/2023 | 500,000 | 535,391 | Belgium | 1.8% | |||||||||||||||
BMW US Capital | 2.75% due 12/02/2019 | AUD 200,000 | 139,432 | Germany | 0.5% | |||||||||||||||
Danone3 | 2.077% due 11/02/2021 | 500,000 | 493,460 | France | 1.6% | |||||||||||||||
Starbucks | 2.45% due 06/15/2026 | 500,000 | 483,034 | United States | 1.6% | |||||||||||||||
Toyota Motor Credit | 2.75% due 02/05/2028 | 202,000 | 200,466 | Japan | 0.6% | |||||||||||||||
Toyota Motor Credit | 3.00% due 03/20/2030 | 500,000 | 491,492 | Japan | 1.6% | |||||||||||||||
| 2,878,667 | 9.5% | |||||||||||||||||||
| Consumer Staples | ||||||||||||||||||||
Nestle Holdings | 2.75% due 04/15/2020 | NOK 3,000,000 | 346,250 | Switzerland | 1.1% | |||||||||||||||
| 346,250 | 1.1% | |||||||||||||||||||
| Energy | ||||||||||||||||||||
NextEra Energy Capital(3 month LIBOR plus2.35%)4 | 4.73588% due 06/15/2067 | 1,050,000 | 881,974 | United States | 2.9% | |||||||||||||||
| 881,974 | 2.9% | |||||||||||||||||||
| Financials | ||||||||||||||||||||
AXA2 | 5.125% due 01/17/2047 | 500,000 | 508,532 | France | 1.7% | |||||||||||||||
Bank of Nova Scotia5 | 4.65% due PERP | 300,000 | 279,000 | Canada | 0.9% | |||||||||||||||
Canadian Imperial Bank | 3.42% due 01/26/2026 | CAD 1,150,000 | 866,040 | Canada | 2.9% | |||||||||||||||
EMIRATES NBD PJSC2 | 6.00% due 10/08/2019 | NZD 750,000 | 495,481 | United Arab Emirates | 1.6% | |||||||||||||||
First Abu Dhabi Bank2 | 3.00% due 03/30/2022 | 1,250,000 | 1,252,006 | United Arab Emirates | 4.1% | |||||||||||||||
Hanmi Financial6 | 5.45% due 03/30/2027 | 500,000 | 512,562 | United States | 1.7% | |||||||||||||||
Hartford Financial Services Group(3 month LIBOR 2.125%)3,4 | 4.643% due 02/12/2047 | 1,000,000 | 880,000 | United States | 2.9% | |||||||||||||||
Iron Mountain | 5.75% due 08/15/2024 | 1,000,000 | 992,020 | United States | 3.3% | |||||||||||||||
Lincoln National4 | 4.63150% due 04/20/2067 | 1,600,000 | 1,248,000 | United States | 4.1% | |||||||||||||||
Townebank Portsmouth VA7 | 4.50% due 07/30/2027 | 500,000 | 501,759 | United States | 1.6% | |||||||||||||||
XLIT(3 month LIBOR plus 2.46%)4 | 5.05425% due PERP | 750,000 | 721,875 | Bermuda | 2.4% | |||||||||||||||
| 8,257,275 | 27.2% | |||||||||||||||||||
| Health Care | ||||||||||||||||||||
NMC Health2 | 5.95% due 11/21/2023 | 500,000 | 520,690 | United Arab Emirates | 1.7% | |||||||||||||||
Novartis Capital | 1.80% due 02/14/2020 | 250,000 | 248,976 | Switzerland | 0.8% | |||||||||||||||
Roche | 2.875% due 09/29/2021 | 500,000 | 504,771 | Switzerland | 1.7% | |||||||||||||||
TEVA Pharmaceuticals | 2.80% due 07/21/2023 | 750,000 | 625,312 | Netherlands | 2.1% | |||||||||||||||
| 1,899,749 | 6.3% | |||||||||||||||||||
Continued on next page.
| 14 | May 31, 2019 | Semi-Annual Report | The accompanying notes are an integral part of these financial statements. | |||||
| Saturna Sustainable Bond Fund:Schedule of Investments | As of May 31, 2019 |
| Corporate Bonds – 68.6% | Coupon / Maturity | Face Amount | Market Value | Country1 | Percentage of Assets | |||||||||||||||
| Industrials | ||||||||||||||||||||
Ingersoll-Rand | 2.625% due 05/01/2020 | $250,000 | $249,685 | Luxembourg | 0.8% | |||||||||||||||
| 249,685 | 0.8% | |||||||||||||||||||
| Materials | ||||||||||||||||||||
Koninklijke DSM2 | 1.00% due 04/09/2025 | EUR 1,000,000 | 1,166,792 | Netherlands | 3.9% | |||||||||||||||
| 1,166,792 | 3.9% | |||||||||||||||||||
| Technology | ||||||||||||||||||||
Apple2 | 2.65% due 06/10/2020 | AUD 500,000 | 349,994 | United States | 1.1% | |||||||||||||||
MSCI3 | 5.75% due 08/15/2025 | 600,000 | 625,380 | United States | 2.1% | |||||||||||||||
Nokia | 3.375% due 06/12/2022 | 1,000,000 | 995,000 | Finland | 3.3% | |||||||||||||||
| 1,970,374 | 6.5% | |||||||||||||||||||
| Total Corporate Bonds | $20,803,231 | 68.6% | ||||||||||||||||||
| Government Bonds – 24.0% | Coupon / Maturity | Face Amount | Market Value | Country1 | Percentage of Assets | |||||||||||||||
| Banks | ||||||||||||||||||||
KFW | 2.00% due 11/30/2021 | $1,000,000 | $1,000,593 | Germany | 3.3% | |||||||||||||||
| 1,000,593 | 3.3% | |||||||||||||||||||
| Foreign Government Bonds | ||||||||||||||||||||
Federal Republic of Brazil | 12.50% due 01/05/2022 | BRL 2,500,000 | 716,982 | Brazil | 2.3% | |||||||||||||||
Mexico Bonos Desarrollo | 6.50% due 06/10/2021 | MXN 200,000 | 993,145 | Mexico | 3.3% | |||||||||||||||
| 1,710,127 | 5.6% | |||||||||||||||||||
| US Treasury Bond | ||||||||||||||||||||
United States Treasury Bond | 5.25% due 11/15/2028 | 500,000 | 632,481 | United States | 2.1% | |||||||||||||||
United States Treasury Bond | 4.50% due 05/15/2038 | 1,500,000 | 1,991,191 | United States | 6.6% | |||||||||||||||
United States Treasury Bond | 3.375% due 11/15/2048 | 450,000 | 524,004 | United States | 1.7% | |||||||||||||||
| 3,147,676 | 10.4% | |||||||||||||||||||
| US Treasury Notes | ||||||||||||||||||||
United States Treasury Note | 2.50% due 05/31/2020 | 500,000 | 501,211 | United States | 1.7% | |||||||||||||||
United States Treasury Note | 3.625% due 02/15/2021 | 900,000 | 924,047 | United States | 3.0% | |||||||||||||||
| 1,425,258 | 4.7% | |||||||||||||||||||
| Total Government Bonds | $7,283,654 | 24.0% | ||||||||||||||||||
| Total investments | (Cost = $28,904,384) | $28,086,885 | 92.6% | |||||||||||||||||
| Other assets (net of liabilities) | 2,260,281 | 7.4% | ||||||||||||||||||
| Total net assets | $30,347,166 | 100.0% | ||||||||||||||||||
| 1 | Country of risk |
| 2 | Security was purchased pursuant to Regulation S under the Securities Act of 1933 which exempts from registration securities offered and sold outside of the United States. Such a security cannot be sold in the United States without either an effective registration statement filed pursuant to the Securities Act of 1933, or pursuant to an exemption from registration. These securities have been deemed liquid under guidelines approved by the Trust’s Board of Trustees. At May 31, 2019, the aggregate value of these securities was $5,593,247 representing 18.4% of net assets. |
Continued on next page.
| The accompanying notes are an integral part of these financial statements. | May 31, 2019 | Semi-Annual Report | 15 | |||||
| Saturna Sustainable Bond Fund:Schedule of Investments | As of May 31, 2019 |  |
| 3 | Security was purchased pursuant to Rule 144A under the Securities Act of 1933 and may be sold in transactions exempt from registration only to qualified institutional buyers or in public offering registered under the Securities Act of 1933. These securities have been deemed liquid under guidelines approved by the Trust’s Board of Trustees. At May 31, 2019, the net value of these securities was $2,534,231 representing 8.4% of net assets. |
| 4 | Variable rate security. The interest rate represents the rate in effect at May 31, 2019 and resets periodically based on the parenthetically disclosed reference rate and spread. |
| 5 | Bank of Nova Scotia is a fixed to float bond and has a fixed rate until 10/12/2022. The interest rate represents the rate in effect at May 31, 2019. |
| 6 | Hanmi Financial is a fixed to float bond and has a fixed rate until 03/30/2022. The interest rate represents the rate in effect at May 31, 2019. |
| 7 | Townebank Portsmouth VA is a fixed to float bond and has a fixed rate until 07/30/2022. The interest rate represents the rate in effect at May 31, 2019. |
Countries | ||||
|
| |||
 |
| |||
| Weightings shown are a percentage of total net assets. |
| |||
Bond Quality Diversification |
| |||||||||||
| % of Total Net Assets |
| |||||||||||
Rated “AAA” | 18.4% | ∎ |
|
|
| |||||||
Rated “AA+” | 1.1% | ∎ | ||||||||||
Rated “AA” | 1.7% | ∎ | ||||||||||
Rated“AA-” | 8.2% | ∎ | ||||||||||
Rated “A+” | 0.5% | ∎ | ||||||||||
Rated“A-” | 11.3% | ∎ | ||||||||||
Rated “BBB+” | 11.9% | ∎ | ||||||||||
Rated “BBB” | 10.7% | ∎ | ||||||||||
Rated“BBB-” | 7.4% | ∎ | ||||||||||
Rated “BB+” | 10.4% | ∎ | ||||||||||
Rated “BB” | 2.1% | ∎ | ||||||||||
Rated“BB-” | 2.3% | ∎ | ||||||||||
Rated “B” | 3.3% | ∎ | ||||||||||
Not rated | 3.3% | ∎ | ||||||||||
Other assets (net of liabilities) | 7.4% | ∎ | ||||||||||
Credit ratings are the lesser of S&P Global Ratings or Moody’s Investors Service. If neither S&P nor Moody’s rate a particular security, that security is categorized as not rated (except for US Treasury securities and securities issued or backed by US agencies which inherit the credit rating for the US government). Ratings range from AAA (highest) to D (lowest). Bonds rated BBB or above are considered investment grade. Credit ratings BB and below are lower-rated securities (junk bonds). Ratings apply to the credit worthiness of the issuers of the underlying securities and not the fund or its shares. Ratings may be subject to change. |
| |||||||||||

| 16 | May 31, 2019 | Semi-Annual Report | The accompanying notes are an integral part of these financial statements. | |||||
| Saturna Sustainable Bond Fund | |
Statement of Assets and Liabilities
| As of May 31, 2019 |
| |||
Assets | ||||
Investments in securities, at value (Cost $28,904,384) | $28,086,885 | |||
Cash | 1,949,015 | |||
Interest receivable | 329,309 | |||
Prepaid expenses | 19,186 | |||
Receivable for Fund shares sold | 13,261 | |||
Total assets | 30,397,656 | |||
Liabilities | ||||
Payable for Fund shares redeemed | 31,220 | |||
Accrued advisory fees | 9,180 | |||
Distributions payable | 8,784 | |||
Accrued Chief Compliance Officer expenses | 1,030 | |||
Accrued retirement plan custodial fees | 276 | |||
Total liabilities | 50,490 | |||
Net assets | $30,347,166 | |||
Analysis of net assets | ||||
Paid-in capital (unlimited shares authorized, without par value) | $31,240,819 | |||
Total distributable earnings | (893,653 | ) | ||
Net assets applicable to Fund shares outstanding | $30,347,166 | |||
Fund shares outstanding | 3,164,173 | |||
Net asset value, offering, and redemption price per share | $9.59 | |||
Statement of Operations
| Period ended May 31, 2019 |
| |||
Investment income | ||||
Interest income | $561,746 | |||
Total investment income | 561,746 | |||
Expenses | ||||
Investment adviser fees | 82,282 | |||
Filing and registration fees | 12,157 | |||
Audit fees | 10,731 | |||
Chief Compliance Officer expenses | 3,836 | |||
Trustee fees | 2,602 | |||
Printing and postage | 2,359 | |||
Custodian fees | 1,607 | |||
Other expenses | 1,101 | |||
Legal fees | 915 | |||
Retirement plan custodial fees | 386 | |||
Total gross expenses | 117,976 | |||
Less adviser fees waived | (18,789 | ) | ||
Less custodian fee credits | (1,488 | ) | ||
Net expenses | 97,699 | |||
Net investment income | $464,047 | |||
| ||||
Net realized loss from investments and foreign currency | $(64,292 | ) | ||
Net decrease in unrealized depreciation on investments and foreign currency | 696,738 | |||
Net gain on investments | $632,446 | |||
Net increase in net assets resulting from operations | $1,096,493 | |||
| The accompanying notes are an integral part of these financial statements. | May 31, 2019 | Semi-Annual Report | 17 | |||||
| Saturna Sustainable Bond Fund | |
Statements of Changes in Net Assets | Period ended May 31, 2019 | Year ended November 30, 2018 | ||||||
Increase (decrease) in net assets from operations | ||||||||
From operations | ||||||||
Net investment income | $464,047 | $821,787 | ||||||
Net realized loss on investment | (64,292 | ) | (88,078 | ) | ||||
Net increase (decrease) in unrealized appreciation | 696,738 | (1,499,785 | ) | |||||
Net increase (decrease) in net assets | 1,096,493 | (766,076 | ) | |||||
Distributions to shareowners | (454,409 | ) | (722,566 | ) | ||||
Capital share transactions | ||||||||
Proceeds from sales of shares | 5,215,764 | 14,807,636 | ||||||
Value of shares issued in reinvestment of dividends | 402,454 | 637,199 | ||||||
Cost of shares redeemed | (7,559,696 | ) | (4,289,584 | ) | ||||
Total capital share transactions | (1,941,478 | ) | 11,155,251 | |||||
Total increase (decrease) in net assets | (1,299,394 | ) | 9,666,609 | |||||
Net assets | ||||||||
Beginning of year | 31,646,560 | 21,979,951 | ||||||
End of year | $30,347,166 | $31,646,560 | ||||||
Shares of the Fund sold and redeemed | ||||||||
Number of shares sold | 548,980 | 1,517,615 | ||||||
Number of shares issued in reinvestment of dividends | 42,266 | 65,470 | ||||||
Number of shares redeemed | (797,749 | ) | (438,446 | ) | ||||
Net increase (decrease) in number of shares outstanding | (206,503 | ) | 1,144,639 | |||||
Financial Highlights | Period endedA | Year ended November 30, | Period endedA | |||||||||||||||||
Selected data per share of outstanding capital stock throughout each period: | May 31, 2019 | 2018 | 2017 | 2016 | Nov. 30, 2015 | |||||||||||||||
Net asset value at beginning of period | $9.39 | $9.87 | $9.65 | $9.75 | $10.00 | |||||||||||||||
Income from investment operations | ||||||||||||||||||||
Net investment income | 0.14 | 0.26 | 0.27 | 0.24 | 0.12 | |||||||||||||||
Net gains (losses) on securities (both realized and unrealized) | 0.20 | (0.48 | ) | 0.23 | (0.10 | ) | (0.25 | ) | ||||||||||||
Total from investment operations | 0.34 | (0.22 | ) | 0.50 | 0.14 | (0.13 | ) | |||||||||||||
Less distributions | ||||||||||||||||||||
Dividends (from net investment income) | (0.14 | ) | (0.26 | ) | (0.27 | ) | (0.24 | ) | (0.12 | ) | ||||||||||
Capital gains distribution | - | - | (0.01 | ) | - | - | ||||||||||||||
Total distributions | (0.14 | ) | (0.26 | ) | (0.28 | ) | (0.24 | ) | (0.12 | ) | ||||||||||
Net asset value at end of period | $9.59 | $9.39 | $9.87 | $9.65 | $9.75 | |||||||||||||||
Total returnB | 3.69% | (2.29 | )% | 5.28% | 1.37% | (1.29 | )%B | |||||||||||||
Ratios / supplemental data | ||||||||||||||||||||
Net assets ($000), end of period | $30,347 | $31,647 | $21,980 | $8,639 | $6,885 | |||||||||||||||
Ratio of expenses to average net assets | ||||||||||||||||||||
Before fee waiversC | 0.79% | 0.77% | 0.92% | 1.17% | 1.02% | |||||||||||||||
After fee waiversC | 0.66% | 0.66% | 0.75% | 0.89% | 0.90% | |||||||||||||||
After fee waivers and custodian fee creditsC | 0.65% | 0.65% | 0.74% | 0.89% | 0.89% | |||||||||||||||
Ratio of net investment income after fee waivers custodian fee credits to average net assetsC | 3.10% | 2.99% | 2.82% | 2.46% | 1.92% | |||||||||||||||
Portfolio turnover rateB | 25% | 25% | 14% | 46% | 4% | |||||||||||||||
| A | Operations commenced on March 27, 2015 |
| B | Not annualized for periods of less than one year |
| C | Annualized for periods of less than on year |
| 18 | May 31, 2019 | Semi-Annual Report | The accompanying notes are an integral part of these financial statements. | |||||
| Notes to Financial Statements |
NOTE 1 – Organization
Saturna Investment Trust (the “Trust”) was established under Washington State Law as a business trust on February 20, 1987. The Trust is registered as anopen-end, diversified management company under the Investment Company Act of 1940, as amended. Nine portfolio series have been created to date, two of which are covered by this annual report: Saturna Sustainable Equity Fund and Saturna Sustainable Bond Fund (the “Funds”). The Sextant Short-Term Bond Fund, Sextant Bond Income Fund, Sextant Core Fund, Sextant Global High Income Fund, Sextant Growth Fund, Sextant International Fund, and the IdahoTax-Exempt Fund are offered through separate prospectuses, the results of which are contained in separate reports.
Saturna Sustainable Equity Fund and Saturna Sustainable Bond Fund commenced operations on March 27, 2015.
Each Fund is an investment company and accordingly follows the investment company accounting and reporting guidance of the Financial Accounting Standards Board (FASB) Accounting Standard Codification Topic 946 “Financial Services – Investment Companies”.
Investment risks:
Saturna Sustainable Equity andSaturna Sustainable Bond Funds: The value of each Fund’s shares rises and falls as the value of the securities in which the Fund invests goes up and down. Fund share prices, yields, and total returns will change with market fluctuations as well as the fortunes of the countries, industries, and companies in which the Fund invests. The Funds do not use derivatives to hedge currency, interest rate, or credit risk.
Ratings are dependent upon the associated ESG risks that are most pertinent to the sector in which an issuer operates. The ratings process associated with sustainable and responsible investing reduces the investable universe for each Fund, which limits opportunities and may increase the risk of loss during market declines. The adviser believes that sustainable investing may mitigate security-specific risk, but there is no guarantee that the securities favored by our investment process will perform better and may perform worse than those that are not favored.
The Funds may invest substantially in one or more sectors, which can increase volatility and exposure to issues specific to a particular sector or industry.
Foreign investing involves risks not normally associated with investing in US securities. These include fluctuations in currency exchange rates, less public information about securities, less governmental market supervision, and the lack of uniform financial, social, and political standards. Foreign investing heightens the risk of confiscatory taxation, seizure or nationalization of assets, establishment of currency controls, or adverse political or social developments that affect investments. The risks of investing in foreign securities are typically greater in less developed or emerging countries.
Liquidity risk exists when particular investments are difficult to sell. If a Fund holds illiquid investments, its portfolio may be more difficult to value, especially in changing markets. Investments by a Fund in foreign securities and those that are thinly traded, such as lower quality issuers, and smaller companies tend to involve greater liquidity risk. If a Fund is forced to sell or unwind these investments to meet redemptions or for other cash needs, the Fund may suffer a penalty. Additionally, the market for certain investments may become illiquid under adverse market or economic conditions independent of any specific adverse changes in the conditions of a particular issuer. In such cases, the Fund, due to limitations on investments in illiquid securities and the difficulty in purchasing and selling such securities, may be unable to achieve its investment objective.
Saturna Sustainable Bond Fund: The risks inherent in the Saturna Sustainable Bond Fund depend primarily on the terms and quality of the obligations in its portfolio, as well as on bond market conditions. When interest rates rise, bond prices fall. When interest rates fall, bond prices go up. Bonds with longer maturities usually are more sensitive to interest rate changes than bonds with shorter maturities. The Fund entails credit risk, which is the possibility that a bond will not be able to pay interest or principal when due. If the credit quality of a bond is perceived to decline, investors will demand a higher yield, which means a lower price on that bond to compensate for the higher level of risk.
The Fund may invest a portion of its assets in securities issued by government sponsored entities such as Fannie Mae, Freddie Mac, and the Federal Home Loan Banks in the US. Foreign governments also sponsor similar entities, which may promote activities such aslow-cost housing or alternative energy. The Fund may also invest in the issues of regional, state, and local governments. The terms of such issues can be complex, and there can be no assurance that a government entity will support such enterprises that encounter financial difficulty.
Issuers of high-yield securities are generally not as strong financially as those issuing higher quality securities. These issuers are more likely to encounter financial difficulties and are more vulnerable to changes in the relevant economy that could affect their ability to make interest and principal payments as expected. High-yield bonds may have low or no ratings, and may be considered “junk bonds.”
Bond investments, especially mortgage-backed and asset-backed securities, are subject to the risk that borrowers will prepay the principal more quickly than expected (prepayment risk) or more slowly than expected (extension risk), which will affect the yield, average life, and price of the securities.
NOTE 2 – Unaudited Information
The information in this interim report has not been subjected to independent audit.
NOTE 3 – Significant Accounting Policies
The following is a summary of the significant accounting policies, in conformity with accounting principles generally accepted in the United States of America, which are consistently followed by the Funds in preparation of their financial statements.
Security valuation:
Investments in securities traded on a national securities exchange andover-the-counter securities for which sale prices are available are valued at that price. Securities for which there are no sales are valued at the latest bid price.
Debt securities are valued usingbid-side valuations provided by an independent service. The service determines valuations using factors such as yields or prices of bonds of comparable quality,
| May 31, 2019 | Semi-Annual Report | 19 | ||||
| Notes to Financial Statements(continued) |
type of issue, coupon maturity, ratings, trading activity, and general market conditions.
Fixed-income debt instruments, such as commercial paper, bankers’ acceptances, and US Treasury Bills, with a maturity of 60 days or less are valued at amortized cost, which approximates market value. Any discount or premium is accreted or amortized on a straight-line basis until maturity.
Foreign markets may close before the time as of which the Funds’ share prices are determined. Because of this, events occurring after the close and before the determination of the Funds’ share prices may have a material effect on the values of some or all of the Funds’ foreign securities. To account for this, the Funds may use outside pricing services for valuation of theirnon-US securities.
In cases in which there is not a readily available market price, a fair value for such security is determined in good faith by or under the direction of the Board of Trustees.
Security transactions are recorded on the trade date. Realized gains and losses on sales of securities are recorded on the identified cost basis.
Foreign currency:
Investment securities and other assets and liabilities denominated in foreign currencies are translated into US dollar amounts at the date of valuation. Purchases and sales of investment securities and income and expense items denominated in foreign currencies are translated into US dollar amounts on the respective dates of such transactions.
The Funds do not isolate that portion of the results of operations resulting from changes in foreign exchange rates on investments from the fluctuations arising from changes in market prices of securities held. Such fluctuations are included with the net realized and unrealized gain or loss from investments.
Reported net realized foreign exchange gains or losses arise from sales of foreign currencies, currency gains or losses realized between the trade and settlement dates on securities transactions, and the difference between the amounts of dividends, interest, and foreign withholding taxes recorded on the Funds’ books and the US dollar equivalent of the amounts actually received or paid. Net unrealized foreign exchange gains and losses arise from changes in the fair values of assets and liabilities, other than investments in securities at fiscal period end, resulting from changes in exchange rates.
Share valuation:
The net asset value (“NAV”) per share of each Fund is calculated by dividing the sum of the value of the securities held by each Fund, plus cash and other assets, minus all liabilities (including estimated accrued expenses) by the total number of shares outstanding for each Fund, rounded to the nearest cent. The Funds’ shares are not priced or traded on days the New York Stock Exchange is closed. The NAV is the offering and redemption price per share.
Fair value measurements:
Accounting Standards Codification (ASC) 820 establishes a three-tier framework for measuring fair value based on a hierarchy of inputs. The hierarchy distinguishes between market data obtained from independent sources (observable inputs) and the Funds’ own market assumptions (unobservable inputs). These inputs are used in determining the value of the Funds’ investments and are summarized below.
| Funds | Level 1 Quoted Price | Level 2 Significant Observable Input | Level 3 Significant Unobservable Input | Total | ||||||||||||
Sustainable Equity Fund | ||||||||||||||||
Common Stocks | ||||||||||||||||
Communications | $166,595 | $- | $- | $166,595 | ||||||||||||
Consumer Discretionary | 1,098,701 | 79,914 | - | $1,178,615 | ||||||||||||
Consumer Staples | 697,417 | 23,448 | - | $720,865 | ||||||||||||
Energy | - | 127,236 | - | $127,236 | ||||||||||||
Financials | 578,318 | 224,358 | - | $802,676 | ||||||||||||
Health Care | 216,214 | 111,375 | - | $327,589 | ||||||||||||
Industrials | 86,325 | 146,274 | - | $232,599 | ||||||||||||
Materials | 38,055 | 146,251 | - | $184,306 | ||||||||||||
Technology | 1,358,497 | 197,506 | - | $1,556,003 | ||||||||||||
Total Assets | $4,240,122 | $1,056,362 | $- | $5,296,484 | ||||||||||||
Sustainable Bond Fund | ||||||||||||||||
Corporate Bonds1 | $- | $20,803,231 | $- | $20,803,231 | ||||||||||||
Government Bonds1 | $- | $7,283,654 | $- | $7,283,654 | ||||||||||||
Total Assets | $- | $28,086,885 | $- | $28,086,885 | ||||||||||||
| 1 | See Schedule of Investments for industry breakout. |
During the period ended May 31, 2019, no Fund had transfers between Level 1, Level 2, or Level 3.
| 20 | May 31, 2019 | Semi-Annual Report | ||||
| Notes to Financial Statements(continued) |
| Level 1 — | Unadjusted quoted prices in active markets for identical assets or liabilities that the Trust has the ability to access. |
| Level 2 — | Observable inputs other than quoted prices in Level 1 that are observable for the asset or liability, either directly or indirectly. These inputs may include quoted prices for the identical instrument on an inactive market, prices for similar instruments, interest rates, prepayment speeds, credit risk, yield curves, default rates, and similar data. |
| Level 3 — | Unobservable inputs for the asset or liability, to the extent relevant observable inputs are not available, representing the Trust’s own assumptions about the assumptions a market participant would use in valuing the asset or liability, and would be based on the best information available. |
The availability of observable inputs can vary from security to security and is affected by a wide variety of factors, including, for example, the type of security, whether the security is new and not yet established in the marketplace, the liquidity of markets, and other characteristics particular to the security. To the extent that valuation is based on models or inputs that are less observable or unobservable in the market, the determination of fair value requires more judgment. Accordingly, the degree of judgment exercised in determining fair value is greatest for instruments categorized in Level 3.
The inputs used to measure fair value may fall into different levels of the fair value hierarchy. In such cases, for disclosure purposes, the level in the fair value hierarchy within which the fair value measurement falls in its entirety, is determined based on the lowest level input that is significant to the fair value measurement in its entirety.
The inputs or methodology used for valuing securities are not necessarily an indication of the risk associated with investing in those securities.
The table on page 20 is a summary of the inputs used as of May 31, 2019, in valuing the Funds’ investments carried at fair value.
Investment concentration:
The Funds may have deposits of cash with the custodian from time to time for one or more reasons. “Other assets (net of liabilities)” in the Funds’ Schedules of Investments primarily represents cash on deposit with the custodian. Cash on deposit will vary widely over time. Accounting Standards Codification (“ASC”) 825,“Financial Instruments,” identifies these items as a concentration of credit risk. The risk is managed by careful financial analysis and review of the custodian’s operations, resources, and protections available to the Trust. This process includes evaluation of other financial institutions providing investment company custody services.
Federal income taxes:
The Funds intend to comply with the requirements of the Internal Revenue Code necessary to qualify as a regulated investment company and to make the requisite distributions of income and capital gains to its shareowners sufficient to relieve them from all or substantially all federal income taxes. Therefore, no federal income tax provision is required.
The Funds recognize the tax benefits of uncertain tax positions only where the position is “more likely than not” to be sustained assuming examination by tax authorities. Management has analyzed the Funds’ tax positions and has concluded that no liability for unrecognized tax benefits should be recorded related to uncertain tax positions taken on returns filed for open tax years (2016-2018) or expected to be taken in the Funds’ 2019 tax returns. The Funds identify their major tax jurisdictions as US federal and foreign jurisdictions where the Funds make significant investments; however, the Funds are not aware of any tax positions for which it is reasonably possible that the total amounts of unrecognized tax benefits will change materially in the next 12 months.
Reclassification of capital accounts:
Accounting principles generally accepted in the United States of America require that certain components of net assets relating to permanent differences be reclassified between financial and tax reporting. These reclassifications have no effect on net assets or net asset value per share. As of November 30, 2018, the reclassification of capital accounts were as follows:
| Equity Fund | Bond Fund | |||||||
Distributable earnings | $- | $2,041 | ||||||
Paid-in capital | $- | $(2,041 | ) | |||||
These reclassifications were due to treatment of foreign currencies,re-designation of distributions, and investments in real estate investment trusts (REITs).
Distributions to shareowners:
For the Sustainable Bond Fund, dividends to shareowners from net investment income are paid daily and distributed on the last business day of each month. Sustainable Equity Fund pays income dividends annually, typically by the end of the year. As a result of its investment strategy, the Saturna Sustainable Equity Fund may not pay income dividends. For both Funds, distributions of capital gains, if any, are made at least annually, and as required to comply with federal excise tax requirements. Distributions to shareowners are determined in accordance with income tax regulations and are recorded on theex-dividend date. Dividends are paid in shares of the Funds, at the net asset value on the payable date. Shareowners may elect to take distributions if they total $10 or more in cash.
Use of estimates:
The preparation of financial statements in conformity with accounting principles generally accepted in the United States of America requires management to make estimates and assumptions that affect the reported amounts of assets and liabilities and disclosure of contingent assets and liabilities at the date of the financial statements and the reported amounts of increases and decreases in net assets from operations during the reporting period. Actual results could differ from those estimates.
Foreign taxes:
Withholding taxes on foreign dividends are paid (a portion of which may be reclaimable) or provided for in accordance with the applicable country’s tax rules and rates and are disclosed in the Statement of Operations. Withholding tax reclaims are filed in certain countries to recover a portion of the amounts previously withheld. The Funds record a reclaim receivable based on a number of factors, including a jurisdiction’s legal obligation to pay reclaims as well as payment history and market convention.
| May 31, 2019 | Semi-Annual Report | 21 | ||||
| Notes to Financial Statements(continued) |
Other:
Interest income is recognized on an accrual basis. Premiums on securities purchased are amortized, and discounts are accreted over the lives of the respective securities. Dividends from equity securities are recorded as income on theex-dividend date.
NOTE 4 – Transactions with Affiliated Persons
Under contracts approved annually by the Trust’s independent trustees, Saturna Capital Corporation provides investment advisory services and certain other administrative services required to conduct Trust business. Expenses incurred by the Trust on behalf of the Funds (e.g., legal fees) are allocated to the Funds on the basis of relative daily average net assets. For such services, each of the Funds pays the adviser an Investment Advisory and Administrative Services Fee of 0.65% for the Sustainable Equity Fund and 0.55% for the Sustainable Bond Fund of average net assets per annum, payable monthly. In addition, the adviser has agreed to certain limits on other expenses, as described below.
The Adviser has voluntarily undertaken to limit expenses of the Sustainable Equity Fund to 0.75% and the Sustainable Bond Fund to 0.65% through March 31, 2020. For the period ended May 31, 2019, the advisory fees incurred were as follows:
| Adviser Fees | Adviser Fees Waived | Expense Reimbursement | ||||||||||
Sustainable Equity | $18,293 | $(18,293 | ) | $(5,169 | ) | |||||||
Sustainable Bond | $82,282 | $(18,789 | ) | $- | ||||||||
In accordance with the expense limitation noted above, for the period ended May 31, 2019, Saturna Capital waived a portion of the advisory fees of the Sustainable Equity Fund and Sustainable Bond Fund. The adviser cannot recoup previously waived fees.
Saturna Brokerage Services, Inc. (“SBS”), a discount brokerage and subsidiary of Saturna Capital Corporation, is registered as a broker-dealer and acts as distributor. On December 19, 2014, the Funds adopted a Distribution Plan in accordance with Rule12b-1 under the 1940 Act. On June 2, 2017,12b-1 fees were terminated for both Saturna Sustainable Funds.
SBS is used to effect portfolio transactions for the Trust. SBS currently executes portfolio transactions without commission. Transactions effected through other brokers are subject to commissions payable to that broker.
Saturna Trust Company (“STC”), a subsidiary of Saturna Capital, acts as retirement plan custodian for Fund shareowners. Each Fund pays an annual fee of $10 per account for retirement plan services to Saturna Trust Company. For the period ended May 31, 2019, the Funds incurred the following amounts:
| Retirement plan custodial fees | ||||
Sustainable Equity | $596 | |||
Sustainable Bond | $386 | |||
Mrs. Jane Carten serves as a trustee and president of the Trust. She is also a director and president of Saturna Capital and vice president of Saturna Trust Company. Mrs. Carten is not compensated by the Trust. For the period ended May 31, 2019, the Trust incurred compensation expenses of $17,000 which is included in $32,456 of total expenses for the independent Trustees. The Saturna Sustainable Funds paid $6,226 of these total expenses.
The officers of the Trust are paid by Saturna Capital, not the Trust, except the Chief Compliance Officer, who may be partially compensated by the Trust. For the period ended May 31, 2019, the Funds paid the following compensation expenses for the Chief Compliance Officer:
| Chief Compliance Officer | ||||
Sustainable Equity | $892 | |||
Sustainable Bond | $3,836 | |||
On May 31, 2019, the trustees, officers, and their affiliates as a group owned 52.05% and 12.04% of the outstanding shares of Sustainable Equity Fund and Sustainable Bond Fund, respectively.
NOTE 5 – Distributions to Shareowners
The tax characteristics of distributions paid for the period ended May 31, 2019, and the fiscal year ended November 30, 2018 were as follows:
| Period ended May 31, 2019 | Year ended November 30, 2018 | |||||||
Sustainable Equity Fund | ||||||||
Ordinary income | $46,186 | $40,318 | ||||||
Sustainable Bond Fund | ||||||||
Ordinary income | $454,409 | $722,566 | ||||||
| 1 | Long-term capital gain dividend designated at 20% rate pursuant to Section 852(b)(3) of the Internal Revenue Code. |
| 22 | May 31, 2019 | Semi-Annual Report | ||||
| Notes to Financial Statements(continued) |
NOTE 6 – Federal Income Taxes
The cost basis of investments for federal income tax purposes on May 31, 2019, was as follows:
| Sustainable Equity | Sustainable Bond | |||||||
Cost of investments | $4,151,082 | $28,904,384 | ||||||
Gross tax unrealized appreciation | $1,318,316 | $254,470 | ||||||
Gross tax unrealized depreciation | $(172,914 | ) | $(1,071,969 | ) | ||||
Net tax unrealized appreciation (depreciation) | $1,145,402 | $(817,499 | ) | |||||
As of November 30, 2018, components of distributable earnings on a tax basis were as follows:
| Sustainable Equity | ||||
Undistributed ordinary income | $40,520 | |||
Tax accumulated earnings | 40,520 | |||
Accumulated capital losses | (284,394 | ) | ||
Unrealized appreciation | 866,045 | |||
Other unrealized losses | (82 | ) | ||
Total accumulated earnings | 622,089 | |||
| Sustainable Bond | ||||
Accumulated capital losses | (19,458 | ) | ||
Unrealized depreciation | (1,512,733 | ) | ||
Other unrealized losses | (3,546 | ) | ||
Total accumulated earnings | (1,535,737 | ) | ||
On November 30, 2018, the Funds had capital loss carryforwards as follows, subject to regulation.
| Carryforward | Expiration | |||||||
Equity Fund | ||||||||
Short-term loss carryforward | $275,790 | Unlimited | ||||||
Long-term loss carryforward | $8,604 | Unlimitied | ||||||
| $284,394 | ||||||||
| Carryforward | Expiration | |||||||
Bond Fund | ||||||||
Short-term loss carryforward | $16,739 | Unlimited | ||||||
Long-term loss carryforward | $2,719 | Unlimitied | ||||||
| $19,458 | ||||||||
NOTE 7 – Investments
Investment transactions other than short-term investments for the period ended May 31, 2019, were as follows:
| Purchases | Sales | |||||||
Sustainable Equity | $241,866 | $462,563 | ||||||
Sustainable Bond | $7,261,593 | $10,105,319 | ||||||
NOTE 8 – Custodian
Under agreements in place with the Trust’s custodian, UMB Bank, custody fees are reduced by credits for cash balances. Such reductions for the period ended May 31, 2019, were as follows:
| Custodian Fee Credits | ||||
Sustainable Equity | $327 | |||
Sustainable Bond | $1,488 | |||
NOTE 9 – Subsequent Events
In preparing these financial statements, the Funds have evaluated events and transactions for potential recognition or disclosure through the date the financial statements were issued.
There were no other events or transactions during the period that materially impacted the amounts or disclosures in the Funds’ financial statements.
| May 31, 2019 | Semi-Annual Report | 23 | ||||
Expenses
All mutual funds have operating expenses. As a Saturna Sustainable Fund shareowner, you incur ongoing costs, including management fees and other Fund expenses such as shareowner reports (like this one). Operating expenses, which are deducted from a fund’s gross earnings, directly reduce the investment return of a fund. Mutual funds (unlike other financial investments) only report their results after deduction of operating expenses.
With the Saturna Sustainable Funds, unlike many mutual funds, you do not incur sales charges (loads) on purchases, reinvested dividends, or other distributions. You do not incur redemption fees or exchange fees. You may incur fees related to extra services requested by you for your account, such as bank wires. The examples below are intended to help you understand your ongoing costs (in dollars) of investing in the Funds and to compare these costs with the ongoing costs of investing in other mutual funds.
Examples
The following examples are based on an investment of $1,000 invested at the beginning of the period and held for the entire period (December 1, 2018 to May 31, 2019).
Actual Expenses
The first line for each Fund provides information about actual account values and actual expenses. You may use the information in this line, together with the amount you have invested, to estimate the expenses that you paid over the period. Simply divide your account value by $1,000 (for example, an $8,600 account value divided by $1,000 = 8.6), then multiply the result by the number in the first line under the heading entitled “Expenses Paid During Period” to estimate the expenses you paid on your account during this period. The Funds may charge for extra services (such as domestic bank wires, international bank wires, or overnight courier delivery of redemption checks) rendered on request, which you may need to estimate to determine your total expenses.
Hypothetical Example For Comparison Purposes
The second line for each Fund provides information about hypothetical account values and hypothetical expenses based on each Fund’s actual expense ratio (based on the last six months) and an assumed rate of return of 5% per year before expenses, which is not the Fund’s actual return. The hypothetical account values and expenses may not be used to estimate the actual ending account balance or expenses you paid for the period. You may use this information to compare the ongoing costs of investing in the Funds and other mutual funds. To do so, compare this 5% hypothetical example with the 5% hypothetical examples that appear in the shareowner reports of other mutual funds. You may wish to add other fees that are not included in the expenses shown in the table, such as IRA fees charged by custodians other than Saturna Trust Company (note that Saturna does not charge such fees to shareowners directly on Saturna IRAs, ESAs, or HSAs with the Saturna Sustainable Funds), and charges for extra services such as bank wires.
Please note that the expenses shown in the tables are meant to highlight your ongoing costs only and do not reflect any transactional costs, such as sales charges (loads) or exchange fees (note that the Saturna Sustainable Funds do not assess any such transactional costs). Therefore, the “Hypothetical” line of each fund is useful in comparing ongoing costs only, and may not help you determine the relative total costs of owning different funds.
| | Beginning Account Value [December 1, 2018] | | | Ending Account Value [May 31, 2019] | | | Expenses Paid During Period | | | Annualized Expense Ratio | | |||||
Sustainable Equity Fund (SEEFX), Actual | $1,000.00 | $1,064.20 | $3.88 | 0.75% | ||||||||||||
Hypothetical (5% return before expenses) | $1,000.00 | $1,021.17 | $3.80 | 0.75% | ||||||||||||
Sustainable Bond Fund (SEBFX), Actual | $1,000.00 | $1,036.90 | $3.32 | 0.65% | ||||||||||||
Hypothetical (5% return before expenses) | $1,000.00 | $1,021.68 | $3.29 | 0.65% | ||||||||||||
Expenses are equal to annualized expense ratios indicated above (based on the most recent fiscal period of December 1, 2018, through May 31, 2019) multiplied by the average account value over the period, multiplied by 182/365 (to reflect theone-half year period).
| 24 | May 31, 2019 | Semi-Annual Report | ||||
Availability of Portfolio Information
| (1) | The Saturna Sustainable Funds file complete schedules of portfolio holdings with the SEC for the first and third quarters of each fiscal year on FormN-Q. |
| (2) | The Funds’ FormsN-Q are available on the SEC’s website at www. sec.gov and at www.saturnasustainable.com. |
| (3) | The Funds’ FormsN-Q may be reviewed and copied at the SEC’s Public Reference Room in Washington, DC. Information on the operation of the Public Reference Room may be obtained by calling1-800-SEC-0330. |
| (4) | The Funds make a complete schedule of portfolio holdings after the end of each month available to investors at www.saturnasustainable.com. |
Householding Policy
To reduce expenses, we may mail only one copy of the Funds’ prospectus, each annual and semi-annual report, and proxy statements when necessary, to those addresses shared by two or more accounts. If you wish to receive individual and/or more copies of these documents, please call us at1-800-728-8762 or write to us at Saturna Capital/Saturna Sustainable Funds, P.O. Box N, Bellingham, WA 98227. We will begin sending you individual copies 30 days after receiving your request.
If you are currently receiving multiple copies and wish to receive only one copy, please call us at1-800-728-8762 or write to us at Saturna Capital/Saturna Sustainable Funds, P.O. Box N, Bellingham, WA 98227. We will begin sending you a single copy with subsequent report mailings.
Availability of Proxy Voting Information
| (1) | A description of the policies and procedures that the Funds use to determine how to vote proxies relating to portfolio securities is available (a) without charge, upon request, by calling Saturna Capital at1-800-728-8762; (b) on the Funds’ website at www. saturnasustainable.com; and (c) on the SEC’s website at www. sec.gov. |
| (2) | Information regarding how each Fund voted proxies relating to portfolio securities during the most recent12-month period ended June 30 is available (a) without charge, upon request, by calling Saturna Capital at1-800-728-8762; (b) on the Funds’ website at www.saturnasustainable.com; and (c) on the SEC’s website at www.sec.gov. |
Privacy Statement
At Saturna Capital and Saturna Investment Trust, we understand the importance of maintaining the privacy of your financial information. We want to assure you that we protect the confidentiality of any personal information that you share with us. In addition, we do not sell information about our current or former customers.
In the course of our relationship, we gather certain nonpublic information about you, including your name, address, investment choices, and account information. We do not disclose your information to unaffiliated third parties unless it is necessary to process a transaction; service your account; deliver your account statements, shareowner reports and other information; or as required by law. When we disclose information to unaffiliated third parties, we require a contract to restrict the companies’ use of customer information and from sharing or using it for any purposes other than performing the services for which they were required.
We may share information within the Saturna Capital family of companies in the course of informing you about products or services that may address your investing needs.
We maintain our own technology resources to minimize the need for any third party services, and restrict access to information within Saturna. We maintain physical, electronic, and procedural safeguards to guard your personal information. If you have any questions or concerns about the security or privacy of your information, please call us at1-800-728-8762.
| May 31, 2019 | Semi-Annual Report | 25 | ||||
Except for this legend, this page has been left blank intentionally.
| 26 | May 31, 2019 | Semi-Annual Report | ||||
Except for this legend, this page has been left blank intentionally.
| May 31, 2019 | Semi-Annual Report | 27 | ||||

Performance Summary(as of June 30, 2019)
|
Average Annual Returns(before any taxes paid by shareowners) |
| |||||||||||||||||||||||
| 1 Year | 3 Year | 5 Year | 10 Year | 15 Year | Expense Ratio | |||||||||||||||||||
IdahoTax-Exempt Fund | 5.80% | 1.74% | 2.56% | 3.21% | 3.36% | 0.68% | 1 | |||||||||||||||||
S&P Idaho Municipal Bond Index | 6.42% | 2.61% | 3.99% | 5.29% | n/a | n/a | ||||||||||||||||||
“Muni Single State Intermediate” Category Average2 | 5.25% | 1.56% | 2.58% | 3.49% | 3.46% | 0.96% | ||||||||||||||||||
Performance data quoted in this report represents past performance, is before any taxes payable by shareowners, and is no guarantee of future results. Current performance may be higher or lower than that stated herein. Performance current to the most recentmonth-end is available by calling toll-free1-800-728-8762 or visiting www.idahotaxexemptfund.com. Average annual total returns are historical and include change in share value as well as reinvestment of dividends and capital gains, if any. The investment return and principal value of an investment will fluctuate so that an investor’s shares, when redeemed, may be worth more or less than their original cost.
Please consider an investment’s objectives, risks, charges, and expenses carefully before investing. To obtain this and other important information about the IdahoTax-Exempt Fund in a prospectus or summary prospectus, ask your financial advisor, visit www.idahotaxexemptfund.com, or call toll free1-800-728-8762. Please read the prospectus or summary prospectus carefully before investing.
A note about risk: See Notes to Financial Statements for a discussion of investment risks. For a more detailed discussion of the risks associated with the Fund, please see the Fund’s prospectus or summary prospectus.
| 1 | By regulation, the expense ratio shown in this table is as stated in the Fund’s most recent prospectus, which is dated March 27, 2019, and incorporates results for the fiscal year ended November 30, 2018. The ratio presented in this table differs from expense ratios shown elsewhere in this report as they represent different fiscal periods. |
| 2 | Source: Morningstar June 30, 2019. Morningstar, Inc. is an independent fund performance monitor. Category returns are determined monthly from total returns by Morningstar, by category as determined by Morningstar. Category average expense ratios are determined by Morningstar from prospectus level data reported by funds in the category. |
| 2 | May 31, 2019 | Semi-Annual Report | ||||

Fellow Shareowners:
Idaho is thriving. Broad economic opportunities, record low unemployment (2.7%), affordable housing, strong personal income, nation leading home price appreciation, a balanced tax structure, abundant outdoor attractions, and a burgeoning tech sector all contribute to Idaho’s booming population growth. Idaho has the 10th highest percentage of vacation homes in the US and the highest percentage in the Pacific Northwest according to Bloomberg Pursuits. SmartAsset ranked Idaho fourth best in the nation for Best Places for The Middle Class in 2018. Remarkably, state tax payers are as healthy as the state’s finances.
Idaho state total gross domestic product surpassed $77 billion for the first time in 2018, a 6.3% increase. State reserve funds grew 15%. Total revenues for governmental activities exceeded total expenditures for governmental activities by $1 billion. The unassigned general fund balance (for discretionary use) ended the year at $801 million, up 15%. Idaho’s combined net position (a useful indicator of whether the financial position of the state is improving or deteriorating) grew $803 million or 6%. Idaho also improved pension funding (plan fiduciary net position as a % total pension liabilities) to 82.5%.
With improving economic conditions and strong revenue growth, the legislature increased appropriations for education, cut taxes for most individuals and businesses providing nearly $142 million in tax relief, and approved the largest cut in state regulations in history. These actions add to the attractiveness of one of the nation’s most economically competitive states. There is not much the state of Idaho is getting wrong these days. The point of this highlight reel is to emphasize that Idaho learned the lessons of 2008 and is better prepared than most other states to successfully endure whatever the next economic calamity happens to be.
Low US unemployment, a firm US Dollar, and modest US inflation do not normally signal US monetary policy easing. However, the uncertainty of the US China trade dispute and its depressing impact on global economic growth and inflation has now overwhelmed the US Federal Reserve’s drive to normalize US interest rates. In 2018, slowing global growth and falling US inflation expectations tightened US monetary conditions, causing a full percent decline in US yields. With US bond yields already in decline, and with Europe and China readying new rounds of monetary policy easing, the Fed may be unable to resist matching their easing moves.
As global growth softens, a US recession remains at the forefront of the minds of US investors. Despite recent slowdowns in US housing, automobiles, and manufacturing sectors, the US economy continues to grow, albeit slowly. In a stabilizing sign for the US economy, the yield spread between10-year and30-year US Treasurys has widened from 0.10% to 0.50% over the last year. With quantitative easing and lower short-term rates on standby in case of a US economic slowdown, market conditions are supportive for fixed-income asset prices. Diminished US municipal yields remain some of the most attractive in a world with $13 trillion ofnegative yielding sovereign and corporate bonds destroying investors’ capital. US rates appear to have room to fall further in the coming years, boosting municipal bond returns in the process.
Respectfully,
(photo omitted)
Jane Carten,
President
(photo omitted)
Phelps McIlvaine,
Vice President, Portfolio Manager
| May 31, 2019 | Semi-Annual Report | 3 | ||||
Performance Summary |
Average Annual Returns (as of May 31, 2019) |
| |||||||||||||||
| 1 Year | 5 Year | 10 Year | Expense Ratio1 | |||||||||||||
IdahoTax-Exempt Fund | 5.25% | 2.43% | 3.07% | 0.68% | ||||||||||||
S&P Idaho Municipal Bond Index | 5.97% | 3.92% | 5.18% | n/a | ||||||||||||
Growth of $10,000
 | Comparison of any mutual fund to a market index must be made bearing in mind that the Index is unmanaged and expense-free. Conversely, the fund will (1) be actively managed; (2) have an objective other than mirroring the index, such as limiting risk; (3) bear transaction and other costs; (4) stand ready to buy and sell its securities to shareowners on a daily basis; and (5) provide a wide range of services. The graph compares $10,000 invested in the Fund on November 30, 2008, to an identical amount invested in the Standard & Poor’s Idaho Municipal Bond Index, a broad-based index of Idaho municipal bond prices. The graph shows that an investment in the Fund would have risen to $13,532 versus $16,576 in the S&P Idaho Municipal Bond Index. |
Past performance does not guarantee future results. The “Growth of $10,000” graph and “Average Annual Returns” performance table assume the reinvestment of dividends and capital gains. They do not reflect the deduction of taxes that a shareowner might pay on fund distributions or the redemption of fund shares.
| 1 | By regulation, the expense ratio for the Fund shown in this table is as stated in the Fund’s most recent prospectus, which is dated March 27, 2019, and incorporates results for the fiscal year ended November 30, 2018. The ratio presented in this table differs from expense ratios shown elsewhere in this report as they represent different fiscal periods. |
Fund Objective
IdahoTax-Exempt Fund seeks to provide income free from federal income, federal alternative minimum, and Idaho state income taxes. Preservation of capital is a secondary objective.
Top 10 Holdings | ||||
| % of Total Net Assets | ||||
Teton Co, ID SCD #401 Driggs(4.00% due 09/15/2035) | 4.2% | |||
University of Idaho Revenue(5.00% due 04/01/2032) | 3.6% | |||
Canyon Co ID SCD #134 Middleton(4.00% due 09/15/2028) | 3.3% | |||
Idaho State Building Authority(5.00% due 09/01/2032) | 3.2% | |||
Idaho Bond Bank(4.00% due 09/15/2032) | 3.2% | |||
Nez Perce CO ISD #1 Lewiston(5.00% due 09/15/2029) | 3.0% | |||
Idaho Fish Wildlife Foundation Rev(5.00% due 12/01/2033) | 2.9% | |||
Ada & Canyon Cos ID JSD #2 Meridian(5.00% due 08/15/2032) | 2.8% | |||
Boise City Urban Renewal Lease Rev(5.00% due 12/15/2032) | 2.6% | |||
Twin Falls Co ID SCD #411(4.25% due 09/15/2030) | 2.5% | |||
Portfolio Diversification | ||||||||||||
| % of Total Net Assets | ||||||||||||
General Obligation | 46.9% | ∎ |
|
|
| |||||||
State Education | 19.6% | ∎ | ||||||||||
Real Estate | 10.9% | ∎ | ||||||||||
Financial Services | 5.7% | ∎ | ||||||||||
Pollution Control | 2.5% | ∎ | ||||||||||
Medical - Hospitals | 2.3% | ∎ | ||||||||||
Health Care Facilities | 2.2% | ∎ | ||||||||||
Water Supply | 2.1% | ∎ | ||||||||||
Transportation | 1.6% | ∎ | ||||||||||
Other assets (net of liabilities) | 6.2% | ∎ | ||||||||||

| 4 | May 31, 2019 | Semi-Annual Report | ||||
| Schedule of Investments | As of May 31, 2019 | |||||||||||||||||
| Tax-Exempt Municipal Bonds - 93.8% | Coupon / Maturity | Face Amount | Market Value | Percentage of Assets | ||||||||||||||
| Financial Services | ||||||||||||||||||
Idaho Bond Bank | 4.00% due 09/15/2032 | $405,000 | $437,185 | 3.2% | ||||||||||||||
Idaho Housing & Finance Rev | 3.00% due 07/01/2036 | 335,000 | 333,704 | 2.5% | ||||||||||||||
| 770,889 | 5.7% | |||||||||||||||||
| General Obligation | ||||||||||||||||||
Ada & Canyon Cos ID JSD #2 Meridian | 5.00% due 08/15/2032 | 325,000 | 384,384 | 2.8% | ||||||||||||||
Ada & Canyon Cos ID JSD #3 Kuna | 4.00% due 09/15/2027 | 100,000 | 117,504 | 0.9% | ||||||||||||||
Adams & Washington Cos ID JSD #432 | 4.00% due 08/15/2019 | 100,000 | 100,522 | 0.7% | ||||||||||||||
Bonneville & Bingham Cos JSD #93 | 5.00% due 09/15/2031 | 200,000 | 221,400 | 1.6% | ||||||||||||||
Bonneville & Bingham Cos JSD #93 | 5.00% due 09/15/2029 | 250,000 | 277,342 | 2.0% | ||||||||||||||
Bonneville Co ID SCD #91 | 4.00% due 09/15/2026 | 15,000 | 16,191 | 0.1% | ||||||||||||||
Bonneville Co ID SCD #91 | 4.00% due 09/15/2026 | 35,000 | 37,809 | 0.3% | ||||||||||||||
Bonneville Co ID SCD #91 | 3.75% due 09/15/2032 | 285,000 | 297,178 | 2.2% | ||||||||||||||
Boundary County ID SCD #101 | 4.00% due 08/15/2021 | 240,000 | 241,291 | 1.8% | ||||||||||||||
Canyon Co ID SCD #134 Middleton | 4.00% due 09/15/2028 | 400,000 | 454,056 | 3.3% | ||||||||||||||
Canyon Co ID SCD #135 Notus | 3.25% due 09/15/2031 | 290,000 | 308,430 | 2.3% | ||||||||||||||
Canyon Co ID SCD #135 Notus | 3.25% due 09/15/2032 | 170,000 | 180,339 | 1.3% | ||||||||||||||
Canyon Co ID SCD #139 Vallivue | 5.00% due 09/15/2024 | 260,000 | 288,964 | 2.1% | ||||||||||||||
Cariboo Franklin Bannock JSD #148 | 3.25% due 09/15/2035 | 300,000 | 318,894 | 2.3% | ||||||||||||||
Cassia Oneida Twin Falls JSD #151 | 3.375% due 09/15/2034 | 160,000 | 166,147 | 1.2% | ||||||||||||||
Kootenai Co ID SCD #271 PREREF | 4.00% due 09/15/2025 | 40,000 | 43,109 | 0.3% | ||||||||||||||
Kootenai Co ID SCD #271 UNREF | 4.00% due 09/15/2025 | 125,000 | 134,916 | 1.0% | ||||||||||||||
Kootenai Co ID SCD #273 | 4.00% due 08/15/2031 | 265,000 | 295,772 | 2.2% | ||||||||||||||
Kootenai-Shoshone ID Area Libraries | 4.25% due 08/01/2021 | 220,000 | 220,990 | 1.6% | ||||||||||||||
Latah Co ID SCD #281 Moscow Ser B | 4.00% due 08/15/2027 | 100,000 | 109,102 | 0.8% | ||||||||||||||
Latah Co ID SCD #281 Moscow Ser B | 4.00% due 08/15/2028 | 200,000 | 217,358 | 1.6% | ||||||||||||||
Madison Co. Id. SDC #321 | 5.00% due 09/15/2035 | 250,000 | 302,378 | 2.2% | ||||||||||||||
Teton Co, ID SCD #401 Driggs | 4.00% due 09/15/2035 | 500,000 | 566,530 | 4.2% | ||||||||||||||
Twin Falls Co ID SCD #411 | 4.00% due 09/15/2027 | 170,000 | 190,373 | 1.4% | ||||||||||||||
Twin Falls Co ID SCD #411 | 4.25% due 09/15/2030 | 300,000 | 335,574 | 2.5% | ||||||||||||||
Twin Falls Co ID SCD #411 | 4.75% due 09/15/2039 | 200,000 | 232,876 | 1.7% | ||||||||||||||
Twin Falls Co ID SCD #411 Series A | 4.25% due 09/15/2031 | 100,000 | 110,997 | 0.8% | ||||||||||||||
Valley & Adams Cos ID JSD #421 | 3.00% due 08/01/2026 | 220,000 | 229,603 | 1.7% | ||||||||||||||
| 6,400,029 | 46.9% | |||||||||||||||||
| Health Care Facilities | ||||||||||||||||||
Idaho Health Faci Auth Hos Rev | 5.00% due 12/01/2047 | 260,000 | 304,806 | 2.2% | ||||||||||||||
| 304,806 | 2.2% | |||||||||||||||||
| Medical - Hospitals | ||||||||||||||||||
Idaho Health Rev Trinity Health Grp | 3.25% due 12/01/2028 | 300,000 | 317,991 | 2.3% | ||||||||||||||
| 317,991 | 2.3% | |||||||||||||||||
| Pollution Control | ||||||||||||||||||
Idaho Bond Bank | 4.00% due 09/15/2033 | 135,000 | 152,797 | 1.1% | ||||||||||||||
Idaho Bond Bank Authority | 4.30% due 09/01/2022 | 20,000 | 20,043 | 0.2% | ||||||||||||||
Idaho Bond Bank Authority | 4.00% due 09/15/2032 | 130,000 | 147,619 | 1.1% | ||||||||||||||
Idaho Bond Bank Authority, Undefeasement | 4.125% due 09/15/2023 | 20,000 | 20,042 | 0.1% | ||||||||||||||
| 340,501 | 2.5% | |||||||||||||||||
Continued on next page.
| The accompanying notes are an integral part of these financial statements. | Semi-Annual Report | May 31, 2019 | 5 | |||||
| Schedule of Investments | As of May 31, 2019 | |||||||||||||||||
| Tax-Exempt Municipal Bonds - 93.8% | Coupon / Maturity | Face Amount | Market Value | Percentage of Assets | ||||||||||||||
| Real Estate | ||||||||||||||||||
Boise City Urban Renewal Lease Rev | 5.00% due 12/15/2032 | $300,000 | $349,911 | 2.6% | ||||||||||||||
Idaho Fish Wildlife Foundation Rev | 5.00% due 12/01/2033 | 320,000 | 393,277 | 2.9% | ||||||||||||||
Idaho State Building Authority | 5.00% due 09/01/2031 | 200,000 | 219,494 | 1.6% | ||||||||||||||
Idaho State Building Authority | 5.00% due 09/01/2032 | 400,000 | 438,460 | 3.2% | ||||||||||||||
Post Falls ID LID SPA | 5.00% due 05/01/2021 | 90,000 | 90,862 | 0.6% | ||||||||||||||
| 1,492,004 | 10.9% | |||||||||||||||||
| State Education | ||||||||||||||||||
Boise State University ID Revenue | 5.00% due 04/01/2028 | 125,000 | 146,431 | 1.1% | ||||||||||||||
Boise State University ID Revenue | 5.00% due 04/01/2032 | 160,000 | 189,046 | 1.4% | ||||||||||||||
Idaho State University | 4.00% due 04/01/2027 | 170,000 | 191,933 | 1.4% | ||||||||||||||
Idaho State University | 4.00% due 04/01/2030 | 245,000 | 271,634 | 2.0% | ||||||||||||||
Idaho State University Revenue | 3.00% due 04/01/2031 | 250,000 | 259,313 | 1.9% | ||||||||||||||
Idaho State University Revenue | 3.00% due 04/01/2032 | 160,000 | 165,112 | 1.2% | ||||||||||||||
Nez Perce CO ISD #1 Lewiston | 5.00% due 09/15/2029 | 330,000 | 407,078 | 3.0% | ||||||||||||||
North Idaho College Dormitory Rev | 4.00% due 11/01/2030 | 285,000 | 314,421 | 2.3% | ||||||||||||||
University of Idaho Revenue | 5.00% due 04/01/2028 | 225,000 | 231,109 | 1.7% | ||||||||||||||
University of Idaho Revenue | 5.00% due 04/01/2032 | 455,000 | 492,706 | 3.6% | ||||||||||||||
| 2,668,783 | 19.6% | |||||||||||||||||
| Transportation | ||||||||||||||||||
Boise ID Airport Park Fac Rev | 3.00% due 09/01/2028 | 210,000 | 214,498 | 1.6% | ||||||||||||||
| 214,498 | 1.6% | |||||||||||||||||
| Water Supply | ||||||||||||||||||
Payette Lakes Rec Wtr & Swr Rev | 4.00% due 08/01/2034 | 255,000 | 279,908 | 2.1% | ||||||||||||||
| 279,908 | 2.1% | |||||||||||||||||
| Total investments | (Cost $12,308,490) | 12,789,409 | 93.8% | |||||||||||||||
| Other assets (net of liabilities) | 844,249 | 6.2% | ||||||||||||||||
| Total net assets | $13,633,658 | 100.0% | ||||||||||||||||
Bond Quality Diversification | ||||||||||||
| % of Total Net Assets |
| |||||||||||
Rated “AAA” | 33.8% | ∎ |
|
|
| |||||||
Rated “AA+” | 22.3% | ∎ | ||||||||||
Rated “AA” | 8.5% | ∎ | ||||||||||
Rated “AA-” | 7.4% | ∎ | ||||||||||
Rated “A+” | 15.9% | ∎ | ||||||||||
Rated “A” | 4.9% | ∎ | ||||||||||
Not rated | 1.0% | ∎ | ||||||||||
Other Assets (net of liabilities) | 6.2% | ∎ | ||||||||||
| Credit ratings are the lesser of S&P Global Ratings or Moody’s Investors Service. If neither S&P nor Moody’s rate a particular security, that security is categorized as not rated (except for US Treasury securities and securities issued or backed by US agencies which inherit the credit rating for the US government). Ratings range from AAA (highest) to D (lowest). Bonds rated BBB or above are considered investment grade. Credit ratings BB and below are lower-rated securities (junk bonds). Ratings apply to the creditworthiness of the issuers of the underlying securities and not the Fund or its shares. Ratings may be subject to change. |
| |||||||||||
| 6 | May 31, 2019 | Semi-Annual Report | The accompanying notes are an integral part of these financial statements. | |||||
Statement of Assets and Liabilities
| As of May 31, 2019 |
| |||
Assets | ||||
Investments in securities, at value | $12,789,409 | |||
Cash | 729,586 | |||
Interest receivable | 124,154 | |||
Prepaid expenses | 3,319 | |||
Insurance reserve premium | 801 | |||
Total assets | 13,647,269 | |||
Liabilities | ||||
Accrued advisory fees | 5,728 | |||
Distributions payable | 4,551 | |||
Payable for fund shares redeemed | 2,939 | |||
Accrued Chief Compliance Officer expenses | 352 | |||
Accrued retirement plan custodial fees | 41 | |||
Total liabilities | 13,611 | |||
Net assets | $13,633,658 | |||
Analysis of net assets | ||||
Paid-in capital (unlimited shares authorized, without par value) | $13,241,556 | |||
Total distributable earnings | 392,102 | |||
Net assets applicable to Fund shares outstanding | $13,633,658 | |||
Fund shares outstanding | 2,481,344 | |||
Net asset value, offering and redemption price per share | $5.49 | |||
Statement of Operations
| Period ended May 31, 2019 |
| |||
Investment income | ||||
Interest income | $185,504 | |||
Total investment income | 185,504 | |||
Expenses | ||||
Investment adviser fees | 33,263 | |||
Audit fees | 2,587 | |||
Chief Compliance Officer expenses | 1,980 | |||
Trustee fees | 1,608 | |||
Filing and registration fees | 1,478 | |||
Transfer agent fees | 918 | |||
Other expenses | 778 | |||
Printing and postage | 578 | |||
Legal fees | 426 | |||
Custodian fees | 286 | |||
Retirement plan custodial fees | 50 | |||
Total gross expenses | 43,952 | |||
Less transfer agent fees waived | (918 | ) | ||
Less custodian fee credits | (234 | ) | ||
Net expenses | 42,800 | |||
Net investment income | $142,704 | |||
Net realized gain from investments | $15,727 | |||
Net increase in unrealized appreciation on investments | 508,167 | |||
Net gain on investments | $523,894 | |||
Net increase in net assets resulting from operations | $666,598 | |||
| The accompanying notes are an integral part of these financial statements. | Semi-Annual Report | May 31, 2019 | 7 | |||||
Statement of Changes of Net Assets | Period ended May 31, 2019 | Year ended November 30, 2018 | ||||||
Increase (decrease) in net assets from operations | ||||||||
From operations | ||||||||
Net investment income | $142,704 | $361,335 | ||||||
Net realized gain (loss) on investment | 15,727 | (44,849 | ) | |||||
Net increase (decrease) in unrealized appreciation | 508,167 | (232,107 | ) | |||||
Net increase in net assets | 666,598 | 84,379 | ||||||
Distributions to shareholders | (142,704 | ) | (361,335 | ) | ||||
Capital share transactions | ||||||||
Proceeds from sales of shares | 501,240 | 3,147,317 | ||||||
Value of shares issued in reinvestment of dividends | 113,999 | 300,919 | ||||||
Cost of shares redeemed | (1,059,793 | ) | (7,091,173 | ) | ||||
Total capital share transactions | (444,554 | ) | (3,642,937 | ) | ||||
Total increase (decrease) in net assets | 79,340 | (3,919,893 | ) | |||||
Net assets | ||||||||
Beginning of period | 13,554,318 | 17,474,211 | ||||||
End of period | $13,633,658 | $13,554,318 | ||||||
Shares of the Fund sold and redeemed | ||||||||
Number of shares sold | 92,966 | 591,416 | ||||||
Number of shares issued in reinvestment of dividends | 21,072 | 56,625 | ||||||
Number of shares redeemed | (197,564 | ) | (1,337,291 | ) | ||||
Net decrease in number of shares outstanding | (83,526 | ) | (689,250 | ) | ||||
Financial Highlights | For period ended | For the year ended November 30, | ||||||||||||||||||||||
Selected data per share of outstanding capital stock throughout each period: | May 31, 2019 | 2018 | 2017 | 2016 | 2015 | 2014 | ||||||||||||||||||
Net asset value at beginning of period | $5.28 | $5.37 | $5.29 | $5.48 | $5.51 | $5.36 | ||||||||||||||||||
Income from investment operations | ||||||||||||||||||||||||
Net investment income | 0.06 | 0.12 | 0.13 | 0.14 | 0.15 | 0.16 | ||||||||||||||||||
Net gains (losses) on securities (both realized & unrealized) | 0.21 | (0.09 | ) | 0.08 | (0.19 | ) | (0.03 | ) | 0.15 | |||||||||||||||
Total from investment operations | 0.27 | 0.03 | 0.21 | (0.05 | ) | 0.12 | 0.31 | |||||||||||||||||
Less distributions | ||||||||||||||||||||||||
Dividends (from net investment income) | (0.06 | ) | (0.12 | ) | (0.13 | ) | (0.14 | ) | (0.15 | ) | (0.16 | ) | ||||||||||||
Distributions (from capital gains) | - | - | - | 0.00 | A | 0.00 | A | 0.00 | A | |||||||||||||||
Total distributions | (0.06 | ) | (0.12 | ) | (0.13 | ) | (0.14 | ) | (0.15 | ) | (0.16 | ) | ||||||||||||
Net asset value at end of period | $5.49 | $5.28 | $5.37 | $5.29 | $5.48 | $5.51 | ||||||||||||||||||
Total returnB | 5.09% | 0.51% | 3.90% | (0.95 | )% | 2.21% | 5.83% | |||||||||||||||||
Ratios / supplemental data | ||||||||||||||||||||||||
Net assets ($000), end of period | $13,634 | $13,554 | $17,474 | $17,997 | $17,420 | $16,721 | ||||||||||||||||||
Ratio of expenses to average net assets | ||||||||||||||||||||||||
Before transfer agent fee waiver and custodian fee creditsC | 0.66% | 0.68% | 0.67% | 0.67% | 0.67% | 0.65% | ||||||||||||||||||
After transfer agent fee waiverC | 0.65% | 0.67% | 0.66% | 0.66% | 0.66% | 0.63% | ||||||||||||||||||
After transfer agent fee waiver and custodian fee creditsC | 0.64% | 0.67% | 0.65% | 0.65% | 0.66% | 0.63% | ||||||||||||||||||
Ratio of net investment income after custodian credits to average net assetsC | 2.15% | 2.20% | 2.33% | 2.54% | 2.66% | 2.85% | ||||||||||||||||||
Portfolio turnover rateB | 2% | 13% | 20% | 15% | 7% | 5% | ||||||||||||||||||
| A | Amount is less than $0.01 |
| B | Not annualized for periods less than one year. |
| C | Annualized for percids less than one year. |
| 8 | May 31, 2019 | Semi-Annual Report | The accompanying notes are an integral part of these financial statements. | |||||
| Notes to Financial Statements |
Note 1 – Organization
Saturna Investment Trust (the “Trust”) was established under Washington State Law as a business trust on February 20, 1987. The Trust is registered as anopen-end, diversified management company under the Investment Company Act of 1940, as amended. In addition to IdahoTax-Exempt Fund (the “Fund”), eight portfolios have been created to date: Sextant Short-Term Bond Fund, Sextant Bond Income Fund, Sextant Core Fund, Sextant Global High Income Fund, Sextant Growth Fund, Sextant International Fund, Saturna Sustainable Equity Fund, and Saturna Sustainable Bond Fund (each, a “Fund”, and collectively, the “Funds”). The other eight portfolios are distributed through separate prospectuses and the results of those Funds are contained in separate reports.
The IdahoTax-Exempt Fund was first authorized to sell shares of beneficial interest on September 4, 1987.
The Fund is an investment company and accordingly follows the investment accounting and reporting guidance of the Financial Accounting Standards Board (FASB) Accounting Standard Codification Topic 946 “Financial Services – Investment Companies.”
Investment risks:
The value of Fund shares rises and falls as the value of the bonds in which the Fund invests goes up and down. The risks inherent in the Fund depend primarily on the terms and quality of the obligations in the Fund’s portfolio, as well as on market conditions. When interest rates rise, bond prices fall. When interest rates fall, bond prices go up. Bonds with longer maturities, such as those held by the Fund, usually are more sensitive to interest rate changes than bonds with shorter maturities. Only consider investing in the Fund if you are willing to accept the risk that you may lose money.
The Fund entails credit risk, which is the possibility that a bond will not be able to pay interest or principal when due. If the credit quality of a bond is perceived to decline, investors will demand a higher yield, which means a lower price on that bond to compensate for the higher level of risk. If a security held by the Fund defaults on payment of interest or principal, the Fund’s income, ability to preserve capital, and liquidity would all be adversely affected.
Fund investments are susceptible to factors adversely affecting Idaho, such as political, economic, and financial trends unique to this relatively small state. Investing only in Idaho bonds means that the Fund’s investments are more concentrated than other mutual funds, and relatively few bond price changes may lead to underperformance compared to investments selected in greater number and/or from a wider universe.
The Fund is vulnerable to income tax rate changes, either at the Idaho or federal level, since part of municipal securities’ value is derived from the recipient’s ability to exclude interest payments from taxation.
Note 2 – Unaudited Information
The information in this interim report has not been subjected to independent audit.
Note 3 – Significant Accounting Policies
The following is a summary of the significant accounting policies, in conformity with accounting principles generally accepted in the United States of America, which are consistently followed by the Fund in the preparation of its financial statements.
Security valuation:
Debt securities are valued usingbid-side valuations provided by an independent service. The service determines valuations using factors such as yields or prices of bonds of comparable quality, type of issue, coupon maturity, ratings, trading activity, and general market conditions. In the absence of a valuation from an independent service for a security, a fair value for such security is determined in good faith by or under the direction of the Board of Trustees.
Security transactions are recorded on trade date. Realized gains and losses on sales of securities are recorded on the identified cost basis.
Share valuation:
The net asset value (“NAV”) per share of the Fund is calculated by dividing the sum of the value of the securities held by the Fund, plus cash and other assets, minus all liabilities (including estimated accrued expenses) by the total number of shares outstanding for the Fund, rounded to the nearest cent. The Fund’s shares are not priced or traded on days the New York Stock Exchange is closed. The NAV is the offering and redemption price per share.
The Trustees have adopted certain policies and procedures with respect to frequent trading of Fund shares. The Fund is intended for long-term investment and does not permit rapid trading of its shares. The Fund cannot always identify all intermediaries, or detect or prevent trading that violates the Frequent Trading Policy through intermediaries or omnibus accounts.
Fair value measurements:
Accounting Standards Codification (ASC) 820 establishes a three-tier framework for measuring fair value based on a hierarchy of inputs. The hierarchy distinguishes between market data obtained from independent sources (observable inputs) and the Fund’s own market assumptions (unobservable inputs). These inputs are used in determining the value of the Fund’s investments and are summarized below.
| Level 1 — | Unadjusted quoted prices in active markets for identical assets or liabilities that the Trust has the ability to access. |
| Level 2 — | Observable inputs other than quoted prices in Level 1 that are observable for the asset or liability, either directly or indirectly. These inputs may include quoted prices for the identical instrument on an inactive market, prices for similar instruments, interest rates, prepayment speeds, credit risk, yield curves, default rates, and similar data. |
| Level 3 — | Unobservable inputs for the asset or liability, to the extent relevant observable inputs are not available, representing the Trust’s own assumptions about the assumptions a market participant would use in valuing the asset or liability, and would be based on the best information available. |
| Semi-Annual Report | May 31, 2019 | 9 | ||||
| Notes to Financial Statements(continued) |
The following table is a summary of the inputs used as of May 31, 2019, in valuing the Fund’s investments carried at value.
Fair Value Inputs | | Level 1 Quoted Price | | | Level 2 Significant Observable Input | | | Level 3 Significant Unobservable Input | | Total | ||||||
Municipal Bonds1 | $- | $12,789,409 | $- | $12,789,409 | ||||||||||||
Total Assets | $- | $12,789,409 | $- | $12,789,409 | ||||||||||||
| ¹ | See Schedule of Investments for industry breakout. |
During the period ended May 31, 2019, the Fund had no transfers among Levels 1, 2, or 3.
The availability of observable inputs can vary from security to security and is affected by a wide variety of factors, including, for example, the type of security, whether the security is new and not yet established in the marketplace, the liquidity of markets, and other characteristics particular to the security. To the extent that valuation is based on models or inputs that are less observable or unobservable in the market, the determination of fair value requires more judgment. Accordingly, the degree of judgment exercised in determining fair value is greatest for instruments categorized in Level 3.
The inputs used to measure fair value may fall into different levels of the fair value hierarchy. In such cases, for disclosure purposes, the level in the fair value hierarchy within which the fair value measurement falls in its entirety, is determined based on the lowest level input that is significant to the fair value measurement in its entirety.
The inputs or methodology used for valuing securities are not necessarily an indication of the risks associated with investing in those securities.
Income taxes:
The Fund intends to comply with the requirements of the Internal Revenue Code necessary to qualify as a regulated investment company and to make the requisite distributions of income and capital gains to its shareowners sufficient to relieve it from all or substantially all federal income taxes. As the Fund intends to meet requirements for tax—exempt income dividends, and the requirements of the Idaho Department of Revenue for income dividends exempt from Idaho state income tax, no income tax provisions are required.
The Fund recognizes the tax benefits of uncertain tax positions only where the position is “more likely than not” to be sustained assuming examination by tax authorities. Management has analyzed the Fund’s tax positions and has concluded that no liability for unrecognized tax benefits should be recorded related to uncertain tax positions taken on returns filed for open tax years (2015 – 2017), or expected to be taken in the Fund’s 2018 tax return. The Fund identifies its major tax jurisdiction as US federal and foreign jurisdictions where the Fund makes significant investments; however, the Fund is not aware of any tax positions for which it is reasonably possible that the total amounts of unrecognized tax benefits will change materially in the next 12 months.
Reclassification of capital accounts:
Accounting principles generally accepted in the United States of America require that certain components of net assets relating to permanent differences be reclassified between financial and tax reporting.
As of May 31, 2019, there were no reclassifications to the capital accounts.
Distributions to shareowners:
The Fund’s dividends to shareowners from net investment income are paid daily and distributed on the last business day of each month.
Distributions of capital gains, if any, are made at least annually and as required to comply with federal excise tax requirements. Distributions to shareowners are determined in accordance with income tax regulations and are recorded on theex-dividend date. Dividends are paid in shares of the Fund, at the net asset value on the payable date. Shareowners may elect to take distributions in cash if they total $10 or more.
Use of estimates:
The preparation of financial statements in conformity with accounting principles generally accepted in the United States of America requires management to make estimates and assumptions that affect the reported amounts of assets and liabilities and disclosure of contingent assets and liabilities at the date of the financial statements and the reported amounts of increases and decreases in net assets from operations during the reporting period. Actual results could differ from those estimates.
Other:
Interest income is recognized on an accrual basis. Premiums on securities purchased are amortized and discounts are accreted over the lives of the respective securities.
Recent accounting pronouncements:
As of November 5, 2018, pursuant to the SEC Release#33-10532 “Disclosure Update and Simplification”, funds are no longer required to disclose whether the distributions from earnings are either from net investment income or net realized capital gains. The presentation for the year ended November 30, 2017, has been adjusted for this change in the Statement of Changes in Net Assets.
In March 2017, FASB issuedAccounting Standards Update No. 2017-08, “Receivables — Nonrefundable Fees and Other Costs (Subtopic310-20), Premium Amortization on Purchased Callable Debt Securities” (“ASU2017-08”). ASU2017-08 shortens the amortization period to the earliest call date for certain purchased callable debt securities held at a premium. The guidance is effective for fiscal years, and interim periods within those fiscal years, beginning after December 15, 2018. Management is currently evaluating the impact of applying this guidance.
In August 2018, FASB issuedAccounting Standards Update No. 2018-13, “Fair Value Measurement (Topic 820: Disclosure Framework — Changes to the Disclosure Requirements for Fair Value Measurement” (“ASU2018-13”). ASU2018-13 eliminates the requirement to disclose the amount of and reasons for transfers between Level 1 and Level 2 of the fair value hierarchy, the timing of transfers between levels
| 10 | May 31, 2019 | Semi-Annual Report | ||||
| Notes to Financial Statements(continued) | (unaudited) |
of the fair value hierarchy and the valuation processes for Level 3 fair value measurements. ASU2018-13 will require the need to disclose the range and weighted average used to develop significant unobservable inputs for Level 3 fair value measurements and the changes in unrealized gains and losses for recurring Level 3 fair value measurements. ASU2018-13 will also require that information is provided about the measurement uncertainty of Level 3 fair value measurements as of the reporting date. The guidance is effective for fiscal years, and interim periods within those fiscal years, beginning after December 15, 2019, and allows for early adoption of either the entire standard or only the provisions that eliminate or modify the requirements. Management has elected to adopt early the provisions that eliminate the disclosure requirements. Management is still currently evaluating the impact of applying the rest of the guidance.
Note 4 – Transactions with Affiliated Persons
Under a contract approved by shareowners on September 28, 1995 and reviewed annually by the Board of Trustees, Saturna Capital Corporation provides investment advisory services and certain other administrative and distribution services to conduct the Fund’s business. For such services, the Fund pays an annual fee equal to 0.50% of its average daily net assets. For the fiscal period ended May 31, 2019, the Fund incurred advisory fee expenses of $33,263. Expenses incurred by the Trust on behalf of the Fund (e.g., legal fees) are allocated to the Fund and the other Funds of the Trust on the basis of relative daily average net assets.
Saturna Capital also acts as transfer agent for the Fund, for which it did not receive any compensation during the fiscal period ended May 31, 2019. Saturna Capital has voluntarily elected to waive the transfer agent fee through May 31, 2019, to reduce the Fund’s operating expenses. Such fees, had they been charged, would have totaled $918.
Saturna Brokerage Services, Inc. (“SBS”), a discount brokerage and subsidiary of Saturna Capital, is registered as a broker-dealer and acts as distributor for the Fund.
Saturna Trust Company (“STC”), a subsidiary of Saturna Capital, acts as a retirement plan custodian for Fund shareowners. For the fiscal period ended May 31, 2019, the Fund incurred retirement plan custodial fees of $50.
Mrs. Jane Carten serves as a trustee and president of the Trust. She is also a director and the president of Saturna Capital and Saturna Trust Company. She is not compensated by the Trust. For the fiscal year ended May 31, 2019, the Trust paid trustee compensation expenses of $17,000 which is included in the $32,456 of total expenses paid for the independent Trustees. The Fund’s allocation of these expenses was $2,781.
The officers of the Trust are paid by Saturna Capital, not the Trust, except the Chief Compliance Officer, who is partially compensated by the Trust. For the period ended May 31, 2019, the Fund’s allocation of these expenses was $1,980.
On May 31, 2019, the trustees, officers, and their immediate families as a group directly or indirectly owned 17.44% of the outstanding shares of the Fund.
Note 5 – Distributions to Shareowners
The tax characteristics of distributions paid during the fiscal periods ended May 31, 2019, and November 30, 2018, were as follows:
| May 31, 2019 | November 30, 2018 | |||||||
Tax-exempt income | $142,704 | $360,134 | ||||||
Taxable income | $- | $1,201 | ||||||
Note 6 – Federal Income Taxes
The cost basis of investments for federal income tax purposes at May 31, 2019, were as follows:
Cost of investments | $12,308,490 | |||
Gross unrealized appreciation | $482,345 | |||
Gross unrealized depreciation | $(1,425 | ) | ||
Net unrealized appreciation | $480,920 | |||
As of November 30, 2018, the components of distributable earnings on a tax basis were as follows:
Undistributed tax exempt income | $3,051 | |||
Tax-exempt accumulated earnings | $3,051 | |||
Accumulated capital loss | $(107,595 | ) | ||
Unrealized appreciation | $(27,248 | ) | ||
Total accumulated earnings | $(131,792 | ) | ||
As of November 30, 2018, the Fund had capital loss carryforwards as follows, subject to regulation.
| Carryforward | Expiration | |||||||
Short-term loss carryforward | $(56,781 | ) | Unlimited | |||||
Long-term loss carryforward | $(50,814 | ) | Unlimited | |||||
| $(107,595 | ) | |||||||
Note 7 – Investments
During the period ended May 31, 2019, the Fund purchased $298,483 of securities and sold/matured $1,012,441 of securities.
Note 8 – Custodian
Under the agreement in place with UMB Bank, custody fees are reduced by credits for cash balances. Such reduction for the period ended May 31, 2019, amounted to $234.
Note 9 – Subsequent Events
In preparing these financial statements, the Funds have evaluated events and transactions for potential recognition or disclosure through the date the financial statements were issued.
There were no other events or transactions during the period that materially impacted the amounts or disclosures in the Funds’ financial statements.
| Semi-Annual Report | May 31, 2019 | 11 | ||||
| Expenses |
All mutual funds have operating expenses. As an IdahoTax-Exempt Fund shareowner, you incur ongoing costs, including management fees and other fund expenses such as shareowner reports (like this one). Operating expenses, which are deducted from a fund’s gross earnings, directly reduce the investment return of a fund. Mutual funds (unlike other financial investments) only report their results after deduction of operating expenses.
With the IdahoTax-Exempt Fund, unlike many mutual funds, you do not incur sales charges (loads) on purchases, reinvested dividends, or other distributions. You do not incur redemption fees or exchange fees. You may incur fees related to extra services requested by you for your account, such as bank wires. The examples below are intended to help you understand your ongoing costs (in dollars) of investing in the Fund and to compare these costs with the ongoing costs of investing in other mutual funds.
Example
The following example is based on an investment of $1,000 invested at the beginning of the period and held for the entire period (December 1, 2018, to May 31, 2019).
Actual Expenses
The first line provides information about actual account values and actual expenses. You may use the information in this line, together with the amount you have invested, to estimate the expenses that you paid over the period. Simply divide your account value by $1,000 (for example, an $8,600 account value divided by $1,000 = 8.6), then multiply the result by the number in the first line under the headingentitled “Expenses Paid During Period” to estimate the expenses you paid on your account during this period. The Fund may charge for extra services (such as domestic bank wires, international bank wires, or overnight courier delivery of redemption checks) rendered on request, which you may need to estimate to determine your total expenses.
Hypothetical Example for Comparison Purposes
The second line provides information about hypothetical account values and hypothetical expenses based on the Fund’s actual expense ratio (based on the last six months) and an assumed rate of return of 5% per year before expenses, which is not the Fund’s actual return. The hypothetical account values and expenses may not be used to estimate the actual ending account balance or expenses you paid for the period. You may use this information to compare the ongoing costs of investing in the Fund and other mutual funds. To do so, compare this 5% hypothetical example with the 5% hypothetical examples that appear in the shareowner reports of other mutual funds. You may wish to add other fees that are not included in the expenses shown in the table, such as charges for extra services like bank wires.
Please note that the expenses shown are meant to highlight your ongoing costs only and do not reflect any transactional costs, such as sales charges (loads), redemption fees, or exchange fees (note that the IdahoTax-Exempt Fund does not charge any such transactional costs). Therefore, the “Hypothetical” line is useful in comparing ongoing costs only, and may not help you determine the relative total costs of owning different funds.
| | Beginning Account Value [December 1, 2018] | | | Ending Account Value [May 31, 2019] | | | Expenses Paid During Period1 | | | Annualized Expense Ratio | | |||||
Actual | $1,000.00 | $1,050.90 | $3.29 | 0.64% | ||||||||||||
Hypothetical (5% return before expenses) | $1,000.00 | $1,021.72 | $3.24 | 0.64% | ||||||||||||
| 1 | Expenses are equal to IdahoTax-Exempt Bond Fund’s annualized expense ratio of 0.67% (based on the most recent semi-annual period of December 1, 2018 through May 31, 2019) multiplied by the average account value over the period multiplied by 183/365 (to reflect theone-half year period). |
| 12 | May 31, 2019 | Semi-Annual Report | ||||
Except for this legend, this page has been left blank intentionally.
| May 31, 2019 | Semi-Annual Report | 13 | ||||
Availability of Portfolio Information
| (1) | The Fund files a complete schedule of portfolio holdings with the SEC for the first and third quarters of each fiscal year on FormN-Q. |
| (2) | The Fund’s FormN-Q is available on the SEC’s website at www.sec.gov and at www.idahotaxexemptfund.com. |
| (3) | The Fund’s FormN-Q may be reviewed and copied at the SEC’s Public Reference Room in Washington, DC. Information on the operation of the Public Reference Room may be obtained by calling1-800/SEC-0330. |
| (4) | The Fund makes a complete schedule of portfolio holdings after the end of each month available to investors at www.idahotaxexemptfund.com. |
Availability of Proxy Voting Information
| (1) | A description of the policies and procedures that the Fund uses to determine how to vote proxies relating to portfolio securities is available (a) without charge, upon request, by calling Saturna Capital at1-800-728-8762; (b) on the Fund’s website at www. idahotaxexemptfund.com; and (c) on the SEC’s website at www.sec.gov. |
| (2) | Information regarding how the Fund voted proxies relating to portfolio securities during the most recent12-month period ended June 30 is available (a) without charge, upon request, by calling Saturna Capital at1-800-728-8762; (b) on the Fund’s website at www.idahotaxexemptfund.com; and (c) on the SEC’s website at www.sec.gov. |
| 14 | May 31, 2019 | Semi-Annual Report | ||||
Householding Policy
To reduce expenses, we may mail only one copy of the Fund’s prospectus, each annual and semi-annual report, and proxy statement when necessary, to those addresses shared by two or more accounts. If you wish to receive individual and/or more copies of these documents, please call us at1-800-728-8762 or write to us at Saturna Capital/IdahoTax-Exempt Fund, P.O. Box N, Bellingham, WA 98227. We will begin sending you individual copies 30 days after receiving your request.
If you are currently receiving multiple copies and wish to receive only one copy, please call us at1-800-728-8762 or write to us at Saturna Capital/IdahoTax-Exempt Fund, P.O. Box N, Bellingham, WA 98227. We will begin sending you a single copy with subsequent report mailings.
Privacy Statement
At Saturna Capital and the IdahoTax-Exempt Fund, we understand the importance of maintaining the privacy of your financial information. We want to assure you that we protect the confidentiality of any personal information that you share with us. In addition, we do not sell information about our current or former customers.
In the course of our relationship, we gather certain nonpublic information about you, including your name, address, investment choices, and account information. We do not disclose your information to unaffiliated third parties unless it is necessary to process a transaction; service your account; deliver your account statements, shareowner reports and other information; or as required by law. When we disclose information to unaffiliated third parties, we require a contract to restrict the companies’ use of customer information and from sharing or using it for any purposes other than performing the services for which they were required.
We may share information within the Saturna Capital family of companies in the course of informing you about products or services that may address your investing needs.
We maintain our own technology resources to minimize the need for any third party services, and restrict access to information within Saturna. We maintain physical, electronic, and procedural safeguards to guard your personal information. If you have any questions or concerns about the security or privacy of your information please call us at1-800-728-8762.
| May 31, 2019 | Semi-Annual Report | 15 | ||||
Item 2. Code of Ethics
Registrant has adopted a code of ethics that applies to the registrant's principal executive officer and principal financial officer or persons performing similar functions, which is included with this submission as Exhibit (a)(1) and posted on the Funds' Internet websites at www.sextantfunds.com, www.saturnasustainable.com, and www.idahotaxexemptfund.com. Requests may also be made via telephone at 1-800-728-8762, and will be processed within one business day of receiving such request.
Item 3. Audit Committee Financial Expert
Not applicable.
Item 4. Principal Accountant Fees and Services
Not applicable.
Item 5. Audit Committee of Listed Registrants
Not applicable.
Item 6. Investments
(a) The Schedule of Investments is fully answered in Item 1.
Item 7. Disclosure of Proxy Voting Policies and Procedures for Closed-End Management Investment Companies
Not applicable.
Item 8. Portfolio Managers of Closed-End Management Investment Companies
Not applicable.
Item 9. Purchase of Equity Securities by Closed-End Management Investment Company and Affiliated Purchasers
Not applicable.
Item 10. Submission of Matters to a Vote of Security Holders
Not applicable.
Item 11. Controls and Procedures
(a) Internal control over financial reporting is under the supervision of the principal executive and financial officers. On June 4, 2019, Mrs. Jane Carten (President) and Mr. Christopher Fankhauser (Treasurer) reviewed the internal control procedures for Saturna Investment Trust and found them reasonable and adequate.
(b) No change.
Item 12. Exhibits
Exhibits included with this filing:
(a)(1) Code of Ethics.
(a)(2) Certification pursuant to Rule 30a-2(a) under the Investment Company Act of 1940 (17 CFR 270.30a-2(a)) is filed and attached hereto as Exhibit 99.CERT.
(a)(3) Not applicable.
(b) Certification pursuant to Rule 30a-2(b) under the Investment Company Act of 1940 (17 CFR 270.30a-2(b)) is filed and attached hereto as Exhibit 99.906CERT.
SIGNATURES
Pursuant to the requirements of the Securities Exchange Act of 1934 and the Investment Company Act of 1940, the registrant has duly caused this report to be signed on its behalf by the undersigned, thereunto duly authorized.
SATURNA INVESTMENT TRUST
By:
/s/ Jane K. Carten, President
Signature and Title
Jane K. Carten, President
Printed name and Title
July 30, 2019
Date
Pursuant to the requirements of the Securities Exchange Act of 1940, this report has been signed below by the following persons on behalf of the registrant and in the capacities indicated.
By:
/s/ Jane K. Carten, President
Signature and Title
Jane K. Carten, President
Printed name and Title
July 30, 2019
Date
By:
/s/ Christopher Fankhauser, Treasurer
Signature and Title
Christopher Fankhauser, Treasurer
Printed name and Title
July 30, 2019
Date