SECURITIES AND EXCHANGE COMMISSION
WASHINGTON, DC 20549
FORM N-CSRS/A
CERTIFIED SHAREHOLDER REPORT OF REGISTERED
MANAGEMENT INVESTMENT COMPANIES
Investment Company Act file number: 811-05071 / 33-13247
SATURNA INVESTMENT TRUST
(Exact Name of Registrant as Specified in Charter)
1300 N. State Street
Bellingham, Washington 98225-4730
(Address of Principal Executive Offices, including ZIP Code)
Elliot S. Cohen
1300 N. State Street
Bellingham, Washington 98225-4730
(Name and Address of Agent for Service)
Registrant’s Telephone Number – (360) 734-9900 Ext. 1804
Date of fiscal year end: November 30, 2024
Date of reporting period: May 31, 2024
Explanatory Note:
The Registrant is filing this Form N-CSRS/A to amend the Form N-CSRS for the period ended May 31, 2024 originally filed with the Securities and Exchange Commission on July 31, 2024, for the following reasons: 1) to correct tagging in the Tailored Shareholder Reports for all series of the Registrant. 2) to correct the accidental omission of items 6 and 7 for the series of Saturna Investment Trust’s Sextant Short Term Bond Fund.
Other than the aforementioned revisions, this amendment does not amend, update or change any other items or disclosures found the original Form N-CSRS filing for the Registrant submitted on July 31, 2024.
Item 1. Report To Shareowners
0000811860trueThe Registrant is filing this Form N-CSR/A to amend the Form N-CSR for the period ended May 31, 2024 originally filed with the Securities and Exchange Commission on July 31, 2024, to correct tagging in the Tailored Shareholder Reports for all series of the Registrant. Other than the aforementioned revisions, this amendment does not amend, update or change any other items or disclosures found the original Form N-CSR filing for the Registrant submitted on July 31, 2024. N-CSRS/ASATURNA INVESTMENT TRUSTN-1A2024-05-31
Semi-Annual Shareholder Report - May 31, 2024
The objective of the Bond Income Fund is current income. This Semiannual Shareholder Report contains important information about the Sextant Bond Income Fund for the period of December 1, 2023 to May 31, 2024. You can find additional information about the Fund at www.saturna.com/sextant/bond-income-fund. You can also request this information by contacting us at 1-800-728-8762 or investorservices@saturna.com. The report describes changes to the Fund that occurred during the reporting period.
What were the Fund’s costs for the last 6 months?
(Based on a hypothetical $10,000 investment)
| Class Name | Cost of a $10,000 Investment | Cost Paid as a % of a $10,000 Investment |
|---|
| Sextant Bond Income | $32.78 | 0.65% |
How did the Fund perform over the last six months?
For the six-month period ended May 31, 2024, the Sextant Bond Income Fund returned 1.71% and the Bloomberg US Aggregate Bond Index returned 2.12%. For the five-year period ended May 31, 2024, the Fund reported an annualized total return of -1.04%, compared to -0.17% for the Index. The primary reason for the Fund’s underperformance was its longer effective duration.
Factors Affecting Past Performance
Persistent high inflation, economic growth uncertainty, and widening deficits among most world economies brought considerable market volatility in fiscal 2024. The Treasury curve was highly volatile throughout the year, with swings of over 100 basis points (bps) across the curve. Ultimately, the curve shifted up over the year, especially in the long end, marking a pronounced bear steepener.
As of May 31, 2024, the Sextant Bond Income Fund had nearly 47% of assets in bonds maturing in 10+ years. In comparison, the Bloomberg US Aggregate Bond Index only held about 20% of such bonds. The Fund’s effective duration was 7.25 years, longer than that of the Index, with an effective duration of 6.06 years. More exposure to movements in interest rates resulted in additional downward movement in net asset value (NAV). However, the Fund was positioned as conservatively as possible within its objectives and mandate.
The Sextant Bond Income Fund maintained an average effective maturity of 10.43 years in fiscal 2024, up from 9.81 years for fiscal 2023. The Fund is defensively positioned relative to the effective maturity of the Morningstar Long-Term Bond category average at 18.7 years. The Fund also targets holdings with a bigger coupon, allowing income to contribute to price stability. As a result, the Fund was in the 22nd percentile of its Morningstar category for the three-year period ended May 31, 2024.
Looking Forward
Federal Reserve policy changes, economic uncertainty, persistent high inflation, and elevated geopolitical risks may lead to continued volatility for yields and the Treasury curve in fiscal 2025. The Sextant Bond Income Fund portfolio remains defensively positioned to better withstand anticipated yield curve changes, currency movements, and inflationary pressures. Our goal has always been to choose good companies and invest through cycles rather than engage in market timing with outsized active bets.
How did the Fund perform over the past 10 years?
The Cumulative Performance chart reflects a hypothetical $10,000 investment in the class of shares noted. Past performance does not guarantee future results. The graph and table do not reflect the deduction of taxes that a shareholder would pay on Fund distributions or redemption of Fund shares.
May 31, 2014 through May 31, 2024 with initial investment of $10,000.
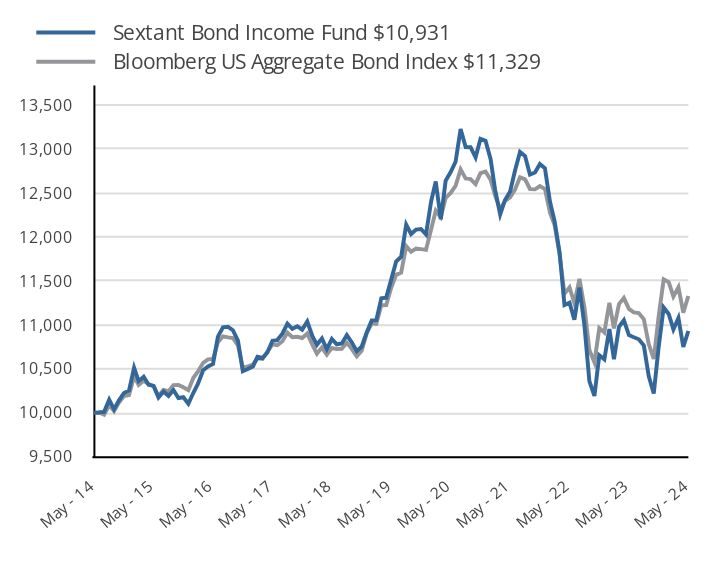
| Sextant Bond Income Fund $10,931 | Bloomberg US Aggregate Bond Index $11,329 |
|---|
| May - 14 | 10,000 | 10,000 |
| June - 14 | 10,005 | 10,005 |
| July - 14 | 10,012 | 9,980 |
| August - 14 | 10,151 | 10,090 |
| September - 14 | 10,041 | 10,022 |
| October - 14 | 10,145 | 10,120 |
| November - 14 | 10,227 | 10,192 |
| December - 14 | 10,255 | 10,202 |
| January - 15 | 10,514 | 10,415 |
| February - 15 | 10,361 | 10,318 |
| March - 15 | 10,411 | 10,365 |
| April - 15 | 10,320 | 10,328 |
| May - 15 | 10,307 | 10,303 |
| June - 15 | 10,176 | 10,191 |
| July - 15 | 10,244 | 10,262 |
| August - 15 | 10,193 | 10,247 |
| September - 15 | 10,260 | 10,316 |
| October - 15 | 10,169 | 10,318 |
| November - 15 | 10,178 | 10,291 |
| December - 15 | 10,105 | 10,258 |
| January - 16 | 10,229 | 10,399 |
| February - 16 | 10,335 | 10,473 |
| March - 16 | 10,485 | 10,569 |
| April - 16 | 10,529 | 10,609 |
| May - 16 | 10,557 | 10,612 |
| June - 16 | 10,867 | 10,803 |
| July - 16 | 10,973 | 10,871 |
| August - 16 | 10,978 | 10,859 |
| September - 16 | 10,940 | 10,852 |
| October - 16 | 10,821 | 10,769 |
| November - 16 | 10,474 | 10,514 |
| December - 16 | 10,499 | 10,529 |
| January - 17 | 10,528 | 10,550 |
| February - 17 | 10,637 | 10,621 |
| March - 17 | 10,624 | 10,615 |
| April - 17 | 10,687 | 10,697 |
| May - 17 | 10,821 | 10,779 |
| June - 17 | 10,828 | 10,769 |
| July - 17 | 10,900 | 10,815 |
| August - 17 | 11,014 | 10,912 |
| September - 17 | 10,956 | 10,860 |
| October - 17 | 10,985 | 10,866 |
| November - 17 | 10,947 | 10,852 |
| December - 17 | 11,039 | 10,902 |
| January - 18 | 10,876 | 10,777 |
| February - 18 | 10,774 | 10,674 |
| March - 18 | 10,846 | 10,743 |
| April - 18 | 10,725 | 10,663 |
| May - 18 | 10,840 | 10,739 |
| June - 18 | 10,780 | 10,726 |
| July - 18 | 10,789 | 10,728 |
| August - 18 | 10,884 | 10,797 |
| September - 18 | 10,802 | 10,728 |
| October - 18 | 10,703 | 10,643 |
| November - 18 | 10,752 | 10,707 |
| December - 18 | 10,914 | 10,903 |
| January - 19 | 11,052 | 11,019 |
| February - 19 | 11,055 | 11,013 |
| March - 19 | 11,304 | 11,224 |
| April - 19 | 11,311 | 11,227 |
| May - 19 | 11,518 | 11,426 |
| June - 19 | 11,722 | 11,570 |
| July - 19 | 11,776 | 11,595 |
| August - 19 | 12,141 | 11,896 |
| September - 19 | 12,034 | 11,833 |
| October - 19 | 12,085 | 11,868 |
| November - 19 | 12,091 | 11,862 |
| December - 19 | 12,030 | 11,854 |
| January - 20 | 12,399 | 12,082 |
| February - 20 | 12,631 | 12,299 |
| March - 20 | 12,203 | 12,227 |
| April - 20 | 12,641 | 12,444 |
| May - 20 | 12,738 | 12,502 |
| June - 20 | 12,856 | 12,581 |
| July - 20 | 13,227 | 12,769 |
| August - 20 | 13,022 | 12,666 |
| September - 20 | 13,021 | 12,659 |
| October - 20 | 12,906 | 12,602 |
| November - 20 | 13,116 | 12,726 |
| December - 20 | 13,094 | 12,744 |
| January - 21 | 12,887 | 12,652 |
| February - 21 | 12,536 | 12,470 |
| March - 21 | 12,257 | 12,314 |
| April - 21 | 12,421 | 12,411 |
| May - 21 | 12,517 | 12,452 |
| June - 21 | 12,753 | 12,539 |
| July - 21 | 12,967 | 12,679 |
| August - 21 | 12,921 | 12,655 |
| September - 21 | 12,709 | 12,546 |
| October - 21 | 12,733 | 12,542 |
| November - 21 | 12,829 | 12,579 |
| December - 21 | 12,782 | 12,547 |
| January - 22 | 12,401 | 12,277 |
| February - 22 | 12,184 | 12,140 |
| March - 22 | 11,826 | 11,803 |
| April - 22 | 11,227 | 11,355 |
| May - 22 | 11,253 | 11,428 |
| June - 22 | 11,061 | 11,249 |
| July - 22 | 11,425 | 11,523 |
| August - 22 | 10,991 | 11,198 |
| September - 22 | 10,362 | 10,714 |
| October - 22 | 10,193 | 10,575 |
| November - 22 | 10,656 | 10,964 |
| December - 22 | 10,610 | 10,915 |
| January - 23 | 10,954 | 11,251 |
| February - 23 | 10,610 | 10,960 |
| March - 23 | 10,980 | 11,238 |
| April - 23 | 11,055 | 11,306 |
| May - 23 | 10,884 | 11,183 |
| June - 23 | 10,860 | 11,143 |
| July - 23 | 10,837 | 11,135 |
| August - 23 | 10,765 | 11,064 |
| September - 23 | 10,418 | 10,783 |
| October - 23 | 10,221 | 10,613 |
| November - 23 | 10,747 | 11,094 |
| December - 23 | 11,199 | 11,518 |
| January - 24 | 11,125 | 11,487 |
| February - 24 | 10,950 | 11,324 |
| March - 24 | 11,078 | 11,429 |
| April - 24 | 10,749 | 11,140 |
| May - 24 | 10,931 | 11,329 |
Annual Average Total Return
| 1 Year | 5 Year | 10 Year |
|---|
| Sextant Bond Income | 0.43% | | 0.89% |
| Bloomberg US Aggregate Bond Index | 1.31% | | 1.25% |
Please visit www.saturna.com/sextant/bond-income-fund for more recent performance information.
Semi-Annual Shareholder Report - May 31, 2024
| Total Net Assets | $9,974,054 |
| # of Portfolio Holdings | 40 |
| Advisory Fees Paid | $25,468 |
| Portfolio Turnover Rate | 4% |
You may have consented to receive one shareholder report at your address if you and one or more individuals in your home have an account with the Fund (householding). If you wish to receive a copy of this document at a new address, contact 1-800-728-8762
What did the Fund invest in?
| United States Treasury Bond (4.250% due 05/15/2039) | 7.4% |
| United States Treasury Bond (3.375% due 11/15/2048) | 4.5% |
| United States Treasury Bond (5.375% due 02/15/2031) | 4.2% |
| Apple (4.500% due 02/23/2036) | 3.4% |
| Microsoft (4.200% due 11/3/2035) | 3.4% |
| Intel (4.000% due 12/15/2032) | 3.3% |
| Home Depot (5.875% due 12/16/2036) | 3.1% |
| Burlington Northern Santa Fe (5.050% due 03/1/2041) | 2.9% |
| United States Treasury Note (2.875% due 05/15/2052) | 2.9% |
| Praxair (3.550% due 11/7/2042) | 2.8% |
| |
| Government | 27.2% |
| Technology | 10.6% |
| Health Care | 10.1% |
| Financials | 8.9% |
| Industrials | 6.6% |
| Energy | 5.9% |
| Consumer Discretionary | 5.7% |
| Utilities | 5.2% |
| Consumer Staples | 5.2% |
| Communications | 4.4% |
| Other Sectors | 2.8% |
| Other Assets (net of liabilities) | 7.4% |
| United States | 85.5% |
| Canada | 2.4% |
| Norway | 2.4% |
| Netherlands | 2.3% |
If you wish to view additional information about the Fund, including but not limited to the Fund's prospectus, financial statements, holdings, or proxy voting information, please visit www.saturna.com/forms#mutual-fund-library .
1300 N. State Street
Bellingham, WA 98225
1-866-290-2688
Semi-Annual Shareholder Report - May 31, 2024
The objective of the Core Fund is long-term appreciation and capital preservation. This Semiannual Shareholder Report contains important information about the Sextant Core Fund for the period of December 1, 2023 to May 31, 2024. You can find additional information about the Fund at www.saturna.com/sextant/core-fund. You can also request this information by contacting us at 1-800-728-8762 or investorservices@saturna.com. The report describes changes to the Fund that occurred during the reporting period.
What were the Fund’s costs for the last 6 months?
(Based on a hypothetical $10,000 investment)
| Class Name | Cost of a $10,000 Investment | Cost Paid as a % of a $10,000 Investment |
|---|
| Sextant Core | $39.86 | 0.76% |
How did the Fund perform over the last six months?
The Sextant Core Fund returned 9.77% for the six-month period as of May 31, 2024. The Dow Jones Moderate Portfolio Index returned 8.05% for the same period. On May 31, 2024, the Fund recorded a 30-day yield of 2.22%.
What Factors influenced Performance?
Equities
The Sextant Core Fund's mandate allocates a 60% weight in equity securities, with two-thirds being US-domiciled companies and one-third foreign-domiciled companies. The Fund generally holds equity positions in larger companies with strong balance sheets. As of May 31, 2024, equity holdings represented 59.19% of the Fund's portfolio. Companies in the Technology sector comprised the largest share of equities in the Fund (17.4%), followed by Industrials (15.1%) and Health Care (7.9%).
Optimism about advances in artificial intelligence (AI) drove global equities performance for the six-month period. The Sextant Core Fund owns several companies that stand to benefit from these advances, including chipmakers Nvidia, Broadcom, and Taiwan Semiconductor, as well as software infrastructure companies Microsoft and Oracle.
Fixed Income
The Sextant Core Fund targets an allocation of 40% cash and investment-grade fixed-income securities. The US Federal Reserve, after an aggressive string of rate hikes in 2022 and 2023, has been on "pause" for almost a year. Higher interest rates on bonds improve their ability to cushion equity declines and reduce portfolio volatility. The Fed's next move is likely to be interest rate cuts, but it is not certain when these cuts will happen.
Looking Forward
The second half of the fiscal year may feature increased political uncertainty. The UK holds its national elections in July, and the US holds it presidential elections in November. While optimism about AI drove recent equity returns, the increasingly adversarial relationship between the US and China escalates geopolitical risk, which is compounded by uncertainty around election outcomes. In the US, large budget deficits are beginning to bite with higher interest rates, which may constrain politicians from enacting growth-oriented fiscal policies such as tax cuts or spending increases. This may make it increasingly difficult to reign in higher than desired inflation rates.
How did the Fund perform over the past 10 years?
The Cumulative Performance chart reflects a hypothetical $10,000 investment in the class of shares noted. Past performance does not guarantee future results. The graph and table do not reflect the deduction of taxes that a shareholder would pay on Fund distributions or redemption of Fund shares.
May 31, 2014 through May 31, 2024 with initial investment of $10,000.
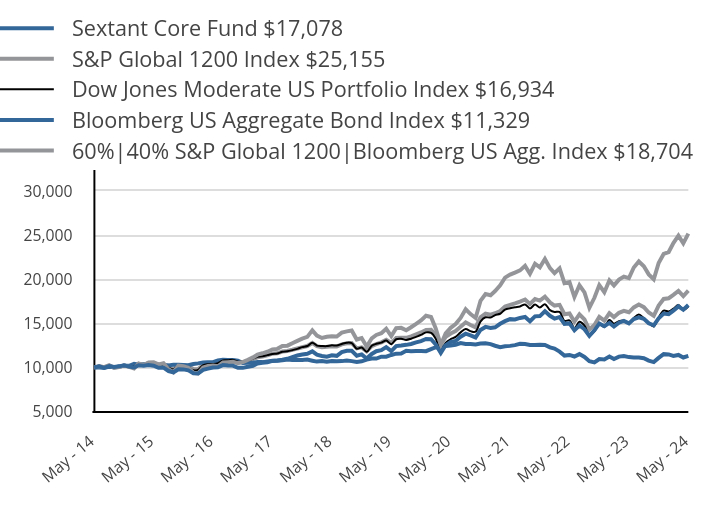
| Sextant Core Fund $17,078 | S&P Global 1200 Index $25,155 | Dow Jones Moderate US Portfolio Index $16,934 | Bloomberg US Aggregate Bond Index $11,329 | 60%|40% S&P Global 1200|Bloomberg US Agg. Index $18,704 |
|---|
| May - 14 | 10,000 | 10,000 | 10,000 | 10,000 | 10,000 |
| June - 14 | 10,144 | 10,180 | 10,193 | 10,005 | 10,110 |
| July - 14 | 9,968 | 10,040 | 10,047 | 9,980 | 10,016 |
| August - 14 | 10,168 | 10,264 | 10,279 | 10,090 | 10,195 |
| September - 14 | 10,056 | 9,977 | 9,976 | 10,022 | 9,996 |
| October - 14 | 10,136 | 10,049 | 10,128 | 10,120 | 10,079 |
| November - 14 | 10,242 | 10,241 | 10,210 | 10,192 | 10,223 |
| December - 14 | 10,110 | 10,073 | 10,153 | 10,202 | 10,126 |
| January - 15 | 10,011 | 9,891 | 10,132 | 10,415 | 10,101 |
| February - 15 | 10,258 | 10,454 | 10,412 | 10,318 | 10,408 |
| March - 15 | 10,200 | 10,293 | 10,383 | 10,365 | 10,331 |
| April - 15 | 10,274 | 10,580 | 10,468 | 10,328 | 10,489 |
| May - 15 | 10,209 | 10,605 | 10,462 | 10,303 | 10,494 |
| June - 15 | 9,978 | 10,354 | 10,320 | 10,191 | 10,299 |
| July - 15 | 9,986 | 10,494 | 10,340 | 10,262 | 10,412 |
| August - 15 | 9,607 | 9,809 | 9,982 | 10,247 | 9,998 |
| September - 15 | 9,467 | 9,462 | 9,793 | 10,316 | 9,813 |
| October - 15 | 9,813 | 10,216 | 10,204 | 10,318 | 10,282 |
| November - 15 | 9,793 | 10,163 | 10,159 | 10,291 | 10,240 |
| December - 15 | 9,680 | 9,987 | 10,030 | 10,258 | 10,120 |
| January - 16 | 9,358 | 9,413 | 9,683 | 10,399 | 9,827 |
| February - 16 | 9,323 | 9,348 | 9,744 | 10,473 | 9,814 |
| March - 16 | 9,741 | 10,004 | 10,273 | 10,569 | 10,263 |
| April - 16 | 9,880 | 10,170 | 10,388 | 10,609 | 10,381 |
| May - 16 | 10,002 | 10,217 | 10,407 | 10,612 | 10,411 |
| June - 16 | 10,037 | 10,140 | 10,498 | 10,803 | 10,438 |
| July - 16 | 10,280 | 10,574 | 10,813 | 10,871 | 10,733 |
| August - 16 | 10,237 | 10,610 | 10,817 | 10,859 | 10,750 |
| September - 16 | 10,219 | 10,654 | 10,869 | 10,852 | 10,774 |
| October - 16 | 9,976 | 10,484 | 10,666 | 10,769 | 10,638 |
| November - 16 | 9,967 | 10,622 | 10,707 | 10,514 | 10,621 |
| December - 16 | 10,088 | 10,875 | 10,799 | 10,529 | 10,779 |
| January - 17 | 10,203 | 11,153 | 11,010 | 10,550 | 10,953 |
| February - 17 | 10,468 | 11,456 | 11,227 | 10,621 | 11,161 |
| March - 17 | 10,538 | 11,614 | 11,278 | 10,615 | 11,251 |
| April - 17 | 10,591 | 11,790 | 11,406 | 10,697 | 11,388 |
| May - 17 | 10,750 | 12,048 | 11,540 | 10,779 | 11,573 |
| June - 17 | 10,803 | 12,114 | 11,584 | 10,769 | 11,606 |
| July - 17 | 10,883 | 12,437 | 11,792 | 10,815 | 11,812 |
| August - 17 | 10,989 | 12,476 | 11,846 | 10,912 | 11,876 |
| September - 17 | 11,183 | 12,747 | 11,965 | 10,860 | 12,008 |
| October - 17 | 11,360 | 13,012 | 12,113 | 10,866 | 12,161 |
| November - 17 | 11,477 | 13,272 | 12,310 | 10,852 | 12,301 |
| December - 17 | 11,559 | 13,468 | 12,434 | 10,902 | 12,432 |
| January - 18 | 11,827 | 14,209 | 12,818 | 10,777 | 12,785 |
| February - 18 | 11,451 | 13,618 | 12,486 | 10,674 | 12,418 |
| March - 18 | 11,317 | 13,344 | 12,437 | 10,743 | 12,300 |
| April - 18 | 11,237 | 13,488 | 12,425 | 10,663 | 12,343 |
| May - 18 | 11,380 | 13,539 | 12,525 | 10,739 | 12,406 |
| June - 18 | 11,326 | 13,515 | 12,491 | 10,726 | 12,387 |
| July - 18 | 11,756 | 13,956 | 12,671 | 10,728 | 12,630 |
| August - 18 | 11,890 | 14,096 | 12,816 | 10,797 | 12,739 |
| September - 18 | 11,899 | 14,200 | 12,770 | 10,728 | 12,763 |
| October - 18 | 11,344 | 13,170 | 12,124 | 10,643 | 12,167 |
| November - 18 | 11,487 | 13,341 | 12,276 | 10,707 | 12,291 |
| December - 18 | 11,025 | 12,368 | 11,787 | 10,903 | 11,843 |
| January - 19 | 11,543 | 13,313 | 12,472 | 11,019 | 12,436 |
| February - 19 | 11,852 | 13,691 | 12,686 | 11,013 | 12,645 |
| March - 19 | 11,961 | 13,886 | 12,823 | 11,224 | 12,850 |
| April - 19 | 12,315 | 14,394 | 13,061 | 11,227 | 13,134 |
| May - 19 | 11,861 | 13,565 | 12,646 | 11,426 | 12,773 |
| June - 19 | 12,433 | 14,456 | 13,205 | 11,570 | 13,341 |
| July - 19 | 12,487 | 14,491 | 13,252 | 11,595 | 13,372 |
| August - 19 | 12,569 | 14,221 | 13,125 | 11,896 | 13,361 |
| September - 19 | 12,669 | 14,560 | 13,262 | 11,833 | 13,524 |
| October - 19 | 12,841 | 14,946 | 13,475 | 11,868 | 13,755 |
| November - 19 | 12,996 | 15,338 | 13,691 | 11,862 | 13,969 |
| December - 19 | 13,229 | 15,858 | 13,979 | 11,854 | 14,249 |
| January - 20 | 13,209 | 15,720 | 13,918 | 12,082 | 14,284 |
| February - 20 | 12,612 | 14,433 | 13,263 | 12,299 | 13,685 |
| March - 20 | 11,650 | 12,573 | 11,875 | 12,227 | 12,595 |
| April - 20 | 12,535 | 13,872 | 12,795 | 12,444 | 13,466 |
| May - 20 | 12,892 | 14,496 | 13,206 | 12,502 | 13,854 |
| June - 20 | 13,007 | 14,915 | 13,467 | 12,581 | 14,129 |
| July - 20 | 13,489 | 15,617 | 13,985 | 12,769 | 14,613 |
| August - 20 | 13,835 | 16,603 | 14,366 | 12,666 | 15,119 |
| September - 20 | 13,652 | 16,049 | 14,121 | 12,659 | 14,813 |
| October - 20 | 13,412 | 15,608 | 14,052 | 12,602 | 14,542 |
| November - 20 | 14,259 | 17,545 | 15,201 | 12,726 | 15,682 |
| December - 20 | 14,599 | 18,329 | 15,690 | 12,744 | 16,111 |
| January - 21 | 14,482 | 18,186 | 15,657 | 12,652 | 15,989 |
| February - 21 | 14,550 | 18,652 | 15,940 | 12,470 | 16,143 |
| March - 21 | 14,951 | 19,299 | 16,087 | 12,314 | 16,398 |
| April - 21 | 15,253 | 20,174 | 16,563 | 12,411 | 16,896 |
| May - 21 | 15,478 | 20,516 | 16,721 | 12,452 | 17,090 |
| June - 21 | 15,439 | 20,751 | 16,828 | 12,539 | 17,256 |
| July - 21 | 15,615 | 20,997 | 16,914 | 12,679 | 17,456 |
| August - 21 | 15,722 | 21,513 | 17,143 | 12,655 | 17,700 |
| September - 21 | 15,244 | 20,617 | 16,689 | 12,546 | 17,196 |
| October - 21 | 15,791 | 21,746 | 17,134 | 12,542 | 17,759 |
| November - 21 | 15,820 | 21,333 | 16,806 | 12,579 | 17,578 |
| December - 21 | 16,368 | 22,278 | 17,165 | 12,547 | 18,027 |
| January - 22 | 15,854 | 21,248 | 16,503 | 12,277 | 17,371 |
| February - 22 | 15,542 | 20,681 | 16,292 | 12,140 | 17,016 |
| March - 22 | 15,723 | 21,229 | 16,290 | 11,803 | 17,097 |
| April - 22 | 14,948 | 19,549 | 15,294 | 11,355 | 16,026 |
| May - 22 | 14,998 | 19,663 | 15,337 | 11,428 | 16,123 |
| June - 22 | 14,212 | 17,980 | 14,460 | 11,249 | 15,194 |
| July - 22 | 14,766 | 19,306 | 15,171 | 11,523 | 16,015 |
| August - 22 | 14,333 | 18,500 | 14,735 | 11,198 | 15,433 |
| September - 22 | 13,578 | 16,756 | 13,667 | 10,714 | 14,293 |
| October - 22 | 14,212 | 17,895 | 14,111 | 10,575 | 14,802 |
| November - 22 | 14,978 | 19,331 | 14,936 | 10,964 | 15,733 |
| December - 22 | 14,669 | 18,529 | 14,596 | 10,915 | 15,313 |
| January - 23 | 15,048 | 19,858 | 15,392 | 11,251 | 16,160 |
| February - 23 | 14,649 | 19,294 | 14,963 | 10,960 | 15,718 |
| March - 23 | 15,078 | 19,955 | 15,242 | 11,238 | 16,200 |
| April - 23 | 15,272 | 20,298 | 15,311 | 11,306 | 16,407 |
| May - 23 | 14,996 | 20,125 | 15,072 | 11,183 | 16,252 |
| June - 23 | 15,487 | 21,323 | 15,617 | 11,143 | 16,809 |
| July - 23 | 15,692 | 22,011 | 15,990 | 11,135 | 17,129 |
| August - 23 | 15,518 | 21,474 | 15,585 | 11,064 | 16,835 |
| September - 23 | 15,007 | 20,543 | 15,067 | 10,783 | 16,226 |
| October - 23 | 14,772 | 19,992 | 14,652 | 10,613 | 15,862 |
| November - 23 | 15,559 | 21,821 | 15,673 | 11,094 | 17,020 |
| December - 23 | 16,112 | 22,861 | 16,450 | 11,518 | 17,768 |
| January - 24 | 16,039 | 23,073 | 16,351 | 11,487 | 17,847 |
| February - 24 | 16,434 | 24,095 | 16,664 | 11,324 | 18,221 |
| March - 24 | 16,922 | 24,936 | 17,066 | 11,429 | 18,669 |
| April - 24 | 16,538 | 24,054 | 16,529 | 11,140 | 18,084 |
| May - 24 | 17,078 | 25,155 | 16,934 | 11,329 | 18,704 |
Effective May 31, 2024, the performance benchmark against which the Fund compares its performance was changed from the Dow Jones Moderate U.S. Portfolio Index to the S&P Global 1200 Index, the Bloomberg US Aggregate Bond Index, and a 60%|40% S&P Global 1200 Index and Bloomberg US Aggregate Bond Index composite, which the investment adviser believes better reflects the Fund’s investment approach.
Annual Average Total Return
| 1 Year | 5 Year | 10 Year |
|---|
| Sextant Core | 13.88% | 7.56% | 5.50% |
| S&P Global 1200 Index | 24.99% | 13.13% | 9.65% |
| Dow Jones Moderate US Portfolio Index | 12.35% | 6.01% | 5.40% |
| Bloomberg US Aggregate Bond Index | 1.31% | | 1.25% |
| 60%|40% S&P Global 1200|Bloomberg US Agg. Index | 15.45% | 7.93% | 6.46% |
Please visit www.saturna.com/sextant/core-fund for more recent performance information.
Semi-Annual Shareholder Report - May 31, 2024
| Total Net Assets | $25,273,737 |
| # of Portfolio Holdings | 81 |
| Advisory Fees Paid | $59,319 |
| Portfolio Turnover Rate | 12% |
You may have consented to receive one shareholder report at your address if you and one or more individuals in your home have an account with the Fund (householding). If you wish to receive a copy of this document at a new address, contact 1-800-728-8762
What did the Fund invest in?
| United States Cash Management Bill (-% due 08/8/2024) | 12.7% |
| Novo Nordisk ADR | 2.7% |
| Eaton | 2.6% |
| Microsoft | 2.1% |
| Comcast (5.650% due 06/15/2035) | 2.0% |
| Pacificorp (6.000% due 01/15/2039) | 2.0% |
| NextEra Energy | 1.9% |
| Oracle (2.950% due 04/1/2030) | 1.8% |
| Alphabet, Class A | 1.7% |
| Agnico-Eagle Mines | 1.6% |
| |
| Technology | 17.4% |
| Government | 15.4% |
| Industrials | 15.1% |
| Health Care | 7.9% |
| Utilities | 6.5% |
| Consumer Discretionary | 6.3% |
| Communications | 5.3% |
| Consumer Staples | 5.3% |
| Materials | 4.9% |
| Financials | 4.9% |
| Other Sectors | 4.2% |
| Other Assets (net of liabilities) | 6.8% |
| United States | 70.9% |
| Canada | 3.4% |
| Ireland | 3.1% |
| Denmark | 2.7% |
| United Kingdom | 2.4% |
| Netherlands | 2.3% |
| France | 2.2% |
| Germany | 2.0% |
| Switzerland | 1.3% |
| Australia | 1.2% |
If you wish to view additional information about the Fund, including but not limited to the Fund's prospectus, financial statements, holdings, or proxy voting information, please visit www.saturna.com/forms#mutual-fund-library .
1300 N. State Street
Bellingham, WA 98225
1-866-290-2688
| SEXTANT GLOBAL HIGH INCOME FUND
Sextant Global High Income Fund
Semi-Annual Shareholder Report - May 31, 2024
The objective of the Global High Income Fund is high income, with a secondary objective of capital preservation. This Semiannual Shareholder Report contains important information about the Sextant Global High Income Fund for the period of December 1, 2023 to May 31, 2024. You can find additional information about the Fund at www.saturna.com/sextant/global-high-income-fund. You can also request this information by contacting us at 1-800-728-8762 or investorservices@saturna.com. The report describes changes to the Fund that occurred during the reporting period.
What were the Fund’s costs for the last 6 months?
(Based on a hypothetical $10,000 investment)
| Class Name | Cost of a $10,000 Investment | Cost Paid as a % of a $10,000 Investment |
|---|
| Sextant Global High Income Fund | $39.35 | 0.75% |
How did the Fund perform over the last six months?
The Sextant Global High Income Fund returned 9.87% for the six-month period ended May 31, 2024. The Fund's equity benchmark, the S&P Global 1200 Index, returned 15.28%. The Fund's debt securities benchmark, the Bloomberg Global High Yield Corporate Bond Index, returned 5.70%. The Fund's 30-day SEC yield on May 31, 2024, was 3.79%
What Factors influenced Performance?
The Federal Reserve's last interest rate increase was in July 2023. It is likely that the Fed's next move will be cutting interest rates. However, as inflation remains above target and economic growth remains resilient, the prospective cuts continue to be pushed further into the future. Since the release of ChatGPT 18 months ago, optimism about artificial intelligence (AI) drove much of the equity returns.
Materials companies Southern Copper and South32 drove semi-annual performance for the Sextant Global High Income Fund. Detractors for the same period included Woodside Energy Group and SK Telecom.
Looking Forward
The second half of the fiscal year may feature increased political uncertainty. The UK holds its national elections in July, and the US holds its presidential elections in November. While optimism about AI drove recent equity returns, the increasingly adversarial relationship between the US and China escalates geopolitical risk, which is compounded by uncertainty around election outcomes. In the US, large budget deficits are beginning to bite with higher interest rates, which may constrain politicians from enacting growth-oriented fiscal policies such as tax cuts or spending increases. This may make it increasingly difficult to reign in higher than desired inflation rates.
How did the Fund perform over the past 10 years?
The Cumulative Performance chart reflects a hypothetical $10,000 investment in the class of shares noted. Past performance does not guarantee future results. The graph and table do not reflect the deduction of taxes that a shareholder would pay on Fund distributions or redemption of Fund shares.
May 31, 2014 through May 31, 2024 with initial investment of $10,000.
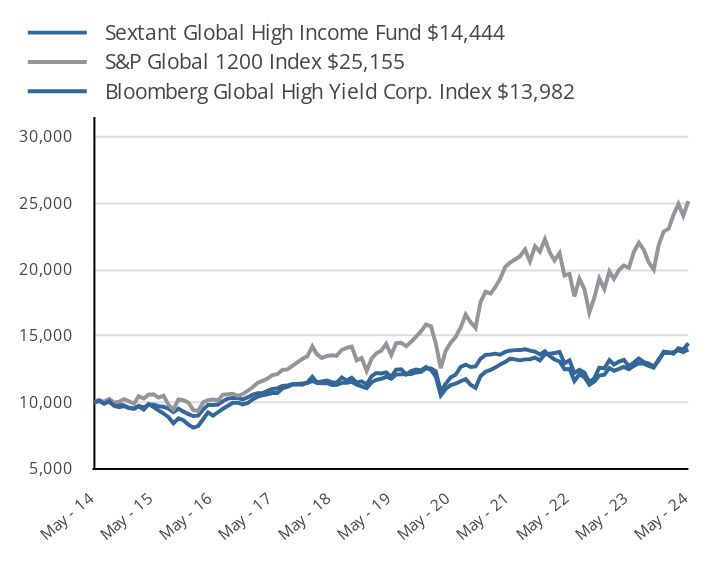
| Sextant Global High Income Fund $14,444 | S&P Global 1200 Index $25,155 | Bloomberg Global High Yield Corp. Index $13,982 |
|---|
| May - 14 | 10,000 | 10,000 | 10,000 |
| June - 14 | 10,132 | 10,180 | 10,096 |
| July - 14 | 9,903 | 10,040 | 9,942 |
| August - 14 | 10,097 | 10,264 | 10,031 |
| September - 14 | 9,745 | 9,977 | 9,773 |
| October - 14 | 9,639 | 10,049 | 9,838 |
| November - 14 | 9,713 | 10,241 | 9,779 |
| December - 14 | 9,574 | 10,073 | 9,589 |
| January - 15 | 9,519 | 9,891 | 9,515 |
| February - 15 | 9,722 | 10,454 | 9,739 |
| March - 15 | 9,455 | 10,293 | 9,622 |
| April - 15 | 9,869 | 10,580 | 9,824 |
| May - 15 | 9,639 | 10,605 | 9,819 |
| June - 15 | 9,400 | 10,354 | 9,708 |
| July - 15 | 9,160 | 10,494 | 9,667 |
| August - 15 | 8,875 | 9,809 | 9,526 |
| September - 15 | 8,424 | 9,462 | 9,271 |
| October - 15 | 8,801 | 10,216 | 9,528 |
| November - 15 | 8,660 | 10,163 | 9,304 |
| December - 15 | 8,328 | 9,987 | 9,116 |
| January - 16 | 8,095 | 9,413 | 8,968 |
| February - 16 | 8,221 | 9,348 | 8,994 |
| March - 16 | 8,728 | 10,004 | 9,467 |
| April - 16 | 9,244 | 10,170 | 9,800 |
| May - 16 | 9,000 | 10,217 | 9,800 |
| June - 16 | 9,254 | 10,140 | 9,831 |
| July - 16 | 9,517 | 10,574 | 10,094 |
| August - 16 | 9,741 | 10,610 | 10,282 |
| September - 16 | 9,965 | 10,654 | 10,336 |
| October - 16 | 9,975 | 10,484 | 10,327 |
| November - 16 | 9,848 | 10,622 | 10,219 |
| December - 16 | 9,956 | 10,875 | 10,391 |
| January - 17 | 10,231 | 11,153 | 10,579 |
| February - 17 | 10,414 | 11,456 | 10,694 |
| March - 17 | 10,536 | 11,614 | 10,694 |
| April - 17 | 10,597 | 11,790 | 10,861 |
| May - 17 | 10,699 | 12,048 | 11,010 |
| June - 17 | 10,699 | 12,114 | 11,053 |
| July - 17 | 11,045 | 12,437 | 11,243 |
| August - 17 | 11,157 | 12,476 | 11,267 |
| September - 17 | 11,340 | 12,747 | 11,357 |
| October - 17 | 11,361 | 13,012 | 11,392 |
| November - 17 | 11,326 | 13,272 | 11,418 |
| December - 17 | 11,493 | 13,468 | 11,460 |
| January - 18 | 11,922 | 14,209 | 11,617 |
| February - 18 | 11,493 | 13,618 | 11,469 |
| March - 18 | 11,577 | 13,344 | 11,432 |
| April - 18 | 11,640 | 13,488 | 11,440 |
| May - 18 | 11,514 | 13,539 | 11,310 |
| June - 18 | 11,482 | 13,515 | 11,320 |
| July - 18 | 11,870 | 13,956 | 11,466 |
| August - 18 | 11,639 | 14,096 | 11,478 |
| September - 18 | 11,849 | 14,200 | 11,552 |
| October - 18 | 11,482 | 13,170 | 11,324 |
| November - 18 | 11,587 | 13,341 | 11,206 |
| December - 18 | 11,351 | 12,368 | 11,063 |
| January - 19 | 11,970 | 13,313 | 11,516 |
| February - 19 | 12,209 | 13,691 | 11,694 |
| March - 19 | 12,177 | 13,886 | 11,774 |
| April - 19 | 12,253 | 14,394 | 11,928 |
| May - 19 | 11,927 | 13,565 | 11,770 |
| June - 19 | 12,470 | 14,456 | 12,089 |
| July - 19 | 12,492 | 14,491 | 12,107 |
| August - 19 | 12,101 | 14,221 | 12,107 |
| September - 19 | 12,350 | 14,560 | 12,136 |
| October - 19 | 12,470 | 14,946 | 12,249 |
| November - 19 | 12,405 | 15,338 | 12,288 |
| December - 19 | 12,653 | 15,858 | 12,548 |
| January - 20 | 12,441 | 15,720 | 12,544 |
| February - 20 | 11,946 | 14,433 | 12,340 |
| March - 20 | 10,519 | 12,573 | 10,843 |
| April - 20 | 11,003 | 13,872 | 11,387 |
| May - 20 | 11,297 | 14,496 | 11,878 |
| June - 20 | 11,403 | 14,915 | 12,074 |
| July - 20 | 11,592 | 15,617 | 12,665 |
| August - 20 | 11,745 | 16,603 | 12,842 |
| September - 20 | 11,333 | 16,049 | 12,662 |
| October - 20 | 11,097 | 15,608 | 12,701 |
| November - 20 | 11,970 | 17,545 | 13,282 |
| December - 20 | 12,308 | 18,329 | 13,573 |
| January - 21 | 12,443 | 18,186 | 13,598 |
| February - 21 | 12,614 | 18,652 | 13,664 |
| March - 21 | 12,846 | 19,299 | 13,589 |
| April - 21 | 13,029 | 20,174 | 13,794 |
| May - 21 | 13,297 | 20,516 | 13,894 |
| June - 21 | 13,236 | 20,751 | 13,930 |
| July - 21 | 13,163 | 20,997 | 13,934 |
| August - 21 | 13,236 | 21,513 | 14,001 |
| September - 21 | 13,248 | 20,617 | 13,898 |
| October - 21 | 13,371 | 21,746 | 13,823 |
| November - 21 | 13,151 | 21,333 | 13,607 |
| December - 21 | 13,613 | 22,278 | 13,839 |
| January - 22 | 13,662 | 21,248 | 13,466 |
| February - 22 | 13,712 | 20,681 | 13,229 |
| March - 22 | 13,787 | 21,229 | 13,075 |
| April - 22 | 12,953 | 19,549 | 12,499 |
| May - 22 | 13,164 | 19,663 | 12,503 |
| June - 22 | 12,218 | 17,980 | 11,604 |
| July - 22 | 12,454 | 19,306 | 12,135 |
| August - 22 | 12,230 | 18,500 | 11,887 |
| September - 22 | 11,508 | 16,756 | 11,320 |
| October - 22 | 11,832 | 17,895 | 11,569 |
| November - 22 | 12,604 | 19,331 | 12,025 |
| December - 22 | 12,554 | 18,529 | 12,089 |
| January - 23 | 13,185 | 19,858 | 12,583 |
| February - 23 | 12,850 | 19,294 | 12,376 |
| March - 23 | 13,069 | 19,955 | 12,525 |
| April - 23 | 13,198 | 20,298 | 12,673 |
| May - 23 | 12,709 | 20,125 | 12,500 |
| June - 23 | 12,992 | 21,323 | 12,742 |
| July - 23 | 13,301 | 22,011 | 12,937 |
| August - 23 | 13,031 | 21,474 | 12,917 |
| September - 23 | 12,928 | 20,543 | 12,744 |
| October - 23 | 12,696 | 19,992 | 12,612 |
| November - 23 | 13,147 | 21,821 | 13,228 |
| December - 23 | 13,812 | 22,861 | 13,721 |
| January - 24 | 13,772 | 23,073 | 13,721 |
| February - 24 | 13,665 | 24,095 | 13,767 |
| March - 24 | 14,068 | 24,936 | 13,907 |
| April - 24 | 13,947 | 24,054 | 13,777 |
| May - 24 | 14,444 | 25,155 | 13,982 |
Annual Average Total Return
| 1 Year | 5 Year | 10 Year |
|---|
| Sextant Global High Income Fund | 13.65% | 3.90% | 3.75% |
| S&P Global 1200 Index | 24.99% | 13.13% | 9.65% |
| Bloomberg Global High Yield Corp. Index | 11.86% | 3.50% | 3.41% |
Please visit www.saturna.com/sextant/global-high-income-fund for more recent performance information.
| SEXTANT GLOBAL HIGH INCOME FUND
Sextant Global High Income Fund
Semi-Annual Shareholder Report - May 31, 2024
| Total Net Assets | $9,648,312 |
| # of Portfolio Holdings | 37 |
| Advisory Fees Paid | $23,902 |
| Portfolio Turnover Rate | 2% |
You may have consented to receive one shareholder report at your address if you and one or more individuals in your home have an account with the Fund (householding). If you wish to receive a copy of this document at a new address, contact 1-800-728-8762
What did the Fund invest in?
| Southern Copper | 6.2% |
| Skandinaviska Enskilda Banken, Cl A | 3.7% |
| BHP Biliton ADR | 3.4% |
| GlaxoSmithKline ADR | 3.0% |
| ANZ Group Holdings ADR | 2.9% |
| Shell ADR | 2.9% |
| Nintendo | 2.8% |
| Novartis ADR | 2.7% |
| YUM! Brands (3.625% due 03/15/2031) | 2.7% |
| South32 ADR | 2.6% |
| |
| Communications | 14.7% |
| Materials | 14.7% |
| Financials | 10.3% |
| Industrials | 8.9% |
| Consumer Discretionary | 8.8% |
| Health Care | 5.9% |
| Energy | 5.8% |
| Technology | 5.2% |
| Utilities | 2.6% |
| Government | 2.5% |
| Other Sectors | 2.3% |
| Other Assets (net of liabilities) | 18.3% |
| United States | 32.5% |
| Australia | 10.5% |
| Peru | 6.2% |
| Norway | 4.9% |
| Sweden | 3.7% |
| United Kingdom | 3.0% |
| Switzerland | 2.9% |
| Netherlands | 2.9% |
| Japan | 2.8% |
| France | 2.4% |
If you wish to view additional information about the Fund, including but not limited to the Fund's prospectus, financial statements, holdings, or proxy voting information, please visit www.saturna.com/forms#mutual-fund-library .
1300 N. State Street
Bellingham, WA 98225
1-866-290-2688
Semi-Annual Shareholder Report - May 31, 2024
The objective of the Growth Fund is long-term capital growth. This Semiannual Shareholder Report contains important information about the Sextant Growth Fund for the period of December 1, 2023 to May 31, 2024. You can find additional information about the Fund at www.saturna.com/sextant/growth-fund. You can also request this information by contacting us at 1-800-728-8762 or investorservices@saturna.com. The report describes changes to the Fund that occurred during the reporting period.
What were the Fund’s costs for the last 6 months?
(Based on a hypothetical $10,000 investment)
| Class Name | Cost of a $10,000 Investment | Cost Paid as a % of a $10,000 Investment |
|---|
| Investor Shares | $52.60 | 0.98% |
How did the Fund perform over the last six months?
For the six-month period ended May 31, 2024, Sextant Growth Fund Investor Shares returned 14.70%, trailing the 16.35% return for the S&P 500 Index. As was the case in the previous fiscal year, the Fund returns suffered in comparison to the S&P 500 due to a handful of mega-cap Technology and artificial intelligence (AI) related stocks driving Index returns.
What Factors Influenced Performance?
After Nvidia's May 2023 earnings announcement, the AI frenzy took off, defining market performance ever since. Indications of declining inflation and imminent rate cuts that buoyed a wider cross-section of the market in late 2023 gave way to inflation resilience and delayed interest rate reductions, which could last into next year. As a result, several of the mega-cap Technology stocks that accounted for much of the S&P 500 gains continued to drive Index performance through the first half of the fiscal year. Nvidia remains the leader of the pack, having appreciated over 130% over the trailing six-month period. The result, while not as dramatic a gap as last year, was the continued outperformance of the market cap-weighted S&P 500 versus the equal-weighted S&P 500.
The Sextant Growth Fund holds several of the mega-cap stocks that led returns over the past six months, including Nvidia, Amazon, Microsoft, and Alphabet. Earlier this year we added Meta (Facebook) to the portfolio. The Fund has investments in AI-adjacent companies such as Broadcom, Oracle, and Quanta, which have performed well. Holdings that detracted from Fund performance were Consumer stocks Lululemon and Monster Beverage, animal health care company Zoetis, and digital media company Adobe.
Looking Forward
With a presidential election approaching, either bravery or foolishness would be required to opine on next year’s outlook. The two candidates have widely divergent opinions on a host of issues including taxation, tariffs, immigration, fossil fuels, alternative energy, and many others. Economic resilience (in terms of jobs and wages) adds to the uncertainty, defying the inverted yield curve prognostications, and consumers are still scarred from the pandemic-engendered period of high inflation.
How did the Fund perform over the past 10 years?
The Cumulative Performance chart reflects a hypothetical $10,000 investment in the class of shares noted. Past performance does not guarantee future results. The graph and table do not reflect the deduction of taxes that a shareholder would pay on Fund distributions or redemption of Fund shares.
May 31, 2014 through May 31, 2024 with initial investment of $10,000.
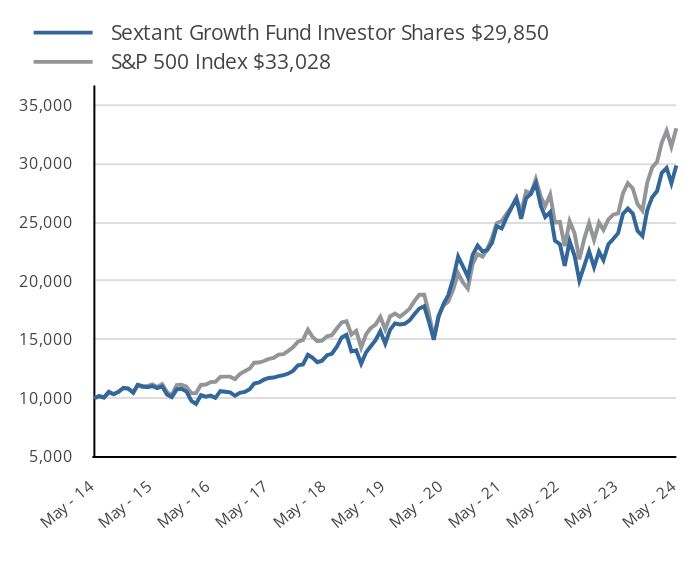
| Sextant Growth Fund Investor Shares $29,850 | S&P 500 Index $33,028 |
|---|
| May - 14 | 10,000 | 10,000 |
| June - 14 | 10,157 | 10,207 |
| July - 14 | 10,063 | 10,066 |
| August - 14 | 10,556 | 10,468 |
| September - 14 | 10,348 | 10,322 |
| October - 14 | 10,536 | 10,574 |
| November - 14 | 10,892 | 10,858 |
| December - 14 | 10,813 | 10,831 |
| January - 15 | 10,470 | 10,506 |
| February - 15 | 11,148 | 11,109 |
| March - 15 | 11,020 | 10,934 |
| April - 15 | 10,933 | 11,039 |
| May - 15 | 11,028 | 11,181 |
| June - 15 | 10,863 | 10,964 |
| July - 15 | 11,012 | 11,194 |
| August - 15 | 10,313 | 10,519 |
| September - 15 | 10,094 | 10,258 |
| October - 15 | 10,755 | 11,124 |
| November - 15 | 10,797 | 11,157 |
| December - 15 | 10,581 | 10,981 |
| January - 16 | 9,772 | 10,436 |
| February - 16 | 9,507 | 10,422 |
| March - 16 | 10,258 | 11,129 |
| April - 16 | 10,132 | 11,172 |
| May - 16 | 10,222 | 11,372 |
| June - 16 | 10,029 | 11,402 |
| July - 16 | 10,599 | 11,822 |
| August - 16 | 10,550 | 11,839 |
| September - 16 | 10,496 | 11,841 |
| October - 16 | 10,208 | 11,625 |
| November - 16 | 10,450 | 12,056 |
| December - 16 | 10,533 | 12,294 |
| January - 17 | 10,775 | 12,527 |
| February - 17 | 11,245 | 13,025 |
| March - 17 | 11,352 | 13,040 |
| April - 17 | 11,581 | 13,174 |
| May - 17 | 11,725 | 13,359 |
| June - 17 | 11,762 | 13,442 |
| July - 17 | 11,883 | 13,719 |
| August - 17 | 11,972 | 13,761 |
| September - 17 | 12,102 | 14,045 |
| October - 17 | 12,354 | 14,372 |
| November - 17 | 12,815 | 14,813 |
| December - 17 | 12,887 | 14,978 |
| January - 18 | 13,707 | 15,836 |
| February - 18 | 13,467 | 15,252 |
| March - 18 | 13,069 | 14,864 |
| April - 18 | 13,202 | 14,921 |
| May - 18 | 13,668 | 15,281 |
| June - 18 | 13,791 | 15,375 |
| July - 18 | 14,375 | 15,947 |
| August - 18 | 15,185 | 16,466 |
| September - 18 | 15,406 | 16,560 |
| October - 18 | 13,992 | 15,428 |
| November - 18 | 14,090 | 15,743 |
| December - 18 | 12,941 | 14,321 |
| January - 19 | 13,917 | 15,469 |
| February - 19 | 14,412 | 15,966 |
| March - 19 | 14,944 | 16,276 |
| April - 19 | 15,713 | 16,935 |
| May - 19 | 14,650 | 15,859 |
| June - 19 | 15,827 | 16,976 |
| July - 19 | 16,379 | 17,220 |
| August - 19 | 16,291 | 16,948 |
| September - 19 | 16,348 | 17,265 |
| October - 19 | 16,642 | 17,639 |
| November - 19 | 17,164 | 18,279 |
| December - 19 | 17,649 | 18,831 |
| January - 20 | 17,845 | 18,823 |
| February - 20 | 16,555 | 17,274 |
| March - 20 | 14,978 | 15,140 |
| April - 20 | 16,916 | 17,081 |
| May - 20 | 18,031 | 17,895 |
| June - 20 | 18,790 | 18,250 |
| July - 20 | 20,213 | 19,279 |
| August - 20 | 22,082 | 20,665 |
| September - 20 | 21,254 | 19,880 |
| October - 20 | 20,351 | 19,351 |
| November - 20 | 22,225 | 21,470 |
| December - 20 | 23,028 | 22,295 |
| January - 21 | 22,510 | 22,070 |
| February - 21 | 22,622 | 22,679 |
| March - 21 | 23,252 | 23,672 |
| April - 21 | 24,668 | 24,935 |
| May - 21 | 24,491 | 25,109 |
| June - 21 | 25,399 | 25,696 |
| July - 21 | 26,243 | 26,306 |
| August - 21 | 27,007 | 27,106 |
| September - 21 | 25,314 | 25,845 |
| October - 21 | 27,060 | 27,656 |
| November - 21 | 27,445 | 27,464 |
| December - 21 | 28,323 | 28,695 |
| January - 22 | 26,419 | 27,210 |
| February - 22 | 25,453 | 26,395 |
| March - 22 | 25,872 | 27,375 |
| April - 22 | 23,451 | 24,988 |
| May - 22 | 23,136 | 25,034 |
| June - 22 | 21,286 | 22,968 |
| July - 22 | 23,387 | 25,085 |
| August - 22 | 22,147 | 24,062 |
| September - 22 | 20,046 | 21,846 |
| October - 22 | 21,303 | 23,615 |
| November - 22 | 22,537 | 24,935 |
| December - 22 | 21,172 | 23,498 |
| January - 23 | 22,503 | 24,975 |
| February - 23 | 21,786 | 24,365 |
| March - 23 | 23,135 | 25,260 |
| April - 23 | 23,583 | 25,654 |
| May - 23 | 24,078 | 25,766 |
| June - 23 | 25,714 | 27,468 |
| July - 23 | 26,174 | 28,350 |
| August - 23 | 25,756 | 27,899 |
| September - 23 | 24,281 | 26,569 |
| October - 23 | 23,828 | 26,010 |
| November - 23 | 26,024 | 28,386 |
| December - 23 | 27,152 | 29,675 |
| January - 24 | 27,678 | 30,174 |
| February - 24 | 29,206 | 31,785 |
| March - 24 | 29,641 | 32,808 |
| April - 24 | 28,328 | 31,468 |
| May - 24 | 29,850 | 33,028 |
Annual Average Total Return
| 1 Year | 5 Year | 10 Year |
|---|
| Investor Shares | 23.97% | 15.30% | 11.56% |
| S&P 500 Index | 28.19% | 15.79% | 12.68% |
Please visit www.saturna.com/sextant/growth-fund for more recent performance information.
Semi-Annual Shareholder Report - May 31, 2024
| Total Net Assets | $67,857,920 |
| # of Portfolio Holdings | 31 |
| Advisory Fees Paid | $164,039 |
| Portfolio Turnover Rate | 6% |
You may have consented to receive one shareholder report at your address if you and one or more individuals in your home have an account with the Fund (householding). If you wish to receive a copy of this document at a new address, contact 1-800-728-8762
What did the Fund invest in?
| Microsoft | 11.1% |
| Apple | 8.3% |
| Alphabet, Class A | 8.1% |
| Amazon.com | 7.0% |
| NVIDIA | 5.6% |
| Costco Wholesale | 4.2% |
| Mastercard, Class A | 3.9% |
| Motorola Solutions | 3.2% |
| Oracle | 3.0% |
| Adobe | 2.9% |
| |
| Infrastructure Software | 16.0% |
| Semiconductor Devices | 15.5% |
| Communications Equipment | 11.5% |
| Internet Media & Services | 10.0% |
| Online Marketplace | 7.0% |
| Medical Devices | 5.3% |
| Specialty Apparel Stores | 4.3% |
| Mass Merchants | 4.2% |
| Other Financial Services | 3.9% |
| Application Software | 2.9% |
| Other Industries | 17.6% |
| Other Assets (net of liabilities) | 1.8% |
If you wish to view additional information about the Fund, including but not limited to the Fund's prospectus, financial statements, holdings, or proxy voting information, please visit www.saturna.com/forms#mutual-fund-library .
1300 N. State Street
Bellingham, WA 98225
1-866-290-2688
Semi-Annual Shareholder Report - May 31, 2024
The objective of the Growth Fund is long-term capital growth. This Semiannual Shareholder Report contains important information about the Sextant Growth Fund for the period of December 1, 2023 to May 31, 2024. You can find additional information about the Fund at www.saturna.com/sextant/growth-fund. You can also request this information by contacting us at 1-800-728-8762 or investorservices@saturna.com. The report describes changes to the Fund that occurred during the reporting period.
What were the Fund’s costs for the last 6 months?
(Based on a hypothetical $10,000 investment)
| Class Name | Cost of a $10,000 Investment | Cost Paid as a % of a $10,000 Investment |
|---|
| Z Shares | $39.75 | 0.74% |
How did the Fund perform over the last six months?
For the six-month period ended May 31, 2024, Sextant Growth Fund Z Shares returned 14.84%, trailing the 16.35% return for the S&P 500 Index. As was the case in the previous fiscal year, the Fund returns suffered in comparison to the S&P 500 due to a handful of mega-cap Technology and artificial intelligence (AI) related stocks driving Index returns.
What Factors Influenced Performance?
After Nvidia's May 2023 earnings announcement, the AI frenzy took off, defining market performance ever since. Indications of declining inflation and imminent rate cuts that buoyed a wider cross-section of the market in late 2023 gave way to inflation resilience and delayed interest rate reductions, which could last into next year. As a result, several of the mega-cap Technology stocks that accounted for much of the S&P 500 gains continued to drive Index performance through the first half of the fiscal year. Nvidia remains the leader of the pack, having appreciated over 130% over the trailing six-month period. The result, while not as dramatic a gap as last year, was the continued outperformance of the market cap-weighted S&P 500 versus the equal-weighted S&P 500.
The Sextant Growth Fund holds several of the mega-cap stocks that led returns over the past six months, including Nvidia, Amazon, Microsoft, and Alphabet. Earlier this year we added Meta (Facebook) to the portfolio. The Fund has investments in AI-adjacent companies such as Broadcom, Oracle, and Quanta, which have performed well. Holdings that detracted from Fund performance were Consumer stocks Lululemon and Monster Beverage, animal health care company Zoetis, and digital media company Adobe.
Looking Forward
With a presidential election approaching, either bravery or foolishness would be required to opine on next year’s outlook. The two candidates have widely divergent opinions on a host of issues including taxation, tariffs, immigration, fossil fuels, alternative energy, and many others. Economic resilience (in terms of jobs and wages) adds to the uncertainty, defying the inverted yield curve prognostications, and consumers are still scarred from the pandemic-engendered period of high inflation.
How did the Fund perform since inception?
The Cumulative Performance chart reflects a hypothetical $10,000 investment in the class of shares noted. Past performance does not guarantee future results. The graph and table do not reflect the deduction of taxes that a shareholder would pay on Fund distributions or redemption of Fund shares.
June 30, 2017 through May 31, 2024 with initial investment of $10,000.
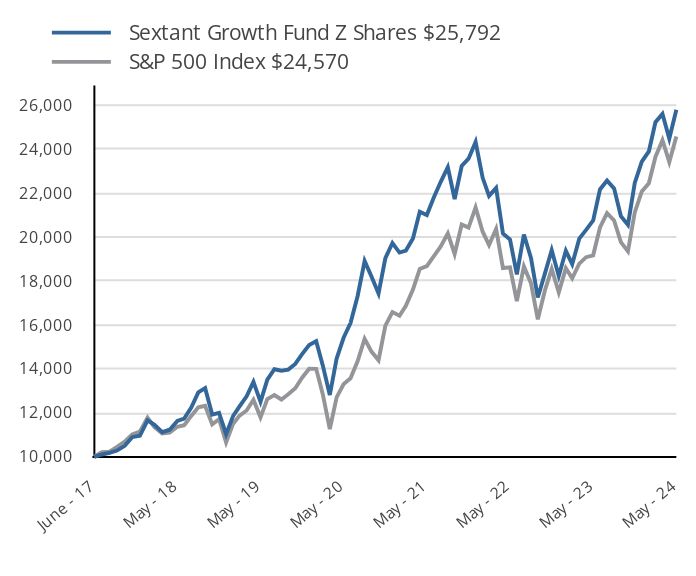
| Sextant Growth Fund Z Shares $25,792 | S&P 500 Index $24,570 |
|---|
| June - 17 | 10,000 | 10,000 |
| July - 17 | 10,107 | 10,206 |
| August - 17 | 10,178 | 10,237 |
| September - 17 | 10,285 | 10,448 |
| October - 17 | 10,499 | 10,692 |
| November - 17 | 10,893 | 11,020 |
| December - 17 | 10,957 | 11,142 |
| January - 18 | 11,661 | 11,780 |
| February - 18 | 11,455 | 11,346 |
| March - 18 | 11,120 | 11,058 |
| April - 18 | 11,233 | 11,100 |
| May - 18 | 11,631 | 11,367 |
| June - 18 | 11,736 | 11,437 |
| July - 18 | 12,239 | 11,863 |
| August - 18 | 12,930 | 12,250 |
| September - 18 | 13,123 | 12,319 |
| October - 18 | 11,921 | 11,477 |
| November - 18 | 12,004 | 11,711 |
| December - 18 | 11,030 | 10,654 |
| January - 19 | 11,862 | 11,508 |
| February - 19 | 12,291 | 11,877 |
| March - 19 | 12,751 | 12,108 |
| April - 19 | 13,406 | 12,598 |
| May - 19 | 12,503 | 11,797 |
| June - 19 | 13,512 | 12,629 |
| July - 19 | 13,986 | 12,810 |
| August - 19 | 13,915 | 12,607 |
| September - 19 | 13,968 | 12,843 |
| October - 19 | 14,224 | 13,122 |
| November - 19 | 14,671 | 13,598 |
| December - 19 | 15,086 | 14,008 |
| January - 20 | 15,259 | 14,003 |
| February - 20 | 14,161 | 12,850 |
| March - 20 | 12,812 | 11,263 |
| April - 20 | 14,471 | 12,707 |
| May - 20 | 15,428 | 13,312 |
| June - 20 | 16,084 | 13,577 |
| July - 20 | 17,306 | 14,342 |
| August - 20 | 18,906 | 15,373 |
| September - 20 | 18,204 | 14,789 |
| October - 20 | 17,433 | 14,396 |
| November - 20 | 19,042 | 15,972 |
| December - 20 | 19,730 | 16,586 |
| January - 21 | 19,294 | 16,418 |
| February - 21 | 19,386 | 16,871 |
| March - 21 | 19,937 | 17,610 |
| April - 21 | 21,150 | 18,550 |
| May - 21 | 21,003 | 18,679 |
| June - 21 | 21,784 | 19,115 |
| July - 21 | 22,514 | 19,569 |
| August - 21 | 23,176 | 20,164 |
| September - 21 | 21,729 | 19,226 |
| October - 21 | 23,231 | 20,573 |
| November - 21 | 23,566 | 20,431 |
| December - 21 | 24,329 | 21,347 |
| January - 22 | 22,693 | 20,242 |
| February - 22 | 21,870 | 19,636 |
| March - 22 | 22,231 | 20,365 |
| April - 22 | 20,159 | 18,589 |
| May - 22 | 19,888 | 18,623 |
| June - 22 | 18,303 | 17,086 |
| July - 22 | 20,114 | 18,661 |
| August - 22 | 19,050 | 17,900 |
| September - 22 | 17,249 | 16,252 |
| October - 22 | 18,333 | 17,567 |
| November - 22 | 19,397 | 18,549 |
| December - 22 | 18,230 | 17,481 |
| January - 23 | 19,372 | 18,579 |
| February - 23 | 18,765 | 18,126 |
| March - 23 | 19,928 | 18,791 |
| April - 23 | 20,324 | 19,084 |
| May - 23 | 20,756 | 19,167 |
| June - 23 | 22,166 | 20,434 |
| July - 23 | 22,568 | 21,090 |
| August - 23 | 22,213 | 20,754 |
| September - 23 | 20,947 | 19,765 |
| October - 23 | 20,556 | 19,349 |
| November - 23 | 22,459 | 21,116 |
| December - 23 | 23,434 | 22,076 |
| January - 24 | 23,898 | 22,447 |
| February - 24 | 25,221 | 23,645 |
| March - 24 | 25,602 | 24,406 |
| April - 24 | 24,474 | 23,409 |
| May - 24 | 25,792 | 24,570 |
Annual Average Total Return
| 1 Year | 5 Year | Since Inception |
|---|
| Z Shares | 24.26% | 15.58% | 14.31% |
| S&P 500 Index | 28.19% | 15.79% | 13.62% |
Please visit www.saturna.com/sextant/growth-fund for more recent performance information.
Semi-Annual Shareholder Report - May 31, 2024
| Total Net Assets | $67,857,920 |
| # of Portfolio Holdings | 31 |
| Advisory Fees Paid | $164,039 |
| Portfolio Turnover Rate | 6% |
You may have consented to receive one shareholder report at your address if you and one or more individuals in your home have an account with the Fund (householding). If you wish to receive a copy of this document at a new address, contact 1-800-728-8762
What did the Fund invest in?
| Microsoft | 11.1% |
| Apple | 8.3% |
| Alphabet, Class A | 8.1% |
| Amazon.com | 7.0% |
| NVIDIA | 5.6% |
| Costco Wholesale | 4.2% |
| Mastercard, Class A | 3.9% |
| Motorola Solutions | 3.2% |
| Oracle | 3.0% |
| Adobe | 2.9% |
| |
| Infrastructure Software | 16.0% |
| Semiconductor Devices | 15.5% |
| Communications Equipment | 11.5% |
| Internet Media & Services | 10.0% |
| Online Marketplace | 7.0% |
| Medical Devices | 5.3% |
| Specialty Apparel Stores | 4.3% |
| Mass Merchants | 4.2% |
| Other Financial Services | 3.9% |
| Application Software | 2.9% |
| Other Industries | 17.6% |
| Other Assets (net of liabilities) | 1.8% |
If you wish to view additional information about the Fund, including but not limited to the Fund's prospectus, financial statements, holdings, or proxy voting information, please visit www.saturna.com/forms#mutual-fund-library .
1300 N. State Street
Bellingham, WA 98225
1-866-290-2688
Sextant International Fund
Semi-Annual Shareholder Report - May 31, 2024
The objective of the International Fund is long-term capital growth. This Semiannual Shareholder Report contains important information about the Sextant International Fund for the period of December 1, 2023 to May 31, 2024. You can find additional information about the Fund at www.saturna.com/sextant/international-fund. You can also request this information by contacting us at 1-800-728-8762 or investorservices@saturna.com. The report describes changes to the Fund that occurred during the reporting period.
What were the Fund’s costs for the last 6 months?
(Based on a hypothetical $10,000 investment)
| Class Name | Cost of a $10,000 Investment | Cost Paid as a % of a $10,000 Investment |
|---|
| Investor Shares | $50.89 | 0.96% |
How did the Fund perform over the last six months?
For the six-month period ended May 31, 2024, the Sextant International Fund Investor Shares returned 12.03%. The MSCI EAFE Index and MSCI ACWI ex US Index returned 13.19% and 11.46% for the same period, respectively.
What Factors Influenced Performance?
The Sextant International Fund mandates that 65% of net assets be held in companies with their headquarters and at least half of their assets and earnings outside the US, and with market capitalizations greater than $1 billion. The Fund generally holds equity positions in larger companies with strong balance sheets. As of May 31, 2024, Technology was the largest sector weighting at 39.2% followed by Health Care at 18.1%, then Industrials at 16.4%. Consumer Discretionary and Materials were the next largest sector weightings in the portfolio, at 8.6% each. In terms of performance contributions, Health Care, Industrials, Communications, and Technology were the largest contributors. Top performers were Taiwan Semiconductor, Eaton, and ASML. The bottom performers included Lululemon, OpenText, and Accenture.
Looking Forward
We are entering an economic regime where global growth may remain sluggish, and the costs of capital elevated. While inflation and interest rates are important, their impact is expected to diminish over the next several quarters, as the significant tail risks associated with them have largely been mitigated. Last year, the Federal Reserve's policy actions could be described as a defusing a bomb; even a minor error could have had catastrophic consequences. This year, the challenge is more akin to parking a boat in a narrow slip on a rainy day — there may be bumps and collisions (i.e. economic weakness, sticky inflation), but probably nothing that will sink the ship. Fed Chair Jerome Powell will likely continue to bounce between hawkish and dovish tones based on the prevailing risks at any given time until the US economy achieves some form of "landing."
In this environment (slow growth + elevated cost of capital=margin pressure), the Sextant International Fund prioritizes companies that offer products and services which help enterprises improve operating profitability through productivity gains. Fortunately, surges in innovation (including AI, digital transformation, and accelerated computing) are likely to drive economic upside relative to market expectations over the next several years. Given this backdrop, the Fund maintains a constructive outlook for the remainder of 2024 and beyond.
How did the Fund perform over the past 10 years?
The Cumulative Performance chart reflects a hypothetical $10,000 investment in the class of shares noted. Past performance does not guarantee future results. The graph and table do not reflect the deduction of taxes that a shareholder would pay on Fund distributions or redemption of Fund shares.
May 31, 2014 through May 31, 2024 with initial investment of $10,000.
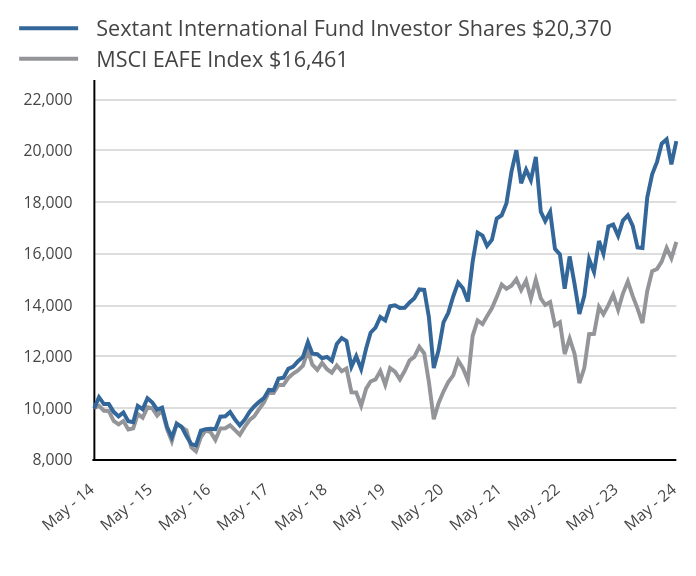
| Sextant International Fund Investor Shares $20,370 | MSCI EAFE Index $16,461 |
|---|
| May - 14 | 10,000 | 10,000 |
| June - 14 | 10,428 | 10,099 |
| July - 14 | 10,159 | 9,901 |
| August - 14 | 10,159 | 9,887 |
| September - 14 | 9,859 | 9,511 |
| October - 14 | 9,682 | 9,373 |
| November - 14 | 9,834 | 9,501 |
| December - 14 | 9,497 | 9,175 |
| January - 15 | 9,459 | 9,221 |
| February - 15 | 10,088 | 9,773 |
| March - 15 | 9,961 | 9,633 |
| April - 15 | 10,387 | 10,034 |
| May - 15 | 10,221 | 9,994 |
| June - 15 | 9,942 | 9,714 |
| July - 15 | 10,018 | 9,916 |
| August - 15 | 9,281 | 9,188 |
| September - 15 | 8,874 | 8,725 |
| October - 15 | 9,389 | 9,407 |
| November - 15 | 9,285 | 9,262 |
| December - 15 | 8,922 | 9,139 |
| January - 16 | 8,599 | 8,479 |
| February - 16 | 8,554 | 8,326 |
| March - 16 | 9,129 | 8,875 |
| April - 16 | 9,188 | 9,142 |
| May - 16 | 9,207 | 9,070 |
| June - 16 | 9,188 | 8,770 |
| July - 16 | 9,673 | 9,215 |
| August - 16 | 9,686 | 9,223 |
| September - 16 | 9,854 | 9,340 |
| October - 16 | 9,563 | 9,150 |
| November - 16 | 9,330 | 8,969 |
| December - 16 | 9,557 | 9,277 |
| January - 17 | 9,865 | 9,547 |
| February - 17 | 10,068 | 9,685 |
| March - 17 | 10,245 | 9,962 |
| April - 17 | 10,389 | 10,223 |
| May - 17 | 10,711 | 10,612 |
| June - 17 | 10,698 | 10,597 |
| July - 17 | 11,150 | 10,903 |
| August - 17 | 11,183 | 10,900 |
| September - 17 | 11,530 | 11,176 |
| October - 17 | 11,615 | 11,347 |
| November - 17 | 11,827 | 11,467 |
| December - 17 | 11,991 | 11,653 |
| January - 18 | 12,569 | 12,239 |
| February - 18 | 12,119 | 11,688 |
| March - 18 | 12,098 | 11,489 |
| April - 18 | 11,941 | 11,763 |
| May - 18 | 11,991 | 11,515 |
| June - 18 | 11,841 | 11,378 |
| July - 18 | 12,491 | 11,659 |
| August - 18 | 12,726 | 11,435 |
| September - 18 | 12,612 | 11,539 |
| October - 18 | 11,612 | 10,621 |
| November - 18 | 12,019 | 10,610 |
| December - 18 | 11,518 | 10,097 |
| January - 19 | 12,321 | 10,762 |
| February - 19 | 12,931 | 11,037 |
| March - 19 | 13,131 | 11,119 |
| April - 19 | 13,541 | 11,443 |
| May - 19 | 13,409 | 10,909 |
| June - 19 | 13,957 | 11,560 |
| July - 19 | 13,996 | 11,415 |
| August - 19 | 13,888 | 11,120 |
| September - 19 | 13,896 | 11,445 |
| October - 19 | 14,104 | 11,857 |
| November - 19 | 14,274 | 11,993 |
| December - 19 | 14,611 | 12,384 |
| January - 20 | 14,595 | 12,127 |
| February - 20 | 13,547 | 11,032 |
| March - 20 | 11,564 | 9,571 |
| April - 20 | 12,251 | 10,197 |
| May - 20 | 13,331 | 10,647 |
| June - 20 | 13,699 | 11,014 |
| July - 20 | 14,339 | 11,273 |
| August - 20 | 14,874 | 11,854 |
| September - 20 | 14,658 | 11,551 |
| October - 20 | 14,147 | 11,091 |
| November - 20 | 15,690 | 12,812 |
| December - 20 | 16,815 | 13,410 |
| January - 21 | 16,702 | 13,268 |
| February - 21 | 16,301 | 13,567 |
| March - 21 | 16,542 | 13,892 |
| April - 21 | 17,368 | 14,322 |
| May - 21 | 17,489 | 14,802 |
| June - 21 | 17,962 | 14,640 |
| July - 21 | 19,174 | 14,752 |
| August - 21 | 20,017 | 15,013 |
| September - 21 | 18,733 | 14,589 |
| October - 21 | 19,263 | 14,951 |
| November - 21 | 18,853 | 14,257 |
| December - 21 | 19,759 | 14,989 |
| January - 22 | 17,634 | 14,265 |
| February - 22 | 17,268 | 14,015 |
| March - 22 | 17,625 | 14,121 |
| April - 22 | 16,187 | 13,219 |
| May - 22 | 15,970 | 13,337 |
| June - 22 | 14,637 | 12,103 |
| July - 22 | 15,891 | 12,707 |
| August - 22 | 14,819 | 12,105 |
| September - 22 | 13,661 | 10,978 |
| October - 22 | 14,366 | 11,569 |
| November - 22 | 15,787 | 12,874 |
| December - 22 | 15,290 | 12,888 |
| January - 23 | 16,492 | 13,933 |
| February - 23 | 15,996 | 13,644 |
| March - 23 | 17,059 | 14,000 |
| April - 23 | 17,128 | 14,409 |
| May - 23 | 16,693 | 13,818 |
| June - 23 | 17,285 | 14,451 |
| July - 23 | 17,494 | 14,920 |
| August - 23 | 17,076 | 14,350 |
| September - 23 | 16,240 | 13,866 |
| October - 23 | 16,222 | 13,306 |
| November - 23 | 18,182 | 14,543 |
| December - 23 | 19,085 | 15,318 |
| January - 24 | 19,574 | 15,407 |
| February - 24 | 20,273 | 15,692 |
| March - 24 | 20,440 | 16,226 |
| April - 24 | 19,469 | 15,827 |
| May - 24 | 20,370 | 16,461 |
Annual Average Total Return
| 1 Year | 5 Year | 10 Year |
|---|
| Investor Shares | 22.03% | 8.72% | 7.37% |
| MSCI EAFE Index | 19.12% | 8.57% | 5.10% |
Please visit www.saturna.com/sextant/international-fund for more recent performance information.
Sextant International Fund
Semi-Annual Shareholder Report - May 31, 2024
| Total Net Assets | $76,980,121 |
| # of Portfolio Holdings | 34 |
| Advisory Fees Paid | $181,027 |
| Portfolio Turnover Rate | 6% |
You may have consented to receive one shareholder report at your address if you and one or more individuals in your home have an account with the Fund (householding). If you wish to receive a copy of this document at a new address, contact 1-800-728-8762
What did the Fund invest in?
| Novo Nordisk ADR | 9.9% |
| ASML Holding NY | 6.8% |
| MercadoLibre | 6.7% |
| Wolters Kluwer | 6.4% |
| Dassault Systemes ADR | 4.7% |
| Taiwan Semiconductor ADR | 4.6% |
| Ferguson | 3.6% |
| NICE Systems ADR | 3.6% |
| SAP ADR | 3.4% |
| Linde | 3.1% |
| |
| Netherlands | 13.2% |
| France | 12.6% |
| Denmark | 9.9% |
| Switzerland | 9.0% |
| Germany | 7.7% |
| United States | 7.2% |
| Argentina | 6.7% |
| Ireland | 6.1% |
| United Kingdom | 6.1% |
| Taiwan | 4.6% |
| Application Software | 13.1% |
| Large Pharma | 12.8% |
| Semiconductor Manufacturing | 11.4% |
| IT Services | 9.5% |
| Online Marketplace | 6.7% |
| Electrical Power Equipment | 5.6% |
| Iron | 4.3% |
| Semiconductor Devices | 4.0% |
| Commercial & Residential Building Equipment & Systems | 3.9% |
| Industrial Wholesale & Rental | 3.6% |
| Other Industries | 21.5% |
| Other Assets (net of liabilities) | 3.6% |
If you wish to view additional information about the Fund, including but not limited to the Fund's prospectus, financial statements, holdings, or proxy voting information, please visit www.saturna.com/forms#mutual-fund-library .
1300 N. State Street
Bellingham, WA 98225
1-866-290-2688
Sextant International Fund
Semi-Annual Shareholder Report - May 31, 2024
The objective of the International Fund is long-term capital growth. This Semiannual Shareholder Report contains important information about the Sextant International Fund for the period of December 1, 2023 to May 31, 2024. You can find additional information about the Fund at www.saturna.com/sextant/international-fund. You can also request this information by contacting us at 1-800-728-8762 or investorservices@saturna.com. The report describes changes to the Fund that occurred during the reporting period.
What were the Fund’s costs for the last 6 months?
(Based on a hypothetical $10,000 investment)
| Class Name | Cost of a $10,000 Investment | Cost Paid as a % of a $10,000 Investment |
|---|
| Z Shares | $38.19 | 0.72% |
How did the Fund perform over the last six months?
For the six-month period ended May 31, 2024, the Sextant International Fund Z Shares returned 12.15%. The MSCI EAFE Index and MSCI ACWI ex US Index returned 13.19% and 11.46% for the same period, respectively.
What Factors Influenced Performance?
The Sextant International Fund mandates that 65% of net assets be held in companies with their headquarters and at least half of their assets and earnings outside the US, and with market capitalizations greater than $1 billion. The Fund generally holds equity positions in larger companies with strong balance sheets. As of May 31, 2024, Technology was the largest sector weighting at 39.2% followed by Health Care at 18.1%, then Industrials at 16.4%. Consumer Discretionary and Materials were the next largest sector weightings in the portfolio, at 8.6% each. In terms of performance contributions, Health Care, Industrials, Communications, and Technology were the largest contributors. Top performers were Taiwan Semiconductor, Eaton, and ASML. The bottom performers included Lululemon, OpenText, and Accenture.
Looking Forward
We are entering an economic regime where global growth may remain sluggish, and the costs of capital elevated. While inflation and interest rates are important, their impact is expected to diminish over the next several quarters, as the significant tail risks associated with them have largely been mitigated. Last year, the Federal Reserve's policy actions could be described as a defusing a bomb; even a minor error could have had catastrophic consequences. This year, the challenge is more akin to parking a boat in a narrow slip on a rainy day — there may be bumps and collisions (i.e. economic weakness, sticky inflation), but probably nothing that will sink the ship. Fed Chair Jerome Powell will likely continue to bounce between hawkish and dovish tones based on the prevailing risks at any given time until the US economy achieves some form of "landing."
In this environment (slow growth + elevated cost of capital=margin pressure), the Sextant International Fund prioritizes companies that offer products and services which help enterprises improve operating profitability through productivity gains. Fortunately, surges in innovation (including AI, digital transformation, and accelerated computing) are likely to drive economic upside relative to market expectations over the next several years. Given this backdrop, the Fund maintains a constructive outlook for the remainder of 2024 and beyond.
How did the Fund perform since inception?
The Cumulative Performance chart reflects a hypothetical $10,000 investment in the class of shares noted. Past performance does not guarantee future results. The graph and table do not reflect the deduction of taxes that a shareholder would pay on Fund distributions or redemption of Fund shares.
June 30, 2017 through May 31, 2024 with initial investment of $10,000.
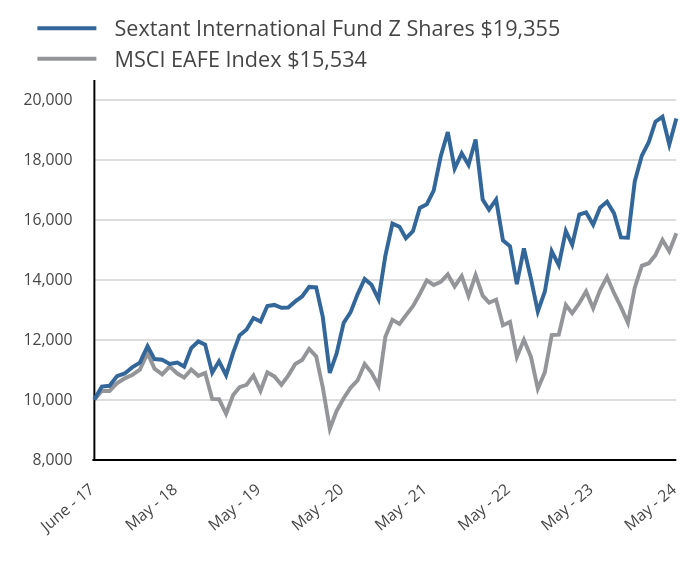
| Sextant International Fund Z Shares $19,355 | MSCI EAFE Index $15,534 |
|---|
| June - 17 | 10,000 | 10,000 |
| July - 17 | 10,435 | 10,289 |
| August - 17 | 10,459 | 10,287 |
| September - 17 | 10,783 | 10,547 |
| October - 17 | 10,869 | 10,708 |
| November - 17 | 11,073 | 10,821 |
| December - 17 | 11,229 | 10,997 |
| January - 18 | 11,777 | 11,549 |
| February - 18 | 11,349 | 11,030 |
| March - 18 | 11,329 | 10,842 |
| April - 18 | 11,189 | 11,101 |
| May - 18 | 11,236 | 10,867 |
| June - 18 | 11,102 | 10,737 |
| July - 18 | 11,717 | 11,002 |
| August - 18 | 11,937 | 10,791 |
| September - 18 | 11,831 | 10,889 |
| October - 18 | 10,895 | 10,023 |
| November - 18 | 11,276 | 10,012 |
| December - 18 | 10,813 | 9,528 |
| January - 19 | 11,566 | 10,156 |
| February - 19 | 12,138 | 10,416 |
| March - 19 | 12,333 | 10,493 |
| April - 19 | 12,717 | 10,798 |
| May - 19 | 12,601 | 10,295 |
| June - 19 | 13,116 | 10,909 |
| July - 19 | 13,152 | 10,772 |
| August - 19 | 13,058 | 10,494 |
| September - 19 | 13,065 | 10,800 |
| October - 19 | 13,268 | 11,189 |
| November - 19 | 13,434 | 11,317 |
| December - 19 | 13,752 | 11,687 |
| January - 20 | 13,737 | 11,444 |
| February - 20 | 12,752 | 10,411 |
| March - 20 | 10,888 | 9,032 |
| April - 20 | 11,534 | 9,623 |
| May - 20 | 12,557 | 10,048 |
| June - 20 | 12,903 | 10,394 |
| July - 20 | 13,504 | 10,638 |
| August - 20 | 14,016 | 11,187 |
| September - 20 | 13,820 | 10,901 |
| October - 20 | 13,339 | 10,467 |
| November - 20 | 14,790 | 12,090 |
| December - 20 | 15,859 | 12,655 |
| January - 21 | 15,753 | 12,521 |
| February - 21 | 15,368 | 12,803 |
| March - 21 | 15,602 | 13,110 |
| April - 21 | 16,381 | 13,515 |
| May - 21 | 16,502 | 13,969 |
| June - 21 | 16,956 | 13,816 |
| July - 21 | 18,098 | 13,921 |
| August - 21 | 18,900 | 14,168 |
| September - 21 | 17,690 | 13,767 |
| October - 21 | 18,196 | 14,109 |
| November - 21 | 17,811 | 13,454 |
| December - 21 | 18,657 | 14,145 |
| January - 22 | 16,658 | 13,462 |
| February - 22 | 16,321 | 13,225 |
| March - 22 | 16,658 | 13,326 |
| April - 22 | 15,301 | 12,475 |
| May - 22 | 15,104 | 12,586 |
| June - 22 | 13,845 | 11,421 |
| July - 22 | 15,030 | 11,991 |
| August - 22 | 14,018 | 11,423 |
| September - 22 | 12,932 | 10,360 |
| October - 22 | 13,598 | 10,918 |
| November - 22 | 14,939 | 12,149 |
| December - 22 | 14,478 | 12,163 |
| January - 23 | 15,613 | 13,149 |
| February - 23 | 15,153 | 12,876 |
| March - 23 | 16,156 | 13,211 |
| April - 23 | 16,230 | 13,598 |
| May - 23 | 15,819 | 13,040 |
| June - 23 | 16,387 | 13,637 |
| July - 23 | 16,584 | 14,080 |
| August - 23 | 16,197 | 13,542 |
| September - 23 | 15,400 | 13,086 |
| October - 23 | 15,391 | 12,557 |
| November - 23 | 17,259 | 13,724 |
| December - 23 | 18,115 | 14,455 |
| January - 24 | 18,578 | 14,540 |
| February - 24 | 19,248 | 14,808 |
| March - 24 | 19,413 | 15,312 |
| April - 24 | 18,487 | 14,936 |
| May - 24 | 19,355 | 15,534 |
Annual Average Total Return
| 1 Year | 5 Year | Since Inception |
|---|
| Z Shares | 22.35% | 8.96% | 0.00 |
| MSCI EAFE Index | 19.12% | 8.57% | 6.26% |
Please visit www.saturna.com/sextant/international-fund for more recent performance information.
Sextant International Fund
Semi-Annual Shareholder Report - May 31, 2024
| Total Net Assets | $76,980,121 |
| # of Portfolio Holdings | 34 |
| Advisory Fees Paid | $181,027 |
| Portfolio Turnover Rate | 6% |
You may have consented to receive one shareholder report at your address if you and one or more individuals in your home have an account with the Fund (householding). If you wish to receive a copy of this document at a new address, contact 1-800-728-8762
What did the Fund invest in?
| Novo Nordisk ADR | 9.9% |
| ASML Holding NY | 6.8% |
| MercadoLibre | 6.7% |
| Wolters Kluwer | 6.4% |
| Dassault Systemes ADR | 4.7% |
| Taiwan Semiconductor ADR | 4.6% |
| Ferguson | 3.6% |
| NICE Systems ADR | 3.6% |
| SAP ADR | 3.4% |
| Linde | 3.1% |
| |
| Netherlands | 13.2% |
| France | 12.6% |
| Denmark | 9.9% |
| Switzerland | 9.0% |
| Germany | 7.7% |
| United States | 7.2% |
| Argentina | 6.7% |
| Ireland | 6.1% |
| United Kingdom | 6.1% |
| Taiwan | 4.6% |
| Application Software | 13.1% |
| Large Pharma | 12.8% |
| Semiconductor Manufacturing | 11.4% |
| IT Services | 9.5% |
| Online Marketplace | 6.7% |
| Electrical Power Equipment | 5.6% |
| Iron | 4.3% |
| Semiconductor Devices | 4.0% |
| Commercial & Residential Building Equipment & Systems | 3.9% |
| Industrial Wholesale & Rental | 3.6% |
| Other Industries | 21.5% |
| Other Assets (net of liabilities) | 3.6% |
If you wish to view additional information about the Fund, including but not limited to the Fund's prospectus, financial statements, holdings, or proxy voting information, please visit www.saturna.com/forms#mutual-fund-library .
1300 N. State Street
Bellingham, WA 98225
1-866-290-2688
| SEXTANT SHORT-TERM BOND
Sextant Short-Term Bond Fund
Semi-Annual Shareholder Report - May 31, 2024
The objective of the Short-Term Bond Fund is capital preservation and current income. This Semiannual Shareholder Report contains important information about the Sextant Short-Term Bond Fund for the period of December 1, 2023 to May 31, 2024. You can find additional information about the Fund at www.saturna.com/sextant/short-term-bond-fund. You can also request this information by contacting us at 1-800-728-8762 or investorservices@saturna.com. The report describes changes to the Fund that occurred during the reporting period.
What were the Fund’s costs for the last 6 months?
(Based on a hypothetical $10,000 investment)
| Class Name | Cost of a $10,000 Investment | Cost Paid as a % of a $10,000 Investment |
|---|
| Sextant Short-Term Bond | $30.29 | 0.60% |
How did the Fund perform over the last six months?
For the six-month period ended May 31, 2024, the Sextant Short-Term Bond Fund returned 1.96%. The Bloomberg US Aggregate 1-3 Year Index returned 2.06%. For the five-year period ended May 31, 2024, the Fund reported an annualized total return of 1.03%, compared to 1.20% for the Index. The primary reason for the Fund’s underperformance was lack of exposure to securitized debt, and cash positions.
Factors Affecting Past Performance
Persistent high inflation, economic growth uncertainty, and widening deficits among most world economies brought considerable market volatility in fiscal 2024. The Treasury curve was highly volatile throughout the year, with swings of over 100 basis points (bps) across the curve. Ultimately, the curve shifted up over the year, especially in the long end, marking a pronounced bear steepener.
As of May 31, 2024, the Sextant Short-Term Bond Fund had 49.2% of assets in bonds maturing inside of one year. In comparison, the Bloomberg US Aggregate 1-3 Year Index had 5.5% of such bonds. The Index held nearly 95% of its assets in bonds with maturities between one and three years, while the Fund held around 41.5% of its assets in such bonds. Bonds with maturities between zero and one years were the primary drivers of fiscal year 2024 performance, and the portfolio’s overweight to this maturity bucket aided performance. Overall, the Fund was positioned defensively during the six-month period, with an allocation to the very front end of the curve and only an 8% allocation to bonds outside of three years. This is reflected in the Fund’s effective duration of 1.43, shorter than the Index, which had an effective duration of 1.76 years.
Looking Forward
Federal Reserve policy changes, economic uncertainty, persistent high inflation, and elevated geopolitical risks may lead to continued volatility for yields and the Treasury curve in fiscal 2025. The Sextant Short-Term Bond Fund portfolio remains defensively positioned to better withstand anticipated yield curve changes, currency movements, and inflationary pressures. Our goal has always been to choose good companies and invest through cycles rather than engage in market timing with outsized active bets.
How did the Fund perform over the past 10 years?
The Cumulative Performance chart reflects a hypothetical $10,000 investment in the class of shares noted. Past performance does not guarantee future results. The graph and table do not reflect the deduction of taxes that a shareholder would pay on Fund distributions or redemption of Fund shares.
May 31, 2014 through May 31, 2024 with initial investment of $10,000.
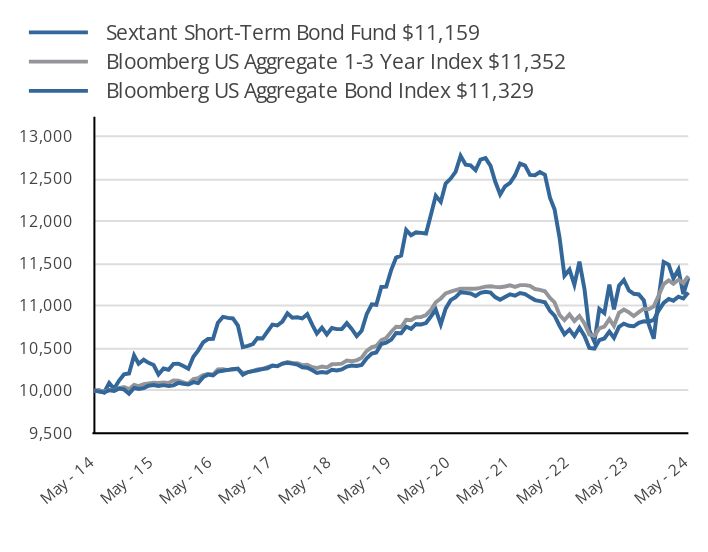
| Sextant Short-Term Bond Fund $11,159 | Bloomberg US Aggregate 1-3 Year Index $11,352 | Bloomberg US Aggregate Bond Index $11,329 |
|---|
| May - 14 | 10,000 | 10,000 | 10,000 |
| June - 14 | 9,989 | 9,996 | 10,005 |
| July - 14 | 9,978 | 9,990 | 9,980 |
| August - 14 | 10,006 | 10,007 | 10,090 |
| September - 14 | 9,996 | 10,000 | 10,022 |
| October - 14 | 10,026 | 10,029 | 10,120 |
| November - 14 | 10,015 | 10,043 | 10,192 |
| December - 14 | 9,965 | 10,018 | 10,202 |
| January - 15 | 10,033 | 10,069 | 10,415 |
| February - 15 | 10,020 | 10,054 | 10,318 |
| March - 15 | 10,030 | 10,077 | 10,365 |
| April - 15 | 10,058 | 10,086 | 10,328 |
| May - 15 | 10,066 | 10,094 | 10,303 |
| June - 15 | 10,055 | 10,091 | 10,191 |
| July - 15 | 10,065 | 10,097 | 10,262 |
| August - 15 | 10,054 | 10,091 | 10,247 |
| September - 15 | 10,063 | 10,121 | 10,316 |
| October - 15 | 10,092 | 10,117 | 10,318 |
| November - 15 | 10,082 | 10,098 | 10,291 |
| December - 15 | 10,072 | 10,084 | 10,258 |
| January - 16 | 10,101 | 10,137 | 10,399 |
| February - 16 | 10,090 | 10,147 | 10,473 |
| March - 16 | 10,160 | 10,183 | 10,569 |
| April - 16 | 10,189 | 10,197 | 10,609 |
| May - 16 | 10,179 | 10,191 | 10,612 |
| June - 16 | 10,226 | 10,252 | 10,803 |
| July - 16 | 10,235 | 10,254 | 10,871 |
| August - 16 | 10,245 | 10,243 | 10,859 |
| September - 16 | 10,253 | 10,255 | 10,852 |
| October - 16 | 10,261 | 10,252 | 10,769 |
| November - 16 | 10,188 | 10,210 | 10,514 |
| December - 16 | 10,219 | 10,216 | 10,529 |
| January - 17 | 10,230 | 10,235 | 10,550 |
| February - 17 | 10,241 | 10,252 | 10,621 |
| March - 17 | 10,254 | 10,258 | 10,615 |
| April - 17 | 10,264 | 10,277 | 10,697 |
| May - 17 | 10,297 | 10,295 | 10,779 |
| June - 17 | 10,289 | 10,290 | 10,769 |
| July - 17 | 10,320 | 10,317 | 10,815 |
| August - 17 | 10,330 | 10,338 | 10,912 |
| September - 17 | 10,319 | 10,326 | 10,860 |
| October - 17 | 10,308 | 10,323 | 10,866 |
| November - 17 | 10,276 | 10,301 | 10,852 |
| December - 17 | 10,270 | 10,305 | 10,902 |
| January - 18 | 10,241 | 10,277 | 10,777 |
| February - 18 | 10,210 | 10,267 | 10,674 |
| March - 18 | 10,221 | 10,284 | 10,743 |
| April - 18 | 10,213 | 10,273 | 10,663 |
| May - 18 | 10,247 | 10,312 | 10,739 |
| June - 18 | 10,238 | 10,313 | 10,726 |
| July - 18 | 10,251 | 10,319 | 10,728 |
| August - 18 | 10,285 | 10,355 | 10,797 |
| September - 18 | 10,297 | 10,348 | 10,728 |
| October - 18 | 10,291 | 10,359 | 10,643 |
| November - 18 | 10,303 | 10,389 | 10,707 |
| December - 18 | 10,381 | 10,470 | 10,903 |
| January - 19 | 10,437 | 10,511 | 11,019 |
| February - 19 | 10,450 | 10,528 | 11,013 |
| March - 19 | 10,550 | 10,597 | 11,224 |
| April - 19 | 10,566 | 10,621 | 11,227 |
| May - 19 | 10,603 | 10,696 | 11,426 |
| June - 19 | 10,681 | 10,755 | 11,570 |
| July - 19 | 10,677 | 10,751 | 11,595 |
| August - 19 | 10,756 | 10,836 | 11,896 |
| September - 19 | 10,729 | 10,831 | 11,833 |
| October - 19 | 10,787 | 10,867 | 11,868 |
| November - 19 | 10,781 | 10,868 | 11,862 |
| December - 19 | 10,798 | 10,893 | 11,854 |
| January - 20 | 10,878 | 10,954 | 12,082 |
| February - 20 | 10,957 | 11,043 | 12,299 |
| March - 20 | 10,782 | 11,088 | 12,227 |
| April - 20 | 10,968 | 11,148 | 12,444 |
| May - 20 | 11,068 | 11,169 | 12,502 |
| June - 20 | 11,104 | 11,185 | 12,581 |
| July - 20 | 11,162 | 11,202 | 12,769 |
| August - 20 | 11,154 | 11,204 | 12,666 |
| September - 20 | 11,147 | 11,203 | 12,659 |
| October - 20 | 11,118 | 11,202 | 12,602 |
| November - 20 | 11,154 | 11,213 | 12,726 |
| December - 20 | 11,166 | 11,228 | 12,744 |
| January - 21 | 11,157 | 11,232 | 12,652 |
| February - 21 | 11,104 | 11,225 | 12,470 |
| March - 21 | 11,072 | 11,220 | 12,314 |
| April - 21 | 11,104 | 11,229 | 12,411 |
| May - 21 | 11,137 | 11,242 | 12,452 |
| June - 21 | 11,120 | 11,225 | 12,539 |
| July - 21 | 11,152 | 11,245 | 12,679 |
| August - 21 | 11,139 | 11,245 | 12,655 |
| September - 21 | 11,104 | 11,236 | 12,546 |
| October - 21 | 11,069 | 11,199 | 12,542 |
| November - 21 | 11,056 | 11,190 | 12,579 |
| December - 21 | 11,043 | 11,173 | 12,547 |
| January - 22 | 10,943 | 11,093 | 12,277 |
| February - 22 | 10,885 | 11,043 | 12,140 |
| March - 22 | 10,764 | 10,893 | 11,803 |
| April - 22 | 10,665 | 10,832 | 11,355 |
| May - 22 | 10,720 | 10,899 | 11,428 |
| June - 22 | 10,644 | 10,823 | 11,249 |
| July - 22 | 10,743 | 10,881 | 11,523 |
| August - 22 | 10,645 | 10,794 | 11,198 |
| September - 22 | 10,504 | 10,661 | 10,714 |
| October - 22 | 10,495 | 10,647 | 10,575 |
| November - 22 | 10,597 | 10,735 | 10,964 |
| December - 22 | 10,616 | 10,757 | 10,915 |
| January - 23 | 10,697 | 10,844 | 11,251 |
| February - 23 | 10,623 | 10,763 | 10,960 |
| March - 23 | 10,753 | 10,919 | 11,238 |
| April - 23 | 10,790 | 10,957 | 11,306 |
| May - 23 | 10,765 | 10,924 | 11,183 |
| June - 23 | 10,760 | 10,880 | 11,143 |
| July - 23 | 10,801 | 10,926 | 11,135 |
| August - 23 | 10,818 | 10,967 | 11,064 |
| September - 23 | 10,814 | 10,960 | 10,783 |
| October - 23 | 10,834 | 10,995 | 10,613 |
| November - 23 | 10,945 | 11,123 | 11,094 |
| December - 23 | 11,036 | 11,257 | 11,518 |
| January - 24 | 11,083 | 11,301 | 11,487 |
| February - 24 | 11,062 | 11,262 | 11,324 |
| March - 24 | 11,108 | 11,308 | 11,429 |
| April - 24 | 11,087 | 11,270 | 11,140 |
| May - 24 | 11,159 | 11,352 | 11,329 |
Effective May 31, 2024, the Fund is adding a new performance benchmark, the Bloomberg US Aggregate Bond Index, which the investment adviser believes better reflects the Fund’s investment approach.
Annual Average Total Return
| 1 Year | 5 Year | 10 Year |
|---|
| Sextant Short-Term Bond | 3.66% | 1.03% | 1.10% |
| Bloomberg US Aggregate 1-3 Year Index | 3.92% | 1.20% | 1.27% |
| Bloomberg US Aggregate Bond Index | 1.31% | | 1.25% |
Please visit www.saturna.com/sextant/short-term-bond-fund for more recent performance information.
| SEXTANT SHORT-TERM BOND
Sextant Short-Term Bond Fund
Semi-Annual Shareholder Report - May 31, 2024
| Total Net Assets | $10,827,122 |
| # of Portfolio Holdings | 37 |
| Advisory Fees Paid | $27,275 |
| Portfolio Turnover Rate | 11% |
You may have consented to receive one shareholder report at your address if you and one or more individuals in your home have an account with the Fund (householding). If you wish to receive a copy of this document at a new address, contact 1-800-728-8762
What did the Fund invest in?
| United States Treasury Note (2.375% due 05/15/2027) | 5.6% |
| United States Cash Management Bill (-% due 08/8/2024) | 5.5% |
| United States Treasury Note (2.250% due 10/31/2024) | 5.5% |
| United States Treasury Bond (1.500% due 02/15/2025) | 5.4% |
| United States Treasury Note (2.625% due 12/31/2025) | 5.3% |
| Florida Power & Light (2.850% due 04/1/2025) | 3.8% |
| United States Treasury Note (2.875% due 04/30/2025) | 3.6% |
| Bank of America (3.500% due 04/19/2026) | 3.6% |
| United States Cash Management Bill (-% due 06/27/2024) | 3.2% |
| Edison International (3.550% due 11/15/2024) | 3.2% |
| |
| Government | 35.0% |
| Financials | 16.2% |
| Utilities | 11.2% |
| Consumer Staples | 8.9% |
| Communications | 7.1% |
| Technology | 5.6% |
| Consumer Discretionary | 5.5% |
| Materials | 2.8% |
| Industrials | 1.8% |
| Health Care | 1.4% |
| Other Assets (net of liabilities) | 4.5% |
| United States | 87.7% |
| United Kingdom | 3.7% |
| Netherlands | 3.2% |
| China | 0.9% |
If you wish to view additional information about the Fund, including but not limited to the Fund's prospectus, financial statements, holdings, or proxy voting information, please visit www.saturna.com/forms#mutual-fund-library .
1300 N. State Street
Bellingham, WA 98225
1-866-290-2688
Semi-Annual Shareholder Report - May 31, 2024
The objective of the Bond Fund is current income and capital preservation. This Semiannual Shareholder Report contains important information about the Sustainable Bond Fund for the period of December 1, 2023 to May 31, 2024. You can find additional information about the Fund at www.saturna.com/sustainable/bond-fund. You can also request this information by contacting us at 1-800-728-8762 or investorservices@saturna.com. The report describes changes to the Fund that occurred during the reporting period.
What were the Fund’s costs for the last 6 months?
(Based on a hypothetical $10,000 investment)
| Class Name | Cost of a $10,000 Investment | Cost Paid as a % of a $10,000 Investment |
|---|
| Sustainable Bond | $33.01 | 0.65% |
How did the Fund perform over the last six months?
The Saturna Sustainable Bond Fund returned 3.14% for the first six months of the fiscal year as of May 31, 2024. The FTSE World Broad Investment-Grade Bond Index returned 1.10% for the same period. The Fund’s outperformance relative the Index can be attributed to differences in duration and currency exposures. The Fund reported a 30-day yield of 4.76%.
The Sustainable Bond Fund portfolio held 42 securities as of May 31, 2024. The Fund’s effective duration decreased from 5.03 years as of May 31, 2023, to 2.80 years as of May 31, 2024. The FTSE WorldBIG Index reported an effective duration of 6.54 years. In an interest rate environment marked by higher volatility on securities with longer maturities, the Fund’s duration profile was decreased to emphasize ownership of high-quality issuers and reduce duration risk.
As of May 31, 2024, Saturna Sustainable Bond Fund held 57.44% of its assets in US dollar-denominated securities, followed by 9.25% in Mexican peso-denominated securities, and 9.16% in euro-denominated securities. The Fund retained a currency weighting of 6.84% to the Colombian peso, 6.58% to the Canadian dollar, 5.22% to the Brazilian real, 3.05% to the Australian dollar, and 0.71% to the British pound. In contrast, the FTSE WorldBIG Index had 53.29% of its portfolio in the US dollar, 28.50% in the euro, and 5.87% in Japanese yen. Relative to the US dollar, the Mexican peso appreciated 2.19% over the trailing six-month period.
How did the Fund perform since inception?
The Cumulative Performance chart reflects a hypothetical $10,000 investment in the class of shares noted. Past performance does not guarantee future results. The graph and table do not reflect the deduction of taxes that a shareholder would pay on Fund distributions or redemption of Fund shares.
March 31, 2015 through May 31, 2024 with initial investment of $10,000.
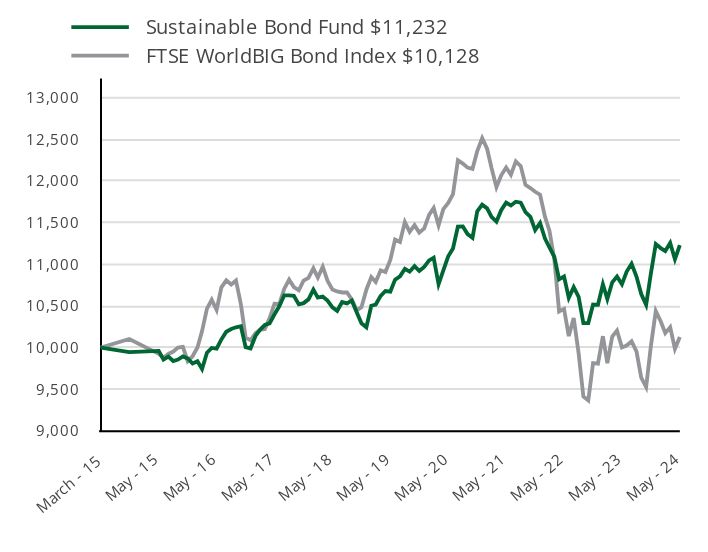
| Sustainable Bond Fund $11,232 | FTSE WorldBIG Bond Index $10,128 |
|---|
| March - 15 | 10,000 | 10,000 |
| April - 15 | 9,945 | 10,103 |
| May - 15 | 9,960 | 9,926 |
| June - 15 | 9,856 | 9,878 |
| July - 15 | 9,893 | 9,924 |
| August - 15 | 9,839 | 9,953 |
| September - 15 | 9,856 | 10,001 |
| October - 15 | 9,894 | 10,009 |
| November - 15 | 9,871 | 9,838 |
| December - 15 | 9,809 | 9,896 |
| January - 16 | 9,837 | 10,002 |
| February - 16 | 9,744 | 10,199 |
| March - 16 | 9,938 | 10,468 |
| April - 16 | 9,996 | 10,574 |
| May - 16 | 9,988 | 10,453 |
| June - 16 | 10,099 | 10,724 |
| July - 16 | 10,191 | 10,807 |
| August - 16 | 10,224 | 10,757 |
| September - 16 | 10,244 | 10,806 |
| October - 16 | 10,257 | 10,521 |
| November - 16 | 10,006 | 10,122 |
| December - 16 | 9,990 | 10,088 |
| January - 17 | 10,140 | 10,173 |
| February - 17 | 10,214 | 10,212 |
| March - 17 | 10,271 | 10,223 |
| April - 17 | 10,291 | 10,355 |
| May - 17 | 10,400 | 10,527 |
| June - 17 | 10,496 | 10,524 |
| July - 17 | 10,628 | 10,704 |
| August - 17 | 10,628 | 10,816 |
| September - 17 | 10,621 | 10,727 |
| October - 17 | 10,519 | 10,688 |
| November - 17 | 10,534 | 10,804 |
| December - 17 | 10,579 | 10,838 |
| January - 18 | 10,696 | 10,952 |
| February - 18 | 10,600 | 10,842 |
| March - 18 | 10,614 | 10,971 |
| April - 18 | 10,565 | 10,804 |
| May - 18 | 10,484 | 10,699 |
| June - 18 | 10,442 | 10,674 |
| July - 18 | 10,547 | 10,662 |
| August - 18 | 10,531 | 10,663 |
| September - 18 | 10,566 | 10,578 |
| October - 18 | 10,425 | 10,449 |
| November - 18 | 10,293 | 10,485 |
| December - 18 | 10,244 | 10,695 |
| January - 19 | 10,503 | 10,847 |
| February - 19 | 10,517 | 10,788 |
| March - 19 | 10,621 | 10,928 |
| April - 19 | 10,680 | 10,907 |
| May - 19 | 10,673 | 11,053 |
| June - 19 | 10,816 | 11,298 |
| July - 19 | 10,856 | 11,268 |
| August - 19 | 10,946 | 11,508 |
| September - 19 | 10,912 | 11,390 |
| October - 19 | 10,978 | 11,470 |
| November - 19 | 10,920 | 11,381 |
| December - 19 | 10,969 | 11,431 |
| January - 20 | 11,047 | 11,594 |
| February - 20 | 11,079 | 11,676 |
| March - 20 | 10,760 | 11,468 |
| April - 20 | 10,927 | 11,662 |
| May - 20 | 11,097 | 11,737 |
| June - 20 | 11,191 | 11,844 |
| July - 20 | 11,452 | 12,250 |
| August - 20 | 11,455 | 12,210 |
| September - 20 | 11,363 | 12,161 |
| October - 20 | 11,319 | 12,145 |
| November - 20 | 11,637 | 12,361 |
| December - 20 | 11,717 | 12,514 |
| January - 21 | 11,672 | 12,388 |
| February - 21 | 11,570 | 12,157 |
| March - 21 | 11,513 | 11,926 |
| April - 21 | 11,650 | 12,069 |
| May - 21 | 11,741 | 12,163 |
| June - 21 | 11,707 | 12,075 |
| July - 21 | 11,752 | 12,236 |
| August - 21 | 11,741 | 12,179 |
| September - 21 | 11,627 | 11,954 |
| October - 21 | 11,570 | 11,916 |
| November - 21 | 11,411 | 11,871 |
| December - 21 | 11,496 | 11,836 |
| January - 22 | 11,309 | 11,570 |
| February - 22 | 11,204 | 11,405 |
| March - 22 | 11,088 | 11,059 |
| April - 22 | 10,820 | 10,434 |
| May - 22 | 10,855 | 10,465 |
| June - 22 | 10,598 | 10,138 |
| July - 22 | 10,726 | 10,356 |
| August - 22 | 10,610 | 9,932 |
| September - 22 | 10,295 | 9,412 |
| October - 22 | 10,295 | 9,367 |
| November - 22 | 10,517 | 9,815 |
| December - 22 | 10,514 | 9,808 |
| January - 23 | 10,760 | 10,137 |
| February - 23 | 10,584 | 9,813 |
| March - 23 | 10,784 | 10,134 |
| April - 23 | 10,854 | 10,205 |
| May - 23 | 10,760 | 10,002 |
| June - 23 | 10,913 | 10,025 |
| July - 23 | 11,007 | 10,075 |
| August - 23 | 10,854 | 9,954 |
| September - 23 | 10,643 | 9,641 |
| October - 23 | 10,514 | 9,526 |
| November - 23 | 10,889 | 10,018 |
| December - 23 | 11,244 | 10,439 |
| January - 24 | 11,195 | 10,316 |
| February - 24 | 11,159 | 10,174 |
| March - 24 | 11,256 | 10,245 |
| April - 24 | 11,061 | 9,986 |
| May - 24 | 11,232 | 10,128 |
Annual Average Total Return
| 1 Year | 5 Year | Since Inception |
|---|
| Sustainable Bond | 4.38% | 1.03% | 1.27% |
| FTSE WorldBIG Bond Index | 1.26% | | 0.10% |
Please visit www.saturna.com/sustainable/bond-fund for more recent performance information.
Semi-Annual Shareholder Report - May 31, 2024
| Total Net Assets | $33,343,240 |
| # of Portfolio Holdings | 42 |
| Advisory Fees Paid | $86,593 |
| Portfolio Turnover Rate | 7% |
You may have consented to receive one shareholder report at your address if you and one or more individuals in your home have an account with the Fund (householding). If you wish to receive a copy of this document at a new address, contact 1-800-728-8762
What did the Fund invest in?
| Int'l Bk Recon & Develop (4.250% due 01/22/2026) | 4.8% |
| Canadian Imperial Bank (4.375% due 10/28/2080) | 4.5% |
| United Utilities (6.875% due 08/15/2028) | 4.4% |
| Inter-American Devel BK (7.500% due 12/5/2024) | 4.3% |
| Int'l Bk Recon & Develop (5.000% due 10/7/2026) | 4.2% |
| Asian Development Bank (6.000% due 02/5/2026) | 4.0% |
| New York City NY Hsg Dev Corp (3.300% due 05/1/2062) | 3.7% |
| First Abu Dhabi Bank PJSC (5.125% due 10/13/2027) | 3.7% |
| MAF Global Securities (7.875% due PERP) | 3.7% |
| AXA (5.125% due 01/17/2027) | 3.7% |
| |
| United States | 25.0% |
| Germany | 12.6% |
| United Arab Emirates | 9.7% |
| United Kingdom | 7.3% |
| Canada | 6.6% |
| Netherlands | 5.6% |
| Finland | 4.8% |
| Philippines | 4.0% |
| France | 3.7% |
| Australia | 3.1% |
| Government | 29.7% |
| Financials | 26.6% |
| Real Estate | 9.4% |
| Technology | 5.9% |
| Utilities | 4.4% |
| Health Care | 4.3% |
| Consumer Discretionary | 3.4% |
| Consumer Staples | 2.8% |
| Communications | 2.6% |
| Industrials | 1.8% |
| Other Sectors | 1.6% |
| Other Assets (net of liabilities) | 7.5% |
If you wish to view additional information about the Fund, including but not limited to the Fund's prospectus, financial statements, holdings, or proxy voting information, please visit www.saturna.com/forms#mutual-fund-library .
1300 N. State Street
Bellingham, WA 98225
1-866-290-2688
Semi-Annual Shareholder Report - May 31, 2024
The objective of the Equity Fund is capital appreciation. This Semiannual Shareholder Report contains important information about the Sustainable Equity Fund for the period of December 1, 2023 to May 31, 2024. You can find additional information about the Fund at www.saturna.com/sustainable/equity-fund. You can also request this information by contacting us at 1-800-728-8762 or investorservices@saturna.com. The report describes changes to the Fund that occurred during the reporting period.
What were the Fund’s costs for the last 6 months?
(Based on a hypothetical $10,000 investment)
| Class Name | Cost of a $10,000 Investment | Cost Paid as a % of a $10,000 Investment |
|---|
| Sustainable Equity | $40.01 | 0.75% |
How did the Fund perform over the last six months?
For the six-month period ended May 31, 2024, the Saturna Sustainable Equity Fund rose 13.37%. The S&P Global 1200 Index gained 15.28% over the period, while the Morningstar Global Large-Stock Blend category trailed at 13.20%. Relative to these two non-ESG benchmarks, the absence of oil and gas investments, and cash drag accounted for most of the performance gap.
The artificial intelligence (AI) frenzy launched by Nvidia’s May 2023 results has continued. Indications of declining inflation and imminent rate cuts that buoyed a wider cross-section of the market in late 2023, gave way to persistent inflation and the delaying of interest rate reductions. Several of the mega-cap Technology stocks that accounted for most of the index gains continued to drive index performance through the first half of the fiscal year. Nvidia remains the leader, having appreciated over 130% over the trailing six-month period. The result has been continued outperformance of the market-cap weight S&P 500 Index versus the equal-weighted S&P 500 Index.
Nvidia was the best performing stock and a top contributor to the Saturna Sustainable Equity Fund for the past six months, followed by Taiwan Semiconductor, Eli Lilly, and Novo Nordisk. The latter three have all been significant contributors over the past few years, which we believe will continue. As the world’s premier semiconductor foundry, Taiwan Semiconductor makes the chips that Nvidia sells to power the AI revolution. Lilly and Novo Nordisk continue to struggle to meet demand for their weight loss drugs Wegovy and Mounjaro. Wegovy may have added cardiovascular benefits, while Mounjaro may help with sleep apnea. We may see additional indications in future. Lululemon, a strong performer in the previous financial year, declined the most among our holdings in the first six months as new competitors and cautious consumers weighed on growth.
With a presidential election approaching, we refrain from opining on the outlook over the coming year. The two candidates have widely divergent opinions on a host of issues including taxation, tariffs, immigration, fossil fuels, alternative energy and others. Adding to the uncertainty has been economic resilience in terms of jobs and wages defying the inverted yield curve prognostications of recession, while consumers remain scarred from the pandemic-engendered period of high inflation.
How did the Fund perform since inception?
The Cumulative Performance chart reflects a hypothetical $10,000 investment in the class of shares noted. Past performance does not guarantee future results. The graph and table do not reflect the deduction of taxes that a shareholder would pay on Fund distributions or redemption of Fund shares.
March 31, 2015 through May 31, 2024 with initial investment of $10,000.
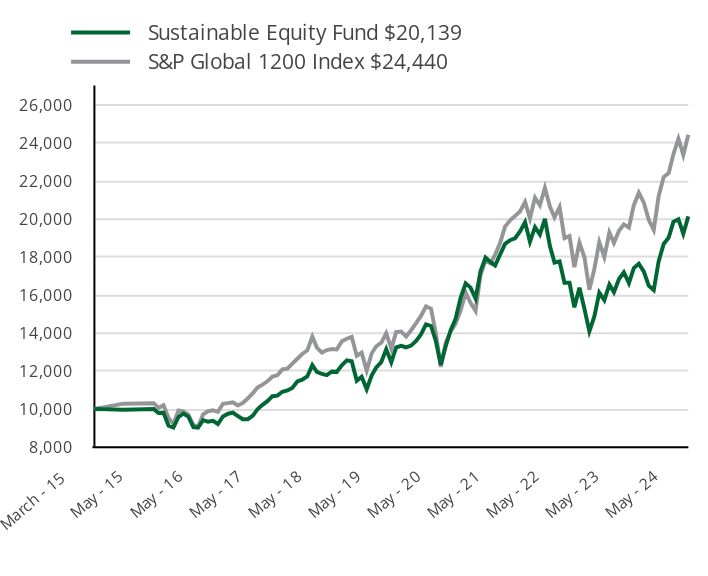
| Sustainable Equity Fund $20,139 | S&P Global 1200 Index $24,440 |
|---|
| March - 15 | 10,000 | 10,000 |
| April - 15 | 9,960 | 10,279 |
| May - 15 | 10,000 | 10,304 |
| June - 15 | 9,790 | 10,060 |
| July - 15 | 9,800 | 10,196 |
| August - 15 | 9,118 | 9,531 |
| September - 15 | 9,018 | 9,193 |
| October - 15 | 9,579 | 9,925 |
| November - 15 | 9,759 | 9,874 |
| December - 15 | 9,599 | 9,703 |
| January - 16 | 9,047 | 9,146 |
| February - 16 | 9,017 | 9,082 |
| March - 16 | 9,408 | 9,720 |
| April - 16 | 9,328 | 9,881 |
| May - 16 | 9,378 | 9,927 |
| June - 16 | 9,208 | 9,852 |
| July - 16 | 9,609 | 10,273 |
| August - 16 | 9,749 | 10,308 |
| September - 16 | 9,810 | 10,351 |
| October - 16 | 9,629 | 10,186 |
| November - 16 | 9,459 | 10,320 |
| December - 16 | 9,462 | 10,566 |
| January - 17 | 9,654 | 10,836 |
| February - 17 | 9,987 | 11,130 |
| March - 17 | 10,219 | 11,284 |
| April - 17 | 10,410 | 11,455 |
| May - 17 | 10,673 | 11,706 |
| June - 17 | 10,703 | 11,770 |
| July - 17 | 10,905 | 12,084 |
| August - 17 | 10,975 | 12,121 |
| September - 17 | 11,106 | 12,384 |
| October - 17 | 11,449 | 12,643 |
| November - 17 | 11,540 | 12,895 |
| December - 17 | 11,711 | 13,085 |
| January - 18 | 12,310 | 13,805 |
| February - 18 | 11,955 | 13,231 |
| March - 18 | 11,843 | 12,964 |
| April - 18 | 11,782 | 13,104 |
| May - 18 | 11,975 | 13,154 |
| June - 18 | 11,955 | 13,131 |
| July - 18 | 12,300 | 13,559 |
| August - 18 | 12,564 | 13,696 |
| September - 18 | 12,514 | 13,797 |
| October - 18 | 11,487 | 12,795 |
| November - 18 | 11,700 | 12,962 |
| December - 18 | 11,036 | 12,016 |
| January - 19 | 11,775 | 12,935 |
| February - 19 | 12,185 | 13,301 |
| March - 19 | 12,472 | 13,491 |
| April - 19 | 13,149 | 13,985 |
| May - 19 | 12,452 | 13,179 |
| June - 19 | 13,241 | 14,045 |
| July - 19 | 13,323 | 14,079 |
| August - 19 | 13,241 | 13,817 |
| September - 19 | 13,334 | 14,146 |
| October - 19 | 13,580 | 14,521 |
| November - 19 | 13,929 | 14,902 |
| December - 19 | 14,452 | 15,407 |
| January - 20 | 14,369 | 15,273 |
| February - 20 | 13,596 | 14,022 |
| March - 20 | 12,329 | 12,215 |
| April - 20 | 13,287 | 13,478 |
| May - 20 | 14,153 | 14,084 |
| June - 20 | 14,741 | 14,491 |
| July - 20 | 15,854 | 15,173 |
| August - 20 | 16,617 | 16,131 |
| September - 20 | 16,390 | 15,593 |
| October - 20 | 15,813 | 15,165 |
| November - 20 | 17,235 | 17,046 |
| December - 20 | 17,977 | 17,808 |
| January - 21 | 17,729 | 17,669 |
| February - 21 | 17,553 | 18,122 |
| March - 21 | 18,142 | 18,750 |
| April - 21 | 18,691 | 19,600 |
| May - 21 | 18,887 | 19,932 |
| June - 21 | 18,980 | 20,161 |
| July - 21 | 19,353 | 20,400 |
| August - 21 | 19,839 | 20,902 |
| September - 21 | 18,804 | 20,031 |
| October - 21 | 19,570 | 21,128 |
| November - 21 | 19,187 | 20,726 |
| December - 21 | 20,007 | 21,645 |
| January - 22 | 18,560 | 20,643 |
| February - 22 | 17,706 | 20,093 |
| March - 22 | 17,769 | 20,625 |
| April - 22 | 16,645 | 18,993 |
| May - 22 | 16,645 | 19,104 |
| June - 22 | 15,354 | 17,468 |
| July - 22 | 16,384 | 18,757 |
| August - 22 | 15,260 | 17,974 |
| September - 22 | 14,084 | 16,280 |
| October - 22 | 14,885 | 17,386 |
| November - 22 | 16,124 | 18,782 |
| December - 22 | 15,727 | 18,002 |
| January - 23 | 16,557 | 19,293 |
| February - 23 | 16,147 | 18,746 |
| March - 23 | 16,840 | 19,387 |
| April - 23 | 17,198 | 19,721 |
| May - 23 | 16,630 | 19,553 |
| June - 23 | 17,418 | 20,717 |
| July - 23 | 17,649 | 21,385 |
| August - 23 | 17,229 | 20,863 |
| September - 23 | 16,494 | 19,959 |
| October - 23 | 16,252 | 19,423 |
| November - 23 | 17,765 | 21,201 |
| December - 23 | 18,686 | 22,212 |
| January - 24 | 19,025 | 22,417 |
| February - 24 | 19,853 | 23,410 |
| March - 24 | 19,991 | 24,227 |
| April - 24 | 19,227 | 23,370 |
| May - 24 | 20,139 | 24,440 |
Annual Average Total Return
| 1 Year | 5 Year | Since Inception |
|---|
| Sustainable Equity | 21.10% | 10.09% | 7.90% |
| S&P Global 1200 Index | 24.99% | 13.13% | 10.20% |
Please visit www.saturna.com/sustainable/equity-fund for more recent performance information.
Semi-Annual Shareholder Report - May 31, 2024
| Total Net Assets | $24,587,651 |
| # of Portfolio Holdings | 48 |
| Advisory Fees Paid | $75,568 |
| Portfolio Turnover Rate | 6% |
You may have consented to receive one shareholder report at your address if you and one or more individuals in your home have an account with the Fund (householding). If you wish to receive a copy of this document at a new address, contact 1-800-728-8762
What did the Fund invest in?
| Novo Nordisk ADR | 5.6% |
| NVIDIA | 4.4% |
| United States Cash Management Bill (-% due 06/27/2024) | 3.7% |
| Schneider Electric ADR | 3.5% |
| Taiwan Semiconductor ADR | 3.3% |
| Wolters Kluwer | 3.3% |
| Nintendo ADR | 3.1% |
| Eli Lilly | 3.0% |
| Tractor Supply | 2.9% |
| Legrand | 2.7% |
| |
| United States | 39.3% |
| France | 11.4% |
| Switzerland | 8.8% |
| United Kingdom | 6.7% |
| Japan | 6.5% |
| Denmark | 5.6% |
| Netherlands | 5.5% |
| Taiwan | 3.3% |
| Sweden | 2.6% |
| Canada | 2.4% |
| Large Pharma | 13.4% |
| Semiconductor Devices | 8.1% |
| IT Services | 7.5% |
| Home Products Stores | 7.1% |
| U S Government | 6.3% |
| Personal Care Products | 6.2% |
| Electrical Power Equipment | 5.6% |
| Commercial & Residential Building Equipment & Systems | 5.3% |
| Consumer Electronics | 4.5% |
| Infrastructure Software | 4.2% |
| Other Industries | 28.1% |
| Other Assets (net of liabilities) | 3.7% |
If you wish to view additional information about the Fund, including but not limited to the Fund's prospectus, financial statements, holdings, or proxy voting information, please visit www.saturna.com/forms#mutual-fund-library .
1300 N. State Street
Bellingham, WA 98225
1-866-290-2688
Item 2. Code of Ethics
Registrant has adopted a code of ethics that applies to the registrant’s principal executive officer and principal financial officer or persons performing similar functions, which is included with this submission as Exhibit (a)(1) and posted on the Registrant’s website at https://www.saturna.com/code-ethics. Requests may also be made via telephone at 1-800-728-8762, and will be processed within one business day of receiving such request.
Item 3. Audit Committee Financial Expert
Not applicable.
Item 4. Principal Accountant Fees and Services
Not applicable.
Item 5. Audit Committee of Listed Registrants
Not applicable.
Item 6. Investments
(a) The Schedule of Investments is fully answered in Item 1.
Item 7. Financial Statements and Financial Highlights for Open-End Management Investment Companies.
Sextant
Short-Term
Bond
Fund
4
Schedule
of
Investments
4
Statement
of
Assets
and
Liabilities
and
Statement
of
Operations
6
Statements
of
Changes
in
Net
Assets
7
Financial
Highlights
8
Sextant
Bond
Income
Fund
9
Schedule
of
Investments
9
Statement
of
Assets
and
Liabilities
and
Statement
of
Operations
11
Statements
of
Changes
in
Net
Assets
12
Financial
Highlights
13
Sextant
Core
Fund
14
Schedule
of
Investments
14
Statement
of
Assets
and
Liabilities
and
Statement
of
Operations
18
Statements
of
Changes
in
Net
Assets
19
Financial
Highlights
20
Sextant
Global
High
Income
Fund
21
Schedule
of
Investments
21
Statement
of
Assets
and
Liabilities
and
Statement
of
Operations
23
Statements
of
Changes
in
Net
Assets
24
Financial
Highlights
25
Sextant
Growth
Fund
26
Schedule
of
Investments
26
Statement
of
Assets
and
Liabilities
and
Statement
of
Operations
28
Statements
of
Changes
in
Net
Assets
29
Financial
Highlights
30
Sextant
International
Fund
31
Schedule
of
Investments
31
Statement
of
Assets
and
Liabilities
and
Statement
of
Operations
33
Statements
of
Changes
in
Net
Assets
34
Financial
Highlights
35
Notes
To
Financial
Statements
36
Note
1
–
Organization
36
Note
2
–
Unaudited
Information
37
Note
4
–
Transactions
with
Affiliated
Persons
40
Note
5
–
Distributions
to
Shareowners
41
Note
6
–
Federal
Income
Taxes
41
Note
7
–
Investments
42
Note
8
–
Custodian
42
Note
9
–
Subsequent
Events
42
Summary
Information
43
Sextant
Short-Term
Bond
Fund
The
accompanying
notes
are
an
integral
part
of
these
financial
statements.
Corporate
Bonds
-
56
.8
%
Coupon
/
Maturity
Face
Amount
Market
Value
Percentage
of
Net
Assets
Communications
Koninklijke
KPN
8.375%
due
10/01/2030
$
300,000
$
343,938
3.2%
Take-Two
Interactive
Software
3.700%
due
04/14/2027
350,000
335,308
3.1%
Verizon
Communication
4.016%
due
12/03/2029
100,000
94,256
0.8%
773,502
7.1%
Consumer
Discretionary
AutoZone
3.250%
due
04/15/2025
300,000
293,976
2.7%
Lowe's
3.125%
due
09/15/2024
100,000
99,266
0.9%
O'Reilly
Automotive
3.600%
due
09/01/2027
150,000
142,512
1.3%
VF
2.400%
due
04/23/2025
67,000
64,869
0.6%
600,623
5.5%
Consumer
Staples
Dollar
General
4.150%
due
11/01/2025
250,000
244,945
2.3%
Kroger
7.700%
due
06/01/2029
100,000
109,866
1.0%
Procter
&
Gamble
2.800%
due
03/25/2027
300,000
284,230
2.6%
Walmart
2.850%
due
07/08/2024
325,000
324,150
3.0%
963,191
8.9%
Financials
Bank
of
America
3.500%
due
04/19/2026
400,000
387,446
3.6%
JPMorgan
Chase
3.300%
due
04/01/2026
350,000
338,233
3.1%
PayPal
Holdings
2.650%
due
10/01/2026
300,000
283,095
2.6%
Visa
3.150%
due
12/14/2025
350,000
339,729
3.2%
1,348,503
12.5%
Health
Care
Biogen
4.050%
due
09/15/2025
100,000
98,136
0.9%
Johnson
&
Johnson
2.450%
due
03/01/2026
50,000
47,860
0.5%
145,996
1.4%
Industrials
Ferguson
Finance
4.250%
due
04/20/2027
200,000
193,401
1.8%
Materials
DuPont
De
Nemours
4.493%
due
11/15/2025
308,000
303,944
2.8%
Technology
Microsoft
3.300%
due
02/06/2027
100,000
96,167
0.9%
NXP
BV/NXP
Funding
5.350%
due
03/01/2026
100,000
99,636
0.9%
Oracle
2.950%
due
05/15/2025
325,000
316,801
2.9%
Qualcomm
3.250%
due
05/20/2027
100,000
95,657
0.9%
608,261
5.6%
Utilities
Edison
International
3.550%
due
11/15/2024
350,000
346,394
3.2%
Exelon
Generation
3.250%
due
06/01/2025
250,000
244,254
2.3%
Florida
Power
&
Light
2.850%
due
04/01/2025
420,000
411,495
3.8%
United
Utilities
6.875%
due
08/15/2028
200,000
210,358
1.9%
1,212,501
11.2%
Total
Corporate
Bonds
(Cost
$6,324,417)
$
6,149,922
56.8%
Government
Bonds
-
38
.7
%
Coupon
/
Maturity
Face
Amount
Market
Value
Percentage
of
Net
Assets
Financials
Federal
Home
Loan
Bank
5.450%
due
01/08/2025
250,000
249,586
2.3%
Sextant
Short-Term
Bond
Fund
The
accompanying
notes
are
an
integral
part
of
these
financial
statements.
Government
Bonds
-
38.7%
Coupon
/
Maturity
Face
Amount
Market
Value
Percentage
of
Net
Assets
Financials
(continued)
Federal
Home
Loan
Bank
5.650%
due
12/28/2026
$
150,000
$
149,587
1.4%
399,173
3.7%
Government
United
States
Cash
Management
Bill
–%
due
06/27/2024
350,000
348,773
3.2%
United
States
Cash
Management
Bill
–%
due
08/08/2024
600,000
594,221
5.5%
United
States
Treasury
Bond
1.500%
due
02/15/2025
600,000
584,349
5.4%
United
States
Treasury
Note
2.875%
due
04/30/2025
400,000
391,723
3.6%
United
States
Treasury
Note
2.375%
due
05/15/2027
650,000
608,715
5.6%
United
States
Treasury
Note
2.250%
due
08/15/2027
100,000
92,848
0.9%
United
States
Treasury
Note
2.250%
due
10/31/2024
600,000
592,430
5.5%
United
States
Treasury
Note
2.625%
due
12/31/2025
600,000
578,320
5.3%
3,791,379
35.0%
Total
Government
Bonds
(Cost
$4,268,814)
$
4,190,552
38.7%
Total
investments
(Cost
$10,593,231)
$
10,340,474
95.5%
Other
assets
(net
of
liabilities)
486,648
4.5%
Total
net
assets
$
10,827,122
100.0%
Sextant
Short-Term
Bond
Fund
The
accompanying
notes
are
an
integral
part
of
these
financial
statements.
Statement
of
Assets
and
Liabilities
Statement
of
Operations
As
of
May
31,
2024
Assets
Investments
in
securities,
at
value
(Cost
$10,593,231)
$
10,340,474
Cash
416,257
Interest
receivable
70,577
Prepaid
expenses
7,393
Receivable
for
Fund
shares
sold
228
Total
assets
10,834,929
Liabilities
Accrued
audit
expenses
2,333
Accrued
retirement
plan
custody
fee
1,184
Accrued
trustee
expenses
1,167
Accrued
legal
expenses
384
Accrued
Chief
Compliance
Officer
expenses
369
Accrued
advisory
fees
319
Distributions
payable
73
Payable
for
Fund
shares
redeemed
42
Accrued
other
operating
expenses
354
Accrued
printing
fees
1,582
Total
liabilities
7,807
Net
assets
$10,827,122
Analysis
of
net
assets
Paid-in
capital
(unlimited
shares
authorized,
without
par
value)
$11,220,421
Total
distributable
earnings
(393,299)
Net
assets
applicable
to
Fund
shares
outstanding
$10,827,122
Fund
shares
outstanding
2,216,124
Net
asset
value,
offering,
and
redemption
price
per
share
$4.89
Period
ended
May
31,
2024
Investment
income
Interest
income
$
177,067
Total
investment
income
177,067
Expenses
Investment
advisory
fees
27,275
Filing
and
registration
fees
10,167
Audit
fees
3,537
Chief
Compliance
Officer
expenses
2,000
Trustee
fees
1,930
Legal
fees
1,675
Retirement
plan
custodial
fees
1,306
Custodian
fees
221
Other
operating
expenses
1,065
Total
gross
expenses
49,176
Less
adviser
fees
waived
(16,225)
Less
custodian
fee
credits
(221)
Net
expenses
32,730
Net
investment
income
$144,337
Net
de
crease
in
unrealized
depreciation
on
investments
60,020
Net
gain
on
investments
60,020
Net
increase
in
net
assets
resulting
from
operations
$204,357
Sextant
Short-Term
Bond
Fund
The
accompanying
notes
are
an
integral
part
of
these
financial
statements.
Statements
of
Changes
in
Net
Assets
Period
ended
May
31,
2024
Year
ended
November
30,
2023
Decrease
in
net
assets
from
operations
From
operations
Net
investment
income
$144,337
$218,039
Net
realized
loss
on
investments
–
(48,629)
Net
decrease
in
unrealized
de
preciation
on
investments
60,020
205,877
Net
increase
in
net
assets
204,357
375,287
Distributions
to
shareowners
from
Net
dividend
and
distribution
to
shareholders
(144,338)
(221,971)
Capital
share
transactions
Proceeds
from
the
sale
of
shares
411,478
1,538,887
Value
of
shares
issued
in
reinvestment
of
dividends
and
distributions
143,593
220,156
Cost
of
shares
redeemed
(621,451)
(3,388,310)
Total
capital
shares
transactions
(66,380)
(1,629,267)
Total
decrease
in
net
assets
(6,361)
(1,475,951)
Net
assets
Beginning
of
period
10,833,483
12,309,434
End
of
period
$10,827,122
$10,833,483
Shares
of
the
Fund
sold
and
redeemed
Sextant
Short-Term
Bond
(STBFX)
Number
of
shares
sold
84,227
319,707
Number
of
shares
issued
in
reinvestment
of
dividends
and
distributions
29,384
45,613
Number
of
shares
redeemed
(127,338)
(701,000)
Net
decrease
in
number
of
shares
outstanding
(13,727)
(335,680)
–
–
Sextant
Short-Term
Bond
Fund:
Financial
Highlights
The
accompanying
notes
are
an
integral
part
of
these
financial
statements.
tin
Sextant
Short-Term
Bond
(STBFX)
Selected
data
per
share
of
outstanding
capital
stock
throughout
each
period:
Period
ended
May
31,
2024
Year
ended
November
30,
2023
2022
2021
2020
2019
A
A
A
A
A
A
A
Net
asset
value
at
beginning
of
period
$4.86
$4.80
$5.07
$5.17
$5.08
$4.94
Income
from
investment
operations
Net
investment
income
0.06
0.09
0.06
0.06
0.08
0.09
Net
gains
(losses)
on
securities
(both
realized
and
unrealized)
0.03
0.07
(0.27)
(0.10)
0.09
0.14
Total
from
investment
operations
0.09
0.16
(0.21)
(0.04)
0.17
0.23
Less
distributions
Dividends
(from
net
investment
income)
(0.06)
(0.10)
(0.06)
(0.06)
(0.08)
(0.09)
Total
distributions
(0.06)
(0.10)
(0.06)
(0.06)
(0.08)
(0.09)
Net
asset
value
at
end
of
period
$4.89
$4.86
$4.80
$5.07
$5.17
$5.08
Total
Return
A
1.96%
3.28%
(4.15)%
(0.88)%
3.46%
4.64%
Ratios
/
supplemental
data
Net
assets
($000),
end
of
period
$10,827
$10,833
$12,309
$11,920
$11,426
$11,089
Ratio
of
expenses
to
average
net
assets
Before
custodian
fee
credits
B
0.90%
0.90%
0.88%
0.66%
0.90%
0.87%
After
advisory
fees
waiver
B
0.61%
0.60%
0.60%
0.59%
0.60%
0.61%
After custodian
fee
credits
B
0.60%
0.60%
0.60%
0.59%
0.60%
0.60%
Ratio
of
net
investment
income
after
custodian
fee
credits to
average
net
assets
B
2.65%
1.95%
1.23%
1.07%
1.64%
1.75%
Portfolio
turnover
rate
A
11%
24%
41%
29%
36%
32%
A
Not
annualized
for
period
of
less
than
one
year
B
Annualized
for
periods
of
less
than
one
year
The
accompanying
notes
are
an
integral
part
of
these
financial
statements.
Corporate
Bonds
-
65
.4
%
Coupon
/
Maturity
Face
Amount
Market
Value
Percentage
of
Net
Assets
Communications
Bellsouth
6.875%
due
10/15/2031
$
200,000
$
209,243
2.1%
Koninklijke
KPN
8.375%
due
10/01/2030
200,000
229,292
2.3%
438,535
4.4%
Consumer
Discretionary
Home
Depot
5.875%
due
12/16/2036
300,000
314,637
3.1%
Lowe's
5.800%
due
10/15/2036
250,000
256,105
2.6%
570,742
5.7%
Consumer
Staples
Kimberly
Clark
5.300%
due
03/01/2041
100,000
98,318
1.0%
Procter
&
Gamble
5.500%
due
02/01/2034
200,000
208,148
2.1%
Unilever
Capital
5.900%
due
11/15/2032
200,000
211,545
2.1%
518,011
5.2%
Energy
Baker
Hughes
6.875%
due
01/15/2029
100,000
105,676
1.1%
Canadian
Natural
Resources
6.450%
due
06/30/2033
225,000
237,213
2.4%
Statoil
7.150%
due
01/15/2029
224,000
241,973
2.4%
584,862
5.9%
Financials
Affiliated
Managers
Group
3.500%
due
08/01/2025
250,000
243,771
2.4%
Bank
Of
New
York
Mellon
MTN
3.300%
due
08/23/2029
250,000
227,705
2.3%
Chubb
Ina
Holdings
4.350%
due
11/03/2045
100,000
85,941
0.8%
State
Street
(Quarterly
US
LIBOR
plus
100)
1
6.552%
due
06/15/2047
150,000
129,029
1.3%
UBS
AG
Stamford
CT
7.750%
due
09/01/2026
200,000
207,195
2.1%
893,641
8.9%
Health
Care
Becton
Dickinson
6.700%
due
08/01/2028
240,000
245,074
2.5%
Johnson
&
Johnson
4.950%
due
05/15/2033
226,000
229,348
2.3%
Johnson
&
Johnson
5.850%
due
07/15/2038
50,000
53,735
0.5%
Medtronic
4.375%
due
03/15/2035
260,000
242,401
2.4%
Merck
6.500%
due
12/01/2033
215,000
237,113
2.4%
1,007,671
10.1%
Industrials
Burlington
Northern
Santa
Fe
5.050%
due
03/01/2041
310,000
293,232
2.9%
Deere
8.100%
due
05/15/2030
95,000
109,782
1.1%
United
Technologies
6.050%
due
06/01/2036
250,000
258,114
2.6%
661,128
6.6%
Materials
Praxair
3.550%
due
11/07/2042
350,000
276,787
2.8%
Technology
Apple
4.500%
due
02/23/2036
350,000
339,540
3.4%
Intel
4.000%
due
12/15/2032
360,000
328,608
3.3%
Microsoft
5.300%
due
02/08/2041
50,000
52,677
0.5%
Microsoft
4.200%
due
11/03/2035
350,000
332,473
3.4%
1,053,298
10.6%
Utilities
Alabama
Power
4.150%
due
08/15/2044
200,000
163,698
1.6%
Florida
Power
&
Light
5.950%
due
10/01/2033
100,000
104,701
1.1%
The
accompanying
notes
are
an
integral
part
of
these
financial
statements.
Corporate
Bonds
-
65.4%
Coupon
/
Maturity
Face
Amount
Market
Value
Percentage
of
Net
Assets
Utilities
(continued)
Puget
Sound
Energy
4.434%
due
11/15/2041
$
300,000
$
250,049
2.5%
518,448
5.2%
Total
Corporate
Bonds
(Cost
$7,455,755)
$
6,523,123
65.4%
Government
Bonds
-
27
.2
%
Coupon
/
Maturity
Face
Amount
Market
Value
Percentage
of
Net
Assets
Government
United
States
Treasury
Bond
5.250%
due
02/15/2029
170,000
175,233
1.8%
United
States
Treasury
Bond
5.375%
due
02/15/2031
400,000
421,781
4.2%
United
States
Treasury
Bond
6.250%
due
05/15/2030
75,000
81,647
0.8%
United
States
Treasury
Bond
4.250%
due
05/15/2039
770,000
741,907
7.4%
United
States
Treasury
Bond
6.125%
due
08/15/2029
225,000
241,374
2.4%
United
States
Treasury
Bond
3.125%
due
11/15/2041
145,000
117,620
1.2%
United
States
Treasury
Bond
3.375%
due
11/15/2048
560,000
447,803
4.5%
United
States
Treasury
Note
2.875%
due
05/15/2052
400,000
287,656
2.9%
United
States
Treasury
Note
2.250%
due
10/31/2024
200,000
197,477
2.0%
Total
Government
Bonds
(Cost
$3,402,147)
$
2,712,498
27.2%
Total
investments
(Cost
$10,857,902)
$
9,235,621
92.6%
Other
assets
(net
of
liabilities)
738,433
7.4%
Total
net
assets
$
9,974,054
100.0%
1
Variable
rate
security.
The
interest
rate
represents
the
rate
in
effect
at
May
31,
2024
and
resets
periodically
based
on
the
parenthetically
disclosed
reference
rate
and
spread.
LIBOR:
London
Interbank
Offered
Rates
MTN:
Medium
Term
Note
The
accompanying
notes
are
an
integral
part
of
these
financial
statements.
Statement
of
Assets
and
Liabilities
Statement
of
Operations
As
of
May
31,
2024
Assets
Investments
in
securities,
at
value
(Cost
$10,857,902)
$
9,235,621
Cash
630,205
Interest
receivable
109,075
Prepaid
expenses
8,455
Receivable
for
Fund
shares
sold
1,642
Total
assets
9,984,998
Liabilities
Accrued
advisory
fees
2,160
Accrued
audit
expenses
1,689
Distributions
payable
1,485
Accrued
trustee
expenses
1,176
Accrued
retirement
plan
custody
fee
987
Payable
for
Fund
shares
redeemed
393
Accrued
legal
expenses
387
Accrued
Chief
Compliance
Officer
expenses
342
Accrued
other
operating
expenses
534
Accrued
printing
fees
795
Accrued
postage
996
Total
liabilities
10,944
Net
assets
$9,974,054
Analysis
of
net
assets
Paid-in
capital
(unlimited
shares
authorized,
without
par
value)
$11,613,449
Total
distributable
earnings
(1,639,395)
Net
assets
applicable
to
Fund
shares
outstanding
$9,974,054
Fund
shares
outstanding
2,327,467
Net
asset
value,
offering,
and
redemption
price
per
share
$4.29
Period
ended
May
31,
2024
Investment
income
Interest
income
$
181,861
Total
investment
income
181,861
Expenses
Investment
advisory
fees
25,468
Filing
and
registration
fees
7,448
Audit
fees
2,967
Trustee
fees
1,865
Chief
Compliance
Officer
expenses
1,795
Legal
fees
1,452
Retirement
plan
custodial
fees
1,087
Custodian
fees
207
Other
operating
expenses
809
Total
gross
expenses
43,098
Less
adviser
fees
waived
(9,783)
Less
custodian
fee
credits
(207)
Net
expenses
33,108
Net
investment
income
$148,753
Net
realized
loss
from
investments
$(783)
Net
decrease
in
unrealized
depreciation
on
investments
15,789
Net
gain
on
investments
15,006
Net
increase
in
net
assets
resulting
from
operations
$163,759
The
accompanying
notes
are
an
integral
part
of
these
financial
statements.
Statements
of
Changes
in
Net
Assets
Period
ended
May
31,
2024
Year
ended
November
30,
2023
Increase
(Decrease)
in
net
assets
from
operations
From
operations
Net
investment
income
$148,753
$278,280
Net
realized
loss
on
investments
(783)
(400)
Net
increase
(decrease)
in
unrealized
de
preciation
on
investments
15,789
(162,297)
Net
increase
in
net
assets
163,759
115,583
Distributions
to
shareowners
from
Net
dividend
and
distribution
to
shareholders
(148,758)
(279,913)
Capital
share
transactions
Proceeds
from
the
sale
of
shares
289,743
1,281,464
Value
of
shares
issued
in
reinvestment
of
dividends
and
distributions
140,190
273,882
Cost
of
shares
redeemed
(544,677)
(1,131,452)
Total
capital
shares
transactions
(114,744)
423,894
Total
increase
(decrease)
in
net
assets
(99,743)
259,564
Net
assets
Beginning
of
period
10,073,797
9,814,233
End
of
period
$9,974,054
$10,073,797
Shares
of
the
Fund
sold
and
redeemed
Sextant
Bond
Income
(SBIFX)
Number
of
shares
sold
66,589
302,431
Number
of
shares
issued
in
reinvestment
of
dividends
and
distributions
32,267
63,138
Number
of
shares
redeemed
(126,268)
(258,610)
Net
increase
(decrease)
in
number
of
shares
outstanding
(27,412)
106,959
–
–
Sextant
Bond
Income
Fund:
Financial
Highlights
The
accompanying
notes
are
an
integral
part
of
these
financial
statements.
tin
Sextant
Bond
Income
(SBIFX)
Selected
data
per
share
of
outstanding
capital
stock
throughout
each
period:
Period
ended
May
31,
2024
Year
ended
November
30,
2023
2022
2021
2020
2019
A
A
A
A
A
A
A
Net
asset
value
at
beginning
of
period
$4.28
$4.37
$5.40
$5.65
$5.34
$4.89
Income
from
investment
operations
Net
investment
income
0.06
0.13
0.12
0.13
0.14
0.15
Net
gains
(losses)
on
securities
(both
realized
and
unrealized)
0.01
(0.09)
(1.03)
(0.25)
0.31
0.45
Total
from
investment
operations
0.07
0.04
(0.91)
(0.12)
0.45
0.60
Less
distributions
Dividends
(from
net
investment
income)
(0.06)
(0.13)
(0.12)
(0.13)
(0.14)
(0.15)
Total
distributions
(0.06)
(0.13)
(0.12)
(0.13)
(0.14)
(0.15)
Net
asset
value
at
end
of
period
$4.29
$4.28
$4.37
$5.40
$5.65
$5.34
Total
Return
A
1.71%
0.86%
(16.94)%
(2.19)%
8.48%
12.45%
Ratios
/
supplemental
data
Net
assets
($000),
end
of
period
$9,974
$10,074
$9,814
$12,533
$14,042
$12,454
Ratio
of
expenses
to
average
net
assets
Before
custodian
fee
credits
B
0.85%
0.96%
1.03%
0.58%
0.63%
0.71%
After
advisory
fees
waiver
B
0.66%
0.65%
0.65%
0.53%
0.48%
0.55%
After custodian
fee
credits
B
0.65%
0.65%
0.65%
0.53%
0.48%
0.55%
Ratio
of
net
investment
income
after
custodian
fee
credits to
average
net
assets
B
2.93%
2.91%
2.58%
2.31%
2.50%
2.96%
Portfolio
turnover
rate
A
4%
0%
0%
3%
13%
21%
A
Not
annualized
for
period
of
less
than
one
year
B
Annualized
for
periods
of
less
than
one
year
The
accompanying
notes
are
an
integral
part
of
these
financial
statements.
Common
Stock
-
59.1%
Number
of
Shares
Cost
Market
Value
Country
1
Percentage
of
Net
Assets
Communications
Internet
Media
&
Services
Alphabet,
Class
A
2,500
$
147,623
$
431,250
United
States
1.7%
Consumer
Discretionary
Apparel,
Footwear
&
Accessory
Design
Hermes
International
25
62,200
59,371
France
0.2%
Automotive
Retailers
AutoZone
2
60
158,534
166,196
United
States
0.7%
O'Reilly
Automotive
2
160
135,486
154,122
United
States
0.6%
294,020
320,318
1.3%
Home
Products
Stores
Floor
&
Decor
Holdings
2
1,900
138,164
222,034
United
States
0.9%
Lowe's
1,100
75,376
243,419
United
States
0.9%
213,540
465,453
1.8%
Specialty
Apparel
Stores
Ross
Stores
1,390
108,387
194,266
United
States
0.8%
TJX
Companies
2,700
139,837
278,370
United
States
1.1%
248,224
472,636
1.9%
817,984
1,317,778
5.2%
Consumer
Staples
Agricultural
Producers
Darling
Ingredients
2
2,500
149,495
101,000
United
States
0.4%
Household
Products
Procter
&
Gamble
1,450
138,928
238,583
United
States
0.9%
Non-Alcoholic
Beverages
PepsiCo
385
42,104
66,566
United
States
0.3%
Packaged
Food
Danone
ADR
25,000
305,091
322,750
France
1.3%
General
Mills
4,200
277,293
288,750
United
States
1.1%
Nestle
ADR
1,000
73,990
106,300
Switzerland
0.4%
656,374
717,800
2.8%
986,901
1,123,949
4.4%
Energy
Exploration
&
Production
ConocoPhillips
2,000
79,556
232,960
United
States
1.0%
Refining
&
Marketing
Phillips
66
1,100
73,403
156,321
United
States
0.6%
Renewable
Energy
Equipment
Enphase
Energy
1,800
236,258
230,220
United
States
0.9%
389,217
619,501
2.5%
Financials
Consumer
Finance
Visa
900
138,794
245,214
United
States
1.0%
Institutional
Brokerage
Virtu
Financial
11,000
185,000
242,000
United
States
0.9%
Other
Financial
Services
Mastercard,
Class
A
500
137,490
223,535
United
States
0.9%
The
accompanying
notes
are
an
integral
part
of
these
financial
statements.
Common
Stock
-
59.1%
Number
of
Shares
Cost
Market
Value
Country
1
Percentage
of
Net
Assets
Financials
(continued)
P&C
Insurance
Chubb
810
$
102,989
$
219,364
Switzerland
0.9%
564,273
930,113
3.7%
Health
Care
Large
Pharma
AstraZeneca
ADR
4,500
284,252
351,090
United
States
1.4%
GlaxoSmithKline
ADR
8,250
306,076
369,352
United
Kingdom
1.4%
Novo
Nordisk
ADR
5,000
155,393
676,400
Denmark
2.7%
745,721
1,396,842
5.5%
Managed
Care
UnitedHealth
Group
300
123,022
148,611
United
States
0.6%
Medical
Devices
Abbott
Laboratories
85
3,104
8,686
United
States
0.0%
3
Boston
Scientific
2
2,500
167,239
188,925
United
States
0.8%
170,343
197,611
0.8%
Medical
Equipment
GE
Healthcare
Technologies
1,400
112,985
109,200
United
States
0.4%
1,152,071
1,852,264
7.3%
Industrials
Building
Construction
EMCOR
Group
Inc
575
209,254
223,479
United
States
0.9%
Commercial
&
Residential
Building
Equipment
&
Systems
Honeywell
International
1,000
49,532
202,190
United
States
0.8%
Johnson
Controls
International
5,350
205,042
384,719
United
States
1.5%
NIBE
Industrier
AB
Class
B
30,000
193,873
153,908
Sweden
0.6%
Trane
400
131,522
130,984
Ireland
0.5%
579,969
871,801
3.4%
Electrical
Power
Equipment
Eaton
2,000
298,440
665,700
Ireland
2.6%
Flow
Control
Equipment
Parker
Hannifin
500
60,804
265,760
United
States
1.1%
Industrial
Wholesale
&
Rental
Fastenal
2,245
51,931
148,125
United
States
0.6%
Rail
Freight
Canadian
National
Railway
2,000
86,366
254,660
Canada
1.0%
Canadian
Pacific
Kansas
City
2,568
182,009
203,796
Canada
0.8%
268,375
458,456
1.8%
Waste
Management
Republic
Services
950
116,161
175,931
United
States
0.7%
1,584,934
2,809,252
11.1%
Materials
Agricultural
Chemicals
Corteva
5,000
264,981
279,700
United
States
1.1%
Base
Metals
Mineral
Resources
4,012
181,000
192,684
Australia
0.8%
Basic
&
Diversified
Chemicals
Linde
560
75,239
243,891
United
Kingdom
1.0%
Iron
BHP
Biliton
ADR
1,750
103,319
104,178
Australia
0.4%
The
accompanying
notes
are
an
integral
part
of
these
financial
statements.
Common
Stock
-
59.1%
Number
of
Shares
Cost
Market
Value
Country
1
Percentage
of
Net
Assets
Materials
(continued)
Precious
Metals
Agnico-Eagle
Mines
6,150
$
299,837
$
419,492
Canada
1.6%
924,376
1,239,945
4.9%
Technology
Application
Software
SAP
ADR
2,100
321,112
383,124
Germany
1.5%
Communications
Equipment
Apple
1,900
44,723
365,275
United
States
1.4%
Motorola
Solutions
1,025
264,513
374,033
United
States
1.5%
309,236
739,308
2.9%
Infrastructure
Software
Microsoft
1,275
282,306
529,291
United
States
2.1%
Oracle
3,100
124,402
363,289
United
States
1.5%
406,708
892,580
3.6%
IT
Services
Wolters
Kluwer
NV
2,000
277,883
320,300
Netherlands
1.3%
Semiconductor
Devices
Broadcom
200
241,180
265,710
United
States
1.1%
Infineon
Technologies
ADR
3,275
91,171
131,819
Germany
0.5%
Micron
Technology
1,550
59,028
193,750
United
States
0.8%
NVIDIA
240
182,797
263,119
United
States
1.0%
NXP
Semiconductors
950
90,828
258,495
Netherlands
1.0%
665,004
1,112,893
4.4%
Semiconductor
Manufacturing
Taiwan
Semiconductor
ADR
1,900
253,546
286,976
Taiwan
1.1%
2,233,489
3,735,181
14.8%
Utilities
Integrated
Electric
Utilities
Dominion
Energy
7,750
368,362
417,880
United
States
1.6%
NextEra
Energy
5,925
185,168
474,119
United
States
1.9%
553,530
891,999
3.5%
Total
Common
Stock
$9,354,398
$14,951,232
59.1%
Corporate
Bonds
-
18.3%
Coupon
/
Maturity
Face
Amount
Market
Value
Country
1
Percentage
of
Net
Assets
Communications
Bellsouth
Capital
Funding
7.875%
due
02/15/2030
150,000
160,075
United
States
0.6%
Comcast
5.650%
due
06/15/2035
500,000
508,855
United
States
2.0%
Expedia
Group
5.000%
due
02/15/2026
250,000
247,385
United
States
1.0%
916,315
3.6%
Consumer
Discretionary
Lowe's
4.250%
due
09/15/2044
250,000
195,487
United
States
0.8%
Stanford
University
4.013%
due
05/01/2042
100,000
85,038
United
States
0.3%
280,525
1.1%
Consumer
Staples
Coca
Cola
1.000%
due
03/15/2028
250,000
217,586
United
States
0.9%
Financials
Charles
Schwab
3.000%
due
03/10/2025
300,000
294,034
United
States
1.2%
The
accompanying
notes
are
an
integral
part
of
these
financial
statements.
Corporate
Bonds
-
18.3%
Coupon
/
Maturity
Face
Amount
Market
Value
Country
1
Percentage
of
Net
Assets
Health
Care
Cardinal
Health
3.500%
due
11/15/2024
$
155,000
$
153,281
United
States
0.6%
Industrials
Burlington
Northern
Santa
Fe
Bond
6.200%
due
08/15/2036
150,000
161,003
United
States
0.6%
CSX
Corp
4.650%
due
03/01/2068
300,000
250,885
United
States
1.0%
FedEx
3.900%
due
02/01/2035
250,000
219,546
United
States
0.9%
Legrand
France
Yankee
8.500%
due
02/15/2025
170,000
173,404
France
0.7%
Union
Pacific
3.375%
due
02/01/2035
250,000
212,848
United
States
0.8%
1,017,686
4.0%
Real
Estate
Welltower
4.250%
due
04/15/2028
350,000
336,467
United
States
1.3%
Technology
Oracle
2.950%
due
04/01/2030
500,000
440,829
United
States
1.8%
Qualcomm
3.250%
due
05/20/2027
220,000
210,445
United
States
0.8%
651,274
2.6%
Utilities
Edison
International
3.550%
due
11/15/2024
250,000
247,424
United
States
1.0%
Pacificorp
6.000%
due
01/15/2039
500,000
505,703
United
States
2.0%
753,127
3.0%
Total
Corporate
Bonds
(Cost
$5,061,050)
$4,620,295
18.3%
Government
Bonds
-
15.4%
Coupon
/
Maturity
Face
Amount
Market
Value
Country
1
Percentage
of
Net
Assets
Government
United
States
Cash
Management
Bill
–%
due
08/08/2024
3,250,000
3,218,696
United
States
12.7%
United
States
Treasury
Bond
4.500%
due
02/15/2036
137,000
137,942
United
States
0.6%
United
States
Treasury
Bond
3.625%
due
02/15/2044
155,000
132,374
United
States
0.5%
United
States
Treasury
Note
1.125%
due
01/15/2025
400,000
389,965
United
States
1.6%
Total
Government
Bonds
(Cost
$3,942,909)
$3,878,977
15.4%
Municipals
Bonds
-
0.4%
Coupon
/
Maturity
Face
Amount
Market
Value
Country
1
Percentage
of
Net
Assets
Utility
Networks
Tacoma
WA
Elec
Sys
Revenue
5.966%
due
01/01/2035
100,000
103,390
United
States
0.4%
Total
Municipals
Bonds
(Cost
$117,172)
$103,390
0.4%
Total
investments
(Cost
$18,475,529)
$23,553,894
93.2%
Other
assets
(net
of
liabilities)
1,719,843
6.8%
Total
net
assets
$25,273,737
100.0%
1
Country
of
domicile
2
Non-income
producing
3
Less
than
0.05%
ADR:
American
Depositary
Receipt
Yankee:
Dollar-denominated
bonds
issued
in
the
U.S.
by
foreign
banks
or
corporations
The
accompanying
notes
are
an
integral
part
of
these
financial
statements.
Statement
of
Assets
and
Liabilities
Statement
of
Operations
As
of
May
31,
2024
Assets
Investments
in
securities,
at
value
(Cost
$18,475,529)
$
23,553,894
Cash
1,622,639
Interest
receivable
66,212
Dividends
receivable
29,727
Receivable
for
Fund
shares
sold
12,575
Prepaid
expenses
7,403
Total
assets
25,292,450
Liabilities
Accrued
advisory
fees
10,628
Accrued
trustee
expenses
2,278
Accrued
retirement
plan
custody
fee
1,185
Accrued
audit
expenses
1,104
Accrued
legal
expenses
807
Accrued
Chief
Compliance
Officer
expenses
630
Payable
for
Fund
shares
redeemed
175
Accrued
other
operating
expenses
1,906
Total
liabilities
18,713
Net
assets
$25,273,737
Analysis
of
net
assets
Paid-in
capital
(unlimited
shares
authorized,
without
par
value)
$19,485,422
Total
distributable
earnings
5,788,315
Net
assets
applicable
to
Fund
shares
outstanding
$25,273,737
Fund
shares
outstanding
1,537,664
Net
asset
value,
offering,
and
redemption
price
per
share
$16.44
Period
ended
May
31,
2024
Investment
income
Interest
income
$
213,856
Dividend
Income
(Net
of
foreign
tax
of
$7,293)
116,383
Total
investment
income
330,239
Expenses
Investment
advisory
fees
59,319
Filing
and
registration
fees
9,882
Audit
fees
6,239
Chief
Compliance
Officer
expenses
3,809
Trustee
fees
3,749
Legal
fees
3,228
Retirement
plan
custodial
fees
1,279
ReFlow
fees
613
Custodian
fees
510
Other
operating
expenses
1,860
Total
gross
expenses
90,488
Less
custodian
fee
credits
(510)
Net
expenses
89,978
Net
investment
income
$240,261
Net
realized
gain
from
investments
and
foreign
currency
$498,091
A
Net
Increase
in
unrealized
appreciation
on
investments
and
foreign
currency
1,455,772
Net
gain
on
investments
1,953,863
Net
increase
in
net
assets
resulting
from
operations
$2,194,124
A
Includes
$184,362
in
net
realized
gains
from
redemptions
in-kind
The
accompanying
notes
are
an
integral
part
of
these
financial
statements.
Statements
of
Changes
in
Net
Assets
Period
ended
May
31,
2024
Year
ended
November
30,
2023
Increase
in
net
assets
from
operations
From
operations
Net
investment
income
$240,261
$343,070
Net
realized
gain
on
investments
and
foreign
currency
498,091
722,143
Net
increase
(decrease)
in
unrealized
appreciation
on
investments
and
foreign
currency
1,455,772
(258,801)
Net
increase
in
net
assets
2,194,124
806,412
Distributions
to
shareowners
from
Net
dividend
and
distribution
to
shareholders
(351,859)
(282,074)
Capital
share
transactions
Proceeds
from
the
sale
of
shares
3,617,191
5,941,201
Value
of
shares
issued
in
reinvestment
of
dividends
and
distributions
351,248
281,446
Cost
of
shares
redeemed
(1,731,703)
(4,834,213)
Total
capital
shares
transactions
2,236,736
1,388,434
Total
increase
in
net
assets
4,079,001
1,912,772
Net
assets
Beginning
of
period
21,194,736
19,281,964
End
of
period
$25,273,737
$21,194,736
Shares
of
the
Fund
sold
and
redeemed
Sextant
Core
(SCORX)
Number
of
shares
sold
230,398
400,225
Number
of
shares
issued
in
reinvestment
of
dividends
and
distributions
22,748
19,424
Number
of
shares
redeemed
(108,406)
(323,202)
Net
increase
in
number
of
shares
outstanding
144,740
96,447
–
–
Sextant
Core
Fund:
Financial
Highlights
The
accompanying
notes
are
an
integral
part
of
these
financial
statements.
tin
Sextant
Core
(SCORX)
Selected
data
per
share
of
outstanding
capital
stock
throughout
each
period:
Period
ended
May
31,
2024
Year
ended
November
30,
2023
2022
2021
2020
2019
A
A
A
A
A
A
A
Net
asset
value
at
beginning
of
period
$15.22
$14.87
$16.20
$14.81
$14.31
$12.84
Income
from
investment
operations
Net
investment
income
0.16
0.26
0.21
0.24
0.19
0.19
Net
gains
(losses)
on
securities
(both
realized
and
unrealized)
1.31
0.30
(1.03)
1.36
1.13
1.45
Total
from
investment
operations
1.47
0.56
(0.82)
1.60
1.32
1.64
Less
distributions
Dividends
(from
net
investment
income)
(0.25)
(0.19)
(0.25)
(0.21)
(0.20)
(0.17)
Distributions
(from
capital
gains)
–
(0.02)
(0.26)
–
(0.62)
–
Total
distributions
(0.25)
(0.21)
(0.51)
(0.21)
(0.82)
(0.17)
Net
asset
value
at
end
of
period
$16.44
$15.22
$14.87
$16.20
$14.81
$14.31
Total
Return
A
9.77%
3.88%
(5.32)%
10.95%
9.72%
13.04%
Ratios
/
supplemental
data
Net
assets
($000),
end
of
period
$25,274
$21,195
$19,282
$18,932
$18,962
$16,875
Ratio
of
expenses
to
average
net
assets
Before
custodian
fee
credits
B
0.76%
0.86%
0.90%
0.57%
0.88%
0.90%
After custodian
fee
credits
B
0.76%
0.85%
0.90%
0.56%
0.88%
0.90%
Ratio
of
net
investment
income
after
custodian
fee
credits to
average
net
assets
B
2.03%
1.72%
1.44%
1.52%
1.40%
1.63%
Portfolio
turnover
rate
A
12%
13%
10%
14%
19%
28%
A
Not
annualized
for
period
of
less
than
one
year
B
Annualized
for
periods
of
less
than
one
year
Sextant
Global
High
Income
Fund
The
accompanying
notes
are
an
integral
part
of
these
financial
statements.
Common
Stock
-
50.3%
Number
of
Shares
Cost
Market
Value
Country
1
Percentage
of
Net
Assets
Communications
Wireless
Telecommunications
Orange
ADR
20,000
$
270,393
$
235,000
France
2.4%
SK
Telecom
ADR
11,000
265,273
227,480
South
Korea
2.4%
Telenor
ASA
20,000
265,603
232,903
Norway
2.4%
Verizon
Communications
6,000
294,820
246,900
United
States
2.6%
1,096,089
942,283
9.8%
Consumer
Discretionary
Automobiles
Volkswagen
AG
1,500
274,363
188,587
Germany
1.9%
Energy
Exploration
&
Production
Woodside
Energy
Group
ADR
8,500
174,552
157,250
Australia
1.6%
Integrated
Oils
Shell
ADR
3,800
241,426
276,564
Netherlands
2.9%
415,978
433,814
4.5%
Financials
Banks
ANZ
Group
Holdings
ADR
15,000
244,950
282,900
Australia
2.9%
Skandinaviska
Enskilda
Banken,
Cl
A
25,000
233,632
356,398
Sweden
3.7%
478,582
639,298
6.6%
Institutional
Brokerage
Virtu
Financial
7,500
119,775
165,000
United
States
1.7%
598,357
804,298
8.3%
Health
Care
Large
Pharma
GlaxoSmithKline
ADR
6,500
267,211
291,005
United
Kingdom
3.0%
Novartis
ADR
2,500
134,038
257,825
Switzerland
2.7%
Sandoz
Group
AG-ADR
500
7,234
17,745
Switzerland
0.2%
408,483
566,575
5.9%
Materials
Base
Metals
Norsk
Hydro
ASA
35,000
314,618
236,889
Norway
2.5%
South32
ADR
19,000
134,773
251,180
Australia
2.6%
Southern
Copper
5,052
335,962
599,319
Peru
6.2%
785,353
1,087,388
11.3%
Iron
BHP
Biliton
ADR
5,500
186,488
327,415
Australia
3.4%
971,841
1,414,803
14.7%
Technology
Communications
Equipment
Cisco
Systems
5,000
179,892
232,500
United
States
2.4%
Consumer
Electronics
Nintendo
5,000
223,480
272,110
Japan
2.8%
403,372
504,610
5.2%
Total
Common
Stock
$4,168,483
$4,854,970
50.3%
Corporate
Bonds
-
28.4%
Coupon
/
Maturity
Face
Amount
Market
Value
Country
1
Percentage
of
Net
Assets
Communications
Comcast
4.650%
due
07/15/2042
250,000
222,263
United
States
2.3%
Sextant
Global
High
Income
Fund
The
accompanying
notes
are
an
integral
part
of
these
financial
statements.
Corporate
Bonds
-
28.4%
Coupon
/
Maturity
Face
Amount
Market
Value
Country
1
Percentage
of
Net
Assets
Communications
(continued)
Netflix
4.375%
due
11/15/2026
$
250,000
$
245,186
United
States
2.6%
467,449
4.9%
Consumer
Discretionary
Ford
Motor
6.375%
due
02/01/2029
220,000
224,814
United
States
2.3%
MDC
Holdings
3.850%
due
01/15/2030
200,000
186,107
United
States
1.9%
YUM!
Brands
3.625%
due
03/15/2031
295,000
256,916
United
States
2.7%
667,837
6.9%
Consumer
Staples
Grupo
Bimbo
4.875%
due
06/27/2044
200,000
175,487
Mexico
1.8%
Energy
Petrobras
International
Finance
6.875%
due
01/20/2040
50,000
48,743
Brazil
0.5%
Petrobras
International
Finance
6.750%
due
01/27/2041
80,000
76,755
Brazil
0.8%
125,498
1.3%
Financials
Lincoln
National(3
month
LIBOR
plus
2.04%)
2
7.628%
due
04/20/2067
250,000
193,750
United
States
2.0%
Industrials
Burlington
Northern
Santa
Fe
5.050%
due
03/01/2041
200,000
189,182
United
States
1.9%
CSX
Corp
4.650%
due
03/01/2068
250,000
209,071
United
States
2.2%
Delta
Air
Lines
3.750%
due
10/28/2029
250,000
228,991
United
States
2.4%
Norfolk
Southern
5.100%
due
08/01/2118
275,000
230,178
United
States
2.4%
857,422
8.9%
Utilities
Edison
International
3.550%
due
11/15/2024
250,000
247,424
United
States
2.6%
Total
Corporate
Bonds
(Cost
$3,097,485)
$2,734,867
28.4%
Government
Bonds
-
2.5%
Coupon
/
Maturity
Face
Amount
Market
Value
Country
1
Percentage
of
Net
Assets
Government
Colombia
Republic
8.375%
due
02/15/2027
125,000
127,625
Colombia
1.3%
Republic
of
Argentina
1.000%
due
07/09/2029
9,276
5,397
Argentina
0.1%
Republic
of
Argentina
1.500%
due
07/09/2046
242,500
110,009
Argentina
1.1%
Total
Government
Bonds
(Cost
$361,824)
$243,031
2.5%
Municipals
Bonds
-
0.5%
Coupon
/
Maturity
Face
Amount
Market
Value
Country
1
Percentage
of
Net
Assets
Municipal
Bonds
Colony
TX
NFM
Sales
Tax
Revenue
7.625%
due
10/01/2042
50,000
49,007
United
States
0.5%
Total
Municipals
Bonds
(Cost
$50,000)
$49,007
0.5%
Total
investments
(Cost
$7,677,792)
$7,881,875
81.7%
Other
assets
(net
of
liabilities)
1,766,437
18.3%
Total
net
assets
$
9,648,312
100.0%
1
Denotes
a
country
or
region
of
primary
exposure
2
Variable
rate
security.
The
interest
rate
represents
the
rate
in
effect
at
May
31,
2024
and
resets
periodically
based
on
the
parenthetically
disclosed
reference
rate
and
spread.
ADR:
American
Depositary
Receipt
LIBOR:
London
Interbank
Offered
Rates
Sextant
Global
High
Income
Fund
The
accompanying
notes
are
an
integral
part
of
these
financial
statements.
Statement
of
Assets
and
Liabilities
Statement
of
Operations
As
of
May
31,
2024
Assets
Investments
in
securities,
at
value
(Cost
$7,677,792)
$
7,881,875
Cash
1,682,072
Interest
receivable
42,842
Dividends
receivable
38,803
Prepaid
expenses
10,157
Receivable
for
Fund
shares
sold
472
Total
assets
9,656,221
Liabilities
Accrued
audit
expenses
2,483
Accrued
advisory
fees
1,203
Accrued
trustee
expenses
1,044
Accrued
retirement
plan
custody
fee
741
Accrued
legal
expenses
474
Accrued
Chief
Compliance
Officer
expenses
313
Accrued
other
operating
expenses
184
Accrued
printing
fees
1,012
Accrued
postage
455
Total
liabilities
7,909
Net
assets
$9,648,312
Analysis
of
net
assets
Paid-in
capital
(unlimited
shares
authorized,
without
par
value)
$9,341,836
Total
distributable
earnings
306,476
Net
assets
applicable
to
Fund
shares
outstanding
$9,648,312
Fund
shares
outstanding
897,347
Net
asset
value,
offering,
and
redemption
price
per
share
$10.75
Period
ended
May
31,
2024
Investment
income
Interest
income
$
120,497
Dividend
Income
(Net
of
foreign
tax
of
$15,863)
115,981
Miscellaneous
income
198
Total
investment
income
236,676
Expenses
Investment
advisory
fees
23,902
Filing
and
registration
fees
11,582
Audit
fees
2,897
Chief
Compliance
Officer
expen
ses
1,766
Trustee
fees
1,747
Legal
fees
1,567
Retirement
plan
custodial
fees
889
Custodian
fees
337
Other
operating
expenses
1,116
Total
gross
expenses
45,803
Less
adviser
fees
waived
(9,676)
Less
custodian
fee
credits
(337)
Net
expenses
35,790
Net
investment
income
$200,886
Net
realized
loss
from
investments
and
foreign
currency
$(83,425)
Net
increase
in
unrealized
appreciation
on
investments
and
foreign
currency
788,600
Net
gain
on
investments
705,175
Net
increase
in
net
assets
resulting
from
operations
$906,061
Sextant
Global
High
Income
Fund
The
accompanying
notes
are
an
integral
part
of
these
financial
statements.
Statements
of
Changes
in
Net
Assets
Period
ended
May
31,
2024
Year
ended
November
30,
2023
Increase
in
net
assets
from
operations
From
operations
Net
investment
income
$200,886
$413,582
Net
realized
loss
on
investments
and
foreign
currency
(83,425)
(11,956)
Net
increase
(decrease)
in
unrealized
appreciation
on
investments
and
foreign
currency
788,600
(13,885)
Net
increase
in
net
assets
906,061
387,741
Distributions
to
shareowners
from
Net
dividend
and
distribution
to
shareholders
(401,403)
(305,551)
Capital
share
transactions
Proceeds
from
the
sale
of
shares
350,408
511,784
Value
of
shares
issued
in
reinvestment
of
dividends
and
distributions
392,421
298,310
Cost
of
shares
redeemed
(1,037,931)
(507,318)
Total
capital
shares
transactions
(295,102)
302,776
Total
increase
in
net
assets
209,556
384,966
Net
assets
Beginning
of
period
9,438,756
9,053,790
End
of
period
$9,648,312
$9,438,756
Shares
of
the
Fund
sold
and
redeemed
Sextant
Global
High
Income
Fund
(SGHIX)
Number
of
shares
sold
33,850
50,804
Number
of
shares
issued
in
reinvestment
of
dividends
and
distributions
38,472
30,440
Number
of
shares
redeemed
(100,450)
(50,276)
Net
increase
(decrease)
in
number
of
shares
outstanding
(28,128)
30,968
–
–
Sextant
Global
High
Income
Fund:
Financial
Highlights
The
accompanying
notes
are
an
integral
part
of
these
financial
statements.
tin
Sextant
Global
High
Income
Fund
(SGHIX)
Selected
data
per
share
of
outstanding
capital
stock
throughout
each
period:
Period
ended
May
31,
2024
Year
ended
November
30,
2023
2022
2021
2020
2019
A
A
A
A
A
A
A
Net
asset
value
at
beginning
of
period
$10.20
$10.12
$10.77
$10.15
$11.42
$11.07
Income
from
investment
operations
Net
investment
income
0.22
0.45
0.40
0.33
0.31
0.42
Net
gains
(losses)
on
securities
(both
realized
and
unrealized)
0.76
(0.03)
(0.83)
0.65
(0.66)
0.32
Total
from
investment
operations
0.98
0.42
(0.43)
0.98
(0.35)
0.74
Less
distributions
Dividends
(from
net
investment
income)
(0.43)
(0.34)
(0.22)
(0.36)
(0.40)
(0.39)
Distributions
(from
capital
gains)
–
–
–
–
(0.52)
–
Total
distributions
(0.43)
(0.34)
(0.22)
(0.36)
(0.92)
(0.39)
Net
asset
value
at
end
of
period
$10.75
$10.20
$10.12
$10.77
$10.15
$11.42
Total
Return
A
9.87%
4.31%
(4.16)%
9.87%
(3.51)%
7.06%
Ratios
/
supplemental
data
Net
assets
($000),
end
of
period
$9,648
$9,439
$9,054
$9,150
$8,615
$9,893
Ratio
of
expenses
to
average
net
assets
Before
custodian
fee
credits
B
0.96%
0.96%
0.98%
0.78%
0.70%
1.11%
After
advisory
fees
waiver
B
0.76%
0.75%
0.75%
0.70%
0.56%
0.76%
After custodian
fee
credits
B
0.75%
0.74%
0.74%
0.69%
0.55%
0.75%
Ratio
of
net
investment
income
after
custodian
fee
credits to
average
net
assets
B
4.21%
4.45%
3.87%
3.11%
3.12%
3.72%
Portfolio
turnover
rate
A
2%
8%
20%
27%
27%
33%
A
Not
annualized
for
period
of
less
than
one
year
B
Annualized
for
periods
of
less
than
one
year
The
accompanying
notes
are
an
integral
part
of
these
financial
statements.
Common
Stock
-
98.2%
Number
of
Shares
Cost
Market
Value
Percentage
of
Net
Assets
Communications
Internet
Media
&
Services
Alphabet,
Class
A
31,680
$
898,428
$
5,464,800
8.1%
Facebook
Inc
2,800
1,335,391
1,307,124
1.9%
2,233,819
6,771,924
10.0%
Consumer
Discretionary
Automotive
Retailers
O'Reilly
Automotive
1
1,300
1,094,232
1,252,238
1.8%
Home
Products
Stores
Lowe's
5,600
198,283
1,239,224
1.8%
Online
Marketplace
Amazon.com
1
26,980
162,991
4,760,351
7.0%
Specialty
Apparel
Stores
Lululemon
Athletica
1
3,000
965,595
935,970
1.4%
TJX
Companies
19,000
824,767
1,958,900
2.9%
1,790,362
2,894,870
4.3%
3,245,868
10,146,683
14.9%
Consumer
Staples
Mass
Merchants
Costco
Wholesale
3,509
410,438
2,841,904
4.2%
Non-Alcoholic
Beverages
Monster
Beverage
32,200
1,489,661
1,671,824
2.4%
1,900,099
4,513,728
6.6%
Financials
Other
Financial
Services
Mastercard,
Class
A
5,896
536,038
2,635,925
3.9%
Health
Care
Managed
Care
Elevance
Health
2,250
1,076,105
1,211,580
1.8%
Medical
Devices
Boston
Scientific
1
22,000
981,996
1,662,540
2.5%
Edwards
Lifesciences
1
10,500
346,070
912,345
1.3%
Stryker
3,000
374,100
1,023,270
1.5%
1,702,166
3,598,155
5.3%
Specialty
&
Generic
Pharma
Zoetis
6,000
998,110
1,017,360
1.5%
3,776,381
5,827,095
8.6%
Industrials
Commercial
&
Residential
Building
Equipment
&
Systems
Johnson
Controls
International
22,500
1,043,161
1,617,975
2.4%
Industrial
Wholesale
&
Rental
Ferguson
6,250
1,141,985
1,285,875
1.9%
Infrastructure
Construction
Quanta
Services
5,000
1,347,130
1,379,700
2.0%
3,532,276
4,283,550
6.3%
The
accompanying
notes
are
an
integral
part
of
these
financial
statements.
Common
Stock
-
98.2%
Number
of
Shares
Cost
Market
Value
Percentage
of
Net
Assets
Materials
Agricultural
Chemicals
Corteva
23,850
$
1,016,058
$
1,334,169
2.0%
Technology
Application
Software
Adobe
1
4,450
23,404
1,979,182
2.9%
Communications
Equipment
Apple
29,100
8,575
5,594,475
8.3%
Motorola
Solutions
6,000
1,346,592
2,189,460
3.2%
1,355,167
7,783,935
11.5%
Infrastructure
Software
Microsoft
18,170
838,685
7,542,912
11.1%
Oracle
17,500
901,024
2,050,825
3.0%
ServiceNow
1
1,900
1,225,009
1,248,167
1.9%
2,964,718
10,841,904
16.0%
Semiconductor
Devices
Advanced
Micro
Devices
1
9,500
758,357
1,585,550
2.3%
Broadcom
1,275
1,200,407
1,693,901
2.5%
Monolithic
Power
Systems
1,100
521,986
809,193
1.2%
NVIDIA
3,500
493,219
3,837,155
5.6%
Qualcomm
7,900
1,066,689
1,611,995
2.4%
Texas
Instruments
5,100
648,430
994,551
1.5%
4,689,088
10,532,345
15.5%
9,032,377
31,137,366
45.9%
Total
investments
$25,272,916
$66,650,440
98.2%
Other
assets
(net
of
liabilities)
1,207,480
1.8%
Total
net
assets
$67,857,920
100.0%
1
Non-income
producing
The
accompanying
notes
are
an
integral
part
of
these
financial
statements.
Statement
of
Assets
and
Liabilities
Statement
of
Operations
As
of
May
31,
2024
Assets
Investments
in
securities,
at
value
(Cost
$25,272,916)
$
66,650,440
Cash
1,228,340
Dividends
receivable
30,060
Prepaid
expenses
16,592
Receivable
for
Fund
shares
sold
3,514
Total
assets
67,928,946
Liabilities
Accrued
advisory
fees
28,676
Accrued
audit
expenses
11,454
Payable
for
Fund
shares
redeemed
7,675
Accrued
trustee
expenses
6,354
Accrued
retirement
plan
custody
fee
2,929
Accrued
Chief
Compliance
Officer
expenses
1,715
Accrued
legal
expenses
1,692
Accrued
12b-1
distribution
fees
899
Accrued
other
operating
expenses
2,393
Accrued
printing
fees
7,239
Total
liabilities
71,026
Net
assets
$67,857,920
Analysis
of
net
assets
Paid-in
capital
(unlimited
shares
authorized,
without
par
value)
$22,854,229
Total
distributable
earnings
45,003,691
Net
assets
applicable
to
Fund
shares
outstanding
$67,857,920
Net
asset
value
per
Investor
Shares
SSGFX
Net
assets,
at
value
$4,249,552
Shares
outstanding
84,972
Net
asset
value,
offering
and
redemption
price
per
share
$50.01
Net
asset
value
per
Z
Shares
SGZFX
Net
assets,
at
value
$63,608,368
Shares
outstanding
1,269,656
Net
asset
value,
offering
and
redemption
price
per
share
$50.10
Period
ended
May
31,
2024
Investment
income
Dividend
Income
$
289,270
Total
investment
income
289,270
Expenses
Investment
advisory
fees
164,039
Audit
fees
18,812
Filing
and
registration
fees
16,995
Trustee
fees
10,944
Chief
Compliance
Officer
expenses
10,943
Legal
fees
8,706
12b-1
distribution
fees
5,095
ReFlow
fees
3,908
Retirement
plan
custodial
fees
3,224
1,025
Investor
Shares
–
1,050
Z
Shares
3,224
Custodian
fees
1,328
Other
operating
expenses
5,113
Total
gross
expenses
249,107
Less
custodian
fee
credits
(1,328)
Net
expenses
247,779
Net
investment
income
$41,491
Net
realized
gain
from
investments
$3,869,178
A
Net
Increase
in
unrealized
appreciation
on
investments
5,005,093
Net
gain
on
investments
8,874,271
Net
increase
in
net
assets
resulting
from
operations
$8,915,762
A
Includes
$1,814,564
in
net
realized
gains
from
redemptions
in-kind
The
accompanying
notes
are
an
integral
part
of
these
financial
statements.
Statements
of
Changes
in
Net
Assets
Period
ended
May
31,
2024
Year
ended
November
30,
2023
Increase
in
net
assets
from
operations
From
operations
Net
investment
income
(loss)
$41,491
$(2,487)
Net
realized
gain
on
investments
3,869,178
865,127
Net
increase
in
unrealized
appreciation
on
investments
5,005,093
7,620,469
Net
increase
in
net
assets
8,915,762
8,483,109
Distributions
to
shareowners
from
1,025
Net
dividend
and
distribution
to
shareholders
-
Investor
Shares
–
(116,456)
1,050
Net
dividend
and
distribution
to
shareholders
-
Z
Shares
(32,415)
(1,184,886)
Total
distributions
(32,415)
(1,301,342)
Capital
share
transactions
Proceeds
from
the
sale
of
shares
1,025
Investor
Shares
221,223
491,401
1,050
Z
Shares
3,944,414
4,454,320
Value
of
shares
issued
in
reinvestment
of
dividends
and
distributions
1,025
Investor
Shares
–
86,817
1,050
Z
Shares
31,514
1,154,557
Cost
of
shares
redeemed
1,025
Investor
Shares
(1,570,686)
(1,032,724)
1,050
Z
Shares
(5,253,900)
(5,613,472)
Total
capital
shares
transactions
(2,627,435)
(459,101)
Total
increase
in
net
assets
6,255,912
6,722,666
Net
assets
Beginning
of
period
61,602,008
54,879,342
End
of
period
$67,857,920
$61,602,008
Shares
of
the
Fund
sold
and
redeemed
Investor
Shares
(SSGFX)
Number
of
shares
sold
4,538
11,981
Number
of
shares
issued
in
reinvestment
of
dividends
and
distributions
–
2,413
Number
of
shares
redeemed
(35,733)
(25,330)
Net
decrease
in
number
of
shares
outstanding
(31,195)
(10,936)
Z
Shares
(SGZFX)
Number
of
shares
sold
83,996
111,231
Number
of
shares
issued
in
reinvestment
of
dividends
and
distributions
696
32,134
Number
of
shares
redeemed
(110,370)
(140,223)
Net
increase
(decrease)
in
number
of
shares
outstanding
(25,678)
3,142
–
–
Sextant
Growth
Fund:
Financial
Highlights
The
accompanying
notes
are
an
integral
part
of
these
financial
statements.
tin
Investor
Shares
(SSGFX)
Selected
data
per
share
of
outstanding
capital
stock
throughout
each
period:
Period
ended
May
31,
2024
Year
ended
November
30,
2023
2022
2021
2020
2019
A
A
A
A
A
A
A
Net
asset
value
at
beginning
of
period
$43.60
$38.72
$51.39
$41.86
$33.25
$28.70
Income
from
investment
operations
Net
investment
income
A
(0.02)
(0.09)
(0.13)
0.09
(0.03)
(0.03)
Net
gains
(losses)
on
securities
(both
realized
and
unrealized)
6.43
5.89
(8.24)
9.70
9.58
5.86
Total
from
investment
operations
6.41
5.80
(8.37)
9.79
9.55
5.83
Less
distributions
Dividends
(from
net
investment
income)
–
–
(0.05)
(0.03)
(0.01)
(0.04)
Distributions
(from
capital
gains)
–
(0.92)
(4.25)
(0.23)
(0.93)
(1.24)
Total
distributions
–
(0.92)
(4.30)
(0.26)
(0.94)
(1.28)
Net
asset
value
at
end
of
period
$50.01
$43.60
$38.72
$51.39
$41.86
$33.25
Total
Return
B
14.70%
15.47%
(17.88)%
23.48%
29.49%
21.81%
Ratios
/
supplemental
data
Net
assets
($000),
end
of
period
$4,250
$5,065
$4,921
$6,411
$5,197
$4,533
Ratio
of
expenses
to
average
net
assets
Before
custodian
fee
credits
C
0.99%
1.04%
1.21%
0.74%
1.05%
1.20%
After custodian
fee
credits
C
0.98%
1.04%
1.20%
0.74%
1.05%
1.20%
Ratio
of
net
investment
income
after
custodian
fee
credits to
average
net
assets
C
(0.10)%
(0.22)%
(0.32)%
0.20%
(0.08)%
(0.07)%
Portfolio
turnover
rate
B
6%
10%
23%
18%
17%
10%
Z
Shares
(SGZFX)
Selected
data
per
share
of
outstanding
capital
stock
throughout
each
period:
Period
ended
May
31,
2024
Year
ended
November
30,
2023
2022
2021
2020
2019
A
A
A
A
A
A
A
Net
asset
value
at
beginning
of
period
$43.65
$38.66
$51.30
$41.78
$33.16
$28.65
Income
from
investment
operations
Net
investment
income
A
0.03
0.01
(0.03)
0.20
0.05
0.08
Net
gains
(losses)
on
securities
(both
realized
and
unrealized)
6.45
5.90
(8.22)
9.66
9.56
5.82
Total
from
investment
operations
6.48
5.91
(8.25)
9.86
9.61
5.90
Less
distributions
Dividends
(from
net
investment
income)
(0.03)
–
(0.14)
(0.11)
(0.06)
(0.15)
Distributions
(from
capital
gains)
–
(0.92)
(4.25)
(0.23)
(0.93)
(1.24)
Total
distributions
(0.03)
(0.92)
(4.39)
(0.34)
(0.99)
(1.39)
Net
asset
value
at
end
of
period
$50.10
$43.65
$38.66
$51.30
$41.78
$33.16
Total
Return
B
14.84%
15.79%
(17.69)%
23.76%
29.79%
22.22%
Ratios
/
supplemental
data
Net
assets
($000),
end
of
period
$63,608
$56,537
$49,958
$62,277
$53,776
$40,978
Ratio
of
expenses
to
average
net
assets
Before
custodian
fee
credits
C
0.75%
0.80%
0.97%
0.51%
0.82%
0.90%
After custodian
fee
credits
C
0.74%
0.80%
0.97%
0.50%
0.82%
0.90%
Ratio
of
net
investment
income
after
custodian
fee
credits to
average
net
assets
C
0.14%
0.02%
(0.08)%
0.43%
0.14%
0.23%
Portfolio
turnover
rate
B
6%
10%
23%
18%
17%
10%
A
Calculated
using
average
shares
outstanding
B
Not
annualized
for
period
of
less
than
one
year
C
Annualized
for
periods
of
less
than
one
year
The
accompanying
notes
are
an
integral
part
of
these
financial
statements.
Common
Stock
-
96
.4
%
Number
of
Shares
Cost
Market
Value
Country
1
Percentage
of
Net
Assets
Communications
Wireless
Telecommunications
Telus
12,650
$
92,488
$
208,093
Canada
0.3%
Consumer
Discretionary
Apparel,
Footwear
&
Accessory
Design
Hermes
International
600
569,151
1,424,894
France
1.9%
Online
Marketplace
MercadoLibre
2
2,990
247,973
5,159,484
Argentina
6.7%
817,124
6,584,378
8.6%
Consumer
Staples
Packaged
Food
Danone
15,000
948,276
967,838
France
1.2%
Personal
Care
Products
L'Oreal
3,400
1,099,801
1,679,092
France
2.2%
2,048,077
2,646,930
3.4%
Health
Care
Health
Care
Supplies
Alcon
24,550
1,281,620
2,188,141
Switzerland
2.9%
Large
Pharma
AstraZeneca
ADR
17,000
1,023,786
1,326,340
United
States
1.7%
Novartis
ADR
8,925
420,260
920,435
Switzerland
1.2%
Novo
Nordisk
ADR
56,350
345,311
7,623,028
Denmark
9.9%
1,789,357
9,869,803
12.8%
Medical
Equipment
Siemens
Healthineers
AG
31,850
1,816,966
1,859,525
Germany
2.4%
4,887,943
13,917,469
18.1%
Industrials
Commercial
&
Residential
Building
Equipment
&
Systems
Assa
Abloy
AB
-
B
51,400
1,222,737
1,511,464
Sweden
2.0%
Johnson
Controls
International
20,700
1,347,733
1,488,537
United
States
1.9%
2,570,470
3,000,001
3.9%
Electrical
Power
Equipment
Eaton
6,875
1,130,243
2,288,344
Ireland
3.0%
Schneider
Electric
SE
8,200
1,559,393
2,046,775
France
2.6%
2,689,636
4,335,119
5.6%
Industrial
Automation
Controls
ABB
Ltd
22,500
1,141,025
1,240,823
Switzerland
1.6%
Industrial
Wholesale
&
Rental
Ferguson
13,635
2,387,112
2,805,265
United
States
3.6%
Rail
Freight
Canadian
National
Railway
10,000
1,164,265
1,273,300
Canada
1.7%
9,952,508
12,654,508
16.4%
Materials
Basic
&
Diversified
Chemicals
Linde
5,500
1,397,250
2,395,360
United
Kingdom
3.1%
Iron
BHP
Biliton
ADR
17,000
990,319
1,012,010
Australia
1.3%
The
accompanying
notes
are
an
integral
part
of
these
financial
statements.
Common
Stock
-
96.4%
Number
of
Shares
Cost
Market
Value
Country
1
Percentage
of
Net
Assets
Materials
(continued)
Iron
(continued)
Rio
Tinto
ADR
32,800
$
1,773,219
$
2,299,280
United
Kingdom
3.0%
2,763,538
3,311,290
4.3%
Specialty
Chemicals
Givaudan
(reg)
200
682,611
943,069
Switzerland
1.2%
4,843,399
6,649,719
8.6%
Technology
Application
Software
Dassault
Systemes
ADR
88,115
998,519
3,572,182
France
4.7%
NICE
Systems
ADR
15,250
577,019
2,799,443
Israel
3.6%
OpenText
37,050
1,492,246
1,083,713
Canada
1.4%
SAP
ADR
14,500
2,088,316
2,645,380
Germany
3.4%
5,156,100
10,100,718
13.1%
Consumer
Electronics
Nintendo
17,000
724,213
925,174
Japan
1.2%
IT
Services
Accenture,
Class
A
3,000
554,430
846,870
Ireland
1.1%
Experian
33,000
1,053,313
1,527,904
Ireland
2.0%
Wolters
Kluwer
31,000
578,573
4,946,679
Netherlands
6.4%
2,186,316
7,321,453
9.5%
Semiconductor
Devices
Infineon
Technologies
AG
34,850
1,302,845
1,410,692
Germany
1.9%
STMicroelectronics
ADR
38,200
1,489,346
1,603,254
Switzerland
2.1%
2,792,191
3,013,946
4.0%
Semiconductor
Manufacturing
ASML
Holding
NY
5,475
190,945
5,257,916
Netherlands
6.8%
Taiwan
Semiconductor
ADR
23,320
2,419,020
3,522,253
Taiwan
4.6%
2,609,965
8,780,169
11.4%
13,468,785
30,141,460
39.2%
Utilities
Power
Generation
Iberdrola
104,317
1,064,673
1,377,553
Spain
1.8%
Total
investments
$37,174,997
$
74,180,110
96.4%
Other
assets
(net
of
liabilities)
2,800,011
3.6%
Total
net
assets
$
76,980,121
100.0%
1
Country
of
domicile
2
Non-income
producing
ADR:
American
Depositary
Receipt
The
accompanying
notes
are
an
integral
part
of
these
financial
statements.
Statement
of
Assets
and
Liabilities
Statement
of
Operations
As
of
May
31,
2024
Assets
Investments
in
securities,
at
value
(Cost
$37,174,997)
$
74,180,110
Cash
2,630,886
Dividends
receivable
221,635
Prepaid
expenses
16,831
Receivable
for
Fund
shares
sold
6,462
Total
assets
77,055,924
Liabilities
Accrued
advisory
fees
32,486
Payable
for
Fund
shares
redeemed
12,538
Accrued
12b-1
distribution
fees
9,613
Accrued
trustee
expenses
6,649
Accrued
audit
expenses
2,472
Accrued
retirement
plan
custody
fee
1,931
Accrued
Chief
Compliance
Officer
expenses
1,815
Accrued
legal
expenses
1,461
Accrued
other
operating
expenses
2,344
Accrued
printing
fees
4,494
Total
liabilities
75,803
Net
assets
$76,980,121
Analysis
of
net
assets
Paid-in
capital
(unlimited
shares
authorized,
without
par
value)
$39,180,193
Total
distributable
earnings
37,799,928
Net
assets
applicable
to
Fund
shares
outstanding
$76,980,121
Net
asset
value
per
Investor
Shares
SSIFX
Net
assets,
at
value
$45,561,865
Shares
outstanding
1,955,249
Net
asset
value,
offering
and
redemption
price
per
share
$23.30
Net
asset
value
per
Z
Shares
SIFZX
Net
assets,
at
value
$31,418,256
Shares
outstanding
1,342,865
Net
asset
value,
offering
and
redemption
price
per
share
$23.40
Period
ended
May
31,
2024
Investment
income
Dividend
Income
(Net
of
foreign
tax
of
$76,228)
$
629,874
Total
investment
income
629,874
Expenses
Investment
advisory
fees
181,027
12b-1
distribution
fees
53,221
Audit
fees
20,000
Filing
and
registration
fees
17,049
Trustee
fees
11,483
Chief
Compliance
Officer
expenses
11,461
Legal
fees
8,849
Custodian
fees
3,554
Retirement
plan
custodial
fees
2,150
1,125
Investor
Shares
136
1,150
Z
Shares
2,014
ReFlow
fees
1,799
Other
operating
expenses
5,523
Total
gross
expenses
316,116
Less
custodian
fee
credits
(3,554)
Net
expenses
312,562
Net
investment
income
$317,312
Net
realized
gain
from
investments
and
foreign
currency
$1,113,756
A
Net
Increase
in
unrealized
appreciation
on
investments
and
foreign
currency
6,456,201
Net
gain
on
investments
7,569,957
Net
increase
in
net
assets
resulting
from
operations
$7,887,269
A
Includes
$321,261
in
net
realized
gains
from
redemptions
in-kind
The
accompanying
notes
are
an
integral
part
of
these
financial
statements.
Statements
of
Changes
in
Net
Assets
Period
ended
May
31,
2024
Year
ended
November
30,
2023
Increase
in
net
assets
from
operations
From
operations
Net
investment
income
$317,312
$318,734
Net
realized
gain
on
investments
and
foreign
currency
1,113,756
693,030
Net
increase
in
unrealized
appreciation
on
investments
and
foreign
currency
6,456,201
7,566,421
Net
increase
in
net
assets
7,887,269
8,578,185
Distributions
to
shareowners
from
1,125
Net
dividend
and
distribution
to
shareholders
-
Investor
Shares
(132,998)
–
1,150
Net
dividend
and
distribution
to
shareholders
-
Z
Shares
(155,645)
–
Total
distributions
(288,643)
–
Capital
share
transactions
Proceeds
from
the
sale
of
shares
1,125
Investor
Shares
6,625,179
3,809,054
1,150
Z
Shares
3,632,792
4,771,807
Value
of
shares
issued
in
reinvestment
of
dividends
and
distributions
1,125
Investor
Shares
130,108
–
1,150
Z
Shares
148,724
–
Cost
of
shares
redeemed
1,125
Investor
Shares
(2,748,562)
(4,606,292)
1,150
Z
Shares
(2,705,273)
(5,094,933)
Total
capital
shares
transactions
5,082,968
(1,120,364)
Total
increase
in
net
assets
12,681,594
7,457,821
Net
assets
Beginning
of
period
64,298,527
56,840,706
End
of
period
$76,980,121
$64,298,527
Shares
of
the
Fund
sold
and
redeemed
Investor
Shares
(SSIFX)
Number
of
shares
sold
291,720
196,993
Number
of
shares
issued
in
reinvestment
of
dividends
and
distributions
5,990
–
Number
of
shares
redeemed
(121,849)
(241,734)
Net
increase
(decrease)
in
number
of
shares
outstanding
175,861
(44,741)
Z
Shares
(SIFZX)
Number
of
shares
sold
159,550
248,209
Number
of
shares
issued
in
reinvestment
of
dividends
and
distributions
6,825
–
Number
of
shares
redeemed
(118,211)
(265,131)
Net
increase
(decrease)
in
number
of
shares
outstanding
48,164
(16,922)
–
–
Sextant
International
Fund:
Financial
Highlights
The
accompanying
notes
are
an
integral
part
of
these
financial
statements.
tin
Investor
Shares
(SSIFX)
Selected
data
per
share
of
outstanding
capital
stock
throughout
each
period:
Period
ended
May
31,
2024
Year
ended
November
30,
2023
2022
2021
2020
2019
A
A
A
A
A
A
A
Net
asset
value
at
beginning
of
period
$20.87
$18.11
$23.49
$19.62
$18.50
$16.83
Income
from
investment
operations
Net
investment
income
A
0.09
0.08
0.09
0.10
0.12
0.12
Net
gains
(losses)
on
securities
(both
realized
and
unrealized)
2.42
2.68
(3.58)
3.85
1.66
2.74
Total
from
investment
operations
2.51
2.76
(3.49)
3.95
1.78
2.86
Less
distributions
Dividends
(from
net
investment
income)
(0.08)
–
(0.13)
(0.08)
(0.11)
(0.15)
Distributions
(from
capital
gains)
–
–
(1.76)
–
(0.55)
(1.04)
Total
distributions
(0.08)
–
(1.89)
(0.08)
(0.66)
(1.19)
Net
asset
value
at
end
of
period
$23.30
$20.87
$18.11
$23.49
$19.62
$18.50
Total
Return
B
12.03%
15.24%
(16.31)%
20.16%
9.86%
18.82%
Ratios
/
supplemental
data
Net
assets
($000),
end
of
period
$45,562
$37,141
$33,029
$46,560
$51,141
$67,390
Ratio
of
expenses
to
average
net
assets
Before
custodian
fee
credits
C
0.97%
1.06%
1.28%
0.93%
0.83%
1.07%
After custodian
fee
credits
C
0.96%
1.05%
1.27%
0.92%
0.82%
1.06%
Ratio
of
net
investment
income
after
custodian
fee
credits to
average
net
assets
C
0.79%
0.43%
0.48%
0.46%
0.70%
0.62%
Portfolio
turnover
rate
B
6%
16%
33%
22%
16%
6%
Z
Shares
(SIFZX)
Selected
data
per
share
of
outstanding
capital
stock
throughout
each
period:
Period
ended
May
31,
2024
Year
ended
November
30,
2023
2022
2021
2020
2019
A
A
A
A
A
A
A
Net
asset
value
at
beginning
of
period
$20.98
$18.15
$23.55
$19.67
$18.55
$16.87
Income
from
investment
operations
Net
investment
income
A
0.12
0.13
0.13
0.15
0.15
0.19
Net
gains
(losses)
on
securities
(both
realized
and
unrealized)
2.42
2.70
(3.59)
3.85
1.67
2.72
Total
from
investment
operations
2.54
2.83
(3.46)
4.00
1.82
2.91
Less
distributions
Dividends
(from
net
investment
income)
(0.12)
–
(0.18)
(0.12)
(0.15)
(0.19)
Distributions
(from
capital
gains)
–
–
(1.76)
–
(0.55)
(1.04)
Total
distributions
(0.12)
–
(1.94)
(0.12)
(0.70)
(1.23)
Net
asset
value
at
end
of
period
$23.40
$20.98
$18.15
$23.55
$19.67
$18.55
Total
Return
B
12.15%
15.59%
(16.17)%
20.42%
10.09%
19.14%
Ratios
/
supplemental
data
Net
assets
($000),
end
of
period
$31,418
$27,157
$23,812
$28,929
$26,921
$30,963
Ratio
of
expenses
to
average
net
assets
Before
custodian
fee
credits
C
0.73%
0.83%
1.04%
0.72%
0.63%
0.85%
After custodian
fee
credits
C
0.72%
0.82%
1.03%
0.71%
0.63%
0.84%
Ratio
of
net
investment
income
after
custodian
fee
credits to
average
net
assets
C
1.00%
0.66%
0.72%
0.68%
0.87%
0.91%
Portfolio
turnover
rate
B
6%
16%
33%
22%
16%
6%
A
Calculated
using
average
shares
outstanding
B
Not
annualized
for
period
of
less
than
one
year
C
Annualized
for
periods
of
less
than
one
year
Notes
To
Financial
Statements
Note
1
–
Organization
Saturna
Investment
Trust
(the
“Trust”)
was
established
under
Washington
State
Law
as
a
business
trust
on
February
20,
1987.
The
Trust
is
registered
as
an
open-end,
diversified
management
company
under
the
Investment
Company
Act
of
1940,
as
amended.
The
Trust
currently
offers
shares
of
eight
portfolio
series:
Sextant
Short-Term
Bond
Fund,
Sextant
Bond
Income
Fund,
Sextant
Core
Fund,
Sextant
Global
High
Income
Fund,
Sextant
Growth
Fund,
Sextant
International
Fund
(each,
a
“Fund”,
and
collectively,
the
“Funds”),
Saturna
Sustainable
Equity
Fund,
and
Saturna
Sustainable
Bond
Fund.
Saturna
Sustainable
Equity
Fund
and
Saturna
Sustainable
Bond
Fund
are
offered
through
separate
prospectuses
and
have
a
separate
shareholder
report.
Sextant
Growth
Investor
Shares
(previously
known
as
Idaho
Limited
Maturity
Tax-Exempt
Fund
until
October
12,
1990,
then
Northwest
Growth
Fund
until
September
28,
1995,
when
the
investment
objective
of
only
Northwest
stocks
was
changed)
commenced
operations
as
an
equity
fund
on
December
30,
1990.
Sextant
Growth
Fund
Z
Shares
began
operations
June
2,
2017.
Sextant
International
Investor
Shares
began
operations
September
28,
1995
and
Sextant
International
Fund
Z
Shares
began
operations
on
June
2,
2017.
Sextant
Short-Term
Bond
began
operations
September
28,
1995.
Sextant
Bond
Income
Fund
(previously
known
as
Washington
Tax-Exempt
Fund
until
September
28,
1995,
when
the
investment
objective
of
only
Washington
State
Municipal
Bonds
was
changed)
began
operations
on
March
1,
1993.
Sextant
Core
Fund
commenced
operations
March
30,
2007.
Sextant
Global
High
Income
Fund
commenced
operations
March
30,
2012.
Each
Fund
is
an
investment
company
and
accordingly
follows
the
investment
company
accounting
and
reporting
guidance
of
the
Financial
Accounting
Standards
Board
(FASB)
Accounting
Standard
Codification
Topic
946
“Financial
Services
-
Investment
Companies”.
Each
class
of
shares
of
a
Fund
represents
an
interest
in
the
same
portfolio
of
investments
of
the
Fund
and
has
in
all
respects
the
same
rights
and
obligations
as
each
other
class
of
the
Fund,
except
that
each
class
bears
its
own
class
expenses,
and
each
class
has
exclusive
voting
rights
on
matters
affecting
that
class.
Each
class
of
shares
may
be
subject
to
different
investment
minimums
and
other
conditions
of
eligibility
as
may
be
described
in
the
prospectus
for
the
particular
class
of
shares,
as
from
time
to
time
in
effect.
Income,
realized
and
unrealized
capital
gains
and
losses,
and
expenses
to
be
paid
by
a
Fund
and
not
allocated
to
a
particular
class
as
provided
below,
shall
be
allocated
to
each
class
on
the
basis
of
relative
net
assets.
Expenses
allocable
to
a
specific
class
are
expenses
specifically
incurred
by
or
for
such
class
including
the
following:
Distribution
fees;
Retirement
plan
custodial
fees;
and
Any
applicable
service
fees.
Net
investment
income
dividends
and
capital
gain
distributions
paid
by
the
Fund
on
each
class
of
its
shares
will
be
calculated
in
the
same
manner
on
the
same
day
and
at
the
same
time.
Investment
risks:
Growth
,
International,
Core,
Short-Term
Bond,
Bond
Income,
and
Global
High
Income
Funds
:
The
value
of
each
Fund’s
shares
rises
and
falls
as
the
value
of
the
securities
in
which
the
Fund
invests
goes
up
and
down.
Fund
share
prices,
yields,
and
total
returns
will
change
with
market
fluctuations
as
well
as
the
fortunes
of
the
countries,
industries,
and
companies
in
which
the
Fund
invests.
The
Funds
do
not
use
derivatives
to
hedge
currency,
interest
rate,
or
credit
risk.
Liquidity
risk
exists
when
particular
investments
are
difficult
to
sell.
If
a
Fund
holds
illiquid
investments,
its
portfolio
may
be
more
difficult
to
value,
especially
in
changing
markets.
Investments
by
a
Fund
in
foreign
securities
and
those
that
are
thinly
traded,
such
as
lower
quality
issuers
and
smaller
companies,
tend
to
involve
greater
liquidity
risk.
If
a
Fund
is
forced
to
sell
or
unwind
these
investments
to
meet
redemptions
or
for
other
cash
needs,
the
Fund
may
suffer
a
penalty.
Additionally,
the
market
for
certain
investments
may
become
illiquid
under
adverse
market
or
economic
conditions
independent
of
any
specific
adverse
changes
in
the
conditions
of
a
particular
issuer.
In
such
cases,
the
Fund,
due
to
limitations
on
investments
in
illiquid
securities
and
the
difficulty
in
purchasing
and
selling
such
securities,
may
be
unable
to
achieve
its
investment
objective.
Growth
and
Core
Funds
:
Smaller
companies
involve
higher
investment
risks
in
that
they
often
have
limited
product
lines,
markets,
and
resources,
or
their
securities
may
trade
less
frequently
and
have
greater
price
fluctuation
than
those
of
larger
companies.
Growth
stocks,
which
can
be
priced
on
future
expectations
rather
than
current
results,
may
decline
substantially
when
expectations
are
not
met.
International
,
Core
,
Short-Term
Bond
,
Bond
Income
,
and
Global
High
Income
Funds
:
Foreign
investing
involves
risks
not
normally
associated
with
investing
in
US
securities.
These
include
fluctuations
in
currency
exchange
rates,
less
public
information
about
securities,
less
governmental
market
supervision,
and
the
lack
of
uniform
financial,
social,
and
political
standards.
Foreign
investing
heightens
the
risk
of
confiscatory
taxation,
seizure
or
nationalization
of
assets,
currency
controls,
or
adverse
political
or
social
developments
that
affect
investments.
The
risks
of
investing
in
foreign
securities
are
typically
greater
in
less
developed
or
emerging
countries.
Core
Fund
:
The
Core
Fund
has
the
risks
of
growth
stocks,
foreign
securities,
credit,
and
interest
rates
—
but
these
risks
are
mitigated
by
spreading
its
investments
in
both
stocks
and
bonds,
and
by
favoring
income-producing
securities
and
those
of
larger,
more
seasoned
companies.
Short-Term
Bond,
Bond
Income
,
Global
High
Income
,
and
Core
Funds
:
Bonds
entail
credit
risk,
which
is
the
possibility
that
a
bond
will
not
be
able
to
pay
interest
or
principal
when
due.
If
the
credit
quality
of
a
bond
is
perceived
to
decline,
investors
will
demand
a
higher
yield,
which
means
a
lower
price
on
that
bond
to
compensate
for
the
higher
level
of
risk.
Interest
rate
fluctuations
affect
bond
prices
and
a
Fund’s
net
asset
value,
but
not
the
income
received
by
the
Fund
from
its
portfolio
securities.
Because
prices
and
yields
on
debt
securities
vary
over
time,
a
Fund’s
yield
also
varies.
Bonds
with
embedded
callable
options
also
contain
an
element
of
prepayment
risk.
When
interest
rates
decline,
issuers
can
retire
their
debt
and
reissue
bonds
at
a
lower
interest
rate.
This
hurts
investors
because
yields
available
for
reinvestment
will
have
declined
and
upward
price
mobility
on
callable
bonds
is
generally
limited
by
the
call
price.
Notes
To
Financial
Statements
(continued)
Global
High
Income
Fund
:
Issuers
of
high-yield
securities
are
generally
not
as
financially
strong
as
those
issuing
higher
quality
securities.
These
issuers
are
more
likely
to
encounter
financial
difficulties
and
are
more
vulnerable
to
changes
in
the
relevant
economy,
such
as
a
recession
or
a
sustained
period
of
rising
interest
rates,
that
could
affect
their
ability
to
make
interest,
principal,
and
dividend
payments
as
expected.
The
prices
of
high-yield
securities
generally
fluctuate
more
than
those
of
higher
quality.
High-yield
securities
are
generally
more
illiquid
(harder
to
sell)
and
harder
to
value.
The
Funds
may
invest
substantially
in
one
or
more
sectors,
which
can
increase
volatility
and
exposure
to
issuers
specific
to
a
particular
sector
or
industry.
Note
2
–
Unaudited
Information
The
information
in
this
interim
report
has
not
been
subject
to
independent
audit.
Note
3
–
Significant
Accounting
Policies
The
following
is
a
summary
of
the
significant
accounting
policies,
in
conformity
with
accounting
principles
generally
accepted
in
the
United
States
of
America,
which
are
consistently
followed
by
the
Funds
in
preparation
of
their
financial
statements.
Security
valuation:
Investments
in
securities
traded
on
a
national
securities
exchange
and
over-the-counter
securities
for
which
sale
prices
are
available
are
valued
at
that
price.
Securities
for
which
there
are
no
sales
are
valued
at
the
latest
bid
price.
Debt
securities
are
valued
using
bid-side
valuations
provided
by
an
independent
service.
The
service
determines
valuations
using
factors
such
as
yields
or
prices
of
bonds
of
comparable
quality,
type
of
issue,
coupon
maturity,
ratings,
trading
activity,
and
general
market
conditions.
Fixed-income
debt
instruments,
such
as
commercial
paper,
bankers’
acceptances,
and
US
Treasury
Bills,
with
a
maturity
of
60
days
or
less
are
valued
at
amortized
cost,
which
approximates
market
value.
Any
discount
or
premium
is
accreted
or
amortized
on
a
straight-line
basis
until
maturity.
Foreign
markets
may
close
before
the
time
as
of
which
the
Funds’
share
prices
are
determined.
Because
of
this,
events
occurring
after
the
close
and
before
the
determination
of
the
Funds’
share
prices
may
have
a
material
effect
on
the
values
of
some
or
all
of
the
Funds’
foreign
securities.
To
account
for
this,
the
Funds
may
use
outside
pricing
services
for
valuation
of
their
non-US
securities.
In
cases
in
which
there
is
not
a
readily
available
market
price,
a
fair
value
for
such
security
is
determined
in
good
faith
by
the
Funds'
investment
adviser
(Saturna
Capital),
whom
the
Board
of
Trustees
has
designated
as
the
Funds’
valuation
designee
to
perform
fair
value
determinations
relating
to
all
Fund
investments.
Security
transactions
are
recorded
on
the
trade
date.
Realized
gains
and
losses
on
sales
of
securities
are
recorded
on
the
identified
cost
basis.
Foreign
currency:
Investment
securities
and
other
assets
and
liabilities
denominated
in
foreign
currencies
are
translated
into
US
dollar
amounts
at
the
date
of
valuation.
Purchases
and
sales
of
investment
securities
and
income
and
expense
items
denominated
in
foreign
currencies
are
translated
into
US
dollar
amounts
on
the
respective
dates
of
such
transactions.
The
Funds
do
not
isolate
that
portion
of
the
results
of
operations
resulting
from
changes
in
foreign
exchange
rates
on
investments
from
the
fluctuations
arising
from
changes
in
market
prices
of
securities
held.
Such
fluctuations
are
included
with
the
net
realized
and
unrealized
gain
or
loss
from
investments.
Reported
net
realized
foreign
exchange
gains
or
losses
arise
from
sales
of
foreign
currencies,
currency
gains
or
losses
realized
between
the
trade
and
settlement
dates
on
securities
transactions,
and
the
difference
between
the
amounts
of
dividends,
interest,
and
foreign
withholding
taxes
recorded
on
the
Funds’
books
and
the
US
dollar
equivalent
of
the
amounts
actually
received
or
paid.
Net
unrealized
foreign
exchange
gains
and
losses
arise
from
changes
in
the
fair
values
of
assets
and
liabilities,
other
than
investments
in
securities
at
fiscal
period
end,
resulting
from
changes
in
exchange
rates.
Share
valuation:
Each
Fund
computes
the
share
price
of
each
share
class
by
dividing
the
net
assets
attributable
to
each
share
class
by
the
outstanding
shares
of
that
class.
Each
share
class
represents
an
interest
in
the
same
investment
portfolio.
Each
share
class
is
identical
in
all
respects
except
that
each
class
bears
its
own
class
expenses,
and
each
class
has
exclusive
voting
rights
on
matters
affecting
that
class.
As
a
result
of
the
differences
in
the
expenses
borne
by
each
share
class,
the
share
price
and
distributions
will
vary
among
a
Fund’s
share
classes.
The
Funds’
shares
are
not
priced
or
traded
on
days
the
New
York
Stock
Exchange
is
closed.
The
NAV
is
both
the
offering
and
redemption
price
per
share.
Share
Valuation
Inputs
as
of
May
31,
2024
Level
1
Level
2
Level
3
Funds
Quoted
Price
Significant
Observable
Input
Significant
Unobservable
Input
Total
Short-Term
Bond
Fund
Corporate
Bonds
1
$–
$6,149,922
$–
$6,149,922
Government
Bonds
1
$–
$4,190,552
$–
$4,190,552
Total
Assets
$–
$10,340,474
$–
$10,340,474
Bond
Income
Fund
Corporate
Bonds
1
$–
$6,523,123
$–
$6,523,123
Government
Bonds
1
$–
$2,712,498
$–
$2,712,498
Total
Assets
$–
$9,235,621
$–
$9,235,621
Note
1
–
Organization
(continued)
Notes
To
Financial
Statements
(continued)
Fair
value
measurements:
Accounting
Standards
Codification
(ASC)
820
establishes
a
three-
tier
framework
for
measuring
fair
value
based
on
a
hierarchy
of
inputs.
The
hierarchy
distinguishes
between
market
data
obtained
from
independent
sources
(observable
inputs)
and
the
Funds’
own
market
assumptions
(unobservable
inputs).
These
inputs
are
used
in
determining
the
value
of
the
Funds’
investments
and
are
summarized
below.
Level
1
-
Unadjusted
quoted
prices
in
active
markets
for
identical
assets
or
liabilities
that
the
Trust
has
the
ability
to
access.
Level
2
-
Observable
inputs
other
than
quoted
prices
in
Level
1
that
are
observable
for
the
asset
or
liability,
either
directly
or
indirectly.
These
inputs
may
include
quoted
prices
for
the
identical
instrument
on
an
inactive
market,
prices
for
similar
instruments,
interest
rates,
prepayment
speeds,
credit
risk,
yield
curves,
default
rates,
and
similar
data.
Core
Fund
Common
Stock
Communications
$431,250
$–
$–
$431,250
Consumer
Discretionary
$1,258,407
$59,371
$–
$1,317,778
Consumer
Staples
$1,123,949
$–
$–
$1,123,949
Energy
$619,501
$–
$–
$619,501
Financials
$930,113
$–
$–
$930,113
Health
Care
$1,852,264
$–
$–
$1,852,264
Industrials
$2,655,344
$153,908
$–
$2,809,252
Materials
$1,047,261
$192,684
$–
$1,239,945
Technology
$3,735,181
$–
$–
$3,735,181
Utilities
$891,999
$–
$–
$891,999
Total
Common
Stock
$14,545,269
$405,963
$–
$14,951,232
Corporate
Bonds
1
$–
$4,620,295
$–
$4,620,295
Government
Bonds
1
$–
$3,878,977
$–
$3,878,977
Municipals
Bonds
1
$–
$103,390
$–
$103,390
Total
Assets
$14,545,269
$9,008,625
$–
$23,553,894
Global
High
Income
Fund
Common
Stock
Communications
$709,380
$232,903
$–
$942,283
Consumer
Discretionary
$–
$188,587
$–
$188,587
Energy
$433,814
$–
$–
$433,814
Financials
$447,900
$356,398
$–
$804,298
Health
Care
$566,575
$–
$–
$566,575
Materials
$1,177,914
$236,889
$–
$1,414,803
Technology
$232,500
$272,110
$–
$504,610
Total
Common
Stock
$3,568,083
$1,286,887
$–
$4,854,970
Corporate
Bonds
1
$–
$2,734,867
$–
$2,734,867
Government
Bonds
1
$–
$243,031
$–
$243,031
Municipals
Bonds
1
$–
$49,007
$–
$49,007
Total
Assets
$3,568,083
$4,313,792
$–
$7,881,875
Growth
Fund
Common
Stock
1
$66,650,440
$–
$–
$66,650,440
Total
Assets
$66,650,440
$–
$–
$66,650,440
International
Fund
Common
Stock
Communications
$208,093
$–
$–
$208,093
Consumer
Discretionary
$5,159,484
$1,424,894
$–
$6,584,378
Consumer
Staples
$–
$2,646,930
$–
$2,646,930
Health
Care
$12,057,944
$1,859,525
$–
$13,917,469
Industrials
$7,855,446
$4,799,062
$–
$12,654,508
Materials
$5,706,650
$943,069
$–
$6,649,719
Technology
$21,331,011
$8,810,449
$–
$30,141,460
Utilities
$–
$1,377,553
$–
$1,377,553
Total
Common
Stock
$52,318,628
$21,861,482
$–
$74,180,110
Total
Assets
$52,318,628
$21,861,482
$–
$74,180,110
1
See
the
Schedule
of
Investments
for
additional
details.
Note
3
–
Significant
Accounting
Policies
(continued)
Notes
To
Financial
Statements
(continued)
Level
3
−
Unobservable
inputs
for
the
asset
or
liability,
to
the
extent
relevant
observable
inputs
are
not
available,
representing
the
Trust’s
own
assumptions
about
the
assumptions
a
market
participant
would
use
in
valuing
the
asset
or
liability,
and
would
be
based
on
the
best
information
available.
The
availability
of
observable
inputs
can
vary
from
security
to
security
and
is
affected
by
a
wide
variety
of
factors,
including,
for
example,
the
type
of
security,
whether
the
security
is
new
and
not
yet
established
in
the
marketplace,
the
liquidity
of
markets,
and
other
characteristics
particular
to
the
security.
To
the
extent
that
valuation
is
based
on
models
or
inputs
that
are
less
observable
or
unobservable
in
the
market,
the
determination
of
fair
value
requires
more
judgment.
Accordingly,
the
degree
of
judgment
exercised
in
determining
fair
value
is
greatest
for
instruments
categorized
in
Level
3.
The
inputs
used
to
measure
fair
value
may
fall
into
different
levels
of
the
fair
value
hierarchy.
In
such
cases,
for
disclosure
purposes,
the
level
in
the
fair
value
hierarchy
within
which
the
fair
value
measurement
falls
in
its
entirety
is
determined
based
on
the
lowest
level
input
that
is
significant
to
the
fair
value
measurement
in
its
entirety.
The
inputs
or
methodology
used
for
valuing
securities
are
not
necessarily
an
indication
of
the
risk
associated
with
investing
in
those
securities.
Investment
concentration:
The
Funds
may
have
deposits
of
cash
with
the
custodian
from
time
to
time
for
one
or
more
reasons.
“Other
assets
(net
of
liabilities)”
in
the
Funds’
Schedules
of
Investments
primarily
represents
cash
on
deposit
with
the
custodian.
Cash
on
deposit
will
vary
widely
over
time.
Accounting
Standards
Codification
(“ASC”)
825,
“Financial
Instruments,”
identifies
these
items
as
a
concentration
of
credit
risk.
The
risk
is
managed
by
careful
financial
analysis
and
review
of
the
custodian’s
operations,
resources,
and
protections
available
to
the
Trust.
This
process
includes
evaluation
of
other
financial
institutions
providing
investment
company
custody
services.
ReFlow
Liquidity
Program:
The
Funds
may
participate
in
the
ReFlow
Fund,
LLC
("ReFlow")
liquidity
program,
which
is
designed
to
provide
an
alternative
liquidity
source
on
days
when
redemptions
of
Fund
shares
exceed
purchases.
Under
the
program,
ReFlow
is
available
to
provide
cash
to
the
Funds
to
meet
all,
or
a
portion,
of
daily
net
shareowner
redemptions.
Following
purchases
of
Fund
shares,
ReFlow
then
generally
redeems
those
shares
when
the
Fund
experiences
net
sales,
at
the
end
of
a
maximum
holding
period
determined
by
ReFlow
(currently
8
days)
or
at
other
times
at
ReFlow's
discretion.
For
use
of
the
ReFlow
service,
a
participating
Fund
pays
a
fee
to
ReFlow
each
time
it
purchases
Fund
shares,
calculated
by
applying
to
the
purchase
amount
a
fee
rate
determined
through
an
automated
daily
"Dutch
auction"
among
other
participating
mutual
funds
seeking
liquidity
that
day.
The
current
minimum
fee
rate
is
0.14%
of
the
value
of
the
Fund
shares
purchased
by
ReFlow,
although
the
Fund
may
submit
a
bid
at
a
higher
fee
rate
if
it
determines
that
doing
so
is
in
the
best
interest
of
Fund
shareowners.
In
accordance
with
federal
securities
laws,
ReFlow
is
prohibited
from
acquiring
more
than
3%
of
the
outstanding
voting
securities
of
a
Fund.
ReFlow
will
periodically
redeem
its
entire
share
position
in
the
Fund
and
request
that
such
redemption
be
met
in
kind
in
accordance
with
the
Funds'
in-kind
redemption
policies.
There
is
no
assurance
that
ReFlow
will
have
sufficient
funds
available
to
meet
the
Funds’
liquidity
needs
on
a
particular
day.
During
the
fiscal
year
ended
May
31,
2024
,
only
the
Growth,
International,
and
Core
Funds
participated
in
ReFlow.
Fees
associated
with
ReFlow
are
disclosed
in
the
Statements
of
Operations.
Federal
income
taxes:
Each
Fund
intends
to
comply
with
the
requirements
of
the
Internal
Revenue
Code
necessary
to
qualify
as
a
regulated
investment
company
and
to
make
the
requisite
distributions
of
income
and
capital
gains
to
its
shareowners
sufficient
to
relieve
it
from
all
or
substantially
all
federal
income
taxes.
Therefore,
no
federal
income
tax
provision
is
required.
The
Funds
recognize
the
tax
benefits
of
uncertain
tax
positions
only
where
the
position
is
“more
likely
than
not”
to
be
sustained
assuming
examination
by
tax
authorities.
Management
has
analyzed
the
Funds’
tax
positions
and
has
concluded
that
no
liability
for
unrecognized
tax
benefits
should
be
recorded
related
to
uncertain
tax
positions
taken
on
returns
filed
for
open
tax
years
(2020
−
2022)
or
expected
to
be
taken
in
the
Funds’
2023
tax
returns.
The
Funds
identify
their
major
tax
jurisdiction
as
US
federal
and
foreign
jurisdictions
where
the
Funds
make
significant
investments;
however,
the
Funds
are
not
aware
of
any
tax
positions
for
which
it
is
reasonably
possible
that
the
total
amounts
of
unrecognized
tax
benefits
will
change
materially
in
the
next
12
months.
Reclassification
of
capital
accounts:
Accounting
principles
generally
accepted
in
the
United
States
of
America
require
that
certain
components
of
net
assets
relating
to
permanent
differences
be
reclassified
between
financial
and
tax
reporting.
These
reclassifications
are
as
of
the
fiscal
year
ended
November
30,
2023
,
and
have
no
effect
on
net
assets
or
NAV
per
share.
These
reclassifications
were
primarily
due
to
redemptions
in
kind
and
operating
losses
Distributions
to
shareowners:
For
the
Sextant
Short-Term
Bond
Fund
and
Sextant
Bond
Income
Fund
,
dividends
to
shareowners
from
net
investment
income
are
paid
daily
and
distributed
on
the
last
business
day
of
each
month.
For
the
Sextant
Core
Fund
,
Sextant
Global
High
Income
Fund
,
Sextant
Growth
Fund
,
and
Sextant
International
Fund
,
dividends
to
shareowners
from
net
investment
income,
if
any,
are
paid
annually,
typically
by
the
end
of
the
year.
Distributions
of
capital
gains,
if
any,
are
made
at
least
annually,
and
as
required
to
comply
with
federal
excise
tax
requirements.
Distributions
to
shareowners
are
Short-Term
Bond
Fund
Bond
Income
Fund
Distributable
earnings
$458
$3
Paid-in
Capital
$(458)
$(3)
Core
Fund
Global
High
Income
Fund
Distributable
earnings
$(728,625)
$(896)
Paid-in
Capital
$728,625
$896
Growth
Fund
International
Fund
Distributable
earnings
$(1,113,438)
$(1,216,988)
Paid-in
Capital
$1,113,438
$1,216,988
Note
3
–
Significant
Accounting
Policies
(continued)
Notes
To
Financial
Statements
(continued)
determined
in
accordance
with
income
tax
regulations
and
are
recorded
on
the
ex-dividend
date.
Dividends
are
paid
in
shares
of
the
Funds,
at
the
net
asset
value
on
the
payable
date.
Shareowners
may
elect
to
take
distributions
if
they
total
$10
or
more
in
cash.
Use
of
estimates:
The
preparation
of
financial
statements
in
conformity
with
accounting
principles
generally
accepted
in
the
United
States
of
America
requires
management
to
make
estimates
and
assumptions
that
affect
the
reported
amounts
of
assets
and
liabilities
and
disclosure
of
contingent
assets
and
liabilities
at
the
date
of
the
financial
statements
and
the
reported
amounts
of
increases
and
decreases
in
net
assets
during
the
reporting
period.
Actual
results
could
differ
from
those
estimates.
Foreign
taxes:
Withholding
taxes
on
foreign
dividends
are
paid
(a
portion
of
which
may
be
reclaimable)
or
provided
for
in
accordance
with
the
applicable
country’s
tax
rules
and
rates
and
are
disclosed
in
the
Statement
of
Operations.
Withholding
tax
reclaims
are
filed
in
certain
countries
to
recover
a
portion
of
the
amounts
previously
withheld.
The
Funds
record
a
reclaim
receivable
based
on
a
number
of
factors,
including
a
jurisdiction’s
legal
obligation
to
pay
reclaims
as
well
as
payment
history
and
market
convention.
LIBOR
Transition
Risks
A
Fund
may
invest
in
certain
debt
securities
or
other
financial
instruments
that
utilize
the
London
Interbank
Offered
Rate
(“LIBOR”)
as
a
benchmark
or
reference
rate
for
various
interest
rate
calculations.
A
benchmark
or
reference
rate
may
be
a
significant
factor
in
determining
the
cost
of
financing
to
a
Fund
or
an
investment’s
value
or
return
to
a
Fund,
and
may
be
used
in
other
ways
that
affect
a
Fund’s
investment
performance.
LIBOR
was
discontinued
as
a
floating
rate
benchmark
after
June
30,
2023.
It
is
anticipated
that
financial
instruments,
such
as
certain
floating
rate
bonds,
that
previously
utilized
LIBOR
have
transitioned
to
using
the
Secured
Overnight
Financing
Rate
(“SOFR”),
which
is
a
broad
measure
of
the
cost
of
overnight
borrowings
secured
by
US
Treasury
securities.
The
transition
from
LIBOR
to
SOFR
(or
any
other
replacement
rate)
may
lead
to
a
reduction
in
the
value
of
some
LIBOR-based
investments,
as
well
as
significant
market
uncertainty,
increased
volatility,
and
illiquidity
in
markets
for
various
instruments,
which
may
result
in
prolonged
adverse
market
conditions
and
impact
a
Fund’s
performance
or
NAV.
Other:
Interest
income
is
recognized
on
an
accrual
basis.
Premiums
on
securities
purchased
are
amortized,
and
discounts
are
accreted
using
the
yield
to
maturity
method
over
the
lives
of
the
respective
securities
or
where
applicable,
to
the
first
call
date
of
the
securities
with
premiums.
Dividends
from
equity
securities
are
recorded
as
income
on
the
ex-dividend
date
or
as
soon
as
information
is
available
to
the
Fund.
Note
4
–
Transactions
with
Affiliated
Persons
Under
contracts
approved
annually
by
the
Trust’s
Board
of
Trustees,
including
those
Trustees
who
are
not
parties
to
the
contract
or
“interested
persons”
(as
defined
in
the
Investment
Company
Act
of
1940)
of
such
parties
or
the
Trust
(the
“Independent
Trustees”),
Saturna
Capital
Corporation
(“Saturna
Capital”)
provides
investment
advisory
services
and
certain
other
administrative
services
required
to
conduct
Trust
business.
Expenses
incurred
by
the
Trust
on
behalf
of
the
Funds
(e.g.,
legal
fees)
are
allocated
to
the
Funds
on
the
basis
of
relative
daily
average
net
assets.
For
such
services,
each
of
the
Funds
pays
the
adviser
a
base
Investment
Advisory
and
Administrative
Services
Fee
of
0.50%
of
average
net
assets
per
annum,
payable
monthly
for
each
of
the
Funds.
In
addition,
the
adviser
has
agreed
to
certain
limits
on
other
expenses,
as
described
below.
The
adviser
has
undertaken
to
limit
expenses
through
March
31,
2024
of
Sextant
Short-Term
Bond
Fund
to
0.60%,
Sextant
Bond
Income
Fund
to
0.65%
and
Sextant
Global
High
Income
to
0.75%.
For
the
period
ended
May
31,
2024
,
the
advisory
fees
incurred
were
as
follows:
1
In
accordance
with
the
expense
limitation
noted
above,
for
the
period
ended
May
31,
2024
,
Saturna
Capital
waived
a
portion
of
the
advisory
fees
of
the
Sextant
Short-Term
Bond
Fund,
Sextant
Bond
Income
Fund,
and
Sextant
Global
High
Income
Fund.
The
adviser
cannot
recoup
previously
waived
fees.
Saturna
Brokerage
Services,
Inc.
(“SBS”),
a
discount
brokerage
and
subsidiary
of
Saturna
Capital
Corporation,
is
registered
as
a
broker-dealer
and
acts
as
distributor.
On
October
3,
2006,
the
Funds
adopted
a
Distribution
Plan
in
accordance
with
Rule
12b-1
under
the
1940
Act.
The
plan
provides
that
the
Funds
will
pay
a
fee
to
SBS
at
an
annual
rate
of
0.25%
of
the
average
net
assets
of
the
Funds.
On
June
2,
2017,
12b-1
fees
were
terminated
for
all
Funds
except
Sextant
Growth
Investor
Shares
and
Sextant
International
Investor
Shares.
SBS
is
used
to
effect
equity
portfolio
transactions
for
the
Trust.
SBS
currently
executes
portfolio
transactions
without
commission.
Transactions
effected
through
other
brokers
are
subject
to
commissions
payable
to
that
broker.
Advisory
Fees
Advisory
Fees
Waived
600
Short-Term
Bond
Fund
$27,275
$(16,225)
650
Bond
Income
Fund
$25,468
$(9,783)
700
Core
Fund
$59,319
n/a
750
Global
High
Income
Fund
$23,902
$(9,676)
800
Growth
Fund
$164,039
n/a
850
International
Fund
$181,027
n/a
Distribution
(12b-1)
fees
600
Short-Term
Bond
Fund
n/a
650
Bond
Income
Fund
n/a
700
Core
Fund
n/a
750
Global
High
Income
Fund
n/a
800
Growth
Fund
Z
Shares
(
SGZFX
)
n/a
800
Growth
Fund
Investor
Shares
(
SSGFX
)
$5,095
850
International
Fund
Z
Shares
(
SIFZX
)
n/a
850
International
Fund
Investor
Shares
(
SSIFX
)
$53,221
Note
3
–
Significant
Accounting
Policies
(continued)
Notes
To
Financial
Statements
(continued)
Saturna
Trust
Company
(“STC”),
a
subsidiary
of
Saturna
Capital,
acts
as
retirement
plan
custodian
for
the
Funds.
Each
class
of
shares
of
a
Fund
pays
an
annual
fee
of
$10
per
account
for
retirement
plan
services
to
Saturna
Trust
Company.
For
the
fiscal
period
ended
May
31,
2024
,
the
Funds
incurred
the
following
retirement
plan
custodial
fees
to
STC:
Ms.
Jane
Carten
serves
as
a
trustee
and
president
of
the
Trust.
She
is
also
a
director
and
president
of
Saturna
Capital,
vice
president
of
Saturna
Trust
Company,
and
chairman
of
Saturna
Sendirian
Berhad
.
Ms.
Carten
is
not
compensated
by
the
Trust.
For
the
fiscal
period
ended
May
31,
2024
,
the
Saturna
Investment
Trust
incurred
$40,899
of
total
expenses
for
the
independent
Trustee’s
compensation
and
Trust
board
meetings.
The
Sextant
Funds
incurred
$31,718
of
these
total
expenses.
On
May
31,
2024
,
the
trustees,
officers,
and
their
affiliates
(including
Saturna
Capital
Corporation)
as
a
group,
owned
the
following
percentages
of
outstanding
shares:
The
officers
of
the
Trust
are
paid
by
Saturna
Capital
Corporation,
not
the
Trust,
except
the
Chief
Compliance
Officer,
who
is
partially
compensated
by
the
Trust.
For
the
fiscal
period
ended
May
31,
2024
,
the
Funds
paid
the
following
compensation
expenses
for
the
Chief
Compliance
Officer:
Note
5
–
Distributions
to
Shareowners
The
tax
characteristics
of
distributions
paid
for
the
fiscal
period
ended
May
31,
2024
,
and
the
year
ended
November
30,
2023
,
were
as
follows:
Note
6
–
Federal
Income
Taxes
The
cost
basis
of
investments
for
federal
income
tax
purposes
at
May
31,
2024
,
were
as
follows:
Retirement
plan
custodial
fees
600
Short-Term
Bond
Fund
(STBFX)
$1,306
650
Bond
Income
Fund
(SBIFX)
$1,087
700
Core
Fund
(SCORX)
$1,279
750
Global
High
Income
Fund
(SGHIX)
$889
1,025
Growth
Fund
Investor
Shares
(SSGFX)
n/a
1,050
Growth
Fund
Z
Shares
(SGZFX)
$3,224
1,125
International
Fund
Investor
Shares
(SSIFX)
$136
1,150
International
Fund
Z
Shares
(SIFZX)
$2,014
Trustees',
officers',
and
affiliates'
ownership
600
Short-Term
Bond
Fund(STBFX)
48.70%
650
Bond
Income
Fund(SBIFX)
40.44%
700
Core
Fund(SCORX)
35.46%
750
Global
High
Income
Fund(SGHIX)
62.51%
800
Growth
Fund(SGZFX
and
SSGFX)
20.22%
850
International
Fund(SIFZX
and
SSIFX)
29.29%
Chief
Compliance
Officer
600
Short-Term
Bond
Fund
$2,000
650
Bond
Income
Fund
$1,795
700
Core
Fund
$3,809
750
Global
High
Income
Fund
$1,766
800
Growth
Fund
$10,943
850
International
Fund
$11,461
Short-Term
Bond
Fund
May
31,
2024
November
30,
2023
Ordinary
Income
$144,338
$221,971
Bond
Income
Fund
May
31,
2024
November
30,
2023
Ordinary
Income
$148,758
$279,913
Core
Fund
May
31,
2024
November
30,
2023
Ordinary
Income
$351,859
$250,849
Long-term
capital
gain
1
$–
$31,225
Global
High
Income
Fund
May
31,
2024
November
30,
2023
Ordinary
Income
$401,403
$305,551
Growth
Fund
May
31,
2024
November
30,
2023
Ordinary
Income
$32,415
$–
Long-term
capital
gain
1
$–
$1,301,342
International
Fund
May
31,
2024
November
30,
2023
Ordinary
Income
$288,643
$–
1
Long-Term
Capital
Gain
dividend
designated
at
20%
rate
pursuant
to
Section
852(b)(3)
of
the
Internal
Revenue
Code.
Short-Term
Bond
Fund
Bond
Income
Fund
Cost
of
investments
$10,593,231
$10,857,902
Gross
tax
unrealized
appreciation
$1,157
$8,290
Gross
tax
unrealized
depreciation
$(253,914)
$(1,630,571)
Net
tax
unrealized
depreciation
$(252,757)
$(1,622,281)
Core
Fund
Global
High
Income
Fund
Cost
of
investments
$18,475,529
$7,677,792
Gross
tax
unrealized
appreciation
$5,736,933
$1,072,686
Gross
tax
unrealized
depreciation
$(658,569)
$(868,603)
Net
tax
unrealized
appreciation
$5,078,364
$204,083
Growth
Fund
International
Fund
Cost
of
investments
$25,272,916
$37,174,997
Gross
tax
unrealized
appreciation
$41,499,078
$37,577,098
Gross
tax
unrealized
depreciation
$(121,554)
$(571,985)
Net
tax
unrealized
appreciation
$41,377,524
$37,005,113
Note
4
–
Transactions
with
Affiliated
Persons
(continued)
Notes
To
Financial
Statements
(continued)
As
of
November
30,
2023
,
the
components
of
distributable
earnings
on
a
tax
basis
were
as
follows:
At
November
30,
2023
,
the
Funds
had
the
following
capital
loss
carryforwards
and
loss
deferrals,
subject
to
regulation.
Loss
carryforwards
may
be
used
to
offset
future
net
capital
gains
realized
for
federal
income
tax
purposes.
Note
7
–
Investments
Investment
transactions
other
than
short-term
investments
and
redemptions
in-kind
for
the
fiscal
year
ended
May
31,
2024
,
were
as
follows:
Redemptions
in-kind
for
the
fiscal
period
ended
May
31,
2024
,
were
as
follows:
Note
8
–
Custodian
Under
agreements
in
place
with
the
Trust’s
custodian,
UMB
Bank,
custody
fees
are
reduced
by
credits
for
cash
balances.
For
the
fiscal
period
ended
May
31,
2024
,
such
reductions
were
as
follows:
Note
9
–
Subsequent
Events
There
were
no
other
events
or
transactions
during
the
period
that
materially
impacted
the
amounts
or
disclosures
in
the
Fund’s
financial
statements.
Short-Term
Bond
Fund
Accumulated
capital
and
other
losses
$(140,543)
Tax
accumulated
earnings
$(140,543)
Unrealized
Depreciation
$(312,777)
Total
accumulated
earnings
$(453,320)
Bond
Income
Fund
Accumulated
capital
and
other
losses
$(16,324)
Tax
accumulated
earnings
$(16,324)
Unrealized
Depreciation
$(1,638,070)
Total
accumulated
earnings
$(1,654,394)
Core
Fund
Undistributed
ordinary
income
$331,689
Accumulated
capital
gains
$
(8,009)
Tax
accumulated
earnings
$323,680
Unrealized
Appreciation
$3,622,380
Other
unrealized
accumulated
losses
$(9)
Total
accumulated
earnings
$3,946,051
Global
High
Income
Fund
Undistributed
ordinary
income
$401,917
Accumulated
capital
and
other
losses
$(15,483)
Tax
accumulated
earnings
$386,434
Unrealized
Depreciation
$(584,593)
Other
unrealized
accumulated
losses
$(23)
Total
accumulated
earnings
$(198,182)
Growth
Fund
Accumulated
capital
gains
$(252,087)
Tax
accumulated
earnings
$(252,087)
Unrealized
Appreciation
$36,372,431
Total
accumulated
earnings
$36,120,344
International
Fund
Undistributed
ordinary
income
$194,146
Accumulated
capital
and
other
losses
$(544,256)
Tax
accumulated
earnings
$(350,110)
Unrealized
Appreciation
$30,551,624
Other
unrealized
accumulated
losses
$1,985
Total
accumulated
earnings
$30,203,499
Short-Term
Bond
Fund
Bond
Income
Fund
Short
term
loss
carryforward
$47,267
$–
Long
term
loss
carryforward
$93,276
$16,324
Total
Capital
loss
carryforward
$140,543
$16,324
Core
Fund
Global
High
Income
Fund
Short
term
loss
carryforward
$8,009
$–
Long
term
loss
carryforward
$–
$15,483
Total
Capital
loss
carryforward
$8,009
$15,483
Growth
Fund
International
Fund
Short
term
loss
carryforward
$252,087
$544,256
Total
Capital
loss
carryforward
$252,087
$544,256
Purchases
Sales
600
Short-Term
Bond
Fund
$2,143,506
$1,135,000
650
Bond
Income
Fund
$787,687
$375,000
700
Core
Fund
$3,341,096
$2,781,769
750
Global
High
Income
Fund
$172,558
$402,402
800
Growth
Fund
$3,870,205
$5,096,815
850
International
Fund
$9,102,797
$4,366,133
Purchases
Sales
700
Core
Fund
$–
$292,024
800
Growth
Fund
$–
$2,230,362
850
International
Fund
$–
$526,557
Custodian
Fee
Credits
600
Short-Term
Bond
Fund
$221
650
Bond
Income
Fund
$207
700
Core
Fund
$510
750
Global
High
Income
Fund
$337
800
Growth
Fund
$1,328
850
International
Fund
$3,554
Note
6
–
Federal
Income
Taxes
(continued)
Availability
of
Quarterly
Portfolio
Information
(1)
The
Sextant
Funds
file
complete
schedules
of
portfolio
holdings
with
the
SEC
for
the
first
and
third
quarters
of
each
fiscal
year
as
an
exhibit
to
their
reports
on
Form
N-PORT.
(2)
The
Funds’
Form
N-PORT
reports
are
available
on
the
SEC’s
website
at
www.sec.gov
and
at
www.sextantfunds.com.
(3)
The
Funds
posts
a
complete
schedule
of
portfolio
holdings
after
the
end
of
each
month,
available
to
investors
at
www.
sextantfunds.com.
Privacy
Statement
At
Saturna
Capital
and
Saturna
Investment
Trust,
we
understand
the
importance
of
maintaining
the
privacy
of
your
financial
information.
We
want
to
assure
you
that
we
protect
the
confidentiality
of
any
personal
information
that
you
share
with
us.
In
addition,
we
do
not
sell
information
about
our
current
or
former
customers.
In
the
course
of
our
relationship,
we
gather
certain
nonpublic
information
about
you,
including
your
name,
address,
investment
choices,
and
account
information.
We
do
not
disclose
your
information
to
unaffiliated
third
parties
unless
it
is
necessary
to
process
a
transaction;
service
your
account;
deliver
your
account
statements,
shareowner
reports,
and
other
information;
or
as
required
by
law.
When
we
disclose
information
to
unaffiliated
third
parties,
we
require
a
contract
to
restrict
the
companies’
use
of
customer
information
and
from
sharing
or
using
it
for
any
purposes
other
than
performing
the
services
for
which
they
were
required.
We
may
share
information
within
the
Saturna
Capital
family
of
companies
in
the
course
of
informing
you
about
products
or
services
that
may
address
your
investing
needs.
We
maintain
our
own
technology
resources
to
minimize
the
need
for
any
third-party
services,
and
restrict
access
to
information
within
Saturna.
We
maintain
physical,
electronic,
and
procedural
safeguards
to
guard
your
personal
information.
If
you
have
any
questions
or
concerns
about
the
security
or
privacy
of
your
information,
please
call
us
at
1-800-728-8762.
Morningstar
Ratings
3
Sustainable
Equity
Fund
4
Schedule
of
Investments
4
Statement
of
Assets
and
Liabilities
and
Statement
of
Operations
7
Statement
of
Changes
in
Net
Assets
8
Financial
Highlights
9
Sustainable
Bond
Fund
10
Schedule
of
Investments
10
Statement
of
Assets
and
Liabilities
and
Statement
of
Operations
13
Statement
of
Changes
in
Net
Assets
14
Financial
Highlights
15
Notes
To
Financial
Statements
16
Note
1
–
Organization
16
Note
2
–
Unaudited
Information
16
Note
3
–
Significant
Accounting
Policies
16
Note
4
–
Transactions
with
Affiliated
Persons
19
Note
5
–
Distributions
to
Shareowners
20
Note
6
–
Federal
Income
Taxes
20
Note
7
–
Investments
20
Note
8
–
Custodian
20
Note
9
–
Subsequent
Events
20
Summary
Information
21
Morningstar
Rating
(as
of
June
30,
2024)
The
Morningstar
Sustainability
Rating
and
the
Morningstar
Portfolio
Sustainability
Score
are
not
based
on
fund
performance
and
are
not
equivalent
to
the
Morningstar
Rating
("Star
Rating").
©
2024
Morningstar®.
All
rights
reserved.
Morningstar,
Inc.
is
an
independent
fund
performance
monitor.
The
information
contained
herein:
(1)
is
proprietary
to
Morningstar
and/or
its
content
providers;
(2)
may
not
be
copied
or
distributed;
and
(3)
is
not
warranted
to
be
accurate,
complete,
or
timely.
Neither
Morningstar
nor
its
content
providers
are
responsible
for
any
damages
or
losses
arising
from
any
use
of
this
information.
A
Morningstar
Ratings™
("Star
Ratings")
are
as
of
June
30,
2024
.
The
Morningstar
Rating
™
for
funds,
or
"star
rating",
is
calculated
for
managed
products
(including
mutual
funds,
variable
annuity
and
variable
life
subaccounts,
exchange-traded
funds,
closed-end
funds,
and
separate
accounts)
with
at
least
a
three-year
history.
Exchange-traded
funds
and
open-ended
mutual
funds
are
considered
a
single
population
for
comparative
purposes.
It
is
calculated
based
on
a
Morningstar
Risk-Adjusted
Return
measure
that
accounts
for
variation
in
a
managed
product's
monthly
excess
performance
(not
including
the
effects
of
sales
charges,
loads,
and
redemption
fees),
placing
more
emphasis
on
downward
variations
and
rewarding
consistent
performance.
The
top
10%
of
products
in
each
product
category
receive
5
stars,
the
next
22.5%
receive
4
stars,
the
next
35%
receive
3
stars,
the
next
22.5%
receive
2
stars,
and
the
bottom
10%
receive
1
star.
The
Overall
Morningstar
Rating
for
a
managed
product
is
derived
from
a
weighted
average
of
the
performance
figures
associated
with
its
three-,
five-,
and
10-year
(if
applicable)
Morningstar
Rating
metrics.
The
weights
are:
100%
three-year
rating
for
36-59
months
of
total
returns,
60%
five-year
rating/40%
three-year
rating
for
60-119
months
of
total
returns,
and
50%
10-year
rating/30%
five-year
rating/20%
three-year
rating
for
120
or
more
months
of
total
returns.
While
the
10-year
overall
star
rating
formula
seems
to
give
the
most
weight
to
the
10-year
period,
the
most
recent
three-year
period
actually
has
the
greatest
impact
because
it
is
included
in
all
three
rating
periods.
B
Morningstar
Sustainability
Ratings
are
as
of
May
31,
2024
.
The
Morningstar
Sustainability
Rating
™
is
intended
to
measure
how
well
the
issuing
companies
of
the
securities
within
a
fund’s
portfolio
are
managing
their
environmental,
social,
and
governance
(“ESG”)
risks
and
opportunities
relative
to
the
fund’s
Morningstar
category
peers.
The
Morningstar
Sustainability
Rating
calculation
is
a
two-step
process.
First,
each
fund
with
at
least
50%
of
assets
covered
by
a
company-level
ESG
score
from
Sustainalytics
receives
a
Morningstar
Portfolio
Sustainability
Score
™
.
The
Morningstar
Portfolio
Sustainability
Score
is
an
asset-weighted
average
of
normalized
company-level
ESG
scores
with
deductions
made
for
controversial
incidents
by
the
issuing
companies,
such
as
environmental
accidents,
fraud,
or
discriminatory
behavior.
The
Morningstar
Sustainability
Rating
is
then
assigned
to
all
scored
funds
within
Morningstar
Categories
in
which
at
least
ten
(10)
funds
receive
a
Portfolio
Sustainability
Score
and
is
determined
by
each
fund's
rank
within
the
following
distribution:
High
(highest
10%),
Above
Average
(next
22.5%),
Average
(next
35%),
Below
Average
(next
22.5%),
and
Low
(lowest
10%).
The
Morningstar
Sustainability
Rating
is
depicted
by
globe
icons
where
High
equals
5
globes
and
Low
equals
1
globe.
A
Sustainability
Rating
is
assigned
to
any
fund
that
has
more
than
half
of
its
underlying
assets
rated
by
Sustainalytics
and
is
within
a
Morningstar
Category
with
at
least
10
scored
funds;
therefore,
the
rating
is
not
limited
to
funds
with
explicit
sustainable
or
responsible
investment
mandates.
Morningstar
updates
its
Sustainability
Ratings
monthly.
Portfolios
receive
a
Morningstar
Portfolio
Sustainability
Score
and
Sustainability
Rating
one
month
and
six
business
days
after
their
reported
as-of
date
based
on
the
most
recent
portfolio.
As
part
of
the
evaluation
process,
Morningstar
uses
Sustainalytics’
ESG
scores
from
the
same
month
as
the
portfolio
as-of
date.
Saturna
Sustainable
Equity
Fund
was
rated
on
100%
of
assets
under
management.
Saturna
Sustainable
Bond
Fund
was
rated
on
92%
of
assets
under
management.
%
Rank
in
Category
is
the
fund’s
percentile
rank
for
the
specified
time
period
relative
to
all
funds
that
have
the
same
Morningstar
category.
The
highest
(or
most
favorable)
percentile
rank
is
1
and
the
lowest
(or
least
favorable)
percentile
rank
is
100.
The
top-
performing
fund
in
a
category
will
always
receive
a
rank
of
1.
Percentile
ranks
within
categories
are
most
useful
in
those
categories
that
have
a
large
number
of
funds.
The
Funds’
portfolios
are
actively
managed
and
are
subject
to
change,
which
may
result
in
different
Morningstar
Sustainability
Ratings
over
time.
Morningstar™
Ratings
A
1
Year
3
Year
5
Year
Overall
Sustainability
Rating™
B
Saturna
Sustainable
Equity
Fund
–
“Global
Large-Stock
Blend”
Category
SEEFX
n/a
%
Rank
in
Category
45
74
55
74
3
Number
of
Funds
in
Category
349
329
299
329
8,247
Saturna
Sustainable
Bond
Fund
–
“Global
Bond”
Category
SEBFX
n/a
%
Rank
in
Category
52
25
17
25
7
Number
of
Funds
in
Category
164
163
142
163
2,454
The
accompanying
notes
are
an
integral
part
of
these
financial
statements.
Common
Stock
-
90
.0
%
Number
of
Shares
Cost
Market
Value
Country
1
Percentage
of
Net
Assets
Consumer
Discretionary
Home
Products
Stores
Home
Depot
1,500
$
279,738
$
502,305
United
States
2.0%
Lowe's
2,400
326,722
531,096
United
States
2.2%
Tractor
Supply
2,500
453,570
713,225
United
States
2.9%
1,060,030
1,746,626
7.1%
Specialty
Apparel
Stores
Lululemon
Athletica
2
900
302,269
280,791
United
States
1.2%
TJX
Companies
5,000
238,192
515,500
United
States
2.1%
540,461
796,291
3.3%
1,600,491
2,542,917
10.4%
Consumer
Staples
Packaged
Food
Danone
ADR
31,200
422,528
402,792
France
1.6%
Personal
Care
Products
Haleon
ADR
11,500
84,284
97,060
United
Kingdom
0.4%
Kenvue
4,289
84,901
82,778
United
States
0.3%
L'Oreal
ADR
5,400
297,824
532,062
France
2.1%
Reckitt
Benckiser
Group
ADR
16,700
280,226
191,883
United
Kingdom
0.8%
Unicharm
ADR
40,500
326,015
262,440
Japan
1.1%
Unilever
ADR
6,600
340,612
361,350
United
Kingdom
1.5%
1,413,862
1,527,573
6.2%
1,836,390
1,930,365
7.8%
Financials
Consumer
Finance
Paypal
2
2,900
674,351
182,671
United
States
0.7%
Life
Insurance
Aviva
ADR
45,600
416,983
568,176
United
Kingdom
2.3%
Other
Financial
Services
Mastercard,
Class
A
860
171,375
384,480
United
States
1.6%
P&C
Insurance
Chubb
2,000
287,787
541,640
Switzerland
2.2%
1,550,496
1,676,967
6.8%
Health
Care
Biotech
BioNTech
SE
2
800
125,059
80,480
Germany
0.3%
Large
Pharma
Eli
Lilly
900
514,269
738,306
United
States
3.0%
GlaxoSmithKline
ADR
9,200
369,834
411,884
United
Kingdom
1.7%
Novartis
ADR
4,300
374,482
443,459
Switzerland
1.8%
Novo
Nordisk
ADR
10,200
324,489
1,379,856
Denmark
5.6%
Roche
Holding
ADR
9,000
406,003
288,090
Switzerland
1.2%
Sandoz
Group
AG-ADR
860
20,210
30,521
Switzerland
0.1%
2,009,287
3,292,116
13.4%
2,134,346
3,372,596
13.7%
Industrials
Commercial
&
Residential
Building
Equipment
&
Systems
Assa
Abloy
ADR
44,500
515,234
650,590
Sweden
2.6%
Legrand
6,200
520,793
673,555
France
2.7%
1,036,027
1,324,145
5.3%
The
accompanying
notes
are
an
integral
part
of
these
financial
statements.
Common
Stock
-
90.0%
Number
of
Shares
Cost
Market
Value
Country
1
Percentage
of
Net
Assets
Industrials
(continued)
Electrical
Components
TE
Connectivity
3,200
$
356,052
$
479,040
Switzerland
2.0%
Electrical
Power
Equipment
Schneider
Electric
ADR
17,100
424,554
852,606
France
3.5%
Siemens
ADR
5,300
361,107
511,609
Germany
2.1%
785,661
1,364,215
5.6%
Industrial
Wholesale
&
Rental
Ferguson
2,500
413,249
514,350
United
States
2.1%
2,590,989
3,681,750
15.0%
Materials
Agricultural
Chemicals
Corteva
3,000
180,769
167,820
United
States
0.7%
Specialty
Chemicals
Ecolab
1,500
237,915
348,300
United
States
1.4%
418,684
516,120
2.1%
Technology
Application
Software
Adobe
2
1,000
108,410
444,760
United
States
1.8%
Dassault
Systemes
ADR
9,100
194,033
368,914
France
1.5%
302,443
813,674
3.3%
Communications
Equipment
Apple
3,028
83,313
582,133
United
States
2.4%
Consumer
Electronics
Nintendo
ADR
56,625
633,295
768,968
Japan
3.1%
Sony
ADR
4,000
261,557
329,360
Japan
1.4%
894,852
1,098,328
4.5%
Electronics
Components
Murata
Manufacturing
12,000
203,199
227,158
Japan
0.9%
Infrastructure
Software
Microsoft
1,438
62,724
596,957
United
States
2.4%
ServiceNow
2
650
392,951
427,004
United
States
1.8%
455,675
1,023,961
4.2%
IT
Services
Accenture,
Class
A
1,600
275,166
451,664
Ireland
1.8%
CGI
Group
Class
A
2
6,000
421,997
592,494
Canada
2.4%
Wolters
Kluwer
5,000
371,604
797,852
Netherlands
3.3%
1,068,767
1,842,010
7.5%
Semiconductor
Devices
NVIDIA
1,000
479,045
1,096,330
United
States
4.4%
NXP
Semiconductors
1,960
215,841
533,316
Netherlands
2.2%
STMicroelectronics
ADR
9,000
381,679
377,730
Switzerland
1.5%
1,076,565
2,007,376
8.1%
Semiconductor
Manufacturing
Taiwan
Semiconductor
ADR
5,325
406,030
804,288
Taiwan
3.3%
4,490,844
8,398,928
34.2%
Total
Common
Stock
$14,622,240
$
22,119,643
90.0%
Government
Bonds
-
6
.3
%
Coupon
/
Maturity
Face
Amount
Market
Value
Country
1
Percentage
of
Net
Assets
Government
United
States
Cash
Management
Bill
–%
due
06/27/2024
900,000
896,844
United
States
3.7%
The
accompanying
notes
are
an
integral
part
of
these
financial
statements.
Government
Bonds
-
6.3%
Coupon
/
Maturity
Face
Amount
Market
Value
Country
1
Percentage
of
Net
Assets
Government
(continued)
United
States
Cash
Management
Bill
–%
due
06/06/2024
$
650,000
$
649,717
United
States
3
2.6%
Total
Government
Bonds
(Cost
$1,546,114)
$
1,546,561
6.3%
Total
investments
(Cost
$16,168,354)
$
23,666,204
96.3%
Other
assets
(net
of
liabilities)
921,447
3.7%
Total
net
assets
$
24,587,651
100.0%
1
Country
of
domicile
unless
otherwise
indicated
2
Non-income
producing
3
Country
of
domicile
ADR:
American
Depositary
Receipt
The
accompanying
notes
are
an
integral
part
of
these
financial
statements.
Statement
of
Assets
and
Liabilities
Statement
of
Operations
As
of
May
31,
2024
Assets
Investments
in
securities,
at
value
(Cost
$16,168,354)
$
23,666,204
Cash
850,429
Dividends
receivable
80,920
Prepaid
expenses
9,514
Receivable
for
Fund
shares
sold
1,687
Total
assets
24,608,754
Liabilities
Accrued
advisory
fees
8,462
Accrued
audit
expenses
6,881
Accrued
trustee
expenses
2,205
Accrued
retirement
plan
custody
fee
847
Accrued
Chief
Compliance
Officer
expenses
638
Accrued
legal
expenses
632
Payable
for
Fund
shares
redeemed
101
Accrued
other
operating
expenses
1,337
Total
liabilities
21,103
Net
assets
$24,587,651
Analysis
of
net
assets
Paid-in
capital
(unlimited
shares
authorized,
without
par
value)
$17,827,144
Total
distributable
earnings
6,760,507
Net
assets
applicable
to
Fund
shares
outstanding
$24,587,651
Fund
shares
outstanding
1,295,691
Net
asset
value,
offering,
and
redemption
price
per
share
$18.98
Period
ended
May
31,
2024
Investment
income
Dividend
Income
(Net
of
foreign
tax
of
$26,367)
$
210,243
Interest
income
2,378
Miscellaneous
income
14
Total
investment
income
212,635
Expenses
Investment
advisory
fees
75,568
Filing
and
registration
fees
13,899
Audit
fees
6,222
Trustee
fees
3,737
Chief
Compliance
Officer
expenses
3,720
Legal
fees
3,055
Retirement
plan
custodial
fees
917
Custodian
fees
717
Other
operating
expenses
2,187
Total
gross
expenses
110,022
Less
adviser
fees
waived
(22,111)
Less
custodian
fee
credits
(717)
Net
expenses
87,194
Net
investment
income
$125,441
Net
realized
loss
from
investments
and
foreign
currency
$(228,462)
Net
i
ncrease
in
unrealized
appreciation
on
investments
and
foreign
currency
2,948,981
Net
gain
on
investments
2,720,519
Net
increase
in
net
assets
resulting
from
operations
$2,845,960
The
accompanying
notes
are
an
integral
part
of
these
financial
statements.
Statements
of
Changes
in
Net
Assets
Period
ended
May
31,
2024
Year
ended
November
30,
2023
Increase
in
net
assets
from
operations
From
operations
Net
investment
income
$125,441
$220,519
Net
realized
loss
on
investments
and
foreign
currency
(228,462)
(449,805)
Net
increase
in
unrealized
appreciation
on
investments
and
foreign
currency
2,948,981
2,164,681
Net
increase
in
net
assets
2,845,960
1,935,395
Distributions
to
shareowners
from
Net
dividend
and
distribution
to
shareholders
(219,353)
(177,042)
Capital
share
transactions
Proceeds
from
the
sale
of
shares
1,289,994
2,443,907
Value
of
shares
issued
in
reinvestment
of
dividends
and
distributions
219,353
176,949
Cost
of
shares
redeemed
(865,584)
(2,844,207)
Total
capital
shares
transactions
643,763
(223,351)
Total
increase
in
net
assets
3,270,370
1,535,002
Net
assets
Beginning
of
period
21,317,281
19,782,279
End
of
period
$24,587,651
$21,317,281
Shares
of
the
Fund
sold
and
redeemed
Sustainable
Equity
(SEEFX)
Number
of
shares
sold
70,924
151,731
Number
of
shares
issued
in
reinvestment
of
dividends
and
distributions
12,563
11,688
Number
of
shares
redeemed
(48,120)
(180,213)
Net
increase
(decrease)
in
number
of
shares
outstanding
35,367
(16,794)
–
–
Sustainable
Equity
Fund:
Financial
Highlights
The
accompanying
notes
are
an
integral
part
of
these
financial
statements.
tin
Sustainable
Equity
(SEEFX)
Selected
data
per
share
of
outstanding
capital
stock
throughout
each
period:
Period
ended
May
31,
2024
Year
ended
November
30,
2023
2022
2021
2020
2019
A
A
A
A
A
A
A
Net
asset
value
at
beginning
of
period
$16.91
$15.49
$18.55
$16.72
$13.58
$11.51
Income
from
investment
operations
Net
investment
income
0.10
0.17
0.14
0.13
0.10
0.09
Net
gains
(losses)
on
securities
(both
realized
and
unrealized)
2.15
1.39
(3.08)
1.76
3.11
2.08
Total
from
investment
operations
2.25
1.56
(2.94)
1.89
3.21
2.17
Less
distributions
Dividends
(from
net
investment
income)
(0.18)
(0.14)
(0.12)
(0.06)
(0.07)
(0.10)
Total
distributions
(0.18)
(0.14)
(0.12)
(0.06)
(0.07)
(0.10)
Net
asset
value
at
end
of
period
$18.98
$16.91
$15.49
$18.55
$16.72
$13.58
Total
Return
A
13.37%
10.18%
(15.96)%
11.32%
23.74%
19.04%
Ratios
/
supplemental
data
Net
assets
($000),
end
of
period
$24,588
$21,317
$19,782
$25,375
$16,834
$8,185
Ratio
of
expenses
to
average
net
assets
Before
custodian
fee
credits
B
0.95%
0.97%
0.93%
0.85%
0.78%
1.81%
After
advisory
fees
waiver
B
0.76%
0.76%
0.76%
0.76%
0.75%
0.78%
After custodian
fee
credits
B
0.75%
0.75%
0.75%
0.75%
0.73%
0.75%
Ratio
of
net
investment
income
after
custodian
fee
credits to
average
net
assets
B
1.08%
1.10%
0.84%
0.71%
0.61%
0.80%
Portfolio
turnover
rate
A
6%
3%
9%
8%
13%
13%
A
Not
annualized
for
period
of
less
than
one
year
B
Annualized
for
periods
of
less
than
one
year
The
accompanying
notes
are
an
integral
part
of
these
financial
statements.
Corporate
Bonds
-
57
.1
%
Coupon
/
Maturity
Face
Amount
Market
Value
Country
1
Percentage
of
Net
Assets
Communications
Koninklijke
KPN
8.375%
due
10/01/2030
$
750,000
$
859,846
Netherlands
2.6%
Consumer
Discretionary
Starbucks
2.450%
due
06/15/2026
1,200,000
1,135,888
United
States
3.4%
Consumer
Staples
Coty
2
4.750%
due
04/15/2026
EUR
750,000
810,814
United
States
2.4%
Coty
3
5.000%
due
04/15/2026
131,000
129,039
United
States
0.4%
939,853
2.8%
Financials
AXA
2,4
5.125%
due
01/17/2027
1,250,000
1,223,563
France
3.7%
Canadian
Imperial
Bank
5
4.375%
due
10/28/2080
CAD
2,100,000
1,494,884
Canada
4.5%
Commonwealth
Bank
Australia
(Quarterly
BBSW
plus
0.41%)
6
4.731%
due
12/23/2026
AUD
850,000
562,224
Australia
1.7%
First
Abu
Dhabi
Bank
PJSC
2
5.125%
due
10/13/2027
1,250,000
1,243,428
United
Arab
Emirates
3.7%
MAF
Sukuk
2
4.638%
due
05/14/2029
800,000
769,000
United
Arab
Emirates
2.3%
Munich
RE
2,7
1.000%
due
05/26/2042
EUR
1,400,000
1,192,778
Germany
3.6%
State
Street
(Quarterly
US
LIBOR
plus
100)
6
6.552%
due
06/15/2047
700,000
602,138
United
States
1.8%
Toronto-Dominion
Bank
2
1.128%
due
12/09/2025
CAD
500,000
347,856
Canada
1.0%
Women's
Livelihood
Bond
Asset
II
B
3
3.950%
due
12/10/2024
600,000
568,697
Singapore
1.7%
Women's
Livelihood
Bond
Asset
II
C
3
3.900%
due
12/23/2025
500,000
470,933
Singapore
1.4%
8,475,501
25.4%
Health
Care
Koninklijke
Philips
7.125%
due
05/15/2025
1,000,000
1,010,266
Netherlands
3.0%
Novartis
Capital
3.000%
due
11/20/2025
250,000
242,872
Switzerland
0.7%
Roche
3
2.625%
due
05/15/2026
200,000
190,928
Switzerland
0.6%
1,444,066
4.3%
Industrials
Odfjell
SE
(Quarterly
NIBOR
plus
5.75%)
2,6
10.260%
due
01/21/2025
NOK
6,000,000
590,208
Norway
1.8%
Materials
Stora
Enso
OYJ
2
7.250%
due
04/15/2036
300,000
312,517
Finland
1.0%
Stora
Enso
OYJ
3
7.250%
due
04/15/2036
200,000
208,345
Finland
0.6%
520,862
1.6%
Real
Estate
MAF
Global
Securities
2,8,9
7.875%
due
PERP
1,200,000
1,225,459
United
Arab
Emirates
3.7%
Prologis
1.250%
due
10/15/2030
500,000
395,577
United
States
1.2%
1,621,036
4.9%
Technology
Microsoft
5.300%
due
02/08/2041
500,000
526,767
United
States
1.6%
Nokia
OYJ
2
2.375%
due
05/15/2025
EUR
1,000,000
1,067,417
Finland
3.2%
RELX
4.000%
due
03/18/2029
400,000
381,516
United
Kingdom
1.1%
1,975,700
5.9%
Utilities
United
Utilities
6.875%
due
08/15/2028
1,400,000
1,472,505
United
Kingdom
4.4%
Total
Corporate
Bonds
(Cost
$19,714,907)
$
19,035,465
57.1%
The
accompanying
notes
are
an
integral
part
of
these
financial
statements.
BBSW:
Bank
Bill
Swap
Rate
LIBOR:
London
Interbank
Offered
Rates
NIBOR:
Norwegian
Interbank
Offered
Rates
Government
Bonds
-
30
.9
%
Coupon
/
Maturity
Face
Amount
Market
Value
Country
1
Percentage
of
Net
Assets
Financials
Federal
Home
Loan
Bank
1.650%
due
10/06/2031
$
500,000
$
400,839
United
States
1.2%
Government
Asian
Development
Bank
6.000%
due
02/05/2026
BRL
7,500,000
1,339,413
Philippines
4.0%
European
Bk
Recon
&
Dev
5.000%
due
01/27/2025
BRL
2,000,000
369,251
United
Kingdom
1.1%
Export-Import
Bank
Korea
5.125%
due
01/11/2033
500,000
498,305
Korea
1.5%
Inter-American
Devel
BK
7.500%
due
12/05/2024
MXN
25,000,000
1,443,801
United
States
4.3%
International
Finance
12.000%
due
11/03/2027
COP
3,000,000,000
816,083
United
States
10
2.4%
Int'l
Bk
Recon
&
Develop
4.250%
due
01/22/2026
MXN
30,000,000
1,598,762
Germany
4.8%
Int'l
Bk
Recon
&
Develop
5.000%
due
10/07/2026
COP
6,000,000,000
1,392,792
Germany
4.2%
Ontario
2.650%
due
02/05/2025
CAD
500,000
361,871
Canada
1.1%
Perusahaan
Penerbit
SBSN
2
3.550%
due
06/09/2051
500,000
358,387
Indonesia
1.1%
Queensland
Treasury
2.500%
due
03/06/2029
AUD
750,000
456,391
Australia
1.4%
Republic
of
Chile
4.340%
due
03/07/2042
500,000
426,910
Chile
1.3%
United
Kingdom
Gilt
2
0.875%
due
07/31/2033
GBP
250,000
237,294
United
Kingdom
0.7%
United
States
Treasury
Bond
3.250%
due
05/15/2042
750,000
615,000
United
States
1.8%
9,914,260
29.7%
Total
Government
Bonds
(Cost
$10,404,367)
$
10,315,099
30.9%
Municipals
Bonds
-
4
.5
%
Coupon
/
Maturity
Face
Amount
Market
Value
Country
1
Percentage
of
Net
Assets
Real
Estate
New
York
City
NY
Hsg
Dev
Corp
6
3.300%
due
05/01/2062
1,250,000
1,250,000
United
States
3.7%
New
York
City
NY
Hsg
Dev
6,11
3.300%
due
05/01/2062
250,000
250,000
United
States
0.8%
Total
Municipals
Bonds
(Cost
$1,500,000)
$
1,500,000
4.5%
Total
investments
(Cost
$31,619,274)
$
30,850,564
92.5%
Other
assets
(net
of
liabilities)
2,492,676
7.5%
Total
net
assets
$
33,343,240
100.0%
1
Denotes
a
country
or
region
of
primary
exposure
2
Security
was
purchased
pursuant
to
Regulation
S
under
the
Securities
Act
of
1933
which
exempts
from
registration
securities
offered
and
sold
outside
of
the
United
States.
Such
a
security
cannot
be
sold
in
the
United
States
without
either
an
effective
registration
statement
filed
pursuant
to
the
Securities
Act
of
1933,
or
pursuant
to
an
exemption
from
registration.
These
Securities
have
been
deemed
liquid
under
guidelines
approved
by
the
Trust's
Board
of
Trustees.
At
May
31,
2024,
the
aggregate
value
of
these
securities
was
$9,378,721
representing
28.2%
of
total
net
assets.
3
Security
was
purchased
pursuant
to
Rule
144A
under
the
Securities
Act
of
1933
and
may
be
sold
in
transactions
exempt
from
registration
only
to
qualified
institutional
buyers
or
in
public
offering
registered
under
the
Securities
Act
of
1933.
These
securities
have
been
deemed
liquid
under
guidelines
approved
by
the
Trust's
Board
of
Trustees.
At
May
31,
2024,
the
aggregate
value
of
these
securities
was
$1,567,942
representing
4.7%
of
total
net
assets.
4
AXA
is
a
fixed
to
float
bond.
The
bond
has
a
fixed
rate
until
01/17/2027.
The
interest
rate
represents
the
rate
in
effect
at
May
31,
2024.
5
Canadian
Imperial
Bank
is
a
fixed
to
float
bond.
The
bond
has
a
fixed
rate
until
10/28/2025.
The
interest
rate
represents
the
rate
in
effect
at
May
31,
2024.
6
Variable
rate
security.
The
interest
rate
represents
the
rate
in
effect
at
May
31,
2024
and
resets
periodically
based
on
the
parenthetically
disclosed
reference
rate
and
spread.
7
Munich
RE
is
a
fixed
to
float
bond.
The
bond
has
a
fixed
rate
until
05/26/2032.
The
interest
rate
represents
the
rate
in
effect
at
May
31,
2024.
8
Security
is
perpetual
in
nature
with
no
stated
maturity
date.
9
Coupon
rates
for
floating
and
adjustable
rate
securities
reflect
the
rates
in
effect
at
period
end.
10
Country
of
domicile
11
Variable
rate
security.
Rate
as
of
period
end
and
maturity
is
the
date
the
principal
owed
can
be
recovered
through
demand.
LIBOR:
London
Interbank
Offered
Rates
The
accompanying
notes
are
an
integral
part
of
these
financial
statements.
AUD
:
Australia
Dollar
BRL
:
Brazil
Real
CAD
:
Canada
Dollar
COP
:
Colombia
Peso
EUR
:
Euro
Dollar
GBP
:
United
Kingdom
Pound
MXN
:
Mexico
Nuevo
Peso
NOK
:
Norway
Krone
USD
:
United
States
Dollar
The
accompanying
notes
are
an
integral
part
of
these
financial
statements.
Statement
of
Assets
and
Liabilities
Statement
of
Operations
As
of
May
31,
2024
Assets
Investments
in
securities,
at
value
(Cost
$31,619,274)
$
30,850,564
Cash
1,901,165
Interest
receivable
437,493
Receivable
for
Fund
shares
sold
165,186
Prepaid
expenses
10,842
Total
assets
33,365,250
Liabilities
Accrued
advisory
fees
9,863
Accrued
trustee
expenses
3,198
Accrued
audit
expenses
2,008
Accrued
legal
expenses
995
Accrued
Chief
Compliance
Officer
expenses
921
Accrued
retirement
plan
custody
fee
507
Accrued
other
operating
expenses
1,659
Accrued
printing
fees
2,859
Total
liabilities
22,010
Net
assets
$33,343,240
Analysis
of
net
assets
Paid-in
capital
(unlimited
shares
authorized,
without
par
value)
$35,630,356
Total
distributable
earnings
(2,287,116)
Net
assets
applicable
to
Fund
shares
outstanding
$33,343,240
Fund
shares
outstanding
3,611,407
Net
asset
value,
offering,
and
redemption
price
per
share
$9.23
Period
ended
May
31,
2024
Investment
income
Interest
income
$
777,016
Total
investment
income
777,016
Expenses
Investment
advisory
fees
86,593
Filing
and
registration
fees
14,382
Audit
fees
9,234
Chief
Compliance
Officer
expenses
5,644
Trustee
fees
5,444
Legal
fees
4,530
Custodian
fees
2,797
Retirement
plan
custodial
fees
567
Other
operating
expenses
4,068
Total
gross
expenses
133,259
Less
adviser
fees
waived
(28,126)
Less
custodian
fee
credits
(2,797)
Net
expenses
102,336
Net
investment
income
$674,680
Net
realized
loss
from
investments
and
foreign
currency
$(34,728)
Net
de
crease
in
unrealized
depreciation
on
investments
and
foreign
currency
294,952
Net
gain
on
investments
260,224
Net
increase
in
net
assets
resulting
from
operations
$934,904
The
accompanying
notes
are
an
integral
part
of
these
financial
statements.
Statements
of
Changes
in
Net
Assets
Period
ended
May
31,
2024
Year
ended
November
30,
2023
Increase
in
net
assets
from
operations
From
operations
Net
investment
income
$674,680
$1,148,799
Net
realized
loss
on
investments
and
foreign
currency
(34,728)
(1,123,261)
Net
decrease
in
unrealized
de
preciation
on
investments
and
foreign
currency
294,952
914,606
Net
increase
in
net
assets
934,904
940,144
Distributions
to
shareowners
from
Net
dividend
and
distribution
to
shareholders
(1,086,688)
(183,662)
Capital
share
transactions
Proceeds
from
the
sale
of
shares
5,463,352
7,936,631
Value
of
shares
issued
in
reinvestment
of
dividends
and
distributions
1,083,701
182,968
Cost
of
shares
redeemed
(2,507,354)
(8,125,858)
Total
capital
shares
transactions
4,039,699
(6,259)
Total
increase
in
net
assets
3,887,915
750,223
Net
assets
Beginning
of
period
29,455,325
28,705,102
End
of
period
$33,343,240
$29,455,325
Shares
of
the
Fund
sold
and
redeemed
Sustainable
Bond
(SEBFX)
Number
of
shares
sold
591,778
863,856
Number
of
shares
issued
in
reinvestment
of
dividends
and
distributions
117,922
20,330
Number
of
shares
redeemed
(271,556)
(894,442)
Net
increase
(decrease)
in
number
of
shares
outstanding
438,144
(10,256)
–
–
Sustainable
Bond
Fund:
Financial
Highlights
The
accompanying
notes
are
an
integral
part
of
these
financial
statements.
tin
Sustainable
Bond
(SEBFX)
Selected
data
per
share
of
outstanding
capital
stock
throughout
each
period:
Period
ended
May
31,
2024
Year
ended
November
30,
2023
2022
2021
2020
2019
A
A
A
A
A
A
A
Net
asset
value
at
beginning
of
period
$9.28
$9.02
$10.02
$10.25
$9.70
$9.39
Income
from
investment
operations
Net
investment
income
0.20
0.36
0.22
0.20
0.23
0.28
Net
gains
(losses)
on
securities
(both
realized
and
unrealized)
0.09
(0.04)
(0.98)
(0.42)
0.42
0.29
Total
from
investment
operations
0.29
0.32
(0.76)
(0.22)
0.65
0.57
Less
distributions
Dividends
(from
net
investment
income)
(0.34)
(0.06)
(0.05)
(0.01)
(0.10)
(0.26)
Distributions
(from
capital
gains)
–
–
(0.19)
–
–
–
Total
distributions
(0.34)
(0.06)
(0.24)
(0.01)
(0.10)
(0.26)
Net
asset
value
at
end
of
period
$9.23
$9.28
$9.02
$10.02
$10.25
$9.70
Total
Return
A
3.14%
3.55%
(7.83)%
(2.14)%
6.78%
6.09%
Ratios
/
supplemental
data
Net
assets
($000),
end
of
period
$33,343
$29,455
$28,705
$26,048
$21,973
$27,775
Ratio
of
expenses
to
average
net
assets
Before
custodian
fee
credits
B
0.85%
0.83%
0.74%
0.86%
0.85%
0.83%
After
advisory
fees
waiver
B
0.67%
0.67%
0.66%
0.66%
0.67%
0.66%
After custodian
fee
credits
B
0.65%
0.65%
0.65%
0.65%
0.65%
0.65%
Ratio
of
net
investment
income
after
custodian
fee
credits to
average
net
assets
B
4.30%
3.89%
2.35%
1.99%
2.33%
2.87%
Portfolio
turnover
rate
A
7%
54%
80%
65%
63%
38%
A
Not
annualized
for
period
of
less
than
one
year
B
Annualized
for
periods
of
less
than
one
year
Notes
To
Financial
Statements
Note
1
–
Organization
Saturna
Investment
Trust
(the
“Trust”)
was
established
under
Washington
State
Law
as
a
business
trust
on
February
20,
1987.
The
Trust
is
registered
as
an
open-end,
diversified
management
company
under
the
Investment
Company
Act
of
1940,
as
amended.
The
Trust
currently
offers
shares
of
eight
portfolio
series,
two
of
which
are
covered
by
this
annual
report:
Saturna
Sustainable
Equity
Fund
and
Saturna
Sustainable
Bond
Fund
(the
“Funds”).
The
Sextant
Short-
Term
Bond
Fund,
Sextant
Bond
Income
Fund,
Sextant
Core
Fund,
Sextant
Global
High
Income
Fund,
Sextant
Growth
Fund,
and
Sextant
International
Fund
are
offered
through
separate
prospectuses
and
have
a
separate
shareholder
report.
Saturna
Sustainable
Equity
Fund
and
Saturna
Sustainable
Bond
Fund
commenced
operations
on
March
27,
2015.
Each
Fund
is
an
investment
company
and
accordingly
follows
the
investment
company
accounting
and
reporting
guidance
of
the
Financial
Accounting
Standards
Board
(FASB)
Accounting
Standard
Codification
Topic
946
“Financial
Services
–
Investment
Companies”.
Investment
risks:
Sustainable
Equity
Fund
and
Sustainable
Bond
Fund
:
The
value
of
each
Fund’s
shares
rises
and
falls
as
the
value
of
the
securities
in
which
the
Fund
invests
goes
up
and
down.
Fund
share
prices,
yields,
and
total
returns
will
change
with
market
fluctuations
as
well
as
the
fortunes
of
the
countries,
industries,
and
companies
in
which
the
Fund
invests.
The
Funds
do
not
use
derivatives
to
hedge
currency,
interest
rate,
or
credit
risk.
The
Fund’s
adviser
employs
a
proprietary
sustainable
rating
system
based
on
its
own,
as
well
as
third-party,
data
to
identify
issuers
believed
to
present
low
environmental,
social,
and
governance
(ESG)
risks.
Ratings
are
dependent
upon
the
associated
ESG
risks
that
are
most
pertinent
to
the
sector
in
which
an
issuer
operates.
The
ratings
process
associated
with
sustainable
and
responsible
investing
reduces
the
investable
universe
for
each
Fund,
which
limits
opportunities
and
may
increase
the
risk
of
loss
during
market
declines.
The
adviser
believes
that
sustainable
investing
may
mitigate
security-specific
risk,
but
there
is
no
guarantee
that
the
securities
favored
by
our
investment
process
will
perform
better
and
may
perform
worse
than
those
that
are
not
favored.
The
Funds
may
invest
substantially
in
one
or
more
sectors,
which
can
increase
volatility
and
exposure
to
issues
specific
to
a
particular
sector
or
industry.
Foreign
investing
involves
risks
not
normally
associated
with
investing
in
US
securities.
These
include
fluctuations
in
currency
exchange
rates,
less
public
information
about
securities,
less
governmental
market
supervision,
and
the
lack
of
uniform
financial,
social,
and
political
standards.
Foreign
investing
heightens
the
risk
of
confiscatory
taxation,
seizure
or
nationalization
of
assets,
establishment
of
currency
controls,
or
adverse
political
or
social
developments
that
affect
investments.
The
risks
of
investing
in
foreign
securities
are
typically
greater
in
less
developed
or
emerging
countries.
Liquidity
risk
exists
when
particular
investments
are
difficult
to
sell.
If
a
Fund
holds
illiquid
investments,
its
portfolio
may
be
more
difficult
to
value,
especially
in
changing
markets.
Investments
by
a
Fund
in
foreign
securities
and
those
that
are
thinly
traded,
such
as
lower
quality
issuers,
and
smaller
companies
tend
to
involve
greater
liquidity
risk.
If
a
Fund
is
forced
to
sell
or
unwind
these
investments
to
meet
redemptions
or
for
other
cash
needs,
the
Fund
may
suffer
a
penalty.
Additionally,
the
market
for
certain
investments
may
become
illiquid
under
adverse
market
or
economic
conditions
independent
of
any
specific
adverse
changes
in
the
conditions
of
a
particular
issuer.
In
such
cases,
the
Fund,
due
to
limitations
on
investments
in
illiquid
securities
and
the
difficulty
in
purchasing
and
selling
such
securities,
may
be
unable
to
achieve
its
investment
objective.
Sustainable
Bond
Fund
:
The
risks
inherent
in
the
Sustainable
Bond
Fund
depend
primarily
on
the
terms
and
quality
of
the
obligations
in
its
portfolio,
as
well
as
on
bond
market
conditions.
When
interest
rates
rise,
bond
prices
fall.
When
interest
rates
fall,
bond
prices
go
up.
Bonds
with
longer
maturities
usually
are
more
sensitive
to
interest
rate
changes
than
bonds
with
shorter
maturities.
The
Fund
entails
credit
risk,
which
is
the
possibility
that
a
bond
will
not
be
able
to
pay
interest
or
principal
when
due.
If
the
credit
quality
of
a
bond
is
perceived
to
decline,
investors
will
demand
a
higher
yield,
which
means
a
lower
price
on
that
bond
to
compensate
for
the
higher
level
of
risk.
The
Fund
may
invest
a
portion
of
its
assets
in
securities
issued
by
government
sponsored
entities
such
as
Fannie
Mae,
Freddie
Mac,
and
the
Federal
Home
Loan
Banks
in
the
US.
Foreign
governments
also
sponsor
similar
entities,
which
may
promote
activities
such
as
low-cost
housing
or
alternative
energy.
The
Fund
may
also
invest
in
the
issues
of
regional,
state,
and
local
governments.
The
terms
of
such
issues
can
be
complex,
and
there
can
be
no
assurance
that
a
government
entity
will
support
such
enterprises
that
encounter
financial
difficulty.
Issuers
of
high-yield
securities
are
generally
not
as
financially
strong
as
those
issuing
higher
quality
securities.
These
issuers
are
more
likely
to
encounter
financial
difficulties
and
are
more
vulnerable
to
changes
in
the
relevant
economy
that
could
affect
their
ability
to
make
interest
and
principal
payments
as
expected.
High-yield
bonds
may
have
low
or
no
ratings,
and
may
be
considered
“junk
bonds.”
Bond
investments,
especially
mortgage-backed
and
asset-backed
securities,
are
subject
to
the
risk
that
borrowers
will
prepay
the
principal
more
quickly
than
expected
(prepayment
risk)
or
more
slowly
than
expected
(extension
risk),
which
will
affect
the
yield,
average
life,
and
price
of
the
securities.
Note
2
–
Unaudited
Information
The
information
in
this
interim
report
has
not
been
subject
to
independent
audit.
Note
3
–
Significant
Accounting
Policies
The
following
is
a
summary
of
the
significant
accounting
policies,
in
conformity
with
accounting
principles
generally
accepted
in
the
United
States
of
America,
which
are
consistently
followed
by
the
Funds
in
preparation
of
their
financial
statements.
Security
valuation:
Investments
in
securities
traded
on
a
national
securities
exchange
and
over-the-counter
securities
for
which
sale
prices
are
available
are
valued
at
that
price.
Securities
for
which
there
are
no
sales
are
valued
at
the
latest
bid
price.
Debt
securities
are
valued
using
bid-side
valuations
provided
by
an
independent
service.
The
service
determines
valuations
using
factors
such
as
yields
or
prices
of
bonds
of
comparable
quality,
type
of
issue,
coupon
maturity,
ratings,
trading
activity,
and
general
market
conditions.
Notes
To
Financial
Statements
(continued)
Fixed-income
debt
instruments,
such
as
commercial
paper,
bankers’
acceptances,
and
US
Treasury
Bills,
with
a
maturity
of
60
days
or
less
are
valued
at
amortized
cost,
which
approximates
market
value.
Foreign
markets
may
close
before
the
time
as
of
which
the
Funds’
share
prices
are
determined.
Because
of
this,
events
occurring
after
the
close
and
before
the
determination
of
the
Funds’
share
prices
may
have
a
material
effect
on
the
values
of
some
or
all
of
the
Funds’
foreign
securities.
To
account
for
this,
the
Funds
may
use
outside
pricing
services
for
valuation
of
their
non-US
securities.
In
cases
in
which
there
is
not
a
readily
available
market
price,
a
fair
value
for
such
security
is
determined
in
good
faith
by
the
Funds'
investment
adviser
(Saturna
Capital),
whom
the
Board
of
Trustees
has
designated
as
the
Funds’
valuation
designee
to
perform
fair
value
determinations
relating
to
all
Fund
investments.
Security
transactions
are
recorded
on
the
trade
date.
Realized
gains
and
losses
on
sales
of
securities
are
recorded
on
the
identified
cost
basis.
Foreign
currency:
Investment
securities
and
other
assets
and
liabilities
denominated
in
foreign
currencies
are
translated
into
US
dollar
amounts
at
the
date
of
valuation.
Purchases
and
sales
of
investment
securities
and
income
and
expense
items
denominated
in
foreign
currencies
are
translated
into
US
dollar
amounts
on
the
respective
dates
of
such
transactions.
The
Funds
do
not
isolate
that
portion
of
the
results
of
operations
resulting
from
changes
in
foreign
exchange
rates
on
investments
from
the
fluctuations
arising
from
changes
in
market
prices
of
securities
held.
Such
fluctuations
are
included
with
the
net
realized
and
unrealized
gain
or
loss
from
investments.
Reported
net
realized
foreign
exchange
gains
or
losses
arise
from
sales
of
foreign
currencies,
currency
gains
or
losses
realized
between
the
trade
and
settlement
dates
on
securities
transactions,
and
the
difference
between
the
amounts
of
dividends,
interest,
and
foreign
withholding
taxes
recorded
on
the
Funds’
books
and
the
US
dollar
equivalent
of
the
amounts
actually
received
or
paid.
Net
unrealized
foreign
exchange
gains
and
losses
arise
from
changes
in
the
fair
values
of
assets
and
liabilities,
other
than
investments
in
securities
at
fiscal
period
end,
resulting
from
changes
in
exchange
rates.
Share
valuation:
Each
Fund
computes
the
share
price
of
each
share
class
by
dividing
the
net
assets
attributable
to
each
share
class
by
the
outstanding
shares
of
that
class.
Each
share
class
represents
an
interest
in
the
same
investment
portfolio.
Each
share
class
is
identical
in
all
respects
except
that
each
class
bears
its
own
class
expenses,
and
each
class
has
exclusive
voting
rights
on
matters
affecting
that
class.
As
a
result
of
the
differences
in
the
expenses
borne
by
each
share
class,
the
share
price
and
distributions
will
vary
among
a
Fund’s
share
classes.
The
Funds’
shares
are
not
priced
or
traded
on
days
the
New
York
Stock
Exchange
is
closed.
The
NAV
is
both
the
offering
and
redemption
price
per
share.
Share
Valuation
Inputs
as
of
May
31,
2024
Level
1
Level
2
Level
3
Funds
Quoted
Price
Significant
Observable
Input
Significant
Unobservable
Input
Total
Sustainable
Equity
Fund
Common
Stock
Consumer
Discretionary
$2,542,917
$–
$–
$2,542,917
Consumer
Staples
$1,930,365
$–
$–
$1,930,365
Financials
$1,676,967
$–
$–
$1,676,967
Health
Care
$3,372,596
$–
$–
$3,372,596
Industrials
$3,008,195
$673,555
$–
$3,681,750
Materials
$516,120
$–
$–
$516,120
Technology
$7,373,918
$1,025,010
$–
$8,398,928
Total
Common
Stock
$20,421,078
$1,698,565
$–
$22,119,643
Government
Bonds
1
$–
$1,546,561
$–
$1,546,561
Total
Assets
$20,421,078
$3,245,126
$–
$23,666,204
Sustainable
Bond
Fund
Corporate
Bonds
1
$–
$19,035,465
$–
$19,035,465
Government
Bonds
Financials
$–
$400,839
$–
$400,839
Government
$–
$9,098,177
$816,083
$9,914,260
Total
Government
Bonds
$–
$9,499,016
$816,083
$10,315,099
Municipals
Bonds
1
$–
$1,500,000
$–
$1,500,000
Total
Assets
$–
$30,034,481
$816,083
$30,850,564
1
See
the
Schedule
of
Investments
for
additional
details.
Note
3
–
Significant
Accounting
Policies
(continued)
Notes
To
Financial
Statements
(continued)
The
following
is
a
reconciliation
of
assets
and
liabilities
for
which
Level
3
inputs
were
used
in
determining
value.
The
following
is
quantitative
information
about
significant
unobservable
inputs
(Level
3)
for
the
Company
as
of
May
31,
2024
.
The
Fund
has
adopted
a
policy
of
recording
any
transfers
of
investment
securities
between
the
different
levels
in
the
fair
value
hierarchy
as
of
the
end
of
the
year.
Fair
value
measurements:
Accounting
Standards
Codification
(ASC)
820
establishes
a
three-
tier
framework
for
measuring
fair
value
based
on
a
hierarchy
of
inputs.
The
hierarchy
distinguishes
between
market
data
obtained
from
independent
sources
(observable
inputs)
and
the
Funds’
own
market
assumptions
(unobservable
inputs).
These
inputs
are
used
in
determining
the
value
of
the
Funds’
investments
and
are
summarized
below.
Level
1
-
Unadjusted
quoted
prices
in
active
markets
for
identical
assets
or
liabilities
that
the
Trust
has
the
ability
to
access.
Level
2
-
Observable
inputs
other
than
quoted
prices
in
Level
1
that
are
observable
for
the
asset
or
liability,
either
directly
or
indirectly.
These
inputs
may
include
quoted
prices
for
the
identical
instrument
on
an
inactive
market,
prices
for
similar
instruments,
interest
rates,
prepayment
speeds,
credit
risk,
yield
curves,
default
rates,
and
similar
data.
Level
3
−
Unobservable
inputs
for
the
asset
or
liability,
to
the
extent
relevant
observable
inputs
are
not
available,
representing
the
Trust’s
own
assumptions
about
the
assumptions
a
market
participant
would
use
in
valuing
the
asset
or
liability,
and
would
be
based
on
the
best
information
available.
The
availability
of
observable
inputs
can
vary
from
security
to
security
and
is
affected
by
a
wide
variety
of
factors,
including,
for
example,
the
type
of
security,
whether
the
security
is
new
and
not
yet
established
in
the
marketplace,
the
liquidity
of
markets,
and
other
characteristics
particular
to
the
security.
To
the
extent
that
valuation
is
based
on
models
or
inputs
that
are
less
observable
or
unobservable
in
the
market,
the
determination
of
fair
value
requires
more
judgment.
Accordingly,
the
degree
of
judgment
exercised
in
determining
fair
value
is
greatest
for
instruments
categorized
in
Level
3.
The
inputs
used
to
measure
fair
value
may
fall
into
different
levels
of
the
fair
value
hierarchy.
In
such
cases,
for
disclosure
purposes,
the
level
in
the
fair
value
hierarchy
within
which
the
fair
value
measurement
falls
in
its
entirety
is
determined
based
on
the
lowest
level
input
that
is
significant
to
the
fair
value
measurement
in
its
entirety.
The
inputs
or
methodology
used
for
valuing
securities
are
not
necessarily
an
indication
of
the
risk
associated
with
investing
in
those
securities.
Concentration
of
credit
risk:
The
Funds
may
have
deposits
of
cash
with
the
custodian
from
time
to
time
for
one
or
more
reasons.
“Other
assets
(net
of
liabilities)”
in
the
Funds’
Schedules
of
Investments
primarily
represents
cash
on
deposit
with
the
custodian.
Cash
on
deposit
will
vary
widely
over
time.
Accounting
Standards
Codification
(“ASC”)
825,
“Financial
Instruments,”
identifies
these
items
as
a
concentration
of
credit
risk.
The
risk
is
managed
by
careful
financial
analysis
and
review
of
the
custodian’s
operations,
resources,
and
protections
available
to
the
Trust.
This
process
includes
evaluation
of
other
financial
institutions
providing
investment
company
custody
services.
Federal
income
taxes:
Each
Fund
intends
to
comply
with
the
requirements
of
the
Internal
Revenue
Code
necessary
to
qualify
as
a
regulated
investment
company
and
to
make
the
requisite
distributions
of
income
and
capital
gains
to
its
shareowners
sufficient
to
relieve
it
from
all
or
substantially
all
federal
income
taxes.
Therefore,
no
federal
income
tax
provision
is
required.
The
Funds
recognize
the
tax
benefits
of
uncertain
tax
positions
only
where
the
position
is
“more
likely
than
not”
to
be
sustained
assuming
examination
by
tax
authorities.
Management
has
analyzed
the
Funds’
tax
positions
and
has
concluded
that
no
liability
for
unrecognized
tax
benefits
should
be
recorded
related
to
uncertain
tax
positions
taken
on
returns
filed
for
open
tax
years
(2020
−
2022)
or
expected
to
be
taken
in
the
Funds’
2023
tax
returns.
The
Funds
identify
their
major
tax
jurisdiction
as
US
federal
and
foreign
jurisdictions
where
the
Funds
make
significant
investments;
however,
the
Funds
are
not
aware
of
any
tax
positions
for
which
it
is
reasonably
possible
that
the
total
amounts
of
unrecognized
tax
benefits
will
change
materially
in
the
next
12
months.
Reclassification
of
capital
accounts:
Accounting
principles
generally
accepted
in
the
United
States
of
America
require
that
certain
components
of
net
assets
relating
to
permanent
differences
be
reclassified
between
financial
and
tax
reporting.
As
of
November
30,
2023
,
there
were
no
reclassifications
to
the
capital
accounts.
Distributions
to
shareowners:
Sustainable
Equity
Fund
and
Sustainable
Bond
Fund
pay
income
dividends
annually,
typically
by
the
end
of
the
year.
As
a
result
of
its
investment
strategy,
the
Saturna
Sustainable
Equity
Fund
may
not
pay
income
dividends.
For
both
Funds,
distributions
of
capital
Common
Stocks
Beginning
Balance
$158,467
Total
realized
gain
(loss)
$-
Change
in
unrealized appreciation
(depreciation)
$26,621
Net
purchases
$-
Net
Sales
$(185,088)
Transfers
into
Level
3
$-
Transfers
out
of
Level
3
$-
Ending
Balance
$0
Corporate
Bonds
Beginning
Balance
$-
Total
realized
gain
(loss)
$-
Change
in
unrealized appreciation
(depreciation)
$-
Net
purchases
$-
Net
Sales
$-
Transfers
into
Level
3
$816,083-
Transfers
out
of
Level
3
$-
Ending
Balance
$816,083
Asset
Category
Fair
Value
Valuation
Technique
Unobservable
Input
Input
Value
Government
$816,083
Local
close
on
05/31/2024
adjusted
by
FX
None
FX
0.000258845
Note
3
–
Significant
Accounting
Policies
(continued)
Notes
To
Financial
Statements
(continued)
gains,
if
any,
are
made
at
least
annually,
and
as
required
to
comply
with
federal
excise
tax
requirements.
Distributions
to
shareowners
are
determined
in
accordance
with
income
tax
regulations
and
are
recorded
on
the
ex-dividend
date.
Dividends
are
paid
in
shares
of
the
Funds,
at
the
net
asset
value
on
the
payable
date.
Shareowners
may
elect
to
take
distributions
if
they
total
$10
or
more
in
cash.
Use
of
estimates:
The
preparation
of
financial
statements
in
conformity
with
accounting
principles
generally
accepted
in
the
United
States
of
America
requires
management
to
make
estimates
and
assumptions
that
affect
the
reported
amounts
of
assets
and
liabilities
and
disclosure
of
contingent
assets
and
liabilities
at
the
date
of
the
financial
statements
and
the
reported
amounts
of
increases
and
decreases
in
net
assets
during
the
reporting
period.
Actual
results
could
differ
from
those
estimates.
Foreign
taxes:
Withholding
taxes
on
foreign
dividends
are
paid
(a
portion
of
which
may
be
reclaimable)
or
provided
for
in
accordance
with
the
applicable
country’s
tax
rules
and
rates
and
are
disclosed
in
the
Statement
of
Operations.
Withholding
tax
reclaims
are
filed
in
certain
countries
to
recover
a
portion
of
the
amounts
previously
withheld.
The
Funds
record
a
reclaim
receivable
based
on
a
number
of
factors,
including
a
jurisdiction’s
legal
obligation
to
pay
reclaims
as
well
as
payment
history
and
market
convention.
LIBOR
Transition
Risk:
A
Fund
may
invest
in
certain
debt
securities
or
other
financial
instruments
that
utilize
the
London
Interbank
Offered
Rate
(“LIBOR”)
as
a
benchmark
or
reference
rate
for
various
interest
rate
calculations.
A
benchmark
or
reference
rate
may
be
a
significant
factor
in
determining
the
cost
of
financing
to
a
Fund
or
an
investment’s
value
or
return
to
a
Fund,
and
may
be
used
in
other
ways
that
affect
a
Fund’s
investment
performance.
LIBOR
was
discontinued
as
a
floating
rate
benchmark
after
June
30,
2023.
It
is
anticipated
that
financial
instruments,
such
as
certain
floating
rate
bonds,
that
previously
utilized
LIBOR
have
transitioned
to
using
the
Secured
Overnight
Financing
Rate
(“SOFR”),
which
is
a
broad
measure
of
the
cost
of
overnight
borrowings
secured
by
US
Treasury
securities.
The
transition
from
LIBOR
to
SOFR
(or
any
other
replacement
rate)
may
lead
to
a
reduction
in
the
value
of
some
LIBOR-based
investments,
as
well
as
significant
market
uncertainty,
increased
volatility,
and
illiquidity
in
markets
for
various
instruments,
which
may
result
in
prolonged
adverse
market
conditions
and
impact
a
Fund’s
performance
or
NAV.
Other:
Interest
income
is
recognized
on
an
accrual
basis.
Premiums
on
securities
purchased
are
amortized,
and
discounts
are
accreted
using
the
yield
to
maturity
method
over
the
lives
of
the
respective
securities
or
where
applicable,
to
the
first
call
date
of
the
securities
with
premiums.
Dividends
from
equity
securities
are
recorded
as
income
on
the
ex-dividend
date
or
as
soon
as
information
is
available
to
the
Fund.
Note
4
–
Transactions
with
Affiliated
Persons
Under
contracts
approved
annually
by
the
Board
of
Trustees,
including
those
who
are
not
parties
to
the
contract
or
“interested
persons”
(as
defined
in
the
Investment
Company
Act
of
1940)
of
such
parties
or
the
Trust
(the
“Independent
Trustees”),
Saturna
Capital
Corporation
(“Saturna
Capital”)
provides
investment
advisory
services
and
certain
other
administrative
services
required
to
conduct
Trust
business.
Expenses
incurred
by
the
Trust
on
behalf
of
the
Funds
(e.g.,
legal
fees)
are
allocated
to
the
Funds
on
the
basis
of
relative
daily
average
net
assets.
For
such
services,
each
of
the
Funds
pays
the
adviser
an
Investment
Advisory
and
Administrative
Services
Fee
of
0.65%
for
the
Sustainable
Equity
Fund
and
0.55%
for
the
Sustainable
Bond
Fund
of
average
net
assets
per
annum,
payable
monthly.
In
addition,
the
adviser
has
agreed
to
certain
limits
on
other
expenses,
as
described
below
The
Adviser
has
undertaken
to
limit
expenses
of
the
Sustainable
Equity
Fund
to
0.75%
and
the
Sustainable
Bond
Fund
to
0.65%
through
March
31,
2024.
For
the
fiscal
period
ended
May
31,
2024
,
the
advisory
fees
incurred
were
as
follows:
1
In
accordance
with
the
expense
limitation
noted
above,
for
the
fiscal
period
ended
May
31,
2024
,
Saturna
Capital
waived
a
portion
of
the
advisory
fees
of
the
Sustainable
Equity
Fund
and
Sustainable
Bond
Fund.
The
adviser
cannot
recoup
previously
waived
fees
Saturna
Brokerage
Services,
Inc.
(“SBS”),
a
discount
brokerage
and
subsidiary
of
Saturna
Capital
Corporation,
is
registered
as
a
broker-
dealer
and
acts
as
distributor.
On
December
19,
2014,
the
Funds
adopted
a
Distribution
Plan
in
accordance
with
Rule
12b-1
under
the
1940
Act.
On
June
2,
2017,
12b-1
fees
were
terminated
for
both
Saturna
Sustainable
Funds.
SBS
is
used
to
effect
equity
portfolio
transactions
for
the
Trust.
SBS
currently
executes
portfolio
transactions
without
commission.
Transactions
effected
through
other
brokers
are
subject
to
commissions
payable
to
that
broker.
Saturna
Trust
Company
(“STC”),
a
subsidiary
of
Saturna
Capital,
acts
as
retirement
plan
custodian
for
the
Funds.
Each
class
of
shares
of
a
Fund
pays
an
annual
fee
of
$10
per
account
for
retirement
plan
services
to
Saturna
Trust
Company.
For
the
fiscal
period
ended
May
31,
2024
,
the
Funds
incurred
the
following
retirement
plan
custodial
fees
to
STC:
Ms.
Jane
Carten
serves
as
a
trustee
and
president
of
the
Trust.
She
is
also
a
director
and
president
of
Saturna
Capital,
vice
president
of
Saturna
Trust
Company,
and
chairman
of
Saturna
Sendirian
Berhad
.
Ms.
Carten
is
not
compensated
by
the
Trust.
For
the
fiscal
period
ended
May
31,
2024
,
the
Saturna
Investment
Trust
incurred
$40,899
of
total
expenses
for
the
Independent
Trustee's
compensation
and
Trust
board
meetings.
The
Saturna
Sustainable
Funds
incurred
$9,181
of
these
total
expenses.
Advisory
Fees
Advisory
Fees
Waived
900
Sustainable
Equity
Fund
$75,568
$(22,111)
950
Sustainable
Bond
Fund
$86,593
$(28,126)
Retirement
plan
custodial
fees
900
Sustainable
Equity
Fund
(SEEFX)
$917
950
Sustainable
Bond
Fund
(SEBFX)
$567
Note
3
–
Significant
Accounting
Policies
(continued)
Notes
To
Financial
Statements
(continued)
On
May
31,
2024
,
the
trustees,
officers,
and
their
affiliates
(including
Saturna
Capital
Corporation)
as
a
group,
owned
the
following
percentages
of
outstanding
shares:
The
officers
of
the
Trust
are
paid
by
Saturna
Capital
Corporation,
not
the
Trust,
except
the
Chief
Compliance
Officer,
who
is
partially
compensated
by
the
Trust.
For
the
fiscal
period
ended
May
31,
2024
,
the
Funds
paid
the
following
compensation
expenses
for
the
Chief
Compliance
Officer:
Note
5
–
Distributions
to
Shareowners
The
tax
characteristics
of
distributions
paid
for
the
fiscal
period
ended
May
31,
2024
,
and
the
fiscal
year
ended
November
30,
2023
,
were
as
follows:
Note
6
–
Federal
Income
Taxes
The
cost
basis
of
investments
for
federal
income
tax
purposes
at
May
31,
2024
,
were
as
follows:
As
of
November
30,
2023
,
the
components
of
distributable
earnings
on
a
tax
basis
were
as
follows:
At
November
30,
2023
,
the
Funds
had
the
following
capital
loss
carryforwards
and
loss
deferrals,
subject
to
regulation.
Prior
to
their
expiration,
loss
carryforwards
may
be
used
to
offset
future
net
capital
gains
realized
for
federal
income
tax
purposes.
Note
7
–
Investments
During
the
fiscal
period
ended
May
31,
2024
,
the
Funds
purchased
and
sold
the
following
amounts
of
securities.
Note
8
–
Custodian
Under
agreements
in
place
with
the
Trust’s
custodian,
UMB
Bank,
custody
fees
are
reduced
by
credits
for
cash
balances.
For
the
fiscal
period
ended
May
31,
2024
,
such
reductions
were
as
follows:
Note
9
–
Subsequent
Events
There
were
no
other
events
or
transactions
during
the
period
that
materially
impacted
the
amounts
or
disclosures
in
the
Funds’
financial
statements.
Trustees',
officers',
and
affiliates'
ownership
900
Sustainable
Equity
Fund(SEEFX)
35.67%
950
Sustainable
Bond
Fund(SEBFX)
15.78%
Chief
Compliance
Officer
900
Sustainable
Equity
Fund
$3,720
950
Sustainable
Bond
Fund
$5,644
Sustainable
Equity
Fund
May
31,
2024
November
30,
2023
Ordinary
Income
$219,353
$177,042
Sustainable
Bond
Fund
May
31,
2024
November
30,
2023
Ordinary
Income
$1,086,688
$183,662
1
Long-Term
Capital
Gain
dividend
designated
at
20%
rate
pursuant
to
Section
852(b)(3)
of
the
Internal
Revenue
Code.
Sustainable
Equity
Fund
Sustainable
Bond
Fund
Cost
of
investments
$16,168,354
$31,619,274
Gross
tax
unrealized
appreciation
$8,430,565
$471,619
Gross
tax
unrealized
depreciation
$(932,715)
$(1,240,329)
Net
tax
unrealized
appreciation
(depreciation)
$7,497,850
$(768,710)
Sustainable
Equity
Fund
Undistributed
ordinary
income
$221,989
Accumulated
capital
and
other
losses
$(635,498)
Tax
accumulated
earnings
$(413,509)
Unrealized
Appreciation
$4,547,702
Other
unrealized
accumulated
losses
$(292)
Total
accumulated
earnings
$4,133,902
Sustainable
Bond
Fund
Undistributed
ordinary
income
$1,028,700
Accumulated
capital
and
other
losses
$(2,085,630)
Tax
accumulated
earnings
$(1,056,930)
Unrealized
Depreciation
$(1,066,729)
Other
unrealized
accumulated
losses
$(11,671)
Total
accumulated
earnings
$(2,135,330)
Sustainable
Equity
Fund
Sustainable
Bond
Fund
Short
term
loss
carryforward
$166,809
$904,725
Long
term
loss
carryforward
$468,690
$1,180,905
Total
Capital
loss
carryforward
$635,499
$2,085,630
Purchases
Sales
900
Sustainable
Equity
Fund
$1,392,944
$1,809,169
950
Sustainable
Bond
Fund
$6,372,311
$2,224,773
Custodian
Fee
Credits
900
Sustainable
Equity
Fund
$717
950
Sustainable
Bond
Fund
$2,797
Note
4
–
Transactions
with
Affiliated
Persons
(continued)
Availability
of
Quarterly
Portfolio
Information
(1)
The
Saturna
Sustainable
Funds
file
complete
schedules
of
portfolio
holdings
with
the
SEC
for
the
first
and
third
quarters
of
each
fiscal
year
as
an
exhibit
to
their
reports
on
Form
N-PORT.
(2)
The
Funds’
Form
N-PORT
reports
are
available
on
the
SEC’s
website
at
www.sec.gov
and
at
www.saturnasustainable.com.
(3)
The
Funds
post
a
complete
schedule
of
portfolio
holdings
after
the
end
of
each
month,
available
to
investors
at
www.
saturnasustainable.com.
Privacy
Statement
At
Saturna
Capital
and
Saturna
Investment
Trust,
we
understand
the
importance
of
maintaining
the
privacy
of
your
financial
information.
We
want
to
assure
you
that
we
protect
the
confidentiality
of
any
personal
information
that
you
share
with
us.
In
addition,
we
do
not
sell
information
about
our
current
or
former
customers.
In
the
course
of
our
relationship,
we
gather
certain
nonpublic
information
about
you,
including
your
name,
address,
investment
choices,
and
account
information.
We
do
not
disclose
your
information
to
unaffiliated
third
parties
unless
it
is
necessary
to
process
a
transaction;
service
your
account;
deliver
your
account
statements,
shareowner
reports,
and
other
information;
or
as
required
by
law.
When
we
disclose
information
to
unaffiliated
third
parties,
we
require
a
contract
to
restrict
the
companies’
use
of
customer
information
and
from
sharing
or
using
it
for
any
purposes
other
than
performing
the
services
for
which
they
were
required.
We
may
share
information
within
the
Saturna
Capital
family
of
companies
in
the
course
of
informing
you
about
products
or
services
that
may
address
your
investing
needs.
We
maintain
our
own
technology
resources
to
minimize
the
need
for
any
third-party
services,
and
restrict
access
to
information
within
Saturna.
We
maintain
physical,
electronic,
and
procedural
safeguards
to
guard
your
personal
information.
If
you
have
any
questions
or
concerns
about
the
security
or
privacy
of
your
information,
please
call
us
at
1-800-728-8762.
Item 8. Changes in and Disagreements with Accountants for Open-End Management Investment Companies.
Not applicable.
Item 9. Proxy Disclosures for Open-End Management Investment Companies.
Not applicable.
Item 10. Remuneration Paid to Directors, Officers, and Others of Open-End Management Investment Companies.
The Funds’ disclosure of remuneration items is included as part of the Financial Statements filed under Item 7 of this form.
Item 11. Statement Regarding Basis for Approval of Investment Advisory Contract.
Not applicable.
Item 12. Disclosure of Proxy Voting Policies and Procedures for Closed-End Management Investment Companies.
Not applicable.
Item 13. Portfolio Managers of Closed-End Management Investment Companies.
Not applicable.
Item 14. Purchases of Equity Securities by Closed-End Management Investment Company and Affiliated Purchasers.
Not applicable.
Item 15. Submission of Matters to a Vote of Security Holders.
No changes to report.
Item 16. Controls and Procedures.
a. The Registrant’s President and Treasurer have concluded, based on their evaluation of the Registrant’s disclosure controls and procedures (as defined in Rule 30a-3(c) under the Investment Company Act of 1940 (the “Act”)) as conducted within 90 days of the filing date of this report, that those disclosure controls and procedures provide reasonable assurance that the material information required to be disclosed by the Registrant on this report is recorded, processed, summarized and reported within the time periods specified in the Securities and Exchange Commission’s rules and forms.
b. There were no significant changes in the Registrant’s internal control over financial reporting (as defined in Rule 30e-3(d) under the Act) that occurred during the period covered by this report that has materially affected, or is reasonably likely to materially affect, the Registrant’s internal control over financial reporting.
Item 17. Disclosure of Securities Lending Activities for Closed-End Management Investment Companies.
Not applicable.
Item 18. Recovery of Erroneously Awarded Compensation.
Not applicable.
Item 19. Exhibits.
Exhibits included with this filing:
(a)(1) Code of Ethics.
(a)(2) Certification pursuant to Rule 30a-2(a) under the Investment Company Act of 1940 (17 CFR 270.30a-2(a)) is filed and attached hereto as Exhibit 99.CERT.
(a)(3) Not applicable.
(b) Certification pursuant to Rule 30a-2(b) under the Investment Company Act of 1940 (17 CFR 270.30a-2(b)) is furnished and attached hereto as Exhibit 99.906.CERT.
SIGNATURES
Pursuant to the requirements of the Securities Exchange Act of 1934 and the Investment Company Act of 1940, the registrant has duly caused this report to be signed on its behalf by the undersigned, thereunto duly authorized.
SATURNA INVESTMENT TRUST
By:
/s/ Jane K. Carten, President
Signature and Title
Jane K. Carten, President
Printed name and Title
September 13, 2024
Date
Pursuant to the requirements of the Securities Exchange Act of 1940, this report has been signed below by the following persons on behalf of the registrant and in the capacities indicated.
By:
/s/ Jane K. Carten, President
Signature and Title
Jane K. Carten, President
Printed name and Title
September 13, 2024
Date
By:
/s/Christopher R. Fankhauser, Treasurer
Signature and Title
Christopher R. Fankhauser, Treasurer
Printed name and Title
September 13, 2024
Date