United States
Securities and Exchange Commission
Washington, D.C. 20549
Form N-CSR
Certified Shareholder Report of Registered Management Investment Companies
Investment Company Act file number: 811-05075
Thrivent Mutual Funds
(Exact name of registrant as specified in charter)
901 Marquette Avenue, Suite 2500
Minneapolis, Minnesota 55402-3211
(Address of principal executive offices) (Zip code)
John D. Jackson, Secretary and Chief Legal Officer
Thrivent Mutual Funds
901 Marquette Avenue, Suite 2500
Minneapolis, Minnesota 55402-3211
(Name and address of agent for service)
Registrant’s telephone number, including area code: (612) 844-7190
Date of fiscal year end: December 31
Date of reporting period: December 31, 2024
Item 1. Report to Stockholders
(a) A copy of the registrant’s report transmitted to shareholders pursuant to Rule 30e-1 under the Investment Company Act of 1940 (the “Act”), as amended, is filed herewith.
(b) Not applicable.
Thrivent Diversified Income Plus Fund
Annual Shareholder Report - December 31, 2024
This annual shareholder report contains important information about the Thrivent Diversified Income Plus Fund (the Fund) for the 12 months ended December 31, 2024.You can find additional information about the Fund at www.thriventmutualfunds.com/prospectus. You can also request this information by contacting us at 800-847-4836.
What were the Fund's costs for the last year?
(based on a hypothetical $10,000 investment)
| Share Class | Cost of a $10K Investment | Cost Paid as a % of a $10K Investment |
|---|
| Class A | $96 | 0.93% |
|---|
How did the Fund perform over the past 12 months?
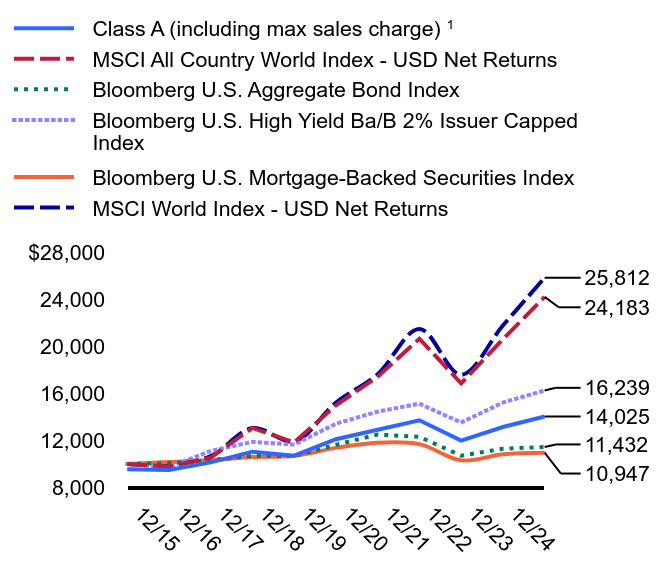
For the 12 months ended December 31, 2024, Diversified Income Plus Fund (excluding sales charge), earned a return of 6.81%, outperforming the average return of its peer group, the Morningstar Conservative Allocation category which returned 5.41%. The Fund’s broad-based benchmark MSCI All Country World Index - USD Net Returns earned a return of 17.49% over the same period.
The key factors that contributed to the Fund's performance over the past 12 months include:
How did the Fund perform over the past 10 years?
| Class A (including max sales charge) Footnote Reference1 | MSCI All Country World Index - USD Net Returns | Bloomberg U.S. Aggregate Bond Index | Bloomberg U.S. High Yield Ba/B 2% Issuer Capped Index | Bloomberg U.S. Mortgage-Backed Securities Index | MSCI World Index - USD Net Returns |
|---|
| 12/14 | 9,550 | 10,000 | 10,000 | 10,000 | 10,000 | 10,000 |
|---|
| 12/15 | 9,491 | 9,764 | 10,055 | 9,728 | 10,151 | 9,913 |
|---|
| 12/16 | 10,127 | 10,531 | 10,321 | 11,099 | 10,321 | 10,657 |
|---|
| 12/17 | 11,037 | 13,056 | 10,687 | 11,867 | 10,577 | 13,045 |
|---|
| 12/18 | 10,694 | 11,827 | 10,688 | 11,644 | 10,682 | 11,908 |
|---|
| 12/19 | 12,097 | 14,973 | 11,620 | 13,412 | 11,360 | 15,203 |
|---|
| 12/20 | 12,904 | 17,406 | 12,492 | 14,440 | 11,800 | 17,621 |
|---|
| 12/21 | 13,707 | 20,633 | 12,299 | 15,111 | 11,677 | 21,465 |
|---|
| 12/22 | 11,975 | 16,844 | 10,699 | 13,513 | 10,298 | 17,571 |
|---|
| 12/23 | 13,130 | 20,584 | 11,291 | 15,210 | 10,817 | 21,751 |
|---|
| 12/24 | 14,025 | 24,183 | 11,432 | 16,239 | 10,947 | 25,812 |
|---|
U.S. Government & Agencies
| Average Annual Total Returns * | 1 year | 5 year | 10 year |
|---|
Class A (excluding sales charge)Footnote Reference1 | 6.81% | 3.00% | 3.92% |
|---|
Class A (including max sales charge)Footnote Reference1 | 2.06% | 2.06% | 3.45% |
|---|
| MSCI All Country World Index - USD Net Returns | 17.49% | 10.06% | 9.23% |
|---|
| Bloomberg U.S. Aggregate Bond Index | 1.25% | -0.33% | 1.35% |
|---|
| Bloomberg U.S. High Yield Ba/B 2% Issuer Capped Index | 6.77% | 3.90% | 4.97% |
|---|
| Bloomberg U.S. Mortgage-Backed Securities Index | 1.20% | -0.74% | 0.91% |
|---|
| MSCI World Index - USD Net Returns | 18.67% | 11.17% | 9.95% |
|---|
* Total returns assume reinvestment of all dividends and capital gains. At various times, the Fund's adviser may have waived certain fees and/or reimbursed expenses, without which total returns would have been lower.
1 The Fund's past performance is not a good predictor of the Fund's future performance. The line graph and table do not reflect the deduction of taxes that a shareholder would pay on fund distributions or redemption of fund shares. Call 800-847-4836 or visit www.thriventfunds.com/mutual-funds/performance-summary.html for performance results current to the most recent month-end.
| Total Net Assets | # of Portfolio Holdings | Portfolio Turnover Rate | Advisory Fees Paid |
|---|
| $975,807,380 | 1,957 | 50% | $5,213,972 |
|---|
What did the Fund invest in?
Top Ten Holdings (% of Net Assets)
| Thrivent Core Emerging Markets Debt Fund | 7.9% |
| U.S. Treasury Notes | 3.0% |
| U.S. Treasury Notes | 1.6% |
| Federal National Mortgage Association Conventional 30-Yr. Pass Through | 1.6% |
| U.S. Treasury Notes | 1.2% |
| Thrivent Core International Equity Fund | 1.1% |
| Federal National Mortgage Association Conventional 30-Yr. Pass Through | 0.9% |
| Federal National Mortgage Association Conventional 30-Yr. Pass Through | 0.9% |
| Federal National Mortgage Association Conventional 30-Yr. Pass Through | 0.9% |
| Federal Home Loan Mortgage Corporation Conventional 30-Yr. Pass Through | 0.9% |
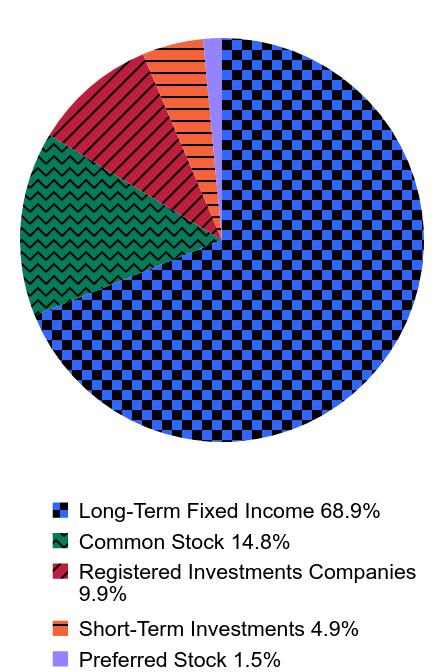
Portfolio Composition (% of Portfolio)
| Value | Value |
|---|
| Long-Term Fixed Income | 68.9% |
| Common Stock | 14.8% |
| Registered Investments Companies | 9.9% |
| Short-Term Investments | 4.9% |
| Preferred Stock | 1.5% |
Major Market Sectors (% of Net Assets)
| Mortgage-Backed Securities | 21.0% |
| Financials | 11.5% |
| U.S. Affiliated Registered Investment Companies | 9.0% |
| U.S. Government & Agencies | 7.9% |
| Asset-Backed Securities | 6.4% |
| Information Technology | 5.9% |
| Collateralized Mortgage Obligations | 5.8% |
| Consumer Discretionary | 4.8% |
| Consumer Staples | 3.8% |
| Energy | 3.2% |
This is a summary of certain changes of the Fund since December 31, 2023. For more complete information, you may review the Fund's next prospectus which will be available at thriventmutualfunds.com/prospectus or upon request at 800-847-4836.
Changes in or Disagreements with Accountants
There were no changes to the Fund's auditor or disagreements with them for the year ended December 31, 2024.
Certain additional fund information is available on the Fund's website, including the Fund's prospectus, financial information, holdings, and proxy voting information.
Important data provider notices and terms available at www.thriventfunds.com/privacy-and-security/index-provider-notices.html
Thrivent Distributors, LLC, a registered broker-dealer and member of FINRA, is the distributor for Thrivent Mutual Funds. Thrivent Asset Management, LLC, an SEC-registered investment adviser, provides asset management services. Both entities are subsidiaries of Thrivent, the marketing name for Thrivent Financial for Lutherans.
Thrivent Diversified Income Plus Fund - Class A: AAHYX
Annual Shareholder Report - December 31, 2024
Thrivent Diversified Income Plus Fund
Annual Shareholder Report - December 31, 2024
This annual shareholder report contains important information about the Thrivent Diversified Income Plus Fund (the Fund) for the 12 months ended December 31, 2024.You can find additional information about the Fund at www.thriventmutualfunds.com/prospectus. You can also request this information by contacting us at 800-847-4836.
What were the Fund's costs for the last year?
(based on a hypothetical $10,000 investment)
| Share Class | Cost of a $10K Investment | Cost Paid as a % of a $10K Investment |
|---|
| Class S | $71 | 0.68% |
|---|
How did the Fund perform over the past 12 months?
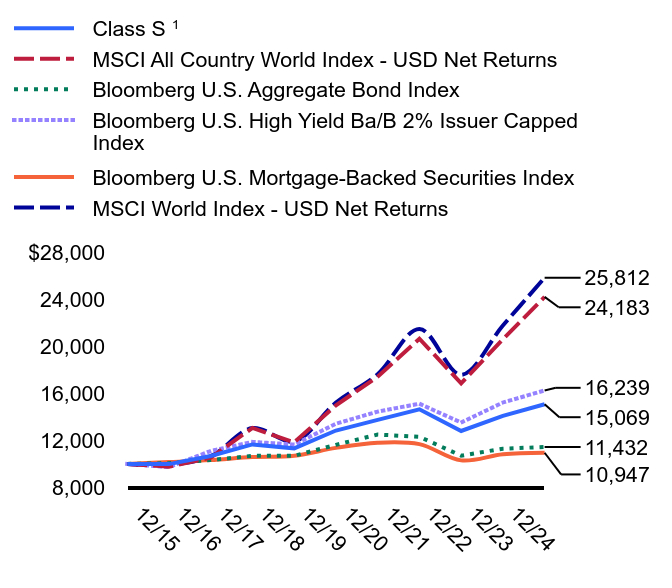
For the 12 months ended December 31, 2024, Diversified Income Plus Fund, earned a return of 7.01%, outperforming the average return of its peer group, the Morningstar Conservative Allocation category which returned 5.41%. The Fund’s broad-based benchmark MSCI All Country World Index - USD Net Returns earned a return of 17.49% over the same period.
The key factors that contributed to the Fund's performance over the past 12 months include:
How did the Fund perform over the past 10 years?
| Class SFootnote Reference1 | MSCI All Country World Index - USD Net Returns | Bloomberg U.S. Aggregate Bond Index | Bloomberg U.S. High Yield Ba/B 2% Issuer Capped Index | Bloomberg U.S. Mortgage-Backed Securities Index | MSCI World Index - USD Net Returns |
|---|
| 12/14 | 10,000 | 10,000 | 10,000 | 10,000 | 10,000 | 10,000 |
|---|
| 12/15 | 9,981 | 9,764 | 10,055 | 9,728 | 10,151 | 9,913 |
|---|
| 12/16 | 10,671 | 10,531 | 10,321 | 11,099 | 10,321 | 10,657 |
|---|
| 12/17 | 11,653 | 13,056 | 10,687 | 11,867 | 10,577 | 13,045 |
|---|
| 12/18 | 11,318 | 11,827 | 10,688 | 11,644 | 10,682 | 11,908 |
|---|
| 12/19 | 12,833 | 14,973 | 11,620 | 13,412 | 11,360 | 15,203 |
|---|
| 12/20 | 13,733 | 17,406 | 12,492 | 14,440 | 11,800 | 17,621 |
|---|
| 12/21 | 14,633 | 20,633 | 12,299 | 15,111 | 11,677 | 21,465 |
|---|
| 12/22 | 12,796 | 16,844 | 10,699 | 13,513 | 10,298 | 17,571 |
|---|
| 12/23 | 14,081 | 20,584 | 11,291 | 15,210 | 10,817 | 21,751 |
|---|
| 12/24 | 15,069 | 24,183 | 11,432 | 16,239 | 10,947 | 25,812 |
|---|
U.S. Government & Agencies
| Average Annual Total Returns * | 1 year | 5 year | 10 year |
|---|
Class SFootnote Reference1 | 7.01% | 3.26% | 4.19% |
|---|
| MSCI All Country World Index - USD Net Returns | 17.49% | 10.06% | 9.23% |
|---|
| Bloomberg U.S. Aggregate Bond Index | 1.25% | -0.33% | 1.35% |
|---|
| Bloomberg U.S. High Yield Ba/B 2% Issuer Capped Index | 6.77% | 3.90% | 4.97% |
|---|
| Bloomberg U.S. Mortgage-Backed Securities Index | 1.20% | -0.74% | 0.91% |
|---|
| MSCI World Index - USD Net Returns | 18.67% | 11.17% | 9.95% |
|---|
* Total returns assume reinvestment of all dividends and capital gains. At various times, the Fund's adviser may have waived certain fees and/or reimbursed expenses, without which total returns would have been lower.
1 The Fund's past performance is not a good predictor of the Fund's future performance. The line graph and table do not reflect the deduction of taxes that a shareholder would pay on fund distributions or redemption of fund shares. Call 800-847-4836 or visit www.thriventfunds.com/mutual-funds/performance-summary.html for performance results current to the most recent month-end.
| Total Net Assets | # of Portfolio Holdings | Portfolio Turnover Rate | Advisory Fees Paid |
|---|
| $975,807,380 | 1,957 | 50% | $5,213,972 |
|---|
What did the Fund invest in?
Top Ten Holdings (% of Net Assets)
| Thrivent Core Emerging Markets Debt Fund | 7.9% |
| U.S. Treasury Notes | 3.0% |
| U.S. Treasury Notes | 1.6% |
| Federal National Mortgage Association Conventional 30-Yr. Pass Through | 1.6% |
| U.S. Treasury Notes | 1.2% |
| Thrivent Core International Equity Fund | 1.1% |
| Federal National Mortgage Association Conventional 30-Yr. Pass Through | 0.9% |
| Federal National Mortgage Association Conventional 30-Yr. Pass Through | 0.9% |
| Federal National Mortgage Association Conventional 30-Yr. Pass Through | 0.9% |
| Federal Home Loan Mortgage Corporation Conventional 30-Yr. Pass Through | 0.9% |
Portfolio Composition (% of Portfolio)
| Value | Value |
|---|
| Long-Term Fixed Income | 68.9% |
| Common Stock | 14.8% |
| Registered Investments Companies | 9.9% |
| Short-Term Investments | 4.9% |
| Preferred Stock | 1.5% |
Major Market Sectors (% of Net Assets)
| Mortgage-Backed Securities | 21.0% |
| Financials | 11.5% |
| U.S. Affiliated Registered Investment Companies | 9.0% |
| U.S. Government & Agencies | 7.9% |
| Asset-Backed Securities | 6.4% |
| Information Technology | 5.9% |
| Collateralized Mortgage Obligations | 5.8% |
| Consumer Discretionary | 4.8% |
| Consumer Staples | 3.8% |
| Energy | 3.2% |
This is a summary of certain changes of the Fund since December 31, 2023. For more complete information, you may review the Fund's next prospectus which will be available at thriventmutualfunds.com/prospectus or upon request at 800-847-4836.
Changes in or Disagreements with Accountants
There were no changes to the Fund's auditor or disagreements with them for the year ended December 31, 2024.
Certain additional fund information is available on the Fund's website, including the Fund's prospectus, financial information, holdings, and proxy voting information.
Important data provider notices and terms available at www.thriventfunds.com/privacy-and-security/index-provider-notices.html
Thrivent Distributors, LLC, a registered broker-dealer and member of FINRA, is the distributor for Thrivent Mutual Funds. Thrivent Asset Management, LLC, an SEC-registered investment adviser, provides asset management services. Both entities are subsidiaries of Thrivent, the marketing name for Thrivent Financial for Lutherans.
Thrivent Diversified Income Plus Fund - Class S: THYFX
Annual Shareholder Report - December 31, 2024
Item 2. Code of Ethics
As of the end of the period covered by this report, the registrant has adopted a code of ethics that applies to the registrant’s principal executive officer, principal financial officer, principal accounting officer or controller, or persons performing similar functions. There were no amendments made to or waivers granted under the code of ethics during the period covered by this report. The registrant’s code of ethics is filed herewith pursuant to Item 19(a)(1) of this Form N-CSR.
Item 3. Audit Committee Financial Expert
Registrant’s board of trustees has determined that Robert J. Chersi, an independent trustee, is the Audit Committee Financial Expert.
Item 4. Principal Accountant Fees and Services
(a) through (d)
Thrivent Diversified Income Plus Fund a series of Thrivent Mutual Funds, a Massachusetts business trust (the “Trust”). The Trust, as of the date of filing this Form N-CSR, contains a total of 23 series (the “Series”), including the Funds. This Form N-CSR relates to the annual report of each Fund.
The following table presents the aggregate fees billed to the Funds for the respective fiscal years ended December 31, 2023 and December 31, 2024 by the Funds’ independent public accountants, PricewaterhouseCoopers LLP (“PwC”), for professional services rendered for the audit of the Funds’ annual financial statements and fees billed for other services rendered by PwC during those periods.
Fiscal Years Ended | 12/31/2023 | 12/31/2024 |
| | | |
| Audit Fees | $49,592 | $28,609 |
| | | |
Audit-Related Fees(1) | $0 | $0 |
| | | |
Tax Fees(2) | $14,870 | $8,322 |
| | | |
All Other Fees(3) | $0 | $0 |
| | | |
| Total | $64,462 | $36,931 |
| | | |
| | | |
(1) Audit-related fees consist of the aggregate fees billed for assurance and related services that are reasonably related to the performance of the audit of financial statements and are not reported under the category of audit fees.
(2) Tax fees consist of the aggregate fees billed for professional services rendered by the principal accountant relating to tax compliance, tax advice, and tax planning and specifically include fees for tax return preparation. These fees include payments for tax return compliance services, excise distribution review services, and other tax related matters.
(3) All other fees consist of the aggregate fees billed for products and services provided by the principal accountant other than audit, audit-related, and tax services. These figures are also reported in the response to Item 4(g) below.
The following table presents the aggregate fees billed to all Series of the Trust (other than the Funds) with fiscal years ending on October 31 for the fiscal years ended October 31, 2023 and October 31, 2024 by PwC for professional services rendered for the audit of the annual financial statements of the applicable Series and fees billed for other services rendered by PwC during those periods.
Fiscal Years Ended | 10/31/2023 | 10/31/2024 |
| | | |
| Audit Fees | $625,508 | $629,391 |
| | | |
Audit-Related Fees(1) | $0 | $0 |
| | | |
Tax Fees(2) | $171,000 | $196,680 |
| | | |
All Other Fees(3) | $0 | $0 |
| | | |
| Total | $796,508 | $826,071 |
| | | |
| | | |
(1) Audit-related fees consist of the aggregate fees billed for assurance and related services that are reasonably related to the performance of the audit of financial statements and are not reported under the category of audit fees.
(2) Tax fees consist of the aggregate fees billed for professional services rendered by the principal accountant relating to tax compliance, tax advice, and tax planning and specifically include fees for tax return preparation. These fees include payments for tax return compliance services, excise distribution review services, and other tax related matters.
(3) All other fees consist of the aggregate fees billed for products and services provided by the principal accountant other than audit, audit-related, and tax services. These figures are also reported in response to Item 4(g) below.
(e) Registrant’s audit committee charter, adopted in February 2010, provides that the audit committee (comprised of the independent Trustees of registrant) is responsible for pre‑approval of all auditing services performed for the registrant. The audit committee also is responsible for pre-approval (subject to the de minimis exceptions for non-audit services described in Section 10A(i)(1)(B) of the Securities Exchange Act of 1934) of all non-auditing services performed for the registrant or an affiliate of registrant. In addition, registrant’s audit committee charter permits a designated member of the audit committee to pre-approve, between meetings, one or more audit or non-audit service projects, subject to an expense limit and notification to the audit committee at the next committee meeting. Registrant’s audit committee pre-approved all fees described above that PwC billed to registrant.
(f) Less than 50% of the hours billed by PwC for auditing services to registrant for the fiscal year ended December 31, 2024 was for work performed by persons other than full-time permanent employees of PwC.
(g) The aggregate non-audit fees billed by PwC to registrant and to registrant’s investment adviser and any entity controlling, controlled by, or under common control with registrant’s investment adviser for the fiscal years set forth below are disclosed in the table below. These figures are also reported in response to Item 4(d) above.
Fiscal Year Ended | 10/31/2023 | 12/31/2023 | 10/31/2024 | 12/31/2024 |
Registrant(1) | $0 | $0 | $0 | $0 |
| Adviser | $0 | $0 | $0 | $0 |
(h) Registrant’s audit committee has considered the non-audit services provided to the registrant and registrant’s investment adviser and any entity controlling, controlled by, or under common control with registrant’s investment adviser as described above and determined that these services do not compromise PwC’s independence.
Item 5. Audit Committee of Listed Registrants
(a) Not applicable.
(b) Not applicable.
Item 6. Investments
(a) Registrant’s Schedules of Investments are included in the financial statements filed under Item 7 of this Form N-CSR.
(b) Not applicable.
Item 7. Financial Statements and Financial Highlights for Open-End Management Investment Companies
The registrant’s audited financial statements and financial highlights as of the end of the period covered by this report are included in this Form N-CSR.
Financial
Statements
and
Additional
Information
Report
of
Independent
Registered
Public
Accounting
Firm
2
Schedule
of
Investments
Thrivent
Diversified
Income
Plus
Fund
3
Statement
of
Assets
and
Liabilities
38
Statement
of
Operations
39
Statement
of
Changes
in
Net
Assets
40
Notes
to
Financial
Statements
41
Financial
Highlights
54
Federal
Tax
Information
56
Change
in
and
Disagreement
with
Accountants
(Item
8)
57
Proxy
Disclosures
(Item
9)
58
Remuneration
Paid
to
Directors,
Officers,
and
Oth-
ers
(Item
10)
59
Statement
Regarding
Basis
for
Approval
of
Invest-
ment
Advisory
Contract
(Item
11)
60
To
the
Board
of
Trustees
of
Thrivent
Mutual
Funds
and
Shareholders
of
Thrivent
Diversified
Income
Plus
Fund
Opinion
on
the
Financial
Statements
We
have
audited
the
accompanying
statement
of
assets
and
liabilities,
including
the
schedule
of
investments,
of
Thrivent
Diversified
Income
Plus
Fund
(one
of
the
funds
constituting
Thrivent
Mutual
Funds,
hereafter
collectively
referred
to
as
the
"Fund")
as
of
December
31,
2024,
the
related
statement
of
operations
for
the
year
ended
December
31,
2024,
the
statement
of
changes
in
net
assets
for
each
of
the
two
years
in
the
period
ended
December
31,
2024,
including
the
related
notes,
and
the
financial
highlights
for
each
of
the
five
years
in
the
period
ended
December
31,
2024
(collectively
referred
to
as
the
“financial
statements”).
In
our
opinion,
the
financial
statements
present
fairly,
in
all
material
respects,
the
financial
position
of
the
Fund
as
of
December
31,
2024,
the
results
of
its
operations
for
the
year
then
ended,
the
changes
in
its
net
assets
for
each
of
the
two
years
in
the
period
ended
December
31,
2024
and
the
financial
highlights
for
each
of
the
five
years
in
the
period
ended
December
31,
2024
in
conformity
with
accounting
principles
generally
accepted
in
the
United
States
of
America.
Basis
for
Opinion
These
financial
statements
are
the
responsibility
of
the
Fund’s
management.
Our
responsibility
is
to
express
an
opinion
on
the
Fund’s
financial
statements
based
on
our
audits.
We
are
a
public
accounting
firm
registered
with
the
Public
Company
Accounting
Oversight
Board
(United
States)
(PCAOB)
and
are
required
to
be
independent
with
respect
to
the
Fund
in
accordance
with
the
U.S.
federal
securities
laws
and
the
applicable
rules
and
regulations
of
the
Securities
and
Exchange
Commission
and
the
PCAOB.
We
conducted
our
audits
of
these
financial
statements
in
accordance
with
the
standards
of
the
PCAOB.
Those
standards
require
that
we
plan
and
perform
the
audit
to
obtain
reasonable
assurance
about
whether
the
financial
statements
are
free
of
material
misstatement,
whether
due
to
error
or
fraud.
Our
audits
included
performing
procedures
to
assess
the
risks
of
material
misstatement
of
the
financial
statements,
whether
due
to
error
or
fraud,
and
performing
procedures
that
respond
to
those
risks.
Such
procedures
included
examining,
on
a
test
basis,
evidence
regarding
the
amounts
and
disclosures
in
the
financial
statements.
Our
audits
also
included
evaluating
the
accounting
principles
used
and
significant
estimates
made
by
management,
as
well
as
evaluating
the
overall
presentation
of
the
financial
statements.
Our
procedures
included
confirmation
of
securities
owned
as
of
December
31,
2024
by
correspondence
with
the
custodian,
transfer
agent
and
brokers;
when
replies
were
not
received
from
brokers,
we
performed
other
auditing
procedures.
We
believe
that
our
audits
provide
a
reasonable
basis
for
our
opinions.
Minneapolis,
Minnesota
February
18,
2025
We
have
served
as
the
auditor
of
one
or
more
investment
companies
in
the
Thrivent
Financial
investment
company
complex
since
1987.
PricewaterhouseCoopers
LLP,
45
South
Seventh
Street,
Suite
3400,
Minneapolis,
MN
55402
T:
(612)
596
6000,
www.pwc.com/us
Report
of
Independent
Registered
Public
Accounting
Firm
Diversified
Income
Plus
Fund
Schedule
of
Investments
as
of
December
31,
2024
The
accompanying
Notes
to
Financial
Statements
are
an
integral
part
of
this
schedule.
Principal
Amount
Long-Term
Fixed
Income
68.9%
Value
Asset-Backed
Securities 6.4%
Affirm
Asset
Securitization
Trust
$
1,250,000
6.820%,
9/15/2028,
Ser.
2023-B,
Class
A
a
$
1,267,514
64,680
7.110%,
11/15/2028,
Ser.
2023-X1,
Class
A
a
64,839
1,500,000
5.610%,
2/15/2029,
Ser.
2024-A,
Class
A
a
1,510,941
AGL
CLO
13,
Ltd.
1,100,000
6.529%,
(TSFR3M
+
1.912%),
10/20/2034,
Ser.
2021-13A,
Class
B
a,b
1,100,516
Anchorage
Capital
CLO
20,
Ltd.
850,000
7.570%,
(TSFR3M
+
3.200%),
1/20/2035,
Ser.
2021-20A,
Class
DR
a,b
850,000
Anchorage
Capital
CLO
21,
Ltd.
1,225,000
7.279%,
(TSFR3M
+
2.662%),
10/20/2034,
Ser.
2021-21A,
Class
C
a,b
1,229,740
Balboa
Bay
Loan
Funding,
Ltd.
625,000
6.331%,
(TSFR3M
+
1.750%),
10/20/2035,
Ser.
2020-1A,
Class
BRR
a,b
625,041
Ballyrock
CLO,
Ltd.
1,450,000
6.429%,
(TSFR3M
+
1.812%),
10/20/2031,
Ser.
2020-2A,
Class
A2R
a,b
1,452,781
Business
Jet
Securities,
LLC
814,148
4.455%,
6/15/2037,
Ser.
2022-1A,
Class
A
a
789,580
1,635,738
6.197%,
5/15/2039,
Ser.
2024-1A,
Class
A
a
1,663,487
CarVal
CLO
IV,
Ltd.
1,250,000
6.629%,
(TSFR3M
+
2.012%),
7/20/2034,
Ser.
2021-1A,
Class
B
a,b
1,250,621
CarVal
CLO,
Ltd.
1,700,000
8.317%,
(TSFR3M
+
3.700%),
4/21/2034,
Ser.
2022-1A,
Class
D
a,b
1,705,909
Cascade
Funding
Mortgage
Trust,
LLC
724,917
4.250%,
4/25/2033,
Ser.
2023-HB12,
Class
A
a,b
717,808
Dryden
36
Senior
Loan
Fund
1,025,000
6.968%,
(TSFR3M
+
2.312%),
4/15/2029,
Ser.
2014-36A,
Class
CR3
a,b
1,026,170
FirstKey
Homes
Trust
1,400,000
1.968%,
10/19/2037,
Ser.
2020-SFR2,
Class
D
a
1,359,569
Hotwire
Funding,
LLC
1,500,000
5.893%,
6/20/2054,
Ser.
2024-1A,
Class
A2
a
1,515,085
HTAP
964,024
7.000%,
4/25/2037,
Ser.
2024-1,
Class
A
a
956,894
HTAP
Issuer
Trust
702,097
6.500%,
4/25/2042,
Ser.
2024-2,
Class
A
a
692,049
Principal
Amount
Long-Term
Fixed
Income 68.9%
Value
Asset-Backed
Securities 6.4%
-
continued
Huntington
Bank
Auto
Credit-
Linked
Notes
$
233,491
5.442%,
10/20/2032,
Ser.
2024-2,
Class
B1
a
$
233,675
Madison
Park
Funding
XVIII,
Ltd.
1,725,000
6.779%,
(TSFR3M
+
2.162%),
10/21/2030,
Ser.
2015-18A,
Class
CRR
a,b
1,727,175
MetroNet
Infrastructure
Issuer,
LLC
1,500,000
6.230%,
4/20/2054,
Ser.
2024-1A,
Class
A2
a
1,530,123
MFA
Trust
732,064
6.330%,
9/25/2054,
Ser.
2024-NPL1,
Class
A1
c
733,402
Neuberger
Berman
CLO,
Ltd.
1,650,000
7.918%,
(TSFR3M
+
3.262%),
10/15/2029,
Ser.
2013-15A,
Class
DR2
a,b
1,652,759
Pagaya
AI
Debt
Grantor
Trust
1,150,000
5.092%,
7/15/2032,
Ser.
2024-11,
Class
A
a
1,150,671
Pagaya
AI
Debt
Grantor
Trust
and
Pagaya
AI
Debt
Trust
694,956
6.093%,
11/15/2031,
Ser.
2024-6,
Class
A
a
701,933
Palmer
Square
Loan
Funding,
Ltd.
250,000
6.150%,
(TSFR3M
+
1.700%),
1/15/2033,
Ser.
2024-2A,
Class
B
a,b
250,005
Pretium
Mortgage
Credit
Partners,
LLC
1,900,000
5.438%,
1/25/2052,
Ser.
2022-NPL1,
Class
A2
a,c
1,826,806
1,222,076
7.021%,
2/25/2054,
Ser.
2024-NPL2,
Class
A1
a,c
1,227,173
1,252,641
7.143%,
3/25/2054,
Ser.
2024-RN1,
Class
A1
a,c
1,256,863
1,455,836
7.520%,
4/27/2054,
Ser.
2024-NPL3,
Class
A1
a,c
1,471,056
1,324,375
3.721%,
7/25/2051,
Ser.
2021-NPL3,
Class
A2
a,c
1,300,752
1,462,817
6.996%,
7/25/2054,
Ser.
2024-NPL4,
Class
A1
a,c
1,469,150
Progress
Residential
Trust
2,350,000
3.600%,
4/17/2039,
Ser.
2022-SFR3,
Class
B
a
2,262,364
PRPM,
LLC
437,853
6.474%,
7/25/2026,
Ser.
2021-6,
Class
A2
a,c
430,928
RCKT
Mortgage
Trust
1,020,402
6.147%,
6/25/2044,
Ser.
2024-CES4,
Class
A1A
a,c
1,028,218
RCO
VII
Mortgage,
LLC
1,067,321
7.021%,
1/25/2029,
Ser.
2024-1,
Class
A1
a,c
1,070,216
Renaissance
Home
Equity
Loan
Trust
1,429,634
5.797%,
8/25/2036,
Ser.
2006-2,
Class
AF3
c
518,476
RR
8,
Ltd.
1,250,000
6.356%,
(TSFR3M
+
1.700%),
7/15/2037,
Ser.
2020-8A,
Class
A2R
a,b
1,256,010
Diversified
Income
Plus
Fund
Schedule
of
Investments
as
of
December
31,
2024
The
accompanying
Notes
to
Financial
Statements
are
an
integral
part
of
this
schedule.
Principal
Amount
Long-Term
Fixed
Income 68.9%
Value
Asset-Backed
Securities 6.4%
-
continued
Saxon
Asset
Securities
Trust
$
567,623
2.546%,
8/25/2035,
Ser.
2004-2,
Class
MF2
b
$
488,286
Sculptor
CLO,
Ltd.
950,000
7.279%,
(TSFR3M
+
2.662%),
1/20/2035,
Ser.
28A,
Class
C
a,b
951,522
Signal
Peak
CLO
1,
Ltd.
1,100,000
6.295%,
(TSFR3M
+
1.950%),
4/17/2034,
Ser.
2014-1A,
Class
CR4
a,b
1,100,000
Silver
Point
CLO
2,
Ltd.
1,800,000
7.317%,
(TSFR3M
+
2.700%),
4/20/2035,
Ser.
2023-2A,
Class
A2
a,b
1,806,764
Stanwich
Mortgage
Loan
Company,
LLC
59,243
6.235%,
10/16/2026,
Ser.
2021-NPB1,
Class
A1
a
59,373
Symphony
CLO
XX,
Ltd.
1,050,000
7.647%,
(TSFR3M
+
3.000%),
1/16/2032,
Ser.
2018-20A,
Class
DR2
a,b
1,052,381
TCW
CLO,
Ltd.
1,400,000
6.330%,
(TSFR3M
+
1.800%),
10/25/2035,
Ser.
2018-1A,
Class
BR3
a,b
1,399,175
Unlock
HEA
Trust
1,382,529
7.000%,
10/25/2038,
Ser.
2023-1,
Class
A
a
1,374,855
1,386,991
7.000%,
4/25/2039,
Ser.
2024-1,
Class
A
a
1,377,746
647,129
6.500%,
10/25/2039,
Ser.
2024-2,
Class
A
a
632,669
Upstart
Securitization
Trust
117,225
6.770%,
6/20/2033,
Ser.
2023-2,
Class
A
a
117,661
Vericrest
Opportunity
Loan
Transferee
1,311,680
4.826%,
2/27/2051,
Ser.
2021-NPL2,
Class
A2
a,c
1,306,662
1,628,469
4.949%,
2/27/2051,
Ser.
2021-NPL3,
Class
A2
a,c
1,622,535
1,145,049
4.826%,
4/25/2051,
Ser.
2021-NPL6,
Class
A2
a,c
1,128,518
338,654
4.949%,
4/25/2051,
Ser.
2021-NPL8,
Class
A2
a,c
333,893
1,736,615
4.826%,
5/25/2051,
Ser.
2021-NPL9,
Class
A2
a,c
1,701,380
401,813
5.438%,
12/26/2051,
Ser.
2021-NP12,
Class
A2
a,c
382,383
Whitebox
CLO
I,
Ltd.
500,000
6.635%,
(TSFR3M
+
2.000%),
7/24/2036,
Ser.
2019-1A,
Class
CRR
a,b
500,893
Whitebox
CLO
IV,
Ltd.
1,250,000
7.217%,
(TSFR3M
+
2.600%),
4/20/2036,
Ser.
2023-4A,
Class
B
a,b
1,257,305
Principal
Amount
Long-Term
Fixed
Income 68.9%
Value
Asset-Backed
Securities 6.4%
-
continued
Wind
River
CLO,
Ltd.
$
950,000
6.879%,
(TSFR3M
+
2.262%),
7/20/2030,
Ser.
2013-1A,
Class
BRR
a,b
$
950,927
Total
62,421,227
Basic
Materials 0.9%
Alliance
Resource
Operating
Partners,
LP/Alliance
Resource
Finance
Corporation
167,000
8.625%,
6/15/2029
a
175,473
ATI,
Inc.
268,000
7.250%,
8/15/2030
275,585
Axalta
Coating
Systems
Dutch
Holding
B
BV
163,000
7.250%,
2/15/2031
a
168,678
Cascades,
Inc./Cascades
USA,
Inc.
297,000
5.125%,
1/15/2026
a,d
294,004
Chemours
Company
270,000
5.750%,
11/15/2028
a
250,813
Cleveland-Cliffs,
Inc.
130,000
5.875%,
6/1/2027
129,263
210,000
4.625%,
3/1/2029
a
194,991
118,000
4.875%,
3/1/2031
a
105,333
78,000
7.375%,
5/1/2033
a
76,612
118,000
6.250%,
10/1/2040
101,799
Consolidated
Energy
Finance
SA
409,000
5.625%,
10/15/2028
a
333,576
Ecolab,
Inc.
174,000
2.125%,
2/1/2032
144,638
First
Quantum
Minerals,
Ltd.
149,000
6.875%,
10/15/2027
a
148,293
FMC
Corporation
135,000
5.150%,
5/18/2026
135,146
FMG
Resources
August
2006,
Pty.
Ltd.
118,000
5.875%,
4/15/2030
a
115,969
Glencore
Funding,
LLC
136,000
5.893%,
4/4/2054
a
131,940
196,000
4.000%,
3/27/2027
a
192,178
Hecla
Mining
Company
160,000
7.250%,
2/15/2028
161,003
Hudbay
Minerals,
Inc.
198,000
4.500%,
4/1/2026
a
195,171
Illuminate
Buyer,
LLC/Illuminate
Holdings
IV,
Inc.
142,000
9.000%,
7/1/2028
a
143,781
INEOS
Finance
plc
353,000
7.500%,
4/15/2029
a
361,339
International
Flavors
&
Fragrances,
Inc.
201,000
1.230%,
10/1/2025
a
195,391
Magnera
Corporation
179,000
7.250%,
11/15/2031
a
174,749
Mercer
International,
Inc.
143,000
5.125%,
2/1/2029
123,608
Methanex
Corporation
179,000
5.125%,
10/15/2027
175,187
119,000
5.250%,
12/15/2029
114,675
Diversified
Income
Plus
Fund
Schedule
of
Investments
as
of
December
31,
2024
The
accompanying
Notes
to
Financial
Statements
are
an
integral
part
of
this
schedule.
Principal
Amount
Long-Term
Fixed
Income 68.9%
Value
Basic
Materials 0.9%
-
continued
Methanex
US
Operations,
Inc.
$
102,000
6.250%,
3/15/2032
a
$
100,914
Mineral
Resources,
Ltd.
192,000
9.250%,
10/1/2028
a
201,441
Mosaic
Company
198,000
5.375%,
11/15/2028
d
200,172
Newmont
Corporation/Newcrest
Finance,
Pty.
Ltd.
200,000
5.350%,
3/15/2034
198,988
Novelis
Corporation
53,000
3.250%,
11/15/2026
a
50,483
124,000
4.750%,
1/30/2030
a
114,455
150,000
3.875%,
8/15/2031
a
129,149
Nutrien,
Ltd.
273,000
4.000%,
12/15/2026
269,217
Peabody
Energy
Corporation,
Convertible
354,000
3.250%,
3/1/2028
d
446,394
SCIL
IV,
LLC/SCIL
USA
Holdings,
LLC
250,000
5.375%,
11/1/2026
a
244,852
Sherwin-Williams
Company
144,000
4.800%,
9/1/2031
142,104
Smurfit
Kappa
Treasury,
ULC
210,000
5.777%,
4/3/2054
a
207,995
SNF
Group
SACA
392,000
3.375%,
3/15/2030
a
343,536
SunCoke
Energy,
Inc.
435,000
4.875%,
6/30/2029
a
396,565
Taseko
Mines,
Ltd.
248,000
8.250%,
5/1/2030
a
253,145
Tronox,
Inc.
124,000
4.625%,
3/15/2029
a
111,296
United
States
Steel
Corporation,
Convertible
242,000
5.000%,
11/1/2026
620,972
Westlake
Corporation
130,000
3.600%,
8/15/2026
d
127,345
Total
8,778,218
Capital
Goods 1.7%
Advanced
Drainage
Systems,
Inc.
242,000
6.375%,
6/15/2030
a
242,021
AECOM
128,000
5.125%,
3/15/2027
126,771
Array
Technologies,
Inc.,
Convertible
459,000
1.000%,
12/1/2028
333,922
BAE
Systems
plc
200,000
5.500%,
3/26/2054
a
194,701
Boeing
Company
136,000
6.858%,
5/1/2054
144,547
412,000
5.930%,
5/1/2060
381,227
222,000
2.196%,
2/4/2026
215,294
197,000
3.250%,
3/1/2028
185,105
293,000
5.150%,
5/1/2030
288,893
68,000
6.528%,
5/1/2034
71,237
Bombardier,
Inc.
56,000
7.875%,
4/15/2027
a
56,085
146,000
6.000%,
2/15/2028
a
145,408
258,000
7.250%,
7/1/2031
a
266,069
Principal
Amount
Long-Term
Fixed
Income 68.9%
Value
Capital
Goods 1.7%
-
continued
$
338,000
7.000%,
6/1/2032
a,d
$
343,834
Builders
FirstSource,
Inc.
250,000
5.000%,
3/1/2030
a
237,654
Camelot
Return
Merger
Sub,
Inc.
177,000
8.750%,
8/1/2028
a
169,611
Canpack
SA/Canpack
US,
LLC
366,000
3.875%,
11/15/2029
a
329,588
Carrier
Global
Corporation
265,000
2.722%,
2/15/2030
237,055
Chart
Industries,
Inc.
296,000
7.500%,
1/1/2030
a
307,745
Clydesdale
Acquisition
Holdings,
Inc.
58,000
6.625%,
4/15/2029
a
58,384
Crown
Cork
&
Seal
Company,
Inc.
142,000
7.375%,
12/15/2026
145,685
EMRLD
Borrower,
LP/Emerald
Co-
Issuer,
Inc.
252,000
6.625%,
12/15/2030
a
252,336
ESAB
Corporation
98,000
6.250%,
4/15/2029
a
99,219
Fluor
Corporation,
Convertible
416,000
1.125%,
8/15/2029
d
522,704
GFL
Environmental,
Inc.
311,000
4.000%,
8/1/2028
a
294,484
300,000
3.500%,
9/1/2028
a
282,740
Greenbrier
Companies,
Inc.,
Convertible
249,000
2.875%,
4/15/2028
d
301,414
H&E
Equipment
Services,
Inc.
386,000
3.875%,
12/15/2028
a
352,780
Herc
Holdings,
Inc.
76,000
5.500%,
7/15/2027
a
75,029
194,000
6.625%,
6/15/2029
a
196,458
Honeywell
International,
Inc.
272,000
5.250%,
3/1/2054
254,723
Howmet
Aerospace,
Inc.
205,000
6.750%,
1/15/2028
214,323
Huntington
Ingalls
Industries,
Inc.
196,000
4.200%,
5/1/2030
185,992
Ingersoll
Rand,
Inc.
226,000
5.176%,
6/15/2029
228,233
68,000
5.700%,
8/14/2033
69,582
John
Bean
Technologies
Corporation,
Convertible
299,000
0.250%,
5/15/2026
296,907
John
Deere
Capital
Corporation
141,000
4.700%,
6/10/2030
140,643
280,000
4.400%,
9/8/2031
271,675
144,000
3.900%,
6/7/2032
133,826
67,000
5.150%,
9/8/2033
67,217
L3Harris
Technologies,
Inc.
144,000
5.400%,
1/15/2027
145,770
Lockheed
Martin
Corporation
187,000
5.200%,
2/15/2064
173,442
Martin
Marietta
Materials,
Inc.
111,000
5.150%,
12/1/2034
108,993
Miter
Brands
Acquisition
Holdco,
Inc./MIWD
Borrower,
LLC
74,000
6.750%,
4/1/2032
a
74,347
Diversified
Income
Plus
Fund
Schedule
of
Investments
as
of
December
31,
2024
The
accompanying
Notes
to
Financial
Statements
are
an
integral
part
of
this
schedule.
Principal
Amount
Long-Term
Fixed
Income 68.9%
Value
Capital
Goods 1.7%
-
continued
MIWD
Holdco
II,
LLC
$
72,000
5.500%,
2/1/2030
a
$
68,009
Mueller
Water
Products,
Inc.
249,000
4.000%,
6/15/2029
a
230,045
Nesco
Holdings
II,
Inc.
284,000
5.500%,
4/15/2029
a
263,524
New
Enterprise
Stone
and
Lime
Company,
Inc.
359,000
5.250%,
7/15/2028
a
346,806
Northrop
Grumman
Corporation
275,000
5.200%,
6/1/2054
255,813
63,000
4.700%,
3/15/2033
61,067
OI
European
Group
BV
251,000
4.750%,
2/15/2030
a
223,450
Otis
Worldwide
Corporation
230,000
2.056%,
4/5/2025
228,226
Owens-Brockway
Glass
Container,
Inc.
216,000
6.625%,
5/13/2027
a
215,072
Pactiv
Evergreen
Group
116,000
4.375%,
10/15/2028
a
115,907
Parker-Hannifin
Corporation
141,000
4.250%,
9/15/2027
139,514
Patrick
Industries,
Inc.,
Convertible
180,000
1.750%,
12/1/2028
244,780
Republic
Services,
Inc.
131,000
3.950%,
5/15/2028
127,546
131,000
5.000%,
12/15/2033
128,866
Resideo
Funding,
Inc.
246,000
6.500%,
7/15/2032
a
246,307
Reworld
Holding
Corporation
111,000
4.875%,
12/1/2029
a
102,655
Roller
Bearing
Company
of
America,
Inc.
336,000
4.375%,
10/15/2029
a
313,950
RTX
Corporation
204,000
5.750%,
1/15/2029
210,594
575,000
4.500%,
6/1/2042
496,280
Sealed
Air
Corporation/Sealed
Air
Corporation
(US)
188,000
6.125%,
2/1/2028
a
188,626
Smyrna
Ready
Mix
Concrete,
LLC
343,000
8.875%,
11/15/2031
a
359,620
Spirit
AeroSystems,
Inc.
103,000
3.850%,
6/15/2026
100,520
60,000
9.750%,
11/15/2030
a
66,396
SRM
Escrow
Issuer,
LLC
85,000
6.000%,
11/1/2028
a
82,906
Standard
Industries,
Inc./NY
118,000
4.750%,
1/15/2028
a
112,926
118,000
3.375%,
1/15/2031
a
101,174
Textron,
Inc.
196,000
3.650%,
3/15/2027
190,992
Trane
Technologies
Financing,
Ltd.
151,000
5.100%,
6/13/2034
149,296
TransDigm,
Inc.
75,000
6.750%,
8/15/2028
a
75,654
416,000
7.125%,
12/1/2031
a
425,969
347,000
6.625%,
3/1/2032
a
350,132
Trivium
Packaging
Finance
184,000
5.500%,
8/15/2026
a
181,365
Principal
Amount
Long-Term
Fixed
Income 68.9%
Value
Capital
Goods 1.7%
-
continued
United
Rentals
North
America,
Inc.
$
310,000
4.000%,
7/15/2030
$
282,200
Veralto
Corporation
139,000
5.350%,
9/18/2028
140,777
Waste
Connections,
Inc.
70,000
3.200%,
6/1/2032
61,266
WESCO
Distribution,
Inc.
124,000
6.375%,
3/15/2029
a
125,657
87,000
6.625%,
3/15/2032
a
88,425
Total
16,325,985
Collateralized
Mortgage
Obligations 5.8%
A&D
Mortgage
Trust
353,493
6.498%,
4/25/2069,
Ser.
2024-NQM2,
Class
A1
a,c
356,704
ACRA
Trust
695,840
5.912%,
10/25/2064,
Ser.
2024-NQM1,
Class
A2
a,c
693,483
Alternative
Loan
Trust
532,785
6.000%,
8/1/2036,
Ser.
2006-24CB,
Class
A9
276,284
Banc
of
America
Alternative
Loan
Trust
495,339
6.000%,
11/25/2035,
Ser.
2005-10,
Class
3CB1
431,072
Banc
of
America
Mortgage
Securities
Trust
284,509
6.404%,
9/25/2035,
Ser.
2005-H,
Class
3A1
b
266,681
Bear
Stearns
Adjustable
Rate
Mortgage
Trust
77,480
7.080%,
(CMT
1Y
+
2.300%),
10/25/2035,
Ser.
2005-9,
Class
A1
b
72,683
CAFL
Issuer,
LLC
666,539
2.239%,
3/28/2029,
Ser.
2021-RTL1,
Class
A1
a,c
661,002
CHL
Mortgage
Pass-Through
Trust
106,822
6.744%,
12/20/2035,
Ser.
2005-HYB8,
Class
3A1
b
103,081
701,303
6.000%,
11/25/2037,
Ser.
2007-18,
Class
1A2
303,125
CHNGE
Mortgage
Trust
1,185,285
3.757%,
3/25/2067,
Ser.
2022-2,
Class
A1
a,b
1,118,046
1,042,316
5.000%,
5/25/2067,
Ser.
2022-3,
Class
A1
a,b
1,026,840
1,080,868
6.525%,
6/25/2058,
Ser.
2023-2,
Class
A1
a,c
1,088,661
743,462
5.820%,
6/25/2067,
Ser.
2022-NQM1,
Class
A3
a,c
741,081
709,971
7.100%,
7/25/2058,
Ser.
2023-3,
Class
A1
a,c
718,700
776,549
6.000%,
10/25/2057,
Ser.
2022-4,
Class
A1
a,c
773,353
CIM
Trust
1,282,000
7.100%,
4/25/2058,
Ser.
2023-I1,
Class
A3
a,c
1,291,833
Citigroup
Mortgage
Loan
Trust,
Inc.
83,258
5.500%,
8/25/2034,
Ser.
2004-NCM2,
Class
1CB1
80,210
Diversified
Income
Plus
Fund
Schedule
of
Investments
as
of
December
31,
2024
The
accompanying
Notes
to
Financial
Statements
are
an
integral
part
of
this
schedule.
Principal
Amount
Long-Term
Fixed
Income 68.9%
Value
Collateralized
Mortgage
Obligations 5.8%
-
continued
$
840,813
5.251%,
4/25/2037,
Ser.
2007-AR5,
Class
1A1A
b
$
743,327
COLT
Mortgage
Loan
Trust
1,129,629
6.328%,
12/25/2068,
Ser.
2024-INV1,
Class
A2
a,c
1,137,708
Countrywide
Alternative
Loan
Trust
414,659
5.000%,
3/25/2035,
Ser.
2005-3CB,
Class
1A1
335,284
219,232
4.160%,
10/25/2035,
Ser.
2005-43,
Class
4A1
b
176,678
143,860
5.500%,
2/25/2036,
Ser.
2005-85CB,
Class
2A2
113,073
Countrywide
Home
Loan
Mortgage
Pass
Through
Trust
437,780
5.190%,
11/25/2035,
Ser.
2005-22,
Class
2A1
b
358,102
CSMC
Trust
674,074
6.567%,
8/25/2067,
Ser.
2022-ATH3,
Class
A3
a,b
674,136
535,074
2.572%,
11/25/2066,
Ser.
2022-NQM1,
Class
A2
a,b
449,520
Deutsche
Alt-A
Securities,
Inc.,
Mortgage
Loan
Trust
631,262
5.250%,
6/25/2035,
Ser.
2005-3,
Class
4A6
559,177
290,863
4.250%,
8/25/2035,
Ser.
2005-AR1,
Class
2A3
b
253,746
Federal
Home
Loan
Mortgage
Corporation
1,354,672
3.500%,
8/15/2035,
Ser.
345,
Class
C8
e
131,622
Federal
Home
Loan
Mortgage
Corporation
-
REMIC
2,646,995
4.000%,
1/25/2051,
Ser.
5249,
Class
LA
2,560,258
1,540,299
Zero
Coupon,
9/25/2053,
Ser.
5334,
Class
BO
1,214,315
5,907,190
1.500%,
12/25/2050,
Ser.
5107,
Class
IO
e
463,386
33,758
2.500%,
5/15/2027,
Ser.
4106,
Class
HI
e
137
360,743
3.000%,
5/15/2027,
Ser.
4046,
Class
GI
e
6,975
439,715
3.000%,
7/15/2027,
Ser.
4084,
Class
NI
e
11,018
582,606
3.000%,
7/15/2027,
Ser.
4074,
Class
IO
e
14,737
240,554
2.500%,
2/15/2028,
Ser.
4162,
Class
AI
e
5,586
501,765
2.500%,
2/15/2028,
Ser.
4161,
Class
UI
e
12,254
804,779
2.500%,
3/15/2028,
Ser.
4177,
Class
EI
e
21,497
1,088,284
3.500%,
10/15/2032,
Ser.
4119,
Class
KI
e
90,392
730,689
3.000%,
2/15/2033,
Ser.
4170,
Class
IG
e
51,746
931,143
3.000%,
4/15/2033,
Ser.
4203,
Class
DI
e
38,949
Federal
National
Mortgage
Association
-
REMIC
1,365,893
4.500%,
6/25/2052,
Ser.
2022-43,
Class
MA
1,339,060
Principal
Amount
Long-Term
Fixed
Income 68.9%
Value
Collateralized
Mortgage
Obligations 5.8%
-
continued
$
709,099
3.000%,
7/25/2027,
Ser.
2012-73,
Class
DI
e
$
15,548
434,586
3.000%,
7/25/2027,
Ser.
2012-74,
Class
AI
e
9,195
584,280
3.000%,
8/25/2027,
Ser.
2012-95,
Class
HI
e
7,566
479,625
3.500%,
9/25/2027,
Ser.
2012-98,
Class
YI
e
11,747
1,392,099
3.000%,
11/25/2027,
Ser.
2012-121,
Class
BI
e
35,533
979,391
3.000%,
12/25/2027,
Ser.
2012-139,
Class
DI
e
23,456
331,538
2.500%,
1/25/2028,
Ser.
2012-152,
Class
AI
e
7,759
872,440
3.000%,
1/25/2028,
Ser.
2012-147,
Class
EI
e
19,122
236,311
2.500%,
2/25/2028,
Ser.
2013-46,
Class
CI
e
3,452
331,551
3.000%,
2/25/2028,
Ser.
2013-2,
Class
GI
e
9,073
209,775
3.000%,
4/25/2028,
Ser.
2013-30,
Class
DI
e
6,105
310,325
3.000%,
11/25/2031,
Ser.
2013-69,
Class
IO
e
2,720
1,017,454
3.000%,
2/25/2033,
Ser.
2013-1,
Class
YI
e
77,267
First
Horizon
Alternative
Mortgage
Securities
Trust
158,744
7.003%,
3/25/2035,
Ser.
2005-AA2,
Class
1A1
b
154,606
138,070
5.576%,
7/25/2035,
Ser.
2005-AA5,
Class
2A1
b
127,400
Flagstar
Mortgage
Trust
468,237
2.500%,
9/25/2041,
Ser.
2021-9INV,
Class
A1
a,b
412,411
GCAT
Trust
1,048,675
4.250%,
5/25/2067,
Ser.
2023-NQM4,
Class
A2
a,b
959,890
324,266
6.000%,
9/25/2054,
Ser.
2024-INV3,
Class
A1
a,b
323,392
GMAC
Mortgage
Corporation
Loan
Trust
311,447
3.863%,
5/25/2035,
Ser.
2005-AR2,
Class
4A
b
264,521
Government
National
Mortgage
Association
77,413
4.000%,
1/16/2027,
Ser.
2012-3,
Class
IO
e
1,003
GS
Mortgage-Backed
Securities
Trust
997,633
5.500%,
10/27/2053,
Ser.
2023-PJ3,
Class
A16
a,b
992,611
Home
RE,
Ltd.
1,550,000
9.160%,
(SOFR30A
+
4.600%),
10/25/2033,
Ser.
2023-1,
Class
M1B
a,b
1,605,912
1,336,987
8.069%,
(SOFR30A
+
3.500%),
10/25/2034,
Ser.
2022-1,
Class
M1B
a,b
1,345,915
IndyMac
IMJA
Mortgage
Loan
Trust
949,211
6.250%,
11/25/2037,
Ser.
2007-A3,
Class
A1
389,552
Diversified
Income
Plus
Fund
Schedule
of
Investments
as
of
December
31,
2024
The
accompanying
Notes
to
Financial
Statements
are
an
integral
part
of
this
schedule.
Principal
Amount
Long-Term
Fixed
Income 68.9%
Value
Collateralized
Mortgage
Obligations 5.8%
-
continued
J.P.
Morgan
Mortgage
Trust
$
697,394
2.774%,
5/25/2052,
Ser.
2021-LTV2,
Class
A2
a,b
$
571,979
1,017,534
5.000%,
10/25/2053,
Ser.
2023-3,
Class
A4A
a,b
1,000,518
71,312
6.500%,
1/25/2035,
Ser.
2005-S1,
Class
1A2
72,078
351,492
5.289%,
2/25/2036,
Ser.
2006-A1,
Class
2A2
b
249,219
LHOME
Mortgage
Trust
900,000
7.017%,
1/25/2029,
Ser.
2024-RTL1,
Class
A1
a,c
909,292
750,000
6.900%,
5/25/2029,
Ser.
2024-RTL3,
Class
A1
a,c
757,513
Merrill
Lynch
Alternative
Note
Asset
Trust
891,555
6.000%,
3/25/2037,
Ser.
2007-F1,
Class
2A1
307,583
MFA
Trust
1,500,000
7.093%,
2/25/2029,
Ser.
2024-RTL1,
Class
A1
a,c
1,509,978
MortgageIT
Securities
Corporation
Mortgage
Loan
Trust
1,622,106
4.913%,
(TSFR1M
+
0.574%),
6/25/2047,
Ser.
2007-1,
Class
1A1
b
1,419,654
NYMT
Loan
Trust
1,000,000
7.154%,
2/25/2029,
Ser.
2024-BPL1,
Class
A1
a,c
1,011,098
1,150,000
6.509%,
5/25/2039,
Ser.
2024-BPL2,
Class
A1
a,c
1,159,174
Pretium
Mortgage
Credit
Partners,
LLC
350,000
8.956%,
10/25/2054,
Ser.
2024-NPL7,
Class
A2
a,c
349,909
PRKCM
Trust
1,263,579
7.087%,
6/25/2058,
Ser.
2023-AFC2,
Class
A3
a
1,269,340
1,148,426
7.627%,
11/25/2058,
Ser.
2023-AFC4,
Class
A2
a,c
1,172,583
PRPM,
LLC
1,122,924
4.000%,
1/25/2054,
Ser.
2024-RCF1,
Class
A1
a,c
1,095,989
1,000,000
3.500%,
5/25/2054,
Ser.
2024-RPL2,
Class
A2
a,c
920,916
798,266
5.689%,
9/25/2029,
Ser.
2024-5,
Class
A1
a,c
795,232
487,339
5.699%,
11/25/2029,
Ser.
2024-6,
Class
A1
a,c
487,388
750,000
8.835%,
12/25/2029,
Ser.
2024-7,
Class
A2
a,c
749,269
Residential
Accredit
Loans,
Inc.
Trust
391,883
6.000%,
8/25/2035,
Ser.
2005-QS10,
Class
2A
337,446
281,137
6.000%,
1/25/2037,
Ser.
2007-QS1,
Class
1A1
216,867
528,491
6.250%,
4/25/2037,
Ser.
2007-QS6,
Class
A6
432,052
Residential
Asset
Securitization
Trust
424,850
4.971%,
1/25/2034,
Ser.
2004-IP1,
Class
A1
b
399,300
Principal
Amount
Long-Term
Fixed
Income 68.9%
Value
Collateralized
Mortgage
Obligations 5.8%
-
continued
Residential
Funding
Mortgage
Security
I
Trust
$
361,241
6.000%,
7/25/2037,
Ser.
2007-S7,
Class
A20
$
283,069
Roc
Mortgage
Trust
408,731
3.487%,
8/25/2026,
Ser.
2021-RTL1,
Class
A1
a,b
408,731
1,250,000
5.589%,
10/25/2039,
Ser.
2024-RTL1,
Class
A1
a,c
1,241,335
Saluda
Grade
Alternative
Mortgage
Trust
2,000,000
7.439%,
7/25/2030,
Ser.
2024-RTL6,
Class
A1
a,c
2,012,137
Sequoia
Mortgage
Trust
424,383
3.972%,
9/20/2046,
Ser.
2007-1,
Class
4A1
b
284,546
Structured
Adjustable
Rate
Mortgage
Loan
Trust
177,369
5.166%,
7/25/2035,
Ser.
2005-15,
Class
4A1
b
150,116
Toorak
Mortgage
Trust
1,500,000
7.333%,
2/25/2031,
Ser.
2024-1,
Class
A1
a,c
1,513,890
Triangle
Re,
Ltd.
1,556,223
7.969%,
(SOFR30A
+
3.400%),
11/25/2033,
Ser.
2023-1,
Class
M1A
a,b
1,579,967
TVC
Mortgage
Trust
1,500,000
8.250%,
11/25/2027,
Ser.
2023-RTL1,
Class
A1
a,c
1,516,395
Verus
Securitization
Trust
1,069,424
2.491%,
11/25/2066,
Ser.
2021-8,
Class
A3
a,b
938,427
1,091,017
6.560%,
12/25/2067,
Ser.
2023-1,
Class
A2
a,c
1,096,657
WaMu
Mortgage
Pass-Through
Certificates
128,325
6.600%,
5/25/2033,
Ser.
2003-AR4,
Class
A7
b
125,339
Washington
Mutual
Mortgage
Pass-Through
Certificates
304,029
6.000%,
3/25/2035,
Ser.
2005-1,
Class
2A
254,667
Total
56,170,931
Commercial
Mortgage-Backed
Securities 0.5%
BANK
2018-BNK12
1,000,000
4.342%,
5/15/2061,
Ser.
2018-BN12,
Class
AS
b
966,440
BBCMS
Mortgage
Trust
5,970,388
1.150%,
9/15/2055,
Ser.
2022-C17,
Class
XA
b,e
422,139
ROCK
Trust
1,150,000
5.388%,
11/13/2041,
Ser.
2024-CNTR,
Class
A
a
1,146,794
Silver
Hill
Trust
145,886
3.102%,
11/25/2049,
Ser.
2019-1,
Class
A1
a,b
142,497
Velocity
Commercial
Capital
Loan
Trust
707,504
6.550%,
1/25/2054,
Ser.
2024-1,
Class
A
a,b
710,060
Diversified
Income
Plus
Fund
Schedule
of
Investments
as
of
December
31,
2024
The
accompanying
Notes
to
Financial
Statements
are
an
integral
part
of
this
schedule.
Principal
Amount
Long-Term
Fixed
Income 68.9%
Value
Commercial
Mortgage-Backed
Securities 0.5%
-
continued
$
548,628
6.650%,
6/25/2054,
Ser.
2024-3,
Class
A
a,b
$
552,747
1,042,586
7.670%,
11/25/2053,
Ser.
2023-4,
Class
A
a,b
1,066,400
Total
5,007,077
Communications
Services 2.3%
AMC
Networks,
Inc.
62,000
10.250%,
1/15/2029
a
65,830
American
Tower
Corporation
260,000
4.400%,
2/15/2026
258,672
135,000
1.450%,
9/15/2026
127,626
191,000
5.500%,
3/15/2028
193,823
136,000
5.800%,
11/15/2028
139,616
196,000
3.800%,
8/15/2029
185,547
191,000
5.000%,
1/31/2030
189,900
AppLovin
Corporation
225,000
5.500%,
12/1/2034
223,323
AT&T,
Inc.
224,000
5.700%,
3/1/2057
214,983
688,000
3.550%,
9/15/2055
462,739
407,000
4.300%,
2/15/2030
394,169
136,000
5.400%,
2/15/2034
136,545
Bell
Telephone
Company
of
Canada
134,000
5.100%,
5/11/2033
130,217
Cable
One,
Inc.,
Convertible
178,000
1.125%,
3/15/2028
d
146,405
CCO
Holdings,
LLC/CCO
Holdings
Capital
Corporation
433,000
5.125%,
5/1/2027
a
425,475
42,000
5.000%,
2/1/2028
a
40,484
16,000
4.750%,
3/1/2030
a
14,611
695,000
4.500%,
8/15/2030
a
623,829
291,000
4.250%,
2/1/2031
a
253,614
204,000
4.750%,
2/1/2032
a
179,046
360,000
4.250%,
1/15/2034
a
292,064
CenterPoint
Energy,
Inc.,
Convertible
9,881
3.369%,
9/15/2029
391,683
Charter
Communications
Operating,
LLC/Charter
Communications
Operating
Capital
Corporation
537,000
4.200%,
3/15/2028
519,101
196,000
5.050%,
3/30/2029
191,784
199,000
6.550%,
6/1/2034
203,559
Clear
Channel
Outdoor
Holdings,
Inc.
266,000
7.875%,
4/1/2030
a
273,765
Clear
Channel
Worldwide
Holdings,
Inc.
198,000
5.125%,
8/15/2027
a
190,588
Comcast
Corporation
408,000
5.650%,
6/1/2054
394,403
326,000
3.400%,
4/1/2030
302,494
Crown
Castle,
Inc.
218,000
2.900%,
3/15/2027
209,300
83,000
4.900%,
9/1/2029
82,078
Deluxe
Corporation
73,000
8.125%,
9/15/2029
a
74,023
Principal
Amount
Long-Term
Fixed
Income 68.9%
Value
Communications
Services 2.3%
-
continued
Deutsche
Telekom
International
Finance
BV
$
368,000
8.750%,
6/15/2030
$
427,561
DIRECTV
Financing,
LLC/DIRECTV
Financing
Co-Obligor,
Inc.
642,000
5.875%,
8/15/2027
a
625,500
Frontier
Communications
Holdings,
LLC
250,000
5.875%,
10/15/2027
a
249,207
GCI,
LLC
250,000
4.750%,
10/15/2028
a
233,482
Gray
Television,
Inc.
78,000
10.500%,
7/15/2029
a
77,995
Iliad
Holding
SASU
313,000
8.500%,
4/15/2031
a
332,770
160,000
7.000%,
4/15/2032
a
160,809
Intelsat
Jackson
Holdings
SA
317,000
6.500%,
3/15/2030
a
292,392
Lamar
Media
Corporation
238,000
3.625%,
1/15/2031
209,465
LCPR
Senior
Secured
Financing
DAC
501,000
6.750%,
10/15/2027
a
453,305
Level
3
Financing,
Inc.
51,000
3.625%,
1/15/2029
a,d
40,545
119,524
10.500%,
4/15/2029
a
133,198
119,524
11.000%,
11/15/2029
a
134,455
213,000
10.500%,
5/15/2030
a
231,957
McGraw-Hill
Education,
Inc.
355,000
5.750%,
8/1/2028
a
346,609
Meta
Platforms,
Inc.
267,000
5.550%,
8/15/2064
260,281
132,000
3.850%,
8/15/2032
122,673
250,000
4.750%,
8/15/2034
243,357
News
Corporation
197,000
3.875%,
5/15/2029
a
182,744
Nexstar
Media,
Inc.
145,000
5.625%,
7/15/2027
a
141,427
155,000
4.750%,
11/1/2028
a
144,519
Optics
Bidco
SPA
262,000
6.000%,
9/30/2034
a
251,530
Outfront
Media
Capital,
LLC/
Outfront
Media
Capital
Corporation
27,000
4.625%,
3/15/2030
a
24,950
Paramount
Global
417,000
6.375%,
3/30/2062
b
403,065
Playtika
Holding
Corporation
189,000
4.250%,
3/15/2029
a
171,329
Rogers
Communications,
Inc.
250,000
5.250%,
3/15/2082
a,b
242,900
204,000
5.000%,
2/15/2029
202,700
340,000
5.300%,
2/15/2034
331,385
Sirius
XM
Radio,
LLC
495,000
5.000%,
8/1/2027
a
481,401
275,000
4.000%,
7/15/2028
a
253,373
Sprint
Capital
Corporation
424,000
6.875%,
11/15/2028
450,069
208,000
8.750%,
3/15/2032
248,332
Take-Two
Interactive
Software,
Inc.
137,000
5.600%,
6/12/2034
138,007
Diversified
Income
Plus
Fund
Schedule
of
Investments
as
of
December
31,
2024
The
accompanying
Notes
to
Financial
Statements
are
an
integral
part
of
this
schedule.
Principal
Amount
Long-Term
Fixed
Income 68.9%
Value
Communications
Services 2.3%
-
continued
TEGNA,
Inc.
$
389,000
4.625%,
3/15/2028
$
367,606
Telenet
Finance
Luxembourg
Notes
SARL
400,000
5.500%,
3/1/2028
a
388,488
T-Mobile
USA,
Inc.
137,000
5.500%,
1/15/2055
128,930
260,000
5.250%,
6/15/2055
236,119
275,000
3.375%,
4/15/2029
256,674
Uniti
Group,
LP/Uniti
Group
Finance
2019,
Inc./CSL
Capital,
LLC
375,000
4.750%,
4/15/2028
a
351,464
Univision
Communications,
Inc.
48,000
8.000%,
8/15/2028
a
48,870
409,000
4.500%,
5/1/2029
a
366,087
177,000
7.375%,
6/30/2030
a
169,327
52,000
8.500%,
7/31/2031
a
50,986
Urban
One,
Inc.
74,000
7.375%,
2/1/2028
a
46,065
Verizon
Communications,
Inc.
160,000
5.500%,
2/23/2054
153,103
196,000
3.150%,
3/22/2030
179,477
311,000
2.355%,
3/15/2032
257,913
242,000
4.780%,
2/15/2035
a
230,367
Viasat,
Inc.
103,000
5.625%,
4/15/2027
a
99,695
Virgin
Media
Finance
plc
150,000
5.000%,
7/15/2030
a
126,952
Virgin
Media
Secured
Finance
plc
315,000
5.500%,
5/15/2029
a
295,453
VMED
O2
UK
Financing
I
plc
141,000
4.750%,
7/15/2031
a
121,215
124,000
7.750%,
4/15/2032
a
124,976
Vodafone
Group
plc
176,000
5.125%,
6/4/2081
b
133,731
227,000
5.750%,
6/28/2054
218,934
129,000
5.875%,
6/28/2064
124,815
300,000
7.000%,
4/4/2079
b
307,221
VZ
Secured
Financing
BV
373,000
5.000%,
1/15/2032
a
329,903
Walt
Disney
Company
130,000
3.800%,
3/22/2030
124,427
Warnermedia
Holdings,
Inc.
495,000
4.054%,
3/15/2029
460,572
Windstream
Services,
LLC/
Windstream
Escrow
Finance
Corporation
135,000
8.250%,
10/1/2031
a
139,431
Zegona
Finance
plc
219,000
8.625%,
7/15/2029
a
232,147
Ziggo
Bond
Company
BV
145,000
5.125%,
2/28/2030
a
130,646
Ziggo
BV
131,000
4.875%,
1/15/2030
a
120,369
Total
22,096,551
Consumer
Cyclical 3.1%
1011778
B.C.,
ULC/New
Red
Finance,
Inc.
171,000
4.375%,
1/15/2028
a
163,342
Principal
Amount
Long-Term
Fixed
Income 68.9%
Value
Consumer
Cyclical 3.1%
-
continued
$
145,000
5.625%,
9/15/2029
a
$
142,828
Adient
Global
Holdings,
Ltd.
68,000
8.250%,
4/15/2031
a
69,341
Alimentation
Couche-Tard,
Inc.
225,000
5.617%,
2/12/2054
a
212,414
Allied
Universal
Holdco,
LLC/Allied
Universal
Finance
Corporation/
Atlas
Luxco
4
SARL
197,000
4.625%,
6/1/2028
a
186,262
260,000
4.625%,
6/1/2028
a
244,859
Allison
Transmission,
Inc.
78,000
3.750%,
1/30/2031
a
69,010
Amazon.com,
Inc.
131,000
1.500%,
6/3/2030
111,132
American
Axle
&
Manufacturing,
Inc.
345,000
5.000%,
10/1/2029
d
315,044
American
Honda
Finance
Corporation
301,000
5.050%,
7/10/2031
298,045
209,000
4.900%,
1/10/2034
d
200,923
Anywhere
Real
Estate
Group,
LLC/Anywhere
Co-Issuer
Corporation
66,000
7.000%,
4/15/2030
a,d
58,552
Arko
Corporation
255,000
5.125%,
11/15/2029
a,d
231,978
Asbury
Automotive
Group,
Inc.
209,000
5.000%,
2/15/2032
a
190,653
Ashton
Woods
USA,
LLC/Ashton
Woods
Finance
Company
240,000
4.625%,
8/1/2029
a
220,803
67,000
4.625%,
4/1/2030
a
60,794
Aston
Martin
Capital
Holdings,
Ltd.
176,000
10.000%,
3/31/2029
a
171,812
Beazer
Homes
USA,
Inc.
206,000
7.500%,
3/15/2031
a
209,209
Belron
UK
Finance
plc
85,000
5.750%,
10/15/2029
a
84,125
Best
Buy
Company,
Inc.
131,000
1.950%,
10/1/2030
110,343
Booking
Holdings,
Inc.,
Convertible
200,000
0.750%,
5/1/2025
527,738
Boyd
Gaming
Corporation
370,000
4.750%,
6/15/2031
a
342,316
Boyne
USA,
Inc.
197,000
4.750%,
5/15/2029
a
186,748
Brookfield
Residential
Properties,
Inc./Brookfield
Residential
US,
LLC
177,000
4.875%,
2/15/2030
a
159,843
Burlington
Stores,
Inc.,
Convertible
143,000
2.250%,
4/15/2025
186,043
188,000
1.250%,
12/15/2027
281,248
Caesars
Entertainment,
Inc.
443,000
4.625%,
10/15/2029
a
414,762
148,000
6.500%,
2/15/2032
a
148,668
111,000
6.000%,
10/15/2032
a
107,023
Carnival
Corporation
206,000
7.625%,
3/1/2026
a
206,301
491,000
5.750%,
3/1/2027
a
489,917
Diversified
Income
Plus
Fund
Schedule
of
Investments
as
of
December
31,
2024
The
accompanying
Notes
to
Financial
Statements
are
an
integral
part
of
this
schedule.
Principal
Amount
Long-Term
Fixed
Income 68.9%
Value
Consumer
Cyclical 3.1%
-
continued
$
293,000
4.000%,
8/1/2028
a
$
277,701
Carnival
Corporation,
Convertible
421,000
5.750%,
12/1/2027
847,052
Carvana
Company
39,533
0.000%,PIK
12.000%,
12/1/2028
a,f
42,212
Cedar
Fair,
LP/Canada's
Wonderland
Company/Magnum
Management
Corporation/
Millennium
Operations,
LLC
60,000
5.375%,
4/15/2027
59,362
339,000
5.250%,
7/15/2029
325,842
Choice
Hotels
International,
Inc.
130,000
3.700%,
12/1/2029
120,700
Churchill
Downs,
Inc.
125,000
4.750%,
1/15/2028
a
120,579
179,000
6.750%,
5/1/2031
a
180,936
Clarios
Global,
LP/Clarios
US
Finance
Company,
Inc.
136,000
6.750%,
5/15/2028
a
138,487
Cracker
Barrel
Old
Country
Store,
Inc.,
Convertible
60,000
0.625%,
6/15/2026
d
56,400
Crocs,
Inc.
118,000
4.250%,
3/15/2029
a
109,080
Cushman
&
Wakefield
US
Borrower,
LLC
60,000
6.750%,
5/15/2028
a
60,055
Daimler
Trucks
Finance
North
America,
LLC
150,000
5.400%,
9/20/2028
a
151,946
Dana,
Inc.
119,000
5.625%,
6/15/2028
117,386
177,000
4.250%,
9/1/2030
164,729
179,000
4.500%,
2/15/2032
164,175
eG
Global
Finance
plc
60,000
12.000%,
11/30/2028
a
67,098
Expedia
Group,
Inc.
229,000
3.250%,
2/15/2030
211,155
Expedia
Group,
Inc.,
Convertible
292,000
Zero
Coupon,
2/15/2026
289,669
Ford
Motor
Company,
Convertible
508,000
Zero
Coupon,
3/15/2026
491,236
Ford
Motor
Credit
Company,
LLC
225,000
5.850%,
5/17/2027
227,413
250,000
2.900%,
2/10/2029
223,889
225,000
7.122%,
11/7/2033
234,829
Forestar
Group,
Inc.
124,000
3.850%,
5/15/2026
a
120,629
Gap,
Inc.
86,000
3.625%,
10/1/2029
a
77,224
34,000
3.875%,
10/1/2031
a
29,400
Garrett
Motion
Holdings,
Inc./
Garrett
LX
I
SARL
168,000
7.750%,
5/31/2032
a
170,442
General
Motors
Financial
Company,
Inc.
199,000
2.900%,
2/26/2025
198,283
149,000
2.750%,
6/20/2025
147,538
220,000
5.800%,
6/23/2028
224,399
159,000
5.800%,
1/7/2029
162,201
300,000
4.900%,
10/6/2029
295,512
Principal
Amount
Long-Term
Fixed
Income 68.9%
Value
Consumer
Cyclical 3.1%
-
continued
$
270,000
5.700%,
9/30/2030
b,g
$
262,395
97,000
5.750%,
2/8/2031
98,277
260,000
5.950%,
4/4/2034
261,358
GoDaddy
Operating
Company,
LLC/GD
Finance
Company,
Inc.
120,000
3.500%,
3/1/2029
a
109,628
Goodyear
Tire
&
Rubber
Company
119,000
4.875%,
3/15/2027
d
114,974
101,000
5.000%,
7/15/2029
d
92,745
Hanesbrands,
Inc.
140,000
4.875%,
5/15/2026
a
137,826
Harley-Davidson
Financial
Services,
Inc.
209,000
5.950%,
6/11/2029
a
209,234
Hilton
Domestic
Operating
Company,
Inc.
281,000
4.875%,
1/15/2030
269,538
60,000
4.000%,
5/1/2031
a
53,960
341,000
3.625%,
2/15/2032
a
296,219
Hilton
Grand
Vacations
Borrower,
LLC/Hilton
Grand
Vacations
Borrower,
Inc.
427,000
5.000%,
6/1/2029
a
402,358
Home
Depot,
Inc.
129,000
5.300%,
6/25/2054
123,574
129,000
5.400%,
6/25/2064
123,651
214,000
3.250%,
4/15/2032
190,918
Hyundai
Capital
America
196,000
3.000%,
2/10/2027
a
188,220
136,000
6.500%,
1/16/2029
a
141,956
International
Game
Technology
plc
297,000
5.250%,
1/15/2029
a
289,740
Jacobs
Entertainment,
Inc.
228,000
6.750%,
2/15/2029
a
220,031
Jaguar
Land
Rover
Automotive
plc
143,000
5.500%,
7/15/2029
a,d
138,731
KB
Home
360,000
4.800%,
11/15/2029
339,392
27,000
4.000%,
6/15/2031
23,838
L
Brands,
Inc.
319,000
6.625%,
10/1/2030
a
321,293
130,000
6.875%,
11/1/2035
133,018
Las
Vegas
Sands
Corporation
140,000
5.900%,
6/1/2027
142,027
LGI
Homes,
Inc.
102,000
7.000%,
11/15/2032
a
100,994
Life
Time,
Inc.
145,000
6.000%,
11/15/2031
a
143,551
Light
&
Wonder
International,
Inc.
147,000
7.250%,
11/15/2029
a
149,960
Live
Nation
Entertainment,
Inc.
133,000
4.750%,
10/15/2027
a
128,582
Live
Nation
Entertainment,
Inc.,
Convertible
506,000
3.125%,
1/15/2029
688,464
315,000
2.875%,
1/15/2030
a
316,260
Lowe's
Companies,
Inc.
330,000
4.500%,
4/15/2030
323,762
Macy's
Retail
Holdings,
LLC
234,000
5.875%,
4/1/2029
a
228,433
120,000
6.125%,
3/15/2032
a
112,655
Diversified
Income
Plus
Fund
Schedule
of
Investments
as
of
December
31,
2024
The
accompanying
Notes
to
Financial
Statements
are
an
integral
part
of
this
schedule.
Principal
Amount
Long-Term
Fixed
Income 68.9%
Value
Consumer
Cyclical 3.1%
-
continued
Marriott
International,
Inc./MD
$
124,000
4.900%,
4/15/2029
$
123,763
198,000
4.625%,
6/15/2030
194,315
Marriott
Vacations
Worldwide
Corporation,
Convertible
192,000
Zero
Coupon,
1/15/2026
182,515
542,000
3.250%,
12/15/2027
505,686
Mattamy
Group
Corporation
178,000
5.250%,
12/15/2027
a
174,038
McDonald's
Corporation
136,000
4.950%,
8/14/2033
d
134,873
Melco
Resorts
Finance,
Ltd.
333,000
5.375%,
12/4/2029
a
303,998
190,000
7.625%,
4/17/2032
a
190,681
Meritage
Homes
Corporation,
Convertible
176,000
1.750%,
5/15/2028
a
172,480
Michaels
Companies,
Inc.
175,000
5.250%,
5/1/2028
a
132,127
NCL
Corporation,
Ltd.
146,000
5.875%,
3/15/2026
a
145,802
264,000
5.875%,
2/15/2027
a
263,174
Nordstrom,
Inc.
201,000
4.250%,
8/1/2031
d
175,786
PENN
Entertainment,
Inc.
300,000
4.125%,
7/1/2029
a,d
269,012
PetSmart,
Inc./PetSmart
Finance
Corporation
329,000
4.750%,
2/15/2028
a
310,410
109,000
7.750%,
2/15/2029
a
105,366
Prime
Security
Services
Borrower,
LLC/Prime
Finance,
Inc.
388,000
5.750%,
4/15/2026
a
387,783
QVC,
Inc.
76,000
6.875%,
4/15/2029
a,d
61,839
Rakuten
Group,
Inc.
180,000
11.250%,
2/15/2027
a
196,205
210,000
9.750%,
4/15/2029
a
227,299
200,000
8.125%,
12/15/2029
a,b,g
197,110
Raven
Acquisition
Holdings,
LLC
103,000
6.875%,
11/15/2031
a
101,967
Royal
Caribbean
Cruises,
Ltd.
554,000
4.250%,
7/1/2026
a
543,545
Saks
Global
Enterprises,
LLC
79,000
11.000%,
12/15/2029
a
76,096
Scientific
Games
Holdings,
LP/
Scientific
Games
US
FinCo,
Inc.
48,000
6.625%,
3/1/2030
a
45,933
SeaWorld
Parks
and
Entertainment,
Inc.
289,000
5.250%,
8/15/2029
a
275,848
Service
Corporation
International/
US
120,000
3.375%,
8/15/2030
105,000
Six
Flags
Entertainment
Corporation
59,000
7.250%,
5/15/2031
a
60,258
Six
Flags
Entertainment
Corporation/Six
Flags
Theme
Parks,
Inc.
60,000
6.625%,
5/1/2032
a
60,811
Principal
Amount
Long-Term
Fixed
Income 68.9%
Value
Consumer
Cyclical 3.1%
-
continued
Six
Flags
Theme
Parks,
Inc.
$
66,000
7.000%,
7/1/2025
a,d
$
65,938
Sonic
Automotive,
Inc.
148,000
4.875%,
11/15/2031
a
132,785
Staples,
Inc.
241,000
10.750%,
9/1/2029
a
237,092
Station
Casinos,
LLC
304,000
4.625%,
12/1/2031
a
272,321
Tenneco,
Inc.
212,000
8.000%,
11/17/2028
a
197,586
Toyota
Motor
Credit
Corporation
136,000
5.550%,
11/20/2030
140,166
129,000
4.800%,
1/5/2034
125,329
Tractor
Supply
Company
136,000
5.250%,
5/15/2033
135,920
Uber
Technologies,
Inc.
187,000
5.350%,
9/15/2054
173,893
235,000
4.800%,
9/15/2034
224,911
Uber
Technologies,
Inc.,
Convertible
232,000
Zero
Coupon,
12/15/2025
233,856
420,000
0.875%,
12/1/2028
462,000
Vail
Resorts,
Inc.,
Convertible
241,000
Zero
Coupon,
1/1/2026
228,348
VICI
Properties,
LP/VICI
Note
Company,
Inc.
486,000
5.750%,
2/1/2027
a
490,179
Victoria's
Secret
&
Company
296,000
4.625%,
7/15/2029
a
269,783
Viking
Cruises,
Ltd.
612,000
5.875%,
9/15/2027
a
607,404
Volkswagen
Group
of
America
Finance,
LLC
74,000
3.350%,
5/13/2025
a
73,576
Walgreens
Boots
Alliance,
Inc.
209,000
3.200%,
4/15/2030
167,944
WASH
Multifamily
Acquisition,
Inc.
187,000
5.750%,
4/15/2026
a
185,554
Wyndham
Hotels
&
Resorts,
Inc.
207,000
4.375%,
8/15/2028
a
196,767
Wynn
Resorts
Finance,
LLC/Wynn
Resorts
Capital
Corporation
289,000
7.125%,
2/15/2031
a
300,967
Yum!
Brands,
Inc.
421,000
4.750%,
1/15/2030
a
402,616
ZF
North
America
Capital,
Inc.
242,000
7.125%,
4/14/2030
a
237,564
103,000
6.750%,
4/23/2030
a
99,079
Total
30,772,495
Consumer
Non-Cyclical 3.1%
1375209
B.C.,
Ltd.
119,000
9.000%,
1/30/2028
a,d
118,905
AbbVie,
Inc.
340,000
5.500%,
3/15/2064
324,616
450,000
4.500%,
5/14/2035
421,415
204,000
5.350%,
3/15/2044
198,860
AdaptHealth,
LLC
523,000
4.625%,
8/1/2029
a
470,335
Diversified
Income
Plus
Fund
Schedule
of
Investments
as
of
December
31,
2024
The
accompanying
Notes
to
Financial
Statements
are
an
integral
part
of
this
schedule.
Principal
Amount
Long-Term
Fixed
Income 68.9%
Value
Consumer
Non-Cyclical 3.1%
-
continued
Albertsons
Companies,
Inc./
Safeway,
Inc./New
Albertsons,
LP/Albertsons,
LLC
$
158,000
4.625%,
1/15/2027
a
$
154,684
407,000
3.500%,
3/15/2029
a
370,435
Altria
Group,
Inc.
132,000
6.200%,
11/1/2028
137,194
Amgen,
Inc.
196,000
5.150%,
3/2/2028
197,426
Anheuser-Busch
InBev
Worldwide,
Inc.
205,000
4.750%,
1/23/2029
204,919
412,000
5.000%,
6/15/2034
407,169
ANI
Pharmaceuticals,
Inc.,
Convertible
197,000
2.250%,
9/1/2029
a
198,970
Archer-Daniels-Midland
Company
133,000
4.500%,
8/15/2033
d
126,512
AstraZeneca
Finance,
LLC
306,000
1.750%,
5/28/2028
277,647
202,000
5.000%,
2/26/2034
199,787
B&G
Foods,
Inc.
103,000
8.000%,
9/15/2028
a
105,881
BAT
Capital
Corporation
172,000
6.343%,
8/2/2030
180,859
140,000
7.750%,
10/19/2032
158,741
Bausch
+
Lomb
Corporation
74,000
8.375%,
10/1/2028
a
76,590
Bausch
Health
Companies,
Inc.
218,000
5.500%,
11/1/2025
a
212,592
227,000
4.875%,
6/1/2028
a
181,600
55,000
11.000%,
9/30/2028
a
52,250
Becton,
Dickinson
and
Company
134,000
4.693%,
2/13/2028
133,340
196,000
2.823%,
5/20/2030
175,569
BellRing
Brands,
Inc.
250,000
7.000%,
3/15/2030
a
256,043
BioMarin
Pharmaceutical,
Inc.,
Convertible
417,000
1.250%,
5/15/2027
386,976
Bio-Rad
Laboratories,
Inc.
220,000
3.300%,
3/15/2027
212,821
Bristol-Myers
Squibb
Company
272,000
5.550%,
2/22/2054
263,862
135,000
5.750%,
2/1/2031
140,408
67,000
5.900%,
11/15/2033
70,298
Bunge,
Ltd.
Finance
Corporation
75,000
4.650%,
9/17/2034
70,798
Campbell's
Company
442,000
5.400%,
3/21/2034
439,786
Cargill,
Inc.
289,000
2.125%,
11/10/2031
a
238,788
Cencora,
Inc.
177,000
5.150%,
2/15/2035
172,551
Central
Garden
&
Pet
Company
133,000
4.125%,
10/15/2030
d
119,451
Champ
Acquisition
Corporation
82,000
8.375%,
12/1/2031
a
83,646
Charles
River
Laboratories
International,
Inc.
144,000
4.000%,
3/15/2031
a
128,099
Principal
Amount
Long-Term
Fixed
Income 68.9%
Value
Consumer
Non-Cyclical 3.1%
-
continued
Chefs'
Warehouse,
Inc.,
Convertible
$
321,000
2.375%,
12/15/2028
$
412,004
Cheplapharm
Arzneimittel
GmbH
60,000
5.500%,
1/15/2028
a
54,348
CHS/Community
Health
Systems,
Inc.
298,000
5.625%,
3/15/2027
a
285,996
148,000
8.000%,
12/15/2027
a,d
147,728
164,000
6.000%,
1/15/2029
a
146,847
174,000
4.750%,
2/15/2031
a
135,016
169,000
10.875%,
1/15/2032
a
174,362
Cigna
Group
136,000
5.600%,
2/15/2054
127,372
181,000
2.400%,
3/15/2030
158,399
Coca-Cola
Company
136,000
5.300%,
5/13/2054
131,179
Concentra
Escrow
Issuer
Corporation
105,000
6.875%,
7/15/2032
a
107,201
Constellation
Brands,
Inc.
139,000
4.800%,
1/15/2029
138,165
261,000
3.150%,
8/1/2029
240,328
87,000
4.900%,
5/1/2033
84,005
CVS
Health
Corporation
272,000
6.050%,
6/1/2054
255,147
159,000
6.750%,
12/10/2054
b
155,906
120,000
5.000%,
2/20/2026
119,876
102,000
4.300%,
3/25/2028
98,828
408,000
4.780%,
3/25/2038
352,786
435,000
6.000%,
6/1/2044
411,363
DaVita,
Inc.
113,000
3.750%,
2/15/2031
a
97,774
172,000
6.875%,
9/1/2032
a
173,318
Diageo
Capital
plc
148,000
2.000%,
4/29/2030
127,752
250,000
5.625%,
10/5/2033
256,599
Edgewell
Personal
Care
Company
260,000
5.500%,
6/1/2028
a
254,496
Eli
Lilly
&
Company
272,000
5.000%,
2/9/2054
249,971
265,000
4.700%,
2/27/2033
259,729
Embecta
Corporation
120,000
5.000%,
2/15/2030
a
110,528
134,000
6.750%,
2/15/2030
a
126,932
Encompass
Health
Corporation
155,000
4.500%,
2/1/2028
149,562
Endo
Finance
Holdings,
Inc.
120,000
8.500%,
4/15/2031
a,d
127,144
Energizer
Holdings,
Inc.
243,000
4.375%,
3/31/2029
a
225,711
Envista
Holdings
Corporation,
Convertible
24,000
2.375%,
6/1/2025
25,812
137,000
1.750%,
8/15/2028
122,547
Fortrea
Holdings,
Inc.
108,000
7.500%,
7/1/2030
a,d
108,179
GE
HealthCare
Technologies,
Inc.
216,000
6.377%,
11/22/2052
232,193
General
Mills,
Inc.
53,000
4.950%,
3/29/2033
51,705
Diversified
Income
Plus
Fund
Schedule
of
Investments
as
of
December
31,
2024
The
accompanying
Notes
to
Financial
Statements
are
an
integral
part
of
this
schedule.
Principal
Amount
Long-Term
Fixed
Income 68.9%
Value
Consumer
Non-Cyclical 3.1%
-
continued
Gilead
Sciences,
Inc.
$
131,000
5.250%,
10/15/2033
$
131,478
HCA,
Inc.
125,000
5.950%,
9/15/2054
118,884
Herbalife
Nutrition,
Ltd./HLF
Financing,
Inc.
207,000
7.875%,
9/1/2025
a
206,707
HLF
Financing
SARL,
LLC/
Herbalife
International,
Inc.
114,000
4.875%,
6/1/2029
a
79,800
Insulet
Corporation,
Convertible
712,000
0.375%,
9/1/2026
899,826
Integer
Holdings
Corporation,
Convertible
358,000
2.125%,
2/15/2028
572,084
Jazz
Investments
I,
Ltd.,
Convertible
460,000
2.000%,
6/15/2026
466,210
388,000
3.125%,
9/15/2030
a
417,488
Jazz
Securities
DAC
79,000
4.375%,
1/15/2029
a
74,487
JBS
USA
Holding
Lux
SARL/JBS
USA
Food
Company/JBS
Lux
Company
SARL
348,000
2.500%,
1/15/2027
330,500
165,000
3.625%,
1/15/2032
145,604
Johnson
&
Johnson
272,000
5.250%,
6/1/2054
265,607
KeHE
Distributors,
LLC/KeHE
Finance
Corporation/NextWave
Distribution,
Inc.
119,000
9.000%,
2/15/2029
a
123,460
Keurig
Dr
Pepper,
Inc.
160,000
3.200%,
5/1/2030
146,334
264,000
5.300%,
3/15/2034
263,508
Kraft
Heinz
Foods
Company
134,000
6.750%,
3/15/2032
145,234
Kroger
Company
130,000
4.500%,
1/15/2029
128,247
Lamb
Weston
Holdings,
Inc.
103,000
4.375%,
1/31/2032
a
93,199
LifePoint
Health,
Inc.
138,000
9.875%,
8/15/2030
a
148,896
151,000
11.000%,
10/15/2030
a
165,747
Mattel,
Inc.
430,000
3.375%,
4/1/2026
a
421,165
Medline
Borrower,
LP/Medline
Co-
Issuer,
Inc.
120,000
6.250%,
4/1/2029
a
121,265
Medtronic
Global
Holdings
SCA
127,000
4.500%,
3/30/2033
121,334
Mozart
Debt
Merger
Sub,
Inc.
362,000
3.875%,
4/1/2029
a
335,207
271,000
5.250%,
10/1/2029
a
261,532
MPH
Acquisition
Holdings,
LLC
118,000
5.500%,
9/1/2028
a
101,157
Nestle
Capital
Corporation
150,000
5.100%,
3/12/2054
a
141,350
Newell
Brands,
Inc.
124,000
6.375%,
9/15/2027
d
124,428
123,000
6.625%,
9/15/2029
d
125,080
62,000
6.375%,
5/15/2030
62,102
Principal
Amount
Long-Term
Fixed
Income 68.9%
Value
Consumer
Non-Cyclical 3.1%
-
continued
Novartis
Capital
Corporation
$
318,000
4.700%,
9/18/2054
$
280,472
Organon
&
Company/Organon
Foreign
Debt
Co-Issuer
BV
164,000
4.125%,
4/30/2028
a
154,075
336,000
5.125%,
4/30/2031
a
302,000
Owens
&
Minor,
Inc.
207,000
6.625%,
4/1/2030
a,d
194,092
PepsiCo,
Inc.
258,000
5.250%,
7/17/2054
249,454
Performance
Food
Group,
Inc.
179,000
4.250%,
8/1/2029
a
166,082
Perrigo
Finance
Unlimited
Company
207,000
4.900%,
6/15/2030
194,010
Philip
Morris
International,
Inc.
260,000
4.875%,
2/15/2028
260,625
140,000
5.625%,
11/17/2029
144,203
136,000
5.125%,
2/13/2031
136,010
140,000
5.750%,
11/17/2032
143,956
204,000
5.250%,
2/13/2034
201,619
120,000
4.900%,
11/1/2034
115,311
Post
Holdings,
Inc.
179,000
4.625%,
4/15/2030
a
165,082
298,000
4.500%,
9/15/2031
a
266,961
Post
Holdings,
Inc.,
Convertible
663,000
2.500%,
8/15/2027
776,705
Roche
Holdings,
Inc.
203,000
5.218%,
3/8/2054
a
193,998
200,000
2.076%,
12/13/2031
a
165,880
Royalty
Pharma
plc
296,000
1.200%,
9/2/2025
288,669
189,000
5.150%,
9/2/2029
188,469
Simmons
Foods,
Inc.
486,000
4.625%,
3/1/2029
a
449,109
Sotera
Health
Holdings,
LLC
124,000
7.375%,
6/1/2031
a
125,625
Spectrum
Brands,
Inc.,
Convertible
371,000
3.375%,
6/1/2029
a
362,207
Star
Parent,
Inc.
129,000
9.000%,
10/1/2030
a
133,979
Sysco
Corporation
131,000
5.950%,
4/1/2030
136,447
Takeda
Pharmaceutical
Company,
Ltd.
200,000
5.650%,
7/5/2054
193,034
291,000
5.000%,
11/26/2028
291,653
200,000
5.650%,
7/5/2044
196,549
Tenet
Healthcare
Corporation
855,000
5.125%,
11/1/2027
837,364
374,000
4.375%,
1/15/2030
347,373
Teva
Pharmaceutical
Finance
Netherlands
III
BV
292,000
3.150%,
10/1/2026
280,582
Unilever
Capital
Corporation
175,000
5.000%,
12/8/2033
174,979
US
Acute
Care
Solutions,
LLC
185,000
9.750%,
5/15/2029
a
188,535
Varex
Imaging
Corporation,
Convertible
241,000
4.000%,
6/1/2025
239,971
Diversified
Income
Plus
Fund
Schedule
of
Investments
as
of
December
31,
2024
The
accompanying
Notes
to
Financial
Statements
are
an
integral
part
of
this
schedule.
Principal
Amount
Long-Term
Fixed
Income 68.9%
Value
Consumer
Non-Cyclical 3.1%
-
continued
Viterra
Finance
BV
$
275,000
3.200%,
4/21/2031
a
$
240,054
Winnebago
Industries,
Inc.,
Convertible
217,000
3.250%,
1/15/2030
a
197,687
Wyeth,
LLC
326,000
6.500%,
2/1/2034
354,737
Zoetis,
Inc.
202,000
5.600%,
11/16/2032
208,259
Total
30,390,368
Energy 2.6%
Antero
Midstream
Partners,
LP/
Antero
Midstream
Finance
Corporation
254,000
5.375%,
6/15/2029
a
247,351
Apache
Corporation
201,000
4.375%,
10/15/2028
193,873
Archrock
Partners,
LP/Archrock
Partners
Finance
Corporation
141,000
6.250%,
4/1/2028
a
140,248
Ascent
Resources
Utica
Holdings,
LLC/ARU
Finance
Corporation
247,000
8.250%,
12/31/2028
a
252,145
121,000
5.875%,
6/30/2029
a
117,838
Baytex
Energy
Corporation
269,000
8.500%,
4/30/2030
a
274,842
Blue
Racer
Midstream,
LLC/Blue
Racer
Finance
Corporation
193,000
7.000%,
7/15/2029
a
197,120
BP
Capital
Markets
America,
Inc.
423,000
4.234%,
11/6/2028
414,130
187,000
4.812%,
2/13/2033
180,769
200,000
5.227%,
11/17/2034
196,977
BP
Capital
Markets
plc
242,000
4.875%,
3/22/2030
b,g
230,597
274,000
6.450%,
12/1/2033
b,g
281,483
Buckeye
Partners,
LP
170,000
4.500%,
3/1/2028
a
161,300
134,000
6.875%,
7/1/2029
a
135,623
California
Resources
Corporation
145,000
8.250%,
6/15/2029
a
147,037
Cheniere
Energy
Partners,
LP
132,000
4.500%,
10/1/2029
127,800
133,000
3.250%,
1/31/2032
115,326
208,000
5.950%,
6/30/2033
212,928
Cheniere
Energy,
Inc.
118,000
5.650%,
4/15/2034
118,678
Civitas
Resources,
Inc.
193,000
8.375%,
7/1/2028
a
200,444
181,000
8.750%,
7/1/2031
a
188,699
CNX
Resources
Corporation
155,000
6.000%,
1/15/2029
a
151,988
CNX
Resources
Corporation,
Convertible
235,000
2.250%,
5/1/2026
672,100
Columbia
Pipelines
Holding
Company,
LLC
143,000
6.055%,
8/15/2026
a
145,018
271,000
6.042%,
8/15/2028
a
277,485
Principal
Amount
Long-Term
Fixed
Income 68.9%
Value
Energy 2.6%
-
continued
Comstock
Resources,
Inc.
$
240,000
6.750%,
3/1/2029
a
$
233,305
252,000
5.875%,
1/15/2030
a
235,020
ConocoPhillips
Company
300,000
4.850%,
1/15/2032
293,954
CQP
Holdco,
LP/BIP-V
Chinnok
Holdco,
LLC
309,000
5.500%,
6/15/2031
a
295,135
Crescent
Energy
Finance,
LLC
370,000
7.625%,
4/1/2032
a
368,096
Delek
Logistics
Partners,
LP/Delek
Logistics
Finance
Corporation
269,000
8.625%,
3/15/2029
a
278,129
Diamond
Foreign
Asset
Company/
Diamond
Finance,
LLC
98,000
8.500%,
10/1/2030
a
101,697
Diamondback
Energy,
Inc.
322,000
5.750%,
4/18/2054
302,174
DT
Midstream,
Inc.
201,000
4.125%,
6/15/2029
a
187,710
Enbridge,
Inc.
260,000
7.375%,
1/15/2083
b
262,215
263,000
7.625%,
1/15/2083
b
275,936
204,000
5.950%,
4/5/2054
201,629
66,000
5.700%,
3/8/2033
66,686
Enerflex,
Ltd.
80,000
9.000%,
10/15/2027
a
83,072
Energy
Transfer,
LP
139,000
5.950%,
5/15/2054
134,378
457,000
8.000%,
5/15/2054
b
478,912
136,000
6.050%,
9/1/2054
133,104
290,000
6.500%,
11/15/2026
b,g
290,119
134,000
4.400%,
3/15/2027
132,715
83,000
7.125%,
5/15/2030
b,g
83,299
136,000
6.400%,
12/1/2030
143,702
Enterprise
Products
Operating,
LLC
195,000
5.550%,
2/16/2055
187,584
130,000
4.150%,
10/16/2028
126,883
280,000
7.733%,
(TSFR3M
+
3.248%),
8/16/2077
b
278,250
EQM
Midstream
Partners,
LP
248,000
4.750%,
1/15/2031
a
233,227
Genesis
Energy
LP/Genesis
Energy
Finance
Corporation
193,000
8.875%,
4/15/2030
196,378
288,000
7.875%,
5/15/2032
282,048
Harvest
Midstream
I,
LP
301,000
7.500%,
9/1/2028
a
303,658
Hess
Midstream
Operations,
LP
269,000
4.250%,
2/15/2030
a
247,997
Hilcorp
Energy
I,
LP/Hilcorp
Finance
Company
324,000
5.750%,
2/1/2029
a
309,112
119,000
6.000%,
4/15/2030
a
111,836
104,000
6.250%,
4/15/2032
a
95,683
Howard
Midstream
Energy
Partners,
LLC
338,000
7.375%,
7/15/2032
a
343,365
ITT
Holdings,
LLC
215,000
6.500%,
8/1/2029
a
196,819
Diversified
Income
Plus
Fund
Schedule
of
Investments
as
of
December
31,
2024
The
accompanying
Notes
to
Financial
Statements
are
an
integral
part
of
this
schedule.
Principal
Amount
Long-Term
Fixed
Income 68.9%
Value
Energy 2.6%
-
continued
Kinder
Morgan,
Inc.
$
256,000
5.950%,
8/1/2054
$
250,104
Kodiak
Gas
Services,
LLC
150,000
7.250%,
2/15/2029
a
153,007
Laredo
Petroleum,
Inc.
208,000
7.750%,
7/31/2029
a
206,008
MEG
Energy
Corporation
169,000
5.875%,
2/1/2029
a
164,962
MPLX,
LP
325,000
1.750%,
3/1/2026
313,781
65,000
5.000%,
3/1/2033
62,427
111,000
5.500%,
6/1/2034
109,398
Nabors
Industries,
Inc.
119,000
7.375%,
5/15/2027
a
118,862
306,000
9.125%,
1/31/2030
a
311,191
National
Fuel
Gas
Company
295,000
5.500%,
1/15/2026
296,145
NGL
Energy
Operating,
LLC/NGL
Energy
Finance
Corporation
99,000
8.125%,
2/15/2029
a
100,301
148,000
8.375%,
2/15/2032
a
149,133
Noble
Finance
II,
LLC
120,000
8.000%,
4/15/2030
a
121,196
Northern
Oil
and
Gas,
Inc.
270,000
8.750%,
6/15/2031
a
278,695
Northern
Oil
and
Gas,
Inc.,
Convertible
339,000
3.625%,
4/15/2029
396,800
NuStar
Logistics,
LP
241,000
6.375%,
10/1/2030
241,654
Occidental
Petroleum
Corporation
93,000
5.000%,
8/1/2027
93,044
268,000
8.875%,
7/15/2030
306,070
ONEOK,
Inc.
261,000
5.700%,
11/1/2054
245,420
134,000
5.650%,
11/1/2028
136,732
177,000
4.750%,
10/15/2031
171,214
Ovintiv,
Inc.
166,000
5.650%,
5/15/2028
168,329
PBF
Holding
Company,
LLC/PBF
Finance
Corporation
197,000
6.000%,
2/15/2028
188,922
Permian
Resources
Operating,
LLC
94,000
6.250%,
2/1/2033
a
92,784
Permian
Resources
Operating,
LLC,
Convertible
117,000
3.250%,
4/1/2028
294,330
Pioneer
Natural
Resources
Company
195,000
1.900%,
8/15/2030
166,148
Plains
All
American
Pipeline,
LP
150,000
8.895%,
(TSFR3M
+
4.372%),
2/2/2025
b,g
148,887
Plains
All
American
Pipeline,
LP/
PAA
Finance
Corporation
317,000
4.650%,
10/15/2025
316,532
Prairie
Acquiror,
LP
199,000
9.000%,
8/1/2029
a
205,016
Precision
Drilling
Corporation
122,000
6.875%,
1/15/2029
a
120,902
Principal
Amount
Long-Term
Fixed
Income 68.9%
Value
Energy 2.6%
-
continued
Range
Resources
Corporation
$
217,000
4.750%,
2/15/2030
a
$
203,627
Rockies
Express
Pipeline,
LLC
310,000
4.950%,
7/15/2029
a
294,322
Saturn
Oil
&
Gas,
Inc.
141,000
9.625%,
6/15/2029
a,d
137,075
Schlumberger
Holdings
Corporation
81,000
4.300%,
5/1/2029
a
78,978
SM
Energy
Company
185,000
6.500%,
7/15/2028
183,840
83,000
7.000%,
8/1/2032
a
81,834
South
Bow
USA
Infrastructure
Holdings,
LLC
75,000
5.584%,
10/1/2034
a
72,945
Suburban
Propane
Partners,
LP/
Suburban
Energy
Finance
Corporation
119,000
5.875%,
3/1/2027
118,063
Suncor
Energy,
Inc.
131,000
7.150%,
2/1/2032
142,356
Sunoco,
LP
358,000
7.000%,
5/1/2029
a
367,404
Sunoco,
LP/Sunoco
Finance
Corporation
171,000
5.875%,
3/15/2028
170,302
Tallgrass
Energy
Partners
LP/
Tallgrass
Energy
Finance
Corporation
330,000
5.500%,
1/15/2028
a
317,371
180,000
7.375%,
2/15/2029
a
180,570
Talos
Production,
Inc.
127,000
9.000%,
2/1/2029
a
130,297
Targa
Resources
Partners,
LP
359,000
4.875%,
2/1/2031
346,629
TGNR
Intermediate
Holdings,
LLC
287,000
5.500%,
10/15/2029
a
267,991
TotalEnergies
Capital
SA
408,000
5.488%,
4/5/2054
391,031
TransCanada
Trust
600,000
5.875%,
8/15/2076
b
592,004
Transocean,
Inc.
126,650
8.750%,
2/15/2030
a
130,617
UGI
Corporation,
Convertible
169,000
5.000%,
6/1/2028
a
191,900
USA
Compression
Partners,
LP/
USA
Compression
Finance
Corporation
209,000
7.125%,
3/15/2029
a
212,688
Valaris,
Ltd.
268,000
8.375%,
4/30/2030
a
270,822
Venture
Global
Calcasieu
Pass,
LLC
144,000
3.875%,
8/15/2029
a
132,295
220,000
4.125%,
8/15/2031
a
197,016
Venture
Global
LNG,
Inc.
445,000
8.125%,
6/1/2028
a
462,930
181,000
9.000%,
9/30/2029
a,b,g
189,243
549,000
8.375%,
6/1/2031
a
572,567
198,000
9.875%,
2/1/2032
a
217,261
Viridien
SA
60,000
8.750%,
4/1/2027
a
58,951
Diversified
Income
Plus
Fund
Schedule
of
Investments
as
of
December
31,
2024
The
accompanying
Notes
to
Financial
Statements
are
an
integral
part
of
this
schedule.
Principal
Amount
Long-Term
Fixed
Income 68.9%
Value
Energy 2.6%
-
continued
Williams
Companies,
Inc.
$
261,000
4.900%,
3/15/2029
$
259,069
131,000
2.600%,
3/15/2031
112,806
Total
25,888,424
Financials 8.1%
Acrisure,
LLC/Acrisure
Finance,
Inc.
84,000
4.250%,
2/15/2029
a
78,970
118,000
7.500%,
11/6/2030
a
121,506
AerCap
Ireland
Capital
DAC/
AerCap
Global
Aviation
Trust
210,000
6.950%,
3/10/2055
b
216,126
200,000
6.500%,
7/15/2025
201,290
150,000
6.100%,
1/15/2027
153,404
207,000
5.750%,
6/6/2028
210,915
362,000
3.000%,
10/29/2028
335,198
Agree,
LP
137,000
5.625%,
6/15/2034
137,399
Air
Lease
Corporation
152,000
2.300%,
2/1/2025
151,626
270,000
4.650%,
6/15/2026
b,g
261,165
162,000
3.125%,
12/1/2030
143,568
Aircastle,
Ltd.
274,000
5.250%,
6/15/2026
a,b,g
268,730
163,000
2.850%,
1/26/2028
a
151,660
Alliant
Holdings
Intermediate,
LLC/
Alliant
Holdings
Co-Issuer,
Inc.
121,000
4.250%,
10/15/2027
a
115,497
150,000
6.750%,
4/15/2028
a
150,353
168,000
7.000%,
1/15/2031
a
168,656
Ally
Financial,
Inc.
390,000
4.700%,
5/15/2026
b,g
363,935
405,000
8.000%,
11/1/2031
447,780
188,000
6.700%,
2/14/2033
d
189,517
American
Express
Company
255,000
3.550%,
9/15/2026
b,g
245,101
10,000
6.338%,
10/30/2026
b
10,124
American
International
Group,
Inc.
271,000
5.125%,
3/27/2033
267,633
AmWINS
Group,
Inc.
99,000
6.375%,
2/15/2029
a
99,607
293,000
4.875%,
6/30/2029
a
275,126
Aon
North
America,
Inc.
272,000
5.750%,
3/1/2054
265,227
Apollo
Debt
Solutions
BDC
214,000
6.700%,
7/29/2031
a
219,778
Arbor
Realty
Trust,
Inc.,
Convertible
26,000
7.500%,
8/1/2025
25,870
Ares
Capital
Corporation
76,000
4.250%,
3/1/2025
75,840
340,000
2.150%,
7/15/2026
325,082
168,000
5.875%,
3/1/2029
169,422
Ares
Strategic
Income
Fund
187,000
5.600%,
2/15/2030
a
184,810
Arthur
J.
Gallagher
&
Company
204,000
5.750%,
7/15/2054
200,513
126,000
5.000%,
2/15/2032
124,359
Assurant,
Inc.
193,000
6.100%,
2/27/2026
194,583
Principal
Amount
Long-Term
Fixed
Income 68.9%
Value
Financials 8.1%
-
continued
Aviation
Capital
Group,
LLC
$
131,000
4.875%,
10/1/2025
a
$
130,826
Avolon
Holdings
Funding,
Ltd.
301,000
4.250%,
4/15/2026
a
297,376
278,000
5.750%,
3/1/2029
a
280,824
Azorra
Finance,
Ltd.
258,000
7.750%,
4/15/2030
a
256,469
Banco
Santander
Mexico
SA
89,000
5.375%,
4/17/2025
a
88,928
200,000
5.621%,
12/10/2029
a
199,000
Banco
Santander
SA
110,000
4.750%,
11/12/2026
b,d,g
104,639
200,000
4.175%,
3/24/2028
b
195,845
200,000
6.921%,
8/8/2033
209,892
Bank
of
America
Corporation
220,000
6.100%,
3/17/2025
b,g
219,414
373,000
1.319%,
6/19/2026
b
366,909
298,000
1.197%,
10/24/2026
b
289,506
325,000
6.125%,
4/27/2027
b,g
327,138
196,000
1.734%,
7/22/2027
b
186,852
278,000
4.376%,
4/27/2028
b
275,048
392,000
3.593%,
7/21/2028
b
379,555
214,000
4.948%,
7/22/2028
b
214,450
230,000
5.819%,
9/15/2029
b
235,679
523,000
3.974%,
2/7/2030
b
501,207
454,000
2.687%,
4/22/2032
b
390,254
204,000
2.572%,
10/20/2032
b
172,129
290,000
2.972%,
2/4/2033
b
249,266
207,000
5.468%,
1/23/2035
b
207,226
529,000
5.425%,
8/15/2035
b
514,884
141,000
3.846%,
3/8/2037
b
124,897
Bank
of
Montreal
195,000
5.203%,
2/1/2028
196,515
140,000
3.088%,
1/10/2037
b
116,329
Bank
of
New
York
Mellon
Corporation
132,000
6.317%,
10/25/2029
b
138,677
214,000
4.596%,
7/26/2030
b
211,370
134,000
6.474%,
10/25/2034
b
144,691
Bank
of
Nova
Scotia
354,000
4.900%,
6/4/2025
b,g
350,317
Barclays
plc
243,000
6.125%,
12/15/2025
b,g
242,428
179,000
2.852%,
5/7/2026
b
177,621
200,000
5.501%,
8/9/2028
b
202,161
193,000
4.972%,
5/16/2029
b
191,144
289,000
4.942%,
9/10/2030
b
283,330
200,000
6.224%,
5/9/2034
b
205,438
136,000
7.119%,
6/27/2034
b
144,330
BlackRock
Funding,
Inc.
136,000
5.250%,
3/14/2054
128,474
Blackstone
Mortgage
Trust,
Inc.,
Convertible
41,000
5.500%,
3/15/2027
39,462
Blackstone
Private
Credit
Fund
259,000
5.600%,
11/22/2029
a
255,712
Blue
Owl
Capital
Corporation
II
136,000
8.450%,
11/15/2026
142,543
Blue
Owl
Credit
Income
Corporation
214,000
4.700%,
2/8/2027
210,942
Diversified
Income
Plus
Fund
Schedule
of
Investments
as
of
December
31,
2024
The
accompanying
Notes
to
Financial
Statements
are
an
integral
part
of
this
schedule.
Principal
Amount
Long-Term
Fixed
Income 68.9%
Value
Financials 8.1%
-
continued
Blue
Owl
Technology
Finance
Corporation
$
68,000
4.750%,
12/15/2025
a
$
67,249
196,000
3.750%,
6/17/2026
a
189,564
Blue
Owl
Technology
Finance
Corporation
II
68,000
6.750%,
4/4/2029
a
68,417
BNP
Paribas
SA
200,000
3.132%,
1/20/2033
a,b
170,480
BPCE
SA
152,000
2.375%,
1/14/2025
a
151,873
Brixmor
Operating
Partnership,
LP
262,000
2.250%,
4/1/2028
239,408
Burford
Capital
Global
Finance,
LLC
286,000
9.250%,
7/1/2031
a
303,632
Capital
One
Financial
Corporation
140,000
3.950%,
9/1/2026
b,d,g
133,159
217,000
3.273%,
3/1/2030
b
200,625
Capital
One
NA
228,000
2.280%,
1/28/2026
b
227,487
Centene
Corporation
544,000
3.000%,
10/15/2030
469,416
Charles
Schwab
Corporation
537,000
5.375%,
6/1/2025
b,g
534,140
255,000
0.900%,
3/11/2026
243,949
300,000
4.000%,
6/1/2026
b,g
290,158
196,000
2.000%,
3/20/2028
d
179,531
135,000
6.136%,
8/24/2034
b
141,740
Citibank
NA
250,000
5.570%,
4/30/2034
252,925
Citigroup,
Inc.
215,000
4.000%,
12/10/2025
b,g
209,329
415,000
3.875%,
2/18/2026
b,g
402,932
451,000
1.122%,
1/28/2027
b
433,113
263,000
1.462%,
6/9/2027
b
250,413
286,000
3.070%,
2/24/2028
b
275,097
133,000
7.375%,
5/15/2028
b,d,g
137,022
271,000
7.625%,
11/15/2028
b,g
282,337
522,000
4.075%,
4/23/2029
b
506,431
165,000
7.125%,
8/15/2029
b,g
168,065
136,000
6.174%,
5/25/2034
b
138,548
240,000
7.000%,
8/15/2034
b,g
253,098
Citizens
Financial
Group,
Inc.
275,000
4.000%,
10/6/2026
b,g
261,065
116,000
5.718%,
7/23/2032
b
116,404
CNA
Financial
Corporation
272,000
5.125%,
2/15/2034
266,951
Coinbase
Global,
Inc.,
Convertible
355,000
0.500%,
6/1/2026
371,873
398,000
0.250%,
4/1/2030
a
423,897
Comerica,
Inc.
160,000
5.625%,
7/1/2025
b,g
159,050
74,000
5.982%,
1/30/2030
b
74,829
Commonwealth
Bank
of
Australia
156,000
2.688%,
3/11/2031
a
132,937
Cooperatieve
Rabobank
UA
149,000
1.339%,
6/24/2026
a,b
146,451
COPT
Defense
Properties,
LP
265,000
2.250%,
3/15/2026
256,452
Principal
Amount
Long-Term
Fixed
Income 68.9%
Value
Financials 8.1%
-
continued
COPT
Defense
Properties,
LP,
Convertible
$
77,000
5.250%,
9/15/2028
a
$
89,320
Corebridge
Financial,
Inc.
272,000
6.375%,
9/15/2054
b
270,140
196,000
6.875%,
12/15/2052
b
201,139
134,000
6.050%,
9/15/2033
138,601
123,000
5.750%,
1/15/2034
125,291
Cousins
Properties,
LP
70,000
5.375%,
2/15/2032
68,748
Credit
Acceptance
Corporation
224,000
9.250%,
12/15/2028
a
236,919
Credit
Agricole
SA
131,000
3.250%,
1/14/2030
a
117,620
Credit
Suisse
Group
AG
130,000
7.250%,
N/A
*,h
13,000
150,000
7.500%,
N/A
*,h
15,000
Deutsche
Bank
AG/New
York,
NY
444,000
2.129%,
11/24/2026
b
432,635
250,000
2.311%,
11/16/2027
b
237,621
190,000
6.819%,
11/20/2029
b
198,821
214,000
3.742%,
1/7/2033
b
181,292
Digital
Realty
Trust,
LP,
Convertible
283,000
1.875%,
11/15/2029
a
291,490
Discover
Bank
260,000
5.974%,
(USISOA05
+
1.730%),
8/9/2028
b
264,772
Discover
Financial
Services
71,000
6.700%,
11/29/2032
75,670
Diversified
Healthcare
Trust
143,000
Zero
Coupon,
1/15/2026
a
134,573
Drawbridge
Special
Opportunities
Fund,
LP
412,000
3.875%,
2/15/2026
a
401,171
Elevance
Health,
Inc.
272,000
5.650%,
6/15/2054
260,634
411,000
2.550%,
3/15/2031
352,652
Encore
Capital
Group,
Inc.,
Convertible
284,000
4.000%,
3/15/2029
286,637
Extra
Space
Storage,
LP
121,000
5.900%,
1/15/2031
124,814
135,000
2.400%,
10/15/2031
112,173
Fairfax
Financial
Holdings,
Ltd.
204,000
6.350%,
3/22/2054
210,059
Federal
Realty
OP,
LP,
Convertible
161,000
3.250%,
1/15/2029
a
163,334
Fifth
Third
Bancorp
320,000
4.500%,
9/30/2025
b,g
315,594
144,000
4.772%,
7/28/2030
b
141,081
Fifth
Third
Bank
NA
343,000
3.850%,
3/15/2026
338,693
FirstCash,
Inc.
294,000
5.625%,
1/1/2030
a
283,249
Five
Corners
Funding
Trust
III
180,000
5.791%,
2/15/2033
a
184,516
Fortress
Transportation
and
Infrastructure
Investors,
LLC
123,000
5.500%,
5/1/2028
a
120,299
223,000
7.000%,
5/1/2031
a
227,492
77,000
7.000%,
6/15/2032
a
78,518
Diversified
Income
Plus
Fund
Schedule
of
Investments
as
of
December
31,
2024
The
accompanying
Notes
to
Financial
Statements
are
an
integral
part
of
this
schedule.
Principal
Amount
Long-Term
Fixed
Income 68.9%
Value
Financials 8.1%
-
continued
Freedom
Mortgage
Holdings,
LLC
$
274,000
9.250%,
2/1/2029
a
$
282,752
118,000
9.125%,
5/15/2031
a
121,666
FS
KKR
Capital
Corporation
132,000
3.400%,
1/15/2026
129,446
132,000
2.625%,
1/15/2027
d
124,938
GGAM
Finance,
Ltd.
124,000
8.000%,
6/15/2028
a
130,200
217,000
5.875%,
3/15/2030
a
212,857
Global
Aircraft
Leasing
Company,
Ltd.
98,000
8.750%,
9/1/2027
a
99,949
Global
Net
Lease,
Inc./Global
Net
Lease
Operating
Partnership,
LP
365,000
3.750%,
12/15/2027
a
333,109
goeasy,
Ltd.
196,000
9.250%,
12/1/2028
a
208,893
122,000
7.625%,
7/1/2029
a
124,658
75,000
6.875%,
5/15/2030
a
75,625
Goldman
Sachs
BDC,
Inc.
122,000
6.375%,
3/11/2027
124,893
Goldman
Sachs
Group,
Inc.
190,000
7.379%,
(H15T
5Y
+
3.623%),
2/10/2025
b,g
189,852
222,000
0.855%,
2/12/2026
b
220,906
195,000
3.650%,
8/10/2026
b,g
186,304
255,000
4.125%,
11/10/2026
b,g
243,710
456,000
1.948%,
10/21/2027
b
432,643
140,000
2.640%,
2/24/2028
b
133,527
155,000
3.615%,
3/15/2028
b
150,727
278,000
4.482%,
8/23/2028
b
274,783
261,000
3.814%,
4/23/2029
b
251,027
131,000
3.800%,
3/15/2030
122,849
131,000
2.615%,
4/22/2032
b
111,628
132,000
2.383%,
7/21/2032
b
110,009
163,000
6.125%,
11/10/2034
b,g
160,900
261,000
5.330%,
7/23/2035
b
256,128
404,000
5.016%,
10/23/2035
b
386,637
Hartford
Financial
Services
Group,
Inc.
130,000
2.800%,
8/19/2029
118,400
125,000
6.910%,
(TSFR3M
+
2.387%),
2/12/2047
a,b
114,984
HAT
Holdings
I,
LLC/HAT
Holdings
II,
LLC,
Convertible
30,000
Zero
Coupon,
5/1/2025
a
32,100
97,000
3.750%,
8/15/2028
a
112,229
Health
Care
Service
Corporation
207,000
5.450%,
6/15/2034
a
206,832
HSBC
Holdings
plc
200,000
6.161%,
3/9/2029
b
205,411
365,000
4.583%,
6/19/2029
b
357,595
159,000
2.804%,
5/24/2032
b
135,101
HUB
International,
Ltd.
344,000
7.250%,
6/15/2030
a
352,514
Huntington
Bancshares,
Inc./OH
160,000
4.450%,
10/15/2027
b,g
152,865
331,000
5.709%,
2/2/2035
b
330,357
230,000
6.141%,
11/18/2039
b
229,701
Icahn
Enterprises,
LP/Icahn
Enterprises
Finance
Corporation
114,000
6.250%,
5/15/2026
113,029
Principal
Amount
Long-Term
Fixed
Income 68.9%
Value
Financials 8.1%
-
continued
$
335,000
5.250%,
5/15/2027
$
317,170
ING
Groep
NV
258,000
1.726%,
4/1/2027
b
247,989
200,000
6.083%,
9/11/2027
b
203,839
Intercontinental
Exchange,
Inc.
215,000
4.350%,
6/15/2029
210,299
Intesa
Sanpaolo
SPA
150,000
4.198%,
6/1/2032
a,b
130,428
Invitation
Homes
Operating
Partnership,
LP
227,000
2.000%,
8/15/2031
184,183
J.P.
Morgan
Chase
&
Company
210,000
4.600%,
2/1/2025
b,g
209,063
177,000
4.000%,
4/1/2025
b,g
175,298
295,000
3.650%,
6/1/2026
b,d,g
286,175
371,000
1.045%,
11/19/2026
b
359,109
261,000
1.578%,
4/22/2027
b
250,620
392,000
4.005%,
4/23/2029
b
380,061
133,000
2.069%,
6/1/2029
b
120,852
523,000
4.493%,
3/24/2031
b
509,601
140,000
2.963%,
1/25/2033
b
121,012
145,000
4.912%,
7/25/2033
b
141,769
140,000
5.717%,
9/14/2033
b
142,994
149,000
5.350%,
6/1/2034
b
148,896
147,000
6.254%,
10/23/2034
b
155,363
69,000
5.336%,
1/23/2035
b
68,562
228,000
5.766%,
4/22/2035
b
233,224
259,000
5.534%,
11/29/2045
b
252,824
Jane
Street
Group/JSG
Finance,
Inc.
191,000
4.500%,
11/15/2029
a
178,860
62,000
7.125%,
4/30/2031
a
63,715
103,000
6.125%,
11/1/2032
a
102,041
Jefferies
Finance,
LLC/JFIN
Co-
Issuer
Corporation
120,000
5.000%,
8/15/2028
a
112,564
151,000
6.625%,
10/15/2031
a
150,761
Jefferson
Capital
Holdings,
LLC
99,000
6.000%,
8/15/2026
a
98,816
247,000
9.500%,
2/15/2029
a
261,646
KeyBank
NA/Cleveland,
OH
196,000
3.900%,
4/13/2029
184,033
250,000
5.000%,
1/26/2033
239,779
Kilroy
Realty,
LP
196,000
4.250%,
8/15/2029
184,683
97,000
6.250%,
1/15/2036
96,233
Kite
Realty
Group,
LP,
Convertible
13,000
0.750%,
4/1/2027
a
13,989
Ladder
Capital
Finance
Holdings,
LLLP/Ladder
Capital
Finance
Corporation
325,000
4.750%,
6/15/2029
a
306,450
Liberty
Mutual
Group,
Inc.
68,000
4.125%,
12/15/2051
a,b
64,710
Lincoln
National
Corporation
300,000
7.105%,
(TSFR3M
+
2.619%),
2/18/2025
b,d
255,282
Lloyds
Banking
Group
plc
440,000
1.627%,
5/11/2027
b
420,884
M&T
Bank
Corporation
406,000
3.500%,
9/1/2026
b,g
385,328
Diversified
Income
Plus
Fund
Schedule
of
Investments
as
of
December
31,
2024
The
accompanying
Notes
to
Financial
Statements
are
an
integral
part
of
this
schedule.
Principal
Amount
Long-Term
Fixed
Income 68.9%
Value
Financials 8.1%
-
continued
Macquarie
Airfinance
Holdings,
Ltd.
$
207,000
6.400%,
3/26/2029
a
$
212,989
149,000
5.150%,
3/17/2030
a
145,549
58,000
6.500%,
3/26/2031
a
59,919
Macquarie
Group,
Ltd.
264,000
1.629%,
9/23/2027
a,b
249,496
Marsh
&
McLennan
Companies,
Inc.
135,000
2.375%,
12/15/2031
113,170
MetLife,
Inc.
320,000
3.850%,
9/15/2025
b,g
314,166
205,000
5.875%,
3/15/2028
b,g
203,919
261,000
6.400%,
12/15/2036
266,042
Metropolitan
Life
Global
Funding
I
244,000
2.950%,
4/9/2030
a
220,355
Mid-America
Apartments,
LP
261,000
4.200%,
6/15/2028
255,175
Mitsubishi
UFJ
Financial
Group,
Inc.
260,000
1.538%,
7/20/2027
b
247,284
Mizuho
Financial
Group,
Inc.
343,000
1.554%,
7/9/2027
b
326,468
278,000
2.564%,
9/13/2031
232,572
135,000
5.748%,
7/6/2034
b
137,616
Molina
Healthcare,
Inc.
312,000
4.375%,
6/15/2028
a
295,684
118,000
6.250%,
1/15/2033
a
116,624
Morgan
Stanley
181,000
5.516%,
11/19/2055
b
174,433
250,000
2.630%,
2/18/2026
b
249,266
302,000
2.188%,
4/28/2026
b
299,307
148,000
0.985%,
12/10/2026
b
142,722
260,000
1.593%,
5/4/2027
b
249,218
262,000
1.512%,
7/20/2027
b
248,990
98,000
5.123%,
2/1/2029
b
98,269
392,000
3.622%,
4/1/2031
b
364,101
140,000
2.943%,
1/21/2033
b
119,948
144,000
4.889%,
7/20/2033
b
139,507
132,000
5.250%,
4/21/2034
b
129,980
156,000
5.424%,
7/21/2034
b
154,912
109,000
5.831%,
4/19/2035
b
111,076
283,000
2.484%,
9/16/2036
b
230,173
MPT
Operating
Partnership,
LP/
MPT
Finance
Corporation
204,000
4.625%,
8/1/2029
d
146,176
Nasdaq,
Inc.
143,000
5.350%,
6/28/2028
145,005
Nationstar
Mortgage
Holdings,
Inc.
59,000
5.500%,
8/15/2028
a
57,300
186,000
5.125%,
12/15/2030
a
173,544
NatWest
Group
plc
131,000
4.892%,
5/18/2029
b
129,670
350,000
6.475%,
6/1/2034
b
359,278
Navient
Corporation
72,000
5.000%,
3/15/2027
70,571
Necessity
Retail
REIT,
Inc./
American
Finance
Operating
Partner,
LP
78,000
4.500%,
9/30/2028
a
71,411
Principal
Amount
Long-Term
Fixed
Income 68.9%
Value
Financials 8.1%
-
continued
New
Mountain
Finance
Corporation,
Convertible
$
39,000
7.500%,
10/15/2025
$
39,077
New
York
Life
Global
Funding
134,000
4.550%,
1/28/2033
a
128,089
137,000
5.000%,
1/9/2034
a
135,398
Nippon
Life
Insurance
Company
675,000
5.950%,
4/16/2054
a,b
680,653
NNN
REIT,
Inc.
131,000
2.500%,
4/15/2030
114,659
Nomura
Holdings,
Inc.
200,000
2.172%,
7/14/2028
180,605
227,000
5.783%,
7/3/2034
229,458
Omega
Healthcare
Investors,
Inc.
127,000
4.750%,
1/15/2028
125,281
130,000
3.375%,
2/1/2031
115,293
OneMain
Finance
Corporation
460,000
3.500%,
1/15/2027
438,784
540,000
3.875%,
9/15/2028
497,632
Panther
Escrow
Issuer,
LLC
346,000
7.125%,
6/1/2031
a
349,458
Park
Intermediate
Holdings,
LLC
328,000
4.875%,
5/15/2029
a
308,661
Pebblebrook
Hotel
Trust,
Convertible
752,000
1.750%,
12/15/2026
698,307
Pine
Street
Trust
III
100,000
6.223%,
5/15/2054
a
100,910
PNC
Bank
NA
130,000
2.700%,
10/22/2029
116,642
PNC
Financial
Services
Group,
Inc.
196,000
6.200%,
9/15/2027
b,g
196,845
145,000
5.582%,
6/12/2029
b
147,531
266,000
6.250%,
3/15/2030
b,g
268,504
134,000
6.875%,
10/20/2034
b
146,269
PRA
Group,
Inc.
188,000
8.375%,
2/1/2028
a
193,264
Prologis
Targeted
US
Logistics
Fund,
LP
196,000
5.250%,
4/1/2029
a
198,209
128,000
5.250%,
1/15/2035
a
125,708
Prologis,
LP
165,000
5.250%,
3/15/2054
153,920
Provident
Financing
Trust
I
155,000
7.405%,
3/15/2038
164,348
Prudential
Financial,
Inc.
142,000
5.125%,
3/1/2052
b
135,130
198,000
6.750%,
3/1/2053
b
206,527
340,000
6.500%,
3/15/2054
b
349,678
160,000
3.700%,
10/1/2050
b
142,335
Realty
Income
Corporation
132,000
4.875%,
6/1/2026
132,319
282,000
3.200%,
1/15/2027
273,407
196,000
3.950%,
8/15/2027
192,709
Redwood
Trust,
Inc.,
Convertible
42,000
7.750%,
6/15/2027
41,117
Regency
Centers,
LP
206,000
5.250%,
1/15/2034
203,009
Regions
Financial
Corporation
129,000
2.250%,
5/18/2025
127,702
Diversified
Income
Plus
Fund
Schedule
of
Investments
as
of
December
31,
2024
The
accompanying
Notes
to
Financial
Statements
are
an
integral
part
of
this
schedule.
Principal
Amount
Long-Term
Fixed
Income 68.9%
Value
Financials 8.1%
-
continued
$
245,000
5.750%,
6/15/2025
b,g
$
242,952
Reinsurance
Group
of
America,
Inc.
134,000
6.000%,
9/15/2033
137,720
226,000
5.750%,
9/15/2034
227,778
Rexford
Industrial
Realty,
LP,
Convertible
98,000
4.375%,
3/15/2027
a
95,648
151,000
4.125%,
3/15/2029
a
146,545
RGA
Global
Funding
130,000
5.500%,
1/11/2031
a
131,366
RHP
Hotel
Properties,
LP/RHP
Finance
Corporation
60,000
4.750%,
10/15/2027
58,043
118,000
4.500%,
2/15/2029
a
111,407
RLJ
Lodging
Trust,
LP
108,000
4.000%,
9/15/2029
a
97,871
Rocket
Mortgage,
LLC/Rocket
Mortgage
Co-Issuer,
Inc.
310,000
3.625%,
3/1/2029
a
280,741
123,000
3.875%,
3/1/2031
a
107,170
172,000
4.000%,
10/15/2033
a
143,253
Ryan
Specialty,
LLC
62,000
4.375%,
2/1/2030
a
58,206
80,000
5.875%,
8/1/2032
a
79,155
Santander
Holdings
USA,
Inc.
144,000
2.490%,
1/6/2028
b
136,566
Santander
UK
Group
Holdings
plc
262,000
1.673%,
6/14/2027
b
249,377
Service
Properties
Trust
103,000
5.500%,
12/15/2027
96,318
160,000
8.375%,
6/15/2029
154,680
195,000
8.625%,
11/15/2031
a
202,915
Simon
Property
Group,
LP
264,000
2.650%,
7/15/2030
234,974
134,000
6.250%,
1/15/2034
142,100
SLM
Corporation
150,000
4.200%,
10/29/2025
148,659
Societe
Generale
SA
177,000
1.488%,
12/14/2026
a,b
170,816
103,000
10.000%,
11/14/2028
a,b,g
109,810
310,000
8.500%,
3/25/2034
a,b,g
309,293
Standard
Chartered
plc
206,000
2.608%,
1/12/2028
a,b
196,165
200,000
5.688%,
5/14/2028
a,b
202,560
Starwood
Property
Trust,
Inc.,
Convertible
316,000
6.750%,
7/15/2027
328,240
State
Street
Corporation
137,000
6.700%,
3/15/2029
b,g
139,707
144,000
4.421%,
5/13/2033
b
137,070
Sumitomo
Life
Insurance
Company
420,000
3.375%,
4/15/2081
a,b
369,898
Sumitomo
Mitsui
Financial
Group,
Inc.
206,000
2.174%,
1/14/2027
195,774
200,000
5.716%,
9/14/2028
204,841
196,000
2.142%,
9/23/2030
165,961
200,000
5.766%,
1/13/2033
205,769
Summit
Hotel
Properties,
Inc.,
Convertible
310,000
1.500%,
2/15/2026
299,460
Principal
Amount
Long-Term
Fixed
Income 68.9%
Value
Financials 8.1%
-
continued
Synchrony
Financial
$
104,000
5.935%,
8/2/2030
b
$
104,955
125,000
7.250%,
2/2/2033
129,034
Synovus
Bank
135,000
5.625%,
2/15/2028
135,241
Toronto-Dominion
Bank
160,000
8.125%,
10/31/2082
b
166,771
209,000
5.523%,
7/17/2028
212,412
144,000
4.456%,
6/8/2032
136,446
112,000
5.146%,
9/10/2034
b
109,577
Truist
Bank
134,000
2.250%,
3/11/2030
115,070
Truist
Financial
Corporation
282,000
6.047%,
6/8/2027
b
286,639
132,000
1.887%,
6/7/2029
b
119,091
490,000
5.100%,
3/1/2030
b,g
473,616
263,000
5.153%,
8/5/2032
b
259,924
201,000
5.711%,
1/24/2035
b
202,538
U.S.
Bancorp
214,000
4.548%,
7/22/2028
b
212,249
70,000
5.836%,
6/12/2034
b
71,358
194,000
5.678%,
1/23/2035
b
195,638
UBS
Group
AG
400,000
4.875%,
2/12/2027
a,b,g
380,966
287,000
3.869%,
1/12/2029
a,b
276,357
200,000
5.699%,
2/8/2035
a,b
201,309
200,000
5.379%,
9/6/2045
a,b
190,487
UniCredit
SPA
118,000
5.861%,
6/19/2032
a,b
118,170
United
Wholesale
Mortgage,
LLC
325,000
5.500%,
4/15/2029
a
313,056
UnitedHealth
Group,
Inc.
408,000
5.375%,
4/15/2054
382,643
276,000
4.200%,
5/15/2032
260,072
USB
Realty
Corporation
194,000
6.065%,
(TSFR3M
+
1.409%),
1/15/2027
a,b,g
155,101
Ventas
Realty,
LP,
Convertible
198,000
3.750%,
6/1/2026
225,126
Vornado
Realty,
LP
90,000
3.400%,
6/1/2031
76,669
Wells
Fargo
&
Company
430,000
3.900%,
3/15/2026
b,g
417,797
226,000
2.188%,
4/30/2026
b
223,954
145,000
3.526%,
3/24/2028
b
140,640
309,000
3.584%,
5/22/2028
b
299,434
214,000
4.808%,
7/25/2028
b
213,241
277,000
7.625%,
9/15/2028
b,d,g
293,931
308,000
4.478%,
4/4/2031
b
298,137
93,000
5.389%,
4/24/2034
b
91,965
187,000
5.557%,
7/25/2034
b
186,750
132,000
6.491%,
10/23/2034
b
140,313
552,000
5.499%,
1/23/2035
b
549,654
Welltower
OP,
LLC,
Convertible
410,000
2.750%,
5/15/2028
a
554,935
Westpac
Banking
Corporation
196,000
4.110%,
7/24/2034
b
184,579
Willis
North
America,
Inc.
136,000
5.900%,
3/5/2054
133,937
261,000
4.500%,
9/15/2028
256,306
Diversified
Income
Plus
Fund
Schedule
of
Investments
as
of
December
31,
2024
The
accompanying
Notes
to
Financial
Statements
are
an
integral
part
of
this
schedule.
Principal
Amount
Long-Term
Fixed
Income 68.9%
Value
Financials 8.1%
-
continued
XHR,
LP
$
243,000
4.875%,
6/1/2029
a
$
229,246
51,000
6.625%,
5/15/2030
a
51,167
Zions
Bancorp
NA
250,000
6.816%,
11/19/2035
b
251,741
Total
79,070,894
Foreign
Government 0.1%
NBN
Company,
Ltd.
235,000
2.625%,
5/5/2031
a
203,084
Saudi
Arabian
Oil
Company
201,000
5.750%,
7/17/2054
a
187,973
Teine
Energy,
Ltd.
250,000
6.875%,
4/15/2029
a
242,756
Total
633,813
Mortgage-Backed
Securities 21.0%
Federal
Home
Loan
Mortgage
Corporation
Conventional
30-Yr.
Pass
Through
688,002
2.000%,
1/1/2052
543,447
7,631,007
2.500%,
5/1/2051
6,290,843
5,461,593
3.500%,
5/1/2052
4,852,230
4,207,003
4.000%,
5/1/2052
3,881,847
5,798,500
5.000%,
7/1/2053
5,629,105
8,331,378
5.500%,
7/1/2053
8,279,107
458,874
5.000%,
8/1/2053
446,448
1,720,756
5.500%,
9/1/2053
1,720,123
Federal
Home
Loan
Mortgage
Corporation
Gold
15-Yr.
Pass
Through
3,730,193
2.500%,
7/1/2030
3,549,655
Federal
National
Mortgage
Association
Conventional
20-Yr.
Pass
Through
4,452,009
3.500%,
5/1/2040
4,120,011
Federal
National
Mortgage
Association
Conventional
30-Yr.
Pass
Through
9,669,173
3.000%,
1/1/2052
8,299,753
1,437,514
2.000%,
2/1/2051
1,136,623
936,895
2.000%,
2/1/2051
740,792
4,323,328
2.500%,
2/1/2051
3,569,989
5,854,194
2.500%,
2/1/2051
4,776,491
10,680,376
2.000%,
3/1/2051
8,377,721
5,684,169
4.000%,
3/1/2051
5,260,148
10,542,241
3.000%,
3/1/2052
8,981,693
8,587,336
2.000%,
4/1/2051
6,700,042
6,238,241
3.000%,
4/1/2051
5,347,174
6,458,419
3.000%,
5/1/2050
5,560,895
1,724,797
2.000%,
5/1/2051
1,355,993
3,685,442
3.000%,
5/1/2051
3,190,614
3,939,663
3.000%,
6/1/2050
3,434,014
1,664,470
4.000%,
6/1/2052
1,525,316
3,058,310
5.000%,
6/1/2053
2,973,300
8,610,346
2.500%,
7/1/2051
7,156,788
3,631,887
3.500%,
7/1/2051
3,259,474
4,657,189
4.000%,
7/1/2052
4,267,857
1,642,199
2.500%,
8/1/2050
1,363,084
7,221,719
3.500%,
8/1/2050
6,497,169
6,843,988
3.500%,
8/1/2052
6,066,044
3,879,909
4.500%,
8/1/2052
3,655,582
Principal
Amount
Long-Term
Fixed
Income 68.9%
Value
Mortgage-Backed
Securities 21.0%
-
continued
$
596,216
5.000%,
8/1/2053
$
579,634
2,026,871
3.500%,
9/1/2052
1,808,735
4,914,683
3.500%,
9/1/2052
4,384,726
498,462
5.000%,
9/1/2052
482,858
1,200,251
4.500%,
9/1/2053
1,136,856
4,335,863
4.500%,
9/1/2053
4,090,749
7,008,492
4.000%,
10/1/2052
6,433,926
1,678,225
2.000%,
11/1/2051
1,325,044
2,644,274
3.500%,
11/1/2052
2,362,795
6,978,382
2.000%,
12/1/2050
5,483,688
16,018,683
4.500%,
12/1/2052
15,184,665
650,000
5.500%,
1/1/2041
i
641,387
700,000
3.500%,
1/1/2049
i
619,092
500,000
4.000%,
1/1/2049
i
457,189
3,000,000
4.500%,
1/1/2049
i
2,821,417
550,000
5.000%,
1/1/2049
i
530,791
Federal
National
Mortgage
Association
Conventional
40-Yr.
Pass
Through
9,846,734
2.500%,
3/1/2062
7,838,704
3,281,670
3.500%,
7/1/2061
2,851,212
3,621,036
4.000%,
12/1/2061
3,286,936
Total
205,129,776
Technology 2.4%
Accenture
Capital,
Inc.
94,000
4.250%,
10/4/2031
90,327
223,000
4.500%,
10/4/2034
211,921
Advanced
Micro
Devices,
Inc.
145,000
3.924%,
6/1/2032
134,583
Akamai
Technologies,
Inc.,
Convertible
313,000
0.125%,
5/1/2025
331,018
233,000
0.375%,
9/1/2027
233,594
276,000
1.125%,
2/15/2029
269,113
Analog
Devices,
Inc.
68,000
2.100%,
10/1/2031
56,963
Apple,
Inc.
686,000
3.750%,
9/12/2047
539,942
Automatic
Data
Processing,
Inc.
280,000
4.450%,
9/9/2034
266,565
Block,
Inc.
424,000
6.500%,
5/15/2032
a
428,093
Block,
Inc.,
Convertible
139,000
0.125%,
3/1/2025
137,749
387,000
0.250%,
11/1/2027
335,142
Boost
Newco
Borrower,
LLC
303,000
7.500%,
1/15/2031
a
317,653
Broadcom,
Inc.
146,000
4.000%,
4/15/2029
a
140,460
130,000
4.800%,
10/15/2034
125,448
Cadence
Design
Systems,
Inc.
112,000
4.700%,
9/10/2034
107,378
Cisco
Systems,
Inc.
272,000
5.350%,
2/26/2064
260,730
Clarivate
Science
Holdings
Corporation
131,000
3.875%,
7/1/2028
a
122,033
Cloud
Software
Group,
Inc.
646,000
6.500%,
3/31/2029
a
634,077
Diversified
Income
Plus
Fund
Schedule
of
Investments
as
of
December
31,
2024
The
accompanying
Notes
to
Financial
Statements
are
an
integral
part
of
this
schedule.
Principal
Amount
Long-Term
Fixed
Income 68.9%
Value
Technology 2.4%
-
continued
Consensus
Cloud
Solutions,
Inc.
$
62,000
6.000%,
10/15/2026
a
$
61,177
CoreLogic,
Inc.
74,000
4.500%,
5/1/2028
a
68,858
CSG
Systems
International,
Inc.,
Convertible
321,000
3.875%,
9/15/2028
323,247
Dayforce,
Inc.,
Convertible
673,000
0.250%,
3/15/2026
646,753
Dell
International,
LLC/EMC
Corporation
100,000
5.300%,
10/1/2029
100,960
Dell,
Inc.
182,000
6.500%,
4/15/2038
190,382
Diebold
Nixdorf,
Inc.
77,000
7.750%,
3/31/2030
a
79,045
Euronet
Worldwide,
Inc.,
Convertible
219,000
0.750%,
3/15/2049
216,482
Fiserv,
Inc.
266,000
5.350%,
3/15/2031
270,389
65,000
5.600%,
3/2/2033
65,833
266,000
5.450%,
3/15/2034
266,162
213,000
5.150%,
8/12/2034
208,129
Gen
Digital,
Inc.
10,000
6.750%,
9/30/2027
a
10,150
149,000
7.125%,
9/30/2030
a,d
152,799
Global
Payments,
Inc.
165,000
5.950%,
8/15/2052
d
159,948
82,000
2.650%,
2/15/2025
81,743
208,000
4.950%,
8/15/2027
208,282
131,000
3.200%,
8/15/2029
119,993
Global
Payments,
Inc.,
Convertible
442,000
1.500%,
3/1/2031
a
432,718
Hewlett
Packard
Enterprise
Company
187,000
4.850%,
10/15/2031
182,377
IBM
International
Capital
Private,
Ltd.
213,000
5.300%,
2/5/2054
196,232
II-VI,
Inc.
128,000
5.000%,
12/15/2029
a
122,149
InterDigital,
Inc.,
Convertible
319,000
3.500%,
6/1/2027
801,446
Iron
Mountain,
Inc.
339,000
4.875%,
9/15/2027
a
330,535
150,000
4.875%,
9/15/2029
a
142,557
380,000
4.500%,
2/15/2031
a
347,400
Jabil,
Inc.
133,000
5.450%,
2/1/2029
134,086
Marvell
Technology,
Inc.
132,000
2.950%,
4/15/2031
115,787
Mastercard,
Inc.
146,000
2.000%,
11/18/2031
121,289
136,000
4.875%,
5/9/2034
133,893
Microchip
Technology,
Inc.
84,000
5.050%,
3/15/2029
83,828
Microchip
Technology,
Inc.,
Convertible
289,000
0.750%,
6/1/2030
a
265,736
Principal
Amount
Long-Term
Fixed
Income 68.9%
Value
Technology 2.4%
-
continued
MKS
Instruments,
Inc.,
Convertible
$
812,000
1.250%,
6/1/2030
a
$
786,016
Moody's
Corporation
140,000
4.250%,
8/8/2032
132,845
NCR
Atleos
Corporation
99,000
9.500%,
4/1/2029
a
107,247
NCR
Voyix
Corporation
177,000
5.000%,
10/1/2028
a
170,246
132,000
5.125%,
4/15/2029
a
126,291
Neptune
Bidco
US,
Inc.
388,000
9.290%,
4/15/2029
a
360,888
NXP
BV/NXP
Funding,
LLC/NXP
USA,
Inc.
72,000
2.700%,
5/1/2025
71,503
131,000
4.300%,
6/18/2029
d
127,159
ON
Semiconductor
Corporation,
Convertible
338,000
Zero
Coupon,
5/1/2027
442,442
288,000
0.500%,
3/1/2029
271,152
Open
Text
Corporation
226,000
3.875%,
12/1/2029
a
204,430
Open
Text
Holdings,
Inc.
240,000
4.125%,
2/15/2030
a
217,650
Oracle
Corporation
255,000
5.375%,
9/27/2054
235,039
482,000
6.900%,
11/9/2052
539,709
140,000
6.150%,
11/9/2029
146,843
327,000
2.950%,
4/1/2030
295,187
219,000
6.250%,
11/9/2032
232,090
PayPal
Holdings,
Inc.
272,000
5.500%,
6/1/2054
265,636
Pitney
Bowes,
Inc.
62,000
6.875%,
3/15/2027
a
61,700
Progress
Software
Corporation,
Convertible
119,000
1.000%,
4/15/2026
142,745
84,000
3.500%,
3/1/2030
a
98,711
RingCentral,
Inc.
261,000
8.500%,
8/15/2030
a
276,142
Rocket
Software,
Inc.
148,000
9.000%,
11/28/2028
a
153,266
S&P
Global,
Inc.
144,000
2.900%,
3/1/2032
125,644
Salesforce.com,
Inc.
374,000
1.950%,
7/15/2031
313,890
Seagate
HDD
Cayman
221,480
9.625%,
12/1/2032
249,573
Semtech
Corporation,
Convertible
235,000
1.625%,
11/1/2027
414,893
Sensata
Technologies,
Inc.
69,000
3.750%,
2/15/2031
a
60,322
Shift4
Payments,
LLC/Shift4
Payments
Finance
Sub,
Inc.
140,000
4.625%,
11/1/2026
a
138,250
SK
Hynix,
Inc.
200,000
5.500%,
1/16/2027
a
201,585
SS&C
Technologies,
Inc.
249,000
5.500%,
9/30/2027
a
246,612
51,000
6.500%,
6/1/2032
a
51,445
Synaptics,
Inc.,
Convertible
320,000
0.750%,
12/1/2031
a
321,714
Diversified
Income
Plus
Fund
Schedule
of
Investments
as
of
December
31,
2024
The
accompanying
Notes
to
Financial
Statements
are
an
integral
part
of
this
schedule.
Principal
Amount
Long-Term
Fixed
Income 68.9%
Value
Technology 2.4%
-
continued
Texas
Instruments,
Inc.
$
136,000
5.150%,
2/8/2054
$
127,312
UKG,
Inc.
132,000
6.875%,
2/1/2031
a
133,918
Verint
Systems,
Inc.,
Convertible
177,000
0.250%,
4/15/2026
165,938
Verisk
Analytics,
Inc.
383,000
5.250%,
6/5/2034
378,308
Viavi
Solutions,
Inc.
306,000
3.750%,
10/1/2029
a
275,932
Viavi
Solutions,
Inc.,
Convertible
238,000
1.625%,
3/15/2026
242,760
Vishay
Intertechnology,
Inc.,
Convertible
503,000
2.250%,
9/15/2030
448,928
VMware,
LLC
262,000
1.400%,
8/15/2026
248,196
370,000
4.700%,
5/15/2030
361,998
192,000
2.200%,
8/15/2031
159,273
Western
Digital
Corporation,
Convertible
566,000
3.000%,
11/15/2028
749,950
Xerox
Holdings
Corporation
30,000
5.000%,
8/15/2025
a
29,847
466,000
5.500%,
8/15/2028
a
399,723
Xerox
Holdings
Corporation,
Convertible
377,000
3.750%,
3/15/2030
a,d
283,127
Xilinx,
Inc.
90,000
2.375%,
6/1/2030
79,323
Ziff
Davis,
Inc.,
Convertible
33,000
1.750%,
11/1/2026
30,836
185,000
3.625%,
3/1/2028
a
180,729
Total
23,268,117
Transportation 0.5%
Air
Canada
309,000
3.875%,
8/15/2026
a
300,227
Air
Transport
Services
Group,
Inc.,
Convertible
246,000
3.875%,
8/15/2029
243,343
American
Airlines,
Inc./
AAdvantage
Loyalty
IP,
Ltd.
349,000
5.500%,
4/20/2026
a
347,872
119,560
5.750%,
4/20/2029
a
118,566
Avis
Budget
Car
Rental,
LLC/Avis
Budget
Finance,
Inc.
156,000
5.375%,
3/1/2029
a,d
145,915
Burlington
Northern
Santa
Fe,
LLC
136,000
5.500%,
3/15/2055
133,597
Canadian
Pacific
Railway
Company
267,000
1.750%,
12/2/2026
252,836
DCLI
Bidco,
LLC
93,000
7.750%,
11/15/2029
a
95,082
Delta
Air
Lines,
Inc.
288,000
4.375%,
4/19/2028
280,848
Delta
Air
Lines,
Inc./SkyMiles
IP,
Ltd.
99,212
4.500%,
10/20/2025
a
98,588
Principal
Amount
Long-Term
Fixed
Income 68.9%
Value
Transportation 0.5%
-
continued
ERAC
USA
Finance,
LLC
$
277,000
5.200%,
10/30/2034
a
$
273,652
JetBlue
Airways
Corporation/
JetBlue
Loyalty,
LP
58,000
9.875%,
9/20/2031
a
61,618
Mileage
Plus
Holdings,
LLC
199,000
6.500%,
6/20/2027
a
200,254
Norfolk
Southern
Corporation
195,000
4.450%,
3/1/2033
186,047
OneSky
Flight,
LLC
80,000
8.875%,
12/15/2029
a
80,056
Penske
Truck
Leasing
Company,
LP/PTL
Finance
Corporation
148,000
1.200%,
11/15/2025
a
143,300
137,000
5.750%,
5/24/2026
a
138,397
128,000
1.700%,
6/15/2026
a
122,197
Rand
Parent,
LLC
256,000
8.500%,
2/15/2030
a,d
257,404
RXO,
Inc.
170,000
7.500%,
11/15/2027
a
174,618
Ryder
System,
Inc.
161,000
2.850%,
3/1/2027
154,516
Southwest
Airlines
Company
133,000
5.125%,
6/15/2027
133,593
Southwest
Airlines
Company,
Convertible
419,000
1.250%,
5/1/2025
430,104
Stena
International
SA
198,000
7.250%,
1/15/2031
a
202,030
United
Airlines,
Inc.
324,000
4.375%,
4/15/2026
a
318,576
VistaJet
Malta
Finance
plc/Vista
Management
Holding,
Inc.
81,000
7.875%,
5/1/2027
a
78,842
136,000
6.375%,
2/1/2030
a,d
118,840
Total
5,090,918
U.S.
Government
&
Agencies 7.9%
Federal
National
Mortgage
Association
-
REMIC
1,500,000
5.000%,
1/25/2055,
Ser.
2024-103,
Class
YD
1,400,525
U.S.
Treasury
Bonds
8,800,000
3.625%,
5/15/2053
7,153,539
7,900,000
4.750%,
11/15/2053
7,815,424
U.S.
Treasury
Notes
4,000,000
5.000%,
10/31/2025
4,023,085
15,300,000
4.250%,
12/31/2025
15,303,882
29,100,000
4.375%,
7/31/2026
29,148,013
11,400,000
4.125%,
7/31/2028
11,321,324
581,000
3.375%,
5/15/2033
533,926
Total
76,699,718
Utilities 2.5%
AEP
Texas,
Inc.
138,000
4.700%,
5/15/2032
132,034
AES
Corporation
165,000
7.600%,
1/15/2055
b
169,474
254,000
3.950%,
7/15/2030
a
234,138
Diversified
Income
Plus
Fund
Schedule
of
Investments
as
of
December
31,
2024
The
accompanying
Notes
to
Financial
Statements
are
an
integral
part
of
this
schedule.
Principal
Amount
Long-Term
Fixed
Income 68.9%
Value
Utilities 2.5%
-
continued
Algonquin
Power
&
Utilities
Corporation
$
451,000
4.750%,
1/18/2082
b
$
423,451
Alliant
Energy
Corporation,
Convertible
165,000
3.875%,
3/15/2026
169,290
Ameren
Corporation
161,000
1.750%,
3/15/2028
145,657
American
Electric
Power
Company,
Inc.
248,000
6.950%,
12/15/2054
b
255,880
131,000
2.300%,
3/1/2030
113,978
66,000
5.625%,
3/1/2033
66,674
American
Water
Capital
Corporation
201,000
5.450%,
3/1/2054
192,207
American
Water
Capital
Corporation,
Convertible
254,000
3.625%,
6/15/2026
250,698
Arizona
Public
Service
Company
138,000
5.550%,
8/1/2033
138,008
Atmos
Energy
Corporation
129,000
5.000%,
12/15/2054
116,194
Calpine
Corporation
298,000
4.500%,
2/15/2028
a
285,816
CenterPoint
Energy,
Inc.
144,000
7.000%,
2/15/2055
b
148,122
83,000
6.700%,
5/15/2055
b
82,541
198,000
1.450%,
6/1/2026
189,117
197,000
2.650%,
6/1/2031
169,261
CenterPoint
Energy,
Inc.,
Convertible
267,000
4.250%,
8/15/2026
272,740
CMS
Energy
Corporation,
Convertible
209,000
3.375%,
5/1/2028
216,419
Consolidated
Edison
Company
of
New
York,
Inc.
408,000
5.700%,
5/15/2054
405,842
Constellation
Energy
Generation,
LLC
204,000
5.750%,
3/15/2054
198,341
133,000
5.800%,
3/1/2033
135,900
Dominion
Energy,
Inc.
217,000
6.875%,
2/1/2055
b
225,496
217,000
7.000%,
6/1/2054
b
229,149
240,000
4.350%,
1/15/2027
b,g
232,387
161,000
3.375%,
4/1/2030
148,092
DTE
Energy
Company
140,000
4.875%,
6/1/2028
139,510
Duke
Energy
Carolinas,
LLC
420,000
5.400%,
1/15/2054
402,281
Duke
Energy
Corporation
240,000
3.250%,
1/15/2082
b
223,090
187,000
5.800%,
6/15/2054
182,156
157,000
6.450%,
9/1/2054
b
158,907
343,000
2.450%,
6/1/2030
300,645
139,000
4.500%,
8/15/2032
d
132,415
125,000
5.750%,
9/15/2033
128,156
Duke
Energy
Corporation,
Convertible
407,000
4.125%,
4/15/2026
417,175
Principal
Amount
Long-Term
Fixed
Income 68.9%
Value
Utilities 2.5%
-
continued
Duke
Energy
Ohio,
Inc.
$
136,000
5.550%,
3/15/2054
$
131,491
Edison
International
137,000
7.875%,
6/15/2054
b
141,501
185,000
4.950%,
4/15/2025
184,847
220,000
5.000%,
12/15/2026
b,g
214,440
259,000
5.450%,
6/15/2029
261,341
Enel
Finance
International
NV
260,000
1.625%,
7/12/2026
a
247,851
226,000
5.125%,
6/26/2029
a
225,713
Entergy
Corporation
130,000
1.900%,
6/15/2028
117,420
Evergy,
Inc.,
Convertible
353,000
4.500%,
12/15/2027
383,181
Eversource
Energy
293,000
4.600%,
7/1/2027
290,979
Exelon
Corporation
540,000
5.600%,
3/15/2053
519,578
130,000
4.050%,
4/15/2030
123,886
Fells
Point
Funding
Trust
266,000
3.046%,
1/31/2027
a
255,765
FirstEnergy
Corporation,
Convertible
369,000
4.000%,
5/1/2026
370,291
Georgia
Power
Company
82,000
4.950%,
5/17/2033
80,302
ITC
Holdings
Corporation
140,000
4.950%,
9/22/2027
a
140,202
Jersey
Central
Power
&
Light
Company
280,000
2.750%,
3/1/2032
a
237,803
Lightning
Power,
LLC
182,000
7.250%,
8/15/2032
a
187,120
MidAmerican
Energy
Company
553,000
5.300%,
2/1/2055
522,385
National
Rural
Utilities
Cooperative
Finance
Corporation
137,000
4.850%,
2/7/2029
137,071
NextEra
Energy
Capital
Holdings,
Inc.
210,000
3.800%,
3/15/2082
b
199,781
331,000
6.750%,
6/15/2054
b
339,104
131,000
6.051%,
3/1/2025
131,232
130,000
2.250%,
6/1/2030
112,398
NextEra
Energy
Capital
Holdings,
Inc.,
Convertible
191,000
3.000%,
3/1/2027
a
221,178
NextEra
Energy
Operating
Partners,
LP
331,000
3.875%,
10/15/2026
a
316,491
NextEra
Energy
Partners,
LP,
Convertible
556,000
Zero
Coupon,
11/15/2025
a
522,640
104,000
2.500%,
6/15/2026
a
97,766
NiSource,
Inc.
81,000
6.375%,
3/31/2055
b
80,632
160,000
6.950%,
11/30/2054
b
162,897
130,000
2.950%,
9/1/2029
118,993
Northern
States
Power
Company/
MN
136,000
5.400%,
3/15/2054
131,092
Diversified
Income
Plus
Fund
Schedule
of
Investments
as
of
December
31,
2024
The
accompanying
Notes
to
Financial
Statements
are
an
integral
part
of
this
schedule.
Principal
Amount
Long-Term
Fixed
Income 68.9%
Value
Utilities 2.5%
-
continued
NRG
Energy,
Inc.
$
167,000
2.000%,
12/2/2025
a
$
162,158
189,000
10.250%,
3/15/2028
a,b,g
208,662
120,000
3.375%,
2/15/2029
a
108,873
185,000
5.250%,
6/15/2029
a
179,678
83,000
6.000%,
2/1/2033
a
80,612
83,000
6.250%,
11/1/2034
a
81,410
NRG
Energy,
Inc.,
Convertible
171,000
2.750%,
6/1/2048
d
375,174
Oncor
Electric
Delivery
Company,
LLC
178,000
5.550%,
6/15/2054
a
173,405
Pacific
Gas
and
Electric
Company
136,000
6.750%,
1/15/2053
148,176
266,000
5.550%,
5/15/2029
270,338
270,000
6.950%,
3/15/2034
295,710
PG&E
Corporation
193,000
7.375%,
3/15/2055
b
198,063
157,000
5.000%,
7/1/2028
153,380
PG&E
Corporation,
Convertible
779,000
4.250%,
12/1/2027
a
844,826
Pinnacle
West
Capital
Corporation,
Convertible
141,000
4.750%,
6/15/2027
a
147,768
PPL
Capital
Funding,
Inc.
197,000
5.250%,
9/1/2034
193,885
PPL
Capital
Funding,
Inc.,
Convertible
247,000
2.875%,
3/15/2028
257,621
Public
Service
Enterprise
Group,
Inc.
130,000
5.875%,
10/15/2028
134,083
131,000
1.600%,
8/15/2030
109,094
San
Diego
Gas
&
Electric
Company
136,000
5.550%,
4/15/2054
131,807
Sempra
162,000
6.550%,
4/1/2055
b
160,728
162,000
6.625%,
4/1/2055
b
161,759
160,000
6.400%,
10/1/2054
b
158,644
162,000
6.875%,
10/1/2054
b
163,809
162,000
4.875%,
10/15/2025
b,g
159,892
Southern
California
Edison
Company
272,000
5.450%,
6/1/2031
276,382
71,000
5.950%,
11/1/2032
74,048
Southern
Company
170,000
5.700%,
10/15/2032
174,623
300,000
4.850%,
3/15/2035
286,209
149,000
4.000%,
1/15/2051
b
146,012
432,000
3.750%,
9/15/2051
b
413,691
Southern
Company,
Convertible
472,000
3.875%,
12/15/2025
495,836
245,000
4.500%,
6/15/2027
a
254,923
TerraForm
Power
Operating,
LLC
480,000
5.000%,
1/31/2028
a
462,455
TXNM
Energy,
Inc.,
Convertible
370,000
5.750%,
6/1/2054
a
428,345
Virginia
Electric
and
Power
Company
184,000
5.350%,
1/15/2054
173,039
Principal
Amount
Long-Term
Fixed
Income 68.9%
Value
Utilities 2.5%
-
continued
Vistra
Corporation
$
118,000
8.000%,
10/15/2026
a,b,g
$
120,426
295,000
7.000%,
12/15/2026
a,b,g
296,682
Vistra
Operations
Company,
LLC
644,000
5.000%,
7/31/2027
a
631,889
WEC
Energy
Group,
Inc.,
Convertible
214,000
4.375%,
6/1/2027
a
227,803
200,000
4.375%,
6/1/2029
a
215,300
Xcel
Energy,
Inc.
157,000
4.000%,
6/15/2028
151,918
213,000
4.600%,
6/1/2032
202,705
Total
24,730,453
Total
Long-Term
Fixed
Income
(cost
$691,647,455)
672,474,965
Shares
Common
Stock
14.8%
Value
Communications
Services 0.9%
3,197
Alphabet,
Inc.,
Class
A
605,192
14,698
Alphabet,
Inc.,
Class
C
2,799,087
4,236
Cogent
Communications
Holdings
326,469
12,545
Comcast
Corporation
470,814
51
Electronic
Arts,
Inc.
7,461
302
Liberty
Media
Corporation-Liberty
Formula
One
Group
j
27,983
5,404
Meta
Platforms,
Inc.
3,164,096
533
Netflix,
Inc.
j
475,074
42
Tripadvisor,
Inc.
j
620
21,131
Verizon
Communications,
Inc.
845,029
21,542
Warner
Brothers
Discovery,
Inc.
j
227,699
Total
8,949,524
Consumer
Discretionary 1.7%
4,832
Advance
Auto
Parts,
Inc.
228,505
15,436
Amazon.com,
Inc.
j
3,386,504
3,779
Aptiv
plc
j
228,554
2,948
Best
Buy
Company,
Inc.
252,938
82
Booking
Holdings,
Inc.
407,410
1,250
Boot
Barn
Holdings,
Inc.
j
189,775
3,185
Brunswick
Corporation
206,006
6,979
Champion
Homes,
Inc.
j
614,850
5,156
Chipotle
Mexican
Grill,
Inc.
j
310,907
4,930
Columbia
Sportswear
Company
413,775
6,905
Cooper-Standard
Holdings,
Inc.
j
93,632
2,001
Crocs,
Inc.
j
219,170
1,582
D.R.
Horton,
Inc.
221,195
1,512
Deckers
Outdoor
Corporation
j
307,072
1,290
DoorDash,
Inc.
j
216,398
4,265
eBay,
Inc.
264,217
1,556
Expedia
Group,
Inc.
j
289,930
2,561
Garmin,
Ltd.
528,232
1,041
Grand
Canyon
Education,
Inc.
j
170,516
373
Group
1
Automotive,
Inc.
157,212
1,196
Hilton
Worldwide
Holdings,
Inc.
295,603
1,766
Home
Depot,
Inc.
686,956
2,118
Lowe's
Companies,
Inc.
522,722
1,314
Lululemon
Athletica,
Inc.
j
502,487
1,281
McDonald's
Corporation
371,349
3,139
NIKE,
Inc.
237,528
88
NVR,
Inc.
j
719,743
362
O'Reilly
Automotive,
Inc.
j
429,260
2,935
PUMA
SE
134,954
Diversified
Income
Plus
Fund
Schedule
of
Investments
as
of
December
31,
2024
The
accompanying
Notes
to
Financial
Statements
are
an
integral
part
of
this
schedule.
Shares
Common
Stock 14.8%
Value
Consumer
Discretionary 1.7%
-
continued
82
Ross
Stores,
Inc.
$
12,404
3,803
SharkNinja,
Inc.
j
370,260
16,034
Sony
Group
Corporation
ADR
339,279
5,005
Stoneridge,
Inc.
j
31,381
4,390
Tesla,
Inc.
j
1,772,858
1,340
Texas
Roadhouse,
Inc.
241,776
5,682
Wyndham
Hotels
&
Resorts,
Inc.
572,689
7,949
Yum
China
Holding,
Inc.
382,903
Total
16,330,950
Consumer
Staples 0.7%
4,848
Altria
Group,
Inc.
253,502
3,960
BJ's
Wholesale
Club
Holdings,
Inc.
j
353,826
781
Casey's
General
Stores,
Inc.
309,456
526
Colgate-Palmolive
Company
47,819
151
Costco
Wholesale
Corporation
138,357
41,572
Coty,
Inc.
j
289,341
1,289
e.l.f.
Beauty,
Inc.
j
161,834
1,420
J
&
J
Snack
Foods
Corporation
220,285
2,444
J.M.
Smucker
Company
269,133
4,030
John
B.
Sanfilippo
&
Son,
Inc.
351,053
20,073
Kenvue,
Inc.
428,558
469
Keurig
Dr
Pepper,
Inc.
15,064
4,288
Lamb
Weston
Holdings,
Inc.
286,567
1,335
Lancaster
Colony
Corporation
231,142
9,619
Philip
Morris
International,
Inc.
1,157,647
2,941
Procter
&
Gamble
Company
493,059
8,591
Sysco
Corporation
656,868
2,684
Turning
Point
Brands,
Inc.
161,308
4,919
Tyson
Foods,
Inc.
282,547
4,949
Walmart,
Inc.
447,142
Total
6,554,508
Energy 0.6%
908
Archrock,
Inc.
22,600
4,132
Baker
Hughes
Company
169,495
6,922
ConocoPhillips
686,455
21,796
Devon
Energy
Corporation
713,383
18,977
Enterprise
Products
Partners,
LP
595,119
3,019
EOG
Resources,
Inc.
370,069
10,815
Expand
Energy
Corporation
1,076,633
11,098
Exxon
Mobil
Corporation
1,193,812
8,743
Halliburton
Company
237,722
365
Hess
Midstream,
LP
13,516
815
Kinder
Morgan,
Inc.
22,331
1,924
Marathon
Petroleum
Corporation
268,398
3,885
Matador
Resources
Company
218,570
6,191
Noble
Corporation
plc
194,397
1,804
Schlumberger
NV
69,165
3,535
Shell
plc
ADR
221,468
5,873
TechnipFMC
plc
169,965
1,618
Williams
Companies,
Inc.
87,566
Total
6,330,664
Financials 2.3%
91
1st
Source
Corporation
5,313
1,955
Allstate
Corporation
376,904
15,107
Ally
Financial,
Inc.
544,003
706
Amalgamated
Financial
Corporation
23,630
788
American
Express
Company
233,871
4,898
American
International
Group,
Inc.
356,574
1,192
Ameriprise
Financial,
Inc.
634,657
Shares
Common
Stock 14.8%
Value
Financials 2.3%
-
continued
5,129
Arch
Capital
Group,
Ltd.
$
473,663
1,317
Associated
Banc-Corp
31,476
27,716
Bank
of
America
Corporation
1,218,118
105
Bank
of
Marin
Bancorp
2,496
4,937
Bank
of
N.T.
Butterfield
&
Son,
Ltd.
180,447
5,114
Bank
of
New
York
Mellon
Corporation
392,909
678
Bank
OZK
30,191
1,378
Berkshire
Hathaway,
Inc.
j
624,620
252
Block,
Inc.
j
21,417
11,489
Bridgewater
Bancshares,
Inc.
j
155,216
766
Brown
&
Brown,
Inc.
78,147
2,734
Capital
One
Financial
Corporation
487,527
819
Cboe
Global
Markets,
Inc.
160,033
8,045
Charles
Schwab
Corporation
595,410
1,872
Chubb,
Ltd.
517,234
837
Citigroup,
Inc.
58,916
644
Community
Trust
Bancorp,
Inc.
34,151
2,922
Discover
Financial
Services
506,178
1,150
Ellington
Credit
Company
7,613
299
Enact
Holdings,
Inc.
9,682
63
Enterprise
Financial
Services
Corporation
3,553
15,063
F.N.B.
Corporation
222,631
184
FactSet
Research
Systems,
Inc.
88,372
1,502
Federal
Agricultural
Mortgage
Corporation
295,819
208
Financial
Institutions,
Inc.
5,676
1,310
First
Bancorp/Puerto
Rico
24,353
305
First
Busey
Corporation
7,189
186
First
Citizens
BancShares,
Inc./NC
393,022
146
First
Mid-Illinois
Bancshares,
Inc.
5,376
894
Fiserv,
Inc.
j
183,646
1,906
Fulton
Financial
Corporation
36,748
5,712
Glacier
Bancorp,
Inc.
286,857
506
Great
Southern
Bancorp,
Inc.
30,208
1,047
Hanmi
Financial
Corporation
24,730
536
Hometrust
Bancshares,
Inc.
18,053
1,840
Houlihan
Lokey,
Inc.
319,534
187
Independent
Bank
Corporation/MI
6,513
6,756
Intercontinental
Exchange,
Inc.
1,006,712
6,347
J.P.
Morgan
Chase
&
Company
1,521,439
24,315
KeyCorp
416,759
2,057
Kinsale
Capital
Group,
Inc.
956,772
41
Loews
Corporation
3,472
855
Marsh
&
McLennan
Companies,
Inc.
181,611
913
Mastercard,
Inc.
480,758
5,538
MetLife,
Inc.
453,451
1,085
MidWestOne
Financial
Group,
Inc.
31,595
460
MSCI,
Inc.
276,005
8,515
Nasdaq,
Inc.
658,295
4,045
Northern
Trust
Corporation
414,613
1,946
OceanFirst
Financial
Corporation
35,223
909
OFG
Bancorp
38,469
590
Old
Second
Bancorp,
Inc.
10,490
3,095
PayPal
Holdings,
Inc.
j
264,158
86
PNC
Financial
Services
Group,
Inc.
16,585
436
Popular,
Inc.
41,010
1,605
Progressive
Corporation
384,574
3,243
Prosperity
Bancshares,
Inc.
244,360
9,359
Radian
Group,
Inc.
296,868
2,536
RLI
Corporation
418,009
443
S&P
Global,
Inc.
220,627
Diversified
Income
Plus
Fund
Schedule
of
Investments
as
of
December
31,
2024
The
accompanying
Notes
to
Financial
Statements
are
an
integral
part
of
this
schedule.
Shares
Common
Stock 14.8%
Value
Financials 2.3%
-
continued
608
SEI
Investments
Company
$
50,148
3,070
Tradeweb
Markets,
Inc.
401,924
3,365
Triumph
Financial,
Inc.
j
305,811
1,392
Truist
Financial
Corporation
60,385
16
TrustCo
Bank
Corporation
NY
533
313
Trustmark
Corporation
11,071
377
U.S.
Bancorp
18,032
2,739
Visa,
Inc.
865,634
20,193
Wells
Fargo
&
Company
1,418,356
7,676
Western
Alliance
Bancorp
641,253
7,585
Zions
Bancorp
NA
411,486
Total
22,269,164
Health
Care 1.6%
3,466
Abbott
Laboratories
392,039
153
AbbVie,
Inc.
27,188
3,664
Agilent
Technologies,
Inc.
492,222
960
Align
Technology,
Inc.
j
200,170
1,358
Amgen,
Inc.
353,949
11,236
Avantor,
Inc.
j
236,743
4,866
Boston
Scientific
Corporation
j
434,631
383
Chemed
Corporation
202,913
1,283
Cigna
Group
354,288
3,762
Danaher
Corporation
863,567
3,915
Edwards
Lifesciences
Corporation
j
289,828
1,466
Elevance
Health,
Inc.
540,807
1,591
Eli
Lilly
&
Company
1,228,252
2,243
Encompass
Health
Corporation
207,141
5,656
Gilead
Sciences,
Inc.
522,445
4,131
Haemonetics
Corporation
j
322,549
1,209
Humana,
Inc.
306,735
751
IDEXX
Laboratories,
Inc.
j
310,494
670
Intuitive
Surgical,
Inc.
j
349,713
6,137
Johnson
&
Johnson
887,533
1,626
Labcorp
Holdings,
Inc.
372,874
480
Medpace
Holdings,
Inc.
j
159,470
7,389
Medtronic
plc
590,233
6,255
Merck
&
Company,
Inc.
622,247
205
Mettler-Toledo
International,
Inc.
j
250,854
2,549
Neurocrine
Biosciences,
Inc.
j
347,939
1,087
Penumbra,
Inc.
j
258,141
274
Regeneron
Pharmaceuticals,
Inc.
j
195,178
1,597
Repligen
Corporation
j
229,872
9,175
Sanofi
SA
ADR
442,510
1,950
Sarepta
Therapeutics,
Inc.
j
237,101
8,636
Stevanato
Group
SPA
188,178
818
Stryker
Corporation
294,521
707
Thermo
Fisher
Scientific,
Inc.
367,803
4,712
Twist
Bioscience
Corporation
j
218,967
686
United
Therapeutics
Corporation
j
242,048
739
UnitedHealth
Group,
Inc.
373,831
876
Vertex
Pharmaceuticals,
Inc.
j
352,765
14,420
Viemed
Healthcare,
Inc.
j
115,648
670
Waters
Corporation
j
248,557
4,321
Zimmer
Biomet
Holdings,
Inc.
456,427
1,629
Zoetis,
Inc.
265,413
Total
15,353,784
Industrials 2.1%
745
AECOM
79,581
8,089
Air
Lease
Corporation
389,971
7,962
Amentum
Holdings,
Inc.
j
167,441
1,833
AMETEK,
Inc.
330,416
351
Armstrong
World
Industries,
Inc.
49,607
Shares
Common
Stock 14.8%
Value
Industrials 2.1%
-
continued
1,419
Automatic
Data
Processing,
Inc.
$
415,384
790
Axon
Enterprise,
Inc.
j
469,513
12,487
Badger
Infrastructure
Solutions,
Ltd.
311,686
6,883
Barrett
Business
Services,
Inc.
298,997
272
Brady
Corporation
20,087
1,780
BWX
Technologies,
Inc.
198,274
1,407
Caterpillar,
Inc.
510,403
38,417
CNH
Industrial
NV
435,265
25,654
CSX
Corporation
827,854
4,590
Dayforce,
Inc.
j
333,418
8,808
Delta
Air
Lines,
Inc.
532,884
6,037
ExlService
Holdings,
Inc.
j
267,922
2,471
Expeditors
International
of
Washington,
Inc.
273,713
13,612
Fastenal
Company
978,839
1,947
Ferguson
Enterprises,
Inc.
337,941
7,859
Flowserve
Corporation
452,050
1,976
Fluor
Corporation
j
97,456
1,694
General
Dynamics
Corporation
446,352
251
Graco,
Inc.
21,157
6,178
Helios
Technologies,
Inc.
275,786
3,184
Hexcel
Corporation
199,637
2,683
Honeywell
International,
Inc.
606,063
4,429
Howmet
Aerospace,
Inc.
484,400
350
IES
Holdings,
Inc.
j
70,336
2,193
Ingersoll
Rand,
Inc.
198,379
2,711
Jacobs
Solutions,
Inc.
362,244
3,237
JB
Hunt
Transport
Services,
Inc.
552,426
5,377
Knight-Swift
Transportation
Holdings,
Inc.
285,196
3,080
Korn
Ferry
207,746
1,968
L3Harris
Technologies,
Inc.
413,831
1,116
Landstar
System,
Inc.
191,796
1,620
Leidos
Holdings,
Inc.
233,377
1,461
Lincoln
Electric
Holdings,
Inc.
273,894
2,129
Masco
Corporation
154,501
14,729
Masterbrand,
Inc.
j
215,191
2,147
Miller
Industries,
Inc.
140,328
1,307
Moog,
Inc.
257,270
461
Northrop
Grumman
Corporation
216,343
3,352
Old
Dominion
Freight
Line,
Inc.
591,293
732
Owens
Corning,
Inc.
124,674
325
Parker-Hannifin
Corporation
206,710
1,631
Quanta
Services,
Inc.
515,477
4,214
Robert
Half,
Inc.
296,918
1,685
Rockwell
Automation,
Inc.
481,556
8,905
Schneider
National,
Inc.
260,738
7,365
Southwest
Airlines
Company
247,611
8,795
Timken
Company
627,699
1,292
Trane
Technologies
plc
477,200
6,270
Uber
Technologies,
Inc.
j
378,206
1,978
UFP
Industries,
Inc.
222,822
190
Union
Pacific
Corporation
43,328
4,877
United
Airlines
Holdings,
Inc.
j
473,557
3,241
United
Parcel
Service,
Inc.
408,690
1,041
United
Rentals,
Inc.
733,322
1,272
Verisk
Analytics,
Inc.
350,347
329
Waste
Management,
Inc.
66,389
4,566
WNS
Holdings,
Ltd.
j
216,383
Total
20,307,875
Information
Technology 3.4%
639
Adobe,
Inc.
j
284,151
2,374
Advanced
Micro
Devices,
Inc.
j
286,755
Diversified
Income
Plus
Fund
Schedule
of
Investments
as
of
December
31,
2024
The
accompanying
Notes
to
Financial
Statements
are
an
integral
part
of
this
schedule.
Shares
Common
Stock 14.8%
Value
Information
Technology 3.4%
-
continued
8,346
Amphenol
Corporation
$
579,630
20,698
Apple,
Inc.
5,183,193
3,143
Applied
Materials,
Inc.
511,146
2,529
Arista
Networks,
Inc.
j
279,530
1,829
ASGN,
Inc.
j
152,429
2,260
Autodesk,
Inc.
j
667,988
7,019
Broadcom,
Inc.
1,627,285
1,426
CDW
Corporation
248,181
9,233
Ciena
Corporation
j
783,051
20,864
Cisco
Systems,
Inc.
1,235,149
10,054
Cohu,
Inc.
j
268,442
2,467
Datadog,
Inc.
j
352,510
8,032
DocuSign,
Inc.
j
722,398
1,214
Fabrinet
j
266,934
2,479
Fortinet,
Inc.
j
234,216
548
Guidewire
Software,
Inc.
j
92,382
4,246
International
Business
Machines
Corporation
933,398
5,904
JFrog,
Ltd.
j
173,637
885
Littelfuse,
Inc.
208,550
12,259
Microsoft
Corporation
5,167,168
1,015
MongoDB,
Inc.
j
236,302
761
Motorola
Solutions,
Inc.
351,757
516
NetApp,
Inc.
59,897
37,820
NVIDIA
Corporation
5,078,848
3,298
ON
Semiconductor
Corporation
j
207,939
834
Onto
Innovation,
Inc.
j
139,003
2,373
Oracle
Corporation
395,437
2,326
Pegasystems,
Inc.
216,783
1,067
Plexus
Corporation
j
166,964
3,541
Qorvo,
Inc.
j
247,622
6,276
QUALCOMM,
Inc.
964,119
54
RingCentral,
Inc.
j
1,891
2,744
Salesforce,
Inc.
917,402
13,429
Samsung
Electronics
Company,
Ltd.
479,238
985
ServiceNow,
Inc.
j
1,044,218
2,451
Taiwan
Semiconductor
Manufacturing
Company,
Ltd.
ADR
484,048
3,610
TD
SYNNEX
Corporation
423,381
11,070
Trimble,
Inc.
j
782,206
18,839
TTM
Technologies,
Inc.
j
466,265
833
Universal
Display
Corporation
121,785
8,314
Varonis
Systems,
Inc.
j
369,391
648
VeriSign,
Inc.
j
134,110
Total
33,546,729
Materials 0.5%
2,425
Albemarle
Corporation
d
208,744
3,718
Ball
Corporation
204,973
2,081
Celanese
Corporation
144,026
5,749
CF
Industries
Holdings,
Inc.
490,505
4,908
Corteva,
Inc.
279,560
1,376
DuPont
de
Nemours,
Inc.
104,920
12
Eagle
Materials,
Inc.
2,961
3,696
Eastman
Chemical
Company
337,519
2,437
Ecolab,
Inc.
571,038
2,716
Greif,
Inc.
166,002
4,549
Ingevity
Corporation
j
185,372
15,820
Ivanhoe
Mines,
Ltd.
j
187,755
1,021
Linde
plc
427,462
3,746
Nucor
Corporation
437,196
5,507
Olin
Corporation
186,136
5,010
Steel
Dynamics,
Inc.
571,491
Shares
Common
Stock 14.8%
Value
Materials 0.5%
-
continued
25,034
Tronox
Holdings
plc
$
252,092
386
United
States
Lime
&
Minerals,
Inc.
51,237
3,119
United
States
Steel
Corporation
106,015
3,495
West
Fraser
Timber
Company,
Ltd.
302,492
Total
5,217,496
Real
Estate 0.4%
3,513
Agree
Realty
Corporation
247,491
1,924
Alexandria
Real
Estate
Equities,
Inc.
187,686
872
AvalonBay
Communities,
Inc.
191,814
1,381
Broadstone
Net
Lease,
Inc.
21,903
2,275
CBRE
Group,
Inc.
j
298,685
4,359
Crown
Castle,
Inc.
395,623
19,881
Cushman
and
Wakefield
plc
j
260,043
528
EastGroup
Properties,
Inc.
84,739
162
Equinix,
Inc.
152,748
12,569
Essential
Properties
Realty
Trust,
Inc.
393,158
1,456
Extra
Space
Storage,
Inc.
217,818
19,637
Healthcare
Realty
Trust,
Inc.
332,847
353
Innovative
Industrial
Properties,
Inc.
23,524
619
Kite
Realty
Group
Trust
15,623
8,851
National
Storage
Affiliates
Trust
335,541
1,981
Outfront
Media,
Inc.
35,143
8,330
Sabra
Health
Care
REIT,
Inc.
144,276
2,857
SBA
Communications
Corporation
582,257
1,002
STAG
Industrial,
Inc.
33,888
1,430
Tanger,
Inc.
48,806
5,045
Terreno
Realty
Corporation
298,361
3,529
Uniti
Group,
Inc.
19,409
Total
4,321,383
Utilities 0.6%
7,430
Alliant
Energy
Corporation
439,410
229
Black
Hills
Corporation
13,401
558
Brookfield
Infrastructure
Corporation
22,326
401
California
Water
Service
Group
18,177
12,910
CenterPoint
Energy,
Inc.
409,634
927
Clearway
Energy,
Inc.,
Class
C
24,102
1,789
Constellation
Energy
Corporation
400,217
6,018
Duke
Energy
Corporation
648,379
9,974
Entergy
Corporation
756,229
1,773
NextEra
Energy
Partners,
LP
31,559
13,219
NiSource,
Inc.
485,930
1,808
Northwestern
Energy
Group,
Inc.
96,656
4,027
Portland
General
Electric
Company
175,658
5,842
Public
Service
Enterprise
Group,
Inc.
493,591
2,618
Spire,
Inc.
177,579
17,472
UGI
Corporation
493,234
4,011
Vistra
Energy
Corporation
552,997
4,382
Xcel
Energy,
Inc.
295,873
Total
5,534,952
Total
Common
Stock
(cost
$99,958,431)
144,717,029
Diversified
Income
Plus
Fund
Schedule
of
Investments
as
of
December
31,
2024
The
accompanying
Notes
to
Financial
Statements
are
an
integral
part
of
this
schedule.
Shares
Registered
Investment
Companies
10.0%
Value
U.S.
Affiliated
9.0%
9,444,525
Thrivent
Core
Emerging
Markets
Debt
Fund
$
76,878,431
1,019,033
Thrivent
Core
International
Equity
Fund
10,414,520
Total
87,292,951
U.S.
Unaffiliated
1.0%
14,380
abrdn
Asia-Pacific
Income
Fund,
Inc.
211,674
43,059
abrdn
Income
Credit
Strategies
Fund
257,062
11,503
abrdn
Total
Dynamic
Dividend
Fund
96,740
27,364
AllianceBernstein
Global
High
Income
Fund,
Inc.
293,616
39,038
Allspring
Income
Opportunities
Fund
268,972
5,906
BlackRock
Capital
Allocation
Term
Trust
89,476
4,916
BlackRock
Core
Bond
Trust
51,421
27,083
BlackRock
Corporate
High
Yield
Fund,
Inc.
265,684
30,673
BlackRock
Credit
Allocation
Income
Trust
320,840
2,772
BlackRock
Debt
Strategies
Fund,
Inc.
29,827
4,227
BlackRock
Enhanced
Equity
Dividend
Trust
35,000
24,851
BlackRock
Enhanced
Global
Dividend
Trust
267,645
14,068
BlackRock
Enhanced
International
Dividend
Trust
74,701
846
BlackRock
Floating
Rate
Income
Strategies
Fund,
Inc.
11,632
9,168
BlackRock
Income
Trust,
Inc.
105,615
18,346
BlackRock
Multi-Sector
Income
Trust
267,852
23,695
Blackstone
Strategic
Credit
2027
Term
Fund
289,790
18,351
Cornerstone
Strategic
Investment
Fund,
Inc.
d
157,635
30,283
Eaton
Vance
Limited
Duration
Income
Fund
295,865
12,368
Eaton
Vance
Tax-Managed
Global
Diversified
Equity
Income
Fund
101,047
9,500
Invesco
Senior
Loan
ETF
200,165
8,093
iShares
iBoxx
$
Investment
Grade
Corporate
Bond
ETF
d
864,656
10,200
iShares
Preferred
and
Income
Securities
ETF
d
320,688
50,149
Nuveen
Credit
Strategies
Income
Fund
285,348
20,903
Nuveen
Preferred
Income
Opportunities
Fund
164,298
24,444
PGIM
Global
High
Yield
Fund,
Inc.
301,150
22,391
PGIM
High
Yield
Bond
Fund,
Inc.
306,309
8,874
Pimco
Dynamic
Income
Fund
d
162,749
16,611
PIMCO
High
Income
Fund
80,729
15,959
PIMCO
Income
Strategy
Fund
II
118,894
1,955
SPDR
S&P
Biotech
ETF
d
176,067
2,534
Tri-Continental
Corporation
80,303
7,882
Vanguard
Intermediate-Term
Corporate
Bond
ETF
d
632,688
Shares
Registered
Investment
Companies 10.0%
Value
U.S.
Unaffiliated
1.0% -
continued
13,602
Vanguard
Short-Term
Corporate
Bond
ETF
$
1,061,092
21,634
Virtus
Convertible
&
Income
Fund
75,070
19,867
Virtus
Dividend,
Interest
&
Premium
Strategy
Fund
250,920
4,526
Virtus
Equity
&
Convertible
Income
Fund
111,611
44,226
Voya
Global
Equity
Dividend
&
Premium
Opportunity
Fund
239,705
5,193
Western
Asset
Diversified
Income
Fund
74,000
67,749
Western
Asset
High
Income
Opportunity
Fund,
Inc.
266,254
Total
9,264,790
Total
Registered
Investment
Companies
(cost
$107,312,228)
96,557,741
Shares
Preferred
Stock
1.5%
Value
Basic
Materials <0.1%
10,678
Albemarle
Corporation,
Convertible,
7.250%
434,488
Total
434,488
Capital
Goods 0.1%
20,002
Boeing
Company,
Convertible,
6.000%
1,217,922
Total
1,217,922
Communications
Services 0.1%
35,275
AT&T,
Inc.,
4.750%
g
700,209
15,250
Telephone
and
Data
Systems,
Inc.,
6.000%
g
263,825
Total
964,034
Financials 1.1%
10,000
AEGON
Funding
Company,
LLC,
5.100%
203,000
20,000
Allstate
Corporation,
5.100%
g
437,600
7,068
Apollo
Global
Management,
Inc.,
Convertible,
6.750%
614,280
7,033
Ares
Management
Corporation,
Convertible,
6.750%
387,096
7,800
Athene
Holding,
Ltd.,
5.625%
g
160,212
20,775
Bank
of
America
Corporation,
4.250%
g
386,415
16,050
Bank
of
America
Corporation,
4.375%
g
311,691
8,025
Bank
of
America
Corporation,
4.750%
g
166,920
16,050
Bank
of
America
Corporation,
5.000%
g
346,680
639
Bank
of
America
Corporation,
Convertible,
7.250%
g
779,101
3,900
Capital
One
Financial
Corporation,
4.800%
g
71,409
19,525
Capital
One
Financial
Corporation,
5.000%
g
371,365
3,900
Charles
Schwab
Corporation,
4.450%
d,g
76,089
2,750
Citizens
Financial
Group,
Inc.,
7.375%
g
71,500
Diversified
Income
Plus
Fund
Schedule
of
Investments
as
of
December
31,
2024
The
accompanying
Notes
to
Financial
Statements
are
an
integral
part
of
this
schedule.
Shares
Preferred
Stock 1.5%
Value
Financials 1.1%
-
continued
6,425
Corebridge
Financial,
Inc.,
6.375%
$
163,773
9,000
Equitable
Holdings,
Inc.,
5.250%
g
184,140
7,800
Fifth
Third
Bancorp,
4.950%
g
163,566
7,800
Huntington
Bancshares,
Inc./OH,
4.500%
g
138,216
23,000
J.P.
Morgan
Chase
&
Company,
4.200%
g
434,470
16,050
J.P.
Morgan
Chase
&
Company,
4.625%
d,g
334,321
16,250
J.P.
Morgan
Chase
&
Company,
4.750%
g
346,938
3,900
KeyCorp,
5.650%
g
84,045
15,950
KeyCorp,
6.200%
b,g
389,021
3,900
MetLife,
Inc.,
4.750%
g
80,574
13,050
Morgan
Stanley,
4.250%
d,g
240,251
10,400
Morgan
Stanley,
5.850%
b,g
253,136
13,084
Morgan
Stanley,
7.125%
b,g
330,109
14,525
Public
Storage,
4.125%
g
258,981
5,025
Public
Storage,
4.625%
g
97,535
1,275
Public
Storage,
4.700%
g
25,054
7,800
Regions
Financial
Corporation,
4.450%
g
138,606
3,900
Regions
Financial
Corporation,
5.700%
b,g
94,536
3,500
Synovus
Financial
Corporation,
8.397%
b,g
90,825
7,800
Truist
Financial
Corporation,
4.750%
g
150,540
13,100
U.S.
Bancorp,
4.000%
g
231,477
21,000
Wells
Fargo
&
Company,
4.250%
g
382,830
16,050
Wells
Fargo
&
Company,
4.375%
g
302,703
7,800
Wells
Fargo
&
Company,
4.700%
g
155,922
11,800
Wells
Fargo
&
Company,
4.750%
g
240,720
761
Wells
Fargo
&
Company,
Convertible,
7.500%
g
908,870
Total
10,604,517
Technology 0.1%
7,246
Hewlett
Packard
Enterprise
Company,
Convertible,
7.625%
454,396
Total
454,396
Utilities 0.1%
23,000
CMS
Energy
Corporation,
4.200%
g
430,100
5,511
NextEra
Energy,
Inc.,
Convertible,
6.926%
225,510
1,518
Nextera
Energy,
Inc.,
Convertible,
7.234%
j
69,221
6,004
NextEra
Energy,
Inc.,
Convertible,
7.299%
292,935
13,600
Southern
Company,
4.950%
281,520
Total
1,299,286
Total
Preferred
Stock
(cost
$16,436,282)
14,974,643
Shares
Collateral
Held
for
Securities
Loaned
1.0%
Value
9,941,768
Thrivent
Cash
Management
Trust
9,941,768
Total
Collateral
Held
for
Securities
Loaned
(cost
$9,941,768)
9,941,768
Shares
or
Principal
Amount
Short-Term
Investments
4.9%
Value
Federal
Home
Loan
Bank
Discount
Notes
600,000
4.525%,
1/2/2025
k,l
$
599,860
1,100,000
4.545%,
1/8/2025
k,l
1,098,971
1,000,000
4.530%,
1/10/2025
k,l
998,830
1,100,000
4.420%,
2/5/2025
k,l
1,095,358
500,000
4.420%,
2/12/2025
k,l
497,480
Thrivent
Core
Short-Term
Reserve
Fund
4,269,640
4.730%
42,696,402
U.S.
Treasury
Bills
400,000
4.502%,
1/16/2025
k,m
399,341
200,000
4.405%,
2/13/2025
k,m
199,011
Total
Short-Term
Investments
(cost
$47,584,476)
47,585,253
Total
Investments
(cost
$972,880,640)
101.1%
$986,251,399
Other
Assets
and
Liabilities,
Net
(1.1%)
(10,444,019)
Total
Net
Assets
100.0%
$975,807,380
a
Denotes
securities
sold
under
Rule
144A
of
the
Securities
Act
of
1933,
which
exempts
them
from
registration.
These
securities
may
be
resold
to
other
dealers
in
the
program
or
to
other
qualified
institutional
buyers.
As
of
December
31,
2024,
the
value
of
these
investments
was
$211,451,577
or
21.7%
of
total
net
assets.
b
Denotes
variable
rate
securities.
The
rate
shown
is
as
of
December
31,
2024.
The
rates
of
certain
variable
rate
securities
are
based
on
a
published
reference
rate
and
spread;
these
may
vary
by
security
and
the
reference
rate
and
spread
are
indicated
in
their
description. The
rates
of
other
variable
rate
securities
are
determined
by
the
issuer
or
agent
and
are
based
on
current
market
conditions. These
securities
do
not
indicate
a
reference
rate
and
spread
in
their
description.
c
Denotes
step
coupon
securities.
Step
coupon
securities
pay
an
initial
coupon
rate
for
the
first
period
and
then
different
coupon
rates
for
following
periods.
The
rate
shown
is
as
of
December
31,
2024.
d
All
or
a
portion
of
the
security
is
on
loan.
e
Denotes
interest
only
security. Interest
only
securities
represent
the
right
to
receive
monthly
interest
payments
on
an
underlying
pool
of
mortgages
or
assets. The
principal
shown
is
the
outstanding
par
amount
of
the
pool
as
of
the
end
of
the
period.
The
actual
effective
yield
of
the
security
is
different
than
the
stated
coupon
rate.
f
Denotes
payment-in-kind
security. The
security
may
pay
an
interest
or
dividend
payment
with
additional
fixed
income
or
equity
securities
in
lieu
of,
or
in
addition
to
a
cash
payment. The
cash
rate
and/or
payment-in-kind
rate
shown
are
as
of
December
31,
2024.
g
Denotes
perpetual
securities.
Perpetual
securities
pay
an
indefinite
stream
of
income
and
have
no
contractual
maturity
date.
Date
shown,
if
applicable,
is
next
call
date.
h
Defaulted
security. Interest
is
not
being
accrued.
i
Denotes
investments
purchased
on
a
when-issued
or
delayed-delivery
basis.
j
Non-income
producing
security.
k
The
interest
rate
shown
reflects
the
yield.
l
All
or
a
portion
of
the
security
is
held
on
deposit
with
the
counterparty
and
pledged
as
the
initial
margin
deposit
for
open
futures
contracts.
Diversified
Income
Plus
Fund
Schedule
of
Investments
as
of
December
31,
2024
The
accompanying
Notes
to
Financial
Statements
are
an
integral
part
of
this
schedule.
,,
m
All
or
a
portion
of
the
security
is
pledged
as
collateral
under
the
agreement
between
the
counterparty,
the
custodian
and
the
fund
for
open
swap
contracts.
*
Denotes
restricted
securities.
Restricted
securities
are
investment
securities
which
cannot
be
offered
for
public
sale
without
first
being
registered
under
the
Securities
Act
of
1933.
The
value
of
all
restricted
securities
held
in
Diversified
Income
Plus
Fund
as
of
December
31,
2024
was
$28,000
or
0.00%
of
total
net
assets.
The
following
table
indicates
the
acquisition
date
and
cost
of
restricted
securities
shown
in
the
schedule
as
of
December
31,
2024.
Security
Acquisition
Date
Cost
Credit
Suisse
Group
AG
5/17/2021
$
144,113
Credit
Suisse
Group
AG
12/4/2013
150,000
The
following
table
presents
the
total
amount
of
securities
loaned
with
continuous
maturity,
by
type,
offset
by
the
gross
payable
upon
return
of
collateral
for
securities
loaned
by
Thrivent
Diversified
Income
Plus
Fund
as
of
December
31,
2024:
Securities
Lending
Transactions
Long-Term
Fixed
Income
$
7,174,329
Common
Stock
2,461,701
Total
lending
$9,636,030
Gross
amount
payable
upon
return
of
collateral
for
securities
loaned
$9,941,768
Net
amounts
due
to
counterparty
$305,738
Definitions:
ADR
-
American
Depositary
Receipt,
which
are
certificates
for
an
underlying
foreign
security's
shares
held
by
an
issuing
U.S.
depository
bank.
CLO
-
Collateralized
Loan
Obligation
ETF
-
Exchange
Traded
Fund
PIK
-
Payment-In-Kind
REMIC
-
Real
Estate
Mortgage
Investment
Conduit
plc
-
Public
Limited
Company
REIT
-
Real
Estate
Investment
Trust
is
a
company
that
buys,
develops,
manages
and/or
sells
real
estate
assets.
S&P
-
Standard
&
Poor's
Ser.
-
Series
SPDR
-
S&P
Depository
Receipts,
which
are
exchange-traded
funds
traded
in
the
U.S.,
Europe,
and
Asia-Pacific
and
managed
by
State
Street
Global
Advisors.
Reference
Rate
Index:
CMT
1Y
-
Constant
Maturity
Treasury
Yield
1
Year
H15T
5Y
-
U.
S.
Treasury
Yield
Curve
Rate
Treasury
Note
Constant
Maturity
5
Year
SOFR30A
-
Secured
Overnight
Financing
Rate
30
Year
Average
TSFR1M
-
CME
Term
SOFR
1
Month
TSFR3M
-
CME
Term
SOFR
3
Month
USISOA05
-
USD
SOFR
Spread-Adjusted
ICE
Swap
Rate
5
Year
Unrealized
Appreciation
(Depreciation)
Gross
unrealized
appreciation
and
depreciation
of
investments
of
the
portfolio
as
a
whole
(including
derivatives,
if
any),
based
on
cost
for
federal
income
tax
purposes,
were
as
follows:
Gross
unrealized
appreciation
$55,959,753
Gross
unrealized
depreciation
(46,396,716)
Net
unrealized
appreciation
(depreciation)
$9,563,037
Cost
for
federal
income
tax
purposes
$976,273,378
Diversified
Income
Plus
Fund
Schedule
of
Investments
as
of
December
31,
2024
The
accompanying
Notes
to
Financial
Statements
are
an
integral
part
of
this
schedule.
Fair
Valuation
Measurements
The
following
table
is
a
summary
of
the
inputs
used,
as
of
December
31,
2024,
in
valuing
Diversified
Income
Plus
Fund's
assets
carried
at
fair
value.
Investments
in
Securities
Total
Level
1
Level
2
Level
3
Long-Term
Fixed
Income
Asset-Backed
Securities
62,421,227
–
62,421,227
–
Basic
Materials
8,778,218
–
8,778,218
–
Capital
Goods
16,325,985
–
16,325,985
–
Collateralized
Mortgage
Obligations
56,170,931
–
56,170,931
–
Commercial
Mortgage-Backed
Securities
5,007,077
–
5,007,077
–
Communications
Services
22,096,551
–
22,096,551
–
Consumer
Cyclical
30,772,495
–
30,772,495
–
Consumer
Non-Cyclical
30,390,368
–
30,390,368
–
Energy
25,888,424
–
25,888,424
–
Financials
79,070,894
–
79,070,894
–
Foreign
Government
633,813
–
633,813
–
Mortgage-Backed
Securities
205,129,776
–
205,129,776
–
Technology
23,268,117
–
23,268,117
–
Transportation
5,090,918
–
5,090,918
–
U.S.
Government
&
Agencies
76,699,718
–
76,699,718
–
Utilities
24,730,453
–
24,730,453
–
Common
Stock
Communications
Services
8,949,524
8,949,524
–
–
Consumer
Discretionary
16,330,950
16,195,996
134,954
–
Consumer
Staples
6,554,508
6,554,508
–
–
Energy
6,330,664
6,330,664
–
–
Financials
22,269,164
22,269,164
–
–
Health
Care
15,353,784
15,353,784
–
–
Industrials
20,307,875
19,996,189
311,686
–
Information
Technology
33,546,729
33,067,491
479,238
–
Materials
5,217,496
5,029,741
187,755
–
Real
Estate
4,321,383
4,321,383
–
–
Utilities
5,534,952
5,534,952
–
–
Preferred
Stock
Basic
Materials
434,488
434,488
–
–
Capital
Goods
1,217,922
1,217,922
–
–
Communications
Services
964,034
964,034
–
–
Financials
10,604,517
10,604,517
–
–
Technology
454,396
454,396
–
–
Utilities
1,299,286
1,299,286
–
–
Registered
Investment
Companies
U.S.
Unaffiliated
9,264,790
9,264,790
–
–
Short-Term
Investments
4,888,851
–
4,888,851
–
Subtotal
Investments
in
Securities
$846,320,278
$167,842,829
$678,477,449
$–
Other
Investments *
Total
U.S.
Affiliated
Registered
Investment
Cos.
87,292,951
Affiliated
Short-Term
Investments
42,696,402
Collateral
Held
for
Securities
Loaned
9,941,768
Subtotal
Other
Investments
$139,931,121
Total
Investments
at
Value
$986,251,399
*
Certain
investments
are
measured
at
fair
value
using
a
net
asset
value
per
share
that
is
not
publicly
available
(practical
expedient). According
to
disclosure
requirements
of
Accounting
Standards
Codification
(ASC)
820,
Fair
Value
Measurement,
securities
valued
using
the
practical
expedient
are
not
classified
in
the
fair
value
hierarchy. The
fair
value
amounts
presented
in
the
table
above
are
intended
to
permit
reconciliation
of
the
fair
value
hierarchy
to
the
amounts
presented
in
the
Statement
of
Assets
and
Liabilities.
Diversified
Income
Plus
Fund
Schedule
of
Investments
as
of
December
31,
2024
The
accompanying
Notes
to
Financial
Statements
are
an
integral
part
of
this
schedule.
Chicago
Mercantile
Exchange
Europe,
Australasia
and
Far
East
Morgan
Stanley
Capital
International
Effective
Federal
Funds
Rate
The
following
table
is
a
summary
of
the
inputs
used,
as
of
December
31,
2024,
in
valuing
Diversified
Income
Plus
Fund's
other
financial
instrument
assets
carried
at
fair
value.
Other
Financial
Instruments
Total
Level
1
Level
2
Level
3
Asset
Derivatives
Futures
Contracts
2,198,827
1,904,834
293,993
–
Total
Asset
Derivatives
$2,198,827
$1,904,834
$293,993
$–
Liability
Derivatives
Futures
Contracts
2,479,750
2,479,750
–
–
Total
Return
Swaps
7,294
–
7,294
–
Credit
Default
Swaps
126,767
–
126,767
–
Total
Liability
Derivatives
$2,613,811
$2,479,750
$134,061
$–
The
following
table
presents
Diversified
Income
Plus
Fund's
futures
contracts
held
as
of
December
31,
2024.
Investments
and/or
cash
totaling
$4,290,499
were
pledged
as
the
initial
margin
deposit
for
these
contracts.
Futures
Contracts
Description
Number
of
Contracts
Long/(Short)
Expiration
Date
Notional
Principal
Amount
Value
and
Unrealized
CBOT
2-Yr.
U.S.
Treasury
Note
52
March
2025
$
10,684,917
$
6,770
CME
E-mini
S&P
500
Index
203
March
2025
62,217,309
(
1,969,446)
ICE
mini
MSCI
EAFE
Index
108
March
2025
12,692,221
(
447,720)
ICE
US
mini
MSCI
Emerging
Markets
Index
30
March
2025
1,673,284
(
62,584)
Total
Futures
Long
Contracts
$
87,267,731
(
$
2,472,980)
CME
E-mini
Russell
2000
Index
(164)
March
2025
(
$
19,611,721)
$
1,163,361
CME
E-mini
S&P
Mid-Cap
400
Index
(25)
March
2025
(
8,317,539)
450,789
CME
Euro
Foreign
Exchange
Currency
(92)
March
2025
(
12,161,556)
214,781
Eurex
Euro
STOXX
50
Index
(231)
March
2025
(
11,970,932)
293,993
Ultra
10-Yr.
U.S.
Treasury
Note
(45)
March
2025
(
5,078,196)
69,133
Total
Futures
Short
Contracts
(
$
57,139,944)
$2,192,057
Total
Futures
Contracts
$
30,127,787
($280,923)
The
following
table
presents
Diversified
Income
Plus
Fund's
total
return
swap
contracts
held
as
of
December
31,
2024.
Total
Return
Swaps
Reference
Entity
Fund
Pays
#
Fund
Receives
Counter-
party
Termination
Date
Notional
Principal
Amount
Value
Upfront
Payments/
(Receipts)
Unrealized
Gain/(Loss)
S&P
MidCap
400
Total
Return
Index
Swap
Total
Return
EFFR
1
day
+
45bps
Goldman
Sachs
&
Co.
LLC
8/6/2025
$
98,942
(
$
7,294)
$
–
(
$
7,294)
Total
Return
Swaps
(
$
7,294)
$
–
($7,294)
#
Payment
made
on
Termination
Date
Diversified
Income
Plus
Fund
Schedule
of
Investments
as
of
December
31,
2024
The
accompanying
Notes
to
Financial
Statements
are
an
integral
part
of
this
schedule.
The
following
table
presents
Diversified
Income
Plus
Fund's
credit
default
swap
contracts
held
as
of
December
31,
2024.
Investments
totaling
$598,352
were
pledged
as
collateral
under
the
agreement
between
the
counterparty,
the
custodian
and
the
fund
for
open
swap
contracts.
Credit
Default
Swaps
Buy/Sell
Protection
1
Termination
Date
Notional
Principal
Amount
2
Upfront
Payments/
(Receipts)
Value
3
Unrealized
Gain/(Loss)
CDX
HY
43,
5
Year,
at
5.00%,
Quarterly
Buy
12/20/2029
$
11,735,000
$
–
(
$
126,767)
(
$
126,767)
Total
Credit
Default
Swaps
$–
($126,767)
($126,767)
1
As
the
buyer
of
protection,
Diversified
Income
Plus
Fund
pays
periodic
fees
in
return
for
payment
by
the
seller
which
is
contingent
upon
an
adverse
credit
event
occurring
in
the
underlying
issuer
or
reference
entity.
As
the
seller
of
protection,
Diversified
Income
Plus
Fund
collects
periodic
fees
from
the
buyer
and
profits
if
the
credit
of
the
underlying
issuer
or
reference
entity
remains
stable
or
improves
while
the
swap
is
outstanding,
but
the
seller
in
a
credit
default
swap
contract
would
be
required
to
pay
the
amount
of
credit
loss,
determined
as
specified
in
the
agreement,
to
the
buyer
in
the
event
of
an
adverse
credit
event
in
the
reference
entity.
2
The
maximum
potential
amount
of
future
payments
Diversified
Income
Plus
Fund
could
be
required
to
make
as
the
seller
or
receive
as
the
buyer
of
protection.
3
The
values
for
credit
indexes
(CDX
or
LCDX)
serve
as
an
indicator
of
the
current
status
of
the
payment/performance
risk
and
represent
the
liability
or
profit
for
the
credit
default
swap
contract
had
the
contract
been
closed
as
of
the
reporting
date.
When
protection
has
been
sold,
the
value
of
the
swap
will
increase
when
the
swap
spread
declines
representing
an
improvement
in
the
reference
entity's
credit
worthiness.
The
value
of
the
swap
will
decrease
when
the
swap
spread
increases
representing
a
deterioration
in
the
reference
entity's
credit
worthiness.
When
protection
has
been
purchased,
the
value
of
the
swap
will
increase
when
the
swap
spread
increases
representing
a
deterioration
in
the
reference
entity's
credit
worthiness.
The
value
of
the
swap
will
decrease
when
the
swap
spread
declines
representing
an
improvement
in
the
reference
entity's
credit
worthiness.
The
following
table
summarizes
the
fair
value
and
Statement
of
Assets
and
Liabilities
location,
as
of
December
31,
2024,
for
Diversified
Income
Plus
Fund's
investments
in
financial
derivative
instruments
by
primary
risk
exposure
as
discussed
under
item
(2)
Significant
Accounting
Policies
of
the
Notes
to
Financial
Statements.
Derivatives
by
risk
category
Statement
of
Assets
and
Liabilities
Location
Fair
Value
Asset
Derivatives
Foreign
Exchange
Contracts
Futures*
Net
Assets
-
Distributable
earnings/(accumulated
loss)
$
214,781
Total
Foreign
Exchange
Contracts
214,781
Equity
Contracts
Futures*
Net
Assets
-
Distributable
earnings/(accumulated
loss)
1,908,143
Total
Equity
Contracts
1,908,143
Interest
Rate
Contracts
Futures*
Net
Assets
-
Distributable
earnings/(accumulated
loss)
75,903
Total
Interest
Rate
Contracts
75,903
Total
Asset
Derivatives
$2,198,827
Liability
Derivatives
Equity
Contracts
Futures*
Net
Assets
-
Distributable
earnings/(accumulated
loss)
2,479,750
Total
Return
Swaps
Net
Assets
-
Distributable
earnings/(accumulated
loss)
7,294
Total
Equity
Contracts
2,487,044
Credit
Contracts
Credit
Default
Swaps
Net
Assets
-
Distributable
earnings/(accumulated
loss)
126,767
Total
Credit
Contracts
126,767
Total
Liability
Derivatives
$2,613,811
*
Includes
cumulative
appreciation/depreciation
of
futures
contracts
as
reported
in
the
Schedule
of
Investments. Only
current
day's
variation
margin
is
reported
within
the
Statement
of
Assets
and
Liabilities.
Diversified
Income
Plus
Fund
Schedule
of
Investments
as
of
December
31,
2024
The
accompanying
Notes
to
Financial
Statements
are
an
integral
part
of
this
schedule.
The
following
table
summarizes
the
net
realized
gains/(losses)
and
Statement
of
Operations
location,
for
the
period
ended
December
31,
2024,
for
Diversified
Income
Plus
Fund's
investments
in
financial
derivative
instruments
by
primary
risk
exposure.
Derivatives
by
risk
category
Statement
of
Operations
Location
Realized
Gains/(Losses)
recognized
in
Income
Interest
Rate
Contracts
Futures
Net
realized
gains/(losses)
on
Futures
contracts
443,141
Total
Interest
Rate
Contracts
443,141
Equity
Contracts
Futures
Net
realized
gains/(losses)
on
Futures
contracts
7,811,526
Total
Equity
Contracts
7,811,526
Foreign
Exchange
Contracts
Futures
Net
realized
gains/(losses)
on
Futures
contracts
477,672
Total
Foreign
Exchange
Contracts
477,672
Credit
Contracts
Credit
Default
Swaps
Net
realized
gains/(losses)
on
Swap
agreements
(1,035,159)
Total
Credit
Contracts
(1,035,159)
Total
$7,697,180
The
following
table
summarizes
the
change
in
net
unrealized
appreciation/(depreciation)
and
Statement
of
Operations
location,
for
the
period
ended
December
31,
2024,
for
Diversified
Income
Plus
Fund's
investments
in
financial
derivative
instruments
by
primary
risk
exposure.
Derivatives
by
risk
category
Statement
of
Operations
Location
Change
in
unrealized
appreciation/(depreciation)
recognized
in
Income
Foreign
Exchange
Contracts
Futures
Change
in
net
unrealized
appreciation/(depreciation)
on
Futures
contracts
493,715
Total
Foreign
Exchange
Contracts
493,715
Equity
Contracts
Futures
Change
in
net
unrealized
appreciation/(depreciation)
on
Futures
contracts
(963,860)
Total
Return
Swaps
Change
in
net
unrealized
appreciation/(depreciation)
on
Swap
agreements
(7,294)
Total
Equity
Contracts
(971,154)
Interest
Rate
Contracts
Futures
Change
in
net
unrealized
appreciation/(depreciation)
on
Futures
contracts
(386,247)
Total
Interest
Rate
Contracts
(386,247)
Credit
Contracts
Credit
Default
Swaps
Change
in
net
unrealized
appreciation/(depreciation)
on
Swap
agreements
163,618
Total
Credit
Contracts
163,618
Total
($700,068)
The
following
table
presents
Diversified
Income
Plus
Fund's
average
volume
of
derivative
activity
during
the
period
ended
December
31,
2024.
Derivative
Risk
Category
Average
Notional
Value
Equity
Contracts
Futures
-
Long
$72,429,327
Futures
-
Short
(38,861,063)
Total
Return
Swaps
-
Short
(3,979)
Interest
Rate
Contracts
Futures
-
Long
11,187,515
Futures
-
Short
(1,492,742)
Foreign
Exchange
Contracts
Futures
-
Short
(12,191,803)
Credit
Contracts
Credit
Default
Swaps
-
Buy
Protection
(776,144)
Diversified
Income
Plus
Fund
Schedule
of
Investments
as
of
December
31,
2024
The
accompanying
Notes
to
Financial
Statements
are
an
integral
part
of
this
schedule.
Investment
in
Affiliates
Affiliated
issuers,
as
defined
under
the
Investment
Company
Act
of
1940,
include
those
in
which
the
Fund's
holdings
of
an
issuer
represent
5%
or
more
of
the
outstanding
voting
securities
of
an
issuer,
any
affiliated
mutual
fund,
or
a
company
which
is
under
common
ownership
or
control
with
the
Fund.
The
Fund
owns
shares
of
Thrivent
Cash
Management
Trust
for
the
purpose
of
securities
lending
and
Thrivent
Core
Short-Term
Reserve
Fund,
a
series
of
Thrivent
Core
Funds,
primarily
to
serve
as
a
cash
sweep
vehicle
for
the
Fund.
Thrivent
Cash
Management
Trust
and
Thrivent
Core
Funds
are
established
solely
for
investment
by
Thrivent
entities.
A
summary
of
transactions
(in
thousands;
values
shown
as
zero
are
less
than
$500)
for
the
fiscal
year
to
date,
in
Diversified
Income
Plus
Fund,
is
as
follows:
Fund
Value
12/31/2023
Gross
Purchases
Gross
Sales
Value
12/31/2024
Shares
Held
at
12/31/2024
%
of
Net
Assets
12/31/2024
U.S.
Affiliated
Registered
Investment
Companies
Core
Emerging
Markets
Debt
$79,693
$4,784
$9,100
$76,878
9,445
7.9%
Core
International
Equity
11,854
356
2,000
10,415
1,019
1.1
Total
U.S.
Affiliated
Registered
Investment
Companies
91,547
87,293
9.0
Affiliated
Short-Term
Investments
Core
Short-Term
Reserve,
4.730%
42,446
384,306
384,056
42,696
4,270
4.4
Total
Affiliated
Short-Term
Investments
42,446
42,696
4.4
Collateral
Held
for
Securities
Loaned
Cash
Management
Trust-
Collateral
Investment
25,760
221,561
237,379
9,942
9,942
1.0
Total
Collateral
Held
for
Securities
Loaned
25,760
9,942
1.0
Total
Value
$159,753
$139,931
Fund
Net
Realized
Gain/(Loss)
Change
in
Unrealized
Appreciation/
(Depreciation)
Distributions
of
Realized
Capital
Gains
Income
Earned
1/1/2024
-
12/31/2024
U.S.
Affiliated
Registered
Investment
Companies
Core
Emerging
Markets
Debt
($2,009)
$3,510
$–
$4,784
Core
International
Equity
255
(50)
–
356
Affiliated
Short-Term
Investments
Core
Short-Term
Reserve,
4.730%
0
(0)
–
1,943
Total
Income/Non
Cash
Income
from
Affiliated
Investments
$7,083
Collateral
Held
for
Securities
Loaned
Cash
Management
Trust-
Collateral
Investment
–
–
–
125
Total
Affiliated
Income
from
Securities
Loaned,
Net
$125
Total
($1,754)
$3,460
$–
Thrivent
Mutual
Funds
Statement
of
Assets
and
Liabilities
The
accompanying
Notes
to
Financial
Statements
are
an
integral
part
of
this
statement.
As
of
December
31,
2024
Diversified
Income
Plus
Fund
Assets
Investments
in
unaffiliated
securities
at
cost
$822,441,640
Investments
in
affiliated
securities
at
cost
$150,439,000
Investments
in
unaffiliated
securities
at
value
(#)
$846,320,278
Investments
in
affiliated
securities
at
value
139,931,121
Cash
25,321
Dividends
and
interest
receivable
6,004,291
Prepaid
expenses
25,897
Receivable
for:
Investments
sold
231,278
Investments
sold
on
a
delayed-delivery
basis
6,496,957
Fund
shares
sold
294,820
Variation
margin
on
open
future
contracts
60,125
Total
Assets
999,390,088
Liabilities
Distributions
payable
212,568
Accrued
expenses
110,373
Payable
for:
Investments
purchased
468,283
Investments
purchased
on
a
delayed-delivery
basis
11,684,320
Return
of
collateral
for
securities
loaned
9,941,768
Fund
shares
redeemed
627,443
Variation
margin
on
open
future
contracts
281,242
Variation
margin
on
open
swap
contracts
9,599
Investment
advisory
fees
98,380
Administrative
fees
3,182
Distribution
fees
21,124
Transfer
agent
fees
50,821
Trustee
fees
1,025
Trustee
deferred
compensation
65,286
Swap
agreements,
at
value
7,294
Contingent
liabilities(**)
—
Total
Liabilities
23,582,708
Net
Assets
Capital
stock
(beneficial
interest)
1,010,985,197
Distributable
earnings/(accumulated
loss)
(35,177,817)
Total
Net
Assets
$975,807,380
Class
S
Share
Capital
$535,492,192
Shares
of
beneficial
interest
outstanding
(Class
S)
76,757,834
Net
asset
value
per
share
$6.98
Class
A
Share
Capital
$440,315,188
Shares
of
beneficial
interest
outstanding
(Class
A)
62,321,177
Net
asset
value
per
share
$7.07
Maximum
public
offering
price
$7.40
(#)
Includes
securities
on
loan
of
9,636,030
(**)
Contingent
liabilities
accrual. Additional
information
can
be
found
in
the
accompanying
Notes
to
Financial
Statements.
Thrivent
Mutual
Funds
Statement
of
Operations
The
accompanying
Notes
to
Financial
Statements
are
an
integral
part
of
this
statement.
For
the
year
ended
December
31,
2024
Diversified
Income
Plus
Fund
Investment
Income
Dividends
$3,647,511
Taxable
interest
35,854,828
Income
from
mortgage
dollar
rolls
203
Affiliated
income
from
securities
loaned,
net
125,325
Income
from
affiliated
investments
1,942,791
Non
cash
income
718
Non
cash
income
from
affiliated
investments
5,139,990
Foreign
tax
withholding
(5,986)
Total
Investment
Income
46,705,380
Expenses
Adviser
fees
5,213,972
Administrative
service
fees
248,792
Audit
and
legal
fees
46,084
Custody
fees
75,365
Distribution
expenses
Class
A
1,132,561
Insurance
expenses
5,877
Printing
and
postage
expenses
Class
S
82,980
Printing
and
postage
expenses
Class
A
79,297
SEC
and
state
registration
expenses
59,810
Transfer
agent
fees
Class
S
435,244
Transfer
agent
fees
Class
A
333,620
Trustees'
fees
46,869
Other
expenses
121,872
Total
Expenses
Before
Reimbursement
7,882,343
Total
Net
Expenses
7,882,343
Net
Investment
Income/(Loss)
38,823,037
Realized
and
Unrealized
Gains/(Losses)
Net
realized
gains/(losses)
on:
Investments
15,316,268
Affiliated
investments
(1,754,237)
Futures
contracts
8,732,339
Foreign
currency
transactions
(2,130)
Swap
agreements
(1,035,159)
Change
in
net
unrealized
appreciation/(depreciation)
on:
Investments
2,367,822
Affiliated
investments
3,459,618
Futures
contracts
(856,392)
Foreign
currency
transactions
72,772
Swap
agreements
156,324
Net
Realized
and
Unrealized
Gains/(Losses)
26,457,225
Net
Increase/(Decrease)
in
Net
Assets
Resulting
From
Operations
$65,280,262
Thrivent
Mutual
Funds
Statement
of
Changes
in
Net
Assets
The
accompanying
Notes
to
Financial
Statements
are
an
integral
part
of
this
statement.
Diversified
Income
Plus
Fund
For
the
periods
ended
12/31/2024
12/31/2023
Operations
Net
investment
income/(loss)
$38,823,037
$42,230,166
Net
realized
gains/(losses)
21,257,081
(16,777,865)
Change
in
net
unrealized
appreciation/(depreciation)
5,200,144
71,398,731
Net
Change
in
Net
Assets
Resulting
From
Operations
65,280,262
96,851,032
Distributions
to
Shareholders
From
income/realized
gains
Class
S
(22,431,407)
(24,093,292)
From
income/realized
gains
Class
A
(17,439,485)
(19,116,719)
Total
from
income/realized
gains
(39,870,892)
(43,210,011)
Total
Distributions
to
Shareholders
(39,870,892)
(43,210,011)
Capital
Stock
Transactions
Class
S
Sold
81,138,220
75,869,998
Distributions
reinvested
21,622,664
23,295,447
Redeemed
(130,075,278)
(149,704,241)
Total
Class
S
Capital
Stock
Transactions
(27,314,394)
(50,538,796)
Class
A
Sold
17,860,530
16,523,005
Distributions
reinvested
15,989,735
17,579,693
Redeemed
(75,690,553)
(84,206,521)
Total
Class
A
Capital
Stock
Transactions
(41,840,288)
(50,103,823)
Capital
Stock
Transactions
(69,154,682)
(100,642,619)
Net
Increase/(Decrease)
in
Net
Assets
(43,745,312)
(47,001,598)
Net
Assets,
Beginning
of
Period
1,019,552,692
1,066,554,290
Net
Assets,
End
of
Period
$975,807,380
$1,019,552,692
Capital
Stock
Share
Transactions
Class
S
shares
Sold
11,692,871
11,511,700
Distributions
reinvested
3,124,189
3,539,523
Redeemed
(18,813,842)
(22,787,317)
Total
Class
S
share
transactions
(3,996,782)
(7,736,094)
Class
A
shares
Sold
2,540,426
2,480,928
Distributions
reinvested
2,281,782
2,638,782
Redeemed
(10,832,172)
(12,663,664)
Total
Class
A
share
transactions
(6,009,964)
(7,543,954)
Thrivent
Mutual
Funds
Notes
to
Financial
Statements
December
31,
2024
(1)
ORGANIZATION
Thrivent
Mutual
Funds
(the
“Trust”)
was
organized
as
a
Massachusetts
Business
Trust
on
March
10,
1987
and
is
registered
as
an
open-end
management
investment
company
under
the
Investment
Company
Act
of
1940
(the
“1940
Act”).
The
Trust
is
divided
into 23
separate
series
(each,
a
"Fund"
and,
collectively,
the
"Funds"),
each
with
its
own
investment
objective
and
policies.
The
Trust
currently
consists
of
four
asset
allocation
Funds, three
income
plus
Funds, nine
equity
Funds, six
fixed-income
Funds,
and
one
money
market
Fund.
This
report
includes Diversified
Income
Plus, one of
the
Trust’s
23
Funds.
The
other
Funds
of
the
Trust
have
a
fiscal
year-end
of
October
31
and
are
presented
under
a
separate
shareholder
report.
The
Funds
are
each
investment
companies
that
follow
the
accounting
and
reporting
guidance
of
the
Financial
Accounting
Standards
Board
("FASB")
Accounting
Standards
Codification
Topic
946
-
Financial
Services
-
Investment
Companies.
Share
Classes
— The
Trust
may
issue
an
unlimited number
of
shares
in
one
or
more
series
as
the
Board
may
authorize.
The
Trust includes
two
classes
of
shares:
Class
A
and
Class
S
shares.
The
classes
of
shares
differ
principally
in
their
respective
distribution
expenses
and
other
class-specific
expenses
and
arrangements.
Class
A
shares
have
an
annual
12b-1
fee
of
0.25%
of
average
net
assets, a
reduced
fee
of
0.125%
or
no
fee.
For
the
Fund
presented
under
this
shareholder
report,
Class
A
shares
have
an
annual
12b-1
fee
of
0.25%
and a
maximum
front-end
sales
load
of
4.50%.
Class
S
shares
are
offered
at
net
asset
value
and
have
no
annual
12b-1
fees.
The
share
classes
have
identical
rights
to
earnings,
assets
and
voting
privileges,
except
for
class-specific
expenses
and
exclusive
rights
to
vote
on
matters
affecting
only
individual
classes. High
Income
Municipal
Bond, Mid
Cap
Growth, Mid
Cap
Value, and Small
Cap
Growth offer
only
Class
S
Shares; each
of
the
other 19
Funds
of
the
Trust
offer
Class
A
and
Class
S
shares.
Under
the
Trust’s
organizational
documents,
its
officers
and
trustees
are
indemnified
against
certain
liabilities
arising
out
of
the
performance
of
their
duties
to
the
Trust.
In
addition,
in
the
normal
course
of
business,
the
Trust
enters
into
contracts
with
vendors
and
others
that
provide
general
damage
clauses.
The
Trust’s
maximum
exposure
under
these
contracts
is
unknown,
as
this
would
involve
future
claims
that
may
be
made
against
the
Trust.
However,
based
on
experience,
the
Trust
expects
the
risk
of
loss
to
be
remote.
(2)
SIGNIFICANT
ACCOUNTING
POLICIES
Valuation
of
Investments
—
The
Fund
records
its investments
at
fair
value
using
market
quotations
when
they
are
readily
available
pursuant
to
Rule
2a-5.
The
Fund's
investments
are
recorded
at
fair
value
determined
in
good
faith
when
market
quotations
are
not
readily
available.
Securities
traded
on
U.S.
or
foreign
securities
exchanges
or
included
in
a
national
market
system
are
valued
at
the
last
sale
price
on
the
principal
exchange
as
of
the
close
of
regular
trading
on
such
exchange
or
the
official
closing price
of
the
national
market
system.
Over-the-counter
securities
and
listed
securities
for
which
no
price
is
readily
available
are
valued
at
the
current
bid
price
considered
best
to
represent
the
value
at
that
time.
Security
prices
are
based
on
quotes
that
are
obtained
from
an
independent
pricing
service
approved
by
the
Trust’s
Board
of
Trustees
(the
“Board”).
The
pricing
service,
in
determining
values
of
fixed-income
securities,
takes
into
consideration
such
factors
as
current
quotations
by
broker/dealers,
coupon,
maturity,
quality,
type
of
issue,
trading
characteristics,
and
other
yield
and
risk
factors
it
deems
relevant
in
determining
valuations.
Securities
which
cannot
be
valued
by
the
approved
pricing
service
are
valued
using
valuations obtained
from dealers
that
make
markets
in
the
securities.
Exchange-listed
options and
futures
contracts
are
valued
at
the
primary
exchange
settle
price.
Exchange
cleared
swap
agreements
are
valued
at
the
clearinghouse
end
of
day
price.
Swap
agreements
not
cleared
on
exchanges
will
be
valued at
the
mid-price
from
the
primary
approved
pricing
service.
Forward
foreign
currency exchange
contracts
are
marked-to-market
based
upon
foreign
currency
exchange
rates
provided
by the
pricing
service.
Investments
in
open-ended
mutual
funds
are
valued
at
the
net
asset
value
at
the
close
of
each
business
day.
The
Board
has
chosen
the
Fund's
investment
Adviser
as
the
valuation
designee,
responsible
for
daily
valuation
of
the
Fund's
securities.
The
Adviser
has
formed
a Valuation
Committee
(the
“Committee”)
that
is
responsible
for
overseeing
the
Fund's
valuation
policies in
accordance
with
Valuation
Policies
and
Procedures.
The
Committee
meets
on
a
monthly
and
on
an
as-needed
basis
to
review
price
challenges,
price
overrides,
stale
prices,
shadow
prices,
manual
prices,
money
market
pricing,
international
fair
valuation,
and
other
securities
requiring
fair
valuation.
The
Committee
monitors
for
significant
events
occurring
prior
to
the
close
of
trading
on
the
New
York
Stock
Exchange
that
could
have
a
material
impact
on
the
value
of
any
securities
that
are
held
by
the
Fund.
Examples
of
such
events
include
trading
halts,
national
news/events,
and
issuer-specific
developments.
If
the
Committee
decides
that
such
events
warrant
using
fair
value
estimates,
the
Committee
will
take
such
events
into
consideration
in
determining
the
fair
value
of
such
securities.
If
market
quotations
or
prices
are
not
readily
available
or
determined
to
be
unreliable,
the
securities
will
be
valued
at
fair
value
as
determined
in
good
faith
pursuant
to
procedures
adopted
by
the
Board.
In
accordance
with
U.S.
Generally
Accepted
Accounting
Principles
(“GAAP”), the
various
inputs
used
to
determine
the
fair
value
of
the
Fund's
investments
are
summarized
in
three
broad
levels. Level
1
includes
quoted
prices
in
active
markets
for
identical
securities; typically
included
in
this
level
are
U.S.
equity
securities,
futures, options
and
registered
investment
company
funds.
Level
2
includes
other
significant
observable
inputs
such
as
quoted
prices
for
similar
securities,
interest
rates,
prepayment
speeds
and
credit
risk;
typically
included
in
this
level
are
fixed
income
securities,
international
securities,
swaps
and
forward
contracts.
Level
3
includes
significant
unobservable
inputs
such
as
the
Adviser’s
own
assumptions
and
broker
evaluations
in
determining
the
fair
value
of
investments.
The
valuation
levels
are
not
necessarily
an
indication
of
the
risk
associated
with
investing
in
these
securities
or
Thrivent
Mutual
Funds
Notes
to
Financial
Statements
December
31,
2024
other
investments.
Investments
measured
using
net
asset
value
per
share
as
a
practical
expedient
for
fair
value
and
that
are
not
publicly
available-for-sale
are
not
categorized
within
the
fair
value
hierarchy.
Valuation
of
International
Securities
—
The
Fund
values
certain
foreign
securities
traded
on
foreign
exchanges
that
close
prior
to
the
close of
the
New
York
Stock
Exchange
using
a
fair
value
pricing
service.
The
fair
value
pricing
service
uses
a
multi-factor
model
that
may
take
into
account
the
local
close,
relevant
general
and
sector
indices,
currency
fluctuation,
prices
of
other
securities
(including
ADRs,
New
York
registered
shares,
and
ETFs),
and
futures,
as
applicable,
to
determine
price
adjustments
for
each
security
in
order
to
reflect
the
effects
of
post-closing
events.
The
Board
has
authorized
the
Adviser
to
make
fair
valuation
determinations
pursuant
to
policies
approved
by
the
Board.
Foreign
Currency
Translation
—
The
accounting
records
of the
Fund
are
maintained
in
U.S.
dollars.
Securities
and
other
assets
and
liabilities
that
are
denominated
in
foreign
currencies
are
translated
into
U.S.
dollars
at
the
daily
closing
rates
of
exchange.
Foreign
currency
amounts
related
to
the
purchase
or
sale
of
securities
and
income
and
expenses
are
translated
at
the
exchange
rate
on
the
transaction
date.
Net
realized
and
unrealized
currency
gains
and
losses
are
recorded
from
closed currency
contracts,
disposition
of foreign
currencies,
exchange
gains
or
losses
between
the
trade
date
and
settlement
date
on
securities
transactions,
and
other
translation
gains
or
losses
on
dividends,
interest
income
and
foreign
withholding
taxes.
The
Fund
does
not
separately
report
the
effect
of
changes
in
foreign
exchange
rates
from
changes
in prices
on
securities
held.
Such
changes
are
included
in
net
realized
and
unrealized
gain
or
loss
from
investments
in
the
Statement
of
Operations.
For
federal
income
tax
purposes,
the
Fund
treats
the
effect
of
changes
in
foreign
exchange
rates
arising
from
actual
foreign
currency
transactions
and
the
changes
in
foreign
exchange
rates
between
the
trade
date
and
settlement
date
as
ordinary
income.
Federal
Income
Taxes
—
No
provision
has
been
made
for
income
taxes
because
the Fund’s
policy
is
to
qualify
as
a
regulated
investment
company
under
the
Internal
Revenue
Code
and
distribute
substantially
all
investment
company
taxable
income
and
net
capital
gain
on
a
timely
basis.
It
is
also
the
intention
of the
Fund
to
distribute
an
amount
sufficient
to
avoid
imposition
of
any
federal
excise
tax.
The
Fund,
accordingly,
anticipates
paying
no
federal
taxes
and
no
federal
tax
provision
was
recorded.
Each
Fund
is
treated
as
a
separate
taxable
entity
for
federal
income
tax
purposes. The
Fund
may
utilize
earnings
and
profits
distributed
to
shareholders
on
the
redemption
of
shares
as
part
of
the
dividends
paid
deduction.
GAAP
requires
management
of
the
Fund
(i.e.,
the
Adviser)
to
make
additional
tax
disclosures
with
respect
to
the
tax
effects
of
certain
income
tax
positions,
whether
those
positions
were
taken
on
previously
filed
tax
returns
or
are
expected
to
be
taken
on
future
returns.
These
positions
must
meet
a
“more
likely
than
not”
standard
that,
based
on
the
technical
merits
of
the
position, it
would
have
a
greater
than
50
percent
likelihood
of
being
sustained
upon
examination.
In
evaluating
whether
a
tax
position
has
met
the
more-
likely-than-not
recognition
threshold,
the
Adviser
must
presume
that
the
position
will
be
examined
by
the
appropriate
taxing
authority
that
has
full
knowledge
of
all
relevant
information.
The
Adviser
analyzed
all
open
tax
years,
as
defined
by
the
statute
of
limitations,
for
all
major
jurisdictions.
Open
tax
years
are
those
that
are
open
for
examination
by
taxing
authorities.
Major
jurisdictions
for
the
Fund
include
U.S.
Federal
and
certain
state
jurisdictions
as
well
as
certain
foreign
countries.
The
Fund's
federal
income
tax
returns
are
subject
to
examination
for
a
period
of
three
years
after
the
filing
of
the
return
for
the
tax
period.
State
returns
may
be
subject
to
examination
for
an
additional
year
depending
on
the
jurisdiction.
The
Fund
has
no
examinations
in
progress
and
none
are
expected
at
this
time.
As
of
December
31,
2024,
the
Adviser
has
reviewed
all
open
tax
years
and
major
jurisdictions
and
concluded
that
there
is
no
effect
to
the
Fund's
tax
liability,
financial
position
or
results
of
operations.
There
is
no
tax
liability
resulting
from
unrecognized
tax
benefits
related
to
uncertain
income
tax
positions
taken
or
expected
to
be
taken
in
future
tax
returns.
The
Fund
is also
not
aware
of
any
tax
positions
for
which
it
is
reasonably
possible
that
the
total
amounts
of
unrecognized
tax
benefits
will
significantly
change
in
the
next
12
months.
Foreign
Income
Taxes
— Funds
are
subject
to
foreign
income
taxes
imposed
by
certain
countries
in
which
they
invest.
Withholding
taxes
on
foreign
dividends
have
been
provided
for
in
accordance
with
the
applicable
country’s
tax
rules
and
rates.
These
amounts
are
shown
as
foreign tax
withholding
in
the
Statement
of
Operations.
The
Fund
pays
tax
on
foreign
capital
gains,
where
applicable.
Taxes
paid
on
foreign
capital
gains, if
any,
are
included
in
the
net
realized
gains/(losses)
on
investments
on
the
Statement
of
Operations.
Expenses
and
Income
—
Estimated
expenses
are
accrued
daily.
The
Fund
is charged
for
those
expenses
that
are
directly
attributable
to
it.
Expenses
that
are
not
directly
attributable
to the
Fund
are
allocated
among
all
appropriate
Funds
in
proportion
to
their
respective
net
assets
or number
of
shareholder
accounts,
or
other
reasonable
basis.
Net
investment
income,
expenses
which
are
not
class-specific,
and
realized
and
unrealized
gains
and
losses
are
allocated
directly
to
each
class
based
upon
the
relative
net
asset
value
of
outstanding
shares.
Interest
income
is
recorded daily
on
all
debt
securities,
as
is accretion
of
market
discount
and
original
issue
discount
and
amortization
of
premium.
Paydown
gains
and
losses
on
mortgage-
backed
and
asset-backed
securities
are
recorded
as
components
of
interest
income.
Dividend
income
and
capital
gain
distributions
are
recorded
on
the
ex-dividend
date.
However, certain
dividends
from
foreign
securities
are
recorded
as
soon
as
the
information
is
available
to
the
Fund.
Non-cash
income,
if
any,
is
recorded
at
the
fair
market
value
of
the
securities
received.
Thrivent
Mutual
Funds
Notes
to
Financial
Statements
December
31,
2024
For
certain
securities,
including
real
estate
investment
trusts,
the Fund
records
distributions
received
in
excess
of
income
as
a
reduction
of
cost
of
investments
and/or
realized
gain.
Such
amounts
are
based
on
estimates
if
actual
amounts
are
not
available.
Actual
amounts
of
income,
realized
gain
and
return
of
capital
may
differ
from
the
estimated
amounts.
The Fund
adjusts
the
estimated
amounts
of
the
components
of
distributions
as
adjustments
to
investment
income,
unrealized
appreciation/depreciation
and
realized
gain/loss
on
investments
as
necessary,
once
the
issuers
provide
information
about
the
actual
composition
of
the
distributions.
Distributions
to
Shareholders
—
Net
investment
income
is
distributed
to
each
shareholder
as
a
dividend.
Dividends
from
Diversified
Income
Plus
are
declared
and
paid
monthly. It
is
possible
that
such
dividends
may
be
reclassified
as
return
of
capital
or
capital
gains
after
year
end.
Such
determination
cannot
be
made
until
tax
information
is
received
from
the
real
estate
investments
of
the
Fund.
Net
realized
gains
from
securities
transactions,
if
any,
are
paid
at
least
annually
after
the
close
of
the
fiscal
year.
In
addition,
the
Fund
may
claim
a
portion
of
the
payment
made
to redeeming
shareholders
as
a
distribution
for
income
tax
purposes.
Derivative
Financial
Instruments
— The Fund may
invest
in
derivatives,
a
category
that
includes
options,
futures,
swaps,
foreign
currency
forward
contracts and
hybrid
instruments.
Derivatives
are
financial
instruments
whose
value
is
derived
from
another
security,
an
index
or
a
currency. The Fund
may
use
derivatives
for
hedging
(attempting
to
offset
a
potential
loss
in
one
position
by
establishing
an
interest
in
an
opposite
position).
This
includes
the
use
of
currency-
based
derivatives
to
manage
the
risk
of
its
positions in
foreign
securities.
The
Fund
may
also
use
derivatives
for
replication
of
a
certain
asset
class
or
speculation
(investing
for
potential
income
or
capital
gain).
These
contracts
may
be
transacted
on
an
exchange
or
over-the-counter
("OTC").
A
derivative
may
incur
a loss
if
the
value
of
the
derivative
decreases
due
to
an
unfavorable
change
in
the
market
rates
or
values
of
the
underlying
derivative.
Losses
can
also
occur
if
the
counterparty
does
not
perform
under
the
derivative
contract.
A
Fund’s
risk
of
loss
from
the
counterparty
credit
risk
on
OTC
derivatives
is
generally
limited
to
the
aggregate
unrealized
gain
netted
against
any
collateral
held
by
such
Fund.
With
exchange
traded
futures
and
centrally
cleared
swaps,
there
is
minimal
counterparty
credit
risk
to
the
Fund
because
the
exchange’s
clearinghouse,
as
counterparty
to
such
derivatives,
guarantees
against
a
possible
default.
The
clearinghouse
stands
between
the
buyer
and
the
seller
of
the
derivative;
thus,
the
credit
risk
is
limited
to
the
failure
of
the
clearinghouse.
However,
credit
risk
still
exists
in
exchange
traded
futures
and
centrally
cleared
swaps
with
respect
to
initial
and
variation
margin
that
is
held
in
a
broker’s
customer
accounts.
While
brokers
are
required
to
segregate
customer
margin
from
their
own
assets,
in
the
event
that
a
broker
becomes
insolvent
or
goes
into
bankruptcy
and
at
that
time
there
is
a
shortfall
in
the
aggregate
amount
of
margin
held
by
the
broker
for
all
its
clients,
U.S.
bankruptcy
laws
will
typically
allocate
that
shortfall
on
a
pro-rata
basis
across
all
of
the
broker’s
customers,
potentially
resulting
in
losses
to
the
Fund.
Using
derivatives
to
hedge
can
guard
against
potential
risks,
but
it
also
adds
to
the
Fund's
expenses
and
can
eliminate
some
opportunities
for
gains.
In
addition,
a
derivative
used
for
mitigating
exposure
or
replication
may
not
accurately
track
the
value
of
the
underlying
asset.
Another
risk
with
derivatives
is
that
some
types
can
amplify
a
gain
or
loss,
potentially
earning
or
losing
substantially
more
money
than
the
actual
cost
of
the
derivative.
In
order
to
define
their
contractual
rights
and
to
secure
rights
that
will
help
the
Fund
mitigate its
counterparty
risk,
the
Fund
may
enter
into
an
International
Swaps
and
Derivatives
Association,
Inc.
Master
Agreement
(“ISDA
Master
Agreement”)
or
similar
agreement
with derivative
contract
counterparties.
An
ISDA
Master
Agreement
is
a
bilateral
agreement
between
a
Fund
and
a
counterparty
that
governs
OTC
derivatives
and
foreign
exchange
contracts
and
typically
includes,
among
other
things,
collateral
posting
terms
and
netting
provisions
in
the
event
of
a
default
and/or
termination
event.
Under
an
ISDA
Master
Agreement, the
Fund
may,
under
certain
circumstances,
offset
with
the
counterparty
certain
derivatives'
payables
and/or
receivables
with
collateral
held
and/or
posted
and
create
one
single
net
payment.
The
provisions
of
the
ISDA
Master
Agreement
typically
permit
a
single
net
payment
in
the
event
of
a
default
(close-out
netting)
including
the
bankruptcy
or
insolvency
of
the
counterparty.
Note,
however,
that
bankruptcy
and
insolvency
laws
of
a
particular
jurisdiction
may
impose
restrictions
on
or
prohibitions
against
the
right
of
offset
in
bankruptcy,
insolvency
or
other
events.
Collateral
and
margin
requirements
vary
by
type
of
derivative.
Margin
requirements
are
established
by
the
broker
or
clearinghouse
for
exchange
traded
and
centrally
cleared
derivatives
(futures,
options,
and
centrally
cleared
swaps).
Brokers
can
ask
for
margining
in
excess
of
the
minimum requirements in
certain
situations.
Collateral
terms
are
contract
specific
for
OTC
derivatives
(foreign
currency
exchange
contracts,
options
and
swaps).
For
derivatives
traded
under
an
ISDA
Master
Agreement,
the
collateral
requirements
are
typically
calculated
by
netting
the
mark
to
market
amount
for
each
transaction
under
such
agreement
and
comparing
that
amount
to
the
value
of
any
collateral
currently
pledged
by
the
Fund
and
the
counterparty.
For
financial
reporting
purposes,
non-cash
collateral
that
has
been
pledged
to
cover
obligations
of
the
Fund
has
been
noted
in
the
Schedule
of
Investments.
To
the
extent
amounts
due
to a
Fund
from
its
counterparties
are
not
fully
collateralized,
contractually
or
otherwise,
the
Fund
bears
the
risk
of
loss
from
counterparty
nonperformance.
The
Fund
attempts
to
mitigate
counterparty
risk
by
only
entering
into
agreements
with
counterparties
that it
believes
has
the
financial
resources
to
honor
their
obligations
and
by
monitoring
the
financial
stability
of
those
counterparties.
Futures
Contracts
— The
Fund
may
use
futures
contracts
to
manage
the
exposure
to
interest
rate
and
market
or
currency
fluctuations.
Gains
or
losses
on
futures
contracts
can
offset
changes
in
the
yield
of
securities.
When
a
futures
contract
is
opened,
cash
or
other
investments
equal
to
the
required
“initial
margin
deposit”
are
held
on
deposit
with
and
pledged
to
the
broker.
Additional
securities
held
by
the
Fund
may
be
earmarked
to
cover
open
futures
contracts. A
futures
contract’s
daily
change
in
value
(“variation
margin”)
is
either
paid
to
or
received
from
the
broker,
Thrivent
Mutual
Funds
Notes
to
Financial
Statements
December
31,
2024
and
is
recorded
as
an
unrealized
gain
or
loss.
When
the
contract
is
closed,
realized
gain
or
loss
is
recorded
equal
to
the
difference
between
the
value
of
the
contract
when
opened
and
the
value
of
the
contract
when
closed.
Futures
contracts
involve,
to
varying
degrees,
risk
of
loss
in
excess
of
the
variation
margin
disclosed
in
the
Statement
of
Assets
and
Liabilities.
Exchange-traded
futures
have
no
significant
counterparty
risk
as
the
exchange
guarantees
the
contracts
against
default.
During
the year
ended
December
31,
2024,
Diversified
Income
Plus used
treasury
futures
to
manage
the
duration
and
yield
curve
exposure
of
the
respective
Fund
versus its
benchmark.
During
the year
ended
December
31,
2024,
Diversified
Income
Plus
used
equity
futures
to
manage
exposure
to
the
equities
market.
During
the
year
ended
December
31,
2024,
Diversified
Income
Plus
used
foreign
exchange
futures
to
hedge
the
currency
risk.
Swap
Agreements
—
The
Fund may
enter
into
swap
transactions,
which
involve
swapping
one
or
more
investment
characteristics
of
a
security
or
a
basket
of
securities
with
another
party.
Such
transactions
include
market
risk,
risk
of
default
by
the
other
party
to
the
transaction,
risk
of
imperfect
correlation
and
manager
risk
and
may
involve
commissions
or
other
costs.
Swap
transactions
generally
do
not
involve
delivery
of
securities,
other
underlying
assets
or
principal.
Accordingly,
the
risk
of
loss
with
respect
to
swap
transactions
is
generally
limited
to
the
net
amount
of
payments
that
the
Fund
is
contractually
obligated
to
make,
or
in
the
case
of
the
counterparty
defaulting,
the
net
amount
of
payments
that
the
Fund
is
contractually
entitled
to
receive.
Risks
of
loss
may
exceed
amounts
recognized
on
the
Statement
of
Assets
and
Liabilities.
If
there
is
a
default
by
the
counterparty,
the
Fund
may
have
contractual
remedies
pursuant
to
the
agreements
related
to
the
transaction.
The
contracts
are
valued
daily
and
unrealized
appreciation
or
depreciation
is
recorded.
Swap
agreements
are
valued
at
the
clearinghouse
end
of
day
prices
as
furnished
by
an
independent
pricing
service.
The
pricing
service
takes
into
account
such
factors
as
swap
curves,
default
probabilities,
recent
trades,
recovery
rates
and
other
factors
it
deems
relevant
in
determining
valuations.
Daily
fluctuations
in
the
value
of
the
centrally
cleared
credit
default
contracts
are
recorded
in
variation
margin
in
the
Statement
of
Assets
and
Liabilities
and
recorded
as
unrealized
gain
or
loss.
The
Fund
accrues
for
the
periodic
payment
and
amortizes
upfront
payments,
if
any,
on
swap
agreements
on
a
daily
basis
with
the
net
amount
recorded
as
realized
gains
or
losses
in
the
Statement
of
Operations.
Receipts
and
payments
received
or
made
as
a
result
of
a
credit
event
or
termination
of
the
contract
are
also
recognized
as
realized
gains
or
losses
in
the
Statement
of
Operations.
Collateral,
in
the
form
of
cash
or
securities,
may
be
required
to
be
held
with
the
Fund’s
custodian,
or
a
third
party,
in
connection
with
these
agreements.
Certain
swap
agreements
are
over-the-counter.
In
these
types
of
transactions,
the
Fund
is
exposed
to
counterparty
risk,
which
is
the
discounted
net
amount
of
payments
owed
to
the
Fund.
This
risk
is
partially
mitigated
by
the
Fund’s
collateral
posting
requirements.
As
the
swap
increases
in
value
to
the
Fund,
the
Fund
receives
collateral
from
the
counterparty.
Certain
interest
rate
and
credit
default
index
swaps
must
be
cleared
through
a
clearinghouse
or
central
counterparty.
Credit
Default
Swaps
—
A
credit
default
swap
("CDS") is
a
swap
agreement
between
two
parties
to
exchange
the
credit
risk
of
a
particular
issuer,
basket
of
securities
or
reference
entity.
In
a
CDS
transaction,
a
buyer
pays
periodic
fees
in
return
for
payment
by
the
seller
which
is
contingent
upon
an
adverse
credit
event
occurring
in
the
underlying
issuer
or
reference
entity.
The
seller
collects
periodic
fees
from
the
buyer
and
profits
if
the
credit
of
the
underlying
issuer
or
reference
entity
remains
stable
or
improves
while
the
swap
is
outstanding,
but
the
seller
in
a
CDS
contract
would
be
required
to
pay
the
amount
of
credit
loss,
determined
as
specified
in
the
agreement,
to
the
buyer
in
the
event
of
an
adverse
credit
event
in
the
reference
entity.
A
buyer
of
a
CDS
is
said
to
buy
protection
whereas
a
seller
of
a
CDS
is
said
to
sell
protection.
The
Fund
may
be
either
the
protection
seller
or
the
protection
buyer.
Certain
Funds
enter
into
credit
default
derivative
contracts
directly
through
CDSs or
through
credit
default
swap
indices
("CDX
Indices").
CDX
Indices
are
static
pools
of
equally
weighted
CDSs
referencing
corporate
bonds
and/or
loans
designed
to
increase
or
decrease
diversified
credit
exposure
to
these
asset
classes.
Funds
sell
default
protection
and
assume
long-risk
positions
in
individual
credits
or
indices.
Index
positions
are
entered
into
to
gain
exposure
to
the
corporate
bond
and/or
loan
markets
in
a
cost-efficient
and
diversified
structure.
In
the
event
that
a
position
defaults,
by
going
into
bankruptcy
and
failing
to
pay
interest
or
principal
on
borrowed
money,
within
any CDX
Indices
held,
the
maximum
potential
amount
of
future
payments
required
would
be
equal
to
the
pro-rata
share
of
that
position
within
the
index
based
on
the
notional
amount
of
the
index.
In
the
event
of
a
default
under
a
CDS
contract,
the
maximum
potential
amount
of
future
payments
would
be
the
notional
amount.
Funds
buy
default
protection
in
order
to
reduce
their
overall
credit
exposure
to
the
corporate
bond
and/or
loan
markets
in
a
cost-
efficient
and
diversified
structure.
If
a
default
event
as
specified
in
the
CDS
reference
entity
agreement
occurs,
the
Fund
has
the
option
to
receive
a
cash
payment
in
exchange
for
the
credit
loss
of
the
reference
entity
obligation
as
of
the
date
of
the
credit
event.
A
realized
gain
or
loss
is
recorded
upon
a
default
event
or
the
maturity
or
termination
of
the
CDS
agreement.
For
CDS,
the
default
events
could
be
bankruptcy
and
failing
to
pay
interest
or
principal
on
borrowed
money
or
a
restructuring.
A
restructuring
is
a
change
in
the
underlying
obligations
which
could
include
a
reduction
in
interest
or
principal,
maturity
extension
and
subordination
to
other
obligations.
During
the year
ended
December
31,
2024,
Diversified
Income
Plus
used
CDX
Indices
(comprised
of
CDSs)
to
help
manage
credit
risk
exposures
within
the
Fund.
Total Return
Swaps
—
A
total return
swap
is
a
swap
agreement
between
two
parties
to
exchange
the
total
return
of
a
particular
Thrivent
Mutual
Funds
Notes
to
Financial
Statements
December
31,
2024
reference
asset.
A
total
return
swap
involves
commitments
to
pay
interest
in
exchange
for
a
market
linked
return
based
on
a
notional
amount.
To
the
extent
that
the
total
return
of
the
security,
group
of
securities,
or
index
underlying
the
transactions
exceeds
or
fall
short
of
the
offsetting
interest
obligation,
the
Funds
will
receive
a
payment
from
or
make
a
payment
to
the
counterparty.
The
Funds
may
take
a
"long"
or
"short"
position
with
respect
to
the
underlying
referenced
asset.
During
the
year
ended December
31,
2024,
Diversified
Income
Plus
used
total return
swaps
to
achieve
exposure
to
asset
classes
where
liquid
futures
contracts
do
not
exist
or
where
pricing
of
the
swap
contract
is
more
attractive
than
the
futures
contract.
For
financial
reporting
purposes,
the
Fund
does
not
offset
derivative
assets
and
derivative
liabilities
that
are
subject
to
netting
arrangements
in
the
Statement
of
Assets
and
Liabilities.
The
amounts
presented
in
the
table
below
are
offset
first
by
financial
instruments
that
have
the
right
to
offset
under
master
netting
or
similar
arrangements,
then
any
remaining
amount
is
reduced
by
cash
and
non-cash
collateral
received/pledged.
The
actual
amounts
of
collateral
may
be
greater
than
the
amounts
presented
in
the
table.
The
following
table
presents
the
gross
and
net
information
about
liabilities
subject
to
master
netting
arrangements,
as
presented
in
the
Statement
of
Assets
and
Liabilities:
Mortgage
Dollar
Roll
Transactions
—
Certain
Funds
enter
into
dollar
roll
transactions
on
securities
issued
or
to
be
issued
by
the
Government
National
Mortgage
Association,
Federal
National
Mortgage
Association
and
Federal
Home
Loan
Mortgage
Corporation,
in
which
the
Funds
sell
mortgage
securities
and
simultaneously
agree
to
repurchase
similar
(same
type
and
coupon)
securities
at
a
later
date
at
an
agreed
upon
price.
The
Funds
must
maintain
liquid
securities
having
a
value
at
least
equal
to
the
repurchase
price
(including
accrued
interest)
for
such
dollar
rolls.
In
addition,
the
Funds
are
required
to segregate
collateral
with the
fund
custodian (depending
on
market
movements)
on
their
mortgage
dollar
rolls.
The
value
of
the
securities
that
the
Funds
are
required
to
purchase
may
decline
below
the
agreed
upon
repurchase
price
of
those
securities.
During
the
period
between
the
sale
and
repurchase,
the
Funds
forgo
principal
and
interest
paid
on
the
mortgage
securities
sold.
The
Funds
are
compensated
from
negotiated
fees
paid
by
brokers
offered
as
an
inducement
to
the
Funds
to
"roll
over"
their
purchase
commitments,
thus
enhancing
the
yield.
Mortgage
dollar
rolls
may
be
renewed
with
a
new
purchase
and
repurchase
price
and
a
cash
settlement
made
on
settlement
date
without
physical
delivery
of
the
securities
subject
to
the
contract.
These
purchase
and
sale
transactions
may
increase
portfolio
turnover
rate.
The
fees
received
are
recognized
over
the
roll
period
and
are
included
in
Income
from
mortgage
dollar
rolls
in
the
Statement
of
Operations.
Securities
Lending
—
The
Trust
has
entered
into
a
Securities
Lending
Agreement
(the
“Agreement”)
with
Goldman
Sachs
Bank
USA
doing
business
as
Goldman
Sachs Agency
Lending ("GSAL"). The
Agreement
authorizes
GSAL
to
lend
securities
to
authorized
borrowers
on
behalf
of
the
Fund.
Pursuant
to
the
Agreement, loaned
securities
are
typically
initially
collateralized equal
to
at
least
102%
of
the
market
value
of U.S.
securities
and
105% of
the
market
value
of non-U.S.
securities.
Daily
market
fluctuations
could
cause
the
value
of
loaned
securities
to
be
more
or
less
than
the
value
of
the
collateral
received.
Any
additional
collateral
is
adjusted
and
settled
on
the
next
business
day.
The
Trust
has
the
ability
to
recall
the
loans
at
any
time
and
could
do
so
in
order
to
vote
proxies
or
sell
the
loaned
securities.
All
cash
collateral
received
is
invested
in
Thrivent
Cash
Management
Trust.
The
Fund
receives dividends
and
interest
that would
have
been
earned
on
the
securities
loaned
while
simultaneously
seeking
to
earn
income
on
the
investment
of
cash
collateral.
Amounts
earned
on
investments
in
Thrivent
Cash
Management
Trust,
net
of
rebates,
fees
paid
to
GSAL
for
services
provided
and
any
other
securities
lending
expenses,
are
included
in
affiliated
income
from
securities
loaned,
net on
the
Statement
of
Operations.
By
investing
any
cash
collateral
it
receives
in
these
transactions, the
Fund
could
realize
additional
gains
or
losses.
If
the
borrower
fails
to
return
the
securities
or
the
invested
collateral
has
declined
in
value, the
Fund
could
lose
money.
Generally,
in
the
event
of
borrower
default, the Fund
has
the
right
to
use
the
collateral
to
offset
any
losses
incurred.
However,
in
the
event the
Fund
is
delayed
or
prevented
from
exercising
its
right
to
dispose
of
the
collateral,
there
may
be
a
potential
loss.
Some
of
these
losses
may
be
indemnified
by
the
lending
agent.
When-Issued
and
Delayed-Delivery
Transactions
— The
Fund
may
purchase
or
sell
securities
on
a
when-issued
or
delayed-
delivery
basis.
These
transactions
involve
a
commitment
by the
Gross
Amounts
Not
Offset
in
the
Statement
of
Assets
and
Liabilities
Fund
Gross
Amounts
of
Recognized
Liabilities
Gross
Amounts
Offset
Net
Amounts
of
Recognized
Liabilities
Financial
Instruments
Cash
Collateral
Pledged
Non-Cash
Collateral
Pledged
(**)
Net
Amount
Diversified
Income
Plus
Total
Return
swap
7,294
–
7,294
–
–
–
7,294
(#)
(**)
Excess
of
collateral
pledged
to
the
counterparty
may
not
be
shown
for
financial
reporting
purposes.
(#)
Net
total
return
swap
amounts
represent
the
net
amount
payable
to
the
counterparty
in
the
event
of
a
default.
Thrivent
Mutual
Funds
Notes
to
Financial
Statements
December
31,
2024
Fund
to
purchase
or
sell
securities
for
a
predetermined
price
or
yield,
with
payment
and
delivery
taking
place
beyond
the
customary
settlement
period.
When
delayed-delivery
purchases
are
outstanding, the
Fund
will
designate
liquid
assets
in
an
amount
sufficient
to
meet
the
purchase
price.
When
purchasing
a
security
on
a
delayed-delivery
basis, the
Fund
assumes
the
rights
and
risks
of
ownership
of
the
security,
including
the
risk
of
price
and
yield
fluctuations,
and
takes
such
fluctuations
into
account
when
determining
its
net
asset
value. The
Fund
may
dispose
of
a
delayed-delivery
transaction
after
it
is
entered
into,
and
may
sell
when-issued
securities
before
they
are
delivered,
which
may
result
in
a
capital
gain
or
loss.
When the
Fund
has
sold
a
security
on
a
delayed-delivery
basis, the
Fund
does
not
participate
in
future
gains
and
losses
with
respect
to
the
security.
Treasury
Inflation
Protected
Securities
— The
Fund
may
invest
in
treasury
inflation
protected
securities
("TIPS").
These
securities
are
fixed
income
securities
whose
principal
value
is
periodically
adjusted
to
the
rate
of
inflation.
The
coupon
interest
rate
is
generally
fixed
at
issuance.
Interest
is
paid
based
on
the
principal
value,
which
is
adjusted
for
inflation.
Any
increase
in
the
principal
amount
will
be
included
as
taxable
interest
in
the
Statement
of
Operations
and
received
in
cash
upon
maturity
or
sale
of
the
security.
Stripped
Securities
—
Certain
Funds
may
invest
in
interest
only
and
principal
only
stripped
mortgage
or
asset
backed
securities.
These
securities
represent
a
participation
in
securities
that
are
structured
in
classes
with
rights
to
receive
different
portions
of
the
interest
and
principal.
Interest
only
securities
receive
all
the
interest,
and
principal
only
securities
receive
all
the
principal.
Interest
only
securities
are
particularly
sensitive
to
changes
in
interest
rates
and
therefore
are
subject
to
greater
fluctuation
in
prices
than
typical
interest
bearing
debt
securities.
As
interest
rates
rise,
the
value
of
the
interest
only
security
increases.
Similarly,
as
interest
rates
decrease,
the
value
of
the
interest
only
security
decreases. If
the
underlying
pool
of
mortgages
or
assets
experience
greater
than
anticipated
prepayments
of
principal, a
Fund
may
not
fully
recoup
its
initial
investment
in
an
interest
only
security.
Principal
only
securities
increase
in
value
if
prepayments
are
greater
than
anticipated
and
decline
if
prepayments
are
slower
than
anticipated.
The
market
value
of
these
securities
is
also
highly
sensitive
to
changes
in
interest
rates.
As
interest
rates
increase,
the
price
of
the
principal
only
security
decreases.
Similarly,
as
interest
rates
decrease,
the
price
of
the
principal
only
security
increases.
The
principal
only
security
represents
the
payment
with
the
longest
maturity,
therefore
making
it
the
most
sensitive
to
interest
rate
changes.
Accounting
Estimates
—
The
preparation
of
financial
statements
in
conformity
with
GAAP
requires
management
to
make
estimates
and
assumptions
that
affect
the
reported
amounts
of
assets
and
liabilities
and
disclosure
of
contingent
assets
and
liabilities
at
the
date
of
the
financial
statements
and
the
reported
amounts
of
income
and
expenses
during
the
reporting
period.
Actual
results
could
differ
from
those
estimates.
Contingent
Liabilities
—
In
the
event
of
adversary
action
proceedings
where the
Fund
is
a
defendant,
a
loss
contingency
will
not
be
accrued
as
a
liability
until
the
amount
of
potential
damages
and
the
likelihood
of
loss
can
be
reasonably
estimated.
For
the year
ended
December
31,
2024, the
Fund
did
not
report
an
accrual
for contingent
liabilities.
Litigation
—
Awards
from
class
action
litigation
are
recorded
as
a
reduction
of
cost
if
the
Fund
still
owns
the
applicable
securities
on
the
payment
date.
If
the
Fund
no
longer
owns
the
applicable
securities,
the
proceeds
are
recorded
as
realized
gains.
Bank Loans
(Leveraged Loans)
—
Certain
Funds
may
invest
in
bank
loans,
which
are
senior
secured
loans
that
are
made
by
banks
or
other
lending
institutions
to
companies
that
are
typically
rated
below
investment
grade.
A Fund
may
invest
in
multiple
series
or
tranches
of
a
bank
loan,
with
varying
terms
and
different
associated
risks.
Transactions
in
bank
loan
securities
may
settle
on
a
delayed
basis,
which
may
result
in
the
proceeds
of
the
sale
to
not
be
readily
available
for
a Fund
to
make
additional
investments.
Interest
rates
of
bank
loan
securities
typically
reset
periodically,
as
the
rates
are
tied
to
a
reference
index
rate,
plus
a
premium.
Income
is
recorded
daily
on
bank
loan
securities.
On
an
ongoing
basis,
a Fund
may
receive
a
commitment
fee
based
on
the
undrawn
portion
of
the
underlying
line
of
credit
of
the
bank
loan.
This
commitment
fee
is
accrued
as
income
over
the
term
of
the
bank
loan.
A Fund
may
receive
consent
and
amendment
fees
for
accepting
an
amendment
to
the
current
terms
of
a
bank
loan.
Consent
and
amendment
fees
are
accrued
as
income
when
the
changes
to
the
bank
loan
are
immaterial
and
to
capital
when
the
changes
are
material.
All
or
a
portion
of
these
bank
loan
commitments
may
be
unfunded.
A
Fund
is
obligated
to
fund
these
commitments
at
the
borrower’s
discretion.
Therefore,
the
Fund
must
have
funds
sufficient
to
cover
its
contractual
obligation.
These
unfunded
bank
loan
commitments,
which
are
marked-to-market
daily,
are
presented
in
the
Schedule
of
Investments
and
included
in
Payable
for
investments
purchased
on
a
delayed-delivery
basis
on
the
Statement
of
Assets
and
Liabilities.
Line
of
Credit
— The
Fund, along
with
other
portfolios
managed
by
the
investment
adviser
or
an
affiliate,
participates
in
a
$100
million
($50
million
committed,
$50
million
uncommitted)
credit
facility
(the
"line
of
credit")
issued
by
State
Street
Bank
and
Trust
Company,
to
be
utilized
for
temporary
or
emergency
purposes
to
fund
shareholder
redemptions
or
for
other
short-term
liquidity
purposes.
Interest
is
charged
to
each
participating
Fund based
on
its
borrowings
at
the
higher
of
the
Federal
Funds
Effective Rate
or
the Overnight
Funding
Rate
plus,
in
each
case,
0.10%
plus
a
margin
of 1.25%.
Each
borrowing
under
the
line
of
credit
matures
no
later
than
30
calendar
days
after
the
date
of
the
borrowing.
Each
participating
Fund
pays
a commitment
fee
in
proportion
to
their
respective
net
assets.
The
line
of
credit
shall
expire
on
December
16,
2025
unless
extended
by
mutual
agreement
of
State
Street
Bank
and
Trust
Company
and
the
Funds.
The
Fund
had
no
borrowings
during
the year
ended
December
31,
2024.
Thrivent
Mutual
Funds
Notes
to
Financial
Statements
December
31,
2024
Recent
Accounting
Pronouncements
—
Accounting
Standards
Update
2023-07,
Segment
Reporting
(Topic
280)
-
Improvements
to
Reportable
Segment
Disclosures
In
this
reporting
period,
the
Funds
adopted
FASB
Accounting
Standards
Update
("ASU")
2023-07,
Segment
Reporting
(Topic
280)
-
Improvements
to
Reportable
Segment
Disclosures
("ASU
2023-
07").
Adoption
of
the
new
standard
impacted
financial
statement
disclosures
only
and
did
not
affect
the
Funds'
financial
position
or
its
results
of
operations.
The
intent
of
ASU
2023-07
is
to
enable
investors
to
better
understand
an
entity's
overall
performance
and
to
assess
its
potential
future
cash
flows
through
improved
segment
disclosures.
An
operating
segment
is
defined
in
Topic
280
as
a
component
of
a
public
entity
that
engages
in
business
activities
from
which
it
may
recognize
revenues
and
incur
expenses,
has
operating
results
that
are
regularly
reviewed
by
the
public
entity’s
chief
operating
decision
maker
(CODM)
to
make
decisions
about
resources
to
be
allocated
to
the
segment
and
assess
its
performance,
and
has
discrete
financial
information
available.
The
Principal
Officers
of
the
Funds,
consisting
of
the
President
as
the
Principal
Executive
Officer
and
the
Treasurer as
the
Principal
Financial
and
Accounting
Officer,
jointly
act
as
the
Funds'
CODMs.
Management
has
determined
that
each
Fund
is
a
single
operating
segment
because
the
CODMs
monitor
the
net
increase
or
decrease
in
net
assets
resulting
from
operations
of
each
Fund
as
a
whole
and
the
Funds'
long-term
strategic
asset
allocation
is
pre-determined
in
accordance
with
the
terms
of
their
respective
prospectus,
based
on
a
defined
investment
strategy
which
is
executed
by
the
Funds'
portfolio
managers
as
a
team.
As
investment
companies,
the
Funds
primarily
engage
in
investing
in
securities
to
generate
a
return
on
investment
for
shareholders.
The
financial
information
provided
to
and
reviewed
by
the
CODM
is
consistent
with
that
presented
in
the
Funds' Schedule
of
Investments,
Statement
of
Changes
in
Net
Assets
and
Financial
Highlights.
Fund
net
assets
are
reflected
on
the
accompanying
Statement
of
Assets
and
Liabilities
as
“Total
Net
Assets”
and
significant
fund
expenses
are
listed
on
the
accompanying
Statement
of
Operations.
Accounting
Standards
Update
2023-09
- Improvements
to
Income
Tax
Disclosures
In
December
2023,
the FASB
issued ASU
2023-09
-
Improvements
to
Income
Tax
Disclosures,
which
amends
quantitative
and
qualitative
income
tax
disclosure
requirements
in
order
to
increase
disclosure
consistency,
bifurcate
income
tax
information
by
jurisdiction
and
remove
information
that
is
no
longer
beneficial.
The
ASU
is
effective
for
annual
periods
beginning
after
December
15,
2024,
and
early
adoption
is
permitted.
At
this
time,
management
is
evaluating
the
implications
of
these
changes
on
the
financial
statements.
Other
—
For
financial
statement
purposes,
investment
security
transactions
are
accounted
for
on
the
trade
date.
Realized
gains
and
losses
from
investment
transactions
are
determined
on
a
specific
cost
identification
basis,
which
is
the
same
basis
used
for
federal
income
tax
purposes.
(3)
FEES
AND
COMPENSATION
PAID
TO
AFFILIATES
Investment
Advisory
Fees
—
The
Trust
has
entered
into
an
Investment
Advisory
Agreement
with
Thrivent
Asset
Mgt.
Under
the
Investment
Advisory
Agreement, the
Fund
pays
a
fee
for
investment
advisory
services.
The
fees
are
accrued
daily
and
paid
monthly.
The
annual
rates
of
fees
as
a
percent
of
average
daily
net
assets
under
the
Investment
Advisory
Agreement
were
as
follows:
Expense
Reimbursements
— Subject
to
certain
limitations, the
Fund
may
invest in
other
Funds,
Thrivent
Cash
Management
Trust,
and
Thrivent
Core Funds.
These
related-party
transactions
are
subject
to
the
same
terms
as
non-related
party
transactions.
To
avoid
duplicate
investment
advisory
fees,
Thrivent
Asset
Mgt.
reimburses
an
amount
equal
to
any
investment
advisory
fees incurred
by
the
Fund
as
a
result
of
its
investment
in
any
other
mutual
fund
for
which
the
Adviser
or
an
affiliate
serves
as
investment
adviser,
other
than
Thrivent
Cash
Management
Trust.
There
are
no
advisory
fees
for
Thrivent
Core
Funds,
and
therefore
no
reimbursement
is
made
related
to
an
investment
in
this
funds.
Distribution
Plan
— Thrivent
Distributors,
LLC
is
the
Trust's
distributor.
The
Trust
has
adopted
a
Distribution
Plan
pursuant
to
Rule
12b-1
under
the
1940
Act.
Class
A
shares
have
an
annual 12b-1
fee
of 0.25%
of
average
net
assets, a
reduced
fee
of
0.125%
or
no
fee.
For
the
Fund
presented
under
this
shareholder
report,
Class
A
shares
have
an annual 12b-1
fee of
0.25%.
Sales
Charges
and
Other
Fees
—
For
the year
ended
December
31,
2024,
Thrivent
Investment
Management
Inc. ("Thrivent
Investment
Mgt.")
and
Thrivent
Distributors,
LLC
received
$20,653
of
aggregate
underwriting
concessions
from
the
sales
of
the
Trust’s
Class
A
shares.
Sales
charges
are
not
an
expense
of
the
Trust
and
are
not
reflected
in
the
financial
statements
of
any
of
the
Funds.
The
Trust
has
entered
into
an
accounting
and
administrative
services
agreement
with
Thrivent
Asset
Mgt.
pursuant
to
which
Thrivent
Asset
Mgt.
provides
certain
accounting
and
administrative
personnel
and
services
to
the
Funds.
Each
Fund pays
a
fee equal
to
the
sum
of
$80,000
plus
0.017%
of
the
Fund's
average
daily
net
Fund
(M
-
Millions)
$0
to
$50M
Over
$50
to
$100M
Over
$100
to
$200M
Over
$200
to
$250M
Over
$250
to
$500M
Over
$500
to
$750M
Over
$750
to
$1,000M
Over
$1,000
to
$2,000M
Over
$2,000
to
$2,500M
Over
$2,500
to
$5,000M
Over
$5,000M
Diversified
Income
Plus
0.550%
0.550%
0.550%
0.550%
0.550%
0.500%
0.500%
0.475%
0.475%
0.450%
0.425%
Thrivent
Mutual
Funds
Notes
to
Financial
Statements
December
31,
2024
assets
to
Thrivent
Asset
Mgt.
These
fees
are
accrued
daily
and paid
monthly.
For
the year
ended
December
31,
2024,
Thrivent
Asset
Mgt.
received
aggregate
fees
for
accounting
and
administrative
personnel
and
services
of $248,792
from
the
Fund
covered
in
this
shareholder
report.
The
Trust
has
entered
into
an
agreement
with
Thrivent
Financial
Investor
Services
Inc.
(“Thrivent
Investor
Services”)
to
provide transfer
agency
and
dividend
payment services
necessary
to
the
Funds
on
a
per-account
basis
for
direct-at-fund
accounts,
and
sub
transfer
agency
services
based
on
assets
under
management
for
third
party
intermediary
accounts.
These
fees
are
accrued
daily
and
paid
monthly.
For
the year
ended
December
31,
2024,
Thrivent
Investor
Services
received
$777,442 for
transfer
agent
services
from
the
Fund
covered
in
this
shareholder
report.
Each
Trustee
who
is
not
affiliated
with
the
Adviser
receives
an
annual
fee
from
the
Trust
for
services
as
a
Trustee
and
is
eligible
to
participate
in
a
deferred
compensation
plan
with
respect
to
fees
received
from
the
Funds.
Participants
in
the
plan
may
designate
their
deferred
Trustee’s
fees
as
if
invested
in a series
of
Thrivent
Mutual
Funds. Money
Market
is
not
eligible
for
the
deferred
plan. The
value
of
each
Trustee’s
deferred
compensation
account
will
increase
or
decrease
as
if
invested
in
shares
of
a
particular series
of
Thrivent
Mutual
Funds.
Each
participant's fees
as
well
as
the
change
in
value
are
included
in
Trustee’s
fees
in
the
Statement
of
Operations.
The
deferred
fees
remain
in
the
appropriate
series
of
Thrivent
Mutual
Funds
until
distribution
in
accordance
with
the
plan.
The Payable
for
trustee
deferred
compensation,
located in
the
Statement
of
Assets
and
Liabilities,
is
unsecured.
Those
Trustees
not
participating
in
the
above
plan
received $30,339
in
fees
from
the
Fund
covered
in
this
shareholder
report
for
the
year
ended
December
31,
2024.
In
addition,
the
Trust
reimbursed
independent
Trustees
for
reasonable
expenses
incurred
in
relation
to
attendance
at Board
meetings
and
industry
conferences.
Certain
officers
and
non-independent
Trustees
of
the
Trust
are
officers
and
directors
of
Thrivent
Asset
Mgt.,
Thrivent
Investment
Mgt., Thrivent
Investor
Services
and
Thrivent
Distributors,
LLC;
however,
they
receive
no
compensation
from
the
Trust.
Affiliated
employees
and
board
consultants
are
reimbursed
for
reasonable
expenses
incurred
in
relation
to
board
meeting
attendance.
Acquired
Fund
Fees
and Expenses
—
Some
Funds
invest
in
other
open-ended
funds.
Fees
and
expenses
of
those
underlying
funds
are
not
included
in
those
Funds'
expense
ratios
reported
in
the
Financial
Highlights.
The
Funds
indirectly
bear
their
proportionate
share
of
the
annualized
weighted
average
expense
ratio
of
the
underlying
funds
in
which
they
invest. This
contractual
provision
may
be
terminated
upon
the
mutual
agreement
between
the
independent
Trustees
of
the
Trust
and
the
Adviser.
Interfund
Lending
—
The
Fund
may
participate
in
an
interfund
lending
program
(the
"Program")
pursuant
to
an
exemptive
order
issued
by
the
SEC.
The
Program permits
the
Fund
to borrow
cash
for
temporary
purposes
from Thrivent
Core
Short-Term
Reserve.
Interest
is
charged
to the
participating
Fund
based
on
its
borrowings
at
the
average
of
the
repo
rate
and
bank
loan
rate,
each
as
defined
in
the
Program.
Each
borrowing
made
under
the
Program
matures
no
later
than
seven
calendar
days
after
the
date
of
the
borrowing,
and
each
borrowing
must
be
securitized
by
a
pledge
of
segregated
collateral
with
a
market
value
at
least
equal
to
102%
of
the
outstanding
principal
value
of
the
loan.
For
the year
ended December
31,
2024, the Fund
did
not borrow
cash
through
the
Program.
(4)
TAX
INFORMATION
Distributions
are
based
on
amounts
calculated
in
accordance
with
applicable
federal
income
tax
regulations,
which
may
differ
from
GAAP.
The
differences
between
book-basis
and
tax-
basis
distributable
earnings
are
primarily
attributable
to
timing
differences
in
recognizing
certain
gains
and
losses
on
investment
transactions, such
as
wash
sales. At
the
end
of
the
fiscal
year,
reclassifications
between
net
asset
accounts
are
made
for
differences
that
are
permanent
in
nature.
These
permanent
differences
primarily
relate
to
the
tax
treatment
of swaps
and
sales
of
callable
bonds.
On
the
Statement
of
Assets
and
Liabilities,
as
a
result
of
permanent
book-to-tax
differences,
reclassification
adjustments
were
made
as
follows
[Increase/(Decrease)]:
At
December
31,
2024,
the
components
of
distributable
earnings
on
a
tax
basis
were
as
follows:
At
December
31,
2024,
the
Fund
had
accumulated
capital
loss
carryovers
as
follows:
To
the
extent
that
the
Fund
realizes
net
capital
gains,
taxable
distributions
will
be
reduced
by
any
unused
capital
loss
carryovers
as
permitted
by
the
Internal
Revenue
Code.
Fund
Distributable
earnings/
(accumulated
loss)
Capital
Stock
Diversified
Income
Plus
$1,626
($1,626)
Fund
Undistributed
Ordinary
Income
a
Undistributed
Long-Term
Capital
Gain
Diversified
Income
Plus
$2,765,352
$
–
a
Undistributed
Ordinary
Income
includes
income
derived
from
short-term
capital
gains,
if
any.
Fund
Capital
Loss
Carryover
Diversified
Income
Plus
$
47,346,784
Thrivent
Mutual
Funds
Notes
to
Financial
Statements
December
31,
2024
During
the
fiscal
year
2024,
capital
loss
carryovers
utilized
by
the
Fund
were
as
follows:
The
tax
character
of
distributions
paid
during
the
years
ended December
31,
2024
and 2023
was
as
follows:
(a)
Ordinary
income
includes
income
derived
from
short-term
capital
gains,
if
any.
(5)
SECURITY
TRANSACTIONS
Purchases
and
Sales
of
Investment
Securities
—
For
the
year
ended
December
31,
2024,
the
cost
of
purchases
and
the
proceeds
from
sales
of
investment
securities,
other
than
U.S.
Government
and
short-term
securities,
were
as
follows:
Purchases
and
Sales
of
U.S.
Government
Securities
were:
Investments
in
Restricted
Securities
—
Certain
Funds
may
own
restricted
securities which
were
purchased
in
private
placement
transactions
without
registration
under
the
Securities
Act
of
1933.
Unless
such
securities
subsequently
become
registered,
they
generally
may
be
resold
only
in
privately
negotiated
transactions
with
a
limited
number
of
purchasers.
As
of
December
31,
2024,
the
following
Fund
held
restricted
securities:
The
Fund
has
no
right
to
require
registration
of
unregistered
securities.
(6)
SECURITY
TRANSACTIONS
WITH
AFFILIATED
FUNDS
The Fund
is
permitted
to
engage
in
securities
transactions
with
affiliated
funds
or
portfolios
under specified
conditions
outlined
in
procedures
adopted
by
the
Board.
The
procedures
have
been
designed
to
ensure
that
any
purchase
or
sale
of
securities
by
a
Fund
from
or
to
another
fund
or
portfolio
that
is
or
could
be
considered
an
affiliate
by
virtue
of
having
a
common
investment
adviser
(or
affiliated
investment
advisers),
common
Trustees
and/or
common
officers
complies
with
Rule
17a-7
of
the
1940
Act.
Further,
as
defined
under
the
procedures,
each
transaction
is
executed
at
the
current
market
price.
During
the year
ended
December
31,
2024, Diversified
Income
Plus engaged
in sale
transactions
in
the
amount
of
$10,170,975
with
a gain
of
$1,250,220,
pursuant
to
Rule
17a-7
of
the
1940
Act.
(7)
RELATED
PARTY
TRANSACTIONS
As
of
December
31,
2024, no
related
parties held
shares
in
excess
of
5%
of
the
Fund
covered
in
this
shareholder
report.
Subscription
and
redemption
activity
by
concentrated
accounts
may
have
a
significant
effect
on
the
operation
of
the
Fund.
In
the
case
of
a
large
redemption,
the
Fund
may
be
forced
to
sell
investments
at
inopportune
times,
resulting
in
additional
losses
for
the
Fund.
(8)
SUBSEQUENT
EVENTS
The
Adviser
of
the
Funds
has
evaluated
the
impact
of
subsequent
events
through
the
date
the
financial
statements
were
issued,
and has
determined
that
no
additional
items
require
disclosure.
(9) MARKET
RISK
Over
time,
securities
markets
generally
tend
to
move
in
cycles
with
periods
when
security
prices
rise
and
periods
when
security
prices
decline.
The
value
of
a
Fund's
investments
may
move
with
these
cycles
and,
in
some
instances,
increase
or
decrease
more
than
the
applicable
market(s)
as
measured
by
the
Fund's
benchmark
index(es).
The
securities
markets
may
also
decline
because
of
factors
that
affect
a
particular
industry
or
market
sector, or
due
to
impacts
from
domestic
or
global
events,
including the
spread
of
infectious
illness,
public
health
threats,
war,
terrorism,
natural
disasters or
similar
events.
As
of December
31,
2024,
the
Fund
had
no
portfolio
concentration
greater
than
25%
in any
market
sector.
(10)
SIGNIFICANT
RISKS
Investing
in
the
Fund
involves
risks.
The
following
is
an
alphabetical
list
of
significant
risks
in
investing
in
the
Fund.
Allocation
Risk
— The
Fund’s
investment
performance
depends
upon
how
its
assets
are
allocated
across
broad
asset
categories
and
applicable
sub-classes
within
such
categories.
Some
broad
asset
categories
and
sub-classes
may
perform
below
expectations
or
the
securities
markets
generally
over
short
and
extended
Fund
Capital
Loss
Carryover
Diversified
Income
Plus
$
19,711,920
Ordinary
Income
(a)
Fund
12/31/2024
12/31/2023
Diversified
Income
Plus
$39,870,892
$43,210,011
In
thousands
Fund
Purchases
Sales/
Paydowns
Diversified
Income
Plus
$303,524
$359,706
In
thousands
Fund
Purchases
Sales/
Paydowns
Diversified
Income
Plus
$173,022
$179,345
Fund
Number
of
Securities
Percent
of
Fund's
Net
Assets
Diversified
Income
Plus
2
0.00%
Thrivent
Mutual
Funds
Notes
to
Financial
Statements
December
31,
2024
periods.
Therefore,
a
principal
risk
of
investing
in
the
Fund
is
that
the
allocation
strategies
used
and
the
allocation
decisions
made
will
not
produce
the
desired
results.
Conflicts
of
Interest
Risk
—
An
investment
in
the
Fund
is
subject
to
a
number
of
actual
or
potential
conflicts
of
interest.
For
example,
the
Adviser
or
its
affiliates
may
provide
services
to
the
Fund
for
which
the
Fund
would
compensate
the
Adviser
and/or
such
affiliates.
The
Fund
may
invest
in
other
pooled
investment
vehicles
sponsored,
managed,
or
otherwise
affiliated
with
the
Adviser,
including
other
Funds.
The
Adviser
may
have
an
incentive
(financial
or
otherwise)
to
enter
into
transactions
or
arrangements
on
behalf
of
the
Fund
with
itself
or
its
affiliates
in
circumstances
where
it
might
not
have
done
so
otherwise.
The
Adviser
or
its
affiliates
manage
other
investment
funds
and/
or
accounts
(including
proprietary
accounts)
and
have
other
clients
with
investment
objectives
and
strategies
that
are
similar
to,
or
overlap
with,
the
investment
objective
and
strategy
of
the
Fund,
creating
conflicts
of
interest
in
investment
and
allocation
decisions
regarding
the
allocation
of
investments
that
could
be
appropriate
for
the
Fund
and
other
clients
of
the
Adviser
or
their
affiliates.
Credit
Risk
—
Credit
risk
is
the
risk
that
an
issuer
of
a
debt
security
to
which
the
Fund
is
exposed
may
no
longer
be
able
or
willing
to
pay
its
debt.
As
a
result
of
such
an
event,
the
debt
security
may
decline
in
price
and
affect
the
value
of
the
Fund.
Cybersecurity
Risk
—
The
Funds
and
their
service
providers
may
be
susceptible
to
operational,
information
security,
privacy,
fraud,
business
disruption,
and
related
risks.
In
general,
cyber
incidents
can
result
from
deliberate
attacks
or
unintentional
events.
Cyber-attacks
include,
but
are
not
limited
to,
gaining
unauthorized
access
to
digital
systems
to
misappropriate
assets
or
sensitive
information,
corrupt
data,
or
otherwise
disrupt
operations.
Cyber
incidents
affecting
the
Adviser,
or
other
service
providers
(including,
but
not
limited
to,
fund
accountants,
custodians,
transfer
agents,
and
financial
intermediaries)
have
the
ability
to
disrupt
and
impact
business
operations,
potentially
resulting
in
financial
losses,
by
interfering
with
the
Funds’
ability
to
calculate
their
NAV,
corrupting
data
or
preventing
parties
from
sharing
information
necessary
for
the
Funds’
operation,
preventing
or
slowing
trades,
stopping
shareholders
from
making
transactions,
potentially
subjecting
the
Funds
or
the
Adviser
to
regulatory
fines
and
penalties,
and
creating
additional
compliance
costs.
Similar
types
of
cybersecurity
risks
are
also
present
for
issuers
or
securities
in
which
the
Funds
may
invest,
which
could
result
in
material
adverse
consequences
for
such
issuers
and
may
cause
the
Funds’
investments
in
such
companies
to
lose
value.
While
the
Funds’
service
providers
have
established
business
continuity
and
incident
response plans
in
the
event
of
such
cyber
incidents,
there
are
inherent
limitations
in
such
plans
and
systems.
Additionally,
the
Funds
cannot
control
the
cybersecurity
plans
and
systems
put
in
place
by
their
service
providers
or
any
other
third
parties
whose
operations
may
affect
the
Funds
or
their
shareholders.
Although
each
Fund
attempts
to
minimize
such
failures
through
controls
and
oversight,
it
is
not
possible
to
identify
all
of
the
operational
risks
that
may
affect
a
Fund
or
to
develop
processes
and
controls
that
completely
eliminate
or
mitigate
the
occurrence
of
such
failures
or
other
disruptions
in
service.
The
value
of
an
investment
in
a
Fund’s
shares
may
be
adversely
affected
by
the
occurrence
of
the
operational
errors
or
failures
or
technological
issues
or
other
similar
events
and
a
Fund
and
its
shareholders
may
bear
costs
tied
to
these
risks.
Derivatives
Risk
—
The
use
of
derivatives
(such
as
futures,
options,
credit
default
swaps,
and
total return
swaps)
involves
additional
risks
and
transaction
costs
which
could
leave
a
Fund
in
a
worse
position
than
if
it
had
not
used
these
instruments.
Changes
in
the
value
of
the
derivative
may
not
correlate
as
intended
with
the
underlying
asset,
rate
or
index,
and
a
Fund
could
lose
much
more
than
the
original
amount
invested.
Derivatives
can
be
highly
volatile,
illiquid
and
difficult
to
value.
Derivatives
are
also
subject
to
the
risk
that
the
other
party
in
the
transaction
will
not
fulfill
its
contractual
obligations.
Some
derivatives
may
give
rise
to
a
form
of
economic
leverage
and
may
expose
the
Fund
to
greater
risk
and
increase
its
costs.
Such
leverage
may
cause
the
Fund
to
liquidate
portfolio
positions
when
it
may
not
be
advantageous
to
do
so
to
satisfy
its
obligations.
Increases
and
decreases
in
the
value
of
the
Fund’s
portfolio
will
be
magnified
when
the
Fund
uses
leverage.
Futures
contracts,
options
on
futures
contracts,
forward
contracts,
and
options
on
derivatives
can
allow
the
Fund
to
obtain
large
investment
exposures
in
return
for
meeting
relatively
small
margin
requirements.
As
a
result,
investments
in
those
transactions
may
be
highly
leveraged.
The
success
of
a
Fund’s
derivatives
strategies
will
depend
on
the
Adviser’s
ability
to
assess
and
predict
the
impact
of
market
or
economic
developments
on
the
underlying
asset,
index
or
rate
and
the
derivative
itself,
without
the
benefit
of
observing
the
performance
of
the
derivative
under
all
possible
market
conditions.
Swap
agreements
may
involve
fees,
commissions
or
other
costs
that
may
reduce
a
Fund’s
gains
from
a
swap
agreement
or
may
cause
a
Fund
to
lose
money.
Futures
contracts
are
subject
to
the
risk
that
an
exchange
may
impose
price
fluctuation
limits,
which
may
make
it
difficult
or
impossible
for
a
Fund
to
close
out
a
position
when
desired.
The
use
of
derivatives
involves
the
risks
associated
with
the
securities
or
other
assets
underlying
those
derivatives,
including
the
risk
of
changes
in
the
value
of
the
underlying
assets
between
the
date
that
the
Fund
enters
into
the
derivatives
transaction
and
the
date
that
the
Fund
closes
out
that
transaction.
When
a
Fund
enters
into
a
futures
contract,
for
example,
it
commits
to
purchasing
or
selling
a
particular
security
at
a
future
date
at
a
specified
price.
Changes
in
the
value
of
the
underlying
security
between
the
time
that
the
Fund
enters
into
the
futures
contract
and
the
time
the
Fund
has
to
purchase
or
sell
the
security
may
cause
the
Fund
to
have
to
purchase
the
security
at
a
price
which
is
greater
than,
or
to
sell
the
security
at
a
price
which
is
lower
than,
the
security’s
then-current
market
value.
When
a
Fund
enters
into
an
interest
rate
swap,
it
agrees
with
another
party
to
exchange
their
respective
interest
rate
exposures
on
a
similar
principal
amount
(e.g.,
exchanging
fixed
rate
interest
payments
on
a
specific
principal
amount
for
Thrivent
Mutual
Funds
Notes
to
Financial
Statements
December
31,
2024
floating
rate
interest
payments
on
that
same
principal
amount,
or
vice
versa).
If
interest
rates
change
in
a
manner
or
to
a
degree
not
anticipated
by
the
Fund,
the
Fund
could
end
up
receiving
less
interest
on
its
investment
than
if
the
Fund
had
not
entered
into
the
swap
agreement.
When
a
Fund
enters
into
a
credit
default
swap,
it
agrees
with
another
party
to
transfer
the
credit
exposure
of
one
or
more
underlying
debt
obligations.
The
purchaser
of
the
credit
default
swap
agrees
to
pay
the
seller
a
fixed
premium
for
a
specific
term,
in
exchange
for
which
the
seller
agrees
to
make
a
contingent
payment
to
the
buyer
in
the
event
the
issuer
of
the
underlying
debt
obligations
defaults
or
upon
the
occurrence
of
another
credit
event
specified
in
the
swap
agreement.
If
the
specified
credit
event
does
not
occur
during
the
term
of
the
credit
default
swap,
the
swap’s
purchaser
will
have
paid
the
fixed
premiums
and
received
no
return
on
the
swap
agreement.
Conversely,
if
the
specified
credit
event
does
occur
during
the
swap’s
term,
the
swap’s
seller
may
have
to
make
a
payment
to
the
purchaser
which
exceeds
the
value
of
the
premiums
that
were
received
by
the
seller.
The
use
of
derivatives
may
also
involve
risks
which
differ
from,
or
are
potentially
greater
than,
the
risks
associated
with
investing
directly
in
the
underlying
reference
asset.
For
example,
the
use
by
a
Fund
of
privately
negotiated,
over-the-counter
(“OTC”)
derivatives
contracts,
including
interest
rates
swaps
and
credit
default
swaps,
exposes
the
Fund
to
the
risk
that
the
counterparty
to
the
OTC
derivatives
contract
will
be
unable
or
unwilling
to
make
timely
payments
under
the
contract
or
otherwise
honor
its
obligations.
There
can
be
no
assurance
that
a
counterparty
will
meet
its
obligations,
especially
during
periods
of
adverse
market
conditions.
The
market
for
certain
types
of
derivative
instruments
may
also
be
less
liquid
than
the
market
for
the
underlying
reference
asset,
making
it
difficult
for
a
Fund
to
value
its
derivative
investments
or
sell
those
investments
at
an
acceptable
price.
Emerging
Markets
Risk
—
The
risks
and
volatility
of
investing
in
foreign
securities
is
increased
in
connection
with
investments
in
emerging
markets.
The
economic,
political
and
market
structures
of
developing
countries
in
emerging
markets,
in
most
cases,
are
not
as
strong
as
the
structures
in
the
U.S.
or
other
developed
countries
in
terms
of
wealth,
stability,
liquidity
and
transparency. The
Fund
may
not
achieve
its
investment
objective
and
portfolio
performance
will
likely
be
negatively
affected
by
portfolio
exposure
to
countries
and
corporations
domiciled
in,
or
with
revenue
exposures
to,
countries
in
the
midst
of,
among
other
things,
hyperinflation,
currency
devaluation,
trade
disagreements,
sudden
political
upheaval
or
interventionist
government
policies,
and
the
risks
of
such
events
are
heightened
within
emerging
market
countries.
Fund
performance
may
also
be
negatively
affected
by
portfolio
exposure
to
countries
and
corporations
domiciled
in,
or
with
revenue
exposures
to,
countries
with
less
developed
or
unreliable
legal,
tax,
regulatory,
accounting,
recordkeeping
and
corporate
governance
systems
and
standards.
In
particular,
there
may
be
less
publicly
available
and
transparent
information
about
issuers
in
emerging
markets
than
would
be
available
about
issuers
in
more
developed
capital
markets
because
such
issuers
may
not
be
subject
to
accounting,
auditing
and
financial
reporting
standards
and
requirements
comparable
to
those
to
which
U.S.
companies
are
subject.
Emerging
markets
may
also
have
differing
legal
systems,
many
of
which
provide
fewer
security
holder
rights
and
practical
remedies
to
pursue
claims
than
are
available
for
securities
of
companies
in
the
U.S.
or
other
developed
countries,
including
class
actions
or
fraud
claims.
Significant
buying
or
selling
actions
by
a
few
major
investors
may
also
heighten
the
volatility
of
emerging
market
securities.
Equity
Security
Risk
—
Equity
securities
held
by
the
Fund
may
decline
significantly
in
price,
sometimes
rapidly
or
unpredictably,
over
short
or
extended
periods
of
time,
and
such
declines
may
occur
because
of
declines
in
the
equity
market
as
a
whole,
or
because
of
declines
in
only
a
particular
country,
geographic
region,
company,
industry,
or
sector
of
the
market.
From
time
to
time,
the
Fund
may
invest
a
significant
portion
of
its
assets
in
companies
in
one
particular
country
or
geographic
region
or
one
or
more
related
sectors
or
industries,
which
would
make
the
Fund
more
vulnerable
to
adverse
developments
affecting
such
countries,
geographic
regions,
sectors
or
industries.
Equity
securities
generally
do
not
move
in
the
same
direction
at
the
same
time
and
are
generally
more
volatile
than
most
debt
securities.
Foreign
Currency
Risk
—
The
value
of
a
foreign
currency
may
decline
against
the
U.S.
dollar,
which
would
reduce
the
dollar
value
of
securities
denominated
in
that
currency.
The
overall
impact
of
such
a
decline
of
foreign
currency
can
be
significant,
unpredictable,
and
long
lasting,
depending
on
the
currencies
represented,
how
each
one
appreciates
or
depreciates
in
relation
to
the
U.S.
dollar,
and
whether
currency
positions
are
hedged. Further,
exchange
rate
movements
are
volatile,
and
it
is
not
possible
to
effectively
hedge
the
currency
risks
of
many
developing
countries.
Foreign
Securities
Risk
—
Foreign
securities
generally
carry
more
risk
and
are
more
volatile
than
their
domestic
counterparts,
in
part
because
of
potential
for
higher
political
and
economic
risks,
lack
of
reliable
information
and
fluctuations
in
currency
exchange
rates
where
investments
are
denominated
in
currencies
other
than
the
U.S.
dollar.
Certain
events
in
foreign
markets
may
adversely
affect
foreign
and
domestic
issuers,
including
interruptions
in
the
global
supply
chain,
market
closures,
war,
terrorism,
natural
disasters
and
outbreak
of
infectious
diseases.
The
Fund’s
investment
in
any
country
could
be
subject
to
governmental
actions
such
as
capital
or
currency
controls,
nationalizing
a
company
or
industry,
expropriating
assets,
or
imposing
punitive
taxes
that
would
have
an
adverse
effect
on
security
prices,
and
impair
the
Fund’s
ability
to
repatriate
capital
or
income.
Foreign
securities
may
also
be
more
difficult
to
resell
than
comparable
U.S.
securities
because
the
markets
for
foreign
securities
are
often
less
liquid.
Even
when
a
foreign
security
increases
in
price
in
its
local
currency,
the
appreciation
may
be
diluted
by
adverse
changes
in
exchange
rates
when
the
security’s
value
is
converted
to
U.S.
dollars.
Foreign
withholding
taxes
also
may
apply
and
errors
and
delays
may
occur
in
the
settlement
process
for
foreign
securities.
High-Yield
Risk
—
High
yield
securities
–
commonly
known
as
“junk
bonds”
–
to
which
the
Fund
is
exposed
are
considered
predominantly
speculative
with
respect
to
the
issuer’s
continuing
Thrivent
Mutual
Funds
Notes
to
Financial
Statements
December
31,
2024
ability
to
make
principal
and
interest
payments.
If
the
issuer
of
the
security
is
in
default
with
respect
to
interest
or
principal
payments,
the
value
of
the
Fund
may
be
negatively
affected.
High-yield
securities
generally
have
a
less
liquid
resale
market.
Interest
Rate
Risk
—
Interest
rate
risk
is
the
risk
that
prices
of
debt
securities
decline
in
value
when
interest
rates
rise
for
debt
securities
that
pay
a
fixed
rate
of
interest.
Debt
securities
with
longer
durations
(a
measure
of
price
sensitivity
of
a
bond
or
bond
fund
to
changes
in
interest
rates)
or
maturities
(i.e.,
the
amount
of
time
until
a
bond’s
issuer
must
pay
its
principal
or
face
value)
tend
to
be
more
sensitive
to
changes
in
interest
rates
than
debt
securities
with
shorter
durations
or
maturities.
Changes
in
general
economic
conditions,
inflation,
and
monetary
policies,
such
as
certain
types
of
interest
rate
changes
by
the
Federal
Reserve,
could
affect
interest
rates
and
the
value
of
some
securities.
During
periods
of
low
interest
rates
or
when
inflation
rates
are
high
or
rising,
the
Fund
may
be
subject
to
a
greater
risk
of
rising
interest
rates.
Investment
Adviser
Risk
—
The
Fund
is
actively
managed
and
the
success
of
its
investment
strategy
depends
significantly
on
the
skills
of
the
Adviser
in
assessing
the
potential
of
the
investments
in
which
the
Fund
invests.
The
assessment
of
potential
Fund
investments
may
prove
incorrect,
resulting
in
losses
or
poor
performance,
even
in
rising
markets.
There
is
also
no
guarantee
that
the
Adviser
will
be
able
to
effectively
implement
the
Fund’s
investment
objective.
Issuer
Risk
—
Issuer
risk
is
the
possibility
that
factors
specific
to
an
issuer
to
which
the
Fund
is
exposed
will
affect
the
market
prices
of
the
issuer’s
securities
and
therefore
the
value
of
the
Fund.
Large
Cap
Risk
—
Large-sized
companies
may
be
unable
to
respond
quickly
to
new
competitive
challenges
such
as
changes
in
technology.
They
may
also
not
be
able
to
attain
the
high
growth
rate
of
successful
smaller
companies,
especially
during
extended
periods
of
economic
expansion.
Liquidity
Risk
—
Liquidity
is
the
ability
to
sell
a
security
relatively
quickly
for
a
price
that
most
closely
reflects
the
actual
value
of
the
security.
To
the
extent
that
dealers
do
not
maintain
inventories
of
bonds
that
keep
pace
with
the
growth
of
the
bond
markets
over
time,
relatively
low
levels
of
dealer
inventories
could
lead
to
decreased
liquidity
and
increased
volatility
in
the
fixed
income
markets,
particularly
during
periods
of
economic
or
market
stress.
As
a
result
of
this
decreased
liquidity,
the
Fund
may
have
to
accept
a
lower
price
to
sell
a
security,
sell
other
securities
to
raise
cash,
or
give
up
an
investment
opportunity,
any
of
which
could
have
a
negative
effect
on
performance.
Market Risk
—
Over
time,
securities
markets
generally
tend
to
move
in
cycles
with
periods
when
security
prices
rise
and
periods
when
security
prices
decline.
The
value
of
the
Fund’s
investments
may
move
with
these
cycles
and,
in
some
instances,
increase
or
decrease
more
than
the
applicable
market(s)
as
measured
by
the
Fund’s
benchmark
index(es).
The
securities
markets
may
also
decline
because
of
factors
that
affect
a
particular
industry
or
market
sector,
or
due
to
impacts
from
domestic
or
global
events,
including
regulatory
events,
economic
downturn,
government
shutdowns,
the
spread
of
infectious
illness
such
as
the
outbreak
of
COVID-19,
public
health
crises,
war,
terrorism,
social
unrest,
recessions,
natural
disasters
or
similar
events.
Mortgage-Backed
and
Other
Asset-Backed
Securities
Risk
—
The
value
of
mortgage-backed
and
asset-backed
securities are
influenced
by
the
factors
affecting
the
housing
market
and
the
assets
underlying
such
securities.
As
a
result,
during
periods
of
declining
asset
value,
difficult
or
frozen
credit
markets,
swings
in
interest
rates,
or
deteriorating
economic
conditions,
mortgage-
related
and
asset-backed
securities
may
decline
in
value,
face
valuation
difficulties,
become
more
volatile
and/or
become
illiquid.
In
addition,
both
mortgage-backed
and
asset-backed
securities
are
sensitive
to
changes
in
the
repayment
patterns
of
the
underlying
security.
If
the
principal
payment
on
the
underlying
asset
is
repaid
faster
or
slower
than
the
holder
of
the
asset-backed
or
mortgage-
backed
security
anticipates,
the
price
of
the
security
may
fall,
particularly
if
the
holder
must
reinvest
the
repaid
principal
at
lower
rates
or
must
continue
to
hold
the
security
when
interest
rates
rise.
This
effect
may
cause
the
value
of
the
Fund
to
decline
and
reduce
the
overall
return
of
the
Fund.
Mortgage-backed
securities
are
also
subject
to
extension
risk,
which
is
the
risk
that
when
interest
rates
rise,
certain
mortgage-backed
securities
are
paid
in
full
by
the
issuer
more
slowly
than
anticipated.
This
can
cause
the
market
value
of
the
security
to
fall
because
the
market
may
view
its
interest
rate
as
low
for
a
longer-term
investment.
Other
Funds
Risk
—
Because
the
Fund
invests
in
other
funds,
the
performance
of
the
Fund
is
dependent,
in
part,
upon
the
performance
of
other
funds
in
which
the
Fund
may
invest.
As
a
result,
the
Fund
is
subject
to
the
same
risks
as
those
faced
by
the
other
funds.
In
addition,
other
funds
may
be
subject
to
additional
fees
and
expenses
that are
borne
by
the
Fund.
Preferred
Securities
Risk
—
There
are
certain
additional
risks
associated
with
investing
in
preferred
securities,
including,
but
not
limited
to,
preferred
securities
may
include
provisions
that
permit
the
issuer,
at
its
discretion,
to
defer
or
omit
distributions
for
a
stated
period
without
any
adverse
consequences
to
the
issuer;
preferred
securities
are
generally
subordinated
to
bonds
and
other
debt
instruments
in
a
company’s
capital
structure
in
terms
of
having
priority
to
corporate
income
and
liquidation
payments,
and
therefore are
subject
to
greater
credit
risk
than
more
senior
debt
instruments;
preferred
securities
may
be
substantially
less
liquid
than
many
other
securities,
such
as
common
stocks
or
U.S.
Government
securities;
generally,
traditional
preferred
securities
offer
no
voting
rights
with
respect
to
the
issuing
company
unless
preferred
dividends
have
been
in
arrears
for
a
specified
number
of
periods,
at
which
time
the
preferred
security
holders
may
elect
a
number
of
directors
to
the
issuer’s
board;
and
in
certain
varying
circumstances,
an
issuer
of
preferred
securities
may
redeem
the
securities
prior
to
a
specified
date.
Prepayment
Risk
—
When
interest
rates
fall,
certain
obligations are
paid
off
by
the
obligor
more
quickly
than
originally
anticipated,
and
Thrivent
Mutual
Funds
Notes
to
Financial
Statements
December
31,
2024
a
Fund
may
have
to
invest
the
proceeds
in
securities
with
lower
yields.
In
periods
of
falling
interest
rates,
the
rate
of
prepayments
tends
to
increase
(as
does
price
fluctuation)
as
borrowers
are
motivated
to
pay
off
debt
and
refinance
at
new
lower
rates.
During
such
periods,
reinvestment
of
the
prepayment
proceeds
by
the
management
team
will
generally
be
at
lower
rates
of
return
than
the
return
on
the
assets
that
were
prepaid.
Prepayment
generally
reduces
the
yield
to
maturity
and
the
average
life
of
the
security.
Quantitative
Investing
Risk
—
Securities
selected
according
to
a
quantitative
analysis
methodology
can
perform
differently
from
the
market
as
a
whole
based
on
the
model
and
the
factors
used
in
the
analysis,
the
weight
placed
on
each
factor
and
changes
in
the
factor’s
historical
trends.
Such
models
are
based
on
assumptions
relating
to
these
and
other
market
factors,
and
the
models
may
not
take
into
account
certain
factors,
or
perform
as
intended,
and
may
result
in
a
decline
in
the
value
of
the
Fund’s
portfolio.
Among
other
risks,
results
generated
by
such
models
may
be
impaired
by
errors
in
human
judgment,
data
imprecision,
software
or
other
technology
systems
malfunctions,
or
programming
flaws.
Such
models
may
not
perform
as
expected
or
may
underperform
in
periods
of
market
volatility.
Real
Estate
Investment
Trust
(“REIT”)
Risk
—
REITs
generally
can
be
divided
into
three
types:
equity
REITs,
mortgage
REITs
and
hybrid
REITs
(which
combine
the
characteristics
of
equity
REITs
and
mortgage
REITs).
Equity
REITs
will
be
affected
by
changes
in
the
values
of,
and
income
from,
the
properties
they
own,
while
mortgage
REITs
may
be
affected
by
the
credit
quality
of
the
mortgage
loans
they
hold.
All
REIT
types
may
be
affected
by
changes
in
interest
rates.
The
effect
of
rising
interest
rates
is
generally
more
pronounced
for
high
dividend
paying
stock
than
for
stocks
that
pay
little
or
no
dividends.
This
may
cause
the
value
of
real
estate
securities
to
decline
during
periods
of
rising
interest
rates,
which
would
reduce
the
overall
return
of
the
Fund.
REITs
are
subject
to
additional
risks,
including
the
fact
that
they
are
dependent
on
specialized
management
skills
that
may
affect
the
REITs’
abilities
to
generate
cash
flows
for
operating
purposes
and
for
making
investor
distributions.
REITs
may
have
limited
diversification
and
are
subject
to
the
risks
associated
with
obtaining
financing
for
real
property.
As
with
any
investment,
there
is
a
risk
that
REIT
securities
and
other
real
estate
industry
investments
may
be
overvalued
at
the
time
of
purchase.
In
addition,
a
REIT
can
pass
its
income
through
to
its
investors
without
any
tax
at
the
entity
level
if
it
complies
with
various
requirements
under
the
Internal
Revenue
Code.
There
is
the
risk,
however,
that
a
REIT
held
by
the
Fund
will
fail
to
qualify
for
this
tax-free
pass-through
treatment
of
its
income.
By
investing
in
REITs
indirectly
through
the
Fund,
in
addition
to
bearing
a
proportionate
share
of
the
expenses
of
the
Fund,
you
will
also
indirectly
bear
similar
expenses
of
the
REITs
in
which
the
Fund
invests.
Regulatory
Risk
—
Legal,
tax,
and
regulatory
developments
may
adversely
affect
the
Funds.
Securities
and
futures
markets
are
subject
to
comprehensive
statutes,
regulations,
and
margin
requirements
enforced
by
the
SEC,
other
regulators
and
self-regulatory
organizations,
and
exchanges,
which
are
authorized
to
take
extraordinary
actions
in
the
event
of
market
emergencies.
The
regulatory
environment
for
the
Funds
is
evolving,
and
changes
in
the
regulation
of
investment
funds,
managers,
and
their
trading
activities
and
capital
markets,
or
a
regulator’s
disagreement
with
the
Funds’
interpretation
of
the
application
of
certain
regulations,
may
adversely
affect
the
ability
of
a
Fund
to
pursue
its
investment
strategy,
its
ability
to
obtain
leverage
and
financing,
and
the
value
of
investments
held
by
the
Fund.
Thrivent
Mutual
Funds
Financial
Highlights
The
accompanying
Notes
to
Financial
Statements
are
an
integral
part
of
this
statement.
Per
Share
Outstanding
Throughout
Each
Period
*
Income
from
Investment
Operations
Less
Distributions
From
Net
Asset
Value,
Beginning
of
Period
Net
Investment
Income/(Loss)
Net
Realized
and
Unrealized
Gain/(Loss)
on
Investments
(a)
Total
from
Investment
Operations
Net
Investment
Income
text
Net
Realized
Gain
on
Investments
Diversified
Income
Plus
Fund
Class
S
Shares
Year
Ended
12/31/2024
$
6.80
$
0.28
$
0.19
$
0.47
$
(0.29)
$
–
Year
Ended
12/31/2023
6.45
0.27
0.36
0.63
(0.28)
–
Year
Ended
12/31/2022
7.62
0.21
(1.16)
(0.95)
(0.22)
–
Year
Ended
12/31/2021
7.63
0.18
0.32
0.50
(0.18)
(0.33)
Year
Ended
12/31/2020
7.34
0.20
0.30
0.50
(0.21)
–
Class
A
Shares
Year
Ended
12/31/2024
6.88
0.27
0.19
0.46
(0.27)
–
Year
Ended
12/31/2023
6.53
0.27
0.35
0.62
(0.27)
–
Year
Ended
12/31/2022
7.70
0.20
(1.17)
(0.97)
(0.20)
–
Year
Ended
12/31/2021
7.71
0.16
0.32
0.48
(0.16)
(0.33)
Year
Ended
12/31/2020
7.42
0.19
0.29
0.48
(0.19)
–
(a)
The
amount
shown
may
not
correlate
with
the
change
in
aggregate
gains
and
losses
of
portfolio
securities
due
to
the
timing
of
sales
and
redemptions
of
fund
shares.
(b)
Total
return
assumes
dividend
reinvestment
and
does
not
reflect
any
deduction
for
applicable
sales
charges. Not
annualized
for
periods
less
than
one
year.
(c)
Portfolio
turnover
rate
may
include
mortgage
dollar
roll
purchase
and
sale
transactions
which
may
increase
portfolio
turnover
rates. Additional
information
can
be
found
in
the
accompanying
Notes
to
Financial
Statements.
*
All
per
share
amounts
have
been
rounded
to
the
nearest
cent.
**
Computed
on
an
annualized
basis
for
periods
less
than
one
year.
Thrivent
Mutual
Funds
Financial
Highlights
–
continued
The
accompanying
Notes
to
Financial
Statements
are
an
integral
part
of
this
statement.
Ratio
to
Average
Net
Assets
**
Ratios
to
Average
Net
Assets
Before
Expenses
Waived,
Credited
or
Acquired
Fund
Fees
and
Expenses
**
Total
Distributions
Net
Asset
Value,
End
of
Period
Total
Return
(b)
Net
Assets,
End
of
Period
(in
millions)
Expenses
Net
Investment
Income/
(Loss)
Expenses
Net
Investment
Income/
(Loss)
*
Portfolio
Turnover
Rate
(c)
$
(0.29)
$
6.98
7.01%
$
535.5
0.68%
4.02%
0.68%
4.02%
50%
(0.28)
6.80
10.05%
549.2
0.68%
4.15%
0.68%
4.15%
80%
(0.22)
6.45
(12.55)%
571.1
0.69%
3.07%
0.69%
3.07%
278%
(0.51)
7.62
6.55%
679.1
0.68%
2.28%
0.68%
2.28%
268%
(0.21)
7.63
7.01%
504.0
0.71%
2.83%
0.71%
2.83%
156%
(0.27)
7.07
6.81%
440.3
0.93%
3.78%
0.93%
3.78%
50%
(0.27)
6.88
9.65%
470.4
0.93%
3.90%
0.93%
3.90%
80%
(0.20)
6.53
(12.64)%
495.4
0.94%
2.82%
0.94%
2.82%
278%
(0.49)
7.70
6.22%
623.5
0.93%
2.01%
0.93%
2.01%
268%
(0.19)
7.71
6.67%
609.6
0.95%
2.58%
0.95%
2.58%
156%
Federal
Tax
Information
(unaudited)
Shareholder
Notification
of
Federal
Tax
Information
The
following
information
is
provided
solely
to
satisfy
the
requirements
set
forth
by
the
Internal
Revenue
Code.
Shareholders
will
be
provided
information
regarding
their
distribution
in
February
2025.
The
Funds
designate
the
percentage
of
dividends
declared
from
net
investment
income
as
(1)
for
corporations,
dividends
qualifying
for
the
70%
dividends
received,
and
(2)
for
individuals,
as
qualified
dividend
income
under
the
Jobs
and
Growth
Tax
Relief
Reconciliation
Act
of
2003
as
follows:
Fund
Dividends
Received
Deduction
for
Corporations
Qualified
Dividend
Income
for
Individuals
Diversified
Income
Plus
7%
8%
Change
in
and
Disagreement
with
Accountants
Not
Applicable
Proxy
Disclosures
Not
Applicable
Remuneration
Paid
to
Directors,
Officers,
and
Others
The
information
is
disclosed
in
the
Statement
of
Operations
and
as
part
of
the
Fees
and
Compensation
Paid
to
Affiliates
section
of
the
Notes
to
Financial
Statements.
Statement
Regarding
Basis
for
Approval
of
Investment
Advisory
Contract
(Unaudited)
Board
Approval
of
Advisory
Agreement
Section
15(c)
of
the
Investment
Company
Act
of
1940,
as
amended
(the
“1940
Act”),
requires
that
a
fund’s
investment
advisory
agreement
be
approved
initially
by
the
fund’s
board
of
trustees.
Section
15(c)
also
requires
that
the
continuation
of
the
agreement,
after
an
initial
term
of
up
to
two
years,
be
annually
reviewed
and
approved
by
the
board.
Any
such
agreement
must
be
approved
by
a
vote
of
a
majority
of
the
trustees
who
are
not
parties
to
the
agreement
or
“interested
persons”
(as
defined
in
the
1940
Act)
of
a
party
to
the
agreement
at
a
meeting
of
the
board
called
for
the
purpose
of
voting
on
such
approval.
At
its
meeting
on
August
20-21,
2024
(the
“Meeting”),
the
Board
of
Trustees
(the
“Board”)
of
the
Thrivent
Mutual
Funds
(the
“Trust”),
including
the
trustees
who
are
not
parties
to
the
agreement
or
“interested
persons”
as
defined
in
the
1940
Act
(the
“Independent
Trustees”),
considered
and
voted
unanimously
to
renew
the
existing
advisory
agreement,
as
amended
(the
“Advisory
Agreement”)
between
the
Trust
and
Thrivent
Asset
Management,
LLC
(the
“Adviser”)
for
each
series
of
the
Trust
(each,
a
“Fund”).
In
advance
of
the
Meeting,
the
Adviser
provided
information
to
the
Board
in
response
to
requests
for
information
by
independent
legal
counsel
on
behalf
of
the
Independent
Trustees
to
facilitate
the
Board’s
evaluation
of
the
Advisory
Agreement.
In
connection
with
its
evaluation
of
Advisory
Agreement,
the
Board
reviewed
a
broad
range
of
information
requested
for
this
purpose
and
considered
a
variety
of
factors,
including
the
following:
1.
The
nature,
extent,
and
quality
of
the
services
provided
by
the
Adviser;
2.
The
performance
of
each
Fund;
3.
The
advisory
fee
and
net
operating
expense
ratio
of
each
Fund
compared
to
a
peer
group;
4.
The
cost
of
services
provided
and
any
profit
realized
by
the
Adviser;
5.
The
extent
to
which
economies
of
scale
may
be
realized
as
the
Funds
grow;
6.
Whether
fee
levels
reflect
these
economies
of
scale
for
the
benefit
of
the
Funds’
shareholders;
7.
Other
benefits
realized
by
the
Adviser
and
its
affiliates
from
their
relationship
with
the
Trust;
and
8.
Any
other
factors
that
the
Board
deemed
relevant
to
its
consideration.
The
Contracts
Committee
of
the
Board
(consisting
of
all
of
the
Independent
Trustees)
met
on
four
occasions
in
2024
--
February
27,
May
21,
July
11
and
August
20
--
to
consider
information
relevant
to
the
annual
contract
renewal
process
furnished
by
the
Adviser
in
advance
of
the
meetings.
During
the
annual
contract
renewal
process,
the
Independent
Trustees
requested,
and
the
Adviser
furnished,
supplemental
information
for
the
Board’s
consideration.
The
Independent
Trustees
also
retained
the
services
of
Management
Practice
LLC
(“MPI”)
as
an
independent
consultant
to
assist
in
the
compilation,
organization,
and
evaluation
of
relevant
information.
This
information
included
Fund-by-Fund
statistical
comparisons
of
the
advisory
fees,
other
fees,
net
operating
expenses
and
performance
of
each
of
the
Funds
in
comparison
to
peer
groups
of
comparable
funds;
performance
volatility
based
on
standard
deviation;
overall
Morningstar
ratings
of
the
Funds;
information
with
respect
to
services
provided
to
the
Funds
and
fees
charged,
including
effective
advisory
fees
that
take
into
account
breakpoints
and
fee
waivers
by
the
Adviser;
asset
and
flow
trends
for
the
Funds;
and
estimates
of
the
cost
of
services
and
profit
realized
by
the
Adviser
and
its
affiliates
that
provide
services
to
the
Funds.
The
Board
received
information
from
the
Adviser
regarding
the
personnel
providing
services
to
the
Funds,
including
investment
management,
compliance
and
administrative
personnel.
The
Board
also
received
monthly
reports
from
the
Adviser’s
investment
management
staff
with
respect
to
the
performance
of
the
Funds.
In
addition
to
its
review
of
the
information
presented
to
the
Board
during
the
annual
contract
renewal
process,
the
Board
considered
information
obtained
from
management
throughout
the
course
of
the
year.
The
Board
also
reviewed
information
from
MPI,
including
Fund-by-
Fund
analyses
and
an
independent
assessment
of
information
relating
to
the
Funds
and
the
Advisory
Agreement.
The
Independent
Trustees
were
represented
by
independent
counsel
throughout
the
review
process
and
during
executive
sessions
without
management
present
to
consider
the
reapproval
of
the
Advisory
Agreement
for
the
Funds.
Each
Independent
Trustee
relied
on
his
or
her
own
business
judgment
in
determining
the
weight
to
be
given
to
each
factor
considered
in
evaluating
Statement
Regarding
Basis
for
Approval
of
Investment
Advisory
Contract
(Unaudited)
the
materials
that
were
presented
to
them.
The
Contracts
Committee’s
and
Board’s
review
and
conclusions
were
based
on
a
comprehensive
consideration
of
all
information
presented
to
them
and
were
not
the
result
of
any
single
controlling
factor.
In
addition,
each
Trustee
may
have
weighed
individual
factors
differently.
The
key
factors
considered
and
the
conclusions
reached
are
described
below.
Nature,
Extent
and
Quality
of
Services
At
each
of
the
Board’s
regular
quarterly
meetings,
management
presented
information
describing
the
services
furnished
to
the
Funds
by
the
Adviser,
transfer
agent
and
administrator.
During
these
meetings,
management
reported
on
the
investment
management,
portfolio
trading
and
compliance
services
provided
to
the
Funds.
During
the
annual
contract
renewal
process,
the
Board
considered
the
specific
services
provided
under
the
Advisory
Agreement.
The
Board
considered
information
relating
to
the
investment
experience
and
qualifications
of
the
portfolio
managers
of
the
Adviser
overseeing
investments
for
the
Funds.
The
Board
received
reports
and
presentations
about
the
Funds
at
each
of
its
quarterly
meetings
from
the
Adviser’s
representatives.
These
reports
and
presentations
gave
the
Board
or
one
of
its
Committees
the
opportunity
to
evaluate
the
abilities
of
the
portfolio
managers
and
other
investment
professionals
and
the
quality
of
services
they
provide
to
the
Funds.
The
Adviser
reviewed
with
the
Board
the
services
provided
by
the
Adviser.
The
Independent
Trustees
also
met,
including
in
executive
session,
with
and
received
periodic
reports
from
the
Trust’s
Chief
Compliance
Officer,
the
Trust’s
independent
accounting
firm,
and
representatives
from
the
internal
audit
department
of
the
Adviser
(Business
Risk
Management).
The
Board
noted
that
the
Chief
Compliance
Officer
met
regularly
between
quarterly
meetings
with
the
Chair
of
the
Ethics
and
Compliance
Committee
and
the
Chairs
of
other
Committees
communicated
with
Adviser
representatives
between
quarterly
meetings.
The
Board
noted
that
investment
management
staff
of
the
Adviser
and
the
Trust’s
Chief
Compliance
Officer
follow
up
as
needed
on
additional
questions
or
concerns
that
arise
during
quarterly
meetings.
The
Board
considered
the
adequacy
of
the
Adviser’s
resources
used
to
provide
services
to
the
Trust
pursuant
to
the
Advisory
Agreement.
The
Adviser
reviewed
with
the
Board
the
Adviser’s
process
for
overseeing
the
portfolio
management
teams
of
each
Fund.
In
addition,
the
Adviser
reviewed
with
the
Board
the
Adviser’s
continued
investments
in
technology,
personnel,
compliance,
operations,
and
the
Adviser’s
oversight
of
other
service
providers
to
the
Funds.
The
Board
viewed
these
actions
as
a
positive
factor
in
reapproving
the
existing
Advisory
Agreement,
as
they
demonstrated
the
Adviser’s
commitment
to
provide
the
Funds
with
quality
service
and
competitive
investment
performance.
The
Board
concluded
that,
within
the
context
of
its
full
deliberations,
the
nature,
extent
and
quality
of
the
investment
advisory
services
provided
to
the
Funds
by
the
Adviser
supported
renewal
of
the
Advisory
Agreement.
Investment
Performance
In
connection
with
each
of
its
regular
quarterly
meetings,
the
Board
received
information
on
the
performance
of
each
Fund,
including
net
performance,
relative
performance
rankings
within
each
Fund’s
Morningstar
peer
universe,
Morningstar
ratings,
comparisons
to
benchmark
index
returns,
and
risk
metrics.
At
each
quarterly
Board
meeting,
members
of
the
Adviser’s
senior
investment
team
reviewed
with
the
Board
information
on
the
economic
and
market
environment
and
risk
management.
The
Board
considered
investment
performance
for
each
Fund,
to
the
extent
applicable,
over
the
one-,
three-,
five-,
and
ten-year
periods.
When
evaluating
investment
performance,
the
Board
considered
longer-term
performance
and
the
trend
of
performance.
Although
the
Board
conducted
its
review
on
a
Fund-by-Fund
basis,
it
noted
that
the
three-year
average
performance
ranking
of
the
Class
A
and
Class
S
shares
(with
equal
weighting
for
each
Fund
and
for
the
period
ended
June
30,
2024)
was
46%
and
42%,
respectively
(with
1%
being
the
best
performance).
The
Board
also
considered
risk
metrics,
including
standard
deviations
of
return,
and
various
factors
affecting
performance.
The
Board
concluded
that
the
performance
of
each
individual
Fund
was
either
satisfactory
or
that
the
Adviser
had
taken
appropriate
actions
in
an
effort
to
improve
Statement
Regarding
Basis
for
Approval
of
Investment
Advisory
Contract
(Unaudited)
performance.
Advisory
Fees
and
Fund
Expenses
The
Board
reviewed
information
prepared
by
MPI
comparing
each
Fund’s
advisory
fee
with
the
advisory
fees
of
a
peer
group
selected
by
MPI
based
on
similar
investment
objective
and
size.
The
Board
also
reviewed
information
provided
by
the
Adviser
comparing
each
Fund’s
advisory
fee
with
the
median
advisory
fee
for
the
relevant
Morningstar
peer
universe.
The
Board
conducted
its
review
on
a
Fund-by-Fund
basis.
It
noted
that
the
advisory
fees
for
79%
of
Funds
(Class
A)
and
76%
of
Funds
(Class
S)
were
below
the
median
of
the
relevant
MPI
peer
group
and
that
the
advisory
fees
for
79%
of
Funds
(Class
A)
and
68%
of
Funds
(Class
S)
were
below
the
median
of
the
relevant
Morningstar
peer
group.
The
Board
reviewed
information
and
explanations
provided
by
the
Adviser
and
MPI
regarding
the
Fund
advisory
fees
that
were
greater
than
the
median
of
the
relevant
MPI
peer
group
or
Morningstar
peer
group.
The
Board
reviewed
information
prepared
by
MPI
comparing
each
Fund’s
overall
expense
ratio
with
the
expense
ratio
of
a
peer
group
selected
by
MPI
based
on
similar
investment
objective
and
size.
The
Board
also
reviewed
information
provided
by
the
Adviser
comparing
each
Fund’s
overall
expense
ratio
with
the
median
overall
expense
ratio
for
the
relevant
Morningstar
peer
universe.
With
respect
to
each
asset
allocation
Fund,
the
Board
reviewed
information
prepared
by
the
Adviser
and
MPI
showing
the
overall
expense
ratio
both
with
and
without
the
expenses
related
to
the
Fund’s
investment
in
underlying
private
equity
investment
funds.
The
Board
considered
the
fee
waivers
and
expense
limitations
which
are
reviewed
by
the
Board
and
the
Adviser
on
an
annual
basis.
The
Board
conducted
its
review
on
a
Fund-by-Fund
basis.
It
noted
that
the
overall
expense
ratios
for
79%
of
Funds
(Class
A)
and
92%
of
Funds
(Class
S)
were
below
the
median
of
the
relevant
MPI
peer
group
and
that
the
overall
expense
ratios
for
79%
of
Funds
(Class
A)
and
84%
of
Funds
(Class
S)
were
below
the
median
of
the
relevant
Morningstar
peer
group
(using
expense
ratios
without
private
equity).
The
Board
reviewed
information
and
explanations
provided
by
the
Adviser
and
MPI
regarding
private
equity
expenses
and
the
Fund
overall
expense
ratios
that
were
greater
than
the
median
of
the
relevant
MPI
peer
group
or
Morningstar
peer
group.
On
the
basis
of
its
review,
the
Board
concluded
that
the
advisory
fees
charged
under
the
Advisory
Agreement
were
reasonable.
Cost
of
Services,
Profitability
and
Economies
of
Scale
The
Board
considered
the
Adviser’s
estimates
of
its
profitability,
which
included
allocations
by
the
Adviser
of
its
costs
in
providing
advisory
services
to
the
Funds.
The
internal
audit
department
of
the
Adviser
(Business
Risk
Management)
conducted
a
review
of
such
allocations
and
provided
a
report
to
the
Board,
which
included
an
assessment
of
the
reasonableness
and
consistency
of
these
allocations.
The
Board
also
received
a
report
from
an
independent
accountant
confirming
certain
calculations.
The
Board
considered
the
profitability
of
the
Adviser
both
overall
and
on
a
Fund-by-Fund
basis.
Based
on
its
review
of
the
data
prepared
by
MPI
and
expense
and
profit
information
provided
by
the
Adviser,
the
Board
concluded
that
the
profits
earned
by
the
Adviser
from
the
Advisory
Agreement
were
not
excessive
in
light
of
the
nature,
extent
and
quality
of
services
provided
to
the
Funds.
The
Board
considered
information
regarding
the
extent
to
which
economies
of
scale
may
be
realized
as
a
Fund’s
assets
increase
and
whether
the
fee
levels
reflect
these
economies
of
scale
for
the
benefit
of
shareholders.
The
Adviser
explained
its
general
goal
with
respect
to
the
employment
of
fee
waivers,
expense
reimbursements
and
breakpoints.
The
Board
considered
information
provided
by
the
Adviser
related
to
advisory
fees,
breakpoints
in
the
advisory
fee
rates
and
fee
waivers
provided
by
the
Adviser.
The
Board
also
considered
management’s
views
on
whether,
or
to
what
extent,
economies
in
the
advisory
function
may
be
realized
as
a
Fund’s
assets
increase.
The
Board
noted
that
expected
economies
of
scale,
where
they
exist,
may
be
shared
through
the
use
of
fee
breakpoints,
fee
waivers
and
expense
limitations
by
the
Adviser,
and/or
a
lower
overall
fee.
Statement
Regarding
Basis
for
Approval
of
Investment
Advisory
Contract
(Unaudited)
Other
Benefits
to
the
Adviser
and
its
Affiliates
The
Board
considered
information
regarding
“fall-out”
or
ancillary
benefits
that
the
Adviser
and
its
affiliates
may
receive
as
a
result
of
their
relationship
with
the
Trust,
both
tangible
and
intangible.
Such
benefits
may
include
the
ability
to
leverage
investment
professionals
who
manage
other
portfolios,
an
enhanced
reputation
as
an
investment
adviser
which
may
help
in
attracting
other
clients
and
investment
personnel,
relationships
with
issuers
or
other
market
participants,
including
private
equity
sponsors,
the
engagement
of
affiliates
as
service
providers
to
the
Funds,
research
received
by
the
Adviser
generated
from
soft
dollar
commissions
for
portfolio
trading,
and
fees
collected
by
affiliates
for
services
provided
to
the
Funds.
The
Board
noted
that
such
benefits
were
difficult
to
quantify
but
were
consistent
with
benefits
received
by
other
fund
advisers.
Based
on
the
factors
discussed
above,
the
Contracts
Committee
unanimously
recommended
approval
of
the
Advisory
Agreement,
and
the
Board,
including
all
of
the
Independent
Trustees
voting
separately,
approved
the
Advisory
Agreement.
Item 8. Changes in and Disagreements with Accountants for Open-End Management Investment Companies.
Not applicable.
Item 9. Proxy Disclosures for Open-End Management Investment Companies.
Not applicable.
Item 10. Remuneration Paid to Directors, Officers, and Others of Open-End Management Investment Companies.
The information is disclosed in the Statement of Operations and as part of the Fees and Compensation Paid to Affiliates section of the Notes to Financial Statements included in Item 7 of this Form N-CSR.
Item 11. Statement Regarding Basis for Approval of Investment Advisory Contract.
Information is included in the financial statements filed under Item 7 of this Form N-CSR.
Item 12. Disclosure of Proxy Voting Policies and Procedures for Closed-End Management Investment Companies
Not applicable.
Item 13. Portfolio Managers of Closed-End Management Investment Companies
Not applicable.
Item 14. Purchases of Equity Securities by Closed-End Management Investment Company and Affiliated Purchasers
Not applicable.
Item 15. Submission of Matters to a Vote of Security Holders
There have been no material changes to the procedures by which shareholders may recommend nominees to registrant’s board of trustees since the registrant last provided disclosure in response to this Item.
Item 16. Controls and Procedures
(a) Registrant’s principal executive and principal financial officers, or persons performing similar functions, have concluded that registrant’s disclosure controls and procedures (as defined in Rule 30a-3(c) under the Investment Company Act of 1940) are effective, based on their evaluation of these controls and procedures as of a date within 90 days of the filing date of this report.
(b) There were no changes in registrant’s internal control over financial reporting (as defined in Rule 30a-3(d) under the Investment Company Act of 1940) that occurred during the period covered by this report that have materially affected, or are reasonably likely to materially affect, registrant’s internal control over financial reporting.
Item 17. Disclosure of Securities Lending Activities for Closed-End Management Investment Companies
Not applicable.
Item 18. Recovery of Erroneously Awarded Compensation.
Not applicable.
Item 19. Exhibits
(a)(2) Any policy required by the listing standards adopted pursuant to Rule 10D-1 under the Exchange Act (17 CFR 240.10D-1) by the registered national securities exchange or registered national securities association upon which the registrant’s securities are listed: Not applicable.
(a)(4) Any written solicitation to purchase securities under Rule 23c-1 under the 1940 Act (17 CFR 270.23c-1) sent or given during the period covered by the report by or on behalf of the registrant to 10 or more persons: Not applicable.
(a)(5) Change in the registrant’s independent public accountant: Not applicable.
Signatures
Pursuant to the requirements of the Securities Exchange Act of 1934 and the Investment Company Act of 1940, the registrant has duly caused this report to be signed on its behalf by the undersigned, thereunto duly authorized.
Date: February 24, 2025 Thrivent Mutual Funds
By: /s/ Michael W. Kremenak
Michael W. Kremenak
President
Pursuant to the requirements of the Securities Exchange Act of 1934 and the Investment Company Act of 1940, this report has been signed below by the following persons on behalf of the registrant and in the capacities and on the dates indicated.
Date: February 24, 2025 By: /s/ Michael W. Kremenak
Michael W. Kremenak
President
(principal executive officer)
Date: February 24, 2025 By: /s/ Sarah L. Bergstrom
Sarah L. Bergstrom
Treasurer and Principal Accounting Officer
(principal financial officer)