| UNITED STATES | |
| SECURITIES AND EXCHANGE COMMISSION | |
| Washington, D.C. 20549 | |
| FORM N-CSR | |
| CERTIFIED SHAREHOLDER REPORT OF REGISTERED | |
| MANAGEMENT INVESTMENT COMPANIES | |
| Investment Company Act file number 811- 5079 | |
| John Hancock Tax-Exempt Series Fund | |
| (Exact name of registrant as specified in charter) | |
| 601 Congress Street, Boston, Massachusetts 02210 | |
| (Address of principal executive offices) (Zip code) | |
| Michael J. Leary | |
| Treasurer | |
| 601 Congress Street | |
| Boston, Massachusetts 02210 | |
| (Name and address of agent for service) | |
| Registrant's telephone number, including area code: 617-663-4490 | |
| Date of fiscal year end: | May 31 |
| Date of reporting period: | November 30, 2009 |
ITEM 1. REPORT TO SHAREHOLDERS.
A look at performance
| For the period ended November 30, 2009 | |||||||||||||||
| Average annual returns (%) | Cumulative total returns (%) | SEC 30- | |||||||||||||
| with maximum sales charge (POP) | with maximum sales charge (POP) | ||||||||||||||
| Six | |||||||||||||||
| Class | 1-year | 5-year | 10-year | months | 1-year | 5-year | 10-year | ||||||||
| A | 6.89 | 2.72 | 4.52 | 0.78 | 6.89 | 14.37 | 55.53 | 3.71 | |||||||
| B | 6.18 | 2.60 | 4.41 | 0.19 | 6.18 | 13.68 | 53.99 | 3.17 | |||||||
| C | 10.18 | 2.94 | 4.27 | 4.19 | 10.18 | 15.61 | 51.85 | 3.18 | |||||||
Performance figures assume all distributions are reinvested. Public offering price (POP) figures reflect maximum sales charges on Class A shares of 4.5% and the applicable contingent deferred sales charge (CDSC) on Class B shares and Class C shares. The returns for Class C shares have been adjusted to reflect the elimination of the front-end sales charge effective July 15, 2004. The Class B shares’ CDSC declines annually between years 1 to 6 according to the following schedule: 5, 4, 3, 3, 2, 1%. No sales charge will be assessed after the sixth year. Class C shares held for less than one year are subject to a 1% CDSC.
The expense ratios of the Fund, both net (including any fee waivers or expense limitations) and gross (excluding any fee waivers or expense limitations), are set forth according to the most recent publicly available prospectus for the Fund and may differ from the expense ratios disclosed in the Financial Highlights tables in this report. The net expenses equal the gross expenses and are as follows: Class A — 1.13%, Class B — 1.83% and Class C — 1.83%.
The returns reflect past results and should not be considered indicative of future performance. The return and principal value of an investment will fluctuate so that shares, when redeemed, may be worth more or less than their original cost. Due to market volatility, the Fund’s current performance may be higher or lower than the performance shown. For current to the most recent month end performance data, please call 1–800–225–5291 or visit the Fund’s Web site at www.jhfunds.com.
The performance table above and the chart on the next page do not reflect the deduction of taxes that a shareholder may pay on fund distributions or on the redemption of fund shares. Please note that a portion of the Fund’s income may be subject to taxes, and on some investors may be subject to the Alternative Minimum Tax (AMT). Also note that capital gains are taxable.
The Fund’s performance results reflect any applicable fee waivers or expense reductions, without which the expenses would increase and results would have been less favorable.
| 6 | New York Tax-Free Income Fund | Semiannual report |
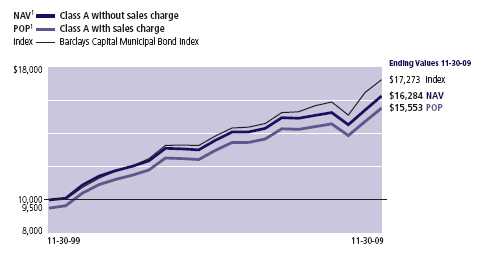
Growth of $10,000
This chart shows what happened to a hypothetical $10,000 investment in John Hancock New York Tax-Free Income Fund Class A shares for the period indicated. For comparison, we’ve shown the same investment in the Barclays Capital Municipal Bond Index.
| With maximum | |||||||
| Class | Period beginning | Without sales charge | sales charge | Index | |||
| B2 | 11-30-99 | $15,399 | $15,399 | $17,273 | |||
| C2 | 11-30-99 | 15,185 | 15,185 | 17,273 | |||
Assuming all distributions were reinvested for the period indicated, the table above shows the value of a $10,000 investment in the Fund’s Class B and Class C shares, respectively, as of November 30, 2009. The Class C shares investment with maximum sales charge has been adjusted to reflect the elimination of the front-end sales charge effective July 15, 2004. Performance of the classes will vary based on the difference in sales charges paid by shareholders investing in the different classes and the fee structure of those classes.
Barclays Capital Municipal Bond Index is an unmanaged index representative of the tax-exempt bond market.
It is not possible to invest directly in an index. Index figures do not reflect sales charges or direct expenses, which would have resulted in lower values if they did.
1 NAV represents net asset value and POP represents public offering price.
2 No contingent deferred sales charge applicable.
| Semiannual report | New York Tax-Free Income Fund | 7 |
Your expenses
These examples are intended to help you understand your ongoing operating expenses.
Understanding fund expenses
As a shareholder of the Fund, you incur two types of costs:
▪ Transaction costs which include sales charges (loads) on purchases or redemptions (varies by share class), minimum account fee charge, etc.
▪ Ongoing operating expenses including management fees, distribution and service fees (if applicable), and other fund expenses.
We are going to present only your ongoing operating expenses here.
Actual expenses/actual returns
This example is intended to provide information about your fund’s actual ongoing operating expenses, and is based on your fund’s actual return. It assumes an account value of $1,000.00 on June 1, 2009 with the same investment held until November 30, 2009.
| Account value | Ending value | Expenses paid during | |||
| on 6-1-09 | on 11-30-09 | period ended 11-30-091 | |||
| Class A | $1,000.00 | $1,055.60 | $5.82 | ||
| Class B | 1,000.00 | 1,051.90 | 9.46 | ||
| Class C | 1,000.00 | 1,051.90 | 9.41 | ||
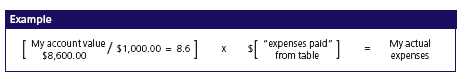
Together with the value of your account, you may use this information to estimate the operating expenses that you paid over the period. Simply divide your account value at November 30, 2009, by $1,000.00, then multiply it by the “expenses paid” for your share class from the table above. For example, for an account value of $8,600.00, the operating expenses should be calculated as follows:
| 8 | New York Tax-Free Income Fund | Semiannual report |
Hypothetical example for comparison purposes
This table allows you to compare your fund’s ongoing operating expenses with those of any other fund. It provides an example of the Fund’s hypothetical account values and hypothetical expenses based on each class’s actual expense ratio and an assumed 5% annualized return before expenses (which is not your fund’s actual return). It assumes an account value of $1,000.00 on June 1, 2009, with the same investment held until November 30, 2009. Look in any other fund shareholder report to find its hypothetical example and you will be able to compare these expenses.
| Account value | Ending value | Expenses paid during | |||
| on 6-1-09 | on 11-30-09 | period ended 11-30-091 | |||
| Class A | $1,000.00 | $1,019.40 | $5.72 | ||
| Class B | 1,000.00 | 1,015.80 | 9.30 | ||
| Class C | 1,000.00 | 1,015.90 | 9.25 | ||
Remember, these examples do not include any transaction costs, therefore, these examples will not help you to determine the relative total costs of owning different funds. If transaction costs were included, your expenses would have been higher. See the prospectus for details regarding transaction costs.
1 Expenses are equal to the Fund’s annualized expense ratio of 1.13%, 1.84% and 1.83% for Class A, Class B and Class C shares, respectively, multiplied by the average account value over the period, multiplied by 183/365 (to reflect the one-half year period).
| Semiannual report | New York Tax-Free Income Fund | 9 |
Portfolio summary
| Top 10 Holdings1 | ||||
| Metropolitan Transportation Authority, 11-15-34, 5.000% | 4.5% | |||
| Puerto Rico Aqueduct & Sewer Authority, 07-01-11, 10.021% | 3.8% | |||
| New York State Dormitory Authority, 05-15-19, 5.500% | 3.7% | |||
| New York City Industrial Development Agency 03-01-15, 6.250% | 3.2% | |||
| Oneida County Industrial Development Agency, 07-01-29, Zero | 3.1% | |||
| Triborough Bridge & Tunnel Authority, 01-01-21, 6.125% | 3.1% | |||
| Long Island Power Authority, 04-01-39, 5.750% | 2.6% | |||
| City of New York, 12-01-17, 5.250% | 2.5% | |||
| Puerto Rico Sales Tax Financing Authority, 08-01-32, Zero | 2.4% | |||
| New York Local Assistance Corp., 05-01-23, 5.375% | 2.3% | |||
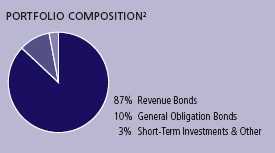
| Sector Composition2,3 | ||||
| General Obligation Bonds | 3% | Development | 4% | |
| Revenue Bonds | Power | 4% | ||
| Education | 20% | Facilities | 4% | |
| Other Revenue | 18% | Tobacco | 3% | |
| Water & Sewer | 11% | Health Care Services | 2% | |
| Health Care | 9% | Industrial Development | 2% | |
| Utilities | 7% | Pollution | 1% | |
| Transportation | 5% | Short-Term Investments & Other | 2% | |
| Airport | 5% | |||
| Quality Composition2 | ||||
| AAA | 31% | BB | 2% | |
| AA | 25% | B | 1% | |
| A | 19% | Other | 2% | |
| BBB | 20% | |||
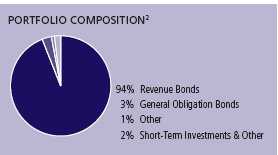
1 As a percentage of net assets on November 30, 2009. Excludes cash and cash equivalents.
2 As a percentage of net assets on November 30, 2009.
3 Investments focused in one sector may fluctuate more widely than investments across multiple sectors. Because the Fund may focus on particular sectors, its performance may depend on the performance of those sectors.
| 10 | New York Tax-Free Income Fund | Semiannual report |
Fund’s investments
As of 11-30-09 (unaudited)
| Maturity | |||||
| Rate | date | Par value | Value | ||
| Municipal Bonds 97.38% | $61,125,654 | ||||
| (Cost $58,613,384) | |||||
| Guam 0.81% | 508,750 | ||||
| Guam Government, | |||||
| Section 30, Series A | 5.750% | 12-01-34 | $500,000 | 508,750 | |
| New York 83.47% | 52,395,251 | ||||
| Albany Parking Authority, | |||||
| Prerefunded, Series A | 5.625 | 07-15-25 | 385,000 | 420,782 | |
| Unrefunded, Series A | 5.625 | 07-15-25 | 365,000 | 370,522 | |
| Chautauqua Asset Securitization Corp. | 6.750 | 07-01-40 | 1,000,000 | 1,000,390 | |
| City of New York, | |||||
| General Obligation, Series B | 5.250 | 12-01-17 | 1,500,000 | 1,597,680 | |
| General Obligation, Series E-1 | 6.250 | 10-15-28 | 500,000 | 581,295 | |
| Herkimer County Industrial | |||||
| Development Agency, | |||||
| Folts Adult Home Inc., Series A | 5.500 | 03-20-40 | 985,000 | 1,048,316 | |
| Long Island Power Authority, | |||||
| Series A | 6.000 | 05-01-33 | 1,000,000 | 1,118,980 | |
| Series A | 5.750 | 04-01-39 | 1,500,000 | 1,601,220 | |
| Metropolitan Transportation Authority, | |||||
| Series A | 5.250 | 11-15-28 | 1,000,000 | 1,083,140 | |
| Series B | 5.000 | 11-15-34 | 2,750,000 | 2,823,755 | |
| Monroe Newpower Corp. | 5.100 | 01-01-16 | 1,000,000 | 991,400 | |
| Nassau County Industrial Development Agency, | |||||
| North Shore Health Systems, Series A | 6.250 | 11-01-21 | 275,000 | 282,827 | |
| New York City Industrial | |||||
| Development Agency, | |||||
| Airis JFK I LLC. Project, Series A, AMT | 5.500 | 07-01-28 | 1,000,000 | 710,500 | |
| Brooklyn Navy Yard Cogeneration Partners, AMT | 5.650 | 10-01-28 | 1,000,000 | 762,820 | |
| Lycee Francais De NY Project, Series A (D) | 5.375 | 06-01-23 | 1,000,000 | 1,027,430 | |
| Polytechnic Projects University | 6.125 | 11-01-30 | 1,000,000 | 1,063,610 | |
| Polytechnic Projects University (D) | 5.250 | 11-01-27 | 1,000,000 | 906,050 | |
| Terminal One Group Association Project (P), AMT | 5.500 | 01-01-21 | 1,000,000 | 1,014,910 | |
| World Trade Center Project, Series A | 6.250 | 03-01-15 | 2,000,000 | 1,977,620 | |
| New York City Municipal Water | |||||
| Finance Authority, | |||||
| Fiscal 2009, Series A (V) | 5.750 | 06-15-40 | 1,000,000 | 1,096,800 | |
| Second Gen. Resolution, Series GG-1 | 5.000 | 06-15-39 | 1,000,000 | 1,019,750 | |
| Series C | Zero | 06-15-33 | 300,000 | 300,000 | |
| Series D | Zero | 06-15-20 | 2,000,000 | 1,346,860 | |
| Series FF-2 | 5.000 | 06-15-40 | 1,000,000 | 1,015,220 | |
| Unrefunded, Series B | 6.000 | 06-15-33 | 460,000 | 477,061 | |
See notes to financial statements
| Semiannual report | New York Tax-Free Income Fund | 11 |
| Maturity | |||||
| Rate | date | Par value | Value | ||
| New York (continued) | |||||
| New York City Transitional | |||||
| Finance Authority, | |||||
| Series A (Zero step up to 7-1-10 then 6.05%) | Zero | 11-01-29 | $1,000,000 | $969,190 | |
| Series B | 6.000% | 11-15-29 | 1,000,000 | 1,036,210 | |
| Series S-4 | 5.500 | 01-15-39 | 1,000,000 | 1,060,280 | |
| New York Local Assistance Corp., | |||||
| Series C | 5.500 | 04-01-17 | 1,225,000 | 1,436,374 | |
| New York State Dormitory Authority, | |||||
| City University 4th, Series A | 5.250 | 07-01-31 | 130,000 | 139,786 | |
| Long Island Jewish Medical Center | 5.375 | 05-01-23 | 1,000,000 | 1,147,320 | |
| Miriam Osborn Memorial Home Association, | |||||
| Series B (D) | 6.875 | 07-01-25 | 750,000 | 763,478 | |
| Mount Sinai School of Medicine | 5.125 | 07-01-39 | 1,000,000 | 982,760 | |
| Orange Regional Medical Center | 6.125 | 12-01-29 | 750,000 | 685,935 | |
| St. Luke Roosevelt Hospital, Series B | Zero | 08-15-40 | 3,000,000 | 438,270 | |
| State University (D) | 5.250 | 05-15-15 | 1,000,000 | 1,095,790 | |
| State University Dormitory, Series A | 6.000 | 07-01-30 | 1,000,000 | 1,043,820 | |
| State University Facilities, Series A | 5.500 | 05-15-19 | 2,000,000 | 2,289,520 | |
| University of Rochester, Series A | |||||
| (Zero step up to 11-1-11 then 14.00%) (D) | Zero | 07-01-25 | 1,000,000 | 1,005,870 | |
| New York State Environmental | |||||
| Facilities Corp., | |||||
| Series A | 5.000 | 06-15-34 | 1,000,000 | 1,029,030 | |
| Unrefunded, Series E | 6.875 | 06-15-10 | 10,000 | 10,054 | |
| Oneida County Industrial Development Agency, | |||||
| Hamilton College, Series A (D) | Zero | 07-01-29 | 5,330,000 | 1,969,595 | |
| Onondaga County Industrial | |||||
| Development Agency, | |||||
| Aero Syracuse LLC., AMT | 6.125 | 01-01-32 | 1,000,000 | 800,110 | |
| Orange County Industrial Development Agency, | |||||
| Arden Hill Care Center, Series C | 7.000 | 08-01-31 | 500,000 | 440,490 | |
| Port Authority of New York & New Jersey, | |||||
| KICA Partners, AMT | 6.750 | 10-01-19 | 1,500,000 | 1,253,265 | |
| Suffolk County Industrial Development Agency, | |||||
| Huntington Hospital Project, Series B | 6.000 | 11-01-22 | 1,000,000 | 1,023,260 | |
| Triborough Bridge & Tunnel Authority, | |||||
| Series Y (D) | 6.125 | 01-01-21 | 1,500,000 | 1,909,950 | |
| Tsasc, Inc., Tobacco Settlement, | |||||
| Series 1 | 5.500 | 07-15-24 | 700,000 | 770,028 | |
| Upper Mohawk Valley Regional Water Finance | |||||
| Authority, (D) | Zero | 04-01-22 | 2,230,000 | 1,277,099 | |
| Westchester County Healthcare Corp., | |||||
| Series A | 6.000 | 11-01-30 | 1,150,000 | 1,110,129 | |
| Yonkers Industrial Development Agency, | |||||
| Yonkers, Inc., Series A | 6.625 | 02-01-26 | 1,000,000 | 1,068,700 | |
| Puerto Rico 9.76% | 6,126,973 | ||||
| Puerto Rico Aqueduct & Sewer Authority, | |||||
| (D) (P) | 10.021 | 07-01-11 | 2,000,000 | 2,347,760 | |
| Puerto Rico Public Building Authority, | |||||
| Series A (D) | 6.250 | 07-01-12 | 1,110,000 | 1,188,355 | |
| Puerto Rico Public Finance Corp., | |||||
| Prerefunded, Series E | 5.500 | 08-01-29 | 1,005,000 | 1,103,078 | |
| Puerto Rico Sales Tax Financing Authority, | |||||
| Capital Appreciation, Series A | Zero | 08-01-32 | 2,000,000 | 1,487,780 | |
See notes to financial statements
| 12 | New York Tax-Free Income Fund | Semiannual report |
| Maturity | |||||
| Rate | date | Par value | Value | ||
| Virgin Islands 3.34% | $2,094,680 | ||||
| Virgin Islands Public Finance Authority, | |||||
| Series A | 6.750% | 10-01-37 | $1,000,000 | 1,046,760 | |
| Series A | 6.500 | 10-01-24 | 535,000 | 568,010 | |
| Sr Lien/Cap Projs, Series A–1 | 5.000 | 10-01-29 | 500,000 | 479,910 | |
| Par value | Value | ||||
| Short-Term Investments 1.38% | $864,000 | ||||
| (Cost $864,000) | |||||
| Repurchase Agreement 1.38% | 864,000 | ||||
| Repurchase Agreement with State Street Corp. dated 11-30-09 | |||||
| at 0.05% to be repurchased at $864,001 on 12-01-09, | |||||
| collateralized by $885,000 U.S. Treasury Bills, zero coupon | |||||
| due 05-13-10 (valued at $884,558) | $864,000 | 864,000 | |||
| Total investments (Cost $59,477,384)† 98.76% | $61,989,654 | ||||
| Other assets and liabilities, net 1.24% | $781,140 | ||||
| Total net assets 100.00% | $62,770,794 | ||||
The percentage shown for each investment category is the total value of the category as a percentage of the net assets of the Fund.
AMT Interest earned from these securities may be considered a tax preference item for purposes of the Federal Alternative Minimum Tax.
(D) Bond is insured by one of these companies:
| Insurance coverage | As a % of total investments | |||
| Ambac Financial Group, Inc. | 4.35% | |||
| Assured Guarantee Corp. | 3.98% | |||
| National Public Finance Guarantee Insurance Corp. | 10.35% | |||
(P) Variable rate obligation. The coupon rate shown represents the rate at period end.
(V) Variable rate demand notes are securities whose interest rates are reset periodically at market levels. These securities are often payable on demand and are shown at their current rates as of November 30, 2009.
† At November 30, 2009, the aggregate cost of investment securities for federal income tax purposes was $59,385,257. Net unrealized appreciation aggregated $2,604,397, of which $3,902,117 related to appreciated investment securities and $1,297,720 related to depreciated investment securities.
See notes to financial statements
| Semiannual report | New York Tax-Free Income Fund | 13 |
F I N A N C I A L S T A T E M E N T S
Financial statements
Statement of assets and liabilities 11-30-09 (unaudited)
This Statement of Assets and Liabilities is the Fund’s balance sheet. It shows the value of what the Fund owns, is due and owes. You’ll also find the net asset value and the maximum offering price per share.
| Assets | |
| Investments, at value (Cost $59,477,384) | $61,989,654 |
| Cash | 732 |
| Receivable for fund shares sold | 66,105 |
| Interest receivable | 816,767 |
| Other receivables and prepaid assets | 4,334 |
| Total assets | 62,877,592 |
| Liabilities | |
| Distributions payable | 57,733 |
| Payable to affiliates | |
| Accounting and legal services fees | 689 |
| Transfer agent fees | 3,436 |
| Distribution and service fees | 5,543 |
| Trustees’ fees | 765 |
| Other liabilities and accrued expenses | 38,632 |
| Total liabilities | 106,798 |
| Net assets | |
| Capital paid-in | $60,609,366 |
| Undistributed net investment income | 25,786 |
| Accumulated net realized loss on investments | (376,628) |
| Net unrealized appreciation on investments | 2,512,270 |
| Net assets | $62,770,794 |
| Net asset value per share | |
| Based on net asset values and shares outstanding — the Fund has an | |
| unlimited number of shares authorized with no par value | |
| Class A ($52,454,042 ÷ 4,375,371 shares) | $11.99 |
| Class B ($3,807,656 ÷ 317,583 shares)1 | $11.99 |
| Class C ($6,509,096 ÷ 542,879 shares)1 | $11.99 |
| Maximum offering price per share | |
| Class A (net asset value per share ÷ 95.5%)2 | $12.55 |
1 Redemption price per share is equal to the net asset value less any applicable contingent deferred sales charge.
2 On single retail sales of less than $100,000. On sales of $100,000 or more and on group sales the offering price is reduced.
See notes to financial statements
| 14 | New York Tax-Free Income Fund | Semiannual report |
F I N A N C I A L S T A T E M E N T S
Statement of operations For the period ended 11-30-09 (unaudited)
This Statement of Operations summarizes the Fund’s investment income earned and expenses incurred in operating the Fund. It also shows net gains (losses) for the period stated.
| Investment income | |
| Interest | $1,631,049 |
| Total investment income | 1,631,049 |
| Expenses | |
| Investment management fees (Note 4) | 152,049 |
| Distribution and service fees (Note 4) | 128,418 |
| Accounting and legal services fees (Note 4) | 7,080 |
| Transfer agent fees (Note 4) | 25,071 |
| Trustees’ fees (Note 5) | 1,725 |
| State registration fees | 2,576 |
| Printing and postage fees | 6,131 |
| Professional fees | 38,659 |
| Custodian fees | 9,381 |
| Registration and filing fees | 7,885 |
| Other | 2,064 |
| Total expenses | 381,039 |
| Less expense reductions (Note 4) | (1,185) |
| Net expenses | 379,854 |
| Net investment income | 1,251,195 |
| Realized and unrealized gain | |
| Net realized gain on investments | 57,515 |
| Change in net unrealized appreciation (depreciation) of investments | 1,925,193 |
| Net realized and unrealized gain | 1,982,708 |
| Increase in net assets from operations | $3,233,903 |
1 Semiannual period from 6-1-09 to 11-30-09.
See notes to financial statements
| Semiannual report | New York Tax-Free Income Fund | 15 |
F I N A N C I A L S T A T E M E N T S
Statements of changes in net assets
These Statements of Changes in Net Assets show how the value of the Fund’s net assets has changed during the last three periods. The difference reflects earnings less expenses, any investment gains and losses, distributions, if any, paid to shareholders and the net of Fund share transactions.
| Period | Period | Year | |
| ended | ended | ended | |
| 11-30-091 | 5-31-092 | 8-31-08 | |
| Increase (decrease) in net assets | |||
| From operations | |||
| Net investment income | $1,251,195 | $1,745,859 | $2,224,738 |
| Net realized gain (loss) | 57,515 | 148,292 | (43,829) |
| Change in net unrealized appreciation (depreciation) | 1,925,193 | (1,746,498) | (277,248) |
| Increase in net assets resulting from operations | 3,233,903 | 147,653 | 1,903,661 |
| Distributions to shareholders | |||
| From net investment income | |||
| Class A | (1,050,310) | (1,423,219) | (1,769,992) |
| Class B | (78,572) | (182,377) | (324,308) |
| Class C | (110,341) | (121,788) | (110,644) |
| From net realized gain | |||
| Total distributions | (1,239,223) | (1,727,384) | (2,204,944) |
| From Fund share transactions (Note 6) | 3,265,990 | 4,184,575 | 725,279 |
| Total increase | 5,260,670 | 2,604,844 | 423,996 |
| Net assets | |||
| Beginning of period | 57,510,124 | 54,905,280 | 54,481,284 |
| End of period | $62,770,794 | $57,510,124 | $54,905,280 |
| Undistributed net investment income | $25,786 | $13,814 | $19,069 |
1 Semiannual period from 6-1-09 to 11-30-09. Unaudited.
2 For the nine month period ended May 31, 2009. The Fund changed its fiscal year end from August 31 to May 31.
See notes to financial statements
| 16 | New York Tax-Free Income Fund | Semiannual report |
Financial highlights
The Financial Highlights show how the Fund’s net asset value for a share has changed since the end of the previous period.
| CLASS A SHARES Period ended | 11-30-091 | 5-31-092 | 8-31-08 | 8-31-07 | 8-31-06 | 8-31-05 | 8-31-04 |
| Per share operating performance | |||||||
| Net asset value, beginning of period | $11.60 | $11.96 | $12.03 | $12.40 | $12.61 | $12.46 | $12.10 |
| Net investment income3 | 0.25 | 0.38 | 0.51 | 0.52 | 0.52 | 0.52 | 0.54 |
| Net realized and unrealized gain (loss) | |||||||
| on investments | 0.39 | (0.36) | (0.07) | (0.37) | (0.21) | 0.15 | 0.36 |
| Total from investment operations | 0.64 | 0.02 | 0.44 | 0.15 | 0.31 | 0.67 | 0.90 |
| Less distributions | |||||||
| From net investment income | (0.25) | (0.38) | (0.51) | (0.52) | (0.52) | (0.52) | (0.54) |
| Net asset value, end of period | $11.99 | $11.60 | $11.96 | $12.03 | $12.40 | $12.61 | $12.46 |
| Total return (%)4 | 5.565 | 0.285 | 3.73 | 1.18 | 2.54 | 5.50 | 7.546 |
| Ratios and supplemental data | |||||||
| Net assets, end of period (in millions) | $52 | $46 | $44 | $40 | $43 | $44 | $44 |
| Ratios (as a percentage of average net | |||||||
| assets): | |||||||
| Expenses before reductions | 1.137 | 1.197,8 | 1.04 | 1.03 | 1.03 | 1.06 | 1.02 |
| Expenses net of fee waivers | 1.137 | 1.197,8 | 1.04 | 1.03 | 1.03 | 1.06 | 1.01 |
| Expenses net of fee waivers | |||||||
| and credits | 1.137 | 1.197,8 | 1.04 | 1.03 | 1.03 | 1.06 | 1.01 |
| Net investment income | 4.267 | 4.507 | 4.28 | 4.22 | 4.20 | 4.18 | 4.35 |
| Portfolio turnover (%) | 6 | 22 | 25 | 17 | 32 | 25 | 43 |
1 Semiannual period from 6-1-09 to 11-30-09. Unaudited.
2 For the nine month period ended May 31, 2009. The Fund changed its fiscal year end from August 31 to May 31.
3 Based on the average daily shares outstanding.
4 Assumes dividend reinvestment (if applicable).
5 Not annualized.
6 Total returns would have been lower had certain expenses not been reduced during the periods shown.
7 Annualized.
8 Includes the impact of proxy expenses, which amounted to 0.04% of average net assets.
See notes to financial statements
| Semiannual report | New York Tax-Free Income Fund | 17 |
| CLASS B SHARES Period ended | 11-30-091 | 5-31-092 | 8-31-08 | 8-31-07 | 8-31-06 | 8-31-05 | 8-31-04 |
| Per share operating performance | |||||||
| Net asset value, beginning | |||||||
| of period | $11.60 | $11.96 | $12.03 | $12.40 | $12.61 | $12.46 | $12.10 |
| Net investment income3 | 0.21 | 0.32 | 0.43 | 0.43 | 0.43 | 0.43 | 0.45 |
| Net realized and unrealized gain | |||||||
| (loss) on investments | 0.39 | (0.36) | (0.07) | (0.37) | (0.21) | 0.15 | 0.36 |
| Total from investment operations | 0.60 | (0.04) | 0.36 | 0.06 | 0.22 | 0.58 | 0.81 |
| Less distributions | |||||||
| From net investment income | (0.21) | (0.32) | (0.43) | (0.43) | (0.43) | (0.43) | (0.45) |
| Net asset value, end of period | $11.99 | $11.60 | $11.96 | $12.03 | $12.40 | $12.61 | $12.46 |
| Total return (%)4 | 5.195 | (0.24)5 | 3.01 | 0.48 | 1.83 | 4.77 | 6.806 |
| Ratios and supplemental data | |||||||
| Net assets, end of period (in millions) | $4 | $6 | $8 | $11 | $14 | $17 | $20 |
| Ratios (as a percentage of average | |||||||
| net assets): | |||||||
| Expenses before reductions | 1.847 | 1.897,8 | 1.74 | 1.73 | 1.73 | 1.76 | 1.72 |
| Expenses net of fee waivers | 1.847 | 1.897,8 | 1.74 | 1.73 | 1.73 | 1.76 | 1.71 |
| Expenses net of fee waivers | |||||||
| and credits | 1.847 | 1.897,8 | 1.74 | 1.73 | 1.73 | 1.76 | 1.71 |
| Net investment income | 3.577 | 3.807 | 3.57 | 3.52 | 3.50 | 3.48 | 3.65 |
| Portfolio turnover (%) | 6 | 22 | 25 | 17 | 32 | 25 | 43 |
1 Semiannual period from 6-1-09 to 11-30-09. Unaudited.
2 For the nine month period ended May 31, 2009. The Fund changed its fiscal year end from August 31 to May 31.
3 Based on the average daily shares outstanding.
4 Assumes dividend reinvestment (if applicable).
5 Not annualized.
6 Total returns would have been lower had certain expenses not been reduced during the periods shown.
7 Annualized.
8 Includes the impact of proxy expenses, which amounted to 0.04% of average net assets.
| CLASS C SHARES Period ended | 11-30-091 | 5-31-092 | 8-31-08 | 8-31-07 | 8-31-06 | 8-31-05 | 8-31-04 |
| Per share operating performance | |||||||
| Net asset value, beginning | |||||||
| of period | $11.60 | $11.96 | $12.03 | $12.40 | $12.61 | $12.46 | $12.10 |
| Net investment income3 | 0.21 | 0.32 | 0.43 | 0.43 | 0.43 | 0.43 | 0.45 |
| Net realized and unrealized gain | |||||||
| (loss) on investments | 0.39 | (0.36) | (0.07) | (0.37) | (0.21) | 0.15 | 0.36 |
| Total from investment operations | 0.60 | (0.04) | 0.36 | 0.06 | 0.22 | 0.58 | 0.81 |
| Less distributions | |||||||
| From net investment income | (0.21) | (0.32) | (0.43) | (0.43) | (0.43) | (0.43) | (0.45) |
| Net asset value, end of period | $11.99 | $11.60 | $11.96 | $12.03 | $12.40 | $12.61 | $12.46 |
| Total return (%)4 | 5.195 | (0.24)5 | 3.01 | 0.48 | 1.83 | 4.77 | 6.806 |
| Ratios and supplemental data | |||||||
| Net assets, end of period | |||||||
| (in millions) | $7 | $6 | $3 | $4 | $3 | $5 | $5 |
| Ratios (as a percentage of average | |||||||
| net assets): | |||||||
| Expenses before reductions | 1.837 | 1.897,8 | 1.74 | 1.73 | 1.73 | 1.76 | 1.72 |
| Expenses net of fee waivers | 1.837 | 1.897,8 | 1.74 | 1.73 | 1.73 | 1.76 | 1.71 |
| Expenses net of fee waivers | |||||||
| and credits | 1.837 | 1.897,8 | 1.74 | 1.73 | 1.73 | 1.76 | 1.71 |
| Net investment income | 3.547 | 3.797 | 3.57 | 3.51 | 3.50 | 3.48 | 3.65 |
| Portfolio turnover (%) | 6 | 22 | 25 | 17 | 32 | 25 | 43 |
1 Semiannual period from 6-1-09 to 11-30-09. Unaudited.
2 For the nine month period ended May 31, 2009. The Fund changed its fiscal year end from August 31 to May 31.
3 Based on the average daily shares outstanding.
4 Assumes dividend reinvestment (if applicable).
5 Not annualized.
6 Total returns would have been lower had certain expenses not been reduced during the periods shown.
7 Annualized.
8 Includes the impact of proxy expenses, which amounted to 0.04% of average net assets.
See notes to financial statements
| 18 | New York Tax-Free Income Fund | Semiannual report |
Notes to financial statements
(unaudited)
Note 1
Organization
John Hancock New York Tax-Free Income Fund (the Fund) is a non-diversified series of John Hancock Tax-Exempt Series Fund (the Trust), an open-end management investment company registered under the Investment Company Act of 1940, as amended (the 1940 Act). The investment objective of the Fund is to seek a high level of current income, consistent with preservation of capital, that is exempt from federal, New York State and New York City personal income taxes.
John Hancock Advisers, LLC (the Adviser) serves as investment adviser for the Fund. John Hancock Funds, LLC (the Distributor), an affiliate of the Adviser, serves as principal underwriter of the Fund. The Adviser and the Distributor are indirect wholly owned subsidiaries of Manulife Financial Corporation (MFC).
The Trustees have authorized the issuance of multiple classes of shares of the Fund, designated as Class A, Class B and Class C shares. The shares of each class represent an interest in the same portfolio of investments of the Fund and have equal rights as to voting, redemptions, dividends and liquidation, except that certain expenses, subject to the approval of the Trustees, may be applied differently to each class of shares in accordance with current regulations of the Securities and Exchange Commission and the Internal Revenue Service. Shareholders of a class that bears distribution and service expenses under the terms of a distribution plan have exclusive voting rights to that distribution plan. Class B shares will convert to Class A shares eight years after purchase.
Note 2
Significant accounting policies
The financial statements have been prepared in conformity with accounting principles generally accepted in the United States of America, which require management to make certain estimates and assumptions at the date of the financial statements. Actual results could differ from those estimates. Events or transactions occurring after period end through the date that the financial statements were issued, January 25, 2010, have been evaluated in the preparation of the financial statements. The following summarizes the significant accounting policies of the Fund:
Security valuation
Investments are stated at value as of the close of the regular trading on the New York Stock Exchange (NYSE), normally at 4:00 P.M., Eastern Time. Debt obligations are valued based on the evaluated prices provided by an independent pricing service, which utilizes both dealer-supplied quotes and electronic data processing techniques, which take into account factors such as institutional-size trading in similar groups of securities, yield, quality, coupon rate, maturity, type of issue, trading characteristics and other market data. Securities traded only in the over-the-counter market are valued at the last bid price quoted by brokers making markets in the securities at the close of trading. Debt obligations, where there are no prices available from an independent pricing service, are valued based on bid qu otations or evaluated prices, as applicable, obtained from broker-dealers or fair valued as described below. Certain short-term debt investments are valued at amortized cost.
Other assets and securities where market quotations are not readily available are valued at fair value as determined in good faith by the Fund’s Pricing Committee in accordance with procedures adopted by the Board of Trustees.
Fair value measurements
The Fund uses a three-tier hierarchy to prioritize the assumptions, referred to as inputs, used in valuation techniques to measure fair value. The three-tier hierarchy of inputs and the valuation techniques used are summarized below:
| Semiannual report | New York Tax-Free Income Fund | 19 |
Level 1 – Exchange-traded prices in active markets for identical securities. This technique is used for exchange-traded domestic common and preferred equities, certain foreign equities, warrants and rights.
Level 2 – Prices determined using significant observable inputs. Observable inputs may include quoted prices for similar securities, interest rates, prepayment speeds and credit risk. Prices for securities valued using these techniques are received from independent pricing vendors and are based on an evaluation of the inputs described. These techniques are used for certain domestic preferred equities, certain foreign equities, unlisted rights and warrants, and fixed income securities.
Level 3 – Prices determined using significant unobservable inputs. In situations where quoted prices or observable inputs are unavailable, such as when there is little or no market activity for an investment, unobservable inputs may be used. Unobservable inputs reflect the Fund’s Pricing Committee’s own assumptions about the factors that market participants would use in pricing an investment and would be based on the best information available. Securities using this technique are generally thinly traded or privately placed, and may be valued using broker quotes, which may include the use of the brokers’ own judgments about the assumptions that market participants would use.
The inputs or methodology used for valuing securities are not necessarily an indication of the risk associated with investing in those securities.
At November 30, 2009, total investments for the Fund are Level 2 under the hierarchy discussed above.
Security transactions and related
investment income
Investment security transactions are accounted for on a trade date plus one basis for daily net asset value calculations. However, for financial reporting purposes, investment transactions are reported on trade date. Interest income is accrued as earned. Dividend income is recorded on the ex-dividend date. Discounts/premiums are accreted/amortized for financial reporting purposes. Debt obligations may be placed in a non-accrual status and related interest income may be reduced by ceasing current accruals and writing off interest receivables when the collection of all or a portion of interest has become doubtful. The Fund uses the identified cost method for determining realized gain or loss on investments for both financial statement and federal income tax reporting purposes.
Repurchase agreements
The Fund may enter into repurchase agreements. When the Fund enters into a repurchase agreement through its custodian, it receives delivery of securities, the amount of which at the time of purchase and each subsequent business day is required to be maintained at such a level that the market value is generally at least 102% of the repurchase amount. The Fund will take receipt of all securities underlying the repurchase agreements it has entered into until such agreements expire. If the seller defaults, the Fund would suffer a loss to the extent that proceeds from the sale of underlying securities were less than the repurchase amount. The Fund may enter into repurchase agreements maturing within seven days with domestic dealers, banks or other financial institutions deemed to be creditworthy by the Adviser.
Line of credit
The Fund and other affiliated funds have entered into an agreement which enables them to participate in a $150 million unsecured committed line of credit with the Fund’s custodian. The Fund is permitted to have bank borrowings for temporary or emergency purposes, including the meeting of redemption requests that otherwise might require the untimely disposition of securities. Interest is charged to each participating fund based on its borrowings at a rate per annum equal to the Federal Funds rate plus 0.50%. In addition, a commitment fee of 0.08% per annum, payable at the end of each calendar quarter, based on the average daily-unused portion of the line of credit, is charged to each participating fund on a prorated basis based on average net assets. For the six-months ended November 30, 2009, there were no borrowings under the line of credit by the Fund.
| 20 | New York Tax-Free Income Fund | Semiannual report |
Pursuant to the custodian agreement, the custodian may, in its discretion, advance funds to the Fund to make properly authorized payments. When such payments result in an overdraft, the Fund is obligated to repay the custodian for any overdraft, including any costs or expenses associated with the overdraft. The custodian has a lien, security interest or security entitlement in any Fund property that is not segregated, to the maximum extent permitted by law to the extent of any overdraft.
Expenses
The majority of expenses are directly identifiable to an individual fund. Fund expenses that are not readily identifiable to a specific fund are allocated in such a manner as deemed equitable, taking into consideration, among other things, the nature and type of expense and the relative size of the funds. Expense estimates are accrued in the period to which they relate and adjustments are made when actual amounts are known.
Class allocations
Income, common expenses and realized and unrealized gains (losses) are determined at the fund level and allocated daily to each class of shares based on the appropriate net asset value of the respective classes. Distribution and service fees, if any, and transfer agent fees, for all classes are calculated daily at the class level based on the appropriate net asset value of each class and the specific expense rate(s) applicable to each class.
Federal income taxes
The Fund intends to qualify as a regulated investment company by complying with the applicable provisions of the Internal Revenue Code and will not be subject to federal income tax on taxable income that is distributed to shareholders. Therefore, no federal income tax provision is required.
For federal income tax purposes, the Fund has a $520,527 capital loss carryforward available, to the extent provided by regulations, to offset future net realized capital gains. To the extent that such carryforward is used by the Fund, it will reduce the amount of capital gain distribution to be paid. The loss carryforward expires as follows: May 31, 2010 — $104,542, May 31, 2011 — $414,533 and May 31, 2012 — $1,452.
As of May 31, 2009, the Fund had no uncertain tax positions that would require financial statement recognition, de-recognition, or disclosure. The Fund’s federal tax return is subject to examination by the Internal Revenue Service for a period of three years.
Distribution of income and gains
The Fund records distributions to shareholders from net investment income and net realized gains, if any, on the ex-dividend date. The Fund generally declares dividends daily and pays them monthly. Capital gain distributions, if any, are paid annually. During the nine-month period ended May 31, 2009, the tax character of distributions paid was as follows: ordinary income $283 and tax exempt income of $1,727,101. During the year ended August 31, 2008, the tax character of distributions paid was as follows: ordinary income $3,533 and tax exempt income of $2,201,411. Distributions paid by the Fund with respect to each class of shares are calculated in the same manner, at the same time and are in the same amount, except for the effect of expenses that may be applied differently to each class.
Such distributions on a tax basis, are determined in conformity with income tax regulations, which may differ from accounting principles generally accepted in the United States of America. Material distributions in excess of tax basis earnings and profits, if any, are reported in the Fund’s financial statements as a return of capital.
Note 3
Guarantees and indemnifications
Under the Fund’s organizational documents, its Officers and Trustees are indemnified against certain liabilities arising out of the performance of their duties to the Fund. Additionally, in the normal course of business, the Fund enters into contracts with service providers that contain general indemnification clauses. The Fund’s maximum exposure under these arrangements is unknown, as this would involve future claims that may be made against the Fund that have not yet occurred.
| Semiannual report | New York Tax-Free Income Fund | 21 |
Note 4
Management fee and transactions with
affiliates and others
The Fund has an investment management contract with the Adviser. Under the investment management contract, the Fund pays a daily management fee to the Adviser equivalent, on an annual basis, to the sum of: (a) 0.50% of the first $250,000,000 of the Fund’s average daily net asset value, (b) 0.45% of the next $250,000,000, (c) 0.425% of the next $500,000,000, (d) 0.40% of the next $250,000,000 and (e) 0.30% of the Fund’s average daily net asset value in excess of $1,250,000,000. The Fund has a subadvisory agreement with MFC Global Investment Management (U.S.), LLC, an indirectly owned subsidiary of MFC and an affiliate of the Adviser. The Fund is not responsible for payment of subadvisory fees. The investment management fees incurred for the six-month period ended November 30, 2009, were equivalent to an annual effective rate of 0.50% of the Fund’s average daily net assets.
Pursuant to the Advisory Agreement, the Fund reimburses the Adviser for all expenses associated with providing the administrative, financial, legal, accounting and recordkeeping services of the Fund, including the preparation of all tax returns, annual, semiannual and periodic reports to shareholders and the preparation of all regulatory reports. These expenses are allocated based on the relative share of net assets of each class at the time the expense was incurred. The accounting and legal services fees incurred for the six-month period ended November 30, 2009, were equivalent to an annual effective rate of 0.02% of the Fund’s average daily net assets.
The Fund has a Distribution Agreement with the Distributor. The Fund has adopted Distribution Plans with respect to Class A, Class B and Class C shares, pursuant to Rule 12b-1 under the 1940 Act, to pay the Distributor for the services it provides as distributor of shares of the Fund. Accordingly, Classes A and B shares make daily payments and Class C shares make monthly payments to the Distributor at an annual rate not to exceed 0.30%, 1.00% and 1.00% of average daily net asset value of Class A, Class B and Class C shares, respectively. A maximum of 0.25% of such payments may be service fees, as defined by the Conduct Rules of the Financial Industry Regulatory Authority. Under the Conduct Rules, curtailment of a portion of the Fund’s Rule 12b-1 payments could occur under certain circumstances.
Class A shares are assessed up-front sales charges. During the six-month period ended November 30, 2009, the Distributor received net up-front sales charges of $99,751 with regard to sales of Class A shares. Of this amount, $12,796 was retained and used for printing prospectuses, advertising, sales literature and other purposes, $86,213 was paid as sales commissions to unrelated broker-dealers and $742 was paid as sales commissions to sales personnel of Signator Investors, Inc. (Signator Investors), a related broker-dealer. Signator Investors is an affiliate of the Adviser.
Class B shares that are redeemed within six years of purchase are subject to a contingent deferred sales charge (CDSC) at declining rates, beginning at 5.00% of the lesser of the current market value at the time of redemption or the original purchase cost of the shares being redeemed. Class C shares that are redeemed within one year of purchase are subject to a CDSC at a rate of 1.00% of the lesser of the current market value at the time of redemption or the original purchase cost of the shares being redeemed. Proceeds from the CDSCs are paid to the Distributor and are used in whole or in part to defray its expenses for providing distribution-related services to the Fund in connection with the sale of Class B and Class C shares. During the six-month period ended November 30, 2009, CDSCs received by the Distributor amounted to $4,490 and $580 for Class B and Class C shares, respectively.
The Fund has a transfer agent agreement with John Hancock Signature Services, Inc. (Signature Services), an indirect subsidiary of MFC. The transfer agent fees are made up of three components:
• The Fund pays a monthly transfer agent fee at an annual rate of 0.01% for all Classes based on each class’s average daily net assets.
| 22 | New York Tax-Free Income Fund | Semiannual report |
• All classes of the Fund pay a monthly fee based on an annual rate of $17.50 per shareholder account.
• In addition, Signature Services is reimbursed for certain out-of-pocket expenses.
Signature Services has voluntarily agreed to waive certain transfer agent expenses. The amount of this waiver for the six-month period ended November 30, 2009 was $163.
Certain investor accounts that maintain small balances are charged an annual small accounts fee by Signature Services. Amounts related to these fees are credited by Signature Services to the Fund and netted against transfer agent expenses. For the year ended November 30, 2009, these fees totaled $1,022.
Class level expenses for the six-month period ended November 30, 2009 were as follows:
| Distribution | Transfer | |||
| Share class | and service fee | agent fees | ||
| Class A | $74,646 | $20,566 | ||
| Class B | 22,284 | 1,937 | ||
| Class C | 31,488 | 2,568 | ||
| Total | $128,418 | $25,071 | ||
Note 5
Trustees’ fees
The compensation of independent Trustees is borne by the Fund. The independent Trustees may elect to defer, for tax purposes, their receipt of this compensation under the John Hancock Group of Funds Deferred Compensation Plan. The Fund makes investments into other John Hancock funds, as applicable, to cover its liability for the deferred compensation. Investments to cover the Fund’s deferred compensation liability are recorded on the Fund’s books as an other asset. The deferred compensation liability and the related other asset are always equal and are marked to market on a periodic basis to reflect any income earned by the investments, as well as any unrealized gains or losses. The Deferred Compensation Plan investments had no impact on the operations of the Fund.
| Semiannual report | New York Tax-Free Income Fund | 23 |
Note 6
Fund share transactions
This listing illustrates the number of Fund shares sold, reinvested and repurchased during the six-month period ended November 30, 2009, the nine-month period ended May 31, 2009 and the year ended August 31, 2008, along with the corresponding dollar value.
| Period ended 11-30-091 | Period ended 5-31-092 | Year ended 8-31-08 | ||||
| Shares | Amount | Shares | Amount | Shares | Amount | |
| Class A shares | ||||||
| Sold | 528,570 | $6,203,925 | 715,444 | $8,108,374 | 725,645 | $8,752,039 |
| Distributions reinvested | 61,849 | 732,212 | 90,159 | 1,023,152 | 108,990 | 1,307,779 |
| Repurchased | (198,371) | (2,342,873) | (507,223) | (5,717,393) | (504,091) | (6,058,408) |
| Net increase | 392,048 | $4,593,264 | 298,380 | $3,414,133 | 330,544 | $4,001,410 |
| Class B shares | ||||||
| Sold | 10,588 | $125,680 | 73,092 | $828,902 | 15,748 | $188,942 |
| Distributions reinvested | 4,471 | 52,821 | 10,581 | 120,015 | 19,419 | 233,281 |
| Repurchased | (192,944) | (2,256,784) | (242,417) | (2,734,169) | (257,670) | (3,113,523) |
| Net decrease | ||||||
| (177,885) | ($2,078,283) | (158,744) | ($1,785,252) | (222,503) | ($2,691,300) | |
| Class C shares | ||||||
| Sold | 123,132 | $1,448,485 | 272,750 | $3,067,557 | 110,434 | $1,329,149 |
| Distributions reinvested | 4,280 | 50,734 | 4,523 | 50,869 | 3,752 | 45,036 |
| Repurchased | (63,058) | (748,210) | (49,379) | (562,732) | (162,304) | (1,959,016) |
| Net increase (decrease) | 64,354 | $751,009 | 227,894 | $2,555,694 | (48,118) | ($584,831) |
| Net increase | 278,517 | $3,265,990 | 367,530 | $4,184,575 | 59,923 | $725,279 |
1 Semiannual period from 6-1-09 to 11-30-09. Unaudited.
2 For the nine month period ended May 31, 2009. The Fund changed its fiscal year end from August 31 to May 31.
Note 7
Purchase and sale of securities
Purchases and proceeds from sales or maturities of securities during the six-month period ended November 30, 2009, aggregated $8,201,930 and $5,083,550, respectively. These amounts include purchases and sales of variable rate demand notes, which amounted to $1,900,000 and $1,550,000, respectively. Other short-term securities are excluded from these amounts.
| 24 | New York Tax-Free Income Fund | Semiannual report |
Board Consideration of and
Continuation of Investment
Advisory Agreement and
Subadvisory Agreement
The Investment Company Act of 1940 (the 1940 Act) requires the Board of Trustees (the Board) of John Hancock Tax-Exempt Series Fund (the Trust), including a majority of the Trustees who have no direct or indirect interest in the investment advisory agreement and are not “interested persons” of the Trust, as defined in the 1940 Act (the Independent Trustees), annually to meet in person to review and consider the continuation of existing advisory and subadvisory agreements. At meetings held on May 6–7 and June 8–9, 2009, the Board considered the renewal of:
(i) the investment advisory agreement (the Advisory Agreement) with John Hancock Advisers, LLC (the Adviser) and
(ii) the investment subadvisory agreement (the Subadvisory Agreement) with MFC Global Investment Management (U.S.), LLC (the Subadviser) for the John Hancock New York Tax-Free Income Fund (the Fund).
The Advisory Agreement and the Subadvisory Agreement are collectively referred to as the Advisory Agreements. The Board considered the factors and reached the conclusions described below relating to the selection of the Adviser and Subadviser and the continuation of the Advisory Agreements. During such meetings, the Board’s Contracts/Operations Committee and the Independent Trustees also met in executive sessions with their independent legal counsel.
In evaluating the Advisory Agreements, the Board, including the Contracts/Operations Committee and its Independent Trustees, reviewed a broad range of information requested for this purpose. The Independent Trustees considered the legal advice of independent legal counsel and relied on their own business judgment in determining the factors to be considered in evaluating the materials that were presented to them and the weight to be given to each such factor. The Board’s review and conclusions were based on a comprehensive consideration of all information presented to the Board and not the result of any single controlling factor. The key factors considered by the Board and the conclusions reached are described below.
Nature, extent and quality of services
The Board considered the ability of the Adviser and the Subadviser, based on their resources, reputation and other attributes, to attract and retain qualified investment professionals, including research, advisory, and supervisory personnel. It considered the background and experience of senior management and investment professionals responsible for managing the Fund. The Board considered the investment philosophy, research and investment decision-making processes of the Adviser and the Subadviser responsible for the daily investment activities of the Fund. The Board considered the Subadviser’s history and experience with the Fund. The Board considered the Adviser’s execution of its oversight responsibilities. The Board further considered the culture of compliance, resources dedicated to compliance, compliance programs, record of compliance with applicable laws and regulation, with the Fund’s investment policies and restrictions and with the applicable Code of Ethics, and the responsibilities of the Adviser’s and Subadviser’s compliance department. In addition, the Board took into account the administrative and other non-advisory services provided to the Fund by the Adviser and its affiliates.
Based on the above factors, together with those referenced below, the Board concluded that, within the context of its full deliberations, the nature, extent and quality of the investment advisory services provided to the Fund by the Adviser and Subadviser supported renewal of the Advisory Agreements.
Fund performance
The Board considered the performance results for the Fund over various time periods ended December 31, 2008. The Board also considered these results in comparison to the performance of a category of relevant funds (the Category), a peer group of comparable funds (the Peer Group) and a benchmark
| Semiannual report | New York Tax-Free Income Fund | 25 |
index. The funds within each Category and Peer Group were selected by Morningstar Inc. (Morningstar), an independent provider of investment company data. The Board reviewed the methodology used by Morningstar to select the funds in the Category and the Peer Group. The Board also considered updated performance information at its May and June 2009 meetings. Performance and other information may be quite different as of the date of this shareholders report.
The Board noted that the Fund’s performance was higher than the performance of the Category and Peer Group medians for the 1-, 3- and 5-year periods under review. The Board also noted that the Fund’s performance for the 10-year time period was inline with the performance of the Category and Peer Group medians. The Board noted that the Fund’s performance for all periods under review was lower than the performance of its benchmark index, the Barclays Capital Municipal Bond Index, as was the performance of the Category and Peer Group medians.
Investment advisory fee and subadvisory fee
rates and expenses
The Board reviewed and considered the contractual investment advisory fee rate payable by the Fund to the Adviser for investment advisory services (the Advisory Agreement Rate). The Board received and considered information comparing the Advisory Agreement Rate with the advisory fees for the Category and Peer Group. The Board noted that the Fund’s Advisory Agreement Rate was equal to the Category median and inline with the Peer Group median.
The Board received and considered expense information regarding the Fund’s various components, including advisory fees, distribution and fees other than advisory and distribution fees, including transfer agent fees, custodian fees, and other miscellaneous fees (e.g., fees for accounting and legal services). The Board considered comparisons of these expenses to the Peer Group median. The Board also received and considered expense information regarding the Fund’s total operating expense ratio (Expense Ratio). The Board received and considered information comparing the Expense
Ratio of the Fund to that of the Peer Group and Category medians before the application of fee waivers and reimbursements (Gross Expense Ratio) and after the application of such waivers and reimbursement (Net Expense Ratio). The Board noted that the Fund’s Net Expense Ratio was higher than the Peer Group and Category medians. The Board also noted that the Fund’s Gross Expense Ratio was inline with the Peer Group median and equal to the Category median. The Board noted that, unlike the Fund, several funds in the Peer Group employed fee waivers or reimbursements.
The Adviser also discussed the Morningstar data and rankings, and other relevant information, for the Fund. Based on the above-referenced considerations and other factors, the Board concluded that the Fund’s overall performance and expense results supported the re-approval of the Advisory Agreements.
The Board also received information about the investment subadvisory fee rate (the Subadvisory Agreement Rate) payable by the Adviser to the Subadviser for investment subadvisory services. The Board concluded that the Subadvisory Agreement Rate was fair and equitable, based on its consideration of the factors described here.
Profitability
The Board received and considered a detailed profitability analysis of the Adviser based on the Advisory Agreements, as well as on other relationships between the Fund and the Adviser and its affiliates, including the Subadviser. The Board also considered a comparison of the Adviser’s profitability to that of other similar investment advisers whose profitability information is publicly available. The Board concluded that, in light of the costs of providing investment management and other services to the Fund, the profits and other ancillary benefits reported by the Adviser were not unreasonable.
Economies of scale
The Board received and considered general information regarding economies of scale with respect to the management of the Fund, including the Fund’s ability to appropriately benefit from economies of scale under the
| 26 | New York Tax-Free Income Fund | Semiannual report |
Fund’s fee structure. The Board recognized the inherent limitations of any analysis of economies of scale, stemming largely from the Board’s understanding that most of the Adviser’s and Subadviser’s costs are not specific to individual Funds, but rather are incurred across a variety of products and services. To ensure that any economies are reasonably shared with the Fund as its assets increase, the Adviser and the Board agreed to continue the existing breakpoints to the Advisory Agreement Rate.
Information about services to other clients
The Board also received information about the nature, extent and quality of services and fee rates offered by the Adviser and Subadviser to their other clients, including other registered investment companies, institutional investors and separate accounts. The Board concluded that the Advisory Agreement Rate and the Subadvisory Agreement Rate were not unreasonable, taking into account fee rates offered to others by the Adviser and Subadviser, respectively, after giving effect to differences in services.
Other benefits to the Adviser
The Board received information regarding potential “fall-out” or ancillary benefits received by the Adviser and its affiliates, including the Subadviser, as a result of their relationship with the Fund. Such benefits could include, among others, benefits directly attributable to the relationship of the Adviser and Subadviser with the Fund and benefits potentially derived from an increase in business as a result of their relationship with the Fund (such as the ability to market to shareholders other financial products offered by the Adviser and its affiliates).
Other factors and broader review
As discussed above, the Board reviewed detailed materials received from the Adviser and Subadviser as part of the annual re-approval process. The Board also regularly reviews and assesses the quality of the services that the Fund receives throughout the year. In this regard, the Board reviews reports of the Adviser and Subadviser at least quarterly, which include, among other things, fund performance reports and compliance reports. In addition, the Board meets with senior investment officers at various times throughout the year.
After considering the above-described factors and based on its deliberations and its evaluation of the information described above, the Board concluded that approval of the continuation of the Advisory Agreements for the Fund was in the best interest of the Fund and its shareholders. Accordingly, the Board unanimously approved the continuation of the Advisory Agreements.
| Semiannual report | New York Tax-Free Income Fund | 27 |
More information
Trustees
Patti McGill Peterson, Chairperson
James R. Boyle†
James F. Carlin
William H. Cunningham
Deborah C. Jackson*
Charles L. Ladner
Stanley Martin*
Dr. John A. Moore
Steven R. Pruchansky††
Gregory A. Russo
John G. Vrysen†
Officers
Keith F. Hartstein
President and Chief Executive Officer
Andrew G. Arnott‡
Chief Operating Officer
Thomas M. Kinzler
Secretary and Chief Legal Officer
Francis V. Knox, Jr.
Chief Compliance Officer
Charles A. Rizzo
Chief Financial Officer
Michael J. Leary
Treasurer
Investment adviser
John Hancock Advisers, LLC
Subadviser
MFC Global Investment Management (U.S.), LLC
Principal distributor
John Hancock Funds, LLC
Custodian
State Street Bank and Trust Company
Transfer agent
John Hancock Signature Services, Inc.
Legal counsel
K&L Gates LLP
The report is certified under the Sarbanes-Oxley Act, which requires mutual funds and other public companies to affirm that, to the best of their knowledge, the information in their financial reports is fairly and accurately stated in all material respects.
* Member of the Audit Committee
†† Member of the Audit Committee effective 9-1-09
† Non-Independent Trustee
‡ Effective 9-1-09
The Fund’s proxy voting policies and procedures, as well as the Fund’s proxy voting record for the most recent twelve-month period ended June 30, are available free of charge on the Securities and Exchange Commission (SEC) Web site at www.sec.gov or on our Web site.
The Fund’s complete list of portfolio holdings, for the first and third fiscal quarters, is filed with the SEC on Form N-Q. The Fund’s Form N-Q is available on our Web site and the SEC’s Web site, www.sec.gov, and can be reviewed and copied (for a fee) at the SEC’s Public Reference Room in Washington, DC. Call 1-800-SEC-0330 to receive information on the operation of the SEC’s Public Reference Room.
We make this information on your fund, as well as monthly portfolio holdings, and other fund details available on our Web site www.jhfunds.com or by calling 1-800-225-5291.
| You can also contact us: | ||
| 1-800-225-5291 | Regular mail: | Express mail: |
| jhfunds.com | John Hancock Signature Services, Inc. | John Hancock Signature Services, Inc. |
| P.O. Box 55913 | Mutual Fund Image Operations | |
| Boston, MA 02205-5913 | 30 Dan Road | |
| Canton, MA 02021 | ||
| 28 | New York Tax-Free Income Fund | Semiannual report |

1-800-225-5291
1-800-554-6713 TDD
1-800-338-8080 EASI-Line
www.jhfunds.com
Now available: electronic delivery
www.jhfunds.com/edelivery
| This report is for the information of the shareholders of John Hancock New York Tax-Free Income Fund. | 760SA 11/09 |
| It is not authorized for distribution to prospective investors unless preceded or accompanied by a prospectus. | 1/10 |
A look at performance
| For the period ended November 30, 2009 | |||||||||||||||
| Average annual returns (%) | Cumulative total returns (%) | SEC 30- day yield (%) as of 11-30-09 | |||||||||||||
| with maximum sales charge (POP) | with maximum sales charge (POP) | ||||||||||||||
| Six | |||||||||||||||
| Class | 1-year | 5-year | 10-year | months | 1-year | 5-year | 10-year | ||||||||
| A | 8.16 | 2.86 | 4.77 | –0.20 | 8.16 | 15.15 | 59.42 | 3.54 | |||||||
| B | 7.50 | 2.75 | 4.68 | –0.78 | 7.50 | 14.50 | 57.92 | 3.00 | |||||||
| C | 11.50 | 3.09 | 4.53 | 3.13 | 11.50 | 16.46 | 55.72 | 3.01 | |||||||
Performance figures assume all distributions are reinvested. Public offering price (POP) figures reflect maximum sales charges on Class A shares of 4.5% and the applicable contingent deferred sales charge (CDSC) on Class B shares and Class C shares. The returns for Class C shares have been adjusted to reflect the elimination of the front-end sales charge effective July 15, 2004. The Class B shares’ CDSC declines annually between years 1 to 6 according to the following schedule: 5, 4, 3, 3, 2, 1%. No sales charge will be assessed after the sixth year. Class C shares held for less than one year are subject to a 1% CDSC.
The expense ratios of the Fund, both net (including any fee waivers or expense limitations) and gross (excluding any fee waivers or expense limitations), are set forth according to the most recent publicly available prospectus for the Fund and may differ from the expense ratios disclosed in the Financial Highlights tables in this report. The net expenses equal the gross expenses and are as follows: Class A — 1.04%, Class B — 1.74% and, Class C — 1.74%.
The returns reflect past results and should not be considered indicative of future performance. The return and principal value of an investment will fluctuate so that shares, when redeemed, may be worth more or less than their original cost. Due to market volatility, the Fund’s current performance may be higher or lower than the performance shown. For current to the most recent month end performance data, please call 1–800–225–5291 or visit the Fund’s Web site at www.jhfunds.com.
The performance table above and the chart on the next page do not reflect the deduction of taxes that a shareholder may pay on fund distributions or on the redemption of fund shares. Please note that a portion of the Fund’s income may be subject to taxes, and some investors may be subject to the Alternative Minimum Tax (AMT). Also note that capital gains are taxable.
The Fund’s performance results reflect any applicable fee waivers or expense reductions, without which the expenses would increase and results would have been less favorable.
| 6 | Massachusetts Tax-Free Income Fund | Semiannual report |
Growth of $10,000
This chart shows what happened to a hypothetical $10,000 investment in the John Hancock Massachusetts Tax-Free Income Fund Class A shares for the period indicated. For comparison, we’ve shown the same investment in the Barclays Capital Municipal Bond Index.

| With maximum | |||||||
| Class | Period beginning | Without sales charge | sales charge | Index | |||
| B2 | 11-30-99 | $15,792 | $15,792 | $17,273 | |||
| C2 | 11-30-99 | 15,572 | 15,572 | 17,273 | |||
Assuming all distributions were reinvested for the period indicated, the table above shows the value of a $10,000 investment in the Fund’s Class B and Class C shares, respectively, as of November 30, 2009. The Class C shares investment with maximum sales charge has been adjusted to reflect the elimination of the front-end sales charge effective July 15, 2004. Performance of the classes will vary based on the difference in sales charges paid by shareholders investing in the different classes and the fee structure of those classes.
Barclays Capital Municipal Bond Index is an unmanaged index representative of the tax-exempt bond market.
It is not possible to invest directly in an index. Index figures do not reflect sales charges or direct expenses, which would have resulted in lower values if they did.
1 NAV represents net asset value and POP represents public offering price.
2 No contingent deferred sales charge applicable.
| Semiannual report | Massachusetts Tax-Free Income Fund | 7 |
Your expenses
These examples are intended to help you understand your ongoing operating expenses.
Understanding fund expenses
As a shareholder of the Fund, you incur two types of costs:
▪ Transaction costs which include sales charges (loads) on purchases or redemptions (varies by share class), minimum account fee charge, etc.
▪ Ongoing operating expenses including management fees, distribution and service fees (if applicable), and other fund expenses.
We are going to present only your ongoing operating expenses here.
Actual expenses/actual returns
This example is intended to provide information about your fund’s actual ongoing operating expenses, and is based on your fund’s actual return. It assumes an account value of $1,000.00 on June 1, 2009 with the same investment held until November 30, 2009.
| Account value | Ending value | Expenses paid during | |||
| on 6-1-09 | on 11-30-09 | period ended 11-30-091 | |||
| Class A | $1,000.00 | $1,045.00 | $5.23 | ||
| Class B | 1,000.00 | 1,042.20 | 8.75 | ||
| Class C | 1,000.00 | 1,041.30 | 8.75 | ||
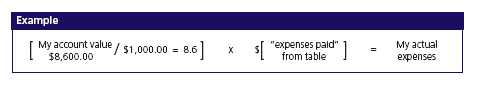
Together with the value of your account, you may use this information to estimate the operating expenses that you paid over the period. Simply divide your account value at November 30, 2009, by $1,000.00, then multiply it by the “expenses paid” for your share class from the table above. For example, for an account value of $8,600.00, the operating expenses should be calculated as follows:
| 8 | Massachusetts Tax-Free Income Fund | Semiannual report |
Hypothetical example for comparison purposes
This table allows you to compare your fund’s ongoing operating expenses with those of any other fund. It provides an example of the Fund’s hypothetical account values and hypothetical expenses based on each class’s actual expense ratio and an assumed 5% annualized return before expenses (which is not your fund’s actual return). It assumes an account value of $1,000.00 on June 1, 2009, with the same investment held until November 30, 2009. Look in any other fund shareholder report to find its hypothetical example and you will be able to compare these expenses.
| Account value | Ending value | Expenses paid during | |||
| on 6-1-09 | on 11-30-09 | period ended 11-30-091 | |||
| Class A | $1,000.00 | $1,020.00 | $5.17 | ||
| Class B | 1,000.00 | 1,016.50 | 8.64 | ||
| Class C | 1,000.00 | 1,016.50 | 8.64 | ||
Remember, these examples do not include any transaction costs, therefore, these examples will not help you to determine the relative total costs of owning different funds. If transaction costs were included, your expenses would have been higher. See the prospectus for details regarding transaction costs.
1 Expenses are equal to the Fund’s annualized expense ratio of 1.02%, 1.71% and 1.71% for Class A, Class B and Class C shares, respectively, multiplied by the average account value over the period, multiplied by 183/365 (to reflect the one-half year period).
| Semiannual report | Massachusetts Tax-Free Income Fund | 9 |
Portfolio summary
| Top 10 Holdings1 | ||||
| Massachusetts State Turnpike Authority, 01-01-23, 5.125% | 4.0% | |||
| Boston Housing Authority, 04-01-27, 5.000% | 2.8% | |||
| Holyoke Gas & Electric Department, 12-01-31, 5.000% | 2.6% | |||
| Route 3 North Transit Improvement Associates, 06-15-29, 5.375% | 2.6% | |||
| Massachusetts Water Resources Authority, 08-01-29, 5.250% | 2.3% | |||
| Massachusetts Bay Transportation Authority, 07-01-33, 5.250% | 2.2% | |||
| Massachusetts Industrial Finance Agency, 12-01-20, 6.750% | 2.2% | |||
| Massachusetts Health & Educational Facilities Authority, 12-15-31, 9.200% | 2.0% | |||
| Commonwealth of Massachusetts, 12-01-24, 5.500% | 1.9% | |||
| Puerto Rico Aqueduct & Sewer Authority, 07-01-11, 10.021% | 1.9% | |||
| Sector Composition2,3 | ||||
| General Obligation Bonds | 10% | Housing | 10% | |
| Revenue Bonds | Utilities | 6% | ||
| Education | 15% | Pollution | 3% | |
| Transportation | 14% | Industrial Development | 1% | |
| Water & Sewer | 11% | Other Revenue | 16% | |
| Health Care | 11% | Short-Term Investments & Other | 3% | |
| Quality Composition2 | ||||
| AAA | 32% | BBB | 16% | |
| AA | 33% | Short-Term Investments & Other | 3% | |
| A | 16% | |||
1 As a percentage of net assets on November 30, 2009. Excludes cash and cash equivalents.
2 As a percentage of net assets on November 30, 2009.
3 Investments focused in one sector may fluctuate more widely than investments across multiple sectors. Because the Fund may focus on particular industries, its performance may depend on the performance of those sectors.
| 10 | Massachusetts Tax-Free Income Fund | Semiannual report |
Fund’s investments
| As of 11-30-09 (unaudited) |
| Maturity | |||||
| Rate | date | Par value | Value | ||
| Municipal Bonds 96.89% | $120,793,741 | ||||
| (Cost $117,152,360) | |||||
| Guam 0.41% | 508,750 | ||||
| Guam Government, | |||||
| Section 30, Series A | 5.750% | 12-01-34 | $500,000 | 508,750 | |
| Massachusetts 85.37% | 106,435,373 | ||||
| Boston Housing Authority, | |||||
| Capital Program Revenue (D) | 5.000 | 04-01-27 | 3,255,000 | 3,429,338 | |
| Capital Program Revenue (D) | 5.000 | 04-01-28 | 2,000,000 | 2,095,660 | |
| Capital Program Revenue (D) | 4.500 | 04-01-26 | 1,000,000 | 1,006,860 | |
| Boston Industrial Development | |||||
| Financing Authority, | |||||
| Harbor Electric Energy Co. AMT | 7.375 | 05-15-15 | 150,000 | 150,546 | |
| Boston Water & Sewer Commission, Series A | 5.750 | 11-01-13 | 355,000 | 389,091 | |
| Commonwealth of Massachusetts, | |||||
| General Obligation (D) | 5.500 | 11-01-17 | 1,000,000 | 1,203,240 | |
| General Obligation, Series C | 5.500 | 11-01-15 | 1,000,000 | 1,188,490 | |
| General Obligation, Series C (D) | 5.500 | 12-01-24 | 2,000,000 | 2,419,360 | |
| General Obligation, Series C | 5.375 | 12-01-19 | 1,000,000 | 1,090,720 | |
| General Obligation, Series E (D) | 5.000 | 11-01-25 | 1,000,000 | 1,150,090 | |
| Freetown Lakeville Regional School District, | |||||
| General Obligation (D) | 5.000 | 07-01-23 | 1,000,000 | 1,037,700 | |
| Holyoke Gas & Electric Department, | |||||
| Series A (D) | 5.000 | 12-01-31 | 3,410,000 | 3,206,355 | |
| Massachusetts Bay Transportation Authority, | |||||
| Prerefunded, Series A | 5.250 | 07-01-30 | 930,000 | 957,100 | |
| Series A | 7.000 | 03-01-14 | 1,000,000 | 1,150,530 | |
| Series A | 5.250 | 07-01-31 | 1,000,000 | 1,128,150 | |
| Series A | 5.250 | 07-01-35 | 1,310,000 | 1,458,357 | |
| Series A | 5.000 | 07-01-31 | 2,000,000 | 2,180,740 | |
| Series A | 5.000 | 07-01-34 | 1,000,000 | 1,163,710 | |
| Series A–2 | Zero | 07-01-26 | 2,500,000 | 1,136,475 | |
| Series B | 5.250 | 07-01-33 | 2,500,000 | 2,782,350 | |
| Unrefunded, Series A | 5.250 | 07-01-30 | 70,000 | 70,902 | |
| Massachusetts Development Finance Agency, | |||||
| Belmont Hill School | 5.000 | 09-01-31 | 1,000,000 | 1,085,380 | |
| Curry College, Series A (D) | 5.250 | 03-01-26 | 1,000,000 | 938,520 | |
| Curry College, Series A (D) | 4.500 | 03-01-25 | 1,000,000 | 872,250 | |
| Dominion Energy Brayton Point AMT | 5.000 | 02-01-36 | 2,000,000 | 1,742,200 | |
| Plantation Apartments, Series A AMT | 5.000 | 12-15-24 | 2,320,000 | 2,327,122 | |
See notes to financial statements
| Semiannual report | Massachusetts Tax-Free Income Fund | 11 |
| Maturity | |||||
| Rate | date | Par value | Value | ||
| Massachusetts (continued) | |||||
| Massachusetts Development Finance Agency, | |||||
| Draper Laboratory | 5.875% | 09-01-30 | $2,000,000 | $2,140,220 | |
| Groves Lincoln, Series A | 7.750 | 06-01-39 | 700,000 | 679,896 | |
| Jewish Philanthropies, Series A | 5.250 | 02-01-22 | 1,875,000 | 2,001,825 | |
| Linden Ponds, Inc., Series A | 5.750 | 11-15-35 | 1,500,000 | 1,071,750 | |
| Massachusetts College of Pharmacy, | |||||
| Series E (D) | 5.000 | 07-01-37 | 1,000,000 | 998,470 | |
| New England Conservatory of Music | 5.250 | 07-01-38 | 2,000,000 | 1,811,160 | |
| Ogden Haverhill Project, Series B AMT | 5.500 | 12-01-19 | 1,500,000 | 1,376,550 | |
| Orchard Cove, Inc. | 5.250 | 10-01-26 | 1,000,000 | 787,550 | |
| Semass Partnership, Series A (D) | 5.625 | 01-01-16 | 500,000 | 515,715 | |
| VOA Concord Assistant Living, Series A | 6.900 | 10-20-41 | 1,000,000 | 1,164,650 | |
| Massachusetts Health & Educational | |||||
| Facilities Authority, | |||||
| Boston College, Series L | 4.750 | 06-01-31 | 1,000,000 | 1,000,020 | |
| Caregroup, Series E-1 | 5.125 | 07-01-33 | 250,000 | 227,550 | |
| Civic Investments, Series B | 9.200 | 12-15-31 | 2,000,000 | 2,498,260 | |
| Emerson Hospital, Series E (D) | 5.000 | 08-15-35 | 1,000,000 | 731,960 | |
| Harvard Pilgrim Healthcare, Series A (D) | 5.000 | 07-01-18 | 1,000,000 | 1,004,260 | |
| Harvard University, Series W | 6.000 | 07-01-35 | 1,000,000 | 1,043,520 | |
| Lahey Clinic, Inc., Series C (D) | 5.000 | 08-15-23 | 1,000,000 | 989,180 | |
| Partners Healtcare | 5.000 | 07-01-22 | 1,000,000 | 1,066,630 | |
| Prerefunded, Partners Healtcare, Series C | 5.750 | 07-01-32 | 970,000 | 1,058,998 | |
| Simmons College, Series D (D) | 6.150 | 10-01-29 | 1,000,000 | 1,056,680 | |
| Sterling & Francine Clark, Series A | 5.000 | 07-01-36 | 1,000,000 | 1,014,520 | |
| Suffolk University, Series A | 6.250 | 07-01-30 | 1,000,000 | 1,047,650 | |
| Tufts University | 5.375 | 08-15-38 | 350,000 | 372,617 | |
| UMass Worcester Campus, Series B (D) | 5.250 | 10-01-31 | 1,500,000 | 1,626,585 | |
| Unrefunded, Partners Healthcare, Series C | 5.750 | 07-01-32 | 30,000 | 30,809 | |
| Unrefunded, South Shore Hospital | 5.750 | 07-01-29 | 365,000 | 365,252 | |
| Wheelock College, Series B (D) | 5.625 | 10-01-30 | 1,000,000 | 1,084,690 | |
| Williams College, Series H | 5.000 | 07-01-33 | 1,500,000 | 1,542,525 | |
| Woods Hole Oceanographic, Series B | 5.375 | 06-01-30 | 1,000,000 | 1,061,250 | |
| Massachusetts Housing Finance Agency, | |||||
| Series A AMT (D) | 5.800 | 07-01-30 | 910,000 | 907,780 | |
| Series B | 4.700 | 12-01-16 | 1,265,000 | 1,297,599 | |
| Massachusetts Industrial Finance Agency, | |||||
| Mass American Water Co. AMT | 6.900 | 12-01-29 | 1,210,000 | 1,162,931 | |
| Mass American Water Co. AMT | 6.750 | 12-01-20 | 2,780,000 | 2,780,334 | |
| Ogden Haverhill Project, Series A AMT | 5.600 | 12-01-19 | 500,000 | 465,885 | |
| Massachusetts Port Authority, | |||||
| Bosfuel Corp. AMT (D) | 5.000 | 07-01-32 | 1,770,000 | 1,658,419 | |
| Series C (D) | 5.750 | 07-01-29 | 1,250,000 | 1,268,412 | |
| US Airways, Inc., Series A AMT (D) | 5.750 | 09-01-16 | 1,000,000 | 945,220 | |
| Massachusetts Special Obligation, | |||||
| Dedicated Tax (D) | 5.250 | 01-01-26 | 1,000,000 | 1,144,230 | |
| Massachusetts State College Building Authority, | |||||
| Series A | 5.500 | 05-01-49 | 1,000,000 | 1,034,490 | |
| Series B (D) | Zero | 05-01-19 | 1,000,000 | 681,040 | |
| Massachusetts State Turnpike Authority, | |||||
| Series A (D) | 5.125 | 01-01-23 | 4,895,000 | 4,966,627 | |
| Series A (D) | 5.000 | 01-01-37 | 300,000 | 279,783 | |
| Series C (D) | Zero | 01-01-20 | 1,000,000 | 588,860 | |
See notes to financial statements
| 12 | Massachusetts Tax-Free Income Fund | Semiannual report |
| Maturity | |||||
| Rate | date | Par value | Value | ||
| Massachusetts (continued) | |||||
| Massachusetts Water Pollution | |||||
| Abatement Trust, | |||||
| Prerefunded, Series 7 | 5.125% | 02-01-31 | $645,000 | $692,059 | |
| Refunded | 5.000 | 08-01-28 | 1,000,000 | 1,093,750 | |
| Series 13 | 5.000 | 08-01-28 | 1,000,000 | 1,077,070 | |
| Series 14 | 5.000 | 08-01-32 | 1,000,000 | 1,060,530 | |
| Unrefunded, Series 7 | 5.125 | 02-01-31 | 1,775,000 | 1,808,015 | |
| Unrefunded, Series 9 | 5.250 | 08-01-18 | 60,000 | 69,625 | |
| Massachusetts Water Resources Authority, | |||||
| Series B (D) | 5.250 | 08-01-29 | 2,500,000 | 2,852,525 | |
| Series B | 5.000 | 08-01-39 | 1,000,000 | 1,034,030 | |
| Narragansett Regional School District, | |||||
| General Obligation (D) | 5.375 | 06-01-18 | 1,000,000 | 1,031,410 | |
| Pittsfield, City of, | |||||
| General Obligation (D) | 5.000 | 04-15-19 | 1,000,000 | 1,050,070 | |
| Plymouth County, | |||||
| Correctional Facility Project (D) | 5.000 | 04-01-22 | 1,000,000 | 1,021,670 | |
| Route 3 North Transit Improvement Associates, | |||||
| Rev Lease (D) | 5.375 | 06-15-29 | 3,100,000 | 3,185,591 | |
| University of Massachusetts Building Authority, | |||||
| Series 1 | 5.000 | 05-01-39 | 1,500,000 | 1,501,050 | |
| Series A (D) | 5.125 | 11-01-25 | 1,000,000 | 1,044,390 | |
| Puerto Rico 9.91% | 12,355,443 | ||||
| Commonwealth of Puerto Rico | |||||
| General Obligation (D)(P) | 9.532 | 07-01-11 | 700,000 | 779,310 | |
| Commonwealth of Puerto Rico, | |||||
| General Obligation, Series B | 5.750 | 07-01-38 | 1,000,000 | 975,300 | |
| Puerto Rico Aqueduct & Sewer Authority (D)(P) | 10.021 | 07-01-11 | 2,000,000 | 2,347,760 | |
| Puerto Rico Aqueduct & Sewer Authority, | |||||
| Series A | Zero | 07-01-24 | 1,750,000 | 1,698,340 | |
| Puerto Rico Highway & Transportation Authority, | |||||
| Prerefunded, Series Y | 6.250 | 07-01-14 | 955,000 | 1,159,083 | |
| Series AA (D) | 5.500 | 07-01-19 | 2,000,000 | 2,101,760 | |
| Unrefunded, Series Y | 6.250 | 07-01-14 | 45,000 | 49,630 | |
| Puerto Rico Housing Finance Authority, | |||||
| Single Family Revenue | 5.125 | 12-01-27 | 1,000,000 | 1,012,590 | |
| Puerto Rico Sales Tax Financing Authority, | |||||
| Capital Appreciation, Series A | Zero | 08-01-32 | 3,000,000 | 2,231,670 | |
| Virgin Islands 1.20% | 1,494,175 | ||||
| Virgin Islands Public Finance Authority, | |||||
| Series A | 6.750 | 10-01-37 | 1,000,000 | 1,046,760 | |
| Series A–1 | 5.000 | 10-01-39 | 500,000 | 447,415 | |
See notes to financial statements
| Semiannual report | Massachusetts Tax-Free Income Fund | 13 |
| Par value | Value | |
| Short-Term Investments 1.38% | $1,718,000 | |
| (Cost $1,718,000) | ||
| Repurchase Agreement 1.38% | 1,718,000 | |
| Repurchase Agreement with State Street Corp. dated 11-30-09 | ||
| at 0.05% to be repurchased at $1,718,002 on 12-1-09, | ||
| collateralized by $1,755,000 U.S. Treasury Bills, 0.00% | ||
| due 5-13-10 (valued at $1,754,123 including interest) | 1,718,000 | 1,718,000 |
| Total investments (Cost $118,870,360)† 98.27% | $122,511,741 | |
| Other assets and liabilities, net 1.73% | $2,159,215 | |
| Total net assets 100.00% | $124,670,956 | |
The percentage shown for each investment category is the total value of that category as a percentage of the net assets applicable to common shareholders.
AMT Interest earned from these securities may be considered a tax preference item for purpose of the Federal Alternative Minimum Tax.
(D) Bond is insured by one of these companies:
| Insurance coverage | As a % of total investments | |||
| ACA Financial Guaranty Corp. | 1.48% | |||
| Ambac Financial Group, Inc. | 6.19% | |||
| Assured Guaranty Ltd. | 0.81% | |||
| Financial Guaranty Insurance Company | 6.32% | |||
| Financial Security Assurance, Inc. | 10.50% | |||
| National Public Finance Guarantee Insurance Company | 16.99% | |||
| Radian Asset Assurance, Inc. | 0.60% | |||
| XL Capital Assurance, Inc. | 0.56% | |||
(P) Variable rate obligation. The coupon rate shown represents the rate at period end.
† At November 30, 2009, the aggregate cost of investment securities for federal income tax purposes was $118,602,402. Net unrealized appreciation aggregated $3,909,339, of which $6,001,135 related to appreciated investment securities and $2,091,796 related to depreciated investment securities.
See notes to financial statements
| 14 | Massachusetts Tax-Free Income Fund | Semiannual report |
F I N A N C I A L S T A T E M E N T S
Financial statements
Statement of assets and liabilities 11-30-09 (unaudited)
This Statement of Assets and Liabilities is the Fund’s balance sheet. It shows the value of what the Fund owns, is due and owes. You’ll also find the net asset value and the maximum offering price per share.
| Assets | |
| Investments, at value (Cost $118,870,360) | $122,511,741 |
| Cash | 106 |
| Receivable for fund shares sold | 254,341 |
| Interest receivable | 2,088,979 |
| Other receivables and prepaid assets | 14,406 |
| Total assets | 124,869,573 |
| Liabilities | |
| Payable for fund shares repurchased | 23,728 |
| Distributions payable | 119,279 |
| Payable to affiliates | |
| Accounting and legal services fees | 831 |
| Transfer agent fees | 6,635 |
| Distribution and service fees | 13,834 |
| Trustees’ fees | 2,574 |
| Other liabilities and accrued expenses | 31,736 |
| Total liabilities | 198,617 |
| Net assets | |
| Capital paid-in | $120,722,715 |
| Undistributed net investment income | 30,012 |
| Accumulated net realized gain on investments | 276,848 |
| Net unrealized appreciation on investments | 3,641,381 |
| Net assets | $124,670,956 |
| Net asset value per share | |
| Based on net asset values and shares outstanding — the Fund has an | |
| unlimited number of shares authorized with no par value | |
| Class A ($101,316,674 ÷ 8,171,892 shares) | $12.40 |
| Class B ($6,063,808 ÷ 489,165 shares)1 | $12.40 |
| Class C ($17,290,474 ÷ 1,394,664 shares)1 | $12.40 |
| Maximum offering price per share | |
| Class A (net asset value per share ÷ 95.5%)2 | $12.98 |
1 Redemption price is equal to net asset value less any applicable contingent deferred sales charge.
2 On single retail sales of less than $100,000. On sales of $100,000 or more and on group sales the offering price is reduced.
See notes to financial statements
| Semiannual report | Massachusetts Tax-Free Income Fund | 15 |
F I N A N C I A L S T A T E M E N T S
Statement of operations For the period ended 11-30-09 (unaudited)
This Statement of Operations summarizes the Fund’s investment income earned and expenses incurred in operating the Fund. It also shows net gains (losses) for the period stated.
| Investment income | |
| Interest | $3,017,781 |
| Expenses | |
| Investment management fees (Note 4) | 306,081 |
| Distribution and service fees (Note 4) | 261,884 |
| Accounting and legal services fees (Note 4) | 11,241 |
| Transfer agent fees (Note 4) | 37,113 |
| Trustees’ fees (Note 5) | 7,166 |
| State registration fees | 4,069 |
| Printing and postage fees | 10,729 |
| Professional fees | 33,420 |
| Custodian fees | 17,222 |
| Registration and filing fees | 9,012 |
| Other | 1,155 |
| Total expenses | 699,092 |
| Less expense reductions (Note 4) | (1,906) |
| Net expenses | 697,186 |
| Net investment income | 2,320,595 |
| Realized and unrealized gain (loss) | |
| Net realized loss on investments | (327,758) |
| Change in net unrealized appreciation (depreciation) of investments | 3,334,568 |
| Net realized and unrealized gain | 3,006,810 |
| Increase in net assets from operations | $5,327,405 |
See notes to financial statements
| 16 | Massachusetts Tax-Free Income Fund | Semiannual report |
F I N A N C I A L S T A T E M E N T S
Statements of changes in net assets
These Statements of Changes in Net Assets show how the value of the Fund’s net assets has changed during the last three periods. The difference reflects earnings less expenses, any investment gains and losses, distributions, if any, paid to shareholders and the net of Fund share transactions.
| Period | Period | Year | |
| ended | ended | ended | |
| 11-30-091 | 5-31-092 | 8-31-08 | |
| Increase (decrease) in net assets | |||
| From operations | |||
| Net investment income | $2,320,595 | $3,560,177 | $4,319,087 |
| Net realized gain (loss) | (327,758) | 271,658 | 54,090 |
| Change in net unrealized | |||
| appreciation (depreciation) | 3,334,568 | (2,550,725) | (761,375) |
| Increase in net assets resulting | |||
| from operations | 5,327,405 | 1,281,110 | 3,611,802 |
| Distributions to shareholders | |||
| From net investment income | |||
| Class A | (1,934,852) | (2,966,287) | (3,530,398) |
| Class B | (108,019) | (220,290) | (365,306) |
| Class C | (253,902) | (337,360) | (365,433) |
| From net realized gain | |||
| Class A | — | (39,269) | (145,816) |
| Class B | — | (3,504) | (20,811) |
| Class C | — | (5,057) | (18,468) |
| Total distributions | (2,296,773) | (3,571,767) | (4,446,232) |
| From Fund share transactions (Note 6) | 5,154,034 | (547,233) | 17,294,873 |
| Total increase (decrease) | 8,184,666 | (2,837,890) | 16,460,443 |
| Net assets | |||
| Beginning of period | 116,486,290 | 119,324,180 | 102,863,737 |
| End of period | $124,670,956 | $116,486,290 | $119,324,180 |
| Undistributed net investment income | $30,012 | $6,190 | $7,533 |
1 Semiannual period from 6-1-09 to 11-30-09. Unaudited.
2 For the nine month period ended May 31, 2009. The Fund changed its fiscal year end from August 31 to May 31.
See notes to financial statements
| Semiannual report | Massachusetts Tax-Free Income Fund | 17 |
Financial highlights
The Financial Highlights show how the Fund’s net asset value for a share has changed since the end of the previous period.
| CLASS A SHARES Period ended | 11-30-091 | 5-31-092 | 8-31-08 | 8-31-07 | 8-31-06 | 8-31-05 | 8-31-04 |
| Per share operating performance | |||||||
| Net asset value, beginning | |||||||
| of period | $12.10 | $12.28 | $12.37 | $12.64 | $12.87 | $12.75 | $12.38 |
| Net investment income3 | 0.24 | 0.38 | 0.51 | 0.53 | 0.53 | 0.54 | 0.56 |
| Net realized and unrealized gain | |||||||
| (loss) on investments | 0.30 | (0.17) | (0.08) | (0.27) | (0.24) | 0.11 | 0.36 |
| Total from investment operations | 0.54 | 0.21 | 0.43 | 0.26 | 0.29 | 0.65 | 0.92 |
| Less distributions | |||||||
| From net investment income | (0.24) | (0.39) | (0.50) | (0.52) | (0.52) | (0.53) | (0.55) |
| From net realized gain | — | —4 | (0.02) | (0.01) | —4 | — | — |
| Total distributions | (0.24) | (0.39) | (0.52) | (0.53) | (0.52) | (0.53) | (0.55) |
| Net asset value, end of period | $12.40 | $12.10 | $12.28 | $12.37 | $12.64 | $12.87 | $12.75 |
| Total return (%)5 | 4.506 | 1.846 | 3.557 | 2.027 | 2.387 | 5.21 | 7.55 |
| Ratios and supplemental data | |||||||
| Net assets, end of period | |||||||
| (in millions) | $101 | $95 | $97 | $80 | $78 | $76 | $71 |
| Ratios (as a percentage of average | |||||||
| net assets): | |||||||
| Expenses before reductions | 1.028 | 1.098,9 | 0.98 | 0.98 | 0.99 | 1.04 | 1.01 |
| Expenses net of fee waivers | 1.028 | 1.098,9 | 0.98 | 0.98 | 0.99 | 1.04 | 1.01 |
| Expenses net of fee waivers | |||||||
| and credits | 1.028 | 1.098,9 | 0.97 | 0.98 | 0.99 | 1.04 | 1.01 |
| Net investment income | 3.958 | 4.398 | 4.08 | 4.16 | 4.19 | 4.20 | 4.40 |
| Portfolio turnover (%) | 8 | 17 | 22 | 25 | 15 | 26 | 44 |
1 Semiannual period from 6-1-09 to 11-30-09. Unaudited.
2 For the nine month period ended May 31, 2009. The Fund changed its fiscal year end from August 31 to May 31.
3 Based on the average daily shares outstanding.
4 Capital gain distribution less than $0.01.
5 Assumes dividend reinvestment (if applicable).
6 Not annualized.
7 Total returns would have been lower had certain expenses not been reduced during the periods shown.
8 Annualized.
9 Includes the impact of proxy expenses, which amounted to 0.04% of average net assets.
See notes to financial statements
| 18 | Massachusetts Tax-Free Income Fund | Semiannual report |
| CLASS B SHARES Period ended | 11-30-091 | 5-31-092 | 8-31-08 | 8-31-07 | 8-31-06 | 8-31-05 | 8-31-04 |
| Per share operating performance | |||||||
| Net asset value, beginning | |||||||
| of period | $12.09 | $12.28 | $12.37 | $12.64 | $12.87 | $12.75 | $12.38 |
| Net investment income3 | 0.20 | 0.32 | 0.42 | 0.44 | 0.44 | 0.45 | 0.47 |
| Net realized and unrealized gain | |||||||
| (loss) on investments | 0.31 | (0.19) | (0.08) | (0.27) | (0.24) | 0.11 | 0.36 |
| Total from investment operations | 0.51 | 0.13 | 0.34 | 0.17 | 0.20 | 0.56 | 0.83 |
| Less distributions | |||||||
| From net investment income | (0.20) | (0.32) | (0.41) | (0.43) | (0.43) | (0.44) | (0.46) |
| From net realized gain | — | —4 | (0.02) | (0.01) | —4 | — | — |
| Total distributions | (0.20) | (0.32) | (0.43) | (0.44) | (0.43) | (0.44) | (0.46) |
| Net asset value, end of period | $12.40 | $12.09 | $12.28 | $12.37 | $12.64 | $12.87 | $12.75 |
| Total return (%)5 | 4.226 | 1.226 | 2.837 | 1.317 | 1.677 | 4.48 | 6.80 |
| Ratios and supplemental data | |||||||
| Net assets, end of period | |||||||
| (in millions) | $6 | $7 | $10 | $12 | $17 | $20 | $23 |
| Ratios (as a percentage of average | |||||||
| net assets): | |||||||
| Expenses before reductions | 1.728 | 1.798,9 | 1.68 | 1.68 | 1.69 | 1.74 | 1.71 |
| Expenses net of fee waivers | 1.718 | 1.798,9 | 1.68 | 1.68 | 1.69 | 1.74 | 1.71 |
| Expenses net of fee waivers | |||||||
| and credits | 1.718 | 1.798,9 | 1.67 | 1.68 | 1.69 | 1.74 | 1.71 |
| Net investment income | 3.258 | 3.698 | 3.39 | 3.46 | 3.49 | 3.50 | 3.70 |
| Portfolio turnover (%) | 8 | 17 | 22 | 25 | 15 | 26 | 44 |
1 Semiannual period from 6-1-09 to 11-30-09. Unaudited.
2 For the nine month period ended May 31, 2009. The Fund changed its fiscal year end from August 31 to May 31.
3 Based on the average daily shares outstanding.
4 Capital gain distribution less than $0.01.
5 Assumes dividend reinvestment (if applicable).
6 Not annualized.
7 Total returns would have been lower had certain expenses not been reduced during the periods shown.
8 Annualized.
9 Includes the impact of proxy expenses, which amounted to 0.04% of average net assets.
See notes to financial statements
| Semiannual report | Massachusetts Tax-Free Income Fund | 19 |
| CLASS C SHARES Period ended | 11-30-091 | 5-31-092 | 8-31-08 | 8-31-07 | 8-31-06 | 8-31-05 | 8-31-04 |
| Per share operating performance | |||||||
| Net asset value, beginning | |||||||
| of period | $12.10 | $12.28 | $12.37 | $12.64 | $12.87 | $12.75 | $12.38 |
| Net investment income3 | 0.20 | 0.32 | 0.42 | 0.44 | 0.44 | 0.45 | 0.47 |
| Net realized and unrealized gain | |||||||
| (loss) on investments | 0.30 | (0.18) | (0.08) | (0.27) | (0.24) | 0.11 | 0.36 |
| Total from investment operations | 0.50 | 0.14 | 0.34 | 0.17 | 0.20 | 0.56 | 0.83 |
| Less distributions | |||||||
| From net investment income | (0.20) | (0.32) | (0.41) | (0.43) | (0.43) | (0.44) | (0.46) |
| From net realized gain | — | —4 | (0.02) | (0.01) | —4 | — | — |
| Total distributions | (0.20) | (0.32) | (0.43) | (0.44) | (0.43) | (0.44) | (0.46) |
| Net asset value, end of period | $12.40 | $12.10 | $12.28 | $12.37 | $12.64 | $12.87 | $12.75 |
| Total return (%)5 | 4.136 | 1.316 | 2.837 | 1.317 | 1.677 | 4.48 | 6.80 |
| Ratios and supplemental data | |||||||
| Net assets, end of period | |||||||
| (in millions) | $17 | $14 | $12 | $10 | $11 | $8 | $8 |
| Ratios (as a percentage of average | |||||||
| net assets): | |||||||
| Expenses before reductions | 1.728 | 1.798,9 | 1.68 | 1.68 | 1.69 | 1.74 | 1.71 |
| Expenses net of fee waivers | 1.718 | 1.798,9 | 1.68 | 1.68 | 1.69 | 1.74 | 1.71 |
| Expenses net of fee waivers | |||||||
| and credits | 1.718 | 1.798,9 | 1.67 | 1.68 | 1.69 | 1.74 | 1.71 |
| Net investment income | 3.248 | 3.678 | 3.38 | 3.46 | 3.48 | 3.49 | 3.69 |
| Portfolio turnover (%) | 8 | 17 | 22 | 25 | 15 | 26 | 44 |
1 Semiannual period from 6-1-09 to 11-30-09. Unaudited.
2 For the nine month period ended May 31, 2009. The Fund changed its fiscal year end from August 31 to May 31.
3 Based on the average daily shares outstanding.
4 Capital gain distribution less than $0.01.
5 Assumes dividend reinvestment (if applicable).
6 Not annualized.
7 Total returns would have been lower had certain expenses not been reduced during the periods shown.
8 Annualized.
9 Includes the impact of proxy expenses, which amounted to 0.04% of average net assets.
See notes to financial statements
| 20 | Massachusetts Tax-Free Income Fund | Semiannual report |
Notes to financial statements
(unaudited)
Note 1
Organization
John Hancock Massachusetts Tax-Free Income Fund (the Fund) is a non-diversified series of John Hancock Tax-Exempt Series Fund (the Trust), an open-end management investment company registered under the Investment Company Act of 1940, as amended (the 1940 Act). The Fund seeks a high level of current income, consistent with preservation of capital, that is exempt from federal and Massachusetts personal income taxes.
John Hancock Advisers, LLC (the Adviser) serves as investment adviser for the Fund. John Hancock Funds, LLC (the Distributor), an affiliate of the Adviser, serves as principal underwriter of the Fund. The Adviser and the Distributor are indirect wholly owned subsidiaries of Manulife Financial Corporation (MFC).
The Trustees have authorized the issuance of multiple classes of shares of the Fund, designated as Class A, Class B and Class C shares. The shares of each class represent an interest in the same portfolio of investments of the Fund and have equal rights as to voting, redemptions, dividends and liquidation, except that certain expenses, subject to the approval of the Trustees, may be applied differently to each class of shares in accordance with current regulations of the Securities and Exchange Commission and the Internal Revenue Service. Shareholders of a class that bears distribution and service expenses under the terms of a distribution plan have exclusive voting rights to that distribution plan. Class B shares will convert to Class A shares eight years after purchase.
Note 2
Significant accounting policies
The financial statements have been prepared in conformity with accounting principles generally accepted in the United States of America, which require management to make certain estimates and assumptions at the date of the financial statements. Actual results could differ from those estimates. Events or transactions occurring after period end through the date that the financial statements were issued, January 25, 2010, have been evaluated in the preparation of the financial statements. The following summarizes the significant accounting policies of the Fund:
Security valuation
Investments are stated at value as of the close of the regular trading on the New York Stock Exchange (NYSE), normally at 4:00 P.M., Eastern Time. Debt obligations are valued based on the evaluated prices provided by an independent pricing service, which utilizes both dealer-supplied quotes and electronic data processing techniques, which take into account factors such as institutional-size trading in similar groups of securities, yield, quality, coupon rate, maturity, type of issue, trading characteristics and other market data. Securities traded only in the over-the-counter market are valued at the last bid price quoted by brokers making markets in the securities at the close of tradin g. Debt obligations, where there are no prices available from an independent pricing service, are valued based on bid quotations or evaluated prices, as applicable, obtained from broker-dealers or fair valued as described below. Certain short-term debt investments are valued at amortized cost.
Other assets and securities where market quotations are not readily available are valued at fair value as determined in good faith by the Fund’s Pricing Committee in accordance with procedures adopted by the Board of Trustees.
Fair value measurements
The Fund uses a three-tier hierarchy to prioritize the assumptions, referred to as inputs, used in valuation techniques to measure fair value. The three-tier hierarchy of inputs and the valuation techniques used are summarized below:
| Semiannual report | Massachusetts Tax-Free Income Fund | 21 |
Level 1 – Exchange-traded prices in active markets for identical securities. This technique is used for exchange-traded domestic common and preferred equities, certain foreign equities, warrants and rights.
Level 2 – Prices determined using significant observable inputs. Observable inputs may include quoted prices for similar securities, interest rates, prepayment speeds and credit risk. Prices for securities valued using these techniques are received from independent pricing vendors and are based on an evaluation of the inputs described. These techniques are used for certain domestic preferred equities, certain foreign equities, unlisted rights and warrants, and fixed income securities.
Level 3 – Prices determined using significant unobservable inputs. In situations where quoted prices or observable inputs are unavailable, such as when there is little or no market activity for an investment, unobservable inputs may be used. Unobservable inputs reflect the Fund’s Pricing Committee’s own assumptions about the factors that market participants would use in pricing an investment and would be based on the best information available. Securities using this technique are generally thinly traded or privately placed, and may be valued using broker quotes, which may include the use of the brokers’ own judgments about the assumptions that market participants would use.
The inputs or methodology used for valuing securities are not necessarily an indication of the risk associated with investing in those securities.
At November 30, 2009, total investments for the Fund are Level 2 under the hierarchy discussed above.
Security transactions and related
investment income
Investment security transactions are accounted for on a trade date plus one basis for daily net asset value calculations. However, for financial reporting purposes, investment transactions are reported on trade date. Interest income is accrued as earned. Discounts/premiums are accreted/amortized for financial reporting purposes. Debt obligations may be placed in a non-accrual status and related interest income may be reduced by ceasing current accruals and writing off interest receivables when the collection of all or a portion of interest has become doubtful. The Fund uses the identified cost method for determining realized gain or loss on investments for both financial statement and federal income tax reporting purposes.
Repurchase agreements
The Fund may enter into repurchase agreements. When the Fund enters into a repurchase agreement through its custodian, it receives delivery of securities, the amount of which at the time of purchase and each subsequent business day is required to be maintained at such a level that the market value is generally at least 102% of the repurchase amount. The Fund will take receipt of all securities underlying the repurchase agreements it has entered into until such agreements expire. If the seller defaults, the Fund would suffer a loss to the extent that proceeds from the sale of underlying securities were less than the repurchase amount. The Fund may enter into repurchase agreements maturing within seven days with domestic dealers, banks or other financial institutions deemed to be creditworthy by the Adviser.
Line of credit
The Fund and other affiliated funds have entered into an agreement which enables them to participate in a $150 million unsecured committed line of credit with the Fund’s custodian. The Fund is permitted to have bank borrowings for temporary or emergency purposes, including the meeting of redemption requests that otherwise might require the untimely disposition of securities. Interest is charged to each participating fund based on its borrowings at a rate per annum equal to the Federal Funds rate plus 0.50%. In addition, a commitment fee of 0.08% per annum, payable at the end of each calendar quarter, based on the average daily-unused portion of the line of credit, is charged to each participating fund on a prorated basis based on average net assets. For
| 22 | Massachusetts Tax-Free Income Fund | Semiannual report |
the six-months ended November 30, 2009, there were no borrowings under the line of credit by the Fund.
Pursuant to the custodian agreement, the custodian may, in its discretion, advance funds to the Fund to make properly authorized payments. When such payments result in an overdraft, the Fund is obligated to repay the custodian for any overdraft, including any costs or expenses associated with the over-draft. The custodian has a lien, security interest or security entitlement in any Fund property that is not segregated, to the maximum extent permitted by law to the extent of any overdraft.
Expenses
The majority of expenses are directly identifiable to an individual fund. Trust expenses that are not readily identifiable to a specific fund are allocated in such a manner as deemed equitable, taking into consideration, among other things, the nature and type of expense and the relative size of the funds. Expense estimates are accrued in the period to which they relate and adjustments are made when actual amounts are known.
Class allocations
Income, common expenses and realized and unrealized gains (losses) are determined at the fund level and allocated daily to each class of shares based on the appropriate net asset value of the respective classes. Distribution and service fees, if any, and transfer agent fees, for all classes are calculated daily at the class level based on the appropriate net asset value of each class and the specific expense rate(s) applicable to each class.
Federal income taxes
The Fund intends to qualify as a regulated investment company by complying with the applicable provisions of the Internal Revenue Code and will not be subject to federal income tax on taxable income that is distributed to shareholders. Therefore, no federal income tax provision is required.
As of May 31, 2009, the Fund had no uncertain tax positions that would require financial statement recognition, de-recognition, or disclosure. The Fund’s federal tax return is subject to examination by the Internal Revenue Service for a period of three years.
Distribution of income and gains
The Fund records distributions to shareholders from net investment income and net realized gains, if any, on the ex-dividend date. The Fund generally declares dividends daily and pays them monthly. Capital gain distributions, if any, are paid annually. During the nine-month period ended May 31, 2009, the tax character of distributions paid was as follows: ordinary income $36,988, tax exempt income $3,486,949 and long-term capital gain $47,830. During the year ended August 31, 2008, the tax character of distributions paid was as follows: ordinary income $27,894, tax exempt income $4,233,243 and long-term capital gain $185,095. Distributions paid by the Fund with respect to each class of shares are calculated in the same manner, at the same time and are in the same amount, except for the effect of expenses that may be applied differently to each class.
Such distributions, on a tax basis, are determined in conformity with income tax regulations, which may differ from accounting principles generally accepted in the United States of America. Material distributions in excess of tax basis earnings and profits, if any, are reported in the Fund’s financial statements as a return of capital.
Note 3
Guarantees and indemnifications
Under the Fund’s organizational documents, its Officers and Trustees are indemnified against certain liabilities arising out of the performance of their duties to the Fund. Additionally, in the normal course of business, the Fund enters into contracts with service providers that contain general indemnification clauses. The Fund’s maximum exposure under these arrangements is unknown, as this would involve future claims that may be made against the Fund that have not yet occurred.
| Semiannual report | Massachusetts Tax-Free Income Fund | 23 |
Note 4
Management fee and transactions with
affiliates and others
The Fund has an investment management contract with the Adviser. Under the investment management contract, the Fund pays a daily management fee to the Adviser equivalent, on an annual basis, to the sum of: (a) 0.50% of the first $250,000,000 of the Fund’s average daily net asset value, (b) 0.45% of the next $250,000,000, (c) 0.425% of the next $500,000,000, (d) 0.40% of the next $250,000,000 and (e) 0.30% of the Fund’s average daily net asset value in excess of $1,250,000,000. The Fund has a subadvisory agreement with MFC Global Investment Management (U.S.), LLC, a subsidiary of MFC and an affiliate of the Adviser. The Fund is not responsible for payment of subadvisory fees. The investment management fees incurred for the six-month period ended November 30, 2009, were equivalent to an annual effective rate of 0.50% of the Fund’s average dai ly net assets.
Pursuant to the Advisory Agreement, the Fund reimburses the Adviser for all expenses associated with providing the administrative, financial, legal, accounting and recordkeeping services of the Fund, including the preparation of all tax returns, annual, semiannual and periodic reports to shareholders and the preparation of all regulatory reports. These expenses are allocated based on the relative share of net assets of each class at the time the expense was incurred. The accounting and legal services fees incurred for the six-month period ended November 30, 2009, were equivalent to an annual effective rate of 0.02% of the Fund’s average daily net assets.
The Fund has a Distribution Agreement with the Distributor. The Fund has adopted Distribution Plans with respect to Class A, Class B and Class C shares, pursuant to Rule 12b-1 under the 1940 Act, to pay the Distributor for the services it provides as distributor of shares of the Fund. Accordingly, Class A shares and Class B shares make daily payments and Class C shares make monthly payments to the Distributor at an annual rate not to exceed 0.30%, 1.00% and 1.00% of average daily net asset value of Class A, Class B and Class C shares, respectively. A maximum of 0.25% of such payments may be service fees, as defined by the Conduct Rules of the Financial Industry Regulatory Authority. Under the Conduct Rules, curtailment of a portion of the Fund’s Rule 12b-1 payments could occur under certain circumstances.
Class A shares are assessed up-front sales charges. During the six-month period ended November 30, 2009, the Distributor received net up-front sales charges of $98,460 with regard to sales of Class A shares. Of this amount, $12,320 was retained and used for printing prospectuses, advertising, sales literature and other purposes, $84,250 was paid as sales commissions to unrelated broker-dealers and $1,890 was paid as sales commissions to sales personnel of Signator Investors, Inc. (Signator Investors), a related broker-dealer. Signator Investors is an affiliate of the Adviser.
Class B shares that are redeemed within six years of purchase are subject to a contingent deferred sales charge (CDSC) at declining rates, beginning at 5.00% of the lesser of the current market value at the time of redemption or the original purchase cost of the shares being redeemed. Class C shares that are redeemed within one year of purchase are subject to a CDSC at a rate of 1.00% of the lesser of the current market value at the time of redemption or the original purchase cost of the shares being redeemed. Proceeds from the CDSCs are paid to the Distributor and are used in whole or in part to defray its expenses for providing distribution-related services to the Fund in connection with the sale of Class B and Class C shares. During the six-month period ended November 30, 2009, CDSCs received by the Distributor amounted to $1,390 and $39 for Class B and Class C shares, respectively.
The Fund has a transfer agent agreement with John Hancock Signature Services, Inc. (Signature Services), an indirect subsidiary of MFC. The transfer agent fees are made up of three components:
| 24 | Massachusetts Tax-Free Income Fund | Semiannual report |
• The Fund pays a monthly transfer agent fee at an annual rate of 0.01% for all Classes based on each class’s average daily net assets.
• All classes of the Fund pay a monthly fee based on an annual rate of $17.50 per shareholder account.
• In addition, Signature Services is reimbursed for certain out-of-pocket expenses.
Signature Services has voluntarily agreed to waive certain transfer agent expenses. The amount of this waiver for the six-month period ended November 30, 2009 was $744.
Certain investor accounts that maintain small balances are charged an annual small accounts fee. Amounts related to these fees are credited to the Fund and netted against transfer agent expenses. For the six-month period ended November 30, 2009, these fees totaled $1,162.
Class level expenses for the six-month period ended November 30, 2009 were as follows:
| Distribution and | Transfer | |||
| Share class | service fees | agent fees | ||
| Class A | $148,717 | $30,282 | ||
| Class B | 33,688 | 2,138 | ||
| Class C | 79,479 | 4,693 | ||
| Total | $261,884 | $37,113 | ||
Note 5
Trustees’ fees
The compensation of independent Trustees is borne by the Fund. The independent Trustees may elect to defer, for tax purposes, their receipt of this compensation under the John Hancock Group of Funds Deferred Compensation Plan. The Fund makes investments into other John Hancock funds, as applicable, to cover its liability for the deferred compensation. Investments to cover the Fund’s deferred compensation liability are recorded on the Fund’s books as an other asset. The deferred compensation liability and the related other asset are always equal and are marked to market on a periodic basis to reflect any income earned by the investments, as well as any unrealized gains or losses. The Deferred Compensation Plan investments had no impact on the operations of the Fund.
| Semiannual report | Massachusetts Tax-Free Income Fund | 25 |
Note 6
Fund share transactions
This listing illustrates the number of Fund shares sold, reinvested and repurchased during the six-month period ended November 30, 2009, the nine-month period ended May 31, 2009 and the year ended August 31, 2008, along with the corresponding dollar value.
| Period ended 11-30-091 | Period ended 5-31-092 | Year ended 8-31-08 | ||||
| Shares | Amount | Shares | Amount | Shares | Amount | |
| Class A shares | ||||||
| Sold | 917,354 | $11,229,366 | 1,165,885 | $13,673,023 | 2,219,649 | $27,487,293 |
| Distributions | ||||||
| reinvested | 101,853 | 1,252,066 | 164,304 | 1,918,925 | 196,397 | 2,425,793 |
| Repurchased | (726,069) | (8,939,909) | (1,376,183) | (15,740,982) | (955,292) | (11,857,448) |
| Net increase | ||||||
| (decrease) | 293,138 | $3,541,523 | (45,994) | ($149,034) | 1,460,754 | $18,055,638 |
| Class B shares | ||||||
| Sold | 22,241 | $272,999 | 30,356 | $359,222 | 46,318 | $571,989 |
| Distributions | ||||||
| reinvested | 4,524 | 55,498 | 11,140 | 129,746 | 18,462 | 228,233 |
| Repurchased | (136,325) | (1,674,441) | (244,117) | (2,835,812) | (271,739) | (3,381,097) |
| Net decrease | (109,560) | ($1,345,944) | (202,621) | ($2,346,844) | (206,959) | ($2,580,875) |
| Class C shares | ||||||
| Sold | 339,737 | $4,159,553 | 271,489 | $3,213,587 | 272,222 | $3,366,433 |
| Distributions | ||||||
| reinvested | 12,043 | 148,195 | 18,700 | 218,103 | 20,820 | 257,178 |
| Repurchased | (109,628) | (1,349,293) | (129,730) | (1,483,045) | (145,385) | (1,803,501) |
| Net increase | 242,152 | $2,958,455 | 160,459 | $1,948,645 | 147,657 | $1,820,110 |
| Net increase | ||||||
| (decrease) | 425,730 | $5,154,034 | (88,156) | ($547,233) | 1,401,452 | $17,294,873 |
1 Semiannual period from 6-1-09 to 11-30-09. Unaudited.
2 For the nine month period ended May 31, 2009. The Fund changed its fiscal year end from August 31 to May 31.
Note 7
Purchase and sale of securities
Purchases and proceeds from sales or maturities of securities during the six-month period ended November 30, 2009, aggregated $18,768,184 and $15,267,119, respectively. These amounts include purchases and sales of variable rate demand notes, which amounted to $4,500,000 and $5,285,000, respectively. Other short-term securities are excluded from these amounts.
| 26 | Massachusetts Tax-Free Income Fund | Semiannual report |
Board Consideration of and
Continuation of Investment Advisory
Agreement and Subadvisory Agreement
The Investment Company Act of 1940 (the 1940 Act) requires the Board of Trustees (the Board) of John Hancock Tax-Exempt Series Fund (the Trust), including a majority of the Trustees who have no direct or indirect interest in the investment advisory agreement and are not “interested persons’ of the Trust, as defined in the 1940 Act (the Independent Trustees), annually to meet in person to review and consider the continuation of existing advisory and subadvisory agreements. At meetings held on May 6–7 and June 8–9, 2009, the Board considered the renewal of:
(i) the investment advisory agreement (the Advisory Agreement) with John Hancock Advisers, LLC (the Adviser) and
(ii) the investment subadvisory agreement (the Subadvisory Agreement) with MFC Global Investment Management (U.S.), LLC (the Subadviser) for the John Hancock Massachusetts Tax-Free Income Fund (the Fund).
The Advisory Agreement and the Subadvisory Agreement are collectively referred to as the Advisory Agreements. The Board considered the factors and reached the conclusions described below relating to the selection of the Adviser and Subadviser and the continuation of the Advisory Agreements. During such meetings, the Board’s Contracts/Operations Committee and the Independent Trustees also met in executive sessions with their independent legal counsel.
In evaluating the Advisory Agreements, the Board, including the Contracts/Operations Committee and its Independent Trustees, reviewed a broad range of information requested for this purpose. The Independent Trustees considered the legal advice of independent legal counsel and relied on their own business judgment in determining the factors to be considered in evaluating the materials that were presented to them and the weight to be given to each such factor. The Board’s review and conclusions were based on a comprehensive consideration of all information presented to the Board and not the result of any single controlling factor. The key factors considered by the Board and the conclusions reached are described below.
Nature, extent and quality of services
The Board considered the ability of the Adviser and the Subadviser, based on their resources, reputation and other attributes, to attract and retain qualified investment professionals, including research, advisory, and supervisory personnel. It considered the background and experience of senior management and investment professionals responsible for managing the Fund. The Board considered the investment philosophy, research and investment decision-making processes of the Adviser and the Subadviser responsible for the daily investment activities of the Fund. The Board considered the Subadviser’s history and experience with the Fund. The Board considered the Adviser’s execution of its oversight responsibilities. The Board further considered the culture of compliance, resources dedicated to compliance, compliance programs, record of compliance with applicable laws and regulation, with the Fund’s investment policies and restrictions and with the applicable Code of Ethics, and the responsibilities of the Adviser’s and Subadviser’s compliance department. In addition, the Board took into account the administrative and other non-advisory services provided to the Fund by the Adviser and its affiliates.
Based on the above factors, together with those referenced below, the Board concluded that, within the context of its full deliberations, the nature, extent and quality of the investment advisory services provided to the Fund by the Adviser and Subadviser supported renewal of the Advisory Agreements.
Fund performance
The Board considered the performance results for the Fund over various time periods ended December 31, 2008. The Board also considered these results in comparison to the performance of a category of relevant funds (the Category), a peer group of comparable funds (the Peer Group) and a benchmark index. The funds within each Category and Peer Group were selected by Morningstar Inc. (Morningstar), an independent provider of
| Semiannual report | Massachusetts Tax-Free Income Fund | 27 |
investment company data. The Board reviewed the methodology used by Morningstar to select the funds in the Category and the Peer Group. The Board also considered updated performance information at its May and June 2009 meetings. Performance and other information may be quite different as of the date of this shareholders report.
The Board noted that the Fund’s performance was equal to or inline with the performance of the Category median for the 1-, 5- and 10-year periods. The Board also noted that the Fund’s performance for the 3-year time period was lower than, but generally competitive with, the performance of the Category median. The Board viewed favorably that the Fund’s performance for all periods under review was higher than the performance of the Peer Group median. The Board noted that the Fund’s performance for all periods under review was lower than the performance of its benchmark index, the Barclays Capital Municipal Bond Index, as was the performance of the Category and Peer Group medians.
Investment advisory fee and subadvisory fee
rates and expenses
The Board reviewed and considered the contractual investment advisory fee rate payable by the Fund to the Adviser for investment advisory services (the Advisory Agreement Rate). The Board received and considered information comparing the Advisory Agreement Rate with the advisory fees for the Category and Peer Group. The Board noted that the Fund’s Advisory Agreement Rate was inline with the Category median and equal to the Peer Group median.
The Board received and considered expense information regarding the Fund’s various components, including advisory fees, distribution and fees other than advisory and distribution fees, including transfer agent fees, custodian fees, and other miscellaneous fees (e.g., fees for accounting and legal services). The Board considered comparisons of these expenses to the Peer Group median. The Board also received and considered expense information regarding the Fund’s total operating expense ratio (Expense Ratio). The Board received and considered information comparing the Expense Ratio of the Fund to that of the Peer Group and Category medians before the application of fee waivers and reimbursements (Gross Expense Ratio) and after the application of such waivers and reimbursement (Net Expense Ratio). The Board noted that the Fund’s Net Expense Ratio was higher than the Peer Group and Category medians. The Board also noted that the Fund’s Gross Expense Ratio was inline with the Category and Peer Group medians. The Board noted that the Fund’s distribution expense contributed to the Fund’s net expense results, and noted that, unlike the Fund, several funds in the Peer Group employed fee waivers or reimbursements.
The Adviser also discussed the Morningstar data and rankings, and other relevant information, for the Fund. Based on the above-referenced considerations and other factors, the Board concluded that the Fund’s overall performance and expense results supported the re-approval of the Advisory Agreements.
The Board also received information about the investment subadvisory fee rate (the Subadvisory Agreement Rate) payable by the Adviser to the Subadviser for investment subadvisory services. The Board concluded that the Subadvisory Agreement Rate was fair and equitable, based on its consideration of the factors described here.
Profitability
The Board received and considered a detailed profitability analysis of the Adviser based on the Advisory Agreements, as well as on other relationships between the Fund and the Adviser and its affiliates, including the Subadviser. The Board also considered a comparison of the Adviser’s profitability to that of other similar investment advisers whose profitability information is publicly available. The Board concluded that, in light of the costs of providing investment management and other services to the Fund, the profits and other ancillary benefits reported by the Adviser were not unreasonable.
Economies of scale
The Board received and considered general information regarding economies of scale with respect to the management of the Fund,
| 28 | Massachusetts Tax-Free Income Fund | Semiannual report |
including the Fund’s ability to appropriately benefit from economies of scale under the Fund’s fee structure. The Board recognized the inherent limitations of any analysis of economies of scale, stemming largely from the Board’s understanding that most of the Adviser’s and Subadviser’s costs are not specific to individual Funds, but rather are incurred across a variety of products and services. To ensure that any economies are reasonably shared with the Fund as its assets increase, the Adviser and the Board agreed to continue the existing breakpoints to the Advisory Agreement Rate.
Information about services to other clients
The Board also received information about the nature, extent and quality of services and fee rates offered by the Adviser and Subadviser to their other clients, including other registered investment companies, institutional investors and separate accounts. The Board concluded that the Advisory Agreement Rate and the Subadvisory Agreement Rate were not unreasonable, taking into account fee rates offered to others by the Adviser and Subadviser, respectively, after giving effect to differences in services.
Other benefits to the Adviser
The Board received information regarding potential “fall-out” or ancillary benefits received by the Adviser and its affiliates, including the Subadviser, as a result of their relationship with the Fund. Such benefits could include, among others, benefits directly attributable to the relationship of the Adviser and Subadviser with the Fund and benefits potentially derived from an increase in business as a result of their relationship with the Fund (such as the ability to market to shareholders other financial products offered by the Adviser and its affiliates).
Other factors and broader review
As discussed above, the Board reviewed detailed materials received from the Adviser and Subadviser as part of the annual re-approval process. The Board also regularly reviews and assesses the quality of the services that the Fund receives throughout the year. In this regard, the Board reviews reports of the Adviser and Subadviser at least quarterly, which include, among other things, fund performance reports and compliance reports. In addition, the Board meets with senior investment officers at various times throughout the year.
After considering the above-described factors and based on its deliberations and its evaluation of the information described above, the Board concluded that approval of the continuation of the Advisory Agreements for the Fund was in the best interest of the Fund and its shareholders. Accordingly, the Board unanimously approved the continuation of the Advisory Agreements.
| Semiannual report | Massachusetts Tax-Free Income Fund | 29 |
More information
Trustees
Patti McGill Peterson, Chairperson
James R. Boyle†
James F. Carlin
William H. Cunningham
Deborah C. Jackson*
Charles L. Ladner
Stanley Martin*
Dr. John A. Moore
Steven R. Pruchansky††
Gregory A. Russo
John G. Vrysen†
Officers
Keith F. Hartstein
President and Chief Executive Officer
Andrew G. Arnott‡
Chief Operating Officer
Thomas M. Kinzler
Secretary and Chief Legal Officer
Francis V. Knox, Jr.
Chief Compliance Officer
Charles A. Rizzo
Chief Financial Officer
Michael J. Leary
Treasurer
Investment adviser
John Hancock Advisers, LLC
Subadviser
MFC Global Investment
Management (U.S.), LLC
Principal distributor
John Hancock Funds, LLC
Custodian
State Street Bank and Trust Company
Transfer agent
John Hancock Signature Services, Inc.
Legal counsel
K&L Gates LLP
The report is certified under the Sarbanes-Oxley Act, which requires mutual funds and other public companies to affirm that, to the best of their knowledge, the information in their financial reports is fairly and accurately stated in all material respects.
* Member of the Audit Committee
†† Member of the Audit Committee effective 9-1-09
† Non-Independent Trustee
‡ Effective 9-1-09
The Fund’s proxy voting policies and procedures, as well as the Fund’s proxy voting record for the most recent twelve-month period ended June 30, are available free of charge on the Securities and Exchange Commission (SEC) Web site at www.sec.gov or on our Web site.
The Fund’s complete list of portfolio holdings, for the first and third fiscal quarters, is filed with the SEC on Form N-Q. The Fund’s Form N-Q is available on our Web site and the SEC’s Web site, www.sec.gov, and can be reviewed and copied (for a fee) at the SEC’s Public Reference Room in Washington, DC. Call 1-800-SEC-0330 to receive information on the operation of the SEC’s Public Reference Room.
We make this information on your fund, as well as monthly portfolio holdings, and other fund details available on our Web site www.jhfunds.com or by calling 1-800-225-5291.
| You can also contact us: | ||
| 1-800-225-5291 | Regular mail: | Express mail: |
| jhfunds.com | John Hancock Signature Services, Inc. | John Hancock Signature Services, Inc. |
| P.O. Box 55913 | Mutual Fund Image Operations | |
| Boston, MA 02205-5913 | 30 Dan Road | |
| Canton, MA 02021 | ||
| 30 | Massachusetts Tax-Free Income Fund | Semiannual report |

1-800-225-5291
1-800-554-6713 TDD
1-800-338-8080 EASI-Line
www.jhfunds.com
Now available: electronic delivery
www.jhfunds.com/edelivery
| This report is for the information of the shareholders of John Hancock Massachusetts Tax-Free Income Fund. | 770SA 11/09 |
| It is not authorized for distribution to prospective investors unless preceded or accompanied by a prospectus. | 1/10 |
ITEM 2. CODE OF ETHICS.
Not applicable at this time.
ITEM 3. AUDIT COMMITTEE FINANCIAL EXPERT.
Not applicable at this time.
ITEM 4. PRINCIPAL ACCOUNTANT FEES AND SERVICES.
Not applicable at this time.
ITEM 5. AUDIT COMMITTEE OF LISTED REGISTRANTS.
Not applicable at this time.
ITEM 6. SCHEDULE OF INVESTMENTS.
(a) Not applicable.
(b) Not applicable.
ITEM 7. DISCLOSURE OF PROXY VOTING POLICIES AND PROCEDURES FOR CLOSED-END MANAGEMENT INVESTMENT COMPANIES.
Not applicable.
ITEM 8. PORTFOLIO MANAGERS OF CLOSED-END MANAGEMENT INVESTMENT COMPANIES.
Not applicable.
ITEM 9. PURCHASES OF EQUITY SECURITIES BY CLOSED-END MANAGEMENT INVESTMENT COMPANY AND AFFILIATED PURCHASERS.
Not applicable.
ITEM 10. SUBMISSION OF MATTERS TO A VOTE OF SECURITY HOLDERS.
Not applicable.
ITEM 11. CONTROLS AND PROCEDURES.
(a) Based upon their evaluation of the registrant's disclosure controls and procedures as conducted within 90 days of the filing date of this Form N-CSR, the registrant's principal executive officer and principal financial officer have concluded that those disclosure controls and procedures provide reasonable assurance that the material information required to be disclosed by the registrant on this report is recorded, processed, summarized and reported within the time periods specified in the Securities and Exchange Commission's rules and forms.
(b) There were no changes in the registrant's internal control over financial reporting that occurred during the registrant's most recent fiscal half-year (the registrant's second fiscal half-year in the case of an annual report) that have materially affected, or are reasonably likely to materially affect, the registrant's internal control over financial reporting.
ITEM 12. EXHIBITS.
(a) Separate certifications for the registrant's principal executive officer and principal financial officer, as required by Section 302 of the Sarbanes-Oxley Act of 2002 and Rule 30a-2(a) under the Investment Company Act of 1940, are attached.
(b) Separate certifications for the registrant's principal executive officer and principal financial officer, as required by 18 U.S.C. Section 1350, as adopted pursuant to Section 906 of the Sarbanes-Oxley Act of 2002, and Rule 30a-2(b) under the Investment Company Act of 1940, are attached. The certifications furnished pursuant to this paragraph are not deemed to be "filed" for purposes of Section 18 of the Securities Exchange Act of 1934, or otherwise subject to the liability of that section. Such certifications are not deemed to be incorporated by reference into any filing under the Securities Act of 1933 or the Securities Exchange Act of 1934, except to the extent that the Registrant specifically incorporates them by reference.
(c)(1) Contact person at the registrant.
| SIGNATURES |
Pursuant to the requirements of the Securities Exchange Act of 1934 and the Investment Company Act of 1940, the registrant has duly caused this report to be signed on its behalf by the undersigned, thereunto duly authorized.
John Hancock Tax-Exempt Series Fund
By: /s/ Keith F. Hartstein
------------------------------
Keith F. Hartstein
President and Chief Executive Officer
Date: January 25, 2010
Pursuant to the requirements of the Securities Exchange Act of 1934 and the Investment Company Act of 1940, this report has been signed below by the following persons on behalf of the registrant and in the capacities and on the dates indicated.
By: /s/ Keith F. Hartstein
-------------------------------
Keith F. Hartstein
President and Chief Executive Officer
Date: January 25, 2010
By: /s/ Charles A. Rizzo
--------------------------------
Charles A. Rizzo
Chief Financial Officer
Date: January 25, 2010