| UNITED STATES | |
| SECURITIES AND EXCHANGE COMMISSION | |
| Washington, D.C. 20549 | |
| FORM N-CSR | |
| CERTIFIED SHAREHOLDER REPORT OF REGISTERED | |
| MANAGEMENT INVESTMENT COMPANIES | |
| Investment Company Act file number 811-5079 | |
| John Hancock Tax-Exempt Series Fund | |
| (Exact name of registrant as specified in charter) | |
| 601 Congress Street, Boston, Massachusetts 02210 | |
| (Address of principal executive offices) (Zip code) | |
| Salvatore Schiavone | |
| Treasurer | |
| 601 Congress Street | |
| Boston, Massachusetts 02210 | |
| (Name and address of agent for service) | |
| Registrant's telephone number, including area code: 617-663-4497 | |
| Date of fiscal year end: | May 31 |
| Date of reporting period: | May 31, 2012 |
ITEM 1. SCHEDULE OF INVESTMENTS
A look at performance
Total returns for the period ended May 31, 2012
| Tax | |||||||||||||
| Average annual total | Cumulative total | SEC 30-day | SEC 30-day | equivalent | |||||||||
| returns (%) | returns (%) | yield (%) | yield (%) | subsidized | |||||||||
| with maximum sales charge | with maximum sales charge | subsidized | unsubsidized1 | yield (%)2 | |||||||||
| as of | as of | as of | |||||||||||
| 1-year | 5-year | 10-year | 1-year | 5-year | 10-year | 5-31-12 | 5-31-12 | 5-31-12 | |||||
| Class A | 6.71 | 4.28 | 4.35 | 6.71 | 23.33 | 53.11 | 2.17 | 2.03 | 3.66 | ||||
| Class B | 5.90 | 4.17 | 4.26 | 5.90 | 22.68 | 51.77 | 1.54 | 1.44 | 2.60 | ||||
| Class C | 9.90 | 4.51 | 4.10 | 9.90 | 24.69 | 49.51 | 1.53 | 1.43 | 2.58 | ||||
Performance figures assume all distributions are reinvested. Figures reflect maximum sales charges on Class A shares of 4.5% and the applicable contingent deferred sales charge (CDSC) on Class B and Class C shares. The returns for Class C shares have been adjusted to reflect the elimination of the front-end sales charge effective 7-15-04. The Class B shares’ CDSC declines annually between years 1 to 6 according to the following schedule: 5, 4, 3, 3, 2, 1%. No sales charge will be assessed after the sixth year. Class C shares held for less than one year are subject to a 1% CDSC.
The expense ratios of the Fund, both net (including any fee waivers or expense limitations) and gross (excluding any fee waivers or expense limitations), are set forth according to the most recent publicly available prospectus for the Fund and may differ from those disclosed in the Financial highlights tables in this report. The fee waivers and expense limitations are contractual at least until 9-30-12 for Class A, Class B and Class C shares. Had the fee waivers and expense limitations not been in place gross expenses would apply. The expense ratios are as follows:
| Class A | Class B | Class C | ||||||
| Net (%) | 0.92 | 1.67 | 1.67 | |||||
| Gross (%) | 1.07 | 1.77 | 1.77 |
The returns reflect past results and should not be considered indicative of future performance. The return and principal value of an investment will fluctuate so that shares, when redeemed, may be worth more or less than their original cost. Due to market volatility, the Fund’s current performance may be higher or lower than the performance shown. For current to the most recent month end performance data, please call 1-800-225-5291 or visit the Fund’s Web site at www.jhfunds.com.
The performance table above and the chart on the next page do not reflect the deduction of taxes that a shareholder may pay on fund distributions or on the redemption of fund shares. Please note that a portion of the Fund’s income may be subject to taxes, and some investors may be subject to the Alternative Minimum Tax (AMT). Also note that capital gains are taxable. The Fund’s performance results reflect any applicable fee waivers or expense reductions, without which the expenses would increase and results would have been less favorable.
| 6 | New York Tax-Free Income Fund | Annual report |
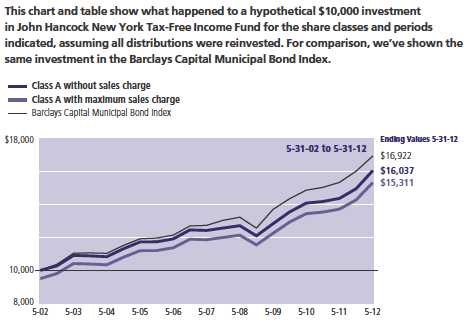
| Without | With maximum | |||
| Start date | sales charge | sales charge | Index | |
| Class B3 | 5-31-02 | $15,177 | $15,177 | $16,922 |
| Class C3 | 5-31-02 | 14,951 | 14,951 | 16,922 |
Performance of the classes will vary based on the difference in sales charges paid by shareholders investing in the different classes and the fee structure of those classes.
The Class C shares investment with maximum sales charge has been adjusted to reflect the elimination of the front-end sales charge effective 7-15-04.
Barclays Capital Municipal Bond Index is an unmanaged index representative of the tax-exempt bond market.
It is not possible to invest directly in an index. Index figures do not reflect sales charges or direct expenses, which would have resulted in lower values if they did.
1 Unsubsidized yield reflects what the yield would have been without the effect of reimbursements and waivers.
2 Tax-equivalent yield is based on the maximum federal income tax rate of 35% and a state tax rate of 8.82%. Share classes will differ due to varying fund expenses.
3 No contingent deferred sales charge is applicable.
| Annual report | New York Tax-Free Income Fund | 7 |
Management’s discussion of
Fund performance
By John Hancock Asset Management a division of Manulife Asset Management (US) LLC
Many municipal bonds posted double-digit gains for the 12 months ended May 31, 2012, thanks to favorable supply and demand dynamics in the municipal market. Demand for municipal bonds returned to normal after declining in late 2010 and early 2011, while modest new issuance and increased early redemptions reduced the outstanding supply of municipal bonds. Another factor contributing to the strong performance of municipal bonds was lower volatility compared with other segments of the financial markets, which attracted investors given uneven economic growth in the U.S. and sovereign debt problems in Europe. Long-term (more than 20 years) municipal bonds generated the best returns, while lower-rated municipal bonds outperformed higher-quality securities. The state of New York experienced some dips in tax revenues over the past year amid continued weakness in the financial sector. However, the budget restructuring undertaken by the governor and the state legislature helped the state make meaningful progress toward eliminating its budget deficit.
For the year ended May 31, 2012, John Hancock New York Tax-Free Income Fund’s Class A shares posted a total return of 11.71%, excluding sales charges. By comparison, Morningstar, Inc.’s muni New York long fund category produced an average return of 11.35%, while the Fund’s benchmark, the Barclays Capital Municipal Bond Index, returned 10.40%. The Fund took on more interest-rate sensitivity during the period as we increased the Fund’s holdings of longer-term bonds and saw some of the Fund’s shorter-term securities redeemed. This shift in positioning contributed favorably to results as long-term bonds outperformed. The Fund also benefited from its exposure to lower-rated credits — bonds rated A or lower attracted growing investor demand as municipal bond yields remained low on an absolute basis. The Fund’s holdings of lower-grade industrial development bonds also provided a boost to Fund performance.
This commentary reflects the views of the portfolio managers through the end of the period discussed in this report. The managers’ statements reflect their own opinions. As such, they are in no way guarantees of future events and are not intended to be used as investment advice or a recommendation regarding any specific security. They are also subject to change at any time as market and other conditions warrant.
Past performance is no guarantee of future results.
The major risk factors in this Fund’s performance are interest-rate and credit risk. When interest rates rise, bond prices usually fall. Generally, an increase in the Fund’s average maturity will make it more sensitive to interest-rate risk. Investments in higher-yielding, lower-rated securities involve additional risks as these securities include a higher risk of default and loss of principal. Municipal bond prices can decline due to fiscal mismanagement or tax shortfalls, or if related projects become unprofitable. Investments focused on one sector may fluctuate more widely than investments across various sectors. Because the Fund may focus on particular sectors, its performance may depend on the performance of those sectors.
If the Fund invests heavily in any one state or region, performance could be affected by factors particular to that state or region.
| 8 | New York Tax-Free Income Fund | Annual report |
Your expenses
These examples are intended to help you understand your ongoing operating expenses of investing in the Fund so you can compare these costs with the ongoing costs of investing in other mutual funds.
Understanding fund expenses
As a shareholder of the Fund, you incur two types of costs:
▪ Transaction costs which include sales charges (loads) on purchases or redemptions (varies by share class), minimum account fee charge, etc.
▪ Ongoing operating expenses including management fees, distribution and service fees (if applicable), and other fund expenses.
We are going to present only your ongoing operating expenses here.
Actual expenses/actual returns
This example is intended to provide information about the Fund’s actual ongoing operating expenses, and is based on the Fund’s actual return. It assumes an account value of $1,000.00 on December 1, 2011 with the same investment held until May 31, 2012.
| Account value | Ending value | Expenses paid during | |
| on 12-1-11 | on 5-31-12 | period ended 5-31-121 | |
| Class A | $1,000.00 | $1,073.30 | $4.82 |
| Class B | 1,000.00 | 1,068.40 | 8.69 |
| Class C | 1,000.00 | 1,068.40 | 8.69 |
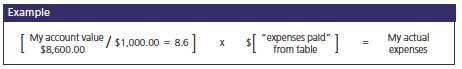
Together with the value of your account, you may use this information to estimate the operating expenses that you paid over the period. Simply divide your account value at May 31, 2012, by $1,000.00, then multiply it by the “expenses paid” for your share class from the table above. For example, for an account value of $8,600.00, the operating expenses should be calculated as follows:
| Annual report | New York Tax-Free Income Fund | 9 |
Your expenses
Hypothetical example for comparison purposes
This table allows you to compare the Fund’s ongoing operating expenses with those of any other fund. It provides an example of the Fund’s hypothetical account values and hypothetical expenses based on each class’s actual expense ratio and an assumed 5% annualized return before expenses (which is not the Fund’s actual return). It assumes an account value of $1,000.00 on December 1, 2011, with the same investment held until May 31, 2012. Look in any other fund shareholder report to find its hypothetical example and you will be able to compare these expenses.
| Account value | Ending value | Expenses paid during | |
| on 12-1-11 | on 5-31-12 | period ended 5-31-121 | |
| Class A | $1,000.00 | $1,020.40 | $4.70 |
| Class B | 1,000.00 | 1,016.60 | 8.47 |
| Class C | 1,000.00 | 1,016.60 | 8.47 |
Remember, these examples do not include any transaction costs, therefore, these examples will not help you to determine the relative total costs of owning different funds. If transaction costs were included, your expenses would have been higher. See the prospectus for details regarding transaction costs.
1 Expenses are equal to the Fund’s annualized expense ratio of 0.93%, 1.68% and 1.68% for Class A, Class B and Class C shares, respectively, multiplied by the average account value over the period, multiplied by 183/366 (to reflect the one half year period).
| 10 | New York Tax-Free Income Fund | Annual report |
Portfolio summary
| Top 10 Holdings (29.9% of Net Assets on 5-31-12)1,2 | ||||
| Oneida County Industrial Development Agency, Zero Coupon, 7-1-29 | 4.0% | |||
| New York State Dormitory Authority, 5.500%, 5-15-19 | 3.7% | |||
| Puerto Rico Sales Tax Financing Corp., Zero Coupon, 8-1-32 | 3.2% | |||
| Triborough Bridge & Tunnel Authority, 6.125%, 1-1-21 | 3.1% | |||
| Metropolitan Transportation Authority, 5.000%, 11-15-34 | 3.0% | |||
| New York City Municipal Water Finance Authority, Zero Coupon, 6-15-20 | 2.7% | |||
| Long Island Power Authority, 5.750%, 4-1-39 | 2.7% | |||
| New York State Dormitory Authority, 5.000%, 7-1-42 | 2.6% | |||
| Upper Mohawk Valley Regional Water Finance Authority, Zero Coupon, 4-1-22 | 2.6% | |||
| Port Authority of New York & New Jersey, 6.750%, 10-1-19 | 2.3% | |||
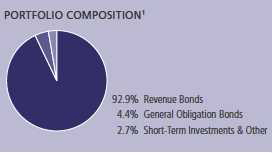
| Sector Composition1,3 | ||||
| General Obligation Bonds | 4.4% | Airport | 7.2% | |
| Revenue Bonds | Transportation | 4.9% | ||
| Education | 16.9% | Facilities | 1.7% | |
| Water & Sewer | 11.5% | Tobacco | 1.5% | |
| Development | 9.2% | Pollution | 1.3% | |
| Health Care | 8.1% | Other Revenue | 22.7% | |
| Utilities | 7.9% | Short-Term Investments & Other | 2.7% | |
| Quality Composition1,4 | ||||
| AAA | 5.3% | |||
| AA | 40.1% | |||
| A | 25.5% | |||
| BBB | 17.8% | |||
| BB | 4.3% | |||
| B | 1.3% | |||
| Not Rated | 3.0% | |||
| Short-Term Investments & Other | 2.7% | |||
1 As a percentage of net assets on 5-31-12.
2 Cash and cash equivalents not included.
3 Investments focused on one sector may fluctuate more widely than investments across various sectors. Because the Fund may focus on particular sectors, its performance may depend on the performance of those sectors.
4 Ratings are from Moody’s Investors Service, Inc. If not available, we have used Standard & Poor’s Corporation ratings. In the absence of ratings from these agencies, we have used Fitch, Inc. ratings. “Not Rated” securities are those with no ratings available from these agencies. All ratings are as of 5-31-12 and do not reflect subsequent downgrades or upgrades, if any.
| Annual report | New York Tax-Free Income Fund | 11 |
Fund’s investments
As of 5-31-12
| Maturity | |||||
| Rate (%) | date | Par value | Value | ||
| Municipal Bonds 97.3% | $62,538,759 | ||||
| (Cost $56,176,666) | |||||
| New York 84.8% | 54,495,686 | ||||
| Brooklyn Arena Local Development Corp. | |||||
| Barclays Center Project | 6.375 | 07-15-43 | $1,000,000 | 1,126,660 | |
| Chautauqua Asset Securitization Corp. | |||||
| Tobacco Settlement | 6.750 | 07-01-40 | 1,000,000 | 947,140 | |
| City of New York, Series D-1 | 5.000 | 10-01-36 | 1,000,000 | 1,127,850 | |
| City of New York, Series E-1 | 6.250 | 10-15-28 | 500,000 | 627,550 | |
| Herkimer County Industrial | |||||
| Development Agency | |||||
| Flots Adult Home, Series A | 5.500 | 03-20-40 | 960,000 | 1,077,301 | |
| Hudson Yards Infrastructure Corp. | |||||
| Series A | 5.750 | 02-15-47 | 1,000,000 | 1,151,330 | |
| Long Island Power Authority | |||||
| Electric, Power & Light Revenues, Series A | 5.750 | 04-01-39 | 1,500,000 | 1,731,045 | |
| Long Island Power Authority | |||||
| Electric, Power & Light Revenues, Series A | 6.000 | 05-01-33 | 1,000,000 | 1,199,230 | |
| Metropolitan Transportation Authority | |||||
| Transit Revenue, Series A | 5.250 | 11-15-28 | 1,000,000 | 1,135,540 | |
| Metropolitan Transportation Authority | |||||
| Transit Revenue, Series B | 5.000 | 11-15-34 | 1,750,000 | 1,951,303 | |
| Monroe County Industrial Development Corp., | |||||
| Series A | 5.000 | 07-01-41 | 1,000,000 | 1,099,480 | |
| Monroe Newpower Corp. | |||||
| Electric, Power & Light Revenues | 5.100 | 01-01-16 | 1,000,000 | 1,026,110 | |
| New York City Industrial Development Agency | |||||
| Airis JFK I LLC Project, Series A AMT | 5.500 | 07-01-28 | 1,000,000 | 961,470 | |
| New York City Industrial Development Agency | |||||
| Brooklyn Navy Yard Cogeneration | |||||
| Partners AMT | 5.650 | 10-01-28 | 1,000,000 | 854,980 | |
| New York City Industrial Development Agency | |||||
| Lycee Francais De NY Project, Series A (D) | 5.375 | 06-01-23 | 1,000,000 | 1,021,830 | |
| New York City Industrial Development Agency | |||||
| Polytechnic University Project (D) | 5.250 | 11-01-27 | 1,000,000 | 1,067,830 | |
| New York City Industrial Development Agency | |||||
| Terminal One Group Association Project | |||||
| AMT (P) | 5.500 | 01-01-21 | 1,000,000 | 1,071,300 | |
| New York City Municipal Water | |||||
| Finance Authority | |||||
| Water Revenue, Series A | 5.750 | 06-15-40 | 1,000,000 | 1,207,070 | |
| 12 | New York Tax-Free Income Fund | Annual report | See notes to financial statements |
| Maturity | |||||
| Rate (%) | date | Par value | Value | ||
| New York (continued) | |||||
| New York City Municipal Water | |||||
| Finance Authority | |||||
| Water Revenue, Series D (Z) | Zero | 06-15-20 | $2,000,000 | $1,747,080 | |
| New York City Municipal Water | |||||
| Finance Authority | |||||
| Water Revenue, Series FF-2 | 5.000 | 06-15-40 | 1,000,000 | 1,098,090 | |
| New York City Municipal Water | |||||
| Finance Authority | |||||
| Water Revenue, Series GG-1 | 5.000 | 06-15-39 | 1,000,000 | 1,098,740 | |
| New York City Transitional Finance Authority | |||||
| Government Fund/Grant Revenue, Series S-4 | 5.500 | 01-15-39 | 1,000,000 | 1,142,650 | |
| New York Liberty Development Corp. | |||||
| 7 World Trade Center, Class 2 | 5.000 | 09-15-43 | 1,000,000 | 1,087,890 | |
| New York Liberty Development Corp. | |||||
| 4 World Trade Center Project | 5.000 | 11-15-44 | 500,000 | 540,670 | |
| New York Liberty Development Corp. | |||||
| Bank of America Tower, Class 2 | 5.625 | 07-15-47 | 1,000,000 | 1,103,730 | |
| New York Local Assistance Corp. | |||||
| Sales Tax Revenue, Series C | 5.500 | 04-01-17 | 1,225,000 | 1,446,223 | |
| New York State Dormitory Authority | |||||
| Series B | 5.000 | 07-01-42 | 1,500,000 | 1,697,910 | |
| New York State Dormitory Authority | |||||
| General Purpose, Series E | 5.000 | 02-15-35 | 1,000,000 | 1,137,380 | |
| New York State Dormitory Authority | |||||
| Miriam Osborn Memorial Home Association, | |||||
| Series B (D) | 6.875 | 07-01-25 | 750,000 | 751,290 | |
| New York State Dormitory Authority | |||||
| Mount Sinai School of Medicine | 5.125 | 07-01-39 | 1,000,000 | 1,085,460 | |
| New York State Dormitory Authority | |||||
| North Shore Long Island Jewish Group, | |||||
| Series A | 5.000 | 05-01-41 | 1,000,000 | 1,074,350 | |
| New York State Dormitory Authority | |||||
| Orange Regional Medical Center | 6.125 | 12-01-29 | 750,000 | 814,073 | |
| New York State Dormitory Authority | |||||
| Rockefeller University, Series A | 5.000 | 07-01-37 | 1,000,000 | 1,159,670 | |
| New York State Dormitory Authority | |||||
| Rockefeller University, Series A | 5.000 | 07-01-41 | 1,000,000 | 1,128,810 | |
| New York State Dormitory Authority | |||||
| State University Educational Facilities, | |||||
| Series A (D) | 5.250 | 05-15-15 | 1,000,000 | 1,093,170 | |
| New York State Dormitory Authority | |||||
| State University Educational Facilities, Series A | 5.500 | 05-15-19 | 2,000,000 | 2,400,060 | |
| New York State Environmental Facilities Corp. | |||||
| Water Revenue, Series A | 5.000 | 06-15-34 | 1,000,000 | 1,171,430 | |
| Oneida County Industrial Development Agency | |||||
| Hamilton College Project, Series A (D)(Z) | Zero | 07-01-29 | 5,330,000 | 2,596,030 | |
| Onondaga County Industrial Development | |||||
| Agency AMT | 6.125 | 01-01-32 | 1,000,000 | 976,560 | |
| Orange County Industrial Development Agency | |||||
| Arden Hill Care Center, Series C | 7.000 | 08-01-31 | 500,000 | 453,130 | |
| Port Authority of New York & New Jersey | |||||
| 5th Installment Special Project AMT | 6.750 | 10-01-19 | 1,500,000 | 1,499,775 | |
| See notes to financial statements | Annual report | New York Tax-Free Income Fund | 13 |
| Maturity | |||||
| Rate (%) | date | Par value | Value | ||
| New York (continued) | |||||
| Port Authority of New York & New Jersey | |||||
| JFK International Airport Terminal | 6.000 | 12-01-36 | $1,000,000 | $1,121,110 | |
| Suffolk County Industrial Development Agency | |||||
| Huntington Hospital Project, Series B | 6.000 | 11-01-22 | 1,000,000 | 1,024,000 | |
| Triborough Bridge & Tunnel Authority | |||||
| Highway Revenue Tolls, Escrowed to | |||||
| Maturity, Series Y | 6.125 | 01-01-21 | 1,500,000 | 2,013,795 | |
| Upper Mohawk Valley Regional Water | |||||
| Finance Authority | |||||
| Water Revenue (D)(Z) | Zero | 04-01-22 | 2,230,000 | 1,647,591 | |
| Puerto Rico 9.9% | 6,338,378 | ||||
| Commonwealth of Puerto Rico | |||||
| Public Improvement, Series A | 5.750 | 07-01-41 | 1,000,000 | 1,072,280 | |
| Puerto Rico Aqueduct & Sewer Authority | |||||
| Water Revenue, Series A | 5.125 | 07-01-37 | 500,000 | 501,345 | |
| Puerto Rico Public Building Authority | |||||
| Lease Revenue, Series A (D) | 6.250 | 07-01-12 | 1,110,000 | 1,115,028 | |
| Puerto Rico Sales Tax Financing Corp. | |||||
| Sales Tax Revenue, Series A (Zero coupon | |||||
| steps up to 6.750% on 8-1-16) (Z) | Zero | 08-01-32 | 2,000,000 | 2,052,980 | |
| Puerto Rico Sales Tax Financing Corp., Series C | 5.000 | 08-01-35 | 1,000,000 | 1,059,730 | |
| Puerto Rico Sales Tax Financing Corp., Series C | 5.375 | 08-01-38 | 500,000 | 537,015 | |
| Virgin Islands 1.8% | 1,168,240 | ||||
| Virgin Islands Public Finance Authority, Series A | 6.750 | 10-01-37 | 1,000,000 | 1,168,240 | |
| Guam 0.8% | 536,455 | ||||
| Guam Government, Series A | 5.750 | 12-01-34 | 500,000 | 536,455 | |
| Par value | Value | ||||
| Short-Term Investments 1.9% | $1,225,000 | ||||
| (Cost $1,225,000) | |||||
| Repurchase Agreement 1.9% | 1,225,000 | ||||
| Repurchase Agreement with State Street Corp. dated 5-31-12 | |||||
| at 0.010% to be repurchased at $1,225,000 on 6-1-12, | |||||
| collateralized by $1,250,000 Federal Home Loan Bank, | |||||
| 0.280% due 8-2-13 (valued at $1,251,173 including interest) | $1,225,000 | 1,225,000 | |||
| Total investments (Cost $57,401,666)† 99.2% | $63,763,759 | ||||
| Other assets and liabilities, net 0.8% | $498,848 | ||||
| Total net assets 100.0% | $64,262,607 | ||||
The percentage shown for each investment category is the total value of the category as a percentage of the net assets of the Fund.
| 14 | New York Tax-Free Income Fund | Annual report | See notes to financial statements |
Notes to Schedule of Investments
AMT Interest earned from these securities may be considered a tax preference item for purpose of the Federal Alternative Minimum Tax.
(D) Bond is insured by one of these companies:
| Insurance Coverage | As a % of total investments | |
| ACA Financial Guaranty Corp. | 4.5% | |
| Ambac Financial Group, Inc. | 4.3% | |
| National Public Finance Guarantee Insurance Company | 5.8% | |
(P) Variable rate obligation. The coupon rate shown represents the rate at period end.
(Z) Zero coupon bonds are issued at a discount from their principal amount in lieu of paying interest periodically.
† At 5-31-12, the aggregate cost of investment securities for federal income tax purposes was $57,278,828. Net unrealized appreciation aggregated $6,484,931 of which $6,650,160 related to appreciated investment securities and $165,229 related to depreciated investment securities.
The Fund had the following sector composition as a percentage of total net assets on 5-31-12:
| General Obligation Bonds | 4.4% | ||
| Revenue Bonds | |||
| Education | 16.9% | ||
| Water & Sewer | 11.5% | ||
| Development | 9.2% | ||
| Health Care | 8.1% | ||
| Utilities | 7.9% | ||
| Airport | 7.2% | ||
| Transportation | 4.9% | ||
| Facilities | 1.7% | ||
| Tobacco | 1.5% | ||
| Pollution | 1.3% | ||
| Other Revenue | 22.7% | ||
| Short-Term Investments & Other | 2.7% |
| See notes to financial statements | Annual report | New York Tax-Free Income Fund | 15 |
F I N A N C I A L S T A T E M E N T S
Financial statements
Statement of assets and liabilities 5-31-12
This Statement of assets and liabilities is the Fund’s balance sheet. It shows the value of what the Fund owns, is due and owes. You’ll also find the net asset value and the maximum offering price per share.
| Assets | |
| Investments, at value (Cost $57,401,666) | $63,763,759 |
| Cash | 9,814 |
| Receivable for fund shares sold | 32,667 |
| Interest receivable | 769,089 |
| Receivable from affiliates | 5,543 |
| Other receivables and prepaid expenses | 10,602 |
| Total assets | 64,591,474 |
| Liabilities | |
| Payable for fund shares repurchased | 250,162 |
| Distributions payable | 25,879 |
| Payable to affiliates | |
| Accounting and legal services fees | 3,151 |
| Transfer agent fees | 3,575 |
| Distribution and service fees | 12,451 |
| Trustees’ fees | 3,762 |
| Other liabilities and accrued expenses | 29,887 |
| Total liabilities | 328,867 |
| Net assets | |
| Paid-in capital | $57,661,406 |
| Undistributed net investment income | 23,929 |
| Accumulated net realized gain (loss) on investments | 215,179 |
| Net unrealized appreciation (depreciation) on investments | 6,362,093 |
| Net assets | $64,262,607 |
| Net asset value per share | |
| Based on net asset values and shares outstanding — the Fund has an | |
| unlimited number of shares authorized with no par value | |
| Class A ($52,981,886 ÷ 4,132,571 shares) | $12.82 |
| Class B ($2,146,264 ÷ 167,388 shares)1 | $12.82 |
| Class C ($9,134,457 ÷ 712,364 shares)1 | $12.82 |
| Maximum offering price per share | |
| Class A (net asset value per share ÷ 95.5%)2 | $13.42 |
1 Redemption price per share is equal to the net asset value less any applicable contingent deferred sales charge.
2 On single retail sales of less than $100,000. On sales of $100,000 or more and on group sales the offering price is reduced.
| 16 | New York Tax-Free Income Fund | Annual report | See notes to financial statements |
F I N A N C I A L S T A T E M E N T S
Statement of operations For the year ended 5-31-12
This Statement of operations summarizes the Fund’s investment income earned and expenses incurred in operating the Fund. It also shows net gains (losses) for the period stated.
| Investment income | |
| Interest | $3,037,556 |
| Expenses | |
| Investment management fees | 313,023 |
| Distribution and service fees | 261,306 |
| Accounting and legal services fees | 12,867 |
| Transfer agent fees | 41,702 |
| Trustees’ fees | 4,309 |
| State registration fees | 9,408 |
| Printing and postage | 8,212 |
| Professional fees | 42,187 |
| Custodian fees | 11,883 |
| Registration and filing fees | 18,727 |
| Other | 14,376 |
| Total expenses | 738,000 |
| Less expense reductions | (78,971) |
| Net expenses | 659,029 |
| Net investment income | 2,378,527 |
| Realized and unrealized gain (loss) | |
| Net realized gain on Investments | 142,970 |
| Change in net unrealized appreciation (depreciation) of Investments | 4,346,005 |
| Net realized and unrealized gain | 4,488,975 |
| Increase in net assets from operations | $6,867,502 |
| See notes to financial statements | Annual report | New York Tax-Free Income Fund | 17 |
F I N A N C I A L S T A T E M E N T S
Statements of changes in net assets
These Statements of changes in net assets show how the value of the Fund’s net assets has changed during the last two periods. The difference reflects earnings less expenses, any investment gains and losses, distributions, if any, paid to shareholders and the net of Fund share transactions.
| Year | Year | |
| ended | ended | |
| 5-31-12 | 5-31-11 | |
| Increase (decrease) in net assets | ||
| From operations | ||
| Net investment income | $2,378,527 | $2,613,552 |
| Net realized gain (loss) | 142,970 | (11,832) |
| Change in net unrealized appreciation (depreciation) | 4,346,005 | (1,584,978) |
| Increase in net assets resulting from operations | 6,867,502 | 1,016,742 |
| Distributions to shareholders | ||
| From net investment income | ||
| Class A | (2,034,067) | (2,160,862) |
| Class B | (67,551) | (87,536) |
| Class C | (264,603) | (281,845) |
| From net realized gain | ||
| Class A | (37,821) | — |
| Class B | (1,492) | — |
| Class C | (5,975) | — |
| Total distributions | (2,411,509) | (2,530,243) |
| From Fund share transactions | (204,711) | (2,867,247) |
| Total increase (decrease) | 4,251,282 | (4,380,748) |
| Net assets | ||
| Beginning of year | 60,011,325 | 64,392,073 |
| End of year | $64,262,607 | $60,011,325 |
| Undistributed net investment income | $23,929 | $20,062 |
| 18 | New York Tax-Free Income Fund | Annual report | See notes to financial statements |
Financial highlights
The Financial highlights show how the Fund’s net asset value for a share has changed during the period.
| CLASS A SHARES Period ended | 5-31-12 | 5-31-11 | 5-31-10 | 5-31-091 | 8-31-08 | 8-31-07 |
| Per share operating performance | ||||||
| Net asset value, beginning of period | $11.94 | $12.20 | $11.60 | $11.96 | $12.03 | $12.40 |
| Net investment income2 | 0.48 | 0.52 | 0.51 | 0.38 | 0.51 | 0.52 |
| Net realized and unrealized gain (loss) | ||||||
| on investments | 0.89 | (0.28) | 0.60 | (0.36) | (0.07) | (0.37) |
| Total from investment operations | 1.37 | 0.24 | 1.11 | 0.02 | 0.44 | 0.15 |
| Less distributions | ||||||
| From net investment income | (0.48) | (0.50) | (0.51) | (0.38) | (0.51) | (0.52) |
| From net realized gain | (0.01) | — | — | — | — | — |
| Total distributions | (0.49) | (0.50) | (0.51) | (0.38) | (0.51) | (0.52) |
| Net asset value, end of period | $12.82 | $11.94 | $12.20 | $11.60 | $11.96 | $12.03 |
| Total return (%)3 | 11.714 | 2.044 | 9.714 | 0.285 | 3.734 | 1.184 |
| Ratios and supplemental data | ||||||
| Net assets, end of period (in millions) | $53 | $50 | $54 | $46 | $44 | $40 |
| Ratios (as a percentage of average net assets): | ||||||
| Expenses before reductions | 1.06 | 1.08 | 1.10 | 1.196,7 | 1.04 | 1.03 |
| Expenses net of fee waivers | 0.93 | 0.96 | 1.10 | 1.196,7 | 1.04 | 1.03 |
| Net investment income | 3.92 | 4.31 | 4.27 | 4.506 | 4.28 | 4.22 |
| Portfolio turnover (%) | 16 | 9 | 7 | 22 | 25 | 17 |
1 For the nine-month period ended 5-31-09. The Fund changed its fiscal year end from August 31 to May 31.
2 Based on the average daily shares outstanding.
3 Does not reflect the effect of sales charges, if any.
4 Total returns would have been lower had certain expenses not been reduced during the periods shown.
5 Not annualized.
6 Annualized.
7 Includes proxy fees. The impact of this expense to the gross and net expense ratios was 0.04%.
| See notes to financial statements | Annual report | New York Tax-Free Income Fund | 19 |
| CLASS B SHARES Period ended | 5-31-12 | 5-31-11 | 5-31-10 | 5-31-091 | 8-31-08 | 8-31-07 |
| Per share operating performance | ||||||
| Net asset value, beginning of period | $11.94 | $12.21 | $11.60 | $11.96 | $12.03 | $12.40 |
| Net investment income2 | 0.39 | 0.43 | 0.42 | 0.32 | 0.43 | 0.43 |
| Net realized and unrealized gain (loss) | ||||||
| on investments | 0.89 | (0.28) | 0.61 | (0.36) | (0.07) | (0.37) |
| Total from investment operations | 1.28 | 0.15 | 1.03 | (0.04) | 0.36 | 0.06 |
| Less distributions | ||||||
| From net investment income | (0.39) | (0.42) | (0.42) | (0.32) | (0.43) | (0.43) |
| From net realized gain | (0.01) | — | — | — | — | — |
| Total distributions | (0.40) | (0.42) | (0.42) | (0.32) | (0.43) | (0.43) |
| Net asset value, end of period | $12.82 | $11.94 | $12.21 | $11.60 | $11.96 | $12.03 |
| Total return (%)3 | 10.904 | 1.254 | 9.034 | (0.24)5 | 3.014 | 0.484 |
| Ratios and supplemental data | ||||||
| Net assets, end of period (in millions) | $2 | $2 | $3 | $6 | $8 | $11 |
| Ratios (as a percentage of average net assets): | ||||||
| Expenses before reductions | 1.76 | 1.77 | 1.80 | 1.896,7 | 1.74 | 1.73 |
| Expenses net of fee waivers | 1.66 | 1.66 | 1.80 | 1.896,7 | 1.74 | 1.73 |
| Net investment income | 3.18 | 3.59 | 3.57 | 3.806 | 3.57 | 3.52 |
| Portfolio turnover (%) | 16 | 9 | 7 | 22 | 25 | 17 |
1 For the nine-month period ended 5-31-09. The Fund changed its fiscal year end from August 31 to May 31.
2 Based on the average daily shares outstanding.
3 Does not reflect the effect of sales charges, if any.
4 Total returns would have been lower had certain expenses not been reduced during the periods shown.
5 Not annualized.
6 Annualized.
7 Includes proxy fees. The impact of this expense to the gross and net expense ratios was 0.04%.
| CLASS C SHARES Period ended | 5-31-12 | 5-31-11 | 5-31-10 | 5-31-091 | 8-31-08 | 8-31-07 |
| Per share operating performance | ||||||
| Net asset value, beginning of period | $11.94 | $12.21 | $11.60 | $11.96 | $12.03 | $12.40 |
| Net investment income2 | 0.39 | 0.43 | 0.43 | 0.32 | 0.43 | 0.43 |
| Net realized and unrealized gain (loss) | ||||||
| on investments | 0.89 | (0.28) | 0.60 | (0.36) | (0.07) | (0.37) |
| Total from investment operations | 1.28 | 0.15 | 1.03 | (0.04) | 0.36 | 0.06 |
| Less distributions | ||||||
| From net investment income | (0.39) | (0.42) | (0.42) | (0.32) | (0.43) | (0.43) |
| From net realized gain | (0.01) | — | — | — | — | — |
| Total distributions | (0.40) | (0.42) | (0.42) | (0.32) | (0.43) | (0.43) |
| Net asset value, end of period | $12.82 | $11.94 | $12.21 | $11.60 | $11.96 | $12.03 |
| Total return (%)3 | 10.904 | 1.254 | 9.044 | (0.24)5 | 3.014 | 0.484 |
| Ratios and supplemental data | ||||||
| Net assets, end of period (in millions) | $9 | $8 | $8 | $6 | $3 | $4 |
| Ratios (as a percentage of average net assets): | ||||||
| Expenses before reductions | 1.76 | 1.78 | 1.80 | 1.896,7 | 1.74 | 1.73 |
| Expenses net of fee waivers | 1.66 | 1.66 | 1.80 | 1.896,7 | 1.74 | 1.73 |
| Net investment income | 3.19 | 3.61 | 3.56 | 3.796 | 3.57 | 3.51 |
| Portfolio turnover (%) | 16 | 9 | 7 | 22 | 25 | 17 |
1 For the nine-month period ended 5-31-09. The Fund changed its fiscal year end from August 31 to May 31.
2 Based on the average daily shares outstanding.
3 Does not reflect the effect of sales charges, if any.
4 Total returns would have been lower had certain expenses not been reduced during the periods shown.
5 Not annualized.
6 Annualized.
7 Includes proxy fees. The impact of this expense to the gross and net expense ratios was 0.04%.
| 20 | New York Tax-Free Income Fund | Annual report | See notes to financial statements |
Notes to financial statements
Note 1 — Organization
John Hancock New York Tax-Free Income Fund (the Fund) is a series of John Hancock Tax-Exempt Series Fund (the Trust), an open-end management investment company organized as a Massachusetts business trust and registered under the Investment Company Act of 1940, as amended (the 1940 Act). The investment objective of the Fund is to seek a high level of current income, consistent with preservation of capital, that is exempt from federal, New York State and New York City personal income taxes.
The Fund may offer multiple classes of shares. The shares currently offered are detailed in the Statement of assets and liabilities. Class A, Class B and Class C shares are offered to all investors. Shareholders of each class have exclusive voting rights to matters that affect that class. The distribution and service fees, if any, and transfer agent fees for each class may differ. Class B shares convert to Class A shares eight years after purchase.
Note 2 — Significant accounting policies
The financial statements have been prepared in conformity with accounting principles generally accepted in the United States of America, which require management to make certain estimates and assumptions at the date of the financial statements. Actual results could differ from those estimates. Events or transactions occurring after the end of the fiscal period through the date that the financial statements were issued have been evaluated in the preparation of the financial statements. The following summarizes the significant accounting policies of the Fund:
Security valuation. Investments are stated at value as of the close of regular trading on the New York Stock Exchange (NYSE), normally at 4:00 P.M., Eastern Time. The Fund uses a three-tier hierarchy to prioritize the pricing assumptions, referred to as inputs, used in valuation techniques to measure fair value. Level 1 includes securities valued using quoted prices in active markets for identical securities. Level 2 includes securities valued using significant observable inputs. Observable inputs may include quoted prices for similar securities, interest rates, prepayment speeds and credit risk. Prices for securities valued using these inputs are received from independent pricing vendors and brokers and are based on an evaluation of the inputs described. Level 3 includes securities valued using significant unobservable inputs when market prices are not readily available or reliable, including the Fund’s own assumptions in determining the fair value of investments. Factors used in determining value may include market or issuer specific events, changes in interest rates and credit quality. The inputs or methodology used for valuing securities are not necessarily an indication of the risks associated with investing in those securities.
As of May 31, 2012, all investments are categorized as Level 2 under the hierarchy described above. Changes in valuation techniques may result in transfers into or out of an assigned level within the disclosure hierarchy. During the year ended May 31, 2012, there were no significant transfers into or out of Level 1, Level 2 or Level 3.
In order to value the securities, the Fund uses the following valuation techniques. Debt obligations are valued based on the evaluated prices provided by an independent pricing service, which utilizes both dealer-supplied and electronic data processing techniques, taking into account factors such as institutional-size trading in similar groups of securities, yield, quality, coupon rate, maturity, type of issue, trading characteristics and other market data. Certain securities traded only in the
| Annual report | New York Tax-Free Income Fund | 21 |
over-the-counter market are valued at the last bid price quoted by brokers making markets in the securities at the close of trading. Certain short-term securities are valued at amortized cost. Other portfolio securities and assets, where market quotations are not readily available, are valued at fair value, as determined in good faith by the Fund’s Pricing Committee, following procedures established by the Board of Trustees.
Repurchase agreements. The Fund may enter into repurchase agreements. When the Fund enters into a repurchase agreement, it receives collateral which is held in a segregated account by the Fund’s custodian. The collateral amount is marked-to-market and monitored on a daily basis to ensure that the collateral held is in an amount not less than the principal amount of the repurchase agreement plus any accrued interest. In the event of a default by the counterparty, realization of the collateral proceeds could be delayed, during which time the collateral value may decline.
Security transactions and related investment income. Investment security transactions are accounted for on a trade date plus one basis for daily net asset value calculations. However, for financial reporting purposes, investment transactions are reported on trade date. Interest income is accrued as earned. Interest income includes coupon interest and amortization/accretion of premiums/discounts on debt securities. Debt obligations may be placed in a non-accrual status and related interest income may be reduced by stopping current accruals and writing off interest receivable when the collection of all or a portion of interest has become doubtful. Gains and losses on securities sold are determined on the basis of identified cost and may include proceeds from litigation.
Line of credit. The Fund may borrow from banks for temporary or emergency purposes, including meeting redemption requests that otherwise might require the untimely sale of securities. Pursuant to the custodian agreement, the custodian may loan money to the Fund to make properly authorized payments. The Fund is obligated to repay the custodian for any overdraft, including any related costs or expenses. The custodian may have a lien, security interest or security entitlement in any Fund property that is not otherwise segregated or pledged, to the maximum extent permitted by law, to the extent of any overdraft.
In addition, the Fund and other affiliated funds have entered into an agreement with Citibank N.A. which enables them to participate in a $100 million unsecured committed line of credit. A commitment fee, payable at the end of each calendar quarter, based on the average daily unused portion of the line of credit, is charged to each participating fund on a pro rata basis and is reflected in other expenses on the Statement of operations. For the year ended May 31, 2012, the Fund had no borrowings under the line of credit.
Expenses. Within the John Hancock Funds complex, expenses that are directly attributable to an individual fund are allocated to such fund. Expenses that are not readily attributable to a specific fund are allocated among all funds in an equitable manner, taking into consideration, among other things, the nature and type of expense and the fund’s relative net assets. Expense estimates are accrued in the period to which they relate and adjustments are made when actual amounts are known.
Class allocations. Income, common expenses and realized and unrealized gains (losses) are determined at the fund level and allocated daily to each class of shares based on the net assets of the class. Class-specific expenses, such as distribution and service fees, if any, and transfer agent fees, are calculated daily for each class, based on the net asset value of the class and the applicable specific expense rates.
| 22 | New York Tax-Free Income Fund | Annual report |
Federal income taxes. The Fund intends to continue to qualify as a regulated investment company by complying with the applicable provisions of the Internal Revenue Code and will not be subject to federal income tax on taxable income that is distributed to shareholders. Therefore, no federal income tax provision is required.
As of May 31, 2012, the Fund had no uncertain tax positions that would require financial statement recognition, derecognition or disclosure. The Fund’s federal tax returns are subject to examination by the Internal Revenue Service for a period of three years.
Distribution of income and gains. Distributions to shareholders from net investment income and net realized gains, if any, are recorded on the ex-date. The Fund generally declares dividends daily and pays them monthly. Capital gain distributions, if any, are distributed at least annually. The tax character of distributions for the years ended May 31, 2012 and May 31, 2011 was as follows:
| MAY 31, 2012 | MAY 31, 2011 | ||||
| Ordinary Income | $3,176 | $156 | |||
| Exempt Interest | $2,363,045 | $2,530,087 | |||
| Long-Term Capital Gain | $45,288 | — | |||
Distributions paid by the Fund with respect to each class of shares are calculated in the same manner, at the same time and in the same amount, except for the effect of class level expenses that may be applied differently to each class. As of May 31, 2012, the components of distributable earnings on a tax basis included $52,289 of undistributed exempt interest and $92,341 of long-term capital gains.
Such distributions and distributable earnings, on a tax basis, are determined in conformity with income tax regulations, which may differ from accounting principles generally accepted in the United States of America. Material distributions in excess of tax basis earnings and profits, if any, are reported in the Fund’s financial statements as a return of capital.
Capital accounts within the financial statements are adjusted for permanent book-tax differences. These adjustments have no impact on net assets or the results of operations. Temporary book-tax differences, if any, will reverse in a subsequent period. Book-tax differences are primarily attributable to distributions payable and accretion on debt securities.
New accounting pronouncements. In May 2011, Accounting Standards Update 2011-04 (ASU 2011-04), Amendments to Achieve Common Fair Value Measurement and Disclosure Requirements in U.S. GAAP and IFRSs, was issued and is effective during interim and annual periods beginning after December 15, 2011. ASU 2011-04 may result in additional disclosure for transfers between levels as well as expanded disclosure for securities categorized as Level 3 under the fair value hierarchy.
In December 2011, the Financial Accounting Standards Board issued Accounting Standards Update No. 2011-11 (ASU 2011-11), Disclosures about Offsetting Assets and Liabilities. The update creates new disclosure requirements requiring entities to disclose both gross and net information for derivatives and other financial instruments that are either offset in the Statement of assets and liabilities or subject to an enforceable master netting arrangement or similar agreement. The disclosure requirements are effective for annual reporting periods beginning on or after January 1, 2013 and interim periods within those annual periods. ASU 2011-11 may result in additional disclosure relating to the presentation of derivatives and certain other financial instruments.
Note 3 — Guarantees and indemnifications
Under the Fund’s organizational documents, its Officers and Trustees are indemnified against certain liabilities arising out of the performance of their duties to the Fund. Additionally, in the normal course of business, the Fund enters into contracts with service providers that contain
| Annual report | New York Tax-Free Income Fund | 23 |
general indemnification clauses. The Fund’s maximum exposure under these arrangements is unknown, as this would involve future claims that may be made against the Fund that have not yet occurred. The risk of material loss from such claims is considered remote.
Note 4 — Fees and transactions with affiliates
John Hancock Advisers, LLC (the Adviser) serves as investment adviser for the Fund. John Hancock Funds, LLC (the Distributor), an affiliate of the Adviser, serves as principal underwriter of the Fund. The Adviser and the Distributor are indirect, wholly owned subsidiaries of Manulife Financial Corporation (MFC).
Management fee. The Fund has an investment management agreement with the Adviser under which the Fund pays a daily management fee to the Adviser equivalent, on an annual basis, to the sum of: (a) 0.500% of the first $250,000,000 of the Fund’s average daily net assets, (b) 0.450% of the next $250,000,000, (c) 0.425% of the next $500,000,000, (d) 0.400% of the next $250,000,000 and (e) 0.300% of the Fund’s average daily net assets in excess of $1,250,000,000. The Adviser has a subadvisory agreement with John Hancock Asset Management a division of Manulife Asset Management (US) LLC, an indirectly owned subsidiary of MFC and an affiliate of the Adviser. The Fund is not responsible for payment of the subadvisory fees.
Prior to October 1, 2011, the Adviser contractually agreed to waive fees and/or reimburse certain expenses for each share class of the Fund. This agreement excluded taxes, portfolio brokerage commissions, interest expense, litigation and indemnification expenses and other extraordinary expenses not incurred in the ordinary course of the Fund’s business. The fee waivers and/or expense reimbursements were such that these expenses would not exceed 0.94%, 1.64%, and 1.64% for Class A, Class B and Class C shares, respectively. The fee waivers and/or expense reimbursements expired on September 30, 2011.
Accordingly, these expense reductions amounted to $3,048, $309 and $1,199 for Class A, Class B and Class C shares, respectively, for the year ended May 31, 2012.
The investment management fees incurred for the year ended May 31, 2012 were equivalent to a net effective rate of 0.49% of the Fund’s average daily net assets.
Accounting and legal services. Pursuant to a service agreement, the Fund reimburses the Adviser for all expenses associated with providing the administrative, financial, legal, accounting and recordkeeping services to the Fund, including the preparation of all tax returns, periodic reports to shareholders and regulatory reports, among other services. These expenses are allocated to each share class based on its relative net assets at the time the expense was incurred. These accounting and legal services fees incurred for the year ended May 31, 2012 amounted to an annual rate of 0.02% of the Fund’s average daily net assets.
Distribution and service plans. The Fund has a distribution agreement with the Distributor. The Fund has adopted distribution and service plans with respect to Class A, Class B and Class C shares pursuant to Rule 12b-1 under the 1940 Act, to pay the Distributor for services provided as the distributor of shares of the Fund. The Fund may pay up to the following contractual rates of distribution and service fees under these arrangements, expressed as an annual percentage of average daily net assets for each class of the Fund’s shares.
| CLASS | 12b-1 FEE | ||||
| Class A | 0.30% | ||||
| Class B | 1.00% | ||||
| Class C | 1.00% | ||||
| 24 | New York Tax-Free Income Fund | Annual report |
Effective August 1, 2011, the Distributor contractually agreed to limit distribution and service fees to 0.15%, 0.90% and 0.90% of the average daily net assets of Class A, Class B and Class C shares, respectively, until at least September 30, 2012, unless renewed by mutual agreement of the Fund and the Distributor based upon a determination that is appropriate under the circumstances at the time.
Accordingly, these fee limitations amounted to $65,608, $1,783 and $7,024 for Class A, Class B and Class C shares, respectively, for the year ended May 31, 2012.
Sales charges. Class A shares are assessed up-front sales charges, which resulted in payments to the Distributor amounting to $114,415 for the year ended May 31, 2012. Of this amount, $16,020 was retained and used for printing prospectuses, advertising, sales literature and other purposes, $91,475 was paid as sales commissions to broker-dealers and $6,920 was paid as sales commissions to sales personnel of Signator Investors, Inc., a broker-dealer affiliate of the Adviser.
Class B and Class C shares are subject to contingent deferred sales charges (CDSCs). Class B shares that are redeemed within six years of purchase are subject to CDSCs, at declining rates, beginning at 5.00% of the lesser of the current market value at the time of redemption or the original purchase cost of the shares being redeemed. Class C shares that are redeemed within one year of purchase are subject to a 1.00% CDSC on the lesser of the current market value at the time of redemption or the original purchase cost of the shares being redeemed. Proceeds from CDSCs are used to compensate the Distributor for providing distribution-related services in connection with the sale of these shares. During the year ended May 31, 2012, CDSCs received by the Distributor amounted to $4,466 and $199 for Class B and Class C shares, respectively.
Transfer agent fees. The Fund has a transfer agent agreement with John Hancock Signature Services, Inc. (Signature Services), an affiliate of the Adviser. The transfer agent fees paid to Signature Services are determined based on the cost to Signature Services (Signature Services Cost) of providing recordkeeping services. The Signature Services Cost includes a component of allocated John Hancock corporate overhead for providing transfer agent services to the Fund and to all other John Hancock affiliated funds. It also includes out-of-pocket expenses that are comprised of payments made to third-parties for recordkeeping services provided to their clients who invest in one or more John Hancock funds. In addition, Signature Services Cost may be reduced by certain fees that Signature Services receives in connection with retirement and small accounts. Signature Services Cost is calculated monthly and allocated, as applicable, to four categories of share classes: Institutional Share Classes, Retirement Share Classes, Municipal Bond Classes and all other Retail Share Classes. Within each of these categories, the applicable costs are allocated to the affected John Hancock affiliated funds and/or classes, based on the relative average daily net assets.
Class level expenses. Class level expenses for the year ended May 31, 2012 were:
| DISTRIBUTION AND | TRANSFER | ||||
| CLASS | SERVICE FEES | AGENT FEES | |||
| Class A | $156,317 | $34,714 | |||
| Class B | 21,355 | 1,423 | |||
| Class C | 83,634 | 5,565 | |||
| Total | $261,306 | $41,702 | |||
| Annual report | New York Tax-Free Income Fund | 25 |
Trustee expenses. The Fund compensates each Trustee who is not an employee of the Adviser or its affiliates. These Trustees may, for tax purposes, elect to defer receipt of this compensation under the John Hancock Group of Funds Deferred Compensation Plan (the Plan). Deferred amounts are invested in various John Hancock funds and remain in the funds until distributed in accordance with the Plan. The investment of deferred amounts and the offsetting liability are included within Other receivables and prepaid expenses and Payable to affiliates — Trustees’ fees, respectively, in the accompanying Statement of assets and liabilities.
Note 5 — Fund share transactions
Transactions in Fund shares for the years ended May 31, 2012 and May 31, 2011 were as follows:
| Year ended 5-31-12 | Year ended 5-31-11 | |||
| Shares | Amount | Shares | Amount | |
| Class A shares | ||||
| Sold | 528,795 | $6,514,026 | 488,751 | $5,913,088 |
| Distributions reinvested | 137,351 | 1,698,349 | 128,442 | 1,540,904 |
| Repurchased | (714,084) | (8,831,901) | (843,143) | (10,094,405) |
| Net decrease | (47,938) | ($619,526) | (225,950) | ($2,640,413) |
| Class B shares | ||||
| Sold | 40,733 | $505,065 | 23,714 | $283,835 |
| Distributions reinvested | 3,701 | 45,757 | 4,476 | 53,903 |
| Repurchased | (56,644) | (699,651) | (92,142) | (1,107,950) |
| Net decrease | (12,210) | ($148,829) | (63,952) | ($770,212) |
| Class C shares | ||||
| Sold | 142,903 | $1,774,380 | 162,028 | $1,968,639 |
| Distributions reinvested | 16,233 | 201,053 | 13,153 | 157,706 |
| Repurchased | (114,251) | (1,411,789) | (133,702) | (1,582,967) |
| Net increase | 44,885 | $563,644 | 41,479 | $543,378 |
| Net decrease | (15,263) | ($204,711) | (248,423) | ($2,867,247) |
Note 6 — Purchase and sale of securities
Purchases and sales of securities, other than short-term securities, aggregated $9,940,390 and $9,558,867, respectively, for the year ended May 31, 2012.
| 26 | New York Tax-Free Income Fund | Annual report |
Auditor’s report
Report of Independent Registered Public Accounting Firm
To the Board of Trustees of John Hancock Tax-Exempt Series Fund and
Shareholders of John Hancock New York Tax-Free Income Fund
In our opinion, the accompanying statement of assets and liabilities, including the schedule of investments, and the related statements of operations and of changes in net assets and the financial highlights present fairly, in all material respects, the financial position of John Hancock New York Tax-Free Income Fund (the “Fund”) at May 31, 2012, and the results of its operations, the changes in its net assets and the financial highlights for each of the periods indicated, in conformity with accounting principles generally accepted in the United States of America. These financial statements and financial highlights (hereafter referred to as “financial statements”) are the responsibility of the Fund’s management; our responsibility is to express an opinion on these financial statements based on our audits. We conducted our audits of these financial statements in accordance with the standards of the Public Company Accounting Oversight Board (United States). Those standards require that we plan and perform the audits to obtain reasonable assurance about whether the financial statements are free of material misstatement. An audit includes examining, on a test basis, evidence supporting the amounts and disclosures in the financial statements, assessing the accounting principles used and significant estimates made by management, and evaluating the overall financial statement presentation. We believe that our audits, which included confirmation of securities at May 31, 2012 by correspondence with the custodian and brokers, provide a reasonable basis for our opinion.
PricewaterhouseCoopers LLP
Boston, Massachusetts
July 23, 2012
| Annual report | New York Tax-Free Income Fund | 27 |
Tax information
Unaudited
For federal income tax purposes, the following information is furnished with respect to the distributions of the Fund, if any, paid during its taxable year ended May 31, 2012.
99.87% of dividends from net investment income are exempt-interest dividends.
The Fund paid $45,288 in capital gain dividends.
Eligible shareholders will be mailed a 2012 Form 1099-DIV in early 2013. This will reflect the tax character of all distributions paid in calendar year 2012.
| 28 | New York Tax-Free Income Fund | Annual report |
Trustees and Officers
This chart provides information about the Trustees and Officers who oversee your John Hancock fund. Officers elected by the Trustees manage the day-to-day operations of the Fund and execute policies formulated by the Trustees.
Independent Trustees
| Name, Year of Birth | Trustee | Number of John |
| Position(s) held with Fund | of the | Hancock funds |
| Principal occupation(s) and other | Trust | overseen by |
| directorships during past 5 years | since1 | Trustee |
| Steven R. Pruchansky, Born: 1944 | 1994 | 49 |
| Chairman (since January 2011); Chairman and Chief Executive Officer, Greenscapes of Southwest | ||
| Florida, Inc. (since 2000); Director and President, Greenscapes of Southwest Florida, Inc. (until 2000); | ||
| Member, Board of Advisors, First American Bank (until 2010); Managing Director, Jon James, LLC (real | ||
| estate) (since 2000); Director, First Signature Bank & Trust Company (until 1991); Director, Mast Realty | ||
| Trust (until 1994); President, Maxwell Building Corp. (until 1991). | ||
| William H. Cunningham, Born: 1944 | 1987 | 49 |
| Professor, University of Texas, Austin, Texas (since 1971); former Chancellor, University of Texas System | ||
| and former President of the University of Texas, Austin, Texas; Director of the following: LIN Television | ||
| (since 2009); Lincoln National Corporation (insurance) (Chairman since 2009 and Director since 2006); | ||
| Resolute Energy Corporation (since 2009); Nanomedical Systems, Inc. (biotechnology company) | ||
| (Chairman since 2008); Yorktown Technologies, LP (tropical fish) (Chairman since 2007); Greater Austin | ||
| Crime Commission (since 2001); Southwest Airlines (since 2000); former Director of the following: | ||
| Introgen (manufacturer of biopharmaceuticals) (until 2008); Hicks Acquisition Company I, Inc. (until | ||
| 2007); Jefferson-Pilot Corporation (diversified life insurance company) (until 2006); and former Advisory | ||
| Director, JP Morgan Chase Bank (formerly Texas Commerce Bank–Austin) (until 2009). | ||
| Deborah C. Jackson, Born: 1952 | 2008 | 49 |
| President, Cambridge College, Cambridge, Massachusetts (since May 2011); Chief Executive Officer, | ||
| American Red Cross of Massachusetts Bay (2002–May 2011); Board of Directors of Eastern Bank | ||
| Corporation (since 2001); Board of Directors of Eastern Bank Charitable Foundation (since 2001); | ||
| Board of Directors of American Student Assistance Corp. (1996–2009); Board of Directors of Boston | ||
| Stock Exchange (2002–2008); Board of Directors of Harvard Pilgrim Healthcare (health benefits | ||
| company) (2007–2011). | ||
| Stanley Martin,2 Born: 1947 | 2008 | 49 |
| Director, The St. Joe Company (real estate development company) (since May 2012); Senior Vice | ||
| President/Audit Executive, Federal Home Loan Mortgage Corporation (2004–2006); Executive Vice | ||
| President/Consultant, HSBC Bank USA (2000–2003); Chief Financial Officer/Executive Vice President, | ||
| Republic New York Corporation & Republic National Bank of New York (1998–2000); Partner, KPMG | ||
| LLP (1971–1998). | ||
| Dr. John A. Moore,2 Born: 1939 | 2005 | 49 |
| President and Chief Executive Officer, Institute for Evaluating Health Risks, (nonprofit institution) | ||
| (1989–2001); Senior Scientist, Sciences International (health research) (2000–2003); Former Assistant | ||
| Administrator & Deputy Administrator, Environmental Protection Agency (1983–1989); Principal, | ||
| Hollyhouse (consulting) (since 2000); Director, CIIT Center for Health Science Research (nonprofit | ||
| research) (until 2007). | ||
| Annual report | New York Tax-Free Income Fund | 29 |
Independent Trustees (continued)
| Name, Year of Birth | Trustee | Number of John |
| Position(s) held with Fund | of the | Hancock funds |
| Principal occupation(s) and other | Trust | overseen by |
| directorships during past 5 years | since1 | Trustee |
| Patti McGill Peterson,2 Born: 1943 | 2005 | 49 |
| Presidential Advisor for Global Initiatives, American Council on Education (since 2011); Chairperson | ||
| of the Board of the Trust (during 2009 and 2010); Principal, PMP Globalinc (consulting) (2007–2011); | ||
| Senior Associate, Institute for Higher Education Policy (2007–2011); Executive Director, CIES | ||
| (international education agency) (until 2007); Vice President, Institute of International Education (until | ||
| 2007); Former President Wells College, St. Lawrence University and the Association of Colleges and | ||
| Universities of the State of New York. Director of the following: Mutual Fund Directors Forum (since | ||
| 2011); Niagara Mohawk Power Corporation (until 2003); Security Mutual Life (insurance) (until 1997); | ||
| ONBANK (until 1993). Trustee of the following: Board of Visitors, The University of Wisconsin, Madison | ||
| (since 2007); Ford Foundation, International Fellowships Program (until 2007); UNCF, International | ||
| Development Partnerships (until 2005); Roth Endowment (since 2002); Council for International | ||
| Educational Exchange (since 2003). | ||
| Gregory A. Russo, Born: 1949 | 2008 | 49 |
| Director and Audit Committee Chairman (since May 2012) and Member of Finance and Audit | ||
| Committees of NCH Healthcare System, Inc. (since 2011) (holding company for multi-entity health care | ||
| system); Director and Member of Finance Committee of The Moorings, Inc. (nonprofit continuing care | ||
| community) (since May 2012); Vice Chairman, Risk & Regulatory Matters, KPMG LLP (KPMG) (2002– | ||
| 2006); Vice Chairman, Industrial Markets, KPMG (1998–2002); Chairman and Treasurer, Westchester | ||
| County, New York, Chamber of Commerce (1985–1995); Director, Treasurer and Chairman of Audit | ||
| and Finance Committees, Putnam Hospital Center (1990–2000); Director and Chairman of Fundraising | ||
| Campaign, United Way of Westchester and Putnam Counties, New York (1990–1997). | ||
| Non-Independent Trustees3 | ||
| Name, Year of Birth | Trustee | Number of John |
| Position(s) held with Fund | of the | Hancock funds |
| Principal occupation(s) and other | Trust | overseen by |
| directorships during past 5 years | since1 | Trustee |
| Hugh McHaffie, Born: 1959 | 2010 | 49 |
| Executive Vice President, John Hancock Financial Services (since 2006, including prior positions); | ||
| President of John Hancock Variable Insurance Trust and John Hancock Funds II (since 2009); Trustee, | ||
| John Hancock retail funds (since 2010); Chairman and Director, John Hancock Advisers, LLC, | ||
| John Hancock Investment Management Services, LLC and John Hancock Funds, LLC (since 2010). | ||
| John G. Vrysen, Born: 1955 | 2009 | 49 |
| Senior Vice President, John Hancock Financial Services (since 2006); Director, Executive Vice President | ||
| and Chief Operating Officer, John Hancock Advisers, LLC, John Hancock Investment Management | ||
| Services, LLC and John Hancock Funds, LLC (since 2005); Chief Operating Officer, John Hancock | ||
| Funds II and John Hancock Variable Insurance Trust (since 2007); Chief Operating Officer, John Hancock | ||
| retail funds (until 2009); Trustee, John Hancock retail funds (since 2009). | ||
| 30 | New York Tax-Free Income Fund | Annual report |
| Principal officers who are not Trustees | |
| Name, Year of Birth | Officer |
| Position(s) held with Fund | of the |
| Principal occupation(s) and other | Trust |
| directorships during past 5 years | since |
| Keith F. Hartstein, Born: 1956 | 2005 |
| President and Chief Executive Officer | |
| Senior Vice President, John Hancock Financial Services (since 2004); Director, President and Chief | |
| Executive Officer, John Hancock Advisers, LLC and John Hancock Funds, LLC (since 2005); Director, | |
| John Hancock Asset Management a division of Manulife Asset Management (US) LLC (since 2005); | |
| Director, John Hancock Investment Management Services, LLC (since 2006); President and Chief | |
| Executive Officer, John Hancock retail funds (since 2005); Member, Investment Company Institute Sales | |
| Force Marketing Committee (since 2003). | |
| Andrew G. Arnott, Born: 1971 | 2009 |
| Senior Vice President and Chief Operating Officer | |
| Senior Vice President, John Hancock Financial Services (since 2009); Executive Vice President, | |
| John Hancock Advisers, LLC (since 2005); Executive Vice President, John Hancock Investment | |
| Management Services, LLC (since 2006); Executive Vice President, John Hancock Funds, LLC (since | |
| 2004); Chief Operating Officer, John Hancock retail funds (since 2009); Senior Vice President, | |
| John Hancock retail funds (since 2010); Vice President, John Hancock Funds II and John Hancock | |
| Variable Insurance Trust (since 2006); Senior Vice President, Product Management and Development, | |
| John Hancock Funds, LLC (until 2009). | |
| Thomas M. Kinzler, Born: 1955 | 2006 |
| Secretary and Chief Legal Officer | |
| Vice President, John Hancock Financial Services (since 2006); Secretary and Chief Legal Counsel, | |
| John Hancock Advisers, LLC, John Hancock Investment Management Services, LLC and John Hancock | |
| Funds, LLC (since 2007); Secretary and Chief Legal Officer, John Hancock retail funds, John Hancock | |
| Funds II and John Hancock Variable Insurance Trust (since 2006). | |
| Francis V. Knox, Jr., Born: 1947 | 2005 |
| Chief Compliance Officer | |
| Vice President, John Hancock Financial Services (since 2005); Chief Compliance Officer, John Hancock | |
| retail funds, John Hancock Funds II, John Hancock Variable Insurance Trust, John Hancock Advisers, | |
| LLC and John Hancock Investment Management Services, LLC (since 2005); Vice President and Chief | |
| Compliance Officer, John Hancock Asset Management a division of Manulife Asset Management (US) | |
| LLC (2005–2008). | |
| Charles A. Rizzo, Born: 1957 | 2007 |
| Chief Financial Officer | |
| Vice President, John Hancock Financial Services (since 2008); Senior Vice President, John Hancock | |
| Advisers, LLC and John Hancock Investment Management Services, LLC (since 2008); Chief Financial | |
| Officer, John Hancock retail funds, John Hancock Funds II and John Hancock Variable Insurance Trust | |
| (since 2007); Assistant Treasurer, Goldman Sachs Mutual Fund Complex (2005–2007); Vice President, | |
| Goldman Sachs (2005–2007). | |
| Annual report | New York Tax-Free Income Fund | 31 |
| Principal officers who are not Trustees (continued) | |
| Name, Year of Birth | Officer |
| Position(s) held with Fund | of the |
| Principal occupation(s) and other | Trust |
| directorships during past 5 years | since |
| Salvatore Schiavone, Born: 1965 | 2010 |
| Treasurer | |
| Assistant Vice President, John Hancock Financial Services (since 2007); Vice President, John Hancock | |
| Advisers, LLC and John Hancock Investment Management Services, LLC (since 2007); Treasurer, | |
| John Hancock retail funds (since 2010); Treasurer, John Hancock closed-end funds (since 2009); | |
| Assistant Treasurer, John Hancock Funds II and John Hancock Variable Insurance Trust (since 2010) and | |
| (2007–2009); Assistant Treasurer, John Hancock retail funds (2007–2009); Assistant Treasurer, Fidelity | |
| Group of Funds (2005–2007); Vice President, Fidelity Management Research Company (2005–2007). | |
The business address for all Trustees and Officers is 601 Congress Street, Boston, Massachusetts 02210-2805.
The Statement of Additional Information of the Fund includes additional information about members of the Board of Trustees of the Fund and is available without charge, upon request, by calling 1-800-225-5291.
1 Each Trustee holds office until his or her successor is elected and qualified, or until the Trustee’s death, retirement, resignation or removal.
2 Member of Audit Committee.
3 Because Messrs. McHaffie and Vrysen are senior executives or directors with the Adviser and/or its affiliates, each of them is considered an “interested person,” as defined in the Investment Company Act of 1940, of the Fund.
| 32 | New York Tax-Free Income Fund | Annual report |
More information
| Trustees | Investment adviser |
| Steven R. Pruchansky, Chairman | John Hancock Advisers, LLC |
| William H. Cunningham | |
| Deborah C. Jackson | Subadviser |
| Stanley Martin* | John Hancock Asset Management a division of |
| Hugh McHaffie† | Manulife Asset Management (US) LLC |
| Dr. John A. Moore,* Vice Chairman | |
| Patti McGill Peterson* | Principal distributor |
| Gregory A. Russo | John Hancock Funds, LLC |
| John G. Vrysen† | |
| Custodian | |
| Officers | State Street Bank and Trust Company |
| Keith F. Hartstein | |
| President and Chief Executive Officer | Transfer agent |
| John Hancock Signature Services, Inc. | |
| Andrew G. Arnott | |
| Senior Vice President and Chief Operating Officer | Legal counsel |
| K&L Gates LLP | |
| Thomas M. Kinzler | |
| Secretary and Chief Legal Officer | Independent registered |
| public accounting firm | |
| Francis V. Knox, Jr. | PricewaterhouseCoopers LLP |
| Chief Compliance Officer | |
| Charles A. Rizzo | |
| Chief Financial Officer | |
| Salvatore Schiavone | |
| Treasurer | |
| *Member of the Audit Committee | |
| †Non-Independent Trustee | |
The Fund’s proxy voting policies and procedures, as well as the Fund’s proxy voting record for the most recent twelve-month period ended June 30, are available free of charge on the Securities and Exchange Commission (SEC) Web site at www.sec.gov or on our Web site.
The Fund’s complete list of portfolio holdings, for the first and third fiscal quarters, is filed with the SEC on Form N-Q. The Fund’s Form N-Q is available on our Web site and the SEC’s Web site, www.sec.gov, and can be reviewed and copied (for a fee) at the SEC’s Public Reference Room in Washington, DC. Call 1-202-551-8090 to receive information on the operation of the SEC’s Public Reference Room.
We make this information on your fund, as well as monthly portfolio holdings, and other fund details available on our Web site at www.jhfunds.com or by calling 1-800-225-5291.
| You can also contact us: | ||
| 1-800-225-5291 | Regular mail: | Express mail: |
| jhfunds.com | John Hancock Signature Services, Inc. | John Hancock Signature Services, Inc. |
| P.O. Box 55913 | Mutual Fund Image Operations | |
| Boston, MA 02205-5913 | 30 Dan Road | |
| Canton, MA 02021 |
| Annual report | New York Tax-Free Income Fund | 33 |

1-800-225-5291
1-800-554-6713 TDD
1-800-338-8080 EASI-Line
www.jhfunds.com
Now available: electronic delivery
www.jhfunds.com/edelivery
| This report is for the information of the shareholders of John Hancock New York Tax-Free Income Fund. | 76A 5/12 |
| It is not authorized for distribution to prospective investors unless preceded or accompanied by a prospectus. | 7/12 |
A look at performance
Total returns for the period ended May 31, 2012
| Tax | ||||||||||||||
| Average annual total | Cumulative total | SEC 30-day | SEC 30-day | equivalent | ||||||||||
| returns (%) | returns (%) | yield (%) | yield (%) | subsidized | ||||||||||
| with maximum sales charge | with maximum sales charge | subsidized | unsubsidized1 | yield (%)2 | ||||||||||
| as of | as of | as of | ||||||||||||
| 1-year | 5-year | 10-year | 1-year | 5-year | 10-year | 5-31-12 | 5-31-12 | 5-31-12 | ||||||
| Class A | 6.61 | 4.27 | 4.58 | 6.61 | 23.24 | 56.55 | 2.27 | 2.12 | 3.69 | |||||
| Class B | 5.85 | 4.15 | 4.48 | 5.85 | 22.56 | 55.06 | 1.63 | 1.53 | 2.65 | |||||
| Class C | 9.85 | 4.49 | 4.33 | 9.85 | 24.57 | 52.86 | 1.63 | 1.53 | 2.65 | |||||
Performance figures assume all distributions are reinvested. Figures reflect maximum sales charges on Class A shares of 4.5% and the applicable contingent deferred sales charge (CDSC) on Class B and Class C shares. The returns for Class C shares have been adjusted to reflect the elimination of the front-end sales charge effective 7-15-04. The Class B shares’ CDSC declines annually between years 1 to 6 according to the following schedule: 5, 4, 3, 3, 2, 1%. No sales charge will be assessed after the sixth year. Class C shares held for less than one year are subject to a 1% CDSC.
The expense ratios of the Fund, both net (including any fee waivers or expense limitations) and gross (excluding any fee waivers or expense limitations), are set forth according to the most recent publicly available prospectus for the Fund and may differ from those disclosed in the Financial highlights tables in this report. The fee waivers and expense limitations are contractual at least until 9-30-12 for Class A, Class B and Class C shares. Had the fee waivers and expense limitations not been in place gross expenses would apply. The expense ratios are as follows:
| Class A | Class B | Class C | |||
| Net (%) | 0.85 | 1.60 | 1.60 | ||
| Gross (%) | 1.00 | 1.70 | 1.70 |
The returns reflect past results and should not be considered indicative of future performance. The return and principal value of an investment will fluctuate so that shares, when redeemed, may be worth more or less than their original cost. Due to market volatility, the Fund’s current performance may be higher or lower than the performance shown. For current to the most recent month end performance data, please call 1-800-225-5291 or visit the Fund’s Web site at www.jhfunds.com.
The performance table above and the chart on the next page do not reflect the deduction of taxes that a shareholder may pay on fund distributions or on the redemption of fund shares. Please note that a portion of the Fund’s income may be subject to taxes, and some investors may be subject to the Alternative Minimum Tax (AMT). Also note that capital gains are taxable. The Fund’s performance results reflect any applicable fee waivers or expense reductions, without which the expenses would increase and results would have been less favorable.
| 6 | Massachusetts Tax-Free Income Fund | Annual report |
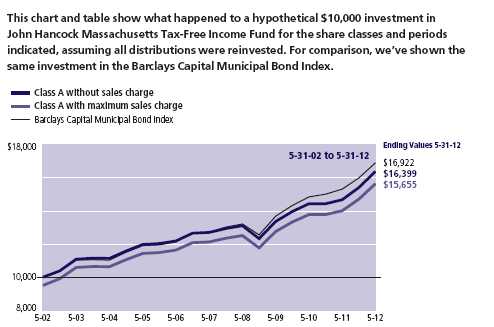
| Without | With maximum | |||
| Start date | sales charge | sales charge | Index | |
| Class B 3 | 5-31-02 | $15,506 | $15,506 | $16,922 |
| Class C3 | 5-31-02 | 15,286 | 15,286 | 16,922 |
Performance of the classes will vary based on the difference in sales charges paid by shareholders investing in the different classes and the fee structure of those classes.
The Class C shares investment with maximum sales charge has been adjusted to reflect the elimination of the front-end sales charge effective 7-15-04.
Barclays Capital Municipal Bond index is an unmanaged index representative of the tax-exempt bond market.
It is not possible to invest directly in an index. Index figures do not reflect sales charges or direct expenses, which would have resulted in lower values if they did.
1 Unsubsidized yield reflects what the yield would have been without the effect of reimbursements and waivers.
2 Tax equivalent yield is based on the maximum federal income tax rate of 35% and state tax rate of 5.3%. Share classes will differ due to varying Fund expenses.
3 No contingent deferred sales charge is applicable.
| Annual report | Massachusetts Tax-Free Income Fund | 7 |
Management’s discussion of
Fund performance
By John Hancock Asset Management a division of Manulife Asset Management (US) LLC
Many municipal bonds posted double-digit gains for the 12 months ended May 31, 2012. Municipal bonds rallied steadily throughout the reporting period thanks to favorable supply and demand dynamics in the municipal market. Demand for municipal bonds returned to its normal level after declining in late 2010 and early 2011, while modest new issuance and increased bond calls reduced the outstanding supply of municipal bonds. Another factor contributing to the strong performance of municipal bonds was lower volatility compared with other segments of the financial markets, which attracted investors amid uneven economic growth in the U.S. and sovereign debt problems in Europe. Long-term municipal bonds (more than 20 years) generated some of the best returns, while lower-rated municipal bonds generally outperformed higher-quality securities. The Commonwealth of Massachusetts has successfully kept its budget on track over the past several years, making both the spending cuts and tax increases necessary to prevent severe budget shortfalls. In addition, bipartisan tax revenue projections have not only prevented overly optimistic assumptions, but have also proven to be fairly accurate. Good fiscal management, combined with modestly improving tax revenues, has allowed Massachusetts to begin rebuilding its state reserve funds.
For the year ended May 31, 2012, John Hancock Massachusetts Tax-Free Income Fund’s Class A shares posted a total return of 11.67%, excluding sales charges. By comparison, Morningstar, Inc.’s muni Massachusetts fund category produced an average return of 11.04%, while the Fund’s benchmark, the Barclays Capital Municipal Bond Index, returned 10.40%.The Fund outpaced both the broad municipal bond index and its Morningstar peer group average. The Fund’s meaningful position in longer-term securities contributed to this outperformance. We focused the Fund’s new purchases on longer-term Massachusetts municipal bonds during the period, which paid off as long-term municipal bonds generated some of the best returns. The Fund also benefited from its holdings of Puerto Rico municipal bonds. The Fund’s Puerto Rico sales tax and transportation bonds fared the best during the period.
This commentary reflects the views of the portfolio managers through the end of the period discussed in this report. The managers’ statements reflect their own opinions. As such, they are in no way guarantees of future events and are not intended to be used as investment advice or a recommendation regarding any specific security. They are also subject to change at any time as market and other conditions warrant.
Past performance is no guarantee of future results.
The major risk factors in this Fund’s performance are interest-rate and credit risk. When interest rates rise, bond prices usually fall. Investments in higher-yielding, lower-rated securities involve additional risks as these securities include a higher risk of default and loss of principal. Municipal bond prices can decline due to fiscal mismanagement or tax shortfalls, or if related projects become unprofitable. Generally, an increase in the Fund’s average maturity will make it more sensitive to interest-rate risk. Investments focused on one sector may fluctuate more widely than investments across multiple sectors. Because the Fund may focus on particular sectors, its performance may depend on the performance of those sectors. If the Fund invests heavily in any one state or region, performance could be disproportionately affected by factors particular to that state or region.
| 8 | Massachusetts Tax-Free Income Fund | Annual report |
Your expenses
These examples are intended to help you understand your ongoing operating expenses of investing in the Fund so you can compare these costs with the ongoing costs of investing in other mutual funds.
Understanding fund expenses
As a shareholder of the Fund, you incur two types of costs:
■ Transaction costs which include sales charges (loads) on purchases or redemptions (varies by share class), minimum account fee charge, etc.
■ Ongoing operating expenses including management fees, distribution and service fees (if applicable), and other fund expenses.
We are going to present only your ongoing operating expenses here.
Actual expenses/actual returns
This example is intended to provide information about the Fund’s actual ongoing operating expenses, and is based on the Fund’s actual return. It assumes an account value of $1,000.00 on December 1, 2011 with the same investment held until May 31, 2012.
| Account value | Ending value | Expenses paid during | |
| on 12-1-11 | on 5-31-12 | period ended 5-31-121 | |
| Class A | $1,000.00 | $1,063.50 | $4.44 |
| Class B | 1,000.00 | 1,059.60 | 8.29 |
| Class C | 1,000.00 | 1,059.60 | 8.29 |
Together with the value of your account, you may use this information to estimate the operating expenses that you paid over the period. Simply divide your account value at May 31, 2012, by $1,000.00, then multiply it by the “expenses paid” for your share class from the table above. For example, for an account value of $8,600.00, the operating expenses should be calculated as follows:
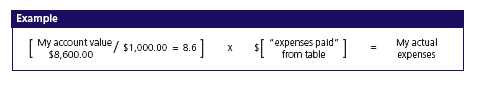
| Annual report | Massachusetts Tax-Free Income Fund | 9 |
Your expenses
Hypothetical example for comparison purposes
This table allows you to compare the Fund’s ongoing operating expenses with those of any other fund. It provides an example of the Fund’s hypothetical account values and hypothetical expenses based on each class’s actual expense ratio and an assumed 5% annualized return before expenses (which is not the Fund’s actual return). It assumes an account value of $1,000.00 on December 1, 2011, with the same investment held until May 31, 2012. Look in any other fund shareholder report to find its hypothetical example and you will be able to compare these expenses.
| Account value | Ending value | Expenses paid during | |
| on 12-1-11 | on 5-31-12 | period ended 5-31-121 | |
| Class A | $1,000.00 | $1,020.70 | $4.34 |
| Class B | 1,000.00 | 1,017.00 | 8.12 |
| Class C | 1,000.00 | 1,017.00 | 8.12 |
Remember, these examples do not include any transaction costs, therefore, these examples will not help you to determine the relative total costs of owning different funds. If transaction costs were included, your expenses would have been higher. See the prospectus for details regarding transaction costs.
1 Expenses are equal to the Fund’s annualized expense ratio of 0.86%, 1.61% and 1.61% for Class A, Class B and Class C shares, respectively, multiplied by the average account value over the period, multiplied by 183/366 (to reflect the one-half year period).
| 10 | Massachusetts Tax-Free Income Fund | Annual report |
Portfolio summary
| Top 10 Holdings (23.7% of Net Assets on 5-31-12)1,2 | |
| Boston Housing Authority, 5.000%, 4-1-27 | 2.7% |
| Holyoke Gas & Electric Department, 5.000%, 12-1-31 | 2.7% |
| Massachusetts Water Resources Authority, 5.250%, 8-1-29 | 2.6% |
| Massachusetts State Department of Transportation, 5.000%, 1-1-37 | 2.6% |
| Massachusetts Bay Transportation Authority, 5.250%, 7-1-33 | 2.5% |
| Puerto Rico Sales Tax Financing Corp., Zero Coupon, 8-1-32 | 2.4% |
| Massachusetts Industrial Finance Agency, 6.750%, 12-1-20 | 2.2% |
| Commonwealth of Massachusetts, 5.500%, 12-1-24 | 2.1% |
| Massachusetts Bay Transportation Authority, 5.000%, 7-1-31 | 2.0% |
| Massachusetts Development Finance Agency, 5.000%, 12-15-24 | 1.9% |
| Sector Composition1,3 | ||||
| General Obligation Bonds | 7.4% | Pollution | 3.6% | |
| Revenue Bonds | Utilities | 2.7% | ||
| Water & Sewer | 15.1% | Facilities | 1.7% | |
| Health Care | 13.8% | Development | 0.8% | |
| Transportation | 13.2% | Industrial Development | 0.1% | |
| Education | 12.9% | Other Revenue | 13.4% | |
| Housing | 8.4% | Short-Term Investments & Other | 6.9% | |
| Quality Composition1,4 | ||||
| AAA | 10.1% | |||
| AA | 34.1% | |||
| A | 20.1% | |||
| BBB | 22.1% | |||
| Not Rated | 6.7% | |||
| Short-Term Investments & Other | 6.9% | |||
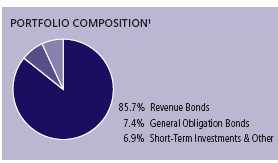
1 As a percentage of net assets on 5-31-12.
2 Cash and cash equivalents not included.
3 Investments focused on one sector may fluctuate more widely than investments across multiple sectors. Because the Fund may focus on particular sectors, its performance may depend on the performance of those sectors.
4 Ratings are from Moody’s Investors Service, Inc. If not available, we have used Standard & Poor’s Corporation ratings. In the absence of ratings from these agencies, we have used Fitch, Inc. ratings. “Not Rated” securities are those with no ratings available from these agencies. All ratings are as of 5-31-12 and do not reflect subsequent downgrades or upgrades, if any.
| Annual report | Massachusetts Tax-Free Income Fund | 11 |
Fund’s investments
As of 5-31-12
| Maturity | |||||
| Rate (%) | date | Par value | Value | ||
| Municipal Bonds 93.1% | $119,171,824 | ||||
| (Cost $109,577,051) | |||||
| Massachusetts 77.5% | 99,213,212 | ||||
| Boston Housing Authority | |||||
| Capital Program Revenue (D) | 5.000 | 04-01-27 | $3,255,000 | 3,505,990 | |
| Boston Housing Authority | |||||
| Capital Program Revenue (D) | 5.000 | 04-01-28 | 2,000,000 | 2,135,200 | |
| Boston Industrial Development | |||||
| Financing Authority | |||||
| Harbor Electric Energy Company Project AMT | 7.375 | 05-15-15 | 90,000 | 90,433 | |
| Boston Water & Sewer Commission | |||||
| Sewer Revenue, Series A | 5.750 | 11-01-13 | 190,000 | 198,244 | |
| Commonwealth of Massachusetts | |||||
| Public Improvements (D) | 5.500 | 11-01-17 | 1,000,000 | 1,239,360 | |
| Commonwealth of Massachusetts | |||||
| Public Improvements, Series C | 5.500 | 11-01-15 | 1,000,000 | 1,166,680 | |
| Commonwealth of Massachusetts | |||||
| Series C (D) | 5.500 | 12-01-24 | 2,000,000 | 2,661,540 | |
| Commonwealth of Massachusetts, Series E | 5.000 | 11-01-25 | 1,000,000 | 1,269,440 | |
| Freetown Lakeville Regional School District | 5.000 | 07-01-23 | 1,000,000 | 1,032,780 | |
| Holyoke Gas & Electric Department | |||||
| Natural Gas Revenue, Series A (D) | 5.000 | 12-01-31 | 3,410,000 | 3,490,135 | |
| Massachusetts Bay Transportation Authority | |||||
| Sales Tax Revenue, Series A | 5.000 | 07-01-31 | 2,000,000 | 2,521,000 | |
| Massachusetts Bay Transportation Authority | |||||
| Sales Tax Revenue, Series A | 5.250 | 07-01-35 | 1,310,000 | 1,707,860 | |
| Massachusetts Bay Transportation Authority | |||||
| Sales Tax Revenue, Series A–2 (Z) | Zero | 07-01-26 | 2,500,000 | 1,409,750 | |
| Massachusetts Bay Transportation Authority | |||||
| Transit Revenue, Series A | 7.000 | 03-01-14 | 1,000,000 | 1,057,500 | |
| Massachusetts Bay Transportation Authority | |||||
| Transit Revenue, Series B | 5.250 | 07-01-33 | 2,500,000 | 3,240,750 | |
| Massachusetts Development Finance Agency | |||||
| Brandeis University, Series 0-1 | 5.000 | 10-01-40 | 1,000,000 | 1,072,820 | |
| Massachusetts Development Finance Agency | |||||
| Carleton Willard Village | 5.625 | 12-01-30 | 450,000 | 485,784 | |
| Massachusetts Development Finance Agency | |||||
| Combined Jewish Philanthropies, Series A | 5.250 | 02-01-22 | 835,000 | 846,156 | |
| Massachusetts Development Finance Agency | |||||
| Curry College, Series A (D) | 4.500 | 03-01-25 | 1,000,000 | 1,006,370 | |
| 12 | Massachusetts Tax-Free Income Fund | Annual report | See notes to financial statements |
| Maturity | |||||
| Rate (%) | date | Par value | Value | ||
| Massachusetts (continued) | |||||
| Massachusetts Development Finance Agency | |||||
| Curry College, Series A (D) | 5.250 | 03-01-26 | $1,000,000 | $1,035,660 | |
| Massachusetts Development Finance Agency | |||||
| Dominion Energy Brayton Point AMT (P) | 5.000 | 02-01-36 | 2,000,000 | 2,048,180 | |
| Massachusetts Development Finance Agency | |||||
| Draper Laboratory | 5.875 | 09-01-30 | 2,000,000 | 2,315,500 | |
| Massachusetts Development Finance Agency | |||||
| Emerson College, Series A | 5.000 | 01-01-40 | 2,000,000 | 2,066,160 | |
| Massachusetts Development Finance Agency | |||||
| Harvard University Series B | 5.000 | 10-15-40 | 1,190,000 | 1,370,713 | |
| Massachusetts Development Finance Agency | |||||
| Linden Ponds, Inc., Series A–1 | 5.500 | 11-15-46 | 56,460 | 34,813 | |
| Massachusetts Development Finance Agency | |||||
| Linden Ponds, Inc., Series A–1 | 6.250 | 11-15-39 | 1,057,748 | 780,851 | |
| Massachusetts Development Finance Agency | |||||
| Linden Ponds, Inc., Series B (Z) | Zero | 11-15-56 | 280,825 | 1,449 | |
| Massachusetts Development Finance Agency | |||||
| Massachusetts College of Pharmacy, | |||||
| Series E (D) | 5.000 | 07-01-37 | 1,000,000 | 1,053,550 | |
| Massachusetts Development Finance Agency | |||||
| New England Conservatory of Music | 5.250 | 07-01-38 | 2,000,000 | 2,084,380 | |
| Massachusetts Development Finance Agency | |||||
| Ogden Haverhill Project, Series B AMT | 5.500 | 12-01-19 | 1,500,000 | 1,514,625 | |
| Massachusetts Development Finance Agency | |||||
| Orchard Cove | 5.250 | 10-01-26 | 1,000,000 | 978,260 | |
| Massachusetts Development Finance Agency | |||||
| Partners HealthCare, Series L | 5.000 | 07-01-36 | 1,000,000 | 1,105,170 | |
| Massachusetts Development Finance Agency | |||||
| Plantation Apartments, Series A AMT | 5.000 | 12-15-24 | 2,320,000 | 2,388,997 | |
| Massachusetts Development Finance Agency | |||||
| The Groves in Lincoln, Series A | 7.750 | 06-01-39 | 700,000 | 525,497 | |
| Massachusetts Development Finance Agency, | |||||
| Southeatern Massachusetts System, | |||||
| Series A (D) | 5.625 | 01-01-16 | 500,000 | 506,220 | |
| Massachusetts Health & Educational | |||||
| Facilities Authority | |||||
| Civic Investments, Prerefunded to 12-15-12, | |||||
| Series B | 9.200 | 12-15-31 | 2,000,000 | 2,134,700 | |
| Massachusetts Health & Educational | |||||
| Facilities Authority | |||||
| Emerson Hospital, Series E (D) | 5.000 | 08-15-35 | 1,000,000 | 927,410 | |
| Massachusetts Health & Educational | |||||
| Facilities Authority | |||||
| Harvard Pilgrim Health Care, Series A (D) | 5.000 | 07-01-18 | 1,000,000 | 1,002,530 | |
| Massachusetts Health & Educational | |||||
| Facilities Authority | |||||
| Lahey Clinic Medical Center, Series C (D) | 5.000 | 08-15-23 | 1,000,000 | 1,048,120 | |
| Massachusetts Health & Educational | |||||
| Facilities Authority | |||||
| Mass Eye & Ear Infirmary | 5.375 | 07-01-35 | 2,000,000 | 2,109,100 | |
| Massachusetts Health & Educational | |||||
| Facilities Authority | |||||
| Partners HealthCare System | 5.000 | 07-01-22 | 1,000,000 | 1,175,890 | |
| See notes to financial statements | Annual report | Massachusetts Tax-Free Income Fund | 13 |
| Maturity | |||||
| Rate (%) | date | Par value | Value | ||
| Massachusetts (continued) | |||||
| Massachusetts Health & Educational | |||||
| Facilities Authority | |||||
| Partners HealthCare, Series J1 | 5.000 | 07-01-34 | $1,000,000 | $1,090,080 | |
| Massachusetts Health & Educational | |||||
| Facilities Authority | |||||
| South Shore Hospital | 5.750 | 07-01-29 | 365,000 | 365,423 | |
| Massachusetts Health & Educational | |||||
| Facilities Authority | |||||
| Springfield College | 5.625 | 10-15-40 | 2,000,000 | 2,098,780 | |
| Massachusetts Health & Educational | |||||
| Facilities Authority | |||||
| Sterling & Francine Clark, Series A | 5.000 | 07-01-36 | 1,000,000 | 1,052,690 | |
| Massachusetts Health & Educational | |||||
| Facilities Authority | |||||
| Suffolk University, Series A | 6.250 | 07-01-30 | 1,000,000 | 1,150,190 | |
| Massachusetts Health & Educational | |||||
| Facilities Authority | |||||
| Tufts University | 5.375 | 08-15-38 | 350,000 | 416,822 | |
| Massachusetts Health & Educational | |||||
| Facilities Authority | |||||
| Williams College, Series H | 5.000 | 07-01-33 | 1,500,000 | 1,554,705 | |
| Massachusetts Health & Educational | |||||
| Facilities Authority | |||||
| Woods Hole Oceanographic, Series B | 5.375 | 06-01-30 | 1,000,000 | 1,127,770 | |
| Massachusetts Housing Finance Agency, | |||||
| Series B | 4.700 | 12-01-16 | 1,050,000 | 1,065,341 | |
| Massachusetts Industrial Finance Agency | |||||
| Aquarion Water Company AMT | 6.750 | 12-01-20 | 2,780,000 | 2,783,864 | |
| Massachusetts Industrial Finance Agency | |||||
| Aquarion Water Company AMT | 6.900 | 12-01-29 | 1,210,000 | 1,211,174 | |
| Massachusetts Industrial Finance Agency | |||||
| Ogden Haverhill Project, Series A AMT | 5.600 | 12-01-19 | 500,000 | 501,865 | |
| Massachusetts Port Authority | |||||
| Boston Fuel Project AMT (D) | 5.000 | 07-01-32 | 1,770,000 | 1,822,711 | |
| Massachusetts Port Authority | |||||
| Conrac Project, Series A | 5.125 | 07-01-41 | 500,000 | 546,855 | |
| Massachusetts Port Authority | |||||
| US Airways Project, Series A AMT (D) | 5.750 | 09-01-16 | 1,000,000 | 1,002,510 | |
| Massachusetts School Building Authority | |||||
| Senior, Series B | 5.000 | 10-15-41 | 1,000,000 | 1,135,190 | |
| Massachusetts State College Building Authority | |||||
| College & University Revenue, Series A | 5.500 | 05-01-49 | 1,000,000 | 1,102,960 | |
| Massachusetts State College Building Authority | |||||
| College & University Revenue, Series B (D)(Z) | Zero | 05-01-19 | 1,000,000 | 855,690 | |
| Massachusetts State Department | |||||
| of Transportation | |||||
| Highway Revenue Tolls, Escrowed to | |||||
| Maturity, Series A (D) | 5.125 | 01-01-23 | 445,000 | 555,418 | |
| Massachusetts State Department | |||||
| of Transportation | |||||
| Highway Revenue Tolls, Series B | 5.000 | 01-01-37 | 3,000,000 | 3,274,380 | |
| Massachusetts State Department | |||||
| of Transportation | |||||
| Highway Revenue Tolls, Series C (D)(Z) | Zero | 01-01-20 | 1,000,000 | 815,360 | |
| 14 | Massachusetts Tax-Free Income Fund | Annual report | See notes to financial statements |
| Maturity | |||||
| Rate (%) | date | Par value | Value | ||
| Massachusetts (continued) | |||||
| Massachusetts Water Pollution | |||||
| Abatement Trust | |||||
| Government Fund/Grant Revenue | 5.000 | 08-01-28 | $1,000,000 | $1,202,310 | |
| Massachusetts Water Pollution | |||||
| Abatement Trust | |||||
| Series 7 | 5.125 | 02-01-31 | 1,775,000 | 1,781,000 | |
| Massachusetts Water Pollution | |||||
| Abatement Trust | |||||
| Series 9 | 5.250 | 08-01-18 | 60,000 | 68,610 | |
| Massachusetts Water Pollution | |||||
| Abatement Trust | |||||
| Water Revenue, Series 13 | 5.000 | 08-01-28 | 1,000,000 | 1,136,540 | |
| Massachusetts Water Pollution | |||||
| Abatement Trust | |||||
| Water Revenue, Series 14 | 5.000 | 08-01-32 | 1,000,000 | 1,173,100 | |
| Massachusetts Water Resources Authority | |||||
| Water Revenue, Series A | 5.000 | 08-01-40 | 1,600,000 | 1,790,832 | |
| Massachusetts Water Resources Authority | |||||
| Water Revenue, Series B | 5.000 | 08-01-39 | 1,000,000 | 1,106,990 | |
| Massachusetts Water Resources Authority | |||||
| Water Revenue, Series B (D) | 5.250 | 08-01-29 | 2,500,000 | 3,277,975 | |
| Metropolitan Boston Transit Parking Corp. | 5.000 | 07-01-41 | 2,000,000 | 2,160,500 | |
| University of Massachusetts Building Authority | |||||
| College & University Revenue, Series 1 | 5.000 | 05-01-39 | 1,500,000 | 1,640,010 | |
| Puerto Rico 13.9% | 17,739,422 | ||||
| Commonwealth of Puerto Rico | |||||
| Public Improvement, Series A | 5.500 | 07-01-39 | 1,000,000 | 1,040,780 | |
| Commonwealth of Puerto Rico | |||||
| Public Improvement, Series A | 5.750 | 07-01-41 | 1,000,000 | 1,072,280 | |
| Puerto Rico Aqueduct & Sewer Authority | |||||
| Water Revenue, Series A | 6.125 | 07-01-24 | 1,750,000 | 2,071,178 | |
| Puerto Rico Aqueduct & Sewer Authority | |||||
| Water Revenue, Series A | 5.125 | 07-01-37 | 1,500,000 | 1,504,035 | |
| Puerto Rico Highway & | |||||
| Transportation Authority | |||||
| Fuel Sales Tax Revenue, Escrowed to | |||||
| Maturity, Series Y | 6.250 | 07-01-14 | 955,000 | 1,071,854 | |
| Puerto Rico Highway & | |||||
| Transportation Authority | |||||
| Fuel Sales Tax Revenue, Series Y | 6.250 | 07-01-14 | 45,000 | 49,013 | |
| Puerto Rico Highway & | |||||
| Transportation Authority | |||||
| Prerefunded, Series AA (D) | 5.500 | 07-01-19 | 1,640,000 | 2,110,418 | |
| Puerto Rico Highway & | |||||
| Transportation Authority | |||||
| Prerefunded, Series H | 5.450 | 07-01-35 | 715,000 | 718,117 | |
| Puerto Rico Highway & | |||||
| Transportation Authority | |||||
| Unrefunded, Series H | 5.450 | 07-01-35 | 285,000 | 296,696 | |
| Puerto Rico Highway & | |||||
| Transportation Authority | |||||
| Unrefunded, Series AA (D) | 5.500 | 07-01-19 | 360,000 | 413,201 | |
| See notes to financial statements | Annual report | Massachusetts Tax-Free Income Fund | 15 |
| Maturity | |||||
| Rate (%) | date | Par value | Value | ||
| Puerto Rico (continued) | |||||
| Puerto Rico Housing Finance Authority | 5.125 | 12-01-27 | $1,000,000 | $1,091,440 | |
| Puerto Rico Sales Tax Financing Corp. | |||||
| Sales Tax Revenue, Series A | 5.500 | 08-01-42 | 1,000,000 | 1,072,880 | |
| Puerto Rico Sales Tax Financing Corp. | |||||
| Sales Tax Revenue, Series A (Zero coupon | |||||
| steps up to 6.750% on 8-1-16) (Z) | Zero | 08-01-32 | 3,000,000 | 3,079,470 | |
| Puerto Rico Sales Tax Financing Corp., Series C | 5.375 | 08-01-38 | 2,000,000 | 2,148,060 | |
| Virgin Islands 1.3% | 1,682,735 | ||||
| Virgin Islands Public Finance Authority, Series A | 6.750 | 10-01-37 | 1,000,000 | 1,168,240 | |
| Virgin Islands Public Finance Authority, | |||||
| Series A–1 | 5.000 | 10-01-39 | 500,000 | 514,495 | |
| Guam 0.4% | 536,455 | ||||
| Guam Government, Series A | 5.750 | 12-01-34 | 500,000 | 536,455 | |
| Par value | Value | ||||
| Short-Term Investments 1.1% | $1,380,000 | ||||
| (Cost $1,380,000) | |||||
| Repurchase Agreement 1.1% | 1,380,000 | ||||
| Repurchase Agreement with State Street Corp. dated 5-31-12 at | |||||
| 0.010% to be repurchased at $1,380,000 on 6-1-12, collateralized | |||||
| by $1,410,000 Federal Home Loan Bank, 0.280% due 8-2-13 | |||||
| (valued at $1,411,323, including interest) | $1,380,000 | 1,380,000 | |||
| Total investments (Cost $110,957,051)† 94.2% | $120,551,824 | ||||
| Other assets and liabilities, net 5.8% | $7,469,833 | ||||
| Total net assets 100.0% | $128,021,657 | ||||
The percentage shown for each investment category is the total value of that category as a percentage of the net assets of the Fund.
AMT Interest earned from these securities may be considered a tax preference item for purpose of the Federal Alternative Minimum Tax.
(D) Bond is insured by one of the following companies:
| Insurance coverage | As a % of total investments | |||||
| ACA Financial Guaranty Corp. | 1.7% | |||||
| Ambac Financial Group, Inc. | 3.3% | |||||
| Assured Guarantee Corp. | 0.9% | |||||
| Assured Guaranty Municipal Corp. | 9.3% | |||||
| Financial Guaranty Insurance Company | 0.5% | |||||
| National Public Finance Guarantee Insurance Company | 10.2% | |||||
| Radian Asset Assurance, Inc. | 0.8% | |||||
| XL Capital Assurance, Inc. | 0.7% | |||||
(P) Variable rate obligation. The coupon rate shown represents the rate at period end.
(Z) Zero coupon bonds are issued at a discount from their principal amount in lieu of paying interest periodically.
† At 5-31-12, the aggregate cost of investment securities for federal income tax purposes was $110,638,533. Net unrealized appreciation aggregated $9,913,291, of which $10,871,728 related to appreciated investment securities and $958,437 related to depreciated investment securities.
| 16 | Massachusetts Tax-Free Income Fund | Annual report | See notes to financial statements |
Notes to Schedule of Investments
| The Fund had the following sector composition as a percentage of total net assets on 5-31-12: | ||||
| General Obligation Bonds | 7.4% | |||
| Revenue Bonds | ||||
| Water & Sewer | 15.1% | |||
| Health Care | 13.8% | |||
| Transportation | 13.2% | |||
| Education | 12.9% | |||
| Housing | 8.4% | |||
| Pollution | 3.6% | |||
| Utilities | 2.7% | |||
| Facilities | 1.7% | |||
| Development | 0.8% | |||
| Industrial Development | 0.1% | |||
| Other Revenue | 13.4% | |||
| Short-Term Investments & Other | 6.9% | |||
| See notes to financial statements | Annual report | Massachusetts Tax-Free Income Fund | 17 |
F I N A N C I A L S T A T E M E N T S
Financial statements
Statement of assets and liabilities 5-31-12
This Statement of assets and liabilities is the Fund’s balance sheet. It shows the value of what the Fund owns, is due and owes. You’ll also find the net asset value and the maximum offering price per share.
| Assets | |
| Investments, at value (Cost $110,957,051) | $120,551,824 |
| Cash | 4,119,272 |
| Receivable for fund shares sold | 1,733,055 |
| Interest receivable | 1,956,341 |
| Receivable from affiliates | 11,840 |
| Other receivables and prepaid expenses | 16,945 |
| Total assets | 128,389,277 |
| Liabilities | |
| Payable for fund shares repurchased | 213,458 |
| Distributions payable | 82,250 |
| Payable to affiliates | |
| Accounting and legal services fees | 6,159 |
| Transfer agent fees | 7,027 |
| Distribution and service fees | 26,481 |
| Trustees’ fees | 6,086 |
| Other liabilities and accrued expenses | 26,159 |
| Total liabilities | 367,620 |
| Net assets | |
| Paid-in capital | $118,010,399 |
| Undistributed net investments income | 97,967 |
| Accumulated net realized gain (loss) on investments | 318,518 |
| Net unrealized appreciation (depreciation) on investments | 9,594,773 |
| Net assets | $128,021,657 |
| Net asset value per share | |
| Based on net asset values and shares outstanding — the Fund has an | |
| unlimited number of shares authorized with no par value | |
| Class A ($105,270,787 ÷ 8,017,344 shares) | $13.13 |
| Class B ($3,472,171 ÷ 264,482 shares)1 | $13.13 |
| Class C ($19,278,699 ÷ 1,468,269 shares)1 | $13.13 |
| Maximum offering price per share | |
| Class A (net asset value per share ÷ 95.5%)2 | $13.75 |
1 Redemption price is equal to net asset value less any applicable contingent deferred sales charge.
2 On single retail sales of less than $100,000. On sales of $100,000 or more and on group sales the offering price is reduced.
| 18 | Massachusetts Tax-Free Income Fund | Annual report | See notes to financial statements |
F I N A N C I A L S T A T E M E N T S
Statement of operations For the year ended 5-31-12
This Statement of operations summarizes the Fund’s investment income earned and expenses incurred in operating the Fund. It also shows net gains (losses) for the period stated.
| Investment income | |
| Interest | $5,558,329 |
| Expenses | |
| Investment management fees | 592,773 |
| Distribution and service fees | 503,742 |
| Accounting and legal services fees | 25,107 |
| Transfer agent fees | 78,941 |
| Trustees’ fees | 8,543 |
| State registration fees | 17,838 |
| Printing and postage | 10,162 |
| Professional fees | 42,609 |
| Custodian fees | 20,059 |
| Registration and filing fees | 19,000 |
| Other | 14,321 |
| Total expenses | 1,333,095 |
| Less expense reductions | (140,680) |
| Net expenses | 1,192,415 |
| Net investment income | 4,365,914 |
| Realized and unrealized gain (loss) | |
| Net realized gain (loss) on investments | 30,787 |
| Change in net unrealized appreciation (depreciation) of investments | 8,465,998 |
| Net realized and unrealized gain | 8,496,785 |
| Increase in net assets from operations | $12,862,699 |
| See notes to financial statements | Annual report | Massachusetts Tax-Free Income Fund | 19 |
F I N A N C I A L S T A T E M E N T S
Statements of changes in net assets
These Statements of changes in net assets show how the value of the Fund’s net assets has changed during the last two periods. The difference reflects earnings less expenses, any investment gains and losses, distributions, if any, paid to shareholders and the net of Fund share transactions.
| Year | Year | |
| ended | ended | |
| 5-31-12 | 5-31-11 | |
| Increase (decrease) in net assets | ||
| From operations | ||
| Net investment income | $4,365,914 | $4,837,630 |
| Net realized gain | 30,787 | 494,247 |
| Change in net unrealized appreciation (depreciation) | 8,465,998 | (4,078,824) |
| Increase in net assets resulting from operations | 12,862,699 | 1,253,053 |
| Distributions to shareholders | ||
| From net investment income | ||
| Class A | (3,695,861) | (4,035,324) |
| Class B | (102,377) | (145,125) |
| Class C | (542,889) | (631,053) |
| From net realized gain | ||
| Class A | (65,672) | (132,947) |
| Class B | (2,260) | (5,601) |
| Class C | (12,064) | (26,227) |
| Total distributions | (4,421,123) | (4,976,277) |
| From Fund share transactions | 6,490,689 | (12,583,533) |
| Total increase (decrease) | 14,932,265 | (16,306,757) |
| Net assets | ||
| Beginning of year | 113,089,392 | 129,396,149 |
| End of year | $128,021,657 | $113,089,392 |
| Undistributed net investment income | $97,967 | $65,342 |
| 20 | Massachusetts Tax-Free Income Fund | Annual report | See notes to financial statements |
Financial highlights
The Financial highlights show how the Fund’s net asset value for a share has changed during the period.
| CLASS A SHARES Period ended | 5-31-12 | 5-31-11 | 5-31-10 | 5-31-091 | 8-31-08 | 8-31-07 |
| Per share operating performance | ||||||
| Net asset value, beginning of period | $12.22 | $12.53 | $12.10 | $12.28 | $12.37 | $12.64 |
| Net investment income2 | 0.49 | 0.50 | 0.49 | 0.38 | 0.51 | 0.53 |
| Net realized and unrealized gain (loss) | ||||||
| on investments | 0.91 | (0.30) | 0.46 | (0.17) | (0.08) | (0.27) |
| Total from investment operations | 1.40 | 0.20 | 0.95 | 0.21 | 0.43 | 0.26 |
| Less distributions | ||||||
| From net investment income | (0.48) | (0.49) | (0.49) | (0.39) | (0.50) | (0.52) |
| From net realized gain | (0.01) | (0.02) | (0.03) | —3 | (0.02) | (0.01) |
| Total distributions | (0.49) | (0.51) | (0.52) | (0.39) | (0.52) | (0.53) |
| Net asset value, end of period | $13.13 | $12.22 | $12.53 | $12.10 | $12.28 | $12.37 |
| Total return (%)4 | 11.675 | 1.675 | 8.045 | 1.846 | 3.555 | 2.025 |
| Ratios and supplemental data | ||||||
| Net assets, end of period (in millions) | $105 | $92 | $105 | $95 | $97 | $80 |
| Ratios (as a percentage of average net assets): | ||||||
| Expenses before reductions | 1.00 | 1.00 | 1.00 | 1.097,8 | 0.98 | 0.98 |
| Expenses net of fee waivers | 0.87 | 0.95 | 1.00 | 1.097,8 | 0.98 | 0.98 |
| Expenses net of fee waivers and credits | 0.87 | 0.95 | 1.00 | 1.097,8 | 0.97 | 0.98 |
| Net investment income | 3.82 | 4.04 | 4.00 | 4.398 | 4.08 | 4.16 |
| Portfolio turnover (%) | 11 | 17 | 10 | 17 | 22 | 25 |
1 For the nine-month period ended 5-31-09. The Fund changed its fiscal year end from August 31 to May 31.
2 Based on the average daily shares outstanding.
3 Less than $0.005 per share.
4 Does not reflect the effect of sales charges, if any.
5 Total returns would have been lower had certain expenses not been reduced during the periods shown.
6 Not annualized.
7 Includes the impact of proxy expenses, which amounted to 0.04% of average net assets.
8 Annualized.
| See notes to financial statements | Annual report | Massachusetts Tax-Free Income Fund | 21 |
| CLASS B SHARES Period ended | 5-31-12 | 5-31-11 | 5-31-10 | 5-31-091 | 8-31-08 | 8-31-07 |
| Per share operating performance | ||||||
| Net asset value, beginning of period | $12.22 | $12.53 | $12.09 | $12.28 | $12.37 | $12.64 |
| Net investment income2 | 0.39 | 0.41 | 0.41 | 0.32 | 0.42 | 0.44 |
| Net realized and unrealized gain (loss) | ||||||
| on investments | 0.92 | (0.29) | 0.46 | (0.19) | (0.08) | (0.27) |
| Total from investment operations | 1.31 | 0.12 | 0.87 | 0.13 | 0.34 | 0.17 |
| Less distributions | ||||||
| From net investment income | (0.39) | (0.41) | (0.40) | (0.32) | (0.41) | (0.43) |
| From net realized gain | (0.01) | (0.02) | (0.03) | —3 | (0.02) | (0.01) |
| Total distributions | (0.40) | (0.43) | (0.43) | (0.32) | (0.43) | (0.44) |
| Net asset value, end of period | $13.13 | $12.22 | $12.53 | $12.09 | $12.28 | $12.37 |
| Total return (%)4 | 10.855 | 0.965 | 7.375 | 1.226 | 2.835 | 1.315 |
| Ratios and supplemental data | ||||||
| Net assets, end of period (in millions) | $3 | $3 | $5 | $7 | $10 | $12 |
| Ratios (as a percentage of average net assets): | ||||||
| Expenses before reductions | 1.70 | 1.70 | 1.70 | 1.797,8 | 1.68 | 1.68 |
| Expenses net of fee waivers | 1.62 | 1.65 | 1.70 | 1.797,8 | 1.68 | 1.68 |
| Expenses net of fee waivers and credits | 1.62 | 1.65 | 1.70 | 1.797,8 | 1.67 | 1.68 |
| Net investment income | 3.08 | 3.33 | 3.29 | 3.698 | 3.39 | 3.46 |
| Portfolio turnover (%) | 11 | 17 | 10 | 17 | 22 | 25 |
1 For the nine-month period ended 5-31-09. The Fund changed its fiscal year end from August 31 to May 31.
2 Based on the average daily shares outstanding.
3 Less than $0.005 per share.
4 Does not reflect the effect of sales charges, if any.
5 Total returns would have been lower had certain expenses not been reduced during the periods shown.
6 Not annualized.
7 Includes the impact of proxy expenses, which amounted to 0.04% of average net assets.
8 Annualized.
| CLASS C SHARES Period ended | 5-31-12 | 5-31-11 | 5-31-10 | 5-31-091 | 8-31-08 | 8-31-07 |
| Per share operating performance | ||||||
| Net asset value, beginning of period | $12.22 | $12.53 | $12.10 | $12.28 | $12.37 | $12.64 |
| Net investment income2 | 0.39 | 0.41 | 0.41 | 0.32 | 0.42 | 0.44 |
| Net realized and unrealized gain (loss) | ||||||
| on investments | 0.92 | (0.29) | 0.45 | (0.18) | (0.08) | (0.27) |
| Total from investment operations | 1.31 | 0.12 | 0.86 | 0.14 | 0.34 | 0.17 |
| Less distributions | ||||||
| From net investment income | (0.39) | (0.41) | (0.40) | (0.32) | (0.41) | (0.43) |
| From net realized gain | (0.01) | (0.02) | (0.03) | —3 | (0.02) | (0.01) |
| Total distributions | (0.40) | (0.43) | (0.43) | (0.32) | (0.43) | (0.44) |
| Net asset value, end of period | $13.13 | $12.22 | $12.53 | $12.10 | $12.28 | $12.37 |
| Total return (%)4 | 10.855 | 0.965 | 7.295 | 1.316 | 2.835 | 1.315 |
| Ratios and supplemental data | ||||||
| Net assets, end of period (in millions) | $19 | $17 | $19 | $14 | $12 | $10 |
| Ratios (as a percentage of average net assets): | ||||||
| Expenses before reductions | 1.70 | 1.70 | 1.70 | 1.797,8 | 1.68 | 1.68 |
| Expenses net of fee waivers | 1.62 | 1.65 | 1.70 | 1.797,8 | 1.68 | 1.68 |
| Expenses net of fee waivers and credits | 1.62 | 1.65 | 1.70 | 1.797,8 | 1.67 | 1.68 |
| Net investment income | 3.07 | 3.34 | 3.30 | 3.678 | 3.38 | 3.46 |
| Portfolio turnover (%) | 11 | 17 | 10 | 17 | 22 | 25 |
1 For the nine-month period ended 5-31-09. The Fund changed its fiscal year end from August 31 to May 31.
2 Based on the average daily shares outstanding.
3 Less than $0.005 per share.
4 Does not reflect the effect of sales charges, if any.
5 Total returns would have been lower had certain expenses not been reduced during the periods shown.
6 Not annualized.
7 Includes the impact of proxy expenses, which amounted to 0.04% of average net assets.
8 Annualized.
| 22 | Massachusetts Tax-Free Income Fund | Annual report | See notes to financial statements |
Notes to financial statements
Note 1 — Organization
John Hancock Massachusetts Tax-Free Income Fund (the Fund) is a series of John Hancock Tax-Exempt Series Fund (the Trust), an open-end management investment company organized as a Massachusetts business trust and registered under the Investment Company Act of 1940, as amended (the 1940 Act). The investment objective of the Fund is to seek a high level of current income, consistent with preservation of capital, that is exempt from federal and Massachusetts personal income taxes.
The Fund may offer multiple classes of shares. The shares currently offered are detailed in the Statement of assets and liabilities. Class A, Class B and Class C shares are offered to all investors. Shareholders of each class have exclusive voting rights to matters that affect that class. The distribution and service fees, if any, and transfer agent fees for each class may differ. Class B shares convert to Class A shares eight years after purchase.
Note 2 — Significant accounting policies
The financial statements have been prepared in conformity with accounting principles generally accepted in the United States of America, which require management to make certain estimates and assumptions at the date of the financial statements. Actual results could differ from those estimates. Events or transactions occurring after the end of the fiscal period through the date that the financial statements were issued have been evaluated in the preparation of the financial statements. The following summarizes the significant accounting policies of the Fund:
Security valuation. Investments are stated at value as of the close of regular trading on the New York Stock Exchange (NYSE), normally at 4:00 P.M., Eastern Time. The Fund uses a three-tier hierarchy to prioritize the pricing assumptions, referred to as inputs, used in valuation techniques to measure fair value. Level 1 includes securities valued using quoted prices in active markets for identical securities. Level 2 includes securities valued using significant observable inputs. Observable inputs may include quoted prices for similar securities, interest rates, prepayment speeds and credit risk. Prices for securities valued using these inputs are received from independent pricing vendors and brokers and are based on an evaluation of the inputs described. Level 3 includes securities valued using significant unobservable inputs when market prices are not readily available or reliable, including the Fund’s own assumptions in determining the fair value of investments. Factors used in determining value may include market or issuer specific events, changes in interest rates and credit quality. The inputs or methodology used for valuing securities are not necessarily an indication of the risks associated with investing in those securities.
As of May 31, 2012, all investments are categorized as Level 2 under the hierarchy described above. Changes in valuation techniques may result in transfers into or out of an assigned level within the disclosure hierarchy. During the year ended May 31, 2012, there were no significant transfers into or out of Level 1, Level 2 or Level 3.
In order to value the securities, the Fund uses the following valuation techniques. Debt obligations are valued based on the evaluated prices provided by an independent pricing service, which utilizes both dealer-supplied and electronic data processing techniques, taking into account factors such as institutional-size trading in similar groups of securities, yield, quality, coupon rate, maturity, type of issue, trading characteristics and other market data. Certain securities traded only in the over-the-counter market are valued at the last bid price quoted by brokers making markets in the securities at the close of trading. Certain short-term securities are valued at amortized cost. Other portfolio
| Annual report | Massachusetts Tax-Free Income Fund | 23 |
securities and assets, where market quotations are not readily available, are valued at fair value, as determined in good faith by the Fund’s Pricing Committee, following procedures established by the Board of Trustees.
Repurchase agreements. The Fund may enter into repurchase agreements. When the Fund enters into a repurchase agreement, it receives collateral which is held in a segregated account by the Fund’s custodian. The collateral amount is marked-to-market and monitored on a daily basis to ensure that the collateral held is in an amount not less than the principal amount of the repurchase agreement plus any accrued interest. In the event of a default by the counterparty, realization of the collateral proceeds could be delayed, during which time the collateral value may decline.
Security transactions and related investment income. Investment security transactions are accounted for on a trade date plus one basis for daily net asset value calculations. However, for financial reporting purposes, investment transactions are reported on trade date. Interest income is accrued as earned. Interest income includes coupon interest and amortization/accretion of premiums/discounts on debt securities. Debt obligations may be placed in a non-accrual status and related interest income may be reduced by stopping current accruals and writing off interest receivable when the collection of all or a portion of interest has become doubtful. Gains and losses on securities sold are determined on the basis of identified cost and may include proceeds from litigation.
Line of credit. The Fund may borrow from banks for temporary or emergency purposes, including meeting redemption requests that otherwise might require the untimely sale of securities. Pursuant to the custodian agreement, the custodian may loan money to the Fund to make properly authorized payments. The Fund is obligated to repay the custodian for any overdraft, including any related costs or expenses. The custodian may have a lien, security interest or security entitlement in any Fund property that is not otherwise segregated or pledged, to the maximum extent permitted by law, to the extent of any overdraft.
In addition, the Fund and other affiliated funds have entered into an agreement with Citibank N.A. which enables them to participate in a $100 million unsecured committed line of credit. A commitment fee, payable at the end of each calendar quarter, based on the average daily unused portion of the line of credit, is charged to each participating fund on a pro rata basis and is reflected in other expenses on the Statement of operations. For the year ended May 31, 2012, the Fund had no borrowings under the line of credit.
Expenses. Within the John Hancock Funds complex, expenses that are directly attributable to an individual fund are allocated to such fund. Expenses that are not readily attributable to a specific fund are allocated among all funds in an equitable manner, taking into consideration, among other things, the nature and type of expense and the fund’s relative net assets. Expense estimates are accrued in the period to which they relate and adjustments are made when actual amounts are known.
Class allocations. Income, common expenses and realized and unrealized gains (losses) are determined at the fund level and allocated daily to each class of shares based on the net assets of the class. Class-specific expenses, such as distribution and service fees, if any, and transfer agent fees, are calculated daily for each class, based on the net asset value of the class and the applicable specific expense rates.
Federal income taxes. The Fund intends to continue to qualify as a regulated investment company by complying with the applicable provisions of the Internal Revenue Code and will not be subject to federal income tax on taxable income that is distributed to shareholders. Therefore, no federal income tax provision is required.
| 24 | Massachusetts Tax-Free Income Fund | Annual report |
As of May 31, 2012, the Fund had no uncertain tax positions that would require financial statement recognition, derecognition or disclosure. The Fund’s federal tax returns are subject to examination by the Internal Revenue Service for a period of three years.
Distribution of income and gains. Distributions to shareholders from net investment income and net realized gains, if any, are recorded on the ex-date. The Fund generally declares dividends daily and pays them monthly. Capital gain distributions, if any, are distributed annually. The tax character of distributions for the years ended May 31, 2012 and May 31, 2011 was as follows:
| MAY 31, 2012 | MAY 31, 2011 | |||
| Ordinary Income | $28,176 | $39,789 | ||
| Exempt Interest | $4,308,429 | $4,771,713 | ||
| Long-Term Capital Gain | $84,518 | $164,775 | ||
Distributions paid by the Fund with respect to each class of shares are calculated in the same manner, at the same time and are in the same amount, except for the effect of class level expenses that may be applied differently to each class. As of May 31, 2012, the components of distributable earnings on a tax basis included $184,198 of undistributed exempt interest.
Such distributions and distributable earnings, on a tax basis, are determined in conformity with income tax regulations, which may differ from accounting principles generally accepted in the United States of America. Material distributions in excess of tax basis earnings and profits, if any, are reported in the Fund’s financial statements as a return of capital.
Capital accounts within financial statements are adjusted for permanent book-tax differences. These adjustments have no impact on net assets or the results of operations. Temporary book-tax differences, if any, will reverse in a subsequent period. Book-tax differences are primarily attributable to wash sale loss deferrals, distributions payable and accretion on debt securities.
New accounting pronouncements. In May 2011, Accounting Standards Update 2011-04 (ASU 2011-04), Amendments to Achieve Common Fair Value Measurement and Disclosure Requirements in U.S. GAAP and IFRSs, was issued and is effective during interim and annual periods beginning after December 15, 2011. ASU 2011-04 may result in additional disclosure for transfers between levels as well as expanded disclosure for securities categorized as Level 3 under the fair value hierarchy.
In December 2011, the Financial Accounting Standards Board issued Accounting Standards Update No. 2011-11 (ASU 2011-11), Disclosures about Offsetting Assets and Liabilities. The update creates new disclosure requirements requiring entities to disclose both gross and net information for derivatives and other financial instruments that are either offset in the Statement of assets and liabilities or subject to an enforceable master netting arrangement or similar agreement. The disclosure requirements are effective for annual reporting periods beginning on or after January 1, 2013 and interim periods within those annual periods. ASU 2011-11 may result in additional disclosure relating to the presentation of derivatives and certain other financial instruments.
Note 3 — Guarantees and indemnifications
Under the Fund’s organizational documents, its Officers and Trustees are indemnified against certain liabilities arising out of the performance of their duties to the Fund. Additionally, in the normal course of business, the Fund enters into contracts with service providers that contain general indemnification clauses. The Fund’s maximum exposure under these arrangements is unknown, as this would involve future claims that may be made against the Fund that have not yet occurred. The risk of material loss from such claims is considered remote.
| Annual report | Massachusetts Tax-Free Income Fund | 25 |
Note 4 — Fees and transactions with affiliates
John Hancock Advisers, LLC (the Adviser) serves as investment adviser for the Fund. John Hancock Funds, LLC (the Distributor), an affiliate of the Adviser, serves as principal underwriter of the Fund. The Adviser and the Distributor are indirect, wholly owned subsidiaries of Manulife Financial Corporation (MFC).
Management fee. The Fund has an investment management contract with the Adviser under which the Fund pays a daily management fee to the Adviser equivalent, on an annual basis, to the sum of: (a) 0.500% of the first $250,000,000 of the Fund’s average daily net assets, (b) 0.450% of the next $250,000,000, (c) 0.425% of the next $500,000,000, (d) 0.400% of the next $250,000,000 and (e) 0.300% of the Fund’s average daily net assets in excess of $1,250,000,000. The Adviser has a subadvisory agreement with John Hancock Asset Management a division of Manulife Asset Management (US) LLC, an indirectly owned subsidiary of MFC and an affiliate of the Adviser. The Fund is not responsible for payment of the subadvisory fees.
Effective July 1, 2010, the Adviser contractually agreed to waive fees and/or reimburse certain expenses for each share class of the Fund. This agreement excluded taxes, portfolio brokerage commissions, interest, litigation and extraordinary expenses not incurred in the ordinary course of the Fund’s business. The fee waivers and/or expense reimbursements were such that these expenses would not exceed 0.95%, 1.65% and 1.65% for Class A, Class B and Class C shares, respectively. Effective September 30, 2011, these fee waivers and/or expense reimbursements expired.
The investment management fees incurred for the year ended May 31, 2012 were equivalent to a net effective rate of 0.50% of the Fund’s average daily net assets.
Accounting and legal services. Pursuant to a service agreement, the Fund reimburses the Adviser for all expenses associated with providing the administrative, financial, legal, accounting and recordkeeping services of the Fund, including the preparation of all tax returns, periodic reports to shareholders and regulatory reports, among other services. These expenses are allocated to each share class based on its relative net assets at the time the expense was incurred. The accounting and legal services fees incurred for the year ended May 31, 2012 amounted to an annual rate of 0.02% of the Fund’s average daily net assets.
Distribution and service plans. The Fund has a distribution agreement with the Distributor. The Fund has adopted distribution and service plans with respect to Class A, Class B and Class C shares pursuant to Rule 12b-1 under the 1940 Act, to pay the Distributor for services provided as the distributor of shares of the Fund. The Fund may pay up to the following contractual rates of distribution and service fees under these arrangements, expressed as an annual percentage of average daily net assets for each class of the Fund’s shares.
| CLASS | 12b-1 FEE | ||||
| Class A | 0.30% | ||||
| Class B | 1.00% | ||||
| Class C | 1.00% | ||||
Effective August 1, 2011, the Distributor has contractually agreed to limit the distribution and service fees to 0.15%, 0.90% and 0.90% of the average daily net assets of Class A, Class B and Class C shares, respectively, until at least September 30, 2012, unless renewed by mutual agreement of the Fund and the Distributor based upon a determination that this is appropriate under the circumstances at the time.
| 26 | Massachusetts Tax-Free Income Fund | Annual report |
Accordingly, these expense reductions amounted to $122,927, $2,797 and $14,956 for Class A, Class B, and Class C shares, respectively, for the year ended May 31, 2012.
Sales charges. Class A shares are assessed up-front sales charges, which resulted in payments to the Distributor amounting to $142,030 for the year ended May 31, 2012. Of this amount, $21,167 was retained and used for printing prospectuses, advertising, sales literature and other purposes, $111,170 was paid as sales commissions to broker-dealers and $9,693 was paid as sales commissions to sales personnel of Signator Investors, Inc., a broker-dealer affiliate of the Adviser.
Class B and Class C shares are subject to contingent deferred sales charges (CDSCs). Class B shares that are redeemed within six years of purchase are subject to CDSCs, at declining rates, beginning at 5.00% of the lesser of the current market value at the time of redemption or the original purchase cost of the shares being redeemed. Class C shares that are redeemed within one year of purchase are subject to a 1.00% CDSCs on the lesser of the current market value at the time of redemption or the original purchase cost of the shares being redeemed. Proceeds from CDSCs are used to compensate the Distributor for providing distribution-related services in connection with the sale of these shares. During the year ended May 31, 2012, CDSCs received by the Distributor amounted to $1,750 and $12 for Class B and Class C shares, respectively.
Transfer agent fees. The Fund has a transfer agent agreement with John Hancock Signature Services, Inc. (Signature Services), an affiliate of the Adviser. The transfer agent fees paid to Signature Services are determined based on the cost to Signature Services (Signature Services Cost) of providing recordkeeping services. The Signature Services Cost includes a component of allocated John Hancock corporate overhead for providing transfer agent services to the Fund and to all other John Hancock affiliated funds. It also includes out-of-pocket expenses that are comprised of payments made to third-parties for recordkeeping services provided to their clients who invest in one or more John Hancock funds. In addition, Signature Services Cost may be reduced by certain fees that Signature Services receives in connection with retirement and small accounts. Signature Services Cost is calculated monthly and allocated, as applicable, to four categories of share classes: Institutional Share Classes, Retirement Share Classes, Municipal Bond Classes and all other Retail Share Classes. Within each of these categories, the applicable costs are allocated to the affected John Hancock affiliated funds and/or classes, based on the relative average daily net assets.
Class level expenses. Class level expenses for the year ended May 31, 2012 were:
| DISTRIBUTION AND | TRANSFER | |||
| CLASS | SERVICE FEES | AGENT FEES | ||
| Class A | $292,202 | $64,863 | ||
| Class B | 33,513 | 2,231 | ||
| Class C | 178,027 | 11,847 | ||
| Total | $503,742 | $78,941 | ||
Trustee expenses. The Fund compensates each Trustee who is not an employee of the Adviser or its affiliates. These Trustees may, for tax purposes, elect to defer receipt of this compensation under the John Hancock Group of Funds Deferred Compensation Plan (the Plan). Deferred amounts are invested in various John Hancock funds and remain in the funds until distributed in accordance with the Plan. The investment of deferred amounts and the offsetting liability are included within Other receivables and prepaid expenses and Payable to affiliates — Trustees’ fees, respectively, in the accompanying Statement of assets and liabilities.
| Annual report | Massachusetts Tax-Free Income Fund | 27 |
Note 5 — Fund share transactions
Transactions in Fund shares for the years ended May 31, 2012 and 2011 were as follows:
| Year ended 5-31-12 | Year ended 5-31-11 | |||
| Shares | Amount | Shares | Amount | |
| Class A shares | ||||
| Sold | 1,097,597 | $14,049,257 | 910,737 | $11,317,354 |
| Distributions reinvested | 209,373 | 2,670,749 | 220,734 | 2,708,233 |
| Repurchased | (839,299) | (10,657,208) | (1,997,898) | (24,236,994) |
| Net increase (decrease) | 467,671 | $6,062,798 | (866,427) | ($10,211,407) |
| Class B shares | ||||
| Sold | 34,239 | $440,045 | 29,576 | $366,589 |
| Distributions reinvested | 5,564 | 70,923 | 6,859 | 84,129 |
| Repurchased | (53,032) | (670,986) | (177,947) | (2,181,221) |
| Net decrease | (13,229) | ($160,018) | (141,512) | ($1,730,503) |
| Class C shares | ||||
| Sold | 278,261 | $3,553,172 | 288,638 | $3,610,346 |
| Distributions reinvested | 34,021 | 433,893 | 34,930 | 427,901 |
| Repurchased | (269,191) | (3,399,156) | (390,925) | (4,679,870) |
| Net increase (decrease) | 43,091 | $587,909 | (67,357) | ($641,623) |
| Net increase (decrease) | 497,533 | $6,490,689 | (1,075,296) | ($12,583,533) |
Note 6 — Purchase and sale of securities
Purchases and sales of securities, other than short-term securities, aggregated $12,711,759 and $12,381,549, respectively, for the year ended May 31, 2012.
| 28 | Massachusetts Tax-Free Income Fund | Annual report |
Auditor’s report
Report of Independent Registered Public Accounting Firm
To the Board of Trustees of John Hancock Tax-Exempt Series Fund and Shareholders of John Hancock Massachusetts Tax-Free Income Fund:
In our opinion, the accompanying statement of assets and liabilities, including the schedule of investments, and the related statements of operations and of changes in net assets and the financial highlights present fairly, in all material respects, the financial position of John Hancock Massachusetts Tax-Free Income Fund (the “Fund”) at May 31, 2012, and the results of its operations, the changes in its net assets and the financial highlights for each of the periods indicated, in conformity with accounting principles generally accepted in the United States of America. These financial statements and financial highlights (hereafter referred to as “financial statements”) are the responsibility of the Fund’s management; our responsibility is to express an opinion on these financial statements based on our audits. We conducted our audits of these financial statements in accordance with the standards of the Public Company Accounting Oversight Board (United States). Those standards require that we plan and perform the audits to obtain reasonable assurance about whether the financial statements are free of material misstatement. An audit includes examining, on a test basis, evidence supporting the amounts and disclosures in the financial statements, assessing the accounting principles used and significant estimates made by management, and evaluating the overall financial statement presentation. We believe that our audits, which included confirmation of securities at May 31, 2012 by correspondence with the custodian and brokers, provide a reasonable basis for our opinion.
PricewaterhouseCoopers LLP
Boston, Massachusetts
July 23, 2012
| Annual report | Massachusetts Tax-Free Income Fund | 29 |
Tax information
Unaudited
For federal income tax purposes, the following information is furnished with respect to the distributions of the Fund, if any, paid during its taxable year ended May 31, 2012.
The Fund paid $84,518 in capital gain dividends.
99.25% of dividends from net investment income are exempt-interest dividends.
Eligible shareholders will be mailed a 2012 Form 1099-DIV in early 2013. This will reflect the tax character of all distributions paid in calendar year 2012.
| 30 | Massachusetts Tax-Free Income Fund | Annual report |
Trustees and Officers
This chart provides information about the Trustees and Officers who oversee your John Hancock fund. Officers elected by the Trustees manage the day-to-day operations of the Fund and execute policies formulated by the Trustees.
| Independent Trustees | ||
| Name, Year of Birth | Trustee | Number of John |
| Position(s) held with Fund | of the | Hancock funds |
| Principal occupation(s) and other | Trust | overseen by |
| directorships during past 5 years | since1 | Trustee |
| Steven R. Pruchansky, Born: 1944 | 1994 | 49 |
| Chairman (since January 2011); Chairman and Chief Executive Officer, Greenscapes of Southwest | ||
| Florida, Inc. (since 2000); Director and President, Greenscapes of Southwest Florida, Inc. (until 2000); | ||
| Member, Board of Advisors, First American Bank (until 2010); Managing Director, Jon James, LLC (real | ||
| estate) (since 2000); Director, First Signature Bank & Trust Company (until 1991); Director, Mast Realty | ||
| Trust (until 1994); President, Maxwell Building Corp. (until 1991). | ||
| William H. Cunningham, Born: 1944 | 1987 | 49 |
| Professor, University of Texas, Austin, Texas (since 1971); former Chancellor, University of Texas System | ||
| and former President of the University of Texas, Austin, Texas; Director of the following: LIN Television | ||
| (since 2009); Lincoln National Corporation (insurance) (Chairman since 2009 and Director since 2006); | ||
| Resolute Energy Corporation (since 2009); Nanomedical Systems, Inc. (biotechnology company) | ||
| (Chairman since 2008); Yorktown Technologies, LP (tropical fish) (Chairman since 2007); Greater Austin | ||
| Crime Commission (since 2001); Southwest Airlines (since 2000); former Director of the following: | ||
| Introgen (manufacturer of biopharmaceuticals) (until 2008); Hicks Acquisition Company I, Inc. (until | ||
| 2007); Jefferson-Pilot Corporation (diversified life insurance company) (until 2006); and former Advisory | ||
| Director, JP Morgan Chase Bank (formerly Texas Commerce Bank–Austin) (until 2009). | ||
| Deborah C. Jackson, Born: 1952 | 2008 | 49 |
| President, Cambridge College, Cambridge, Massachusetts (since May 2011); Chief Executive Officer, | ||
| American Red Cross of Massachusetts Bay (2002–May 2011); Board of Directors of Eastern Bank | ||
| Corporation (since 2001); Board of Directors of Eastern Bank Charitable Foundation (since 2001); | ||
| Board of Directors of American Student Assistance Corp. (1996–2009); Board of Directors of Boston | ||
| Stock Exchange (2002–2008); Board of Directors of Harvard Pilgrim Healthcare (health benefits | ||
| company) (2007–2011). | ||
| Stanley Martin,2 Born: 1947 | 2008 | 49 |
| Director, The St. Joe Company (real estate development company) (since May 2012); Senior Vice | ||
| President/Audit Executive, Federal Home Loan Mortgage Corporation (2004–2006); Executive Vice | ||
| President/Consultant, HSBC Bank USA (2000–2003); Chief Financial Officer/Executive Vice President, | ||
| Republic New York Corporation & Republic National Bank of New York (1998–2000); Partner, KPMG | ||
| LLP (1971–1998). | ||
| Dr. John A. Moore,2 Born: 1939 | 2005 | 49 |
| President and Chief Executive Officer, Institute for Evaluating Health Risks, (nonprofit institution) | ||
| (1989–2001); Senior Scientist, Sciences International (health research) (2000–2003); Former Assistant | ||
| Administrator & Deputy Administrator, Environmental Protection Agency (1983–1989); Principal, | ||
| Hollyhouse (consulting) (since 2000); Director, CIIT Center for Health Science Research (nonprofit | ||
| research) (until 2007). | ||
| Annual report | Massachusetts Tax-Free Income Fund | 31 |
| Independent Trustees (continued) | ||
| Name, Year of Birth | Trustee | Number of John |
| Position(s) held with Fund | of the | Hancock funds |
| Principal occupation(s) and other | Trust | overseen by |
| directorships during past 5 years | since1 | Trustee |
| Patti McGill Peterson,2 Born: 1943 | 2005 | 49 |
| Presidential Advisor for Global Initiatives, American Council on Education (since 2011); Chairperson | ||
| of the Board of the Trust (during 2009 and 2010); Principal, PMP Globalinc (consulting) (2007–2011); | ||
| Senior Associate, Institute for Higher Education Policy (2007–2011); Executive Director, CIES | ||
| (international education agency) (until 2007); Vice President, Institute of International Education (until | ||
| 2007); Former President Wells College, St. Lawrence University and the Association of Colleges and | ||
| Universities of the State of New York. Director of the following: Mutual Fund Directors Forum (since | ||
| 2011); Niagara Mohawk Power Corporation (until 2003); Security Mutual Life (insurance) (until 1997); | ||
| ONBANK (until 1993). Trustee of the following: Board of Visitors, The University of Wisconsin, Madison | ||
| (since 2007); Ford Foundation, International Fellowships Program (until 2007); UNCF, International | ||
| Development Partnerships (until 2005); Roth Endowment (since 2002); Council for International | ||
| Educational Exchange (since 2003). | ||
| Gregory A. Russo, Born: 1949 | 2008 | 49 |
| Director and Audit Committee Chairman (since May 2012) and Member of Finance and Audit | ||
| Committees of NCH Healthcare System, Inc. (since 2011) (holding company for multi-entity health care | ||
| system); Director and Member of Finance Committee of The Moorings, Inc. (nonprofit continuing care | ||
| community) (since May 2012); Vice Chairman, Risk & Regulatory Matters, KPMG LLP (KPMG) (2002– | ||
| 2006); Vice Chairman, Industrial Markets, KPMG (1998–2002); Chairman and Treasurer, Westchester | ||
| County, New York, Chamber of Commerce (1985–1995); Director, Treasurer and Chairman of Audit | ||
| and Finance Committees, Putnam Hospital Center (1990–2000); Director and Chairman of Fundraising | ||
| Campaign, United Way of Westchester and Putnam Counties, New York (1990–1997). | ||
| Non-Independent Trustees3 | ||
| Name, Year of Birth | Trustee | Number of John |
| Position(s) held with Fund | of the | Hancock funds |
| Principal occupation(s) and other | Trust | overseen by |
| directorships during past 5 years | since1 | Trustee |
| Hugh McHaffie, Born: 1959 | 2010 | 49 |
| Executive Vice President, John Hancock Financial Services (since 2006, including prior positions); | ||
| President of John Hancock Variable Insurance Trust and John Hancock Funds II (since 2009); Trustee, | ||
| John Hancock retail funds (since 2010); Chairman and Director, John Hancock Advisers, LLC, | ||
| John Hancock Investment Management Services, LLC and John Hancock Funds, LLC (since 2010). | ||
| John G. Vrysen, Born: 1955 | 2009 | 49 |
| Senior Vice President, John Hancock Financial Services (since 2006); Director, Executive Vice President | ||
| and Chief Operating Officer, John Hancock Advisers, LLC, John Hancock Investment Management | ||
| Services, LLC and John Hancock Funds, LLC (since 2005); Chief Operating Officer, John Hancock | ||
| Funds II and John Hancock Variable Insurance Trust (since 2007); Chief Operating Officer, John Hancock | ||
| retail funds (until 2009); Trustee, John Hancock retail funds (since 2009). | ||
| 32 | Massachusetts Tax-Free Income Fund | Annual report |
| Principal officers who are not Trustees | |
| Name, Year of Birth | Officer |
| Position(s) held with Fund | of the |
| Principal occupation(s) and other | Trust |
| directorships during past 5 years | since |
| Keith F. Hartstein, Born: 1956 | 2005 |
| President and Chief Executive Officer | |
| Senior Vice President, John Hancock Financial Services (since 2004); Director, President and Chief | |
| Executive Officer, John Hancock Advisers, LLC and John Hancock Funds, LLC (since 2005); Director, | |
| John Hancock Asset Management a division of Manulife Asset Management (US) LLC (since 2005); | |
| Director, John Hancock Investment Management Services, LLC (since 2006); President and Chief | |
| Executive Officer, John Hancock retail funds (since 2005); Member, Investment Company Institute Sales | |
| Force Marketing Committee (since 2003). | |
| Andrew G. Arnott, Born: 1971 | 2009 |
| Senior Vice President and Chief Operating Officer | |
| Senior Vice President, John Hancock Financial Services (since 2009); Executive Vice President, | |
| John Hancock Advisers, LLC (since 2005); Executive Vice President, John Hancock Investment | |
| Management Services, LLC (since 2006); Executive Vice President, John Hancock Funds, LLC (since | |
| 2004); Chief Operating Officer, John Hancock retail funds (since 2009); Senior Vice President, | |
| John Hancock retail funds (since 2010); Vice President, John Hancock Funds II and John Hancock | |
| Variable Insurance Trust (since 2006); Senior Vice President, Product Management and Development, | |
| John Hancock Funds, LLC (until 2009). | |
| Thomas M. Kinzler, Born: 1955 | 2006 |
| Secretary and Chief Legal Officer | |
| Vice President, John Hancock Financial Services (since 2006); Secretary and Chief Legal Counsel, | |
| John Hancock Advisers, LLC, John Hancock Investment Management Services, LLC and John Hancock | |
| Funds, LLC (since 2007); Secretary and Chief Legal Officer, John Hancock retail funds, John Hancock | |
| Funds II and John Hancock Variable Insurance Trust (since 2006). | |
| Francis V. Knox, Jr., Born: 1947 | 2005 |
| Chief Compliance Officer | |
| Vice President, John Hancock Financial Services (since 2005); Chief Compliance Officer, John Hancock | |
| retail funds, John Hancock Funds II, John Hancock Variable Insurance Trust, John Hancock Advisers, | |
| LLC and John Hancock Investment Management Services, LLC (since 2005); Vice President and Chief | |
| Compliance Officer, John Hancock Asset Management a division of Manulife Asset Management (US) | |
| LLC (2005–2008). | |
| Charles A. Rizzo, Born: 1957 | 2007 |
| Chief Financial Officer | |
| Vice President, John Hancock Financial Services (since 2008); Senior Vice President, John Hancock | |
| Advisers, LLC and John Hancock Investment Management Services, LLC (since 2008); Chief Financial | |
| Officer, John Hancock retail funds, John Hancock Funds II and John Hancock Variable Insurance Trust | |
| (since 2007); Assistant Treasurer, Goldman Sachs Mutual Fund Complex (2005–2007); Vice President, | |
| Goldman Sachs (2005–2007). | |
| Annual report | Massachusetts Tax-Free Income Fund | 33 |
| Principal officers who are not Trustees (continued) | |
| Name, Year of Birth | Officer |
| Position(s) held with Fund | of the |
| Principal occupation(s) and other | Trust |
| directorships during past 5 years | since |
| Salvatore Schiavone, Born: 1965 | 2010 |
| Treasurer | |
| Assistant Vice President, John Hancock Financial Services (since 2007); Vice President, John Hancock | |
| Advisers, LLC and John Hancock Investment Management Services, LLC (since 2007); Treasurer, | |
| John Hancock retail funds (since 2010); Treasurer, John Hancock closed-end funds (since 2009); | |
| Assistant Treasurer, John Hancock Funds II and John Hancock Variable Insurance Trust (since 2010) and | |
| (2007–2009); Assistant Treasurer, John Hancock retail funds (2007–2009); Assistant Treasurer, Fidelity | |
| Group of Funds (2005–2007); Vice President, Fidelity Management Research Company (2005–2007). | |
The business address for all Trustees and Officers is 601 Congress Street, Boston, Massachusetts 02210-2805.
The Statement of Additional Information of the Fund includes additional information about members of the Board of Trustees of the Fund and is available without charge, upon request, by calling 1-800-225-5291.
1 Each Trustee holds office until his or her successor is elected and qualified, or until the Trustee’s death, retirement, resignation or removal.
2 Member of Audit Committee.
3 Because Messrs. McHaffie and Vrysen are senior executives or directors with the Adviser and/or its affiliates, each of them is considered an “interested person,” as defined in the Investment Company Act of 1940, of the Fund.
| 34 | Massachusetts Tax-Free Income Fund | Annual report |
More information
| Trustees | Investment adviser |
| Steven R. Pruchansky, Chairman | John Hancock Advisers, LLC |
| William H. Cunningham | |
| Deborah C. Jackson | Subadviser |
| Stanley Martin* | John Hancock Asset Management a division of |
| Hugh McHaffie† | Manulife Asset Management (US) LLC |
| Dr. John A. Moore,* Vice Chairman | |
| Patti McGill Peterson* | Principal distributor |
| Gregory A. Russo | John Hancock Funds, LLC |
| John G. Vrysen† | |
| Custodian | |
| Officers | State Street Bank and Trust Company |
| Keith F. Hartstein | |
| President and Chief Executive Officer | Transfer agent |
| John Hancock Signature Services, Inc. | |
| Andrew G. Arnott | |
| Senior Vice President and Chief Operating Officer | Legal counsel |
| K&L Gates LLP | |
| Thomas M. Kinzler | |
| Secretary and Chief Legal Officer | Independent registered |
| public accounting firm | |
| Francis V. Knox, Jr. | PricewaterhouseCoopers LLP |
| Chief Compliance Officer | |
| Charles A. Rizzo | |
| Chief Financial Officer | |
| Salvatore Schiavone | |
| Treasurer | |
| *Member of the Audit Committee | |
| †Non-Independent Trustee | |
The Fund’s proxy voting policies and procedures, as well as the Fund’s proxy voting record for the most recent twelve-month period ended June 30, are available free of charge on the Securities and Exchange Commission (SEC) Web site at www.sec.gov or on our Web site.
The Fund’s complete list of portfolio holdings, for the first and third fiscal quarters, is filed with the SEC on Form N-Q. The Fund’s Form N-Q is available on our Web site and the SEC’s Web site, www.sec.gov, and can be reviewed and copied (for a fee) at the SEC’s Public Reference Room in Washington, DC. Call 1-202-551-8090 to receive information on the operation of the SEC’s Public Reference Room.
We make this information on your fund, as well as monthly portfolio holdings, and other fund details available on our Web site at www.jhfunds.com or by calling 1-800-225-5291.
| You can also contact us: | ||
| 1-800-225-5291 | Regular mail: | Express mail: |
| jhfunds.com | John Hancock Signature Services, Inc. | John Hancock Signature Services, Inc. |
| P.O. Box 55913 | Mutual Fund Image Operations | |
| Boston, MA 02205-5913 | 30 Dan Road | |
| Canton, MA 02021 |
| Annual report | Massachusetts Tax-Free Income Fund | 35 |

1-800-225-5291
1-800-554-6713 TDD
1-800-338-8080 EASI-Line
www.jhfunds.com
Now available: electronic delivery
www.jhfunds.com/edelivery
| This report is for the information of the shareholders of John Hancock Massachusetts Tax-Free Income Fund. | 77A 5/12 |
| It is not authorized for distribution to prospective investors unless preceded or accompanied by a prospectus. | 7/12 |
ITEM 2. CODE OF ETHICS.
As of the end of the year, May 31, 2012, the registrant has adopted a code of ethics, as defined in Item 2 of Form N-CSR, that applies to its Chief Executive Officer, Chief Financial Officer and Treasurer (respectively, the principal executive officer, the principal financial officer and the principal accounting officer, the “Covered Officers”). A copy of the code of ethics is filed as an exhibit to this Form N-CSR.
ITEM 3. AUDIT COMMITTEE FINANCIAL EXPERT.
Effective July 25, 2012, Gregory A. Russo is the audit committee financial expert and is “independent”, pursuant to general instructions on Form N-CSR Item 3.
Prior to July 25, 2012, Stanley Martin was the audit committee financial expert and was “independent”, pursuant to general instructions on Form N-CSR Item 3.
ITEM 4. PRINCIPAL ACCOUNTANT FEES AND SERVICES.
(a) Audit Fees
The aggregate fees billed for professional services rendered by the principal accountant for the audits of the registrant’s annual financial statements or services that are normally provided by the accountant in connection with statutory and regulatory filings or engagements amounted to the following for the fiscal years ended May 31, 2012 and 2011. These fees were billed to the registrant and were approved by the registrant’s audit committee.
| Fund | May 31, 2012 | May 31, 2011 | ||
| John Hancock Massachusetts Tax-Free Income Fund | $ | 30,534 | $ | 25,867 |
| John Hancock New York Tax-Free Income Fund | 30,535 | 25,868 | ||
| Total | $ | 61,069 | $ | 51,735 |
(b) Audit-Related Services
Audit-related fees for assurance and related services by the principal accountant are billed to the registrant or to the registrant’s investment adviser (not including any sub-adviser whose role is primarily portfolio management and is subcontracted with or overseen by another investment adviser), and any entity controlling, controlled by, or under common control with the adviser ("control affiliates") that provides ongoing services to the registrant. The nature of the services provided was affiliated service provider internal controls reviews. Amounts billed to the registrant were as follows:
| Fund | May 31, 2012 | May 31, 2011 | ||
| John Hancock Massachusetts Tax-Free Income Fund | $ | 783 | $ | 347 |
| John Hancock New York Tax-Free Income Fund | 783 | 347 | ||
| Total | $ | 1,566 | $ | 694 |
Amounts billed to control affiliates were $96,255 and $91,670 for the fiscal years ended May 31, 2012 and 2011, respectively.
(c) Tax Fees
The aggregate fees billed for professional services rendered by the principal accountant for tax compliance, tax advice and tax planning (“tax fees”) amounted to the following for the fiscal years ended May 31, 2012 and 2011. The nature of the services comprising the tax fees was the review of the registrant’s tax returns and tax distribution requirements. These fees were billed to the registrant and were approved by the registrant’s audit committee.
| Fund | May 31, 2012 | May 31, 2011 | ||
| John Hancock Massachusetts Tax-Free Income Fund | $ | 2,856 | $ | 2,720 |
| John Hancock New York Tax-Free Income Fund | 2,856 | 2,720 | ||
| Total | $ | 5,712 | $ | 5,440 |
(d) All Other Fees
Other fees billed for professional services rendered by the principal accountant to the registrant or to the control affiliates for the fiscal years ended May 31, 2012 and 2011 amounted to the following:
| Fund | May 31, 2012 | May 31, 2011 | ||
| John Hancock Massachusetts Tax-Free Income Fund | $ | 199 | $ | 182 |
| John Hancock New York Tax-Free Income Fund | 200 | 182 | ||
| Total | $ | 399 | $ | 364 |
(e)(1) Audit Committee Pre-Approval Policies and Procedures:
The trust’s Audit Committee must pre-approve all audit and non-audit services provided by the independent registered public accounting firm (the “Auditor”) relating to the operations or financial reporting of the funds. Prior to the commencement of any audit or non-audit services to a fund, the Audit Committee reviews the services to determine whether they are appropriate and permissible under applicable law.
The trust’s Audit Committee has adopted policies and procedures to, among other purposes, provide a framework for the Committee’s consideration of audit-related and non-audit services by the Auditor. The policies and procedures require that any audit-related and non-audit service provided by the Auditor and any non-audit service provided by the Auditor to a fund service provider that relates directly to the operations and financial reporting of a fund are subject to approval by the Audit Committee before such service is provided. Audit-related services provided by the Auditor that are expected to exceed $25,000 per year/per fund are subject to specific pre-approval by the Audit Committee. Tax services provided by the Auditor that are expected to exceed $30,000 per year/per fund are subject to specific pre-approval by the Audit Committee.
All audit services, as well as the audit-related and non-audit services that are expected to exceed the amounts stated above, must be approved in advance of provision of the service by formal resolution of the Audit Committee. At the regularly scheduled Audit Committee meetings, the Committee reviews a report summarizing the services, including fees, provided by the Auditor.
(e)(2) Services approved pursuant to paragraph (c)(7)(i)(C) of Rule 2-01 of Regulation S-X:
Audit-Related Fees, Tax Fees and All Other Fees:
There were no amounts that were approved by the Audit Committee pursuant to the de minimis exception under Rule 2-01 of Regulation S-X.
(f) According to the registrant’s principal accountant for the fiscal year ended May 31, 2012, the percentage of hours spent on the audit of the registrant's financial statements for the most recent fiscal year that were attributed to work performed by persons who were not full-time, permanent employees of principal accountant was less than 50%.
(g) The aggregate non-audit fees billed by the registrant’s principal accountant for non-audit services rendered to the registrant and rendered to the registrant's control affiliates for the fiscal years ended May 31, 2012 and 2011 amounted to the following:
| Trust | May 31, 2012 | May 31, 2011 | ||
| John Hancock Tax-Exempt Series Fund | $ | 3,337,357 | $ | 1,914,584 |
(h) The audit committee of the registrant has considered the non-audit services provided by the registrant’s principal accountant to the control affiliates and has determined that the services that were not pre-approved are compatible with maintaining the principal accountant’s independence.
ITEM 5. AUDIT COMMITTEE OF LISTED REGISTRANTS.
The registrant has a separately-designated standing audit committee comprised of independent trustees. Effective July 25, 2012, the members of the audit committee are as follows:
Gregory A. Russo - Chairman
Dr. John A. Moore
Steven R. Pruchansky
Prior to July 25, 2012, the members of the audit committee were as follows:
Stanley Martin - Chairman
Dr. John A. Moore
Patti McGill Peterson
ITEM 6. SCHEDULE OF INVESTMENTS.
(a) Not applicable.
(b) Not applicable.
ITEM 7. DISCLOSURE OF PROXY VOTING POLICIES AND PROCEDURES FOR CLOSED-END MANAGEMENT INVESTMENT COMPANIES.
Not applicable.
ITEM 8. PORTFOLIO MANAGERS OF CLOSED-END MANAGEMENT INVESTMENT COMPANIES.
Not applicable.
ITEM 9. PURCHASES OF EQUITY SECURITIES BY CLOSED-END MANAGEMENT INVESTMENT COMPANY AND AFFILIATED PURCHASERS.
Not applicable.
ITEM 10. SUBMISSION OF MATTERS TO A VOTE OF SECURITY HOLDERS.
The registrant has adopted procedures by which shareholders may recommend nominees to the registrant's Board of Trustees. A copy of the procedures is filed as an exhibit to this Form N-CSR. See attached “John Hancock Funds – Nominating, Governance and Administration Committee Charter”.
ITEM 11. CONTROLS AND PROCEDURES.
(a) Based upon their evaluation of the registrant's disclosure controls and procedures as conducted within 90 days of the filing date of this Form N-CSR, the registrant's principal executive officer and principal financial officer have concluded that those disclosure controls and procedures provide reasonable assurance that the material information required to be disclosed by the registrant on this report is recorded, processed, summarized and reported within the time periods specified in the Securities and Exchange Commission's rules and forms.
(b) There were no changes in the registrant's internal control over financial reporting that occurred during the registrant's most recent fiscal half-year (the registrant's second fiscal half-year in the case of an annual report) that have materially affected, or are reasonably likely to materially affect, the registrant's internal control over financial reporting.
ITEM 12. EXHIBITS.
(a)(1) Code of Ethics for Covered Officers is attached.
(a)(2) Separate certifications for the registrant's principal executive officer and principal financial officer, as required by Section 302 of the Sarbanes-Oxley Act of 2002 and Rule 30a-2(a) under the Investment Company Act of 1940, are attached.
(b)(1) Separate certifications for the registrant's principal executive officer and principal financial officer, as required by 18 U.S.C. Section 1350, as adopted pursuant to Section 906 of the Sarbanes-Oxley Act of 2002, and Rule 30a-2(b) under the Investment Company Act of 1940, are attached. The certifications furnished pursuant to this paragraph are not deemed to be "filed" for purposes of Section 18 of the Securities Exchange Act of 1934, or otherwise subject to the liability of that section. Such certifications are not deemed to be incorporated by reference into any filing under the Securities Act of 1933 or the Securities Exchange Act of 1934, except to the extent that the Registrant specifically incorporates them by reference.
(c)(1) Submission of Matters to a Vote of Security Holders is attached. See attached “John Hancock Funds – Nominating, Governance and Administration Committee Charter”.
(c)(2) Contact person at the registrant.
| SIGNATURES |
Pursuant to the requirements of the Securities Exchange Act of 1934 and the Investment Company Act of 1940, the registrant has duly caused this report to be signed on its behalf by the undersigned, thereunto duly authorized.
John Hancock Tax-Exempt Series Fund
| By: | /s/ Keith F. Hartstein |
| ------------------------------ | |
| Keith F. Hartstein | |
| President and | |
| Chief Executive Officer | |
| Date: | July 23, 2012 |
Pursuant to the requirements of the Securities Exchange Act of 1934 and the Investment Company Act of 1940, this report has been signed below by the following persons on behalf of the registrant and in the capacities and on the dates indicated.
| By: | /s/ Keith F. Hartstein |
| ------------------------------- | |
| Keith F. Hartstein | |
| President and | |
| Chief Executive Officer | |
| Date: | July 23, 2012 |
| By: | /s/ Charles A. Rizzo |
| -------------------------------- | |
| Charles A. Rizzo | |
| Chief Financial Officer | |
| Date: | July 23, 2012 |