UNITED STATES
SECURITIES AND EXCHANGE COMMISSION
Washington, D.C. 20549
FORM N-CSR
Certified Shareholder Report of
Registered Management Investment Companies
Investment Company Act File Number: 811-05085
Capital Income Builder
(Exact Name of Registrant as Specified in Charter)
333 South Hope Street
Los Angeles, California 90071
(Address of Principal Executive Offices)
Registrant's telephone number, including area code: (213) 486-9200
Date of fiscal year end: October 31
Date of reporting period: October 31, 2016
Michael W. Stockton
Capital Income Builder
333 South Hope Street
Los Angeles, California 90071
(Name and Address of Agent for Service)
ITEM 1 – Reports to Stockholders

New frontiers in the
dividend universe
Special feature page 6
 | Capital Income Builder® Annual report
for the year ended
October 31, 2016 |
Capital Income Builder seeks to provide you with a level of current income that exceeds the average yield on U.S. stocks generally and to provide you with a growing stream of income over the years. The fund’s secondary objective is to provide you with growth of capital.
This fund is one of more than 40 offered by one of the nation’s largest mutual fund families, American Funds, from Capital Group. For 85 years, Capital has invested with a long-term focus based on thorough research and attention to risk.
Fund results shown in this report, unless otherwise indicated, are for Class A shares at net asset value. If a sales charge (maximum 5.75%) had been deducted, the results would have been lower. Results are for past periods and are not predictive of results for future periods. Current and future results may be lower or higher than those shown. Share prices and returns will vary, so investors may lose money. Investing for short periods makes losses more likely. Investments are not FDIC-insured, nor are they deposits of or guaranteed by a bank or any other entity, so they may lose value. For current information and month-end results, visit americanfunds.com.
Here are the average annual total returns on a $1,000 investment with all distributions reinvested for periods ended September 30, 2016 (the most recent calendar quarter-end):
| Class A shares | | 1 year | | 5 years | | 10 years |
| | | | | | | |
| Reflecting 5.75% maximum sales charge | | 4.68% | | 7.64% | | 4.34% |
For other share class results, visit americanfunds.com and americanfundsretirement.com.
The total annual fund operating expense ratio is 0.60% for Class A shares as of the prospectus dated January 1, 2017 (unaudited).
Investment results assume all distributions are reinvested and reflect applicable fees and expenses. When applicable, investment results reflect fee waivers, without which results would have been lower. Visit americanfunds.com for more information.
The fund’s 30-day yield for Class A shares as of November 30, 2016, reflecting the 5.75% maximum sales charge and calculated in accordance with the U.S. Securities and Exchange Commission formula, was 3.11%.
The return of principal for bond funds and for funds with significant underlying bond holdings is not guaranteed. Fund shares are subject to the same interest rate, inflation and credit risks associated with the underlying bond holdings. Investing outside the United States may be subject to additional risks, such as currency fluctuations, periods of illiquidity and price volatility. These risks may be heightened in connection with investments in developing countries. Refer to the fund prospectus and the Risk Factors section of this report for more information on these and other risks associated with investing in the fund.

Fellow investors:
Equity markets rose over Capital Income Builder’s fiscal year. In a volatile period, stocks fell in early 2016 amid anxieties about sluggish global economic growth and lower oil prices; however, equities rebounded as commodity prices recovered and U.S. economic data brightened. The more defensive, higher dividend-paying sectors rose in the U.S. but generated mixed returns elsewhere. For the 12 months ended October 31, 2016, the fund achieved a total return of 2.74%, with all dividends reinvested. By way of comparison, the MSCI ACWI (All Country World Index), a measure of returns for stock markets in 46 countries, rose 2.05%. Meanwhile, Bloomberg Barclays U.S. Aggregate Index, a broad measure of U.S. fixed income markets, returned 4.37%. The fund’s peer group, as measured by the Lipper Global Equity Income Funds Average, gained 1.83% for the period.
Dividend income
The fund paid regular dividends of 50 cents per share in December 2015 and in March, June and September of 2016. In addition, a special dividend of 2 cents per share was paid in December. The fund strives to grow its dividend and provide a special dividend each fiscal year, though its ability to do so is dependent on market conditions, including the impact of foreign currency movements. Prudence guides distribution decisions, as the fund strives to grow income while carefully managing risk. Capital Income Builder recorded a 12-month yield of 3.51% as of October 31, 2016, greater than that of the Lipper Global Equity Income Funds Average (2.91%), MSCI ACWI (2.59%),
Results at a glance
For periods ended October 31, 2016, with all distributions reinvested
| | | Cumulative | | | | | | | | | |
| | | total returns | | Average annual total returns |
| | | | | | | | | Lifetime |
| | | 1 year | | 5 years | | 10 years | | (since 7/30/87) |
| | | | | | | | | | | | | | | | | |
| Capital Income Builder (Class A shares) | | | 2.74 | % | | | 7.28 | % | | | 4.40 | % | | | 9.19 | % |
| MSCI ACWI (All Country World Index)1,2 | | | 2.05 | | | | 8.03 | | | | 3.78 | | | | 6.58 | |
| Bloomberg Barclays U.S. Aggregate Index2 | | | 4.37 | | | | 2.90 | | | | 4.64 | | | | 6.59 | |
| 70%/30% MSCI ACWI/Bloomberg Barclays Index1,2,3 | | | 2.87 | | | | 6.62 | | | | 4.36 | | | | 6.87 | |
| Lipper Global Equity Income Funds Average4 | | | 1.83 | | | | 6.71 | | | | 2.90 | | | | — | |
| 1 | From July 30, 1987, through December 31, 1987, the MSCI World Index was used because the MSCI ACWI did not exist. MSCI World Index results reflect dividends net of withholding taxes, and MSCI ACWI results reflect dividends gross of withholding taxes through December 31, 2000, and dividends net of withholding taxes thereafter. |
| 2 | The market indexes are unmanaged and, therefore, have no expenses. Investors cannot invest directly in an index. Sources: MSCI, Bloomberg Index Services Ltd., Thomson Reuters Lipper. |
| 3 | The 70%/30% MSCI ACWI/Bloomberg Barclays Index blends the MSCI ACWI with the Bloomberg Barclays U.S. Aggregate Index by weighting their total returns at 70% and 30%, respectively. Results assume the blend is rebalanced monthly. |
| 4 | Lipper averages reflect the current composition of all eligible mutual funds (all share classes) within a given category. |
Largest equity holdings
October 31, 2016
| | | Percent of |
| Company | | | net assets |
| Philip Morris International | | | 3.6 | % |
| Verizon Communications | | | 2.6 | |
| Altria | | | 2.2 | |
| AbbVie | | | 1.9 | |
| National Grid | | | 1.8 | |
| Coca-Cola | | | 1.7 | |
| Royal Dutch Shell | | | 1.6 | |
| Amgen | | | 1.6 | |
| SSE | | | 1.5 | |
| Imperial Brands | | | 1.5 | |
Bloomberg Barclays U.S. Aggregate Index (2.12%) and the S&P 500 (2.12%).
The current environment
Global equity markets declined early in the period amid lower prices for oil and other commodities, as well as worries about the pace of global economic growth. Stocks recovered over 2016 on the back of an uptick in commodity prices, solid U.S. economic growth and fresh stimulus measures in China.
More defensive, high-dividend-paying sectors generally advanced. Globally, utilities and consumer staples stocks rose 6% and 4%, respectively, in the MSCI All Country World Index, while telecommunication services stocks remained essentially flat. Defensive sectors in the U.S. rallied sharply, benefiting from periodic flights to safety and investors’ demand for yield in a low interest rate environment; however, utilities and telecommunication services stocks gave up some of their gains late in the period amid concerns about the potential impact of higher U.S. interest rates on high-dividend-paying stocks.
The U.S. was among the top-returning developed markets, as data showed economic growth there continued to meaningfully outpace the rest of the world.
European equities lagged their U.S. counterparts, hurt by weak economic data and deflationary pressures. Meanwhile, a strong yen and a sluggish economy hurt Japanese stocks, which fell in local currency terms but rose in U.S. dollars.
In the U.S. bond market, investment-grade credit and long-dated Treasuries

generated among the strongest returns. After hiking rates in December, the Federal Reserve struck a cautious tone early in the year, but expressed increased confidence in the U.S. economy as 2016 drew to a close.
A look at the portfolio
As of October 31, consumer staples was the single biggest sector among the fund’s equity holdings, comprising 14.2% of total assets. Utilities followed at 10.3%. Investments in U.S. equities represented 42.3% of the fund’s overall holdings, while non-U.S. equities made up 37.4%.
In share-price terms, four of the fund’s 10 largest holdings registered positive returns over the period, as investors were drawn to dividend-paying companies outside the health care sector. Tobacco firms Philip Morris International and Altria benefited from their defensive nature and from speculation about mergers-and-acquisitions activity in the tobacco sector. Telecommunication services firm Verizon and soft drink giant Coca-Cola also were supported by strong demand for equity income. In contrast, U.S.-based investors in several U.K.-headquartered firms, such as utilities SSE and National Grid and tobacco firm Imperial Brands, were hurt by the sharp decline in the British pound against the U.S. dollar over the period. Royal Dutch Shell fell amid concerns about the outlook for oil prices. Drug makers Amgen and AbbVie declined due to worries about price pressures in the U.S. market.
Overall, the fund’s fixed income investments produced positive returns. Holdings consist primarily of government and corporate securities. In addition to generating income, this portion of Capital Income Builder’s portfolio seeks to provide stability during volatile markets.
The road ahead
The global economy is poised for slow growth. The U.S. economy will likely continue to grow at a moderate pace, although much political uncertainty exists following the presidential election. In Europe, growth should remain sluggish and markets could experience volatility due to Brexit fallout and other political developments. In a low bond yield environment, the fund holds a historically greater-than-average position in equities, while using bonds more for the stability they provide.
We believe that U.S. interest rates will likely slowly rise over time but at a moderate pace. Rate increases can hurt

Capital Income Builder and Lipper Global Equity Income Funds Average numbers calculated by Lipper. MSCI ACWI numbers calculated by RIMES. Until September 30, 1998, yield data for the Lipper Global Equity Income Funds Average reflects the average yield of the fund and only two other funds.
The value of a long-term perspective
| 1 | As outlined in the prospectus, the sales charge is reduced for accounts (and aggregated investments) of $25,000 or more and is eliminated for purchases of $1 million or more. There is no sales charge on dividends or capital gain distributions that are reinvested in additional shares. |
| 2 | The market index is unmanaged and, therefore, has no expenses. Investors cannot invest directly in an index. |
| 3 | The 70%/30% MSCI ACWI/Bloomberg Barclays Index blends the MSCI ACWI (All Country World Index) with the Bloomberg Barclays U.S. Aggregate Index by weighting their total returns at 70% and 30%, respectively. Results assume the blend is rebalanced monthly. |
certain dividend-paying stocks, but would also allow the fund to potentially generate more income from bonds than it has in recent years. At the same time, valuations for certain higher yielding stocks in the U.S. have become stretched due to high investor demand for yield in a low-rate environment. Given these historically high valuations, managers are using fundamental research to assess whether a company’s high price-to-earnings multiple is truly reflective of the company’s growth prospects.
Managers are targeting companies that offer somewhat lower yields but higher growth potential; many of these companies are in industries that have not generally been high-yielding, such as information technology and biotechnology (to learn more, please read the accompanying feature in this report). In addition to helping fulfill the fund’s objective of providing income growth, these nontraditional “dividend growers” tend to be less interest rate sensitive and can offer some opportunities for price appreciation. Managers also are finding some attractive opportunities in the energy sector and some appealing valuations outside the U.S. We thank you for investing in Capital Income Builder, and we look forward to reporting to you again in six months.
Cordially,

James B. Lovelace
Vice Chairman of the Board

Joyce E. Gordon
President
December 8, 2016
For current information about the fund, visit americanfunds.com.
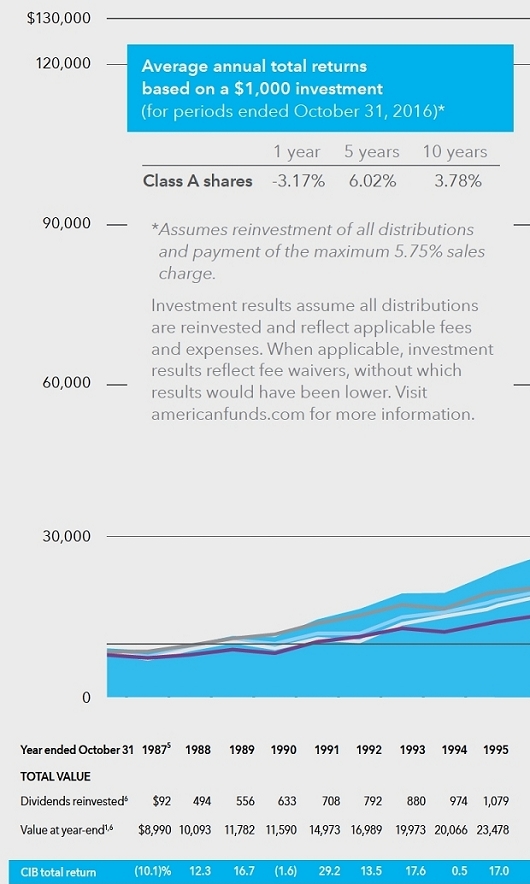
How a $10,000 investment has grown over the fund’s lifetime
Fund results shown are for Class A shares and reflect deduction of the maximum sales charge of 5.75% on the $10,000 investment.1 Thus, the net amount invested was $9,425. Results are for past periods and are not predictive of results for future periods. Current and future results may be lower or higher than those shown. Share prices and returns will vary, so investors may lose money.
For current information and month-end results, visit americanfunds.com.

| 4 | From July 30, 1987, through December 31, 1987, the MSCI World Index was used because the MSCI ACWI (All Country World Index) did not exist. MSCI World Index results reflect dividends net of withholding taxes, and MSCI ACWI results reflect dividends gross of withholding taxes through December 31, 2000, and dividends net of withholding taxes thereafter. |
| 5 | For the period July 30, 1987, commencement of operations, through October 31, 1987. |
| 6 | Prior to January 1, 2009, dividends from net investment income were declared daily and paid to shareholders quarterly. As of January 1, 2009, the fund began declaring and distributing dividends on a periodic basis. Dividends reinvested reflect quarterly dividends actually paid during the period, while year-end values are adjusted for cumulative dividends accrued but not yet paid. |
| | |
| | The results shown are before taxes on fund distributions and sale of fund shares. |
New frontiers in the dividend universe


Companies that are growing dividends tend to be stronger-than-average companies that have more cash on the balance sheet.
JOYCE GORDON
When investors think about dividend investing, their thoughts may first turn to historically higher yielding but low-growth industries like utilities. However, the universe of dividend-paying stocks is broader and more diverse than this impression indicates. More companies outside higher yielding industries — such as information technology and biotechnology — have embraced dividends in recent years.
These newcomers have initiated dividends as they have become more mature businesses, and in response to shareholder demand for income in a low bond-yield environment. Investment analysts and portfolio managers at Capital Group broach the topic of dividends often in meetings with management, according to portfolio manager Jim Lovelace.
“We make the pitch to companies that they should consider returning a healthy portion of profits to shareholders rather than simply trying to grow their revenues through acquisitions, which sometimes result in just making the company larger, not necessarily more profitable,” says Jim.
In pursuing its objective of providing current income and growth of income, Capital Income Builder (CIB) invests in a mix of companies on the dividend-paying spectrum. The fund invests heavily in the traditional high-dividend-paying sectors that yield more than the overall market. But the fund also targets relatively lower yielding companies with the potential to meaningfully grow dividends over time.
“CIB’s objective is delivering current income higher than that of the market and growing income at a rate faster than that of inflation,” says portfolio manager Darcy Kopcho. “And some of the higher yielding equities don’t grow; so they do meet that objective of paying out high current income but they don’t grow that income. And so we really need a mix in CIB of lower yielding stocks with higher growth, and higher yielding stocks with lower growth.”
Targeting dividend-growing stocks, such as the dividend newcomers in the information technology and biotech industries, is important for CIB. These “dividend growers” have tended to be less volatile than the market as a whole, adding stability to the fund.
“Companies that are growing dividends tend to be stronger-than-average companies that have more cash on the balance sheet,” says portfolio manager Joyce Gordon. “So they tend to weather the storm a little better than companies that are extremely leveraged.”
Additionally, “in this low interest rate environment, everyone is looking for good yield,” she says. “So finding a dividend-growing company that has not yet been discovered by the market can be an opportunity for price appreciation, as well as growing dividends.”
Tech turns to dividends
Information technology firms traditionally have been averse to paying dividends, believing that to do so would communicate that they were not confident about future growth prospects.
However, the environment for information technology companies has changed significantly since the 1980s and 1990s, when the use of the PC and the internet grew rapidly. Now that both areas of technology have penetrated most markets, many decades-old IT firms are not reinvesting as much of their profits back into the business or making as many acquisitions — leaving more cash to return to shareholders.
“Years ago, these companies were in the early stages of building out their business models, a process that is very expensive and requires a lot of cash,” Darcy says. “As more mature companies, they now generate more free cash flow than they did in the early years of their formation. At the same time, shareholders — including those of us at Capital — have been persistent in asking managements to think about total return in the form of dividends instead of share repurchases.”
Some ill-timed share repurchases during the dot-com era taught IT companies the value of returning cash to shareholders versus buying back stock, she explains. “I think many IT companies now have a better understanding that cash paid out is a sure thing for shareholders — versus share repurchases, which may or may not add value.”
Microsoft comes around
Microsoft is one IT company that has embraced dividends. The company began paying a modest regular dividend in 2004, but began increasing it substantially in the past several years. As Microsoft matured, its growth slowed, causing it to consider paying more in dividends, relates equity investment analyst Cheryl Frank.

We make the pitch to companies that they should consider returning a healthy portion of profits to shareholders rather than simply trying to grow their revenues through acquisitions.
JIM LOVELACE
“They were generating so much cash flow, which they weren’t able to fully utilize,” she says. “And so it made sense for them to pay a dividend. They are committed to growing that dividend over time.”
Cheryl adds that Microsoft’s recent successes leave it well positioned to remain capable of growing its dividend over time. In the last few years, the company has strengthened its focus on its enterprise business segment, especially in the area of cloud computing, in which businesses store information over the internet rather than on computer hard drives or local servers. Microsoft’s cloud computing platform benefits from the company’s global footprint of servers and the integration of its Office suite. Moreover, Microsoft has been able to generate more revenue from flagship products like the Xbox gaming system and Office suite by adopting subscription-based business models.
Semiconductors enter dividends
Another industry that has embraced dividends in recent years is semiconductor companies such as Intel and Texas Instruments. Twenty to 30 years ago, the companies felt that paying a dividend would signal to the market and to potential employees that they would not grow rapidly. However, over the last 20 years, as PC sales (and prices) continued to slump and the smartphone market has become more saturated, the companies came to understand that they were more mature businesses, says equity investment analyst Isaac Sudit.
“The companies began to realize that growth prospects were diminished. We saw this coming, and we engaged with managements, trying to point out to them

Results are based on the weighted average of total returns in USD (with gross dividends reinvested) of a global universe of companies for the period December 31, 1989, to December 31, 2015. The Global Universe consisted of the 1,000 largest companies in the MSCI IMI indexes for North America (50% weight), Europe (25%), Japan (10%) and the 500 largest companies for emerging markets (10%) and Pacific ex Japan (5%) starting in January 2005 (company-level data were not available prior to 2005). For the period December 1989 to December 2004, the global universe consisted of the 1,000 largest companies in the S&P Global BMI indexes for North America, Europe and Japan and the 500 largest companies for emerging markets and Pacific ex Japan (with the same geographic weighting). The universe constituents were updated and rebalanced quarterly. A company was classified as a “dividend payer” if it paid a dividend during the previous 12 months. A company was classified as a “dividend grower” (a subset of payers) if its trailing 12-month dividend per share increased relative to one year earlier. Volatility reflects annualized standard deviation of monthly total returns. Past results are not predictive of results in future periods. Sources: FactSet, Compustat, Worldscope, MSCI, Capital Group.

that if there was ever a time to start paying dividends, it was now — and if not, that time was coming,” he says.
A similar story played out at Qualcomm, which licenses technology to smartphone makers to power cellular communication. After the company’s shares began declining amid fears that the global smartphone market was becoming saturated, the company realized that paying a dividend was a way to support the stock.
“Management realized that paying a dividend was one way to communicate confidence in their business to the market,” Isaac says.
Although semiconductor companies like Texas Instruments and Intel are mature and not experiencing the meteoric growth they did during the PC boom, the semiconductor industry still has a lot of growth potential. For example, cloud computing providers like Amazon and Google have built huge data centers to house hundreds of servers — many of which are run using Intel microprocessors. Isaac believes that the market had not fully appreciated the growth potential in Intel’s data center business.
“This was an emerging business for Intel,” notes Isaac. “Because the market was so fixated on slowing PC sales, it did not realize that the data center business was going to be as large a piece of business as PCs for the company.”
In addition to cloud computing, semiconductor growth also should be supported by the integration of technology into more products, such as cars, wearable technology, and “smart” homes and appliances.
Another semiconductor company in which CIB is invested, Taiwan Semiconductor Manufacturing Company (TSMC), has taken advantage of a transformation in its industry over the last 20 years. Semiconductor companies used to both design and manufacture chips. However, the high cost of building state-of-the-art manufacturing plants makes it uneconomical for many firms to do both. As a result, most chip designers outsource manufacturing to independent foundries like TSMC, which has become a manufacturing powerhouse.
That success has fueled dividend growth at the company, explains equity investment analyst Irfan Furniturewala.
“Taiwan Semiconductor has a strong shareholder focus,” says Irfan. “Capital allocation is a strength of this company. So the company wants to make sure it invests enough into the business to serve customers but at the same time it recognizes the need to provide an income stream back to shareholders.”
U.S. semiconductor firm Xilinx has also capitalized on the evolution of its industry. As semiconductors have steadily advanced, the cost of designing a chip from scratch has risen. This has made prototyping chips for devices more expensive for electronics and industrial companies. That’s where Xilinx comes in. Xilinx makes programmable logic devices, which are essentially “do-it-yourself” kits containing semiconductors and software that electronics and industrial companies can use to design and program a prototype chip for testing in their devices — at much lower cost than if they had designed the chips from scratch.
The company enjoys healthy operating margins and benefits from a lack of competition and large barriers to

Shareholders — including those of us at Capital — have been persistent in asking managements to think about total return in the form of dividends instead of share repurchases.
DARCY KOPCHO
entry — factors that give Irfan confidence that the company should be able to sustain and potentially grow its dividend.
Capturing growth opportunities
In addition to targeting newcomers to the dividend-paying universe, CIB also is seeking to identify long-standing dividend payers that could be positioned for growth based on breakthrough products. These include pharmaceutical firms that are working to develop cutting-edge blockbuster drugs. In recent years, drug companies have made important advances in such treatments as immunotherapy, which harnesses the patient’s own immune system to fight diseases like rheumatoid arthritis and cancer. Drug companies are also continuing to develop cancer therapies that target specific cancer-related mutations or that alter the micro-environment surrounding tumors.
“The exciting thing about the bio-pharmaceutical industry is that we are seeing a renaissance in R&D that is driving new scientific discoveries and eventually new drugs in areas like oncology and inflammation,” notes equity investment analyst Skye Drynan. “These are such large markets that they can be massive needle-movers even for very large companies.”
Investing in dividend-paying drug companies can be a prudent way to seek to capitalize on potential blockbuster treatments, according to Darcy. That’s because shareholders can capture a dividend as they wait to see whether the experimental drugs are successful.
“That’s a much different approach than buying a biotech company that doesn’t generate revenue — and therefore pays no dividend — in the hope that their trials will succeed,” Darcy says.
Although large pharmaceutical companies have long paid dividends, biotechnology firms historically have not. However, a few have initiated dividends as their business models have matured, adds Jim. “These biotech companies seem to be emerging out of their high-growth, high-reinvestment phase to more of a cash-generative phase,” he says.
For biotech firm Amgen, shareholder demand and changes in its business encouraged the company to initiate a dividend in 2011, notes equity investment analyst Craig Gordon. The company has grown it significantly since then.
“There was a change in how management thought about the business — not that

Source: FactSet. As of September 30, 2016.

The New Geography of Investing®
Where a company does business can be more important than where it’s located. Here’s a look at Capital Income Builder’s portfolio through the revenue lens. The charts below show the countries and regions in which the fund’s equity investments are located, and where the revenue comes from.
Capital Income Builder Geographic Exposure
Equity portion breakdown by domicile (%)

| | Region | | Fund |
| ■ | United States | | | 53 | % |
| ■ | Canada | | | 5 | |
| ■ | Europe | | | 33 | |
| ■ | Japan | | | 1 | |
| ■ | Asia-Pacific ex. Japan | | | 5 | |
| ■ | Emerging markets | | | 3 | |
| | Total | | | 100 | % |
Equity portion breakdown by revenue (%)

| | Region | | Fund |
| ■ | United States | | | 43 | % |
| ■ | Canada | | | 5 | |
| ■ | Europe | | | 24 | |
| ■ | Japan | | | 3 | |
| ■ | Asia-Pacific ex. Japan | | | 5 | |
| ■ | Emerging markets | | | 20 | |
| | Total | | | 100 | % |
Source: Capital Group (as of October 31, 2016).
they wouldn’t grow, but they are just a different company now,” Craig says. “They also recognized that they need to be competitive with their peer groups, who are paying dividends.”
Several factors contributed to the company’s paying a dividend, he explains. Amgen’s base business has become more durable due to pricing power and lack of competition, and the company has become leaner by cutting expenses. These changes have generated cash that can be used for dividends, he says. In addition, the company has a robust drug pipeline and has built out a global sales organization to market its treatments.
Looking for undiscovered companies
From IT companies to pharmaceutical firms, CIB is seeking out companies that have the willingness and the wherewithal to increase dividends over time. Both factors — capacity and commitment — are key ingredients in the fund’s active approach to income investing. Investment analysts and portfolio managers seek to identify companies that meet both criteria based on fundamental research and conversations with management.
“Sometimes these companies have not yet been discovered by the market,” Joyce says. “So if we can find companies that are poised to grow their dividends, and we invest in them early on in that process, these companies can be a really good deal for shareholders — providing a rising stream of income, along with price appreciation potential.” ■
Summary investment portfolio October 31, 2016
| Industry sector diversification | Percent of net assets |

| Country diversification by domicile | | Percent of
net assets |
| United States | | | 57.71 | % |
| United Kingdom | | | 14.96 | |
| Euro zone* | | | 7.62 | |
| Canada | | | 4.45 | |
| Switzerland | | | 2.90 | |
| Hong Kong | | | 1.79 | |
| Singapore | | | 1.45 | |
| Taiwan | | | 1.14 | |
| Japan | | | 1.12 | |
| Other countries | | | 3.84 | |
| Short-term securities & other assets less liabilities | | | 3.02 | |
| * | Countries using the euro as a common currency; those represented in the fund’s portfolio are Austria, Belgium, Finland, France, Germany, Italy, the Netherlands, Portugal and Spain. |
| Common stocks 79.21% | | Shares | | | Value
(000) | |
| Consumer staples 14.24% | | | | | | | | |
| Philip Morris International Inc. | | | 37,541,798 | | | $ | 3,620,531 | |
| Altria Group, Inc. | | | 32,600,305 | | | | 2,155,532 | |
| Coca-Cola Co. | | | 38,844,000 | | | | 1,646,986 | |
| Imperial Brands PLC | | | 30,790,552 | | | | 1,490,734 | |
| Reynolds American Inc. | | | 21,881,257 | | | | 1,205,220 | |
| British American Tobacco PLC | | | 15,117,376 | | | | 868,100 | |
| Nestlé SA | | | 11,204,110 | | | | 812,384 | |
| Procter & Gamble Co. | | | 8,071,420 | | | | 700,599 | |
| Kraft Heinz Co. | | | 4,803,766 | | | | 427,295 | |
| Other securities | | | | | | | 1,229,878 | |
| | | | | | | | 14,157,259 | |
| | | | | | | | | |
| Utilities 10.10% | | | | | | | | |
| National Grid PLC | | | 137,374,487 | | | | 1,790,759 | |
| SSE PLC1 | | | 78,291,002 | | | | 1,524,626 | |
| Dominion Resources, Inc. | | | 16,051,888 | | | | 1,207,102 | |
| Duke Energy Corp. | | | 10,740,209 | | | | 859,432 | |
| EDP - Energias de Portugal, SA1 | | | 242,838,428 | | | | 802,660 | |
| Southern Co. | | | 13,904,424 | | | | 717,051 | |
| Iberdrola, SA, non-registered shares | | | 94,269,403 | | | | 642,534 | |
| Other securities | | | | | | | 2,489,636 | |
| | | | | | | | 10,033,800 | |
| | | | | | | | | |
| Health care 8.42% | | | | | | | | |
| AbbVie Inc. | | | 34,239,801 | | | | 1,909,896 | |
| Amgen Inc. | | | 10,960,003 | | | | 1,547,114 | |
| GlaxoSmithKline PLC | | | 73,735,109 | | | | 1,460,725 | |
| Novartis AG | | | 18,207,743 | | | | 1,295,362 | |
| AstraZeneca PLC | | | 8,046,600 | | | | 451,874 | |
| AstraZeneca PLC (ADR) | | | 7,895,700 | | | | 223,606 | |
| Pfizer Inc. | | | 17,617,800 | | | | 558,660 | |
| Other securities | | | | | | | 924,651 | |
| | | | | | | | 8,371,888 | |
| | | | | | | | | |
| Telecommunication services 8.24% | | | | | | | | |
| Verizon Communications Inc. | | | 53,783,533 | | | | 2,586,988 | |
| AT&T Inc. | | | 36,458,877 | | | | 1,341,322 | |
| Singapore Telecommunications Ltd. | | | 389,897,631 | | | | 1,087,369 | |
| Vodafone Group PLC | | | 290,091,764 | | | | 798,203 | |
| CenturyLink, Inc. | | | 15,974,978 | | | | 424,615 | |
| Other securities | | | | | | | 1,952,100 | |
| | | | | | | | 8,190,597 | |
| | | Shares | | | Value
(000) | |
| Financials 7.54% | | | | | | | | |
| Sampo Oyj, Class A1 | | | 29,229,310 | | | $ | 1,340,252 | |
| BNP Paribas SA | | | 8,838,249 | | | | 512,664 | |
| Swedbank AB, Class A | | | 17,007,555 | | | | 398,443 | |
| JPMorgan Chase & Co. | | | 5,748,400 | | | | 398,134 | |
| CME Group Inc., Class A | | | 3,910,149 | | | | 391,406 | |
| Other securities | | | | | | | 4,448,396 | |
| | | | | | | | 7,489,295 | |
| | | | | | | | | |
| Energy 7.46% | | | | | | | | |
| Royal Dutch Shell PLC, Class B | | | 44,716,600 | | | | 1,157,605 | |
| Royal Dutch Shell PLC, Class A (GBP denominated) | | | 12,151,795 | | | | 303,202 | |
| Royal Dutch Shell PLC, Class B (ADR) | | | 2,625,000 | | | | 137,314 | |
| Royal Dutch Shell PLC, Class A (ADR) | | | 49,143 | | | | 2,448 | |
| Exxon Mobil Corp. | | | 13,322,600 | | | | 1,110,039 | |
| Chevron Corp. | | | 9,924,600 | | | | 1,039,602 | |
| Suncor Energy Inc. | | | 21,888,518 | | | | 656,835 | |
| BP PLC | | | 74,052,421 | | | | 438,426 | |
| TOTAL SA | | | 8,731,091 | | | | 419,037 | |
| Other securities | | | | | | | 2,154,891 | |
| | | | | | | | 7,419,399 | |
| | | | | | | | | |
| Industrials 6.08% | | | | | | | | |
| Lockheed Martin Corp. | | | 5,172,774 | | | | 1,274,468 | |
| Abertis Infraestructuras, SA, Class A | | | 47,468,263 | | | | 704,765 | |
| General Electric Co. | | | 22,628,400 | | | | 658,486 | |
| Boeing Co. | | | 4,378,046 | | | | 623,565 | |
| Caterpillar Inc. | | | 7,133,200 | | | | 595,337 | |
| Other securities | | | | | | | 2,186,225 | |
| | | | | | | | 6,042,846 | |
| | | | | | | | | |
| Information technology 5.16% | | | | | | | | |
| International Business Machines Corp. | | | 5,433,100 | | | | 835,013 | |
| Taiwan Semiconductor Manufacturing Co., Ltd. | | | 124,132,000 | | | | 741,468 | |
| Intel Corp. | | | 19,863,000 | | | | 692,623 | |
| Texas Instruments Inc. | | | 7,374,400 | | | | 522,476 | |
| Other securities | | | | | | | 2,341,057 | |
| | | | | | | | 5,132,637 | |
| | | | | | | | | |
| Real estate 4.41% | | | | | | | | |
| Crown Castle International Corp. | | | 15,449,405 | | | | 1,405,741 | |
| Other securities | | | | | | | 2,980,558 | |
| | | | | | | | 4,386,299 | |
| | | | | | | | | |
| Consumer discretionary 4.25% | | | | | | | | |
| Las Vegas Sands Corp. | | | 14,858,200 | | | | 859,993 | |
| McDonald’s Corp. | | | 3,746,300 | | | | 421,721 | |
| Other securities | | | | | | | 2,937,317 | |
| | | | | | | | 4,219,031 | |
| | | | | | | | | |
| Materials 1.98% | | | | | | | | |
| Rio Tinto PLC | | | 13,477,000 | | | | 468,400 | |
| Agrium Inc. | | | 4,309,500 | | | | 395,698 | |
| Other securities | | | | | | | 1,103,631 | |
| | | | | | | | 1,967,729 | |
| | | | | | | | | |
| Miscellaneous 1.33% | | | | | | | | |
| Other common stocks in initial period of acquisition | | | | | | | 1,321,269 | |
| | | | | | | | | |
| Total common stocks (cost: $71,701,013,000) | | | | | | | 78,732,049 | |
| | | | | | | | | |
| Preferred securities 0.02% | | | | | | | | |
| Financials 0.02% | | | | | | | | |
| Other securities | | | | | | | 13,520 | |
| | | | | | | | | |
| Total preferred securities (cost: $17,994,000) | | | | | | | 13,520 | |
| Rights & warrants 0.00% | | Shares | | | Value
(000) | |
| Miscellaneous 0.00% | | | | | | |
| Other rights & warrants in initial period of acquisition | | | | | | $ | 247 | |
| | | | | | | | | |
| Total rights & warrants (cost: $218,000) | | | | | | | 247 | |
| | | | | | | | | |
| Convertible stocks 0.48% | | | | | | | | |
| Utilities 0.20% | | | | | | | | |
| Dominion Resources, Inc., convertible preferred, Series A, units | | | 3,968,702 | | | | 199,825 | |
| | | | | | | | | |
| Real estate 0.14% | | | | | | | | |
| Other securities | | | | | | | 135,431 | |
| | | | | | | | | |
| Miscellaneous 0.14% | | | | | | | | |
| Other convertible stocks in initial period of acquisition | | | | | | | 145,234 | |
| | | | | | | | | |
| Total convertible stocks (cost: $457,059,000) | | | | | | | 480,490 | |
| | | | | | | | | |
| Bonds, notes & other debt instruments 17.27% | | Principal amount
(000) | | | | |
| U.S. Treasury bonds & notes 6.81% | | | | | | | | |
| U.S. Treasury 5.49% | | | | | | | | |
| U.S. Treasury 0.75%–8.88% 2016–2046 | | $ | 4,956,575 | | | | 5,451,245 | |
| | | | | | | | | |
| U.S. Treasury inflation-protected securities 1.32% | | | | | | | | |
| U.S. Treasury Inflation-Protected Securities 0.13%–2.38% 2017–20442 | | | 1,244,934 | | | | 1,314,750 | |
| | | | | | | | | |
| Total U.S. Treasury bonds & notes | | | | | | | 6,765,995 | |
| | | | | | | | | |
| Corporate bonds & notes 6.62% | | | | | | | | |
| Energy 1.16% | | | | | | | | |
| Chevron Corp. 2.10%–2.95% 2021–2026 | | | 36,810 | | | | 37,302 | |
| Exxon Mobil Corp. 2.222% 2021 | | | 7,750 | | | | 7,870 | |
| Royal Dutch Shell PLC 1.75%–3.75% 2021–2046 | | | 15,060 | | | | 14,786 | |
| Shell International Finance BV 1.88%–4.00% 2021–2046 | | | 21,380 | | | | 21,314 | |
| Other securities | | | | | | | 1,070,487 | |
| | | | | | | | 1,151,759 | |
| | | | | | | | | |
| Telecommunication services 0.94% | | | | | | | | |
| AT&T Inc. 4.13%–8.25% 2026–20483 | | | 42,962 | | | | 44,822 | |
| Verizon Communications Inc. 1.23%–4.52% 2017–20484 | | | 66,079 | | | | 63,969 | |
| Other securities | | | | | | | 828,672 | |
| | | | | | | | 937,463 | |
| | | | | | | | | |
| Health care 0.92% | | | | | | | | |
| AbbVie Inc. 2.30%–4.45% 2020–2046 | | | 82,530 | | | | 82,929 | |
| Amgen Inc. 1.85%–4.40% 2021–2045 | | | 39,775 | | | | 39,107 | |
| Novartis Securities Investment Ltd. 5.125% 2019 | | | 15,000 | | | | 16,261 | |
| Other securities | | | | | | | 776,779 | |
| | | | | | | | 915,076 | |
| | | | | | | | | |
| Utilities 0.50% | | | | | | | | |
| Dominion Resources, Inc. 4.104% 20215 | | | 12,838 | | | | 13,751 | |
| Virginia Electric and Power Co. 2.95%–3.45% 2022–2024 | | | 9,105 | | | | 9,590 | |
| Other securities | | | | | | | 474,229 | |
| | | | | | | | 497,570 | |
| | | | | | | | | |
| Consumer staples 0.43% | | | | | | | | |
| Altria Group, Inc. 2.63%–9.25% 2019–2046 | | | 34,614 | | | | 36,726 | |
| Coca-Cola Co. 3.30% 2021 | | | 2,000 | | | | 2,143 | |
| Philip Morris International Inc. 1.88%–4.25% 2021–2044 | | | 15,130 | | | | 15,586 | |
| Reynolds American Inc. 2.30%–6.15% 2018–2045 | | | 83,200 | | | | 95,155 | |
| Other securities | | | | | | | 276,973 | |
| | | | | | | | 426,583 | |
| | | Principal amount
(000) | | | Value
(000) | |
| Industrials 0.33% | | | | | | | | |
| Lockheed Martin Corp. 1.85%–4.70% 2018–2046 | | $ | 32,305 | | | $ | 34,582 | |
| Other securities | | | | | | | 297,333 | |
| | | | | | | | 331,915 | |
| | | | | | | | | |
| Real estate 0.30% | | | | | | | | |
| Crown Castle International Corp. 2.25%–4.88% 2021–2022 | | | 8,050 | | | | 8,027 | |
| Other securities | | | | | | | 286,516 | |
| | | | | | | | 294,543 | |
| | | | | | | | | |
| Information technology 0.18% | | | | | | | | |
| International Business Machines Corp. 3.375% 2023 | | | 5,000 | | | | 5,339 | |
| Other securities | | | | | | | 179,355 | |
| | | | | | | | 184,694 | |
| | | | | | | | | |
| Other 1.86% | | | | | | | | |
| Other securities | | | | | | | 1,846,119 | |
| | | | | | | | | |
| Total corporate bonds & notes | | | | | | | 6,585,722 | |
| | | | | | | | | |
| Mortgage-backed obligations 2.88% | | | | | | | | |
| Federal agency mortgage-backed obligations 2.75% | | | | | | | | |
| Fannie Mae 0%–7.50% 2017–20474,5,6 | | | 1,066,794 | | | | 1,148,273 | |
| Freddie Mac 0%–6.50% 2019–20474,5 | | | 867,913 | | | | 919,992 | |
| Other securities | | | | | | | 681,618 | |
| | | | | | | | 2,749,883 | |
| | | | | | | | | |
| Other 0.13% | | | | | | | | |
| Other securities | | | | | | | 109,841 | |
| | | | | | | | | |
| Total mortgage-backed obligations | | | | | | | 2,859,724 | |
| | | | | | | | | |
| Federal agency bonds & notes 0.16% | | | | | | | | |
| Fannie Mae 2.125% 2026 | | | 37,230 | | | | 37,309 | |
| Freddie Mac 1.00%–5.50% 2017–2019 | | | 114,400 | | | | 116,615 | |
| Other securities | | | | | | | 3,039 | |
| | | | | | | | | |
| Total federal agency bonds & notes | | | | | | | 156,963 | |
| | | | | | | | | |
| Other 0.80% | | | | | | | | |
| Other securities | | | | | | | 795,235 | |
| | | | | | | | | |
| Total bonds, notes & other debt instruments (cost: $16,778,513,000) | | | | | | | 17,163,639 | |
| | | | | | | | | |
| Short-term securities 2.63% | | | | | | | | |
| Chevron Corp. 0.47%–0.58% due 12/1/2016–1/6/20173 | | | 127,400 | | | | 127,302 | |
| Coca-Cola Co. 0.52% due 12/16/20163 | | | 75,000 | | | | 74,959 | |
| ExxonMobil Corp. 0.41%–0.54% due 11/2/2016–12/19/2016 | | | 100,000 | | | | 99,968 | |
| Fannie Mae 0.60% due 1/3/2017 | | | 100,000 | | | | 99,950 | |
| Federal Home Loan Bank 0.26%–0.44% due 11/18/2016–3/1/2017 | | | 725,000 | | | | 724,571 | |
| Freddie Mac 0.45%–0.50% due 2/17/2017–5/15/2017 | | | 150,000 | | | | 149,748 | |
| IBM Corp. 0.42%–0.63% due 11/7/2016–12/27/20163 | | | 180,650 | | | | 180,556 | |
| U.S. Treasury Bills 0.33% due 1/19/2017 | | | 100,000 | | | | 99,936 | |
| Other securities | | | | | | | 1,056,596 | |
| | | | | | | | | |
| Total short-term securities (cost: $2,613,327,000) | | | | | | | 2,613,586 | |
| Total investment securities 99.61% (cost: $91,568,124,000) | | | | | | | 99,003,531 | |
| Other assets less liabilities 0.39% | | | | | | | 388,933 | |
| | | | | | | | | |
| Net assets 100.00% | | | | | | $ | 99,392,464 | |
This summary investment portfolio is designed to streamline the report and help investors better focus on the fund’s principal holdings. See the inside back cover for details on how to obtain a complete schedule of portfolio holdings.
As permitted by U.S. Securities and Exchange Commission regulations, “Miscellaneous” securities including holdings in their first year of acquisition that have not previously been publicly disclosed.
“Other securities” includes all issues that are not disclosed separately in the summary investment portfolio. “Other securities” includes securities which were valued under fair value procedures adopted by authority of the board of trustees. The total value of securities which were valued under fair value procedures was $43,421,000, which represented .04% of the net assets of the fund. “Other securities” also includes loan participations and assignments, which may be subject to legal or contractual restrictions on resale. The total value of all such loans was $74,986,000, which represented .08% of the net assets of the fund.
Forward currency contracts
The fund has entered into forward currency contracts as shown in the following table. The average month-end notional amount of open forward currency contracts while held was $569,809,000.
| | | | | | | | | | | Unrealized | |
| | | | | | | | | appreciation | |
| | | | | | | Contract amount | | (depreciation) | |
| | | | | | | Receive | | Deliver | | at 10/31/2016 | |
| | | Settlement date | | Counterparty | | (000) | | (000) | | (000) | |
| Sales: | | | | | | | | | | | | |
| British pounds | | 12/7/2016 | | JPMorgan Chase | | $130,907 | | £102,582 | | | $ 5,244 | |
| British pounds | | 12/7/2016 | | Citibank | | $195,573 | | £160,000 | | | (427 | ) |
| Euros | | 11/16/2016 | | Citibank | | $318,764 | | €282,500 | | | 8,453 | |
| South African rand | | 1/6/2017 | | Barclays Bank PLC | | $8,505 | | ZAR118,700 | | | (177 | ) |
| South African rand | | 1/6/2017 | | Barclays Bank PLC | | $8,481 | | ZAR118,700 | | | (200 | ) |
| South African rand | | 1/6/2017 | | Barclays Bank PLC | | $9,675 | | ZAR136,275 | | | (292 | ) |
| | | | | | | | | | | | $12,601 | |
Investments in affiliates
A company is an affiliate of the fund under the Investment Company Act of 1940 if the fund’s holdings in that company represent 5% or more of the outstanding voting shares. The value of the fund’s affiliated-company holdings is either shown in the summary investment portfolio or included in the value of “Other securities” under the respective industry sectors. Further details on such holdings and related transactions during the year ended October 31, 2016, appear below.
| | | | | | | | | | | | | | | | | | Value of | |
| | | | | | | | | | | | | | | Dividend | | | affiliates at | |
| | | Beginning | | | | | | | | | Ending | | | income | | | 10/31/2016 | |
| | | shares | | | Additions | | | Reductions | | | shares | | | (000) | | | (000) | |
| SSE PLC | | | 76,658,002 | | | | 1,633,000 | | | | — | | | | 78,291,002 | | | $ | 94,408 | | | $ | 1,524,626 | |
| Sampo Oyj, Class A | | | 23,972,801 | | | | 5,256,509 | | | | — | | | | 29,229,310 | | | | 68,227 | | | | 1,340,252 | |
| EDP - Energias de Portugal, SA | | | 230,413,901 | | | | 20,766,988 | | | | 8,342,461 | | | | 242,838,428 | | | | 52,563 | | | | 802,660 | |
| Six Flags Entertainment Corp. | | | 6,081,400 | | | | 79,000 | | | | — | | | | 6,160,400 | | | | 14,289 | | | | 342,826 | |
| VTech Holdings Ltd. | | | 16,512,300 | | | | 3,577,000 | | | | — | | | | 20,089,300 | | | | 7,829 | | | | 246,598 | |
| Greene King PLC | | | 24,691,512 | | | | — | | | | — | | | | 24,691,512 | | | | 10,709 | | | | 221,077 | |
| Vanguard International Semiconductor Corp.7 | | | 56,371,446 | | | | 35,304,279 | | | | — | | | | 91,675,725 | | | | 5,770 | | | | 187,085 | |
| Whitecap Resources Inc.7 | | | 8,112,000 | | | | 13,273,000 | | | | — | | | | 21,385,000 | | | | 4,013 | | | | 170,914 | |
| Mercury General Corp. | | | 2,809,700 | | | | 100,000 | | | | — | | | | 2,909,700 | | | | 7,030 | | | | 158,491 | |
| Covanta Holding Corp.7 | | | 2,700,000 | | | | 7,547,332 | | | | — | | | | 10,247,332 | | | | 9,269 | | | | 153,710 | |
| TalkTalk Telecom Group PLC | | | 56,376,217 | | | | — | | | | 5,031,217 | | | | 51,345,000 | | | | 11,568 | | | | 127,955 | |
| DineEquity, Inc. | | | 1,167,500 | | | | 307,500 | | | | — | | | | 1,475,000 | | | | 5,184 | | | | 116,673 | |
| AA PLC | | | 25,551,116 | | | | 11,268,561 | | | | — | | | | 36,819,677 | | | | 3,719 | | | | 115,417 | |
| Moneysupermarket.com Group PLC | | | 28,508,401 | | | | 7,080,000 | | | | — | | | | 35,588,401 | | | | 3,981 | | | | 114,084 | |
| Ratchaburi Electricity Generating Holding PCL | | | 77,350,000 | | | | — | | | | — | | | | 77,350,000 | | | | 4,992 | | | | 110,508 | |
| Tesco Lotus Retail Growth Freehold and Leasehold Property Fund | | | 145,255,000 | | | | — | | | | — | | | | 145,255,000 | | | | 3,589 | | | | 75,953 | |
| Marston’s PLC | | | 37,254,228 | | | | 4,630,000 | | | | — | | | | 41,884,228 | | | | 4,117 | | | | 68,543 | |
| Gannett Co., Inc. | | | 9,191,300 | | | | — | | | | 643,900 | | | | 8,547,400 | | | | 5,676 | | | | 66,413 | |
| Convenience Retail Asia Ltd. | | | 51,330,000 | | | | — | | | | — | | | | 51,330,000 | | | | 1,487 | | | | 27,400 | |
| Leifheit AG, non-registered shares | | | 320,000 | | | | — | | | | — | | | | 320,000 | | | | 982 | | | | 20,726 | |
| Canyon Services Group Inc.8 | | | 3,645,500 | | | | — | | | | 3,645,500 | | | | — | | | | — | | | | — | |
| Glow Energy PCL8 | | | 84,822,200 | | | | — | | | | 17,185,700 | | | | 67,636,500 | | | | 13,713 | | | | — | |
| TDC A/S8,9 | | | 53,982,555 | | | | — | | | | 53,982,555 | | | | — | | | | — | | | | — | |
| Veresen Inc.8 | | | 15,072,100 | | | | 520,200 | | | | 4,963,300 | | | | 10,629,000 | | | | 9,778 | | | | — | |
| | | | | | | | | | | | | | | | | | | $ | 342,893 | | | $ | 5,991,911 | |
The following footnotes apply to either the individual securities noted or one or more of the securities aggregated and listed as a single line item.
| 1 | Represents an affiliated company as defined under the Investment Company Act of 1940. |
| 2 | Index-linked bond whose principal amount moves with a government price index. |
| 3 | Acquired in a transaction exempt from registration under Rule 144A or Section 4(2) of the Securities Act of 1933. May be resold in the U.S. in transactions exempt from registration, normally to qualified institutional buyers. The total value of all such securities, including those in “Other securities,” was $2,930,562,000, which represented 2.95% of the net assets of the fund. |
| 4 | Coupon rate may change periodically. |
| 5 | Principal payments may be made periodically. Therefore, the effective maturity date may be earlier than the stated maturity date. |
| 6 | Purchased on a TBA basis. |
| 7 | This security was an unaffiliated issuer in its initial period of acquisition at 10/31/2015; it was not publicly disclosed. |
| 8 | Unaffiliated issuer at 10/31/2016. |
| 9 | Security did not produce income during the last 12 months. |
Key to abbreviations and symbols
ADR = American Depositary Receipts
€ = Euros
GBP/£ = British pounds
TBA = To-be-announced
ZAR = South African rand
See Notes to Financial Statements
Financial statements
Statement of assets and liabilities
at October 31, 2016 | (dollars in thousands) |
| Assets: | | | | | | | | |
| Investment securities, at value: | | | | | | | | |
| Unaffiliated issuers (cost: $85,331,120) | | $ | 93,011,620 | | | | | |
| Affiliated issuers (cost: $6,237,004) | | | 5,991,911 | | | $ | 99,003,531 | |
| Cash | | | | | | | 174 | |
| Cash denominated in currencies other than U.S. dollars (cost: $13,152) | | | | | | | 13,131 | |
| Unrealized appreciation on open forward currency contracts | | | | | | | 13,697 | |
| Receivables for: | | | | | | | | |
| Sales of investments | | | 786,524 | | | | | |
| Sales of fund’s shares | | | 130,388 | | | | | |
| Closed forward currency contracts | | | 706 | | | | | |
| Dividends and interest | | | 337,856 | | | | | |
| Other | | | 494 | | | | 1,255,968 | |
| | | | | | | | 100,286,501 | |
| Liabilities: | | | | | | | | |
| Unrealized depreciation on open forward currency contracts | | | | | | | 1,096 | |
| Payables for: | | | | | | | | |
| Purchases of investments | | | 678,645 | | | | | |
| Repurchases of fund’s shares | | | 155,881 | | | | | |
| Investment advisory services | | | 16,577 | | | | | |
| Services provided by related parties | | | 32,227 | | | | | |
| Trustees’ deferred compensation | | | 1,472 | | | | | |
| Other | | | 8,139 | | | | 892,941 | |
| Net assets at October 31, 2016 | | | | | | $ | 99,392,464 | |
| | | | | | | | | |
| Net assets consist of: | | | | | | | | |
| Capital paid in on shares of beneficial interest | | | | | | $ | 94,911,613 | |
| Distributions in excess of net investment income | | | | | | | (103,080 | ) |
| Accumulated net realized loss | | | | | | | (2,862,564 | ) |
| Net unrealized appreciation | | | | | | | 7,446,495 | |
| Net assets at October 31, 2016 | | | | | | $ | 99,392,464 | |
(dollars and shares in thousands, except per-share amounts)
Shares of beneficial interest issued and outstanding (no stated par value) —
unlimited shares authorized (1,729,153 total shares outstanding)
| | | | | | Shares | | | Net asset value | |
| | | Net assets | | | outstanding | | | per share | |
| Class A | | $ | 69,127,342 | | | | 1,202,602 | | | $ | 57.48 | |
| Class B | | | 87,470 | | | | 1,514 | | | | 57.77 | |
| Class C | | | 5,822,394 | | | | 101,241 | | | | 57.51 | |
| Class F-1 | | | 4,337,739 | | | | 75,466 | | | | 57.48 | |
| Class F-2 | | | 7,505,525 | | | | 130,638 | | | | 57.45 | |
| Class 529-A | | | 2,142,808 | | | | 37,289 | | | | 57.47 | |
| Class 529-B | | | 8,384 | | | | 145 | | | | 57.72 | |
| Class 529-C | | | 665,121 | | | | 11,579 | | | | 57.44 | |
| Class 529-E | | | 88,820 | | | | 1,546 | | | | 57.47 | |
| Class 529-F-1 | | | 75,427 | | | | 1,312 | | | | 57.48 | |
| Class R-1 | | | 133,706 | | | | 2,327 | | | | 57.46 | |
| Class R-2 | | | 628,353 | | | | 10,936 | | | | 57.46 | |
| Class R-2E | | | 11,511 | | | | 201 | | | | 57.30 | |
| Class R-3 | | | 992,492 | | | | 17,271 | | | | 57.47 | |
| Class R-4 | | | 750,952 | | | | 13,069 | | | | 57.46 | |
| Class R-5E | | | 10 | | | | — | * | | | 57.45 | |
| Class R-5 | | | 208,389 | | | | 3,624 | | | | 57.50 | |
| Class R-6 | | | 6,806,021 | | | | 118,393 | | | | 57.49 | |
| * | Amount less than one thousand. |
See Notes to Financial Statements
Statement of operations
for the year ended October 31, 2016 | (dollars in thousands) |
| | | | | | | |
| Investment income: | | | | | | | | |
| Income: | | | | | | | | |
| Dividends (net of non-U.S. taxes of $93,221; also includes $342,893 from affiliates) | | $ | 3,338,718 | | | | | |
| Interest (net of non-U.S. taxes of $16) | | | 519,111 | | | $ | 3,857,829 | |
| Fees and expenses*: | | | | | | | | |
| Investment advisory services | | | 227,702 | | | | | |
| Distribution services | | | 268,270 | | | | | |
| Transfer agent services | | | 93,476 | | | | | |
| Administrative services | | | 21,009 | | | | | |
| Reports to shareholders | | | 3,767 | | | | | |
| Registration statement and prospectus | | | 2,715 | | | | | |
| Trustees’ compensation | | | 481 | | | | | |
| Auditing and legal | | | 4,604 | | | | | |
| Custodian | | | 5,229 | | | | | |
| Other | | | 2,721 | | | | 629,974 | |
| Net investment income | | | | | | | 3,227,855 | |
| | | | | | | | | |
| Net realized loss and unrealized depreciation: | | | | | | | | |
| Net realized (loss) gain on: | | | | | | | | |
| Investments (includes $262,338 net loss from affiliates) | | | (349,361 | ) | | | | |
| Forward currency contracts | | | 72,664 | | | | | |
| Currency transactions | | | (16,215 | ) | | | (292,912 | ) |
| Net unrealized (depreciation) appreciation on: | | | | | | | | |
| Investments | | | (320,981 | ) | | | | |
| Forward currency contracts | | | 14,316 | | | | | |
| Currency translations | | | (225 | ) | | | (306,890 | ) |
| Net realized loss and unrealized depreciation | | | | | | | (599,802 | ) |
| | | | | | | | | |
| Net increase in net assets resulting from operations | | | | | | $ | 2,628,053 | |
| * | Additional information related to class-specific fees and expenses is included in the Notes to Financial Statements. |
| Statements of changes in net assets | |
| | (dollars in thousands) |
| | |
| | | Year ended October 31 | |
| | | 2016 | | | 2015 | |
| Operations: | | | | | | | | |
| Net investment income | | $ | 3,227,855 | | | $ | 3,179,262 | |
| Net realized (loss) gain | | | (292,912 | ) | | | 2,093,740 | |
| Net unrealized depreciation | | | (306,890 | ) | | | (6,037,615 | ) |
| Net increase (decrease) in net assets resulting from operations | | | 2,628,053 | | | | (764,613 | ) |
| | | | | | | | | |
| Dividends paid to shareholders from net investment income | | | (3,399,496 | ) | | | (3,830,363 | ) |
| | | | | | | | | |
| Net capital share transactions | | | 3,000,237 | | | | 4,965,294 | |
| | | | | | | | | |
| Total increase in net assets | | | 2,228,794 | | | | 370,318 | |
| | | | | | | | | |
| Net assets: | | | | | | | | |
| Beginning of year | | | 97,163,670 | | | | 96,793,352 | |
| End of year (including distributions in excess of net investment income: $(103,080) and $(75,750), respectively) | | $ | 99,392,464 | | | $ | 97,163,670 | |
See Notes to Financial Statements
Notes to financial statements
1. Organization
Capital Income Builder (the “fund”) is registered under the Investment Company Act of 1940 as an open-end, diversified management investment company. The fund seeks to provide a level of current income that exceeds the average yield on U.S. stocks generally and a growing stream of income over the years. Growth of capital is a secondary objective.
The fund has 18 share classes consisting of five retail share classes (Classes A, B and C, as well as two F share classes, F-1 and F-2), five 529 college savings plan share classes (Classes 529-A, 529-B, 529-C, 529-E and 529-F-1) and eight retirement plan share classes (Classes R-1, R-2, R-2E, R-3, R-4, R-5E, R-5 and R-6). The 529 college savings plan share classes can be used to save for college education. The retirement plan share classes are generally offered only through eligible employer-sponsored retirement plans. The fund’s share classes are described further in the following table:
| Share class | | Initial sales charge | | Contingent deferred sales charge upon
redemption | | Conversion feature |
| Classes A and 529-A | | Up to 5.75% | | None (except 1% for certain redemptions within one year of purchase without an initial sales charge) | | None |
| Classes B and 529-B* | | None | | Declines from 5% to 0% for redemptions within six years of purchase | | Classes B and 529-B convert to Classes A and 529-A, respectively, after eight years |
| Class C | | None | | 1% for redemptions within one year of purchase | | Class C converts to Class F-1 after 10 years |
| Class 529-C | | None | | 1% for redemptions within one year of purchase | | None |
| Class 529-E | | None | | None | | None |
| Classes F-1, F-2 and 529-F-1 | | None | | None | | None |
| Classes R-1, R-2, R-2E, R-3, R-4, R-5E, R-5 and R-6 | | None | | None | | None |
| * | Class B and 529-B shares of the fund are not available for purchase. |
On November 20, 2015, the fund made an additional retirement plan share class (Class R-5E) available for sale pursuant to an amendment to its registration statement filed with the U.S. Securities and Exchange Commission. Refer to the fund’s prospectus for more details.
Holders of all share classes have equal pro rata rights to the assets, dividends and liquidation proceeds of the fund. Each share class has identical voting rights, except for the exclusive right to vote on matters affecting only its class. Share classes have different fees and expenses (“class-specific fees and expenses”), primarily due to different arrangements for distribution, transfer agent and administrative services. Differences in class-specific fees and expenses will result in differences in net investment income and, therefore, the payment of different per-share dividends by each share class.
2. Significant accounting policies
The fund is an investment company that applies the accounting and reporting guidance issued in Topic 946 by the U.S. Financial Accounting Standards Board. The fund’s financial statements have been prepared to comply with U.S. generally accepted accounting principles (“U.S. GAAP”). These principles require the fund’s investment adviser to make estimates and assumptions that affect reported amounts and disclosures. Actual results could differ from those estimates. Subsequent events, if any, have been evaluated through the date of issuance in the preparation of the financial statements. The fund follows the significant accounting policies described in this section, as well as the valuation policies described in the next section on valuation.
Security transactions and related investment income — Security transactions are recorded by the fund as of the date the trades are executed with brokers. Realized gains and losses from security transactions are determined based on the specific identified cost of the securities. In the event a security is purchased with a delayed payment date, the fund will segregate liquid assets sufficient to meet its payment obligations. Dividend income is recognized on the ex-dividend date and interest income is recognized on an accrual basis. Market discounts, premiums and original issue discounts on fixed-income securities are amortized daily over the expected life of the security.
Class allocations — Income, fees and expenses (other than class-specific fees and expenses) and realized and unrealized gains and losses are allocated daily among the various share classes based on their relative net assets. Class-specific fees and expenses, such as distribution, transfer agent and administrative services, are charged directly to the respective share class.
Dividends and distributions to shareholders — Dividends and distributions to shareholders are recorded on the ex-dividend date.
Currency translation — Assets and liabilities, including investment securities, denominated in currencies other than U.S. dollars are translated into U.S. dollars at the exchange rates supplied by one or more pricing vendors on the valuation date. Purchases and sales of investment securities and income and expenses are translated into U.S. dollars at the exchange rates on the dates of such transactions. The effects of changes in exchange rates on investment securities are included with the net realized gain or loss and net unrealized appreciation or depreciation on investments in the fund’s statement of operations. The realized gain or loss and unrealized appreciation or depreciation resulting from all other transactions denominated in currencies other than U.S. dollars are disclosed separately.
3. Valuation
Capital Research and Management Company (“CRMC”), the fund’s investment adviser, values the fund’s investments at fair value as defined by U.S. GAAP. The net asset value of each share class of the fund is generally determined as of approximately 4:00 p.m. New York time each day the New York Stock Exchange is open.
Methods and inputs — The fund’s investment adviser uses the following methods and inputs to establish the fair value of the fund’s assets and liabilities. Use of particular methods and inputs may vary over time based on availability and relevance as market and economic conditions evolve.
Equity securities are generally valued at the official closing price of, or the last reported sale price on, the exchange or market on which such securities are traded, as of the close of business on the day the securities are being valued or, lacking any sales, at the last available bid price. Prices for each security are taken from the principal exchange or market on which the security trades.
Fixed-income securities, including short-term securities, are generally valued at prices obtained from one or more pricing vendors. Vendors value such securities based on one or more of the inputs described in the following table. The table provides examples of inputs that are commonly relevant for valuing particular classes of fixed-income securities in which the fund is authorized to invest. However, these classifications are not exclusive, and any of the inputs may be used to value any other class of fixed-income security.
| Fixed-income class | | Examples of standard inputs |
| All | | Benchmark yields, transactions, bids, offers, quotations from dealers and trading systems, new issues, spreads and other relationships observed in the markets among comparable securities; and proprietary pricing models such as yield measures calculated using factors such as cash flows, financial or collateral performance and other reference data (collectively referred to as “standard inputs”) |
| Corporate bonds & notes; convertible securities | | Standard inputs and underlying equity of the issuer |
| Bonds & notes of governments & government agencies | | Standard inputs and interest rate volatilities |
| Mortgage-backed; asset-backed obligations | | Standard inputs and cash flows, prepayment information, default rates, delinquency and loss assumptions, collateral characteristics, credit enhancements and specific deal information |
| Municipal securities | | Standard inputs and, for certain distressed securities, cash flows or liquidation values using a net present value calculation based on inputs that include, but are not limited to, financial statements and debt contracts |
When the fund’s investment adviser deems it appropriate to do so (such as when vendor prices are unavailable or deemed to be not representative), fixed-income securities will be valued in good faith at the mean quoted bid and ask prices that are reasonably and timely available (or bid prices, if ask prices are not available) or at prices for securities of comparable maturity, quality and type.
Securities with both fixed-income and equity characteristics, or equity securities traded principally among fixed-income dealers, are generally valued in the manner described for either equity or fixed-income securities, depending on which method is deemed most appropriate by the fund’s investment adviser. Forward currency contracts are valued at the mean of representative quoted bid and ask prices, generally based on prices supplied by one or more pricing vendors.
Securities and other assets for which representative market quotations are not readily available or are considered unreliable by the fund’s investment adviser are fair valued as determined in good faith under fair valuation guidelines adopted by authority of the fund’s board of trustees as further described. The investment adviser follows fair valuation guidelines, consistent with U.S. Securities and Exchange Commission rules and guidance, to consider relevant principles and factors when making fair value determinations. The investment
adviser considers relevant indications of value that are reasonably and timely available to it in determining the fair value to be assigned to a particular security, such as the type and cost of the security; contractual or legal restrictions on resale of the security; relevant financial or business developments of the issuer; actively traded similar or related securities; conversion or exchange rights on the security; related corporate actions; significant events occurring after the close of trading in the security; and changes in overall market conditions. In addition, the closing prices of equity securities that trade in markets outside U.S. time zones may be adjusted to reflect significant events that occur after the close of local trading but before the net asset value of each share class of the fund is determined. Fair valuations and valuations of investments that are not actively trading involve judgment and may differ materially from valuations that would have been used had greater market activity occurred.
Processes and structure — The fund’s board of trustees has delegated authority to the fund’s investment adviser to make fair value determinations, subject to board oversight. The investment adviser has established a Joint Fair Valuation Committee (the “Fair Valuation Committee”) to administer, implement and oversee the fair valuation process, and to make fair value decisions. The Fair Valuation Committee regularly reviews its own fair value decisions, as well as decisions made under its standing instructions to the investment adviser’s valuation teams. The Fair Valuation Committee reviews changes in fair value measurements from period to period and may, as deemed appropriate, update the fair valuation guidelines to better reflect the results of back testing and address new or evolving issues. The Fair Valuation Committee reports any changes to the fair valuation guidelines to the board of trustees with supplemental information to support the changes. The fund’s board and audit committee also regularly review reports that describe fair value determinations and methods.
The fund’s investment adviser has also established a Fixed-Income Pricing Review Group to administer and oversee the fixed-income valuation process, including the use of fixed-income pricing vendors. This group regularly reviews pricing vendor information and market data. Pricing decisions, processes and controls over security valuation are also subject to additional internal reviews, including an annual control self-evaluation program facilitated by the investment adviser’s compliance group.
Classifications — The fund’s investment adviser classifies the fund’s assets and liabilities into three levels based on the inputs used to value the assets or liabilities. Level 1 values are based on quoted prices in active markets for identical securities. Level 2 values are based on significant observable market inputs, such as quoted prices for similar securities and quoted prices in inactive markets. Certain securities trading outside the U.S. may transfer between Level 1 and Level 2 due to valuation adjustments resulting from significant market movements following the close of local trading. Level 3 values are based on significant unobservable inputs that reflect the investment adviser’s determination of assumptions that market participants might reasonably use in valuing the securities. The valuation levels are not necessarily an indication of the risk or liquidity associated with the underlying investment. For example, U.S. government securities are reflected as Level 2 because the inputs used to determine fair value may not always be quoted prices in an active market. The following tables present the fund’s valuation levels as of October 31, 2016 (dollars in thousands):
| | | Investment securities |
| | | Level 1* | | | Level 2 | | | Level 3 | | | Total | |
| Assets: | | | | | | | | | | | | | | | | |
| Common stocks: | | | | | | | | | | | | | | | | |
| Consumer staples | | $ | 14,157,259 | | | $ | — | | | $ | — | | | $ | 14,157,259 | |
| Utilities | | | 10,033,800 | | | | — | | | | — | | | | 10,033,800 | |
| Health care | | | 8,371,888 | | | | — | | | | — | | | | 8,371,888 | |
| Telecommunication services | | | 8,190,597 | | | | — | | | | — | | | | 8,190,597 | |
| Financials | | | 7,489,295 | | | | — | | | | — | | | | 7,489,295 | |
| Energy | | | 7,419,399 | | | | — | | | | — | | | | 7,419,399 | |
| Industrials | | | 6,042,846 | | | | — | | | | — | | | | 6,042,846 | |
| Information technology | | | 5,132,637 | | | | — | | | | — | | | | 5,132,637 | |
| Real estate | | | 4,384,237 | | | | 2,062 | | | | — | | | | 4,386,299 | |
| Consumer discretionary | | | 4,219,031 | | | | — | | | | — | | | | 4,219,031 | |
| Materials | | | 1,967,729 | | | | — | | | | — | | | | 1,967,729 | |
| Miscellaneous | | | 1,321,269 | | | | — | | | | — | | | | 1,321,269 | |
| Preferred securities | | | 5,212 | | | | 8,308 | | | | — | | | | 13,520 | |
| Rights & warrants | | | 247 | | | | — | | | | — | | | | 247 | |
| Convertible stocks | | | 480,490 | | | | — | | | | — | | | | 480,490 | |
| Bonds, notes & other debt instruments: | | | | | | | | | | | | | | | | |
| U.S. Treasury bonds & notes | | | — | | | | 6,765,995 | | | | — | | | | 6,765,995 | |
| Corporate bonds & notes | | | — | | | | 6,585,722 | | | | — | | | | 6,585,722 | |
| Mortgage-backed obligations | | | — | | | | 2,859,724 | | | | — | | | | 2,859,724 | |
| Federal agency bonds & notes | | | — | | | | 156,963 | | | | — | | | | 156,963 | |
| Other | | | — | | | | 755,343 | | | | 39,892 | | | | 795,235 | |
| Short-term securities | | | — | | | | 2,613,586 | | | | — | | | | 2,613,586 | |
| Total | | $ | 79,215,936 | | | $ | 19,747,703 | | | $ | 39,892 | | | $ | 99,003,531 | |
| | | Other investments† |
| | | Level 1 | | | Level 2 | | | Level 3 | | | Total | |
| Assets: | | | | | | | | | | | | | | | | |
| Unrealized appreciation on open forward currency contracts | | $ | — | | | $ | 13,697 | | | $ | — | | | $ | 13,697 | |
| Liabilities: | | | | | | | | | | | | | | | | |
| Unrealized depreciation on open forward currency contracts | | | — | | | | (1,096 | ) | | | — | | | | (1,096 | ) |
| Total | | $ | — | | | $ | 12,601 | | | $ | — | | | $ | 12,601 | |
| * | Securities with a value of $27,128,419,000, which represented 27.29% of the net assets of the fund, transferred from Level 2 to Level 1 since the prior fiscal year-end, primarily due to a lack of significant market movements following the close of local trading. |
| † | Forward currency contracts are not included in the investment portfolio. |
4. Risk factors
Investing in the fund may involve certain risks including, but not limited to, those described below.
Market conditions — The prices of, and the income generated by, the common stocks, bonds and other securities held by the fund may decline — sometimes rapidly or unpredictably — due to various factors, including events or conditions affecting the general economy or particular industries; overall market changes; local, regional or global political, social or economic instability; governmental or governmental agency responses to economic conditions; and currency exchange rate, interest rate and commodity price fluctuations. These risks may be heightened in the case of smaller capitalization stocks.
Issuer risks — The prices of, and the income generated by, securities held by the fund may decline in response to various factors directly related to the issuers of such securities, including reduced demand for an issuer’s goods or services, poor management performance and strategic initiatives such as mergers, acquisitions or dispositions and the market response to any such initiatives.
Investing in income-oriented stocks — Income provided by the fund may be reduced by changes in the dividend policies of, and the capital resources available for dividend payments at, the companies in which the fund invests.
Investing in debt instruments — The prices of, and the income generated by, bonds and other debt securities held by the fund may be affected by changing interest rates and by changes in the effective maturities and credit ratings of these securities.
Rising interest rates will generally cause the prices of bonds and other debt securities to fall. Falling interest rates may cause an issuer to redeem, call or refinance a debt security before its stated maturity, which may result in the fund having to reinvest the proceeds in lower yielding securities. Longer maturity debt securities generally have greater sensitivity to changes in interest rates and may be subject to greater price fluctuations than shorter maturity debt securities.
Bonds and other debt securities are also subject to credit risk, which is the possibility that the credit strength of an issuer will weaken and/or an issuer of a debt security will fail to make timely payments of principal or interest and the security will go into default. Lower quality debt securities generally have higher rates of interest and may be subject to greater price fluctuations than higher quality debt securities. Credit risk is gauged, in part, by the credit ratings of the debt securities in which the fund invests. However, ratings are only the opinions of the rating agencies issuing them and are not guarantees as to credit quality or an evaluation of market risk. The fund’s investment adviser relies on its own credit analysts to research issuers and issues in seeking to mitigate various credit and default risks.
Investing outside the U.S. — Securities of issuers domiciled outside the U.S., or with significant operations or revenues outside the U.S., may lose value because of adverse political, social, economic or market developments (including social instability, regional conflicts, terrorism and war) in the countries or regions in which the issuers operate or generate revenue. These securities may also lose value due to changes in foreign currency exchange rates against the U.S. dollar and/or currencies of other countries. Issuers of these securities may be more susceptible to actions of foreign governments, such as the imposition of price controls or punitive taxes, that could adversely impact the value of these securities. Securities markets in certain countries may be more volatile and/or less liquid than those in the U.S. Investments outside the U.S. may also be subject to different accounting practices and different regulatory, legal and reporting standards and practices, and may be more difficult to value, than those in the U.S. In addition, the value of investments outside the U.S. may be reduced by foreign taxes, including foreign withholding taxes on interest and dividends. Further, there may be increased risks of delayed settlement of securities purchased or sold by the fund. The risks of investing outside the U.S. may be heightened in connection with investments in emerging markets.
Management — The investment adviser to the fund actively manages the fund’s investments. Consequently, the fund is subject to the risk that the methods and analyses employed by the investment adviser in this process may not produce the desired results. This could cause the fund to lose value or its investment results to lag relevant benchmarks or other funds with similar objectives.
5. Certain investment techniques
Index-linked bonds — The fund has invested in index-linked bonds, which are fixed-income securities whose principal value is periodically adjusted to a government price index. Over the life of an index-linked bond, interest is paid on the adjusted principal value. Increases or decreases in the principal value of index-linked bonds are recorded as interest income in the fund’s statement of operations.
Mortgage dollar rolls — The fund has entered into mortgage dollar roll transactions in which the fund sells a mortgage-backed security to a counterparty and simultaneously enters into an agreement with the same counterparty to buy back a similar security on a specific future date at a predetermined price. Mortgage dollar rolls are accounted for as purchase and sale transactions, which may increase the fund’s portfolio turnover rate.
Loan transactions — The fund has entered into loan transactions in which the fund acquires a loan either through an agent, by assignment from another holder, or as a participation interest in another holder’s portion of a loan. The loan is often administered by a financial institution that acts as agent for the holders of the loan, and the fund may be required to receive approval from the agent and/or borrower prior to the sale of the investment. The loan’s interest rate and maturity date may change based on the terms of the loan, including potential early payments of principal.
Forward currency contracts — The fund has entered into forward currency contracts, which represent agreements to exchange currencies on specific future dates at predetermined rates. The fund’s investment adviser uses forward currency contracts to manage the fund’s exposure to changes in exchange rates. Upon entering into these contracts, risks may arise from the potential inability of counterparties to meet the terms of their contracts and from possible movements in exchange rates.
On a daily basis, the fund’s investment adviser values forward currency contracts and records unrealized appreciation or depreciation for open forward currency contracts in the fund’s statement of assets and liabilities. Realized gains or losses are recorded at the time the forward currency contract is closed or offset by another contract with the same broker for the same settlement date and currency.
Closed forward currency contracts that have not reached their settlement date are included in the respective receivables or payables for closed forward currency contracts in the fund’s statement of assets and liabilities. Net realized gains or losses from closed forward currency contracts and net unrealized appreciation or depreciation from open forward currency contracts are recorded in the fund’s statement of operations.
The following tables present the financial statement impacts resulting from the fund’s use of forward currency contracts as of, or for the year ended, October 31, 2016 (dollars in thousands):
| | | | | Assets | | | Liabilities | |
| Contract | | Risk type | | Location on statement of assets and liabilities | | Value | | | Location on statement of assets and liabilities | | Value | |
| Forward currency | | Currency | | Unrealized appreciation on open forward currency contracts | | $ | 13,697 | | | Unrealized depreciation on open forward currency contracts | | $ | 1,096 | |
| Forward currency | | Currency | | Receivables for closed forward currency contracts | | | 706 | | | Payables for closed forward currency contracts | | | — | |
| | | | | | | $ | 14,403 | | | | | $ | 1,096 | |
| | | | | | | | | | | | | | | |
| | | | | Net realized gain | | | Net unrealized appreciation | |
| Contract | | Risk type | | Location on statement of operations | | Value | | | Location on statement of operations | | Value | |
| Forward currency | | Currency | | Net realized gain on forward currency contracts | | $ | 72,664 | | | Net unrealized appreciation on forward currency contracts | | $ | 14,316 | |
Collateral — The fund participates in a collateral program due to its use of forward currency contracts and future delivery contracts. For forward currency contracts, the program calls for the fund to either receive or pledge collateral based on the net gain or loss on unsettled forward currency contracts by counterparty. For future delivery contracts, the program calls for the fund to either receive or pledge
collateral based on the net gain or loss on unsettled contracts by certain counterparties. The purpose of the collateral is to cover potential losses that could occur in the event that either party cannot meet its contractual obligations.
Rights of offset — The fund has entered into enforceable master netting agreements with certain counterparties for forward currency contracts, where on any date amounts payable by each party to the other (in the same currency with respect to the same transaction) may be closed or offset by each party’s payment obligation. If an early termination date occurs under these agreements following an event of default or termination event, all obligations of each party to its counterparty are settled net through a single payment in a single currency (“close-out netting”). For financial reporting purposes, the fund does not offset financial assets and financial liabilities that are subject to these master netting arrangements in the statement of assets and liabilities.
The following table presents the fund’s forward currency contracts by counterparty that are subject to master netting agreements but that are not offset in the fund’s statement of assets and liabilities. The net amount column shows the impact of offsetting on the fund’s statement of assets and liabilities as of October 31, 2016, if close-out netting was exercised (dollars in thousands):
| | | Gross amounts
recognized in the | | | Gross amounts not offset in the
statement of assets and liabilities and
subject to a master netting agreement | | | | |
| | | statement of assets | | | Available | | | Non-cash | | | Cash | | | Net | |
| Counterparty | | and liabilities | | | to offset | | | collateral* | | | collateral | | | amount | |
| Assets: | | | | | | | | | | | | | | | | | | | | |
| Citibank | | $ | 9,159 | | | $ | (427 | ) | | $ | (8,732 | ) | | $ | — | | | $ | — | |
| JPMorgan Chase | | | 5,244 | | | | — | | | | (5,244 | ) | | | — | | | | — | |
| Total | | $ | 14,403 | | | $ | (427 | ) | | $ | (13,976 | ) | | $ | — | | | $ | — | |
| Liabilities: | | | | | | | | | | | | | | | | | | | | |
| Barclays Bank PLC | | $ | 669 | | | $ | — | | | $ | — | | | $ | — | | | $ | 669 | |
| Citibank | | | 427 | | | | (427 | ) | | | — | | | | — | | | | — | |
| Total | | $ | 1,096 | | | $ | (427 | ) | | $ | — | | | $ | — | | | $ | 669 | |
| * | Non-cash collateral is shown on a settlement basis. |
6. Taxation and distributions
Federal income taxation — The fund complies with the requirements under Subchapter M of the Internal Revenue Code applicable to mutual funds and intends to distribute substantially all of its net taxable income and net capital gains each year. The fund is not subject to income taxes to the extent such distributions are made. Therefore, no federal income tax provision is required.
As of and during the period ended October 31, 2016, the fund did not have a liability for any unrecognized tax benefits. The fund recognizes interest and penalties, if any, related to unrecognized tax benefits as income tax expense in the statement of operations. During the period, the fund did not incur any interest or penalties.
The fund is not subject to examination by U.S. federal tax authorities for tax years before 2012, by state tax authorities for tax years before 2011 and by tax authorities outside the U.S. for tax years before 2009.
Non-U.S. taxation — Dividend and interest income are recorded net of non-U.S. taxes paid. The fund may file withholding tax reclaims in certain jurisdictions to recover a portion of amounts previously withheld. As a result of rulings from European courts, the fund filed for additional reclaims related to prior years. These reclaims are recorded when the amount is known and there are no significant uncertainties on collectability. Gains realized by the fund on the sale of securities in certain countries are subject to non-U.S. taxes. The fund records an estimated deferred tax liability based on unrealized gains to provide for potential non-U.S. taxes payable upon the sale of these securities.
Distributions — Distributions paid to shareholders are based on net investment income and net realized gains determined on a tax basis, which may differ from net investment income and net realized gains for financial reporting purposes. These differences are due primarily to different treatment for items such as currency gains and losses; short-term capital gains and losses; capital losses related to sales of certain securities within 30 days of purchase; unrealized appreciation of certain investments in securities outside the U.S.; cost of investments sold; net capital losses; amortization of premiums and discounts; and income on certain investments. The fiscal year in which amounts are distributed may differ from the year in which the net investment income and net realized gains are recorded by the fund for financial reporting purposes.
During the year ended October 31, 2016, the fund reclassified $47,000 from distributions in excess of net investment income to capital paid in on shares of beneficial interest and $144,358,000 from accumulated net realized loss to distributions in excess of net investment income to align financial reporting with tax reporting.
Under the Regulated Investment Company Modernization Act of 2010 (the “Act”), net capital losses recognized after October 31, 2011, may be carried forward indefinitely, and their character is retained as short-term and/or long-term losses. Previously, net capital losses were carried forward for eight years and treated as short-term losses. As a transition rule, the Act requires that post-enactment net capital losses be used before pre-enactment net capital losses.
As of October 31, 2016, the tax basis components of distributable earnings, unrealized appreciation (depreciation) and cost of investment securities were as follows (dollars in thousands):
| Undistributed ordinary income | | | | | | $ | 375,461 | |
| Capital loss carryforward*: | | | | | | | | |
| No expiration | | $ | (400,109 | ) | | | | |
| Expiring 2017 | | | (2,587,903 | ) | | | (2,988,012 | ) |
| | | | | | | | | |
| Gross unrealized appreciation on investment securities | | | | | | | 12,042,986 | |
| Gross unrealized depreciation on investment securities | | | | | | | (4,948,628 | ) |
| Net unrealized appreciation on investment securities | | | | | | | 7,094,358 | |
| Cost of investment securities | | | | | | | 91,909,173 | |
| * | The capital loss carryforward will be used to offset any capital gains realized by the fund in future years through the expiration date. The fund will not make distributions from capital gains while a capital loss carryforward remains. |
Tax-basis distributions paid to shareholders from ordinary income were as follows (dollars in thousands):
| | | Year ended October 31 | |
| Share class | | 2016 | | | 2015 | |
| Class A | | $ | 2,449,842 | | | $ | 2,811,410 | |
| Class B | | | 5,543 | | | | 19,622 | |
| Class C | | | 165,318 | | | | 214,059 | |
| Class F-1 | | | 144,139 | | | | 148,745 | |
| Class F-2 | | | 224,843 | | | | 205,163 | |
| Class 529-A | | | 73,351 | | | | 86,316 | |
| Class 529-B | | | 425 | | | | 1,291 | |
| Class 529-C | | | 17,870 | | | | 22,391 | |
| Class 529-E | | | 2,861 | | | | 3,401 | |
| Class 529-F-1 | | | 2,561 | | | | 2,902 | |
| Class R-1 | | | 3,811 | | | | 4,771 | |
| Class R-2 | | | 17,620 | | | | 23,343 | |
| Class R-2E | | | 137 | | | | 6 | |
| Class R-3 | | | 30,988 | | | | 37,385 | |
| Class R-4 | | | 22,961 | | | | 23,362 | |
| Class R-5E* | | | — | † | | | | |
| Class R-5 | | | 12,087 | | | | 16,802 | |
| Class R-6 | | | 225,139 | | | | 209,394 | |
| Total | | $ | 3,399,496 | | | $ | 3,830,363 | |
| * | Class R-5E shares were offered beginning November 20, 2015. |
| † | Amount less than one thousand. |
7. Fees and transactions with related parties
CRMC, the fund’s investment adviser, is the parent company of American Funds Distributors,® Inc. (“AFD”), the principal underwriter of the fund’s shares, and American Funds Service Company® (“AFS”), the fund’s transfer agent. CRMC, AFD and AFS are considered related parties to the fund.
Investment advisory services — The fund has an investment advisory and service agreement with CRMC that provides for monthly fees accrued daily. These fees are based on a series of decreasing annual rates beginning with 0.240% on the first $1 billion of daily net assets and decreasing to 0.110% on such assets in excess of $115 billion. The agreement also provides for monthly fees, accrued daily, based on a series of decreasing rates beginning with 3.00% on the first $100,000,000 of the fund’s monthly gross income and decreasing to
2.50% on such income in excess of $100,000,000. For the year ended October 31, 2016, the investment advisory services fee was $227,702,000, which was equivalent to an annualized rate of 0.232% of average daily net assets.
Class-specific fees and expenses — Expenses that are specific to individual share classes are accrued directly to the respective share class. The principal class-specific fees and expenses are further described below:
Distribution services — The fund has plans of distribution for all share classes, except Class F-2, R-5E, R-5 and R-6 shares. Under the plans, the board of trustees approves certain categories of expenses that are used to finance activities primarily intended to sell fund shares and service existing accounts. The plans provide for payments, based on an annualized percentage of average daily net assets, ranging from 0.30% to 1.00% as noted in this section. In some cases, the board of trustees has limited the amounts that may be paid to less than the maximum allowed by the plans. All share classes with a plan may use up to 0.25% of average daily net assets to pay service fees, or to compensate AFD for paying service fees, to firms that have entered into agreements with AFD to provide certain shareholder services. The remaining amounts available to be paid under each plan are paid to dealers to compensate them for their sales activities.
For Class A and 529-A shares, distribution-related expenses include the reimbursement of dealer and wholesaler commissions paid by AFD for certain shares sold without a sales charge. These share classes reimburse AFD for amounts billed within the prior 15 months but only to the extent that the overall annual expense limit of 0.30% is not exceeded. As of October 31, 2016, there were no unreimbursed expenses subject to reimbursement for Class A or 529-A shares.
| Share class | | Currently approved limits | | Plan limits |
| Class A | | | 0.30 | % | | | 0.30 | % |
| Class 529-A | | | 0.30 | | | | 0.50 | |
| Classes B and 529-B | | | 1.00 | | | | 1.00 | |
| Classes C, 529-C and R-1 | | | 1.00 | | | | 1.00 | |
| Class R-2 | | | 0.75 | | | | 1.00 | |
| Class R-2E | | | 0.60 | | | | 0.85 | |
| Classes 529-E and R-3 | | | 0.50 | | | | 0.75 | |
| Classes F-1, 529-F-1 and R-4 | | | 0.25 | | | | 0.50 | |
Transfer agent services — The fund has a shareholder services agreement with AFS under which the fund compensates AFS for providing transfer agent services to each of the fund’s share classes. These services include recordkeeping, shareholder communications and transaction processing. In addition, the fund reimburses AFS for amounts paid to third parties for performing transfer agent services on behalf of fund shareholders.
Administrative services — The fund has an administrative services agreement with CRMC under which the fund compensates CRMC for providing administrative services to Class A, C, F, 529 and R shares. These services include, but are not limited to, coordinating, monitoring, assisting and overseeing third parties that provide services to fund shareholders. Under the agreement, Class A shares pay an annual fee of 0.01% and Class C, F, 529 and R shares pay an annual fee of 0.05% of their respective average daily net assets.
529 plan services — Each 529 share class is subject to service fees to compensate the Virginia College Savings Plan (“Virginia529”) for its oversight and administration of the 529 college savings plan. From November 1, 2015 to June 30, 2016, the quarterly fee was based on a series of decreasing annual rates beginning with 0.10% on the first $30 billion of the net assets invested in Class 529 shares of the American Funds and decreasing to 0.05% on such assets in excess of $70 billion. Effective July 1, 2016, the quarterly fee was amended to annual rates of 0.10% on the first $20 billion of the net assets invested in the Class 529 shares of the American Funds, 0.05% on such assets between $20 billion and $100 billion, and 0.03% on such assets over $100 billion. The fee for any given calendar quarter is accrued and calculated on the basis of the average net assets of Class 529 shares of the American Funds for the last month of the prior calendar quarter. The fee is included in other expenses in the fund’s statement of operations. Virginia529 is not considered a related party to the fund.
For the year ended October 31, 2016, class-specific expenses under the agreements were as follows (dollars in thousands):
| Share class | | Distribution
services | | | Transfer agent
services | | | Administrative
services | | | 529 plan
services |
| Class A | | $169,710 | | | $68,220 | | | $6,975 | | | Not applicable |
| Class B | | 2,188 | | | 253 | | | Not applicable | | | Not applicable |
| Class C | | 61,043 | | | 5,986 | | | 3,059 | | | Not applicable |
| Class F-1 | | 10,398 | | | 5,137 | | | 2,086 | | | Not applicable |
| Class F-2 | | Not applicable | | | 6,308 | | | 3,039 | | | Not applicable |
| Class 529-A | | 4,811 | | | 1,744 | | | 1,074 | | | $1,764 |
| Class 529-B | | 174 | | | 20 | | | 9 | | | 15 |
| Class 529-C | | 6,716 | | | 589 | | | 339 | | | 557 |
| Class 529-E | | 446 | | | 32 | | | 45 | | | 74 |
| Class 529-F-1 | | — | | | 57 | | | 35 | | | 58 |
| Class R-1 | | 1,404 | | | 147 | | | 70 | | | Not applicable |
| Class R-2 | | 4,820 | | | 2,310 | | | 324 | | | Not applicable |
| Class R-2E | | 30 | | | 10 | | | 2 | | | Not applicable |
| Class R-3 | | 4,903 | | | 1,630 | | | 492 | | | Not applicable |
| Class R-4 | | 1,627 | | | 704 | | | 327 | | | Not applicable |
| Class R-5E* | | Not applicable | | | — | † | | — | † | | Not applicable |
| Class R-5 | | Not applicable | | | 202 | | | 162 | | | Not applicable |
| Class R-6 | | Not applicable | | | 127 | | | 2,971 | | | Not applicable |
| Total class-specific expenses | | $268,270 | | | $93,476 | | | $21,009 | | | $2,468 |
| * | Class R-5E shares were offered beginning November 20, 2015. |
| † | Amount less than one thousand. |
Trustees’ deferred compensation — Trustees who are unaffiliated with CRMC may elect to defer the cash payment of part or all of their compensation. These deferred amounts, which remain as liabilities of the fund, are treated as if invested in shares of the fund or other American Funds. These amounts represent general, unsecured liabilities of the fund and vary according to the total returns of the selected funds. Trustees’ compensation of $481,000 in the fund’s statement of operations reflects $344,000 in current fees (either paid in cash or deferred) and a net increase of $137,000 in the value of the deferred amounts.
Affiliated officers and trustees — Officers and certain trustees of the fund are or may be considered to be affiliated with CRMC, AFD and AFS. No affiliated officers or trustees received any compensation directly from the fund.
Security transactions with related funds — The fund may purchase from, or sell securities to, other CRMC-managed funds (or funds managed by certain affiliates of CRMC) under procedures adopted by the fund’s board of trustees. The funds involved in such transactions are considered related by virtue of having a common investment adviser (or affiliated investment advisers), common trustees and/or common officers. When such transactions occur, each transaction is executed at the current market price of the security and no brokerage commissions or fees are paid in accordance with Rule 17a-7 of the 1940 Act.
8. Capital share transactions
Capital share transactions in the fund were as follows (dollars and shares in thousands):
| | | Sales1 | | | Reinvestments of
dividends | | | Repurchases1 | | | Net (decrease)
increase | |
| Share class | | Amount | | | Shares | | | Amount | | | Shares | | | Amount | | | Shares | | | Amount | | | Shares | |
| | | | | | | | | | | | | | | | | | | | | | | | | |
| Year ended October 31, 2016 |
| | | | | | | | | | | | | | | | | | | | | | | | | | | | | | | | | |
| Class A | | $ | 6,406,158 | | | | 112,021 | | | $ | 2,382,869 | | | | 41,880 | | | $ | (9,167,996 | ) | | | (159,692 | ) | | $ | (378,969 | ) | | | (5,791 | ) |
| Class B | | | 1,843 | | | | 32 | | | | 5,474 | | | | 97 | | | | (306,824 | ) | | | (5,365 | ) | | | (299,507 | ) | | | (5,236 | ) |
| Class C | | | 897,986 | | | | 15,687 | | | | 160,353 | | | | 2,816 | | | | (1,552,478 | ) | | | (27,071 | ) | | | (494,139 | ) | | | (8,568 | ) |
| Class F-1 | | | 1,102,047 | | | | 19,242 | | | | 139,055 | | | | 2,443 | | | | (861,777 | ) | | | (15,011 | ) | | | 379,325 | | | | 6,674 | |
| Class F-2 | | | 3,535,895 | | | | 61,158 | | | | 205,284 | | | | 3,605 | | | | (1,452,288 | ) | | | (25,319 | ) | | | 2,288,891 | | | | 39,444 | |
| Class 529-A | | | 217,113 | | | | 3,791 | | | | 73,336 | | | | 1,289 | | | | (301,636 | ) | | | (5,247 | ) | | | (11,187 | ) | | | (167 | ) |
| Class 529-B | | | 335 | | | | 6 | | | | 424 | | | | 7 | | | | (21,622 | ) | | | (378 | ) | | | (20,863 | ) | | | (365 | ) |
| Class 529-C | | | 76,400 | | | | 1,335 | | | | 17,866 | | | | 314 | | | | (118,114 | ) | | | (2,057 | ) | | | (23,848 | ) | | | (408 | ) |
| Class 529-E | | | 10,021 | | | | 175 | | | | 2,859 | | | | 50 | | | | (14,202 | ) | | | (247 | ) | | | (1,322 | ) | | | (22 | ) |
| Class 529-F-1 | | | 16,662 | | | | 288 | | | | 2,560 | | | | 45 | | | | (12,499 | ) | | | (217 | ) | | | 6,723 | | | | 116 | |
| Class R-1 | | | 19,646 | | | | 343 | | | | 3,805 | | | | 67 | | | | (34,944 | ) | | | (607 | ) | | | (11,493 | ) | | | (197 | ) |
| Class R-2 | | | 130,466 | | | | 2,281 | | | | 17,581 | | | | 309 | | | | (194,120 | ) | | | (3,392 | ) | | | (46,073 | ) | | | (802 | ) |
| Class R-2E | | | 21,254 | | | | 366 | | | | 137 | | | | 2 | | | | (9,948 | ) | | | (169 | ) | | | 11,443 | | | | 199 | |
| Class R-3 | | | 229,441 | | | | 3,997 | | | | 30,883 | | | | 542 | | | | (253,080 | ) | | | (4,418 | ) | | | 7,244 | | | | 121 | |
| Class R-4 | | | 293,727 | | | | 5,084 | | | | 22,950 | | | | 403 | | | | (161,837 | ) | | | (2,827 | ) | | | 154,840 | | | | 2,660 | |
| Class R-5E2 | | | 10 | | | | — | 3 | | | — | | | | — | | | | — | | | | — | | | | 10 | | | | — | 3 |
| Class R-5 | | | 85,173 | | | | 1,494 | | | | 12,077 | | | | 213 | | | | (279,924 | ) | | | (4,875 | ) | | | (182,674 | ) | | | (3,168 | ) |
| Class R-6 | | | 1,765,044 | | | | 30,814 | | | | 225,137 | | | | 3,953 | | | | (368,345 | ) | | | (6,454 | ) | | | 1,621,836 | | | | 28,313 | |
| Total net increase (decrease) | | $ | 14,809,221 | | | | 258,114 | | | $ | 3,302,650 | | | | 58,035 | | | $ | (15,111,634 | ) | | | (263,346 | ) | | $ | 3,000,237 | | | | 52,803 | |
| | | | | | | | | | | | | | | | | | | | | | | | | | | | | | | | | |
| Year ended October 31, 2015 |
| | | | | | | | | | | | | | | | | | | | | | | | | | | | | | | | | |
| Class A | | $ | 7,198,792 | | | | 120,817 | | | $ | 2,734,420 | | | | 46,458 | | | $ | (6,889,462 | ) | | | (116,072 | ) | | $ | 3,043,750 | | | | 51,203 | |
| Class B | | | 4,878 | | | | 81 | | | | 19,334 | | | | 326 | | | | (450,385 | ) | | | (7,525 | ) | | | (426,173 | ) | | | (7,118 | ) |
| Class C | | | 1,056,511 | | | | 17,702 | | | | 207,251 | | | | 3,512 | | | | (1,610,507 | ) | | | (27,046 | ) | | | (346,745 | ) | | | (5,832 | ) |
| Class F-1 | | | 1,241,853 | | | | 20,803 | | | | 143,346 | | | | 2,437 | | | | (660,258 | ) | | | (11,137 | ) | | | 724,941 | | | | 12,103 | |
| Class F-2 | | | 1,649,536 | | | | 27,713 | | | | 184,494 | | | | 3,140 | | | | (807,568 | ) | | | (13,678 | ) | | | 1,026,462 | | | | 17,175 | |
| Class 529-A | | | 237,458 | | | | 3,982 | | | | 86,292 | | | | 1,466 | | | | (278,715 | ) | | | (4,688 | ) | | | 45,035 | | | | 760 | |
| Class 529-B | | | 1,010 | | | | 17 | | | | 1,290 | | | | 22 | | | | (25,458 | ) | | | (426 | ) | | | (23,158 | ) | | | (387 | ) |
| Class 529-C | | | 85,717 | | | | 1,438 | | | | 22,384 | | | | 380 | | | | (107,783 | ) | | | (1,815 | ) | | | 318 | | | | 3 | |
| Class 529-E | | | 10,361 | | | | 174 | | | | 3,401 | | | | 58 | | | | (12,492 | ) | | | (210 | ) | | | 1,270 | | | | 22 | |
| Class 529-F-1 | | | 14,614 | | | | 245 | | | | 2,902 | | | | 49 | | | | (14,939 | ) | | | (251 | ) | | | 2,577 | | | | 43 | |
| Class R-1 | | | 27,493 | | | | 462 | | | | 4,764 | | | | 81 | | | | (31,130 | ) | | | (524 | ) | | | 1,127 | | | | 19 | |
| Class R-2 | | | 138,235 | | | | 2,323 | | | | 23,295 | | | | 395 | | | | (198,678 | ) | | | (3,345 | ) | | | (37,148 | ) | | | (627 | ) |
| Class R-2E | | | 124 | | | | 1 | | | | 5 | | | | — | 3 | | | (84 | ) | | | (1 | ) | | | 45 | | | | — | 3 |
| Class R-3 | | | 221,671 | | | | 3,724 | | | | 37,253 | | | | 633 | | | | (265,518 | ) | | | (4,472 | ) | | | (6,594 | ) | | | (115 | ) |
| Class R-4 | | | 152,429 | | | | 2,568 | | | | 23,346 | | | | 397 | | | | (127,023 | ) | | | (2,139 | ) | | | 48,752 | | | | 826 | |
| Class R-5 | | | 99,452 | | | | 1,662 | | | | 16,785 | | | | 285 | | | | (84,017 | ) | | | (1,422 | ) | | | 32,220 | | | | 525 | |
| Class R-6 | | | 1,482,960 | | | | 24,930 | | | | 209,393 | | | | 3,561 | | | | (813,738 | ) | | | (13,720 | ) | | | 878,615 | | | | 14,771 | |
| Total net increase (decrease) | | $ | 13,623,094 | | | | 228,642 | | | $ | 3,719,955 | | | | 63,200 | | | $ | (12,377,755 | ) | | | (208,471 | ) | | $ | 4,965,294 | | | | 83,371 | |
| 1 | Includes exchanges between share classes of the fund. |
| 2 | Class R-5E shares were offered beginning November 20, 2015. |
| 3 | Amount less than one thousand. |
9. Investment transactions
The fund made purchases and sales of investment securities, excluding short-term securities and U.S. government obligations, if any, of $39,571,460,000 and $36,500,468,000, respectively, during the year ended October 31, 2016.
Financial highlights
| | | | | | Income (loss) from
investment operations1 | | | | | | | | | | | | | | | | | | | |
| | | Net asset
value,
beginning
of period | | |
Net
investment
income2 | | | Net (losses)
gains on
securities (both
realized and
unrealized) | | | Total from
investment
operations | | | Dividends
(from net
investment
income) | | | Net asset
value,
end
of period | | | Total
return3 | | | Net assets,
end of period
(in millions) | | | Ratio of
expenses
to average
net assets2 | | | Ratio of
net income
to average
net assets2 | |
| Class A: | | | | | | | | | | | | | | | | | | | | | | | | | | | | | | | | | | | | | | | | |
| Year ended 10/31/2016 | | | 57.96 | | | | 1.91 | | | | (.37 | ) | | | 1.54 | | | | (2.02 | ) | | | 57.48 | | | | 2.74 | | | | 69,127 | | | | .60 | | | | 3.34 | |
| Year ended 10/31/2015 | | | 60.76 | | | | 1.97 | | | | (2.38 | ) | | | (.41 | ) | | | (2.39 | ) | | | 57.96 | | | | (.69 | ) | | | 70,041 | | | | .59 | | | | 3.31 | |
| Year ended 10/31/2014 | | | 58.25 | | | | 2.64 | | | | 2.28 | | | | 4.92 | | | | (2.41 | ) | | | 60.76 | | | | 8.64 | | | | 70,314 | | | | .62 | | | | 4.44 | |
| Year ended 10/31/2013 | | | 52.75 | | | | 1.85 | | | | 5.88 | | | | 7.73 | | | | (2.23 | ) | | | 58.25 | | | | 14.99 | | | | 65,602 | | | | .61 | | | | 3.35 | |
| Year ended 10/31/2012 | | | 49.34 | | | | 1.87 | | | | 3.67 | | | | 5.54 | | | | (2.13 | ) | | | 52.75 | | | | 11.48 | | | | 58,027 | | | | .63 | | | | 3.68 | |
| Class B: | | | | | | | | | | | | | | | | | | | | | | | | | | | | | | | | | | | | | | | | |
| Year ended 10/31/2016 | | | 58.13 | | | | 1.48 | | | | (.37 | ) | | | 1.11 | | | | (1.47 | ) | | | 57.77 | | | | 1.95 | | | | 87 | | | | 1.36 | | | | 2.58 | |
| Year ended 10/31/2015 | | | 60.87 | | | | 1.52 | | | | (2.38 | ) | | | (.86 | ) | | | (1.88 | ) | | | 58.13 | | | | (1.43 | ) | | | 392 | | | | 1.34 | | | | 2.53 | |
| Year ended 10/31/2014 | | | 58.33 | | | | 2.25 | | | | 2.22 | | | | 4.47 | | | | (1.93 | ) | | | 60.87 | | | | 7.83 | | | | 844 | | | | 1.38 | | | | 3.79 | |
| Year ended 10/31/2013 | | | 52.79 | | | | 1.42 | | | | 5.90 | | | | 7.32 | | | | (1.78 | ) | | | 58.33 | | | | 14.12 | | | | 1,207 | | | | 1.37 | | | | 2.59 | |
| Year ended 10/31/2012 | | | 49.36 | | | | 1.50 | | | | 3.66 | | | | 5.16 | | | | (1.73 | ) | | | 52.79 | | | | 10.64 | | | | 1,613 | | | | 1.38 | | | | 2.94 | |
| Class C: | | | | | | | | | | | | | | | | | | | | | | | | | | | | | | | | | | | | | | | | |
| Year ended 10/31/2016 | | | 57.98 | | | | 1.46 | | | | (.37 | ) | | | 1.09 | | | | (1.56 | ) | | | 57.51 | | | | 1.92 | | | | 5,822 | | | | 1.40 | | | | 2.54 | |
| Year ended 10/31/2015 | | | 60.77 | | | | 1.50 | | | | (2.39 | ) | | | (.89 | ) | | | (1.90 | ) | | | 57.98 | | | | (1.48 | ) | | | 6,367 | | | | 1.38 | | | | 2.51 | |
| Year ended 10/31/2014 | | | 58.25 | | | | 2.17 | | | | 2.27 | | | | 4.44 | | | | (1.92 | ) | | | 60.77 | | | | 7.78 | | | | 7,027 | | | | 1.42 | | | | 3.66 | |
| Year ended 10/31/2013 | | | 52.75 | | | | 1.40 | | | | 5.88 | | | | 7.28 | | | | (1.78 | ) | | | 58.25 | | | | 14.06 | | | | 7,159 | | | | 1.41 | | | | 2.55 | |
| Year ended 10/31/2012 | | | 49.34 | | | | 1.47 | | | | 3.66 | | | | 5.13 | | | | (1.72 | ) | | | 52.75 | | | | 10.60 | | | | 6,970 | | | | 1.43 | | | | 2.89 | |
| Class F-1: | | | | | | | | | | | | | | | | | | | | | | | | | | | | | | | | | | | | | | | | |
| Year ended 10/31/2016 | | | 57.96 | | | | 1.87 | | | | (.37 | ) | | | 1.50 | | | | (1.98 | ) | | | 57.48 | | | | 2.66 | | | | 4,338 | | | | .67 | | | | 3.26 | |
| Year ended 10/31/2015 | | | 60.77 | | | | 1.93 | | | | (2.39 | ) | | | (.46 | ) | | | (2.35 | ) | | | 57.96 | | | | (.76 | ) | | | 3,987 | | | | .65 | | | | 3.25 | |
| Year ended 10/31/2014 | | | 58.25 | | | | 2.69 | | | | 2.19 | | | | 4.88 | | | | (2.36 | ) | | | 60.77 | | | | 8.57 | | | | 3,445 | | | | .69 | | | | 4.53 | |
| Year ended 10/31/2013 | | | 52.75 | | | | 1.82 | | | | 5.88 | | | | 7.70 | | | | (2.20 | ) | | | 58.25 | | | | 14.93 | | | | 4,065 | | | | .67 | | | | 3.30 | |
| Year ended 10/31/2012 | | | 49.35 | | | | 1.86 | | | | 3.66 | | | | 5.52 | | | | (2.12 | ) | | | 52.75 | | | | 11.44 | | | | 3,106 | | | | .66 | | | | 3.65 | |
| Class F-2: | | | | | | | | | | | | | | | | | | | | | | | | | | | | | | | | | | | | | | | | |
| Year ended 10/31/2016 | | | 57.94 | | | | 2.01 | | | | (.36 | ) | | | 1.65 | | | | (2.14 | ) | | | 57.45 | | | | 2.93 | | | | 7,506 | | | | .40 | | | | 3.50 | |
| Year ended 10/31/2015 | | | 60.74 | | | | 2.08 | | | | (2.38 | ) | | | (.30 | ) | | | (2.50 | ) | | | 57.94 | | | | (.49 | ) | | | 5,284 | | | | .40 | | | | 3.50 | |
| Year ended 10/31/2014 | | | 58.23 | | | | 2.59 | | | | 2.44 | | | | 5.03 | | | | (2.52 | ) | | | 60.74 | | | | 8.86 | | | | 4,496 | | | | .42 | | | | 4.37 | |
| Year ended 10/31/2013 | | | 52.73 | | | | 1.94 | | | | 5.89 | | | | 7.83 | | | | (2.33 | ) | | | 58.23 | | | | 15.21 | | | | 2,213 | | | | .41 | | | | 3.52 | |
| Year ended 10/31/2012 | | | 49.32 | | | | 1.98 | | | | 3.67 | | | | 5.65 | | | | (2.24 | ) | | | 52.73 | | | | 11.71 | | | | 2,132 | | | | .41 | | | | 3.88 | |
| Class 529-A: | | | | | | | | | | | | | | | | | | | | | | | | | | | | | | | | | | | | | | | | |
| Year ended 10/31/2016 | | | 57.94 | | | | 1.86 | | | | (.36 | ) | | | 1.50 | | | | (1.97 | ) | | | 57.47 | | | | 2.66 | | | | 2,143 | | | | .69 | | | | 3.25 | |
| Year ended 10/31/2015 | | | 60.74 | | | | 1.91 | | | | (2.38 | ) | | | (.47 | ) | | | (2.33 | ) | | | 57.94 | | | | (.80 | ) | | | 2,170 | | | | .68 | | | | 3.22 | |
| Year ended 10/31/2014 | | | 58.23 | | | | 2.58 | | | | 2.28 | | | | 4.86 | | | | (2.35 | ) | | | 60.74 | | | | 8.56 | | | | 2,229 | | | | .72 | | | | 4.35 | |
| Year ended 10/31/2013 | | | 52.74 | | | | 1.80 | | | | 5.87 | | | | 7.67 | | | | (2.18 | ) | | | 58.23 | | | | 14.86 | | | | 2,063 | | | | .70 | | | | 3.26 | |
| Year ended 10/31/2012 | | | 49.33 | | | | 1.83 | | | | 3.67 | | | | 5.50 | | | | (2.09 | ) | | | 52.74 | | | | 11.39 | | | | 1,805 | | | | .72 | | | | 3.59 | |
| Class 529-B: | | | | | | | | | | | | | | | | | | | | | | | | | | | | | | | | | | | | | | | | |
| Year ended 10/31/2016 | | | 58.08 | | | | 1.41 | | | | (.36 | ) | | | 1.05 | | | | (1.41 | ) | | | 57.72 | | | | 1.85 | | | | 8 | | | | 1.49 | | | | 2.47 | |
| Year ended 10/31/2015 | | | 60.83 | | | | 1.45 | | | | (2.39 | ) | | | (.94 | ) | | | (1.81 | ) | | | 58.08 | | | | (1.55 | ) | | | 30 | | | | 1.46 | | | | 2.42 | |
| Year ended 10/31/2014 | | | 58.29 | | | | 2.16 | | | | 2.23 | | | | 4.39 | | | | (1.85 | ) | | | 60.83 | | | | 7.69 | | | | 55 | | | | 1.50 | | | | 3.64 | |
| Year ended 10/31/2013 | | | 52.76 | | | | 1.36 | | | | 5.89 | | | | 7.25 | | | | (1.72 | ) | | | 58.29 | | | | 13.99 | | | | 74 | | | | 1.49 | | | | 2.47 | |
| Year ended 10/31/2012 | | | 49.34 | | | | 1.43 | | | | 3.66 | | | | 5.09 | | | | (1.67 | ) | | | 52.76 | | | | 10.50 | | | | 92 | | | | 1.51 | | | | 2.82 | |
| | | | | | Income (loss) from
investment operations1 | | | | | | | | | | | | | | | | | | | |
| | | Net asset
value,
beginning
of period | | | Net
investment
income2 | | | Net (losses)
gains on
securities (both
realized and
unrealized) | | | Total from
investment
operations | | | Dividends
(from net
investment
income) | | | Net asset
value,
end
of period | | | Total
return3 | | | Net assets,
end of period
(in millions) | | | Ratio of
expenses
to average
net assets2 | | | Ratio of
net income
to average
net assets2 | |
| Class 529-C: | | | | | | | | | | | | | | | | | | | | | | | | | | | | | | | | | | | | | | | | |
| Year ended 10/31/2016 | | | 57.91 | | | | 1.42 | | | | (.37 | ) | | | 1.05 | | | | (1.52 | ) | | | 57.44 | | | | 1.86 | | | | 665 | | | | 1.46 | | | | 2.48 | |
| Year ended 10/31/2015 | | | 60.71 | | | | 1.45 | | | | (2.38 | ) | | | (.93 | ) | | | (1.87 | ) | | | 57.91 | | | | (1.55 | ) | | | 694 | | | | 1.46 | | | | 2.44 | |
| Year ended 10/31/2014 | | | 58.20 | | | | 2.12 | | | | 2.28 | | | | 4.40 | | | | (1.89 | ) | | | 60.71 | | | | 7.71 | | | | 728 | | | | 1.49 | | | | 3.57 | |
| Year ended 10/31/2013 | | | 52.71 | | | | 1.37 | | | | 5.87 | | | | 7.24 | | | | (1.75 | ) | | | 58.20 | | | | 13.99 | | | | 682 | | | | 1.48 | | | | 2.48 | |
| Year ended 10/31/2012 | | | 49.31 | | | | 1.43 | | | | 3.66 | | | | 5.09 | | | | (1.69 | ) | | | 52.71 | | | | 10.52 | | | | 611 | | | | 1.50 | | | | 2.81 | |
| Class 529-E: | | | | | | | | | | | | | | | | | | | | | | | | | | | | | | | | | | | | | | | | |
| Year ended 10/31/2016 | | | 57.94 | | | | 1.73 | | | | (.36 | ) | | | 1.37 | | | | (1.84 | ) | | | 57.47 | | | | 2.42 | | | | 89 | | | | .92 | | | | 3.02 | |
| Year ended 10/31/2015 | | | 60.74 | | | | 1.77 | | | | (2.38 | ) | | | (.61 | ) | | | (2.19 | ) | | | 57.94 | | | | (1.02 | ) | | | 91 | | | | .92 | | | | 2.98 | |
| Year ended 10/31/2014 | | | 58.23 | | | | 2.44 | | | | 2.28 | | | | 4.72 | | | | (2.21 | ) | | | 60.74 | | | | 8.28 | | | | 94 | | | | .95 | | | | 4.11 | |
| Year ended 10/31/2013 | | | 52.73 | | | | 1.66 | | | | 5.89 | | | | 7.55 | | | | (2.05 | ) | | | 58.23 | | | | 14.62 | | | | 88 | | | | .94 | | | | 3.02 | |
| Year ended 10/31/2012 | | | 49.33 | | | | 1.71 | | | | 3.65 | | | | 5.36 | | | | (1.96 | ) | | | 52.73 | | | | 11.10 | | | | 77 | | | | .96 | | | | 3.35 | |
| Class 529-F-1: | | | | | | | | | | | | | | | | | | | | | | | | | | | | | | | | | | | | | | | | |
| Year ended 10/31/2016 | | | 57.96 | | | | 1.99 | | | | (.37 | ) | | | 1.62 | | | | (2.10 | ) | | | 57.48 | | | | 2.87 | | | | 75 | | | | .46 | | | | 3.47 | |
| Year ended 10/31/2015 | | | 60.76 | | | | 2.05 | | | | (2.38 | ) | | | (.33 | ) | | | (2.47 | ) | | | 57.96 | | | | (.55 | ) | | | 69 | | | | .46 | | | | 3.44 | |
| Year ended 10/31/2014 | | | 58.25 | | | | 2.72 | | | | 2.27 | | | | 4.99 | | | | (2.48 | ) | | | 60.76 | | | | 8.78 | | | | 70 | | | | .49 | | | | 4.58 | |
| Year ended 10/31/2013 | | | 52.75 | | | | 1.92 | | | | 5.88 | | | | 7.80 | | | | (2.30 | ) | | | 58.25 | | | | 15.14 | | | | 63 | | | | .48 | | | | 3.48 | |
| Year ended 10/31/2012 | | | 49.34 | | | | 1.94 | | | | 3.67 | | | | 5.61 | | | | (2.20 | ) | | | 52.75 | | | | 11.63 | | | | 54 | | | | .50 | | | | 3.81 | |
| Class R-1: | | | | | | | | | | | | | | | | | | | | | | | | | | | | | | | | | | | | | | | | |
| Year ended 10/31/2016 | | | 57.94 | | | | 1.46 | | | | (.38 | ) | | | 1.08 | | | | (1.56 | ) | | | 57.46 | | | | 1.91 | | | | 134 | | | | 1.40 | | | | 2.54 | |
| Year ended 10/31/2015 | | | 60.73 | | | | 1.49 | | | | (2.37 | ) | | | (.88 | ) | | | (1.91 | ) | | | 57.94 | | | | (1.48 | ) | | | 146 | | | | 1.39 | | | | 2.51 | |
| Year ended 10/31/2014 | | | 58.22 | | | | 2.16 | | | | 2.27 | | | | 4.43 | | | | (1.92 | ) | | | 60.73 | | | | 7.79 | | | | 152 | | | | 1.42 | | | | 3.64 | |
| Year ended 10/31/2013 | | | 52.72 | | | | 1.41 | | | | 5.88 | | | | 7.29 | | | | (1.79 | ) | | | 58.22 | | | | 14.08 | | | | 150 | | | | 1.40 | | | | 2.55 | |
| Year ended 10/31/2012 | | | 49.31 | | | | 1.48 | | | | 3.66 | | | | 5.14 | | | | (1.73 | ) | | | 52.72 | | | | 10.63 | | | | 151 | | | | 1.41 | | | | 2.90 | |
| Class R-2: | | | | | | | | | | | | | | | | | | | | | | | | | | | | | | | | | | | | | | | | |
| Year ended 10/31/2016 | | | 57.94 | | | | 1.45 | | | | (.37 | ) | | | 1.08 | | | | (1.56 | ) | | | 57.46 | | | | 1.92 | | | | 628 | | | | 1.40 | | | | 2.54 | |
| Year ended 10/31/2015 | | | 60.73 | | | | 1.51 | | | | (2.37 | ) | | | (.86 | ) | | | (1.93 | ) | | | 57.94 | | | | (1.44 | ) | | | 680 | | | | 1.35 | | | | 2.54 | |
| Year ended 10/31/2014 | | | 58.22 | | | | 2.18 | | | | 2.27 | | | | 4.45 | | | | (1.94 | ) | | | 60.73 | | | | 7.79 | | | | 751 | | | | 1.41 | | | | 3.67 | |
| Year ended 10/31/2013 | | | 52.72 | | | | 1.43 | | | | 5.88 | | | | 7.31 | | | | (1.81 | ) | | | 58.22 | | | | 14.13 | | | | 759 | | | | 1.37 | | | | 2.60 | |
| Year ended 10/31/2012 | | | 49.32 | | | | 1.47 | | | | 3.66 | | | | 5.13 | | | | (1.73 | ) | | | 52.72 | | | | 10.60 | | | | 720 | | | | 1.41 | | | | 2.90 | |
| Class R-2E: | | | | | | | | | | | | | | | | | | | | | | | | | | | | | | | | | | | | | | | | |
| Year ended 10/31/2016 | | | 57.88 | | | | 1.60 | | | | (.33 | ) | | | 1.27 | | | | (1.85 | ) | | | 57.30 | | | | 2.27 | | | | 12 | | | | 1.11 | | | | 2.80 | |
| Year ended 10/31/2015 | | | 60.71 | | | | 1.75 | | | | (2.41 | ) | | | (.66 | ) | | | (2.17 | ) | | | 57.88 | | | | (1.12 | ) | | | — | 4 | | | 1.00 | | | | 2.93 | |
| Period from 8/29/2014 to 10/31/20145,6 | | | 61.50 | | | | .16 | | | | (.41 | ) | | | (.25 | ) | | | (.54 | ) | | | 60.71 | | | | (.39 | )7,8 | | | — | 4 | | | .15 | 7,8 | | | .28 | 7,8 |
| Class R-3: | | | | | | | | | | | | | | | | | | | | | | | | | | | | | | | | | | | | | | | | |
| Year ended 10/31/2016 | | | 57.95 | | | | 1.70 | | | | (.37 | ) | | | 1.33 | | | | (1.81 | ) | | | 57.47 | | | | 2.37 | | | | 993 | | | | .96 | | | | 2.97 | |
| Year ended 10/31/2015 | | | 60.74 | | | | 1.76 | | | | (2.38 | ) | | | (.62 | ) | | | (2.17 | ) | | | 57.95 | | | | (1.04 | ) | | | 994 | | | | .94 | | | | 2.95 | |
| Year ended 10/31/2014 | | | 58.23 | | | | 2.42 | | | | 2.28 | | | | 4.70 | | | | (2.19 | ) | | | 60.74 | | | | 8.26 | | | | 1,049 | | | | .98 | | | | 4.08 | |
| Year ended 10/31/2013 | | | 52.74 | | | | 1.65 | | | | 5.87 | | | | 7.52 | | | | (2.03 | ) | | | 58.23 | | | | 14.57 | | | | 1,011 | | | | .97 | | | | 3.00 | |
| Year ended 10/31/2012 | | | 49.33 | | | | 1.69 | | | | 3.67 | | | | 5.36 | | | | (1.95 | ) | | | 52.74 | | | | 11.10 | | | | 953 | | | | .98 | | | | 3.33 | |
See page 32 for footnotes.
Financial highlights (continued)
| | | | | | Income (loss) from
investment operations1 | | | | | | | | | | | | | | | | | | | |
| | | Net asset
value,
beginning
of period | | | Net
investment
income2 | | | Net (losses)
gains on
securities (both
realized and
unrealized) | | | Total from
investment
operations | | | Dividends
(from net
investment
income) | | | Net asset
value,
end
of period | | | Total
return3 | | | Net assets,
end of period
(in millions) | | | Ratio of
expenses
to average
net assets2 | | | Ratio of
net income
to average
net assets2 | |
| Class R-4: | | | | | | | | | | | | | | | | | | | | | | | | | | | | | | | | | | | | | | | | |
| Year ended 10/31/2016 | | | 57.95 | | | | 1.86 | | | | (.35 | ) | | | 1.51 | | | | (2.00 | ) | | | 57.46 | | | | 2.68 | | | | 751 | | | | .65 | | | | 3.24 | |
| Year ended 10/31/2015 | | | 60.75 | | | | 1.94 | | | | (2.38 | ) | | | (.44 | ) | | | (2.36 | ) | | | 57.95 | | | | (.74 | ) | | | 603 | | | | .64 | | | | 3.25 | |
| Year ended 10/31/2014 | | | 58.24 | | | | 2.60 | | | | 2.28 | | | | 4.88 | | | | (2.37 | ) | | | 60.75 | | | | 8.58 | | | | 582 | | | | .67 | | | | 4.38 | |
| Year ended 10/31/2013 | | | 52.74 | | | | 1.82 | | | | 5.89 | | | | 7.71 | | | | (2.21 | ) | | | 58.24 | | | | 14.95 | | | | 530 | | | | .65 | | | | 3.31 | |
| Year ended 10/31/2012 | | | 49.33 | | | | 1.86 | | | | 3.66 | | | | 5.52 | | | | (2.11 | ) | | | 52.74 | | | | 11.46 | | | | 452 | | | | .66 | | | | 3.65 | |
| Class R-5E: | | | | | | | | | | | | | | | | | | | | | | | | | | | | | | | | | | | | | | | | |
| Period from 11/20/2015 to 10/31/20165,9 | | | 57.40 | | | | 1.84 | | | | .30 | | | | 2.14 | | | | (2.09 | ) | | | 57.45 | | | | 3.82 | 7 | | | — | 4 | | | .52 | 10 | | | 3.40 | 10 |
| Class R-5: | | | | | | | | | | | | | | | | | | | | | | | | | | | | | | | | | | | | | | | | |
| Year ended 10/31/2016 | | | 57.98 | | | | 2.11 | | | | (.44 | ) | | | 1.67 | | | | (2.15 | ) | | | 57.50 | | | | 2.98 | | | | 208 | | | | .37 | | | | 3.68 | |
| Year ended 10/31/2015 | | | 60.79 | | | | 2.12 | | | | (2.40 | ) | | | (.28 | ) | | | (2.53 | ) | | | 57.98 | | | | (.45 | ) | | | 394 | | | | .34 | | | | 3.56 | |
| Year ended 10/31/2014 | | | 58.27 | | | | 2.88 | | | | 2.19 | | | | 5.07 | | | | (2.55 | ) | | | 60.79 | | | | 8.92 | | | | 381 | | | | .38 | | | | 4.85 | |
| Year ended 10/31/2013 | | | 52.77 | | | | 2.00 | | | | 5.87 | | | | 7.87 | | | | (2.37 | ) | | | 58.27 | | | | 15.28 | | | | 473 | | | | .35 | | | | 3.62 | |
| Year ended 10/31/2012 | | | 49.35 | | | | 2.01 | | | | 3.67 | | | | 5.68 | | | | (2.26 | ) | | | 52.77 | | | | 11.79 | | | | 449 | | | | .36 | | | | 3.94 | |
| Class R-6: | | | | | | | | | | | | | | | | | | | | | | | | | | | | | | | | | | | | | | | | |
| Year ended 10/31/2016 | | | 57.97 | | | | 2.08 | | | | (.37 | ) | | | 1.71 | | | | (2.19 | ) | | | 57.49 | | | | 3.05 | | | | 6,806 | | | | .30 | | | | 3.62 | |
| Year ended 10/31/2015 | | | 60.77 | | | | 2.14 | | | | (2.38 | ) | | | (.24 | ) | | | (2.56 | ) | | | 57.97 | | | | (.40 | ) | | | 5,222 | | | | .30 | | | | 3.60 | |
| Year ended 10/31/2014 | | | 58.26 | | | | 2.76 | | | | 2.33 | | | | 5.09 | | | | (2.58 | ) | | | 60.77 | | | | 8.95 | | | | 4,577 | | | | .32 | | | | 4.66 | |
| Year ended 10/31/2013 | | | 52.76 | | | | 2.04 | | | | 5.86 | | | | 7.90 | | | | (2.40 | ) | | | 58.26 | | | | 15.35 | | | | 2,963 | | | | .30 | | | | 3.69 | |
| Year ended 10/31/2012 | | | 49.35 | | | | 2.02 | | | | 3.68 | | | | 5.70 | | | | (2.29 | ) | | | 52.76 | | | | 11.83 | | | | 1,039 | | | | .32 | | | | 3.96 | |
| | | Year ended October 31 |
| Portfolio turnover rate for all share classes11 | | 2016 | | 2015 | | 2014 | | 2013 | | 2012 |
| Including mortgage dollar roll transactions | | 47% | | 63% | | 55% | | 69% | | 68% |
| Excluding mortgage dollar roll transactions | | 38% | | 50% | | Not available |
| 1 | Based on average shares outstanding. |
| 2 | For the year ended October 31, 2014, this column reflects the impact of a corporate action event that resulted in a one-time increase to net investment income. If the corporate action event had not occurred, the Class A net investment income per share would have been lower by $.68; the Class A ratio of expenses to average net assets would have been lower by .03 percentage points; and the Class A ratio of net income to average net assets would have been lower by 1.15 percentage points. The impact to the other share classes would have been similar. |
| 3 | Total returns exclude any applicable sales charges, including contingent deferred sales charges. |
| 4 | Amount less than $1 million. |
| 5 | Based on operations for the period shown and, accordingly, is not representative of a full year. |
| 6 | Class R-2E shares were offered beginning August 29, 2014. |
| 7 | Not annualized. |
| 8 | All or a significant portion of assets in this class consisted of seed capital invested by CRMC and/or its affiliates. Fees for distribution services are not charged or accrued on these seed capital assets. If such fees were paid by the fund on seed capital assets, fund expenses would have been higher and net income and total return would have been lower. |
| 9 | Class R-5E shares were offered beginning November 20, 2015. |
| 10 | Annualized. |
| 11 | Refer to Note 5 for more information on mortgage dollar rolls. |
See Notes to Financial Statements
Report of Independent Registered Public Accounting Firm
To the Board of Trustees and Shareholders of Capital Income Builder
In our opinion, the accompanying statement of assets and liabilities, including the summary investment portfolio, and the related statements of operations and of changes in net assets and the financial highlights present fairly, in all material respects, the financial position of Capital Income Builder (the “Fund”) as of October 31, 2016, the results of its operations for the year then ended, the changes in its net assets for each of the two years in the period then ended and the financial highlights for each of the periods presented, in conformity with accounting principles generally accepted in the United States of America. These financial statements and financial highlights (hereafter referred to as “financial statements”) are the responsibility of the Fund’s management. Our responsibility is to express an opinion on these financial statements based on our audits. We conducted our audits of these financial statements in accordance with the standards of the Public Company Accounting Oversight Board (United States). Those standards require that we plan and perform the audit to obtain reasonable assurance about whether the financial statements are free of material misstatement. An audit includes examining, on a test basis, evidence supporting the amounts and disclosures in the financial statements, assessing the accounting principles used and significant estimates made by management, and evaluating the overall financial statement presentation. We believe that our audits, which included confirmation of securities as of October 31, 2016 by correspondence with the custodian and brokers, provide a reasonable basis for our opinion.
PricewaterhouseCoopers LLP
Los Angeles, California
December 8, 2016
As a fund shareholder, you incur two types of costs: (1) transaction costs, such as initial sales charges on purchase payments and contingent deferred sales charges on redemptions (loads), and (2) ongoing costs, including management fees, distribution and service (12b-1) fees, and other expenses. This example is intended to help you understand your ongoing costs (in dollars) of investing in the fund so you can compare these costs with the ongoing costs of investing in other mutual funds. The example is based on an investment of $1,000 invested at the beginning of the period and held for the entire six-month period (May 1, 2016, through October 31, 2016).
Actual expenses:
The first line of each share class in the table on the following page provides information about actual account values and actual expenses. You may use the information in this line, together with the amount you invested, to estimate the expenses that you paid over the period. Simply divide your account value by $1,000 (for example, an $8,600 account value divided by $1,000 = 8.6), then multiply the result by the number in the first line under the heading titled “Expenses paid during period” to estimate the expenses you paid on your account during this period.
Hypothetical example for comparison purposes:
The second line of each share class in the table on the following page provides information about hypothetical account values and hypothetical expenses based on the actual expense ratio for the share class and an assumed rate of return of 5.00% per year before expenses, which is not the actual return of the share class. The hypothetical account values and expenses may not be used to estimate the actual ending account balance or expenses you paid for the period. You may use this information to compare the ongoing costs of investing in the fund and other funds. To do so, compare this 5.00% hypothetical example with the 5.00% hypothetical examples that appear in the shareholder reports of the other funds.
Notes:
Retirement plan participants may be subject to certain fees charged by the plan sponsor, and Class F-1, F-2 and 529-F-1 shareholders may be subject to fees charged by financial intermediaries, typically ranging from 0.75% to 1.50% of assets annually depending on services offered. You can estimate the impact of these fees by adding the amount of the fees to the total estimated expenses you paid on your account during the period as calculated above. In addition, your ending account value would be lower by the amount of these fees.
Note that the expenses shown in the table on the following page are meant to highlight your ongoing costs only and do not reflect any transactional costs, such as sales charges (loads). Therefore, the second line of each share class in the table is useful in comparing ongoing costs only and will not help you determine the relative total costs of owning different funds. In addition, if these transactional costs were included, your costs would have been higher.
| | | Beginning
account value
5/1/2016 | | | Ending
account value
10/31/2016 | | | Expenses paid
during period* | | | Annualized
expense ratio | |
| Class A - actual return | | $ | 1,000.00 | | | $ | 1,007.97 | | | $ | 3.04 | | | | .60 | % |
| Class A - assumed 5% return | | | 1,000.00 | | | | 1,022.18 | | | | 3.06 | | | | .60 | |
| Class B - actual return | | | 1,000.00 | | | | 1,004.16 | | | | 6.82 | | | | 1.35 | |
| Class B - assumed 5% return | | | 1,000.00 | | | | 1,018.40 | | | | 6.87 | | | | 1.35 | |
| Class C - actual return | | | 1,000.00 | | | | 1,004.01 | | | | 6.97 | | | | 1.38 | |
| Class C - assumed 5% return | | | 1,000.00 | | | | 1,018.25 | | | | 7.02 | | | | 1.38 | |
| Class F-1 - actual return | | | 1,000.00 | | | | 1,007.57 | | | | 3.39 | | | | .67 | |
| Class F-1 - assumed 5% return | | | 1,000.00 | | | | 1,021.83 | | | | 3.41 | | | | .67 | |
| Class F-2 - actual return | | | 1,000.00 | | | | 1,008.99 | | | | 1.97 | | | | .39 | |
| Class F-2 - assumed 5% return | | | 1,000.00 | | | | 1,023.24 | | | | 1.99 | | | | .39 | |
| Class 529-A - actual return | | | 1,000.00 | | | | 1,007.68 | | | | 3.39 | | | | .67 | |
| Class 529-A - assumed 5% return | | | 1,000.00 | | | | 1,021.83 | | | | 3.41 | | | | .67 | |
| Class 529-B - actual return | | | 1,000.00 | | | | 1,003.69 | | | | 7.37 | | | | 1.46 | |
| Class 529-B - assumed 5% return | | | 1,000.00 | | | | 1,017.85 | | | | 7.43 | | | | 1.46 | |
| Class 529-C - actual return | | | 1,000.00 | | | | 1,003.59 | | | | 7.27 | | | | 1.44 | |
| Class 529-C - assumed 5% return | | | 1,000.00 | | | | 1,017.95 | | | | 7.32 | | | | 1.44 | |
| Class 529-E - actual return | | | 1,000.00 | | | | 1,006.53 | | | | 4.55 | | | | .90 | |
| Class 529-E - assumed 5% return | | | 1,000.00 | | | | 1,020.67 | | | | 4.58 | | | | .90 | |
| Class 529-F-1 - actual return | | | 1,000.00 | | | | 1,008.72 | | | | 2.23 | | | | .44 | |
| Class 529-F-1 - assumed 5% return | | | 1,000.00 | | | | 1,022.99 | | | | 2.24 | | | | .44 | |
| Class R-1 - actual return | | | 1,000.00 | | | | 1,003.94 | | | | 7.07 | | | | 1.40 | |
| Class R-1 - assumed 5% return | | | 1,000.00 | | | | 1,018.15 | | | | 7.12 | | | | 1.40 | |
| Class R-2 - actual return | | | 1,000.00 | | | | 1,003.88 | | | | 7.02 | | | | 1.39 | |
| Class R-2 - assumed 5% return | | | 1,000.00 | | | | 1,018.20 | | | | 7.07 | | | | 1.39 | |
| Class R-2E - actual return | | | 1,000.00 | | | | 1,005.44 | | | | 5.71 | | | | 1.13 | |
| Class R-2E - assumed 5% return | | | 1,000.00 | | | | 1,019.51 | | | | 5.75 | | | | 1.13 | |
| Class R-3 - actual return | | | 1,000.00 | | | | 1,006.13 | | | | 4.85 | | | | .96 | |
| Class R-3 - assumed 5% return | | | 1,000.00 | | | | 1,020.37 | | | | 4.89 | | | | .96 | |
| Class R-4 - actual return | | | 1,000.00 | | | | 1,007.62 | | | | 3.29 | | | | .65 | |
| Class R-4 - assumed 5% return | | | 1,000.00 | | | | 1,021.93 | | | | 3.31 | | | | .65 | |
| Class R-5E - actual return | | | 1,000.00 | | | | 1,008.30 | | | | 2.68 | | | | .53 | |
| Class R-5E - assumed 5% return | | | 1,000.00 | | | | 1,022.53 | | | | 2.70 | | | | .53 | |
| Class R-5 - actual return | | | 1,000.00 | | | | 1,009.07 | | | | 1.92 | | | | .38 | |
| Class R-5 - assumed 5% return | | | 1,000.00 | | | | 1,023.29 | | | | 1.94 | | | | .38 | |
| Class R-6 - actual return | | | 1,000.00 | | | | 1,009.52 | | | | 1.52 | | | | .30 | |
| Class R-6 - assumed 5% return | | | 1,000.00 | | | | 1,023.69 | | | | 1.53 | | | | .30 | |
| * | The “expenses paid during period” are equal to the “annualized expense ratio,” multiplied by the average account value over the period, multiplied by the number of days in the period, and divided by 365 (to reflect the one-half year period). |
We are required to advise you of the federal tax status of certain distributions received by shareholders during the fiscal year. The fund hereby designates the following amounts for the fund’s fiscal year ended October 31, 2016:
| Qualified dividend income | | | 100% | |
| Corporate dividends received deduction | | $ | 1,594,531,000 | |
| U.S. government income that may be exempt from state taxation | | $ | 200,856,000 | |
Individual shareholders should refer to their Form 1099 or other tax information, which will be mailed in January 2017, to determine the calendar year amounts to be included on their 2016 tax returns. Shareholders should consult their tax advisors.
Approval of Investment Advisory and Service Agreement
The Capital Income Builder’s board has approved the fund’s Investment Advisory and Service Agreement (the “agreement”) with Capital Research and Management Company (“CRMC”) for an additional one-year term through October 31, 2017. The board approved the agreement following the recommendation of the fund’s Contracts Committee (the “committee”), which is composed of all of the fund’s independent board members. The board and the committee determined that the fund’s advisory fee structure was fair and reasonable in relation to the services provided, and that approving the agreement was in the best interests of the fund and its shareholders.
In reaching this decision, the board and the committee took into account information furnished to them throughout the year and otherwise provided to them, as well as information prepared specifically in connection with their review of the agreement, and were advised by their independent counsel. They considered the following factors, among others, but did not identify any single issue or particular piece of information that, in isolation, was the controlling factor, and each board and committee member did not necessarily attribute the same weight to each factor.
1. Nature, extent and quality of services
The board and the committee considered the depth and quality of CRMC’s investment management process, including its global research capabilities; the experience, capability and integrity of its senior management and other personnel; the low turnover rates of its key personnel; the overall financial strength and stability of CRMC and the Capital Group organization; and the ongoing evolution of CRMC’s organizational structure designed to maintain and strengthen these qualities. The board and the committee also considered the nature, extent and quality of administrative, compliance and shareholder services provided by CRMC to the fund under the agreement and other agreements, as well as the benefits to fund shareholders from investing in a fund that is part of a large family of funds. The board and the committee concluded that the nature, extent and quality of the services provided by CRMC have benefited and should continue to benefit the fund and its shareholders.
2. Investment results
The board and the committee considered the investment results of the fund in light of its primary objectives of providing a level of current income that exceeds the average yield on U.S. stocks generally and a growing stream of income over the years and its secondary objective of providing growth of capital. They compared the fund’s investment results with those of other relevant funds (including funds that currently form the basis of the Lipper index for the category in which the fund is included), and data such as relevant market and fund indexes, over various periods through March 31, 2016. This report, including the letter to shareholders and related disclosures, contains certain information about the fund’s investment results. The board and the committee reviewed the fund’s investment results measured against various indexes, including the S&P 500 Index, the Lipper Income Funds Index, and the Lipper Equity Income Funds Index. They noted that the investment results of the fund generally compared favorably to those of these indexes for the lifetime period and 20-year period, and were mixed for shorter periods while recognizing that none of the indexes is a perfect comparison given the fund’s distinguishing characteristics. The board and the committee concluded that the fund’s investment results have been satisfactory for renewal of the agreement and that CRMC’s record in managing the fund indicated that its continued management should benefit the fund and its shareholders.
3. Advisory fees and total expenses
The board and the committee compared the advisory fees and total expense levels of the fund to those of other relevant funds. They observed that the fund’s advisory fees and expenses generally compared favorably to those of other similar funds included in the Lipper Income Funds category. The board and the committee also considered the breakpoint discounts in the fund’s advisory fee structure that reduce the level of fees charged by CRMC to the fund as fund assets increase. In addition, they reviewed
information regarding the effective advisory fees charged to non-mutual fund clients by CRMC and its affiliates. They noted that, to the extent there were differences between the advisory fees paid by the fund and the advisory fees paid by those clients, the differences appropriately reflected the investment, operational, regulatory and market differences between advising the fund and the other clients. The board and the committee concluded that the fund’s cost structure was fair and reasonable in relation to the services provided, and that the fund’s shareholders receive reasonable value in return for the advisory fees and other amounts paid to CRMC by the fund.
4. Ancillary benefits
The board and the committee considered a variety of other benefits that CRMC and its affiliates receive as a result of CRMC’s relationship with the fund and the other American Funds, including fees for administrative services provided to certain share classes; fees paid to CRMC’s affiliated transfer agent; sales charges and distribution fees received and retained by the fund’s principal underwriter, an affiliate of CRMC; and possible ancillary benefits to CRMC and its institutional management affiliates in managing other investment vehicles. The board and the committee reviewed CRMC’s portfolio trading practices, noting the benefits CRMC receives from the research obtained with commissions from portfolio transactions made on behalf of the fund. The board and the committee took these ancillary benefits into account in evaluating the reasonableness of the advisory fees and other amounts paid to CRMC by the fund.
5. Adviser financial information
The board and the committee reviewed information regarding CRMC’s costs of providing services to the American Funds, including personnel, systems and resources of investment, compliance, trading, accounting and other administrative operations. They considered CRMC’s costs and related cost allocation methodology as well as its willingness to invest in technology, infrastructure and staff to maintain and expand services and capabilities, respond to industry and regulatory developments, and attract and retain qualified personnel. They noted information regarding the compensation structure for CRMC’s investment professionals. The board and the committee also compared CRMC’s profitability and compensation data to the reported results and data of several large, publicly held investment management companies. The board and the committee noted the competitiveness and cyclicality of both the mutual fund industry and the capital markets, and the importance in that environment of CRMC’s long-term profitability for maintaining its independence, company culture and management continuity. They further considered the breakpoint discounts in the fund’s advisory fee structure. The board and the committee concluded that the fund’s advisory fee structure reflected a reasonable sharing of benefits between CRMC and the fund’s shareholders.
Board of trustees and other officers
Independent trustees1
| Name and year of birth | | Year first
elected
a trustee
of the fund2 | | Principal occupation(s) during past five years | | Number of
portfolios in fund
complex overseen
by trustee3 | | Other directorships4
held by trustee |
| Joseph C. Berenato, 1946 | | 2005 | | Former Chairman and CEO, Ducommun Incorporated (aerospace components manufacturer) | | 15 | | Ducommun Incorporated |
| Robert J. Denison, 1941 | | 2005 | | Chair, First Security Management (private investment) | | 6 | | None |
| Mary Anne Dolan, 1947 | | 2010 | | Founder and President, MAD Ink (communications company) | | 10 | | None |
| John G. Freund, 1953 | | 2016 | | Founder and Managing Director, Skyline Ventures
(venture capital investor in health care companies) | | 6 | | Collegium Pharmaceutical, Inc.; Proteon Therapeutics, Inc.; Tetraphase Pharmaceuticals, Inc. |
| Pedro J. Greer, Jr., 1956 | | 2016 | | Physician; Chairman of the Board and Associate Dean, Florida International University | | 3 | | None |
| R. Clark Hooper, 1946 | | 2010 | | Private investor | | 81 | | None |
Merit E. Janow, 1958
Chairman of the Board
(Independent and Non-Executive) | | 2001 | | Dean and Professor, Columbia University,
School of International and Public Affairs | | 80 | | MasterCard Incorporated;
Trimble Navigation Limited |
| Leonade D. Jones, 1947 | | 2010 | | Retired; former Treasurer, The Washington Post Company (retired 1996) | | 10 | | None |
| Stefanie Powers, 1942 | | 1989–1996
1997 | | Actor, producer, author, entrepreneur; Co-founder and President of The William Holden Wildlife Foundation; founder of The Jaguar Conservation Trust; former conservation consultant to Land Rover and Jaguar North America | | 3 | | None |
| Christopher E. Stone, 1956 | | 2009 | | President, Open Society Foundations; former Professor of the Practice of Criminal Justice, John F. Kennedy School of Government, Harvard University | | 6 | | None |
| Steadman Upham, PhD, 1949 | | 2001 | | President Emeritus and University Professor, The University of Tulsa | | 80 | | None |
Koicho Itoh, a trustee of the fund since 2005, retired on December 31, 2015. The trustees thank Mr. Itoh for his dedication and service to the fund.
Interested trustees5,6
Name, year of birth
and position with fund | | Year first
elected
a trustee
or officer
of the fund2 | | Principal occupation(s) during past five years
and positions held with affiliated entities or
the principal underwriter of the fund | | Number of
portfolios in fund
complex overseen
by trustee3 | | Other directorships4
held by trustee |
James B. Lovelace, 1956
Vice Chairman of the Board | | 1992 | | Partner — Capital Research Global
Investors, Capital Research and Management Company; Director, Capital Research and Management Company | | 2 | | None |
Joyce E. Gordon, 1956
President | | 1996 | | Partner — Capital Research Global
Investors, Capital Research and Management
Company; Director, Capital Research and
Management Company | | 2 | | None |
The fund’s statement of additional information includes further details about fund trustees and is available without charge upon request by calling American Funds Service Company at (800) 421-4225 or by visiting the American Funds website at americanfunds.com. The address for all trustees and officers of the fund is 333 South Hope Street, Los Angeles, CA 90071, Attention: Secretary.
See page 40 for footnotes.
Other officers6
Name, year of birth
and position with fund | | Year first
elected
an officer
of the fund2 | | Principal occupation(s) during past five years and positions held with affiliated entities
or the principal underwriter of the fund |
Donald H. Rolfe, 1972
Executive Vice President | | 2008 | | Senior Vice President and Senior Counsel — Fund Business Management Group,
Capital Research and Management Company |
David A. Hoag, 1965
Senior Vice President | | 2006 | | Partner — Capital Fixed Income Investors, Capital Research and Management Company;
Partner — Capital Fixed Income Investors, Capital Bank and Trust Company;7
Director, The Capital Group Companies, Inc.7 |
Darcy Kopcho, 1953
Senior Vice President | | 2013 | | Director, The Capital Group Companies, Inc.;7
Executive Vice President and Director, Capital Group International, Inc.;7
Partner — Capital International Investors, Capital Guardian Trust Company;7
Partner — Capital International Investors, Capital Research and Management Company |
David M. Riley, 1967
Senior Vice President | | 2006 | | Partner — Capital Research Global Investors, Capital Research and Management Company;
Director, The Capital Group Companies, Inc.7 |
Bradley J. Vogt, 1965
Senior Vice President | | 2010 | | Chairman, Capital Research Company;7
Partner — Capital Research Global Investors, Capital Research and Management Company;
Director, The Capital Group Companies, Inc.7 |
Grant L. Cambridge, 1962
Vice President | | 2014 | | Partner — Capital Research Global Investors, Capital Research and Management Company |
M. Taylor Hinshaw, 1973
Vice President | | 2010 | | Partner — Capital Research Global Investors, Capital Research and Management Company |
Caroline Randall, 1974
Vice President | | 2015 | | Partner — Capital Research Global Investors, Capital Research Company7 |
Michael W. Stockton, 1967
Secretary | | 2013 | | Vice President — Fund Business Management Group, Capital Research and Management Company |
Gregory F. Niland, 1971
Treasurer | | 2016 | | Vice President — Investment Operations, Capital Research and Management Company |
Jennifer L. Butler, 1966
Assistant Secretary | | 2013 | | Assistant Vice President — Fund Business Management Group, Capital Research and Management Company |
Dori Laskin, 1951
Assistant Treasurer | | 2010 | | Vice President — Investment Operations, Capital Research and Management Company |
Brian C. Janssen, 1972
Assistant Treasurer | | 2016 | | Vice President — Investment Operations, Capital Research and Management Company |
| 1 | The term independent trustee refers to a trustee who is not an “interested person” of the fund within the meaning of the Investment Company Act of 1940. |
| 2 | Trustees and officers of the fund serve until their resignation, removal or retirement. |
| 3 | Funds managed by Capital Research and Management Company or its affiliates. |
| 4 | This includes all directorships/trusteeships (other than those in the American Funds or other funds managed by Capital Research and Management Company or its affiliates) that are held by each trustee as a trustee or director of a public company or a registered investment company. |
| 5 | The term interested trustee refers to a trustee who is an “interested person” within the meaning of the Investment Company Act of 1940, on the basis of their affiliation with the fund’s investment adviser, Capital Research and Management Company, or affiliated entities (including the fund’s principal underwriter). |
| 6 | All of the directors/trustees and/or officers listed, with the exception of Grant L. Cambridge, M. Taylor Hinshaw and Caroline Randall, are officers and/or directors/trustees of one or more of the other funds for which Capital Research and Management Company serves as investment adviser. |
| 7 | Company affiliated with Capital Research and Management Company. |
Offices of the fund and of the investment adviser
Capital Research and Management Company
333 South Hope Street
Los Angeles, CA 90071-1406
6455 Irvine Center Drive
Irvine, CA 92618-4518
Transfer agent for shareholder accounts
American Funds Service Company
(Write to the address near you.)
P.O. Box 6007
Indianapolis, IN 46206-6007
P.O. Box 2280
Norfolk, VA 23501-2280
Custodian of assets
JPMorgan Chase Bank
270 Park Avenue
New York, NY 10017-2070
Counsel
O’Melveny & Myers LLP
400 South Hope Street
Los Angeles, CA 90071-2899
Independent registered public accounting firm
PricewaterhouseCoopers LLP
601 South Figueroa Street
Los Angeles, CA 90017-3874
Principal underwriter
American Funds Distributors, Inc.
333 South Hope Street
Los Angeles, CA 90071-1406
Investors should carefully consider investment objectives, risks, charges and expenses. This and other important information is contained in the fund prospectus and summary prospectus, which can be obtained from your financial professional and should be read carefully before investing. You may also call American Funds Service Company (AFS) at (800) 421-4225 or visit the American Funds website at americanfunds.com.
“American Funds Proxy Voting Procedures and Principles” — which describes how we vote proxies relating to portfolio securities — is available on the American Funds website or upon request by calling AFS. The fund files its proxy voting record with the U.S. Securities and Exchange Commission (SEC) for the 12 months ended June 30 by August 31. The proxy voting record is available free of charge on the SEC website at sec.gov and on the American Funds website.
A complete October 31, 2016, portfolio of Capital Income Builder’s investments is available free of charge by calling AFS or visiting the SEC website (where it is part of Form N-CSR).
Capital Income Builder files a complete list of its portfolio holdings with the SEC for the first and third quarters of each fiscal year on Form N-Q. This filing is available free of charge on the SEC website. You may also review or, for a fee, copy this filing at the SEC’s Public Reference Room in Washington, D.C. Additional information regarding the operation of the Public Reference Room may be obtained by calling the SEC’s Office of Investor Education and Advocacy at (800) SEC-0330. Additionally, the list of portfolio holdings is available by calling AFS.
This report is for the information of shareholders of Capital Income Builder, but it also may be used as sales literature when preceded or accompanied by the current prospectus or summary prospectus, which gives details about charges, expenses, investment objectives and operating policies of the fund. If used as sales material after December 31, 2016, this report must be accompanied by an American Funds statistical update for the most recently completed calendar quarter.
Bloomberg® is a trademark of Bloomberg Finance L.P. (collectively with its affiliates, “Bloomberg”). Barclays® is a trademark of Barclays Bank Plc (collectively with its affiliates, “Barclays”), used under license. Neither Bloomberg nor Barclays approves or endorses this material, guarantees the accuracy or completeness of any information herein and, to the maximum extent allowed by law, neither shall have any liability or responsibility for injury or damages arising in connection therewith.
The American Funds Advantage®
Since 1931, American Funds, part of Capital Group, has helped investors pursue long-term investment success. Our consistent approach — in combination with The Capital SystemSM — has resulted in a superior long-term track record.
Aligned with investor success
We base our decisions on a long-term perspective, which we believe aligns our goals with the interests of our clients. Our portfolio managers average 27 years of investment experience, including 22 years at our company, reflecting a career commitment to our long-term approach.1
The Capital SystemSM
The Capital System combines individual accountability with teamwork. Funds using The Capital System are divided into portions that are managed independently by investment professionals with diverse backgrounds, ages and investment approaches. An extensive global research effort is the backbone of our system.
Superior long-term track record
Our equity funds have beaten their Lipper peer indexes in 91% of 10-year periods and 95% of 20-year periods. Our fixed income funds have beaten their Lipper indexes in 58% of 10-year periods and 58% of 20-year periods.2 Our fund management fees have been among the lowest in the industry.3
| | 1 | Portfolio manager experience as of December 31, 2015. |
| | 2 | Based on Class A share results for rolling periods through December 31, 2015. Periods covered are the shorter of the fund’s lifetime or since the comparable Lipper index inception date (except Capital Income Builder and SMALLCAP World Fund, for which the Lipper average was used). |
| | 3 | On average, our management fees were in the lowest quintile 68% of the time, based on the 20-year period ended December 31, 2015, versus comparable Lipper categories, excluding funds of funds. |

ITEM 2 – Code of Ethics
The Registrant has adopted a Code of Ethics that applies to its Principal Executive Officer and Principal Financial Officer. The Registrant undertakes to provide to any person without charge, upon request, a copy of the Code of Ethics. Such request can be made to American Funds Service Company at 800/421-9225 or to the Secretary of the Registrant, 333 South Hope Street, Los Angeles, California 90071.
ITEM 3 – Audit Committee Financial Expert
The Registrant’s board has determined that Leonade D. Jones, a member of the Registrant’s audit committee, is an “audit committee financial expert” and "independent," as such terms are defined in this Item. This designation will not increase the designee’s duties, obligations or liability as compared to his or her duties, obligations and liability as a member of the audit committee and of the board, nor will it reduce the responsibility of the other audit committee members. There may be other individuals who, through education or experience, would qualify as "audit committee financial experts" if the board had designated them as such. Most importantly, the board believes each member of the audit committee contributes significantly to the effective oversight of the Registrant’s financial statements and condition.
ITEM 4 – Principal Accountant Fees and Services
Registrant:
a) Audit Fees:
2015 142,000
2016 182,000
b) Audit-Related Fees:
2015 0
2016 0
c) Tax Fees:
2015 8,000
2016 9,000
The tax fees consist of professional services relating to the preparation of the Registrant’s tax returns.
d) All Other Fees:
2015 0
2016 0
Adviser and affiliates (includes only fees for non-audit services billed to the adviser and affiliates for engagements that relate directly to the operations and financial reporting of the Registrant and were subject to the pre-approval policies described below):
a) Audit Fees:
Not Applicable
b) Audit-Related Fees:
2015 None
2016 17,000
The audit-related fees consist of assurance and related services relating to the examination of the Registrant’s transfer agent, principal underwriter and investment adviser conducted in accordance with Statement on Standards for Attestation Engagements Number 16 issued by the American Institute of Certified Public Accountants.
c) Tax Fees:
2015 29,000
2016 9,000
The tax fees consist of consulting services relating to the Registrant’s investments.
d) All Other Fees:
2015 2,000
2016 2,000
The other fees consist of subscription services related to an accounting research tool.
All audit and permissible non-audit services that the Registrant’s audit committee considers compatible with maintaining the independent registered public accounting firm’s independence are required to be pre-approved by the committee. The pre-approval requirement will extend to all non-audit services provided to the Registrant, the investment adviser, and any entity controlling, controlled by, or under common control with the investment adviser that provides ongoing services to the Registrant, if the engagement relates directly to the operations and financial reporting of the Registrant. The committee will not delegate its responsibility to pre-approve these services to the investment adviser. The committee may delegate to one or more committee members the authority to review and pre-approve audit and permissible non-audit services. Actions taken under any such delegation will be reported to the full committee at its next meeting. The pre-approval requirement is waived with respect to non-audit services if certain conditions are met. The pre-approval requirement was not waived for any of the non-audit services listed above provided to the Registrant, adviser and affiliates.
Aggregate non-audit fees paid to the Registrant’s auditors, including fees for all services billed to the Registrant, adviser and affiliates that provide ongoing services to the Registrant, were $59,000 for fiscal year 2015 and $22,000 for fiscal year 2016. The non-audit services represented by these amounts were brought to the attention of the committee and considered to be compatible with maintaining the auditors’ independence.
ITEM 5 – Audit Committee of Listed Registrants
Not applicable to this Registrant, insofar as the Registrant is not a listed issuer as defined in Rule 10A-3 under the Securities Exchange Act of 1934.
ITEM 6 – Schedule of Investments
Capital Income Builder®
Investment portfolio
October 31, 2016
Common stocks 79.21%
Consumer staples 14.24% | Shares | Value
(000) |
| Philip Morris International Inc. | 37,541,798 | $3,620,531 |
| Altria Group, Inc. | 32,600,305 | 2,155,532 |
| Coca-Cola Co. | 38,844,000 | 1,646,986 |
| Imperial Brands PLC | 30,790,552 | 1,490,734 |
| Reynolds American Inc. | 21,881,257 | 1,205,220 |
| British American Tobacco PLC | 15,117,376 | 868,100 |
| Nestlé SA | 11,204,110 | 812,384 |
| Procter & Gamble Co. | 8,071,420 | 700,599 |
| Kraft Heinz Co. | 4,803,766 | 427,295 |
| Unilever PLC | 7,739,900 | 323,809 |
| Diageo PLC | 9,631,400 | 256,938 |
| Japan Tobacco Inc. | 5,677,200 | 216,218 |
| Kimberly-Clark Corp. | 1,000,000 | 114,410 |
| SalMar ASA | 2,897,000 | 94,038 |
| PepsiCo, Inc. | 862,000 | 92,406 |
| Unilever NV, depository receipts | 1,282,000 | 53,731 |
| Tate & Lyle PLC | 5,334,346 | 50,928 |
| Convenience Retail Asia Ltd.1 | 51,330,000 | 27,400 |
| | | 14,157,259 |
| Utilities 10.10% | | |
| National Grid PLC | 137,374,487 | 1,790,759 |
| SSE PLC1 | 78,291,002 | 1,524,626 |
| Dominion Resources, Inc. | 16,051,888 | 1,207,102 |
| Duke Energy Corp. | 10,740,209 | 859,432 |
| EDP - Energias de Portugal, SA1 | 242,838,428 | 802,660 |
| Southern Co. | 13,904,424 | 717,051 |
| Iberdrola, SA, non-registered shares | 94,269,403 | 642,534 |
| Engie SA | 26,077,624 | 376,012 |
| Power Assets Holdings Ltd. | 33,363,200 | 313,820 |
| CMS Energy Corp. | 7,344,000 | 309,550 |
| Red Eléctrica de Corporación, SA | 14,811,156 | 309,001 |
| Exelon Corp. | 7,048,000 | 240,125 |
| Cheung Kong Infrastructure Holdings Ltd. | 20,452,000 | 167,586 |
| PG&E Corp. | 2,532,000 | 157,288 |
| Glow Energy PCL | 67,636,500 | 148,811 |
| Sempra Energy | 1,165,825 | 124,860 |
| Ratchaburi Electricity Generating Holding PCL1 | 77,350,000 | 110,508 |
| Fortum Oyj | 5,000,000 | 83,374 |
| Pennon Group PLC | 8,036,994 | 82,092 |
| Centrica PLC | 13,321,897 | 34,927 |
| Infratil Ltd. | 14,867,000 | 31,682 |
| | | 10,033,800 |
Capital Income Builder — Page 1 of 32
Common stocks
Health care 8.42% | Shares | Value
(000) |
| AbbVie Inc. | 34,239,801 | $1,909,896 |
| Amgen Inc. | 10,960,003 | 1,547,114 |
| GlaxoSmithKline PLC | 73,735,109 | 1,460,725 |
| Novartis AG | 18,207,743 | 1,295,362 |
| AstraZeneca PLC | 8,046,600 | 451,874 |
| AstraZeneca PLC (ADR) | 7,895,700 | 223,606 |
| Pfizer Inc. | 17,617,800 | 558,660 |
| Johnson & Johnson | 2,263,000 | 262,485 |
| Takeda Pharmaceutical Co. Ltd. | 5,755,000 | 257,924 |
| Orion Oyj, Class B | 3,815,674 | 162,478 |
| Roche Holding AG, non-registered shares, non-voting | 593,000 | 136,332 |
| Merck & Co., Inc. | 936,000 | 54,962 |
| Eli Lilly and Co. | 683,500 | 50,470 |
| | | 8,371,888 |
| Telecommunication services 8.24% | | |
| Verizon Communications Inc. | 53,783,533 | 2,586,988 |
| AT&T Inc. | 36,458,877 | 1,341,322 |
| Singapore Telecommunications Ltd. | 389,897,631 | 1,087,369 |
| Vodafone Group PLC | 290,091,764 | 798,203 |
| CenturyLink, Inc. | 15,974,978 | 424,615 |
| BCE Inc. | 7,193,000 | 326,803 |
| TELUS Corp. | 8,710,508 | 282,038 |
| Telia Co. AB | 66,588,000 | 266,141 |
| HKT Trust and HKT Ltd., units | 122,978,460 | 169,034 |
| NTT DoCoMo, Inc. | 6,373,000 | 160,464 |
| Nippon Telegraph and Telephone Corp. | 3,583,000 | 159,214 |
| TalkTalk Telecom Group PLC1 | 51,345,000 | 127,955 |
| MTN Group Ltd. | 10,413,000 | 89,868 |
| freenet AG | 3,122,600 | 89,484 |
| Advanced Info Service PCL | 18,358,000 | 80,519 |
| Intouch Holdings PCL | 37,725,796 | 57,132 |
| Intouch Holdings PCL, non-voting depository receipts | 13,170,153 | 19,945 |
| Hutchison Telecommunications Hong Kong Holdings Ltd. | 214,176,000 | 69,040 |
| China Mobile Ltd. | 4,754,000 | 54,463 |
| | | 8,190,597 |
| Financials 7.54% | | |
| Sampo Oyj, Class A1 | 29,229,310 | 1,340,252 |
| BNP Paribas SA | 8,838,249 | 512,664 |
| Swedbank AB, Class A | 17,007,555 | 398,443 |
| JPMorgan Chase & Co. | 5,748,400 | 398,134 |
| CME Group Inc., Class A | 3,910,149 | 391,406 |
| Toronto-Dominion Bank (CAD denominated) | 8,231,000 | 373,473 |
| Zurich Insurance Group AG | 1,347,300 | 352,500 |
| Bank of Montreal | 4,810,000 | 306,107 |
| Principal Financial Group, Inc. | 5,063,600 | 276,473 |
| HSBC Holdings PLC (GBP denominated) | 27,193,535 | 205,101 |
| HSBC Holdings PLC (HKD denominated) | 8,303,944 | 62,476 |
| Prudential PLC | 15,641,358 | 255,490 |
| New York Community Bancorp, Inc. | 17,727,200 | 254,563 |
| BB&T Corp. | 6,297,000 | 246,842 |
| Royal Bank of Canada | 3,800,000 | 237,411 |
| Westpac Banking Corp. | 7,394,168 | 171,386 |
| American International Group, Inc. | 2,600,000 | 160,420 |
Capital Income Builder — Page 2 of 32
Common stocks
Financials (continued) | Shares | Value
(000) |
| Mercury General Corp.1 | 2,909,700 | $158,491 |
| Svenska Handelsbanken AB, Class A | 10,164,269 | 138,642 |
| Lloyds Banking Group PLC | 195,848,365 | 137,263 |
| Arthur J. Gallagher & Co. | 2,786,989 | 134,417 |
| St. James’s Place PLC | 10,801,723 | 124,941 |
| Aberdeen Asset Management PLC | 26,275,000 | 102,978 |
| Bank of China Ltd., Class H | 228,061,000 | 102,333 |
| Skandinaviska Enskilda Banken AB, Class A | 8,807,421 | 88,882 |
| Umpqua Holdings Corp. | 4,475,000 | 68,378 |
| Bangkok Bank PCL, non-voting depository receipt | 13,859,000 | 63,162 |
| Credit Suisse Group AG | 4,470,309 | 62,432 |
| Marsh & McLennan Companies, Inc. | 973,000 | 61,679 |
| Wells Fargo & Co. | 1,235,000 | 56,822 |
| Bank of Nova Scotia | 1,006,400 | 54,083 |
| Société Générale | 1,356,945 | 52,970 |
| Union National Bank PJSC | 46,855,465 | 50,007 |
| People’s United Financial, Inc. | 1,750,000 | 28,420 |
| UBS Group AG | 1,855,000 | 26,244 |
| Intesa Sanpaolo SPA | 8,798,000 | 19,007 |
| Donnelley Financial Solutions, Inc.2 | 699,418 | 15,003 |
| | | 7,489,295 |
| Energy 7.46% | | |
| Royal Dutch Shell PLC, Class B | 44,716,600 | 1,157,605 |
| Royal Dutch Shell PLC, Class A (GBP denominated) | 12,151,795 | 303,202 |
| Royal Dutch Shell PLC, Class B (ADR) | 2,625,000 | 137,314 |
| Royal Dutch Shell PLC, Class A (ADR) | 49,143 | 2,448 |
| Exxon Mobil Corp. | 13,322,600 | 1,110,039 |
| Chevron Corp. | 9,924,600 | 1,039,602 |
| Suncor Energy Inc. | 21,888,518 | 656,835 |
| BP PLC | 74,052,421 | 438,426 |
| TOTAL SA | 8,731,091 | 419,037 |
| Spectra Energy Corp | 9,123,220 | 381,442 |
| Enbridge Inc. (CAD denominated) | 8,598,143 | 371,285 |
| Helmerich & Payne, Inc. | 3,991,415 | 251,898 |
| Kinder Morgan, Inc. | 10,309,000 | 210,613 |
| Occidental Petroleum Corp. | 2,730,603 | 199,088 |
| TransCanada Corp. | 4,043,000 | 183,025 |
| Whitecap Resources Inc.1 | 21,385,000 | 170,914 |
| Inter Pipeline Ltd. | 7,573,500 | 157,026 |
| Veresen Inc. | 10,629,000 | 96,282 |
| ConocoPhillips | 2,028,100 | 88,121 |
| Williams Companies, Inc. | 1,547,838 | 45,197 |
| | | 7,419,399 |
| Industrials 6.08% | | |
| Lockheed Martin Corp. | 5,172,774 | 1,274,468 |
| Abertis Infraestructuras, SA, Class A | 47,468,263 | 704,765 |
| General Electric Co. | 22,628,400 | 658,486 |
| Boeing Co. | 4,378,046 | 623,565 |
| Caterpillar Inc. | 7,133,200 | 595,337 |
| KONE Oyj, Class B | 6,755,000 | 310,924 |
| BAE Systems PLC | 41,844,160 | 277,854 |
| Singapore Technologies Engineering Ltd | 103,381,200 | 232,584 |
| MTR Corp. Ltd. | 32,656,000 | 180,848 |
Capital Income Builder — Page 3 of 32
Common stocks
Industrials (continued) | Shares | Value
(000) |
| Emerson Electric Co. | 3,500,000 | $177,380 |
| Sydney Airport, units | 35,385,683 | 168,506 |
| Covanta Holding Corp.1 | 10,247,332 | 153,710 |
| Edenred SA | 4,584,029 | 106,203 |
| Andritz AG | 1,573,972 | 82,331 |
| Siemens AG | 661,680 | 75,142 |
| BTS Rail Mass Transit Growth Infrastructure Fund | 200,000,000 | 69,719 |
| Air New Zealand Ltd. | 39,377,907 | 54,347 |
| CK Hutchison Holdings Ltd. | 3,440,400 | 42,564 |
| R.R. Donnelley & Sons Co. | 2,216,233 | 39,338 |
| CCR SA, ordinary nominative | 6,450,000 | 35,059 |
| United Technologies Corp. | 301,000 | 30,762 |
| Norfolk Southern Corp. | 322,000 | 29,946 |
| Transurban Group | 3,668,056 | 28,991 |
| PayPoint PLC | 1,905,000 | 25,066 |
| Safran SA | 272,000 | 18,701 |
| LSC Communications, Inc. | 699,418 | 16,954 |
| CTCI Corp. | 9,300,000 | 13,659 |
| SEEK Ltd. | 982,116 | 10,937 |
| COSCO Pacific Ltd. | 4,734,001 | 4,700 |
| | | 6,042,846 |
| Information technology 5.16% | | |
| International Business Machines Corp. | 5,433,100 | 835,013 |
| Taiwan Semiconductor Manufacturing Co., Ltd. | 124,132,000 | 741,468 |
| Intel Corp. | 19,863,000 | 692,623 |
| Texas Instruments Inc. | 7,374,400 | 522,476 |
| Cisco Systems, Inc. | 10,000,000 | 306,800 |
| Xilinx, Inc. | 5,570,200 | 283,356 |
| Microsoft Corp. | 4,353,900 | 260,886 |
| VTech Holdings Ltd.1 | 20,089,300 | 246,598 |
| QUALCOMM Inc. | 3,300,000 | 226,776 |
| Quanta Computer Inc. | 95,330,996 | 193,336 |
| Vanguard International Semiconductor Corp.1 | 91,675,725 | 187,085 |
| Paychex, Inc. | 3,282,000 | 181,166 |
| Moneysupermarket.com Group PLC1 | 35,588,401 | 114,084 |
| Western Union Co. | 4,712,000 | 94,570 |
| Ricoh Co., Ltd. | 11,436,500 | 93,350 |
| Apple Inc. | 752,000 | 85,382 |
| Accenture PLC, Class A | 323,300 | 37,580 |
| Automatic Data Processing, Inc. | 345,600 | 30,088 |
| | | 5,132,637 |
| Real estate 4.41% | | |
| Crown Castle International Corp. | 15,449,405 | 1,405,741 |
| Lamar Advertising Co., Class A | 5,948,400 | 377,426 |
| Gaming and Leisure Properties, Inc. | 10,159,257 | 333,528 |
| Iron Mountain Inc. | 8,842,959 | 298,273 |
| Link Real Estate Investment Trust | 41,561,896 | 296,352 |
| Ventas, Inc. | 3,973,900 | 269,232 |
| HCP, Inc. | 6,820,000 | 233,585 |
| Public Storage | 981,000 | 209,659 |
| RioCan Real Estate Investment Trust | 8,389,207 | 163,118 |
| American Campus Communities, Inc. | 3,102,500 | 161,671 |
| Hospitality Properties Trust | 4,941,000 | 135,186 |
Capital Income Builder — Page 4 of 32
Common stocks
Real estate (continued) | Shares | Value
(000) |
| Alexandria Real Estate Equities, Inc. | 1,095,904 | $118,149 |
| Land and Houses PCL, non-voting depository receipt | 239,795,358 | 63,037 |
| Land and Houses PCL FR | 111,619,642 | 29,342 |
| Tesco Lotus Retail Growth Freehold and Leasehold Property Fund1 | 145,255,000 | 75,953 |
| TAG Immobilien AG | 5,417,538 | 72,317 |
| Fortune Real Estate Investment Trust | 32,254,000 | 39,093 |
| Fortune Real Estate Investment Trust3 | 1,692,000 | 2,062 |
| Cheung Kong Property Holdings Ltd. | 3,863,000 | 28,616 |
| Outfront Media Inc. | 1,116,400 | 24,014 |
| Unibail-Rodamco SE, non-registered shares | 83,730 | 19,946 |
| Fibra Uno Administración, SA de CV | 8,630,000 | 16,469 |
| Prologis, Inc. | 259,400 | 13,530 |
| | | 4,386,299 |
| Consumer discretionary 4.25% | | |
| Las Vegas Sands Corp. | 14,858,200 | 859,993 |
| McDonald’s Corp. | 3,746,300 | 421,721 |
| Six Flags Entertainment Corp.1 | 6,160,400 | 342,826 |
| ITV PLC | 114,611,860 | 239,186 |
| Ford Motor Co. | 20,000,000 | 234,800 |
| Greene King PLC1 | 24,691,512 | 221,077 |
| SES SA, Class A (FDR) | 8,792,330 | 202,205 |
| Toyota Motor Corp. | 3,239,000 | 187,755 |
| Taylor Wimpey plc | 88,132,500 | 152,858 |
| DineEquity, Inc.1 | 1,475,000 | 116,673 |
| AA PLC1 | 36,819,677 | 115,417 |
| Modern Times Group MTG AB, Class B | 3,908,862 | 105,250 |
| William Hill PLC | 27,608,000 | 99,957 |
| Daimler AG | 1,345,400 | 95,866 |
| ProSiebenSat.1 Media SE | 1,977,377 | 85,220 |
| Viacom Inc., Class B | 1,935,200 | 72,686 |
| Marston’s PLC1 | 41,884,228 | 68,543 |
| Li & Fung Ltd. | 139,140,000 | 68,533 |
| Gannett Co., Inc.1 | 8,547,400 | 66,413 |
| Marks and Spencer Group PLC | 15,315,000 | 63,829 |
| Hasbro, Inc. | 743,000 | 61,974 |
| Stella International Holdings Ltd. | 32,259,000 | 55,987 |
| H & M Hennes & Mauritz AB, Class B | 1,662,500 | 46,771 |
| Ladbrokes PLC2 | 25,130,000 | 41,094 |
| Barratt Developments PLC | 6,186,775 | 34,357 |
| BCA Marketplace PLC | 15,524,700 | 34,252 |
| Sands China Ltd. | 7,232,400 | 31,473 |
| Pacific Textiles Holdings Ltd. | 17,431,000 | 21,981 |
| Leifheit AG, non-registered shares1 | 320,000 | 20,726 |
| Fielmann AG | 265,442 | 18,410 |
| Sa Sa International Holdings Ltd. | 33,434,000 | 15,304 |
| Chow Sang Sang Holdings International Ltd. | 5,278,000 | 9,323 |
| Sitoy Group Holdings Ltd. | 18,200,000 | 6,571 |
| | | 4,219,031 |
| Materials 1.98% | | |
| Rio Tinto PLC | 13,477,000 | 468,400 |
| Agrium Inc. | 4,309,500 | 395,698 |
| Amcor Ltd. | 28,752,480 | 321,518 |
| Potash Corp. of Saskatchewan Inc. | 10,804,905 | 175,904 |
Capital Income Builder — Page 5 of 32
Common stocks
Materials (continued) | Shares | Value
(000) |
| Dow Chemical Co. | 2,604,900 | $140,170 |
| Nucor Corp. | 2,768,819 | 135,257 |
| Givaudan SA | 66,000 | 127,725 |
| BHP Billiton PLC | 7,169,000 | 108,326 |
| BASF SE | 470,000 | 41,430 |
| Praxair, Inc. | 265,500 | 31,079 |
| Greatview Aseptic Packaging Co. Ltd. | 43,742,000 | 22,222 |
| | | 1,967,729 |
| Miscellaneous 1.33% | | |
| Other common stocks in initial period of acquisition | | 1,321,269 |
| Total common stocks (cost: $71,701,013,000) | | 78,732,049 |
Preferred securities 0.02%
Financials 0.02% | | |
| CoBank, ACB, Class E, noncumulative4 | 13,000 | 8,308 |
| HSBC Holdings PLC, Series 2, 8.00% | 200,000 | 5,212 |
| Total preferred securities (cost: $17,994,000) | | 13,520 |
Rights & warrants 0.00%
Miscellaneous 0.00% | | |
| Other rights & warrants in initial period of acquisition | | 247 |
| Total rights & warrants (cost: $218,000) | | 247 |
Convertible stocks 0.48%
Utilities 0.20% | | |
| Dominion Resources, Inc., convertible preferred, Series A, units | 3,968,702 | 199,825 |
| Real estate 0.14% | | |
| American Tower Corp., Series B, 5.50% depository share, convertible preferred 2018 | 1,234,000 | 135,431 |
| Miscellaneous 0.14% | | |
| Other convertible stocks in initial period of acquisition | | 145,234 |
| Total convertible stocks (cost: $457,059,000) | | 480,490 |
Bonds, notes & other debt instruments 17.27%
U.S. Treasury bonds & notes 6.81%
U.S. Treasury 5.49% | Principal amount
(000) | |
| U.S. Treasury 7.50% 2016 | $190,000 | 190,524 |
| U.S. Treasury 4.50% 2017 | 100,000 | 102,126 |
| U.S. Treasury 4.625% 2017 | 100,000 | 101,223 |
| U.S. Treasury 8.75% 2017 | 50,000 | 52,204 |
| U.S. Treasury 8.875% 2017 | 135,850 | 144,611 |
| U.S. Treasury 3.50% 2018 | 75,000 | 77,618 |
| U.S. Treasury 0.75% 2019 | 19,296 | 19,176 |
| U.S. Treasury 0.875% 2019 | 54,042 | 53,930 |
Capital Income Builder — Page 6 of 32
Bonds, notes & other debt instruments
U.S. Treasury bonds & notes (continued)
U.S. Treasury (continued) | Principal amount
(000) | Value
(000) |
| U.S. Treasury 1.50% 2019 | $40,000 | $40,580 |
| U.S. Treasury 1.625% 2019 | 111,600 | 113,610 |
| U.S. Treasury 1.625% 2019 | 38,820 | 39,516 |
| U.S. Treasury 1.75% 2019 | 8,570 | 8,757 |
| U.S. Treasury 3.125% 2019 | 100,000 | 105,465 |
| U.S. Treasury 3.625% 2019 | 80,000 | 85,828 |
| U.S. Treasury 8.125% 2019 | 93,440 | 111,781 |
| U.S. Treasury 1.125% 2020 | 51,950 | 52,011 |
| U.S. Treasury 1.25% 2020 | 382,100 | 384,370 |
| U.S. Treasury 1.25% 2020 | 40,700 | 40,932 |
| U.S. Treasury 1.375% 2020 | 104,827 | 105,495 |
| U.S. Treasury 1.375% 2020 | 70,000 | 70,640 |
| U.S. Treasury 1.375% 2020 | 16,500 | 16,657 |
| U.S. Treasury 1.625% 2020 | 52,000 | 52,878 |
| U.S. Treasury 1.75% 2020 | 36,615 | 37,390 |
| U.S. Treasury 3.50% 2020 | 19,150 | 20,724 |
| U.S. Treasury 3.625% 2020 | 4,000 | 4,330 |
| U.S. Treasury 8.50% 2020 | 76,000 | 94,299 |
| U.S. Treasury 8.75% 2020 | 188,700 | 238,617 |
| U.S. Treasury 8.75% 2020 | 180,000 | 230,765 |
| U.S. Treasury 1.125% 2021 | 237,050 | 235,068 |
| U.S. Treasury 1.25% 2021 | 200,000 | 199,766 |
| U.S. Treasury 1.25% 2021 | 62,895 | 62,708 |
| U.S. Treasury 1.375% 2021 | 200,000 | 200,774 |
| U.S. Treasury 2.125% 2021 | 32,750 | 33,953 |
| U.S. Treasury 3.125% 2021 | 25,000 | 27,010 |
| U.S. Treasury 3.625% 2021 | 31,600 | 34,726 |
| U.S. Treasury 8.00% 2021 | 127,500 | 168,799 |
| U.S. Treasury 8.125% 2021 | 25,000 | 32,887 |
| U.S. Treasury 2.00% 2022 | 34,650 | 35,604 |
| U.S. Treasury 2.125% 2022 | 67,680 | 70,028 |
| U.S. Treasury 7.625% 2022 | 25,000 | 33,906 |
| U.S. Treasury 1.375% 2023 | 100,000 | 98,652 |
| U.S. Treasury 1.50% 2023 | 84,750 | 84,406 |
| U.S. Treasury 1.50% 2023 | 61,670 | 61,455 |
| U.S. Treasury 1.625% 2023 | 164,250 | 164,680 |
| U.S. Treasury 1.625% 2023 | 50,000 | 50,155 |
| U.S. Treasury 6.25% 2023 | 75,000 | 97,693 |
| U.S. Treasury 7.125% 2023 | 210,000 | 281,005 |
| U.S. Treasury 2.25% 2024 | 55,000 | 57,231 |
| U.S. Treasury 6.875% 2025 | 25,000 | 35,528 |
| U.S. Treasury 1.50% 2026 | 158,898 | 154,255 |
| U.S. Treasury 6.125% 2027 | 75,000 | 106,600 |
| U.S. Treasury 6.375% 2027 | 45,000 | 64,772 |
| U.S. Treasury 5.50% 2028 | 75,000 | 103,096 |
| U.S. Treasury 6.125% 2029 | 30,000 | 44,102 |
| U.S. Treasury 6.25% 2030 | 107,000 | 161,177 |
| U.S. Treasury 2.875% 2045 | 76,415 | 81,107 |
| U.S. Treasury 2.50% 2046 | 75,307 | 74,045 |
| | | 5,451,245 |
Capital Income Builder — Page 7 of 32
Bonds, notes & other debt instruments
U.S. Treasury bonds & notes (continued)
U.S. Treasury inflation-protected securities 1.32% | Principal amount
(000) | Value
(000) |
| U.S. Treasury Inflation-Protected Security 0.125% 20175 | $21,208 | $21,264 |
| U.S. Treasury Inflation-Protected Security 0.128% 20205 | 310,595 | 316,513 |
| U.S. Treasury Inflation-Protected Security 0.125% 20215 | 101,620 | 103,682 |
| U.S. Treasury Inflation-Protected Security 0.125% 20245 | 150,677 | 152,259 |
| U.S. Treasury Inflation-Protected Security 0.25% 20255 | 104,838 | 106,218 |
| U.S. Treasury Inflation-Protected Security 0.375% 20255 | 27,320 | 28,041 |
| U.S. Treasury Inflation-Protected Security 2.375% 20255 | 164,698 | 195,012 |
| U.S. Treasury Inflation-Protected Security 0.125% 20265 | 50,239 | 50,370 |
| U.S. Treasury Inflation-Protected Security 0.625% 20265 | 132,985 | 138,809 |
| U.S. Treasury Inflation-Protected Security 2.00% 20265 | 53,757 | 62,668 |
| U.S. Treasury Inflation-Protected Security 2.125% 20415 | 814 | 1,072 |
| U.S. Treasury Inflation-Protected Security 0.75% 20425 | 50,150 | 50,584 |
| U.S. Treasury Inflation-Protected Security 1.375% 20445 | 76,033 | 88,258 |
| | | 1,314,750 |
| Total U.S. Treasury bonds & notes | | 6,765,995 |
Corporate bonds & notes 6.62%
Energy 1.16% | | |
| American Energy (Marcellus), Term Loan A, 8.50% 20216,7,8 | 3,275 | 311 |
| American Energy (Marcellus), Term Loan B, 5.25% 20206,7,8 | 1,500 | 854 |
| American Energy (Permian Basin) 7.125% 20204 | 4,425 | 3,286 |
| American Energy (Permian Basin) 7.375% 20214 | 1,700 | 1,262 |
| Anadarko Petroleum Corp. 4.85% 2021 | 1,040 | 1,130 |
| Anadarko Petroleum Corp. 5.55% 2026 | 5,855 | 6,671 |
| Anadarko Petroleum Corp. 6.20% 2040 | 1,580 | 1,830 |
| Anadarko Petroleum Corp. 6.60% 2046 | 3,175 | 3,899 |
| APT Pipelines Ltd. 4.20% 20254 | 4,440 | 4,594 |
| Blue Racer Midstream LLC / Blue Racer Finance Corp. 6.125% 20224 | 1,725 | 1,695 |
| Boardwalk Pipeline Partners 3.375% 2023 | 5,000 | 4,870 |
| Boardwalk Pipelines, LP 4.95% 2024 | 4,695 | 4,893 |
| Canadian Natural Resources Ltd. 3.80% 2024 | 1,975 | 2,013 |
| Cenovus Energy Inc. 3.00% 2022 | 16,340 | 15,920 |
| Cenovus Energy Inc. 3.80% 2023 | 6,120 | 6,047 |
| Cheniere Energy, Inc. 7.00% 20244 | 3,530 | 3,759 |
| Chesapeake Energy Corp. 4.13% 20198 | 2,000 | 1,855 |
| Chesapeake Energy Corp. 8.00% 20224 | 2,000 | 2,040 |
| Chesapeake Energy Corp., Term Loan, 8.50% 20216,7,8 | 2,150 | 2,302 |
| Chevron Corp. 2.10% 2021 | 20,720 | 20,883 |
| Chevron Corp. 2.954% 2026 | 16,090 | 16,419 |
| Concho Resources Inc. 5.50% 2023 | 1,500 | 1,542 |
| ConocoPhillips 4.20% 2021 | 3,120 | 3,384 |
| ConocoPhillips 4.95% 2026 | 16,485 | 18,537 |
| ConocoPhillips 5.95% 2046 | 600 | 743 |
| CONSOL Energy Inc. 5.875% 2022 | 1,450 | 1,342 |
| Denbury Resources Inc. 9.00% 20214 | 825 | 854 |
| Devon Energy Corp. 5.00% 2045 | 4,085 | 3,972 |
| Diamond Offshore Drilling, Inc. 4.875% 2043 | 16,660 | 12,293 |
| Ecopetrol SA 5.875% 2023 | 3,575 | 3,843 |
| Ecopetrol SA 5.375% 2026 | 3,855 | 3,899 |
| Ecopetrol SA 5.875% 2045 | 1,425 | 1,265 |
| Enbridge Energy Partners, LP 9.875% 2019 | 5,000 | 5,782 |
| Enbridge Energy Partners, LP 4.375% 2020 | 1,865 | 1,992 |
| Enbridge Energy Partners, LP 5.20% 2020 | 650 | 705 |
Capital Income Builder — Page 8 of 32
Bonds, notes & other debt instruments
Corporate bonds & notes (continued)
Energy (continued) | Principal amount
(000) | Value
(000) |
| Enbridge Energy Partners, LP 5.875% 2025 | $35,430 | $40,822 |
| Enbridge Energy Partners, LP 5.50% 2040 | 3,500 | 3,662 |
| Enbridge Energy Partners, LP 7.375% 2045 | 46,180 | 59,703 |
| Enbridge Energy Partners, LP, Series B, 6.50% 2018 | 23,200 | 24,649 |
| Enbridge Inc. 5.60% 2017 | 6,940 | 7,071 |
| Enbridge Inc. 4.00% 2023 | 19,680 | 20,197 |
| Energy Transfer Partners, LP 4.75% 2026 | 8,350 | 8,625 |
| Energy Transfer Partners, LP 6.125% 2045 | 3,780 | 3,950 |
| EnLink Midstream Partners, LP 2.70% 2019 | 5,920 | 5,920 |
| EnLink Midstream Partners, LP 4.40% 2024 | 3,815 | 3,803 |
| EnLink Midstream Partners, LP 4.15% 2025 | 4,865 | 4,751 |
| EnLink Midstream Partners, LP 5.05% 2045 | 5,095 | 4,562 |
| Ensco PLC 5.20% 2025 | 6,010 | 4,923 |
| Ensco PLC 5.75% 2044 | 1,060 | 713 |
| Enterprise Products Operating LLC 3.70% 2026 | 2,430 | 2,484 |
| Enterprise Products Operating LLC 3.95% 2027 | 2,170 | 2,260 |
| Enterprise Products Operating LLC 4.90% 2046 | 685 | 713 |
| EP Energy Corp. 9.375% 2020 | 600 | 473 |
| EP Energy Corp. 6.375% 2023 | 1,350 | 925 |
| Extraction Oil & Gas Holdings LLC 7.875% 20214 | 875 | 930 |
| Exxon Mobil Corp. 2.222% 2021 | 7,750 | 7,870 |
| Genel Energy Finance 3 Ltd. 7.50% 20194 | 11,000 | 9,185 |
| Halliburton Co. 3.80% 2025 | 9,880 | 10,301 |
| Halliburton Co. 5.00% 2045 | 8,980 | 9,904 |
| Husky Energy Inc. 6.20% 2017 | 5,500 | 5,724 |
| Husky Energy Inc. 7.25% 2019 | 4,500 | 5,212 |
| Jupiter Resources Inc. 8.50% 20224 | 3,000 | 2,475 |
| Kinder Morgan Energy Partners, LP 6.00% 2017 | 375 | 379 |
| Kinder Morgan Energy Partners, LP 3.50% 2023 | 2,480 | 2,483 |
| Kinder Morgan Energy Partners, LP 4.15% 2024 | 5,180 | 5,313 |
| Kinder Morgan Energy Partners, LP 4.25% 2024 | 1,335 | 1,379 |
| Kinder Morgan Energy Partners, LP 5.00% 2043 | 8,020 | 7,687 |
| Kinder Morgan Energy Partners, LP 5.40% 2044 | 9,505 | 9,564 |
| Kinder Morgan Energy Partners, LP 5.50% 2044 | 3,200 | 3,254 |
| Kinder Morgan Finance Co. 5.05% 2046 | 7,500 | 7,299 |
| Kinder Morgan, Inc. 4.30% 2025 | 130,619 | 136,211 |
| Kinder Morgan, Inc. 5.55% 2045 | 48,660 | 50,533 |
| NGL Energy Partners LP 5.125% 2019 | 3,100 | 3,084 |
| NGPL PipeCo LLC 7.119% 20174 | 10,225 | 10,707 |
| NGPL PipeCo LLC 9.625% 20194 | 6,425 | 6,778 |
| NGPL PipeCo LLC 7.768% 20374 | 10,000 | 11,000 |
| NGPL PipeCo LLC, Term Loan B, 6.75% 20176,7,8 | 30 | 30 |
| Noble Corp. PLC 5.25% 2018 | 1,090 | 1,085 |
| Noble Corp. PLC 7.20% 2025 | 4,470 | 3,654 |
| Noble Corp. PLC 8.20% 2045 | 7,020 | 4,765 |
| Parsley Energy, Inc. 6.25% 20244 | 900 | 950 |
| PDC Energy Inc. 7.75% 2022 | 5,150 | 5,498 |
| Pemex Project Funding Master Trust 5.75% 2018 | 2,750 | 2,894 |
| Pemex Project Funding Master Trust, Series 13, 6.625% 2035 | 15,000 | 15,172 |
| Petrobras Global Finance Co. 8.375% 2021 | 4,000 | 4,431 |
| Petrobras Global Finance Co. 6.25% 2024 | 2,320 | 2,294 |
| Petrobras Global Finance Co. 6.85% 2115 | 2,075 | 1,779 |
| Petróleos Mexicanos 5.50% 20194 | 3,725 | 3,952 |
| Petróleos Mexicanos 6.375% 20214 | 4,780 | 5,241 |
Capital Income Builder — Page 9 of 32
Bonds, notes & other debt instruments
Corporate bonds & notes (continued)
Energy (continued) | Principal amount
(000) | Value
(000) |
| Petróleos Mexicanos 4.50% 2026 | $11,830 | $11,457 |
| Petróleos Mexicanos 6.875% 2026 | 60,245 | 67,498 |
| Petróleos Mexicanos 6.875% 20264 | 11,845 | 13,271 |
| Petróleos Mexicanos 5.50% 2044 | 4,161 | 3,645 |
| Petróleos Mexicanos 5.625% 2046 | 10,840 | 9,415 |
| Petróleos Mexicanos 6.75% 20474 | 18,169 | 18,031 |
| Phillips 66 2.95% 2017 | 4,000 | 4,041 |
| Phillips 66 4.30% 2022 | 11,525 | 12,676 |
| Phillips 66 Partners LP 3.605% 2025 | 1,075 | 1,086 |
| Phillips 66 Partners LP 3.55% 2026 | 895 | 894 |
| Phillips 66 Partners LP 4.68% 2045 | 160 | 156 |
| Phillips 66 Partners LP 4.90% 2046 | 735 | 733 |
| Pioneer Natural Resources Co. 3.45% 2021 | 1,370 | 1,429 |
| QGOG Atlantic/Alaskan Rigs Ltd. 5.25% 20194,7 | 2,451 | 2,218 |
| QGOG Constellation SA 6.25% 20194 | 500 | 244 |
| Range Resources Corp. 4.875% 2025 | 4,225 | 4,058 |
| Regency Energy Partners LP and Regency Energy Finance Corp. 6.50% 2021 | 1,500 | 1,552 |
| Regency Energy Partners LP and Regency Energy Finance Corp. 5.50% 2023 | 4,050 | 4,176 |
| Repsol, SA 4.50% 2075 | €3,200 | 3,273 |
| Rice Energy Inc. 6.25% 2022 | $2,200 | 2,250 |
| Rice Energy Inc. 7.25% 2023 | 4,250 | 4,526 |
| Royal Dutch Shell PLC 1.75% 2021 | 10,865 | 10,746 |
| Royal Dutch Shell PLC 2.50% 2026 | 1,025 | 997 |
| Royal Dutch Shell PLC 3.75% 2046 | 3,170 | 3,043 |
| Sabine Pass Liquefaction, LLC 5.625% 2021 | 5,500 | 5,830 |
| Sabine Pass Liquefaction, LLC 6.25% 2022 | 3,000 | 3,300 |
| Sabine Pass Liquefaction, LLC 5.625% 2023 | 1,000 | 1,068 |
| Schlumberger BV 4.00% 20254 | 19,010 | 20,448 |
| Seven Generations Energy Ltd. 6.75% 20234 | 325 | 345 |
| Shell International Finance BV 1.875% 2021 | 8,250 | 8,202 |
| Shell International Finance BV 2.875% 2026 | 6,630 | 6,654 |
| Shell International Finance BV 4.00% 2046 | 6,500 | 6,458 |
| SM Energy Co. 5.625% 2025 | 825 | 790 |
| SM Energy Co. 6.75% 2026 | 575 | 590 |
| Southwestern Energy Co. 6.70% 2025 | 15,460 | 14,803 |
| Spectra Energy Partners, LP 2.95% 2018 | 4,040 | 4,123 |
| Spectra Energy Partners, LP 3.375% 2026 | 2,125 | 2,117 |
| Sunoco LP 6.25% 2021 | 6,165 | 6,335 |
| Targa Resources Corp. 4.125% 2019 | 6,000 | 6,082 |
| Targa Resources Corp. 5.125% 20254 | 775 | 777 |
| Targa Resources Partners LP 5.375% 20274 | 775 | 777 |
| TC PipeLines, LP 4.375% 2025 | 5,345 | 5,522 |
| Teekay Corp. 8.50% 2020 | 1,800 | 1,647 |
| Tesoro Logistics LP 5.50% 2019 | 575 | 614 |
| Tesoro Logistics LP 6.125% 2021 | 430 | 450 |
| Tesoro Logistics LP 6.25% 2022 | 1,400 | 1,491 |
| Tesoro Logistics LP 6.375% 2024 | 340 | 368 |
| TransCanada Corp. 5.875% 2076 | 45,500 | 48,799 |
| TransCanada PipeLines Ltd. 6.50% 2018 | 10,000 | 10,845 |
| TransCanada PipeLines Ltd., junior subordinated 6.35% 2067 | 12,430 | 9,975 |
| TransCanada PipeLines Ltd., junior subordinated 5.625% 2075 | 2,725 | 2,762 |
| Transocean Inc. 6.80% 2016 | 5,450 | 5,464 |
| Transocean Inc. 8.125% 2021 | 1,985 | 1,926 |
| Transportadora de Gas Peru SA 4.25% 20284,7 | 2,175 | 2,280 |
Capital Income Builder — Page 10 of 32
Bonds, notes & other debt instruments
Corporate bonds & notes (continued)
Energy (continued) | Principal amount
(000) | Value
(000) |
| Weatherford International PLC 7.75% 2021 | $1,475 | $1,495 |
| Weatherford International PLC 8.25% 2023 | 1,825 | 1,893 |
| Western Gas Partners LP 2.60% 2018 | 1,375 | 1,378 |
| Western Gas Partners LP 3.95% 2025 | 3,035 | 3,041 |
| Western Gas Partners LP 4.65% 2026 | 3,310 | 3,476 |
| Williams Partners LP 4.125% 2020 | 5,000 | 5,222 |
| Williams Partners LP 3.60% 2022 | 6,565 | 6,691 |
| Williams Partners LP 4.50% 2023 | 3,350 | 3,509 |
| Williams Partners LP 4.30% 2024 | 6,030 | 6,203 |
| Williams Partners LP 3.90% 2025 | 4,030 | 4,028 |
| Williams Partners LP 4.00% 2025 | 14,805 | 14,875 |
| Williams Partners LP 4.90% 2045 | 3,730 | 3,494 |
| Williams Partners LP 5.10% 2045 | 8,585 | 8,288 |
| | | 1,151,759 |
| Telecommunication services 0.94% | | |
| Altice Financing SA 6.625% 20234 | 8,005 | 8,270 |
| Altice Finco SA 6.50% 20224 | 700 | 733 |
| Altice Finco SA, First Lien, 7.75% 20224 | 11,250 | 11,883 |
| Altice SA 7.625% 20254 | 31,325 | 32,695 |
| Altice NV 7.50% 20264 | 3,000 | 3,105 |
| América Móvil, SAB de CV 6.45% 2022 | MXN45,000 | 2,347 |
| América Móvil, SAB de CV 8.46% 2036 | 147,200 | 7,559 |
| AT&T Inc. 4.125% 2026 | $21,095 | 22,184 |
| AT&T Inc. 8.25% 2031 | 2,633 | 3,813 |
| AT&T Inc. 4.50% 2035 | 13,440 | 13,394 |
| AT&T Inc. 4.35% 2045 | 2,184 | 2,013 |
| AT&T Inc. 4.50% 20484 | 3,610 | 3,418 |
| CenturyLink, Inc. 7.50% 2024 | 45,916 | 47,982 |
| CenturyLink, Inc., Series T, 5.80% 2022 | 2,925 | 2,980 |
| Cequel Communications Holdings I, LLC and Cequel Capital Corp. 6.375% 20204 | 8,425 | 8,709 |
| Clearwire Communications and Clearwire Finance, Inc. 14.75% 20164 | 4,000 | 4,035 |
| Deutsche Telekom International Finance BV 6.75% 2018 | 15,000 | 16,389 |
| Frontier Communications Corp. 8.875% 2020 | 1,000 | 1,066 |
| Frontier Communications Corp. 9.25% 2021 | 5,575 | 5,903 |
| Frontier Communications Corp. 10.50% 2022 | 10,825 | 11,299 |
| Frontier Communications Corp. 7.125% 2023 | 1,650 | 1,492 |
| Frontier Communications Corp. 11.00% 2025 | 73,235 | 75,042 |
| Intelsat Jackson Holding Co. 7.25% 2019 | 600 | 482 |
| Intelsat Jackson Holding Co. 7.25% 2020 | 625 | 472 |
| Ligado Networks, Term Loan, 9.75% 20206,7,8,9 | 5,252 | 4,859 |
| MetroPCS Wireless, Inc. 6.25% 2021 | 25,500 | 26,616 |
| Numericable Group SA 6.00% 20224 | 32,760 | 33,620 |
| Numericable Group SA 7.375% 20264 | 3,650 | 3,691 |
| SoftBank Group Corp. 3.36% 20234,7 | 20,000 | 20,169 |
| Sprint Capital Corp. 6.90% 2019 | 17,200 | 18,146 |
| Sprint Nextel Corp. 8.375% 2017 | 22,875 | 23,847 |
| Sprint Nextel Corp. 9.125% 2017 | 112,350 | 114,878 |
| Sprint Nextel Corp. 7.00% 2020 | 6,500 | 6,760 |
| Sprint Nextel Corp. 7.25% 2021 | 1,950 | 2,001 |
| Sprint Nextel Corp. 11.50% 2021 | 158,585 | 186,337 |
| Sprint Nextel Corp. 7.875% 2023 | 42,000 | 41,580 |
| T-Mobile US, Inc. 6.542% 2020 | 14,604 | 15,065 |
| T-Mobile US, Inc. 6.50% 2024 | 3,000 | 3,225 |
Capital Income Builder — Page 11 of 32
Bonds, notes & other debt instruments
Corporate bonds & notes (continued)
Telecommunication services (continued) | Principal amount
(000) | Value
(000) |
| T-Mobile US, Inc. 6.375% 2025 | $8,275 | $8,891 |
| T-Mobile US, Inc. 6.50% 2026 | 45,275 | 50,029 |
| Verizon Communications Inc. 1.234% 20178 | 7,695 | 7,709 |
| Verizon Communications Inc. 1.375% 2019 | 6,000 | 5,953 |
| Verizon Communications Inc. 1.75% 2021 | 4,340 | 4,255 |
| Verizon Communications Inc. 2.625% 2026 | 19,545 | 18,792 |
| Verizon Communications Inc. 3.85% 2042 | 8,310 | 7,643 |
| Verizon Communications Inc. 4.125% 2046 | 15,124 | 14,514 |
| Verizon Communications Inc. 4.522% 2048 | 5,065 | 5,103 |
| Vodafone Group PLC 5.625% 2017 | 10,450 | 10,597 |
| Wind Acquisition SA 4.75% 20204 | 9,300 | 9,393 |
| Wind Acquisition SA 7.375% 20214 | 6,350 | 6,525 |
| | | 937,463 |
| Health care 0.92% | | |
| AbbVie Inc. 2.50% 2020 | 35,335 | 35,813 |
| AbbVie Inc. 2.30% 2021 | 11,485 | 11,500 |
| AbbVie Inc. 3.20% 2022 | 5,015 | 5,167 |
| AbbVie Inc. 2.85% 2023 | 3,055 | 3,075 |
| AbbVie Inc. 3.20% 2026 | 17,925 | 17,672 |
| AbbVie Inc. 4.45% 2046 | 9,715 | 9,702 |
| Actavis Funding SCS 2.35% 2018 | 17,700 | 17,881 |
| Actavis Funding SCS 3.00% 2020 | 6,830 | 7,051 |
| Actavis Funding SCS 3.45% 2022 | 9,790 | 10,191 |
| Actavis Funding SCS 3.80% 2025 | 36,170 | 37,642 |
| Actavis Funding SCS 4.55% 2035 | 810 | 840 |
| Actavis Funding SCS 4.75% 2045 | 10,500 | 11,068 |
| Aetna Inc. 2.40% 2021 | 20,975 | 21,191 |
| Aetna Inc. 2.80% 2023 | 3,280 | 3,324 |
| Aetna Inc. 3.20% 2026 | 34,645 | 34,913 |
| Aetna Inc. 4.25% 2036 | 4,090 | 4,167 |
| Amgen Inc. 1.85% 2021 | 8,835 | 8,711 |
| Amgen Inc. 2.60% 2026 | 21,800 | 21,055 |
| Amgen Inc. 4.40% 2045 | 9,140 | 9,341 |
| AstraZeneca PLC 3.375% 2025 | 22,405 | 23,434 |
| Baxalta Inc. 4.00% 2025 | 4,830 | 5,066 |
| Becton, Dickinson and Co. 2.675% 2019 | 3,400 | 3,507 |
| Becton, Dickinson and Co. 3.734% 2024 | 3,255 | 3,477 |
| Becton, Dickinson and Co. 4.685% 2044 | 1,770 | 1,941 |
| Biogen Inc. 5.20% 2045 | 4,750 | 5,383 |
| Boston Scientific Corp. 2.85% 2020 | 11,470 | 11,791 |
| Boston Scientific Corp. 6.00% 2020 | 8,075 | 9,045 |
| Boston Scientific Corp. 3.375% 2022 | 5,300 | 5,539 |
| Boston Scientific Corp. 3.85% 2025 | 4,000 | 4,202 |
| Celgene Corp. 3.625% 2024 | 5,515 | 5,694 |
| Celgene Corp. 3.875% 2025 | 22,730 | 23,927 |
| Celgene Corp. 4.625% 2044 | 10,405 | 10,527 |
| Celgene Corp. 5.00% 2045 | 1,695 | 1,827 |
| Centene Corp. 5.75% 2017 | 3,175 | 3,242 |
| Centene Corp. 5.625% 2021 | 4,830 | 5,096 |
| Centene Corp. 4.75% 2022 | 7,730 | 7,885 |
| Centene Corp. 6.125% 2024 | 1,350 | 1,438 |
| Centene Corp. 4.75% 2025 | 4,450 | 4,450 |
| Concordia Healthcare Corp. 9.50% 20224 | 2,610 | 1,592 |
Capital Income Builder — Page 12 of 32
Bonds, notes & other debt instruments
Corporate bonds & notes (continued)
Health care (continued) | Principal amount
(000) | Value
(000) |
| DJO Finco Inc. 8.125% 20214 | $3,675 | $3,390 |
| EMD Finance LLC 2.40% 20204 | 1,600 | 1,621 |
| EMD Finance LLC 2.95% 20224 | 9,800 | 10,057 |
| EMD Finance LLC 3.25% 20254 | 18,700 | 19,113 |
| Endo Finance LLC & Endo Finco Inc. 6.00% 20234 | 3,175 | 2,762 |
| Endo Pharmaceuticals Holdings Inc. 5.75% 20224 | 915 | 828 |
| Express Scripts Inc. 4.80% 2046 | 2,750 | 2,769 |
| Gilead Sciences, Inc. 3.05% 2016 | 18,215 | 18,247 |
| Gilead Sciences, Inc. 3.25% 2022 | 1,780 | 1,871 |
| Gilead Sciences, Inc. 2.95% 2027 | 8,375 | 8,296 |
| Gilead Sciences, Inc. 4.15% 2047 | 9,465 | 9,411 |
| HCA Inc. 3.75% 2019 | 1,915 | 1,963 |
| HCA Inc. 6.50% 2020 | 5,000 | 5,547 |
| HCA Inc. 5.00% 2024 | 5,000 | 5,237 |
| HCA Inc. 5.25% 2025 | 4,000 | 4,200 |
| HCA Inc. 5.25% 2026 | 4,175 | 4,375 |
| HCA Inc. 4.50% 2027 | 1,250 | 1,237 |
| Hologic, Inc. 5.25% 20224 | 1,150 | 1,221 |
| Humana Inc. 3.85% 2024 | 6,800 | 7,205 |
| Humana Inc. 4.95% 2044 | 700 | 760 |
| IMS Health Holdings, Inc. 5.00% 20264 | 1,700 | 1,759 |
| inVentiv Health, Inc. 10.00% 20184,9 | 10,278 | 10,545 |
| inVentiv Health, Inc. 10.00% 2018 | 1,256 | 1,257 |
| inVentiv Health, Inc. 10.00% 2018 | 837 | 838 |
| inVentiv Health, Inc. 7.50% 20244 | 1,875 | 1,936 |
| inVentiv Health, Inc., Term Loan B, 4.75% 20236,7,8 | 6,000 | 6,007 |
| inVentiv Health, Inc., Term Loan B4, 8.75% 20186,7,8 | 2,860 | 2,869 |
| Johnson & Johnson 2.45% 2026 | 4,830 | 4,881 |
| Kindred Healthcare, Inc. 8.00% 2020 | 1,875 | 1,884 |
| Kindred Healthcare, Inc. 8.75% 2023 | 2,110 | 2,055 |
| Kinetic Concepts, Inc. 7.875% 20214 | 1,475 | 1,606 |
| Kinetic Concepts, Inc. 9.625% 20214 | 12,000 | 11,610 |
| Kinetic Concepts, Inc. 12.50% 20214 | 5,000 | 4,762 |
| Laboratory Corporation of America Holdings 4.70% 2045 | 12,565 | 13,360 |
| Mallinckrodt PLC 5.625% 20234 | 4,195 | 3,964 |
| McKesson Corp. 2.284% 2019 | 4,815 | 4,878 |
| MEDNAX, Inc. 5.25% 20234 | 370 | 388 |
| Medtronic, Inc. 2.50% 2020 | 14,015 | 14,393 |
| Medtronic, Inc. 4.625% 2045 | 2,825 | 3,209 |
| Merck & Co., Inc. 1.161% 20188 | 30,000 | 30,155 |
| Molina Healthcare, Inc. 5.375% 2022 | 5,855 | 6,122 |
| Mylan Laboratories Inc. 3.15% 20214 | 8,000 | 8,144 |
| Novartis Securities Investment Ltd. 5.125% 2019 | 15,000 | 16,261 |
| Pfizer Inc. 1.15% 20188 | 5,000 | 5,020 |
| Pfizer Inc. 7.20% 2039 | 196 | 292 |
| Quintiles Transnational Corp. 4.875% 20234 | 3,285 | 3,396 |
| Roche Holdings, Inc. 2.375% 20274 | 14,175 | 13,921 |
| Shire PLC 2.40% 2021 | 13,500 | 13,416 |
| Shire PLC 2.875% 2023 | 13,680 | 13,481 |
| Shire PLC 3.20% 2026 | 17,760 | 17,505 |
| St. Jude Medical, Inc. 2.80% 2020 | 2,645 | 2,706 |
| Tenet Healthcare Corp. 6.75% 2023 | 1,815 | 1,670 |
| Tenet Healthcare Corp., First Lien, 6.25% 2018 | 4,000 | 4,250 |
| Tenet Healthcare Corp., First Lien, 6.00% 2020 | 2,115 | 2,247 |
Capital Income Builder — Page 13 of 32
Bonds, notes & other debt instruments
Corporate bonds & notes (continued)
Health care (continued) | Principal amount
(000) | Value
(000) |
| Tenet Healthcare Corp., First Lien, 4.50% 2021 | $10,000 | $10,050 |
| Teva Pharmaceutical Finance Company BV 2.20% 2021 | 18,865 | 18,677 |
| Teva Pharmaceutical Finance Company BV 2.80% 2023 | 8,980 | 8,850 |
| Teva Pharmaceutical Finance Company BV 3.15% 2026 | 13,075 | 12,751 |
| Teva Pharmaceutical Finance Company BV 4.10% 2046 | 9,390 | 8,762 |
| UnitedHealth Group Inc. 2.70% 2020 | 6,460 | 6,663 |
| UnitedHealth Group Inc. 3.75% 2025 | 13,180 | 14,249 |
| UnitedHealth Group Inc. 4.625% 2035 | 1,475 | 1,687 |
| UnitedHealth Group Inc. 4.75% 2045 | 2,455 | 2,843 |
| Valeant Pharmaceuticals International Inc. 5.50% 20234 | 40,825 | 31,946 |
| VPI Escrow Corp. 6.75% 20184 | 17,914 | 17,377 |
| VPI Escrow Corp. 6.375% 20204 | 8,435 | 7,381 |
| VRX Escrow Corp. 5.375% 20204 | 3,465 | 2,963 |
| VRX Escrow Corp. 5.875% 20234 | 1,615 | 1,252 |
| VRX Escrow Corp. 6.125% 20254 | 1,110 | 857 |
| WellPoint, Inc. 2.30% 2018 | 2,740 | 2,763 |
| WellPoint, Inc. 2.25% 2019 | 2,000 | 2,020 |
| Zimmer Holdings, Inc. 2.00% 2018 | 4,000 | 4,021 |
| Zimmer Holdings, Inc. 2.70% 2020 | 5,500 | 5,597 |
| Zimmer Holdings, Inc. 3.15% 2022 | 4,000 | 4,103 |
| | | 915,076 |
| Financials 0.78% | | |
| ACE Capital Trust II 9.70% 2030 | 7,210 | 10,905 |
| ACE INA Holdings Inc. 2.30% 2020 | 1,625 | 1,659 |
| ACE INA Holdings Inc. 2.875% 2022 | 3,695 | 3,845 |
| ACE INA Holdings Inc. 3.35% 2026 | 3,690 | 3,884 |
| ACE INA Holdings Inc. 4.35% 2045 | 4,135 | 4,633 |
| American Express Co. 6.15% 2017 | 9,080 | 9,437 |
| AXA SA, junior subordinated 6.463% (undated)4 | 1,900 | 1,991 |
| AXA SA, Series B, junior subordinated 6.379% (undated)4 | 7,000 | 7,671 |
| Bank of America Corp. 5.75% 2017 | 5,000 | 5,224 |
| Bank of America Corp. 5.65% 2018 | 1,940 | 2,053 |
| Bank of America Corp. 2.625% 2020 | 7,750 | 7,888 |
| Bank of America Corp. 2.625% 2021 | 11,177 | 11,324 |
| Bank of America Corp. 5.875% 2021 | 5,000 | 5,690 |
| Bank of America Corp. 3.50% 2026 | 15,631 | 16,066 |
| Bank of America Corp. 3.248% 2027 | 19,175 | 19,219 |
| Bank of America Corp. junior subordinated 6.25% noncumulative (undated) | 6,875 | 7,210 |
| Bank of America Corp., Series AA, 6.10% (undated) | 1,050 | 1,098 |
| Bank of New York Mellon Corp. 2.10% 2019 | 15,000 | 15,205 |
| Bank of New York Mellon Corp. 2.20% 2023 | 5,000 | 4,935 |
| Barclays Bank PLC 5.14% 2020 | 15,525 | 16,748 |
| BB&T Corp. 1.45% 2019 | 8,780 | 8,765 |
| BB&T Corp. 2.45% 2020 | 7,800 | 7,961 |
| Berkshire Hathaway Finance Corp. 1.15% 2018 | 5,590 | 5,583 |
| Berkshire Hathaway Finance Corp. 1.30% 2019 | 2,810 | 2,805 |
| Berkshire Hathaway Inc. 2.20% 2021 | 2,240 | 2,291 |
| Berkshire Hathaway Inc. 3.125% 2026 | 2,205 | 2,292 |
| Capital One Financial Corp. 1.85% 2019 | 5,000 | 4,998 |
| CIT Group Inc. 5.00% 2017 | 7,000 | 7,096 |
| CIT Group Inc. 3.875% 2019 | 2,525 | 2,570 |
| Citigroup Inc. 2.50% 2018 | 7,500 | 7,606 |
| Citigroup Inc. 8.50% 2019 | 12,656 | 14,716 |
Capital Income Builder — Page 14 of 32
Bonds, notes & other debt instruments
Corporate bonds & notes (continued)
Financials (continued) | Principal amount
(000) | Value
(000) |
| Citigroup Inc. 2.35% 2021 | $10,000 | $10,015 |
| Citigroup Inc. 3.20% 2026 | 31,250 | 31,230 |
| Citigroup Inc., Series Q, junior subordinated 5.95% (undated) | 10,723 | 11,018 |
| Citigroup Inc., Series P, 5.95% (undated) | 113 | 116 |
| CNA Financial Corp. 7.35% 2019 | 6,000 | 6,881 |
| Credit Suisse Group AG 3.80% 2022 | 7,888 | 8,030 |
| Credit Suisse Group AG 3.80% 20234 | 12,050 | 12,190 |
| Credit Suisse Group AG 4.55% 20264 | 7,500 | 7,879 |
| Discover Financial Services 10.25% 2019 | 4,334 | 5,084 |
| Goldman Sachs Group, Inc. 2.241% 20218 | 17,228 | 17,222 |
| Goldman Sachs Group, Inc. 2.35% 2021 | 7,985 | 7,953 |
| Goldman Sachs Group, Inc. 5.75% 2022 | 7,500 | 8,682 |
| Goldman Sachs Group, Inc. 4.75% 2045 | 7,219 | 7,980 |
| HBOS PLC 6.75% 20184 | 25,085 | 26,734 |
| HSBC Holdings PLC 2.65% 2022 | 12,350 | 12,289 |
| HSBC USA Inc. 1.737% 20188 | 5,000 | 5,020 |
| Intesa Sanpaolo SpA 5.017% 20244 | 6,370 | 5,922 |
| iStar Financial Inc. 4.875% 2018 | 1,650 | 1,656 |
| JPMorgan Chase & Co. 6.30% 2019 | 5,000 | 5,544 |
| JPMorgan Chase & Co. 4.625% 2021 | 5,000 | 5,508 |
| JPMorgan Chase & Co. 2.95% 2026 | 6,000 | 5,952 |
| JPMorgan Chase & Co., Series I, junior subordinated 7.90% (undated) | 49,540 | 51,125 |
| Leucadia National Corp. 5.50% 2023 | 3,265 | 3,434 |
| MetLife Global Funding I 2.30% 20194 | 5,395 | 5,483 |
| MetLife Global Funding I 2.00% 20204 | 2,155 | 2,167 |
| MetLife Global Funding I 2.50% 20204 | 4,000 | 4,083 |
| MetLife Global Funding I 1.95% 20214 | 11,000 | 10,963 |
| MetLife, Inc. 3.60% 2025 | 2,870 | 3,042 |
| Morgan Stanley 2.125% 2018 | 10,000 | 10,076 |
| Morgan Stanley 2.50% 2021 | 20,725 | 20,897 |
| Morgan Stanley 2.281% 20238 | 6,500 | 6,503 |
| Morgan Stanley 3.125% 2026 | 21,660 | 21,662 |
| Morgan Stanley 3.875% 2026 | 7,525 | 7,948 |
| MSCI Inc. 4.75% 20264 | 2,575 | 2,601 |
| New York Life Global Funding 1.50% 20194 | 3,665 | 3,672 |
| New York Life Global Funding 2.10% 20194 | 6,000 | 6,087 |
| New York Life Global Funding 1.95% 20204 | 2,190 | 2,202 |
| New York Life Global Funding 1.70% 20214 | 23,000 | 22,788 |
| Nordea Bank AB 1.625% 20184 | 2,500 | 2,504 |
| Northern Trust Corp. 5.85% 20174 | 2,850 | 2,982 |
| PNC Preferred Funding Trust I, junior subordinated 2.50% (undated)4,8 | 15,300 | 15,070 |
| QBE Insurance Group Ltd. 2.40% 20184 | 15,035 | 15,104 |
| Travelers Companies, Inc. 3.75% 2046 | 805 | 822 |
| US Bancorp. 1.307% 20188 | 5,000 | 5,012 |
| Wells Fargo & Co. 1.11% 20178 | 7,695 | 7,698 |
| Wells Fargo & Co. 2.10% 2021 | 17,944 | 17,868 |
| Wells Fargo & Co. 2.50% 2021 | 2,631 | 2,666 |
| Wells Fargo & Co. 3.00% 2026 | 19,760 | 19,689 |
| Wells Fargo & Co., Series K, junior subordinated 7.98% (undated) | 71,606 | 74,739 |
| | | 775,160 |
Capital Income Builder — Page 15 of 32
Bonds, notes & other debt instruments
Corporate bonds & notes (continued)
Consumer discretionary 0.73% | Principal amount
(000) | Value
(000) |
| 21st Century Fox America, Inc. 4.95% 2045 | $1,700 | $1,875 |
| Adient Global Holdings Ltd. 4.875% 20264 | 750 | 740 |
| Amazon.com, Inc. 4.95% 2044 | 4,250 | 4,984 |
| American Honda Finance Corp. 1.70% 2021 | 10,000 | 9,903 |
| Bayerische Motoren Werke AG 1.45% 20194 | 10,210 | 10,182 |
| Bayerische Motoren Werke AG 1.85% 20214 | 2,000 | 1,982 |
| Bayerische Motoren Werke AG 2.00% 20214 | 15,000 | 15,025 |
| Boyd Gaming Corp. 6.375% 20264 | 3,375 | 3,628 |
| Burger King Corp. 4.625% 20224 | 13,000 | 13,455 |
| Burger King Corp. 6.00% 20224 | 4,150 | 4,351 |
| Cablevision Systems Corp. 7.75% 2018 | 18,475 | 19,514 |
| Cablevision Systems Corp. 5.50% 20274 | 2,400 | 2,440 |
| CBS Corp. 1.95% 2017 | 8,000 | 8,031 |
| CBS Outdoor Americas Inc. 5.25% 2022 | 1,500 | 1,558 |
| CBS Outdoor Americas Inc. 5.625% 2024 | 799 | 834 |
| CCO Holdings LLC and CCO Holdings Capital Corp. 3.579% 20204 | 7,815 | 8,111 |
| CCO Holdings LLC and CCO Holdings Capital Corp. 4.464% 20224 | 6,175 | 6,587 |
| CCO Holdings LLC and CCO Holdings Capital Corp. 6.625% 2022 | 800 | 835 |
| CCO Holdings LLC and CCO Holdings Capital Corp. 4.908% 20254 | 37,910 | 40,974 |
| CCO Holdings LLC and CCO Holdings Capital Corp. 5.50% 20264 | 3,275 | 3,373 |
| CCO Holdings LLC and CCO Holdings Capital Corp. 5.75% 20264 | 4,575 | 4,778 |
| Clear Channel Worldwide Holdings, Inc. 7.625% 2020 | 1,775 | 1,726 |
| Comcast Corp. 6.30% 2017 | 7,000 | 7,366 |
| Comcast Corp. 2.35% 2027 | 7,635 | 7,390 |
| Comcast Corp. 4.75% 2044 | 5,905 | 6,703 |
| Cooper-Standard Holdings Inc. 5.625% 20264 | 1,245 | 1,253 |
| Cumulus Media Holdings Inc. 7.75% 2019 | 5,030 | 2,113 |
| Cumulus Media Inc., Term Loan B, 4.25% 20206,7,8 | 2,045 | 1,421 |
| Daimler Finance NA LLC 2.70% 20204 | 1,500 | 1,540 |
| DaimlerChrysler North America Holding Corp. 1.617% 20184,8 | 1,500 | 1,508 |
| DaimlerChrysler North America Holding Corp. 2.00% 20214 | 14,875 | 14,778 |
| DaimlerChrysler North America Holding Corp. 2.20% 20214 | 4,100 | 4,109 |
| DaimlerChrysler North America Holding Corp. 3.30% 20254 | 6,750 | 6,994 |
| DISH DBS Corp. 7.875% 2019 | 7,000 | 7,811 |
| Dollar Tree Inc. 5.25% 2020 | 575 | 598 |
| Dollar Tree Inc. 5.75% 2023 | 11,175 | 11,915 |
| Federated Department Stores, Inc. 6.90% 2029 | 3,177 | 3,572 |
| Ford Motor Co. 4.75% 2043 | 750 | 754 |
| Ford Motor Credit Co. 8.00% 2016 | 2,000 | 2,016 |
| Ford Motor Credit Co. 4.25% 2017 | 5,000 | 5,039 |
| Ford Motor Credit Co. 2.375% 2018 | 2,500 | 2,518 |
| Ford Motor Credit Co. 2.597% 2019 | 810 | 820 |
| Ford Motor Credit Co. 3.20% 2021 | 10,000 | 10,228 |
| Ford Motor Credit Co. 3.219% 2022 | 4,390 | 4,483 |
| Ford Motor Credit Co. 3.664% 2024 | 1,000 | 1,014 |
| Ford Motor Credit Co. 4.134% 2025 | 15,000 | 15,623 |
| Gannett Co., Inc. 5.125% 2019 | 1,385 | 1,427 |
| Gannett Co., Inc. 4.875% 20214 | 435 | 455 |
| Gannett Co., Inc. 5.50% 20244 | 680 | 700 |
| General Motors Co. 4.00% 2025 | 1,340 | 1,355 |
| General Motors Financial Co. 6.75% 2018 | 1,500 | 1,610 |
| General Motors Financial Co. 3.70% 2020 | 15,890 | 16,393 |
| General Motors Financial Co. 4.375% 2021 | 5,000 | 5,319 |
| General Motors Financial Co. 3.45% 2022 | 3,170 | 3,210 |
Capital Income Builder — Page 16 of 32
Bonds, notes & other debt instruments
Corporate bonds & notes (continued)
Consumer discretionary (continued) | Principal amount
(000) | Value
(000) |
| General Motors Financial Co. 3.70% 2023 | $2,730 | $2,771 |
| General Motors Financial Co. 4.30% 2025 | 7,500 | 7,668 |
| General Motors Financial Co. 4.00% 2026 | 8,500 | 8,471 |
| Hilton Worldwide Finance LLC 5.625% 2021 | 1,800 | 1,854 |
| Hilton Worldwide Holdings Inc. 4.25% 20244 | 5,815 | 5,859 |
| Home Depot, Inc. 4.40% 2021 | 10,000 | 11,106 |
| Home Depot, Inc. 2.125% 2026 | 10,820 | 10,452 |
| Home Depot, Inc. 3.50% 2056 | 1,170 | 1,091 |
| International Game Technology 6.25% 20224 | 2,800 | 2,985 |
| Li & Fung Ltd. 6.00% (undated) | 28,831 | 29,984 |
| Limited Brands, Inc. 8.50% 2019 | 3,006 | 3,509 |
| Limited Brands, Inc. 7.00% 2020 | 2,994 | 3,428 |
| Limited Brands, Inc. 6.875% 2035 | 2,575 | 2,742 |
| Marks and Spencer Group PLC 6.25% 20174 | 6,729 | 7,034 |
| Marriott International, Inc., Series I, 6.375% 2017 | 5,250 | 5,414 |
| McDonald’s Corp. 3.70% 2026 | 10,895 | 11,558 |
| McDonald’s Corp. 4.70% 2035 | 3,000 | 3,307 |
| McDonald’s Corp. 4.875% 2045 | 5,700 | 6,414 |
| McGraw-Hill Global Education Holdings, LLC, Term Loan B, 5.00% 20226,7,8 | 3,601 | 3,612 |
| Mediacom Broadband LLC and Mediacom Broadband Corp. 6.375% 2023 | 6,875 | 7,184 |
| MGM Resorts International 6.75% 2020 | 2,025 | 2,264 |
| MGM Resorts International 7.75% 2022 | 12,700 | 14,728 |
| Michaels Stores, Inc. 5.875% 20204 | 725 | 749 |
| NBC Universal Enterprise, Inc. 1.565% 20184,8 | 13,105 | 13,199 |
| NBC Universal Enterprise, Inc. 5.25% 20494 | 9,635 | 10,288 |
| NCL Corp. Ltd. 5.25% 20194 | 900 | 920 |
| Needle Merger Sub Corp. 8.125% 20194 | 1,714 | 1,714 |
| Neiman Marcus Group LTD Inc. 8.00% 20214 | 2,150 | 1,784 |
| Neiman Marcus Group LTD Inc. 8.75% 20214,9 | 3,955 | 3,142 |
| Neiman Marcus, Term Loan B, 4.25% 20206,7,8 | 6,305 | 5,812 |
| Newell Rubbermaid Inc. 2.60% 2019 | 6,445 | 6,579 |
| Newell Rubbermaid Inc. 3.15% 2021 | 15,055 | 15,694 |
| Newell Rubbermaid Inc. 3.85% 2023 | 11,275 | 11,980 |
| Newell Rubbermaid Inc. 4.20% 2026 | 22,695 | 24,550 |
| Newell Rubbermaid Inc. 5.50% 2046 | 17,585 | 20,789 |
| NIKE, Inc. 3.875% 2045 | 12,145 | 12,743 |
| PETCO Animal Supplies, Inc., Term Loan B-1, 5.00% 20236,7,8 | 9,429 | 9,526 |
| PETsMART, Inc. 7.125% 20234 | 7,100 | 7,446 |
| Playa Resorts Holding BV 8.00% 20204 | 6,600 | 6,831 |
| Sally Holdings LLC and Sally Capital Inc. 5.625% 2025 | 725 | 778 |
| Schaeffler Verwaltungs 4.125% 20214,9 | 500 | 513 |
| Schaeffler Verwaltungs 4.50% 20234,9 | 325 | 330 |
| Starbucks Corp. 2.70% 2022 | 1,500 | 1,559 |
| Starbucks Corp. 4.30% 2045 | 1,750 | 1,993 |
| Tenneco Inc. 5.00% 2026 | 7,475 | 7,531 |
| Thomson Reuters Corp. 1.30% 2017 | 2,455 | 2,456 |
| Thomson Reuters Corp. 1.65% 2017 | 2,880 | 2,888 |
| Thomson Reuters Corp. 4.30% 2023 | 2,085 | 2,260 |
| Thomson Reuters Corp. 5.65% 2043 | 2,375 | 2,707 |
| Time Warner Cable Inc. 5.00% 2020 | 10,000 | 10,797 |
| Toyota Motor Credit Corp. 2.25% 2023 | 5,630 | 5,622 |
| Under Armour, Inc. 3.25% 2026 | 2,840 | 2,807 |
| Univision Communications Inc. 8.50% 20214 | 1,469 | 1,514 |
| Univision Communications Inc. 6.75% 20224 | 10,000 | 10,575 |
Capital Income Builder — Page 17 of 32
Bonds, notes & other debt instruments
Corporate bonds & notes (continued)
Consumer discretionary (continued) | Principal amount
(000) | Value
(000) |
| Univision Communications Inc. 5.125% 20254 | $2,500 | $2,516 |
| Volkswagen Group of America Finance, LLC 1.25% 20174 | 5,930 | 5,919 |
| Volkswagen Group of America Finance, LLC 2.40% 20204 | 4,070 | 4,110 |
| Warner Music Group 5.625% 20224 | 6,475 | 6,758 |
| Wynn Las Vegas, LLC and Wynn Capital Corp. 5.375% 2022 | 1,675 | 1,725 |
| Wynn Macau, Ltd. 5.25% 20214 | 1,000 | 1,008 |
| YUM! Brands, Inc. 5.00% 20244 | 3,090 | 3,183 |
| YUM! Brands, Inc. 5.25% 20264 | 1,545 | 1,614 |
| ZF Friedrichshafen AG 4.50% 20224 | 7,395 | 7,848 |
| ZF Friedrichshafen AG 4.75% 20254 | 8,000 | 8,470 |
| | | 721,583 |
| Utilities 0.50% | | |
| Tampa Electric Co. 5.40% 2021 | 1,987 | 2,228 |
| AES Corp. 8.00% 2020 | 2,900 | 3,415 |
| AES Corp. 7.375% 2021 | 7,000 | 7,927 |
| AES Corp. 6.00% 2026 | 1,250 | 1,289 |
| American Electric Power Co., Inc. 2.75% 2026 | 7,289 | 7,199 |
| Calpine Corp. 6.00% 20224 | 350 | 366 |
| Calpine Corp. 5.375% 2023 | 2,925 | 2,910 |
| Calpine Corp. 7.875% 20234 | 1,123 | 1,179 |
| Calpine Corp. 5.875% 20244 | 5,000 | 5,287 |
| CenterPoint Energy, Inc. 2.25% 2022 | 6,264 | 6,336 |
| Cleveland Electric Illuminating Co. 8.875% 2018 | 21,700 | 24,705 |
| CMS Energy Corp. 8.75% 2019 | 2,060 | 2,423 |
| CMS Energy Corp. 5.05% 2022 | 9,322 | 10,557 |
| CMS Energy Corp. 3.875% 2024 | 1,650 | 1,774 |
| CMS Energy Corp. 3.60% 2025 | 10,631 | 11,208 |
| CMS Energy Corp. 3.00% 2026 | 9,287 | 9,387 |
| Comision Federal de Electricidad 4.75% 20274 | 745 | 758 |
| Consumers Energy Co., First Mortgage Bonds, 5.15% 2017 | 1,500 | 1,518 |
| Consumers Energy Co. 5.65% 2020 | 4,058 | 4,577 |
| Consumers Energy Co. 2.85% 2022 | 1,454 | 1,516 |
| Dominion Resources, Inc. 4.104% 20217 | 12,838 | 13,751 |
| Duke Energy Corp. 1.80% 2021 | 14,000 | 13,845 |
| Duke Energy Corp. 3.75% 2024 | 2,490 | 2,651 |
| Duke Energy Corp. 2.65% 2026 | 6,660 | 6,497 |
| Duke Energy Corp. 3.75% 2046 | 5,250 | 5,031 |
| Duke Energy Florida, LLC 3.40% 2046 | 3,285 | 3,148 |
| Dynegy Finance Inc. 6.75% 2019 | 2,520 | 2,563 |
| Dynegy Finance Inc. 7.375% 2022 | 2,290 | 2,227 |
| Dynegy Finance Inc. 7.625% 2024 | 2,570 | 2,470 |
| Electricité de France SA 4.95% 20454 | 6,500 | 6,948 |
| Emera Inc. 6.75% 2076 | 16,000 | 17,712 |
| Emera US Finance LP 2.15% 20194 | 2,000 | 2,020 |
| Emera US Finance LP 2.70% 20214 | 6,000 | 6,108 |
| Emera US Finance LP 3.55% 20264 | 3,300 | 3,379 |
| Entergy Corp. 4.70% 2017 | 6,500 | 6,527 |
| Entergy Corp. 5.59% 2024 | 1,221 | 1,455 |
| Entergy Corp. 2.40% 2026 | 7,875 | 7,710 |
| Entergy Corp. 2.95% 2026 | 12,745 | 12,599 |
| Entergy Louisiana, LLC 3.30% 2022 | 3,264 | 3,385 |
| Eversource Energy 2.50% 2021 | 3 | 3 |
| Eversource Energy 2.375% 2022 | 2,564 | 2,594 |
Capital Income Builder — Page 18 of 32
Bonds, notes & other debt instruments
Corporate bonds & notes (continued)
Utilities (continued) | Principal amount
(000) | Value
(000) |
| Eversource Energy 3.25% 2025 | $542 | $571 |
| Exelon Corp. 2.45% 2021 | 2,499 | 2,528 |
| Exelon Corp. 3.95% 2025 | 10,000 | 10,696 |
| Exelon Corp. 3.40% 2026 | 1,570 | 1,625 |
| Exelon Corp. 4.95% 2035 | 1,124 | 1,246 |
| Exelon Corp. 4.45% 2046 | 7,000 | 7,320 |
| FirstEnergy Corp. 7.375% 2031 | 3,200 | 4,173 |
| FirstEnergy Corp., Series B, 4.25% 2023 | 8,488 | 9,019 |
| Mississippi Power Co. 4.25% 2042 | 2,781 | 2,551 |
| Nevada Power Co., General and Refunding Mortgage Notes, Series V, 7.125% 2019 | 1,428 | 1,613 |
| Northern States Power Co., First Mortgage Bonds, 2.15% 2022 | 2,124 | 2,137 |
| NRG Energy, Inc. 6.625% 2023 | 2,000 | 2,005 |
| NRG Energy, Inc. 7.25% 20264 | 3,825 | 3,777 |
| NRG Energy, Inc. 6.625% 20274 | 1,025 | 961 |
| NV Energy, Inc 6.25% 2020 | 18,664 | 21,709 |
| Ohio Power Co., Series G, 6.60% 2033 | 3,178 | 4,054 |
| Ohio Power Co., Series D, 6.60% 2033 | 704 | 906 |
| Pacific Gas and Electric Co. 3.25% 2021 | 3,000 | 3,165 |
| Pacific Gas and Electric Co. 2.45% 2022 | 1,972 | 2,005 |
| Pacific Gas and Electric Co. 3.25% 2023 | 10,000 | 10,520 |
| Pacific Gas and Electric Co. 3.85% 2023 | 2,431 | 2,652 |
| Pacific Gas and Electric Co. 3.40% 2024 | 4,000 | 4,232 |
| Pacific Gas and Electric Co. 3.75% 2024 | 602 | 653 |
| Pacific Gas and Electric Co. 3.75% 2042 | 1,101 | 1,109 |
| Pacific Gas and Electric Co. 4.25% 2046 | 3,129 | 3,413 |
| Pennsylvania Electric Co. 6.05% 2017 | 3,000 | 3,110 |
| Progress Energy, Inc. 7.05% 2019 | 9,650 | 10,860 |
| Progress Energy, Inc. 7.00% 2031 | 10,000 | 13,353 |
| Progress Energy, Inc. 7.75% 2031 | 7,115 | 9,840 |
| Public Service Co. of Colorado 5.80% 2018 | 4,850 | 5,224 |
| Public Service Co. of Colorado 2.25% 2022 | 1,741 | 1,764 |
| Puget Energy, Inc. 6.50% 2020 | 8,815 | 10,180 |
| Puget Energy, Inc. 5.625% 2022 | 9,010 | 10,289 |
| Puget Energy, Inc. 3.65% 2025 | 9,902 | 10,185 |
| Sierra Pacific Power Co. 2.60% 2026 | 15,750 | 15,754 |
| Southern Co. 2.35% 2021 | 12,500 | 12,640 |
| Talen Energy Corp. 6.50% 2018 | 1,000 | 1,043 |
| Talen Energy Corp. 4.625% 20194 | 2,370 | 2,263 |
| Tampa Electric Co. 2.60% 2022 | 1,803 | 1,845 |
| Teco Finance, Inc. 1.476% 20188 | 1,360 | 1,358 |
| Teco Finance, Inc. 5.15% 2020 | 17,285 | 18,910 |
| TEX Operations Co. LLC, Term Loan B, 5.00% 20236,7,8 | 4,926 | 4,971 |
| TEX Operations Co. LLC, Term Loan C, 5.00% 20236,7,8 | 1,124 | 1,134 |
| Virginia Electric and Power Co. 2.95% 2022 | 7,245 | 7,599 |
| Virginia Electric and Power Co. 3.45% 2024 | 1,860 | 1,991 |
| Xcel Energy Inc. 3.30% 2025 | 5,850 | 6,100 |
| Xcel Energy Inc. 6.50% 2036 | 10,000 | 13,335 |
| | | 497,570 |
| Consumer staples 0.43% | | |
| Altria Group, Inc. 9.25% 2019 | 3,834 | 4,626 |
| Altria Group, Inc. 2.625% 2020 | 4,340 | 4,465 |
| Altria Group, Inc. 4.75% 2021 | 1,500 | 1,675 |
| Altria Group, Inc. 2.95% 2023 | 3,800 | 3,923 |
Capital Income Builder — Page 19 of 32
Bonds, notes & other debt instruments
Corporate bonds & notes (continued)
Consumer staples (continued) | Principal amount
(000) | Value
(000) |
| Altria Group, Inc. 4.00% 2024 | $3,000 | $3,299 |
| Altria Group, Inc. 2.625% 2026 | 1,375 | 1,366 |
| Altria Group, Inc. 5.375% 2044 | 3,375 | 4,117 |
| Altria Group, Inc. 3.875% 2046 | 13,390 | 13,255 |
| Anheuser-Busch InBev NV 6.875% 2019 | 16,000 | 18,426 |
| Anheuser-Busch InBev NV 2.65% 2021 | 3,275 | 3,359 |
| Anheuser-Busch InBev NV 3.30% 2023 | 7,140 | 7,477 |
| Anheuser-Busch InBev NV 3.65% 2026 | 28,235 | 29,777 |
| Anheuser-Busch InBev NV 4.90% 2046 | 5,670 | 6,520 |
| Coca-Cola Co. 3.30% 2021 | 2,000 | 2,143 |
| Constellation Brands, Inc. 3.875% 2019 | 3,500 | 3,671 |
| CVS Health Corp. 2.125% 2021 | 5,010 | 5,021 |
| CVS Health Corp. 2.875% 2026 | 6,430 | 6,399 |
| Kraft Heinz Co. 4.375% 2046 | 6,120 | 6,191 |
| Kroger Co. 6.40% 2017 | 31,300 | 32,528 |
| Molson Coors Brewing Co. 1.45% 2019 | 1,245 | 1,238 |
| Molson Coors Brewing Co. 2.10% 2021 | 3,325 | 3,316 |
| Molson Coors Brewing Co. 3.00% 2026 | 9,020 | 8,964 |
| Molson Coors Brewing Co. 4.20% 2046 | 955 | 965 |
| Mondelez International, Inc. 1.625% 20194 | 8,000 | 7,978 |
| PepsiCo, Inc. 1.70% 2021 | 3,100 | 3,083 |
| PepsiCo, Inc. 2.375% 2026 | 4,250 | 4,184 |
| PepsiCo, Inc. 3.45% 2046 | 5,750 | 5,502 |
| Pernod Ricard SA 2.95% 20174 | 12,000 | 12,034 |
| Pernod Ricard SA 4.45% 20224 | 13,975 | 15,334 |
| Philip Morris International Inc. 1.875% 2021 | 2,170 | 2,173 |
| Philip Morris International Inc. 3.60% 2023 | 4,545 | 4,899 |
| Philip Morris International Inc. 2.75% 2026 | 1,915 | 1,938 |
| Philip Morris International Inc. 3.875% 2042 | 4,500 | 4,461 |
| Philip Morris International Inc. 4.25% 2044 | 2,000 | 2,115 |
| Procter & Gamble Co. 1.70% 2021 | 10,200 | 10,179 |
| Procter & Gamble Co. 2.45% 2026 | 4,500 | 4,494 |
| Reynolds American Inc. 2.30% 2018 | 2,645 | 2,681 |
| Reynolds American Inc. 3.25% 2020 | 7,355 | 7,688 |
| Reynolds American Inc. 4.00% 2022 | 4,500 | 4,847 |
| Reynolds American Inc. 4.45% 2025 | 40,250 | 44,277 |
| Reynolds American Inc. 5.70% 2035 | 2,315 | 2,810 |
| Reynolds American Inc. 6.15% 2043 | 1,135 | 1,455 |
| Reynolds American Inc. 5.85% 2045 | 25,000 | 31,397 |
| SABMiller Holdings Inc. 2.45% 20174 | 14,815 | 14,858 |
| Unilever Capital Corp. 1.375% 2021 | 10,500 | 10,338 |
| Walgreens Boots Alliance, Inc. 2.60% 2021 | 6,695 | 6,785 |
| Walgreens Boots Alliance, Inc. 3.10% 2023 | 4,505 | 4,567 |
| Walgreens Boots Alliance, Inc. 3.45% 2026 | 4,975 | 5,083 |
| Walgreens Boots Alliance, Inc. 4.65% 2046 | 1,250 | 1,323 |
| WM. Wrigley Jr. Co 2.40% 20184 | 4,075 | 4,138 |
| WM. Wrigley Jr. Co 2.90% 20194 | 2,000 | 2,061 |
| WM. Wrigley Jr. Co 3.375% 20204 | 29,685 | 31,180 |
| | | 426,583 |
| Materials 0.35% | | |
| Air Liquide SA 1.75% 20214 | 3,515 | 3,479 |
| ArcelorMittal 10.85% 2019 | 10,750 | 12,927 |
| ArcelorMittal 7.25% 2022 | 20,500 | 23,370 |
Capital Income Builder — Page 20 of 32
Bonds, notes & other debt instruments
Corporate bonds & notes (continued)
Materials (continued) | Principal amount
(000) | Value
(000) |
| Ball Corp. 4.375% 2020 | $1,225 | $1,311 |
| BHP Billiton Finance (USA) Ltd. 2.05% 2018 | 13,220 | 13,381 |
| CEMEX Finance LLC 6.00% 2024 | 3,660 | 3,797 |
| CEMEX SAB de CV 5.70% 2025 | 4,190 | 4,274 |
| CEMEX SAB de CV 7.75% 2026 | 10,190 | 11,444 |
| Chemours Co. 6.625% 2023 | 2,400 | 2,340 |
| Chemours Co. 7.00% 2025 | 2,790 | 2,727 |
| E.I. du Pont de Nemours and Co. 5.25% 2016 | 826 | 830 |
| E.I. du Pont de Nemours and Co. 2.80% 2023 | 10,000 | 10,142 |
| Ecolab Inc. 3.00% 2016 | 8,725 | 8,743 |
| Ecolab Inc. 4.35% 2021 | 1,500 | 1,672 |
| First Quantum Minerals Ltd. 6.75% 20204 | 7,188 | 6,918 |
| First Quantum Minerals Ltd. 7.00% 20214 | 23,782 | 22,831 |
| First Quantum Minerals Ltd. 7.25% 20224 | 72,600 | 69,061 |
| FMG Resources 3.75% 20196,7,8 | 3,715 | 3,717 |
| FMG Resources 9.75% 20224 | 5,500 | 6,422 |
| Freeport-McMoRan Copper & Gold Inc. 3.55% 2022 | 5,000 | 4,600 |
| Freeport-McMoRan Inc. 6.875% 2023 | 15,000 | 15,638 |
| Georgia Gulf Corp. 4.875% 2023 | 2,500 | 2,588 |
| Glencore Funding LLC 4.00% 20254 | 9,500 | 9,374 |
| Monsanto Co. 2.75% 2021 | 515 | 525 |
| Monsanto Co. 4.40% 2044 | 300 | 299 |
| Mosaic Co. 4.25% 2023 | 1,700 | 1,747 |
| Novelis Corp. 6.25% 20244 | 900 | 938 |
| Novelis Corp. 5.875% 20264 | 1,100 | 1,117 |
| Owens-Illinois, Inc. 5.875% 20234 | 4,970 | 5,306 |
| Owens-Illinois, Inc. 6.375% 20254 | 4,130 | 4,540 |
| Platform Specialty Products Corp. 10.375% 20214 | 4,300 | 4,655 |
| Platform Specialty Products Corp. 6.50% 20224 | 200 | 195 |
| Potash Corp. of Saskatchewan Inc. 5.875% 2036 | 350 | 413 |
| Rayonier Advanced Materials Inc. 5.50% 20244 | 2,545 | 2,348 |
| Reynolds Group Inc. 9.875% 2019 | 203 | 208 |
| Reynolds Group Inc. 5.75% 2020 | 9,000 | 9,248 |
| Reynolds Group Inc. 6.875% 2021 | 3,000 | 3,105 |
| Ryerson Inc. 11.00% 20224 | 6,851 | 7,502 |
| Summit Materials, Inc. 6.125% 2023 | 700 | 721 |
| Teck Resources Ltd. 8.00% 20214 | 1,350 | 1,478 |
| Tembec Industries Inc. 9.00% 20194 | 1,055 | 844 |
| Vale Overseas Ltd. 5.875% 2021 | 5,250 | 5,611 |
| Vale Overseas Ltd. 6.875% 2036 | 8,150 | 8,260 |
| Vale Overseas Ltd. 6.875% 2039 | 40,280 | 40,006 |
| Vale SA 5.625% 2042 | 470 | 411 |
| Xstrata Canada Financial Corp. 4.95% 20214 | 3,250 | 3,465 |
| Yara International ASA 7.875% 20194 | 2,225 | 2,531 |
| Zekelman Industries Inc. 9.875% 20234 | 1,240 | 1,308 |
| Zekelman Industries Inc., Term Loan B, 6.00% 20216,7,8 | 998 | 1,009 |
| | | 349,376 |
| Industrials 0.33% | | |
| 3M Co. 1.625% 2021 | 3,300 | 3,300 |
| 3M Co. 2.25% 2026 | 7,250 | 7,102 |
| 3M Co. 3.125% 2046 | 2,200 | 2,069 |
| ADS Waste Escrow 8.25% 2020 | 1,275 | 1,334 |
| AerCap Holdings NV 2.75% 2017 | 3,250 | 3,258 |
Capital Income Builder — Page 21 of 32
Bonds, notes & other debt instruments
Corporate bonds & notes (continued)
Industrials (continued) | Principal amount
(000) | Value
(000) |
| European Aeronautic Defence and Space Company 2.70% 20234 | $5,335 | $5,465 |
| Allison Transmission Holdings, Inc. 5.00% 20244 | 800 | 818 |
| American Airlines, Inc., 5.50% 20194 | 3,500 | 3,631 |
| American Airlines, Inc., Series 2013-2, Class A, 4.95% 20247 | 400 | 435 |
| ARAMARK Corp. 5.125% 2024 | 11,000 | 11,550 |
| Ashtead Group PLC 5.625% 20244 | 5,000 | 5,287 |
| Associated Materials, LLC and AMH New Finance, Inc. 9.125% 2017 | 4,125 | 3,960 |
| BNSF Funding Trust I 6.613% 2055 | 6,700 | 7,730 |
| Builders Firstsource, Inc. 10.75% 20234 | 6,025 | 6,959 |
| Builders FirstSource, Inc. 5.625% 20244 | 1,075 | 1,083 |
| Canadian National Railway Co. 5.55% 2018 | 25,000 | 26,562 |
| Canadian National Railway Co. 3.20% 2046 | 2,960 | 2,793 |
| Caterpillar Inc. 1.70% 2021 | 4,500 | 4,425 |
| CEVA Group PLC 7.00% 20214 | 1,850 | 1,508 |
| CEVA Group PLC 9.00% 20214 | 775 | 507 |
| CEVA Group PLC, Apollo Global Securities LLC LOC, 5.969% 20216,7,8 | 515 | 412 |
| CEVA Logistics Canada, ULC, Term Loan, 6.50% 20216,7,8 | 91 | 73 |
| CEVA Logistics Holdings BV, Term Loan, 6.50% 20216,7,8 | 529 | 423 |
| CEVA Logistics U.S. Holdings Inc., Term Loan B, 6.50% 20216,7,8 | 730 | 584 |
| Continental Airlines, Inc., Series 1998-1, Class A, 6.648% 20197 | 1,089 | 1,110 |
| Continental Airlines, Inc., Series 1997-4, Class A, 6.90% 20197 | 797 | 808 |
| Continental Airlines, Inc., Series 2001-1, Class A1, 6.703% 20227 | 2,483 | 2,669 |
| Continental Airlines, Inc., Series 2000-2, Class A-1, 7.707% 20227 | 5,899 | 6,426 |
| Continental Airlines, Inc., Series 2000-1, Class A1, 8.048% 20227 | 5,952 | 6,648 |
| Corporate Risk Holdings LLC 9.50% 20194 | 6,538 | 6,750 |
| DAE Aviation Holdings, Inc. 10.00% 20234 | 4,575 | 4,872 |
| Deck Chassis Acquisition Inc. 10.00% 20234 | 5,500 | 5,734 |
| ERAC USA Finance Co. 2.60% 20214 | 5,250 | 5,317 |
| ERAC USA Finance Co. 2.70% 20234 | 3,250 | 3,227 |
| FBM Finance, Inc. 8.25% 20214 | 1,300 | 1,365 |
| Gardner Denver, Inc., Term Loan B, 4.25% 20206,7,8 | 3,568 | 3,472 |
| Gates Global LLC 6.00% 20224 | 8,950 | 8,502 |
| Gates Global LLC, Term Loan B, 4.25% 20216,7,8 | 9,924 | 9,788 |
| General Electric Capital Corp. 2.342% 2020 | 5,984 | 6,109 |
| General Electric Corp. 5.25% 2017 | 12,500 | 13,065 |
| HD Supply, Inc. 5.25% 20214 | 3,325 | 3,545 |
| HDTFS Inc. 6.75% 2019 | 4,846 | 4,947 |
| Honeywell International Inc. 1.85% 2021 | 19,020 | 18,981 |
| Honeywell International Inc. 2.50% 2026 | 4,500 | 4,435 |
| LMI Aerospace Inc. 7.375% 2019 | 2,550 | 2,577 |
| Lockheed Martin Corp. 1.85% 2018 | 3,370 | 3,404 |
| Lockheed Martin Corp. 2.50% 2020 | 8,340 | 8,565 |
| Lockheed Martin Corp. 3.10% 2023 | 2,370 | 2,481 |
| Lockheed Martin Corp. 3.55% 2026 | 7,820 | 8,298 |
| Lockheed Martin Corp. 4.50% 2036 | 2,320 | 2,609 |
| Lockheed Martin Corp. 4.70% 2046 | 8,085 | 9,225 |
| LSC Communications, Inc. 8.75% 20234 | 1,200 | 1,185 |
| Nielsen Finance LLC and Nielsen Finance Co. 5.50% 20214 | 750 | 783 |
| Nielsen Finance LLC and Nielsen Finance Co. 5.00% 20224 | 2,825 | 2,888 |
| PACCAR Inc. 1.65% 2021 | 4,250 | 4,241 |
| R.R. Donnelley & Sons Co. 7.875% 2021 | 3,475 | 3,753 |
| Republic Services, Inc. 3.80% 2018 | 2,500 | 2,590 |
| Siemens AG 1.30% 20194 | 10,500 | 10,425 |
| Silver II Borrower S.C.A./Silver II U.S. Holdings, LLC 7.75% 20204 | 4,225 | 3,359 |
Capital Income Builder — Page 22 of 32
Bonds, notes & other debt instruments
Corporate bonds & notes (continued)
Industrials (continued) | Principal amount
(000) | Value
(000) |
| TransDigm Inc. 5.50% 2020 | $17,400 | $17,944 |
| United Rentals, Inc. 5.875% 2026 | 1,675 | 1,715 |
| United Rentals, Inc. 5.50% 2027 | 8,750 | 8,761 |
| United Technologies Corp. 1.95% 2021 | 9,330 | 9,345 |
| United Technologies Corp. 2.65% 2026 | 6,950 | 6,959 |
| Watco Companies 6.375% 20234 | 1,735 | 1,770 |
| | | 331,915 |
| Real estate 0.30% | | |
| Alexandria Real Estate Equities, Inc. 3.90% 2023 | 4,800 | 5,021 |
| Alexandria Real Estate Equities, Inc. 4.30% 2026 | 2,800 | 3,008 |
| Alexandria Real Estate Equities, Inc. 4.50% 2029 | 1,205 | 1,275 |
| American Campus Communities, Inc. 3.35% 2020 | 7,200 | 7,474 |
| American Campus Communities, Inc. 3.75% 2023 | 10,190 | 10,588 |
| American Campus Communities, Inc. 4.125% 2024 | 12,080 | 12,816 |
| Boston Properties, Inc. 3.65% 2026 | 4,900 | 5,083 |
| Brandywine Operating Partnership, LP 5.70% 2017 | 41 | 42 |
| Brandywine Operating Partnership, LP 3.95% 2023 | 170 | 174 |
| Corporate Office Properties LP 3.60% 2023 | 515 | 511 |
| Corporate Office Properties LP 5.25% 2024 | 590 | 637 |
| Corporate Office Properties LP 5.00% 2025 | 4,335 | 4,599 |
| Crescent Resources 10.25% 20174 | 3,355 | 3,364 |
| Crown Castle International Corp. 2.25% 2021 | 7,750 | 7,695 |
| Crown Castle International Corp. 4.875% 2022 | 300 | 332 |
| DCT Industrial Trust Inc. 4.50% 2023 | 7,400 | 7,760 |
| DDR Corp. 4.25% 2026 | 415 | 434 |
| Developers Diversified Realty Corp. 7.50% 2017 | 27,306 | 27,976 |
| Developers Diversified Realty Corp. 7.875% 2020 | 9,000 | 10,738 |
| EPR Properties 4.50% 2025 | 7,265 | 7,387 |
| ERP Operating LP 2.85% 2026 | 3,250 | 3,218 |
| Essex Portfolio L.P. 3.25% 2023 | 7,845 | 8,021 |
| Essex Portfolio L.P. 3.875% 2024 | 9,035 | 9,532 |
| Essex Portfolio L.P. 3.375% 2026 | 2,010 | 2,037 |
| Gaming and Leisure Properties, Inc. 4.375% 2021 | 550 | 580 |
| Gaming and Leisure Properties, Inc. 5.375% 2026 | 3,780 | 4,016 |
| Hospitality Properties Trust 6.70% 2018 | 5,978 | 6,188 |
| Hospitality Properties Trust 5.00% 2022 | 5,250 | 5,686 |
| Hospitality Properties Trust 4.50% 2023 | 5,980 | 6,123 |
| Hospitality Properties Trust 4.50% 2025 | 3,925 | 3,979 |
| Host Hotels & Resorts LP 3.75% 2023 | 4,000 | 4,035 |
| Host Hotels & Resorts LP 4.50% 2026 | 2,650 | 2,779 |
| Iron Mountain Inc. 6.00% 20204 | 6,000 | 6,367 |
| iStar Financial Inc. 5.00% 2019 | 8,400 | 8,401 |
| Kimco Realty Corp. 4.30% 2018 | 10,000 | 10,272 |
| Kimco Realty Corp. 3.40% 2022 | 3,025 | 3,171 |
| Prologis, Inc. 3.35% 2021 | 3,950 | 4,155 |
| Prologis, Inc. 3.75% 2025 | 1,825 | 1,958 |
| Realogy Corp. 5.25% 20214 | 8,375 | 8,846 |
| Realogy Corp. 4.875% 20234 | 2,575 | 2,601 |
| Scentre Group 2.375% 20194 | 3,950 | 4,002 |
| Scentre Group 2.375% 20214 | 4,220 | 4,253 |
| Scentre Group 3.25% 20254 | 4,155 | 4,188 |
| Scentre Group 3.50% 20254 | 9,000 | 9,252 |
| Select Income REIT 4.15% 2022 | 3,055 | 3,094 |
Capital Income Builder — Page 23 of 32
Bonds, notes & other debt instruments
Corporate bonds & notes (continued)
Real estate (continued) | Principal amount
(000) | Value
(000) |
| Select Income REIT 4.50% 2025 | $1,645 | $1,658 |
| WEA Finance LLC 2.70% 20194 | 14,415 | 14,741 |
| WEA Finance LLC 3.25% 20204 | 22,015 | 22,805 |
| WEA Finance LLC 3.75% 20244 | 11,180 | 11,671 |
| | | 294,543 |
| Information technology 0.18% | | |
| Apple Inc. 1.55% 2021 | 12,130 | 12,010 |
| Apple Inc. 2.45% 2026 | 7,500 | 7,355 |
| Apple Inc. 3.85% 2046 | 4,500 | 4,402 |
| Blackboard Inc. 9.75% 20214 | 77 | 78 |
| Blackboard Inc., Term Loan B4, 6.00% 20216,7,8 | 599 | 594 |
| Camelot Finance SA 7.875% 20244 | 3,145 | 3,224 |
| Camelot Finance SA, Term Loan B, 4.75% 20236,7,8 | 2,000 | 2,005 |
| Cisco Systems, Inc. 1.85% 2021 | 8,460 | 8,452 |
| First Data Corp. 6.75% 20204 | 5,255 | 5,452 |
| First Data Corp. 7.00% 20234 | 5,150 | 5,427 |
| First Data Corp. 5.00% 20244 | 13,525 | 13,745 |
| First Data Corp. 5.75% 20244 | 775 | 791 |
| Harris Corp. 2.70% 2020 | 1,530 | 1,551 |
| Harris Corp. 3.832% 2025 | 815 | 854 |
| Harris Corp. 4.854% 2035 | 3,050 | 3,281 |
| Harris Corp. 5.054% 2045 | 3,360 | 3,714 |
| Infor Inc. 5.75% 20204 | 1,475 | 1,549 |
| International Business Machines Corp. 3.375% 2023 | 5,000 | 5,339 |
| JDA Software Group, Inc. 7.375% 20244 | 550 | 569 |
| JDA Software Group, Inc., Term Loan B, 4.50% 20236,7,8 | 2,850 | 2,857 |
| Kronos Inc., Term Loan B, 5.00% 20236,7,8 | 1,825 | 1,835 |
| Kronos Inc., Term Loan B, 9.25% 20246,7,8 | 2,800 | 2,893 |
| Microsoft Corp. 4.45% 2045 | 10,740 | 11,851 |
| Microsoft Corp. 3.70% 2046 | 11,250 | 11,047 |
| National Semiconductor Corp. 6.60% 2017 | 10,000 | 10,354 |
| NXP BV and NXP Funding LLC 4.125% 20204 | 4,000 | 4,230 |
| NXP BV and NXP Funding LLC 4.125% 20214 | 6,325 | 6,768 |
| Oracle Corp. 1.46% 20198 | 5,000 | 5,043 |
| Oracle Corp. 1.90% 2021 | 31,000 | 30,925 |
| Oracle Corp. 2.65% 2026 | 3,450 | 3,413 |
| Oracle Corp. 4.125% 2045 | 2,525 | 2,557 |
| Oracle Corp. 4.00% 2046 | 2,000 | 1,982 |
| Samsung Electronics America, Inc. 1.75% 20174 | 2,350 | 2,353 |
| Solera Holdings, Inc. 10.50% 20244 | 1,750 | 1,965 |
| Western Digital Corp. 7.375% 20234 | 1,325 | 1,454 |
| Western Digital Corp. 10.50% 20244 | 1,000 | 1,159 |
| Western Digital Corp., Term Loan B1, 4.50% 20236,7,8 | 1,596 | 1,616 |
| | | 184,694 |
| Total corporate bonds & notes | | 6,585,722 |
| Mortgage-backed obligations 2.88% | | |
| Banc of America Commercial Mortgage Inc., Series 2007-3, Class A4, 5.552% 20497,8 | 2,787 | 2,814 |
| Banc of America Mortgage Securities Inc., Series 2004-B, Class 1A1, 2.922% 20347,8 | 44 | 44 |
| Bear Stearns ARM Trust, Series 2003-8, Class III-A, 3.05% 20347,8 | 1,057 | 1,063 |
| Bear Stearns Commercial Mortgage Securities Trust, Series 2007-T28, Class A1A, 5.71% 20427,8 | 179 | 184 |
| Bear Stearns Commercial Mortgage Securities Trust, Series 2007-PW18, Class AM, 6.084% 20507,8 | 4,320 | 4,455 |
Capital Income Builder — Page 24 of 32
Bonds, notes & other debt instruments
Mortgage-backed obligations (continued) | Principal amount
(000) | Value
(000) |
| Citigroup Commercial Mortgage Trust, Series 2008-C7, Class AM, 6.129% 20497,8 | $5,000 | $5,157 |
| Commercial Mortgage Trust, Series 2005-LP5, Class E, 4.691% 20434,7,8 | 2,060 | 2,057 |
| CS First Boston Mortgage Securities Corp., Series 2002-30, Class IA1, 7.50% 20327 | 269 | 294 |
| CS First Boston Mortgage Securities Corp., Series 2002-34, Class IA1, 7.50% 20327 | 168 | 184 |
| CS First Boston Mortgage Securities Corp., Series 2003-21, Class VA1, 6.50% 20337 | 211 | 228 |
| CS First Boston Mortgage Securities Corp., Series 2007-C2, Class AM, 5.615% 20497,8 | 117 | 119 |
| DBUBS Mortgage Trust, Series 2011-LC2A, Class A1, 4.537% 20444,7 | 2,000 | 2,199 |
| DBUBS Mortgage Trust, Series 2011-LC1A, Class A1, 3.742% 20464,7 | 270 | 272 |
| Fannie Mae 4.50% 20207 | 446 | 461 |
| Fannie Mae 6.00% 20217 | 593 | 639 |
| Fannie Mae 5.00% 20237 | 1,332 | 1,438 |
| Fannie Mae 4.50% 20247 | 6,706 | 7,172 |
| Fannie Mae 4.50% 20247 | 1,645 | 1,774 |
| Fannie Mae 6.00% 20247 | 2,526 | 2,893 |
| Fannie Mae 6.00% 20247 | 19 | 21 |
| Fannie Mae 6.00% 20267 | 9,181 | 10,517 |
| Fannie Mae 6.00% 20277 | 13,249 | 15,177 |
| Fannie Mae 5.50% 20337 | 368 | 418 |
| Fannie Mae 3.50% 20357 | 42,535 | 45,056 |
| Fannie Mae 6.00% 20367 | 5,865 | 6,784 |
| Fannie Mae 6.00% 20367 | 4,611 | 5,333 |
| Fannie Mae 6.00% 20367 | 3,244 | 3,703 |
| Fannie Mae 6.00% 20367 | 2,615 | 3,024 |
| Fannie Mae 6.00% 20367 | 1,008 | 1,165 |
| Fannie Mae 5.50% 20377 | 407 | 464 |
| Fannie Mae 6.50% 20377 | 1,662 | 1,930 |
| Fannie Mae 6.50% 20377 | 316 | 338 |
| Fannie Mae 6.50% 20377 | 251 | 291 |
| Fannie Mae 6.50% 20377 | 169 | 181 |
| Fannie Mae 7.00% 20377 | 3,868 | 4,579 |
| Fannie Mae 7.00% 20377 | 361 | 419 |
| Fannie Mae 7.50% 20377 | 612 | 687 |
| Fannie Mae 7.50% 20377 | 280 | 315 |
| Fannie Mae 7.50% 20377 | 260 | 292 |
| Fannie Mae 7.50% 20377 | 120 | 128 |
| Fannie Mae 5.50% 20387 | 3,823 | 4,386 |
| Fannie Mae 5.50% 20387 | 2,886 | 3,312 |
| Fannie Mae 5.50% 20387 | 1,241 | 1,422 |
| Fannie Mae 5.50% 20387 | 714 | 819 |
| Fannie Mae 5.50% 20387 | 375 | 424 |
| Fannie Mae 5.60% 20387,8 | 139 | 148 |
| Fannie Mae 6.00% 20387 | 1,969 | 2,262 |
| Fannie Mae 7.00% 20387 | 88 | 103 |
| Fannie Mae 3.00% 20397,8 | 795 | 843 |
| Fannie Mae 3.07% 20397,8 | 875 | 930 |
| Fannie Mae 3.204% 20397,8 | 1,270 | 1,352 |
| Fannie Mae 5.50% 20397 | 280 | 317 |
| Fannie Mae 4.00% 20407 | 806 | 877 |
| Fannie Mae 6.00% 20407 | 14,047 | 16,129 |
| Fannie Mae 4.00% 20417 | 1,287 | 1,400 |
| Fannie Mae 4.00% 20417 | 778 | 846 |
| Fannie Mae 4.00% 20417 | 603 | 656 |
| Fannie Mae 4.00% 20417 | 395 | 433 |
| Fannie Mae 5.00% 20417 | 12,364 | 13,772 |
| Fannie Mae 6.00% 20417 | 9,939 | 11,505 |
Capital Income Builder — Page 25 of 32
Bonds, notes & other debt instruments
Mortgage-backed obligations (continued) | Principal amount
(000) | Value
(000) |
| Fannie Mae 4.00% 20427 | $30,163 | $32,761 |
| Fannie Mae 4.00% 20427 | 17,938 | 19,482 |
| Fannie Mae 4.00% 20427 | 6,181 | 6,722 |
| Fannie Mae 4.00% 20427 | 4,326 | 4,698 |
| Fannie Mae 4.00% 20427 | 2,481 | 2,682 |
| Fannie Mae 4.00% 20427 | 2,106 | 2,291 |
| Fannie Mae 4.00% 20437 | 20,661 | 22,471 |
| Fannie Mae 4.00% 20437 | 17,145 | 18,759 |
| Fannie Mae 4.50% 20437 | 6,287 | 6,867 |
| Fannie Mae 4.00% 20447 | 8,306 | 8,988 |
| Fannie Mae 4.00% 20447 | 7,993 | 8,646 |
| Fannie Mae 4.00% 20457 | 114,037 | 122,188 |
| Fannie Mae 4.00% 20457 | 100,217 | 107,390 |
| Fannie Mae 3.50% 20467 | 86,374 | 89,278 |
| Fannie Mae 3.50% 20467 | 43,261 | 44,716 |
| Fannie Mae 3.50% 20467 | 2,950 | 3,129 |
| Fannie Mae 4.00% 20467 | 123,734 | 132,627 |
| Fannie Mae 4.00% 20467,10 | 80,000 | 85,681 |
| Fannie Mae 4.00% 20467 | 57,622 | 62,470 |
| Fannie Mae 4.00% 20467 | 34,771 | 37,697 |
| Fannie Mae 4.00% 20467 | 26,495 | 28,626 |
| Fannie Mae 4.00% 20467 | 23,962 | 25,979 |
| Fannie Mae 4.00% 20467 | 21,025 | 22,716 |
| Fannie Mae 4.00% 20467,10 | 14,600 | 15,623 |
| Fannie Mae 4.00% 20467 | 8,078 | 8,757 |
| Fannie Mae 4.00% 20467 | 7,094 | 7,672 |
| Fannie Mae 4.00% 20467 | 6,900 | 7,268 |
| Fannie Mae 4.00% 20467 | 5,954 | 6,433 |
| Fannie Mae 4.00% 20467 | 5,665 | 6,140 |
| Fannie Mae 4.00% 20467 | 5,544 | 5,955 |
| Fannie Mae 4.50% 20467,10 | 7,300 | 7,972 |
| Fannie Mae 7.00% 20477 | 60 | 68 |
| Fannie Mae, Series 2002-15, Class PG, 6.00% 20177 | 7 | 8 |
| Fannie Mae, Series 2006-78, Class CG, 4.50% 20217 | 1,353 | 1,382 |
| Fannie Mae, Series 2001-25, Class ZA, 6.50% 20317 | 721 | 812 |
| Fannie Mae, Series 2006-32, Class OA, principal only, 0% 20367 | 2,112 | 1,907 |
| Fannie Mae, Series 2006-51, Class PO, principal only, 0% 20367 | 1,520 | 1,386 |
| Fannie Mae, Series 2006-96, Class OP, principal only, 0% 20367 | 447 | 409 |
| Fannie Mae, Series 2006-56, Class OG, principal only, 0% 20367 | 280 | 257 |
| Fannie Mae, Series 2006-65, Class PF, 0.814% 20367,8 | 2,013 | 2,007 |
| Fannie Mae, Series 2001-50, Class BA, 7.00% 20417 | 95 | 109 |
| Fannie Mae, Series 2002-W3, Class A5, 7.50% 20417 | 93 | 109 |
| Freddie Mac 5.50% 20237 | 1,202 | 1,297 |
| Freddie Mac 5.50% 20277 | 2,641 | 2,966 |
| Freddie Mac 3.50% 20347 | 1,448 | 1,532 |
| Freddie Mac 3.50% 20357 | 42,754 | 45,325 |
| Freddie Mac 3.50% 20357 | 40,887 | 43,340 |
| Freddie Mac 3.50% 20357 | 35,964 | 38,120 |
| Freddie Mac 3.50% 20357 | 17,998 | 19,091 |
| Freddie Mac 3.50% 20357 | 9,194 | 9,748 |
| Freddie Mac 3.50% 20357 | 7,641 | 8,105 |
| Freddie Mac 3.50% 20357 | 517 | 547 |
| Freddie Mac 3.50% 20367 | 28,878 | 30,634 |
| Freddie Mac 5.00% 20387 | 1,909 | 2,141 |
| Freddie Mac 5.50% 20387 | 3,802 | 4,320 |
Capital Income Builder — Page 26 of 32
Bonds, notes & other debt instruments
Mortgage-backed obligations (continued) | Principal amount
(000) | Value
(000) |
| Freddie Mac 5.00% 20397 | $14,121 | $15,616 |
| Freddie Mac 4.00% 20407 | 2,006 | 2,166 |
| Freddie Mac 6.00% 20407 | 142 | 163 |
| Freddie Mac 4.50% 20417 | 21,960 | 24,102 |
| Freddie Mac 4.50% 20417 | 959 | 1,053 |
| Freddie Mac 5.00% 20417 | 351 | 393 |
| Freddie Mac 5.50% 20417 | 6,751 | 7,652 |
| Freddie Mac 4.00% 20427 | 18,012 | 19,332 |
| Freddie Mac 4.50% 20437 | 2,142 | 2,340 |
| Freddie Mac 3.50% 20457 | 46,046 | 49,230 |
| Freddie Mac 3.50% 20467 | 72,129 | 75,811 |
| Freddie Mac 3.50% 20467 | 23,572 | 24,935 |
| Freddie Mac 3.50% 20467 | 9,716 | 10,288 |
| Freddie Mac 3.50% 20467 | 603 | 624 |
| Freddie Mac 4.00% 20467 | 58,373 | 62,521 |
| Freddie Mac 4.00% 20467 | 38,794 | 41,871 |
| Freddie Mac 4.00% 20467 | 21,193 | 22,874 |
| Freddie Mac 4.00% 20467 | 19,059 | 20,571 |
| Freddie Mac 4.00% 20467 | 5,013 | 5,375 |
| Freddie Mac 4.00% 20467 | 1,842 | 1,973 |
| Freddie Mac 6.50% 20477 | 416 | 471 |
| Freddie Mac, Series 2890, Class KT, 4.50% 20197 | 699 | 718 |
| Freddie Mac, Series K716, Class A2, multifamily 3.13% 20217 | 8,590 | 9,158 |
| Freddie Mac, Series K023, Class A2, multifamily 2.307% 20227 | 18,009 | 18,497 |
| Freddie Mac, Series K020, Class A2, multifamily 2.373% 20227 | 10,110 | 10,422 |
| Freddie Mac, Series K021, Class A2, multifamily 2.396% 20227 | 41,420 | 42,753 |
| Freddie Mac, Series K024, Class A2, multifamily 2.573% 20227 | 5,965 | 6,212 |
| Freddie Mac, Series K718, Class A2, multifamily 2.791% 20227 | 11,565 | 12,177 |
| Freddie Mac, Series K722, Class A2, multifamily 2.406% 20237 | 8,000 | 8,248 |
| Freddie Mac, Series KS01, Class A2, multifamily 2.522% 20237 | 3,717 | 3,832 |
| Freddie Mac, Series K030, Class A2, multifamily 3.25% 20237,8 | 9,380 | 10,112 |
| Freddie Mac, Series 2642, Class BL, 3.50% 20237 | 425 | 434 |
| Freddie Mac, Series 2626, Class NG, 3.50% 20237 | 63 | 64 |
| Freddie Mac, Series K036, Class A2, multifamily 3.527% 20237,8 | 10,000 | 10,961 |
| Freddie Mac, Series K043, Class A2, multifamily 3.062% 20247 | 53,910 | 57,514 |
| Freddie Mac, Series K044, Class A2, multifamily 2.811% 20257 | 71,090 | 74,591 |
| Freddie Mac, Series 3135, Class OP, principal only, 0% 20267 | 816 | 767 |
| Freddie Mac, Series K056, Class A2, multifamily 2.525% 20267 | 15,640 | 15,942 |
| Freddie Mac, Series K057, Class A2, multifamily 2.57% 20267 | 11,050 | 11,277 |
| Freddie Mac, Series K055, Class A2, multifamily 2.673% 20267 | 17,000 | 17,519 |
| Freddie Mac, Series K054, Class A2, multifamily 2.745% 20267 | 3,000 | 3,110 |
| Freddie Mac, Series 2122, Class QM, 6.25% 20297 | 1,963 | 2,206 |
| Freddie Mac, Series 3136, Class OP, principal only, 0% 20367 | 2,749 | 2,590 |
| Freddie Mac, Series 3155, Class FO, principal only, 0% 20367 | 1,707 | 1,557 |
| Freddie Mac, Series 3149, Class MO, principal only, 0% 20367 | 860 | 816 |
| Freddie Mac, Series 3147, Class OD, principal only, 0% 20367 | 900 | 813 |
| Freddie Mac, Series 3149, Class AO, principal only, 0% 20367 | 771 | 725 |
| Freddie Mac, Series 3117, Class OG, principal only, 0% 20367 | 479 | 450 |
| Government National Mortgage Assn. 4.50% 20377 | 2,515 | 2,770 |
| Government National Mortgage Assn. 6.00% 20397 | 3,828 | 4,424 |
| Government National Mortgage Assn. 6.50% 20397 | 545 | 623 |
| Government National Mortgage Assn. 3.50% 20407 | 341 | 363 |
| Government National Mortgage Assn. 5.00% 20407 | 3,413 | 3,704 |
| Government National Mortgage Assn. 5.50% 20407 | 4,843 | 5,490 |
| Government National Mortgage Assn. 4.50% 20417 | 3,708 | 4,017 |
Capital Income Builder — Page 27 of 32
Bonds, notes & other debt instruments
Mortgage-backed obligations (continued) | Principal amount
(000) | Value
(000) |
| Government National Mortgage Assn. 5.00% 20417 | $4,432 | $4,802 |
| Government National Mortgage Assn. 6.50% 20417 | 2,186 | 2,586 |
| Government National Mortgage Assn. 4.50% 20437 | 21,875 | 23,604 |
| Government National Mortgage Assn. 4.50% 20437 | 2,289 | 2,473 |
| Government National Mortgage Assn. 4.50% 20437 | 2,097 | 2,266 |
| Government National Mortgage Assn. 4.50% 20447 | 100 | 108 |
| Government National Mortgage Assn. 4.00% 20457 | 79,334 | 85,040 |
| Government National Mortgage Assn. 4.00% 20457 | 37,107 | 39,844 |
| Government National Mortgage Assn. 4.50% 20457 | 90,146 | 97,495 |
| Government National Mortgage Assn. 4.50% 20457 | 70,513 | 76,147 |
| Government National Mortgage Assn. 4.50% 20457 | 28,216 | 30,461 |
| Government National Mortgage Assn. 4.50% 20457 | 19,183 | 20,711 |
| Government National Mortgage Assn. 4.50% 20457 | 15,844 | 17,104 |
| Government National Mortgage Assn. 4.50% 20457 | 12,532 | 13,533 |
| Government National Mortgage Assn. 4.50% 20457 | 7,319 | 7,903 |
| Government National Mortgage Assn. 4.50% 20457 | 1,718 | 1,855 |
| Government National Mortgage Assn. 4.00% 20467 | 190,970 | 204,706 |
| Government National Mortgage Assn. 4.00% 20467,10 | 2,490 | 2,665 |
| Government National Mortgage Assn. 5.835% 20587 | 1,170 | 1,194 |
| Government National Mortgage Assn. 6.21% 20587 | 856 | 878 |
| Government National Mortgage Assn. 6.21% 20587 | 170 | 176 |
| Government National Mortgage Assn. 6.39% 20587 | 153 | 155 |
| Government National Mortgage Assn. 4.574% 20617 | 2,419 | 2,530 |
| Government National Mortgage Assn. 4.558% 20627 | 6,714 | 7,074 |
| Government National Mortgage Assn. 4.637% 20627 | 2,933 | 3,098 |
| Government National Mortgage Assn. 4.813% 20627 | 3,708 | 3,886 |
| Government National Mortgage Assn. 4.767% 20647 | 1,326 | 1,377 |
| Government National Mortgage Assn. 4.933% 20647 | 749 | 778 |
| Government National Mortgage Assn. 4.931% 20647 | 714 | 739 |
| Government National Mortgage Assn. 4.947% 20647 | 754 | 782 |
| Government National Mortgage Assn. 4.927% 20657 | 708 | 734 |
| Government National Mortgage Assn., Series 2005-7, Class AO, principal only, 0% 20357 | 2,188 | 1,986 |
| Government National Mortgage Assn., Series 2007-8, Class LO, principal only, 0% 20377 | 1,440 | 1,314 |
| Government National Mortgage Assn., Series 2003, 6.112% 20587 | 218 | 223 |
| Greenwich Capital Commercial Funding Corp., Series 2007-GG9, Class A4, 5.444% 20397 | 3,381 | 3,393 |
| GS Mortgage Securities Corp. II, Series 2010-C2, Class A2, 5.162% 20434,7,8 | 1,685 | 1,883 |
| Hilton USA Trust, Series 2013-HLF, Class AFX, 2.662% 20304,7 | 9,136 | 9,136 |
| Hilton USA Trust, Series 2013-HLF, Class BFX, 3.367% 20304,7 | 11,750 | 11,748 |
| Hilton USA Trust, Series 2013-HLF, Class CFX, 3.714% 20304,7 | 14,635 | 14,633 |
| Hilton USA Trust, Series 2013-HLF, Class DFX, 4.407% 20304,7 | 5,060 | 5,059 |
| J.P. Morgan Chase Commercial Mortgage Securities Trust, Series 2006-LDP9, Class AM, 5.372% 20477 | 100 | 100 |
| J.P. Morgan Chase Commercial Mortgage Securities Corp., Series 2007-CB18, Class A1A, 5.431% 20477,8 | 3,126 | 3,136 |
| J.P. Morgan Chase Commercial Mortgage Securities Corp., Series 2007-LDPX, Class A1A, 5.439% 20497 | 6,266 | 6,310 |
| J.P. Morgan Chase Commercial Mortgage Securities Corp., Series 2007-CB19, Class A4, 5.715% 20497,8 | 7,208 | 7,291 |
| J.P. Morgan Chase Commercial Mortgage Securities Corp., Series 2007-LD12, Class A1A, 5.85% 20517,8 | 4,498 | 4,597 |
| LB-UBS Commercial Mortgage Trust, Series 2007-C7, Class AM, 6.159% 20457,8 | 5,335 | 5,548 |
| Morgan Stanley Capital I Trust, Series 2011-C2, Class A4, 4.661% 20444,7 | 1,677 | 1,855 |
| Morgan Stanley Capital I Trust, Series 2011-C1, Class A4, 5.033% 20474,7,8 | 100 | 111 |
| Nationstar HECM Loan Trust, Series 2016-3A, Class A, 2.013% 20264,7 | 2,019 | 2,011 |
| Nationstar HECM Loan Trust, Series 2016-2A, Class A, 2.239% 20263,4,7 | 1,461 | 1,467 |
| Towd Point Mortgage Trust, Series 2016-4, Class A1, 2.25% 20564,7,8 | 4,388 | 4,404 |
| Wachovia Bank Commercial Mortgage Trust, Series 2007-C31, Class AM, 5.591% 20477,8 | 8,000 | 8,089 |
| | | 2,859,724 |
Capital Income Builder — Page 28 of 32
Bonds, notes & other debt instruments
Asset-backed obligations 0.57% | Principal amount
(000) | Value
(000) |
| Aesop Funding LLC, Series 2012-3A, Class A, 2.10% 20194,7 | $500 | $502 |
| Aesop Funding LLC, Series 2013-2A, Class A, 2.97% 20204,7 | 12,345 | 12,573 |
| Aesop Funding LLC, Series 2014-2A, Class A, 2.50% 20214,7 | 12,500 | 12,619 |
| Aesop Funding LLC, Series 2016-1A, Class A, 2.99% 20224,7 | 4,010 | 4,092 |
| American Express Credit Account Master Trust, Series 2014-4, Class A, 1.43% 20207 | 19,870 | 19,940 |
| AmeriCredit Automobile Receivables Trust, Series 2014-4, Class A3, 1.27% 20197 | 4,972 | 4,975 |
| AmeriCredit Automobile Receivables Trust, Series 2013-2, Class C, 1.79% 20197 | 1,870 | 1,873 |
| AmeriCredit Automobile Receivables Trust, Series 2016-1, Class C, 2.89% 20227 | 1,280 | 1,311 |
| Avant Loans Funding Trust, Series 2016-C, Class A, 2.96% 20194,7 | 4,746 | 4,745 |
| Avant Loans Funding Trust, Series 2016-B, Class A, 3.92% 20194,7 | 5,259 | 5,284 |
| Avant Loans Funding Trust, Series 2016-A, Class A, 4.11% 20194,7 | 1,031 | 1,035 |
| Avant Loans Funding Trust, Series 2016-C, Class B, 4.92% 20204,7 | 5,090 | 5,101 |
| Avant Loans Funding Trust, Series 2015-A, Class A, 4.00% 20214,7 | 1,121 | 1,128 |
| Bank of the West Auto Trust, Series 2014-1, Class A3, 1.09% 20194,7 | 5,516 | 5,518 |
| Carlyle Global Market Strategies Commodities Fund, Series 2015-1A, Class A, 2.131% 20203,4,7,8 | 34,007 | 31,785 |
| Carlyle Global Market Strategies Commodities Fund, Series 2014-1A, Class A, 2.717% 20213,4,7,8 | 8,924 | 8,107 |
| CarMaxAuto Owner Trust, Series 2014-4, Class A3, 1.25% 20197 | 18,487 | 18,505 |
| CenterPoint Energy Transition Bond Co. III, LLC, Series 2008, Class A1, 4.192% 20207 | 13 | 13 |
| Citi Held For Issuance, Series 2015-PM2, Class A, 2.35% 20224,7 | 5,726 | 5,722 |
| Citi Held For Issuance, Series 2015-PM3, Class A, 2.56% 20224,7 | 8,111 | 8,104 |
| Citi Held For Issuance, Series 2016-PM-1, Class A, 4.65% 20254,7 | 4,743 | 4,820 |
| Conseco Finance Securitizations Corp., Series 2002-2, Class A2, 6.03% 20337 | 44 | 44 |
| Consumer Credit Origination Loan Trust, Series 2015-1, Class A, 2.82% 20214,7 | 433 | 435 |
| CPS Auto Receivables Trust, Series 2016-B, Class A, 2.07% 20194,7 | 1,707 | 1,707 |
| CPS Auto Receivables Trust, Series 2016-A, Class B, 3.34% 20204,7 | 7,100 | 7,250 |
| CPS Auto Receivables Trust, Series 2015-A, Class B, 2.79% 20214,7 | 3,125 | 3,132 |
| CPS Auto Receivables Trust, Series 2016-A, Class C, 3.80% 20214,7 | 1,500 | 1,528 |
| CPS Auto Receivables Trust, Series 2015-A, Class C, 4.00% 20214,7 | 2,395 | 2,424 |
| CWABS, Inc., Series 2004-15, Class AF6, 4.613% 20357 | 676 | 689 |
| CWHEQ Revolving Home Equity Loan Trust, Series 2005-D, Class 2A, FSA insured, 0.725% 20357,8 | 141 | 127 |
| CWHEQ Revolving Home Equity Loan Trust, Series 2006-F, Class 2A1A, FSA insured, 0.675% 20367,8 | 6,421 | 5,781 |
| CWHEQ Revolving Home Equity Loan Trust, Series 2006-I, Class 2A, FSA insured, 0.675% 20377,8 | 8,592 | 7,741 |
| CWHEQ Revolving Home Equity Loan Trust, Series 2007-B, Class A, FSA insured, 0.685% 20377,8 | 18,274 | 16,980 |
| Discover Card Execution Note Trust, Series 2014-A5, Class A, 1.39% 20207 | 50,000 | 50,148 |
| Discover Card Execution Note Trust, Series 2014-A4, Class A4, 2.12% 20217 | 33,755 | 34,438 |
| DRB Prime Student Loan Trust, Series 2015-D, Class A3, 2.50% 20364,7 | 1,569 | 1,570 |
| Drive Auto Receivables Trust, Series 2015-BA, Class C, 2.76% 20214,7 | 7,270 | 7,318 |
| Drive Auto Receivables Trust, Series 2015-CA, Class C, 3.01% 20214,7 | 7,300 | 7,370 |
| Drive Auto Receivables Trust, Series 2015-DA, Class C, 3.38% 20214,7 | 5,670 | 5,787 |
| Drive Auto Receivables Trust, Series 2016-AA, Class C, 3.91% 20214,7 | 12,000 | 12,273 |
| Drive Auto Receivables Trust, Series 2016-BA, Class C, 3.19% 20224,7 | 2,890 | 2,937 |
| Drivetime Auto Owner Trust, Series 2016-1A, Class C, 3.54% 20214,7 | 1,365 | 1,379 |
| Drivetime Auto Owner Trust, Series 2016-3A, Class C, 3.15% 20224,7 | 1,510 | 1,507 |
| Drivetime Auto Owner Trust, Series 2016-2A, Class C, 3.67% 20224,7 | 1,425 | 1,454 |
| Fifth Third Auto Trust, Series 2014-3, Class A3, 0.96% 20197 | 10,767 | 10,765 |
| Ford Credit Auto Lease Trust, Series 2014-B, Class A4, 1.10% 20177 | 1,451 | 1,451 |
| Ford Credit Auto Owner Trust, Series 2015-1, Class A, 2.12% 20264,7 | 15,600 | 15,829 |
| Ford Credit Auto Owner Trust, Series 2016-2, Class A, 2.03% 20274,7 | 5,000 | 5,029 |
| Ford Credit Auto Owner Trust, Series 2016-1, Class A, 2.31% 20274,7 | 5,000 | 5,098 |
| Hertz Vehicle Financing LLC, Rental Car Asset-backed Notes, Series 2011-1A, Class A2, 3.29% 20184,7 | 690 | 693 |
| Hertz Vehicle Financing LLC, Rental Car Asset-backed Notes, Series 2013-1A, Class A2, 1.83% 20194,7 | 4,000 | 3,985 |
| Hertz Vehicle Financing LLC, Rental Car Asset-backed Notes, Series 2015-3A, Class A, 2.67% 20214,7 | 1,885 | 1,897 |
| Hertz Vehicle Financing LLC, Rental Car Asset-backed Notes, Series 2015-1, Class A, 2.73% 20214,7 | 29,415 | 29,838 |
| Hertz Vehicle Financing LLC, Rental Car Asset-backed Notes, Series 2015-1, Class A, 3.52% 20214,7 | 1,938 | 1,956 |
Capital Income Builder — Page 29 of 32
Bonds, notes & other debt instruments
Asset-backed obligations (continued) | Principal amount
(000) | Value
(000) |
IndyMac Home Equity Mortgage Loan Asset-backed Trust, Series 2007-H1, Class A1,
FSA insured, 0.694% 20377,8 | $13,122 | $11,694 |
| MarketPlace Loan Trust, Series 2015-AV-1, Class A, 4.00% 20214,7 | 557 | 559 |
| Octagon Investment Partners XV Ltd., Series 2013-1A, Class A, CLO, 2.168% 20254,7,8 | 21,600 | 21,534 |
| Option One Mortgage Loan Trust, Series 2007-FXD2, Class II-A6, 5.68% 20377,8 | 3,054 | 2,843 |
| Prestige Auto Receivables Trust, Series 2015-1, Class C, 2.40% 20214,7 | 5,000 | 5,011 |
| Prestige Auto Receivables Trust, Series 2015-1, Class D, 3.05% 20214,7 | 5,000 | 4,962 |
| RAMP Trust, Series 2004-RS12, Class A-I-6, 4.547% 20347 | 87 | 89 |
| Santander Drive Auto Receivables Trust, Series 2014-1, Class B, 1.59% 20187 | 80 | 80 |
| Santander Drive Auto Receivables Trust, Series 2014-5, Class A3, 1.15% 20197 | 590 | 590 |
| Santander Drive Auto Receivables Trust, Series 2014-1, Class C, 2.36% 20207 | 3,965 | 3,987 |
| Santander Drive Auto Receivables Trust, Series 2014-4, Class C, 2.60% 20207 | 6,790 | 6,862 |
| Santander Drive Auto Receivables Trust, Series 2015-2, Class C, 2.44% 20217 | 12,415 | 12,558 |
| Santander Drive Auto Receivables Trust, Series 2016-2, Class C, 2.66% 20217 | 1,855 | 1,882 |
| Santander Drive Auto Receivables Trust, Series 2015-3, Class C, 2.74% 20217 | 7,665 | 7,790 |
| Santander Drive Auto Receivables Trust, Series 2015-4, Class C, 2.97% 20217 | 2,700 | 2,746 |
| Santander Drive Auto Receivables Trust, Series 2016-1, Class C, 3.09% 20227 | 7,550 | 7,736 |
| Verizon Owner Trust, Series 2016-1A, Class A, 1.42% 20214,7 | 2,115 | 2,120 |
| Volkswagen Auto Loan Enhanced Trust, Series 2014-2, Class A3 0.95% 20197 | 40,954 | 40,891 |
| Westlake Automobile Receivables Trust, Series 2015-1-A, Class C, 2.29% 20204,7 | 2,250 | 2,255 |
| Westlake Automobile Receivables Trust, Series 2016-1A, Class C, 3.29% 20214,7 | 2,250 | 2,286 |
| Westlake Automobile Receivables Trust, Series 2015-1-A, Class D, 2.96% 20224,7 | 2,625 | 2,625 |
| World Omni Auto Receivables Trust, Series 2014-B, Class A3, 1.14% 20207 | 18,490 | 18,496 |
| | | 567,908 |
| Bonds & notes of governments & government agencies outside the U.S. 0.17% | | |
| Manitoba (Province of) 3.05% 2024 | 6,850 | 7,277 |
| Ontario (Province of) 3.20% 2024 | 10,000 | 10,698 |
| Saudi Arabia (Kingdom of) 3.25% 20264 | 37,250 | 36,767 |
| Saudi Arabia (Kingdom of) 4.50% 20464 | 27,600 | 27,176 |
| United Mexican States 4.35% 2047 | 6,875 | 6,521 |
| United Mexican States, Series M, 6.50% 2021 | MXN1,520,500 | 82,300 |
| | | 170,739 |
| Federal agency bonds & notes 0.16% | | |
| CoBank, ACB 1.45% 20224,8 | $3,190 | 3,039 |
| Fannie Mae 2.125% 2026 | 37,230 | 37,309 |
| Freddie Mac 1.00% 2017 | 14,400 | 14,437 |
| Freddie Mac 5.50% 2017 | 50,000 | 51,920 |
| Freddie Mac 1.25% 2019 | 50,000 | 50,258 |
| | | 156,963 |
| Municipals 0.06% | | |
| State of Florida, Hurricane Catastrophe Fund Fin. Corp., Rev. Bonds, Series 2013-A, 2.107% 2018 | 15,500 | 15,708 |
State of New Jersey, Transportation Trust Fund Auth., Transportation System Rev. Ref. Bonds,
Series 2013-B, 1.758% 2018 | 15,000 | 14,749 |
| State of Washington, Energy Northwest, Columbia Generating Station Electric Rev. Bonds, Series 2015-B, 2.814% 2024 | 25,000 | 26,131 |
| | | 56,588 |
| Total bonds, notes & other debt instruments (cost: $16,778,513,000) | | 17,163,639 |
Capital Income Builder — Page 30 of 32
| Short-term securities 2.63% | Principal amount
(000) | Value
(000) |
| Apple Inc. 0.52%–0.53% due 12/12/2016–1/9/20174 | $110,000 | $109,915 |
| Army and Air Force Exchange Service 0.47% due 12/2/20164 | 33,000 | 32,986 |
| Caterpillar Financial Services Corp. 0.55% due 12/7/2016 | 75,000 | 74,966 |
| Chevron Corp. 0.47%–0.58% due 12/1/2016–1/6/20174 | 127,400 | 127,302 |
| Ciesco LLC 0.55%–0.81% due 11/4/2016–11/14/20164 | 152,400 | 152,377 |
| Coca-Cola Co. 0.52% due 12/16/20164 | 75,000 | 74,959 |
| Emerson Electric Co. 0.44% due 11/21/20164 | 50,000 | 49,988 |
| Estée Lauder Companies Inc. 0.65% due 1/17/20174 | 20,000 | 19,972 |
| ExxonMobil Corp. 0.41%–0.54% due 11/2/2016–12/19/2016 | 100,000 | 99,968 |
| Fannie Mae 0.60% due 1/3/2017 | 100,000 | 99,950 |
| Federal Farm Credit Banks 0.65% due 12/12/2016 | 35,000 | 34,989 |
| Federal Home Loan Bank 0.26%–0.44% due 11/18/2016–3/1/2017 | 725,000 | 724,571 |
| Freddie Mac 0.45%–0.50% due 2/17/2017–5/15/2017 | 150,000 | 149,748 |
| General Electric Co. 0.35% due 11/1/2016 | 44,950 | 44,950 |
| Hershey Co. 0.43% due 11/14/20164 | 25,000 | 24,996 |
| IBM Corp. 0.42%–0.63% due 11/7/2016–12/27/20164 | 180,650 | 180,556 |
| John Deere Financial Inc. 0.47% due 11/16/20164 | 60,000 | 59,989 |
| Microsoft Corp. 0.60%–0.62% due 1/4/2017–1/17/20174 | 185,000 | 184,787 |
| Paccar Financial Corp. 0.44% due 11/4/2016 | 40,000 | 39,998 |
| Pfizer Inc. 0.52% due 12/12/20164 | 50,000 | 49,975 |
| Qualcomm Inc. 0.48% due 12/1/20164 | 15,900 | 15,894 |
| U.S. Treasury Bills 0.33% due 1/19/2017 | 100,000 | 99,936 |
| Wal-Mart Stores, Inc. 0.47% due 11/21/20164 | 80,000 | 79,982 |
| Wells Fargo Bank, N.A. 0.92%–1.07% due 12/1/2016–4/19/2017 | 80,800 | 80,832 |
| Total short-term securities (cost: $2,613,327,000) | | 2,613,586 |
| Total investment securities 99.61% (cost: $91,568,124,000) | | 99,003,531 |
| Other assets less liabilities 0.39% | | 388,933 |
| Net assets 100.00% | | $99,392,464 |
As permitted by U.S. Securities and Exchange Commission regulations, “Miscellaneous” securities include holdings in their first year of acquisition that have not previously been publicly disclosed.
Capital Income Builder — Page 31 of 32
Forward currency contracts
The fund has entered into forward currency contracts as shown in the following table. The average month-end notional amount of open forward currency contracts while held was $569,809,000.
| | Settlement
date | Counterparty | Contract amount | Unrealized
appreciation
(depreciation)
at 10/31/2016
(000) |
Receive
(000) | Deliver
(000) |
| Sales: | | | | | |
| British pounds | 12/7/2016 | JPMorgan Chase | $130,907 | £102,582 | $5,244 |
| British pounds | 12/7/2016 | Citibank | $195,573 | £160,000 | (427) |
| Euros | 11/16/2016 | Citibank | $318,764 | €282,500 | 8,453 |
| South African rand | 1/6/2017 | Barclays Bank PLC | $8,505 | ZAR118,700 | (177) |
| South African rand | 1/6/2017 | Barclays Bank PLC | $8,481 | ZAR118,700 | (200) |
| South African rand | 1/6/2017 | Barclays Bank PLC | $9,675 | ZAR136,275 | (292) |
| | | | | | $12,601 |
The following footnotes apply to either the individual securities noted or one or more of the securities aggregated and listed as a single line item.
| 1 | Represents an affiliated company as defined under the Investment Company Act of 1940. |
| 2 | Security did not produce income during the last 12 months. |
| 3 | Valued under fair value procedures adopted by authority of the board of trustees. The total value of all such securities was $43,421,000, which represented .04% of the net assets of the fund. |
| 4 | Acquired in a transaction exempt from registration under Rule 144A or Section 4(2) of the Securities Act of 1933. May be resold in the U.S. in transactions exempt from registration, normally to qualified institutional buyers. The total value of all such securities was $2,930,562,000, which represented 2.95% of the net assets of the fund. |
| 5 | Index-linked bond whose principal amount moves with a government price index. |
| 6 | Loan participations and assignments; may be subject to legal or contractual restrictions on resale. The total value of all such loans was $74,986,000, which represented .08% of the net assets of the fund. |
| 7 | Principal payments may be made periodically. Therefore, the effective maturity date may be earlier than the stated maturity date. |
| 8 | Coupon rate may change periodically. |
| 9 | Payment in kind; the issuer has the option of paying additional securities in lieu of cash. |
| 10 | Purchased on a TBA basis. |
| Key to abbreviations and symbols | | |
| ADR = American Depositary Receipts | FDR = Fiduciary Depositary Receipts | MXN = Mexican pesos |
| Auth. = Authority | Fin. = Finance | Ref. = Refunding |
| CAD = Canadian dollars | GBP/£ = British pounds | Rev. = Revenue |
| CLO = Collateralized Loan Obligations | HKD = Hong Kong dollars | TBA = To-be-announced |
| € = Euros | LOC = Letter of Credit | ZAR = South African rand |
Investments are not FDIC-insured, nor are they deposits of or guaranteed by a bank or any other entity, so they may lose value.
Investors should carefully consider investment objectives, risks, charges and expenses. This and other important information is contained in the fund prospectus and summary prospectus, which can be obtained from your financial professional and should be read carefully before investing. You may also call American Funds Service Company (AFS) at (800) 421-4225 or visit the American Funds website at americanfunds.com.
| MFGEFPX-012-1216O-S54110 | Capital Income Builder — Page 32 of 32 |
Report of Independent Registered Public Accounting Firm
To the Board of Trustees and Shareholders of Capital Income Builder
In our opinion, the accompanying statement of assets and liabilities, including the summary investment portfolio, and the related statements of operations and of changes in net assets and the financial highlights (included in Item 1 of this Form N-CSR) and the investment portfolio (included in Item 6 of this Form N-CSR) present fairly, in all material respects, the financial position of Capital Income Builder (the “Fund”) as of October 31, 2016, the results of its operations for the year then ended, the changes in its net assets for each of the two years in the period then ended and the financial highlights for each of the periods presented, in conformity with accounting principles generally accepted in the United States of America. These financial statements, financial highlights, and investment portfolio (hereafter referred to as "financial statements") are the responsibility of the Fund’s management. Our responsibility is to express an opinion on these financial statements based on our audits. We conducted our audits of these financial statements in accordance with the standards of the Public Company Accounting Oversight Board (United States). Those standards require that we plan and perform the audit to obtain reasonable assurance about whether the financial statements are free of material misstatement. An audit includes examining, on a test basis, evidence supporting the amounts and disclosures in the financial statements, assessing the accounting principles used and significant estimates made by management, and evaluating the overall financial statement presentation. We believe that our audits, which included confirmation of securities as of October 31, 2016 by correspondence with the custodian and brokers, provide a reasonable basis for our opinion.
PricewaterhouseCoopers LLP
Los Angeles, California
December 8, 2016
ITEM 7 – Disclosure of Proxy Voting Policies and Procedures for Closed-End Management Investment Companies
Not applicable to this Registrant, insofar as the Registrant is not a closed-end management investment company.
ITEM 8 – Portfolio Managers of Closed-End Management Investment Companies
Not applicable to this Registrant, insofar as the Registrant is not a closed-end management investment company.
ITEM 9 – Purchases of Equity Securities by Closed-End Management Investment Company and Affiliated Purchasers
Not applicable to this Registrant, insofar as the Registrant is not a closed-end management investment company.
ITEM 10 – Submission of Matters to a Vote of Security Holders
There have been no material changes to the procedures by which shareholders may recommend nominees to the Registrant’s board of trustees since the Registrant last submitted a proxy statement to its shareholders. The procedures are as follows. The Registrant has a nominating and governance committee comprised solely of persons who are not considered ‘‘interested persons’’ of the Registrant within the meaning of the Investment Company Act of 1940, as amended. The committee periodically reviews such issues as the board’s composition, responsibilities, committees, compensation and other relevant issues, and recommends any appropriate changes to the full board of trustees. While the committee normally is able to identify from its own resources an ample number of qualified candidates, it will consider shareholder suggestions of persons to be considered as nominees to fill future vacancies on the board. Such suggestions must be sent in writing to the nominating and governance committee of the Registrant, c/o the Registrant’s Secretary, and must be accompanied by complete biographical and occupational data on the prospective nominee, along with a written consent of the prospective nominee for consideration of his or her name by the nominating and governance committee.
ITEM 11 – Controls and Procedures
| (a) | The Registrant’s Principal Executive Officer and Principal Financial Officer have concluded, based on their evaluation of the Registrant’s disclosure controls and procedures (as such term is defined in Rule 30a-3 under the Investment Company Act of 1940), that such controls and procedures are adequate and reasonably designed to achieve the purposes described in paragraph (c) of such rule. |
| | |
| (b) | There were no changes in the Registrant’s internal controls over financial reporting (as defined in Rule 30a-3(d) under the Investment Company Act of 1940) that occurred during the Registrant’s second fiscal quarter of the period covered by this report that has materially affected, or is reasonably likely to materially affect, the Registrant’s internal control over financial reporting. |
ITEM 12 – Exhibits
| (a)(1) | The Code of Ethics that is the subject of the disclosure required by Item 2 is attached as an exhibit hereto. |
| | |
| (a)(2) | The certifications required by Rule 30a-2 of the Investment Company Act of 1940 and Sections 302 and 906 of the Sarbanes-Oxley Act of 2002 are attached as exhibits hereto. |
SIGNATURES
Pursuant to the requirements of the Securities Exchange Act of 1934 and the Investment Company Act of 1940, the Registrant has duly caused this report to be signed on its behalf by the undersigned, thereunto duly authorized.
| | CAPITAL INCOME BUILDER |
| | |
| | By ___/s/ Donald H. Rolfe_____________________ |
| | Donald H. Rolfe, Executive Vice President and Principal Executive Officer |
| | |
| | Date: December 27, 2016 |
Pursuant to the requirements of the Securities Exchange Act of 1934 and the Investment Company Act of 1940, this report has been signed below by the following persons on behalf of the Registrant and in the capacities and on the dates indicated.
| By ___/s/ Donald H. Rolfe_____________________ |
Donald H. Rolfe, Executive Vice President and Principal Executive Officer |
| |
| Date: December 27, 2016 |
| By ___/s/ Gregory F. Niland_____________________ |
Gregory F. Niland, Treasurer and Principal Financial Officer |
| |
| Date: December 27, 2016 |
