UNITED STATES
SECURITIES AND EXCHANGE COMMISSION
Washington, D.C. 20549
FORM N-CSR
Certified Shareholder Report of
Registered Management Investment Companies
Investment Company Act File Number: 811-05085
Capital Income Builder
(Exact Name of Registrant as Specified in Charter)
333 South Hope Street, 55th Floor
Los Angeles, California 90071
(Address of Principal Executive Offices)
Registrant's telephone number, including area code: (949) 975-5000
Date of fiscal year end: October 31
Date of reporting period: October 31, 2022
Gregory F. Niland
Capital Income Builder
5300 Robin Hood Road
Norfolk, Virginia 23513
(Name and Address of Agent for Service)
ITEM 1 – Reports to Stockholders
Capital Income Builder® Annual report
for the year ended
October 31, 2022 |  |
| | |

Seeking
income growth
opportunities from
around the world
Capital Income Builder seeks to provide you with a level of current income that exceeds the average yield on U.S. stocks generally and to provide you with a growing stream of income over the years. The fund’s secondary objective is to provide you with growth of capital.
This fund is one of more than 40 offered by Capital Group, home of American Funds, one of the nation’s largest mutual fund families. For over 90 years, Capital Group has invested with a long-term focus based on thorough research and attention to risk.
Fund results shown in this report, unless otherwise indicated, are for Class F-2 and Class A shares at net asset value. If a sales charge (maximum 5.75% for Class A shares) had been deducted, the results would have been lower. Results are for past periods and are not predictive of results for future periods. Current and future results may be lower or higher than those shown. Prices and returns will vary, so investors may lose money. Investing for short periods makes losses more likely. For current information and month-end results, visit capitalgroup.com.
Here are the average annual total returns on a $1,000 investment for periods ended September 30, 2022 (the most recent calendar quarter-end):
| | | 1 year | | 5 years | | 10 years |
| | | | | | | |
| Class F-2 shares | | | –10.85 | % | | | 2.28 | % | | | 4.96 | % |
| Class A shares (reflecting 5.75% maximum sales charge) | | | –16.15 | | | | 0.86 | | | | 4.13 | |
For other share class results, visit capitalgroup.com and americanfundsretirement.com.
The total annual fund operating expense ratios are 0.36% for Class F-2 shares and 0.59% for Class A shares as of the prospectus dated January 1, 2023 (unaudited). The expense ratios are restated to reflect current fees.
Investment results assume all distributions are reinvested and reflect applicable fees and expenses. When applicable, results reflect fee waivers and/or expense reimbursements, without which they would have been lower. Visit capitalgroup.com for more information.
The fund’s 30-day yield as of October 31, 2022, was 2.63% for Class F-2 shares and 2.29% for Class A shares, calculated in accordance with the U.S. Securities and Exchange Commission (SEC) formula. The fund’s 12-month distribution rate as of that date was 3.99% for Class F-2 shares and 3.53% for Class A shares. The Class A share results reflect the 5.75% maximum sales charge. The SEC yield reflects the rate at which the fund is earning income on its current portfolio of securities, while the distribution rate reflects the fund’s past dividends paid to shareholders. Accordingly, the fund’s SEC yield and distribution rate may differ.
The return of principal for bond funds and for funds with significant underlying bond holdings is not guaranteed. Fund shares are subject to the same interest rate, inflation and credit risks associated with the underlying bond holdings. Investing outside the United States may be subject to additional risks, such as currency fluctuations, periods of illiquidity and price volatility. These risks may be heightened in connection with investments in developing countries. Refer to the fund prospectus and the Risk Factors section of this report for more information on these and other risks associated with investing in the fund.
Investments are not FDIC-insured, nor are they deposits of or guaranteed by a bank or any other entity, so they may lose value.
Contents
| 1 | | Letter to investors |
| | | |
| 4 | | The value of a long-term perspective |
| | | |
| 6 | | Investment portfolio |
| | | |
| 35 | | Financial statements |
| | | |
| 67 | | Board of trustees and other officers |
| | | |
Fellow investors:
Global markets retreated from last year’s strong gains amid heightened geopolitical risk, persistent inflationary pressures and aggressive monetary tightening. For the 12 months ended October 31, 2022, Capital Income Builder fell 9.21%, with all dividends reinvested, faring better than the 18.50% loss of the 70%/30% MSCI All Country World Index (ACWI)/Bloomberg U.S. Aggregate Index. The blended index, which measures returns for global stock markets and U.S. fixed income, is the fund’s primary benchmark as of January 1, 2021.
Dividend income
Capital Income Builder’s primary objective is to provide shareholders a level of current income that exceeds the average yield on U.S. stocks in general as well as a growing stream of income over the years. The secondary goal is to grow capital. In pursuit of its income objective, the fund recorded a 12-month yield of 3.99% for its F-2 share class, greater than the corresponding yield for the MSCI ACWI (2.33%). The 12-month yield for the Bloomberg U.S. Aggregate Index was 5.01% as of October 31, 2022, versus 1.66% in October 2021.
The fund’s F-2 shares paid dividends of approximately $1.04 a share, including a special dividend of about 61 cents per share, in December 2021. The fund also went on to pay regular dividends of approximately 46 cents a share in March and June 2022 and about 45 cents in September. The fund strives to grow its quarterly distribution rate over time.
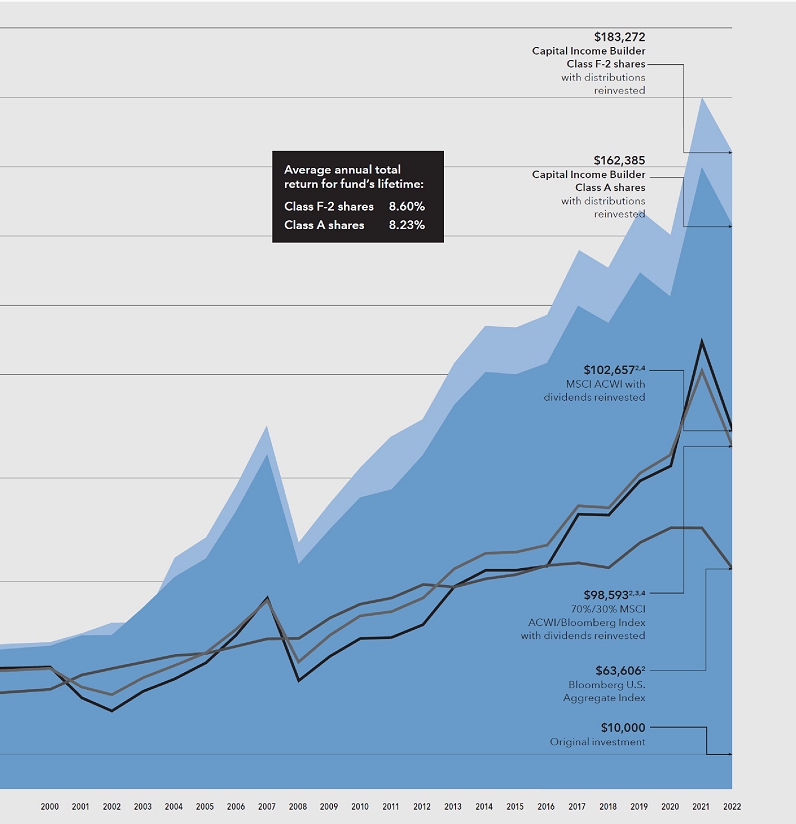
Results at a glance
For periods ended October 31, 2022, with all distributions reinvested
| | | Cumulative
total returns | | Average annual total returns |
| | | 1 year | | 5 years | | 10 years | | Lifetime
(since Class A
inception on
7/30/87) |
| | | | | | | | | |
| Capital Income Builder (Class F-2 shares)1 | | | –9.21 | % | | | 3.33 | % | | | 5.53 | % | | | 8.60 | % |
| Capital Income Builder (Class A shares) | | | –9.42 | | | | 3.11 | | | | 5.32 | | | | 8.41 | |
| 70%/30% MSCI ACWI/Bloomberg Index2,3,4 | | | –18.50 | | | | 3.76 | | | | 5.97 | | | | 6.71 | |
| MSCI ACWI (All Country World Index)2,3,5 | | | –19.96 | | | | 5.24 | | | | 7.98 | | | | 6.83 | |
| Bloomberg U.S. Aggregate Index3,6 | | | –15.68 | | | | –0.54 | | | | 0.74 | | | | 5.39 | |
| | | | | | | | | | | | | | | | | |
| 1 | Class F-2 shares were first offered on August 1, 2008. Class F-2 share results prior to the date of first sale are hypothetical based on the results of the original share class of the fund without a sales charge, adjusted for typical estimated expenses. Visit capitalgroup.com for more information on specific expense adjustments and the actual dates of first sale. |
| 2 | From July 30, 1987, through December 31, 1987, the MSCI World Index was used because the MSCI ACWI did not exist. MSCI World Index results reflect dividends net of withholding taxes, and MSCI ACWI results reflect dividends gross of withholding taxes through December 31, 2000, and dividends net of withholding taxes thereafter. |
| 3 | The market indexes are unmanaged and, therefore, have no expenses. Investors cannot invest directly in an index. There have been periods when the fund has lagged the index. Sources: MSCI, Bloomberg Index Services Ltd. |
| 4 | The 70%/30% MSCI ACWI/Bloomberg Index blends the MSCI ACWI with the Bloomberg U.S. Aggregate Index by weighting their total returns at 70% and 30%, respectively. Results assume the blend is rebalanced monthly. As of January 1, 2021, the fund’s primary benchmark is the 70%/30% MSCI ACWI/Bloomberg U.S. Aggregate Index. |
| 5 | The MSCI All Country World Index is a free float-adjusted, market capitalization-weighted index that measures equity results in global developed and emerging markets. It consists of more than 40 developed and emerging market country indexes. |
| 6 | The Bloomberg U.S. Aggregate Index represents the U.S. investment-grade, fixed-rate bond market. |
| | |
Global markets struggled
While Capital Income Builder ended the fiscal year in negative territory, it held up notably well in the face of major stock and bond market declines as investors absorbed the implications of Russia’s February invasion of Ukraine, the challenge of balancing persistent inflationary pressures with a potential recession, and the U.S. Federal Reserve’s firm commitment to tighter monetary policy. In 2022, the Fed raised interest rates five times by the end of October, including three 75-basis-point increases, to combat rising inflation in the most aggressive rate hiking in decades. Europe grappled with significant political upheaval and economic challenges coupled with monetary tightening; the European Central Bank (ECB) raised interest rates to the highest level since 2009. Among other major markets, China faced slowing economic growth and the implications of COVID-19-induced lockdowns.
Against this backdrop, the MSCI ACWI fell 19.96% for the fiscal year, versus a 14.61% drop for the S&P 500 Index.1 All MSCI ACWI sectors declined, except for energy, which rose 28.95% as oil and natural gas prices soared. Communication services, consumer discretionary and information technology fell the most, with communication services sliding 39.56%. Value stocks fared better than growth equities in a significant reversal from previous years; the MSCI ACWI Value Index2 lost 10.29%, versus a 29.25% decline for the MSCI ACWI Growth Index.3 Bond markets sank as central banks aggressively raised interest rates to fight high inflation. The Bloomberg U.S. Aggregate Index dropped 15.68%, while the Bloomberg Corporate Investment Grade Index fell 19.57%.
Inside the portfolio
Capital Income Builder’s holdings are focused on companies that we believe will provide current and growing dividend income and capital appreciation through a challenging market environment.
VICI Properties — which makes up 1.7% of fund assets — was a major contributor. Shares of the real estate investment trust, which owns portfolios for Caesars Palace Las Vegas, MGM Grand and the Venetian Resort Las Vegas, rose 9.10%; VICI posted strong 2021 profits and robust quarterly earnings throughout 2022 following its acquisition of MGM Growth Properties and expanded partnership with Great Wolf Resorts. Real estate firms in general compose a notable portion of the fund, at 6.0% of assets.
Shares of Canadian Natural Resources rose 41.12% for the fiscal year, amid higher energy prices and tighter supply in the face of ongoing conflict in Ukraine. In general, Capital Income Builder invests in select low-cost energy providers and sound capital allocators that focus on shareholder returns. We believe that many of these companies are likely to continue participating in the major long-term energy transition happening across the globe. This includes Europe’s shift from Russian gas and increased demand for renewables amid pressure for reduced carbon emissions. Despite potential challenges, we believe this longer-term global energy shift will offer significant opportunities related to new pipelines and demand for liquified natural gas and renewable energy sources.
Investments in the consumer staples sector — which make up 10.3% of the portfolio — further supported fund results and are likely to remain resilient in a slowing economy. Shares of General Mills rose 32.01%; the food giant had a dividend yield of 2.57% at the end of the fiscal year. British American Tobacco (BAT) and Phillip Morris International, which respectively make up 1.7% and 2.2% of fund assets, also helped relative results. Both firms remain committed to developing reduced-risk, next-generation products and have managed to sustain pricing power in an inflationary environment.
In general, health care tends to hold up well during cyclical downturns, and the sector appears to be more resistant to current inflationary pressures than other areas of the market, such as food and energy. Select health care companies offer attractive valuations, along with the potential for improving fundamentals and long-term product pipeline opportunities driven by innovative research. AbbVie was one of the largest contributors to the portfolio for the fiscal year; the pharmaceutical firm is the second-largest fund holding, making up 2.3% of assets. AbbVie offered a 3.85% dividend yield as of October 31. Shares of Amgen also rose sharply, and shares of Gilead Sciences climbed, bolstered by sales of its cancer and HIV drugs in the first three quarters of 2022.
In the industrials sector, aerospace and defense companies have benefited from post-COVID-19 reopenings and higher defense budgets in the face of rising geopolitical tensions. Shares of Raytheon Technologies gained amid strong profits throughout the fiscal year, driven by recovering demand for commercial aerospace and expectations for increased military spending.
Shares of Comcast fell sharply. The telecommunications giant reported strong results for its theme park business in the first three quarters of 2022, but grappled with slower revenue from its Sky business, which operates across Europe. Comcast offered a dividend yield of 3.34% as of October 31.
Shares of energy company Gazprom declined amid Russian sanctions and the implications of European efforts to reduce dependence on Russian gas following the invasion of Ukraine. Shares of the Moscow Exchange Micex also fell sharply. The energy crisis stemming from the Russia-Ukraine conflict also hurt European
| 1 | The S&P 500 Index is a market capitalization-weighted index that represents approximately 500 widely held common stocks. |
| 2 | The MSCI ACWI Value Index captures large- and mid-cap securities exhibiting overall value style characteristics across 23 developed market and 24 emerging market countries. Value style characteristics are defined using three variables: book value to price, 12-month forward earnings to price and dividend yield. |
| 3 | The MSCI ACWI Growth Index captures large- and mid-cap securities exhibiting overall growth style characteristics across 23 developed market and 24 emerging market countries. Growth style characteristics are defined using five variables: short- and long-term forward EPS growth rates, current internal growth rate, long-term historical EPS growth trend and long-term historical sales per share growth trend. |
| | |
utilities firms, with shares of Italian utilities provider Enel affected by adverse economic and geopolitical pressures, including worries about exposure to Russian gas, Italian political uncertainty and the risk of a European recession.
In the technology sector, several semiconductor stocks declined in the face of supply chain issues and fears about the potential impact of a global economic slowdown. Shares of GlobalWafers, Taiwan Semiconductor Manufacturing Company and Vanguard International all fell. GlobalWafers was also weighed down by issues related to its failed takeover of Germany-based silicon wafer maker Siltronic.
Bond allocations
Capital Income Builder’s bond allocations aim to complement its global equity investments in both higher-yielding stocks with lower-dividend growth potential and stocks with lower current yields and prospects for faster dividend growth. Fixed income investments tend to include well-diversified, higher-quality securities, with the goal of providing income and cushioning equity volatility. U.S. bonds declined over the fiscal year, but still held up better than global stocks, with the Bloomberg U.S. Aggregate Index falling 15.68% versus a 19.96% decline for the MSCI ACWI Index. Bond allocations now offer more income opportunities than a year ago, in the view of managers; exposure to bonds has notably increased to 19.6% of total assets from 15.3% as of October 31, 2021. The fund remains focused on high-quality, lower-risk bonds as a source of steady income. As bond valuations have become more attractive, the fund has seen increased exposure to select mortgage-backed securities.
Moving forward
The world is currently facing a variety of economic, geopolitical and market-based crosscurrents. Inflation appears likely to persist, concerns about recession loom and higher interest rates have become a reality across key developed markets. More broadly, current circumstances appear to reflect longer-term shifts from deflation to inflation and lower to higher interest rates, heightened geopolitical risk, the redistribution of global supply chains, and a multiyear global energy transition.
Against this backdrop, dividend-paying stocks have garnered investor attention after a decade-long period of growth-oriented stocks dominating markets. In a rising and more normalized interest rate environment, total return is likely to be driven by a combination of capital appreciation and dividend returns. For more historical context, dividend returns represented more than one-third of total S&P 500 returns from January 1926 to September 2022, with capital appreciation making up the rest of the return. (By contrast, dividends constituted more than 70% of S&P 500 returns in the 1970s, when inflation was rampant.*) Capital Income Builder was created in 1987 after a period of high inflation to help provide a stream of dividends in an attempt to counter inflation. Dividend payers tend to hold up well in inflationary environments.
We recognize the immediate challenges and opportunities across a range of possible economic scenarios, while staying firmly grounded in Capital Income Builder’s key driving philosophy of finding higher-yielding stocks with predictable growth. The fund continues to focus on companies with sound, improving capital allocation that we believe are poised to maintain healthy balance sheets and pay sustainable dividends. This includes convictions in companies with low starting yields that we believe can grow dividends reliably over time, bond proxies that are typically higher yielding but have lower growth, and cyclical companies with significant cash flow in areas such as aerospace and energy. We continue to find attractive dividend opportunities across the globe. In our view, many non-U.S. companies offer relatively appealing valuations, strong dividend culture and potential currency-related benefits, especially if dollar strength starts to wane.
Given the scope of many different economic and market-related crosscurrents, we believe Capital Income Builder’s focus on income has the potential to benefit investors, especially in light of its emphasis on companies that can adapt and continue to provide sustainable dividend growth in an uncertain environment. We expect that the fund’s focus on high-quality, lower-risk bonds should also offer further stability through volatile periods.
We would like to thank you for your continued support and look forward to reporting to you again in six months.
Sincerely,

David A. Hoag
Co-President

Winnie Kwan
Co-President

Steven T. Watson
Co-President
December 8, 2022
For current information about the fund, visit capitalgroup.com.
| * | Source: Capital/S&P Dow Jones indexes. Dividends constituted 4.2% of the S&P 500’s total return from January 1, 1970, to December 31, 1979, while capital appreciation made up 1.7%. From January 1, 1926, to September 30, 2022, dividends constituted 3.8% of the S&P 500’s total return, while capital appreciation made up 6.2%. |
| | |
The value of a long-term perspective
Fund results shown are for Class F-2 and Class A shares. Class A share results reflect deduction of the maximum sales charge of 5.75% on the $10,000 investment1; thus, the net amount invested was $9,425. Results are for past periods and are not predictive of results for future periods. Prices and returns will vary, so investors may lose money. For current information and month-end results, visit capitalgroup.com.
The results shown are before taxes on fund distributions and sale of fund shares. Class F-2 shares were first offered on August 1, 2008. Class F-2 share results prior to the date of first sale are hypothetical based on the results of the original share class of the fund without a sales charge, adjusted for typical estimated expenses. Visit capitalgroup.com for more information on specific expense adjustments and the actual dates of first sale.
| 1 | As outlined in the prospectus, the sales charge is reduced for accounts (and aggregated investments) of $25,000 or more and is eliminated for purchases of $1 million or more. There is no sales charge on dividends or capital gain distributions that are reinvested in additional shares. |
| 2 | The market index is unmanaged and, therefore, has no expenses. Investors cannot invest directly in an index. There have been periods when the fund has lagged the index. |
| 3 | The 70%/30% MSCI ACWI/Bloomberg Index blends the MSCI ACWI (All Country World Index) with the Bloomberg U.S. Aggregate Index by weighting their total returns at 70% and 30%, respectively. Results assume the blend is rebalanced monthly. |
| 4 | From July 30, 1987, through December 31, 1987, the MSCI World Index was used because the MSCI ACWI did not exist. MSCI World Index results reflect dividends net of withholding taxes, and MSCI ACWI results reflect dividends gross of withholding taxes through December 31, 2000, and dividends net of withholding taxes thereafter. |
| 5 | For the period July 30, 1987, commencement of operations, through October 31, 1987. |
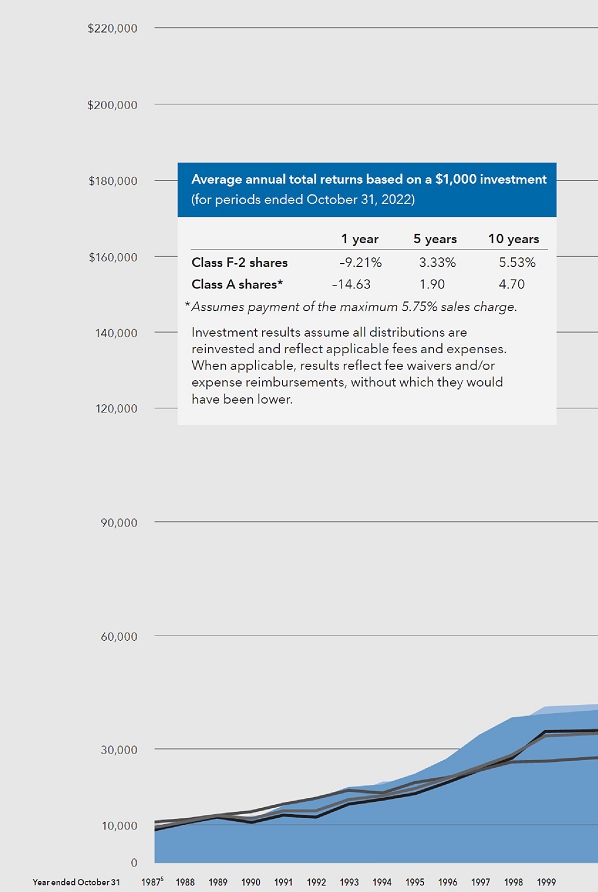
How a hypothetical $10,000 investment has grown
There have always been reasons not to invest. If you look beyond the negative headlines, however, you will find that despite occasional stumbles, financial markets have tended to reward investors over the long term. As the chart below shows, over its lifetime Capital Income Builder has done demonstrably better than its primary benchmark. Dividends, particularly when reinvested, have accounted for a large portion of the fund’s overall results.
Investment portfolio October 31, 2022
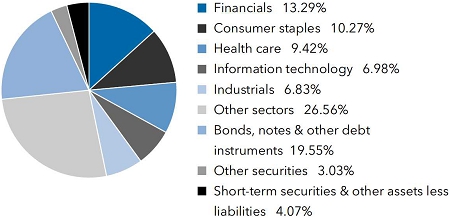
| Sector diversification | Percent of net assets |
| Country diversification by domicile | | Percent of
net assets |
| United States | | | 66.30 | % |
| Eurozone* | | | 6.14 | |
| United Kingdom | | | 6.07 | |
| Canada | | | 4.01 | |
| Switzerland | | | 3.55 | |
| India | | | 1.30 | |
| Brazil | | | 1.10 | |
| Singapore | | | 1.06 | |
| Hong Kong | | | .98 | |
| Other countries | | | 5.42 | |
| Short-term securities & other assets less liabilities | | | 4.07 | |
| * | Countries using the euro as a common currency; those represented in the fund’s portfolio are Belgium, Finland, France, Germany, Greece, Ireland, Italy, Luxembourg, the Netherlands, Portugal and Spain. |
| Common stocks 73.35% | | Shares | | | Value
(000) | |
| Financials 13.29% | | | | | | | | |
| Zurich Insurance Group AG | | | 3,525,191 | | | $ | 1,504,283 | |
| Toronto-Dominion Bank (CAD denominated) | | | 14,222,612 | | | | 910,243 | |
| JPMorgan Chase & Co. | | | 6,041,003 | | | | 760,441 | |
| PNC Financial Services Group, Inc. | | | 4,332,697 | | | | 701,160 | |
| CME Group, Inc., Class A | | | 4,003,180 | | | | 693,751 | |
| DBS Group Holdings, Ltd. | | | 26,771,329 | | | | 646,778 | |
| Morgan Stanley | | | 7,838,387 | | | | 644,080 | |
| Münchener Rückversicherungs-Gesellschaft AG | | | 2,121,470 | | | | 560,615 | |
| DNB Bank ASA | | | 26,715,932 | | | | 472,842 | |
| Power Corporation of Canada, subordinate voting shares | | | 16,459,500 | | | | 408,724 | |
| BlackRock, Inc. | | | 564,743 | | | | 364,773 | |
| Principal Financial Group, Inc. | | | 3,792,800 | | | | 334,259 | |
| Webster Financial Corp. | | | 5,822,182 | | | | 315,912 | |
| American International Group, Inc. | | | 4,926,520 | | | | 280,812 | |
| B3 SA-Brasil, Bolsa, Balcao | | | 94,751,330 | | | | 275,880 | |
| Blackstone, Inc., nonvoting shares | | | 2,966,119 | | | | 270,332 | |
| Tryg A/S | | | 12,163,039 | | | | 263,221 | |
| East West Bancorp, Inc. | | | 2,668,647 | | | | 190,995 | |
| Travelers Companies, Inc. | | | 1,001,700 | | | | 184,774 | |
| Ping An Insurance (Group) Company of China, Ltd., Class H | | | 40,046,667 | | | | 160,194 | |
| Ping An Insurance (Group) Company of China, Ltd., Class A | | | 2,804,884 | | | | 13,892 | |
| AIA Group, Ltd. | | | 22,469,800 | | | | 170,177 | |
| State Street Corp. | | | 2,268,303 | | | | 167,854 | |
| Kaspi.kz JSC1 | | | 2,447,140 | | | | 160,288 | |
| KBC Groep NV | | | 2,979,119 | | | | 149,267 | |
| Citizens Financial Group, Inc. | | | 3,587,962 | | | | 146,748 | |
| National Bank of Canada | | | 2,053,000 | | | | 139,785 | |
| OneMain Holdings, Inc. | | | 3,542,856 | | | | 136,612 | |
| ING Groep NV | | | 13,717,920 | | | | 134,944 | |
| Wells Fargo & Company | | | 2,556,514 | | | | 117,574 | |
| Swedbank AB, Class A | | | 7,814,300 | | | | 116,529 | |
| KeyCorp | | | 6,498,537 | | | | 116,129 | |
| China Pacific Insurance (Group) Co., Ltd., Class H | | | 69,619,612 | | | | 112,283 | |
| Corebridge Financial, Inc.2 | | | 4,000,000 | | | | 90,680 | |
| Truist Financial Corp. | | | 2,020,500 | | | | 90,498 | |
| Franklin Resources, Inc. | | | 3,799,500 | | | | 89,098 | |
| EFG International AG | | | 10,030,543 | | | | 82,140 | |
| BNP Paribas SA | | | 1,607,000 | | | | 75,428 | |
| TPG, Inc., Class A2 | | | 2,401,693 | | | | 73,852 | |
| Bank Central Asia Tbk PT | | | 128,165,200 | | | | 72,310 | |
| Great-West Lifeco, Inc.2 | | | 3,060,000 | | | | 70,843 | |
| Citigroup, Inc. | | | 1,460,000 | | | | 66,956 | |
| Hang Seng Bank, Ltd. | | | 4,630,800 | | | | 65,188 | |
| Common stocks (continued) | | Shares | | | Value
(000) | |
| Financials (continued) | | | | | | | | |
| Euronext NV | | | 999,658 | | | $ | 63,523 | |
| Patria Investments, Ltd., Class A3 | | | 4,432,700 | | | | 63,033 | |
| Banco Santander, SA | | | 18,170,300 | | | | 47,083 | |
| Cullen/Frost Bankers, Inc. | | | 297,924 | | | | 46,193 | |
| Hong Kong Exchanges and Clearing, Ltd. | | | 1,619,200 | | | | 43,112 | |
| Vontobel Holding AG | | | 722,067 | | | | 40,670 | |
| Macquarie Group, Ltd. | | | 349,591 | | | | 37,903 | |
| China Merchants Bank Co., Ltd., Class H | | | 8,228,000 | | | | 27,044 | |
| SouthState Corp. | | | 214,206 | | | | 19,371 | |
| IIFL Wealth Management, Ltd. | | | 760,130 | | | | 16,266 | |
| UniCredit SpA | | | 1,105,058 | | | | 13,703 | |
| Jonah Energy Parent, LLC4 | | | 1,631 | | | | 81 | |
| Moscow Exchange MICEX-RTS PJSC4,5 | | | 85,235,374 | | | | — | 6 |
| Sberbank of Russia PJSC4,5,7 | | | 19,327,472 | | | | — | 6 |
| | | | | | | | 12,821,126 | |
| | | | | | | | | |
| Consumer staples 10.27% | | | | | | | | |
| Philip Morris International, Inc. | | | 23,047,508 | | | | 2,116,914 | |
| British American Tobacco PLC | | | 36,080,352 | | | | 1,420,678 | |
| British American Tobacco PLC (ADR) | | | 5,339,964 | | | | 211,569 | |
| Nestlé SA | | | 7,926,274 | | | | 863,116 | |
| PepsiCo, Inc. | | | 4,360,157 | | | | 791,717 | |
| General Mills, Inc. | | | 9,602,257 | | | | 783,352 | |
| Altria Group, Inc. | | | 16,618,974 | | | | 768,960 | |
| Imperial Brands PLC | | | 18,410,813 | | | | 448,451 | |
| Kimberly-Clark Corp. | | | 3,457,945 | | | | 430,376 | |
| ITC, Ltd. | | | 100,224,616 | | | | 422,196 | |
| Unilever PLC (GBP denominated) | | | 5,086,840 | | | | 231,856 | |
| Carlsberg A/S, Class B | | | 1,849,873 | | | | 218,028 | |
| Danone SA | | | 4,292,863 | | | | 213,564 | |
| Keurig Dr Pepper, Inc. | | | 5,079,438 | | | | 197,285 | |
| Anheuser-Busch InBev SA/NV | | | 3,286,679 | | | | 164,352 | |
| Kraft Heinz Company | | | 2,880,637 | | | | 110,818 | |
| Procter & Gamble Company | | | 671,222 | | | | 90,393 | |
| Mondelez International, Inc. | | | 1,289,056 | | | | 79,251 | |
| Vector Group, Ltd. | | | 6,328,252 | | | | 67,206 | |
| Seven & i Holdings Co., Ltd. | | | 1,730,200 | | | | 64,626 | |
| Viscofan, SA, non-registered shares | | | 779,691 | | | | 46,424 | |
| Reckitt Benckiser Group PLC | | | 602,632 | | | | 39,946 | |
| Scandinavian Tobacco Group A/S | | | 2,058,240 | | | | 34,503 | |
| Wuliangye Yibin Co., Ltd., Class A | | | 1,569,956 | | | | 28,716 | |
| Hilton Food Group PLC | | | 2,800,821 | | | | 19,593 | |
| Kimberly-Clark de México, SAB de CV, ordinary participation certificates, Class A | | 12,310,685 | | | | 19,423 | |
| Coca-Cola HBC AG (CDI) | | | 636,500 | | | | 13,887 | |
| Haleon PLC5 | | | 3,284,000 | | | | 10,093 | |
| | | | | | | | 9,907,293 | |
| | | | | | | | | |
| Health care 9.42% | | | | | | | | |
| AbbVie, Inc. | | | 15,298,693 | | | | 2,239,729 | |
| Amgen, Inc. | | | 4,741,895 | | | | 1,281,971 | |
| Gilead Sciences, Inc. | | | 13,892,977 | | | | 1,090,043 | |
| Medtronic PLC | | | 7,216,561 | | | | 630,294 | |
| AstraZeneca PLC | | | 5,314,855 | | | | 624,989 | |
| Abbott Laboratories | | | 5,862,665 | | | | 580,052 | |
| Novartis AG | | | 6,628,923 | | | | 535,557 | |
| Bristol-Myers Squibb Company | | | 6,563,686 | | | | 508,489 | |
| Pfizer, Inc. | | | 7,911,544 | | | | 368,282 | |
| UnitedHealth Group, Inc. | | | 614,542 | | | | 341,163 | |
| Roche Holding AG, nonvoting non-registered shares | | | 888,794 | | | | 295,170 | |
| GSK PLC | | | 11,330,890 | | | | 185,662 | |
| Royalty Pharma PLC, Class A | | | 3,759,287 | | | | 159,093 | |
| Merck & Co., Inc. | | | 702,500 | | | | 71,093 | |
| CVS Health Corp. | | | 669,922 | | | | 63,442 | |
| EBOS Group, Ltd. | | | 2,658,446 | | | | 57,961 | |
| Bayer AG | | | 1,072,107 | | | | 56,387 | |
| Koninklijke Philips NV (EUR denominated) | | | 310,789 | | | | 3,937 | |
| Organon & Co. | | | 70,250 | | | | 1,839 | |
| | | | | | | | 9,095,153 | |
| Common stocks (continued) | | Shares | | | Value
(000) | |
| Information technology 6.98% | | | | | | | | |
| Broadcom, Inc. | | | 5,841,109 | | | $ | 2,746,023 | |
| Microsoft Corp. | | | 6,287,744 | | | | 1,459,574 | |
| Taiwan Semiconductor Manufacturing Company, Ltd. | | | 51,783,456 | | | | 626,753 | |
| Automatic Data Processing, Inc. | | | 883,400 | | | | 213,518 | |
| Texas Instruments, Inc. | | | 1,198,011 | | | | 192,437 | |
| Paychex, Inc. | | | 1,520,436 | | | | 179,883 | |
| Apple, Inc. | | | 1,163,450 | | | | 178,403 | |
| KLA Corp. | | | 430,103 | | | | 136,106 | |
| NetApp, Inc. | | | 1,815,150 | | | | 125,736 | |
| QUALCOMM, Inc. | | | 1,015,727 | | | | 119,510 | |
| Vanguard International Semiconductor Corp. | | | 54,804,249 | | | | 112,934 | |
| SAP SE | | | 880,449 | | | | 84,983 | |
| Tokyo Electron, Ltd. | | | 314,000 | | | | 83,391 | |
| GlobalWafers Co., Ltd. | | | 7,363,753 | | | | 81,927 | |
| Western Union Company | | | 6,010,700 | | | | 81,205 | |
| Analog Devices, Inc. | | | 418,785 | | | | 59,727 | |
| MediaTek, Inc. | | | 2,989,467 | | | | 54,738 | |
| Intel Corp. | | | 1,604,123 | | | | 45,605 | |
| Fidelity National Information Services, Inc. | | | 529,032 | | | | 43,904 | |
| Tripod Technology Corp. | | | 12,630,424 | | | | 34,964 | |
| International Business Machines Corp. | | | 227,619 | | | | 31,477 | |
| SINBON Electronics Co., Ltd. | | | 3,987,072 | | | | 30,996 | |
| BE Semiconductor Industries NV | | | 326,200 | | | | 16,673 | |
| | | | | | | | 6,740,467 | |
| | | | | | | | | |
| Industrials 6.83% | | | | | | | | |
| Raytheon Technologies Corp. | | | 20,758,595 | | | | 1,968,330 | |
| Lockheed Martin Corp. | | | 1,167,324 | | | | 568,113 | |
| BAE Systems PLC | | | 48,702,793 | | | | 454,862 | |
| Honeywell International, Inc. | | | 2,195,550 | | | | 447,936 | |
| RELX PLC | | | 11,642,336 | | | | 312,557 | |
| RELX PLC (ADR) | | | 759,134 | | | | 20,466 | |
| L3Harris Technologies, Inc. | | | 1,233,957 | | | | 304,133 | |
| Siemens AG | | | 2,500,430 | | | | 273,397 | |
| Kone OYJ, Class B | | | 6,371,100 | | | | 260,979 | |
| Trinity Industries, Inc.3 | | | 7,712,016 | | | | 220,024 | |
| Deutsche Post AG | | | 5,658,237 | | | | 200,800 | |
| VINCI SA | | | 2,097,947 | | | | 193,190 | |
| Singapore Technologies Engineering, Ltd. | | | 74,142,756 | | | | 172,839 | |
| Illinois Tool Works, Inc. | | | 650,000 | | | | 138,794 | |
| BOC Aviation, Ltd. | | | 16,978,156 | | | | 113,661 | |
| Grupo Aeroportuario del Pacífico, SAB de CV, Class B | | | 6,602,714 | | | | 102,275 | |
| Trelleborg AB, Class B | | | 4,230,000 | | | | 93,211 | |
| Ventia Services Group Pty, Ltd.3 | | | 48,847,735 | | | | 86,550 | |
| Norfolk Southern Corp. | | | 342,215 | | | | 78,049 | |
| LIXIL Corp. | | | 4,771,900 | | | | 72,239 | |
| United Parcel Service, Inc., Class B | | | 396,000 | | | | 66,437 | |
| Compañia de Distribución Integral Logista Holdings, SA, non-registered shares | | | 3,048,755 | | | | 63,091 | |
| Waste Management, Inc. | | | 382,611 | | | | 60,594 | |
| General Dynamics Corp. | | | 224,400 | | | | 56,055 | |
| ITOCHU Corp. | | | 1,951,900 | | | | 50,525 | |
| Marubeni Corp. | | | 5,050,000 | | | | 44,253 | |
| Carrier Global Corp. | | | 1,081,344 | | | | 42,994 | |
| CCR SA, ordinary nominative shares | | | 14,116,678 | | | | 35,418 | |
| Airbus SE, non-registered shares | | | 319,385 | | | | 34,587 | |
| AB Volvo, Class B | | | 1,935,186 | | | | 31,689 | |
| Sulzer AG | | | 374,355 | | | | 24,955 | |
| | | | | | | | 6,593,003 | |
| | | | | | | | | |
| Utilities 6.34% | | | | | | | | |
| Dominion Energy, Inc. | | | 11,728,074 | | | | 820,613 | |
| DTE Energy Company | | | 4,849,200 | | | | 543,644 | |
| Power Grid Corporation of India, Ltd. | | | 179,406,466 | | | | 494,477 | |
| National Grid PLC | | | 41,878,261 | | | | 455,479 | |
| Iberdrola, SA, non-registered shares | | | 41,961,778 | | | | 426,091 | |
| E.ON SE | | | 47,693,266 | | | | 399,498 | |
| The Southern Co. | | | 5,832,500 | | | | 381,912 | |
| Engie SA | | | 22,511,806 | | | | 292,641 | |
| Common stocks (continued) | | Shares | | | Value
(000) | |
| Utilities (continued) | | | | | | | | |
| ENGIE SA, bonus dividend | | | 3,818,624 | | | $ | 49,640 | |
| Edison International | | | 5,359,531 | | | | 321,786 | |
| AES Corp. | | | 9,541,613 | | | | 249,609 | |
| Entergy Corp. | | | 2,209,425 | | | | 236,718 | |
| Evergy, Inc. | | | 3,750,568 | | | | 229,272 | |
| Duke Energy Corp. | | | 2,412,000 | | | | 224,750 | |
| Public Service Enterprise Group, Inc. | | | 2,527,930 | | | | 141,741 | |
| Sempra Energy | | | 875,819 | | | | 132,196 | |
| CenterPoint Energy, Inc. | | | 4,465,549 | | | | 127,759 | |
| Exelon Corp. | | | 3,270,868 | | | | 126,223 | |
| Enel SpA | | | 27,463,619 | | | | 122,650 | |
| SSE PLC | | | 6,716,533 | | | | 119,851 | |
| NextEra Energy, Inc. | | | 1,226,469 | | | | 95,051 | |
| ENN Energy Holdings, Ltd. | | | 5,081,900 | | | | 50,530 | |
| Power Assets Holdings, Ltd. | | | 9,434,000 | | | | 45,129 | |
| CMS Energy Corp. | | | 352,820 | | | | 20,129 | |
| American Electric Power Company, Inc. | | | 120,522 | | | | 10,596 | |
| | | | | | | | 6,117,985 | |
| | | | | | | | | |
| Energy 6.32% | | | | | | | | |
| Canadian Natural Resources, Ltd. (CAD denominated)2 | | | 15,064,682 | | | | 903,538 | |
| TC Energy Corp. (CAD denominated) | | | 16,592,645 | | | | 728,817 | |
| TC Energy Corp. | | | 1,387,400 | | | | 60,935 | |
| Chevron Corp. | | | 4,200,335 | | | | 759,841 | |
| Exxon Mobil Corp. | | | 5,570,288 | | | | 617,244 | |
| TotalEnergies SE | | | 7,980,721 | | | | 434,571 | |
| EOG Resources, Inc. | | | 3,127,408 | | | | 426,954 | |
| BP PLC | | | 70,864,879 | | | | 389,923 | |
| Shell PLC (GBP denominated) | | | 10,113,335 | | | | 278,815 | |
| Shell PLC (ADR) | | | 738,100 | | | | 41,061 | |
| ConocoPhillips | | | 2,289,004 | | | | 288,620 | |
| Pioneer Natural Resources Company | | | 909,940 | | | | 233,318 | |
| Woodside Energy Group, Ltd. | | | 7,591,011 | | | | 174,704 | |
| Woodside Energy Group, Ltd. (CDI) | | | 2,125,736 | | | | 49,146 | |
| Enbridge, Inc. (CAD denominated)2 | | | 4,457,700 | | | | 173,681 | |
| Schlumberger, Ltd. | | | 3,258,133 | | | | 169,521 | |
| Equitrans Midstream Corp. | | | 18,872,981 | | | | 158,910 | |
| Baker Hughes Co., Class A | | | 4,650,800 | | | | 128,641 | |
| DT Midstream, Inc. | | | 1,195,562 | | | | 71,375 | |
| Galp Energia, SGPS, SA, Class B | | | 1,006,588 | | | | 10,221 | |
| Constellation Oil Services Holding SA, Class B-14,5 | | | 282,550 | | | | — | 6 |
| Gazprom PJSC4,7 | | | 84,735,990 | | | | — | 6 |
| | | | | | | | 6,099,836 | |
| | | | | | | | | |
| Real estate 6.01% | | | | | | | | |
| VICI Properties, Inc. REIT3 | | | 52,658,330 | | | | 1,686,120 | |
| Crown Castle, Inc. REIT | | | 11,951,934 | | | | 1,592,715 | |
| Equinix, Inc. REIT | | | 823,841 | | | | 466,656 | |
| Gaming and Leisure Properties, Inc. REIT | | | 8,273,693 | | | | 414,677 | |
| Federal Realty Investment Trust REIT | | | 2,500,000 | | | | 247,450 | |
| Link REIT | | | 32,738,146 | | | | 193,518 | |
| American Tower Corp. REIT | | | 869,676 | | | | 180,188 | |
| CK Asset Holdings, Ltd. | | | 28,272,934 | | | | 156,318 | |
| Charter Hall Group REIT | | | 13,076,087 | | | | 108,232 | |
| POWERGRID Infrastructure Investment Trust3 | | | 59,148,100 | | | | 98,707 | |
| Mindspace Business Parks REIT | | | 21,491,600 | | | | 92,242 | |
| Extra Space Storage, Inc. REIT | | | 513,464 | | | | 91,109 | |
| Embassy Office Parks REIT | | | 21,328,000 | | | | 88,731 | |
| Americold Realty Trust, Inc. REIT | | | 2,701,312 | | | | 65,507 | |
| CTP NV | | | 6,006,045 | | | | 62,322 | |
| Digital Realty Trust, Inc. REIT | | | 610,751 | | | | 61,228 | |
| Kimco Realty Corp. REIT | | | 2,819,000 | | | | 60,270 | |
| Sun Hung Kai Properties, Ltd. | | | 5,568,353 | | | | 59,907 | |
| Longfor Group Holdings, Ltd. | | | 25,875,500 | | | | 32,964 | |
| CubeSmart REIT | | | 727,081 | | | | 30,443 | |
| Douglas Elliman, Inc. | | | 2,245,900 | | | | 10,376 | |
| TAG Immobilien AG | | | 658,445 | | | | 4,129 | |
| | | | | | | | 5,803,809 | |
| Common stocks (continued) | | Shares | | | Value
(000) | |
| Consumer discretionary 2.71% | | | | | | | | |
| McDonald’s Corp. | | | 1,815,766 | | | $ | 495,087 | |
| Home Depot, Inc. | | | 1,138,335 | | | | 337,095 | |
| Starbucks Corp. | | | 3,619,300 | | | | 313,395 | |
| Industria de Diseño Textil, SA | | | 13,201,427 | | | | 299,282 | |
| Kering SA | | | 495,863 | | | | 227,230 | |
| Midea Group Co., Ltd., Class A | | | 35,149,235 | | | | 193,502 | |
| LVMH Moët Hennessy-Louis Vuitton SE | | | 251,902 | | | | 159,074 | |
| YUM! Brands, Inc. | | | 902,600 | | | | 106,733 | |
| Darden Restaurants, Inc. | | | 623,503 | | | | 89,248 | |
| Restaurant Brands International, Inc. | | | 1,393,243 | | | | 82,731 | |
| Galaxy Entertainment Group, Ltd. | | | 17,447,000 | | | | 79,682 | |
| Cie. Financière Richemont SA, Class A | | | 687,066 | | | | 67,201 | |
| Hasbro, Inc. | | | 663,260 | | | | 43,278 | |
| OPAP SA | | | 2,405,363 | | | | 29,476 | |
| Mercedes-Benz Group AG | | | 494,395 | | | | 28,631 | |
| Inchcape PLC | | | 2,546,035 | | | | 21,723 | |
| Kindred Group PLC (SDR) | | | 1,933,000 | | | | 16,807 | |
| Thule Group AB | | | 828,459 | | | | 16,327 | |
| VF Corp. | | | 397,691 | | | | 11,235 | |
| | | | | | | | 2,617,737 | |
| | | | | | | | | |
| Communication services 2.71% | | | | | | | | |
| Comcast Corp., Class A | | | 19,657,649 | | | | 623,934 | |
| Verizon Communications, Inc. | | | 10,020,406 | | | | 374,463 | |
| SoftBank Corp. | | | 33,512,558 | | | | 330,291 | |
| BCE, Inc. | | | 5,561,882 | | | | 250,874 | |
| Koninklijke KPN NV | | | 81,065,231 | | | | 226,799 | |
| Singapore Telecommunications, Ltd. | | | 117,092,300 | | | | 206,789 | |
| Nippon Telegraph and Telephone Corp. | | | 6,654,900 | | | | 183,228 | |
| HKT Trust and HKT, Ltd., units | | | 100,055,060 | | | | 113,061 | |
| Warner Music Group Corp., Class A | | | 2,928,864 | | | | 76,209 | |
| Omnicom Group, Inc. | | | 931,500 | | | | 67,767 | |
| WPP PLC | | | 7,309,271 | | | | 64,208 | |
| Indus Towers, Ltd. | | | 18,916,173 | | | | 42,390 | |
| Pearson PLC | | | 2,478,885 | | | | 27,302 | |
| ProSiebenSat.1 Media SE | | | 3,562,000 | | | | 24,219 | |
| | | | | | | | 2,611,534 | |
| | | | | | | | | |
| Materials 2.47% | | | | | | | | |
| Vale SA (ADR), ordinary nominative shares | | | 30,925,978 | | | | 400,182 | |
| Vale SA, ordinary nominative shares | | | 19,740,969 | | | | 256,551 | |
| Rio Tinto PLC | | | 7,048,863 | | | | 366,755 | |
| Linde PLC | | | 781,484 | | | | 232,374 | |
| Air Products and Chemicals, Inc. | | | 855,988 | | | | 214,339 | |
| BHP Group, Ltd. (CDI) | | | 7,292,000 | | | | 173,647 | |
| International Flavors & Fragrances, Inc. | | | 1,645,521 | | | | 160,619 | |
| LyondellBasell Industries NV | | | 1,630,155 | | | | 124,625 | |
| Evonik Industries AG | | | 4,821,154 | | | | 88,882 | |
| Sociedad Química y Minera de Chile SA, Class B (ADR) | | | 936,668 | | | | 87,747 | |
| BASF SE | | | 1,925,521 | | | | 86,458 | |
| UPM-Kymmene OYJ | | | 1,677,885 | | | | 56,229 | |
| Asahi Kasei Corp. | | | 8,589,800 | | | | 55,140 | |
| Nexa Resources SA | | | 4,624,901 | | | | 23,217 | |
| WestRock Co. | | | 662,600 | | | | 22,568 | |
| Shin-Etsu Chemical Co., Ltd. | | | 178,600 | | | | 18,665 | |
| Fortescue Metals Group, Ltd. | | | 1,982,847 | | | | 18,644 | |
| | | | | | | | 2,386,642 | |
| | | | | | | | | |
| Total common stocks (cost: $58,698,846,000) | | | | | | | 70,794,585 | |
| | | | | | | | | |
| Preferred securities 0.06% | | | | | | | | |
| Information technology 0.05% | | | | | | | | |
| Samsung Electronics Co., Ltd., nonvoting preferred shares | | | 1,163,110 | | | | 43,521 | |
| Preferred securities (continued) | | Shares | | | Value
(000) | |
| Financials 0.01% | | | | | | | | |
| CoBank, ACB, Class E, 5.006% noncumulative preferred shares1,8 | | | 13,000 | | | $ | 10,368 | |
| | | | | | | | | |
| Total preferred securities (cost: $50,246,000) | | | | | | | 53,889 | |
| | | | | | | | | |
| Rights & warrants 0.00% | | | | | | | | |
| Consumer discretionary 0.00% | | | | | | | | |
| Compagnie Financière Richemont SA, Class A, warrants, expire 11/22/20235 | | | 684,470 | | | | 335 | |
| | | | | | | | | |
| Total rights & warrants (cost: $0) | | | | | | | 335 | |
| | | | | | | | | |
| Convertible stocks 0.48% | | | | | | | | |
| Utilities 0.30% | | | | | | | | |
| NextEra Energy, Inc., noncumulative convertible preferred units, 6.926% 9/1/2025 | | | 3,206,400 | | | | 149,098 | |
| AES Corp., convertible preferred units, 6.875% 2/15/2024 | | | 913,000 | | | | 89,940 | |
| American Electric Power Company, Inc., convertible preferred units, 6.125% 8/15/20232 | | | 938,000 | | | | 46,637 | |
| | | | | | | | 285,675 | |
| | | | | | | | | |
| Health care 0.11% | | | | | | | | |
| Danaher Corp., Series B, cumulative convertible preferred shares, 5.00% 4/15/20232 | | | 84,600 | | | | 110,696 | |
| | | | | | | | | |
| Consumer discretionary 0.07% | | | | | | | | |
| Aptiv PLC, Series A, convertible preferred shares, 5.50% 6/15/2023 | | | 623,573 | | | | 66,647 | |
| | | | | | | | | |
| Total convertible stocks (cost: $445,466,000) | | | | | | | 463,018 | |
| | | | | | | | | |
| Investment funds 2.49% | | | | | | | | |
| Capital Group Central Corporate Bond Fund3 | | | 305,300,361 | | | | 2,402,714 | |
| | | | | | | | | |
| Total investment funds (cost: $3,076,443,000) | | | | | | | 2,402,714 | |
| | | | | | | | | |
| Bonds, notes & other debt instruments 19.55% | | Principal amount
(000) | | | | | |
| U.S. Treasury bonds & notes 8.87% | | | | | | | | |
| U.S. Treasury 5.90% | | | | | | | | |
| U.S. Treasury 7.625% 11/15/2022 | | USD | 39,700 | | | | 39,764 | |
| U.S. Treasury 7.125% 2/15/2023 | | | 299,800 | | | | 302,333 | |
| U.S. Treasury 6.25% 8/15/2023 | | | 350,000 | | | | 354,607 | |
| U.S. Treasury 2.25% 3/31/2024 | | | 300,000 | | | | 290,227 | |
| U.S. Treasury 3.25% 8/31/2024 | | | 49,842 | | | | 48,717 | |
| U.S. Treasury 4.25% 9/30/2024 | | | 858 | | | | 854 | |
| U.S. Treasury 7.50% 11/15/20249 | | | 331,275 | | | | 350,374 | |
| U.S. Treasury 7.625% 2/15/2025 | | | 250,000 | | | | 266,697 | |
| U.S. Treasury 2.875% 7/31/2025 | | | 100,000 | | | | 95,995 | |
| U.S. Treasury 6.875% 8/15/2025 | | | 145,145 | | | | 154,148 | |
| U.S. Treasury 6.00% 2/15/2026 | | | 206,000 | | | | 215,431 | |
| U.S. Treasury 6.75% 8/15/2026 | | | 35,000 | | | | 37,914 | |
| U.S. Treasury 6.50% 11/15/2026 | | | 178,000 | | | | 192,091 | |
| U.S. Treasury 2.25% 2/15/2027 | | | 75 | | | | 69 | |
| U.S. Treasury 6.625% 2/15/2027 | | | 65,000 | | | | 70,712 | |
| U.S. Treasury 2.50% 3/31/2027 | | | 136,000 | | | | 126,259 | |
| U.S. Treasury 2.75% 7/31/2027 | | | 475,000 | | | | 444,292 | |
| U.S. Treasury 6.375% 8/15/2027 | | | 85,000 | | | | 92,476 | |
| U.S. Treasury 4.125% 10/31/2027 | | | 952 | | | | 948 | |
| U.S. Treasury 6.125% 11/15/20279 | | | 499,614 | | | | 540,324 | |
| U.S. Treasury 2.875% 8/15/2028 | | | 160,000 | | | | 148,740 | |
| U.S. Treasury 5.50% 8/15/2028 | | | 140,000 | | | | 148,628 | |
| U.S. Treasury 5.25% 11/15/2028 | | | 89,000 | | | | 93,414 | |
| U.S. Treasury 5.25% 2/15/2029 | | | 25,000 | | | | 26,306 | |
| U.S. Treasury 6.125% 8/15/2029 | | | 30,000 | | | | 33,333 | |
| U.S. Treasury 6.25% 5/15/2030 | | | 274,563 | | | | 310,970 | |
| U.S. Treasury 1.875% 2/15/2032 | | | 195,000 | | | | 162,394 | |
| U.S. Treasury 2.875% 5/15/2032 | | | 300,000 | | | | 272,203 | |
| U.S. Treasury 2.75% 8/15/2032 | | | 1,151 | | | | 1,031 | |
| Bonds, notes & other debt instruments (continued) | | Principal amount
(000) | | | Value
(000) | |
| U.S. Treasury bonds & notes (continued) | | | | | | | | |
| U.S. Treasury (continued) | | | | | | | | |
| U.S. Treasury 1.125% 5/15/20409 | | USD | 228,288 | | | $ | 136,871 | |
| U.S. Treasury 2.50% 2/15/2046 | | | 29,300 | | | | 21,056 | |
| U.S. Treasury 2.875% 11/15/2046 | | | 20,300 | | | | 15,692 | |
| U.S. Treasury 3.00% 5/15/2047 | | | 116,000 | | | | 91,746 | |
| U.S. Treasury 3.00% 2/15/20499 | | | 228,388 | | | | 183,256 | |
| U.S. Treasury 2.875% 5/15/2049 | | | 41,800 | | | | 32,717 | |
| U.S. Treasury 1.375% 8/15/2050 | | | 40,000 | | | | 21,439 | |
| U.S. Treasury 2.00% 8/15/2051 | | | 40,000 | | | | 25,330 | |
| U.S. Treasury 1.875% 11/15/2051 | | | 58,498 | | | | 35,815 | |
| U.S. Treasury 2.25% 2/15/20529 | | | 220,000 | | | | 148,257 | |
| U.S. Treasury 2.875% 5/15/2052 | | | 2,249 | | | | 1,753 | |
| U.S. Treasury 3.00% 8/15/20529 | | | 200,000 | | | | 160,787 | |
| | | | | | | | 5,695,970 | |
| | | | | | | | | |
| U.S. Treasury inflation-protected securities 2.97% | | | | | | | | |
| U.S. Treasury Inflation-Protected Security 0.125% 1/15/202310 | | | 275,640 | | | | 275,023 | |
| U.S. Treasury Inflation-Protected Security 0.625% 4/15/202310 | | | 319,953 | | | | 317,904 | |
| U.S. Treasury Inflation-Protected Security 0.375% 7/15/202310 | | | 239,587 | | | | 237,632 | |
| U.S. Treasury Inflation-Protected Security 0.625% 1/15/202410 | | | 306,081 | | | | 301,297 | |
| U.S. Treasury Inflation-Protected Security 0.50% 4/15/202410 | | | 149,188 | | | | 146,156 | |
| U.S. Treasury Inflation-Protected Security 0.125% 7/15/202410 | | | 602,434 | | | | 587,393 | |
| U.S. Treasury Inflation-Protected Security 0.125% 10/15/202410 | | | 247,702 | | | | 240,540 | |
| U.S. Treasury Inflation-Protected Security 0.25% 1/15/202510 | | | 52,589 | | | | 50,816 | |
| U.S. Treasury Inflation-Protected Security 0.125% 4/15/202610 | | | 225,759 | | | | 213,189 | |
| U.S. Treasury Inflation-Protected Security 0.50% 1/15/202810 | | | 150,089 | | | | 141,442 | |
| U.S. Treasury Inflation-Protected Security 0.125% 1/15/203110 | | | 199,106 | | | | 176,542 | |
| U.S. Treasury Inflation-Protected Security 2.125% 2/15/204110 | | | 1,001 | | | | 1,051 | |
| U.S. Treasury Inflation-Protected Security 1.00% 2/15/20499,10 | | | 158,542 | | | | 131,682 | |
| U.S. Treasury Inflation-Protected Security 0.25% 2/15/205010 | | | 3,341 | | | | 2,244 | |
| U.S. Treasury Inflation-Protected Security 0.125% 2/15/205110 | | | 59,496 | | | | 38,372 | |
| | | | | | | | 2,861,283 | |
| | | | | | | | | |
| Total U.S. Treasury bonds & notes | | | | | | | 8,557,253 | |
| | | | | | | | | |
| Mortgage-backed obligations 7.15% | | | | | | | | |
| Federal agency mortgage-backed obligations 6.41% | | | | | | | | |
| BX Trust, Series 2021-ACNT, Class D, (1-month USD-LIBOR + 1.85%) 5.262% 11/15/20381,8,11 | | | 1,121 | | | | 1,056 | |
| Fannie Mae Pool #930337 6.00% 1/1/202411 | | | 1 | | | | 1 | |
| Fannie Mae Pool #AA8755 4.50% 7/1/202411 | | | 569 | | | | 565 | |
| Fannie Mae Pool #AA8211 4.50% 8/1/202411 | | | 84 | | | | 83 | |
| Fannie Mae Pool #AX9959 3.50% 12/1/202911 | | | 219 | | | | 209 | |
| Fannie Mae Pool #BA2999 3.50% 11/1/203011 | | | 247 | | | | 237 | |
| Fannie Mae Pool #683351 5.50% 2/1/203311 | | | 82 | | | | 83 | |
| Fannie Mae Pool #CA1299 3.50% 3/1/203311 | | | 101 | | | | 97 | |
| Fannie Mae Pool #MA3438 3.50% 8/1/203311 | | | 275 | | | | 261 | |
| Fannie Mae Pool #MA3658 3.50% 5/1/203411 | | | 381 | | | | 361 | |
| Fannie Mae Pool #CA4490 3.50% 8/1/203411 | | | 532 | | | | 504 | |
| Fannie Mae Pool #887695 6.00% 6/1/203611 | | | 1,122 | | | | 1,161 | |
| Fannie Mae Pool #894308 6.00% 10/1/203611 | | | 168 | | | | 170 | |
| Fannie Mae Pool #902164 6.00% 11/1/203611 | | | 1,016 | | | | 1,049 | |
| Fannie Mae Pool #902503 6.00% 11/1/203611 | | | 808 | | | | 837 | |
| Fannie Mae Pool #903076 6.00% 12/1/203611 | | | 1,405 | | | | 1,456 | |
| Fannie Mae Pool #AD0249 5.50% 4/1/203711 | | | 110 | | | | 112 | |
| Fannie Mae Pool #AS9772 3.50% 6/1/203711 | | | 35 | | | | 33 | |
| Fannie Mae Pool #966172 7.00% 7/1/203711 | | | 131 | | | | 132 | |
| Fannie Mae Pool #256845 6.50% 8/1/203711 | | | 69 | | | | 72 | |
| Fannie Mae Pool #256960 6.50% 11/1/203711 | | | 381 | | | | 402 | |
| Fannie Mae Pool #257137 7.00% 3/1/203811 | | | 23 | | | | 25 | |
| Fannie Mae Pool #963269 5.50% 5/1/203811 | | | 1,190 | | | | 1,222 | |
| Fannie Mae Pool #963341 5.50% 5/1/203811 | | | 272 | | | | 279 | |
| Fannie Mae Pool #963454 5.50% 6/1/203811 | | | 989 | | | | 1,015 | |
| Fannie Mae Pool #963796 5.50% 6/1/203811 | | | 333 | | | | 339 | |
| Fannie Mae Pool #929964 6.00% 9/1/203811 | | | 506 | | | | 523 | |
| Fannie Mae Pool #970772 5.50% 11/1/203811 | | | 48 | | | | 48 | |
| Fannie Mae Pool #AE0392 5.50% 12/1/203911 | | | 66 | | | | 67 | |
| Fannie Mae Pool #AL0152 6.00% 6/1/204011 | | | 3,625 | | | | 3,736 | |
| Fannie Mae Pool #AE8073 4.00% 12/1/204011 | | | 213 | | | | 200 | |
| Bonds, notes & other debt instruments (continued) | | Principal amount
(000) | | | Value
(000) | |
| Mortgage-backed obligations (continued) | | | | | | | | |
| Federal agency mortgage-backed obligations (continued) | | | | | | | | |
| Fannie Mae Pool #AL1571 5.00% 6/1/204111 | | USD | 3,124 | | | $ | 3,130 | |
| Fannie Mae Pool #AL0913 6.00% 7/1/204111 | | | 2,563 | | | | 2,648 | |
| Fannie Mae Pool #AJ0257 4.00% 9/1/204111 | | | 76 | | | | 71 | |
| Fannie Mae Pool #AJ4154 4.00% 11/1/204111 | | | 210 | | | | 198 | |
| Fannie Mae Pool #AB4050 4.00% 12/1/204111 | | | 410 | | | | 385 | |
| Fannie Mae Pool #AJ4189 4.00% 12/1/204111 | | | 238 | | | | 224 | |
| Fannie Mae Pool #AJ9165 4.00% 1/1/204211 | | | 5,565 | | | | 5,228 | |
| Fannie Mae Pool #890407 4.00% 2/1/204211 | | | 557 | | | | 523 | |
| Fannie Mae Pool #AL2745 4.00% 3/1/204211 | | | 1,689 | | | | 1,586 | |
| Fannie Mae Pool #AO6721 4.00% 6/1/204211 | | | 10,749 | | | | 10,097 | |
| Fannie Mae Pool #AO1820 4.00% 6/1/204211 | | | 903 | | | | 848 | |
| Fannie Mae Pool #890445 4.00% 7/1/204211 | | | 1,271 | | | | 1,194 | |
| Fannie Mae Pool #AS0831 4.50% 10/1/204311 | | | 585 | | | | 558 | |
| Fannie Mae Pool #AW4156 4.00% 5/1/204411 | | | 2,159 | | | | 2,023 | |
| Fannie Mae Pool #AW4026 4.00% 6/1/204411 | | | 2,645 | | | | 2,478 | |
| Fannie Mae Pool #AX2782 4.00% 9/1/204411 | | | 2,704 | | | | 2,530 | |
| Fannie Mae Pool #AY1313 4.00% 3/1/204511 | | | 5,096 | | | | 4,748 | |
| Fannie Mae Pool #AS6840 4.00% 3/1/204611 | | | 6,107 | | | | 5,721 | |
| Fannie Mae Pool #AL8522 3.50% 5/1/204611 | | | 944 | | | | 850 | |
| Fannie Mae Pool #BC8719 4.00% 6/1/204611 | | | 2,458 | | | | 2,301 | |
| Fannie Mae Pool #BC8720 4.00% 6/1/204611 | | | 1,779 | | | | 1,666 | |
| Fannie Mae Pool #AS7598 4.00% 7/1/204611 | | | 5,672 | | | | 5,309 | |
| Fannie Mae Pool #BD1967 4.00% 7/1/204611 | | | 1,808 | | | | 1,691 | |
| Fannie Mae Pool #BD5477 4.00% 7/1/204611 | | | 38 | | | | 36 | |
| Fannie Mae Pool #MA2691 4.50% 7/1/204611 | | | 1,084 | | | | 1,041 | |
| Fannie Mae Pool #AS7759 4.00% 8/1/204611 | | | 13,369 | | | | 12,516 | |
| Fannie Mae Pool #AS7760 4.00% 8/1/204611 | | | 5,784 | | | | 5,414 | |
| Fannie Mae Pool #AS7939 4.00% 9/1/204611 | | | 9,136 | | | | 8,552 | |
| Fannie Mae Pool #AL9190 4.00% 9/1/204611 | | | 1,497 | | | | 1,401 | |
| Fannie Mae Pool #BC4712 4.00% 10/1/204611 | | | 5,044 | | | | 4,697 | |
| Fannie Mae Pool #BC4801 4.00% 11/1/204611 | | | 3,401 | | | | 3,166 | |
| Fannie Mae Pool #MA2907 4.00% 2/1/204711 | | | 28 | | | | 27 | |
| Fannie Mae Pool #AS9313 4.00% 3/1/204711 | | | 4,688 | | | | 4,388 | |
| Fannie Mae Pool #BE3229 4.00% 3/1/204711 | | | 1,718 | | | | 1,599 | |
| Fannie Mae Pool #BD7165 4.00% 4/1/204711 | | | 28 | | | | 26 | |
| Fannie Mae Pool #AS9454 4.00% 4/1/204711 | | | 18 | | | | 17 | |
| Fannie Mae Pool #BM4187 4.50% 5/1/204711 | | | 16,386 | | | | 15,873 | |
| Fannie Mae Pool #BH2491 4.00% 6/1/204711 | | | 2,532 | | | | 2,367 | |
| Fannie Mae Pool #MA3058 4.00% 7/1/204711 | | | 3,044 | | | | 2,840 | |
| Fannie Mae Pool #CA0243 4.50% 8/1/204711 | | | 15,382 | | | | 14,714 | |
| Fannie Mae Pool #BJ1668 4.00% 12/1/204711 | | | 2,933 | | | | 2,744 | |
| Fannie Mae Pool #MA3211 4.00% 12/1/204711 | | | 555 | | | | 517 | |
| Fannie Mae Pool #BJ2751 4.50% 5/1/204811 | | | 7,997 | | | | 7,644 | |
| Fannie Mae Pool #CA2033 4.00% 7/1/204811 | | | 10,346 | | | | 9,584 | |
| Fannie Mae Pool #CA2157 4.00% 8/1/204811 | | | 21,531 | | | | 19,945 | |
| Fannie Mae Pool #BF0320 5.50% 1/1/204911 | | | 13,514 | | | | 13,954 | |
| Fannie Mae Pool #BF0572 5.50% 4/1/204911 | | | 29,819 | | | | 29,686 | |
| Fannie Mae Pool #FM2675 4.00% 6/1/204911 | | | 6,322 | | | | 5,862 | |
| Fannie Mae Pool #FM1262 4.00% 7/1/204911 | | | 18,165 | | | | 16,827 | |
| Fannie Mae Pool #BO2264 3.00% 10/1/204911 | | | 11,069 | | | | 9,493 | |
| Fannie Mae Pool #CA4819 4.00% 12/1/204911 | | | 9,057 | | | | 8,343 | |
| Fannie Mae Pool #BO6274 3.00% 1/1/205011 | | | 16,925 | | | | 14,522 | |
| Fannie Mae Pool #FM2872 3.00% 2/1/205011 | | | 38,978 | | | | 33,429 | |
| Fannie Mae Pool #CA5216 3.00% 2/1/205011 | | | 16,680 | | | | 14,363 | |
| Fannie Mae Pool #CA5226 3.00% 2/1/205011 | | | 7,089 | | | | 6,105 | |
| Fannie Mae Pool #FM2676 4.00% 3/1/205011 | | | 5,885 | | | | 5,415 | |
| Fannie Mae Pool #CA6309 3.00% 7/1/205011 | | | 34,692 | | | | 30,194 | |
| Fannie Mae Pool #FM4897 3.00% 11/1/205011 | | | 6,823 | | | | 5,929 | |
| Fannie Mae Pool #CA8046 3.00% 12/1/205011 | | | 27,283 | | | | 23,628 | |
| Fannie Mae Pool #FM9632 3.00% 11/1/205111 | | | 45,436 | | | | 38,945 | |
| Fannie Mae Pool #FM9631 3.00% 11/1/205111 | | | 19,253 | | | | 16,492 | |
| Fannie Mae Pool #CB2414 3.00% 12/1/205111 | | | 22,258 | | | | 19,172 | |
| Fannie Mae Pool #FS0972 3.50% 1/1/205211 | | | 23,335 | | | | 20,795 | |
| Fannie Mae Pool #FS0647 3.00% 2/1/205211 | | | 14,733 | | | | 12,744 | |
| Fannie Mae Pool #BF0142 5.50% 8/1/205611 | | | 38,808 | | | | 39,601 | |
| Fannie Mae Pool #BF0145 3.50% 3/1/205711 | | | 32,100 | | | | 28,681 | |
| Fannie Mae Pool #BF0339 5.00% 1/1/205911 | | | 36,985 | | | | 37,297 | |
| Bonds, notes & other debt instruments (continued) | | Principal amount
(000) | | | Value
(000) | |
| Mortgage-backed obligations (continued) | | | | | | | | |
| Federal agency mortgage-backed obligations (continued) | | | | | | | | |
| Fannie Mae Pool #BF0342 5.50% 1/1/205911 | | USD | 26,412 | | | $ | 26,755 | |
| Fannie Mae Pool #BF0379 3.50% 4/1/205911 | | | 78,726 | | | | 70,340 | |
| Fannie Mae Pool #BF0497 3.00% 7/1/206011 | | | 27,354 | | | | 23,225 | |
| Fannie Mae Pool #BF0548 3.00% 7/1/206111 | | | 21,243 | | | | 17,969 | |
| Fannie Mae, Series 2001-25, Class ZA, 6.50% 6/25/203111 | | | 190 | | | | 192 | |
| Fannie Mae, Series 2006-65, Class PF, (1-month USD-LIBOR + 0.28%) 3.866% 7/25/20368,11 | | | 572 | | | | 562 | |
| Fannie Mae, Series 2001-50, Class BA, 7.00% 10/25/204111 | | | 28 | | | | 29 | |
| Fannie Mae, Series 2002-W3, Class A5, 7.50% 11/25/204111 | | | 39 | | | | 42 | |
| Fannie Mae, Series 2017-M7, Class A2, Multi Family, 2.961% 2/25/20278,11 | | | 2,640 | | | | 2,462 | |
| Fannie Mae, Series 2006-51, Class PO, principal only, 0% 3/25/203611 | | | 301 | | | | 270 | |
| Fannie Mae, Series 2006-32, Class OA, principal only, 0% 5/25/203611 | | | 585 | | | | 476 | |
| Fannie Mae, Series 2006-56, Class OG, principal only, 0% 7/25/203611 | | | 74 | | | | 61 | |
| Fannie Mae, Series 2006-96, Class OP, principal only, 0% 10/25/203611 | | | 133 | | | | 113 | |
| Freddie Mac Pool #G13173 5.50% 5/1/202311 | | | 4 | | | | 4 | |
| Freddie Mac Pool #ZK3460 3.50% 8/1/202611 | | | 26 | | | | 25 | |
| Freddie Mac Pool #RD5008 3.50% 9/1/202911 | | | 171 | | | | 162 | |
| Freddie Mac Pool #ZS7148 3.50% 4/1/203011 | | | 9 | | | | 9 | |
| Freddie Mac Pool #V62089 3.50% 6/1/203311 | | | 285 | | | | 270 | |
| Freddie Mac Pool #ZS8716 3.50% 9/1/203311 | | | 230 | | | | 217 | |
| Freddie Mac Pool #G18723 3.50% 2/1/203411 | | | 3,715 | | | | 3,520 | |
| Freddie Mac Pool #ZT1799 3.50% 3/1/203411 | | | 535 | | | | 506 | |
| Freddie Mac Pool #QN3000 1.50% 8/1/203511 | | | 210 | | | | 179 | |
| Freddie Mac Pool #ZA2505 3.50% 5/1/203811 | | | 315 | | | | 286 | |
| Freddie Mac Pool #A76884 5.00% 5/1/203811 | | | 249 | | | | 242 | |
| Freddie Mac Pool #G04697 5.50% 9/1/203811 | | | 880 | | | | 904 | |
| Freddie Mac Pool #A87873 5.00% 8/1/203911 | | | 3,329 | | | | 3,316 | |
| Freddie Mac Pool #G06789 6.00% 5/1/204011 | | | 38 | | | | 39 | |
| Freddie Mac Pool #G06061 4.00% 10/1/204011 | | | 537 | | | | 505 | |
| Freddie Mac Pool #Q00232 4.50% 4/1/204111 | | | 4,892 | | | | 4,745 | |
| Freddie Mac Pool #Q00850 4.50% 5/1/204111 | | | 160 | | | | 155 | |
| Freddie Mac Pool #G06841 5.50% 6/1/204111 | | | 1,730 | | | | 1,778 | |
| Freddie Mac Pool #G08456 5.00% 7/1/204111 | | | 99 | | | | 96 | |
| Freddie Mac Pool #G60546 4.00% 12/1/204211 | | | 4,054 | | | | 3,814 | |
| Freddie Mac Pool #Q21442 4.50% 8/1/204311 | | | 315 | | | | 300 | |
| Freddie Mac Pool #760014 2.745% 8/1/20458,11 | | | 589 | | | | 571 | |
| Freddie Mac Pool #G60138 3.50% 8/1/204511 | | | 15,667 | | | | 14,159 | |
| Freddie Mac Pool #G60279 4.00% 10/1/204511 | | | 4,404 | | | | 4,134 | |
| Freddie Mac Pool #Q41088 4.00% 6/1/204611 | | | 10,400 | | | | 9,696 | |
| Freddie Mac Pool #Q41905 4.00% 7/1/204611 | | | 3,872 | | | | 3,609 | |
| Freddie Mac Pool #Q42626 4.00% 8/1/204611 | | | 3,896 | | | | 3,633 | |
| Freddie Mac Pool #T65389 3.50% 9/1/204611 | | | 58 | | | | 51 | |
| Freddie Mac Pool #Q44227 4.00% 9/1/204611 | | | 944 | | | | 885 | |
| Freddie Mac Pool #Q49716 4.50% 8/1/204711 | | | 350 | | | | 332 | |
| Freddie Mac Pool #ZS4735 3.50% 9/1/204711 | | | 2,866 | | | | 2,577 | |
| Freddie Mac Pool #K39018 6.50% 10/1/204711 | | | 49 | | | | 49 | |
| Freddie Mac Pool #G08793 4.00% 12/1/204711 | | | 17,669 | | | | 16,429 | |
| Freddie Mac Pool #Q52596 4.50% 12/1/204711 | | | 371 | | | | 356 | |
| Freddie Mac Pool #SI2002 4.00% 3/1/204811 | | | 900 | | | | 836 | |
| Freddie Mac Pool #Q55986 4.50% 5/1/204811 | | | 7,897 | | | | 7,532 | |
| Freddie Mac Pool #ZT1704 4.50% 1/1/204911 | | | 156,223 | | | | 149,717 | |
| Freddie Mac Pool #SD0214 3.00% 11/1/204911 | | | 40,605 | | | | 34,818 | |
| Freddie Mac Pool #QA5741 3.00% 12/1/204911 | | | 4,557 | | | | 3,916 | |
| Freddie Mac Pool #QA5125 3.50% 12/1/204911 | | | 1,445 | | | | 1,294 | |
| Freddie Mac Pool #SD7551 3.00% 1/1/205211 | | | 75,421 | | | | 64,614 | |
| Freddie Mac Pool #RA7556 4.50% 6/1/205211 | | | 83,287 | | | | 78,378 | |
| Freddie Mac Pool #SD1584 4.50% 9/1/205211 | | | 18,699 | | | | 17,777 | |
| Freddie Mac Pool #RA7938 5.00% 9/1/205211 | | | 3,461 | | | | 3,347 | |
| Freddie Mac, Series 2122, Class QM, 6.25% 2/15/202911 | | | 503 | | | | 507 | |
| Freddie Mac, Series KS01, Class A2, Multi Family, 2.522% 1/25/202311 | | | 303 | | | | 302 | |
| Freddie Mac, Series K030, Class A2, Multi Family, 3.25% 4/25/202311 | | | 8,427 | | | | 8,374 | |
| Freddie Mac, Series K036, Class A2, Multi Family, 3.527% 10/25/202311 | | | 10,000 | | | | 9,853 | |
| Freddie Mac, Series K050, Class A2, Multi Family, 3.334% 8/25/202511 | | | 11,250 | | | | 10,795 | |
| Freddie Mac, Series K055, Class A2, Multi Family, 2.673% 3/25/202611 | | | 3,500 | | | | 3,266 | |
| Freddie Mac, Series K064, Class A2, Multi Family, 3.224% 3/25/20278,11 | | | 4,390 | | | | 4,121 | |
| Freddie Mac, Series K066, Class A2, Multi Family, 3.117% 6/25/202711 | | | 4,360 | | | | 4,064 | |
| Freddie Mac, Series K067, Class A2, Multi Family, 3.194% 7/25/202711 | | | 4,810 | | | | 4,489 | |
| Bonds, notes & other debt instruments (continued) | | Principal amount
(000) | | | Value
(000) | |
| Mortgage-backed obligations (continued) | | | | | | | | |
| Federal agency mortgage-backed obligations (continued) | | | | | | | | |
| Freddie Mac, Series K068, Class A2, Multi Family, 3.244% 8/25/202711 | | USD | 2,350 | | | $ | 2,196 | |
| Freddie Mac, Series K069, Class A2, Multi Family, 3.187% 9/25/20278,11 | | | 8,906 | | | | 8,295 | |
| Freddie Mac, Series 3135, Class OP, principal only, 0% 4/15/202611 | | | 102 | | | | 95 | |
| Freddie Mac, Series 3117, Class OG, principal only, 0% 2/15/203611 | | | 71 | | | | 60 | |
| Freddie Mac, Series 3136, Class OP, principal only, 0% 4/15/203611 | | | 715 | | | | 602 | |
| Freddie Mac, Series 3147, Class OD, principal only, 0% 4/15/203611 | | | 269 | | | | 228 | |
| Freddie Mac, Series 3155, Class FO, principal only, 0% 5/15/203611 | | | 482 | | | | 406 | |
| Freddie Mac, Series 3149, Class MO, principal only, 0% 5/15/203611 | | | 137 | | | | 116 | |
| Freddie Mac, Series 3149, Class AO, principal only, 0% 5/15/203611 | | | 117 | | | | 100 | |
| Freddie Mac Seasoned Credit Risk Transfer Trust, Series 2017-3, Class MT, 3.00% 7/25/205611 | | | 8,686 | | | | 7,615 | |
| Freddie Mac Seasoned Credit Risk Transfer Trust, Series 2017-3, Class HT, 3.25% 7/25/205611 | | | 1,750 | | | | 1,561 | |
| Freddie Mac Seasoned Credit Risk Transfer Trust, Series 2017-2, Class MA, 3.00% 8/25/205611 | | | 9,088 | | | | 8,470 | |
| Freddie Mac Seasoned Credit Risk Transfer Trust, Series 2017-2, Class HA, 3.00% 8/25/20568,11 | | | 8,984 | | | | 8,385 | |
| Freddie Mac Seasoned Credit Risk Transfer Trust, Series 2018-1, Class HT, 3.00% 5/25/205711 | | | 9,323 | | | | 8,101 | |
| Freddie Mac Seasoned Credit Risk Transfer Trust, Series 2017-4, Class HT, 3.25% 6/25/20578,11 | | | 13,988 | | | | 12,632 | |
| Freddie Mac Seasoned Credit Risk Transfer Trust, Series 2017-4, Class MT, 3.50% 6/25/205711 | | | 7,871 | | | | 7,090 | |
| Freddie Mac Seasoned Credit Risk Transfer Trust, Series 2017-4, Class M45T, 4.50% 6/25/205711 | | | 14,615 | | | | 14,153 | |
| Freddie Mac Seasoned Credit Risk Transfer Trust, Series 2018-3, Class MA, 3.50% 8/25/205711 | | | 13,397 | | | | 12,722 | |
| Freddie Mac Seasoned Credit Risk Transfer Trust, Series 2018-2, Class MT, 3.50% 11/25/205711 | | | 9,780 | | | | 8,780 | |
| Freddie Mac Seasoned Credit Risk Transfer Trust, Series 2019-1, Class MT, 3.50% 7/25/205811 | | | 4,585 | | | | 4,112 | |
| Freddie Mac Seasoned Credit Risk Transfer Trust, Series 2019-1, Class MA, 3.50% 7/25/205811 | | | 1,472 | | | | 1,395 | |
| Freddie Mac Seasoned Credit Risk Transfer Trust, Series 2019-2, Class MT, 3.50% 8/26/205811 | | | 3,854 | | | | 3,458 | |
| Freddie Mac Seasoned Credit Risk Transfer Trust, Series 2019-3, Class MT, 3.50% 10/25/205811 | | | 2,387 | | | | 2,144 | |
| Freddie Mac Seasoned Credit Risk Transfer Trust, Series 2019-4, Class MA, 3.00% 2/25/205911 | | | 31,780 | | | | 29,479 | |
| Freddie Mac Seasoned Loan Structured Transaction Trust, Series 2018-1, Class A1, 3.50% 6/25/202811 | | | 702 | | | | 666 | |
| Freddie Mac Seasoned Loan Structured Transaction Trust, Series 2019-3, Class A1C, 2.75% 11/25/202911 | | | 40,722 | | | | 37,096 | |
| Government National Mortgage Assn. 4.00% 11/1/205211,12 | | | 582,342 | | | | 536,747 | |
| Government National Mortgage Assn. 4.50% 11/1/205211,12 | | | 154,223 | | | | 146,198 | |
| Government National Mortgage Assn. 5.00% 11/1/205211,12 | | | 740,308 | | | | 720,325 | |
| Government National Mortgage Assn. 5.50% 11/1/205211,12 | | | 89,955 | | | | 89,526 | |
| Government National Mortgage Assn. Pool #736682 4.50% 12/15/203711 | | | 645 | | | | 625 | |
| Government National Mortgage Assn. Pool #738938 6.50% 2/20/203911 | | | 84 | | | | 86 | |
| Government National Mortgage Assn. Pool #783690 6.00% 9/20/203911 | | | 840 | | | | 884 | |
| Government National Mortgage Assn. Pool #783689 5.50% 2/20/204011 | | | 1,162 | | | | 1,222 | |
| Government National Mortgage Assn. Pool #783539 5.00% 10/20/204011 | | | 935 | | | | 916 | |
| Government National Mortgage Assn. Pool #751708 3.50% 12/15/204011 | | | 78 | | | | 71 | |
| Government National Mortgage Assn. Pool #783688 5.00% 6/20/204111 | | | 1,071 | | | | 1,081 | |
| Government National Mortgage Assn. Pool #005198 6.50% 9/20/204111 | | | 356 | | | | 370 | |
| Government National Mortgage Assn. Pool #783687 4.50% 12/20/204111 | | | 1,056 | | | | 1,019 | |
| Government National Mortgage Assn. Pool #MA2894 4.50% 6/20/204511 | | | 1,151 | | | | 1,124 | |
| Government National Mortgage Assn. Pool #MA3246 4.50% 11/20/204511 | | | 1,519 | | | | 1,492 | |
| Government National Mortgage Assn. Pool #MA5077 3.50% 3/20/204811 | | | 4,476 | | | | 4,072 | |
| Government National Mortgage Assn. Pool #MA5468 5.00% 9/20/204811 | | | 442 | | | | 434 | |
| Government National Mortgage Assn. Pool #MA5530 5.00% 10/20/204811 | | | 105 | | | | 103 | |
| Government National Mortgage Assn. Pool #MA5652 4.50% 12/20/204811 | | | 592 | | | | 570 | |
| Government National Mortgage Assn. Pool #MA5711 4.50% 1/20/204911 | | | 982 | | | | 944 | |
| Government National Mortgage Assn. Pool #MA5712 5.00% 1/20/204911 | | | 1,236 | | | | 1,213 | |
| Government National Mortgage Assn. Pool #MA5764 4.50% 2/20/204911 | | | 2,130 | | | | 2,053 | |
| Government National Mortgage Assn. Pool #MA5878 5.00% 4/20/204911 | | | 12,530 | | | | 12,286 | |
| Government National Mortgage Assn. Pool #MA6042 5.00% 7/20/204911 | | | 7,793 | | | | 7,710 | |
| Bonds, notes & other debt instruments (continued) | | Principal amount
(000) | | | Value
(000) | |
| Mortgage-backed obligations (continued) | | | | | | | | |
| Federal agency mortgage-backed obligations (continued) | | | | | | | | |
| Government National Mortgage Assn. Pool #773426 4.70% 9/20/206111 | | USD | 9 | | | $ | 9 | |
| Government National Mortgage Assn. Pool #795485 4.677% 7/20/206211 | | | 16 | | | | 16 | |
| Government National Mortgage Assn. Pool #AG8088 4.95% 3/20/206411 | | | 2 | | | | 2 | |
| Government National Mortgage Assn. Pool #AG8117 4.886% 4/20/206411 | | | 2 | | | | 2 | |
| Government National Mortgage Assn. Pool #AG8193 4.947% 9/20/206411 | | | 2 | | | | 2 | |
| Government National Mortgage Assn. Pool #AG8207 4.946% 11/20/206411 | | | 2 | | | | 2 | |
| Government National Mortgage Assn. Pool #AG8244 4.945% 1/20/206511 | | | 2 | | | | 2 | |
| Government National Mortgage Assn., Series 2005-7, Class AO, principal only, 0% 2/16/203511 | | | 496 | | | | 421 | |
| Government National Mortgage Assn., Series 2007-8, Class LO, principal only, 0% 3/20/203711 | | | 394 | | | | 316 | |
| Uniform Mortgage-Backed Security 2.50% 11/1/203711,12 | | | 50,000 | | | | 45,059 | |
| Uniform Mortgage-Backed Security 2.50% 12/1/203711,12 | | | 100,000 | | | | 89,992 | |
| Uniform Mortgage-Backed Security 3.00% 11/1/205211,12 | | | 10,770 | | | | 9,157 | |
| Uniform Mortgage-Backed Security 4.00% 11/1/205211,12 | | | 42,182 | | | | 38,352 | |
| Uniform Mortgage-Backed Security 4.50% 11/1/205211,12 | | | 170,910 | | | | 160,362 | |
| Uniform Mortgage-Backed Security 5.00% 11/1/205211,12 | | | 308,088 | | | | 297,172 | |
| Uniform Mortgage-Backed Security 5.50% 11/1/205211,12 | | | 900 | | | | 888 | |
| Uniform Mortgage-Backed Security 6.00% 11/1/205211,12 | | | 864 | | | | 868 | |
| Uniform Mortgage-Backed Security 3.00% 12/1/205211,12 | | | 256,650 | | | | 218,192 | |
| Uniform Mortgage-Backed Security 4.00% 12/1/205211,12 | | | 4,004 | | | | 3,639 | |
| Uniform Mortgage-Backed Security 4.50% 12/1/205211,12 | | | 784,836 | | | | 735,845 | |
| Uniform Mortgage-Backed Security 5.00% 12/1/205211,12 | | | 500,000 | | | | 481,797 | |
| Uniform Mortgage-Backed Security 5.50% 12/1/205211,12 | | | 1,136,525 | | | | 1,119,160 | |
| Uniform Mortgage-Backed Security 6.00% 12/1/205211,12 | | | 25,756 | | | | 25,791 | |
| | | | | | | | 6,189,050 | |
| | | | | | | | | |
| Collateralized mortgage-backed obligations (privately originated) 0.37% | | | | | | | | |
| Arroyo Mortgage Trust, Series 2021-1R, Class A1, 1.175% 10/25/20481,8,11 | | | 14,702 | | | | 12,525 | |
| Bear Stearns ARM Trust, Series 2003-8, Class IIIA, 2.795% 1/25/20348,11 | | | 305 | | | | 239 | |
| BRAVO Residential Funding Trust, Series 2022-R1, Class A, 3.125% 1/29/2070 (6.125% on 1/29/2025)1,11,13 | | | 3,150 | | | | 2,750 | |
| Cascade Funding Mortgage Trust, Series 2020-HB4, Class A, 0.946% 12/26/20301,8,11 | | | 5,836 | | | | 5,651 | |
| Cascade Funding Mortgage Trust, Series 2021-HB7, Class A, 1.151% 10/27/20311,8,11 | | | 14,286 | | | | 13,394 | |
| Cascade Funding Mortgage Trust, Series 2021-HB7, Class M1, 2.125% 10/27/20311,8,11 | | | 1,296 | | | | 1,183 | |
| Cascade Funding Mortgage Trust, Series 2021-HB6, Class A, 0.898% 6/25/20361,8,11 | | | 10,909 | | | | 10,324 | |
| CIM Trust, Series 2022-R2, Class A1, 3.75% 12/25/20611,8,11 | | | 17,648 | | | | 16,509 | |
| CS First Boston Mortgage Securities Corp., Series 2002-30, Class IA1, 7.50% 11/25/203211 | | | 116 | | | | 113 | |
| CS First Boston Mortgage Securities Corp., Series 2002-34, Class IA1, 7.50% 12/25/203211 | | | 78 | | | | 78 | |
| CS First Boston Mortgage Securities Corp., Series 2003-21, Class VA1, 6.50% 7/25/203311 | | | 95 | | | | 88 | |
| Finance of America Structured Securities Trust, Series 2019-JR1, Class A, 2.00% 3/25/20691,11 | | | 8,250 | | | | 8,732 | |
| Flagstar Mortgage Trust, Series 2021-10INV, Class A3, 2.50% 10/25/20511,8,11 | | | 26,847 | | | | 20,764 | |
| Freddie Mac Structured Agency Credit Risk Debt Notes, Series 2021-DNA6, Class M2, (30-day Average USD-SOFR + 1.50%) 4.497% 10/25/20411,8,11 | | | 815 | | | | 750 | |
| Freddie Mac Structured Agency Credit Risk Debt Notes, Series 2022-DNA3, Class M1A, (30-day Average USD-SOFR + 2.00%) 4.997% 4/25/20421,8,11 | | | 8,041 | | | | 7,886 | |
| Freddie Mac Structured Agency Credit Risk Debt Notes, Series 2022-DNA6, Class M1A, (30-day Average USD-SOFR + 2.15%) 5.147% 9/25/20421,8,11 | | | 3,087 | | | | 3,061 | |
| Freddie Mac Structured Agency Credit Risk Debt Notes, Series 2022-DNA6, Class M1B, (30-day Average USD-SOFR + 3.70%) 6.697% 9/25/20421,8,11 | | | 5,838 | | | | 5,807 | |
| GS Mortgage-Backed Securities Trust, Series 2022-PJ5, Class A4, 2.50% 10/25/20521,8,11 | | | 62,494 | | | | 48,384 | |
| Home Partners of America Trust, Series 2022-1, Class A, 3.93% 4/17/20391,11 | | | 18,702 | | | | 17,417 | |
| Legacy Mortgage Asset Trust, Series 2022-GS1, Class A1, 4.00% 2/25/2061 (7.00% on 4/25/2025)1,11,13 | | | 18,711 | | | | 17,749 | |
| Legacy Mortgage Asset Trust, Series 2021-GS2, Class A1, 1.75% 4/25/20611,8,11 | | | 2,175 | | | | 2,021 | |
| Legacy Mortgage Asset Trust, Series 2021-GS5, Class A1, 2.25% 7/25/2067 (5.25% on 11/25/2024)1,11,13 | | | 8,933 | | | | 8,170 | |
| Mello Warehouse Securitization Trust, Series 2021-3, Class A, (1-month USD-LIBOR + 0.85%) 4.436% 11/25/20551,8,11 | | | 24,241 | | | | 23,395 | |
| Mill City Mortgage Trust, Series 2018-1, Class A1, 3.25% 5/25/20621,8,11 | | | 161 | | | | 155 | |
| NewRez Warehouse Securitization Trust, Series 2021-1, Class A, (1-month USD-LIBOR + 0.75%) 4.336% 5/25/20551,8,11 | | | 25,007 | | | | 24,526 | |
| Bonds, notes & other debt instruments (continued) | | Principal amount
(000) | | | Value
(000) | |
| Mortgage-backed obligations (continued) | | | | | | | | |
| Collateralized mortgage-backed obligations (privately originated) (continued) | | | | | |
| Onslow Bay Financial Mortgage Loan Trust, Series 2022-J1, Class A2, 2.50% 2/25/20521,8,11 | | USD | 11,202 | | | $ | 8,608 | |
| Reverse Mortgage Investment Trust, Series 2021-HB1, Class A, 1.259% 11/25/20311,8,11 | | | 7,154 | | | | 6,797 | |
| Towd Point Mortgage Trust, Series 2016-5, Class A1, 2.50% 10/25/20561,8,11 | | | 2,492 | | | | 2,458 | |
| Towd Point Mortgage Trust, Series 2017-5, Class A1, 4.186% 2/25/20571,8,11 | | | 688 | | | | 678 | |
| Towd Point Mortgage Trust, Series 2017-4, Class A1, 2.75% 6/25/20571,8,11 | | | 653 | | | | 620 | |
| Towd Point Mortgage Trust, Series 2017-3, Class A1, 2.75% 7/25/20571,8,11 | | | 346 | | | | 339 | |
| Towd Point Mortgage Trust, Series 2017-6, Class A1, 2.75% 10/25/20571,8,11 | | | 981 | | | | 937 | |
| Towd Point Mortgage Trust, Series 2018-2, Class A1, 3.25% 3/25/20581,8,11 | | | 1,270 | | | | 1,213 | |
| Towd Point Mortgage Trust, Series 2018-5, Class A1A, 3.25% 7/25/20581,8,11 | | | 314 | | | | 300 | |
| Towd Point Mortgage Trust, Series 2020-4, Class A1, 1.75% 10/25/20601,11 | | | 72,185 | | | | 64,214 | |
| Treehouse Park Improvement Association No.1 - Anleihen 9.75% 12/1/20331,4 | | | 6,473 | | | | 5,446 | |
| Tricon Residential Trust, Series 2021-SFR1, Class A, 1.943% 7/17/20381,11 | | | 19,525 | | | | 16,943 | |
| | | | | | | | 360,224 | |
| | | | | | | | | |
| Commercial mortgage-backed securities 0.37% | | | | | | | | |
| Barclays Commercial Mortgage Securities, LLC, Series 2017-DELC, Class A, 4.387% 8/15/20361,8,11 | | | 14,672 | | | | 14,319 | |
| Barclays Commercial Mortgage Securities, LLC, Series 2022-C17, Class A5, 4.441% 9/15/205511 | | | 8,633 | | | | 7,873 | |
| Boca Commercial Mortgage Trust, Series 2022-BOCA, Class A, (1-month USD CME Term SOFR + 1.7696%) 5.145% 5/15/20391,8,11 | | | 10,389 | | | | 10,135 | |
| BPR Trust, Series 2022-OANA, Class A, (1-month USD CME Term SOFR + 1.898%) 5.274% 4/15/20371,8,11 | | | 31,327 | | | | 30,430 | |
| BX Trust, Series 2022-CSMO, Class A, (1-month USD CME Term SOFR + 2.115%) 5.49% 6/15/20271,8,11 | | | 31,020 | | | | 30,668 | |
| BX Trust, Series 2021-VOLT, Class A, (1-month USD-LIBOR + 0.70%) 4.112% 9/15/20361,8,11 | | | 55,444 | | | | 52,763 | |
| BX Trust, Series 2021-ARIA, Class A, (1-month USD-LIBOR + 0.899%) 4.311% 10/15/20361,8,11 | | | 26,562 | | | | 24,957 | |
| BX Trust, Series 2021-ARIA, Class C, (1-month USD-LIBOR + 1.646%) 5.058% 10/15/20361,8,11 | | | 3,984 | | | | 3,685 | |
| BX Trust, Series 2021-ARIA, Class D, (1-month USD-LIBOR + 1.895%) 5.308% 10/15/20361,8,11 | | | 1,380 | | | | 1,253 | |
| BX Trust, Series 2022-IND, Class A, (1-month USD CME Term SOFR + 1.491%) 4.867% 4/15/20371,8,11 | | | 14,845 | | | | 14,335 | |
| BX Trust, Series 2021-SOAR, Class A, (1-month USD-LIBOR + 0.67%) 4.082% 6/15/20381,8,11 | | | 11,509 | | | | 10,938 | |
| BX Trust, Series 2021-SOAR, Class C, (1-month USD-LIBOR + 1.10%) 4.512% 6/15/20381,8,11 | | | 976 | | | | 914 | |
| BX Trust, Series 2021-SOAR, Class D, (1-month USD-LIBOR + 1.40%) 4.812% 6/15/20381,8,11 | | | 3,704 | | | | 3,463 | |
| BX Trust, Series 2021-ACNT, Class B, (1-month USD-LIBOR + 1.25%) 4.662% 11/15/20381,8,11 | | | 1,996 | | | | 1,883 | |
| BX Trust, Series 2021-ACNT, Class C, (1-month USD-LIBOR + 1.50%) 4.912% 11/15/20381,8,11 | | | 392 | | | | 368 | |
| BX Trust, Series 2022-PSB, Class A, (1-month USD CME Term SOFR + 2.451%) 5.827% 8/15/20391,8,11 | | | 9,619 | | | | 9,601 | |
| Extended Stay America Trust, Series 2021-ESH, Class A, (1-month USD-LIBOR + 1.08%) 4.493% 7/15/20381,8,11 | | | 10,246 | | | | 9,854 | |
| Extended Stay America Trust, Series 2021-ESH, Class C, (1-month USD-LIBOR + 1.70%) 5.113% 7/15/20381,8,11 | | | 1,172 | | | | 1,112 | |
| Extended Stay America Trust, Series 2021-ESH, Class D, (1-month USD-LIBOR + 2.25%) 5.663% 7/15/20381,8,11 | | | 1,228 | | | | 1,164 | |
| GS Mortgage Securities Trust, Series 2018-HULA, Class A, 4.332% 7/15/20251,8,11 | | | 13,722 | | | | 13,247 | |
| Hawaii Hotel Trust, Series 2019-MAUI, Class A, (1-month USD-LIBOR + 1.15%) 4.562% 5/17/20381,8,11 | | | 35,000 | | | | 33,750 | |
| JPMorgan Chase Commercial Mortgage Securities Trust, Series 2022-OPO, Class C, 3.377% 1/5/20391,11 | | | 1,301 | | | | 1,074 | |
| JPMorgan Chase Commercial Mortgage Securities Trust, Series 2022-OPO, Class C, 3.565% 1/5/20391,8,11 | | | 1,046 | | | | 837 | |
| La Quinta Mortgage Trust, Series 2022-LAQ, Class A, (1-month USD CME Term SOFR + 1.724%) 5.10% 3/15/20391,8,11 | | | 10,415 | | | | 10,051 | |
| LUXE Commercial Mortgage Trust, Series 2021-TRIP, Class A, (1-month USD-LIBOR + 1.05%) 4.462% 10/15/20381,8,11 | | | 17,861 | | | | 17,057 | |
| Morgan Stanley Bank of America Merrill Lynch Trust, Series 2013-C9, Class A4, 3.102% 5/15/204611 | | | 3,000 | | | | 2,961 | |
| Bonds, notes & other debt instruments (continued) | | Principal amount
(000) | | | Value
(000) | |
| Mortgage-backed obligations (continued) | | | | | | | | |
| Commercial mortgage-backed securities (continued) | | | | | | | | |
| Multi Family Connecticut Avenue Securities, Series 2019-1, Class M10, (1-month USD-LIBOR + 3.25%) 6.836% 10/15/20491,8,11 | | USD | 4,319 | | | $ | 3,994 | |
| SREIT Trust, Series 2021-MFP, Class A, (1-month USD-LIBOR + 0.731%) 4.143% 11/15/20381,8,11 | | | 36,060 | | | | 34,291 | |
| SREIT Trust, Series 2021-MFP, Class C, (1-month USD-LIBOR + 1.329%) 4.741% 11/15/20381,8,11 | | | 1,038 | | | | 976 | |
| WF-RBS Commercial Mortgage Trust, Series 2014-C19, Class A5, 4.101% 3/15/204711 | | | 4,000 | | | | 3,899 | |
| | | | | | | | 351,852 | |
| | | | | | | | | |
| Total mortgage-backed obligations | | | | | | | 6,901,126 | |
| | | | | | | | | |
| Corporate bonds, notes & loans 2.64% | | | | | | | | |
| Energy 0.46% | | | | | | | | |
| AI Candelaria (Spain), SLU 7.50% 12/15/20281 | | | 430 | | | | 363 | |
| AI Candelaria (Spain), SLU 5.75% 6/15/20331 | | | 1,495 | | | | 975 | |
| Apache Corp. 4.25% 1/15/2030 | | | 17,930 | | | | 15,992 | |
| Apache Corp. 5.35% 7/1/2049 | | | 1,250 | | | | 966 | |
| Baker Hughes Holdings LLC 2.061% 12/15/2026 | | | 802 | | | | 701 | |
| Bonanza Creek Energy, Inc. 5.00% 10/15/20261 | | | 3,070 | | | | 2,831 | |
| BP Capital Markets America, Inc. 2.721% 1/12/2032 | | | 3,000 | | | | 2,436 | |
| Canadian Natural Resources, Ltd. 2.95% 1/15/2023 | | | 2,390 | | | | 2,381 | |
| Canadian Natural Resources, Ltd. 3.80% 4/15/2024 | | | 1,975 | | | | 1,929 | |
| Canadian Natural Resources, Ltd. 3.85% 6/1/2027 | | | 1,000 | | | | 921 | |
| Canadian Natural Resources, Ltd. 2.95% 7/15/2030 | | | 3,873 | | | | 3,181 | |
| Cenovus Energy, Inc. 5.25% 6/15/2037 | | | 2,150 | | | | 1,871 | |
| Cenovus Energy, Inc. 5.40% 6/15/2047 | | | 5,935 | | | | 5,070 | |
| Cheniere Energy Partners, LP 4.50% 10/1/2029 | | | 4,000 | | | | 3,538 | |
| Chesapeake Energy Corp. 5.50% 2/1/20261 | | | 6,570 | | | | 6,378 | |
| Chesapeake Energy Corp. 5.875% 2/1/20291 | | | 920 | | | | 871 | |
| CNX Resources Corp. 7.25% 3/14/20271 | | | 1,000 | | | | 994 | |
| CNX Resources Corp. 7.375% 1/15/20311 | | | 411 | | | | 408 | |
| ConocoPhillips 3.80% 3/15/2052 | | | 1,000 | | | | 746 | |
| Constellation Oil Services Holding SA 4.00% PIK 12/31/202614 | | | 255 | | | | 198 | |
| Continental Resources, Inc. 2.875% 4/1/20321 | | | 2,296 | | | | 1,680 | |
| Continental Resources, Inc. 4.90% 6/1/2044 | | | 2,000 | | | | 1,422 | |
| CrownRock, L.P. 5.00% 5/1/20291 | | | 3,000 | | | | 2,730 | |
| DCP Midstream Operating, LP 5.625% 7/15/2027 | | | 6,000 | | | | 5,835 | |
| DCP Midstream Operating, LP 3.25% 2/15/2032 | | | 2,250 | | | | 1,794 | |
| Diamond Foreign Asset Co. / Diamond Finance, LLC 9.00% Cash 4/22/20271,8,14 | | | 443 | | | | 410 | |
| Diamond Foreign Asset Co. / Diamond Finance, LLC 9.00% Cash 4/22/202714 | | | 402 | | | | 372 | |
| Diamondback Energy, Inc. 4.25% 3/15/2052 | | | 2,101 | | | | 1,522 | |
| DT Midstream, Inc. 4.125% 6/15/20291 | | | 1,000 | | | | 867 | |
| DT Midstream, Inc. 4.375% 6/15/20311 | | | 2,915 | | | | 2,463 | |
| Enbridge Energy Partners, LP 7.375% 10/15/2045 | | | 5,459 | | | | 5,813 | |
| Enbridge, Inc. 3.40% 8/1/2051 | | | 718 | | | | 466 | |
| Endeavor Energy Resources, LP 5.75% 1/30/20281 | | | 2,000 | | | | 1,948 | |
| Energean Israel Finance, Ltd. 4.50% 3/30/20241 | | | 2,915 | | | | 2,792 | |
| Energean Israel Finance, Ltd. 5.875% 3/30/20311 | | | 1,060 | | | | 901 | |
| Energy Transfer Partners, LP 5.30% 4/15/2047 | | | 600 | | | | 472 | |
| Energy Transfer Partners, LP 6.00% 6/15/2048 | | | 700 | | | | 590 | |
| Energy Transfer Partners, LP 6.25% 4/15/2049 | | | 1,120 | | | | 979 | |
| Energy Transfer Partners, LP 6.25% junior subordinated perpetual bonds (3-month USD-LIBOR + 4.028% on 2/15/2023)13 | | | 5,000 | | | | 4,165 | |
| Energy Transfer Partners, LP 6.50% junior subordinated perpetual bonds (5-year UST Yield Curve Rate T Note Constant Maturity + 5.694% on 11/15/2026)13 | | | 791 | | | | 682 | |
| Energy Transfer Partners, LP 6.625% junior subordinated perpetual bonds (3-month USD-LIBOR + 4.155% on 2/15/2028)13 | | | 5,220 | | | | 3,758 | |
| Enterprise Products Operating, LLC 4.20% 1/31/2050 | | | 2,795 | | | | 2,060 | |
| Enterprise Products Operating, LLC 3.20% 2/15/2052 | | | 1,000 | | | | 619 | |
| EQM Midstream Partners, LP 6.00% 7/1/20251 | | | 2,500 | | | | 2,425 | |
| EQM Midstream Partners, LP 4.125% 12/1/2026 | | | 2,000 | | | | 1,770 | |
| EQM Midstream Partners, LP 7.50% 6/1/20271 | | | 650 | | | | 643 | |
| EQM Midstream Partners, LP 6.50% 7/1/20271 | | | 1,255 | | | | 1,227 | |
| EQM Midstream Partners, LP 4.50% 1/15/20291 | | | 2,290 | | | | 1,952 | |
| EQT Corp. 6.375% 2/1/202513 | | | 2,000 | | | | 2,007 | |
| EQT Corp. 3.90% 10/1/2027 | | | 4,020 | | | | 3,618 | |
| EQT Corp. 5.00% 1/15/2029 | | | 155 | | | | 144 | |
| EQT Corp. 7.25% 2/1/203013 | | | 15,000 | | | | 15,394 | |
| Bonds, notes & other debt instruments (continued) | | Principal amount
(000) | | | Value
(000) | |
| Corporate bonds, notes & loans (continued) | | | | | | | | |
| Energy (continued) | | | | | | | | |
| EQT Corp. 3.625% 5/15/20311 | | USD | 5,945 | | | $ | 4,953 | |
| Equinor ASA 3.625% 9/10/2028 | | | 13,165 | | | | 12,213 | |
| Equinor ASA 3.25% 11/18/2049 | | | 7,583 | | | | 5,251 | |
| Exxon Mobil Corp. 2.61% 10/15/2030 | | | 20,000 | | | | 16,925 | |
| Exxon Mobil Corp. 3.452% 4/15/2051 | | | 2,000 | | | | 1,433 | |
| Gray Oak Pipeline, LLC 2.60% 10/15/20251 | | | 1,952 | | | | 1,756 | |
| Guara Norte SARL 5.198% 6/15/20341 | | | 1,191 | | | | 936 | |
| Harbour Energy PLC 5.50% 10/15/20261 | | | 2,000 | | | | 1,805 | |
| Hess Midstream Operations, LP 5.50% 10/15/20301 | | | 310 | | | | 280 | |
| Hess Midstream Partners, LP 5.625% 2/15/20261 | | | 1,000 | | | | 982 | |
| Hilcorp Energy I, LP 6.25% 11/1/20281 | | | 1,000 | | | | 943 | |
| Hilcorp Energy I, LP 5.75% 2/1/20291 | | | 1,665 | | | | 1,527 | |
| Hilcorp Energy I, LP 6.00% 4/15/20301 | | | 1,925 | | | | 1,746 | |
| Hilcorp Energy I, LP 6.00% 2/1/20311 | | | 450 | | | | 410 | |
| Hilcorp Energy I, LP 6.25% 4/15/20321 | | | 2,125 | | | | 1,952 | |
| Kinder Morgan, Inc. 3.25% 8/1/2050 | | | 2,007 | | | | 1,227 | |
| Kinder Morgan, Inc. 3.60% 2/15/2051 | | | 4,000 | | | | 2,597 | |
| Kinder Morgan, Inc. 5.45% 8/1/2052 | | | 826 | | | | 700 | |
| Leviathan Bond, Ltd. 6.75% 6/30/20301 | | | 1,390 | | | | 1,245 | |
| Magellan Midstream Partners, LP 3.95% 3/1/2050 | | | 4,000 | | | | 2,736 | |
| Marathon Oil Corp. 4.40% 7/15/2027 | | | 3,375 | | | | 3,147 | |
| Marathon Oil Corp. 5.20% 6/1/2045 | | | 3,500 | | | | 2,877 | |
| MPLX, LP 1.75% 3/1/2026 | | | 1,846 | | | | 1,611 | |
| MPLX, LP 2.65% 8/15/2030 | | | 1,994 | | | | 1,572 | |
| MPLX, LP 4.95% 9/1/2032 | | | 3,333 | | | | 3,021 | |
| MPLX, LP 4.95% 3/14/2052 | | | 1,500 | | | | 1,163 | |
| Murphy Oil Corp. 5.875% 12/1/2027 | | | 2,005 | | | | 1,950 | |
| Murphy Oil USA, Inc. 3.75% 2/15/20311 | | | 1,000 | | | | 835 | |
| Neptune Energy Group Holdings, Ltd. 6.625% 5/15/20251 | | | 6,955 | | | | 6,770 | |
| New Fortress Energy, Inc. 6.75% 9/15/20251 | | | 1,800 | | | | 1,770 | |
| New Fortress Energy, Inc. 6.50% 9/30/20261 | | | 8,085 | | | | 7,859 | |
| NGL Energy Operating, LLC 7.50% 2/1/20261 | | | 7,435 | | | | 6,739 | |
| NGPL PipeCo, LLC 7.768% 12/15/20371 | | | 2,000 | | | | 1,997 | |
| NorthRiver Midstream Finance, LP 5.625% 2/15/20261 | | | 3,000 | | | | 2,844 | |
| Occidental Petroleum Corp. 5.50% 12/1/2025 | | | 1,400 | | | | 1,406 | |
| Occidental Petroleum Corp. 3.00% 2/15/2027 | | | 4,000 | | | | 3,648 | |
| Occidental Petroleum Corp. 6.125% 1/1/2031 | | | 5,000 | | | | 5,019 | |
| Occidental Petroleum Corp. 4.625% 6/15/2045 | | | 3,000 | | | | 2,465 | |
| Occidental Petroleum Corp. 4.40% 4/15/2046 | | | 2,000 | | | | 1,631 | |
| Occidental Petroleum Corp. 4.40% 8/15/2049 | | | 6,000 | | | | 4,856 | |
| Oleoducto Central SA 4.00% 7/14/20271 | | | 1,065 | | | | 869 | |
| ONEOK, Inc. 5.85% 1/15/2026 | | | 2,162 | | | | 2,152 | |
| ONEOK, Inc. 4.55% 7/15/2028 | | | 203 | | | | 184 | |
| ONEOK, Inc. 4.35% 3/15/2029 | | | 360 | | | | 320 | |
| ONEOK, Inc. 3.10% 3/15/2030 | | | 2,234 | | | | 1,808 | |
| ONEOK, Inc. 6.35% 1/15/2031 | | | 5,903 | | | | 5,831 | |
| ONEOK, Inc. 4.95% 7/13/2047 | | | 628 | | | | 477 | |
| ONEOK, Inc. 7.15% 1/15/2051 | | | 2,319 | | | | 2,180 | |
| Pemex Project Funding Master Trust, Series 13, 6.625% 6/15/2035 | | | 10,000 | | | | 6,961 | |
| Petróleos Mexicanos 6.875% 10/16/2025 | | | 5,500 | | | | 5,294 | |
| Petróleos Mexicanos 4.50% 1/23/2026 | | | 2,032 | | | | 1,794 | |
| Petróleos Mexicanos 6.50% 1/23/2029 | | | 60 | | | | 48 | |
| Petróleos Mexicanos 8.75% 6/2/2029 | | | 16,668 | | | | 14,874 | |
| Petróleos Mexicanos 6.84% 1/23/2030 | | | 2,500 | | | | 2,000 | |
| Petróleos Mexicanos 5.95% 1/28/2031 | | | 580 | | | | 419 | |
| Petróleos Mexicanos 6.70% 2/16/2032 | | | 6,205 | | | | 4,703 | |
| Petróleos Mexicanos 6.75% 9/21/2047 | | | 944 | | | | 570 | |
| Petrorio Luxembourg SARL 6.125% 6/9/20261 | | | 2,370 | | | | 2,150 | |
| Pioneer Natural Resources Company 1.90% 8/15/2030 | | | 3,933 | | | | 3,025 | |
| Plains All American Pipeline, LP 3.80% 9/15/2030 | | | 1,135 | | | | 948 | |
| Qatar Petroleum 3.30% 7/12/20511 | | | 1,710 | | | | 1,165 | |
| Range Resources Corp. 4.75% 2/15/20301 | | | 445 | | | | 394 | |
| Rattler Midstream Partners, LP 5.625% 7/15/20251 | | | 1,000 | | | | 1,028 | |
| Sabine Pass Liquefaction, LLC 5.625% 3/1/2025 | | | 6,450 | | | | 6,427 | |
| Schlumberger BV 4.00% 12/21/20251 | | | 24,405 | | | | 23,499 | |
| Southwestern Energy Co. 8.375% 9/15/2028 | | | 320 | | | | 332 | |
| Southwestern Energy Co. 5.375% 2/1/2029 | | | 5,455 | | | | 5,095 | |
| Bonds, notes & other debt instruments (continued) | | Principal amount
(000) | | | Value
(000) | |
| Corporate bonds, notes & loans (continued) | | | | | | | | |
| Energy (continued) | | | | | | | | |
| Southwestern Energy Co. 5.375% 3/15/2030 | | USD | 975 | | | $ | 903 | |
| Southwestern Energy Co. 4.75% 2/1/2032 | | | 550 | | | | 476 | |
| Sunoco Logistics Operating Partners, LP 5.40% 10/1/2047 | | | 1,536 | | | | 1,223 | |
| Sunoco, LP 6.00% 4/15/2027 | | | 1,000 | | | | 982 | |
| Sunoco, LP 4.50% 5/15/2029 | | | 3,700 | | | | 3,187 | |
| Superior Plus, LP and Superior General Partner, Inc. 4.50% 3/15/20291 | | | 1,000 | | | | 850 | |
| Tallgrass Energy Partners, LP 7.50% 10/1/20251 | | | 1,000 | | | | 1,012 | |
| Targa Resources Partners, LP 6.875% 1/15/2029 | | | 3,110 | | | | 3,106 | |
| Targa Resources Partners, LP 5.50% 3/1/2030 | | | 5,190 | | | | 4,800 | |
| TransCanada Corp. 5.875% 8/15/2076 (3-month USD-LIBOR + 4.64% on 8/15/2026)13 | | | 49,286 | | | | 45,974 | |
| TransCanada Corp., junior subordinated, (3-month USD-LIBOR + 2.21%) 5.115% 5/16/20678 | | | 1,000 | | | | 752 | |
| TransCanada PipeLines, Ltd. 4.10% 4/15/2030 | | | 11,939 | | | | 10,699 | |
| Transportadora de Gas Peru SA 4.25% 4/30/20281 | | | 1,090 | | | | 1,007 | |
| Valaris, Ltd. 8.25% Cash 4/30/202814 | | | 221 | | | | 218 | |
| Venture Global Calcasieu Pass, LLC 4.125% 8/15/20311 | | | 1,985 | | | | 1,697 | |
| Venture Global Calcasieu Pass, LLC 3.875% 11/1/20331 | | | 1,000 | | | | 804 | |
| Weatherford International, Ltd. 6.50% 9/15/20281 | | | 2,000 | | | | 1,913 | |
| Western Gas Partners, LP 3.95% 6/1/2025 | | | 1,520 | | | | 1,443 | |
| Western Gas Partners, LP 4.65% 7/1/2026 | | | 3,105 | | | | 2,946 | |
| Western Gas Partners, LP 5.45% 4/1/2044 | | | 1,000 | | | | 814 | |
| Western Midstream Operating, LP 3.35% 2/1/202513 | | | 5,040 | | | | 4,801 | |
| Western Midstream Operating, LP 4.30% 2/1/203013 | | | 4,755 | | | | 4,192 | |
| Western Midstream Operating, LP 5.50% 2/1/205013 | | | 3,956 | | | | 3,088 | |
| Williams Companies, Inc. 5.30% 8/15/2052 | | | 1,750 | | | | 1,478 | |
| | | | | | | | 443,979 | |
| | | | | | | | | |
| Communication services 0.37% | | | | | | | | |
| América Móvil, SAB de CV, 6.45% 12/5/2022 | | MXN | 45,000 | | | | 2,262 | |
| América Móvil, SAB de CV, 4.70% 7/21/2032 | | USD | 2,500 | | | | 2,294 | |
| América Móvil, SAB de CV, 8.46% 12/18/2036 | | MXN | 147,200 | | | | 6,090 | |
| AT&T, Inc. 2.25% 2/1/2032 | | USD | 1,000 | | | | 752 | |
| AT&T, Inc. 2.55% 12/1/2033 | | | 5,181 | | | | 3,824 | |
| AT&T, Inc. 3.50% 9/15/2053 | | | 5,957 | | | | 3,830 | |
| Cablevision Systems Corp. 5.50% 4/15/20271 | | | 3,000 | | | | 2,820 | |
| Cablevision Systems Corp. 5.75% 1/15/20301 | | | 4,250 | | | | 3,259 | |
| CCO Holdings, LLC 5.00% 2/1/20281 | | | 6,000 | | | | 5,440 | |
| CCO Holdings, LLC 6.375% 9/1/20291 | | | 3,525 | | | | 3,254 | |
| CCO Holdings, LLC 4.75% 3/1/20301 | | | 2,475 | | | | 2,084 | |
| CCO Holdings, LLC 4.50% 8/15/20301 | | | 3,950 | | | | 3,212 | |
| CCO Holdings, LLC 4.25% 2/1/20311 | | | 3,650 | | | | 2,890 | |
| CCO Holdings, LLC 4.75% 2/1/20321 | | | 5,675 | | | | 4,554 | |
| CCO Holdings, LLC 4.50% 6/1/20331 | | | 24,425 | | | | 18,569 | |
| CCO Holdings, LLC 4.25% 1/15/20341 | | | 18,300 | | | | 13,479 | |
| CCO Holdings, LLC and CCO Holdings Capital Corp. 5.125% 5/1/20271 | | | 6,000 | | | | 5,569 | |
| CCO Holdings, LLC and CCO Holdings Capital Corp. 3.50% 3/1/2042 | | | 3,000 | | | | 1,879 | |
| CCO Holdings, LLC and CCO Holdings Capital Corp. 3.90% 6/1/2052 | | | 3,000 | | | | 1,863 | |
| Charter Communications Operating, LLC 3.70% 4/1/2051 | | | 2,000 | | | | 1,202 | |
| Comcast Corp. 2.65% 2/1/2030 | | | 20,000 | | | | 16,739 | |
| Comcast Corp. 2.45% 8/15/2052 | | | 1,000 | | | | 548 | |
| DIRECTV Holdings, LLC and DIRECTV Financing Co., Inc. 5.875% 8/15/20271 | | | 5,000 | | | | 4,512 | |
| Embarq Corp. 7.995% 6/1/2036 | | | 725 | | | | 293 | |
| Frontier Communications Corp. 5.875% 10/15/20271 | | | 2,000 | | | | 1,843 | |
| Frontier Communications Holdings, LLC 5.875% 11/1/2029 | | | 731 | | | | 572 | |
| Gray Television, Inc. 7.00% 5/15/20271 | | | 1,000 | | | | 954 | |
| Lamar Media Corp. 4.875% 1/15/2029 | | | 5,650 | | | | 5,120 | |
| Level 3 Communications, Inc. 3.875% 11/15/20291 | | | 2,500 | | | | 2,060 | |
| Level 3 Financing, Inc. 3.75% 7/15/20291 | | | 2,015 | | | | 1,536 | |
| Match Group, Inc. 4.625% 6/1/20281 | | | 1,000 | | | | 891 | |
| Meta Platforms, Inc. 3.85% 8/15/20321 | | | 13,000 | | | | 11,075 | |
| Meta Platforms, Inc. 4.45% 8/15/20521 | | | 7,500 | | | | 5,579 | |
| Netflix, Inc. 3.625% 6/15/20251 | | | 5,575 | | | | 5,301 | |
| Netflix, Inc. 4.875% 4/15/2028 | | | 275 | | | | 261 | |
| Netflix, Inc. 5.875% 11/15/2028 | | | 4,569 | | | | 4,546 | |
| Netflix, Inc. 5.375% 11/15/20291 | | | 150 | | | | 143 | |
| Netflix, Inc. 4.875% 6/15/20301 | | | 6,650 | | | | 6,167 | |
| OUTFRONT Media Capital, LLC 4.625% 3/15/20301 | | | 6,650 | | | | 5,510 | |
| Bonds, notes & other debt instruments (continued) | | Principal amount
(000) | | | Value
(000) | |
| Corporate bonds, notes & loans (continued) | | | | | | | | |
| Communication services (continued) | | | | | | | | |
| SBA Tower Trust 1.631% 11/15/20261 | | USD | 22,469 | | | $ | 18,785 | |
| Scripps Escrow II, Inc. 3.875% 1/15/20291 | | | 1,250 | | | | 1,034 | |
| Sirius XM Radio, Inc. 4.00% 7/15/20281 | | | 4,775 | | | | 4,113 | |
| Sirius XM Radio, Inc. 3.875% 9/1/20311 | | | 2,850 | | | | 2,286 | |
| Sprint Corp. 6.875% 11/15/2028 | | | 35,170 | | | | 36,348 | |
| Sprint Corp. 8.75% 3/15/2032 | | | 8,710 | | | | 10,235 | |
| T-Mobile US, Inc. 3.50% 4/15/2025 | | | 6,550 | | | | 6,252 | |
| T-Mobile US, Inc. 3.75% 4/15/2027 | | | 10,000 | | | | 9,231 | |
| T-Mobile US, Inc. 3.875% 4/15/2030 | | | 8,975 | | | | 7,947 | |
| T-Mobile US, Inc. 2.55% 2/15/2031 | | | 4,564 | | | | 3,614 | |
| T-Mobile US, Inc. 2.875% 2/15/2031 | | | 636 | | | | 513 | |
| T-Mobile US, Inc. 3.50% 4/15/2031 | | | 25,000 | | | | 21,055 | |
| T-Mobile US, Inc. 3.00% 2/15/2041 | | | 4,200 | | | | 2,830 | |
| T-Mobile US, Inc. 3.30% 2/15/2051 | | | 3,316 | | | | 2,133 | |
| T-Mobile US, Inc. 3.40% 10/15/2052 | | | 5,200 | | | | 3,371 | |
| Twitter, Inc. 3.875% 12/15/20271 | | | 7,000 | | | | 7,072 | |
| Twitter, Inc. 5.00% 3/1/20301 | | | 875 | | | | 881 | |
| Verizon Communications, Inc. 1.75% 1/20/2031 | | | 3,000 | | | | 2,228 | |
| Verizon Communications, Inc. 2.55% 3/21/2031 | | | 23,150 | | | | 18,309 | |
| Verizon Communications, Inc. 2.355% 3/15/2032 | | | 11,186 | | | | 8,481 | |
| Verizon Communications, Inc. 2.875% 11/20/2050 | | | 4,250 | | | | 2,514 | |
| Verizon Communications, Inc. 3.55% 3/22/2051 | | | 5,000 | | | | 3,383 | |
| Verizon Communications, Inc. 3.875% 3/1/2052 | | | 5,000 | | | | 3,542 | |
| Vodafone Group PLC 4.25% 9/17/2050 | | | 4,575 | | | | 3,232 | |
| Warner Music Group 3.75% 12/1/20291 | | | 1,000 | | | | 834 | |
| WarnerMedia Holdings, Inc. 4.279% 3/15/20321 | | | 5,138 | | | | 4,156 | |
| WarnerMedia Holdings, Inc. 5.05% 3/15/20421 | | | 5,499 | | | | 4,032 | |
| WarnerMedia Holdings, Inc. 5.141% 3/15/20521 | | | 7,934 | | | | 5,551 | |
| | | | | | | | 356,738 | |
| | | | | | | | | |
| Consumer discretionary 0.37% | | | | | | | | |
| AutoNation, Inc. 3.85% 3/1/2032 | | | 5,750 | | | | 4,483 | |
| Bayerische Motoren Werke AG 3.45% 4/1/20271 | | | 1,075 | | | | 993 | |
| Bayerische Motoren Werke AG 3.70% 4/1/20321 | | | 850 | | | | 731 | |
| Booking Holdings, Inc. 4.625% 4/13/2030 | | | 5,000 | | | | 4,709 | |
| Burger King Corp. 3.875% 1/15/20281 | | | 1,000 | | | | 881 | |
| Burger King Corp. 4.00% 10/15/20301 | | | 1,000 | | | | 818 | |
| Carnival Corp. 10.50% 2/1/20261 | | | 11,000 | | | | 10,796 | |
| Carnival Corp. 4.00% 8/1/20281 | | | 7,000 | | | | 5,652 | |
| Daimler Trucks Finance North America, LLC 1.125% 12/14/20231 | | | 50,000 | | | | 47,659 | |
| Daimler Trucks Finance North America, LLC 1.625% 12/13/20241 | | | 18,450 | | | | 16,971 | |
| Daimler Trucks Finance North America, LLC 2.375% 12/14/20281 | | | 1,850 | | | | 1,501 | |
| Daimler Trucks Finance North America, LLC 2.50% 12/14/20311 | | | 4,550 | | | | 3,382 | |
| Empire Resorts, Inc. 7.75% 11/1/20261 | | | 3,225 | | | | 2,659 | |
| Ford Motor Co. 2.30% 2/10/2025 | | | 20,695 | | | | 18,758 | |
| Ford Motor Co. 2.90% 2/10/2029 | | | 14,995 | | | | 11,790 | |
| Ford Motor Co. 7.45% 7/16/2031 | | | 2,000 | | | | 2,009 | |
| Ford Motor Co. 3.25% 2/12/2032 | | | 6,000 | | | | 4,515 | |
| Ford Motor Credit Company, LLC 5.125% 6/16/2025 | | | 5,010 | | | | 4,842 | |
| Ford Motor Credit Company, LLC 2.70% 8/10/2026 | | | 3,990 | | | | 3,462 | |
| Ford Motor Credit Company, LLC 4.95% 5/28/2027 | | | 7,000 | | | | 6,419 | |
| General Motors Company 6.80% 10/1/2027 | | | 3,226 | | | | 3,271 | |
| Grand Canyon University 4.125% 10/1/2024 | | | 20,000 | | | | 18,800 | |
| Grand Canyon University 4.375% 10/1/2026 | | | 3,000 | | | | 2,760 | |
| Hanesbrands, Inc. 4.875% 5/15/20261 | | | 1,000 | | | | 919 | |
| Harley-Davidson, Inc. 3.35% 6/8/20251 | | | 3,135 | | | | 2,912 | |
| Hilton Worldwide Holdings, Inc. 5.75% 5/1/20281 | | | 6,000 | | | | 5,798 | |
| Hilton Worldwide Holdings, Inc. 4.00% 5/1/20311 | | | 2,000 | | | | 1,675 | |
| Home Depot, Inc. 2.95% 6/15/2029 | | | 4,775 | | | | 4,221 | |
| International Game Technology PLC 4.125% 4/15/20261 | | | 2,000 | | | | 1,860 | |
| International Game Technology PLC 6.25% 1/15/20271 | | | 7,000 | | | | 6,952 | |
| KB Home 4.80% 11/15/2029 | | | 1,000 | | | | 818 | |
| Las Vegas Sands Corp. 3.50% 8/18/2026 | | | 1,000 | | | | 874 | |
| Las Vegas Sands Corp. 3.90% 8/8/2029 | | | 7,000 | | | | 5,665 | |
| Lithia Motors, Inc. 3.875% 6/1/20291 | | | 2,000 | | | | 1,617 | |
| Lowe’s Companies, Inc. 4.05% 5/3/2047 | | | 4 | | | | 3 | |
| Lowe’s Companies, Inc. 5.625% 4/15/2053 | | | 3,000 | | | | 2,707 | |
| Bonds, notes & other debt instruments (continued) | | Principal amount
(000) | | | Value
(000) | |
| Corporate bonds, notes & loans (continued) | | | | | | | | |
| Consumer discretionary (continued) | | | | | | | | |
| Macy’s Retail Holdings, LLC 5.875% 3/15/20301 | | USD | 555 | | | $ | 467 | |
| Marriott International, Inc. 5.00% 10/15/2027 | | | 1,500 | | | | 1,445 | |
| Marriott International, Inc. 2.85% 4/15/2031 | | | 3,300 | | | | 2,571 | |
| Marriott International, Inc. 2.75% 10/15/2033 | | | 670 | | | | 487 | |
| McDonald’s Corp. 3.70% 1/30/2026 | | | 7,015 | | | | 6,736 | |
| McDonald’s Corp. 2.125% 3/1/2030 | | | 4,136 | | | | 3,366 | |
| McDonald’s Corp. 4.60% 9/9/2032 | | | 1,275 | | | | 1,212 | |
| McDonald’s Corp. 4.45% 3/1/2047 | | | 2,100 | | | | 1,715 | |
| McDonald’s Corp. 3.625% 9/1/2049 | | | 4,898 | | | | 3,463 | |
| McDonald’s Corp. 5.15% 9/9/2052 | | | 655 | | | | 590 | |
| Melco International Development, Ltd. 5.75% 7/21/20281 | | | 1,000 | | | | 580 | |
| Melco International Development, Ltd. 5.375% 12/4/20291 | | | 6,415 | | | | 3,596 | |
| MercadoLibre, Inc. 3.125% 1/14/2031 | | | 1,055 | | | | 765 | |
| MGM Resorts International 6.00% 3/15/2023 | | | 4,000 | | | | 4,003 | |
| MGM Resorts International 6.75% 5/1/2025 | | | 1,500 | | | | 1,483 | |
| MGM Resorts International 4.75% 10/15/2028 | | | 2,000 | | | | 1,739 | |
| Nordstrom, Inc. 2.30% 4/8/2024 | | | 4,000 | | | | 3,759 | |
| Nordstrom, Inc. 4.25% 8/1/2031 | | | 4,000 | | | | 2,910 | |
| QVC, Inc. 4.45% 2/15/2025 | | | 2,000 | | | | 1,752 | |
| Royal Caribbean Cruises, Ltd. 11.50% 6/1/20251 | | | 22,280 | | | | 24,023 | |
| Royal Caribbean Cruises, Ltd. 4.25% 7/1/20261 | | | 2,825 | | | | 2,253 | |
| Royal Caribbean Cruises, Ltd. 8.25% 1/15/20291 | | | 2,815 | | | | 2,810 | |
| Sally Holdings, LLC 5.625% 12/1/2025 | | | 3,000 | | | | 2,835 | |
| Sands China, Ltd. 5.625% 8/8/2025 | | | 1,000 | | | | 885 | |
| Sands China, Ltd. 4.30% 1/8/2026 | | | 1,000 | | | | 821 | |
| Sands China, Ltd. 2.80% 3/8/202713 | | | 1,000 | | | | 742 | |
| Sands China, Ltd. 5.90% 8/8/2028 | | | 5,000 | | | | 3,983 | |
| Sands China, Ltd. 3.35% 3/8/202913 | | | 11,000 | | | | 7,385 | |
| Sonic Automotive, Inc. 4.625% 11/15/20291 | | | 1,560 | | | | 1,226 | |
| Sonic Automotive, Inc. 4.875% 11/15/20311 | | | 3,030 | | | | 2,292 | |
| Starbucks Corp. 3.10% 3/1/2023 | | | 18,233 | | | | 18,134 | |
| Starbucks Corp. 4.50% 11/15/2048 | | | 5,690 | | | | 4,608 | |
| Stellantis Finance US, Inc. 1.711% 1/29/20271 | | | 2,975 | | | | 2,462 | |
| Stellantis Finance US, Inc. 5.625% 1/12/20281 | | | 1,500 | | | | 1,418 | |
| Stellantis Finance US, Inc. 6.375% 9/12/20321 | | | 3,699 | | | | 3,430 | |
| The Gap, Inc. 3.625% 10/1/20291 | | | 1,000 | | | | 704 | |
| VICI Properties, LP / VICI Note Co., Inc. 5.625% 5/1/20241 | | | 2,245 | | | | 2,219 | |
| VICI Properties, LP / VICI Note Co., Inc. 3.75% 2/15/20271 | | | 3,390 | | | | 2,978 | |
| Wyndham Worldwide Corp. 4.375% 8/15/20281 | | | 3,560 | | | | 3,140 | |
| Wynn Resorts Finance, LLC 7.75% 4/15/20251 | | | 2,325 | | | | 2,270 | |
| Wynn Resorts Finance, LLC 5.125% 10/1/20291 | | | 5,390 | | | | 4,300 | |
| YUM! Brands, Inc. 4.75% 1/15/20301 | | | 2,000 | | | | 1,793 | |
| YUM! Brands, Inc. 3.625% 3/15/2031 | | | 1,000 | | | | 805 | |
| | | | | | | | 354,037 | |
| | | | | | | | | |
| Financials 0.36% | | | | | | | | |
| ACE Capital Trust II, junior subordinated, 9.70% 4/1/2030 | | | 7,210 | | | | 9,031 | |
| ACE INA Holdings, Inc. 4.35% 11/3/2045 | | | 3,230 | | | | 2,639 | |
| AerCap Ireland Capital Designated Activity Company 3.00% 10/29/2028 | | | 4,000 | | | | 3,234 | |
| AerCap Ireland Capital Designated Activity Company 3.30% 1/30/2032 | | | 5,314 | | | | 3,995 | |
| AerCap Ireland Capital Designated Activity Company 3.85% 10/29/2041 | | | 5,079 | | | | 3,384 | |
| American Express Co. 5.85% 11/5/2027 | | | 775 | | | | 774 | |
| American Express Co. 4.42% 8/3/2033 (USD-SOFR + 1.76% on 8/3/2032)13 | | | 4,174 | | | | 3,700 | |
| Aon Corp. / Aon Global Holdings PLC 3.90% 2/28/2052 | | | 4,000 | | | | 2,842 | |
| Bank of America Corp. 4.948% 7/22/2028 (USD-SOFR + 2.04% on 7/22/2027)13 | | | 3,500 | | | | 3,341 | |
| Bank of America Corp. 1.922% 10/24/2031 (USD-SOFR + 1.37% on 10/24/2030)13 | | | 8,000 | | | | 5,878 | |
| Bank of America Corp. 2.972% 2/4/2033 (USD-SOFR + 1.33% on 2/4/2032)13 | | | 3,789 | | | | 2,941 | |
| Bank of America Corp. 5.015% 7/22/2033 (USD-SOFR + 2.16% on 7/22/2032)13 | | | 4,210 | | | | 3,866 | |
| Bank of America Corp. 3.846% 3/8/2037 (5-year CMT + 2.00% on 3/8/2032)13 | | | 5,000 | | | | 4,012 | |
| Bank of Ireland Group PLC 6.253% 9/16/2026 (1-year UST Yield Curve Rate T Note Constant Maturity + 2.65% on 9/16/2025)1,13 | | | 700 | | | | 676 | |
| Bank of Nova Scotia 2.45% 2/2/2032 | | | 2,217 | | | | 1,662 | |
| Barclays Bank PLC 5.501% 8/9/2028 (1-year UST Yield Curve Rate T Note Constant Maturity + 2.65% on 8/5/2027)13 | | | 1,000 | | | | 924 | |
| Blackstone Holdings Finance Co. LLC 5.90% 11/3/20271 | | | 2,000 | | | | 1,996 | |
| BNP Paribas 3.50% 3/1/20231 | | | 25,000 | | | | 24,841 | |
| BNP Paribas 2.159% 9/15/2029 (USD-SOFR + 1.218% on 9/15/2028)1,13 | | | 1,275 | | | | 983 | |
| Bonds, notes & other debt instruments (continued) | | Principal amount
(000) | | | Value
(000) | |
| Corporate bonds, notes & loans (continued) | | | | | | | | |
| Financials (continued) | | | | | | | | |
| Charles Schwab Corp. 2.45% 3/3/2027 | | USD | 1,775 | | | $ | 1,585 | |
| Citigroup, Inc. 3.057% 1/25/2033 (USD-SOFR + 1.351% on 1/25/2032)13 | | | 8,537 | | | | 6,661 | |
| Citigroup, Inc. 4.91% 5/24/2033 (USD-SOFR + 2.086% on 5/24/2032)13 | | | 529 | | | | 481 | |
| CME Group, Inc. 2.65% 3/15/2032 | | | 2,500 | | | | 2,014 | |
| Coinbase Global, Inc. 3.375% 10/1/20281 | | | 1,700 | | | | 1,115 | |
| Coinbase Global, Inc. 3.625% 10/1/20311 | | | 5,525 | | | | 3,285 | |
| Commonwealth Bank of Australia 3.784% 3/14/20321 | | | 3,000 | | | | 2,331 | |
| Corebridge Financial, Inc. 3.85% 4/5/20291 | | | 2,235 | | | | 1,955 | |
| Corebridge Financial, Inc. 3.90% 4/5/20321 | | | 2,803 | | | | 2,346 | |
| Corebridge Financial, Inc. 4.35% 4/5/20421 | | | 2,067 | | | | 1,554 | |
| Corebridge Financial, Inc. 4.40% 4/5/20521 | | | 4,688 | | | | 3,433 | |
| Credit Suisse Group AG 3.80% 6/9/2023 | | | 12,050 | | | | 11,751 | |
| Credit Suisse Group AG 2.193% 6/5/2026 (USD-SOFR + 2.044% on 6/5/2025)1,13 | | | 1,000 | | | | 843 | |
| Credit Suisse Group AG 6.442% 8/11/2028 (USD-SOFR + 3.70% on 8/11/2027)1,13 | | | 4,000 | | | | 3,614 | |
| Danske Bank AS 3.875% 9/12/20231 | | | 9,250 | | | | 9,058 | |
| Danske Bank AS 4.298% 4/1/2028 (1-year UST Yield Curve Rate T Note Constant Maturity + 1.75% on 4/1/2027)1,13 | | | 5,000 | | | | 4,408 | |
| FS Energy and Power Fund 7.50% 8/15/20231 | | | 6,480 | | | | 6,507 | |
| Goldman Sachs Group, Inc. 3.814% 4/23/2029 (3-month USD-LIBOR + 1.158% on 4/23/2028)13 | | | 1,785 | | | | 1,585 | |
| Goldman Sachs Group, Inc. 2.60% 2/7/2030 | | | 2,128 | | | | 1,695 | |
| Goldman Sachs Group, Inc. 2.615% 4/22/2032 (USD-SOFR + 1.281% on 4/22/2031)13 | | | 3,125 | | | | 2,388 | |
| Goldman Sachs Group, Inc. 2.65% 10/21/2032 (USD-SOFR + 1.264% on 10/21/2031)13 | | | 7,500 | | | | 5,687 | |
| Goldman Sachs Group, Inc. 3.102% 2/24/2033 (USD-SOFR + 1.41% on 2/24/2032)13 | | | 12,500 | | | | 9,803 | |
| Goldman Sachs Group, Inc. 3.436% 2/24/2043 (USD-SOFR + 1.632% on 2/24/2042)13 | | | 971 | | | | 663 | |
| Groupe BPCE SA 2.75% 1/11/20231 | | | 22,675 | | | | 22,546 | |
| HSBC Holdings PLC 5.21% 8/11/2028 (USD-SOFR + 2.61% on 8/11/2027)13 | | | 2,000 | | | | 1,833 | |
| HSBC Holdings PLC 7.39% 11/03/2028 (USD-SOFR + 7.39% on 11/3/2027)13 | | | 1,000 | | | | 1,002 | |
| HSBC Holdings PLC 4.583% 6/19/2029 (3-month USD-LIBOR + 1.535% on 6/19/2028)13 | | | 12,500 | | | | 10,866 | |
| HSBC Holdings PLC 5.402% 8/11/2033 (USD-SOFR + 2.87% on 8/11/2032)13 | | | 7,000 | | | | 6,079 | |
| Huarong Finance 2017 Co., Ltd. 4.25% 11/7/2027 | | | 3,500 | | | | 2,378 | |
| ING Groep NV 4.252% 3/28/2033 (USD-SOFR + 2.07% on 3/28/2032)13 | | | 1,988 | | | | 1,654 | |
| Intercontinental Exchange, Inc. 2.65% 9/15/2040 | | | 2,275 | | | | 1,504 | |
| Intesa Sanpaolo SpA 3.375% 1/12/20231 | | | 4,100 | | | | 4,078 | |
| Intesa Sanpaolo SpA 5.017% 6/26/20241 | | | 9,100 | | | | 8,594 | |
| Iron Mountain Information Management Services, Inc. 5.00% 7/15/20321 | | | 2,470 | | | | 2,043 | |
| JPMorgan Chase & Co. 2.947% 2/24/2028 (USD-SOFR + 1.17% on 2/24/2027)13 | | | 2,750 | | | | 2,422 | |
| JPMorgan Chase & Co. 4.323% 4/26/2028 (USD-SOFR + 1.56% on 4/26/2027)13 | | | 2,500 | | | | 2,327 | |
| JPMorgan Chase & Co. 4.851% 7/25/2028 (USD-SOFR + 1.99% on 7/25/2027)13 | | | 2,245 | | | | 2,136 | |
| JPMorgan Chase & Co. 3.509% 1/23/2029 (3-month USD-LIBOR + 0.945% on 1/23/2028)13 | | | 7,650 | | | | 6,759 | |
| JPMorgan Chase & Co. 1.953% 2/4/2032 (USD-SOFR + 1.065% on 2/4/2031)13 | | | 2,775 | | | | 2,036 | |
| JPMorgan Chase & Co. 2.58% 4/22/2032 (USD-SOFR + 1.25% on 4/22/2031)13 | | | 785 | | | | 604 | |
| JPMorgan Chase & Co. 2.545% 11/8/2032 (USD-SOFR + 1.18% on 11/8/2031)13 | | | 3,008 | | | | 2,273 | |
| JPMorgan Chase & Co. 2.963% 1/25/2033 (USD-SOFR + 1.26% on 1/25/2032)13 | | | 10,763 | | | | 8,418 | |
| JPMorgan Chase & Co. 4.586% 4/26/2033 (USD-SOFR + 1.80% on 4/26/2032)13 | | | 299 | | | | 267 | |
| JPMorgan Chase & Co. 4.912% 7/25/2033 (USD-SOFR + 2.08% on 7/25/2032)13 | | | 825 | | | | 751 | |
| Ladder Capital Finance Holdings LLLP 4.25% 2/1/20271 | | | 4,000 | | | | 3,369 | |
| Lloyds Banking Group PLC 4.375% 3/22/2028 | | | 5,375 | | | | 4,786 | |
| Lloyds Banking Group PLC 4.976% 8/11/2033 (1-year UST Yield Curve Rate T Note Constant Maturity + 2.30% on 8/11/2032)13 | | | 1,000 | | | | 857 | |
| LPL Holdings, Inc. 4.625% 11/15/20271 | | | 2,275 | | | | 2,099 | |
| Marsh & McLennan Companies, Inc. 2.375% 12/15/2031 | | | 1,096 | | | | 850 | |
| Metropolitan Life Global Funding I 4.30% 8/25/20291 | | | 2,000 | | | | 1,841 | |
| Mitsubishi UFJ Financial Group, Inc. 5.354% 9/13/2028 (1-year UST Yield Curve Rate T Note Constant Maturity + 1.90% on 9/13/2027)13 | | | 1,500 | | | | 1,447 | |
| Morgan Stanley 2.72% 7/22/2025 (USD-SOFR + 1.152% on 7/22/2024)13 | | | 9,225 | | | | 8,711 | |
| Morgan Stanley 4.679% 7/17/2026 (USD-SOFR + 1.669% on 7/17/2025)13 | | | 980 | | | | 951 | |
| Morgan Stanley 4.21% 4/20/2028 (USD-SOFR + 1.61% on 4/20/2027)13 | | | 1,159 | | | | 1,074 | |
| Morgan Stanley 6.296% 10/18/2028 (USD-SOFR + 2.44% on 10/18/2027)13 | | | 1,000 | | | | 1,010 | |
| Morgan Stanley 2.943% 1/21/2033 (USD-SOFR + 1.29% on 1/21/2032)13 | | | 6,000 | | | | 4,681 | |
| Morgan Stanley 4.889% 7/20/2033 (USD-SOFR + 2.077% on 7/20/2032)13 | | | 940 | | | | 857 | |
| Morgan Stanley 6.342% 10/18/2033 (USD-SOFR + 2.565% on 10/18/2032)13 | | | 1,000 | | | | 1,015 | |
| Morgan Stanley 5.297% 4/20/2037 (USD-SOFR + 2.62% on 4/20/2032)13 | | | 1,345 | | | | 1,195 | |
| MSCI, Inc. 4.00% 11/15/20291 | | | 5,000 | | | | 4,350 | |
| MSCI, Inc. 3.875% 2/15/20311 | | | 2,000 | | | | 1,689 | |
| Bonds, notes & other debt instruments (continued) | | Principal amount
(000) | | | Value
(000) | |
| Corporate bonds, notes & loans (continued) | | | | | | | | |
| Financials (continued) | | | | | | | | |
| MSCI, Inc. 3.25% 8/15/20331 | | USD | 1,000 | | | $ | 775 | |
| National Australia Bank, Ltd. 2.99% 5/21/20311 | | | 3,000 | | | | 2,255 | |
| Navient Corp. 6.75% 6/15/2026 | | | 2,000 | | | | 1,891 | |
| Navient Corp. 5.00% 3/15/2027 | | | 2,000 | | | | 1,690 | |
| Navient Corp. 5.50% 3/15/2029 | | | 1,000 | | | | 796 | |
| Navient Corp. 5.625% 8/1/2033 | | | 8,200 | | | | 5,797 | |
| Oxford Finance LLC 6.375% 2/1/20271 | | | 2,415 | | | | 2,214 | |
| Rede D’Or Finance SARL 4.50% 1/22/20301 | | | 3,000 | | | | 2,482 | |
| Springleaf Finance Corp. 6.125% 3/15/2024 | | | 1,000 | | | | 978 | |
| Springleaf Finance Corp. 6.875% 3/15/2025 | | | 2,000 | | | | 1,942 | |
| SVB Financial Group 4.70% junior subordinated perpetual bonds (5-year UST Yield Curve Rate T Note Constant Maturity + 3.064% on 11/15/2031)13 | | | 2,690 | | | | 1,809 | |
| Toronto-Dominion Bank 2.00% 9/10/2031 | | | 4,000 | | | | 2,969 | |
| Toronto-Dominion Bank 3.20% 3/10/2032 | | | 3,166 | | | | 2,574 | |
| U.S. Bancorp 3.15% 4/27/2027 | | | 4,000 | | | | 3,679 | |
| Wells Fargo & Company 4.808% 7/25/2028 (USD-SOFR + 1.98% on 7/25/2027)13 | | | 2,000 | | | | 1,896 | |
| Wells Fargo & Company 3.35% 3/2/2033 (USD-SOFR + 1.50% on 3/2/2032)13 | | | 12,800 | | | | 10,331 | |
| Wells Fargo & Company 4.897% 7/25/2033 (USD-SOFR + 4.897% on 7/25/2032)13 | | | 2,395 | | | | 2,194 | |
| Wells Fargo & Company 4.611% 4/25/2053 (USD-SOFR + 2.13% on 4/25/2052)13 | | | 1,508 | | | | 1,205 | |
| | | | | | | | 344,310 | |
| | | | | | | | | |
| Utilities 0.28% | | | | | | | | |
| AES Panama Generation Holdings SRL 4.375% 5/31/20301 | | | 1,095 | | | | 864 | |
| Alabama Power Co. 3.94% 9/1/2032 | | | 2,500 | | | | 2,237 | |
| Alfa Desarrollo SpA 4.55% 9/27/20511 | | | 2,835 | | | | 1,820 | |
| Alliant Energy Finance, LLC 3.60% 3/1/20321 | | | 1,155 | | | | 976 | |
| Ameren Corp. 2.50% 9/15/2024 | | | 1,616 | | | | 1,531 | |
| Commonwealth Edison Co. 2.95% 8/15/2027 | | | 2,450 | | | | 2,209 | |
| Consumers Energy Co. 3.60% 8/15/2032 | | | 1,375 | | | | 1,210 | |
| Consumers Energy Co. 4.05% 5/15/2048 | | | 6,425 | | | | 5,003 | |
| Consumers Energy Co. 3.75% 2/15/2050 | | | 5,625 | | | | 4,166 | |
| Consumers Energy Co. 3.10% 8/15/2050 | | | 10,259 | | | | 6,689 | |
| Consumers Energy Co. 3.50% 8/1/2051 | | | 360 | | | | 251 | |
| Consumers Energy Co. 2.65% 8/15/2052 | | | 1,003 | | | | 593 | |
| DTE Electric Co. 3.65% 3/1/2052 | | | 1,500 | | | | 1,082 | |
| DTE Energy Company 3.00% 3/1/2032 | | | 1,500 | | | | 1,246 | |
| Duke Energy Corp. 4.30% 3/15/2028 | | | 1,000 | | | | 941 | |
| Duke Energy Corp. 4.50% 8/15/2032 | | | 4,775 | | | | 4,309 | |
| Duke Energy Corp. 5.00% 8/15/2052 | | | 1,500 | | | | 1,244 | |
| Edison International 3.55% 11/15/2024 | | | 3,442 | | | | 3,302 | |
| Edison International 4.95% 4/15/2025 | | | 700 | | | | 689 | |
| Edison International 5.75% 6/15/2027 | | | 5,642 | | | | 5,507 | |
| Edison International 4.125% 3/15/2028 | | | 2,158 | | | | 1,921 | |
| Edison International 5.00% junior subordinated perpetual bonds (5-year UST Yield Curve Rate T Note Constant Maturity + 3.901% on 3/15/2027)13 | | | 3,000 | | | | 2,437 | |
| Emera, Inc. 6.75% 6/15/2076 (3-month USD-LIBOR + 5.44% on 6/15/2026)13 | | | 15,349 | | | | 14,365 | |
| Empresas Publicas de Medellin ESP 4.25% 7/18/2029 | | | 1,713 | | | | 1,226 | |
| Empresas Publicas de Medellin ESP 4.375% 2/15/20311 | | | 920 | | | | 626 | |
| Enel Finance International SA 7.50% 10/14/20321 | | | 1,075 | | | | 1,078 | |
| Enfragen Energia Sur SA 5.375% 12/30/2030 | | | 800 | | | | 410 | |
| Entergy Louisiana, LLC 4.20% 9/1/2048 | | | 5,950 | | | | 4,607 | |
| Entergy Louisiana, LLC 4.75% 9/15/2052 | | | 900 | | | | 751 | |
| Eversource Energy 2.80% 5/1/2023 | | | 1,870 | | | | 1,847 | |
| Eversource Energy 3.80% 12/1/2023 | | | 15,000 | | | | 14,758 | |
| Exelon Corp. 4.45% 4/15/2046 | | | 8,115 | | | | 6,380 | |
| FirstEnergy Corp. 2.05% 3/1/2025 | | | 1,502 | | | | 1,388 | |
| FirstEnergy Corp. 1.60% 1/15/2026 | | | 2,600 | | | | 2,267 | |
| FirstEnergy Corp. 2.65% 3/1/2030 | | | 1,305 | | | | 1,058 | |
| FirstEnergy Corp. 2.25% 9/1/2030 | | | 4,837 | | | | 3,730 | |
| FirstEnergy Corp. 3.40% 3/1/2050 | | | 15,150 | | | | 9,446 | |
| FirstEnergy Corp., Series B, 4.40% 7/15/2027 (4.15% on 1/15/2023)13 | | | 26,785 | | | | 25,198 | |
| Florida Power & Light Company 2.875% 12/4/2051 | | | 480 | | | | 307 | |
| IPALCO Enterprises, Inc. 3.70% 9/1/2024 | | | 2,000 | | | | 1,902 | |
| ITC Holdings Corp. 4.95% 9/22/20271 | | | 950 | | | | 922 | |
| NextEra Energy Capital Holdings, Inc. 2.25% 6/1/2030 | | | 3,206 | | | | 2,548 | |
| Oncor Electric Delivery Company, LLC 4.55% 9/15/20321 | | | 975 | | | | 920 | |
| Pacific Gas and Electric Co. 3.25% 6/15/2023 | | | 16,490 | | | | 16,234 | |
| Bonds, notes & other debt instruments (continued) | | Principal amount
(000) | | | Value
(000) | |
| Corporate bonds, notes & loans (continued) | | | | | | | | |
| Utilities (continued) | | | | | | | | |
| Pacific Gas and Electric Co. 3.40% 8/15/2024 | | USD | 3,665 | | | $ | 3,487 | |
| Pacific Gas and Electric Co. 3.15% 1/1/2026 | | | 1,365 | | | | 1,231 | |
| Pacific Gas and Electric Co. 2.95% 3/1/2026 | | | 12,987 | | | | 11,502 | |
| Pacific Gas and Electric Co. 3.30% 3/15/2027 | | | 1,749 | | | | 1,509 | |
| Pacific Gas and Electric Co. 3.30% 12/1/2027 | | | 738 | | | | 626 | |
| Pacific Gas and Electric Co. 4.65% 8/1/2028 | | | 2,500 | | | | 2,190 | |
| Pacific Gas and Electric Co. 4.55% 7/1/2030 | | | 1,100 | | | | 965 | |
| Pacific Gas and Electric Co. 2.50% 2/1/2031 | | | 21,190 | | | | 15,857 | |
| Pacific Gas and Electric Co. 3.25% 6/1/2031 | | | 1,300 | | | | 1,013 | |
| Pacific Gas and Electric Co. 4.95% 7/1/2050 | | | 10,000 | | | | 7,475 | |
| Pacific Gas and Electric Co. 3.50% 8/1/2050 | | | 20,610 | | | | 12,610 | |
| PG&E Corp. 5.00% 7/1/2028 | | | 2,595 | | | | 2,345 | |
| PG&E Corp. 5.25% 7/1/2030 | | | 2,890 | | | | 2,564 | |
| Public Service Electric and Gas Co. 3.20% 5/15/2029 | | | 4,000 | | | | 3,551 | |
| Public Service Enterprise Group, Inc. 3.20% 8/1/2049 | | | 3,300 | | | | 2,189 | |
| Southern California Edison Co. 2.85% 8/1/2029 | | | 1,600 | | | | 1,342 | |
| Southern California Edison Co. 2.25% 6/1/2030 | | | 4,515 | | | | 3,555 | |
| Southern California Edison Co. 2.75% 2/1/2032 | | | 2,000 | | | | 1,576 | |
| Southern California Edison Co. 4.00% 4/1/2047 | | | 6,667 | | | | 4,769 | |
| Southern California Edison Co. 4.125% 3/1/2048 | | | 6,667 | | | | 4,863 | |
| Southern California Edison Co. 2.95% 2/1/2051 | | | 2,869 | | | | 1,693 | |
| Southern California Edison Co., Series C, 3.60% 2/1/2045 | | | 4,463 | | | | 2,945 | |
| Talen Energy Corp. 7.25% 5/15/20271 | | | 2,290 | | | | 2,328 | |
| Talen Energy Corp., Term Loan, (3-month USD CME Term SOFR + 4.75%) 7.48% 11/13/20238,15 | | | 5,000 | | | | 5,016 | |
| Talen Energy Supply, LLC 7.625% 6/1/20281 | | | 705 | | | | 724 | |
| Union Electric Co. 3.90% 4/1/2052 | | | 645 | | | | 486 | |
| Venture Global Calcasieu Pass, LLC 3.875% 8/15/20291 | | | 3,430 | | | | 2,950 | |
| Virginia Electric and Power Co. 2.40% 3/30/2032 | | | 4,670 | | | | 3,667 | |
| WEC Energy Group, Inc. 5.15% 10/1/2027 | | | 1,125 | | | | 1,108 | |
| Xcel Energy, Inc. 2.60% 12/1/2029 | | | 3,875 | | | | 3,188 | |
| | | | | | | | 271,519 | |
| | | | | | | | | |
| Health care 0.26% | | | | | | | | |
| AbbVie, Inc. 3.20% 11/21/2029 | | | 498 | | | | 436 | |
| Amgen, Inc. 3.00% 2/22/2029 | | | 350 | | | | 306 | |
| Amgen, Inc. 4.05% 8/18/2029 | | | 10,325 | | | | 9,540 | |
| Amgen, Inc. 4.20% 3/1/2033 | | | 9,000 | | | | 8,116 | |
| Amgen, Inc. 4.875% 3/1/2053 | | | 2,825 | | | | 2,408 | |
| Anthem, Inc. 2.375% 1/15/2025 | | | 1,534 | | | | 1,442 | |
| Avantor Funding, Inc. 4.625% 7/15/20281 | | | 1,000 | | | | 906 | |
| Bausch Health Companies, Inc. 6.125% 2/1/20271 | | | 1,000 | | | | 659 | |
| Baxter International, Inc. 2.272% 12/1/2028 | | | 1,342 | | | | 1,104 | |
| Baxter International, Inc. 2.539% 2/1/2032 | | | 2,681 | | | | 2,046 | |
| Becton, Dickinson and Company 4.298% 8/22/2032 | | | 3,000 | | | | 2,717 | |
| Catalent Pharma Solutions, Inc. 3.125% 2/15/20291 | | | 850 | | | | 697 | |
| Catalent Pharma Solutions, Inc. 3.50% 4/1/20301 | | | 1,270 | | | | 1,028 | |
| Centene Corp. 2.45% 7/15/2028 | | | 14,495 | | | | 11,944 | |
| Centene Corp. 3.375% 2/15/2030 | | | 5,344 | | | | 4,448 | |
| Centene Corp. 3.00% 10/15/2030 | | | 2,590 | | | | 2,089 | |
| Centene Corp. 2.50% 3/1/2031 | | | 1,500 | | | | 1,154 | |
| Centene Corp. 2.625% 8/1/2031 | | | 3,950 | | | | 3,028 | |
| Endo International PLC 5.875% 10/15/20241 | | | 225 | | | | 179 | |
| Gilead Sciences, Inc. 2.80% 10/1/2050 | | | 935 | | | | 570 | |
| HCA, Inc. 4.125% 6/15/2029 | | | 8,450 | | | | 7,465 | |
| HCA, Inc. 3.50% 9/1/2030 | | | 4,000 | | | | 3,319 | |
| HCA, Inc. 3.625% 3/15/20321 | | | 629 | | | | 511 | |
| HCA, Inc. 5.25% 6/15/2049 | | | 2,500 | | | | 2,030 | |
| Humana, Inc. 3.70% 3/23/2029 | | | 649 | | | | 579 | |
| Laboratory Corporation of America Holdings 4.70% 2/1/2045 | | | 6,900 | | | | 5,602 | |
| Merck & Co., Inc. 1.70% 6/10/2027 | | | 11,549 | | | | 10,070 | |
| Merck & Co., Inc. 2.15% 12/10/2031 | | | 15,402 | | | | 12,241 | |
| Molina Healthcare, Inc. 4.375% 6/15/20281 | | | 2,500 | | | | 2,246 | |
| Molina Healthcare, Inc. 3.875% 5/15/20321 | | | 2,500 | | | | 2,092 | |
| Owens & Minor, Inc. 6.625% 4/1/20301 | | | 2,135 | | | | 1,780 | |
| Owens & Minor, Inc., Term Loan, (USD-SOFR + 3.75%) 4.25% 3/22/20298,15 | | | 3,980 | | | | 3,910 | |
| Perrigo Finance Unlimited Co. 4.375% 3/15/2026 | | | 1,500 | | | | 1,409 | |
| Bonds, notes & other debt instruments (continued) | | Principal amount
(000) | | | Value
(000) | |
| Corporate bonds, notes & loans (continued) | | | | | | | | |
| Health care (continued) | | | | | | | | |
| Regeneron Pharmaceuticals, Inc. 1.75% 9/15/2030 | | USD | 543 | | | $ | 410 | |
| Shire PLC 2.875% 9/23/2023 | | | 1,084 | | | | 1,060 | |
| Shire PLC 3.20% 9/23/2026 | | | 25,483 | | | | 23,439 | |
| Tenet Healthcare Corp. 4.875% 1/1/20261 | | | 1,000 | | | | 947 | |
| Tenet Healthcare Corp. 6.125% 6/15/20301 | | | 4,000 | | | | 3,699 | |
| Teva Pharmaceutical Finance Co. BV 6.00% 4/15/2024 | | | 34,087 | | | | 33,759 | |
| Teva Pharmaceutical Finance Co. BV 7.125% 1/31/2025 | | | 5,500 | | | | 5,458 | |
| Teva Pharmaceutical Finance Co. BV 3.15% 10/1/2026 | | | 8,160 | | | | 6,909 | |
| Teva Pharmaceutical Finance Co. BV 4.75% 5/9/2027 | | | 4,985 | | | | 4,405 | |
| Teva Pharmaceutical Finance Co. BV 6.75% 3/1/2028 | | | 25,805 | | | | 24,384 | |
| Teva Pharmaceutical Finance Co. BV 5.125% 5/9/2029 | | | 7,815 | | | | 6,725 | |
| Teva Pharmaceutical Finance Co. BV 4.10% 10/1/2046 | | | 34,359 | | | | 20,878 | |
| UnitedHealth Group, Inc. 2.375% 8/15/2024 | | | 2,940 | | | | 2,814 | |
| UnitedHealth Group, Inc. 5.30% 2/15/2030 | | | 1,200 | | | | 1,201 | |
| UnitedHealth Group, Inc. 4.20% 5/15/2032 | | | 767 | | | | 707 | |
| UnitedHealth Group, Inc. 5.35% 2/15/2033 | | | 1,700 | | | | 1,707 | |
| UnitedHealth Group, Inc. 4.75% 5/15/2052 | | | 750 | | | | 657 | |
| UnitedHealth Group, Inc. 5.875% 2/15/2053 | | | 1,200 | | | | 1,226 | |
| Valeant Pharmaceuticals International, Inc. 5.50% 11/1/20251 | | | 5,000 | | | | 4,005 | |
| | | | | | | | 252,461 | |
| | | | | | | | | |
| Industrials 0.19% | | | | | | | | |
| ADT Security Corp. 4.125% 8/1/20291 | | | 1,000 | | | | 860 | |
| Allegiant Travel Co. 7.25% 8/15/20271 | | | 1,051 | | | | 990 | |
| Allison Transmission Holdings, Inc. 3.75% 1/30/20311 | | | 2,650 | | | | 2,121 | |
| American Airlines, Inc., Series 2013-2, Class A, 4.95% 7/15/2024 | | | 81 | | | | 80 | |
| Ashtead Capital, Inc. 5.50% 8/11/20321 | | | 5,000 | | | | 4,527 | |
| Avis Budget Group, Inc. 4.75% 4/1/20281 | | | 1,000 | | | | 880 | |
| Avis Budget Group, Inc. 5.375% 3/1/20291 | | | 1,000 | | | | 869 | |
| BNSF Funding Trust I, junior subordinated, 6.613% 12/15/2055 (3-month USD-LIBOR + 2.35% on 1/15/2026)13 | | | 6,700 | | | | 6,255 | |
| Boeing Company 4.508% 5/1/2023 | | | 25,029 | | | | 24,929 | |
| Boeing Company 5.15% 5/1/2030 | | | 4,917 | | | | 4,548 | |
| Boeing Company 3.625% 2/1/2031 | | | 3,907 | | | | 3,249 | |
| Boeing Company 3.60% 5/1/2034 | | | 5,000 | | | | 3,737 | |
| Boeing Company 5.705% 5/1/2040 | | | 5,000 | | | | 4,347 | |
| Boeing Company 5.805% 5/1/2050 | | | 4,000 | | | | 3,447 | |
| Burlington Northern Santa Fe, LLC 3.30% 9/15/2051 | | | 1,157 | | | | 791 | |
| BWX Technologies, Inc. 4.125% 4/15/20291 | | | 1,000 | | | | 866 | |
| Canadian Pacific Railway, Ltd. 2.45% 12/2/2031 | | | 8,260 | | | | 6,561 | |
| Canadian Pacific Railway, Ltd. 3.00% 12/2/2041 | | | 2,944 | | | | 2,044 | |
| Canadian Pacific Railway, Ltd. 3.10% 12/2/2051 | | | 13,250 | | | | 8,449 | |
| Carrier Global Corp. 2.722% 2/15/2030 | | | 12,267 | | | | 10,096 | |
| Carrier Global Corp. 3.377% 4/5/2040 | | | 1,483 | | | | 1,061 | |
| Carrier Global Corp. 3.577% 4/5/2050 | | | 1,289 | | | | 867 | |
| CSX Corp. 2.40% 2/15/2030 | | | 7,186 | | | | 5,895 | |
| CSX Corp. 4.50% 11/15/2052 | | | 3,000 | | | | 2,450 | |
| Eaton Corp. 4.15% 3/15/2033 | | | 1,518 | | | | 1,348 | |
| Eaton Corp. 4.70% 8/23/2052 | | | 584 | | | | 497 | |
| General Electric Capital Corp. 4.418% 11/15/2035 | | | 7,011 | | | | 6,195 | |
| Hillenbrand, Inc. 3.75% 3/1/2031 | | | 4,700 | | | | 3,767 | |
| Howmet Aerospace, Inc. 5.90% 2/1/2027 | | | 1,000 | | | | 984 | |
| Howmet Aerospace, Inc. 6.75% 1/15/2028 | | | 2,000 | | | | 2,000 | |
| Icahn Enterprises, LP 4.375% 2/1/2029 | | | 1,190 | | | | 997 | |
| Lockheed Martin Corp. 5.10% 11/15/2027 | | | 951 | | | | 954 | |
| Lockheed Martin Corp. 5.25% 1/15/2033 | | | 1,084 | | | | 1,088 | |
| Lockheed Martin Corp. 5.70% 11/15/2054 | | | 797 | | | | 804 | |
| Masonite International Corp. 5.375% 2/1/20281 | | | 1,000 | | | | 917 | |
| Masonite International Corp. 3.50% 2/15/20301 | | | 1,000 | | | | 796 | |
| Mexico City Airport Trust 5.50% 7/31/2047 | | | 2,500 | | | | 1,618 | |
| Mileage Plus Holdings, LLC 6.50% 6/20/20271 | | | 3,605 | | | | 3,569 | |
| Norfolk Southern Corp. 4.55% 6/1/2053 | | | 774 | | | | 631 | |
| Otis Worldwide Corp. 2.056% 4/5/2025 | | | 15,629 | | | | 14,468 | |
| Prime Security Services Borrower, LLC 5.75% 4/15/20261 | | | 1,000 | | | | 975 | |
| Rolls-Royce PLC 5.75% 10/15/20271 | | | 5,415 | | | | 4,908 | |
| SkyMiles IP, Ltd. 4.75% 10/20/20281 | | | 1,840 | | | | 1,713 | |
| SkyMiles IP, Ltd., Term Loan, (3-month USD-LIBOR + 3.75%) 7.993% 10/20/20278,15 | | | 2,000 | | | | 2,021 | |
| Bonds, notes & other debt instruments (continued) | | Principal amount
(000) | | | Value
(000) | |
| Corporate bonds, notes & loans (continued) | | | | | | | | |
| Industrials (continued) | | | | | | | | |
| Spirit AeroSystems, Inc. 5.50% 1/15/20251 | | USD | 4,000 | | | $ | 3,866 | |
| Spirit AeroSystems, Inc. 7.50% 4/15/20251 | | | 1,640 | | | | 1,597 | |
| TransDigm, Inc. 8.00% 12/15/20251 | | | 2,000 | | | | 2,037 | |
| TransDigm, Inc. 6.25% 3/15/20261 | | | 4,700 | | | | 4,644 | |
| Union Pacific Corp. 2.80% 2/14/2032 | | | 4,500 | | | | 3,733 | |
| Union Pacific Corp. 2.95% 3/10/2052 | | | 1,823 | | | | 1,152 | |
| Union Pacific Corp. 3.95% 8/15/2059 | | | 4,500 | | | | 3,284 | |
| United Airlines, Inc. 4.375% 4/15/20261 | | | 1,080 | | | | 988 | |
| United Airlines, Inc. 4.625% 4/15/20291 | | | 875 | | | | 750 | |
| United Rentals, Inc. 4.875% 1/15/2028 | | | 2,000 | | | | 1,863 | |
| United Rentals, Inc. 4.00% 7/15/2030 | | | 1,000 | | | | 853 | |
| United Technologies Corp. 3.125% 5/4/2027 | | | 12,375 | | | | 11,305 | |
| | | | | | | | 186,241 | |
| | | | | | | | | |
| Information technology 0.11% | | | | | | | | |
| Analog Devices, Inc. 1.70% 10/1/2028 | | | 1,350 | | | | 1,117 | |
| Analog Devices, Inc. 2.10% 10/1/2031 | | | 2,576 | | | | 2,024 | |
| Apple, Inc. 3.35% 8/8/2032 | | | 5,500 | | | | 4,854 | |
| Apple, Inc. 3.95% 8/8/2052 | | | 2,814 | | | | 2,237 | |
| Black Knight, Inc. 3.625% 9/1/20281 | | | 1,880 | | | | 1,633 | |
| Block, Inc. 2.75% 6/1/2026 | | | 3,000 | | | | 2,683 | |
| Block, Inc. 3.50% 6/1/2031 | | | 6,500 | | | | 5,249 | |
| Booz Allen Hamilton, Inc. 3.875% 9/1/20281 | | | 1,125 | | | | 993 | |
| Booz Allen Hamilton, Inc. 4.00% 7/1/20291 | | | 1,505 | | | | 1,318 | |
| Broadcom, Inc. 4.00% 4/15/20291 | | | 302 | | | | 265 | |
| Broadcom, Inc. 4.75% 4/15/2029 | | | 5,000 | | | | 4,651 | |
| Broadcom, Inc. 4.15% 11/15/2030 | | | 3,000 | | | | 2,584 | |
| Broadcom, Inc. 2.45% 2/15/20311 | | | 2,905 | | | | 2,183 | |
| Broadcom, Inc. 4.15% 4/15/20321 | | | 1,054 | | | | 884 | |
| Broadcom, Inc. 2.60% 2/15/20331 | | | 2,990 | | | | 2,129 | |
| Broadcom, Inc. 3.137% 11/15/20351 | | | 205 | | | | 143 | |
| Broadcom, Inc. 3.50% 2/15/20411 | | | 2,338 | | | | 1,545 | |
| Broadcom, Inc. 3.75% 2/15/20511 | | | 1,203 | | | | 773 | |
| Entegris Escrow Corp. 4.75% 4/15/20291 | | | 6,925 | | | | 6,129 | |
| Fair Isaac Corp. 4.00% 6/15/20281 | | | 1,000 | | | | 908 | |
| Fidelity National Information Services, Inc. 3.10% 3/1/2041 | | | 212 | | | | 139 | |
| Gartner, Inc. 4.50% 7/1/20281 | | | 3,600 | | | | 3,344 | |
| Gartner, Inc. 3.625% 6/15/20291 | | | 2,000 | | | | 1,704 | |
| Global Payments, Inc. 5.30% 8/15/2029 | | | 1,000 | | | | 943 | |
| Global Payments, Inc. 2.90% 11/15/2031 | | | 937 | | | | 716 | |
| Lenovo Group, Ltd. 5.875% 4/24/2025 | | | 38,190 | | | | 37,056 | |
| Match Group Holdings II, LLC 4.125% 8/1/20301 | | | 1,000 | | | | 818 | |
| NortonLifeLock, Inc. 6.75% 9/30/20271 | | | 2,000 | | | | 1,974 | |
| Oracle Corp. 2.875% 3/25/2031 | | | 7,108 | | | | 5,609 | |
| Oracle Corp. 3.60% 4/1/2050 | | | 2,500 | | | | 1,542 | |
| Oracle Corp. 3.95% 3/25/2051 | | | 3,029 | | | | 1,987 | |
| salesforce.com, inc. 2.90% 7/15/2051 | | | 2,000 | | | | 1,291 | |
| ServiceNow, Inc. 1.40% 9/1/2030 | | | 4,090 | | | | 3,016 | |
| Unisys Corp. 6.875% 11/1/20271 | | | 1,000 | | | | 838 | |
| VeriSign, Inc. 2.70% 6/15/2031 | | | 625 | | | | 485 | |
| | | | | | | | 105,764 | |
| | | | | | | | | |
| Consumer staples 0.10% | | | | | | | | |
| 7-Eleven, Inc. 0.95% 2/10/20261 | | | 1,300 | | | | 1,119 | |
| 7-Eleven, Inc. 1.80% 2/10/20311 | | | 3,540 | | | | 2,616 | |
| 7-Eleven, Inc. 2.50% 2/10/20411 | | | 2,360 | | | | 1,438 | |
| 7-Eleven, Inc. 2.80% 2/10/20511 | | | 3,195 | | | | 1,817 | |
| Albertsons Companies, Inc. 3.50% 3/15/20291 | | | 4,290 | | | | 3,562 | |
| Altria Group, Inc. 4.40% 2/14/2026 | | | 1,173 | | | | 1,126 | |
| Altria Group, Inc. 2.45% 2/4/2032 | | | 2,000 | | | | 1,423 | |
| Altria Group, Inc. 3.875% 9/16/2046 | | | 1,756 | | | | 1,081 | |
| Altria Group, Inc. 3.70% 2/4/2051 | | | 2,604 | | | | 1,527 | |
| Anheuser-Busch InBev NV 4.75% 1/23/2029 | | | 15,000 | | | | 14,603 | |
| Anheuser-Busch InBev NV 4.60% 4/15/2048 | | | 2,500 | | | | 2,065 | |
| Anheuser-Busch InBev NV 4.50% 6/1/2050 | | | 1,500 | | | | 1,226 | |
| ARAMARK Corp. 6.375% 5/1/20251 | | | 2,000 | | | | 1,982 | |
| British American Tobacco PLC 4.70% 4/2/2027 | | | 7,862 | | | | 7,293 | |
| Bonds, notes & other debt instruments (continued) | | Principal amount
(000) | | | Value
(000) | |
| Corporate bonds, notes & loans (continued) | | | | | | | | |
| Consumer staples (continued) | | | | | | | | |
| British American Tobacco PLC 3.557% 8/15/2027 | | USD | 7,650 | | | $ | 6,666 | |
| British American Tobacco PLC 4.742% 3/16/2032 | | | 1,000 | | | | 840 | |
| British American Tobacco PLC 4.39% 8/15/2037 | | | 1,300 | | | | 944 | |
| British American Tobacco PLC 3.734% 9/25/2040 | | | 4,640 | | | | 2,928 | |
| British American Tobacco PLC 4.54% 8/15/2047 | | | 3,138 | | | | 2,032 | |
| British American Tobacco PLC 4.758% 9/6/2049 | | | 2,361 | | | | 1,580 | |
| British American Tobacco PLC 5.65% 3/16/2052 | | | 713 | | | | 540 | |
| Conagra Brands, Inc. 5.30% 11/1/2038 | | | 739 | | | | 646 | |
| Constellation Brands, Inc. 4.35% 5/9/2027 | | | 1,919 | | | | 1,833 | |
| Constellation Brands, Inc. 4.75% 5/9/2032 | | | 1,016 | | | | 948 | |
| Coty, Inc. 5.00% 4/15/20261 | | | 1,000 | | | | 940 | |
| Imperial Tobacco Finance PLC 6.125% 7/27/20271 | | | 965 | | | | 932 | |
| Kraft Heinz Company 3.00% 6/1/2026 | | | 2,072 | | | | 1,914 | |
| Kraft Heinz Company 3.875% 5/15/2027 | | | 2,795 | | | | 2,621 | |
| Kraft Heinz Company 5.20% 7/15/2045 | | | 8,000 | | | | 7,007 | |
| Kraft Heinz Company 4.375% 6/1/2046 | | | 5,000 | | | | 3,912 | |
| Kraft Heinz Company 5.50% 6/1/2050 | | | 2,177 | | | | 1,998 | |
| MARB BondCo PLC 3.95% 1/29/20311 | | | 1,677 | | | | 1,246 | |
| NBM US Holdings, Inc. 6.625% 8/6/20297 | | | 3,000 | | | | 2,784 | |
| Performance Food Group, Inc. 5.50% 10/15/20271 | | | 120 | | | | 114 | |
| Philip Morris International, Inc. 1.75% 11/1/2030 | | | 1,000 | | | | 734 | |
| Reckitt Benckiser Treasury Services PLC 2.75% 6/26/20241 | | | 2,215 | | | | 2,125 | |
| Reynolds American, Inc. 4.45% 6/12/2025 | | | 7,045 | | | | 6,804 | |
| Reynolds American, Inc. 5.85% 8/15/2045 | | | 640 | | | | 504 | |
| TreeHouse Foods, Inc. 4.00% 9/1/2028 | | | 725 | | | | 613 | |
| | | | | | | | 96,083 | |
| | | | | | | | | |
| Real estate 0.07% | | | | | | | | |
| American Tower Corp. 2.70% 4/15/2031 | | | 1,783 | | | | 1,392 | |
| American Tower Corp. 2.30% 9/15/2031 | | | 1,000 | | | | 746 | |
| American Tower Corp. 4.05% 3/15/2032 | | | 646 | | | | 553 | |
| Brookfield Property REIT, Inc. 4.50% 4/1/20271 | | | 1,975 | | | | 1,685 | |
| Corporacion Inmobiliaria Vesta, SAB de CV, 3.625% 5/13/20311 | | | 980 | | | | 717 | |
| Equinix, Inc. 2.90% 11/18/2026 | | | 6,572 | | | | 5,862 | |
| FibraSOMA 4.375% 7/22/20311 | | | 2,753 | | | | 1,734 | |
| Forestar Group, Inc. 3.85% 5/15/20261 | | | 1,000 | | | | 853 | |
| Forestar Group, Inc. 5.00% 3/1/20281 | | | 2,000 | | | | 1,657 | |
| Gaming and Leisure Properties, Inc. 4.00% 1/15/2030 | | | 2,500 | | | | 2,067 | |
| Hospitality Properties Trust 4.50% 6/15/2023 | | | 2,990 | | | | 2,953 | |
| Hospitality Properties Trust 4.50% 3/15/2025 | | | 1,965 | | | | 1,742 | |
| Hospitality Properties Trust 7.50% 9/15/2025 | | | 906 | | | | 885 | |
| Hospitality Properties Trust 3.95% 1/15/2028 | | | 4,150 | | | | 3,056 | |
| Howard Hughes Corp. 5.375% 8/1/20281 | | | 9,675 | | | | 8,300 | |
| Howard Hughes Corp. 4.375% 2/1/20311 | | | 825 | | | | 622 | |
| Iron Mountain, Inc. 4.875% 9/15/20271 | | | 1,000 | | | | 927 | |
| Iron Mountain, Inc. 5.00% 7/15/20281 | | | 2,410 | | | | 2,160 | |
| Iron Mountain, Inc. 4.875% 9/15/20291 | | | 3,085 | | | | 2,660 | |
| Iron Mountain, Inc. 4.50% 2/15/20311 | | | 955 | | | | 775 | |
| Kennedy-Wilson Holdings, Inc. 4.75% 3/1/2029 | | | 2,150 | | | | 1,749 | |
| Kennedy-Wilson Holdings, Inc. 5.00% 3/1/2031 | | | 1,125 | | | | 884 | |
| Ladder Capital Corp. 5.25% 10/1/20251 | | | 1,000 | | | | 924 | |
| RLJ Lodging Trust, LP 3.75% 7/1/20261 | | | 1,000 | | | | 915 | |
| Sun Communities Operating, LP 2.30% 11/1/2028 | | | 1,006 | | | | 802 | |
| Sun Communities Operating, LP 2.70% 7/15/2031 | | | 3,703 | | | | 2,730 | |
| Sun Communities Operating, LP 4.20% 4/15/2032 | | | 8,647 | | | | 7,104 | |
| VICI Properties, LP 3.875% 2/15/20291 | | | 1,815 | | | | 1,532 | |
| VICI Properties, LP 4.625% 12/1/20291 | | | 3,000 | | | | 2,616 | |
| VICI Properties, LP 4.125% 8/15/20301 | | | 10,645 | | | | 8,806 | |
| Westfield Corp., Ltd. 3.50% 6/15/20291 | | | 2,083 | | | | 1,670 | |
| | | | | | | | 71,078 | |
| | | | | | | | | |
| Materials 0.07% | | | | | | | | |
| Alcoa Nederland Holding BV 4.125% 3/31/20291 | | | 2,000 | | | | 1,696 | |
| Anglo American Capital PLC 2.625% 9/10/20301 | | | 2,819 | | | | 2,166 | |
| Anglo American Capital PLC 3.95% 9/10/20501 | | | 803 | | | | 531 | |
| Arconic Corp. 6.00% 5/15/20251 | | | 2,000 | | | | 1,985 | |
| Ardagh Metal Packaging Finance USA, LLC 6.00% 6/15/20271 | | | 530 | | | | 509 | |
| Bonds, notes & other debt instruments (continued) | | Principal amount
(000) | | | Value
(000) | |
| Corporate bonds, notes & loans (continued) | | | | | | | | |
| Materials (continued) | | | | | | | | |
| Avient Corp. 5.75% 5/15/20251 | | USD | 1,000 | | | $ | 980 | |
| Avient Corp. 7.125% 8/1/20301 | | | 730 | | | | 699 | |
| Axalta Coating Systems, LLC 4.75% 6/15/20271 | | | 3,675 | | | | 3,354 | |
| Ball Corp. 2.875% 8/15/2030 | | | 1,000 | | | | 778 | |
| Braskem Idesa SAPI 7.45% 11/15/20291 | | | 2,002 | | | | 1,537 | |
| Braskem SA 5.875% 1/31/20501 | | | 2,500 | | | | 1,823 | |
| CAN-PACK Spolka Akcyjna 3.875% 11/15/20291 | | | 1,500 | | | | 1,194 | |
| Celanese US Holdings, LLC 6.379% 7/15/2032 | | | 874 | | | | 796 | |
| Cleveland-Cliffs, Inc. 6.75% 3/15/20261 | | | 3,000 | | | | 2,983 | |
| Cleveland-Cliffs, Inc. 5.875% 6/1/2027 | | | 3,000 | | | | 2,797 | |
| CSN Islands XI Corp. 6.75% 1/28/2028 | | | 350 | | | | 301 | |
| CSN Resources SA 4.625% 6/10/2031 | | | 208 | | | | 139 | |
| CSN Resources SA 5.875% 4/8/2032 | | | 1,664 | | | | 1,206 | |
| CSN Resources SA 5.875% 4/8/20321 | | | 278 | | | | 202 | |
| Dow Chemical Co. 5.55% 11/30/2048 | | | 2,500 | | | | 2,167 | |
| FMG Resources 4.375% 4/1/20311 | | | 1,500 | | | | 1,195 | |
| Graphic Packaging International, Inc. 3.50% 3/15/20281 | | | 5,000 | | | | 4,331 | |
| International Flavors & Fragrances, Inc. 2.30% 11/1/20301 | | | 2,600 | | | | 1,957 | |
| LYB International Finance III, LLC 4.20% 5/1/2050 | | | 2,000 | | | | 1,378 | |
| LYB International Finance III, LLC 3.625% 4/1/2051 | | | 4,001 | | | | 2,499 | |
| Methanex Corp. 5.125% 10/15/2027 | | | 5,430 | | | | 4,966 | |
| Mineral Resources, Ltd. 8.125% 5/1/20271 | | | 1,000 | | | | 997 | |
| Mineral Resources, Ltd. 8.00% 11/1/20271 | | | 2,075 | | | | 2,044 | |
| Mosaic Co. 4.25% 11/15/2023 | | | 1,700 | | | | 1,681 | |
| Nova Chemicals Corp. 4.875% 6/1/20241 | | | 1,500 | | | | 1,462 | |
| Nova Chemicals Corp. 5.25% 6/1/20271 | | | 4,840 | | | | 4,332 | |
| Nova Chemicals Corp. 4.25% 5/15/20291 | | | 6,500 | | | | 5,316 | |
| Novelis Corp. 3.875% 8/15/20311 | | | 1,000 | | | | 777 | |
| Olin Corp. 5.00% 2/1/2030 | | | 1,850 | | | | 1,677 | |
| Sherwin-Williams Company 3.45% 6/1/2027 | | | 5,851 | | | | 5,379 | |
| South32 Treasury (USA), Ltd. 4.35% 4/14/20321 | | | 1,246 | | | | 1,044 | |
| | | | | | | | 68,878 | |
| | | | | | | | | |
| Total corporate bonds, notes & loans | | | | | | | 2,551,088 | |
| | | | | | | | | |
| Asset-backed obligations 0.72% | | | | | | | | |
| Aesop Funding, LLC, Series 2019-2A, Class D, 3.04% 9/22/20251,11 | | | 5,000 | | | | 4,514 | |
| Aesop Funding, LLC, Series 2020-1A, Class A, 2.33% 8/20/20261,11 | | | 12,814 | | | | 11,626 | |
| Aesop Funding, LLC, Series 2020-2, Class A, 2.02% 2/20/20271,11 | | | 8,090 | | | | 7,166 | |
| Aesop Funding, LLC, Series 2020-2A, Class B, 2.96% 2/20/20271,11 | | | 1,383 | | | | 1,236 | |
| AGL CLO, Ltd., Series 2022-18A, Class A1, (3-month USD CME Term SOFR + 1.32%) 5.308% 4/21/20311,8,11 | | | 1,419 | | | | 1,398 | |
| AmeriCredit Automobile Receivables Trust, Series 2022-2, Class A2B, (30-day Average USD-SOFR + 1.15%) 3.967% 12/18/20258,11 | | | 14,040 | | | | 14,040 | |
| Bankers Healthcare Group Securitization Trust, Series 2020-A, Class A, 2.56% 9/17/20311,11 | | | 151 | | | | 146 | |
| Bankers Healthcare Group Securitization Trust, Series 2020-A, Class B, 3.59% 9/17/20311,11 | | | 2,000 | | | | 1,839 | |
| Bankers Healthcare Group Securitization Trust, Series 2020-A, Class C, 5.17% 9/17/20311,11 | | | 2,000 | | | | 1,814 | |
| Blackbird Capital II Aircraft Lease, Ltd. / Blackbird Capital II Aircraft Lease US, LLC, Series 2021-1, Class B, 3.446% 7/15/20461,11 | | | 451 | | | | 337 | |
| CarMaxAuto Owner Trust, Series 2022-3, Class A2B, (30-day Average USD-SOFR + 0.77%) 3.561% 9/15/20258,11 | | | 8,122 | | | | 8,137 | |
| Castlelake Aircraft Securitization Trust, Series 2021-1, Class A, 2.868% 5/11/20371,11 | | | 2,853 | | | | 2,397 | |
| Castlelake Aircraft Securitization Trust, Series 2017-1R, Class A, 2.741% 8/15/20411,11 | | | 439 | | | | 381 | |
| CF Hippolyta, LLC, Series 2020-1, Class A1, 1.69% 7/15/20601,11 | | | 36,355 | | | | 32,006 | |
| CF Hippolyta, LLC, Series 2020-1, Class A2, 1.99% 7/15/20601,11 | | | 5,845 | | | | 4,783 | |
| CF Hippolyta, LLC, Series 2021-1, Class A1, 1.53% 3/15/20611,11 | | | 27,261 | | | | 23,406 | |
| CF Hippolyta, LLC, Series 2022-1, Class A1, 5.97% 8/15/20621,11 | | | 45,262 | | | | 44,149 | |
| CLI Funding V, LLC, Series 2020-2A, Class B, 3.56% 9/15/20451,11 | | | 280 | | | | 246 | |
| CLI Funding V, LLC, Series 2020-1A, Class B, 3.62% 9/18/20451,11 | | | 517 | | | | 451 | |
| CLI Funding VI, LLC, Series 2020-2A, Class A, 2.03% 9/15/20451,11 | | | 591 | | | | 511 | |
| CLI Funding VI, LLC, Series 2020-1A, Class A, 2.08% 9/18/20451,11 | | | 792 | | | | 681 | |
| Credit Acceptance Auto Loan Trust, Series 2020-1A, Class A, 2.01% 2/15/20291,11 | | | 613 | | | | 613 | |
| Bonds, notes & other debt instruments (continued) | | Principal amount
(000) | | | Value
(000) | |
| Asset-backed obligations (continued) | | | | | | | | |
| CWHEQ Revolving Home Equity Loan Trust, Series 2005-D, Class 2A, FSA insured, (1-month USD-LIBOR + 0.19%) 3.602% 11/15/20358,11 | | USD | 25 | | | $ | 23 | |
| CWHEQ Revolving Home Equity Loan Trust, Series 2006-F, Class 2A1A, FSA insured, (1-month USD-LIBOR + 0.14%) 3.552% 7/15/20368,11 | | | 1,486 | | | | 1,357 | |
| CWHEQ Revolving Home Equity Loan Trust, Series 2006-I, Class 2A, FSA insured, (1-month USD-LIBOR + 0.14%) 3.552% 1/15/20378,11 | | | 1,757 | | | | 1,608 | |
| CWHEQ Revolving Home Equity Loan Trust, Series 2007-B, Class A, FSA insured, (1-month USD-LIBOR + 0.15%) 3.562% 2/15/20378,11 | | | 3,752 | | | | 3,436 | |
| Drive Auto Receivables Trust, Series 2020-1, Class D, 2.70% 5/17/202711 | | | 6,757 | | | | 6,621 | |
| Exeter Automobile Receivables Trust, Series 2022-3A, Class A2, 3.45% 8/15/202411 | | | 4,900 | | | | 4,884 | |
| Exeter Automobile Receivables Trust, Series 2022-4A, Class A2, 3.99% 8/15/202411 | | | 4,471 | | | | 4,460 | |
| Exeter Automobile Receivables Trust, Series 2020-1A, Class D, 2.73% 12/15/20251,11 | | | 5,710 | | | | 5,619 | |
| FirstKey Homes Trust, Series 2020-SFR2, Class A, 1.266% 10/19/20371,11 | | | 7,839 | | | | 6,867 | |
| Ford Credit Auto Owner Trust, Series 2022-B, Class A2B, (30-day Average USD-SOFR + 0.60%) 3.391% 2/15/20258,11 | | | 6,646 | | | | 6,647 | |
| Ford Credit Auto Owner Trust, Series 2018-2, Class A, 3.47% 1/15/20301,11 | | | 22,965 | | | | 22,676 | |
| Ford Credit Auto Owner Trust, Series 2018-1, Class A, 3.19% 7/15/20311,11 | | | 40,645 | | | | 38,752 | |
| Ford Credit Auto Owner Trust, Series 2020-1, Class A, 2.04% 8/15/20311,11 | | | 9,089 | | | | 8,363 | |
| GCI Funding I, LLC, Series 2020-1, Class A, 2.82% 10/18/20451,11 | | | 50,617 | | | | 44,427 | |
| GCI Funding I, LLC, Series 2021-1, Class A, 2.38% 6/18/20461,11 | | | 4,930 | | | | 4,147 | |
| Global SC Finance V SRL, Series 2019-1A, Class B, 4.81% 9/17/20391,11 | | | 2,252 | | | | 2,086 | |
| Global SC Finance V SRL, Series 2020-1A, Class A, 2.17% 10/17/20401,11 | | | 1,170 | | | | 1,029 | |
| Global SC Finance V SRL, Series 2020-1A, Class B, 3.55% 10/17/20401,11 | | | 321 | | | | 286 | |
| GM Financial Automobile Leasing Trust, Series 2022-3, Class A2B, (30-day Average USD-SOFR + 0.71%) 3.63% 10/21/20248,11 | | | 6,893 | | | | 6,890 | |
| GM Financial Consumer Automobile Receivables Trust, Series 2022-3, Class A2B, (30-day Average USD-SOFR + 0.60%) 3.391% 9/16/20258,11 | | | 7,390 | | | | 7,391 | |
| Hertz Vehicle Financing III, LLC, Series 2021-A, Class B, 3.65% 6/30/20231,4,11 | | | 1,780 | | | | 1,712 | |
| Hertz Vehicle Financing III, LLC, Series 2021-1A, Class A, 1.21% 12/26/20251,11 | | | 13,004 | | | | 11,828 | |
| Hertz Vehicle Financing III, LLC, Series 2021-1A, Class B, 1.56% 12/26/20251,11 | | | 4,878 | | | | 4,443 | |
| Hertz Vehicle Financing III, LLC, Series 2021-1A, Class C, 2.05% 12/26/20251,11 | | | 779 | | | | 699 | |
| Hertz Vehicle Financing III, LLC, Series 2022-1A, Class C, 2.63% 6/25/20261,11 | | | 1,164 | | | | 1,021 | |
| Hertz Vehicle Financing III, LLC, Series 2021-2A, Class A, 1.68% 12/27/20271,11 | | | 14,098 | | | | 11,913 | |
| Hertz Vehicle Financing III, LLC, Series 2021-2A, Class B, 2.12% 12/27/20271,11 | | | 5,267 | | | | 4,435 | |
| Hertz Vehicle Financing III, LLC, Series 2021-2A, Class C, 2.52% 12/27/20271,11 | | | 826 | | | | 683 | |
| Hertz Vehicle Financing III, LLC, Series 2022-2A, Class C, 2.95% 6/26/20281,11 | | | 2,012 | | | | 1,605 | |
| Hyundai Auto Receivables Trust, Series 2022-B, Class A2B, (30-day Average USD-SOFR + 0.58%) 3.371% 5/15/20258,11 | | | 6,830 | | | | 6,830 | |
| Mission Lane Credit Card Master Trust, Series 2022-A, Class A, 6.92% 9/15/20271,11 | | | 2,097 | | | | 2,040 | |
| Mission Lane Credit Card Master Trust, Series 2022-A, Class B, 9.20% 9/15/20271,11 | | | 100 | | | | 97 | |
| Navient Student Loan Trust, Series 2021-A, Class A, 0.84% 5/15/20691,11 | | | 2,402 | | | | 2,031 | |
| Navient Student Loan Trust, Series 2021-C, Class A, 1.06% 10/15/20691,11 | | | 16,910 | | | | 14,439 | |
| Navigator Aircraft ABS, Ltd., Series 2021-1, Class A, 2.771% 11/15/20461,11 | | | 1,285 | | | | 1,061 | |
| Navigator Aircraft ABS, Ltd., Series 2021-1, Class B, 3.571% 11/15/20461,11 | | | 876 | | | | 596 | |
| Nelnet Student Loan Trust, Series 2021-A, Class APT1, 1.36% 4/20/20621,11 | | | 19,711 | | | | 17,165 | |
| Nelnet Student Loan Trust, Series 2021-B, Class AFX, 1.42% 4/20/20621,11 | | | 46,096 | | | | 40,249 | |
| Nelnet Student Loan Trust, Series 2021-CA, Class C, 3.36% 4/20/20621,11 | | | 1,328 | | | | 1,005 | |
| Nelnet Student Loan Trust, Series 2021-C, Class AFL, (1-month USD-LIBOR + 0.74%) 4.229% 4/20/20621,8,11 | | | 23,673 | | | | 22,670 | |
| Nelnet Student Loan Trust, Series 2021-CA, Class D, 4.44% 4/20/20621,11 | | | 1,889 | | | | 1,454 | |
| New Economy Assets Phase 1 Issuer, LLC, Series 2021-1, Class A1, 1.91% 10/20/20611,11 | | | 93,915 | | | | 78,854 | |
| Nissan Auto Lease Trust, Series 2021-A, Class A3, 0.52% 8/15/202411 | | | 18,200 | | | | 17,611 | |
| Nissan Auto Lease Trust, Series 2022-A, Class A2B, (30-day Average USD-SOFR + 0.68%) 3.471% 8/15/20248,11 | | | 17,200 | | | | 17,204 | |
| OnDeck Asset Securitization Trust, LLC, Series 2021-1A, Class A, 1.59% 5/17/20271,11 | | | 7,425 | | | | 6,841 | |
| Oportun Funding, LLC, Series 2021-B, Class A, 1.47% 5/8/20311,11 | | | 5,757 | | | | 5,029 | |
| Option One Mortgage Loan Trust, Series 2007-FXD2, Class IIA6, 5.68% 3/25/203711 | | | 873 | | | | 824 | |
| PFS Financing Corp., Series 2022-D, Class A, 4.27% 8/16/20271,11 | | | 1,364 | | | | 1,302 | |
| Santander Drive Auto Receivables Trust, Series 2022-4, Class A2, 4.05% 7/15/202511 | | | 12,800 | | | | 12,710 | |
| Santander Drive Auto Receivables Trust, Series 2022-5, Class B, 4.43% 3/15/202711 | | | 518 | | | | 502 | |
| Santander Drive Auto Receivables Trust, Series 2022-5, Class C, 4.74% 10/15/202811 | | | 484 | | | | 465 | |
| SMB Private Education Loan Trust, Series 2021-A, Class APT2, 1.07% 1/15/20531,11 | | | 5,703 | | | | 4,747 | |
| SOLRR Aircraft Aviation Holding, Ltd., Series 2021-1, Class A, 2.636% 10/15/20461,11 | | | 699 | | | | 559 | |
| Stonepeak Infrastructure Partners, Series 2021-1A, Class B, 3.821% 2/28/20331,11 | | | 1,231 | | | | 1,061 | |
| SuttonPark Structured Settlements, Series 2021-1, Class A, 1.95% 9/15/20751,11 | | | 2,120 | | | | 1,919 | |
| Textainer Marine Containers, Ltd., Series 2020-2A, Class A, 2.10% 9/20/20451,11 | | | 326 | | | | 283 | |
| Bonds, notes & other debt instruments (continued) | | Principal amount
(000) | | | Value
(000) | |
| Asset-backed obligations (continued) | | | | | | | | |
| Textainer Marine Containers, Ltd., Series 2020-2A, Class B, 3.34% 9/20/20451,11 | | USD | 953 | | | $ | 820 | |
| Toyota Auto Loan Extended Note Trust, Series 2020-1, Class A, 1.35% 5/25/20331,11 | | | 5,335 | | | | 4,800 | |
| Toyota Auto Loan Extended Note Trust, Series 2021-1, Class A, 1.07% 2/27/20341,8,11 | | | 19,538 | | | | 17,129 | |
| Toyota Auto Receivables Owner Trust, Series 2022-C, Class A2B, (1-month USD-SOFR + 0.57%) 3.361% 8/15/20258,11 | | | 2,462 | | | | 2,459 | |
| Triton Container Finance VIII, LLC, Series 2020-1, Class A, 2.11% 9/20/20451,11 | | | 1,646 | | | | 1,386 | |
| Triton Container Finance VIII, LLC, Series 2020-1, Class B, 3.74% 9/20/20451,11 | | | 658 | | | | 566 | |
| Verizon Master Trust, Series 2022-3, Class A, 3.01% 5/20/2027 (3.76% on 11/20/2023)11,13 | | | 14,780 | | | | 14,443 | |
| Volkswagen Auto Lease Trust, Series 2022-A, Class A2, 3.02% 10/21/202411 | | | 9,936 | | | | 9,776 | |
| Westlake Automobile Receivables Trust, Series 2022-2A, Class A2A, 3.36% 8/15/20251,11 | | | 11,208 | | | | 11,061 | |
| | | | | | | | | |
| Total asset-backed obligations | | | | | | | 699,773 | |
| | | | | | | | | |
| Bonds & notes of governments & government agencies outside the U.S. 0.10% | | | | | | | | |
| Dominican Republic 4.50% 1/30/20301 | | | 401 | | | | 323 | |
| Dominican Republic 6.00% 2/22/20331 | | | 510 | | | | 429 | |
| Dominican Republic 5.30% 1/21/20411 | | | 571 | | | | 396 | |
| Dominican Republic 5.875% 1/30/20601 | | | 700 | | | | 463 | |
| Panama (Republic of) 4.50% 4/1/2056 | | | 2,585 | | | | 1,704 | |
| Panama (Republic of) 4.50% 1/19/2063 | | | 690 | | | | 440 | |
| Peru (Republic of) 2.783% 1/23/2031 | | | 19,165 | | | | 15,162 | |
| Peru (Republic of) 2.78% 12/1/2060 | | | 2,950 | | | | 1,585 | |
| Peru (Republic of) 3.23% 7/28/2121 | | | 3,600 | | | | 1,927 | |
| Portuguese Republic 5.125% 10/15/2024 | | | 41,500 | | | | 41,561 | |
| Qatar (State of) 4.50% 4/23/20281 | | | 7,070 | | | | 6,928 | |
| Qatar (State of) 5.103% 4/23/20481 | | | 4,800 | | | | 4,480 | |
| Romania 3.50% 4/3/2034 | | EUR | 1,770 | | | | 1,198 | |
| Saudi Arabia (Kingdom of) 3.628% 4/20/20271 | | USD | 5,000 | | | | 4,728 | |
| Saudi Arabia (Kingdom of) 3.625% 3/4/20281 | | | 11,435 | | | | 10,656 | |
| United Mexican States 5.00% 4/27/2051 | | | 2,370 | | | | 1,799 | |
| United Mexican States 3.75% 4/19/2071 | | | 2,550 | | | | 1,467 | |
| | | | | | | | | |
| Total bonds & notes of governments & government agencies outside the U.S. | | | | | | | 95,246 | |
| | | | | | | | | |
| Federal agency bonds & notes 0.04% | | | | | | | | |
| Fannie Mae 2.125% 4/24/20269 | | | 37,230 | | | | 34,508 | |
| | | | | | | | | |
| Municipals 0.03% | | | | | | | | |
| California 0.00% | | | | | | | | |
| Golden State Tobacco Securitization Corp., Enhanced Tobacco Settlement Asset-Backed Bonds, Series 2021-B, 2.746% 6/1/2034 | | | 1,580 | | | | 1,215 | |
| | | | | | | | | |
| Illinois 0.02% | | | | | | | | |
| G.O. Bonds, Pension Funding, Series 2003, 5.10% 6/1/2033 | | | 22,485 | | | | 21,036 | |
| | | | | | | | | |
| Ohio 0.00% | | | | | | | | |
| Cleveland-Cuyahoga Port Auth., Federal Lease Rev. Bonds (VA Cleveland Health Care Center Project), Series 2021, 4.425% 5/1/2031 | | | 4,865 | | | | 4,240 | |
| Higher Educational Facs. Commission, Healthcare Fac. Rev. Bonds (Judson Obligated Group 2020 Project), Series 2020-A, 3.75% 12/1/2023 | | | 610 | | | | 601 | |
| | | | | | | | 4,841 | |
| | | | | | | | | |
| Texas 0.01% | | | | | | | | |
| Grand Parkway Transportation Corp., Grand Parkway System Toll Rev. Ref. Bonds, Series 2020-B, 3.236% 10/1/2052 | | | 8,155 | | | | 5,205 | |
| | | | | | | | | |
| Washington 0.00% | | | | | | | | |
| Energy Northwest, Electric Rev. Bonds (Columbia Generating Station), Series 2015-B, 2.814% 7/1/2024 | | | 800 | | | | 782 | |
| | | | | | | | | |
| Total municipals | | | | | | | 33,079 | |
| Total bonds, notes & other debt instruments (cost: $20,456,279,000) | | | | | | | 18,872,073 | |
| Short-term securities 9.16% | | Shares | | | Value
(000) | |
| Money market investments 8.94% | | | | | | | | |
| Capital Group Central Cash Fund 3.18%3,16 | | | 86,281,119 | | | $ | 8,626,386 | |
| | | | | | | | | |
| Money market investments purchased with collateral from securities on loan 0.22% | | | | | | | | |
| Capital Group Central Cash Fund 3.18%3,16,17 | | | 918,779 | | | | 91,860 | |
| Invesco Short-Term Investments Trust – Government & Agency Portfolio, Institutional Class 3.07%16,17 | | | 34,935,462 | | | | 34,935 | |
| Goldman Sachs Financial Square Government Fund, Institutional Shares 3.09%16,17 | | | 34,842,445 | | | | 34,842 | |
| State Street Institutional U.S. Government Money Market Fund, Premier Class 3.01%16,17 | | | 27,900,000 | | | | 27,900 | |
| Dreyfus Treasury Obligations Cash Management, Institutional Shares 3.00%16,17 | | | 12,826,780 | | | | 12,827 | |
| BlackRock Liquidity Funds – FedFund, Institutional Shares 2.87%16,17 | | | 6,400,000 | | | | 6,400 | |
| Morgan Stanley Institutional Liquidity Funds – Government Portfolio, Institutional Class 2.88%16,17 | | | 6,400,000 | | | | 6,400 | |
| | | | | | | | 215,164 | |
| | | | | | | | | |
| Total short-term securities (cost: $8,841,579,000) | | | | | | | 8,841,550 | |
| Total investment securities 105.09% (cost: $91,568,859,000) | | | | | | | 101,428,164 | |
| Other assets less liabilities (5.09)% | | | | | | | (4,914,729 | ) |
| | | | | | | | | |
| Net assets 100.00% | | | | | | $ | 96,513,435 | |
Futures contracts
| Contracts | | Type | | Number of
contracts | | Expiration | | Notional
amount
(000) | | | Value and
unrealized
(depreciation)
appreciation
at 10/31/2022
(000) | |
| 2 Year U.S. Treasury Note Futures | | Long | | 23,559 | | December 2022 | | | USD4,815,055 | | | | $ | (68,097 | ) |
| 5 Year U.S. Treasury Note Futures | | Long | | 29,920 | | December 2022 | | | 3,189,285 | | | | | (126,646 | ) |
| 10 Year U.S. Treasury Note Futures | | Short | | 2,925 | | December 2022 | | | (323,487 | ) | | | | 21,009 | |
| 10 Year Ultra U.S. Treasury Note Futures | | Short | | 3,814 | | December 2022 | | | (442,364 | ) | | | | 36,886 | |
| 20 Year U.S. Treasury Bond Futures | | Long | | 1,033 | | December 2022 | | | 124,476 | | | | | (16,426 | ) |
| 30 Year Ultra U.S. Treasury Bond Futures | | Long | | 3,128 | | December 2022 | | | 399,309 | | | | | (64,856 | ) |
| | | | | | | | | | | | | | $ | (218,130 | ) |
Forward currency contracts
| Contract amount | | | | | | Unrealized
depreciation | |
Currency purchased
(000) | | Currency sold
(000) | | Counterparty | | Settlement
date | | at 10/31/2022
(000) | |
| USD | | 370 | | EUR | | 380 | | JPMorgan Chase | | 11/16/2022 | | | $(6 | ) |
Swap contracts
Interest rate swaps
Centrally cleared interest rate swaps
| Receive | | Pay | | | | Notional | | | Value at | | | Upfront
premium | | | Unrealized
(depreciation)
appreciation | |
| Rate | | Payment
frequency | | Rate | | Payment
frequency | | Expiration
date | | amount
(000) | | | 10/31/2022
(000) | | | paid
(000) | | | at 10/31/2022
(000) | |
| 3.52647% | | Annual | | U.S. EFFR | | Annual | | 6/16/2024 | | | USD480,632 | | | $ | (8,948 | ) | | | $ — | | | $ | (8,948 | ) |
| 3.5291% | | Annual | | U.S. EFFR | | Annual | | 6/16/2024 | | | 519,368 | | | | (9,648 | ) | | | — | | | | (9,648 | ) |
Swap contracts (continued)
Interest rate swaps (continued)
Centrally cleared interest rate swaps (continued)
| Receive | | Pay | | | | Notional | | Value at | | Upfront
premium | | Unrealized
(depreciation)
appreciation | |
| Rate | | Payment
frequency | | Rate | | Payment
frequency | | Expiration
date | | amount
(000) | | 10/31/2022
(000) | | paid
(000) | | at 10/31/2022
(000) | |
| 3.497% | | Annual | | U.S. EFFR | | Annual | | 6/16/2024 | | | USD518,700 | | | $ | (9,893 | ) | | $ | — | | | $ | (9,893 | ) |
| 3.4585% | | Annual | | U.S. EFFR | | Annual | | 6/17/2024 | | | 80,177 | | | | (1,577 | ) | | | — | | | | (1,577 | ) |
| 3.4325% | | Annual | | U.S. EFFR | | Annual | | 6/17/2024 | | | 380,800 | | | | (7,643 | ) | | | — | | | | (7,643 | ) |
| 3-month USD-LIBOR | | Quarterly | | 0.619% | | Semi-annual | | 12/20/2029 | | | 739,000 | | | | 160,815 | | | | 382 | | | | 160,433 | |
| 3-month USD-LIBOR | | Quarterly | | 0.811% | | Semi-annual | | 7/27/2050 | | | 93,600 | | | | 48,104 | | | | — | | | | 48,104 | |
| | | | | | | | | | | | | | | $ | 171,210 | | | $ | 382 | | | $ | 170,828 | |
Investments in affiliates3
| | | Value of
affiliates at
11/1/2021
(000) | | | Additions
(000) | | | Reductions
(000) | | | Net
realized
gain (loss)
(000) | | | Net
unrealized
(depreciation)
appreciation
(000) | | | Value of
affiliates at
10/31/2022
(000) | | | Dividend
income
(000) | | | Capital gain
distributions
received
(000) | |
| Common stocks 2.23% | | | | | | | | | | | | | | | | | | | | | | | | | | | | | | | | |
| Financials 0.06% | | | | | | | | | | | | | | | | | | | | | | | | | | | | | | | | |
| Patria Investments, Ltd., Class A | | $ | — | | | $ | 70,223 | | | $ | — | | | $ | — | | | $ | (7,190 | ) | | $ | 63,033 | | | $ | 1,849 | | | $ | — | |
| Industrials 0.32% | | | | | | | | | | | | | | | | | | | | | | | | | | | | | | | | |
| Trinity Industries, Inc. | | | 216,322 | | | | — | | | | — | | | | — | | | | 3,702 | | | | 220,024 | | | | 7,095 | | | | — | |
| Ventia Services Group Pty, Ltd. | | | — | | | | 60,562 | | | | — | | | | — | | | | 25,988 | | | | 86,550 | | | | 3,038 | | | | — | |
| BOC Aviation, Ltd.18 | | | 313,999 | | | | — | | | | 140,096 | | | | (18,983 | ) | | | (41,259 | ) | | | — | | | | 5,918 | | | | — | |
| | | | | | | | | | | | | | | | | | | | | | | | 306,574 | | | | | | | | | |
| Real estate 1.85% | | | | | | | | | | | | | | | | | | | | | | | | | | | | | | | | |
| VICI Properties, Inc. REIT | | | 1,062,571 | | | | 589,661 | | | | 221,203 | | | | 23,335 | | | | 231,756 | | | | 1,686,120 | | | | 55,080 | | | | — | |
| POWERGRID Infrastructure Investment Trust | | | 95,526 | | | | — | | | | — | | | | — | | | | 3,181 | | | | 98,707 | | | | 10,475 | | | | — | |
| TAG Immobilien AG18 | | | 275,804 | | | | 5,355 | | | | 114,213 | | | | (69,882 | ) | | | (92,935 | ) | | | — | | | | 7,287 | | | | — | |
| | | | | | | | | | | | | | | | | | | | | | | | 1,784,827 | | | | | | | | | |
| Total common stocks | | | | | | | | | | | | | | | | | | | | | | | 2,154,434 | | | | | | | | | |
| Investment funds 2.49% | | | | | | | | | | | | | | | | | | | | | | | | | | | | | | | | |
| Capital Group Central Corporate Bond Fund | | | 3,057,906 | | | | 149,083 | | | | 134,998 | | | | (13,757 | ) | | | (655,520 | ) | | | 2,402,714 | | | | 78,474 | | | | 26,817 | |
| Short-term securities 9.03% | | | | | | | | | | | | | | | | | | | | | | | | | | | | | | | | |
| Money market investments 8.94% | | | | | | | | | | | | | | | | | | | | | | | | | | | | | | | | |
| Capital Group Central Cash Fund 3.18%16 | | | 5,194,573 | | | | 13,802,473 | | | | 10,369,470 | | | | (826 | ) | | | (364 | ) | | | 8,626,386 | | | | 88,090 | | | | — | |
| Money market investments purchased with collateral from securities on loan 0.09% | | | | | | | | | | | | | | | | | | | | | | | | | | | | | | | | |
| Capital Group Central Cash Fund 3.18%16,17 | | | 351 | | | | 91,509 | 19 | | | | | | | | | | | | | | | 91,860 | | | | — | 20 | | | — | |
| Total short-term securities | | | | | | | | | | | | | | | | | | | | | | | 8,718,246 | | | | | | | | | |
| Total 13.75% | | | | | | | | | | | | | | $ | (80,113 | ) | | $ | (532,641 | ) | | $ | 13,275,394 | | | $ | 257,306 | | | $ | 26,817 | |
Restricted securities7
| | | Acquisition
date(s) | | Cost
(000) | | | Value
(000) | | | Percent
of net
assets | |
| NBM US Holdings, Inc. 6.625% 8/6/2029 | | 4/1/2020-4/3/2020 | | $ | 2,740 | | | $ | 2,784 | | | | .00 | % |
| Sberbank of Russia PJSC4,5 | | 6/14/2022 | | | 56,809 | | | | — | 6 | | | .00 | |
| Gazprom PJSC4 | | 10/4/2022 | | | 245,009 | | | | — | 6 | | | .00 | |
| Total | | | | $ | 304,558 | | | $ | 2,784 | | | | .00 | % |
| | |
| 1 | Acquired in a transaction exempt from registration under Rule 144A of the Securities Act of 1933. May be resold in the U.S. in transactions exempt from registration, normally to qualified institutional buyers. The total value of all such securities was $2,224,421,000, which represented 2.30% of the net assets of the fund. |
| 2 | All or a portion of this security was on loan. The total value of all such securities was $233,621,000, which represented .24% of the net assets of the fund. Refer to Note 5 for more information on securities lending. |
| 3 | Affiliate of the fund or part of the same “group of investment companies” as the fund, as defined under the Investment Company Act of 1940, as amended. |
| 4 | Value determined using significant unobservable inputs. |
| 5 | Security did not produce income during the last 12 months. |
| 6 | Amount less than one thousand. |
| 7 | Restricted security, other than Rule 144A, subject to legal or contractual restrictions on resale, including securities not registered under the Securities Act of 1933. The total value of all such restricted securities was $2,784,000, which represented less than 0.01% of the net assets of the fund. |
| 8 | Coupon rate may change periodically. Reference rate and spread are as of the most recent information available. Some coupon rates are determined by the issuer or agent based on current market conditions; therefore, the reference rate and spread are not available. |
| 9 | All or a portion of this security was pledged as collateral. The total value of pledged collateral was $171,979,000, which represented .18% of the net assets of the fund. |
| 10 | Index-linked bond whose principal amount moves with a government price index. |
| 11 | Principal payments may be made periodically. Therefore, the effective maturity date may be earlier than the stated maturity date. |
| 12 | Purchased on a TBA basis. |
| 13 | Step bond; coupon rate may change at a later date. |
| 14 | Payment in kind; the issuer has the option of paying additional securities in lieu of cash. Payment methods and rates are as of the most recent payment when available. |
| 15 | Loan participations and assignments; may be subject to legal or contractual restrictions on resale. The total value of all such loans was $10,947,000, which represented .01% of the net assets of the fund. |
| 16 | Rate represents the seven-day yield at 10/31/2022. |
| 17 | Security purchased with cash collateral from securities on loan. Refer to Note 5 for more information on securities lending. |
| 18 | Affiliated issuer during the reporting period but no longer an affiliate at 10/31/2022. Refer to the investment portfolio for the security value at 10/31/2022. |
| 19 | Represents net activity. Refer to Note 5 for more information on securities lending. |
| 20 | Dividend income is included with securities lending income in the fund’s statement of operations and is not shown in this table. |
Key to abbreviations
ADR = American Depositary Receipts
Assn. = Association
Auth. = Authority
CAD = Canadian dollars
CDI = CREST Depository Interest
CLO = Collateralized Loan Obligations
CME = CME Group
CMT = Constant Maturity Treasury
EFFR = Effective Federal Funds Rate
EUR = Euros
Fac. = Facility
Facs. = Facilities
G.O. = General Obligation
GBP = British pounds
LIBOR = London Interbank Offered Rate
MXN = Mexican pesos
PIK = Payment In Kind
Ref. = Refunding
REIT = Real Estate Investment Trust
Rev. = Revenue
SDR = Swedish Depositary Receipts
SOFR = Secured Overnight Financing Rate
TBA = To be announced
USD = U.S. dollars
Refer to the notes to financial statements.
Financial statements
Statement of assets and liabilities
at October 31, 2022 | (dollars in thousands) |
| Assets: | | | | | | | | |
| Investment securities, at value (includes $233,621 of investment securities on loan): | | | | | | | | |
| Unaffiliated issuers (cost: $78,118,674) | | $ | 88,152,770 | | | | | |
| Affiliated issuers (cost: $13,450,185) | | | 13,275,394 | | | $ | 101,428,164 | |
| Cash | | | | | | | 21,744 | |
| Cash denominated in currencies other than U.S. dollars (cost: $46,033) | | | | | | | 45,817 | |
| Receivables for: | | | | | | | | |
| Sales of investments | | | 3,277,568 | | | | | |
| Sales of fund’s shares | | | 43,902 | | | | | |
| Dividends and interest | | | 425,395 | | | | | |
| Securities lending income | | | 3 | | | | | |
| Variation margin on futures contracts | | | 3,632 | | | | | |
| Variation margin on centrally cleared swap contracts | | | 4,368 | | | | 3,754,868 | |
| | | | | | | | 105,250,593 | |
| Liabilities: | | | | | | | | |
| Collateral for securities on loan | | | | | | | 215,164 | |
| Unrealized depreciation on open forward currency contracts | | | | | | | 6 | |
| Unrealized depreciation on unfunded commitments | | | | | | | 31 | |
| Payables for: | | | | | | | | |
| Purchases of investments | | | 8,334,161 | | | | | |
| Repurchases of fund’s shares | | | 70,161 | | | | | |
| Investment advisory services | | | 14,951 | | | | | |
| Services provided by related parties | | | 18,344 | | | | | |
| Trustees’ deferred compensation | | | 2,055 | | | | | |
| Variation margin on futures contracts | | | 21,462 | | | | | |
| Variation margin on centrally cleared swap contracts | | | 2,988 | | | | | |
| Other | | | 57,835 | | | | 8,521,957 | |
| Net assets at October 31, 2022 | | | | | | $ | 96,513,435 | |
| | | | | | | | | |
| Net assets consist of: | | | | | | | | |
| Capital paid in on shares of beneficial interest | | | | | | $ | 87,041,692 | |
| Total distributable earnings | | | | | | | 9,471,743 | |
| Net assets at October 31, 2022 | | | | | | $ | 96,513,435 | |
Refer to the notes to financial statements.
Financial statements (continued)
Statement of assets and liabilities
at October 31, 2022 (continued) | |
(dollars and shares in thousands, except per-share amounts)
Shares of beneficial interest issued and outstanding (no stated par value) —
unlimited shares authorized (1,596,130 total shares outstanding)
| | | Net assets | | | Shares
outstanding | | | Net asset value
per share | |
| Class A | | $ | 58,325,378 | | | | 964,464 | | | $ | 60.47 | |
| Class C | | | 1,458,291 | | | | 24,053 | | | | 60.63 | |
| Class T | | | 10 | | | | — | * | | | 60.46 | |
| Class F-1 | | | 2,097,379 | | | | 34,681 | | | | 60.48 | |
| Class F-2 | | | 12,566,072 | | | | 207,980 | | | | 60.42 | |
| Class F-3 | | | 4,857,591 | | | | 80,348 | | | | 60.46 | |
| Class 529-A | | | 2,157,929 | | | | 35,697 | | | | 60.45 | |
| Class 529-C | | | 80,379 | | | | 1,326 | | | | 60.61 | |
| Class 529-E | | | 61,243 | | | | 1,013 | | | | 60.48 | |
| Class 529-T | | | 13 | | | | — | * | | | 60.47 | |
| Class 529-F-1 | | | 11 | | | | — | * | | | 60.44 | |
| Class 529-F-2 | | | 154,924 | | | | 2,561 | | | | 60.49 | |
| Class 529-F-3 | | | 11 | | | | — | * | | | 60.47 | |
| Class R-1 | | | 56,841 | | | | 939 | | | | 60.54 | |
| Class R-2 | | | 343,747 | | | | 5,682 | | | | 60.50 | |
| Class R-2E | | | 36,645 | | | | 609 | | | | 60.20 | |
| Class R-3 | | | 612,603 | | | | 10,128 | | | | 60.49 | |
| Class R-4 | | | 430,794 | | | | 7,125 | | | | 60.46 | |
| Class R-5E | | | 81,317 | | | | 1,347 | | | | 60.38 | |
| Class R-5 | | | 252,238 | | | | 4,170 | | | | 60.50 | |
| Class R-6 | | | 12,940,019 | | | | 214,007 | | | | 60.47 | |
| * | Amount less than one thousand. |
Refer to the notes to financial statements.
Financial statements (continued)
Statement of operations
for the year ended October 31, 2022 | (dollars in thousands) |
| Investment income: | | | | | | | | |
| Income: | | | | | | | | |
| Dividends (net of non-U.S. taxes of $138,558; also includes $257,306 from affiliates) | | $ | 3,253,803 | | | | | |
| Interest from unaffiliated issuers | | | 519,614 | | | | | |
| Securities lending income (net of fees) | | | 5,002 | | | $ | 3,778,419 | |
| Fees and expenses*: | | | | | | | | |
| Investment advisory services | | | 233,758 | | | | | |
| Distribution services | | | 201,174 | | | | | |
| Transfer agent services | | | 70,581 | | | | | |
| Administrative services | | | 31,579 | | | | | |
| 529 plan services | | | 1,574 | | | | | |
| Reports to shareholders | | | 1,267 | | | | | |
| Registration statement and prospectus | | | 1,274 | | | | | |
| Trustees’ compensation | | | 119 | | | | | |
| Auditing and legal | | | 320 | | | | | |
| Custodian | | | 3,881 | | | | | |
| Other | | | 441 | | | | 545,968 | |
| Net investment income | | | | | | | 3,232,451 | |
| | | | | | | | | |
| Net realized gain and unrealized depreciation: | | | | | | | | |
| Net realized gain (loss) on: | | | | | | | | |
| Investments (net of non-U.S. taxes of $6,168): | | | | | | | | |
| Unaffiliated issuers | | | 1,560,973 | | | | | |
| Affiliated issuers | | | (80,113 | ) | | | | |
| Futures contracts | | | (346,206 | ) | | | | |
| Forward currency contracts | | | 80 | | | | | |
| Swap contracts | | | 139,936 | | | | | |
| Currency transactions | | | (7,881 | ) | | | | |
| Capital gain distributions received from affiliated issuers | | | 26,817 | | | | 1,293,606 | |
| Net unrealized (depreciation) appreciation on: | | | | | | | | |
| Investments (net of non-U.S. taxes of $47,171): | | | | | | | | |
| Unaffiliated issuers | | | (13,941,904 | ) | | | | |
| Affiliated issuers | | | (532,641 | ) | | | | |
| Futures contracts | | | (209,261 | ) | | | | |
| Forward currency contracts | | | (10 | ) | | | | |
| Swap contracts | | | 72,839 | | | | | |
| Currency translations | | | (11,942 | ) | | | (14,622,919 | ) |
| Net realized gain and unrealized depreciation | | | | | | | (13,329,313 | ) |
| | | | | | | | | |
| Net decrease in net assets resulting from operations | | | | | | $ | (10,096,862 | ) |
| * | Additional information related to class-specific fees and expenses is included in the notes to financial statements. |
Refer to the notes to financial statements.
Financial statements (continued)
| Statements of changes in net assets | (dollars in thousands) |
| | | Year ended October 31, | |
| | | 2022 | | | 2021 | |
| Operations: | | | | | | | | |
| Net investment income | | $ | 3,232,451 | | | $ | 3,399,362 | |
| Net realized gain | | | 1,293,606 | | | | 3,150,917 | |
| Net unrealized (depreciation) appreciation | | | (14,622,919 | ) | | | 17,014,248 | |
| Net (decrease) increase in net assets resulting from operations | | | (10,096,862 | ) | | | 23,564,527 | |
| | | | | | | | | |
| Distributions paid to shareholders | | | (3,677,886 | ) | | | (3,013,431 | ) |
| | | | | | | | | |
| Net capital share transactions | | | 221,678 | | | | (3,572,504 | ) |
| | | | | | | | | |
| Total (decrease) increase in net assets | | | (13,553,070 | ) | | | 16,978,592 | |
| | | | | | | | | |
| Net assets: | | | | | | | | |
| Beginning of year | | | 110,066,505 | | | | 93,087,913 | |
| End of year | | $ | 96,513,435 | | | $ | 110,066,505 | |
Refer to the notes to financial statements.
Notes to financial statements
1. Organization
Capital Income Builder (the “fund”) is registered under the Investment Company Act of 1940, as amended (the “1940 Act”), as an open-end, diversified management investment company. The fund seeks to provide a level of current income that exceeds the average yield on U.S. stocks generally and a growing stream of income over the years. Growth of capital is a secondary objective.
The fund has 21 share classes consisting of six retail share classes (Classes A, C, T, F-1, F-2 and F-3), seven 529 college savings plan share classes (Classes 529-A, 529-C, 529-E, 529-T, 529-F-1, 529-F-2 and 529-F-3) and eight retirement plan share classes (Classes R-1, R-2, R-2E, R-3, R-4, R-5E, R-5 and R-6). The 529 college savings plan share classes can be used to save for college education. The retirement plan share classes are generally offered only through eligible employer-sponsored retirement plans. The fund’s share classes are described further in the following table:
| Share class | | Initial sales
charge | | Contingent deferred sales
charge upon redemption | | Conversion feature |
| Classes A and 529-A | | Up to 5.75% for Class A; up to 3.50% for Class 529-A | | None (except 1.00% for certain redemptions within 18 months of purchase without an initial sales charge) | | None |
| Classes C and 529-C | | None | | 1.00% for redemptions within one year of purchase | | Class C converts to Class A after eight years and Class 529-C converts to Class 529-A after five years |
| Class 529-E | | None | | None | | None |
| Classes T and 529-T* | | Up to 2.50% | | None | | None |
| Classes F-1, F-2, F-3, 529-F-1, 529-F-2 and 529-F-3 | | None | | None | | None |
| Classes R-1, R-2, R-2E, R-3, R-4, R-5E, R-5 and R-6 | | None | | None | | None |
| * | Class T and 529-T shares are not available for purchase. |
Holders of all share classes have equal pro rata rights to the assets, dividends and liquidation proceeds of the fund. Each share class has identical voting rights, except for the exclusive right to vote on matters affecting only its class. Share classes have different fees and expenses (“class-specific fees and expenses”), primarily due to different arrangements for distribution, transfer agent and administrative services. Differences in class-specific fees and expenses will result in differences in net investment income and, therefore, the payment of different per-share dividends by each share class.
2. Significant accounting policies
The fund is an investment company that applies the accounting and reporting guidance issued in Topic 946 by the U.S. Financial Accounting Standards Board. The fund’s financial statements have been prepared to comply with U.S. generally accepted accounting principles (“U.S. GAAP”). These principles require the fund’s investment adviser to make estimates and assumptions that affect reported amounts and disclosures. Actual results could differ from those estimates. Subsequent events, if any, have been evaluated through the date of issuance in the preparation of the financial statements. The fund follows the significant accounting policies described in this section, as well as the valuation policies described in the next section on valuation.
Security transactions and related investment income — Security transactions are recorded by the fund as of the date the trades are executed with brokers. Realized gains and losses from security transactions are determined based on the specific identified cost of the securities. In the event a security is purchased with a delayed payment date, the fund will segregate liquid assets sufficient to meet its payment obligations. Dividend income is recognized on the ex-dividend date and interest income is recognized on an accrual basis. Market discounts, premiums and original issue discounts on fixed-income securities are amortized daily over the expected life of the security.
Class allocations — Income, fees and expenses (other than class-specific fees and expenses), realized gains and losses and unrealized appreciation and depreciation are allocated daily among the various share classes based on their relative net assets. Class-specific fees and expenses, such as distribution, transfer agent and administrative services, are charged directly to the respective share class.
Distributions paid to shareholders — Income dividends and capital gain distributions are recorded on the ex-dividend date.
Currency translation — Assets and liabilities, including investment securities, denominated in currencies other than U.S. dollars are translated into U.S. dollars at the exchange rates supplied by one or more pricing vendors on the valuation date. Purchases and sales of investment securities and income and expenses are translated into U.S. dollars at the exchange rates on the dates of such transactions. The effects of changes in exchange rates on investment securities are included with the net realized gain or loss and net unrealized appreciation or depreciation on investments in the fund’s statement of operations. The realized gain or loss and unrealized appreciation or depreciation resulting from all other transactions denominated in currencies other than U.S. dollars are disclosed separately.
3. Valuation
Capital Research and Management Company (“CRMC”), the fund’s investment adviser, values the fund’s investments at fair value as defined by U.S. GAAP. The net asset value per share is calculated once daily as of the close of regular trading on the New York Stock Exchange, normally 4 p.m. New York time, each day the New York Stock Exchange is open.
Methods and inputs — The fund’s investment adviser uses the following methods and inputs to establish the fair value of the fund’s assets and liabilities. Use of particular methods and inputs may vary over time based on availability and relevance as market and economic conditions evolve.
Equity securities, including depositary receipts, are generally valued at the official closing price of, or the last reported sale price on, the exchange or market on which such securities are traded, as of the close of business on the day the securities are being valued or, lacking any sales, at the last available bid price. Prices for each security are taken from the principal exchange or market on which the security trades.
Fixed-income securities, including short-term securities, are generally valued at evaluated prices obtained from third-party pricing vendors. Vendors value such securities based on one or more of the inputs described in the following table. The table provides examples of inputs that are commonly relevant for valuing particular classes of fixed-income securities in which the fund is authorized to invest. However, these classifications are not exclusive, and any of the inputs may be used to value any other class of fixed-income security.
| Fixed-income class | | Examples of standard inputs |
| All | | Benchmark yields, transactions, bids, offers, quotations from dealers and trading systems, new issues, spreads and other relationships observed in the markets among comparable securities; and proprietary pricing models such as yield measures calculated using factors such as cash flows, financial or collateral performance and other reference data (collectively referred to as “standard inputs”) |
| Corporate bonds, notes & loans; convertible securities | | Standard inputs and underlying equity of the issuer |
| Bonds & notes of governments & government agencies | | Standard inputs and interest rate volatilities |
| Mortgage-backed; asset-backed obligations | | Standard inputs and cash flows, prepayment information, default rates, delinquency and loss assumptions, collateral characteristics, credit enhancements and specific deal information |
| Municipal securities | | Standard inputs and, for certain distressed securities, cash flows or liquidation values using a net present value calculation based on inputs that include, but are not limited to, financial statements and debt contracts |
Securities with both fixed-income and equity characteristics, or equity securities traded principally among fixed-income dealers, are generally valued in the manner described for either equity or fixed-income securities, depending on which method is deemed most appropriate by the fund’s investment adviser. The Capital Group Central Corporate Bond Fund (“CCBF”), a fund within the Capital Group Central Fund Series II, and Capital Group Central Cash Fund (“CCF”), a fund within the Capital Group Central Fund Series (collectively the “Central Funds”), are each valued based upon a floating net asset value, which fluctuates with changes in the value of each fund’s portfolio securities. The underlying securities are valued based on the policies and procedures in the Central Funds’ statements of additional information. Exchange-traded futures are generally valued at the official settlement price of the exchange or market on which such instruments are traded, as of the close of business on the day the futures are being valued. Forward currency contracts are valued based on the spot and forward exchange rates obtained from a third-party pricing vendor. Swaps are generally valued using evaluated prices obtained from third-party pricing vendors who calculate these values based on market inputs that may include the yields of the indices referenced in the instrument and the relevant curve, dealer quotes, default probabilities and recovery rates, other reference data, and terms of the contract.
Securities and other assets for which representative market quotations are not readily available or are considered unreliable by the fund’s investment adviser are fair valued as determined in good faith under fair valuation guidelines adopted by the fund’s investment adviser and approved by the board of trustees as further described. The investment adviser follows fair valuation guidelines, consistent with U.S. Securities and Exchange Commission rules and guidance, to consider relevant principles and factors when making fair value determinations. The investment adviser considers relevant indications of value that are reasonably and timely available to it in determining the fair value to be assigned to a particular security, such as the type and cost of the security, contractual or legal restrictions on resale of the security, relevant financial or business developments of the issuer, actively traded similar or related securities, dealer or broker quotes, conversion or exchange rights on the security, related corporate actions, significant events occurring after the close of trading in the security, and changes in overall market conditions. In addition, the closing prices of equity securities that trade in markets outside U.S. time zones may be adjusted to reflect significant events that occur after the close of local trading but before the net asset value of each share class of the fund is determined. Fair valuations of investments that are not actively trading involve judgment and may differ materially from valuations that would have been used had greater market activity occurred.
Processes and structure — The fund’s board of trustees has designated the fund’s investment adviser to make fair value determinations, subject to board oversight. The investment adviser has established a Joint Fair Valuation Committee (the “Fair Valuation Committee”) to administer, implement and oversee the fair valuation process, and to make fair value decisions. The Fair Valuation Committee regularly reviews its own fair value decisions, as well as decisions made under its standing instructions to the investment adviser’s valuation team. The Fair Valuation Committee reviews changes in fair value measurements from period to period and may, as deemed appropriate, update the fair valuation guidelines to better reflect the results of back testing and address new or evolving issues. The Fair Valuation Committee reports any changes to the fair valuation guidelines to the board of trustees. The fund’s board and audit committee also regularly review reports that describe fair value determinations and methods.
The fund’s investment adviser has also established a Fixed-Income Pricing Review Group to administer and oversee the fixed-income valuation process, including the use of fixed-income pricing vendors. This group regularly reviews pricing vendor information and market data. Pricing decisions, processes and controls over security valuation are also subject to additional internal reviews facilitated by the investment adviser’s global risk management group.
Classifications — The fund’s investment adviser classifies the fund’s assets and liabilities into three levels based on the inputs used to value the assets or liabilities. Level 1 values are based on quoted prices in active markets for identical securities. Level 2 values are based on significant observable market inputs, such as quoted prices for similar securities and quoted prices in inactive markets. Certain securities trading outside the U.S. may transfer between Level 1 and Level 2 due to valuation adjustments resulting from significant market movements following the close of local trading. Level 3 values are based on significant unobservable inputs that reflect the investment adviser’s determination of assumptions that market participants might reasonably use in valuing the securities. The valuation levels are not necessarily an indication of the risk or liquidity associated with the underlying investment. For example, U.S. government securities are reflected as Level 2 because the inputs used to determine fair value may not always be quoted prices in an active market. The tables on the following page present the fund’s valuation levels as of October 31, 2022 (dollars in thousands):
| | | Investment securities | |
| | | Level 1 | | | Level 2 | | | Level 3 | | | Total | |
| Assets: | | | | | | | | | | | | | | | | |
| Common stocks: | | | | | | | | | | | | | | | | |
| Financials | | $ | 12,821,045 | | | $ | — | | | $ | 81 | | | $ | 12,821,126 | |
| Consumer staples | | | 9,907,293 | | | | — | | | | — | | | | 9,907,293 | |
| Health care | | | 9,095,153 | | | | — | | | | — | | | | 9,095,153 | |
| Information technology | | | 6,740,467 | | | | — | | | | — | | | | 6,740,467 | |
| Industrials | | | 6,593,003 | | | | — | | | | — | | | | 6,593,003 | |
| Utilities | | | 6,068,345 | | | | 49,640 | | | | — | | | | 6,117,985 | |
| Energy | | | 6,099,836 | | | | — | | | | — | * | | | 6,099,836 | |
| Real estate | | | 5,803,809 | | | | — | | | | — | | | | 5,803,809 | |
| Consumer discretionary | | | 2,617,737 | | | | — | | | | — | | | | 2,617,737 | |
| Communication services | | | 2,611,534 | | | | — | | | | — | | | | 2,611,534 | |
| Materials | | | 2,386,642 | | | | — | | | | — | | | | 2,386,642 | |
| Preferred securities | | | 43,521 | | | | 10,368 | | | | — | | | | 53,889 | |
| Rights & warrants | | | 335 | | | | — | | | | — | | | | 335 | |
| Convertible stocks | | | 463,018 | | | | — | | | | — | | | | 463,018 | |
| Investment funds | | | 2,402,714 | | | | — | | | | — | | | | 2,402,714 | |
| Bonds, notes & other debt instruments: | | | | | | | | | | | | | | | | |
| U.S. Treasury bonds & notes | | | — | | | | 8,557,253 | | | | — | | | | 8,557,253 | |
| Mortgage-backed obligations | | | — | | | | 6,895,680 | | | | 5,446 | | | | 6,901,126 | |
| Corporate bonds, notes & loans | | | — | | | | 2,551,088 | | | | — | | | | 2,551,088 | |
| Asset-backed obligations | | | — | | | | 698,061 | | | | 1,712 | | | | 699,773 | |
| Bonds & notes of governments & government agencies outside the U.S. | | | — | | | | 95,246 | | | | — | | | | 95,246 | |
| Federal agency bonds & notes | | | — | | | | 34,508 | | | | — | | | | 34,508 | |
| Municipals | | | — | | | | 33,079 | | | | — | | | | 33,079 | |
| Short-term securities | | | 8,841,550 | | | | — | | | | — | | | | 8,841,550 | |
| Total | | $ | 82,496,002 | | | $ | 18,924,923 | | | $ | 7,239 | | | $ | 101,428,164 | |
| | | | | |
| | | Other investments† | |
| | | Level 1 | | | Level 2 | | | Level 3 | | | Total | |
| Assets: | | | | | | | | | | | | | | | | |
| Unrealized appreciation on futures contracts | | $ | 57,895 | | | $ | — | | | $ | — | | | $ | 57,895 | |
| Unrealized appreciation on centrally cleared interest rate swaps | | | — | | | | 208,537 | | | | — | | | | 208,537 | |
| Liabilities: | | | | | | | | | | | | | | | | |
| Unrealized depreciation on futures contracts | | | (276,025 | ) | | | — | | | | — | | | | (276,025 | ) |
| Unrealized depreciation on open forward currency contracts | | | — | | | | (6 | ) | | | — | | | | (6 | ) |
| Unrealized depreciation on centrally cleared interest rate swaps | | | — | | | | (37,709 | ) | | | — | | | | (37,709 | ) |
| Total | | $ | (218,130 | ) | | $ | 170,822 | | | $ | — | | | $ | (47,308 | ) |
| * | Amount less than one thousand. |
| † | Futures contracts, forward currency contracts and interest rate swaps are not included in the fund’s investment portfolio. |
4. Risk factors
Investing in the fund may involve certain risks including, but not limited to, those described below.
Market conditions — The prices of, and the income generated by, the common stocks, bonds and other securities held by the fund may decline — sometimes rapidly or unpredictably — due to various factors, including events or conditions affecting the general economy or particular industries or companies; overall market changes; local, regional or global political, social or economic instability; governmental, governmental agency or central bank responses to economic conditions; and currency exchange rate, interest rate and commodity price fluctuations. These risks may be heightened in the case of smaller capitalization stocks.
Economies and financial markets throughout the world are highly interconnected. Economic, financial or political events, trading and tariff arrangements, wars, terrorism, cybersecurity events, natural disasters, public health emergencies (such as the spread of infectious disease) and other circumstances in one country or region, including actions taken by governmental or quasi-governmental authorities in response to any of the foregoing, could have impacts on global economies or markets. As a result, whether or not the fund invests in
securities of issuers located in or with significant exposure to the countries affected, the value and liquidity of the fund’s investments may be negatively affected by developments in other countries and regions.
Issuer risks — The prices of, and the income generated by, securities held by the fund may decline in response to various factors directly related to the issuers of such securities, including reduced demand for an issuer’s goods or services, poor management performance, major litigation, investigations or other controversies related to the issuer, changes in financial condition or credit rating, changes in government regulations affecting the issuer or its competitive environment and strategic initiatives such as mergers, acquisitions or dispositions and the market response to any such initiatives.
Investing in income-oriented stocks — The value of the fund’s securities and income provided by the fund may be reduced by changes in the dividend policies of, and the capital resources available for dividend payments at, the companies in which the fund invests.
Investing in debt instruments — The prices of, and the income generated by, bonds and other debt securities held by the fund may be affected by factors such as the interest rates, maturities and credit quality of these securities.
Rising interest rates will generally cause the prices of bonds and other debt securities to fall. Also, when interest rates rise, issuers are less likely to refinance existing debt securities, causing the average life of such securities to extend. A general rise in interest rates may cause investors to sell debt securities on a large scale, which could also adversely affect the price and liquidity of debt securities and could also result in increased redemptions from the fund. Falling interest rates may cause an issuer to redeem, call or refinance a debt security before its stated maturity, which may result in the fund failing to recoup the full amount of its initial investment and having to reinvest the proceeds in lower yielding securities. Longer maturity debt securities generally have greater sensitivity to changes in interest rates and may be subject to greater price fluctuations than shorter maturity debt securities.
Bonds and other debt securities are also subject to credit risk, which is the possibility that the credit strength of an issuer or guarantor will weaken or be perceived to be weaker, and/or an issuer of a debt security will fail to make timely payments of principal or interest and the security will go into default. Changes in actual or perceived creditworthiness may occur quickly. A downgrade or default affecting any of the fund’s securities could cause the value of the fund’s shares to decrease. Lower quality debt securities generally have higher rates of interest and may be subject to greater price fluctuations than higher quality debt securities. Credit risk is gauged, in part, by the credit ratings of the debt securities in which the fund invests. However, ratings are only the opinions of the rating agencies issuing them and are not guarantees as to credit quality or an evaluation of market risk. The fund’s investment adviser relies on its own credit analysts to research issuers and issues in assessing credit and default risks.
Investing outside the U.S. — Securities of issuers domiciled outside the U.S., or with significant operations or revenues outside the U.S., may lose value because of adverse political, social, economic or market developments (including social instability, regional conflicts, terrorism and war) in the countries or regions in which the issuers operate or generate revenue. These securities may also lose value due to changes in foreign currency exchange rates against the U.S. dollar and/or currencies of other countries. Issuers of these securities may be more susceptible to actions of foreign governments, such as nationalization, currency blockage or the imposition of price controls, sanctions, or punitive taxes, each of which could adversely impact the value of these securities. Securities markets in certain countries may be more volatile and/or less liquid than those in the U.S. Investments outside the U.S. may also be subject to different regulatory, legal, accounting, auditing, financial reporting and recordkeeping requirements, and may be more difficult to value, than those in the U.S. In addition, the value of investments outside the U.S. may be reduced by foreign taxes, including foreign withholding taxes on interest and dividends. Further, there may be increased risks of delayed settlement of securities purchased or sold by the fund, which could impact the liquidity of the fund’s portfolio. The risks of investing outside the U.S. may be heightened in connection with investments in emerging markets.
Management — The investment adviser to the fund actively manages the fund’s investments. Consequently, the fund is subject to the risk that the methods and analyses, including models, tools and data, employed by the investment adviser in this process may be flawed or incorrect and may not produce the desired results. This could cause the fund to lose value or its investment results to lag relevant benchmarks or other funds with similar objectives.
5. Certain investment techniques
Securities lending — The fund has entered into securities lending transactions in which the fund earns income by lending investment securities to brokers, dealers or other institutions. Each transaction involves three parties: the fund, acting as the lender of the securities, a borrower, and a lending agent that acts as an intermediary.
Securities lending transactions are entered into by the fund under a securities lending agent agreement with the lending agent. The lending agent facilitates the exchange of securities between the fund and approved borrowers, ensures that securities loans are properly coordinated and documented, marks-to-market the value of collateral daily, secures additional collateral from a borrower if it falls below preset terms, and may reinvest cash collateral on behalf of the fund according to agreed parameters. The lending agent provides indemnification to the fund against losses resulting from a borrower default. Although risk is mitigated by the collateral and indemnification, the fund could experience a delay in recovering its securities and a potential loss of income or value if a borrower fails to return securities, collateral investments decline in value or the lending agent fails to perform.
The borrower is required to post highly liquid assets, such as cash or U.S. government securities, as collateral for the loan in an amount at least equal to the value of the securities loaned. Investments made with cash collateral are recognized as assets in the fund’s investment portfolio. The same amount is recorded as a liability in the fund’s statement of assets and liabilities. While securities are on loan, the fund will continue to receive the equivalent of the interest, dividends or other distributions paid by the issuer, as well as a portion of the interest on the investment of the collateral. Additionally, although the fund does not have the right to vote on securities while they are on loan, the fund has a right to consent on corporate actions and a right to recall loaned securities to vote. A borrower is obligated to return loaned securities at the conclusion of a loan or, during the pendency of a loan, on demand from the fund.
As of October 31, 2022, the total value of securities on loan was $233,621,000, and the total value of collateral received was $243,452,000. Collateral received includes cash of $215,164,000 and U.S. government securities of $28,288,000. Investment securities purchased from cash collateral are disclosed in the fund’s investment portfolio as short-term securities. Securities received as collateral are not recognized as fund assets. The contractual maturity of cash collateral received under the securities lending agreement is classified as overnight and continuous.
Index-linked bonds — The fund has invested in index-linked bonds, which are fixed-income securities whose principal value is periodically adjusted to a government price index. Over the life of an index-linked bond, interest is paid on the adjusted principal value. Increases or decreases in the principal value of index-linked bonds are recorded as interest income in the fund’s statement of operations.
Mortgage dollar rolls — The fund has entered into mortgage dollar roll transactions in which the fund sells a mortgage-backed security to a counterparty and simultaneously enters into an agreement with the same counterparty to buy back a similar security on a specific future date at a predetermined price. Mortgage dollar rolls are accounted for as purchase and sale transactions. Portfolio turnover rates excluding and including mortgage dollar rolls are presented at the end of the fund’s financial highlights table.
Loan transactions — The fund has entered into loan transactions in which the fund acquires a loan either through an agent, by assignment from another holder, or as a participation interest in another holder’s portion of a loan. The loan is often administered by a financial institution that acts as agent for the holders of the loan, and the fund may be required to receive approval from the agent and/or borrower prior to the sale of the investment. The loan’s interest rate and maturity date may change based on the terms of the loan, including potential early payments of principal.
Unfunded commitments — The fund has participated in transactions that involve unfunded commitments, which may obligate the fund to purchase new or additional bonds if certain contingencies are met. As of October 31, 2022, the fund’s maximum exposure of unfunded bond commitments was $407,000, which would represent less than .01% of the net assets of the fund should such commitments become due. Unrealized depreciation of $31,000 is disclosed as unrealized depreciation on unfunded commitments in the fund’s statement of assets and liabilities and is included in net unrealized depreciation on investments in unaffiliated issuers in the fund’s statement of operations.
Futures contracts — The fund has entered into futures contracts, which provide for the future sale by one party and purchase by another party of a specified amount of a specific financial instrument for a specified price, date, time and place designated at the time the contract is made. Futures contracts are used to strategically manage the fund’s interest rate sensitivity by increasing or decreasing the duration of the fund or a portion of the fund’s portfolio.
Upon entering into futures contracts, and to maintain the fund’s open positions in futures contracts, the fund is required to deposit with a futures broker, known as a futures commission merchant (“FCM”), in a segregated account in the name of the FCM an amount of cash, U.S. government securities or other liquid securities, known as initial margin. The margin required for a particular futures contract is set by the exchange on which the contract is traded to serve as collateral, and may be significantly modified from time to time by the exchange during the term of the contract.
On a daily basis, the fund pays or receives variation margin based on the increase or decrease in the value of the futures contracts and records variation margin on futures contracts in the statement of assets and liabilities. Futures contracts may involve a risk of loss in excess of the variation margin shown on the fund’s statement of assets and liabilities. The fund records realized gains or losses at the time the futures contract is closed or expires. Net realized gains or losses and net unrealized appreciation or depreciation from futures contracts
are recorded in the fund’s statement of operations. The average month-end notional amount of futures contracts while held was $7,065,958,000.
Forward currency contracts — The fund has entered into forward currency contracts, which represent agreements to exchange currencies on specific future dates at predetermined rates. The fund’s investment adviser uses forward currency contracts to manage the fund’s exposure to changes in exchange rates. Upon entering into these contracts, risks may arise from the potential inability of counterparties to meet the terms of their contracts and from possible movements in exchange rates.
On a daily basis, the fund’s investment adviser values forward currency contracts and records unrealized appreciation or depreciation for open forward currency contracts in the fund’s statement of assets and liabilities. Realized gains or losses are recorded at the time the forward currency contract is closed or offset by another contract with the same broker for the same settlement date and currency.
Closed forward currency contracts that have not reached their settlement date are included in the respective receivables or payables for closed forward currency contracts in the fund’s statement of assets and liabilities. Net realized gains or losses from closed forward currency contracts and net unrealized appreciation or depreciation from open forward currency contracts are recorded in the fund’s statement of operations. The average month-end notional amount of open forward currency contracts while held was $408,000.
Swap contracts — The fund has entered into swap agreements, which are two-party contracts entered into primarily by institutional investors for a specified time period. In a typical swap transaction, two parties agree to exchange the returns earned or realized from one or more underlying assets or rates of return. Swap agreements can be traded on a swap execution facility (SEF) and cleared through a central clearinghouse (cleared), traded over-the-counter (OTC) and cleared, or traded bilaterally and not cleared. Because clearing interposes a central clearinghouse as the ultimate counterparty to each participant’s swap, and margin is required to be exchanged under the rules of the clearinghouse, central clearing is intended to decrease (but not eliminate) counterparty risk relative to uncleared bilateral swaps. To the extent the fund enters into bilaterally negotiated swap transactions, the fund will enter into swap agreements only with counterparties that meet certain credit standards and subject to agreed collateralized procedures. The term of a swap can be days, months or years and certain swaps may be less liquid than others.
Upon entering into a centrally cleared swap contract, the fund is required to deposit cash, U.S. government securities or other liquid securities, which is known as initial margin. Generally, the initial margin required for a particular swap is set and held as collateral by the clearinghouse on which the contract is cleared. The amount of initial margin required may be significantly modified from time to time by the clearinghouse during the term of the contract.
On a daily basis, interest accruals related to the exchange of future payments are recorded as a receivable and payable in the fund’s statement of assets and liabilities for centrally cleared swaps and as unrealized appreciation or depreciation in the fund’s statement of assets and liabilities for bilateral swaps. For centrally cleared swaps, the fund also pays or receives a variation margin based on the increase or decrease in the value of the swaps, including accrued interest as applicable, and records variation margin in the statement of assets and liabilities. The fund records realized gains and losses on both the net accrued interest and any gain or loss recognized at the time the swap is closed or expires. Net realized gains or losses, as well as any net unrealized appreciation or depreciation, from swaps are recorded in the fund’s statement of operations.
Swap agreements can take different forms. The fund has entered into the following types of swap agreements:
Interest rate swaps — The fund has entered into interest rate swaps, which seek to manage the interest rate sensitivity of the fund by increasing or decreasing the duration of the fund or a portion of the fund’s portfolio. An interest rate swap is an agreement between two parties to exchange or swap payments based on changes in an interest rate or rates. Typically, one interest rate is fixed and the other is variable based on a designated short-term interest rate such as the Secured Overnight Financing Rate (SOFR), prime rate or other benchmark, or on an inflation index such as the U.S. Consumer Price Index (which is a measure that examines the weighted average of prices of a basket of consumer goods and services and measures changes in the purchasing power of the U.S. dollar and the rate of inflation). In other types of interest rate swaps, known as basis swaps, the parties agree to swap variable interest rates based on different designated short-term interest rates. Interest rate swaps generally do not involve the delivery of securities or other principal amounts. Rather, cash payments are exchanged by the parties based on the application of the designated interest rates to a notional amount, which is the predetermined dollar principal of the trade upon which payment obligations are computed. Accordingly, the fund’s current obligation or right under the swap agreement is generally equal to the net amount to be paid or received under the swap agreement based on the relative value of the position held by each party. The average month-end notional amount of interest rate swaps while held was $2,606,115,000.
The following tables identify the location and fair value amounts on the fund’s statement of assets and liabilities and the effect on the fund’s statement of operations resulting from the fund’s use of futures contracts, forward currency contracts and interest rate swaps as of, or for the year ended, October 31, 2022 (dollars in thousands):
| | | | | Assets | | | Liabilities | |
| Contracts | | Risk type | | Location on statement of
assets and liabilities | | Value | | | Location on statement of
assets and liabilities | | Value | |
| Futures | | Interest | | Unrealized appreciation* | | $ | 57,895 | | | Unrealized depreciation* | | $ | 276,025 | |
| Forward currency | | Currency | | Unrealized appreciation on open forward currency contracts | | | — | | | Unrealized depreciation on open forward currency contracts | | | 6 | |
| Swap (centrally cleared) | | Interest | | Unrealized appreciation* | | | 208,537 | | | Unrealized depreciation* | | | 37,709 | |
| | | | | | | $ | 266,432 | | | | | $ | 313,740 | |
| |
| | | | | | | | | | | | | | | |
| | | | | Net realized (loss) gain | | | Net unrealized (depreciation) appreciation | |
| Contracts | | Risk type | | Location on statement of operations | | | Value | | | Location on statement of operations | | | Value | |
| Futures | | Interest | | Net realized loss on futures contracts | | $ | (346,206 | ) | | Net unrealized depreciation on futures contracts | | $ | (209,261 | ) |
| Forward currency | | Currency | | Net realized gain on forward currency contracts | | | 80 | | | Net unrealized depreciation on forward currency contracts | | | (10 | ) |
| Swap | | Interest | | Net realized gain on swap contracts | | | 139,936 | | | Net unrealized appreciation on swap contracts | | | 72,839 | |
| | | | | | | $ | (206,190 | ) | | | | $ | (136,432 | ) |
| * | Includes cumulative appreciation/depreciation on futures contracts and centrally cleared interest rate swaps as reported in the applicable tables following the fund’s investment portfolio. Only current day’s variation margin is reported within the fund’s statement of assets and liabilities. |
Collateral — The fund receives or pledges highly liquid assets, such as cash or U.S. government securities, as collateral due to securities lending and its use of futures contracts, forward currency contracts, interest rate swaps and future delivery contracts. For securities lending, the fund receives collateral in exchange for lending investment securities. The lending agent may reinvest cash collateral from securities lending transactions according to agreed parameters. Cash collateral reinvested by the lending agent, if any, is disclosed in the fund’s investment portfolio. For futures contracts and centrally cleared interest rate swaps, the fund pledges collateral for initial and variation margin by contract. For forward currency contracts, the fund either receives or pledges collateral based on the net gain or loss on unsettled contracts by counterparty. For future delivery contracts, the fund either receives or pledges collateral based on the net gain or loss on unsettled contracts by certain counterparties. The purpose of the collateral is to cover potential losses that could occur in the event that either party cannot meet its contractual obligation. Non-cash collateral pledged by the fund, if any, is disclosed in the fund’s investment portfolio, and cash collateral pledged by the fund, if any, is held in a segregated account with the fund’s custodian, which is reflected as pledged cash collateral in the fund’s statement of assets and liabilities.
Rights of offset — The fund has entered into enforceable master netting agreements with certain counterparties for forward currency contracts, where on any date amounts payable by each party to the other (in the same currency with respect to the same transaction) may be closed or offset by each party’s payment obligation. If an early termination date occurs under these agreements following an event of default or termination event, all obligations of each party to its counterparty are settled net through a single payment in a single currency (“close-out netting”). For financial reporting purposes, the fund does not offset financial assets and financial liabilities that are subject to these master netting arrangements in the statement of assets and liabilities.
The following table presents the fund’s forward currency contracts by counterparty that are subject to master netting agreements but that are not offset in the fund’s statement of assets and liabilities. The net amount column shows the impact of offsetting on the fund’s statement of assets and liabilities as of October 31, 2022, if close-out netting was exercised (dollars in thousands):
| | | Gross amounts
recognized in the | | | Gross amounts not offset in the
statement of assets and liabilities and
subject to a master netting agreement | | | | |
| Counterparty | | statement of assets
and liabilities | | | Available
to offset | | | Non-cash
collateral* | | | Cash
collateral* | | | Net
amount | |
| Liabilities: | | | | | | | | | | | | | | | | | | | | |
| JPMorgan Chase | | $ | 6 | | | $ | — | | | $ | (5 | ) | | $ | — | | | $ | 1 | |
| * | Collateral is shown on a settlement basis. |
6. Taxation and distributions
Federal income taxation — The fund complies with the requirements under Subchapter M of the Internal Revenue Code applicable to regulated investment companies and intends to distribute substantially all of its net taxable income and net capital gains each year. The fund is not subject to income taxes to the extent such distributions are made. Therefore, no federal income tax provision is required.
As of and during the year ended October 31, 2022, the fund did not have a liability for any unrecognized tax benefits. The fund recognizes interest and penalties, if any, related to unrecognized tax benefits as income tax expense in the statement of operations. During the year, the fund did not incur any significant interest or penalties.
The fund’s tax returns are generally not subject to examination by federal, state and, if applicable, non-U.S. tax authorities after the expiration of each jurisdiction’s statute of limitations, which is typically three years after the date of filing but can be extended in certain jurisdictions.
Non-U.S. taxation — Dividend and interest income are recorded net of non-U.S. taxes paid. The fund may file withholding tax reclaims in certain jurisdictions to recover a portion of amounts previously withheld. As a result of rulings from European courts, the fund filed for additional reclaims related to prior years. These reclaims are recorded when the amount is known and there are no significant uncertainties on collectability. During the year ended October 31, 2022, the fund recognized $23,226,000 in reclaims (net of $1,105,000 in fees and the effect of realized gain or loss from currency translations) and $463,000 in interest related to European court rulings, which is included in dividend income and interest income, respectively, in the fund’s statement of operations. Gains realized by the fund on the sale of securities in certain countries, if any, may be subject to non-U.S. taxes. If applicable, the fund records an estimated deferred tax liability based on unrealized gains to provide for potential non-U.S. taxes payable upon the sale of these securities.
Distributions — Distributions determined on a tax basis may differ from net investment income and net realized gains for financial reporting purposes. These differences are due primarily to different treatment for items such as currency gains and losses; short-term capital gains and losses; capital losses related to sales of certain securities within 30 days of purchase; unrealized appreciation of certain investments in securities outside the U.S.; cost of investments sold; net capital losses; amortization of premiums and discounts and income on certain investments. The fiscal year in which amounts are distributed may differ from the year in which the net investment income and net realized gains are recorded by the fund for financial reporting purposes.
During the year ended October 31, 2022, the fund reclassified $59,000 from total distributable earnings to capital paid in on shares of beneficial interest to align financial reporting with tax reporting.
As of October 31, 2022, the tax basis components of distributable earnings, unrealized appreciation (depreciation) and cost of investments were as follows (dollars in thousands):
| Undistributed ordinary income | | $ | 887,139 | |
| Capital loss carryforward* | | | (650,581 | ) |
| Gross unrealized appreciation on investments | | | 16,908,053 | |
| Gross unrealized depreciation on investments | | | (7,617,890 | ) |
| Net unrealized appreciation on investments | | | 9,290,163 | |
| Cost of investments | | | 92,090,311 | |
| * | Reflects the utilization of capital loss carryforward of $842,180,000. The capital loss carryforward will be used to offset any capital gains realized by the fund in future years. The fund will not make distributions from capital gains while a capital loss carryforward remains. |
Tax-basis distributions paid to shareholders from ordinary income were as follows (dollars in thousands):
| | | Year ended October 31 | |
| Share class | | 2022 | | | 2021 | |
| Class A | | $ | 2,204,404 | | | $ | 1,803,887 | |
| Class C | | | 48,020 | | | | 43,976 | |
| Class T | | | — | † | | | — | † |
| Class F-1 | | | 79,956 | | | | 81,851 | |
| Class F-2 | | | 475,799 | | | | 361,167 | |
| Class F-3 | | | 193,691 | | | | 151,534 | |
| Class 529-A | | | 81,529 | | | | 67,657 | |
| Class 529-C | | | 2,594 | | | | 2,541 | |
| Class 529-E | | | 2,187 | | | | 1,904 | |
| Class 529-T | | | — | † | | | — | † |
| Class 529-F-1 | | | — | † | | | 1 | |
| Class 529-F-2 | | | 5,781 | | | | 4,131 | |
| Class 529-F-3 | | | — | † | | | — | † |
| Class R-1 | | | 1,685 | | | | 1,372 | |
| Class R-2 | | | 10,303 | | | | 8,487 | |
| Class R-2E | | | 1,266 | | | | 1,045 | |
| Class R-3 | | | 21,533 | | | | 18,347 | |
| Class R-4 | | | 17,146 | | | | 14,759 | |
| Class R-5E | | | 2,841 | | | | 2,032 | |
| Class R-5 | | | 10,567 | | | | 9,247 | |
| Class R-6 | | | 518,584 | | | | 439,493 | |
| Total | | $ | 3,677,886 | | | $ | 3,013,431 | |
| † | Amount less than one thousand. |
7. Fees and transactions with related parties
CRMC, the fund’s investment adviser, is the parent company of American Funds Distributors®, Inc. (“AFD”), the principal underwriter of the fund’s shares, and American Funds Service Company® (“AFS”), the fund’s transfer agent. CRMC, AFD and AFS are considered related parties to the fund.
Investment advisory services — The fund has an investment advisory and service agreement with CRMC that provides for monthly fees accrued daily. These fees are based on a series of decreasing annual rates beginning with 0.240% on the first $1 billion of daily net assets and decreasing to 0.110% on such assets in excess of $115 billion. The agreement also provides for monthly fees, accrued daily, based on a series of decreasing rates beginning with 3.00% on the first $100,000,000 of the fund’s monthly gross income and decreasing to 2.50% on such income in excess of $100,000,000. For the year ended October 31, 2022, the investment advisory services fees were $233,758,000, which were equivalent to an annualized rate of 0.222% of average daily net assets.
Class-specific fees and expenses — Expenses that are specific to individual share classes are accrued directly to the respective share class. The principal class-specific fees and expenses are further described below:
Distribution services — The fund has plans of distribution for all share classes, except Class F-2, F-3, 529-F-2, 529-F-3, R-5E, R-5 and R-6 shares. Under the plans, the board of trustees approves certain categories of expenses that are used to finance activities primarily intended to sell fund shares and service existing accounts. The plans provide for payments, based on an annualized percentage of average daily net assets, ranging from 0.30% to 1.00% as noted in this section. In some cases, the board of trustees has limited the amounts that may be paid to less than the maximum allowed by the plans. All share classes with a plan may use up to 0.25% of average daily net assets to pay service fees, or to compensate AFD for paying service fees, to firms that have entered into agreements with AFD to provide certain shareholder services. The remaining amounts available to be paid under each plan are paid to dealers to compensate them for their sales activities.
| Share class | | Currently approved limits | Plan limits |
| Class A | | | 0.30 | % | | | 0.30 | % |
| Class 529-A | | | 0.30 | | | | 0.50 | |
| Classes C, 529-C and R-1 | | | 1.00 | | | | 1.00 | |
| Class R-2 | | | 0.75 | | | | 1.00 | |
| Class R-2E | | | 0.60 | | | | 0.85 | |
| Classes 529-E and R-3 | | | 0.50 | | | | 0.75 | |
| Classes T, F-1, 529-T, 529-F-1 and R-4 | | | 0.25 | | | | 0.50 | |
For Class A and 529-A shares, distribution-related expenses include the reimbursement of dealer and wholesaler commissions paid by AFD for certain shares sold without a sales charge. These share classes reimburse AFD for amounts billed within the prior 15 months but only to the extent that the overall annual expense limits are not exceeded. As of October 31, 2022, there were no unreimbursed expenses subject to reimbursement for Class A or 529-A shares.
Transfer agent services — The fund has a shareholder services agreement with AFS under which the fund compensates AFS for providing transfer agent services to each of the fund’s share classes. These services include recordkeeping, shareholder communications and transaction processing. In addition, the fund reimburses AFS for amounts paid to third parties for performing transfer agent services on behalf of fund shareholders.
Administrative services — The fund has an administrative services agreement with CRMC under which the fund compensates CRMC for providing administrative services to all share classes. Administrative services are provided by CRMC and its affiliates to help assist third parties providing non-distribution services to fund shareholders. These services include providing in-depth information on the fund and market developments that impact fund investments. Administrative services also include, but are not limited to, coordinating, monitoring and overseeing third parties that provide services to fund shareholders. The agreement provides the fund the ability to charge an administrative services fee at the annual rate of 0.05% of the average daily net assets attributable to each share class of the fund. Currently the fund pays CRMC an administrative services fee at the annual rate of 0.03% of the average daily net assets attributable to each share class of the fund for CRMC’s provision of administrative services.
529 plan services — Each 529 share class is subject to service fees to compensate the Virginia College Savings Plan (“Virginia529”) for its oversight and administration of the CollegeAmerica 529 college savings plan. The fees are based on the combined net assets invested in Class 529 and ABLE shares of the American Funds. Class ABLE shares are offered on other American Funds by Virginia529 through ABLEAmerica®, a tax-advantaged savings program for individuals with disabilities. Virginia529 is not considered a related party to the fund.
Prior to January 1, 2022, the quarterly fees were based on a series of decreasing annual rates beginning with 0.09% on the first $20 billion of the combined net assets invested in the American Funds and decreasing to 0.03% on such assets in excess of $100 billion. Effective January 1, 2022, the quarterly fees were amended to a series of decreasing annual rates beginning with 0.09% on the first $20 billion of the combined net assets invested in the American Funds and decreasing to 0.03% on such assets in excess of $75 billion. The fees for any given calendar quarter are accrued and calculated on the basis of the average net assets of Class 529 and ABLE shares of the American Funds for the last month of the prior calendar quarter. For the year ended October 31, 2022, the 529 plan services fees were $1,574,000, which were equivalent to 0.058% of the average daily net assets of each 529 share class.
For the year ended October 31, 2022, class-specific expenses under the agreements were as follows (dollars in thousands):
| Share class | | Distribution
services | | | Transfer agent
services | | | Administrative
services | | | 529 plan
services | |
| Class A | | | $162,423 | | | | $46,929 | | | | $19,262 | | | | Not applicable | |
| Class C | | | 17,694 | | | | 1,310 | | | | 532 | | | | Not applicable | |
| Class T | | | — | | | | — | * | | | — | * | | | Not applicable | |
| Class F-1 | | | 5,741 | | | | 3,218 | | | | 708 | | | | Not applicable | |
| Class F-2 | | | Not applicable | | | | 14,034 | | | | 3,947 | | | | Not applicable | |
| Class F-3 | | | Not applicable | | | | 39 | | | | 1,551 | | | | Not applicable | |
| Class 529-A | | | 5,514 | | | | 1,587 | | | | 718 | | | | $1,385 | |
| Class 529-C | | | 976 | | | | 66 | | | | 29 | | | | 56 | |
| Class 529-E | | | 343 | | | | 20 | | | | 21 | | | | 40 | |
| Class 529-T | | | — | | | | — | * | | | — | * | | | — | * |
| Class 529-F-1 | | | — | | | | — | * | | | — | * | | | — | * |
| Class 529-F-2 | | | Not applicable | | | | 63 | | | | 48 | | | | 93 | |
| Class 529-F-3 | | | Not applicable | | | | — | * | | | — | * | | | — | * |
| Class R-1 | | | 637 | | | | 58 | | | | 19 | | | | Not applicable | |
| Class R-2 | | | 2,895 | | | | 1,326 | | | | 116 | | | | Not applicable | |
| Class R-2E | | | 254 | | | | 86 | | | | 13 | | | | Not applicable | |
| Class R-3 | | | 3,453 | | | | 1,010 | | | | 207 | | | | Not applicable | |
| Class R-4 | | | 1,244 | | | | 485 | | | | 149 | | | | Not applicable | |
| Class R-5E | | | Not applicable | | | | 120 | | | | 24 | | | | Not applicable | |
| Class R-5 | | | Not applicable | | | | 126 | | | | 85 | | | | Not applicable | |
| Class R-6 | | | Not applicable | | | | 104 | | | | 4,150 | | | | Not applicable | |
| Total class-specific expenses | | | $201,174 | | | | $70,581 | | | | $31,579 | | | | $1,574 | |
| * | Amount less than one thousand. |
Trustees’ deferred compensation — Trustees who are unaffiliated with CRMC may elect to defer the cash payment of part or all of their compensation. These deferred amounts, which remain as liabilities of the fund, are treated as if invested in shares of the fund or other American Funds. These amounts represent general, unsecured liabilities of the fund and vary according to the total returns of the selected funds. Trustees’ compensation of $119,000 in the fund’s statement of operations reflects $564,000 in current fees (either paid in cash or deferred) and a net decrease of $445,000 in the value of the deferred amounts.
Affiliated officers and trustees — Officers and certain trustees of the fund are or may be considered to be affiliated with CRMC, AFD and AFS. No affiliated officers or trustees received any compensation directly from the fund.
Investments in CCBF and CCF — The fund holds shares of CCBF, a corporate bond fund, and CCF, an institutional prime money market fund, which are both managed by CRMC. CCBF seeks to provide maximum total return consistent with capital preservation and prudent risk management by investing primarily in corporate debt instruments. CCBF is used as an investment vehicle for the fund’s corporate bond investments. CCF invests in high-quality, short-term money market instruments. CCF is used as the primary investment vehicle for the fund’s short-term instruments. Both CCBF and CCF shares are only available for purchase by CRMC, its affiliates, and other funds managed by CRMC or its affiliates, and are not available to the public. CRMC does not receive an investment advisory services fee from either CCBF or CCF.
Security transactions with related funds — The fund purchased investment securities from, and sold investment securities to, other funds managed by CRMC (or funds managed by certain affiliates of CRMC) under procedures adopted by the fund’s board of trustees. The funds involved in such transactions are considered related by virtue of having a common investment adviser (or affiliated investment advisers), common trustees and/or common officers. Each transaction was executed at the current market price of the security and no brokerage commissions or fees were paid in accordance with Rule 17a-7 of the 1940 Act. During the year ended October 31, 2022, the fund engaged in such purchase and sale transactions with related funds in the amounts of $1,107,443,000 and $900,735,000, respectively, which generated $143,102,000 of net realized gains from such sales.
Interfund lending — Pursuant to an exemptive order issued by the SEC, the fund, along with other CRMC-managed funds (or funds managed by certain affiliates of CRMC), may participate in an interfund lending program. The program provides an alternate credit facility that permits the funds to lend or borrow cash for temporary purposes directly to or from one another, subject to the conditions of the exemptive order. The fund did not lend or borrow cash through the interfund lending program at any time during the year ended October 31, 2022.
8. Indemnifications
The fund’s organizational documents provide board members and officers with indemnification against certain liabilities or expenses in connection with the performance of their duties to the fund. In the normal course of business, the fund may also enter into contracts that provide general indemnifications. The fund’s maximum exposure under these arrangements is unknown since it is dependent on future claims that may be made against the fund. The risk of material loss from such claims is considered remote. Insurance policies are also available to the fund’s board members and officers.
9. Capital share transactions
Capital share transactions in the fund were as follows (dollars and shares in thousands):
| | | Sales* | | | Reinvestments of
distributions | | | Repurchases* | | | Net (decrease)
increase | |
| Share class | | Amount | | | Shares | | | Amount | | | Shares | | | Amount | | | Shares | | | Amount | | | Shares | |
| | | | | | | | | | | | | | |
| Year ended October 31, 2022 | | | | | | | | | | | | | |
| | | | | | | | | | | | | | | | | | | | | | | | | | | | | | | | | |
| Class A | | $ | 3,465,066 | | | | 52,358 | | | $ | 2,152,168 | | | | 32,762 | | | $ | (6,529,586 | ) | | | (99,587 | ) | | $ | (912,352 | ) | | | (14,467 | ) |
| Class C | | | 159,051 | | | | 2,387 | | | | 47,492 | | | | 717 | | | | (569,730 | ) | | | (8,621 | ) | | | (363,187 | ) | | | (5,517 | ) |
| Class T | | | — | | | | — | | | | — | | | | — | | | | — | | | | — | | | | — | | | | — | |
| Class F-1 | | | 84,636 | | | | 1,284 | | | | 78,736 | | | | 1,198 | | | | (315,063 | ) | | | (4,782 | ) | | | (151,691 | ) | | | (2,300 | ) |
| Class F-2 | | | 3,259,555 | | | | 49,796 | | | | 458,007 | | | | 6,992 | | | | (2,594,158 | ) | | | (39,749 | ) | | | 1,123,404 | | | | 17,039 | |
| Class F-3 | | | 1,014,514 | | | | 15,391 | | | | 190,957 | | | | 2,914 | | | | (941,761 | ) | | | (14,316 | ) | | | 263,710 | | | | 3,989 | |
| Class 529-A | | | 188,969 | | | | 2,853 | | | | 81,502 | | | | 1,241 | | | | (335,197 | ) | | | (5,089 | ) | | | (64,726 | ) | | | (995 | ) |
| Class 529-C | | | 17,495 | | | | 265 | | | | 2,592 | | | | 39 | | | | (44,346 | ) | | | (667 | ) | | | (24,259 | ) | | | (363 | ) |
| Class 529-E | | | 5,185 | | | | 78 | | | | 2,187 | | | | 33 | | | | (12,327 | ) | | | (185 | ) | | | (4,955 | ) | | | (74 | ) |
| Class 529-T | | | — | | | | — | | | | — | † | | | — | † | | | — | | | | — | | | | — | † | | | — | † |
| Class 529-F-1 | | | — | | | | — | | | | — | † | | | — | † | | | — | | | | — | | | | — | † | | | — | † |
| Class 529-F-2 | | | 37,272 | | | | 561 | | | | 5,780 | | | | 88 | | | | (21,821 | ) | | | (332 | ) | | | 21,231 | | | | 317 | |
| Class 529-F-3 | | | — | | | | — | | | | — | † | | | — | † | | | — | | | | — | | | | — | † | | | — | † |
| Class R-1 | | | 11,274 | | | | 169 | | | | 1,685 | | | | 25 | | | | (16,586 | ) | | | (248 | ) | | | (3,627 | ) | | | (54 | ) |
| Class R-2 | | | 62,429 | | | | 946 | | | | 10,287 | | | | 156 | | | | (97,827 | ) | | | (1,482 | ) | | | (25,111 | ) | | | (380 | ) |
| Class R-2E | | | 7,901 | | | | 120 | | | | 1,266 | | | | 19 | | | | (12,763 | ) | | | (196 | ) | | | (3,596 | ) | | | (57 | ) |
| Class R-3 | | | 101,417 | | | | 1,533 | | | | 21,473 | | | | 326 | | | | (168,818 | ) | | | (2,558 | ) | | | (45,928 | ) | | | (699 | ) |
| Class R-4 | | | 82,790 | | | | 1,245 | | | | 17,144 | | | | 260 | | | | (152,062 | ) | | | (2,306 | ) | | | (52,128 | ) | | | (801 | ) |
| Class R-5E | | | 26,919 | | | | 416 | | | | 2,841 | | | | 44 | | | | (16,208 | ) | | | (249 | ) | | | 13,552 | | | | 211 | |
| Class R-5 | | | 34,049 | | | | 513 | | | | 10,549 | | | | 161 | | | | (64,713 | ) | | | (973 | ) | | | (20,115 | ) | | | (299 | ) |
| Class R-6 | | | 1,014,868 | | | | 15,516 | | | | 518,577 | | | | 7,908 | | | | (1,061,989 | ) | | | (16,080 | ) | | | 471,456 | | | | 7,344 | |
| Total net increase (decrease) | | $ | 9,573,390 | | | | 145,431 | | | $ | 3,603,243 | | | | 54,883 | | | $ | (12,954,955 | ) | | | (197,420 | ) | | $ | 221,678 | | | | 2,894 | |
Refer to the end of the table for footnotes.
| | | Sales* | | | Reinvestments of
distributions | | | Repurchases* | | | Net (decrease)
increase | |
| Share class | | Amount | | | Shares | | | Amount | | | Shares | | | Amount | | | Shares | | | Amount | | | Shares | |
| | | | | | | | | | | | | | |
| Year ended October 31, 2021 | | | | | | | | | | | | | |
| | | | | | | | | | | | | | | | | | | | | | | | | | | | | | | | | |
| Class A | | $ | 4,147,577 | | | | 62,401 | | | $ | 1,761,839 | | | | 26,703 | | | $ | (7,428,785 | ) | | | (112,837 | ) | | $ | (1,519,369 | ) | | | (23,733 | ) |
| Class C | | | 180,636 | | | | 2,719 | | | | 43,493 | | | | 661 | | | | (700,412 | ) | | | (10,587 | ) | | | (476,283 | ) | | | (7,207 | ) |
| Class T | | | — | | | | — | | | | — | | | | — | | | | — | | | | — | | | | — | | | | — | |
| Class F-1 | | | 88,375 | | | | 1,338 | | | | 79,389 | | | | 1,209 | | | | (1,280,260 | ) | | | (19,239 | ) | | | (1,112,496 | ) | | | (16,692 | ) |
| Class F-2 | | | 2,865,178 | | | | 43,285 | | | | 346,551 | | | | 5,249 | | | | (2,435,458 | ) | | | (36,912 | ) | | | 776,271 | | | | 11,622 | |
| Class F-3 | | | 972,972 | | | | 14,726 | | | | 148,683 | | | | 2,250 | | | | (873,388 | ) | | | (13,220 | ) | | | 248,267 | | | | 3,756 | |
| Class 529-A | | | 206,621 | | | | 3,129 | | | | 67,639 | | | | 1,026 | | | | (381,089 | ) | | | (5,771 | ) | | | (106,829 | ) | | | (1,616 | ) |
| Class 529-C | | | 20,204 | | | | 306 | | | | 2,540 | | | | 39 | | | | (59,112 | ) | | | (895 | ) | | | (36,368 | ) | | | (550 | ) |
| Class 529-E | | | 6,284 | | | | 96 | | | | 1,904 | | | | 29 | | | | (15,747 | ) | | | (238 | ) | | | (7,559 | ) | | | (113 | ) |
| Class 529-T | | | — | | | | — | | | | — | † | | | — | † | | | — | | | | — | | | | — | † | | | — | † |
| Class 529-F-1 | | | 10 | | | | — | † | | | — | † | | | — | † | | | (40 | ) | | | (1 | ) | | | (30 | ) | | | (1 | ) |
| Class 529-F-2 | | | 37,248 | | | | 564 | | | | 4,129 | | | | 62 | | | | (22,175 | ) | | | (335 | ) | | | 19,202 | | | | 291 | |
| Class 529-F-3 | | | — | | | | — | | | | — | † | | | — | † | | | — | | | | — | | | | — | † | | | — | † |
| Class R-1 | | | 7,665 | | | | 115 | | | | 1,372 | | | | 21 | | | | (15,342 | ) | | | (232 | ) | | | (6,305 | ) | | | (96 | ) |
| Class R-2 | | | 63,887 | | | | 964 | | | | 8,476 | | | | 129 | | | | (114,272 | ) | | | (1,735 | ) | | | (41,909 | ) | | | (642 | ) |
| Class R-2E | | | 10,256 | | | | 157 | | | | 1,045 | | | | 16 | | | | (14,070 | ) | | | (214 | ) | | | (2,769 | ) | | | (41 | ) |
| Class R-3 | | | 108,167 | | | | 1,635 | | | | 18,303 | | | | 278 | | | | (197,768 | ) | | | (2,997 | ) | | | (71,298 | ) | | | (1,084 | ) |
| Class R-4 | | | 89,575 | | | | 1,350 | | | | 14,697 | | | | 223 | | | | (134,980 | ) | | | (2,051 | ) | | | (30,708 | ) | | | (478 | ) |
| Class R-5E | | | 26,235 | | | | 400 | | | | 2,032 | | | | 31 | | | | (17,407 | ) | | | (264 | ) | | | 10,860 | | | | 167 | |
| Class R-5 | | | 33,764 | | | | 507 | | | | 9,235 | | | | 140 | | | | (67,194 | ) | | | (1,027 | ) | | | (24,195 | ) | | | (380 | ) |
| Class R-6 | | | 2,287,607 | | | | 34,864 | | | | 439,177 | | | | 6,669 | | | | (3,917,770 | ) | | | (58,748 | ) | | | (1,190,986 | ) | | | (17,215 | ) |
| Total net increase (decrease) | | $ | 11,152,261 | | | | 168,556 | | | $ | 2,950,504 | | | | 44,735 | | | $ | (17,675,269 | ) | | | (267,303 | ) | | $ | (3,572,504 | ) | | | (54,012 | ) |
| * | Includes exchanges between share classes of the fund. |
| † | Amount less than one thousand. |
10. Investment transactions
The fund engaged in purchases and sales of investment securities, excluding short-term securities and U.S. government obligations, if any, of $84,320,265,000 and $85,840,690,000, respectively, during the year ended October 31, 2022.
Financial highlights
| | | | | | (Loss) income from
investment operations1 | | | Dividends and distributions | | | | | | | | | | | | | | | | | | | |
| Year ended | | Net asset
value,
beginning
of year | | | Net
investment
income | | | Net (losses)
gains on
securities
(both
realized and
unrealized) | | | Total from
investment
operations | | | Dividends
(from net
investment
income) | | | Distributions
(from capital
gains) | | | Total
dividends
and
distributions | | | Net asset
value,
end
of year | | | Total return2,3 | | | Net assets,
end of
year
(in millions) | | | Ratio of
expenses to
average net
assets before
reimburse-
ments4 | | | Ratio of
expenses to
average net
assets after
reimburse-
ments3,4 | | | Ratio of
net income
to average
net assets3 | |
| Class A: | | | | | | | | | | | | | | | | | | | | | | | | | | | | | | | | | | | | | | | |
| 10/31/2022 | | $ | 69.09 | | | $ | 1.98 | | | $ | (8.33 | ) | | $ | (6.35 | ) | | $ | (2.27 | ) | | $ | — | | | $ | (2.27 | ) | | $ | 60.47 | | | | (9.42 | )% | | $ | 58,325 | | | | .59 | % | | | .59 | % | | | 3.00 | % |
| 10/31/2021 | | | 56.52 | | | | 2.07 | | | | 12.33 | | | | 14.40 | | | | (1.83 | ) | | | — | | | | (1.83 | ) | | | 69.09 | | | | 25.67 | | | | 67,634 | | | | .59 | | | | .59 | | | | 3.12 | |
| 10/31/2020 | | | 61.99 | | | | 1.96 | | | | (4.74 | ) | | | (2.78 | ) | | | (2.09 | ) | | | (.60 | ) | | | (2.69 | ) | | | 56.52 | | | | (4.55 | ) | | | 56,666 | | | | .61 | | | | .61 | | | | 3.31 | |
| 10/31/2019 | | | 58.01 | | | | 1.94 | | | | 4.18 | | | | 6.12 | | | | (2.14 | ) | | | — | | | | (2.14 | ) | | | 61.99 | | | | 10.79 | | | | 65,201 | | | | .60 | | | | .60 | | | | 3.23 | |
| 10/31/2018 | | | 62.81 | | | | 1.95 | | | | (3.81 | ) | | | (1.86 | ) | | | (2.15 | ) | | | (.79 | ) | | | (2.94 | ) | | | 58.01 | | | | (3.16 | ) | | | 63,346 | | | | .58 | | | | .58 | | | | 3.18 | |
| Class C: | | | | | | | | | | | | | | | | | | | | | | | | | | | | | | | | | | | | | | | | | | | | | | | | | | | | |
| 10/31/2022 | | | 69.23 | | | | 1.49 | | | | (8.34 | ) | | | (6.85 | ) | | | (1.75 | ) | | | — | | | | (1.75 | ) | | | 60.63 | | | | (10.07 | ) | | | 1,458 | | | | 1.33 | | | | 1.33 | | | | 2.25 | |
| 10/31/2021 | | | 56.63 | | | | 1.57 | | | | 12.36 | | | | 13.93 | | | | (1.33 | ) | | | — | | | | (1.33 | ) | | | 69.23 | | | | 24.72 | | | | 2,047 | | | | 1.34 | | | | 1.34 | | | | 2.37 | |
| 10/31/2020 | | | 62.07 | | | | 1.52 | | | | (4.73 | ) | | | (3.21 | ) | | | (1.63 | ) | | | (.60 | ) | | | (2.23 | ) | | | 56.63 | | | | (5.26 | ) | | | 2,083 | | | | 1.35 | | | | 1.35 | | | | 2.55 | |
| 10/31/2019 | | | 58.07 | | | | 1.48 | | | | 4.19 | | | | 5.67 | | | | (1.67 | ) | | | — | | | | (1.67 | ) | | | 62.07 | | | | 9.95 | | | | 3,401 | | | | 1.36 | | | | 1.36 | | | | 2.47 | |
| 10/31/2018 | | | 62.86 | | | | 1.47 | | | | (3.83 | ) | | | (2.36 | ) | | | (1.64 | ) | | | (.79 | ) | | | (2.43 | ) | | | 58.07 | | | | (3.94 | ) | | | 3,889 | | | | 1.37 | | | | 1.37 | | | | 2.39 | |
| Class T: | | | | | | | | | | | | | | | | | | | | | | | | | | | | | | | | | | | | | | | | | | | | | | | | | | | | |
| 10/31/2022 | | | 69.08 | | | | 2.14 | | | | (8.32 | ) | | | (6.18 | ) | | | (2.44 | ) | | | — | | | | (2.44 | ) | | | 60.46 | | | | (9.18 | )5 | | | — | 6 | | | .33 | 5 | | | .33 | 5 | | | 3.26 | 5 |
| 10/31/2021 | | | 56.52 | | | | 2.23 | | | | 12.33 | | | | 14.56 | | | | (2.00 | ) | | | — | | | | (2.00 | ) | | | 69.08 | | | | 25.96 | 5 | | | — | 6 | | | .34 | 5 | | | .34 | 5 | | | 3.37 | 5 |
| 10/31/2020 | | | 62.00 | | | | 2.11 | | | | (4.75 | ) | | | (2.64 | ) | | | (2.24 | ) | | | (.60 | ) | | | (2.84 | ) | | | 56.52 | | | | (4.31 | )5 | | | — | 6 | | | .35 | 5 | | | .35 | 5 | | | 3.57 | 5 |
| 10/31/2019 | | | 58.02 | | | | 2.08 | | | | 4.18 | | | | 6.26 | | | | (2.28 | ) | | | — | | | | (2.28 | ) | | | 62.00 | | | | 11.06 | 5 | | | — | 6 | | | .36 | 5 | | | .36 | 5 | | | 3.48 | 5 |
| 10/31/2018 | | | 62.83 | | | | 2.09 | | | | (3.83 | ) | | | (1.74 | ) | | | (2.28 | ) | | | (.79 | ) | | | (3.07 | ) | | | 58.02 | | | | (2.96 | )5 | | | — | 6 | | | .36 | 5 | | | .36 | 5 | | | 3.40 | 5 |
| Class F-1: | | | | | | | | | | | | | | | | | | | | | | | | | | | | | | | | | | | | | | | | | | | | | | | | | | | | |
| 10/31/2022 | | | 69.09 | | | | 1.94 | | | | (8.33 | ) | | | (6.39 | ) | | | (2.22 | ) | | | — | | | | (2.22 | ) | | | 60.48 | | | | (9.46 | ) | | | 2,097 | | | | .64 | | | | .64 | | | | 2.95 | |
| 10/31/2021 | | | 56.51 | | | | 2.02 | | | | 12.35 | | | | 14.37 | | | | (1.79 | ) | | | — | | | | (1.79 | ) | | | 69.09 | | | | 25.61 | | | | 2,555 | | | | .65 | | | | .65 | | | | 3.06 | |
| 10/31/2020 | | | 61.98 | | | | 1.93 | | | | (4.74 | ) | | | (2.81 | ) | | | (2.06 | ) | | | (.60 | ) | | | (2.66 | ) | | | 56.51 | | | | (4.61 | ) | | | 3,033 | | | | .65 | | | | .65 | | | | 3.26 | |
| 10/31/2019 | | | 58.00 | | | | 1.90 | | | | 4.18 | | | | 6.08 | | | | (2.10 | ) | | | — | | | | (2.10 | ) | | | 61.98 | | | | 10.72 | | | | 4,013 | | | | .66 | | | | .66 | | | | 3.17 | |
| 10/31/2018 | | | 62.81 | | | | 1.91 | | | | (3.83 | ) | | | (1.92 | ) | | | (2.10 | ) | | | (.79 | ) | | | (2.89 | ) | | | 58.00 | | | | (3.26 | ) | | | 3,996 | | | | .66 | | | | .66 | | | | 3.11 | |
| Class F-2: | | | | | | | | | | | | | | | | | | | | | | | | | | | | | | | | | | | | | | | | | | | | | | | | | | | | |
| 10/31/2022 | | | 69.03 | | | | 2.12 | | | | (8.32 | ) | | | (6.20 | ) | | | (2.41 | ) | | | — | | | | (2.41 | ) | | | 60.42 | | | | (9.21 | ) | | | 12,566 | | | | .37 | | | | .37 | | | | 3.23 | |
| 10/31/2021 | | | 56.47 | | | | 2.22 | | | | 12.32 | | | | 14.54 | | | | (1.98 | ) | | | — | | | | (1.98 | ) | | | 69.03 | | | | 25.95 | | | | 13,182 | | | | .37 | | | | .37 | | | | 3.34 | |
| 10/31/2020 | | | 61.95 | | | | 2.09 | | | | (4.75 | ) | | | (2.66 | ) | | | (2.22 | ) | | | (.60 | ) | | | (2.82 | ) | | | 56.47 | | | | (4.35 | ) | | | 10,126 | | | | .38 | | | | .38 | | | | 3.54 | |
| 10/31/2019 | | | 57.97 | | | | 2.05 | | | | 4.19 | | | | 6.24 | | | | (2.26 | ) | | | — | | | | (2.26 | ) | | | 61.95 | | | | 11.03 | | | | 11,155 | | | | .39 | | | | .39 | | | | 3.43 | |
| 10/31/2018 | | | 62.78 | | | | 2.06 | | | | (3.82 | ) | | | (1.76 | ) | | | (2.26 | ) | | | (.79 | ) | | | (3.05 | ) | | | 57.97 | | | | (3.00 | ) | | | 9,869 | | | | .39 | | | | .39 | | | | 3.37 | |
| Class F-3: | | | | | | | | | | | | | | | | | | | | | | | | | | | | | | | | | | | | | | | | | | | | | | | | | | | | |
| 10/31/2022 | | | 69.08 | | | | 2.19 | | | | (8.33 | ) | | | (6.14 | ) | | | (2.48 | ) | | | — | | | | (2.48 | ) | | | 60.46 | | | | (9.12 | ) | | | 4,858 | | | | .26 | | | | .26 | | | | 3.33 | |
| 10/31/2021 | | | 56.50 | | | | 2.29 | | | | 12.33 | | | | 14.62 | | | | (2.04 | ) | | | — | | | | (2.04 | ) | | | 69.08 | | | | 26.09 | | | | 5,275 | | | | .27 | | | | .27 | | | | 3.45 | |
| 10/31/2020 | | | 61.98 | | | | 2.15 | | | | (4.74 | ) | | | (2.59 | ) | | | (2.29 | ) | | | (.60 | ) | | | (2.89 | ) | | | 56.50 | | | | (4.24 | ) | | | 4,102 | | | | .28 | | | | .28 | | | | 3.64 | |
| 10/31/2019 | | | 58.01 | | | | 2.12 | | | | 4.17 | | | | 6.29 | | | | (2.32 | ) | | | — | | | | (2.32 | ) | | | 61.98 | | | | 11.12 | | | | 4,401 | | | | .29 | | | | .29 | | | | 3.54 | |
| 10/31/2018 | | | 62.81 | | | | 2.13 | | | | (3.82 | ) | | | (1.69 | ) | | | (2.32 | ) | | | (.79 | ) | | | (3.11 | ) | | | 58.01 | | | | (2.88 | ) | | | 3,723 | | | | .29 | | | | .29 | | | | 3.47 | |
| Class 529-A: | | | | | | | | | | | | | | | | | | | | | | | | | | | | | | | | | | | | | | | | | | | | | | | | | | |
| 10/31/2022 | | | 69.06 | | | | 1.96 | | | | (8.32 | ) | | | (6.36 | ) | | | (2.25 | ) | | | — | | | | (2.25 | ) | | | 60.45 | | | | (9.45 | ) | | | 2,158 | | | | .61 | | | | .61 | | | | 2.98 | |
| 10/31/2021 | | | 56.49 | | | | 2.04 | | | | 12.33 | | | | 14.37 | | | | (1.80 | ) | | | — | | | | (1.80 | ) | | | 69.06 | | | | 25.61 | | | | 2,534 | | | | .63 | | | | .63 | | | | 3.08 | |
| 10/31/2020 | | | 61.96 | | | | 1.93 | | | | (4.73 | ) | | | (2.80 | ) | | | (2.07 | ) | | | (.60 | ) | | | (2.67 | ) | | | 56.49 | | | | (4.59 | ) | | | 2,164 | | | | .65 | | | | .65 | | | | 3.27 | |
| 10/31/2019 | | | 57.99 | | | | 1.90 | | | | 4.17 | | | | 6.07 | | | | (2.10 | ) | | | — | | | | (2.10 | ) | | | 61.96 | | | | 10.71 | | | | 2,306 | | | | .66 | | | | .66 | | | | 3.17 | |
| 10/31/2018 | | | 62.79 | | | | 1.91 | | | | (3.82 | ) | | | (1.91 | ) | | | (2.10 | ) | | | (.79 | ) | | | (2.89 | ) | | | 57.99 | | | | (3.24 | ) | | | 2,238 | | | | .66 | | | | .66 | | | | 3.11 | |
Refer to the end of the table for footnotes.
Financial highlights (continued)
| | | | | | (Loss) income from
investment operations1 | | | Dividends and distributions | | | | | | | | | | | | | | | | | | | |
| Year ended | | Net asset
value,
beginning
of year | | | Net
investment
income | | | Net (losses)
gains on
securities
(both
realized and
unrealized) | | | Total from
investment
operations | | | Dividends
(from net
investment
income) | | | Distributions
(from capital
gains) | | | Total
dividends
and
distributions | | | Net asset
value,
end
of year | | | Total return2,3 | | | Net assets,
end of
year
(in millions) | | | Ratio of
expenses to
average net
assets before
reimburse-
ments4 | | | Ratio of
expenses to
average net
assets after
reimburse-
ments3,4 | | | Ratio of
net income
to average
net assets3 | |
| Class 529-C: | | | | | | | | | | | | | | | | | | | | | | | | | | | | | | | | | | | | | | | |
| 10/31/2022 | | $ | 69.21 | | | $ | 1.45 | | | $ | (8.34 | ) | | $ | (6.89 | ) | | $ | (1.71 | ) | | $ | — | | | $ | (1.71 | ) | | $ | 60.61 | | | | (10.13 | )% | | $ | 80 | | | | 1.38 | % | | | 1.38 | % | | | 2.19 | % |
| 10/31/2021 | | | 56.61 | | | | 1.55 | | | | 12.36 | | | | 13.91 | | | | (1.31 | ) | | | — | | | | (1.31 | ) | | | 69.21 | | | | 24.70 | | | | 117 | | | | 1.37 | | | | 1.37 | | | | 2.33 | |
| 10/31/2020 | | | 62.02 | | | | 1.50 | | | | (4.73 | ) | | | (3.23 | ) | | | (1.58 | ) | | | (.60 | ) | | | (2.18 | ) | | | 56.61 | | | | (5.29 | ) | | | 127 | | | | 1.38 | | | | 1.38 | | | | 2.52 | |
| 10/31/2019 | | | 58.03 | | | | 1.46 | | | | 4.17 | | | | 5.63 | | | | (1.64 | ) | | | — | | | | (1.64 | ) | | | 62.02 | | | | 9.89 | | | | 375 | | | | 1.40 | | | | 1.40 | | | | 2.44 | |
| 10/31/2018 | | | 62.77 | | | | 1.43 | | | | (3.81 | ) | | | (2.38 | ) | | | (1.57 | ) | | | (.79 | ) | | | (2.36 | ) | | | 58.03 | | | | (3.97 | ) | | | 425 | | | | 1.42 | | | | 1.42 | | | | 2.33 | |
| Class 529-E: | | | | | | | | | | | | | | | | | | | | | | | | | | | | | | | | | | | | | | | | | | | | | | | | | | | | |
| 10/31/2022 | | | 69.09 | | | | 1.80 | | | | (8.32 | ) | | | (6.52 | ) | | | (2.09 | ) | | | — | | | | (2.09 | ) | | | 60.48 | | | | (9.65 | ) | | | 61 | | | | .85 | | | | .85 | | | | 2.74 | |
| 10/31/2021 | | | 56.51 | | | | 1.89 | | | | 12.35 | | | | 14.24 | | | | (1.66 | ) | | | — | | | | (1.66 | ) | | | 69.09 | | | | 25.35 | | | | 75 | | | | .85 | | | | .85 | | | | 2.86 | |
| 10/31/2020 | | | 61.98 | | | | 1.81 | | | | (4.75 | ) | | | (2.94 | ) | | | (1.93 | ) | | | (.60 | ) | | | (2.53 | ) | | | 56.51 | | | | (4.80 | ) | | | 68 | | | | .86 | | | | .86 | | | | 3.05 | |
| 10/31/2019 | | | 58.00 | | | | 1.77 | | | | 4.18 | | | | 5.95 | | | | (1.97 | ) | | | — | | | | (1.97 | ) | | | 61.98 | | | | 10.47 | | | | 82 | | | | .88 | | | | .88 | | | | 2.96 | |
| 10/31/2018 | | | 62.79 | | | | 1.77 | | | | (3.81 | ) | | | (2.04 | ) | | | (1.96 | ) | | | (.79 | ) | | | (2.75 | ) | | | 58.00 | | | | (3.45 | ) | | | 84 | | | | .88 | | | | .88 | | | | 2.88 | |
| Class 529-T: | | | | | | | | | | | | | | | | | | | | | | | | | | | | | | | | | | | | | | | | | | | | | | | | | | | | |
| 10/31/2022 | | | 69.08 | | | | 2.12 | | | | (8.32 | ) | | | (6.20 | ) | | | (2.41 | ) | | | — | | | | (2.41 | ) | | | 60.47 | | | | (9.22 | )5 | | | — | 6 | | | .37 | 5 | | | .37 | 5 | | | 3.22 | 5 |
| 10/31/2021 | | | 56.52 | | | | 2.19 | | | | 12.33 | | | | 14.52 | | | | (1.96 | ) | | | — | | | | (1.96 | ) | | | 69.08 | | | | 25.89 | 5 | | | — | 6 | | | .40 | 5 | | | .40 | 5 | | | 3.31 | 5 |
| 10/31/2020 | | | 62.00 | | | | 2.08 | | | | (4.75 | ) | | | (2.67 | ) | | | (2.21 | ) | | | (.60 | ) | | | (2.81 | ) | | | 56.52 | | | | (4.37 | )5 | | | — | 6 | | | .41 | 5 | | | .41 | 5 | | | 3.51 | 5 |
| 10/31/2019 | | | 58.02 | | | | 2.04 | | | | 4.19 | | | | 6.23 | | | | (2.25 | ) | | | — | | | | (2.25 | ) | | | 62.00 | | | | 10.99 | 5 | | | — | 6 | | | .42 | 5 | | | .42 | 5 | | | 3.41 | 5 |
| 10/31/2018 | | | 62.82 | | | | 2.04 | | | | (3.81 | ) | | | (1.77 | ) | | | (2.24 | ) | | | (.79 | ) | | | (3.03 | ) | | | 58.02 | | | | (3.01 | )5 | | | — | 6 | | | .42 | 5 | | | .42 | 5 | | | 3.33 | 5 |
| Class 529-F-1: | | | | | | | | | | | | | | | | | | | | | | | | | | | | | | | | | | | | | | | | | | | | | | | | | | | | |
| 10/31/2022 | | | 69.05 | | | | 2.06 | | | | (8.32 | ) | | | (6.26 | ) | | | (2.35 | ) | | | — | | | | (2.35 | ) | | | 60.44 | | | | (9.30 | )5 | | | — | 6 | | | .46 | 5 | | | .46 | 5 | | | 3.13 | 5 |
| 10/31/2021 | | | 56.50 | | | | 2.10 | | | | 12.39 | | | | 14.49 | | | | (1.94 | ) | | | — | | | | (1.94 | ) | | | 69.05 | | | | 25.84 | 5 | | | — | 6 | | | .44 | 5 | | | .44 | 5 | | | 3.17 | 5 |
| 10/31/2020 | | | 61.97 | | | | 2.08 | | | | (4.74 | ) | | | (2.66 | ) | | | (2.21 | ) | | | (.60 | ) | | | (2.81 | ) | | | 56.50 | | | | (4.36 | )5 | | | — | 6 | | | .41 | 5 | | | .41 | 5 | | | 3.51 | 5 |
| 10/31/2019 | | | 58.00 | | | | 2.04 | | | | 4.17 | | | | 6.21 | | | | (2.24 | ) | | | — | | | | (2.24 | ) | | | 61.97 | | | | 10.98 | | | | 115 | | | | .42 | | | | .42 | | | | 3.41 | |
| 10/31/2018 | | | 62.81 | | | | 2.04 | | | | (3.82 | ) | | | (1.78 | ) | | | (2.24 | ) | | | (.79 | ) | | | (3.03 | ) | | | 58.00 | | | | (3.03 | ) | | | 104 | | | | .42 | | | | .42 | | | | 3.33 | |
| Class 529-F-2: | | | | | | | | | | | | | | | | | | | | | | | | | | | | | | | | | | | | | | | | | | | | | | | | | | | | |
| 10/31/2022 | | | 69.11 | | | | 2.13 | | | | (8.33 | ) | | | (6.20 | ) | | | (2.42 | ) | | | — | | | | (2.42 | ) | | | 60.49 | | | | (9.20 | ) | | | 155 | | | | .36 | | | | .36 | | | | 3.24 | |
| 10/31/2021 | | | 56.52 | | | | 2.22 | | | | 12.34 | | | | 14.56 | | | | (1.97 | ) | | | — | | | | (1.97 | ) | | | 69.11 | | | | 25.97 | | | | 155 | | | | .38 | | | | .38 | | | | 3.34 | |
| 10/31/20207,8 | | | 56.52 | | | | — | | | | — | | | | — | | | | — | | | | — | | | | — | | | | 56.52 | | | | — | | | | 110 | | | | — | | | | — | | | | — | |
| Class 529-F-3: | | | | | | | | | | | | | | | | | | | | | | | | | | | | | | | | | | | | | | | | | | | | | | | | | | | | |
| 10/31/2022 | | | 69.09 | | | | 2.15 | | | | (8.33 | ) | | | (6.18 | ) | | | (2.44 | ) | | | — | | | | (2.44 | ) | | | 60.47 | | | | (9.17 | ) | | | — | 6 | | | .32 | | | | .32 | | | | 3.27 | |
| 10/31/2021 | | | 56.52 | | | | 2.24 | | | | 12.34 | | | | 14.58 | | | | (2.01 | ) | | | — | | | | (2.01 | ) | | | 69.09 | | | | 26.00 | | | | — | 6 | | | .38 | | | | .33 | | | | 3.38 | |
| 10/31/20207,8 | | | 56.52 | | | | — | | | | — | | | | — | | | | — | | | | — | | | | — | | | | 56.52 | | | | — | | | | — | 6 | | | — | | | | — | | | | — | |
| Class R-1: | | | | | | | | | | | | | | | | | | | | | | | | | | | | | | | | | | | | | | | | | | | | | | | | | | | | |
| 10/31/2022 | | | 69.14 | | | | 1.48 | | | | (8.33 | ) | | | (6.85 | ) | | | (1.75 | ) | | | — | | | | (1.75 | ) | | | 60.54 | | | | (10.11 | ) | | | 57 | | | | 1.34 | | | | 1.34 | | | | 2.25 | |
| 10/31/2021 | | | 56.56 | | | | 1.56 | | | | 12.34 | | | | 13.90 | | | | (1.32 | ) | | | — | | | | (1.32 | ) | | | 69.14 | | | | 24.70 | | | | 69 | | | | 1.36 | | | | 1.36 | | | | 2.35 | |
| 10/31/2020 | | | 62.00 | | | | 1.50 | | | | (4.72 | ) | | | (3.22 | ) | | | (1.62 | ) | | | (.60 | ) | | | (2.22 | ) | | | 56.56 | | | | (5.29 | ) | | | 62 | | | | 1.38 | | | | 1.38 | | | | 2.53 | |
| 10/31/2019 | | | 58.00 | | | | 1.47 | | | | 4.18 | | | | 5.65 | | | | (1.65 | ) | | | — | | | | (1.65 | ) | | | 62.00 | | | | 9.89 | | | | 84 | | | | 1.39 | | | | 1.39 | | | | 2.46 | |
| 10/31/2018 | | | 62.80 | | | | 1.45 | | | | (3.82 | ) | | | (2.37 | ) | | | (1.64 | ) | | | (.79 | ) | | | (2.43 | ) | | | 58.00 | | | | (3.94 | ) | | | 101 | | | | 1.39 | | | | 1.39 | | | | 2.36 | |
Refer to the end of the table for footnotes.
Financial highlights (continued)
| | | | | | (Loss) income from
investment operations1 | | | Dividends and distributions | | | | | | | | | | | | | | | | | | | |
| Year ended | | Net asset
value,
beginning
of year | | | Net
investment
income | | | Net (losses)
gains on
securities
(both
realized and
unrealized) | | | Total from
investment
operations | | | Dividends
(from net
investment
income) | | | Distributions
(from capital
gains) | | | Total
dividends
and
distributions | | | Net asset
value,
end
of year | | | Total return2,3 | | | Net assets,
end of
year
(in millions) | | | Ratio of
expenses to
average net
assets before
reimburse-
ments4 | | | Ratio of
expenses to
average net
assets after
reimburse-
ments3,4 | | | Ratio of
net income
to average
net assets3 | |
| Class R-2: | | | | | | | | | | | | | | | | | | | | | | | | | | | | | | | | | | | | | | | |
| 10/31/2022 | | $ | 69.10 | | | $ | 1.47 | | | $ | (8.32 | ) | | $ | (6.85 | ) | | $ | (1.75 | ) | | $ | — | | | $ | (1.75 | ) | | $ | 60.50 | | | | (10.10 | )% | | $ | 344 | | | | 1.35 | % | | | 1.35 | % | | | 2.24 | % |
| 10/31/2021 | | | 56.53 | | | | 1.56 | | | | 12.33 | | | | 13.89 | | | | (1.32 | ) | | | — | | | | (1.32 | ) | | | 69.10 | | | | 24.72 | | | | 419 | | | | 1.36 | | | | 1.36 | | | | 2.35 | |
| 10/31/2020 | | | 61.98 | | | | 1.50 | | | | (4.73 | ) | | | (3.23 | ) | | | (1.62 | ) | | | (.60 | ) | | | (2.22 | ) | | | 56.53 | | | | (5.30 | ) | | | 379 | | | | 1.38 | | | | 1.38 | | | | 2.53 | |
| 10/31/2019 | | | 58.00 | | | | 1.47 | | | | 4.17 | | | | 5.64 | | | | (1.66 | ) | | | — | | | | (1.66 | ) | | | 61.98 | | | | 9.91 | | | | 460 | | | | 1.38 | | | | 1.38 | | | | 2.45 | |
| 10/31/2018 | | | 62.79 | | | | 1.46 | | | | (3.82 | ) | | | (2.36 | ) | | | (1.64 | ) | | | (.79 | ) | | | (2.43 | ) | | | 58.00 | | | | (3.93 | ) | | | 487 | | | | 1.39 | | | | 1.39 | | | | 2.37 | |
| Class R-2E: | | | | | | | | | | | | | | | | | | | | | | | | | | | | | | | | | | | | | | | | | | | | | | | | | | | | |
| 10/31/2022 | | | 68.78 | | | | 1.66 | | | | (8.29 | ) | | | (6.63 | ) | | | (1.95 | ) | | | — | | | | (1.95 | ) | | | 60.20 | | | | (9.85 | ) | | | 37 | | | | 1.06 | | | | 1.06 | | | | 2.53 | |
| 10/31/2021 | | | 56.27 | | | | 1.74 | | | | 12.29 | | | | 14.03 | | | | (1.52 | ) | | | — | | | | (1.52 | ) | | | 68.78 | | | | 25.08 | | | | 46 | | | | 1.07 | | | | 1.07 | | | | 2.64 | |
| 10/31/2020 | | | 61.72 | | | | 1.67 | | | | (4.72 | ) | | | (3.05 | ) | | | (1.80 | ) | | | (.60 | ) | | | (2.40 | ) | | | 56.27 | | | | (5.03 | ) | | | 40 | | | | 1.09 | | | | 1.09 | | | | 2.83 | |
| 10/31/2019 | | | 57.77 | | | | 1.63 | | | | 4.17 | | | | 5.80 | | | | (1.85 | ) | | | — | | | | (1.85 | ) | | | 61.72 | | | | 10.25 | | | | 50 | | | | 1.09 | | | | 1.09 | | | | 2.74 | |
| 10/31/2018 | | | 62.58 | | | | 1.63 | | | | (3.80 | ) | | | (2.17 | ) | | | (1.85 | ) | | | (.79 | ) | | | (2.64 | ) | | | 57.77 | | | | (3.66 | ) | | | 40 | | | | 1.09 | | | | 1.09 | | | | 2.67 | |
| Class R-3: | | | | | | | | | | | | | | | | | | | | | | | | | | | | | | | | | | | | | | | | | | | | | | | | | | | | |
| 10/31/2022 | | | 69.09 | | | | 1.77 | | | | (8.32 | ) | | | (6.55 | ) | | | (2.05 | ) | | | — | | | | (2.05 | ) | | | 60.49 | | | | (9.70 | ) | | | 613 | | | | .91 | | | | .91 | | | | 2.68 | |
| 10/31/2021 | | | 56.52 | | | | 1.85 | | | | 12.34 | | | | 14.19 | | | | (1.62 | ) | | | — | | | | (1.62 | ) | | | 69.09 | | | | 25.26 | | | | 748 | | | | .92 | | | | .92 | | | | 2.80 | |
| 10/31/2020 | | | 61.98 | | | | 1.77 | | | | (4.74 | ) | | | (2.97 | ) | | | (1.89 | ) | | | (.60 | ) | | | (2.49 | ) | | | 56.52 | | | | (4.87 | ) | | | 673 | | | | .93 | | | | .93 | | | | 2.98 | |
| 10/31/2019 | | | 58.00 | | | | 1.74 | | | | 4.17 | | | | 5.91 | | | | (1.93 | ) | | | — | | | | (1.93 | ) | | | 61.98 | | | | 10.40 | | | | 835 | | | | .94 | | | | .94 | | | | 2.90 | |
| 10/31/2018 | | | 62.80 | | | | 1.73 | | | | (3.82 | ) | | | (2.09 | ) | | | (1.92 | ) | | | (.79 | ) | | | (2.71 | ) | | | 58.00 | | | | (3.52 | ) | | | 858 | | | | .94 | | | | .94 | | | | 2.82 | |
| Class R-4: | | | | | | | | | | | | | | | | | | | | | | | | | | | | | | | | | | | | | | | | | | | | | | | | | | | | |
| 10/31/2022 | | | 69.07 | | | | 1.96 | | | | (8.32 | ) | | | (6.36 | ) | | | (2.25 | ) | | | — | | | | (2.25 | ) | | | 60.46 | | | | (9.43 | ) | | | 431 | | | | .61 | | | | .61 | | | | 2.98 | |
| 10/31/2021 | | | 56.50 | | | | 2.05 | | | | 12.34 | | | | 14.39 | | | | (1.82 | ) | | | — | | | | (1.82 | ) | | | 69.07 | | | | 25.65 | | | | 547 | | | | .62 | | | | .62 | | | | 3.10 | |
| 10/31/2020 | | | 61.97 | | | | 1.95 | | | | (4.74 | ) | | | (2.79 | ) | | | (2.08 | ) | | | (.60 | ) | | | (2.68 | ) | | | 56.50 | | | | (4.58 | ) | | | 475 | | | | .62 | | | | .62 | | | | 3.29 | |
| 10/31/2019 | | | 57.99 | | | | 1.92 | | | | 4.17 | | | | 6.09 | | | | (2.11 | ) | | | — | | | | (2.11 | ) | | | 61.97 | | | | 10.73 | | | | 583 | | | | .64 | | | | .64 | | | | 3.21 | |
| 10/31/2018 | | | 62.79 | | | | 1.91 | | | | (3.81 | ) | | | (1.90 | ) | | | (2.11 | ) | | | (.79 | ) | | | (2.90 | ) | | | 57.99 | | | | (3.22 | ) | | | 732 | | | | .64 | | | | .64 | | | | 3.12 | |
| Class R-5E: | | | | | | | | | | | | | | | | | | | | | | | | | | | | | | | | | | | | | | | | | | | | | | | | | | | | |
| 10/31/2022 | | | 68.98 | | | | 2.08 | | | | (8.30 | ) | | | (6.22 | ) | | | (2.38 | ) | | | — | | | | (2.38 | ) | | | 60.38 | | | | (9.24 | ) | | | 81 | | | | .41 | | | | .41 | | | | 3.18 | |
| 10/31/2021 | | | 56.43 | | | | 2.18 | | | | 12.32 | | | | 14.50 | | | | (1.95 | ) | | | — | | | | (1.95 | ) | | | 68.98 | | | | 25.90 | | | | 78 | | | | .42 | | | | .42 | | | | 3.29 | |
| 10/31/2020 | | | 61.91 | | | | 2.07 | | | | (4.75 | ) | | | (2.68 | ) | | | (2.20 | ) | | | (.60 | ) | | | (2.80 | ) | | | 56.43 | | | | (4.40 | ) | | | 55 | | | | .42 | | | | .42 | | | | 3.51 | |
| 10/31/2019 | | | 57.94 | | | | 1.98 | | | | 4.23 | | | | 6.21 | | | | (2.24 | ) | | | — | | | | (2.24 | ) | | | 61.91 | | | | 10.97 | | | | 43 | | | | .43 | | | | .43 | | | | 3.31 | |
| 10/31/2018 | | | 62.75 | | | | 2.03 | | | | (3.81 | ) | | | (1.78 | ) | | | (2.24 | ) | | | (.79 | ) | | | (3.03 | ) | | | 57.94 | | | | (3.04 | ) | | | 20 | | | | .44 | | | | .44 | | | | 3.32 | |
| Class R-5: | | | | | | | | | | | | | | | | | | | | | | | | | | | | | | | | | | | | | | | | | | | | | | | | | | | | |
| 10/31/2022 | | | 69.11 | | | | 2.16 | | | | (8.32 | ) | | | (6.16 | ) | | | (2.45 | ) | | | — | | | | (2.45 | ) | | | 60.50 | | | | (9.16 | ) | | | 252 | | | | .30 | | | | .30 | | | | 3.28 | |
| 10/31/2021 | | | 56.53 | | | | 2.25 | | | | 12.34 | | | | 14.59 | | | | (2.01 | ) | | | — | | | | (2.01 | ) | | | 69.11 | | | | 26.02 | | | | 309 | | | | .31 | | | | .31 | | | | 3.40 | |
| 10/31/2020 | | | 62.01 | | | | 2.13 | | | | (4.75 | ) | | | (2.62 | ) | | | (2.26 | ) | | | (.60 | ) | | | (2.86 | ) | | | 56.53 | | | | (4.28 | ) | | | 274 | | | | .32 | | | | .32 | | | | 3.59 | |
| 10/31/2019 | | | 58.04 | | | | 2.08 | | | | 4.19 | | | | 6.27 | | | | (2.30 | ) | | | — | | | | (2.30 | ) | | | 62.01 | | | | 11.07 | | | | 326 | | | | .33 | | | | .33 | | | | 3.47 | |
| 10/31/2018 | | | 62.84 | | | | 2.10 | | | | (3.82 | ) | | | (1.72 | ) | | | (2.29 | ) | | | (.79 | ) | | | (3.08 | ) | | | 58.04 | | | | (2.93 | ) | | | 214 | | | | .34 | | | | .34 | | | | 3.42 | |
| Class R-6: | | | | | | | | | | | | | | | | | | | | | | | | | | | | | | | | | | | | | | | | | | | | | | | | | | | | |
| 10/31/2022 | | | 69.08 | | | | 2.19 | | | | (8.32 | ) | | | (6.13 | ) | | | (2.48 | ) | | | — | | | | (2.48 | ) | | | 60.47 | | | | (9.11 | ) | | | 12,940 | | | | .26 | | | | .26 | | | | 3.33 | |
| 10/31/2021 | | | 56.51 | | | | 2.28 | | | | 12.34 | | | | 14.62 | | | | (2.05 | ) | | | — | | | | (2.05 | ) | | | 69.08 | | | | 26.07 | | | | 14,277 | | | | .27 | | | | .27 | | | | 3.45 | |
| 10/31/2020 | | | 61.99 | | | | 2.16 | | | | (4.75 | ) | | | (2.59 | ) | | | (2.29 | ) | | | (.60 | ) | | | (2.89 | ) | | | 56.51 | | | | (4.24 | ) | | | 12,651 | | | | .27 | | | | .27 | | | | 3.65 | |
| 10/31/2019 | | | 58.01 | | | | 2.12 | | | | 4.19 | | | | 6.31 | | | | (2.33 | ) | | | — | | | | (2.33 | ) | | | 61.99 | | | | 11.12 | | | | 12,050 | | | | .28 | | | | .28 | | | | 3.54 | |
| 10/31/2018 | | | 62.82 | | | | 2.13 | | | | (3.82 | ) | | | (1.69 | ) | | | (2.33 | ) | | | (.79 | ) | | | (3.12 | ) | | | 58.01 | | | | (2.88 | ) | | | 9,528 | | | | .29 | | | | .29 | | | | 3.48 | |
Refer to the end of the table for footnotes.
Financial highlights (continued)
| | | Year ended October 31, |
| Portfolio turnover rate for all share classes9,10 | | 2022 | | 2021 | | 2020 | | 2019 | | 2018 |
| Excluding mortgage dollar roll transactions | | | 27 | % | | | 41 | % | | | 55 | % | | | 32 | % | | | 37 | % |
| Including mortgage dollar roll transactions | | | 87 | % | | | 72 | % | | | 118 | % | | | 45 | % | | | 73 | % |
| | | | | | | | | | | | | | | | | | | | | |
| 1 | Based on average shares outstanding. |
| 2 | Total returns exclude any applicable sales charges, including contingent deferred sales charges. |
| 3 | This column reflects the impact, if any, of certain reimbursements from CRMC. During one of the years shown, CRMC reimbursed a portion of transfer agent services fees for Class 529-F-3. |
| 4 | Ratios do not include expenses of any Central Funds. The fund indirectly bears its proportionate share of the expenses of any Central Funds. |
| 5 | All or a significant portion of assets in this class consisted of seed capital invested by CRMC and/or its affiliates. Fees for distribution services are not charged or accrued on these seed capital assets. If such fees were paid by the fund on seed capital assets, fund expenses would have been higher and net income and total return would have been lower. |
| 6 | Amount less than $1 million. |
| 7 | Based on operations for a period that is less than a full year. |
| 8 | Class 529-F-2 and 529-F-3 shares began investment operations on October 30, 2020. |
| 9 | Refer to Note 5 for more information on mortgage dollar rolls. |
| 10 | Rates do not include the fund’s portfolio activity with respect to any Central Funds. |
Refer to the notes to financial statements.
Report of Independent Registered Public Accounting Firm
To the Board of Trustees and Shareholders of Capital Income Builder
Opinion on the Financial Statements
We have audited the accompanying statement of assets and liabilities, including the investment portfolio, of Capital Income Builder (the “Fund”) as of October 31, 2022, the related statement of operations for the year ended October 31, 2022, the statements of changes in net assets for each of the two years in the period ended October 31, 2022, including the related notes, and the financial highlights for each of the periods indicated therein (collectively referred to as the “financial statements”). In our opinion, the financial statements present fairly, in all material respects, the financial position of the Fund as of October 31, 2022, the results of its operations for the year then ended, the changes in its net assets for each of the two years in the period ended October 31, 2022 and the financial highlights for each of the periods indicated therein in conformity with accounting principles generally accepted in the United States of America.
Basis for Opinion
These financial statements are the responsibility of the Fund’s management. Our responsibility is to express an opinion on the Fund’s financial statements based on our audits. We are a public accounting firm registered with the Public Company Accounting Oversight Board (United States) (PCAOB) and are required to be independent with respect to the Fund in accordance with the U.S. federal securities laws and the applicable rules and regulations of the Securities and Exchange Commission and the PCAOB.
We conducted our audits of these financial statements in accordance with the standards of the PCAOB. Those standards require that we plan and perform the audit to obtain reasonable assurance about whether the financial statements are free of material misstatement, whether due to error or fraud.
Our audits included performing procedures to assess the risks of material misstatement of the financial statements, whether due to error or fraud, and performing procedures that respond to those risks. Such procedures included examining, on a test basis, evidence regarding the amounts and disclosures in the financial statements. Our audits also included evaluating the accounting principles used and significant estimates made by management, as well as evaluating the overall presentation of the financial statements. Our procedures included confirmation of securities owned as of October 31, 2022 by correspondence with the custodian, transfer agent and brokers; when replies were not received from brokers, we performed other auditing procedures. We believe that our audits provide a reasonable basis for our opinion.
/s/ PricewaterhouseCoopers LLP
Los Angeles, California
December 8, 2022
We have served as the auditor of one or more investment companies in The Capital Group Companies Investment Company Complex since 1934.
As a fund shareholder, you incur two types of costs: (1) transaction costs, such as initial sales charges on purchase payments and contingent deferred sales charges on redemptions (loads), and (2) ongoing costs, including management fees, distribution and service (12b-1) fees, and other expenses. This example is intended to help you understand your ongoing costs (in dollars) of investing in the fund so you can compare these costs with the ongoing costs of investing in other mutual funds. The example is based on an investment of $1,000 invested at the beginning of the period and held for the entire six-month period (May 1, 2022, through October 31, 2022).
Actual expenses:
The first line of each share class in the table on the following page provides information about actual account values and actual expenses. You may use the information in this line, together with the amount you invested, to estimate the expenses that you paid over the period. Simply divide your account value by $1,000 (for example, an $8,600 account value divided by $1,000 = 8.6), then multiply the result by the number in the first line under the heading titled “Expenses paid during period” to estimate the expenses you paid on your account during this period.
Hypothetical example for comparison purposes:
The second line of each share class in the table on the following page provides information about hypothetical account values and hypothetical expenses based on the actual expense ratio for the share class and an assumed rate of return of 5.00% per year before expenses, which is not the actual return of the share class. The hypothetical account values and expenses may not be used to estimate the actual ending account balance or expenses you paid for the period. You may use this information to compare the ongoing costs of investing in the fund and other funds. To do so, compare this 5.00% hypothetical example with the 5.00% hypothetical examples that appear in the shareholder reports of the other funds.
Notes:
Retirement plan participants may be subject to certain fees charged by the plan sponsor, and Class F-1, F-2, F-3, 529-F-1, 529-F-2 and 529-F-3 shareholders may be subject to fees charged by financial intermediaries, typically ranging from 0.75% to 1.50% of assets annually depending on services offered. You can estimate the impact of these fees by adding the amount of the fees to the total estimated expenses you paid on your account during the period as calculated above. In addition, your ending account value would be lower by the amount of these fees.
Note that the expenses shown in the table on the following page are meant to highlight your ongoing costs only and do not reflect any transactional costs, such as sales charges (loads). Therefore, the second line of each share class in the table is useful in comparing ongoing costs only and will not help you determine the relative total costs of owning different funds. In addition, if these transactional costs were included, your costs would have been higher.
Expense example (continued)
| | | Beginning
account value
5/1/2022 | | | Ending
account value
10/31/2022 | | | Expenses paid
during period* | | | Annualized
expense ratio | |
| Class A – actual return | | $ | 1,000.00 | | | $ | 933.23 | | | $ | 2.87 | | | | .59 | % |
| Class A – assumed 5% return | | | 1,000.00 | | | | 1,022.23 | | | | 3.01 | | | | .59 | |
| Class C – actual return | | | 1,000.00 | | | | 929.82 | | | | 6.47 | | | | 1.33 | |
| Class C – assumed 5% return | | | 1,000.00 | | | | 1,018.50 | | | | 6.77 | | | | 1.33 | |
| Class T – actual return | | | 1,000.00 | | | | 934.47 | | | | 1.61 | | | | .33 | |
| Class T – assumed 5% return | | | 1,000.00 | | | | 1,023.54 | | | | 1.68 | | | | .33 | |
| Class F-1 – actual return | | | 1,000.00 | | | | 933.02 | | | | 3.12 | | | | .64 | |
| Class F-1 – assumed 5% return | | | 1,000.00 | | | | 1,021.98 | | | | 3.26 | | | | .64 | |
| Class F-2 – actual return | | | 1,000.00 | | | | 934.33 | | | | 1.80 | | | | .37 | |
| Class F-2 – assumed 5% return | | | 1,000.00 | | | | 1,023.34 | | | | 1.89 | | | | .37 | |
| Class F-3 – actual return | | | 1,000.00 | | | | 934.83 | | | | 1.27 | | | | .26 | |
| Class F-3 – assumed 5% return | | | 1,000.00 | | | | 1,023.89 | | | | 1.33 | | | | .26 | |
| Class 529-A – actual return | | | 1,000.00 | | | | 933.11 | | | | 3.02 | | | | .62 | |
| Class 529-A – assumed 5% return | | | 1,000.00 | | | | 1,022.08 | | | | 3.16 | | | | .62 | |
| Class 529-C – actual return | | | 1,000.00 | | | | 929.39 | | | | 6.76 | | | | 1.39 | |
| Class 529-C – assumed 5% return | | | 1,000.00 | | | | 1,018.20 | | | | 7.07 | | | | 1.39 | |
| Class 529-E – actual return | | | 1,000.00 | | | | 932.06 | | | | 4.14 | | | | .85 | |
| Class 529-E – assumed 5% return | | | 1,000.00 | | | | 1,020.92 | | | | 4.33 | | | | .85 | |
| Class 529-T – actual return | | | 1,000.00 | | | | 934.17 | | | | 1.80 | | | | .37 | |
| Class 529-T – assumed 5% return | | | 1,000.00 | | | | 1,023.34 | | | | 1.89 | | | | .37 | |
| Class 529-F-1 – actual return | | | 1,000.00 | | | | 933.86 | | | | 2.24 | | | | .46 | |
| Class 529-F-1 – assumed 5% return | | | 1,000.00 | | | | 1,022.89 | | | | 2.35 | | | | .46 | |
| Class 529-F-2 – actual return | | | 1,000.00 | | | | 934.39 | | | | 1.76 | | | | .36 | |
| Class 529-F-2 – assumed 5% return | | | 1,000.00 | | | | 1,023.39 | | | | 1.84 | | | | .36 | |
| Class 529-F-3 – actual return | | | 1,000.00 | | | | 934.56 | | | | 1.56 | | | | .32 | |
| Class 529-F-3 – assumed 5% return | | | 1,000.00 | | | | 1,023.59 | | | | 1.63 | | | | .32 | |
| Class R-1 – actual return | | | 1,000.00 | | | | 929.65 | | | | 6.57 | | | | 1.35 | |
| Class R-1 – assumed 5% return | | | 1,000.00 | | | | 1,018.40 | | | | 6.87 | | | | 1.35 | |
| Class R-2 – actual return | | | 1,000.00 | | | | 929.64 | | | | 6.57 | | | | 1.35 | |
| Class R-2 – assumed 5% return | | | 1,000.00 | | | | 1,018.40 | | | | 6.87 | | | | 1.35 | |
| Class R-2E – actual return | | | 1,000.00 | | | | 931.05 | | | | 5.16 | | | | 1.06 | |
| Class R-2E – assumed 5% return | | | 1,000.00 | | | | 1,019.86 | | | | 5.40 | | | | 1.06 | |
| Class R-3 – actual return | | | 1,000.00 | | | | 931.73 | | | | 4.43 | | | | .91 | |
| Class R-3 – assumed 5% return | | | 1,000.00 | | | | 1,020.62 | | | | 4.63 | | | | .91 | |
| Class R-4 – actual return | | | 1,000.00 | | | | 933.20 | | | | 2.97 | | | | .61 | |
| Class R-4 – assumed 5% return | | | 1,000.00 | | | | 1,022.13 | | | | 3.11 | | | | .61 | |
| Class R-5E – actual return | | | 1,000.00 | | | | 934.14 | | | | 2.00 | | | | .41 | |
| Class R-5E – assumed 5% return | | | 1,000.00 | | | | 1,023.14 | | | | 2.09 | | | | .41 | |
| Class R-5 – actual return | | | 1,000.00 | | | | 934.51 | | | | 1.51 | | | | .31 | |
| Class R-5 – assumed 5% return | | | 1,000.00 | | | | 1,023.64 | | | | 1.58 | | | | .31 | |
| Class R-6 – actual return | | | 1,000.00 | | | | 934.87 | | | | 1.27 | | | | .26 | |
| Class R-6 – assumed 5% return | | | 1,000.00 | | | | 1,023.89 | | | | 1.33 | | | | .26 | |
| | |
| * | The “expenses paid during period” are equal to the “annualized expense ratio,” multiplied by the average account value over the period, multiplied by the number of days in the period, and divided by 365 (to reflect the one-half year period). |
| | |
We are required to advise you of the federal tax status of certain distributions received by shareholders during the fiscal year. The fund hereby designates the following amounts for the fund’s fiscal year ended October 31, 2022:
| Qualified dividend income | | $ | 3,289,162,000 | |
| Section 199A dividends | | $ | 121,172,000 | |
| Section 163(j) interest dividends | | $ | 858,521,000 | |
| Corporate dividends received deduction | | $ | 1,414,469,000 | |
| U.S. government income that may be exempt from state taxation | | $ | 519,581,000 | |
Individual shareholders should refer to their Form 1099 or other tax information, which will be mailed in January 2023, to determine the calendar year amounts to be included on their 2022 tax returns. Shareholders should consult their tax advisors.
Approval of Investment Advisory and Service Agreement
The fund’s board has approved the continuation of the fund’s Investment Advisory and Service Agreement (the “agreement”) with Capital Research and Management Company (“CRMC”) for an additional one-year term through October 31, 2023. The board approved the agreement following the recommendation of the fund’s Contracts Committee (the “committee”), which is composed of all the fund’s independent board members. The board and the committee determined in the exercise of their business judgment that the fund’s advisory fee structure was fair and reasonable in relation to the services provided, and that approving the agreement was in the best interests of the fund and its shareholders.
In reaching this decision, the board and the committee took into account their interactions with CRMC as well as information furnished to them throughout the year and otherwise provided to them, as well as information prepared specifically in connection with their review of the agreement, and were advised by their independent counsel with respect to the matters considered. They considered the following factors, among others, but did not identify any single issue or particular piece of information that, in isolation, was the controlling factor, and each board and committee member did not necessarily attribute the same weight to each factor.
1. Nature, extent and quality of services
The board and the committee considered the depth and quality of CRMC’s investment management process, including its global research capabilities; the experience, capability and integrity of its senior management and other personnel; the low turnover rates of its key personnel; the overall financial strength and stability of CRMC and the Capital Group organization; the resources and systems CRMC devotes to investment management (the manner in which the fund’s assets are managed, including liquidity management), financial, investment operations, compliance, trading, proxy voting, shareholder communications, and other services; and the ongoing evolution of CRMC’s organizational structure designed to maintain and strengthen these qualities. The board and the committee also considered the nature, extent and quality of administrative and shareholder services provided by CRMC to the fund under the agreement and other agreements, as well as the benefits to fund shareholders from investing in a fund that is part of a large family of funds. The board and the committee considered the risks assumed by CRMC in providing services to the fund, including operational, business, financial, reputational, regulatory and litigation risks. The board and the committee concluded that the nature, extent and quality of the services provided by CRMC have benefited and should continue to benefit the fund and its shareholders.
2. Investment results
The board and the committee considered the investment results of the fund in light of its objective. They compared the fund’s investment results with those of other funds (including funds that currently form the basis of the Lipper index for the category in which the fund is included), and data such as relevant market and fund indexes over various periods (including the fund’s lifetime) through March 31, 2022. They generally placed greater emphasis on investment results over longer term periods. On the basis of this evaluation and the board’s and the committee’s ongoing review of investment results, and considering the relative market conditions during certain reporting periods, the board and the committee concluded that the fund’s investment results have been satisfactory for renewal of the agreement, and that CRMC’s record in managing the fund indicated that its continued management should benefit the fund and its shareholders.
3. Advisory fees and total expenses
The board and the committee compared the advisory fees and total expense levels of the fund to those of other relevant funds. They observed that the fund’s advisory fees and expenses generally compared favorably to those of other similar funds included in the comparable Lipper category. The board and the committee also considered the breakpoint discounts in the fund’s advisory fee structure that reduce the level of fees charged by CRMC to the fund as fund assets increase. In addition, they reviewed information regarding the effective advisory fees charged to non-mutual fund clients by CRMC and its affiliates. They noted that, to the extent there were differences between the advisory fees paid by the fund and the advisory fees paid by those clients, the differences appropriately reflected the investment, operational, regulatory and market differences between advising the fund and the other clients. The board and the
committee concluded that the fund’s cost structure was fair and reasonable in relation to the services provided, as well as in relation to the risks assumed by the adviser in sponsoring and managing the fund, and that the fund’s shareholders receive reasonable value in return for the advisory fees and other amounts paid to CRMC by the fund.
4. Ancillary benefits
The board and the committee considered a variety of other benefits that CRMC and its affiliates receive as a result of CRMC’s relationship with the fund and other American Funds, including fees for administrative services provided to certain share classes; fees paid to CRMC’s affiliated transfer agent; sales charges and distribution fees received and retained by the fund’s principal underwriter, an affiliate of CRMC; and possible ancillary benefits to CRMC and its institutional management affiliates in managing other investment vehicles. The board and the committee reviewed CRMC’s portfolio trading practices, noting that CRMC bears the cost of third-party research. The board and committee also noted that CRMC benefited from the use of commissions from portfolio transactions made on behalf of the fund to facilitate payment to certain broker-dealers for research to comply with regulatory requirements applicable to these firms, with all such amounts reimbursed by CRMC. The board and the committee took these ancillary benefits into account in evaluating the reasonableness of the advisory fees and other amounts paid to CRMC by the fund.
5. Adviser financial information
The board and the committee reviewed information regarding CRMC’s costs of providing services to the American Funds, including personnel, systems and resources of investment, compliance, trading, accounting and other administrative operations. They considered CRMC’s costs and related cost allocation methodology as well as its track record of investing in technology, infrastructure and staff to maintain and expand services and capabilities, respond to industry and regulatory developments, and attract and retain qualified personnel. They noted information regarding the compensation structure for CRMC’s investment professionals. They reviewed information on the profitability of the investment adviser and its affiliates. The board and the committee also compared CRMC’s profitability and compensation data to the reported results and data of a number of large, publicly held investment management companies. The board and the committee noted the competitiveness and cyclicality of both the mutual fund industry and the capital markets, and the importance in that environment of CRMC’s long-term profitability for maintaining its independence, company culture and management continuity. They further considered the breakpoint discounts in the fund’s advisory fee structure and CRMC’s sharing of potential economies of scale, or efficiencies, through breakpoints and other fee reductions and costs voluntarily absorbed. The board and the committee concluded that the fund’s advisory fee structure reflected a reasonable sharing of benefits between CRMC and the fund’s shareholders.
This page was intentionally left blank.
This page was intentionally left blank.
This page was intentionally left blank.
This page was intentionally left blank.
Board of trustees and other officers
Independent trustees1
| Name and year of birth | | Year first
elected
a trustee
of the fund2 | | Principal occupation(s) during past five years | | Number of
portfolios in fund
complex overseen
by trustee3 | | Other directorships4
held by trustee |
| Mary Anne Dolan, 1947 | | 2010 | | Founder and President, MAD Ink (communications company); former Editor-in-Chief, The Los Angeles Herald Examiner (retired 1989) | | 10 | | None |
| John G. Freund, MD, 1953 | | 2016 | | Founder and former Managing Director, Skyline Ventures (a venture capital investor in health care companies); Co-Founder of Intuitive Surgical, Inc. (1995—2000); Co-Founder and former CEO of Arixa Pharmaceuticals, Inc. (2016—2020) | | 6 | | Collegium Pharmaceutical, Inc.; SI – Bone, Inc.; Sutro Biopharma, Inc. |
| Pedro J. Greer, Jr., 1956 | | 2016 | | Physician; Professor and Founding Dean, College of Medicine, Roseman University of Health Sciences; former Chairman/Associate Dean, Florida International University | | 3 | | None |
| Merit E. Janow, 1958 | | 2001 | | Dean Emerita and Professor of Practice, International Economic Law & International Affairs, Columbia University, School of International and Public Affairs | | 93 | | Aptiv (autonomous and green vehicle technology); Mastercard Incorporated |
| Leonade D. Jones, 1947 | | 2010 | | Retired; former Treasurer, The Washington Post Company (retired 1996) | | 10 | | None |
| Earl Lewis, Jr., 1955 | | 2017 | | Professor and Director, University of Michigan; former President, The Andrew W. Mellon Foundation | | 3 | | 2U, Inc. (educational technology company) |
Christopher E. Stone, 1956
Chair of the Board
(Independent and Non-Executive) | | 2009 | | Professor of Practice of Public Integrity, University of Oxford, Blavatnik School of Government; former President, Open Society Foundations | | 9 | | None |
| Kathy J. Williams, 1955 | | 2021 | | Board Chair, Above & Beyond Teaching | | 7 | | None |
| Amy Zegart, Ph.D., 1967 | | 2021 | | Senior Fellow, Hoover Institution, Stanford University; Senior Fellow, Freeman Spogli Institute, Stanford University | | 6 | | Kratos Defense & Security Solutions |
Interested trustees5,6
Name, year of birth
and position with fund | | Year first
elected
a trustee
or officer
of the fund2 | | Principal occupation(s) during past five years
and positions held with affiliated entities or
the principal underwriter of the fund | | Number of
portfolios in fund
complex overseen
by trustee3 | | Other directorships4
held by trustee |
Winnie Kwan, 1972
Co-President and Trustee | | 2017 | | Partner — Capital Research Global Investors, Capital International, Inc.7 | | 3 | | None |
Sung Lee, 1966
Trustee | | 2019 | | Partner — Capital Research Global Investors, Capital International, Inc.7; Director, The Capital Group Companies, Inc.7 | | 3 | | None |
The fund’s statement of additional information includes further details about fund trustees and is available without charge upon request by calling American Funds Service Company at (800) 421-4225 or by visiting the American Funds website at capitalgroup.com. The address for all trustees and officers of the fund is 333 South Hope Street, Los Angeles, CA 90071, Attention: Secretary.
Refer to page 68 for footnotes.
Other officers6
Name, year of birth
and position with fund | | Year first
elected
an officer
of the fund2 | | Principal occupation(s) during past five years and positions held with affiliated entities
or the principal underwriter of the fund |
David A. Hoag, 1965
Co-President | | 2006 | | Partner — Capital Fixed Income Investors, Capital Research and Management Company;
Partner — Capital Fixed Income Investors, Capital Bank and Trust Company7 |
Steven T. Watson, 1955
Co-President | | 1998–2006
2017 | | Partner — Capital International Investors, Capital International, Inc.7; Director, Capital International, Inc.7 |
Donald Rolfe, 1972
Principal Executive Officer | | 2008 | | Senior Vice President and Senior Counsel — Fund Business Management Group, Capital Research and Management Company; Secretary, Capital Research and Management Company |
Michael W. Stockton, 1967
Executive Vice President | | 2013 | | Senior Vice President — Fund Business Management Group, Capital Research and Management Company |
Aline Avzaradel, 1978
Senior Vice President | | 2020 | | Partner — Capital International Investors, Capital Research and Management Company;
Director, Capital Research and Management Company |
Alfonso Barroso, 1971
Senior Vice President | | 2019 | | Partner — Capital Research Global Investors, Capital Research Company7;
Director, Capital Research and Management Company |
Grant L. Cambridge, 1962
Senior Vice President | | 2014 | | Partner — Capital International Investors, Capital Research and Management Company |
Charles E. Ellwein, 1968
Senior Vice President | | 2022 | | Partner — Capital Research Global Investors, Capital Research and Management Company;
Director, Capital Research and Management Company |
James B. Lovelace, 1956
Senior Vice President | | 1992 | | Partner — Capital Research Global Investors, Capital Research and Management Company;
Partner — Capital Research Global Investors, Capital Bank and Trust Company7 |
Fergus N. MacDonald, 1969
Senior Vice President | | 2019 | | Partner — Capital Fixed Income Investors, Capital Research and Management Company;
Director, The Capital Group Companies, Inc.7 |
Caroline Randall, 1974
Senior Vice President | | 2015 | | Partner — Capital Research Global Investors, Capital Research Company7;
Director, The Capital Group Companies, Inc.7 |
Bradley J. Vogt, 1965
Senior Vice President | | 2010 | | Partner — Capital Research Global Investors, Capital Research and Management Company;
Partner — Capital Research Global Investors, Capital Bank and Trust Company7 |
Philip Winston, 1955
Senior Vice President | | 2019 | | Partner — Capital International Investors, Capital Research and Management Company; Partner — Capital
International Investors, Capital International Limited7; Senior Vice President, Capital International Limited7 |
M. Taylor Hinshaw, 1973
Vice President | | 2010 | | Partner — Capital Research Global Investors, Capital Research and Management Company |
Jennifer L. Butler, 1966
Secretary | | 2013 | | Assistant Vice President — Fund Business Management Group, Capital Research and Management Company |
Gregory F. Niland, 1971
Treasurer | | 2016 | | Vice President — Investment Operations, Capital Research and Management Company |
Michael R. Tom, 1988
Assistant Secretary | | 2021 | | Associate — Fund Business Management Group, Capital Research and Management Company |
Sandra Chuon, 1972
Assistant Treasurer | | 2019 | | Vice President — Investment Operations, Capital Research and Management Company |
W. Michael Pattie, 1981
Assistant Treasurer | | 2020 | | Assistant Vice President — Investment Operations, Capital Research and Management Company |
| | |
| 1 | The term “independent trustee” refers to a trustee who is not an “interested person” of the fund within the meaning of the Investment Company Act of 1940. |
| 2 | Trustees and officers of the fund serve until their resignation, removal or retirement. |
| 3 | Funds managed by Capital Research and Management Company or its affiliates. |
| 4 | This includes all directorships/trusteeships (other than those in the American Funds or other funds managed by Capital Research and Management Company or its affiliates) that are held by each trustee as a trustee or director of a public company or a registered investment company. |
| 5 | The term “interested trustee” refers to a trustee who is an “interested person” within the meaning of the Investment Company Act of 1940, on the basis of their affiliation with the fund’s investment adviser, Capital Research and Management Company, or affiliated entities (including the fund’s principal underwriter). |
| 6 | All of the trustees and/or officers listed, with the exception of M. Taylor Hinshaw, are officers and/or directors/trustees of one or more of the other funds for which Capital Research and Management Company serves as investment adviser. |
| 7 | Company affiliated with Capital Research and Management Company. |
| | |
Office of the fund
333 South Hope Street
Los Angeles, CA 90071-1406
Investment adviser
Capital Research and Management Company
333 South Hope Street
Los Angeles, CA 90071-1406
Transfer agent for shareholder accounts
American Funds Service Company
(Write to the address nearest you.)
P.O. Box 6007
Indianapolis, IN 46206-6007
P.O. Box 2280
Norfolk, VA 23501-2280
Custodian of assets
JPMorgan Chase Bank
270 Park Avenue
New York, NY 10017-2070
Counsel
O’Melveny & Myers LLP
400 South Hope Street
Los Angeles, CA 90071-2899
Independent registered public accounting firm
PricewaterhouseCoopers LLP
601 South Figueroa Street
Los Angeles, CA 90017-3874
Principal underwriter
American Funds Distributors, Inc.
333 South Hope Street
Los Angeles, CA 90071-1406
Investors should carefully consider investment objectives, risks, charges and expenses. This and other important information is contained in the fund prospectus and summary prospectus, which can be obtained from your financial professional and should be read carefully before investing. You may also call American Funds Service Company (AFS) at (800) 421-4225 or visit the American Funds website at capitalgroup.com.
“American Funds Proxy Voting Procedures and Principles” — which describes how we vote proxies relating to portfolio securities — is available on the American Funds website or upon request by calling AFS. The fund files its proxy voting record with the U.S. Securities and Exchange Commission (SEC) for the 12 months ended June 30 by August 31. The proxy voting record is available free of charge on the SEC website at sec.gov and on the American Funds website.
Capital Income Builder files a complete list of its portfolio holdings with the SEC for the first and third quarters of each fiscal year on Form NPORT-P. The list of portfolio holdings is available free of charge on the SEC website and on our website.
This report is for the information of shareholders of Capital Income Builder, but it also may be used as sales literature when preceded or accompanied by the current prospectus or summary prospectus, which gives details about charges, expenses, investment objectives and operating policies of the fund. If used as sales material after December 31, 2022, this report must be accompanied by an American Funds statistical update for the most recently completed calendar quarter.
Bloomberg® is a trademark and service mark of Bloomberg Finance L.P. and its affiliates (collectively “Bloomberg”). Bloomberg or Bloomberg’s licensors own all proprietary rights in the Bloomberg Indices. Neither Bloomberg nor Bloomberg’s licensors approves or endorses this material, or guarantees the accuracy or completeness of any information herein, or makes any warranty, express or implied, as to the results to be obtained therefrom and, to the maximum extent allowed by law, neither shall have any liability or responsibility for injury or damages arising in connection therewith.
MSCI has not approved, reviewed or produced this report, makes no express or implied warranties or representations and is not liable whatsoever for any data in the report. You may not redistribute the MSCI data or use it as a basis for other indices or investment products.
The S&P 500 Index is a product of S&P Dow Jones Indices LLC and/or its affiliates and have been licensed for use by Capital Group. Copyright © 2022 S&P Dow Jones Indices LLC, a division of S&P Global, and/or its affiliates. All rights reserved. Redistribution or reproduction in whole or in part is prohibited without written permission of S&P Dow Jones Indices LLC.
This report, and any product, index or fund referred to herein, is not sponsored, endorsed or promoted in any way by J.P. Morgan or any of its affiliates who provide no warranties whatsoever, express or implied, and shall have no liability to any prospective investor, in connection with this report. J.P. Morgan disclaimer: www.jpmm.com/research/disclosures
American Funds Distributors, Inc., member FINRA.
The Capital Advantage®
Since 1931, Capital Group, home of American Funds, has helped investors pursue long-term investment success. Our consistent approach — in combination with The Capital SystemTM — has resulted in superior outcomes.
| | Aligned with investor success |
| | We base our decisions on a long-term perspective, which we believe aligns our goals with the interests of our clients. Our portfolio managers average 27 years of investment industry experience, including 21 years at our company, reflecting a career commitment to our long-term approach.1 |
| | |
| | The Capital System |
| | The Capital System combines individual accountability with teamwork. Funds using The Capital System are divided into portions that are managed independently by investment professionals with diverse backgrounds, ages and investment approaches. An extensive global research effort is the backbone of our system. |
| | |
| | American Funds’ superior outcomes |
| | Equity funds have beaten their Lipper peer indexes in 90% of 10-year periods and 99% of 20-year periods.2 Fixed income funds have helped investors achieve diversification through attention to correlation between bonds and equities.3 Fund management fees have been among the lowest in the industry.4 |
| | |
| | 1 | Investment industry experience as of December 31, 2021. |
| | 2 | Based on Class F-2 share results for rolling calendar-year periods starting the first full calendar year after each fund’s inception through December 31, 2021. Periods covered are the shorter of the fund’s lifetime or since the comparable Lipper index inception date (except Capital Income Builder and SMALLCAP World Fund, for which the Lipper average was used). Expenses differ for each share class, so results will vary. |
| | 3 | Based on Class F-2 share results as of December 31, 2021. Thirteen of the 17 fixed income American Funds that have been in existence for the three-year period showed a three-year correlation below 0.3. S&P 500 Index was used as an equity market proxy. Correlation based on monthly total returns. Correlation is a statistical measure of how two securities move in relation to each other. A correlation ranges from –1 to 1. A positive correlation close to 1 implies that as one security moves, either up or down, the other security will move in “lockstep,” in the same direction. A negative correlation close to –1 indicates that the securities have moved in the opposite direction. |
| | 4 | On average, our management fees were in the lowest quintile 63% of the time, based on the 20-year period ended December 31, 2021, versus comparable Lipper categories, excluding funds of funds. |
Class F-2 shares were first offered on August 1, 2008. Class F-2 share results prior to the date of first sale are hypothetical based on the results of the original share class of the fund without a sales charge, adjusted for typical estimated expenses. Results for certain funds with an inception date after August 1, 2008, also include hypothetical returns because those funds’ Class F-2 shares sold after the funds’ date of first offering. Visit capitalgroup.com for more information on specific expense adjustments and the actual dates of first sale.
All Capital Group trademarks mentioned are owned by The Capital Group Companies, Inc., an affiliated company or fund. All other company and product names mentioned are the property of their respective companies.

��
ITEM 2 – Code of Ethics
The Registrant has adopted a Code of Ethics that applies to its Principal Executive Officer and Principal Financial Officer. The Registrant undertakes to provide to any person without charge, upon request, a copy of the Code of Ethics. Such request can be made by calling 800/421-4225 or to the Secretary of the Registrant, 333 South Hope Street, 55th Floor, Los Angeles, California 90071.
ITEM 3 – Audit Committee Financial Expert
The Registrant’s board has determined that John G. Freund, a member of the Registrant’s audit committee, is an “audit committee financial expert” and "independent," as such terms are defined in this Item. This designation will not increase the designee’s duties, obligations or liability as compared to his or her duties, obligations and liability as a member of the audit committee and of the board, nor will it reduce the responsibility of the other audit committee members. There may be other individuals who, through education or experience, would qualify as "audit committee financial experts" if the board had designated them as such. Most importantly, the board believes each member of the audit committee contributes significantly to the effective oversight of the Registrant’s financial statements and condition.
ITEM 4 – Principal Accountant Fees and Services
| a) Audit Fees: | | |
| Audit | 2021 | 164,000 |
| | 2022 | 157,000 |
| | | |
| b) Audit-Related Fees: | | |
| | 2021 | None |
| | 2022 | None |
| | | |
| c) Tax Fees: | | |
| | 2021 | 9,000 |
| | 2022 | 9,000 |
| | The tax fees consist of professional services relating to the preparation of the Registrant’s tax returns. | |
| | | |
| d) All Other Fees: | | |
| | 2021 | None |
| | 2022 | None |
| | | |
| | Adviser and affiliates (includes only fees for non-audit services billed to the adviser and affiliates for engagements that relate directly to the operations and financial reporting of the Registrant and were subject to the pre-approval policies described below): | |
| a) Audit Fees: | | |
| | Not Applicable | |
| | | |
| b) Audit-Related Fees: | | |
| | 2021 | None |
| | 2022 | None |
| | The audit-related fees consist of assurance and related services relating to the examination of the Registrant’s transfer agent, principal underwriter and investment adviser conducted in accordance with Statement on Standards for Attestation Engagements Number 18 issued by the American Institute of Certified Public Accountants. | |
| | | |
| c) Tax Fees: | | |
| | 2021 | None |
| | 2022 | None |
| | The tax fees consist of consulting services relating to the Registrant’s investments. | |
| | | |
| | | |
| d) All Other Fees: | | |
| | 2021 | 2,000 |
| | 2022 | None |
| | The other fees consist of subscription services related to an accounting research tool. | |
| | | |
| | | |
| | All audit and permissible non-audit services that the Registrant’s audit committee considers compatible with maintaining the independent registered public accounting firm’s independence are required to be pre-approved by the committee. The pre-approval requirement will extend to all non-audit services provided to the Registrant, the investment adviser, and any entity controlling, controlled by, or under common control with the investment adviser that provides ongoing services to the Registrant, if the engagement relates directly to the operations and financial reporting of the Registrant. The committee will not delegate its responsibility to pre-approve these services to the investment adviser. The committee may delegate to one or more committee members the authority to review and pre-approve audit and permissible non-audit services. Actions taken under any such delegation will be reported to the full committee at its next meeting. The pre-approval requirement is waived with respect to non-audit services if certain conditions are met. The pre-approval requirement was not waived for any of the non-audit services listed above provided to the Registrant, adviser and affiliates. | |
| | | |
| | Aggregate non-audit fees paid to the Registrant’s auditors, including fees for all services billed to the Registrant, adviser and affiliates that provide ongoing services to the Registrant, were $11,000 for fiscal year 2021 and $9,000 for fiscal year 2022. The non-audit services represented by these amounts were brought to the attention of the committee and considered to be compatible with maintaining the auditors’ independence. | |
ITEM 5 – Audit Committee of Listed Registrants
Not applicable to this Registrant, insofar as the Registrant is not a listed issuer as defined in Rule 10A-3 under the Securities Exchange Act of 1934.
ITEM 6 – Schedule of Investments
Not applicable, insofar as the schedule is included as part of the report to shareholders filed under Item 1 of this Form.
ITEM 7 – Disclosure of Proxy Voting Policies and Procedures for Closed-End Management Investment Companies
Not applicable to this Registrant, insofar as the Registrant is not a closed-end management investment company.
ITEM 8 – Portfolio Managers of Closed-End Management Investment Companies
Not applicable to this Registrant, insofar as the Registrant is not a closed-end management investment company.
ITEM 9 – Purchases of Equity Securities by Closed-End Management Investment Company and Affiliated Purchasers
Not applicable to this Registrant, insofar as the Registrant is not a closed-end management investment company.
ITEM 10 – Submission of Matters to a Vote of Security Holders
There have been no material changes to the procedures by which shareholders may recommend nominees to the Registrant’s board of trustees since the Registrant last submitted a proxy statement to its shareholders. The procedures are as follows. The Registrant has a nominating and governance committee comprised solely of persons who are not considered ‘‘interested persons’’ of the Registrant within the meaning of the Investment Company Act of 1940, as amended. The committee periodically reviews such issues as the board’s composition, responsibilities, committees, compensation and other relevant issues, and recommends any appropriate changes to the full board of trustees. While the committee normally is able to identify from its own resources an ample number of qualified candidates, it will consider shareholder suggestions of persons to be considered as nominees to fill future vacancies on the board. Such suggestions must be sent in writing to the nominating and governance committee of the Registrant, c/o the Registrant’s Secretary, and must be accompanied by complete biographical and occupational data on the prospective nominee, along with a written consent of the prospective nominee for consideration of his or her name by the nominating and governance committee.
ITEM 11 – Controls and Procedures
| (a) | The Registrant’s Principal Executive Officer and Principal Financial Officer have concluded, based on their evaluation of the Registrant’s disclosure controls and procedures (as such term is defined in Rule 30a-3 under the Investment Company Act of 1940), that such controls and procedures are adequate and reasonably designed to achieve the purposes described in paragraph (c) of such rule. |
| | |
| (b) | There were no changes in the Registrant’s internal controls over financial reporting (as defined in Rule 30a-3(d) under the Investment Company Act of 1940) that occurred during the Registrant’s semi-annual period covered by this report that has materially affected, or is reasonably likely to materially affect, the Registrant’s internal control over financial reporting. |
ITEM 12 – Exhibits
| (a)(1) | The Code of Ethics that is the subject of the disclosure required by Item 2 is attached as an exhibit hereto. |
| | |
| (a)(2) | The certifications required by Rule 30a-2 of the Investment Company Act of 1940 and Sections 302 and 906 of the Sarbanes-Oxley Act of 2002 are attached as exhibits hereto. |
SIGNATURES
Pursuant to the requirements of the Securities Exchange Act of 1934 and the Investment Company Act of 1940, the Registrant has duly caused this report to be signed on its behalf by the undersigned, thereunto duly authorized.
| | CAPITAL INCOME BUILDER |
| | |
| | By __/s/ Donald H. Rolfe________________ |
| | Donald H. Rolfe, Principal Executive Officer |
| | |
| | Date: December 30, 2022 |
Pursuant to the requirements of the Securities Exchange Act of 1934 and the Investment Company Act of 1940, this report has been signed below by the following persons on behalf of the Registrant and in the capacities and on the dates indicated.
| By _ /s/ Donald H. Rolfe_____________ |
Donald H. Rolfe, Principal Executive Officer |
| |
| Date: December 30, 2022 |
| By ___/s/ Gregory F. Niland__________________ |
Gregory F. Niland, Treasurer and Principal Financial Officer |
| |
| Date: December 30, 2022 |