                                  UNITED STATES

                       SECURITIES AND EXCHANGE COMMISSION

                             Washington, D.C. 20549

                                   FORM N-CSR

              CERTIFIED SHAREHOLDER REPORT OF REGISTERED MANAGEMENT

                              INVESTMENT COMPANIES

Investment Company Act file number  811-05083

                                VANECK VIP TRUST
               (Exact name of registrant as specified in charter)

                      666 Third Avenue, New York, NY 10017
               (Address of principal executive offices) (Zip code)

                         Van Eck Associates Corporation
                      666 THIRD AVENUE, NEW YORK, NY 10017
                     (Name and address of agent for service)

Registrant's telephone number, including area code: (212) 293-2000

Date of fiscal year end:  DECEMBER 31

Date of reporting period: DECEMBER 31, 2016
Item 1. Report to Shareholders.
| ANNUAL REPORT | ||
| December 31, 2016 | ||
VanEck VIP Trust
VanEck VIP Emerging Markets Fund
| 800.826.2333 | vaneck.com |
The information contained in this shareholder letter represents the personal opinions of the investment team members and may differ from those of other portfolio managers or of the firm as a whole. This information is not intended to be a forecast of future events, a guarantee of future results or investment advice. Also, unless otherwise specifically noted, any discussion of the Fund’s holdings, the Fund’s performance, and the views of the investment team members are as of December 31, 2016.
| PRIVACY NOTICE |
| (unaudited) |
| FACTS | WHAT DOES VANECK DO WITH YOUR PERSONAL INFORMATION? |
| Why? | Financial companies choose how they share your personal information. Federal law gives consumers the right to limit some but not all sharing. Federal law also requires us to tell you how we collect, share, and protect your personal information. Please read this notice carefully to understand what we do. |
| What? | The types of personal information we collect and share depend on the product or service you have with us. This information can include:
■ Social Security number and account balances ■ assets and payment history ■ risk tolerance and transaction history
|
| How? | All financial companies need to share customers’ personal information to run their everyday business. In the section below, we list the reasons financial companies can share their customers’ personal information; the reasons VanEck chooses to share; and whether you can limit this sharing. |
| Reasons we can share your personal information | Does VanEck share? | Can you limit this sharing? | To limit our sharing | Questions? |
| For our everyday business purposes—such as to process your transactions, maintain your account(s), respond to court orders and legal investigations, or report to credit bureaus | Yes | No | Call us at 800.826.2333.
Please note:
However, you can contact us at any time to limit our sharing. | 800.826.2333 |
| For our marketing purposes—to offer our products and services to you | Yes | No | ||
| For joint marketing with other financial companies | Yes | No | ||
| For our affiliates’ everyday business purposes—information about your transactions and experiences | Yes | No | ||
| For our affiliates’ everyday business purposes—information about your creditworthiness | No | We don’t share | ||
| For our affiliates to market to you | Yes | Yes | ||
| For nonaffiliates to market to you | No | We don’t share |
| PRIVACY NOTICE |
| (unaudited) (continued) |
| Who we are | |
| Who is providing this notice? | Van Eck Associates Corporation, its affiliates and funds sponsored or managed by Van Eck (collectively “VanEck”). |
| What we do | |
| How does VanEck protect my personal information? | To protect your personal information from unauthorized access and use, we use security measures that comply with federal law. These measures include computer safeguards and secured files and buildings. |
| How does Van Eck collect my personal information? | We collect your personal information, for example, when you |
| n open an account or give us your income information | |
| n provide employment information or give us your contact information | |
| n tell us about your investment or retirement portfolio | |
| We also collect your personal information from others, such as credit bureaus, affiliates, or other companies. | |
| Why can’t I limit all sharing? | Federal law gives you the right to limit only |
| n sharing for affiliates’ everyday business purposes—information about your creditworthiness | |
| n affiliates from using your information to market to you | |
| n sharing for nonaffiliates to market to you | |
| State laws and individual companies may give you additional rights to limit sharing. See below for more on your rights under state law. | |
| What happens when I limit sharing for an account I hold jointly with someone else? | Your choices will apply to everyone on your account—unless you tell us otherwise. |
| Definitions | |
| Affiliates | Companies related by common ownership or control. They can be financial and nonfinancial companies. |
| n Our affiliates include companies with a VanEck name such as Van Eck Securities Corporation and others such as MV Index Solutions GmbH. | |
| Nonaffiliates | Companies not related by common ownership or control. They can be financial and nonfinancial companies. |
| n VanEck does not share with nonaffiliates so they can market to you. | |
| Joint marketing | A formal agreement between nonaffiliated financial companies that together market financial products or services to you. |
| n Our joint marketing partners include financial services companies. | |
| Other important information | |
| California Residents—In accordance with California law, we will not share information we collect about California residents with nonaffiliates except as permitted by law, such as with the consent of the customer or to service the customer’s accounts. We also will limit the sharing of information about you with our affiliates to the extent required by applicable California law. | |
| Vermont Residents—In accordance with Vermont law, we will not share information we collect about Vermont residents with nonaffiliates except as permitted by law, such as with the consent of the customer or to service the customer’s accounts. We will not share creditworthiness information about Vermont residents among VanEck’s affiliates except with the authorization or consent of the Vermont resident. | |
| VANECK VIP EMERGING MARKETS FUND |
| December 31, 2016 (unaudited) |
Dear Shareholder:
The Initial Class shares of the VanEck VIP Emerging Markets Fund (the “Fund”) returned 0.10% during the 12 month period ended December 31, 2016, and underperformed the MSCI Emerging Markets Index (MSCI EM),1 its benchmark index, which gained 11.60% over the same period.
The most significant reason behind the underperformance of the Fund this year has been style. The Fund employs an all-cap strategy, focusing on structural growth. Analyzing emerging markets performance in 2016, certain elements stand out. These are interconnected and they combined to affect materially, and adversely, our performance following a very successful period for the Fund. A rebound in commodities led to a leveraged performance of the commodity-based stocks, countries, and currencies in emerging markets. The Fund eschews investment in many of the largest stocks in this space, because of its cyclical nature, combined with concerns about a high degree of state ownership.
In addition, large-capitalization stocks (some of which are commodity equities) were clear winners this year. Both cyclical and large-cap stocks performed well after a number of years of underperformance, as large-cap value which, in many cases, crosses over with cyclical sectors (materials and energy) will have periods of outperformance over growth. For example, in a review of growth versus value in emerging markets, value outperformed in much of the 2000s as commodity companies led other facets of emerging markets. Following the financial crisis, growth has since outperformed, as consumer stocks began to rally. 2016 breaks this trend, however, our sense is that we are far closer to the end of this short transitional period of outperformance of value than the beginning, and we have focused over the past year on positioning in companies that will benefit when regime change means investors once again favor high-quality growth over low-quality, large-cap cyclicals.
In our opinion, the outperformance of cyclical stocks is unsustainable over the medium- to longer-term, and we remain disciplined in our strategy of investing in structural growth throughout the capitalization range. We believe this approach has served our investors well over time.
Fund Review
On a sector level, consumer staples/discretionary and financials helped the Fund’s relative performance in 2016, while industrials and information technology detracted the most from performance. On a country level, China and Russia were the largest detractors from relative performance.
| 1 |
| VANECK VIP EMERGING MARKETS FUND |
| (unaudited) (continued) |
Thailand and the Philippines aided performance. Small- and mid-cap stocks accounted for more than 80% of the relative underperformance versus the benchmark in 2016.
Our top five performing stocks were companies from across the globe. In India, Yes Bank Ltd. (3.2% of Fund net assets†), a high-quality, private sector bank, benefited from both improving loan growth and widening lending spreads. This led to significant results as has the bank’s focus on retail as opposed to commercial business opportunities. In addition, as it becomes clear that the current government is unlikely to recapitalize the overly indebted state-owned banking sector, the well-managed private banks are positioned to take considerable market share.
As a Brazilian real holding, BB Seguridade Participações (1.1% of Fund net assets†), the insurance arm of the largest Latin America-based bank Banco do Brasil, was helped significantly by the rebound in the Brazilian market during the first half of 2016. Their story is a structural one, with the company continuing to display strong execution in line with our growth thesis.
In Peru, in addition to its improving asset quality, consistent performance, and asset growth, financial holding company Credicorp (2.0% of Fund net assets†) benefited from an uptick in the commodities markets, together with the turnaround in the Peruvian market during the 12 month period.
Another company that continued to execute operations well was CP All Plc (2.5% of Fund net assets†) in Thailand. Its principal line of business is the operation of 7-Eleven convenience stores, the largest chain of convenience stores in Thailand. We tend to favor that format as it suits the lifestyle of the increasingly urban populations of emerging markets. The gradual addition of ready-to-eat meals has boosted margins, while the introduction of new services such as being a delivery conduit for e-commerce purchases increases traffic.
Taiwan Semiconductor Manufacturing (3.2% of Fund net assets†), is the largest and undisputed global leader in Integrated Circuit (IC) manufacturing. As a build-to-order foundry, it provides a wide-range of value-add activities and process development. We attribute its structural growth success to its proven, winning business model, unparalleled scale advantage, optimized execution, technology scope and depth, and the demand for more and more advanced processing power for smartphones and general computing. In 2016, the foundry sector generally benefited from recovering end-demand in the first half of the year after low
| 2 |
utilization due to high customer inventory and weak end-demand in 2015. We are structurally positive on Taiwan Semiconductor and expect it to sustain 10% growth in the next three to five years driven by continued strong bit growth in communication devices. Its return on invested capital2 (ROIC) should trend up on a rising return on assets3 (ROA) and a stable or growing margin.
Four of the five biggest detractors from performance during the 12 month period were Chinese. Having been forced to change its business model, Hong Kong-based Boer Power Holdings (sold by Fund by period end), which provides electrical distribution solutions, faced, in our opinion, increased business risk. The company’s leverage increased as it took on higher levels of accounts receivable.
CAR (sold by Fund by period end), also based in Hong Kong, is the largest auto rental company in China and provides vehicles to U-Car, a partner providing “Uber-like” chauffeured car services in China. The issues around this company and its poor performance centered on uncertainty surrounding the regulatory environment that led U-Car to scale back its investment and use fewer CAR vehicles.
One of the Fund’s internet holdings, JD.com (2.3% of Fund net assets†) suffered from the widespread exit from the Chinese market during the first quarter of the year, giving back some of its outperformance of the previous year. The second quarter brought some negative points regarding top line sales which caused further multiple contraction. However the company, as market leader, continues to reflect, in our opinion, the considerable strength of the growth opportunities in the ecommerce sector in China and we are inclined to remain patient.
Wasion Group Holdings (sold by Fund by period end) is in the business of improving the efficiency of power use in China. Early in the period under review, it suffered from the fallout created by the adjustment and lengthening of payment timelines on certain government contracts and we exited our position in the company.
Luxoft Holdings (1.2% of Fund net assets†) is a high-end information technology services provider, in particular to the financial services industry, with its programmers largely situated in the ex-Soviet Union countries, referred to as Commonwealth of Independent States (CIS). During the period under review, the company reported lower than expected numbers, largely related to the pulling of a key contract by a client.
| 3 |
| VANECK VIP EMERGING MARKETS FUND |
| (unaudited) (continued) |
The Fund may invest in Chinese A-shares listed and traded on the Shanghai Stock Exchange through Stock Connect, or on such other stock exchanges in China which participate in Stock Connect. The Fund may also invest in participatory notes (P-Notes) to gain exposure to a company where the ability to access the internal capital markets is limited. We currently own three Chinese A-share companies on the Shanghai exchange.
Strategy and Outlook
Developments that occurred in the fourth quarter of 2016 have the potential to be unhelpful for the asset class going forward and bear observation. For instance, the ascent of the U.S. dollar tends to hurt earnings in the emerging markets and contract domestic liquidity. Although we can make a case for “overvaluation” of the U.S. dollar, particularly against local emerging markets currencies, in the short term, flows matter more. In addition, the decline in bonds globally may or may not be supportive for emerging markets, depending on whether such decline is accompanied by substantially better economic growth. One significant supporting factor, however, is that emerging markets earnings expectations held up well over 2016 in stark contrast to the previous four years over which the ultimate earnings results significantly disappointed.
Entering 2017, emerging markets face a significant degree of risk, both good and bad. The actions of the new U.S. administration, though they may be very different from the rhetoric of the campaign, may also impact the case for emerging markets, both positively and negatively. The complicated and uncertain interplay of reflationary policies, rates and the U.S. dollar, is hard to predict. It may lead to reflation, stagflation, or possibly lead back to the deflationary environment of the last few years.
Protectionism has reared its ugly head. This will ultimately impact negatively on smaller, more open emerging markets. The upside, however, would be to force these economies into effecting reform which will increase the value-added of their economies.
We are encouraged by the solid delivery of earnings growth from the companies that we hold. They have generally met fairly buoyant expectations. They may not be the “flavor of the month” (or the year), as currently heavy cyclicals rule the roost, but those steadily increasing earnings will be reflected in the performance of the stock prices, and thus, the Fund. With our disciplined focus on structural growth, we
| 4 |
expect to continue to benefit over the medium term, without the difficulties of trying to time cycles.
Since idiosyncrasy remains a critical aspect of investing in emerging markets, we continue to appreciate the flexibility inherent in our process that allows us to invest in well-priced structural growth opportunities across market capitalizations. In addition, we also retain the advantage of being able to avoid certain larger capitalization names that are often exposed to cyclical industries and/or may be subject to unwelcome government involvement. As we go forward, we will continue our pursuit of attractive investments that we believe can deliver the anticipated growth that characterizes emerging markets countries.
The Fund continues to employ an active, non-index driven approach. This provides the flexibility to address not only interesting emerging markets opportunities, but also concerns in both companies and countries should any arise. It is essentially the flexibility to invest in the best structural growth stories that we can find, many of which are found in mid- and small-cap stocks.
The Fund is subject to the risks associated with its investments in emerging markets securities, which tend to be more volatile and less liquid than securities traded in developed countries. The Fund’s investments in foreign securities involve risks related to adverse political and economic developments unique to a country or a region, currency fluctuations or controls, and the possibility of arbitrary action by foreign governments, including the takeover of property without adequate compensation or imposition of prohibitive taxation. The Fund is subject to risks associated with investments in derivatives, illiquid securities, and small- or mid-cap companies. The Fund is also subject to inflation risk, market risk, non-diversification risk, and leverage risk. Please see the prospectus for information on these and other risk considerations.
| 5 |
VANECK VIP EMERGING MARKETS FUND
(unaudited) (continued)
We appreciate your participation in the VanEck VIP Emerging Markets Fund, and we look forward to helping you meet your investment goals in the future.
 |  | |
| David A. Semple | Angus Shillington | |
| Portfolio Manager | Deputy Portfolio Manager | |
| January 23, 2017 |
Represents the opinions of the investment adviser. Past performance is no guarantee of future results. Not intended to be a forecast of future events, a guarantee of future results or investment advice. Current market conditions may not continue.
| † | All Fund assets referenced are Total Net Assets as of December 31, 2016. |
All indices are unmanaged and include the reinvestment of all dividends, but do not reflect the payment of transaction costs, advisory fees or expenses that are associated with an investment in the Fund. An index’s performance is not illustrative of the Fund’s performance. Indices are not securities in which investments can be made. Results reflect past performance and do not guarantee future results.
| 1 | MSCI Emerging Markets Index (MSCI EM) is a free float-adjusted market capitalization index that is designed to measure equity market performance of 23 emerging markets countries. |
| 2 | Return on invested capital (ROIC) formula is the operating profit in the income statement minus taxes. |
| 3 | The return on assets (ROA) ratio formula is calculated by dividing net income by average total assets. This ratio can also be represented as a product of the profit margin and the total asset turnover. |
| 6 |
December 31, 2016 (unaudited)
| Samsung Electronics Co. Ltd. | 4.7 | % | ||
| Tencent Holdings Ltd. | 4.0 | % | ||
| Alibaba Group Holding Ltd. | 3.5 | % | ||
| Taiwan Semiconductor Manufacturing Co. Ltd. | 3.2 | % | ||
| Yes Bank Ltd. | 3.2 | % | ||
| Naspers Ltd. | 2.8 | % | ||
| CP All Public Co. Ltd. | 2.5 | % | ||
| JD.com, Inc. | 2.3 | % | ||
| Credicorp Ltd. | 2.0 | % | ||
| CIE Automotive, S.A. | 1.9 | % | ||
| * Percentage of net assets. Portfolio is subject to change. |
| 7 |
VANECK VIP EMERGING MARKETS FUND
December 31, 2016 (unaudited)
| This chart shows the value of a hypothetical $10,000 investment in the Fund over the past 10 fiscal year periods or since inception (for funds lacking 10-year records). The result is compared with the Fund’s benchmark, and may include a broad-based market index | Hypothetical Growth of $10,000 (Ten Year: Initial Class) 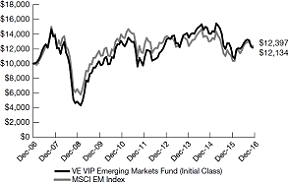 |
| Average Annual Total Return 12/31/16 | Fund Initial Class | MSCI EM | ||||||
| One Year | 0.10 | % | 11.60 | % | ||||
| Five Year | 4.51 | % | 1.64 | % | ||||
| Ten Year | 1.95 | % | 2.17 | % | ||||
| Total Return 12/31/16 | Fund Class S | MSCI EM | ||||||
| Life* (cumulative) | 0.10 | % | 5.50 | % | ||||
| * Inception date for the Fund was 5/2/16 (Class S) | ||||||||
The performance quoted represents past performance. Past performance is no guarantee of future results; current performance may be lower or higher than the performance data quoted. Performance information reflects temporary waivers of expenses and/or fees and does not include insurance/annuity fees and expenses. Investment returns would have been reduced had these fees/expenses been included. Investment return and the value of the shares of the Fund will fluctuate so that an investor’s shares, when redeemed, may be worth more or less than their original cost. Fund returns assume that dividends and capital gains distributions have been reinvested in the Fund at NAV. Performance information current to the most recent month end is available by calling 800.826.2333 or by visiting vaneck.com.
The Fund is only available to life insurance and annuity companies to fund their variable annuity and variable life insurance products. These contracts offer life insurance and tax benefits to the beneficial owners of the Fund. Your insurance or annuity company charges fees and expenses for these benefits that are not reflected in this report or in the Fund’s performance, since they are not direct expenses of the Fund. For insurance products, performance figures do not reflect the cost for insurance and if they did, the performance shown would be significantly lower. A review of your particular life and/or annuity contract will provide you with much greater detail regarding these costs and benefits.
| 8 |
All indices listed are unmanaged indices and include the reinvestment of all dividends, but do not reflect the payment of transaction costs, advisory fees or expenses that are associated with an investment in the Fund. An index’s performance is not illustrative of the Fund’s performance. Indices are not securities in which investments can be made.
MSCI Emerging Markets Index (MSCI EM) is a free float-adjusted market capitalization index that is designed to measure equity market performance of emerging markets, calculated with dividends reinvested.
| 9 |
VANECK VIP EMERGING MARKETS FUND
(unaudited)
As a shareholder of the Fund, you incur two types of costs: (1) transaction costs, including program fees on purchase payments; and (2) ongoing costs, including management fees and other Fund expenses. This disclosure is intended to help you understand the ongoing costs (in dollars) of investing in the Fund and to compare these costs with the ongoing costs of investing in other mutual funds.
The disclosure is based on an investment of $1,000 invested at the beginning of the period and held for the entire period, July 1, 2016 to December 31, 2016.
Actual Expenses
The first line in the table below provides information about account values and actual expenses. You may use the information in this line, together with the amount you invested, to estimate the expenses that you paid over the period. Simply divide your account value by $1,000 (for example, an $8,600 account value divided by $1,000 = 8.6), then multiply the result by the number in the first line under the heading entitled “Expenses Paid During the Period.”
Hypothetical Example for Comparison Purposes
The second line in the table below provides information about hypothetical account values and hypothetical expenses based on the Fund’s actual expense ratio and an assumed rate of return of 5% per year before expenses, which is not the Fund’s actual return. The hypothetical account values and expenses may not be used to estimate the actual ending account balance or expenses you paid for the period. You may use this information to compare the ongoing costs of investing in the Fund and other funds. To do so, compare this 5% hypothetical example with the 5% hypothetical examples that appear in the shareholder reports of other funds.
Please note that the expenses shown in the table are meant to highlight your ongoing costs only and do not reflect any transactional costs, such as fees on purchase payments. Therefore, the second line of the table is useful in comparing ongoing costs only, and will not help you determine the relative costs of owning different funds. In addition, if these transactional costs were included, your costs would have been higher.
| 10 |
| Beginning Account Value July 1, 2016 | Ending Account Value December 31, 2016 | Expenses Paid During the Period* July 1, 2016 - December 31, 2016 | |||||||
| VanEck VIP Emerging Markets Fund | |||||||||
| Initial Class | |||||||||
| Actual | $1,000.00 | $ 987.70 | $5.75 | ||||||
| Hypothetical** | $1,000.00 | $1,019.36 | $5.84 | ||||||
| Class S | |||||||||
| Actual | $1,000.00 | $ 984.80 | $8.48 | ||||||
| Hypothetical** | $1,000.00 | $1,016.59 | $8.62 |
| * | Expenses are equal to the Fund’s annualized expense ratio (for the six months ended December 31, 2016), of 1.15% on Initial Class Shares and 1.70% on Class S Shares, multiplied by the average account value over the period, multiplied by the number of days in the most recent fiscal half year divided by the number of the days in the fiscal year (to reflect the one-half year period). |
| ** | Assumes annual return of 5% before expenses |
| 11 |
| VANECK VIP EMERGING MARKETS FUND |
| SCHEDULE OF INVESTMENTS |
| December 31, 2016 |
| Number of Shares | Value | ||||||
| COMMON STOCKS: 90.7% | |||||||
| Argentina: 0.6% | |||||||
| 52,700 | Grupo Supervielle SA (ADR) * | $ | 692,478 | ||||
| Brazil: 3.6% | |||||||
| 157,000 | BB Seguridade Participacoes SA # | 1,362,623 | |||||
| 108,900 | CVC Brasil Operadora e Agencia de Viagens SA # | 792,018 | |||||
| 50,000 | Fleury SA # | 546,820 | |||||
| 40,000 | Ouro Fino Saude Animal Participacoes SA | 344,118 | |||||
| 65,000 | Smiles SA # | 892,146 | |||||
| 53,000 | Valid Solucoes SA # | 400,772 | |||||
| 4,338,497 | |||||||
| China / Hong Kong: 28.6% | |||||||
| 263,000 | AIA Group Ltd. # | 1,473,284 | |||||
| 48,300 | Alibaba Group Holding Ltd. (ADR) * | 4,241,223 | |||||
| 3,356,000 | Beijing Enterprises Water Group Ltd. # | 2,221,180 | |||||
| 174,000 | Beijing Originwater Technology Co. Ltd. * | 438,662 | |||||
| 3,588,969 | China Animal Healthcare Ltd. * # § | 240,669 | |||||
| 36,800 | China Lodging Group Ltd. (ADR) | 1,907,712 | |||||
| 1,328,000 | China Maple Leaf Educational Systems Ltd. # | 880,336 | |||||
| 1,426,000 | China Medical System Holdings Ltd. # | 2,251,344 | |||||
| 1,505,000 | China Resources Phoenix Healthcare Holdings Co. Ltd. * # | 1,916,646 | |||||
| Number of Shares | Value | ||||||
| China / Hong Kong: (continued) | |||||||
| 1,424,000 | Fu Shou Yuan International Group Ltd. # | $ | 837,036 | ||||
| 175,000 | Galaxy Entertainment Group Ltd. # | 757,946 | |||||
| 111,650 | JD.com, Inc. (ADR) * | 2,840,376 | |||||
| 26,800 | Kweichow Moutai Co. Ltd. # | 1,287,264 | |||||
| 1,964,000 | Man Wah Holdings Ltd. # | 1,326,135 | |||||
| 161,991 | Shanghai International Airport Co. Ltd. # | 617,496 | |||||
| 218,000 | Shenzhou International Group Holdings Ltd. # | 1,374,419 | |||||
| 220,000 | Sinopharm Group Co. Ltd. # | 901,636 | |||||
| 19,180 | TAL Education Group (ADR) * | 1,345,477 | |||||
| 481,000 | Techtronic Industries Co. # | 1,721,247 | |||||
| 203,000 | Tencent Holdings Ltd. # | 4,922,163 | |||||
| 446,948 | Zhengzhou Yutong Bus Co. Ltd. # | 1,258,127 | |||||
| 34,760,378 | |||||||
| Egypt: 0.8% | |||||||
| 255,750 | Commercial International Bank Egypt SAE # | 1,030,094 | |||||
| India: 14.0% | |||||||
| 1,077,000 | Ashok Leyland Ltd. * # | 1,265,543 | |||||
| 224,000 | Cadila Healthcare Ltd. # | 1,168,856 | |||||
| 127,000 | Cholamandalam Investment and Finance Co. Ltd. # | 1,764,007 | |||||
| 586,000 | Fortis Healthcare Ltd. * # | 1,554,445 | |||||
See Notes to Financial Statements
| 12 |
| Number of Shares | Value | ||||||
| India: (continued) | |||||||
| 84,000 | HDFC Bank Ltd. | $ | 1,634,949 | ||||
| 185,800 | Phoenix Mills Ltd. # | 1,015,792 | |||||
| 98,000 | Strides Shasun Ltd. # | 1,522,569 | |||||
| 60,734 | Supreme Industries Ltd. * # | 810,259 | |||||
| 121,278 | Syngene International Ltd. # Reg S 144A | 997,014 | |||||
| 191,000 | TVS Motor Co. Ltd. # | 1,007,056 | |||||
| 74,199 | VA Tech Wabag Ltd. # | 510,509 | |||||
| 227,000 | Yes Bank Ltd. # | 3,845,829 | |||||
| 17,096,828 | |||||||
| Indonesia: 2.1% | |||||||
| 2,398,000 | Bank Rakyat Indonesia Tbk PT # | 2,071,187 | |||||
| 1,186,000 | Link Net Tbk PT | 453,361 | |||||
| 2,524,548 | |||||||
| Jordan: 0.6% | |||||||
| 32,000 | Hikma Pharmaceuticals Plc (GBP) # | 745,846 | |||||
| Kenya: 1.4% | |||||||
| 9,416,000 | Safaricom Ltd. | 1,759,699 | |||||
| Mexico: 3.4% | |||||||
| 21,360 | Fomento Economico Mexicano SAB de CV (ADR) | 1,627,846 | |||||
| 476,000 | Qualitas Controladora SAB de CV | 673,943 | |||||
| 731,000 | Unifin Financiera SAPI de CV SOFOM ENR | 1,812,544 | |||||
| 4,114,333 | |||||||
| Peru: 2.0% | |||||||
| 15,660 | Credicorp Ltd. (USD) | 2,472,088 | |||||
| Number of Shares | Value | ||||||
| Philippines: 1.3% | |||||||
| 1,035,000 | Robinsons Retail Holdings, Inc. # | $ | 1,545,231 | ||||
| Russia: 2.1% | |||||||
| 6,090 | Magnit PJSC # | 1,088,615 | |||||
| 73,000 | Yandex NV (USD) * | 1,469,490 | |||||
| 2,558,105 | |||||||
| South Africa: 5.9% | |||||||
| 522,000 | Advtech Ltd. * | 652,607 | |||||
| 32,000 | Aspen Pharmacare Holdings Ltd. # | 659,224 | |||||
| 23,300 | Naspers Ltd. # | 3,401,605 | |||||
| 342,000 | Rhodes Food Group Pty Ltd. | 671,113 | |||||
| 59,000 | Spar Group Ltd. | 853,097 | |||||
| 887,000 | Transaction Capital Ltd. | 933,905 | |||||
| 7,171,551 | |||||||
| South Korea: 3.8% | |||||||
| 2,365 | LG Household & Health Care Ltd. # | 1,677,947 | |||||
| 2,830 | NAVER Corp. # | 1,812,268 | |||||
| 23,365 | Soulbrain Co. Ltd. # | 1,166,450 | |||||
| 4,656,665 | |||||||
| Spain: 1.9% | |||||||
| 120,000 | CIE Automotive SA # | 2,335,147 | |||||
| Switzerland: 2.0% | |||||||
| 27,000 | Luxoft Holding, Inc. (USD) * | 1,517,400 | |||||
| 43,800 | Wizz Air Holdings Plc (GBP) * # Reg S 144A | 966,312 | |||||
| 2,483,712 | |||||||
| Taiwan: 7.0% | |||||||
| 576,000 | Advanced Semiconductor Engineering, Inc. # | 587,224 | |||||
| 297,800 | Aerospace Industrial Development Corp. # | 352,512 | |||||
See Notes to Financial Statements
| 13 |
| VANECK VIP EMERGING MARKETS FUND |
| SCHEDULE OF INVESTMENTS |
| (continued) |
| Number of Shares | Value | ||||||
| Taiwan: (continued) | |||||||
| 384,000 | Basso Industry Corp. # | $ | 1,108,190 | ||||
| 12,000 | Largan Precision Co. Ltd. # | 1,398,736 | |||||
| 101,654 | Poya Co. Ltd. | 1,178,062 | |||||
| 698,000 | Taiwan Semiconductor Manufacturing Co. Ltd. # | 3,909,675 | |||||
| 8,534,399 | |||||||
| Thailand: 3.6% | |||||||
| 1,758,000 | CP ALL PCL # | 3,063,916 | |||||
| 1,135,000 | Srisawad Power 1979 PCL (NVDR) # | 1,302,509 | |||||
| 4,366,425 | |||||||
| Turkey: 3.2% | |||||||
| 106,283 | AvivaSA Emeklilik ve Hayat AS # | 578,964 | |||||
| 191,000 | Tofas Turk Otomobil Fabrikasi AS # | 1,332,620 | |||||
| 4,839,079 | Turkiye Sinai Kalkinma Bankasi AS # | 1,932,112 | |||||
| 3,843,696 | |||||||
| United Arab Emirates: 0.8% | |||||||
| 49,500 | NMC Health Plc (GBP) # | 941,677 | |||||
| United Kingdom: 2.0% | |||||||
| 49,900 | Bank of Georgia Holdings Plc # | 1,837,298 | |||||
| 1,235,312 | Hirco Plc * # § | 0 | |||||
| 255,000 | International Personal Finance Plc # | 540,937 | |||||
| 2,378,235 | |||||||
| Total Common Stocks (Cost: $105,138,587) | 110,349,632 | ||||||
| Number of Shares | Value | ||||||
| PREFERRED STOCKS: 6.8% | |||||||
| Brazil: 0.9% | |||||||
| 101,760 | Itau Unibanco Holding SA # | $ | 1,055,447 | ||||
| Colombia: 1.3% | |||||||
| 160,000 | Banco Davivienda SA | 1,598,934 | |||||
| South Korea: 4.6% | |||||||
| 4,783 | Samsung Electronics Co. Ltd. # | 5,663,242 | |||||
| Total Preferred Stocks (Cost: $8,010,596) | 8,317,623 | ||||||
| REAL ESTATE INVESTMENT TRUSTS: 1.7% | |||||||
| Mexico: 1.7% | |||||||
| 663,000 | Concentradora Hipotecaria SAPI de CV | 746,807 | |||||
| 1,060,800 | TF Administradora Industrial, S de RL de CV | 1,335,617 | |||||
| Total Real Estate Investment Trusts (Cost: $3,048,078) | 2,082,424 | ||||||
| MONEY MARKET FUND: 0.7% (Cost: $815,513) | |||||||
| 815,513 | AIM Treasury Portfolio—Institutional Class | 815,513 | |||||
| Total Investments: 99.9% (Cost: $117,012,774) | 121,565,192 | ||||||
| Other assets less liabilities: 0.1% | 167,426 | ||||||
| NET ASSETS: 100.0% | $ | 121,732,618 | |||||
| ADR | American Depositary Receipt |
| GBP | British Pound |
| NVDR | Non-Voting Depositary Receipt |
| USD | United States Dollar |
See Notes to Financial Statements
| 14 |
| * | Non-income producing |
| # | Indicates a fair valued security which has been valued in good faith pursuant to guidelines established by the Board of Trustees. The aggregate value of fair valued securities is $87,548,171 which represents 71.9% of net assets. |
| § | Illiquid Security — the aggregate value of illiquid securities is $240,669 which represents 0.2% of net assets. |
| Reg S | Security was purchased pursuant to Regulation S under the Securities Act of 1933, which exempts from registration securities offered and sold outside of the United States. Such a security cannot be sold in the United States without either an effective registration statement filed pursuant to the Securities Act of 1933, or pursuant to an exemption from registration. |
| 144A | Security exempt from registration under Rule 144A of the Securities Act of 1933, as amended, or otherwise restricted. These securities may be resold in transactions exempt from registration, unless otherwise noted, and the value amounted to $1,963,326, or 1.6% of net assets. |
| Summary of Investments by Sector (unaudited) | % of Investments | Value | ||||||
| Consumer Discretionary | 21.1 | % | $ | 25,690,135 | ||||
| Consumer Staples | 9.7 | 11,815,029 | ||||||
| Financials | 23.5 | 28,613,132 | ||||||
| Health Care | 11.3 | 13,790,864 | ||||||
| Industrials | 4.4 | 5,299,424 | ||||||
| Information Technology | 21.0 | 25,521,421 | ||||||
| Materials | 1.6 | 1,976,709 | ||||||
| Real Estate | 2.6 | 3,098,216 | ||||||
| Telecommunication Services | 1.8 | 2,213,060 | ||||||
| Utilities | 2.3 | 2,731,689 | ||||||
| Money Market Fund | 0.7 | 815,513 | ||||||
| 100.0 | % | $ | 121,565,192 | |||||
The summary of inputs used to value the Fund’s investments as of December 31, 2016 is as follows:
| Level 1 Quoted Prices | Level 2 Significant Observable Inputs | Level 3 Significant Unobservable Inputs | Value | |||||||||||||
| Common Stocks | ||||||||||||||||
| Argentina | $ | 692,478 | $ | — | $ — | $ | 692,478 | |||||||||
| Brazil | 344,118 | 3,994,379 | — | 4,338,497 | ||||||||||||
| China / Hong Kong | 10,773,450 | 23,746,259 | 240,669 | 34,760,378 | ||||||||||||
| Egypt | — | 1,030,094 | — | 1,030,094 | ||||||||||||
| India | 1,634,949 | 15,461,879 | — | 17,096,828 | ||||||||||||
| Indonesia | 453,361 | 2,071,187 | — | 2,524,548 | ||||||||||||
| Jordan | — | 745,846 | — | 745,846 | ||||||||||||
| Kenya | 1,759,699 | — | — | 1,759,699 | ||||||||||||
| Mexico | 4,114,333 | — | — | 4,114,333 | ||||||||||||
| Peru | 2,472,088 | — | — | 2,472,088 | ||||||||||||
| Philippines | — | 1,545,231 | — | 1,545,231 | ||||||||||||
See Notes to Financial Statements
| 15 |
VANECK VIP EMERGING MARKETS FUND
SCHEDULE OF INVESTMENTS
(continued)
| Level 1 Quoted Prices | Level 2 Significant Observable Inputs | Level 3 Significant Unobservable Inputs | Value | |||||||||||||
| Common Stocks (continued) | ||||||||||||||||
| Russia | $ | 1,469,490 | $ | 1,088,615 | $ — | $ | 2,558,105 | |||||||||
| South Africa | 3,110,722 | 4,060,829 | — | 7,171,551 | ||||||||||||
| South Korea | — | 4,656,665 | — | 4,656,665 | ||||||||||||
| Spain | — | 2,335,147 | — | 2,335,147 | ||||||||||||
| Switzerland | 1,517,400 | 966,312 | — | 2,483,712 | ||||||||||||
| Taiwan | 1,178,062 | 7,356,337 | — | 8,534,399 | ||||||||||||
| Thailand | — | 4,366,425 | — | 4,366,425 | ||||||||||||
| Turkey | — | 3,843,696 | — | 3,843,696 | ||||||||||||
| United Arab Emirates | — | 941,677 | — | 941,677 | ||||||||||||
| United Kingdom | — | 2,378,235 | 0 | 2,378,235 | ||||||||||||
| Preferred Stocks | ||||||||||||||||
| Brazil | — | 1,055,447 | — | 1,055,447 | ||||||||||||
| Colombia | 1,598,934 | — | — | 1,598,934 | ||||||||||||
| South Korea | — | 5,663,242 | — | 5,663,242 | ||||||||||||
| Real Estate Investment Trusts* | 2,082,424 | — | — | 2,082,424 | ||||||||||||
| Money Market Fund | 815,513 | — | — | 815,513 | ||||||||||||
| Total | $ | 34,017,021 | $ | 87,307,502 | $240,669 | $ | 121,565,192 | |||||||||
* See Schedule of Investments for security type and geographic sector breakouts.
During the year ended December 31, 2016, transfers of securities from Level 1 to Level 2 were $1,733,812 and transfers from Level 2 to Level 1 were $3,504,825. These transfers resulted primarily from changes in certain foreign securities valuation methodologies between the last close of the securities’ primary market (Level 1) and valuation by the pricing service (Level 2), which takes into account market direction or events occurring before the Fund’s pricing time but after the last local close, as described in the Notes to Financial Statements.
The following table reconciles the valuation of the Fund’s Level 3 investment securities and related transactions during the year ended December 31, 2016:
| Common Stocks | ||||||||
| China / Hong Kong | United Kingdom | |||||||
| Balance as of December 31, 2015 | $602,017 | $ 0 | ||||||
| Realized gain (loss) | — | — | ||||||
| Net change in unrealized appreciation (depreciation) | (361,348 | ) | 0 | |||||
| Purchases | — | — | ||||||
| Sales | — | — | ||||||
| Transfers in and/or out of level 3 | — | — | ||||||
| Balance as of December 31, 2016 | $240,669 | $ 0 | ||||||
See Notes to Financial Statements
| 16 |
STATEMENT OF ASSETS AND LIABILITIES
December 31, 2016
| Assets: | ||||
| Investments, at value (Cost $117,012,774) | $ | 121,565,192 | ||
| Cash denominated in foreign currency, at value (Cost $365,675) | 364,844 | |||
| Receivables: | ||||
| Investments sold | 163,814 | |||
| Shares of beneficial interest sold | 486,795 | |||
| Dividends | 34,699 | |||
| Prepaid expenses | 3,082 | |||
| Total assets | 122,618,426 | |||
| Liabilities: | ||||
| Payables: | ||||
| Investments purchased | 297,678 | |||
| Shares of beneficial interest redeemed | 144,466 | |||
| Due to Adviser | 102,319 | |||
| Due to custodian | 1,226 | |||
| Deferred Trustee fees | 56,778 | |||
| Accrued expenses | 283,341 | |||
| Total liabilities | 885,808 | |||
| NET ASSETS | $ | 121,732,618 | ||
| Initial Class Shares: | ||||
| Net Assets | $ | 121,722,596 | ||
| Shares of beneficial interest outstanding | 11,698,938 | |||
| Net asset value, redemption and offering price per share | $ | 10.40 | ||
| Class S Shares: | ||||
| Net Assets | $ | 10,022 | ||
| Shares of beneficial interest outstanding | 967 | |||
| Net asset value, redemption and offering price per share | $ | 10.36 | ||
| Net Assets consist of: | ||||
| Aggregate paid in capital | $ | 130,428,566 | ||
| Net unrealized appreciation | 4,340,602 | |||
| Undistributed net investment income | 440,371 | |||
| Accumulated net realized loss | (13,476,921 | ) | ||
| $ | 121,732,618 |
See Notes to Financial Statements
| 17 |
VANECK VIP EMERGING MARKETS FUND
For the Year Ended December 31, 2016
| Income: | ||||||||
| Dividends (net of foreign taxes withheld of $181,555) | $ | 2,351,012 | ||||||
| Expenses: | ||||||||
| Management fees | $ | 1,253,497 | ||||||
| Distribution fees – Class S Shares | 17 | |||||||
| Transfer agent fees – Initial Class Shares | 27,451 | |||||||
| Transfer agent fees – Class S Shares | 2,002 | |||||||
| Custodian fees | 34,823 | |||||||
| Professional fees | 76,414 | |||||||
| Reports to shareholders | 41,270 | |||||||
| Insurance | 8,403 | |||||||
| Trustees’ fees and expenses | 11,720 | |||||||
| Interest | 5,048 | |||||||
| Other | 18,221 | |||||||
| Total expenses | 1,478,866 | |||||||
| Waiver of management fees | (1,979 | ) | ||||||
| Net expenses | 1,476,887 | |||||||
| Net investment income | 874,125 | |||||||
| Net realized loss on: | ||||||||
| Investments (net of foreign taxes of $41,277) | (12,930,063 | ) | ||||||
| Foreign currency transactions and foreign denominated assets and liabilities | (337,450 | ) | ||||||
| Net realized loss | (13,267,513 | ) | ||||||
| Net change in unrealized appreciation (depreciation) on: | ||||||||
| Investments (net of foreign taxes of $202,990) | 12,282,352 | |||||||
| Foreign currency transactions and foreign denominated assets and liabilities | (10,288 | ) | ||||||
| Net change in unrealized appreciation (depreciation) | 12,272,064 | |||||||
| Net Decrease in Net Assets Resulting from Operations | $ | (121,324 | ) |
See Notes to Financial Statements
| 18 |
STATEMENT OF CHANGES IN NET ASSETS
| Year Ended December 31, | Year Ended December 31, | |||||||
| 2016 | 2015 | |||||||
| Operations: | ||||||||
| Net investment income | $ | 874,125 | $ | 1,067,753 | ||||
| Net realized gain (loss) | (13,267,513 | ) | 169,335 | |||||
| Net change in unrealized appreciation (depreciation) | 12,272,064 | (23,176,667 | ) | |||||
| Net decrease in net assets resulting from operations | (121,324 | ) | (21,939,579 | ) | ||||
| Dividends and Distributions to shareholders from: | ||||||||
| Net investment income | ||||||||
| Initial Class Shares | (572,076 | ) | (799,151 | ) | ||||
| Net realized capital gains | ||||||||
| Initial Class Shares | (619,749 | ) | (7,885,742 | ) | ||||
| Total dividends and distributions | (1,191,825 | ) | (8,684,893 | ) | ||||
| Share transactions*: | ||||||||
| Proceeds from sale of shares | ||||||||
| Initial Class Shares | 23,055,188 | 35,539,992 | ||||||
| Class S Shares† | 10,010 | — | ||||||
| 23,065,198 | 35,539,992 | |||||||
| Reinvestment of dividends and distributions | ||||||||
| Initial Class Shares | 1,191,825 | 8,684,893 | ||||||
| Cost of shares redeemed | ||||||||
| Initial Class Shares | (29,236,352 | ) | (39,011,493 | ) | ||||
| Net increase (decrease) in net assets resulting from share transactions | (4,979,329 | ) | 5,213,392 | |||||
| Total decrease in net assets | (6,292,478 | ) | (25,411,080 | ) | ||||
| Net Assets: | ||||||||
| Beginning of year | 128,025,096 | 153,436,176 | ||||||
| End of year (including undistributed net investment income of $440,371 and $524,919, respectively) | $ | 121,732,618 | $ | 128,025,096 | ||||
| * Shares of beneficial interest issued, reinvested and redeemed (unlimited number of $.001 par value shares authorized): | ||||||||
| Initial Class Shares: | ||||||||
| Shares sold | 2,203,274 | 2,848,951 | ||||||
| Shares reinvested | 126,925 | 714,218 | ||||||
| Shares redeemed | (2,819,100 | ) | (3,222,848 | ) | ||||
| Net increase (decrease) | (488,901 | ) | 340,321 | |||||
| Class S Shares†: | ||||||||
| Shares sold | 967 | |||||||
| Shares reinvested | — | |||||||
| Shares redeemed | — | |||||||
| Net increase | 967 | |||||||
| † Inception date of Class S Shares was May 2, 2016. | ||||||||
See Notes to Financial Statements
| 19 |
VANECK VIP EMERGING MARKETS FUND
For a share outstanding throughout each year:
| Initial Class Shares | ||||||||||||||||||||
| Year Ended December 31, | ||||||||||||||||||||
| 2016 | 2015 | 2014 | 2013 | 2012 | ||||||||||||||||
| Net asset value, beginning of year | $10.50 | $ 12.95 | $14.90 | $13.50 | $10.40 | |||||||||||||||
| Income from investment operations: | ||||||||||||||||||||
| Net investment income | 0.08 | 0.09 | 0.10 | 0.07 | 0.07 | |||||||||||||||
| Net realized and unrealized gain (loss) on investments | (0.08 | ) | (1.80 | ) | (0.23 | ) | 1.54 | 3.03 | ||||||||||||
| Total from investment operations | — | (b) | (1.71 | ) | (0.13 | ) | 1.61 | 3.10 | ||||||||||||
| Less dividends and distributions from: | ||||||||||||||||||||
| Net investment income | (0.05 | ) | (0.07 | ) | (0.08 | ) | (0.21 | ) | — | |||||||||||
| Net realized capital gains | (0.05 | ) | (0.67 | ) | (1.74 | ) | — | — | ||||||||||||
| Total dividends and distributions | (0.10 | ) | (0.74 | ) | (1.82 | ) | (0.21 | ) | — | |||||||||||
| Redemption fees | — | — | — | — | — | (b) | ||||||||||||||
| Net asset value, end of year | $10.40 | $ 10.50 | $12.95 | $14.90 | $13.50 | |||||||||||||||
| Total return (a) | 0.10 | % | (13.99 | )% | (0.41 | )% | 12.02 | % | 29.81 | % | ||||||||||
| Ratios/Supplemental Data | ||||||||||||||||||||
| Net assets, end of year (000’s) | $121,723 | $128,025 | $153,436 | $167,932 | $171,456 | |||||||||||||||
| Ratio of gross expenses to average net assets | 1.18 | % | 1.14 | % | 1.17 | % | 1.23 | % | 1.23 | % | ||||||||||
| Ratio of net expenses to average net assets | 1.18 | % | 1.14 | % | 1.17 | % | 1.23 | % | 1.23 | % | ||||||||||
| Ratio of net expenses, excluding interest expense, to average net assets | 1.19 | %(c) | 1.13 | % | 1.17 | % | 1.22 | % | 1.23 | % | ||||||||||
| Ratio of net investment income to average net assets | 0.70 | % | 0.71 | % | 0.69 | % | 0.56 | % | 0.55 | % | ||||||||||
| Portfolio turnover rate | 62 | % | 65 | % | 85 | % | 83 | % | 93 | % | ||||||||||
| (a) | Total return is calculated assuming an initial investment made at the net asset value at the beginning of the year, reinvestment of any dividends and distributions at net asset value on the dividend/distribution payment date and a redemption at the net asset value on the last day of the year. The return does not reflect the deduction of taxes that a shareholder would pay on Fund dividends/distributions or the redemption of Fund shares. |
| (b) | Amount represents less than $0.005 per share |
| (c) | Excludes reimbursement from prior year custodial charge of 0.02%. |
See Notes to Financial Statements
| 20 |
FINANCIAL HIGHLIGHTS
For a share outstanding throughout each period:
| Class S Shares | |||||
| May 2, 2016 (a) through December 31, 2016 | |||||
| Net asset value, beginning of period | $10.35 | ||||
| Income from investment operations: | |||||
| Net investment income | 0.01 | ||||
| Net realized and unrealized gain (loss) on investments | — | (b) | |||
| Total from investment operations | 0.01 | ||||
| Net asset value, end of period | $10.36 | ||||
| Total return (c) | 0.10 | %(d) | |||
| Ratios/Supplemental Data | |||||
| Net assets, end of period (000’s) | $ 10 | ||||
| Ratio of gross expenses to average net assets | 30.43 | %(e) | |||
| Ratio of net expenses to average net assets | 1.75 | %(e) | |||
| Ratio of net expenses, excluding interest expense, to average net assets | 1.75 | %(e) | |||
| Ratio of net investment income to average net assets | 0.12 | %(e) | |||
| Portfolio turnover rate | 62 | %(d)(f) | |||
| (a) | Commencement of operations |
| (b) | Amount represents less than $0.005 per share |
| (c) | Total return is calculated assuming an initial investment made at the net asset value at the beginning of the period, reinvestment of any dividends and distributions at net asset value on the dividend/distribution payment date and a redemption at the net asset value on the last day of the period. The return does not reflect the deduction of taxes that a shareholder would pay on Fund dividends/distributions or the redemption of Fund shares. |
| (d) | Not annualized |
| (e) | Annualized |
| (f) | Portfolio turnover is calculated at the fund level and represents a one year period |
See Notes to Financial Statements
| 21 |
VANECK VIP EMERGING MARKETS FUND
December 31, 2016
Note 1—Fund Organization—VanEck VIP Trust (the “Trust”) (formerly Van Eck VIP Trust) is registered under the Investment Company Act of 1940, as amended, as an open-end management investment company. The Trust was organized as a Massachusetts business trust on January 7, 1987. The VanEck VIP Emerging Markets Fund (the “Fund”) is a diversified series of the Trust and seeks long-term capital appreciation by investing primarily in equity securities in emerging markets around the world. The Fund currently offers two classes of shares: Initial Class Shares and Class S Shares. The two classes are identical except Class S Shares are subject to a distribution fee. Class S Shares commenced operations on May 2, 2016.
Note 2—Significant Accounting Policies—The preparation of financial statements in conformity with U.S. generally accepted accounting principles (“GAAP”) requires management to make estimates and assumptions that affect the reported amounts and disclosures in the financial statements. Actual results could differ from those estimates.
The Fund is an investment company and is following accounting and reporting requirements of Accounting Standards Codification (“ASC”) 946 Financial Services - Investment Companies.
The following is a summary of significant accounting policies followed by the Fund.
| A. | Security Valuation—The Fund values its investments in securities and other assets and liabilities at fair value daily. Fair value is the price that would be received to sell an asset or paid to transfer a liability in an orderly transaction between market participants on the measurement date. Securities traded on national exchanges or traded on the NASDAQ National Market System are valued at the last sales price as reported at the close of each business day. Securities traded on the NASDAQ Stock Market are valued at the NASDAQ official closing price. Over-the-counter securities not included in the NASDAQ National Market System and listed securities for which no sale was reported are valued at the mean of the bid and ask prices. To the extent these securities are actively traded they are categorized as Level 1 in the fair value hierarchy (as described below). Certain foreign securities, whose values may be affected by market direction or events occurring before the Fund’s pricing time (4:00 p.m. Eastern Time) but after the last close of the securities’ primary market, are fair valued using a pricing service and are categorized as Level 2 in the fair value hierarchy. The pricing service considers the correlation of the trading patterns of the foreign security to intraday trading in the U.S. markets, based on indices of domestic securities and other appropriate indicators such as prices of |
| 22 |
| relevant ADR’s and futures contracts. The Fund may also fair value securities in other situations, such as, when a particular foreign market is closed but the Fund is open. Short-term obligations with more than sixty days remaining to maturity are valued at market value. Short-term obligations with sixty days or less to maturity are valued at amortized cost, which with accrued interest approximates fair value. Money market fund investments are valued at net asset value and are categorized as Level 1 in the fair value hierarchy. Securities for which quotations are not available are stated at fair value as determined by the Pricing Committee of Van Eck Associates Corporation (the “Adviser”). The Pricing Committee provides oversight of the Fund’s valuation policies and procedures, which are approved by the Fund’s Board of Trustees. Among other things, these procedures allow the Fund to utilize independent pricing services, quotations from securities dealers, and other market sources to determine fair value. The Pricing Committee convenes regularly to review the fair value of financial instruments for which market prices are not readily available. The Pricing Committee employs various methods for calibrating the valuation approaches utilized to determine fair value, including a regular review of key inputs and assumptions, transactional back-testing and disposition analysis. | ||
| Certain factors such as economic conditions, political events, market trends, the nature of and duration of any restrictions on disposition, trading in similar securities of the issuer or comparable issuers and other security specific information are used to determine the fair value of these securities. Depending on the relative significance of valuation inputs, these securities may be classified either as Level 2 or Level 3 in the fair value hierarchy. The price which the Fund may realize upon sale of an investment may differ materially from the value presented in the Schedule of Investments. | ||
| The Fund utilizes various methods to measure the fair value of its investments on a recurring basis, which includes a hierarchy that prioritizes inputs to valuation methods used to measure fair value. The fair value hierarchy gives highest priority to unadjusted quoted prices in active markets for identical assets and liabilities (Level 1 measurements) and the lowest priority to unobservable inputs (Level 3 measurements). The inputs or methodologies used for valuing securities are not necessarily an indication of the risk associated with investing in those securities. The transfers between levels of the fair value hierarchy assume the financial instruments were transferred at the beginning of the reporting period. The three levels of the fair value hierarchy are described below: |
| 23 |
VANECK VIP EMERGING MARKETS FUND
NOTES TO FINANCIAL STATEMENTS
(continued)
| Level 1 – Quoted prices in active markets for identical securities. | ||
| Level 2 – Significant observable inputs (including quoted prices for similar securities, interest rates, prepayment speeds, credit risk, etc.). | ||
| Level 3 – Significant unobservable inputs (including the Fund’s own assumptions in determining the fair value of investments). | ||
| A summary of the inputs, the levels used to value the Fund’s investments, and transfers between levels are located in the Schedule of Investments. Additionally, tables that reconcile the valuation of the Fund’s Level 3 investments and that present additional information about valuation methodologies and unobservable inputs, if applicable, are located in the Schedule of Investments. | ||
| B. | Federal Income Taxes—It is the Fund’s policy to comply with the provisions of the Internal Revenue Code applicable to regulated investment companies and to distribute all of its taxable income to its shareholders. Therefore, no federal income tax provision is required. | |
| C. | Currency Translation—Assets and liabilities denominated in foreign currencies and commitments under foreign currency contracts are translated into U.S. dollars at the closing prices of such currencies each business day. Purchases and sales of investments are translated at the exchange rates prevailing when such investments are acquired or sold. Income and expenses are translated at the exchange rates prevailing when accrued. The portion of realized and unrealized gains and losses on investments that result from fluctuations in foreign currency exchange rates is not separately disclosed. Recognized gains or losses attributable to foreign currency fluctuations on foreign currency denominated assets, other than investments, and liabilities are recorded as net realized gain (loss) on foreign currency transactions and foreign denominated assets and liabilities in the Statement of Operations. | |
| D. | Dividends and Distributions to Shareholders—Dividends to shareholders from net investment income and distributions from net realized capital gains, if any, are declared and paid annually. Income dividends and capital gain distributions are determined in accordance with U.S. income tax regulations, which may differ from such amounts determined in accordance with GAAP. | |
| E. | Restricted Securities—The Fund may invest in securities that are subject to legal or contractual restrictions on resale. These securities generally may be resold in transactions exempt from registration or to the public if the securities are registered. Disposal of these securities may involve time- |
| 24 |
| consuming negotiations and expense, and prompt sale at an acceptable price may be difficult. Information regarding restricted securities, if any, is included at the end of the Fund’s Schedule of Investments. | ||
| F. | Warrants—The Fund may invest in warrants whose values are linked to indices or underlying instruments. The Fund may use these warrants to gain exposure to markets that might be difficult to invest in through conventional securities. Warrants may be more volatile than their linked indices or underlying instruments. Potential losses are limited to the amount of the original investment. At December 31, 2016, the Fund held no warrants. | |
| G. | Use of Derivative Instruments—The Fund may make investments in derivative instruments, including, but not limited to, options, futures, swaps and other derivatives relating to foreign currency transactions. A derivative is an instrument whose value is derived from underlying assets, indices, reference rates or a combination of these factors. Derivative instruments may be privately negotiated contracts (often referred to as over-the-counter (“OTC”) derivatives) or they may be listed and traded on an exchange. Derivative contracts may involve future commitments to purchase or sell financial instruments or commodities at specified terms on a specified date, or to exchange interest payment streams or currencies based on a notional or contractual amount. Derivative instruments may involve a high degree of financial risk. The use of derivative instruments also involves the risk of loss if the investment adviser is incorrect in its expectation of the timing or level of fluctuations in securities prices, interest rates or currency prices. Investments in derivative instruments also include the risk of default by the counterparty, the risk that the investment may not be liquid and the risk that a small movement in the price of the underlying security or benchmark may result in a disproportionately large movement, unfavorable or favorable, in the price of the derivative instrument. The Fund held no derivative instruments during the year ended December 31, 2016. | |
| H. | Other—Security transactions are accounted for on trade date. Dividend income is recorded on the ex-dividend date except that certain dividends from foreign securities are recognized upon notification of the ex-dividend date. Interest income, including amortization of premiums and discounts, is accrued as earned. Realized gains and losses are calculated on the specific identified cost basis. Estimated foreign taxes that are expected to be withheld from proceeds at the sale of certain foreign investments are accrued by the Fund and decrease the unrealized gain on investments. The Fund received redemption fees from Class R1 Shares prior to its closing on April 30, 2012 which are reflected in the Financial Highlights. |
| 25 |
VANECK VIP EMERGING MARKETS FUND
NOTES TO FINANCIAL STATEMENTS
(continued)
| Income, expenses (excluding class-specific expenses), realized, and unrealized gains/losses are allocated proportionately to each class of shares based upon the relative net asset value of outstanding shares of each class at the beginning of the day (after adjusting for current capital share activity of the respective classes). Class-specific expenses are charged directly to the applicable class of shares. | ||
| In the normal course of business, the Fund enters into contracts that contain a variety of general indemnifications. The Fund’s maximum exposure under these agreements is unknown as this would involve future claims that may be made against the Fund that have not yet occurred. However, the Adviser believes the risk of loss under these arrangements to be remote. |
Note 3—Investment Management and Other Agreements—The Adviser is the investment adviser to the Fund. The Adviser receives a management fee, calculated daily and payable monthly based on an annual rate of 1.00% of the Fund’s average daily net assets. The Adviser has agreed, until at least May 1, 2017, to voluntarily waive management fees and assume expenses to prevent the Fund’s total annual operating expenses (excluding acquired fund fees and expenses, interest expense, trading expenses, dividend and interest payments on securities sold short, taxes, and extraordinary expenses) from exceeding 1.50% of average daily net assets for Initial Class Shares and 1.75% of average daily net assets for Class S Shares. For the year ended December 31, 2016, the Adviser waived management fees in the amount of $1,979.
In addition, Van Eck Securities Corporation, an affiliate of the Adviser, acts as the Fund’s distributor (the “Distributor”). Certain officers and trustees of the Trust are officers, directors or stockholders of the Adviser and Distributor.
Note 4—12b-1 Plan of Distribution—The Trust and the Distributor are parties to a distribution agreement dated May 1, 2006. The Fund has adopted a Distribution Plan (the “Plan”) for Class S Shares in accordance with Rule 12b-1 under the 1940 Act. Pursuant to the Plan, the Fund is authorized to incur distribution expenses for its Class S Shares which will principally be payments to securities dealers who have sold shares and serviced shareholder accounts and payments to the Distributor for reimbursement of other actual promotion and distribution expenses incurred by the Distributor on behalf of the Fund. The amount paid in any one year is 0.25% of average daily net assets for Class S Shares.
Note 5—Investments—For the year ended December 31, 2016, the cost of purchases and proceeds from sales of investments, excluding U.S. government securities and short-term obligations, aggregated to $77,477,835 and $82,632,853, respectively.
| 26 |
Note 6—Income Taxes—For Federal income tax purposes, the identified cost of investments owned at December 31, 2016 was $117,357,134 and net unrealized appreciation aggregated to $4,208,058, of which $15,915,487 related to appreciated securities and $11,707,429 related to depreciated securities.
At December 31, 2016, the components of accumulated earnings, on a tax basis, were as follows:
| Undistributed ordinary income | $ | 618,829 | ||
| Accumulated capital losses | (13,254,238 | ) | ||
| Other temporary differences | (56,781 | ) | ||
| Unrealized appreciation | 3,996,242 | |||
| Total | $ | (8,695,948 | ) |
The tax character of dividends and distributions paid to shareholders was as follows:
| Year Ended December 31, 2016 | Year Ended December 31, 2015 | ||||||||
| Ordinary income | $ | 579,946 | $ | 799,151 | |||||
| Long-term capital gains | 611,879 | 7,885,742 | |||||||
| 1,191,825 | $ | 8,684,893 | |||||||
At December 31, 2016, the Fund had capital loss carryforwards available to offset future capital gains as follows:
| Post-Effective No Expiration Long-Term Capital Losses | Post-Effective No Expiration Short-Term Capital Losses | |
| $7,990,296 | $5,263,942 |
During the year ended December 31, 2016, as a result of permanent book to tax differences, the Fund decreased undistributed net investment income by $386,597 and decreased accumulated net realized loss on investments by $386,597. Net assets were not affected by this reclassification. These differences are primarily due to foreign currency transactions and reclassification of foreign capital gains tax.
The Fund recognizes the tax benefits of uncertain tax positions only where the position is “more-likely-than-not” to be sustained assuming examination by applicable tax authorities. Management has analyzed the Fund’s tax positions, and has concluded that no liability for unrecognized tax benefits should be recorded related to uncertain tax positions taken on return filings for all open tax years. The Fund does not have exposure for additional years that might still be open in certain foreign jurisdictions. Therefore, no provision for income tax is required in the Fund’s financial statements. However, the Fund is subject
| 27 |
VANECK VIP EMERGING MARKETS FUND
NOTES TO FINANCIAL STATEMENTS
(continued)
to foreign taxes on the appreciation in value of certain investments. The Fund provides for such taxes on both realized and unrealized appreciation.
The Fund recognizes interest and penalties, if any, related to uncertain tax positions as income tax expense in the Statement of Operations. During the year ended December 31, 2016, the Fund did not incur any interest or penalties.
Note 7—Concentration of Risk—The Fund may purchase securities on foreign exchanges. Securities of foreign issuers involve special risks and considerations not typically associated with investing in U.S. issuers. These risks include devaluation of currencies, less reliable information about issuers, different securities transaction clearance and settlement practices, and future adverse political and economic developments. These risks are heightened for investments in emerging market countries. Moreover, securities of many foreign issuers and their markets may be less liquid and their prices more volatile than those of comparable U.S. issuers.
As a result of events involving Ukraine and the Russian Federation, the United States and the European Union (“EU”) have imposed sanctions on certain Russian individuals and companies. These sanctions do not currently impact the Fund. Additional economic sanctions may be imposed or other actions may be taken that may adversely affect the value and liquidity of the Russian-related issuers’ held by the Fund.
Further, the United Kingdom recently decided to leave the EU, creating economic and political uncertainty in its wake. Significant uncertainty exists regarding the timing of the United Kingdom’s withdrawal from the EU and the effects such withdrawal will have on the Euro, European economies and the global markets. This may further impact the value of the Euro and the British pound sterling, and has caused volatility and uncertainty in European and global markets.
At December 31, 2016, the Adviser owned 100% of the Fund’s Class S Shares. The aggregate shareholder accounts of two insurance companies owned approximately 69% and 14% of the Initial Class Shares.
Note 8—Trustee Deferred Compensation Plan—The Trust has a Deferred Compensation Plan (the “Deferred Plan”) for Trustees under which the Trustees can elect to defer receipt of their trustee fees until retirement, disability or termination from the Board of Trustees. The fees otherwise payable to the participating Trustees are deemed invested in shares of eligible Funds of the Trust and the VanEck Funds (another registered investment company managed by the Adviser) as directed by the Trustees.
| 28 |
The expense for the Deferred Plan is included in “Trustees’ fees and expenses” on the Statement of Operations. The liability for the Deferred Plan is shown as “Deferred Trustee fees” on the Statement of Assets and Liabilities.
Note 9—Bank Line of Credit—The Trust participates with VanEck Funds (collectively the “VE/VIP Funds”) in a $30 million committed credit facility (the “Facility”) to be utilized for temporary financing until the settlement of sales or purchases of portfolio securities, the repurchase or redemption of shares of the Fund and other temporary or emergency purposes. The participating VE/VIP Funds have agreed to pay commitment fees, pro rata, based on the unused but available balance. Interest is charged to the VE/VIP Funds at rates based on prevailing market rates in effect at the time of borrowings. During the year ended December 31, 2016, the average daily loan balance during the 100 day period for which a loan was outstanding amounted to $1,016,412 and the average interest rate was 1.72%. At December 31, 2016, the Fund had no outstanding borrowings under the Facility.
Note 10—Recent Accounting Pronouncements and Regulatory Requirements—The Fund adopted Accounting Standards Update No. 2014-15 (“ASU 2014-15”), Disclosure of Uncertainties about an Entity’s Ability to Continue as a Going Concern, which requires management to assess the Fund’s ability to continue as a going concern and to provide related disclosures in certain circumstances. Under the new standard, disclosures are required when conditions give rise to substantial doubt about a company’s ability to continue as a going concern within one year from the financial statement issuance date. Based on management’s evaluation, there are no conditions or events that could adversely affect the Fund’s ability to meet its obligations within one year after the date the financial statements are issued. Accordingly, no disclosures are required specific to going concern uncertainties in the Fund’s financial statements.
In October 2016, the Securities and Exchange Commission (the “SEC”) released its Final Rule on Investment Company Reporting Modernization (the “Rule”). The Rule, which introduces two new regulatory reporting forms for investment companies - Form N-PORT and Form N-CEN - also contains amendments to Regulation S-X which impact financial statement presentation, particularly the presentation of derivative investments. Although still evaluating the impact of the Rule, management believes that many of the Regulation S-X amendments are consistent with the Fund’s current financial statement presentation and expects that the Fund will be able to comply with the Rule’s Regulation S-X amendments by the August 1, 2017 compliance date.
| 29 |
VANECK VIP EMERGING MARKETS FUND
NOTES TO FINANCIAL STATEMENTS
(continued)
Note 11—Subsequent Event Review—The Fund has evaluated subsequent events and transactions for potential recognition or disclosure through the date the financial statements were issued.
A dividend of $0.054 per share from net investment income was declared and paid on January 31, 2017 to shareholders of record of the Initial Class Shares as of January 30, 2017 with a reinvestment date of January 31, 2017.
A dividend of $0.054 per share from net investment income was declared and paid on January 31, 2017 to shareholders of record of the Class S Shares as of January 30, 2017 with a reinvestment date of January 31, 2017.
| 30 |
REPORT OF INDEPENDENT REGISTERED PUBLIC ACCOUNTING FIRM
The Board of Trustees of VanEck VIP Trust and Shareholders of VanEck VIP Emerging Markets Fund
We have audited the accompanying statement of assets and liabilities, including the schedule of investments, of VanEck VIP Emerging Markets Fund (one of the series constituting VanEck VIP Trust) (the “Fund”) as of December 31, 2016, and the related statement of operations for the year then ended, the statements of changes in net assets for each of the two years in the period then ended, and financial highlights for each of the five years in the period then ended. These financial statements and financial highlights are the responsibility of the Fund’s management. Our responsibility is to express an opinion on these financial statements and financial highlights based on our audits.
We conducted our audits in accordance with the standards of the Public Company Accounting Oversight Board (United States). Those standards require that we plan and perform the audit to obtain reasonable assurance about whether the financial statements and financial highlights are free of material misstatement. We were not engaged to perform an audit of the Fund’s internal control over financial reporting. Our audits included consideration of internal control over financial reporting as a basis for designing audit procedures that are appropriate in the circumstances, but not for the purpose of expressing an opinion on the effectiveness of the Fund’s internal control over financial reporting. Accordingly, we express no such opinion. An audit also includes examining, on a test basis, evidence supporting the amounts and disclosures in the financial statements and financial highlights, assessing the accounting principles used and significant estimates made by management, and evaluating the overall financial statement presentation. Our procedures included confirmation of securities owned as of December 31, 2016, by correspondence with the custodian and brokers or by other appropriate auditing procedures where replies from brokers were not received. We believe that our audits provide a reasonable basis for our opinion.
In our opinion, the financial statements and financial highlights referred to above present fairly, in all material respects, the financial position of VanEck VIP Emerging Markets Fund (one of the series constituting VanEck VIP Trust) at December 31, 2016, the results of its operations for the year then ended, the changes in its net assets for each of the two years in the period then ended, and the financial highlights for each of the five years in the period then ended, in conformity with U.S. generally accepted accounting principles.

New York, New York
February 15, 2017
| 31 |
VANECK VIP EMERGING MARKETS FUND
(unaudited)
The Fund intends to pass through foreign tax credits in the maximum amounts shown. The gross foreign source income earned during the fiscal year 2016 by the Fund is shown below.
| Fund Foreign Tax Credits | Gross Foreign Source Income | |
| $222,753 | $2,526,847 |
For the 2016 fiscal year, 0.53% of the ordinary income dividends paid by the Fund qualified for the Corporate Dividends Received Deduction.
| 32 |
| VANECK VIP TRUST |
| BOARD OF TRUSTEES AND OFFICERS |
| December 31, 2016 (unaudited) |
| Trustee’s Name, Address(1) and Year of Birth | Position(s) Held With Trust, Term of Office(2) and Length of Time Served | Principal Occupation(s) During Past Five Years | Number of Portfolios In Fund Complex(3) Overseen By Trustee | Other Directorships Held Outside The Fund Complex(3) During The Past Five Years | ||||
| Independent Trustees: | ||||||||
| Jon Lukomnik 1956 (A)(G) | Trustee since March 2006 | Managing Partner, Sinclair Capital LLC (consulting firm), 2000 to present; Executive Director, Investor Responsibility Research Center Institute, 2008 to present. | 12 | Member of the Deloitte Audit Quality Advisory Committee; Chairman of the Advisory Committee of Legion Partners; Member of the Standing Advisory Group to the Public Company Accounting Oversight Board; formerly Chairman of the Board of the New York Classical Theatre; formerly Director of The Governance Fund, LLC. | ||||
| Jane DiRenzo Pigott 1957 (A)(G) | Trustee since July 2007; Currently, Chairperson of the Governance Committee | Managing Director, R3 Group LLC (consulting firm), 2002 to present. | 12 | Formerly, Director and Chair of Audit Committee of 3E Company (environmental services); formerly Director of MetLife Investment Funds, Inc. | ||||
| Wayne H. Shaner 1947 (A)(G) | Trustee since March 2006 | Managing Partner, Rockledge Partners LLC, 2003 to present (investment adviser); Public Member of the Investment Committee, Maryland State Retirement System, 1991 to 2014. | 12 | Director, The Torray Funds (1 portfolio), since 1993 (Chairman of the Board since December 2005). | ||||
| 33 |
| VANECK VIP TRUST |
| BOARD OF TRUSTEES AND OFFICERS |
| December 31, 2016 (unaudited) (continued) |
| Trustee’s Name, Address(1) and Year of Birth | Position(s) Held With Trust, Term of Office(2) and Length of Time Served | Principal Occupation(s) During Past Five Years | Number of Portfolios In Fund Complex(3) Overseen By Trustee | Other Directorships Held Outside The Fund Complex(3) During The Past Five Years | ||||
| R. Alastair Short 1953 (A)(G) | Trustee since June 2004; Currently, Vice Chairperson of the Board and Chairperson of the Audit Committee | President, Apex Capital Corporation (personal investment vehicle), January 1988 to present; Vice Chairman, W.P. Stewart & Co., Ltd. (asset management firm), September 2007 to September 2008. | 70 | Chairman and Independent Director, EULAV Asset Management; Independent Director, Tremont offshore funds; Director, Kenyon Review; formerly Director of The Medici Archive Project. | ||||
| Richard D. Stamberger 1959 (A)(G) | Trustee since 1995; Currently, Chairperson of the Board | Director, President and CEO, SmartBrief, Inc. (business media company), 1999 to present. | 70 | Director, SmartBrief, Inc.; Director, Food and Friends, Inc. | ||||
| Robert L. Stelzl 1945 (A)(G) | Trustee since July 2007 | President, Rivas Capital, Inc. (real estate property management services company), 2004 to present; Trustee, the estate of Donald Koll, 2012 to present; Trustee, Robert D. MacDonald Trust, 2015 to present; Trustee, Joslyn Family Trusts, 2003 to 2014. | 12 | Director and Chairman, Brookfield Properties, Inc. and Brookfield Residential Properties, Inc. | ||||
| (1) | The address for each Trustee and officer is 666 Third Avenue, 9th Floor, New York, New York 10017. |
| (2) | Each Trustee serves until resignation, death, retirement or removal. The Board established a mandatory retirement policy applicable to all Independent Trustees, which provides that Independent Trustees shall resign from the Board on December 31 of the year such Trustee reaches the age of 75. |
| (3) | The Fund Complex consists of VanEck Funds, VanEck VIP Trust and VanEck Vectors ETF Trust. |
| (A) | Member of the Audit Committee. |
| (G) | Member of the Governance Committee. |
| 34 |
| Officer’s Name, Address(1) And Year of Birth | Position(s) Held With Trust | Term of Office And Length of Time Served(2) | Principal Occupations During The Past Five Years | |||
| Matthew A. Babinsky, 1983 | Assistant Vice President and Assistant Secretary | Since 2016 | Assistant Vice President and Assistant General Counsel of the Adviser, Van Eck Securities Corporation (VESC) and Van Eck Absolute Return Advisers VEARA (since 2016); Associate, Clifford Chance US LLP (October 2011 to April 2016); Officer of other investment companies advised by the Adviser. | |||
| Russell G. Brennan, 1964 | Assistant Vice President and Assistant Treasurer | Since 2008 | Assistant Vice President of the Adviser (since 2008); Officer of other investment companies advised by the Adviser. | |||
| Charles T. Cameron, 1960 | Vice President | Since 1996 | Director of Trading (since 1995) and Portfolio Manager (since 1997) for the Adviser; Officer of other investment companies advised by the Adviser. | |||
| John J. Crimmins, 1957 | Vice President, Treasurer, Chief Financial Officer and Principal Accounting Officer | Since 2009 (Treasurer); since 2012 (Vice President, Chief Financial Officer and Principal Accounting Officer) | Vice President of Portfolio Administration of the Adviser (since 2009); Vice President of Van Eck Securities Corporation (VESC) and Van Eck Absolute Return Advisers (VEARA) (since 2009); Officer of other investment companies advised by the Adviser. | |||
| Susan C. Lashley, 1955 | Vice President | Since 1998 | Vice President of the Adviser and VESC; Officer of other investment companies advised by the Adviser. | |||
| Laura I. Martínez, 1980 | Assistant Vice President and Assistant Secretary | Since 2008 | Vice President (since 2016), Associate General Counsel and Assistant Secretary of the Adviser, VESC and VEARA (since 2008); Officer of other investment companies advised by the Adviser. | |||
| James Parker, 1969 | Assistant Treasurer | Since 2014 | Manager, Portfolio Administration of the Adviser, VESC and VEARA (since 2010); Vice President of J.P. Morgan Financial Reporting and Fund Administration (2002-2010). |
| 35 |
| VANECK VIP TRUST |
| BOARD OF TRUSTEES AND OFFICERS |
| December 31, 2016 (unaudited) (continued) |
| Officer’s Name, Address(1) And Year of Birth | Position(s) Held With Trust | Term of Office And Length of Time Served(2) | Principal Occupations During The Past Five Years | |||
| Jonathan R. Simon, 1974 | Vice President, Secretary and Chief Legal Officer | Since 2006 (Vice President and until 2014, also Assistant Secretary); since 2014 (Secretary and Chief Legal Officer) | Senior Vice President (since 2016), General Counsel and Secretary (since 2014) of the Adviser, VESC and VEARA; Associate General Counsel and Assistant Secretary of the Adviser, VESC and VEARA (2006-2014); Officer of other investment companies advised by the Adviser. | |||
| Bruce J. Smith, 1955 | Senior Vice President | Since 1985 | Senior Vice President, Chief Financial Officer, Treasurer and Controller of the Adviser, VESC and VEARA (since 1997); Director of the Adviser, VESC and VEARA (since October 2010); Officer of other investment companies advised by the Adviser. | |||
| Janet Squitieri, 1961 | Chief Compliance Officer | Since 2013 | Vice President, Global Head of Compliance of the Adviser, VESC and VEARA (since September 2013); Chief Compliance Officer and Senior Vice President of HSBC Global Asset Management North America (August 2010-September 2013); Chief Compliance Officer of Babcock & Brown LP North America (July 2008-June 2010). | |||
| Jan F. van Eck, 1963 | Chief Executive Officer and President | Since 2005 (serves as Chief Executive Officer and President since 2010, prior thereto, served as Executive Vice President) | President, Director and Owner of the Adviser (since July 1993); Executive Vice President of the Adviser (January 1985-October 2010); Director (since November 1985), President (since October 2010) and Executive Vice President (June 1991-October 2010) of VESC; Director and President of VEARA (since May 1997); Trustee (since 2006), President and Chief Executive Officer of Market Vectors ETF Trust (since 2009); Officer of other investment companies advised by the Adviser. |
| (1) | The address for each Executive Officer is 666 Third Avenue, 9th Floor, New York, NY 10017. |
| (2) | Officers are elected yearly by the Board. |
| 36 |
This report is intended for the Fund’s shareholders. It may not be distributed to prospective investors unless it is preceded or accompanied by the Fund’s prospectus, which includes more complete information. An investor should consider the investment objective, risks, and charges and expenses of the Fund carefully before investing. The prospectus contains this and other information about the investment company. Please read the prospectus carefully before investing.
Additional information about the VanEck VIP (the “Trust”) Board of Trustees/Officers and a description of the policies and procedures the Trust uses to determine how to vote proxies relating to portfolio securities are provided in the Statement of Additional Information. The Statement of Additional Information and information regarding how the Trust voted proxies relating to portfolio securities during the most recent twelve month period ending June 30 is available, without charge, by calling 800.826.2333, or by visiting vaneck.com, or on the Securities and Exchange Commission’s website at https://www.sec.gov.
The Trust files its complete schedule of portfolio holdings with the Securities and Exchange Commission for the first and third quarters of each fiscal year on Form N-Q. The Trust’s Form N-Qs are available on the Commission’s website at https://www.sec.gov and may be reviewed and copied at the Commission’s Public Reference Room in Washington, D.C. Information on the operation of the Public Reference Room may be obtained by calling 202.942.8090. The Fund’s complete schedule of portfolio holdings is also available by calling 800.826.2333 or by visiting vaneck.com.

| Investment Adviser: | Van Eck Associates Corporation | |
| Distributor: | Van Eck Securities Corporation | |
| 666 Third Avenue, New York, NY 10017 | ||
| vaneck.com | ||
| Account Assistance: | 800.544.4653 | VIPEMAR |
 | ||
| ANNUAL REPORT | ||
| December 31, 2016 | ||
VanEck VIP Trust
VanEck VIP Global Gold Fund
| 800.826.2333 | vaneck.com |
The information contained in this shareholder letter represents the personal opinions of the investment team members and may differ from those of other portfolio managers or of the firm as a whole. This information is not intended to be a forecast of future events, a guarantee of future results or investment advice. Also, unless otherwise specifically noted, any discussion of the Fund’s holdings, the Fund’s performance, and the views of the investment team members are as of December 31, 2016.
(unaudited)
| FACTS | WHAT DOES VANECK DO WITH YOUR PERSONAL INFORMATION? | ||||
| Why? | Financial companies choose how they share your personal information. Federal law gives consumers the right to limit some but not all sharing. Federal law also requires us to tell you how we collect, share, and protect your personal information. Please read this notice carefully to understand what we do. | ||||
| What? | The types of personal information we collect and share depend on the product or service you have with us. This information can include: n Social Security number and account balances n assets and payment history n risk tolerance and transaction history | ||||
| How? | All financial companies need to share customers’ personal information to run their everyday business. In the section below, we list the reasons financial companies can share their customers’ personal information; the reasons VanEck chooses to share; and whether you can limit this sharing. | ||||
| Reasons we can share your personal information | Does VanEck share? | Can you limit this sharing? | To limit our sharing | Questions? | |
| For our everyday business purposes—such as to process your transactions, maintain your account(s), respond to court orders and legal investigations, or report to credit bureaus | Yes | No | Call us at 800.826.2333.
Please note:
However, you can contact us at any time to limit our sharing.
| 800.826.2333 | |
| For our marketing purposes—to offer our products and services to you | Yes | No | |||
| For joint marketing with other financial companies | Yes | No | |||
| For our affiliates’ everyday business purposes—information about your transactions and experiences | Yes | No | |||
| For our affiliates’ everyday business purposes—information about your creditworthiness | No | We don’t share | |||
| For our affiliates to market to you | Yes | Yes | |||
| For nonaffiliates to market to you | No | We don’t share | |||
PRIVACY NOTICE
(unaudited) (continued)
| Who we are | |
| Who is providing this notice? | Van Eck Associates Corporation, its affiliates and funds sponsored or managed by Van Eck (collectively “VanEck”). |
| What we do | |
| How does VanEck protect my personal information? | To protect your personal information from unauthorized access and use, we use security measures that comply with federal law. These measures include computer safeguards and secured files and buildings. |
| How does VanEck collect my personal information? | We collect your personal information, for example, when you n open an account or give us your income information n provide employment information or give us your contact information n tell us about your investment or retirement portfolio We also collect your personal information from others, such as credit bureaus, affiliates, or other companies. |
| Why can’t I limit all sharing? | Federal law gives you the right to limit only n sharing for affiliates’ everyday business purposes—information about your creditworthiness n affiliates from using your information to market to you n sharing for nonaffiliates to market to you State laws and individual companies may give you additional rights to limit sharing. See below for more on your rights under state law. |
| What happens when I limit sharing for an account I hold jointly with someone else? | Your choices will apply to everyone on your account—unless you tell us otherwise. |
| Definitions | |
| Affiliates | Companies related by common ownership or control. They can be financial and nonfinancial companies. n Our affiliates include companies with a VanEck name such as Van Eck Securities Corporation and others such as MV Index Solutions GmbH. |
| Nonaffiliates | Companies not related by common ownership or control. They can be financial and nonfinancial companies. n VanEck does not share with nonaffiliates so they can market to you. |
| Joint marketing | A formal agreement between nonaffiliated financial companies that together market financial products or services to you. n Our joint marketing partners include financial services companies. |
| Other important information | |
| California Residents—In accordance with California law, we will not share information we collect about California residents with nonaffiliates except as permitted by law, such as with the consent of the customer or to service the customer’s accounts. We also will limit the sharing of information about you with our affiliates to the extent required by applicable California law. | |
| Vermont Residents—In accordance with Vermont law, we will not share information we collect about Vermont residents with nonaffiliates except as permitted by law, such as with the consent of the customer or to service the customer’s accounts. We will not share creditworthiness information about Vermont residents among VanEck’s affiliates except with the authorization or consent of the Vermont resident. | |
December 31, 2016 (unaudited)
Dear Shareholder:
The Class S shares of the VanEck VIP Global Gold Fund (the “Fund”) rose 48.25% during the 12 months ended December 31, 2016, in line with the performance of the NYSE Arca Gold Miners Index1 (GDMNTR) which gained 54.35% for the same period.
Gold stocks outperformed the metal during the period. Phenomenal gains of over 100% in the first half of the year were significantly reduced during the second half due to the poor performance of the gold stocks as the gold price dropped. However, 2016 remained a strong year for gold stocks. While gold stocks, in general, were up substantially for the year, the small-cap gold mining stocks, as represented by the MVISTM Global Junior Gold Miners Index (MVGDXJTR),2 gained 75.09%. After the successful turnaround of the sector during the past couple of years, gold mining companies were well positioned to take advantage of the year’s higher gold price. Lower costs, healthier balance sheets, an improved record of delivering against expectations, and a sharp focus not on growth, but on maximizing profits and returns, have allowed gold stocks to reclaim their position as effective investments for leveraged exposure to gold.
Gold Sector Overview
| n | Gold ended 2016 at $1,152.27 per ounce, up $90.85 per ounce or 8.6% for the year. | |
| n | On January 4, the first trading day of 2016, the Chinese equity market fell drastically, with the Shanghai Composite Stock Index3 down 6.9% during the session. The Chinese selloff spread to global equity markets, and the S&P 500® Index4 had one of the worst starts to the year. Commodities also took a hit, with oil and copper down 9% and 3%, respectively during January. On January 29, the Bank of Japan surprised the markets with the adoption of negative interest rates. In addition, most major U.S. economic data releases in January were disappointing. | |
| n | All of these factors contributed to an environment which was very positive for gold as a portfolio diversifier and hedge against tail risk5 allowing gold to post strong gains early in the year. | |
| n | The gold rally continued through the month of April, supported by a weaker dollar, volatility and weakness in global equity markets, the adoption of negative interest rates also by the European Central Bank, and waning conviction in the market regarding further rate hikes by the U.S. Federal Reserve (Fed). |
| 1 |
VANECK VIP GLOBAL GOLD FUND
(unaudited) (continued)
| n | In early May, gold traded intra-day above $1,300 per ounce for the first time since January 2015, but it traded back at around the $1,200 per ounce level later in May, as the market’s expectations jumped for a Fed rate increase in the summer. | |
| n | On June 3, the U.S. Labor Department’s May jobs report fell far short of expectations. The odds of a Fed rate increase tanked along with the U.S. dollar and gold advanced $34 per ounce on that day to reach $1,244 per ounce. | |
| n | Following the June 23 Brexit vote when the U.K. chose to withdraw from the European Union (EU), bond yields fell to record lows and gold rallied to two-year highs, reaching $1,375 per ounce on July 6. However, as soon as the U.K. Brexit decision became old news, the markets once again shifted all focus to the Fed’s guidance regarding rate increases. | |
| n | On October 4, following statements by Fed members that were interpreted by the market as increasing the likelihood of an interest rate hike, gold fell $44 per ounce, or 3.4% for the day and closed below $1,300 per ounce. | |
| n | However, it was the outcome of the U.S. presidential elections, with a Trump victory, that ultimately drove the gold selloff in the fourth quarter. Gold fell almost 10% or $123 per ounce in the period from November 8 to December 31. The market priced in a rosy scenario in which projected Trump tax cuts, infrastructure spending, and regulatory reforms are expected to ignite robust economic growth; an outlook which is negative for gold. | |
| n | The moves in the gold price correlated with flows in/out of gold bullion exchange traded products (ETPs). Investment demand was strong in the first half, as shown by inflows of 15.7 million ounces into gold bullion ETPs. This represented a 35% increase in holdings to 61 million ounces of gold. Inflows had not been this strong since 2009 when investors sought bullion after the subprime credit crisis. The rate of inflows slowed down in the second half of the year, but holdings continued to increase, reaching over 64 million ounces on November 9. Post-election, gold bullion ETPs experienced net outflows of 7.3 million ounces, to end the year at 57.1 million ounces, representing a 26% increase during 2016. |
| 2 |
Fund Review
At the end of 2016, the Fund was almost fully invested in equities, with cash holdings representing 0.7% of net assets. The Fund held no gold bullion at the end of 2016.
The overall top-down allocation of the portfolio did not change materially during the year. However, the number of positions held by the Fund increased. There are fewer overweight positions and also, a few new companies among the Fund’s top 10 holdings. The Fund reduced exposure to royalty companies to rotate into producing companies, and increased exposure to large caps and Australian mid-tiers/juniors.
Among the Fund’s top holdings, B2Gold (6.9% of Fund net assets†) outperformed significantly, gaining 132.4% during the year. The market finally rewarded the company for its excellent growth profile, following the year’s higher gold prices, as well as additional project funding secured by the company, and improved production and cost guidance for 2016.
Goldcorp (4.3% of Fund net assets†) underperformed (gaining 18.6%), following management changes in early 2016. Those changes came well after the sector-wide management rotations of the last couple of years, which sets the company to some extent behind the rest of the industry in its transformation initiatives. However, so far, we see no reason to believe they won’t be equally successful. Goldcorp has a strong asset base; delivering on expectations should lead to its shares outperforming.
Outlook
Through most of 2016 we were bullish on gold, believing it had embarked on a new bull market. This belief was based on fundamentals, which included unprecedented levels of peace-time sovereign debt and monetary policies, such as quantitative easing and negative rates, which distort markets and pose systemic risks. While we were premature in forecasting a new gold bull market, we continue to believe these risks will ultimately drive gold to new highs. However, the turn the markets took following the U.S. presidential election took us entirely by surprise.
The stock market is reflecting a consensus for robust economic growth. The Trump administration certainly has the potential to implement policies that promote growth. However, it seems the market is ignoring many potential risks the administration may face. These include attempting to change trade treaties, immigration policies, Democrats and deficit hawks in Congress, the national debt, and Fed tightening. Potential moves by China or Russia, disarray in the EU, and strife in the Middle East could
| 3 |
VANECK VIP GLOBAL GOLD FUND
(unaudited) (continued)
also impact the administration’s efforts. We believe many of these risks will surface in 2017, reversing the positive sentiment in the stock market and U.S. dollar to gold’s benefit.
This year the Fed is again showing optimism towards the economy, guiding for three rate increases in 2017. However the Fed has a dismal forecasting record and we see no reason to believe that 2017 will be any different. At this time last year, the Fed was guiding for four rate increases in 2016, yet there was only one. The bear market trend from 2011 to 2015 has clearly been broken and 2016 showed us that investors are becoming quite skittish of systemic financial risks. We now characterize 2016-2017 as a base-forming phase for gold, probably a precursor to a bull market.
The Fund is subject to the risks associated with concentrating its assets in the gold industry, which can be significantly affected by international economic, monetary and political developments. The Fund’s overall portfolio may decline in value due to developments specific to the gold industry. The Fund’s investments in foreign securities involve risks related to adverse political and economic developments unique to a country or a region, currency fluctuations or controls, and the possibility of arbitrary action by foreign governments, including the takeover of property without adequate compensation or imposition of prohibitive taxation. The Fund is subject to risks associated with investments in derivatives, commodity-linked instruments, illiquid securities, and small- or mid-cap companies. The Fund is also subject to inflation risk, market risk, non-diversification risk, leverage risk, and risks of investments in a wholly owned subsidiary. Please see the prospectus for information on these and other risk considerations.
| 4 |
We appreciate your continued investment in the VanEck VIP Global Gold Fund, and we look forward to helping you meet your investment goals in the future.
 |  |
| Joseph M. Foster | Imaru Casanova |
| Portfolio Manager January 9, 2017 | Deputy Portfolio Manager |
Represents the opinions of the investment adviser. Past performance is no guarantee of future results. Not intended to be a forecast of future events, a guarantee of future results or investment advice. Current market conditions may not continue.
| † | All Fund assets referenced are Total Net Assets as of December 31, 2016. |
| All indices listed are unmanaged indices and include the reinvestment of all dividends, but do not reflect the payment of transaction costs, advisory fees or expenses that are associated with an investment in the Fund. An index’s performance is not illustrative of the Fund’s performance. Indices are not securities in which investments can be made. Results reflect past performance and do not guarantee future results. | |
| 1 | NYSE Arca Gold Miners (GDMNTR) Index is a market capitalization-weighted index comprised of publicly traded companies involved primarily in the mining for gold. |
| 2 | MVISTM Junior Gold Miners Index (MVGDXJTR) is a rules-based, modified market capitalization-weighted, flat-adjusted index comprised of a focused group of small-and mid-cap companies in the gold or silver mining industry. |
| 3 | Shanghai Composite Stock Index is a capitalization-weighted stock market index of all stocks that are traded at the Shanghai Stock Exchange. |
| 4 | S&P 500® Index (S&P 500) consists of 500 widely held common stocks, covering four broad sectors (industrials, utilities, financial and transportation). |
| 5 | Tail risk is a form of portfolio risk that arises when the possibility that an investment will move more than three standard deviations from the mean is greater than what is shown by a normal distribution. |
| 5 |
TOP TEN EQUITY HOLDINGS*
December 31, 2016 (unaudited)
| B2Gold Corp. | 7.1 | % | ||
| Agnico-Eagle Mines Ltd. | 5.3 | % | ||
| Newmont Mining Corp. | 5.0 | % | ||
| Goldcorp, Inc. | 4.3 | % | ||
| Fresnillo Plc | 3.7 | % | ||
| Continental Gold, Inc. | 3.3 | % | ||
| Evolution Mining Ltd. | 3.3 | % | ||
| Alamos Gold, Inc. | 3.2 | % | ||
| Randgold Resources Ltd. | 2.9 | % | ||
| Silver Wheaton Corp. | 2.9 | % | ||
| *Percentage of net assets. Portfolio is subject to change. |
| 6 |
December 31, 2016 (unaudited)
| This chart shows the value of a hypothetical $10,000 investment in the Fund over the past 10 fiscal year periods or since inception (for funds lacking 10-year records). The result is compared with the Fund’s benchmark, and may include a broad-based market index | Hypothetical Growth of $10,000 (Since Inception: Class S)
|

Average Annual
| Total Return | Fund | |||||||||||
| 12/31/16 | Class S | GDMNTR | S&P 500 | |||||||||
| One Year | 48.25 | % | 54.35 | % | 11.96 | % | ||||||
| Life* | (5.46 | )% | (7.77 | )% | 12.25 | % | ||||||
* Inception date for the Fund was 4/26/13 (Class S).
The performance quoted represents past performance. Past performance is no guarantee of future results; current performance may be lower or higher than the performance data quoted. Performance information reflects temporary waivers of expenses and/or fees and does not include insurance/annuity fees and expenses. Investment returns would have been reduced had these fees/expenses been included. Investment return and the value of the shares of the Fund will fluctuate so that an investor’s shares, when redeemed, may be worth more or less than their original cost. Fund returns assume that dividends and capital gains distributions have been reinvested in the Fund at NAV. Performance information current to the most recent month end is available by calling 800.826.2333 or by visiting vaneck.com.
The Fund is only available to life insurance and annuity companies to fund their variable annuity and variable life insurance products. These contracts offer life insurance and tax benefits to the beneficial owners of the Fund. Your insurance or annuity company charges fees and expenses for these benefits that are not reflected in this report or in the Fund’s performance, since they are not direct expenses of the Fund. For insurance products, performance figures do not reflect the cost for insurance and if they did, the performance shown would be significantly lower. A review of your particular life and/or annuity contract will provide you with much greater detail regarding these costs and benefits.
All indices listed are unmanaged indices and include the reinvestment of all dividends, but do not reflect the payment of transaction costs, advisory fees or expenses that are associated with an investment in the Fund. An index’s performance is not illustrative of the Fund’s performance. Indices are not securities in which investments can be made.
The NYSE Arca Gold Miners Index (GDMNTR) is a modified modified market capitalization-weighted index comprised of publicly traded companies involved primarily in mining for gold.
The S&P 500® Index consists of 500 widely held common stocks covering industrial, utility, financial and transportation sectors.
| 7 |
EXPLANATION OF EXPENSES
(unaudited)
As a shareholder of the Fund, you incur two types of costs: (1) transaction costs, including program fees on purchase payments; and (2) ongoing costs, including management fees and other Fund expenses. This disclosure is intended to help you understand the ongoing costs (in dollars) of investing in the Fund and to compare these costs with the ongoing costs of investing in other mutual funds.
The disclosure is based on an investment of $1,000 invested at the beginning of the period and held for the entire period, July 1, 2016 to December 31, 2016.
Actual Expenses
The first line in the table below provides information about account values and actual expenses. You may use the information in this line, together with the amount you invested, to estimate the expenses that you paid over the period. Simply divide your account value by $1,000 (for example, an $8,600 account value divided by $1,000 = 8.6), then multiply the result by the number in the first line under the heading entitled “Expenses Paid During the Period.”
Hypothetical Example for Comparison Purposes
The second line in the table below provides information about hypothetical account values and hypothetical expenses based on the Fund’s actual expense ratio and an assumed rate of return of 5% per year before expenses, which is not the Fund’s actual return. The hypothetical account values and expenses may not be used to estimate the actual ending account balance or expenses you paid for the period. You may use this information to compare the ongoing costs of investing in the Fund and other funds. To do so, compare this 5% hypothetical example with the 5% hypothetical examples that appear in the shareholder reports of other funds.
Please note that the expenses shown in the table are meant to highlight your ongoing costs only and do not reflect any transactional costs, such as fees on purchase payments. Therefore, the second line of the table is useful in comparing ongoing costs only, and will not help you determine the relative costs of owning different funds. In addition, if these transactional costs were included, your costs would have been higher.
| 8 |
| Expenses Paid | ||||||||||||
| Ending | During the Period* | |||||||||||
| Beginning | Account Value | July 1, 2016 - | ||||||||||
| Account Value | December 31, | December 31, | ||||||||||
| July 1, 2016 | 2016 | 2016 | ||||||||||
| VanEck VIP Global Gold Fund | ||||||||||||
| Actual | $ | 1,000.00 | $ | 763.70 | $ | 6.43 | ||||||
| Hypothetical** | $ | 1,000.00 | $ | 1,017.85 | $ | 7.35 | ||||||
| * | Expenses are equal to the Fund’s annualized expense ratio (for the six months ended December 31, 2016), of 1.45%, multiplied by the average account value over the period, multiplied by the number of days in the most recent fiscal half year divided by the number of the days in the fiscal year (to reflect the one-half year period). |
| ** | Assumes annual return of 5% before expenses |
| 9 |
VAN ECK VIP GLOBAL GOLD FUND
CONSOLIDATED SCHEDULE OF INVESTMENTS
December 31, 2016
| Number | ||||||||
| of Shares | Value | |||||||
| COMMON STOCKS: 98.7% | ||||||||
| Australia: 12.3% | ||||||||
| 483,118 | Cardinal Resources Ltd. * # | $ | 82,603 | |||||
| 45,000 | Dacian Gold Ltd. * # | 66,270 | ||||||
| 427,592 | Evolution Mining Ltd. # | 639,402 | ||||||
| 999,465 | Gold Road Resources Ltd. * # | 409,705 | ||||||
| 31,200 | Newcrest Mining Ltd. # | 447,378 | ||||||
| 128,600 | Northern Star Resources Ltd. # | 328,683 | ||||||
| 104,539 | OceanaGold Corp. (CAD) | 304,433 | ||||||
| 186,100 | Saracen Mineral Holdings Ltd. * # | 130,546 | ||||||
| 2,409,020 | ||||||||
| Canada: 68.2% | ||||||||
| 6,537 | Agnico-Eagle Mines Ltd. | 274,840 | ||||||
| 18,200 | Agnico-Eagle Mines Ltd. (USD) | 764,400 | ||||||
| 1,100 | Alamos Gold, Inc. | 7,587 | ||||||
| 89,854 | Alamos Gold, Inc. (USD) | 614,601 | ||||||
| 188,900 | Argonaut Gold, Inc. * | 298,267 | ||||||
| 2,700 | Asanko Gold, Inc. * | 8,285 | ||||||
| 51,900 | Asanko Gold, Inc. (USD) * | 158,814 | ||||||
| 133,900 | Atacama Pacific Gold Corp. * | 37,897 | ||||||
| 202,775 | AuRico Metals, Inc. * | 152,536 | ||||||
| 25,880 | AuRico Metals, Inc. (USD) * | 19,211 | ||||||
| 38,100 | Auryn Resources, Inc. * | 83,995 | ||||||
| 51,917 | B2Gold Corp. * | 123,350 | ||||||
| 528,000 | B2Gold Corp. (USD) * | 1,251,360 | ||||||
| 24,300 | Barrick Gold Corp. (USD) | 388,314 | ||||||
| 112,700 | Bear Creek Mining Corp. * | 197,255 | ||||||
| 218,000 | Belo Sun Mining Corp. * | 110,409 | ||||||
| Number | ||||||||
| of Shares | Value | |||||||
| Canada: (continued) | ||||||||
| 74,863 | Brio Gold, Inc. * | $ | 181,212 | |||||
| 143,000 | Columbus Gold Corp. * | 63,903 | ||||||
| 198,700 | Continental Gold, Inc. * | 651,160 | ||||||
| 69,150 | Corvus Gold, Inc. * | 28,326 | ||||||
| 21,000 | Corvus Gold, Inc. (USD) * | 8,795 | ||||||
| 29,900 | Detour Gold Corp. * | 407,307 | ||||||
| 189,600 | Eastmain Resources, Inc. * | 72,019 | ||||||
| 71,800 | Eldorado Gold Corp. (USD) * | 231,196 | ||||||
| 74,000 | First Mining Finance Corp. * | 47,399 | ||||||
| 20,400 | Fortuna Silver Mines, Inc. (USD) * | 115,260 | ||||||
| 61,700 | Goldcorp, Inc. (USD) | 839,120 | ||||||
| 76,400 | Guyana Goldfields, Inc. * | 348,243 | ||||||
| 699,670 | Integra Gold Corp. * | 291,822 | ||||||
| 101,400 | Kinross Gold Corp. (USD) * | 315,354 | ||||||
| 61,352 | Kirkland Lake Gold Ltd. * | 320,777 | ||||||
| 92,200 | Klondex Mines Ltd. * | 429,189 | ||||||
| 24,800 | Lundin Gold, Inc. * | 97,157 | ||||||
| 20,000 | MAG Silver Corp. (USD) * | 220,600 | ||||||
| 90,000 | Midas Gold Corp. * | 58,318 | ||||||
| 2,500 | New Gold, Inc. * | 8,770 | ||||||
| 90,100 | New Gold, Inc. (USD) * | 315,350 | ||||||
| 102,847 | Newcastle Gold Ltd. * | 55,918 | ||||||
| 37,900 | NovaGold Resources, Inc. (USD) * | 172,824 | ||||||
| 296,688 | Orezone Gold Corp. * | 117,115 | ||||||
| 11,000 | Osisko Mining, Inc. * | 19,990 | ||||||
| 46,700 | Osisko Mining, Inc. * § 144A ø | 84,868 | ||||||
| 217,242 | Pilot Gold, Inc. * | 72,001 | ||||||
| 86,800 | Premier Gold Mines Ltd. * | 165,500 | ||||||
See Notes to Financial Statements
| 10 |
| Number | ||||||||
| of Shares | Value | |||||||
| Canada: (continued) | ||||||||
| 7,100 | Pretium Resources, Inc. * | $ | 58,803 | |||||
| 19,000 | Pretium Resources, Inc. (USD) * | 156,560 | ||||||
| 11,500 | Richmont Mines, Inc. * Reg S | 74,688 | ||||||
| 9,500 | Richmont Mines, Inc. (USD) * Reg S | 61,750 | ||||||
| 239,000 | Roxgold, Inc. * 144A | 215,388 | ||||||
| 340,000 | Rye Patch Gold Corp. * | 78,501 | ||||||
| 326,000 | Sabina Gold and Silver Corp. * | 237,947 | ||||||
| 118,700 | Semafo, Inc. * | 390,760 | ||||||
| 28,900 | Silver Wheaton Corp. (USD) | 558,348 | ||||||
| 4,500 | Sulliden Mining Capital, Inc. * | 989 | ||||||
| 37,200 | TMAC Resources, Inc. * Reg S | 424,739 | ||||||
| 29,570 | Torex Gold Resources, Inc. * | 457,871 | ||||||
| 5,323 | Yamana Gold, Inc. | 14,946 | ||||||
| 126,900 | Yamana Gold, Inc. (USD) | 356,589 | ||||||
| 13,318,493 | ||||||||
| Mexico: 3.7% | ||||||||
| 48,100 | Fresnillo Plc (GBP) # | 714,495 | ||||||
| United Kingdom: 4.3% | ||||||||
| 58,800 | Acacia Mining Plc # | 269,435 | ||||||
| 7,400 | Randgold Resources Ltd. (ADR) | 564,916 | ||||||
| 834,351 | ||||||||
| Number | ||||||||
| of Shares | Value | |||||||
| United States: 10.2% | ||||||||
| 28,800 | Newmont Mining Corp. | $ | 981,216 | |||||
| 7,600 | Royal Gold, Inc. | 481,460 | ||||||
| 33,654 | Tahoe Resources, Inc. (CAD) | 317,077 | ||||||
| 23,000 | Tahoe Resources, Inc. | 216,660 | ||||||
| 1,996,413 | ||||||||
| Total Common Stocks | ||||||||
| (Cost: $17,774,046) | 19,272,772 | |||||||
| WARRANTS: 0.0% | ||||||||
| (Cost: $0) | ||||||||
| Canada: 0.0% | ||||||||
| 62,450 | Pilot Gold, Inc. Warrants (CAD 0.90, expiring 05/16/19) * § | 5,349 | ||||||
| MONEY MARKET FUND: 0.8% | ||||||||
| (Cost: $144,280) | ||||||||
| 144,280 | AIM Treasury Portfolio—Institutional Class | 144,280 | ||||||
| Total Investments: 99.5% | ||||||||
| (Cost: $17,918,326) | 19,422,401 | |||||||
| Other assets less | ||||||||
| liabilities: 0.5% | 101,258 | |||||||
| NET ASSETS: 100.0% | $ | 19,523,659 | ||||||
| ADR | American Depositary Receipt |
| CAD | Canadian Dollar |
| GBP | British Pound |
| USD | United States Dollar |
See Notes to Financial Statements
| 11 |
VANECK VIP GLOBAL GOLD FUND
CONSOLIDATED SCHEDULE OF INVESTMENTS
(continued)
| * | Non-income producing |
| # | Indicates a fair valued security which has been valued in good faith pursuant to guidelines established by the Board of Trustees. The aggregate value of fair valued securities is $3,088,517 which represents 15.8% of net assets. |
| § | Illiquid Security – the aggregate value of illiquid securities is $90,217 which represents 0.5% of net assets. |
| ø | Restricted Security – the aggregate value of restricted securities is $84,868, or 0.4% of net assets. |
| Reg S | Security was purchased pursuant to Regulation S under the Securities Act of 1933, which exempts from registration securities offered and sold outside of the United States. Such a security cannot be sold in the United States without either an effective registration statement filed pursuant to the Securities Act of 1933, or pursuant to an exemption from registration. |
| 144A | Security exempt from registration under Rule 144A of the Securities Act of 1933, as amended, or otherwise restricted. These securities may be resold in transactions exempt from registration, unless otherwise noted, and the value amounted to $300,256, or 1.5% of net assets. |
Restricted securities held by the Fund as of December 31, 2016 are as follows:
| Security | Acquisition Date | Number of Shares | Acquisition Cost | Value | % of Net Assets | |||||||||||||||
| Osisko Mining, Inc. | 09/09/16 | 46,700 | $98,535 | $84,868 | 0.4% | |||||||||||||||
| Summary of Investments by Sector (unaudited) | % of Investments | Value | ||||||
| Diversified Metals & Mining | 2.0 | % | $ | 393,961 | ||||
| Gold | 87.4 | 16,972,355 | ||||||
| Precious Metals & Minerals | 5.2 | 1,017,597 | ||||||
| Silver | 4.6 | 894,208 | ||||||
| Money Market Fund | 0.8 | 144,280 | ||||||
| 100.0 | % | $ | 19,422,401 | |||||
The summary of inputs used to value the Fund’s investments as of December 31, 2016 is as follows:
| Level 2 | Level 3 | ||||||||||||||||
| Level 1 | Significant | Significant | |||||||||||||||
| Quoted | Observable | Unobservable | |||||||||||||||
| Prices | Inputs | Inputs | Value | ||||||||||||||
| Common Stocks | |||||||||||||||||
| Australia | $ | 304,433 | $ | 2,104,587 | $ | — | $ | 2,409,020 | |||||||||
| Canada | 13,318,493 | — | — | 13,318,493 | |||||||||||||
| Mexico | — | 714,495 | — | 714,495 | |||||||||||||
| United Kingdom | 564,916 | 269,435 | — | 834,351 | |||||||||||||
| United States | 1,996,413 | — | — | 1,996,413 | |||||||||||||
| Warrants* | 5,349 | — | — | 5,349 | |||||||||||||
| Money Market Fund | 144,280 | — | — | 144,280 | |||||||||||||
| Total | $ | 16,333,884 | $ | 3,088,517 | $ | — | $ | 19,422,401 | |||||||||
* See Schedule of Investments for security type and geographic country breakouts.
There were no transfers between levels during the year ended December 31, 2016.
See Notes to Financial Statements
| 12 |
CONSOLIDATED STATEMENT OF ASSETS AND LIABILITIES
December 31, 2016
| Assets: | ||||
| Investments, at value (Cost $17,918,326) | $ | 19,422,401 | ||
| Cash | 426 | |||
| Receivables: | ||||
| Shares of beneficial interest sold | 136,120 | |||
| Due from Adviser | 294 | |||
| Dividends | 613 | |||
| Prepaid expenses | 552 | |||
| Total assets | 19,560,406 | |||
| Liabilities: | ||||
| Payables: | ||||
| Shares of beneficial interest redeemed | 717 | |||
| Due to Distributor | 3,980 | |||
| Deferred Trustee fees | 3,687 | |||
| Accrued expenses | 28,363 | |||
| Total liabilities | 36,747 | |||
| NET ASSETS | $ | 19,523,659 | ||
| Shares of beneficial interest outstanding | 2,746,312 | |||
| Net asset value, redemption and offering price per share | $ | 7.11 | ||
| Net Assets consist of: | ||||
| Aggregate paid in capital | $ | 21,628,861 | ||
| Net unrealized appreciation | 1,504,075 | |||
| Accumulated net investment loss | (201,178 | ) | ||
| Accumulated net realized loss | (3,408,099 | ) | ||
| $ | 19,523,659 |
See Notes to Financial Statements
| 13 |
VANECK VIP GLOBAL GOLD FUND
CONSOLIDATED STATEMENT OF OPERATIONS
For the Year Ended December 31, 2016
| Income: | ||||||||
| Dividends (net of foreign taxes withheld of $7,950) | $ | 82,845 | ||||||
| Interest | 820 | |||||||
| Total income | 83,665 | |||||||
| Expenses: | ||||||||
| Management fees | $ | 138,128 | ||||||
| Distribution fees | 46,043 | |||||||
| Transfer agent fees | 24,541 | |||||||
| Administration fees | 46,043 | |||||||
| Custodian fees | 25,165 | |||||||
| Professional fees | 31,068 | |||||||
| Reports to shareholders | 16,098 | |||||||
| Insurance | 805 | |||||||
| Trustees’ fees and expenses | 3,748 | |||||||
| Interest | 946 | |||||||
| Other | 6,198 | |||||||
| Total expenses | 338,783 | |||||||
| Waiver of management fees | (71,142 | ) | ||||||
| Net expenses | 267,641 | |||||||
| Net investment loss | (183,976 | ) | ||||||
| Net realized loss on: | ||||||||
| Investments | (1,856,919 | ) | ||||||
| Forward foreign currency contracts, foreign currency transactions and foreign denominated assets and liabilities | (4,511 | ) | ||||||
| Net realized loss | (1,861,430 | ) | ||||||
| Net change in unrealized appreciation (depreciation) on: | ||||||||
| Investments | 4,229,279 | |||||||
| Foreign currency transactions and foreign denominated assets and liabilities | (9 | ) | ||||||
| Net change in unrealized appreciation (depreciation) | 4,229,270 | |||||||
| Net Increase in Net Assets Resulting from Operations | $ | 2,183,864 |
See Notes to Financial Statements
| 14 |
CONSOLIDATED STATEMENT OF CHANGES IN NET ASSETS
| Year Ended | Year Ended | |||||||
| December 31, | December 31, | |||||||
| 2016 | 2015 | |||||||
| Operations: | ||||||||
| Net investment loss | $ | (183,976 | ) | $ | (47,855 | ) | ||
| Net realized loss | (1,861,430 | ) | (1,340,629 | ) | ||||
| Net change in unrealized appreciation (depreciation) | 4,229,270 | (908,545 | ) | |||||
| Net increase (decrease) in net assets resulting from operations | 2,183,864 | (2,297,029 | ) | |||||
| Dividends and Distributions to shareholders from: | ||||||||
| Net investment income | (53,580 | ) | — | |||||
| Net realized capital gains | — | (40,209 | ) | |||||
| Total dividends and distributions | (53,580 | ) | (40,209 | ) | ||||
| Share transactions*: | ||||||||
| Proceeds from sale of shares | 25,568,826 | 6,706,073 | ||||||
| Reinvestment of dividends and distributions | 53,580 | 40,209 | ||||||
| Cost of shares redeemed | (15,978,774 | ) | (4,257,919 | ) | ||||
| Net increase in net assets resulting from share transactions | 9,643,632 | 2,488,363 | ||||||
| Total increase in net assets | 11,773,916 | 151,125 | ||||||
| Net Assets: | ||||||||
| Beginning of year | 7,749,743 | 7,598,618 | ||||||
| End of year (including accumulated net investment loss of $(201,178) and $(46,629), respectively) | $ | 19,523,659 | $ | 7,749,743 | ||||
| * Shares of beneficial interest issued, reinvested and redeemed (unlimited number of $.001 par value shares authorized): | ||||||||
| Class S Shares: | ||||||||
| Shares sold | 3,072,541 | 1,143,463 | ||||||
| Shares reinvested | 11,473 | 5,616 | ||||||
| Shares redeemed | (1,941,798 | ) | (728,098 | ) | ||||
| Net increase | 1,142,216 | 420,981 | ||||||
See Notes to Financial Statements
| 15 |
VANECK VIP GLOBAL GOLD FUND
For a share outstanding throughout each period:
| For the Period | ||||||||||||||||||||
| April 26, 2013 (a) | ||||||||||||||||||||
| Year Ended | through | |||||||||||||||||||
| December 31, | December 31, | |||||||||||||||||||
| 2016 | 2015 | 2014 | 2013 | |||||||||||||||||
| Net asset value, beginning of period | $ | 4.83 | $ | 6.42 | $ | 6.85 | $ | 8.88 | ||||||||||||
| Income from investment operations: | ||||||||||||||||||||
| Net investment loss | (0.04 | ) | (0.02 | ) | (0.04 | ) | (0.02 | ) | ||||||||||||
| Net realized and unrealized gain (loss) on investments | 2.35 | (1.54 | ) | (0.36 | ) | (2.01 | ) | |||||||||||||
| Total from investment operations | 2.31 | (1.56 | ) | (0.40 | ) | (2.03 | ) | |||||||||||||
| Less dividends and distributions from: | ||||||||||||||||||||
| Net investment income | (0.03 | ) | — | (0.03 | ) | — | ||||||||||||||
| Net realized capital gains | — | (0.03 | ) | — | — | |||||||||||||||
| Total dividends and distributions | (0.03 | ) | (0.03 | ) | (0.03 | ) | — | |||||||||||||
| Net asset value, end of period | $ | 7.11 | $ | 4.83 | $ | 6.42 | $ | 6.85 | ||||||||||||
| Total return (b) | 48.25 | % | (24.43 | )% | (5.89 | )% | (22.86 | )%(c) | ||||||||||||
| Ratios/Supplemental Data | ||||||||||||||||||||
| Net assets, end of period (000’s) | $19,524 | $7,750 | $7,599 | $4,820 | ||||||||||||||||
| Ratio of gross expenses to average net assets | 1.84 | % | 2.46 | % | 2.41 | % | 4.82 | %(d) | ||||||||||||
| Ratio of net expenses to average net assets | 1.45 | % | 1.45 | % | 1.45 | % | 1.45 | %(d) | ||||||||||||
| Ratio of net expenses, excluding interest expense, to average net assets | 1.45 | % | 1.45 | % | 1.45 | % | 1.45 | %(d) | ||||||||||||
| Ratio of net investment loss to average net assets | (1.00 | )% | (0.57 | )% | (0.88 | )% | (0.55 | )%(d) | ||||||||||||
| Portfolio turnover rate | 57 | % | 44 | % | 33 | % | 33 | %(c) | ||||||||||||
| (a) | Commencement of operations |
| (b) | Total return is calculated assuming an initial investment made at the net asset value at the beginning of the period, reinvestment of any dividends and distributions at net asset value on the dividend/distribution payment date and a redemption at the net asset value on the last day of the period. The return does not reflect the deduction of taxes that a shareholder would pay on Fund dividends/distributions or the redemption of Fund shares. |
| (c) | Not annualized |
| (d) | Annualized |
See Notes to Financial Statements
| 16 |
NOTES TO CONSOLIDATED FINANCIAL STATEMENTS
December 31, 2016
Note 1—Fund Organization—VanEck VIP Trust (the “Trust”) (formerly Van Eck VIP Trust) is registered under the Investment Company Act of 1940, as amended, as an open-end management investment company. The Trust was organized as a Massachusetts business trust on January 7, 1987. The VanEck VIP Global Gold Fund (the “Fund”) is a non-diversified series of the Trust and seeks long-term capital appreciation by investing in common stocks of gold-mining companies or directly in gold bullion and other metals. The Fund may effect certain investments through the wholly owned VIP Gold Fund Subsidiary (the “Subsidiary”). The Fund currently offers a single class of shares: Class S shares.
Note 2—Significant Accounting Policies—The preparation of financial statements in conformity with U.S. generally accepted accounting principles (“GAAP”) requires management to make estimates and assumptions that affect the reported amounts and disclosures in the financial statements. Actual results could differ from those estimates.
The Fund is an investment company and is following accounting and reporting requirements of Accounting Standards Codification (“ASC”) 946 Financial Services – Investment Companies.
The following is a summary of significant accounting policies followed by the Fund.
| A. | Security Valuation—The Fund values its investments in securities and other assets and liabilities at fair value daily. Fair value is the price that would be received to sell an asset or paid to transfer a liability in an orderly transaction between market participants on the measurement date. Securities traded on national exchanges or traded on the NASDAQ National Market System are valued at the last sales price reported at the close of each business day. Securities traded on the NASDAQ Stock Market are valued at the NASDAQ official closing price. Over-the-counter securities not included in the NASDAQ National Market System and listed securities for which no sale was reported are valued at the mean of the bid and ask prices. To the extent these securities are actively traded they are categorized as Level 1 in the fair value hierarchy (as described below). Certain foreign securities, whose values may be affected by market direction or events occurring before the Fund’s pricing time (4:00 p.m. Eastern Standard Time) but after the last close of the securities’ primary market, are fair valued using a pricing service and are categorized as Level 2 in the fair value hierarchy. The pricing service considers the correlation of the trading patterns of the foreign security to intraday trading in the U.S. market, based on indices of domestic securities and other appropriate indicators such as prices of relevant ADR’s and futures contracts. The Fund may also fair value securities |
| 17 |
VANECK VIP GLOBAL GOLD FUND
NOTES TO CONSOLIDATED FINANCIAL STATEMENTS
(continued)
| in other situations, such as, when a particular foreign market is closed but the Fund is open. Short-term obligations with more than sixty days remaining to maturity are valued at market value. Short-term obligations with sixty days or less to maturity are valued at amortized cost, which with accrued interest approximates fair value. Money market fund investments are valued at net asset value and are classified as Level 1 in the fair value hierarchy. Securities for which quotations are not available are stated at fair value as determined by the Pricing Committee of Van Eck Associates Corporation (the “Adviser”). The Pricing Committee provides oversight of the Fund’s valuation policies and procedures, which are approved by the Fund’s Board of Trustees. Among other things, these procedures allow the Fund to utilize independent pricing services, quotations from securities dealers, and other market sources to determine fair value. The Pricing Committee convenes regularly to review the fair value of financial instruments for which market prices are not readily available. The Pricing Committee employs various methods for calibrating the valuation approaches utilized to determine fair value, including a regular review of key inputs and assumptions, transactional back-testing and disposition analysis. | |
| Certain factors such as economic conditions, political events, market trends, the nature of and duration of any restrictions on disposition, trading in similar securities of the issuer or comparable issuers and other security specific information are used to determine the fair value of these securities. Depending on the relative significance of valuation inputs, these securities may be classified either as Level 2 or Level 3 in the fair value hierarchy. The price which the Fund may realize upon sale of an investment may differ materially from the value presented in the Consolidated Schedule of Investments. | |
| The Fund utilizes various methods to measure the fair value of its investments on a recurring basis, which includes a hierarchy that prioritizes inputs to valuation methods used to measure fair value. The fair value hierarchy gives highest priority to unadjusted quoted prices in active markets for identical assets and liabilities (Level 1 measurements) and the lowest priority to unobservable inputs (Level 3 measurements). The inputs or methodologies used for valuing securities are not necessarily an indication of the risk associated with investing in those securities. The transfers between levels of the fair value hierarchy assume the financial instruments were transferred at the beginning of the reporting period. The three levels of the fair value hierarchy are described below: | |
| Level 1 – Quoted prices in active markets for identical securities. |
| 18 |
| Level 2 – Significant observable inputs (including quoted prices for similar securities, interest rates, prepayment speeds, credit risk, etc.). | |
| Level 3 – Significant unobservable inputs (including the Fund’s own assumptions in determining the fair value of investments). | |
| A summary of the inputs, the levels used to value the Fund’s investments, and transfers between levels are located in the Consolidated Schedule of Investments. Additionally, tables that reconcile the valuation of the Fund’s Level 3 investments and that present additional information about valuation methodologies and unobservable inputs, if applicable, are located in the Consolidated Schedule of Investments. | |
| B. | Basis for Consolidation—The Subsidiary, a Cayman Islands exempted company, was incorporated on January 25, 2013. The Subsidiary acts as an investment vehicle in order to effect certain investments on behalf of the Fund. All interfund account balances and transactions between the Fund and Subsidiary have been eliminated in consolidation. As of December 31, 2016, the Fund held $4,744 in its Subsidiary, representing 0.02% of the Fund’s net assets. |
| C. | Federal Income Taxes—It is the Fund’s policy to comply with the provisions of the Internal Revenue Code applicable to regulated investment companies and to distribute all of its taxable income to its shareholders. Therefore, no federal income tax provision is required. |
| D. | Currency Translation—Assets and liabilities denominated in foreign currencies and commitments under foreign currency contracts are translated into U.S. dollars at the closing prices of such currencies each business day. Purchases and sales of investments are translated at the exchange rates prevailing when such investments are acquired or sold. Income and expenses are translated at the exchange rates prevailing when accrued. The portion of realized and unrealized gains and losses on investments that result from fluctuations in foreign currency exchange rates is not separately disclosed. Recognized gains or losses attributable to foreign currency fluctuations on foreign currency denominated assets, other than investments, and liabilities are recorded as net realized gain (loss) on foreign currency transactions and foreign denominated assets and liabilities in the Consolidated Statement of Operations. |
| E. | Dividends and Distributions to Shareholders—Dividends to shareholders from net investment income and distributions from net realized capital gains, if any, are declared and paid annually. Income dividends and capital gain distributions are determined in accordance with U.S. income |
| 19 |
VANECK VIP GLOBAL GOLD FUND
NOTES TO CONSOLIDATED FINANCIAL STATEMENTS
(continued)
| tax regulations, which may differ from such amounts determined in accordance with GAAP. | |
| F. | Restricted Securities—The Fund may invest in securities that are subject to legal or contractual restrictions on resale. These securities generally may be resold in transactions exempt from registration or to the public if the securities are registered. Disposal of these securities may involve time-consuming negotiations and expense, and prompt sale at an acceptable price may be difficult. Information regarding restricted securities, if any, is included at the end of the Fund’s Consolidated Schedule of Investments. |
| G. | Warrants—The Fund may invest in warrants whose values are linked to indices or underlying instruments. The Fund may use these warrants to gain exposure to markets that might be difficult to invest in through conventional securities. Warrants may be more volatile than their linked indices or underlying instruments. Potential losses are limited to the amount of the original investment. Warrants held at December 31, 2016 are reflected in the Consolidated Schedule of Investments. |
| H. | Use of Derivative Instruments—The Fund may make investments in derivative instruments, including, but not limited to, options, futures, swaps and other derivatives relating to foreign currency transactions. A derivative is an instrument whose value is derived from underlying assets, indices, reference rates or a combination of these factors. Derivative instruments may be privately negotiated contracts (often referred to as over-the-counter (“OTC”) derivatives) or they may be listed and traded on an exchange. Derivative contracts may involve future commitments to purchase or sell financial instruments at specified terms on a specified date, or to exchange interest payment streams or currencies based on a notional or contractual amount. Derivative instruments may involve a high degree of financial risk. The use of derivative instruments also involves the risk of loss if the investment adviser is incorrect in its expectation of the timing or level of fluctuations in securities prices, interest rates or currency prices. Investments in derivative instruments also include the risk of default by the counterparty, the risk that the investment may not be liquid and the risk that a small movement in the price of the underlying security or benchmark may result in a disproportionately large movement, unfavorable or favorable, in the price of the derivative instrument. GAAP requires enhanced disclosures about the Fund’s derivative instruments and hedging activities. Details of this disclosure are found below. At December 31, 2016, the Fund held no derivative instruments. |
| 20 |
| Forward Foreign Currency Contracts—The Fund is subject to foreign currency risk in the normal course of pursuing its investment objectives. The Fund may buy and sell forward foreign currency contracts to settle purchases and sales of foreign denominated securities, gain currency exposure or to hedge foreign denominated assets. Realized gains and losses from forward foreign currency contracts, if any, are included in net realized gain (loss) on forward foreign currency contracts, foreign currency transactions and foreign denominated assets and liabilities in the Consolidated Statement of Operations. The Fund may incur additional risk from investments in forward foreign currency contracts if the counterparty is unable to fulfill its obligation or there are unanticipated movements of the foreign currency relative to the U.S. dollar. The Fund held forward foreign currency contracts for two months during the year ended December 31, 2016 with an average unrealized depreciation of $1,005. At December 31, 2016, the Fund held no forward foreign currency contracts. | |
| The impact of transactions in derivative instruments during the year ended December 31, 2016, was as follows: | |
| Foreign | |||
| Currency Risk | |||
| Realized gain (loss): | |||
| Forward foreign currency contacts1 | $(2,081) | ||
| 1 | Consolidated Statement of Operations location: Net realized loss on forward foreign currency contracts, foreign currency transactions and foreign denominated assets and liabilities | |
| I. | Offsetting Assets and Liabilities—In the ordinary course of business, the Fund enters into transactions subject to enforceable master netting or other similar agreements. Generally, the right of setoff in those agreements allows the Fund to set off any exposure to a specific counterparty with any collateral received or delivered to that counterparty based on the terms of the agreements. The Fund may pledge or receive cash and/or securities as collateral for derivative instruments. Collateral, if any, held at December 31, 2016 is presented in the Consolidated Schedule of Investments. |
| J. | Other—Security transactions are accounted for on trade date. Dividend income is recorded on the ex-dividend date except that certain dividends from foreign securities are recognized upon notification of the ex-dividend date. Interest income, including amortization of premiums and discounts, is accrued as earned. Realized gains and losses are calculated on the identified cost basis. Estimated foreign taxes that are expected to be withheld from proceeds at the sale of certain foreign investments are accrued by the Fund and decrease the unrealized gain on investments. |
| 21 |
VANECK VIP GLOBAL GOLD FUND
NOTES TO CONSOLIDATED FINANCIAL STATEMENTS
(continued)
In the normal course of business, the Fund enters into contracts that contain a variety of general indemnifications. The Fund’s maximum exposure under these agreements is unknown as this would involve future claims that may be made against the Fund that have not yet occurred. However, the Adviser believes the risk of loss under these arrangements to be remote.
Note 3—Investment Management and Other Agreements—The Adviser is the investment adviser to the Fund. The Adviser receives a management fee, calculated daily and payable monthly based on an annual rate of 0.75% of the first $500 million of the Fund’s average daily net assets, 0.65% of the next $250 million of average daily net assets and 0.50% of the average daily net assets in excess of $750 million. The Adviser has agreed, until at least May 1, 2017, to voluntarily waive management fees and assume expenses to prevent the Fund’s total annual operating expenses (excluding acquired fund fees and expenses, interest expense, trading expenses, dividend and interest payments on securities sold short, taxes, and extraordinary expenses) from exceeding 1.45% of the Fund’s average daily net assets. For the year ended December 31, 2016, the Adviser waived management fees in the amount of $71,142.
The Adviser also performs accounting and administrative services for the Fund. The Adviser is paid a monthly fee at a rate of 0.25% of the average daily net assets for the Fund per year on the first $750 million of the average daily net assets and 0.20% per year of the average daily net assets in excess of $750 million. During the year ended December 31, 2016, the Adviser received $46,043 from the Fund pursuant to this contract.
In addition, Van Eck Securities Corporation, an affiliate of the Adviser, acts as the Fund’s distributor (the “Distributor”). Certain officers and trustees of the Trust are officers, directors or stockholders of the Adviser and Distributor.
Note 4—12b-1 Plan of Distribution—The Trust and the Distributor are parties to a distribution agreement dated April 26, 2013. The Fund has adopted a Distribution Plan (the “Plan”) in accordance with Rule 12b-1 under the 1940 Act (the “Act”). Pursuant to the Plan, the Fund is authorized to incur distribution expenses which will principally be payments to securities dealers who have sold shares and serviced shareholder accounts and payments to the Distributor, for reimbursement of other actual promotion and distribution expenses incurred by the Distributor on behalf of the Fund. The amount paid in any one year is 0.25% of the Fund’s average daily net assets.
Note 5—Investments—For the year ended December 31, 2016, the cost of purchases and proceeds from sales of investments, excluding U.S. government securities and short-term obligations, aggregated to $19,404,694 and $10,034,324, respectively.
| 22 |
During the year ended December 31, 2016, the Fund engaged in purchases and sales of investments with funds or other accounts that are managed by the Adviser (or an affiliate of the Adviser). These purchase and sale transactions complied with Rule 17a-7 under the Act and aggregated to $203,018 and $0, respectively.
Note 6—Income Taxes—For Federal income tax purposes, the identified cost of investments owned at December 31, 2016 was $20,496,764 and net unrealized depreciation aggregated to $1,072,168, of which $2,700,529 related to appreciated securities and $3,772,697 related to depreciated securities.
At December 31, 2016, the components of accumulated earnings, on a tax basis, were as follows:
| Undistributed ordinary income | $ | 991,334 | |||
| Accumulated capital losses | (2,047,460 | ) | |||
| Other temporary differences | (3,682 | ) | |||
| Unrealized depreciation | (1,045,394 | ) | |||
| Total | $ | (2,105,202 | ) |
The tax character of dividends and distributions paid to shareholders was as follows:
| Year Ended | Year Ended | |||||||||
| December 31, 2016 | December 31, 2015 | |||||||||
| Ordinary income | $ | 53,580 | $ | 1,288 | ||||||
| Long-term capital gains | — | 38,921 | ||||||||
| $ | 53,580 | $ | 40,209 | |||||||
At December 31, 2016, the Fund had capital loss carryforwards available to offset future capital gains as follows:
| Post-Effective No Expiration | Post-Effective No Expiration | ||
| Long-Term Capital Losses | Short-Term Capital Losses | ||
| $1,418,409 | $629,051 |
During the year ended December 31, 2016, as a result of permanent book to tax differences, the Fund decreased accumulated net investment loss by $83,007, increased accumulated net realized loss on investments by $66,272 and decreased aggregate paid in capital by $16,735. Net assets were not affected by this reclassification. These differences are primarily due to foreign currency transactions, investments in passive foreign investment companies and an investment in a controlled foreign corporation.
The Fund recognizes the tax benefits of uncertain tax positions only where the position is “more-likely-than-not” to be sustained assuming examination by
| 23 |
VANECK VIP GLOBAL GOLD FUND
NOTES TO CONSOLIDATED FINANCIAL STATEMENTS
(continued)
applicable tax authorities. Management has analyzed the Fund’s tax positions, and has concluded that no liability for unrecognized tax benefits should be recorded related to uncertain tax positions expected to be taken on return filings for all open tax years. Therefore, no provision for income tax is required in the Fund’s consolidated financial statements.
The Fund recognizes interest and penalties, if any, related to uncertain tax positions as income tax expense in the Consolidated Statement of Operations. During the year ended December 31, 2016, the Fund did not incur any interest or penalties.
Note 7—Concentration of Risk—The Fund may purchase securities on foreign exchanges. Securities of foreign issuers involve special risks and considerations not typically associated with investing in U.S. issuers. These risks include devaluation of currencies, less reliable information about issuers, different securities transaction clearance and settlement practices, and future adverse political and economic developments. These risks are heightened for investments in emerging market countries. Moreover, securities of many foreign issuers and their markets may be less liquid and their prices more volatile than those of comparable U.S. issuers.
The Fund may concentrate its investments in companies which are significantly engaged in the exploration, development, production and distribution of gold and other natural resources such as strategic and other metals, minerals, forest products, oil, natural gas and coal and by investing in gold bullion and coins. In addition, the Fund may invest up to 25% of its net assets in gold and silver coins, gold, silver, platinum and palladium bullion and exchange traded funds that invest in such coins and bullion and derivatives on the foregoing. Since the Fund may so concentrate, it may be subject to greater risks and market fluctuations than other more diversified portfolios. The production and marketing of gold and other natural resources may be affected by actions and changes in governments. In addition, gold and natural resources may be cyclical in nature.
The United Kingdom recently decided to leave the European Union (“EU”), creating economic and political uncertainty in its wake. Significant uncertainty exists regarding the timing of the United Kingdom’s withdrawal from the EU and the effects such withdrawal will have on the Euro, European economies and the global markets. This may further impact the value of the Euro and the British pound sterling, and has caused volatility and uncertainty in European and global markets.
At December 31, 2016, the Adviser owned approximately 2% of the Fund’s outstanding shares of beneficial interest. Additionally, the aggregate shareholder
| 24 |
accounts of two insurance companies owned approximately 73% and 19% of the Fund’s outstanding shares of beneficial interest.
Note 8—Trustee Deferred Compensation Plan—The Trust has a Deferred Compensation Plan (the “Deferred Plan”) for Trustees under which the Trustees can elect to defer receipt of their trustee fees until retirement, disability or termination from the Board of Trustees. The fees otherwise payable to the participating Trustees are deemed invested in shares of eligible Funds of the Trust and the VanEck Funds (another registered investment company managed by the Adviser) as directed by the Trustees.
The expense for the Deferred Plan is included in “Trustees’ fees and expenses” in the Consolidated Statement of Operations. The liability for the Deferred Plan is shown as “Deferred Trustee fees” in the Consolidated Statement of Assets and Liabilities.
Note 9—Bank Line of Credit—The Trust participates with VanEck Funds (collectively the “VE/VIP Funds”) in a $30 million committed credit facility (the “Facility”) to be utilized for temporary financing until the settlement of sales or purchases of portfolio securities, the repurchase or redemption of shares of the Fund and other temporary or emergency purposes. The participating VE/VIP Funds have agreed to pay commitment fees, pro rata, based on the unused but available balance. Interest is charged to the VE/VIP Funds at rates based on prevailing market rates in effect at the time of borrowings. During the year ended December 31, 2016, the average daily loan balance during the 25 day period for which a loan was outstanding amounted to $788,119 and the average interest rate was 1.77%. At December 31, 2016, the Fund had no outstanding borrowings under the Facility.
Note 10—Recent Accounting Pronouncements and Regulatory Requirements—The Fund adopted Accounting Standards Update No. 2014-15 (“ASU 2014-15”), Disclosure of Uncertainties about an Entity’s Ability to Continue as a Going Concern, which requires management to assess the Fund’s ability to continue as a going concern and to provide related disclosures in certain circumstances. Under the new standard, disclosures are required when conditions give rise to substantial doubt about a company’s ability to continue as a going concern within one year from the financial statement issuance date. Based on management’s evaluation, there are no conditions or events that could adversely affect the Fund’s ability to meet its obligations within one year after the date the financial statements are issued. Accordingly, no disclosures are required specific to going concern uncertainties in the Fund’s financial statements.
| 25 |
VANECK VIP GLOBAL GOLD FUND
NOTES TO CONSOLIDATED FINANCIAL STATEMENTS
(continued)
In October 2016, the Securities and Exchange Commission (the “SEC”) released its Final Rule on Investment Company Reporting Modernization (the “Rule”). The Rule, which introduces two new regulatory reporting forms for investment companies – Form N-PORT and Form N-CEN – also contains amendments to Regulation S-X which impact financial statement presentation, particularly the presentation of derivative investments. Although still evaluating the impact of the Rule, management believes that many of the Regulation S-X amendments are consistent with the Fund’s current financial statement presentation and expects that the Fund will be able to comply with the Rule’s Regulation S-X amendments by the August 1, 2017 compliance date.
Note 11-Subsequent Event Review—The Fund has evaluated subsequent events and transactions for potential recognition or disclosure through the date the financial statements were issued.
A dividend of $0.348 per share from net investment income was declared and paid on January 31, 2017 to shareholders of record of the Class S Shares as of January 30, 2017 with a reinvestment date of January 31, 2017.
| 26 |
REPORT OF INDEPENDENT REGISTERED PUBLIC ACCOUNTING FIRM
The Board of Trustees of VanEck VIP Trust and Shareholders of VanEck VIP Global Gold Fund
We have audited the accompanying consolidated statement of assets and liabilities, including the consolidated schedule of investments, of VanEck VIP Global Gold Fund (one of the series constituting VanEck VIP Trust) (the “Fund”) as of December 31, 2016, and the related consolidated statement of operations for the year then ended, the consolidated statements of changes in net assets for each of the two years in the period then ended, and the financial highlights for the periods indicated therein. These financial statements and financial highlights are the responsibility of the Fund’s management. Our responsibility is to express an opinion on these financial statements and financial highlights based on our audits.
We conducted our audits in accordance with the standards of the Public Company Accounting Oversight Board (United States). Those standards require that we plan and perform the audit to obtain reasonable assurance about whether the financial statements and financial highlights are free of material misstatement. We were not engaged to perform an audit of the Fund’s internal control over financial reporting. Our audits included consideration of internal control over financial reporting as a basis for designing audit procedures that are appropriate in the circumstances, but not for the purpose of expressing an opinion on the effectiveness of the Fund’s internal control over financial reporting. Accordingly, we express no such opinion. An audit also includes examining, on a test basis, evidence supporting the amounts and disclosures in the financial statements and financial highlights, assessing the accounting principles used and significant estimates made by management, and evaluating the overall financial statement presentation. Our procedures included confirmation of securities owned as of December 31, 2016, by correspondence with the custodian and brokers or by other appropriate auditing procedures where replies from brokers were not received. We believe that our audits provide a reasonable basis for our opinion.
In our opinion, the financial statements and financial highlights referred to above present fairly, in all material respects, the consolidated financial position of VanEck VIP Global Gold Fund (one of the series constituting VanEck VIP Trust) at December 31, 2016, the consolidated results of its operations for the year then ended, the consolidated changes in its net assets for each of the two years in the period then ended, and the financial highlights for the periods indicated therein, in conformity with U.S. generally accepted accounting principles.

New York, New York
February 15, 2017
| 27 |
TAX INFORMATION
(unaudited)
The Fund intends to pass through foreign tax credits in the maximum amounts shown. The gross foreign source income earned during the fiscal year 2016 by the Fund is shown below.
| Fund Foreign Tax Credits | Gross Foreign Source Income | ||
| $7,948 | $77,825 |
For the 2016 fiscal year, 0.90% of the ordinary income dividends paid by the Fund qualified for the Corporate Dividends Received Deduction.
| 28 |
VANECK VIP TRUST
BOARD OF TRUSTEES AND OFFICERS
December 31, 2016 (unaudited)
| Trustee’s Name, Address(1) and Year of Birth | Position(s) Held With Trust, Term of Office(2) and Length of Time Served | Principal Occupation(s) During Past Five Years | Number of Portfolios In Fund Complex(3) Overseen By Trustee | Other Directorships Held Outside The Fund Complex(3) During The Past Five Years | ||||
| Independent Trustees: | ||||||||
| Jon Lukomnik 1956 (A)(G) | Trustee since March 2006 | Managing Partner, Sinclair Capital LLC (consulting firm), 2000 to present; Executive Director, Investor Responsibility Research Center Institute, 2008 to present. | 12 | Member of the Deloitte Audit Quality Advisory Committee; Chairman of the Advisory Committee of Legion Partners; Member of the Standing Advisory Group to the Public Company Accounting Oversight Board; formerly Chairman of the Board of the New York Classical Theatre; formerly Director of The Governance Fund, LLC. | ||||
| Jane DiRenzo Pigott 1957 (A)(G) | Trustee since July 2007; Currently, Chairperson of the Governance Committee | Managing Director, R3 Group LLC (consulting firm), 2002 to present. | 12 | Formerly, Director and Chair of Audit Committee of 3E Company (environmental services); formerly Director of MetLife Investment Funds, Inc. | ||||
| Wayne H. Shaner 1947 (A)(G) | Trustee since March 2006 | Managing Partner, Rockledge Partners LLC, 2003 to present (investment adviser); Public Member of the Investment Committee, Maryland State Retirement System, 1991 to 2014. | 12 | Director, The Torray Funds (1 portfolio), since 1993 (Chairman of the Board since December 2005). | ||||
| 29 |
VANECK VIP TRUST
BOARD OF TRUSTEES AND OFFICERS
December 31, 2016 (unaudited) (continued)
| Trustee’s Name, Address(1) and Year of Birth | Position(s) Held With Trust, Term of Office(2) and Length of Time Served | Principal Occupation(s) During Past Five Years | Number of Portfolios In Fund Complex(3) Overseen By Trustee | Other Directorships Held Outside The Fund Complex(3) During The Past Five Years | ||||
| R. Alastair Short 1953 (A)(G) | Trustee since June 2004; Currently, Vice Chairperson of the Board and Chairperson of the Audit Committee | President, Apex Capital Corporation (personal investment vehicle), January 1988 to present; Vice Chairman, W.P. Stewart & Co., Ltd. (asset management firm), September 2007 to September 2008. | 70 | Chairman and Independent Director, EULAV Asset Management; Independent Director, Tremont offshore funds; Director, Kenyon Review; formerly Director of The Medici Archive Project. | ||||
| Richard D. Stamberger 1959 (A)(G) | Trustee since 1995; Currently, Chairperson of the Board | Director, President and CEO, SmartBrief, Inc. (business media company), 1999 to present. | 70 | Director, SmartBrief, Inc.; Director, Food and Friends, Inc. | ||||
| Robert L. Stelzl 1945 (A)(G) | Trustee since July 2007 | President, Rivas Capital, Inc. (real estate property management services company), 2004 to present; Co-Trustee, the estate of Donald Koll, 2012 to present; Trustee, Robert D. MacDonald Trust, 2015 to present; Trustee, Joslyn Family Trusts, 2003 to 2014. | 12 | Director and Chairman, Brookfield Properties, Inc. and Brookfield Residential Properties, Inc. |
| (1) | The address for each Trustee and officer is 666 Third Avenue, 9th Floor, New York, New York 10017. |
| (2) | Each Trustee serves until resignation, death, retirement or removal. The Board established a mandatory retirement policy applicable to all Independent Trustees, which provides that Independent Trustees shall resign from the Board on December 31 of the year such Trustee reaches the age of 75. |
| (3) | The Fund Complex consists of VanEck Funds, VanEck VIP Trust and VanEck Vectors ETF Trust. |
| (A) | Member of the Audit Committee. |
| (G) | Member of the Governance Committee. |
| 30 |
| Officer’s Name, Address(1) And Year of Birth | Position(s) Held With Trust | Term of Office And Length of Time Served(2) | Principal Occupations During The Past Five Years | |||
| Matthew A. Babinsky, 1983 | Assistant Vice President and Assistant Secretary | Since 2016 | Assistant Vice President and Assistant General Counsel of the Adviser, Van Eck Securities Corporation (VESC) and Van Eck Absolute Return Advisers VEARA (since 2016); Associate, Clifford Chance US LLP (October 2011 to April 2016); Officer of other investment companies advised by the Adviser. | |||
| Russell G. Brennan, 1964 | Assistant Vice President and Assistant Treasurer | Since 2008 | Assistant Vice President of the Adviser (since 2008); Officer of other investment companies advised by the Adviser. | |||
| Charles T. Cameron, 1960 | Vice President | Since 1996 | Director of Trading (since 1995) and Portfolio Manager (since 1997) for the Adviser; Officer of other investment companies advised by the Adviser. | |||
| John J. Crimmins, 1957 | Vice President, Treasurer, Chief Financial Officer and Principal Accounting Officer | Since 2009 (Treasurer); since 2012 (Vice President, Chief Financial Officer and Principal Accounting Officer) | Vice President of Portfolio Administration of the Adviser (since 2009); Vice President of Van Eck Securities Corporation (VESC) and Van Eck Absolute Return Advisers (VEARA) (since 2009); Officer of other investment companies advised by the Adviser. | |||
| Susan C. Lashley, 1955 | Vice President | Since 1998 | Vice President of the Adviser and VESC; Officer of other investment companies advised by the Adviser. | |||
| Laura I. Martínez, 1980 | Assistant Vice President and Assistant Secretary | Since 2008 | Vice President (since 2016), Associate General Counsel and Assistant Secretary of the Adviser, VESC and VEARA (since 2008); Officer of other investment companies advised by the Adviser. | |||
| James Parker, 1969 | Assistant Treasurer | Since 2014 | Manager, Portfolio Administration of the Adviser, VESC and VEARA (since 2010); Vice President of J.P. Morgan Financial Reporting and Fund Administration (2002-2010). | |||
| Jonathan R. Simon, 1974 | Vice President, Secretary and Chief Legal Officer | Since 2006 (Vice President and until 2014, also Assistant Secretary); since 2014 (Secretary and Chief Legal Officer) | Senior Vice President (since 2016), General Counsel and Secretary (since 2014) of the Adviser, VESC and VEARA; Associate General Counsel and Assistant Secretary of the Adviser, VESC and VEARA (2006-2014); Officer of other investment companies advised by the Adviser. |
| 31 |
VANECK VIP TRUST
BOARD OF TRUSTEES AND OFFICERS
December 31, 2016 (unaudited) (continued)
| Officer’s Name, Address(1) And Year of Birth | Position(s) Held With Trust | Term of Office And Length of Time Served(2) | Principal Occupations During The Past Five Years | |||
| Bruce J. Smith, 1955 | Senior Vice President | Since 1985 | Senior Vice President, Chief Financial Officer, Treasurer and Controller of the Adviser, VESC and VEARA (since 1997); Director of the Adviser, VESC and VEARA (since October 2010); Officer of other investment companies advised by the Adviser. | |||
| Janet Squitieri, 1961 | Chief Compliance Officer | Since 2013 | Vice President, Global Head of Compliance of the Adviser, VESC and VEARA (since September 2013); Chief Compliance Officer and Senior Vice President of HSBC Global Asset Management North America (August 2010-September 2013); Chief Compliance Officer of Babcock & Brown LP North America (July 2008-June 2010). | |||
| Jan F. van Eck, 1963 | Chief Executive Officer and President | Since 2005 (serves as Chief Executive Officer and President since 2010, prior thereto, served as Executive Vice President) | President, Director and Owner of the Adviser (since July 1993); Executive Vice President of the Adviser (January 1985-October 2010); Director (since November 1985), President (since October 2010) and Executive Vice President (June 1991-October 2010) of VESC; Director and President of VEARA (since May 1997); Trustee (since 2006), President and Chief Executive Officer of Market Vectors ETF Trust (since 2009); Officer of other investment companies advised by the Adviser. |
| (1) | The address for each Executive Officer is 666 Third Avenue, 9th Floor, New York, NY 10017. |
| (2) | Officers are elected yearly by the Board. |
| 32 |
This report is intended for the Fund’s shareholders. It may not be distributed to prospective investors unless it is preceded or accompanied by the Fund’s prospectus, which includes more complete information. An investor should consider the investment objective, risks, and charges and expenses of the Fund carefully before investing. The prospectus contains this and other information about the investment company. Please read the prospectus carefully before investing.
Additional information about the VanEck VIP (the “Trust”) Board of Trustees/Officers and a description of the policies and procedures the Trust uses to determine how to vote proxies relating to portfolio securities are provided in the Statement of Additional Information. The Statement of Additional Information and information regarding how the Trust voted proxies relating to portfolio securities during the most recent twelve month period ending June 30 is available, without charge, by calling 800.826.2333, or by visiting vaneck.com, or on the Securities and Exchange Commission’s website at https://www.sec.gov.
The Trust files its complete schedule of portfolio holdings with the Securities and Exchange Commission for the first and third quarters of each fiscal year on Form N-Q. The Trust’s Form N-Qs are available on the Commission’s website at https://www.sec.gov and may be reviewed and copied at the Commission’s Public Reference Room in Washington, D.C. Information on the operation of the Public Reference Room may be obtained by calling 202.942.8090. The Fund’s complete schedule of portfolio holdings is also available by calling 800.826.2333 or by visiting vaneck.com.

| Investment Adviser: | Van Eck Associates Corporation | |
| Distributor: | Van Eck Securities Corporation | |
| 666 Third Avenue, New York, NY 10017 | ||
| vaneck.com | ||
| Account Assistance: | 800.544.4653 | VIPGGAR |
 | ||
| ANNUAL REPORT | ||
| December 31, 2016 | ||
VanEck VIP Trust
VanEck VIP Global Hard Assets Fund
| 800.826.2333 | vaneck.com |
The information contained in this shareholder letter represents the personal opinions of the investment team members and may differ from those of other portfolio managers or of the firm as a whole. This information is not intended to be a forecast of future events, a guarantee of future results or investment advice. Also, unless otherwise specifically noted, any discussion of the Fund’s holdings, the Fund’s performance, and the views of the investment team members are as of December 31, 2016.
(unaudited)
| FACTS | WHAT DOES VANECK DO WITH YOUR PERSONAL INFORMATION? |
| Why? | Financial companies choose how they share your personal information. Federal law gives consumers the right to limit some but not all sharing. Federal law also requires us to tell you how we collect, share, and protect your personal information. Please read this notice carefully to understand what we do. |
| What? | The types of personal information we collect and share depend on the product or service you have with us. This information can include:
n Social Security number and account balances n assets and payment history n risk tolerance and transaction history
|
| How? | All financial companies need to share customers’ personal information to run their everyday business. In the section below, we list the reasons financial companies can share their customers’ personal information; the reasons VanEck chooses to share; and whether you can limit this sharing. |
| Reasons we can share your personal information | Does VanEck share? | Can you limit this sharing? | To limit our sharing | Questions? |
| For our everyday business purposes—such as to process your transactions, maintain your account(s), respond to court orders and legal investigations, or report to credit bureaus | Yes | No | Call us at 800.826.2333.
Please note:
However, you can contact us at any time to limit our sharing. | 800.826.2333 |
| For our marketing purposes—to offer our products and services to you | Yes | No | ||
| For joint marketing with other financial companies | Yes | No | ||
| For our affiliates’ everyday business purposes—information about your transactions and experiences | Yes | No | ||
| For our affiliates’ everyday business purposes—information about your creditworthiness | No | We don’t share | ||
| For our affiliates to market to you | Yes | Yes | ||
| For nonaffiliates to market to you | No | We don’t share |
PRIVACY NOTICE
(unaudited) (continued)
| Who we are | |
| Who is providing this notice? | Van Eck Associates Corporation, its affiliates and funds sponsored or managed by Van Eck (collectively “VanEck”). |
| What we do | |
| How does VanEck protect my personal information? | To protect your personal information from unauthorized access and use, we use security measures that comply with federal law. These measures include computer safeguards and secured files and buildings. |
| How does VanEck collect my personal information? | We collect your personal information, for example, when you |
| n open an account or give us your income information | |
| n provide employment information or give us your contact information | |
| n tell us about your investment or retirement portfolio | |
| We also collect your personal information from others, such as credit bureaus, affiliates, or other companies. | |
| Why can’t I limit all sharing? | Federal law gives you the right to limit only |
| n sharing for affiliates’ everyday business purposes—information about your creditworthiness | |
| n affiliates from using your information to market to you | |
| n sharing for nonaffiliates to market to you | |
| State laws and individual companies may give you additional rights to limit sharing. See below for more on your rights under state law. | |
| What happens when I limit sharing for an account I hold jointly with someone else? | Your choices will apply to everyone on your account—unless you tell us otherwise. |
| Definitions | |
| Affiliates | Companies related by common ownership or control. They can be financial and nonfinancial companies. |
| n Our affiliates include companies with a VanEck name such as Van Eck Securities Corporation and others such as MV Index Solutions GmbH. | |
| Nonaffiliates | Companies not related by common ownership or control. They can be financial and nonfinancial companies. |
| n VanEck does not share with nonaffiliates so they can market to you. | |
| Joint marketing | A formal agreement between nonaffiliated financial companies that together market financial products or services to you. |
| n Our joint marketing partners include financial services companies. | |
| Other important information | |
| California Residents—In accordance with California law, we will not share information we collect about California residents with nonaffiliates except as permitted by law, such as with the consent of the customer or to service the customer’s accounts. We also will limit the sharing of information about you with our affiliates to the extent required by applicable California law. | |
| Vermont Residents—In accordance with Vermont law, we will not share information we collect about Vermont residents with nonaffiliates except as permitted by law, such as with the consent of the customer or to service the customer’s accounts. We will not share creditworthiness information about Vermont residents among VanEck’s affiliates except with the authorization or consent of the Vermont resident. | |
VANECK VIP GLOBAL HARD ASSETS FUND
December 31, 2016 (unaudited)
Dear Shareholder:
The Initial Class shares of the VanEck VIP Global Hard Assets Fund (the “Fund”) gained 43.71% for the 2016 calendar year, outperforming the S&P® North American Natural Resources Sector Index (SPGINRTR)1 which gained 30.87%.
As 2016 unfolded, there were increasing signs that the global economy and equity markets had become accustomed to rolling economic and geopolitical risks and, by year-end, had begun to discount incipient signs and hopes of a more robust global GDP outlook. As the year drew to a close, the deflation/inflation “conversation” shifted from being strongly deflationary to including a degree of valid concern about the prospect of forthcoming inflation. Taken together with the continued rebalancing of supply and demand (particularly for oil and gas), all these factors proved, for the most part, positive for commodities.
Several key contributors of Fund performance were positions in the energy sector and metals and mining industry. Perhaps most notable was the Fund’s contributions from strategic allocations to gold equities – positions which comprised 12% of the Fund’s net assets at the beginning of the year to just over 22% by mid-year. While this exposure was eventually reduced to under 9% by year end, this marked one of the highest weightings to the space since the Fund’s inception and was also a top driver of Fund performance on the year.
Market Overview
Energy
Placing OPEC’s (Organization of Petroleum Exporting Countries) November meeting in context, we believe it could well be described as “historic.” Until the meeting in November, OPEC was essentially defunct as an effective institution and, while it may have brought it to its knees originally, it was the Saudis who resurrected it. In the short term, $40/barrel oil had become unbearable, with OPEC’s members unable to meet their own fiscal obligations, and Saudi Arabia suffering the most. In the longer term, $40/barrel oil provided the majors and national oil companies, in particular, little incentive to establish any sort of stable, longer-term oil supply to support demand growth or avoid future oil price spikes.
Despite the balance of risks and data that came out in 2016 leaning to the down side, demand for crude oil and gasoline remained resilient in the face of both anemic global GDP and GDP outlook. The U.S., the largest consumer of crude oil and petroleum products, was particularly robust
| 1 |
VANECK VIP GLOBAL HARD ASSETS FUND
(unaudited) (continued)
with recent weekly gasoline consumption figures reaching all-time record levels – remarkable for the “non-driving season” month of December.
Metals and Mining
Despite strong share price performance, the global mining sector continued its corporate-level restructuring, with the strengthening of balance sheets and reduction of operating costs the main focus. However, signs are now becoming apparent that at least some companies are starting to focus again on growth.
Base metals remained more or less strong over the course of the year. Following somewhat of a stuttering start, they strengthened into the end of the year, reflecting some of the production cuts that were part of the continuing multi-year restructuring in the industry. Among the base metals, zinc’s supply and demand came into better alignment, not least because Glencore (4.3% of Fund net assets†) significantly reduced production of the metal at one of its major mines and demand remained solid. Copper, too, had a good year in 2016.
Gold had a roller-coaster of a year in 2016. For the first half, it benefited from continued monetary easing, stimulus policies, and the erosion of confidence in the ability of central banks to deliver global growth. However, this, then, turned around when it became very apparent that the Fed was going to raise rates and the U.S. dollar started to strengthen.
Agriculture
A very healthy corn and wheat crop in North America put pressure both on prices and companies engaged in activities ancillary to these commodities – be they related either to input or output.
While these prices may have been, in part, helpful and stimulative for proteins, they too had their own supply issues with cattle markets, in particular, under pressure from oversupply. The U.S. cattle herd, having dropped in number drastically three or four years ago, has now completely rebounded.
Fund Review
The Fund’s top contributors were all metals and mining companies. Glencore, a diversified mining company, and First Quantum (3.4% of Fund net assets†), a copper producer, benefited from both commodity price support and continued, and expanded, strategic structural optimization. Gold company Agnico Eagle Mines (2.2% of Fund net assets†), together with robust gold prices earlier in the year, benefited
| 2 |
from its continued focus on cost reduction and strong operational performance.
The Fund’s top detractors were: CF Industries Holdings (2.0% of Fund net assets†), a fertilizer and agricultural chemicals company which was hit by softer pricing related to nitrogen oversupply; Valero Energy (sold by the Fund during the period), an oil and gas refining and marketing company which suffered from the rebound in crude oil prices; and SunEdison, a solar company (also sold by the Fund during the period).
Significant new purchases by the Fund were made in the gold and oil and gas exploration and production sub-industries including new positions in Newmont Mining (2.2% of Fund net assets†) and PDC Energy (3.0% of Fund net assets†). The Fund’s largest sales during the period included oil and gas exploration and production company Anadarko Petroleum and oil and gas refining and marketing company Valero Energy (both fully exited before year-end).
Outlook
As we have always said, our fund does not necessarily need economic and market winds at our back to deliver performance, we just need gale-force winds in our face to dissipate. While we believe the balance of risks at the beginning of the year paid homage to past fears, as the year progressed, markets began underwriting a more positive tilt, seeing a glass half-full rather than half-empty.
As we look out over 2017, and even further ahead, we believe it is extremely important to keep in mind that the depths of gloom plumbed in February 2016 marked the low point in probably one of the deepest and certainly longest downturns in history in the commodity markets. However, as these markets improve, we expect their emergence and rebound not to be short lived. Indeed, we consider that the fundamentals of a commodity bull market are, essentially, all now firmly anchored in place.
The supply response to massive, multi-year capital underinvestment is already apparent and will become ever more so, with lasting production implications. However, the deep corporate restructuring that we have seen over the last couple of years is improving both operating and financial performance.
We think it is difficult to overemphasize that when it comes to the deep corporate restructuring that has been, and continues to be, undertaken in response to weak commodity prices, companies have responded in an almost unprecedented fashion. Since debt levels had raised existential
| 3 |
VANECK VIP GLOBAL HARD ASSETS FUND
(unaudited) (continued)
risks, companies unabashedly pursued an all-of-the-above approach to balance sheet repair, including the elimination of dividend distributions and share repurchase programs, as well as issuing equity and using other novel financial engineering. In our view, this could lead to much stronger operational and financial results as companies emerge from this historical down-turn.
One of the main pillars of our investment philosophy continues to be to look for long-term growth and the structural enhancement in intrinsic value in the companies in which we invest. Even in today’s market conditions this continues to be one of our guiding tenets. Since we remain convinced that positioning our portfolio for the future, and not just reacting to current circumstances, is of paramount importance, our focus across the sectors in which we invest remains on companies that can navigate commodity price volatility and help grow sustainable net asset value.
The Fund is subject to risks associated with concentrating its investments in hard assets and the hard assets sector, including real estate, precious metals, and natural resources, and can be significantly affected by events relating to these industries, including international political and economic developments, inflation, and other factors. The Fund’s portfolio securities may experience substantial price fluctuations as a result of these factors, and may move independently of the trends of industrialized companies.
The Fund’s investments in foreign securities involve risks related to adverse political and economic developments unique to a country or a region, currency fluctuations or controls, and the possibility of arbitrary action by foreign governments, including the takeover of property without adequate compensation or imposition of prohibitive taxation. The Fund is subject to risks associated with investments in derivative, commodity-linked instruments, and illiquid securities. The Fund is also subject to inflation risk, market risk, non-diversification risk, and leverage risk. Please see the prospectus for information on these and other risk considerations.
| 4 |
We very much appreciate your continued investment in the VanEck VIP Global Hard Assets Fund, and we look forward to helping you meet your investment goals in the future.
 |  | |
| Shawn Reynolds | Charles T. Cameron | |
| Portfolio Manager | Deputy Portfolio Manager | |
| January 23, 2017 |
Represents the opinions of the investment adviser. Past performance is no guarantee of future results. Not intended to be a forecast of future events, a guarantee of future results or investment advice. Current market conditions may not continue.
| † | All Fund assets referenced are Total Net Assets as of December 31, 2016. |
All indices are unmanaged and include the reinvestment of all dividends, but do not reflect the payment of transaction costs, advisory fees or expenses that are associated with an investment in the Fund. An index’s performance is not illustrative of the Fund’s performance. Indices are not securities in which investments can be made. Results reflect past performance and do not guarantee future results.
| 1 | S&P® North American Natural Resources Sector (SPGINRTR) Index includes mining, energy, paper and forest products, and plantation-owning companies, but excludes the chemicals industry and steel sub-industry. |
| 5 |
VANECK VIP GLOBAL HARD ASSETS FUND
December 31, 2016 (unaudited)
| Halliburton Co. | 4.4% | |
| Glencore plc | 4.3% | |
| Nabors Industries Ltd. | 4.3% | |
| Diamondback Energy, Inc. | 3.9% | |
| Parsley Energy, Inc. | 3.7% | |
| Patterson-UTI Energy, Inc. | 3.7% | |
| Pioneer Natural Resources Co. | 3.5% | |
| Cimarex Energy Co. | 3.5% | |
| EOG Resources, Inc. | 3.5% | |
| Schlumberger NV | 3.5% | |
| * Percentage of net assets. Portfolio is subject to change. |
| 6 |
December 31, 2016 (unaudited)
This chart shows the value of a hypothetical $10,000 investment in the Fund over the past 10 fiscal year periods or since inception (for funds lacking 10-year records). The result is compared with the Fund’s benchmark, and may include a broad-based market index.
Performance of Class S shares will vary from that of the Initial Class shares due to differences in class specific fees and any applicable sales charges. | Hypothetical Growth of $10,000 (Ten Year: Initial Class)
|
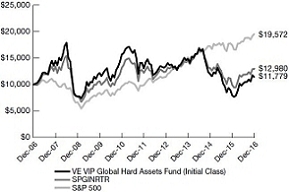
| Average Annual | ||||||||||||
| Total Return | Fund | |||||||||||
| 12/31/16 | Initial Class | SPGINRTR | S&P 500 | |||||||||
| One Year | 43.71 | % | 30.87 | % | 11.96 | % | ||||||
| Five Year | (2.43 | )% | 1.26 | % | 14.66 | % | ||||||
| Ten Year | 1.65 | % | 2.64 | % | 6.95 | % | ||||||
| Average Annual | ||||||||||||
| Total Return | Fund | |||||||||||
| 12/31/16 | Class S | SPGINRTR | S&P 500 | |||||||||
| One Year | 43.41 | % | 30.87 | % | 11.96 | % | ||||||
| Five Year | (2.68 | )% | 1.26 | % | 14.66 | % | ||||||
| Ten Year | 1.33 | % | 2.64 | % | 6.95 | % | ||||||
The performance quoted represents past performance. Past performance is no guarantee of future results; current performance may be lower or higher than the performance data quoted. Performance information reflects temporary waivers of expenses and/or fees and does not include insurance/annuity fees and expenses. Investment returns would have been reduced had these fees/expenses been included. Investment return and the value of the shares of the Fund will fluctuate so that an investor’s shares, when redeemed, may be worth more or less than their original cost. Fund returns assume that dividends and capital gains distributions have been reinvested in the Fund at NAV. Performance information current to the most recent month end is available by calling 800.826.2333 or by visiting vaneck.com.
The Fund is only available to life insurance and annuity companies to fund their variable annuity and variable life insurance products. These contracts offer life insurance and tax benefits to the beneficial owners of the Fund. Your insurance or annuity company charges fees and expenses for these benefits that are not reflected in this report or in the Fund’s performance, since they are not direct expenses of the Fund. For insurance products, performance figures do not reflect the cost for insurance and if they did, the performance shown would be significantly lower. A review of your particular life and/or annuity contract will provide you with much greater detail regarding these costs and benefits.
| 7 |
VANECK VIP GLOBAL HARD ASSETS FUND
PERFORMANCE COMPARISON
(unaudited) (continued)
All indices listed are unmanaged indices and include the reinvestment of all dividends, but do not reflect the payment of transaction costs, advisory fees or expenses that are associated with an investment in the Fund. An index’s performance is not illustrative of the Fund’s performance. Indices are not securities in which investments can be made.
The S&P® North American Natural Resources Sector (SPGINRTR) Index includes mining, energy, paper and forest products, and plantation-owning companies.
The S&P 500® Index consists of 500 widely held common stocks covering industrial, utility, financial and transportation sectors.
| 8 |
(unaudited)
As a shareholder of the Fund, you incur two types of costs: (1) transaction costs, including program fees on purchase payments; and (2) ongoing costs, including management fees and other Fund expenses. This disclosure is intended to help you understand the ongoing costs (in dollars) of investing in the Fund and to compare these costs with the ongoing costs of investing in other mutual funds.
The disclosure is based on an investment of $1,000 invested at the beginning of the period and held for the entire period, July 1, 2016 to December 31, 2016.
Actual Expenses
The first line in the table below provides information about account values and actual expenses. You may use the information in this line, together with the amount you invested, to estimate the expenses that you paid over the period. Simply divide your account value by $1,000 (for example, an $8,600 account value divided by $1,000 = 8.6), then multiply the result by the number in the first line under the heading entitled “Expenses Paid During the Period.”
Hypothetical Example for Comparison Purposes
The second line in the table below provides information about hypothetical account values and hypothetical expenses based on the Fund’s actual expense ratio and an assumed rate of return of 5% per year before expenses, which is not the Fund’s actual return. The hypothetical account values and expenses may not be used to estimate the actual ending account balance or expenses you paid for the period. You may use this information to compare the ongoing costs of investing in the Fund and other funds. To do so, compare this 5% hypothetical example with the 5% hypothetical examples that appear in the shareholder reports of other funds.
Please note that the expenses shown in the table are meant to highlight your ongoing costs only and do not reflect any transactional costs, such as fees on purchase payments. Therefore, the second line of the table is useful in comparing ongoing costs only, and will not help you determine the relative costs of owning different funds. In addition, if these transactional costs were included, your costs would have been higher.
| 9 |
VANECK VIP GLOBAL HARD ASSETS FUND
EXPLANATION OF EXPENSES
(unaudited) (continued)
| Expenses Paid | ||||||||||||||||
| Ending | During the Period* | |||||||||||||||
| Beginning | Account Value | July 1, 2016 - | ||||||||||||||
| Account Value | December 31, | December 31, | ||||||||||||||
| July 1, 2016 | 2016 | 2016 | ||||||||||||||
| VanEck VIP Global Hard Assets Fund | ||||||||||||||||
| Initial Class | Actual | $ | 1,000.00 | $ | 1,119.70 | $ | 5.49 | |||||||||
| Hypothetical** | $ | 1,000.00 | $ | 1,019.96 | $ | 5.23 | ||||||||||
| Class S | Actual | $ | 1,000.00 | $ | 1,118.40 | $ | 6.76 | |||||||||
| Hypothetical** | $ | 1,000.00 | $ | 1,018.75 | $ | 6.44 | ||||||||||
| * | Expenses are equal to the Fund’s annualized expense ratio (for the six months ended December 31, 2016), of 1.03% on Initial Class Shares, and 1.27% on Class S Shares, multiplied by the average account value over the period, multiplied by the number of days in the most recent fiscal half year divided by the number of the days in the fiscal year (to reflect the one-half year period). |
| ** | Assumes annual return of 5% before expenses |
| 10 |
| Number | |||||||
| of Shares | Value | ||||||
| COMMON STOCKS: 96.7% | |||||||
| Bermuda: 0.7% | |||||||
| 116,500 | Golar LNG Ltd. (USD) | $ | 2,672,510 | ||||
| Canada: 14.2% | |||||||
| 27,822 | Agnico-Eagle Mines Ltd. | 1,169,740 | |||||
| 183,600 | Agnico-Eagle Mines Ltd. (USD) | 7,711,200 | |||||
| 76,500 | Agrium, Inc. (USD) | 7,692,075 | |||||
| 276,100 | Barrick Gold Corp. (USD) | 4,412,078 | |||||
| 1,355,200 | First Quantum Minerals Ltd. | 13,474,785 | |||||
| 324,100 | Goldcorp, Inc. (USD) | 4,407,760 | |||||
| 688,400 | Kinross Gold Corp. (USD) * | 2,140,924 | |||||
| 563,000 | New Gold, Inc. (USD) * | 1,970,500 | |||||
| 667,100 | Teck Resources Ltd. (USD) | 13,362,013 | |||||
| 56,341,075 | |||||||
| France: 0.6% | |||||||
| 335,200 | Vallourec SA * # | 2,303,176 | |||||
| Kuwait: 1.5% | |||||||
| 3,890,609 | Kuwait Energy Plc (GBP) * # § ø | 6,069,240 | |||||
| Luxembourg: 1.1% | |||||||
| 119,600 | Tenaris SA (ADR) | 4,270,916 | |||||
| Monaco: 0.5% | |||||||
| 430,300 | Scorpio Tankers, Inc. (USD) | 1,949,259 | |||||
| South Africa: 0.8% | |||||||
| 1,746,945 | Petra Diamonds Ltd. (GBP) * # | 3,353,557 | |||||
| Switzerland: 6.2% | |||||||
| 5,048,665 | Glencore Xstrata Plc (GBP) * # | 17,058,848 | |||||
| 1,477,800 | Weatherford International Plc (USD) * | 7,374,222 | |||||
| 24,433,070 | |||||||
| Number | |||||||
| of Shares | Value | ||||||
| United Kingdom: 1.1% | |||||||
| 57,300 | Randgold Resources Ltd. (ADR) | $ | 4,374,282 | ||||
| United States: 70.0% | |||||||
| 262,000 | Callon Petroleum Co. * | 4,026,940 | |||||
| 247,000 | CF Industries Holdings, Inc. | 7,775,560 | |||||
| 101,700 | Cimarex Energy Co. | 13,821,030 | |||||
| 100,550 | Concho Resources, Inc. * | 13,332,930 | |||||
| 476,300 | Consol Energy, Inc. | 8,682,949 | |||||
| 152,600 | Diamondback Energy, Inc. * | 15,421,756 | |||||
| 135,900 | EOG Resources, Inc. | 13,739,490 | |||||
| 327,100 | Freeport-McMoRan Copper & Gold, Inc. * | 4,314,449 | |||||
| 176,600 | Green Plains Renewable Energy, Inc. | 4,918,310 | |||||
| 273,500 | Gulfport Energy Corp. * | 5,918,540 | |||||
| 320,600 | Halliburton Co. | 17,341,254 | |||||
| 143,500 | Hess Corp. | 8,938,615 | |||||
| 665,100 | Laredo Petroleum, Inc. * | 9,404,514 | |||||
| 353,700 | Louisiana-Pacific Corp. * | 6,695,541 | |||||
| 1,035,500 | Nabors Industries Ltd. | 16,982,200 | |||||
| 297,650 | Newfield Exploration Co. * | 12,054,825 | |||||
| 252,200 | Newmont Mining Corp. | 8,592,454 | |||||
| 420,900 | Parsley Energy, Inc. * | 14,832,516 | |||||
| 550,800 | Patterson-UTI Energy, Inc. | 14,827,536 | |||||
| 163,300 | PDC Energy, Inc. * | 11,852,314 | |||||
| 77,600 | Pioneer Natural Resources Co. | 13,973,432 | |||||
See Notes to Financial Statements
| 11 |
VANECK VIP GLOBAL HARD ASSETS FUND
SCHEDULE OF INVESTMENTS
(continued)
| Number | |||||||
| of Shares | Value | ||||||
| United States: (continued) | |||||||
| 90,800 | RSP Permian, Inc. * | $ | 4,051,496 | ||||
| 163,500 | Schlumberger Ltd. | 13,725,825 | |||||
| 252,500 | SM Energy Co. | 8,706,200 | |||||
| 220,000 | Steel Dynamics, Inc. | 7,827,600 | |||||
| 228,000 | Sunrun, Inc. * | 1,210,680 | |||||
| 440,600 | Superior Energy Services, Inc. | 7,437,328 | |||||
| 53,500 | Tyson Foods, Inc. | 3,299,880 | |||||
| 40,000 | Union Pacific Corp. | 4,147,200 | |||||
| 277,853,364 | |||||||
| Total Common Stocks (Cost: $336,007,938) | 383,620,449 | ||||||
| Number | |||||||
| of Shares | Value | ||||||
| REAL ESTATE INVESTMENT TRUST: 0.2% (Cost: $976,798) | |||||||
| United States: 0.2% | |||||||
| 49,500 | Hannon Armstrong Sustainable Infrastructure Capital, Inc. | $ | 940,005 | ||||
| MONEY MARKET FUND: 3.3% (Cost: $12,853,994) | |||||||
| 12,853,994 | AIM Treasury Portfolio – Institutional Class | 12,853,994 | |||||
| Total Investments: 100.2% (Cost: $349,838,730) | 397,414,448 | ||||||
| Liabilities in excess of other assets: (0.2)% | (617,686 | ) | |||||
| NET ASSETS: 100.0% | $ | 396,796,762 | |||||
| ADR | American Depositary Receipt |
| GBP | British Pound |
| USD | United States Dollar |
| * | Non-income producing |
| # | Indicates a fair valued security which has been valued in good faith pursuant to guidelines established by the Board of Trustees. The aggregate value of fair valued securities is $28,784,821 which represents 7.3% of net assets. |
| § | Illiquid Security – the aggregate value of illiquid securities is $6,069,240 which represents 1.5% of net assets. |
| ø | Restricted Security – the aggregate value of restricted securities is $6,069,240, or 1.5% of net assets. |
See Notes to Financial Statements
| 12 |
Restricted securities held by the Fund as of December 31, 2016 are as follows:
| Acquisition | Number of | Acquisition | % of | |||||||||||
| Security | Date | �� | Shares | Cost | Value | Net Assets | ||||||||
| Kuwait Energy Plc | 08/06/2008 | 3,890,609 | $11,764,893 | $6,069,240 | 1.5% | |||||||||
| Summary of Investments | % of | |||||||
| by Sector (unaudited) | Investments | Value | ||||||
| Consumer Staples | 0.8 | % | $ | 3,299,880 | ||||
| Energy | 65.1 | 258,629,323 | ||||||
| Financials | 0.2 | 940,005 | ||||||
| Industrials | 1.4 | 5,357,880 | ||||||
| Materials | 29.3 | 116,333,366 | ||||||
| Money Market Fund | 3.2 | 12,853,994 | ||||||
| 100.0 | % | $ | 397,414,448 | |||||
The summary of inputs used to value the Fund’s investments as of December 31, 2016 is as follows:
| Level 2 | Level 3 | ||||||||||||||||
| Level 1 | Significant | Significant | |||||||||||||||
| Quoted | Observable | Unobservable | |||||||||||||||
| Prices | Inputs | Inputs | Value | ||||||||||||||
| Common Stocks | |||||||||||||||||
| Bermuda | $ | 2,672,510 | $ | — | $ | — | $ | 2,672,510 | |||||||||
| Canada | 56,341,075 | — | — | 56,341,075 | |||||||||||||
| France | — | 2,303,176 | — | 2,303,176 | |||||||||||||
| Kuwait | — | — | 6,069,240 | 6,069,240 | |||||||||||||
| Luxembourg | 4,270,916 | — | — | 4,270,916 | |||||||||||||
| Monaco | 1,949,259 | — | — | 1,949,259 | |||||||||||||
| South Africa | — | 3,353,557 | — | 3,353,557 | |||||||||||||
| Switzerland | 7,374,222 | 17,058,848 | — | 24,433,070 | |||||||||||||
| United Kingdom | 4,374,282 | — | — | 4,374,282 | |||||||||||||
| United States | 277,853,364 | — | — | 277,853,364 | |||||||||||||
| Real Estate Investment | |||||||||||||||||
| Trust* | 940,005 | — | — | 940,005 | |||||||||||||
| Money Market Fund | 12,853,994 | — | — | 12,853,994 | |||||||||||||
| Total | $ | 368,629,627 | $ | 22,715,581 | $ | 6,069,240 | $ | 397,414,448 | |||||||||
* See Schedule of Investments for security type and geographic country breakouts.
There were no transfers between levels during the year ended December 31, 2016.
See Notes to Financial Statements
| 13 |
VANECK VIP GLOBAL HARD ASSETS FUND
SCHEDULE OF INVESTMENTS
(continued)
The following table reconciles the valuation of the Fund’s Level 3 investment securities and related transactions during the year ended December 31, 2016:
| Common Stocks | ||||||||
| Brazil | Kuwait | |||||||
| Balance as of December 31, 2015 | $ | 0 | $ | 3,457,955 | ||||
| Realized gain (loss) | (508,890 | ) | — | |||||
| Net change in unrealized appreciation (depreciation) | 508,890 | 2,611,285 | ||||||
| Purchases | — | — | ||||||
| Sales | 0 | — | ||||||
| Transfers in and/or out of level 3 | — | — | ||||||
| Balance as of December 31, 2016 | $ | — | $ | 6,069,240 | ||||
The following table presents additional information about valuation methodologies and inputs used for investments that are measured at fair value and categorized within Level 3 as of December 31, 2016:
| Impact to | ||||||||||
| Valuation | ||||||||||
| Value as of | Unobservable | from an | ||||||||
| December 31, | Valuation | Input | Unobservable | Increase in | ||||||
| 2016 | Technique | Description(1) | Input | Input(2) | ||||||
| Common Stocks | ||||||||||
| Kuwait | $6,069,240 | Guideline | Entitlement Multiple | 5.50x-10.25x | Increase | |||||
| Public | Working Interest | |||||||||
| Companies | Multiple | 0.40x-3.00x | Increase | |||||||
| Marketability Discount | 10% | Decrease | ||||||||
| (1) | In determining certain of these inputs, management evaluates a variety of factors including economic condition, industry and market developments, market valuations of comparable companies and company specific developments. |
| (2) | This column represents the directional change in the fair value of the Level 3 investments that would result from an increase to the corresponding unobservable input. A decrease to the unobservable input would have the opposite effect. Significant increases or decreases in these inputs in isolation could result in significantly higher or lower fair value measurements. |
See Notes to Financial Statements
| 14 |
STATEMENT OF ASSETS AND LIABILITIES
December 31, 2016
| Assets: | ||||
| Investments, at value (Cost $349,838,730) | $ | 397,414,448 | ||
| Cash | 21,079 | |||
| Cash denominated in foreign currency, at value (Cost $20) | 20 | |||
| Receivables: | ||||
| Investments sold | 23,052 | |||
| Shares of beneficial interest sold | 466,180 | |||
| Dividends | 256,048 | |||
| Prepaid expenses | 8,147 | |||
| Total assets | 398,188,974 | |||
| Liabilities: | ||||
| Payables: | ||||
| Investments purchased | 46,019 | |||
| Shares of beneficial interest redeemed | 625,956 | |||
| Due to Adviser | 342,377 | |||
| Due to Distributor | 37,182 | |||
| Deferred Trustee fees | 127,727 | |||
| Accrued expenses | 212,951 | |||
| Total liabilities | 1,392,212 | |||
| NET ASSETS | $ | 396,796,762 | ||
| Initial Class Shares: | ||||
| Net Assets | $ | 224,611,824 | ||
| Shares of beneficial interest outstanding | 9,303,455 | |||
| Net asset value, redemption and offering price per share | $ | 24.14 | ||
| Class S Shares: | ||||
| Net Assets | $ | 172,184,938 | ||
| Shares of beneficial interest outstanding | 7,379,941 | |||
| Net asset value, redemption and offering price per share | $ | 23.33 | ||
| Net Assets consist of: | ||||
| Aggregate paid in capital | $ | 445,991,016 | ||
| Net unrealized appreciation | 47,575,748 | |||
| Accumulated net investment loss | (127,727 | ) | ||
| Accumulated net realized loss | (96,642,275 | ) | ||
| $ | 396,796,762 |
See Notes to Financial Statements
| 15 |
VANECK VIP GLOBAL HARD ASSETS FUND
For the Year Ended December 31, 2016
| Income: | ||||||||
| Dividends (net of foreign taxes withheld of $81,517) | $ | 2,796,508 | ||||||
| Expenses: | ||||||||
| Management fees | $ | 3,417,965 | ||||||
| Distribution fees — Class S Shares | 346,091 | |||||||
| Transfer agent fees — Initial Class Shares | 27,139 | |||||||
| Transfer agent fees — Class S Shares | 11,705 | |||||||
| Custodian fees | 3,734 | |||||||
| Professional fees | 60,756 | |||||||
| Reports to shareholders | 55,043 | |||||||
| Insurance | 22,021 | |||||||
| Trustees’ fees and expenses | 5,807 | |||||||
| Other | 14,429 | |||||||
| Total expenses | 3,964,690 | |||||||
| Net investment loss | (1,168,182 | ) | ||||||
| Net realized loss on: | ||||||||
| Investments | (43,167,552 | ) | ||||||
| Foreign currency transactions and foreign denominated assets and liabilities | (1,229 | ) | ||||||
| Net realized loss | (43,168,781 | ) | ||||||
| Net change in unrealized appreciation (depreciation) on: | ||||||||
| Investments | 164,245,213 | |||||||
| Foreign currency transactions and foreign denominated assets and liabilities | 119 | |||||||
| Net change in unrealized appreciation (depreciation) | 164,245,332 | |||||||
| Net Increase in Net Assets Resulting from Operations | $ | 119,908,369 |
See Notes to Financial Statements
| 16 |
STATEMENT OF CHANGES IN NET ASSETS
| Year Ended | Year Ended | |||||||
| December 31, | December 31, | |||||||
| 2016 | 2015 | |||||||
| Operations: | ||||||||
| Net investment income (loss) | $ | (1,168,182 | ) | $ | 1,263,161 | |||
| Net realized loss | (43,168,781 | ) | (43,267,357 | ) | ||||
| Net change in unrealized appreciation (depreciation) | 164,245,332 | (93,377,920 | ) | |||||
| Net increase (decrease) in net assets resulting from operations | 119,908,369 | (135,382,116 | ) | |||||
| Dividends to shareholders from: | ||||||||
| Net investment income | ||||||||
| Initial Class Shares | (800,315 | ) | (76,223 | ) | ||||
| Class S Shares | (456,585 | ) | (33,963 | ) | ||||
| Total dividends | (1,256,900 | ) | (110,186 | ) | ||||
| Share transactions*: | ||||||||
| Proceeds from sale of shares | ||||||||
| Initial Class Shares | 53,363,374 | 76,350,511 | ||||||
| Class S Shares | 90,975,754 | 45,544,897 | ||||||
| 144,339,128 | 121,895,408 | |||||||
| Reinvestment of dividends | ||||||||
| Initial Class Shares | 800,315 | 76,223 | ||||||
| Class S Shares | 456,585 | 33,963 | ||||||
| 1,256,900 | 110,186 | |||||||
| Cost of shares redeemed | ||||||||
| Initial Class Shares | (77,331,352 | ) | (85,135,234 | ) | ||||
| Class S Shares | (57,842,110 | ) | (26,916,943 | ) | ||||
| (135,173,462 | ) | (112,052,177 | ) | |||||
| Net increase in net assets resulting from share transactions | 10,422,566 | 9,953,417 | ||||||
| Total increase (decrease) in net assets | 129,074,035 | (125,538,885 | ) | |||||
| Net Assets: | ||||||||
| Beginning of year | 267,722,727 | 393,261,612 | ||||||
| End of year (including undistributed (accumulated) net investment income (loss) of $(127,727) and $1,135,927, respectively) | $ | 396,796,762 | $ | 267,722,727 | ||||
| * Shares of beneficial interest issued, reinvested and redeemed (unlimited number of $.001 par value shares authorized): | ||||||||
| Initial Class Shares: | ||||||||
| Shares sold | 2,574,457 | 3,387,554 | ||||||
| Shares reinvested | 49,586 | 3,123 | ||||||
| Shares redeemed | (3,754,331 | ) | (3,801,553 | ) | ||||
| Net decrease | (1,130,288 | ) | (410,876 | ) | ||||
| Class S Shares: | ||||||||
| Shares sold | 4,535,734 | 2,106,383 | ||||||
| Shares reinvested | 29,212 | 1,433 | ||||||
| Shares redeemed | (2,788,791 | ) | (1,298,862 | ) | ||||
| Net increase | 1,776,155 | 808,954 | ||||||
See Notes to Financial Statements
| 17 |
VANECK VIP GLOBAL HARD ASSETS FUND
For a share outstanding throughout each year:
| Initial Class Shares | ||||||||||||||||||||
| Year Ended December 31, | ||||||||||||||||||||
| 2016 | 2015 | 2014 | 2013 | 2012 | ||||||||||||||||
| Net asset value, beginning of year | $16.88 | $25.37 | $31.39 | $29.13 | $30.75 | |||||||||||||||
| Income from investment operations: | ||||||||||||||||||||
| Net investment income (loss) | (0.05 | ) | 0.10 | 0.06 | 0.08 | (b) | 0.15 | (b) | ||||||||||||
| Net realized and unrealized gain (loss) on investments | 7.39 | (8.58 | ) | (6.05 | ) | 2.95 | 1.00 | |||||||||||||
| Total from investment operations | 7.34 | (8.48 | ) | (5.99 | ) | 3.03 | 1.15 | |||||||||||||
| Less dividends and distributions from: | ||||||||||||||||||||
| Net investment income | (0.08 | ) | (0.01 | ) | (0.03 | ) | (0.20 | ) | (0.18 | ) | ||||||||||
| Net realized capital gains | — | — | — | (0.57 | ) | (2.59 | ) | |||||||||||||
| Total dividends and distributions | (0.08 | ) | (0.01 | ) | (0.03 | ) | (0.77 | ) | (2.77 | ) | ||||||||||
| Redemption fees | — | — | — | — | — | (c) | ||||||||||||||
| Net asset value, end of year | $24.14 | $16.88 | $25.37 | $31.39 | $29.13 | |||||||||||||||
| Total return (a) | 43.71 | % | (33.45 | )% | (19.10 | )% | 10.53 | % | 3.39 | % | ||||||||||
| Ratios/Supplemental Data | ||||||||||||||||||||
| Net assets, end of year (000’s) | $224,612 | $176,087 | $275,099 | $336,763 | $354,487 | |||||||||||||||
| Ratio of gross expenses to average net assets | 1.06 | % | 1.05 | % | 1.06 | % | 1.09 | % | 1.03 | % | ||||||||||
| Ratio of net expenses to average net assets | 1.06 | % | 1.05 | % | 1.06 | % | 1.09 | % | 1.03 | % | ||||||||||
| Ratio of net expenses, excluding interest expense, to average net assets | 1.06 | % | 1.05 | % | 1.06 | % | 1.09 | % | 1.03 | % | ||||||||||
| Ratio of net investment income (loss) to average net assets | (0.24 | )% | 0.43 | % | 0.19 | % | 0.27 | % | 0.50 | % | ||||||||||
| Portfolio turnover rate | 45 | % | 21 | % | 31 | % | 31 | % | 29 | % | ||||||||||
| (a) | Total return is calculated assuming an initial investment made at the net asset value at the beginning of the year, reinvestment of any dividends and distributions at net asset value on the dividend/distribution payment date and a redemption at the net asset value on the last day of the year. The return does not reflect the deduction of taxes that a shareholder would pay on Fund dividends/distributions or the redemption of Fund shares. |
| (b) | Calculated based upon average shares outstanding |
| (c) | Amount represents less than $0.005 per share |
See Notes to Financial Statements
| 18 |
FINANCIAL HIGHLIGHTS
For a share outstanding throughout each year:
| Class S Shares | ||||||||||||||||||||
| Year Ended December 31, | ||||||||||||||||||||
| 2016 | 2015 | 2014 | 2013 | 2012 | ||||||||||||||||
| Net asset value, beginning of year | $16.35 | $24.64 | $30.55 | $28.38 | $30.10 | |||||||||||||||
| Income from investment operations: | ||||||||||||||||||||
| Net investment income (loss) | (0.09 | ) | 0.04 | (0.02 | ) | 0.01 | (b) | 0.13 | (b) | |||||||||||
| Net realized and unrealized gain (loss) on investments | 7.15 | (8.32 | ) | (5.89 | ) | 2.88 | 0.92 | |||||||||||||
| Total from investment operations | 7.06 | (8.28 | ) | (5.91 | ) | 2.89 | 1.05 | |||||||||||||
| Less dividends and distributions from: | ||||||||||||||||||||
| Net investment income | (0.08 | ) | (0.01 | ) | — | (0.15 | ) | (0.18 | ) | |||||||||||
| Net realized capital gains | — | — | — | (0.57 | ) | (2.59 | ) | |||||||||||||
| Total dividends and distributions | (0.08 | ) | (0.01 | ) | — | (0.72 | ) | (2.77 | ) | |||||||||||
| Redemption fees | — | — | — | — | — | (c) | ||||||||||||||
| Net asset value, end of year | $23.33 | $16.35 | $24.64 | $30.55 | $28.38 | |||||||||||||||
| Total return (a) | 43.41 | % | (33.62 | )% | (19.35 | )% | 10.30 | % | 3.11 | % | ||||||||||
| Ratios/Supplemental Data | ||||||||||||||||||||
| Net assets, end of year (000’s) | $172,185 | $91,635 | $118,163 | $122,407 | $86,241 | |||||||||||||||
| Ratio of gross expenses to average net assets | 1.30 | % | 1.31 | % | 1.32 | % | 1.34 | % | 1.34 | % | ||||||||||
| Ratio of net expenses to average net assets | 1.30 | % | 1.31 | % | 1.32 | % | 1.34 | % | 1.34 | % | ||||||||||
| Ratio of net expenses, excluding interest expense, to average net assets | 1.30 | % | 1.31 | % | 1.32 | % | 1.34 | % | 1.34 | % | ||||||||||
| Ratio of net investment income (loss) to average net assets | (0.50 | )% | 0.17 | % | (0.06 | )% | 0.03 | % | 0.47 | % | ||||||||||
| Portfolio turnover rate | 45 | % | 21 | % | 31 | % | 31 | % | 29 | % | ||||||||||
| (a) | Total return is calculated assuming an initial investment made at the net asset value at the beginning of the year, reinvestment of any dividends and distributions at net asset value on the dividend/distribution payment date and a redemption at the net asset value on the last day of the year. The return does not reflect the deduction of taxes that a shareholder would pay on Fund dividends/distributions or the redemption of Fund shares. |
| (b) | Calculated based upon average shares outstanding |
| (c) | Amount represents less than $0.005 per share |
See Notes to Financial Statements
| 19 |
VANECK VIP GLOBAL HARD ASSETS FUND
December 31, 2016
Note 1—Fund Organization—VanEck VIP Trust (the “Trust”) (formerly Van Eck VIP Trust) is registered under the Investment Company Act of 1940, as amended, as an open-end management investment company. The Trust was organized as a Massachusetts business trust on January 7, 1987. The VanEck VIP Global Hard Assets Fund (the “Fund”) is a diversified series of the Trust and seeks long-term capital appreciation by investing primarily in hard asset securities. The Fund offers two classes of shares: Initial Class Shares and Class S Shares. The two classes are identical except Class S Shares are subject to a distribution fee.
Note 2—Significant Accounting Policies—The preparation of financial statements in conformity with U.S. generally accepted accounting principles (“GAAP”) requires management to make estimates and assumptions that affect the reported amounts and disclosures in the financial statements. Actual results could differ from those estimates.
The Fund is an investment company and is following accounting and reporting requirements of Accounting Standards Codification (“ASC”) 946 Financial Services – Investment Companies.
The following is a summary of significant accounting policies followed by the Fund.
| A. | Security Valuation—The Fund values its investments in securities and other assets and liabilities at fair value daily. Fair value is the price that would be received to sell an asset or paid to transfer a liability in an orderly transaction between market participants on the measurement date. Securities traded on national exchanges or traded on the NASDAQ National Market System are valued at the last sales price reported at the close of each business day. Securities traded on the NASDAQ Stock Market are valued at the NASDAQ official closing price. Over-the-counter securities not included in the NASDAQ National Market System and listed securities for which no sale was reported are valued at the mean of the bid and ask prices. To the extent these securities are actively traded they are categorized as Level 1 in the fair value hierarchy (as described below). Certain foreign securities, whose values may be affected by market direction or events occurring before the Fund’s pricing time (4:00 p.m. Eastern Standard Time) but after the last close of the securities’ primary market, are fair valued using a pricing service and are categorized as Level 2 in the fair value hierarchy. The pricing service considers the correlation of the trading patterns of the foreign security to intraday trading in the U.S. market, based on indices of domestic securities and other appropriate indicators such as prices of relevant ADR’s and futures contracts. The Fund may also fair value securities |
| 20 |
| in other situations, such as, when a particular foreign market is closed but the Fund is open. Short-term obligations with more than sixty days remaining to maturity are valued at market value. Short-term obligations with sixty days or less to maturity are valued at amortized cost, which with accrued interest approximates fair value. Money market fund investments are valued at net asset value and are classified as Level 1 in the fair value hierarchy. Securities for which quotations are not available are stated at fair value as determined by the Pricing Committee of Van Eck Associates Corporation (the “Adviser”). The Pricing Committee provides oversight of the Fund’s valuation policies and procedures, which are approved by the Fund’s Board of Trustees. Among other things, these procedures allow the Fund to utilize independent pricing services, quotations from securities dealers, and other market sources to determine fair value. The Pricing Committee convenes regularly to review the fair value of financial instruments for which market prices are not readily available. The Pricing Committee employs various methods for calibrating the valuation approaches utilized to determine fair value, including a regular review of key inputs and assumptions, transactional back-testing and disposition analysis. | |
| Certain factors such as economic conditions, political events, market trends, the nature of and duration of any restrictions on disposition, trading in similar securities of the issuer or comparable issuers and other security specific information are used to determine the fair value of these securities. Depending on the relative significance of valuation inputs, these securities may be classified either as Level 2 or Level 3 in the fair value hierarchy. The price which the Fund may realize upon sale of an investment may differ materially from the value presented in the Schedule of Investments. | |
The Fund utilizes various methods to measure the fair value of its investments on a recurring basis, which includes a hierarchy that prioritizes inputs to valuation methods used to measure fair value. The fair value hierarchy gives highest priority to unadjusted quoted prices in active markets for identical assets and liabilities (Level 1 measurements) and the lowest priority to unobservable inputs (Level 3 measurements). The inputs or methodologies used for valuing securities are not necessarily an indication of the risk associated with investing in those securities. The transfers between levels of the fair value hierarchy assume the financial instruments were transferred at the beginning of the reporting period. The three levels of the fair value hierarchy are described below:
Level 1 – Quoted prices in active markets for identical securities. |
| 21 |
VANECK VIP GLOBAL HARD ASSETS FUND
NOTES TO FINANCIAL STATEMENTS
(continued)
| Level 2 – Significant observable inputs (including quoted prices for similar securities, interest rates, prepayment speeds, credit risk, etc.). | |
| Level 3 – Significant unobservable inputs (including the Fund’s own assumptions in determining the fair value of investments). | |
| A summary of the inputs, the levels used to value the Fund’s investments, and transfers between levels are located in the Schedule of Investments. Additionally, tables that reconcile the valuation of the Fund’s Level 3 investments and that present additional information about valuation methodologies and unobservable inputs, if applicable, are located in the Schedule of Investments. | |
| B. | Federal Income Taxes—It is the Fund’s policy to comply with the provisions of the Internal Revenue Code applicable to regulated investment companies and to distribute all of its taxable income to its shareholders. Therefore, no federal income tax provision is required. |
| C. | Currency Translation—Assets and liabilities denominated in foreign currencies and commitments under foreign currency contracts are translated into U.S. dollars at the closing prices of such currencies each business day. Purchases and sales of investments are translated at the exchange rates prevailing when such investments are acquired or sold. Income and expenses are translated at the exchange rates prevailing when accrued. The portion of realized and unrealized gains and losses on investments that result from fluctuations in foreign currency exchange rates is not separately disclosed. Recognized gains or losses attributable to foreign currency fluctuations on foreign currency denominated assets, other than investments, and liabilities are recorded as net realized gain (loss) on foreign currency transactions and foreign denominated assets and liabilities in the Statement of Operations. |
| D. | Dividends and Distributions to Shareholders—Dividends to shareholders from net investment income and distributions from net realized capital gains, if any, are declared and paid annually. Income dividends and capital gain distributions are determined in accordance with U.S. income tax regulations, which may differ from such amounts determined in accordance with GAAP. |
| E. | Restricted Securities—The Fund may invest in securities that are subject to legal or contractual restrictions on resale. These securities generally may be resold in transactions exempt from registration or to the public if the securities are registered. Disposal of these securities may involve time-consuming negotiations and expense, and prompt sale at an acceptable |
| 22 |
| price may be difficult. Information regarding restricted securities, if any, is included at the end of the Fund’s Schedule of Investments. | |
| F. | Use of Derivative Instruments—The Fund may make investments in derivative instruments, including, but not limited to, options, futures, swaps and other derivatives relating to foreign currency transactions. A derivative is an instrument whose value is derived from underlying assets, indices, reference rates or a combination of these factors. Derivative instruments may be privately negotiated contracts (often referred to as over-the-counter (“OTC”) derivatives) or they may be listed and traded on an exchange. Derivative contracts may involve future commitments to purchase or sell financial instruments or commodities at specified terms on a specified date, or to exchange interest payment streams or currencies based on a notional or contractual amount. Derivative instruments may involve a high degree of financial risk. The use of derivative instruments also involves the risk of loss if the investment adviser is incorrect in its expectation of the timing or level of fluctuations in securities prices, interest rates or currency prices. Investments in derivative instruments also include the risk of default by the counterparty, the risk that the investment may not be liquid and the risk that a small movement in the price of the underlying security or benchmark may result in a disproportionately large movement, unfavorable or favorable, in the price of the derivative instrument. The Fund held no derivative instruments during the year ended December 31, 2016. |
| G. | Other—Security transactions are accounted for on trade date. Dividend income is recorded on the ex-dividend date except that certain dividends from foreign securities are recognized upon notification of the ex-dividend date. Interest income, including amortization of premiums and discounts, is accrued as earned. Realized gains and losses are calculated on the specific identified cost basis. The Fund received redemption fees from Class R1 Shares prior to its closing on April 30, 2012 which are reflected in the Financial Highlights. |
| Income, expenses (excluding class-specific expenses), realized, and unrealized gains/losses are allocated proportionately to each class of shares based upon the relative net asset value of outstanding shares of each class at the beginning of the day (after adjusting for current capital share activity of the respective classes). Class-specific expenses are charged directly to the applicable class of shares. | |
| In the normal course of business, the Fund enters into contracts that contain a variety of general indemnifications. The Fund’s maximum exposure under these agreements is unknown as this would involve future claims that may |
| 23 |
VANECK VIP GLOBAL HARD ASSETS FUND
NOTES TO FINANCIAL STATEMENTS
(continued)
| be made against the Fund that have not yet occurred. However, the Adviser believes the risk of loss under these arrangements to be remote. |
Note 3—Investment Management and Other Agreements—The Adviser is the investment adviser to the Fund. The Adviser receives a management fee, calculated daily and payable monthly based on an annual rate of 1.00% of the first $500 million of average daily net assets, 0.90% of the next $250 million of average daily net assets and 0.70% of the average daily net assets in excess of $750 million. The Adviser has agreed, until at least May 1, 2017, to voluntarily waive management fees and assume expenses to prevent the Fund’s total annual operating expenses (excluding acquired fund fees and expenses, interest expense, trading expenses, dividend and interest payments on securities sold short, taxes, and extraordinary expenses) from exceeding 1.20% for Initial Class Shares and 1.45% for Class S Shares. For the year ended December 31, 2016, no management fees were waived nor were any expenses assumed by the Adviser.
In addition, Van Eck Securities Corporation, an affiliate of the Adviser, acts as the Fund’s distributor (the “Distributor”). Certain officers and trustees of the Trust are officers, directors or stockholders of the Adviser and Distributor.
Note 4—12b-1 Plan of Distribution—The Trust and the Distributor are parties to a distribution agreement dated May 1, 2006. The Fund has adopted a Distribution Plan (the “Plan”) for Class S Shares in accordance with Rule 12b-1 under the 1940 Act. Pursuant to the Plan, the Fund is authorized to incur distribution expenses for its Class S Shares which will principally be payments to securities dealers who have sold shares and serviced shareholder accounts and payments to the Distributor, for reimbursement of other actual promotion and distribution expenses incurred by the Distributor on behalf of the Fund. The amount paid in any one year is 0.25% of average daily net assets for Class S Shares.
Note 5—Investments—For the year ended December 31, 2016, the cost of purchases and proceeds from sales of investments, excluding U.S. government securities and short-term obligations, aggregated to $152,037,608 and $147,718,149, respectively.
Note 6—Income Taxes—For Federal income tax purposes, the identified cost of investments owned at December 31, 2016 was $365,373,037 and net unrealized appreciation aggregated to $32,041,411, of which $99,222,455 related to appreciated securities and $67,181,044 related to depreciated securities.
| 24 |
At December 31, 2016, the components of accumulated earnings, on a tax basis, were as follows:
| Undistributed ordinary income | $ | — | ||
| Accumulated capital losses | (81,107,970 | ) | ||
| Other temporary differences | (127,725 | ) | ||
| Unrealized appreciation | 32,041,441 | |||
| Total | $ | (49,194,254 | ) |
The tax character of dividends and distributions paid to shareholders was as follows:
| Year Ended December 31, 2016 | Year Ended December 31, 2015 | |||||||||
| Ordinary income | $ | 1,256,900 | $ | 110,186 | ||||||
At December 31, 2016, the Fund had capital loss carryforwards available to offset future capital gains as follows:
| Post-Effective No Expiration Long-Term Capital Losses | Post-Effective No Expiration Short-Term Capital Losses | ||
| $74,232,956 | $6,875,014 |
During the year ended December 31, 2016, as a result of permanent book to tax differences, the Fund decreased accumulated net investment loss by $1,161,428, increased accumulated net realized loss on investments by $17 and decreased aggregated paid in capital by $1,161,411. Net assets were not affected by this reclassification. These differences are primarily due to foreign currency transactions and net operating losses.
The Fund recognizes the tax benefits of uncertain tax positions only where the position is “more-likely-than-not” to be sustained assuming examination by applicable tax authorities. Management has analyzed the Fund’s tax positions, and has concluded that no liability for unrecognized tax benefits should be recorded related to uncertain tax positions taken on return filings for all open tax years. The Fund does not have exposure for additional years that might still be open in certain foreign jurisdictions. Therefore, no provision for income tax is required in the Fund’s financial statements.
The Fund recognizes interest and penalties, if any, related to uncertain tax positions as income tax expense in the Statement of Operations. During the year ended December 31, 2016, the Fund did not incur any interest or penalties.
Note 7—Concentration of Risk—The Fund may purchase securities on foreign exchanges. Securities of foreign issuers involve special risks and considerations not typically associated with investing in U.S. issuers. These
| 25 |
VANECK VIP GLOBAL HARD ASSETS FUND
NOTES TO FINANCIAL STATEMENTS
(continued)
risks include devaluation of currencies, less reliable information about issuers, different securities transaction clearance and settlement practices, and future adverse political and economic developments. These risks are heightened for investments in emerging market countries. Moreover, securities of many foreign issuers and their markets may be less liquid and their prices more volatile than those of comparable U.S. issuers.
The Fund may concentrate its investments in companies which are significantly engaged in the exploration, development, production and distribution of gold and other natural resources such as strategic and other metals, minerals, forest products, oil, natural gas and coal and by investing in gold bullion and coins. Since the Fund may so concentrate, it may be subject to greater risks and market fluctuations than other more diversified portfolios. The production and marketing of gold and other natural resources may be affected by actions and changes in governments. In addition, gold and natural resources may be cyclical in nature.
The United Kingdom recently decided to leave the European Union (“EU”), creating economic and political uncertainty in its wake. Significant uncertainty exists regarding the timing of the United Kingdom’s withdrawal from the EU and the effects such withdrawal will have on the Euro, European economies and the global markets. This may further impact the value of the Euro and the British pound sterling, and has caused volatility and uncertainty in European and global markets.
At December 31, 2016, the aggregate shareholder accounts of three insurance companies owned approximately 52%, 22%, and 8% of the Initial Class Shares and four insurance companies owned approximately 40%, 32%, 13%, and 6% of the Class S Shares.
Note 8—Trustee Deferred Compensation Plan—The Trust has a Deferred Compensation Plan (the “Deferred Plan”) for Trustees under which the Trustees can elect to defer receipt of their trustee fees until retirement, disability or termination from the Board of Trustees. The fees otherwise payable to the participating Trustees are deemed invested in shares of eligible Funds of the Trust and the VanEck Funds (another registered investment company managed by the Adviser) as directed by the Trustees.
The expense for the Deferred Plan is included in “Trustees’ fees and expenses” on the Statement of Operations. The liability for the Deferred Plan is shown as “Deferred Trustee fees” on the Statement of Assets and Liabilities.
Note 9—Bank Line of Credit—The Trust participates with VanEck Funds (collectively the “VE/VIP Funds”) in a $30 million committed credit facility (the
| 26 |
“Facility”) to be utilized for temporary financing until the settlement of sales or purchases of portfolio securities, the repurchase or redemption of shares of the Fund and other temporary or emergency purposes. The participating VE/VIP Funds have agreed to pay commitment fees, pro rata, based on the unused but available balance. Interest is charged to the VE/VIP Funds at rates based on prevailing market rates in effect at the time of borrowings. During the year ended December 31, 2016, the Fund had no outstanding borrowings under the Facility.
Note 10—Recent Accounting Pronouncements and Regulatory Requirements— The Fund adopted Accounting Standards Update No. 2014-15 (“ASU 2014-15”), Disclosure of Uncertainties about an Entity’s Ability to Continue as a Going Concern, which requires management to assess the Fund’s ability to continue as a going concern and to provide related disclosures in certain circumstances. Under the new standard, disclosures are required when conditions give rise to substantial doubt about a company’s ability to continue as a going concern within one year from the financial statement issuance date. Based on management’s evaluation, there are no conditions or events that could adversely affect the Fund’s ability to meet its obligations within one year after the date the financial statements are issued. Accordingly, no disclosures are required specific to going concern uncertainties in the Fund’s financial statements.
In October 2016, the Securities and Exchange Commission (the “SEC”) released its Final Rule on Investment Company Reporting Modernization (the “Rule”). The Rule, which introduces two new regulatory reporting forms for investment companies – Form N-PORT and Form N-CEN – also contains amendments to Regulation S-X which impact financial statement presentation, particularly the presentation of derivative investments. Although still evaluating the impact of the Rule, management believes that many of the Regulation S-X amendments are consistent with the Fund’s current financial statement presentation and expects that the Fund will be able to comply with the Rule’s Regulation S-X amendments by the August 1, 2017 compliance date.
Note 11—Subsequent Event Review—The Fund has evaluated subsequent events and transactions for potential recognition or disclosure through the date the financial statements were issued.
| 27 |
REPORT OF INDEPENDENT REGISTERED PUBLIC ACCOUNTING FIRM
The Board of Trustees of VanEck VIP Trust and Shareholders of VanEck VIP Global Hard Assets Fund
We have audited the accompanying statement of assets and liabilities, including the schedule of investments, of VanEck VIP Global Hard Assets Fund (one of the series constituting VanEck VIP Trust) (the “Fund”) as of December 31, 2016, and the related statement of operations for the year then ended, the statements of changes in net assets for each of the two years in the period then ended, and the financial highlights for each of the five years in the period then ended. These financial statements and financial highlights are the responsibility of the Fund’s management. Our responsibility is to express an opinion on these financial statements and financial highlights based on our audits.
We conducted our audits in accordance with the standards of the Public Company Accounting Oversight Board (United States). Those standards require that we plan and perform the audit to obtain reasonable assurance about whether the financial statements and financial highlights are free of material misstatement. We were not engaged to perform an audit of the Fund’s internal control over financial reporting. Our audits included consideration of internal control over financial reporting as a basis for designing audit procedures that are appropriate in the circumstances, but not for the purpose of expressing an opinion on the effectiveness of the Fund’s internal control over financial reporting. Accordingly, we express no such opinion. An audit also includes examining, on a test basis, evidence supporting the amounts and disclosures in the financial statements and financial highlights, assessing the accounting principles used and significant estimates made by management, and evaluating the overall financial statement presentation. Our procedures included confirmation of securities owned as of December 31, 2016, by correspondence with the custodian and brokers or by other appropriate auditing procedures where replies from brokers were not received. We believe that our audits provide a reasonable basis for our opinion.
In our opinion, the financial statements and financial highlights referred to above present fairly, in all material respects, the financial position of VanEck VIP Global Hard Assets Fund (one of the series constituting VanEck VIP Trust) at December 31, 2016, the results of its operations for the year then ended, the changes in its net assets for each of the two years in the period then ended, and the financial highlights for each of the five years in the period then ended, in conformity with U.S. generally accepted accounting principles.

New York, New York
February 15, 2017
| 28 |
(unaudited)
For the 2016 fiscal year, 100% of the ordinary income dividends paid by the Fund qualified for the Corporate Dividends Received Deduction.
| 29 |
VANECK VIP TRUST
BOARD OF TRUSTEES AND OFFICERS
December 31, 2016 (unaudited)
| Trustee’s Name, Address(1) and Year of Birth | Position(s) Held With Trust, Term of Office(2) and Length of Time Served | Principal Occupation(s) During Past Five Years | Number of Portfolios In Fund Complex(3) Overseen By Trustee | Other Directorships Held Outside The Fund Complex(3) During The Past Five Years | ||||
| Independent Trustees: | ||||||||
| Jon Lukomnik 1956 (A)(G) | Trustee since March 2006 | Managing Partner, Sinclair Capital LLC (consulting firm), 2000 to present; Executive Director, Investor Responsibility Research Center Institute, 2008 to present. | 12 | Member of the Deloitte Audit Quality Advisory Committee; Chairman of the Advisory Committee of Legion Partners; Member of the Standing Advisory Group to the Public Company Accounting Oversight Board; formerly Chairman of the Board of the New York Classical Theatre; formerly Director of The Governance Fund, LLC. | ||||
| Jane DiRenzo Pigott 1957 (A)(G) | Trustee since July 2007; Currently, Chairperson of the Governance Committee | Managing Director, R3 Group LLC (consulting firm), 2002 to present. | 12 | Formerly, Director and Chair of Audit Committee of 3E Company (environmental services); formerly Director of MetLife Investment Funds, Inc. | ||||
| Wayne H. Shaner 1947 (A)(G) | Trustee since March 2006 | Managing Partner, Rockledge Partners LLC, 2003 to present (investment adviser); Public Member of the Investment Committee, Maryland State Retirement System, 1991 to 2014. | 12 | Director, The Torray Funds (1 portfolio), since 1993 (Chairman of the Board since December 2005). | ||||
| 30 |
| Trustee’s Name, Address(1) and Year of Birth | Position(s) Held With Trust, Term of Office(2) and Length of Time Served | Principal Occupation(s) During Past Five Years | Number of Portfolios In Fund Complex(3) Overseen By Trustee | Other Directorships Held Outside The Fund Complex(3) During The Past Five Years | ||||
| R. Alastair Short 1953 (A)(G) | Trustee since June 2004; Currently, Vice Chairperson of the Board and Chairperson of the Audit Committee | President, Apex Capital Corporation (personal investment vehicle), January 1988 to present; Vice Chairman, W.P. Stewart & Co., Ltd. (asset management firm), September 2007 to September 2008. | 70 | Chairman and Independent Director, EULAV Asset Management; Independent Director, Tremont offshore funds; Director, Kenyon Review; formerly Director of The Medici Archive Project. | ||||
| Richard D. Stamberger 1959 (A)(G) | Trustee since 1995; Currently, Chairperson of the Board | Director, President and CEO, SmartBrief, Inc. (business media company), 1999 to present. | 70 | Director, SmartBrief, Inc.; Director, Food and Friends, Inc. | ||||
| Robert L. Stelzl 1945 (A)(G) | Trustee since July 2007 | President, Rivas Capital, Inc. (real estate property management services company), 2004 to present; Co-Trustee, the estate of Donald Koll, 2012 to present; Trustee, Robert D. MacDonald Trust, 2015 to present; Trustee, Joslyn Family Trusts, 2003 to 2014. | 12 | Director and Chairman, Brookfield Properties, Inc. and Brookfield Residential Properties, Inc. | ||||
| (1) | The address for each Trustee and officer is 666 Third Avenue, 9th Floor, New York, New York 10017. |
| (2) | Each Trustee serves until resignation, death, retirement or removal. The Board established a mandatory retirement policy applicable to all Independent Trustees, which provides that |
| Independent Trustees shall resign from the Board on December 31 of the year such Trustee reaches the age of 75. | |
| (3) | The Fund Complex consists of VanEck Funds, VanEck VIP Trust and VanEck Vectors ETF Trust. |
| (A) | Member of the Audit Committee. |
| (G) | Member of the Governance Committee. |
| 31 |
VANECK VIP TRUST
BOARD OF TRUSTEES AND OFFICERS
December 31, 2016 (unaudited) (continued)
| Officer’s Name, Address(1) And Year of Birth | Position(s) Held With Trust | Term of Office And Length of Time Served(2) | Principal Occupations During The Past Five Years | |||
| Matthew A. Babinsky, 1983 | Assistant Vice President and Assistant Secretary | Since 2016 | Assistant Vice President and Assistant General Counsel of the Adviser, Van Eck Securities Corporation (VESC) and Van Eck Absolute Return Advisers VEARA (since 2016); Associate, Clifford Chance US LLP (October 2011 to April 2016); Officer of other investment companies advised by the Adviser. | |||
| Russell G. Brennan, 1964 | Assistant Vice President and Assistant Treasurer | Since 2008 | Assistant Vice President of the Adviser (since 2008); Officer of other investment companies advised by the Adviser. | |||
| Charles T. Cameron, 1960 | Vice President | Since 1996 | Director of Trading (since 1995) and Portfolio Manager (since 1997) for the Adviser; Officer of other investment companies advised by the Adviser. | |||
| John J. Crimmins, 1957 | Vice President, Treasurer, Chief Financial Officer and Principal Accounting Officer | Since 2009 (Treasurer); since 2012 (Vice President, Chief Financial Officer and Principal Accounting Officer) | Vice President of Portfolio Administration of the Adviser (since 2009); Vice President of Van Eck Securities Corporation (VESC) and Van Eck Absolute Return Advisers (VEARA) (since 2009); Officer of other investment companies advised by the Adviser. | |||
| Susan C. Lashley, 1955 | Vice President | Since 1998 | Vice President of the Adviser and VESC; Officer of other investment companies advised by the Adviser. | |||
| Laura I. Martínez, 1980 | Assistant Vice President and Assistant Secretary | Since 2008 | Vice President (since 2016), Associate General Counsel and Assistant Secretary of the Adviser, VESC and VEARA (since 2008); Officer of other investment companies advised by the Adviser. | |||
| James Parker, 1969 | Assistant Treasurer | Since 2014 | Manager, Portfolio Administration of the Adviser, VESC and VEARA (since 2010); Vice President of J.P. Morgan Financial Reporting and Fund Administration (2002-2010). |
| 32 |
| Officer’s Name, Address(1) And Year of Birth | Position(s) Held With Trust | Term of Office And Length of Time Served(2) | Principal Occupations During The Past Five Years | |||
| Jonathan R. Simon, 1974 | Vice President, Secretary and Chief Legal Officer | Since 2006 (Vice President and until 2014, also Assistant Secretary); since 2014 (Secretary and Chief Legal Officer) | Senior Vice President (since 2016), General Counsel and Secretary (since 2014) of the Adviser, VESC and VEARA; Associate General Counsel and Assistant Secretary of the Adviser, VESC and VEARA (2006-2014); Officer of other investment companies advised by the Adviser. | |||
| Bruce J. Smith, 1955 | Senior Vice President | Since 1985 | Senior Vice President, Chief Financial Officer, Treasurer and Controller of the Adviser, VESC and VEARA (since 1997); Director of the Adviser, VESC and VEARA (since October 2010); Officer of other investment companies advised by the Adviser. | |||
| Janet Squitieri, 1961 | Chief Compliance Officer | Since 2013 | Vice President, Global Head of Compliance of the Adviser, VESC and VEARA (since September 2013); Chief Compliance Officer and Senior Vice President of HSBC Global Asset Management North America (August 2010-September 2013); Chief Compliance Officer of Babcock & Brown LP North America (July 2008-June 2010). | |||
| Jan F. van Eck, 1963 | Chief Executive Officer and President | Since 2005 (serves as Chief Executive Officer and President since 2010, prior thereto, served as Executive Vice President) | President, Director and Owner of the Adviser (since July 1993); Executive Vice President of the Adviser (January 1985-October 2010); Director (since November 1985), President (since October 2010) and Executive Vice President (June 1991-October 2010) of VESC; Director and President of VEARA (since May 1997); Trustee (since 2006), President and Chief Executive Officer of Market Vectors ETF Trust (since 2009); Officer of other investment companies advised by the Adviser. | |||
| (1) | The address for each Executive Officer is 666 Third Avenue, 9th Floor, New York, NY 10017. |
| (2) | Officers are elected yearly by the Board. |
| 33 |
This report is intended for the Fund’s shareholders. It may not be distributed to prospective investors unless it is preceded or accompanied by the Fund’s prospectus, which includes more complete information. An investor should consider the investment objective, risks, and charges and expenses of the Fund carefully before investing. The prospectus contains this and other information about the investment company. Please read the prospectus carefully before investing.
Additional information about the VanEck VIP (the “Trust”) Board of Trustees/Officers and a description of the policies and procedures the Trust uses to determine how to vote proxies relating to portfolio securities are provided in the Statement of Additional Information. The Statement of Additional Information and information regarding how the Trust voted proxies relating to portfolio securities during the most recent twelve month period ending June 30 is available, without charge, by calling 800.826.2333, or by visiting vaneck.com, or on the Securities and Exchange Commission’s website at https://www.sec.gov.
The Trust files its complete schedule of portfolio holdings with the Securities and Exchange Commission for the first and third quarters of each fiscal year on Form N-Q. The Trust’s Form N-Qs are available on the Commission’s website at https://www.sec.gov and may be reviewed and copied at the Commission’s Public Reference Room in Washington, D.C. Information on the operation of the Public Reference Room may be obtained by calling 202.942.8090. The Fund’s complete schedule of portfolio holdings is also available by calling 800.826.2333 or by visiting vaneck.com.

| Investment Adviser: | Van Eck Associates Corporation | |
| Distributor: | Van Eck Securities Corporation | |
| 666 Third Avenue, New York, NY 10017 | ||
| vaneck.com | ||
| Account Assistance: | 800.544.4653 | VIPGHAAR |
 | ||
| ANNUAL REPORT | ||
| December 31, 2016 | ||
VanEck VIP Trust
VanEck VIP Long/Short Equity Index Fund
| 800.826.2333 | vaneck.com |
The information contained in this shareholder letter represents the personal opinions of the investment team members and may differ from those of other portfolio managers or of the firm as a whole. This information is not intended to be a forecast of future events, a guarantee of future results or investment advice. Also, unless otherwise specifically noted, any discussion of the Fund’s holdings, the Fund’s performance, and the views of the investment team members are as of December 31, 2016.
(unaudited)
| FACTS | WHAT DOES VANECK DO WITH YOUR PERSONAL INFORMATION? | |
| Why? | Financial companies choose how they share your personal information. Federal law gives consumers the right to limit some but not all sharing. Federal law also requires us to tell you how we collect, share, and protect your personal information. Please read this notice carefully to understand what we do. | |
| What? | The types of personal information we collect and share depend on the product or service you have with us. This information can include: | |
| ■ Social Security number and account balances | ||
| ■ assets and payment history | ||
| ■ risk tolerance and transaction history | ||
| How? | All financial companies need to share customers’ personal information to run their everyday business. In the section below, we list the reasons financial companies can share their customers’ personal information; the reasons Van Eck chooses to share; and whether you can limit this sharing. | |
| Reasons we can share your personal information | Does VanEck share? | Can you limit this sharing? | To limit our sharing | Questions? |
| For our everyday business purposes—such as to process your transactions, maintain your account(s), respond to court orders and legal investigations, or report to credit bureaus | Yes | No | Call us at 800.826.2333.
Please note:
However, you can contact us at any time to limit our sharing. | 800.826.2333 |
| For our marketing purposes—to offer our products and services to you | Yes | No | ||
| For joint marketing with other financial companies | Yes | No | ||
| For our affiliates’ everyday business purposes—information about your transactions and experiences | Yes | No | ||
| For our affiliates’ everyday business purposes—information about your creditworthiness | No | We don’t share | ||
| For our affiliates to market to you | Yes | Yes | ||
| For nonaffiliates to market to you | No | We don’t share |
PRIVACY NOTICE
(unaudited) (continued)
| Who we are | ||
| Who is providing this notice? | Van Eck Associates Corporation, its affiliates and funds sponsored or managed by Van Eck (collectively “VanEck”). | |
| What we do | ||
| How does VanEck protect my personal information? | To protect your personal information from unauthorized access and use, we use security measures that comply with federal law. These measures include computer safeguards and secured files and buildings. | |
| How does VanEck collect my personal information? | We collect your personal information, for example, when you | |
| ■ open an account or give us your income information | ||
| ■ provide employment information or give us your contact information | ||
| ■ tell us about your investment or retirement portfolio | ||
| We also collect your personal information from others, such as credit bureaus, affiliates, or other companies. | ||
| Why can’t I limit all sharing? | Federal law gives you the right to limit only | |
| ■ sharing for affiliates’ everyday business purposes—information about your creditworthiness | ||
| ■ affiliates from using your information to market to you | ||
| ■ sharing for nonaffiliates to market to you | ||
| State laws and individual companies may give you additional rights to limit sharing. See below for more on your rights under state law. | ||
| What happens when I limit sharing for an account I hold jointly with someone else? | Your choices will apply to everyone on your account—unless you tell us otherwise. | |
| Definitions | ||
| Affiliates | Companies related by common ownership or control. They can be financial and nonfinancial companies. | |
| ■ Our affiliates include companies with a VanEck name such as Van Eck Securities Corporation and others such as MV Index Solutions GmbH. | ||
| Nonaffiliates | Companies not related by common ownership or control. They can be financial and nonfinancial companies. | |
| ■ VanEck does not share with nonaffiliates so they can market to you. | ||
| Joint marketing | A formal agreement between nonaffiliated financial companies that together market financial products or services to you. | |
| ■ Our joint marketing partners include financial services companies. | ||
| Other important information | ||
| California Residents—In accordance with California law, we will not share information we collect about California residents with nonaffiliates except as permitted by law, such as with the consent of the customer or to service the customer’s accounts. We also will limit the sharing of information about you with our affiliates to the extent required by applicable California law. Vermont Residents—In accordance with Vermont law, we will not share information we collect about Vermont residents with nonaffiliates except as permitted by law, such as with the consent of the customer or to service the customer’s accounts. We will not share creditworthiness information about Vermont residents among VanEck’s affiliates except with the authorization or consent of the Vermont resident. | ||
VANECK VIP LONG/SHORT EQUITY INDEX FUND
December 31, 2016 (unaudited)
Dear Shareholder:
The VanEck VIP Long/Short Equity Index Fund (the “Fund”) gained 2.62% (Class S shares) for the 12 month period ended December 31, 2016. The Fund’s benchmark, the MVISTM North America Long/Short Equity Index1 (the “Index”) gained 4.04% for the same period. The annualized daily volatility of both the Fund and the Index was just over 5%.
The Index uses a proprietary statistical model to identify a weighted set of exchange-traded funds (ETFs) that seeks to reproduce the performance of a universe of North America-focused long/short equity hedge funds.2 Each month, the Fund allocates its assets to long and short positions in the ETFs that the Index model selects. As the Index is constructed so that the sum of its gross long and short exposures equals 100%, the Fund never uses any leverage.3
Fund Review
During the year, the Index model made allocations to 21 different ETFs, of which fifteen track equity indices, four hold debt securities, one tracks the price of silver, and one tracks the value of the U.S. dollar relative to other major currencies. Twelve of the equity ETFs invest in a combination of value and growth stocks, while the other three invest exclusively in growth stocks. The table below summarizes the gross and net exposures of the Fund in 2016.*
| Average Gross Exposure | Average Net Exposure | ||||||||||||||||||||||||||
| Long | Short | Long | Short | ||||||||||||||||||||||||
| Months | Exposure | Months | Exposure | Months | Exposure | Months | Exposure | ||||||||||||||||||||
| Equity | 12 | 40.41 | % | 6 | -14.49 | % | 12 | 33.17 | % | 0 | 0.00 | % | |||||||||||||||
| Debt | 4 | 26.67 | % | 4 | -18.30 | % | 3 | 33.33 | % | 4 | -16.63 | % | |||||||||||||||
| Commodity | 0 | 0.00 | % | 1 | -0.92 | % | 0 | 0.00 | % | 1 | -0.92 | % | |||||||||||||||
| Currency | 1 | 15.63 | % | 0 | 0.00 | % | 1 | 15.63 | % | 0 | 0.00 | % | |||||||||||||||
| Cash and T-Bills | 12 | 62.81 | % | 0 | 0.00 | % | 12 | 62.81 | % | 0 | 0.00 | % | |||||||||||||||
| * | The fund rebalances its positions at the end of each month. In any given month it can have long, short or no exposure to various asset classes. Gross exposures are the total exposures of each type. Net exposures are computed as long minus short. The above table reports the number of months for which the fund had either long or short gross or net exposures to each asset class in which it invested at some time during the year. |
Source: VanEck. Any information regarding model composition, portfolio composition methodology and investment process or limits reflects current implementation practices, and this implementation may be modified or changed by VanEck at any time in its sole discretion without notice.
| 1 |
VANECK VIP LONG/SHORT EQUITY INDEX FUND
(unaudited) (continued)
In response to the elevated sector rotation and concomitant volatility of the U.S. equity markets during the year, the model positioned the Fund conservatively throughout, with an average holding of cash and U.S. Treasury bills of 62.81%. As shown in the table, the Fund maintained moderate gross and net long exposures to equity ETFs throughout the year, while taking gross short positions in six months of the year. As an alternative to volatile equities, the Fund took both long and short positions in debt ETFs for several months of the year. It also held a small short position in the spot silver ETF (SLV) in November and a long U.S. dollar position in December.
The chart below shows more detail on the Fund’s exposures in 2016. Specifically, it highlights the model’s bias throughout the year towards growth over value in its selection of equity ETFs. This occurred primarily because of the greater volatility of the value sector generally and of energy and energy-related ETFs in particular. While this dampened returns, it succeeded in its primary objectives of low volatility and capital preservation.
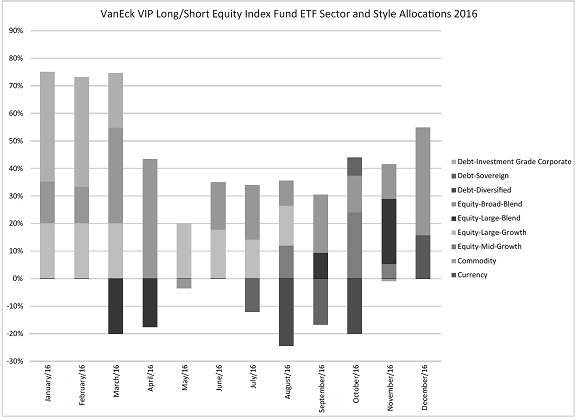
Source: VanEck; MV Index Solutions; Bloomberg LP. Past performance is no guarantee of future results; current performance may be lower or higher than the performance data quoted. Index performance is not illustrative of fund performance. Investors cannot invest directly in an Index.
| 2 |
Outlook
The model favors lower volatility ETFs because it prioritizes capital preservation over non-risk-adjusted returns. The extreme volatility of energy markets in 2015 and 2016 and the rapid sector rotation it engendered drove the model’s steady decline in net exposure over the period. Looking forward, equity net exposure should remain low as long as these conditions persist and rise if they moderate.
The Fund is subject to market risk, including possible loss of principal. Because the Fund is a “fund-of funds,” an investor will indirectly bear the principal risks of the exchange-traded products in which it invests, including but not limited to, risks associated with smaller companies, foreign securities, emerging markets, debt securities, commodities and derivatives. With respect to derivatives, the use of leverage may magnify losses. The Fund will bear its share of the fees and expenses of the exchange traded products. Consequently, an investment in the Fund entails more direct and indirect expenses than a direct investment in an exchange-traded product. Because the Fund invests in exchange-traded products, it is subject to additional risks that do not apply to conventional mutual funds, including the risks that the market price of an exchange-traded product’s shares may be higher or lower than the value of its underlying assets, there may be a lack of liquidity in the shares of the exchange-traded product, or trading may be halted by the exchange on which they trade. Debt securities may be subject to credit risk and interest rate risk. Investments in debt securities typically decrease in value when interest rates rise. The Fund may actively engage in short selling, which entails special risks. If the Fund makes short sales in securities that increase in value, the fund will lose value. Because the Adviser relies heavily on proprietary quantitative models, the Fund is also subject to model and data risk. Please see the prospectus for information on these and other risk considerations.
| 3 |
VANECK VIP LONG/SHORT EQUITY INDEX FUND
(unaudited) (continued)
We look forward to your participation in the VanEck VIP Long/Short Equity Index Fund and to helping you meet your investment needs in the future.
 |  |
| Marc S. Freed Portfolio Manager | David Schassler Deputy Portfolio Manager |
| January 23, 2017 |
Represents the opinions of the investment adviser. Past performance is no guarantee of future results. Not intended to be a forecast of future events, a guarantee of future results or investment advice. Current market conditions may not continue.
All indices are unmanaged and include the reinvestment of all dividends, but do not reflect the payment of transaction costs, advisory fees or expenses that are associated with an investment in the Fund. An index’s performance is not illustrative of the Fund’s performance. Indices are not securities in which investments can be made. Results reflect past performance and do not guarantee future results.
| 1 | MVISTM North America Long/Short Equity Index (MVLSNATR) is constructed using a rules-based process and seeks to capture the performance of a group of long/short equity hedge funds that focus on North American companies. This is done by identifying an initial universe of North American focused long/short equity hedge funds, and then eliminating outlier hedge funds, typically eliminating more of the underperforming outlier hedge funds, from the initial universe with a patented True Alpha® (True a®) metric that scores and ranks funds based on their risk-adjusted performance over a twelve month period. |
| 2 | “North American” means U.S. and Canadian exchanges only. |
| 3 | The Fund never holds any positions on margin, i.e., it never borrows money to pay for its positions. It also does not lend its holdings to other investors. |
| 4 |
December 31, 2016 (unaudited)
| This chart shows the value of a hypothetical $10,000 investment in the Fund over the past 10 fiscal year periods or since inception (for funds lacking 10-year records). The result is compared with the Fund’s benchmark, and may include a broad-based market index. | Hypothetical Growth of $10,000 (Since Inception: Class S) |
| Average Annual Total Return 12/31/16 | Fund Class S | MVLSNATR | S&P 500 | ||||||
| One Year | 2.62 | % | 4.04 | % | 11.96 | % | |||
| Life* | 0.27 | % | 1.50 | % | 7.28 | % | |||
| * | Inception date for the Fund was 9/17/14 (Class S). |
The performance quoted represents past performance. Past performance is no guarantee of future results; current performance may be lower or higher than the performance data quoted. Performance information reflects temporary waivers of expenses and/or fees and does not include insurance/annuity fees and expenses. Investment returns would have been reduced had these fees/expenses been included. Investment return and the value of the shares of the Fund will fluctuate so that an investor’s shares, when redeemed, may be worth more or less than their original cost. Fund returns assume that dividends and capital gains distributions have been reinvested in the Fund at NAV. Performance information current to the most recent month end is available by calling 800.826.2333 or by visiting vaneck.com.
The Fund is only available to life insurance and annuity companies to fund their variable annuity and variable life insurance products. These contracts offer life insurance and tax benefits to the beneficial owners of the Fund. Your insurance or annuity company charges fees and expenses for these benefits that are not reflected in this report or in the Fund’s performance, since they are not direct expenses of the Fund. For insurance products, performance figures do not reflect the cost for insurance and if they did, the performance shown would be significantly lower. A review of your particular life and/or annuity contract will provide you with much greater detail regarding these costs and benefits.
All indices listed are unmanaged indices and include the reinvestment of all dividends, but do not reflect the payment of transaction costs, advisory fees or expenses that are associated with an investment in the Fund. An index’s performance is not illustrative of the Fund’s performance. Indices are not securities in which investments can be made.
MVIS™ North America Long/Short Equity Index (MVLSNATR) seeks to capture the systematic returns (beta) of North American focused long/short equity hedge funds. The index employs a patented rating and ranking system that filters out funds with low beta as compared to their hedge fund peer group. The index is constructed using transparent, liquid ETFs to produce hedge fund-style returns.
The S&P 500® Index consists of 500 widely held common stocks covering industrial, utility, financial and transportation sectors.
| 5 |
VANECK VIP LONG/SHORT EQUITY INDEX FUND
EXPLANATION OF EXPENSES
(unaudited)
As a shareholder of the Fund, you incur two types of costs: (1) transaction costs, including program fees on purchase payments; and (2) ongoing costs, including management fees and other Fund expenses. This disclosure is intended to help you understand the ongoing costs (in dollars) of investing in the Fund and to compare these costs with the ongoing costs of investing in other mutual funds.
The disclosure is based on an investment of $1,000 invested at the beginning of the period and held for the entire period, July 1, 2016 to December 31, 2016.
Actual Expenses
The first line in the table below provides information about account values and actual expenses. You may use the information in this line, together with the amount you invested, to estimate the expenses that you paid over the period. Simply divide your account value by $1,000 (for example, an $8,600 account value divided by $1,000 = 8.6), then multiply the result by the number in the first line under the heading entitled “Expenses Paid During the Period.”
Hypothetical Example for Comparison Purposes
The second line in the table below provides information about hypothetical account values and hypothetical expenses based on the Fund’s actual expense ratio and an assumed rate of return of 5% per year before expenses, which is not the Fund’s actual return. The hypothetical account values and expenses may not be used to estimate the actual ending account balance or expenses you paid for the period. You may use this information to compare the ongoing costs of investing in the Fund and other funds. To do so, compare this 5% hypothetical example with the 5% hypothetical examples that appear in the shareholder reports of other funds.
Please note that the expenses shown in the table are meant to highlight your ongoing costs only and do not reflect any transactional costs, such as fees on purchase payments. Therefore, the second line of the table is useful in comparing ongoing costs only, and will not help you determine the relative costs of owning different funds. In addition, if these transactional costs were included, your costs would have been higher.
| 6 |
| Beginning Account Value July 1, 2016 | Ending Account Value December 31, 2016 | Expenses Paid During the Period* July 1, 2016 - December 31, 2016 | |||||||
| VanEck VIP Long/Short Equity Index Fund | |||||||||
| Actual | $1,000.00 | $1,026.60 | $6.11 | ||||||
| Hypothetical** | $1,000.00 | $1,019.10 | $6.09 | ||||||
| * | Expenses are equal to the Fund’s annualized expense ratio (for the six months ended December 31, 2016), of 1.20%, multiplied by the average account value over the period, multiplied by the number of days in the most recent fiscal half year divided by the number of the days in the fiscal year (to reflect the one-half year period). |
| ** | Assumes annual return of 5% before expenses |
| 7 |
VANECK VIP LONG/SHORT EQUITY INDEX FUND
December 31, 2016
| Number | |||||||
| of Shares | Value | ||||||
| EXCHANGE TRADED FUNDS: 48.8% | |||||||
| 1,064 | iShares Core S&P Small-Cap ETF | $ | 146,321 | ||||
| 9,229 | PowerShares DB US Dollar Index Bullish Fund * | 244,199 | |||||
| 2,728 | SPDR S&P Bank ETF | 118,586 | |||||
| 1,861 | Vanguard Information Technology ETF | 226,112 | |||||
| Total Exchange Traded Funds (Cost: $725,221) | 735,218 | ||||||
| Principal | |||||||
| Amount | |||||||
| SHORT-TERM INVESTMENTS: 46.0% | |||||||
| Government Obligation: 39.8% (Cost: $599,810) | |||||||
| $ | 600,000 | United States Treasury Bill (a) 0.36%, 02/02/17 | 599,810 | ||||
| Number | |||||||
| of Shares | Value | ||||||
| Money Market Fund: 6.2% (Cost: $94,149) | |||||||
| 94,149 | AIM Treasury Portfolio — Institutional Class | $ | 94,149 | ||||
| Total Short-term Investments: 46.0% (Cost: $693,959) | 693,959 | ||||||
| Total Investments: 94.8% (Cost: $1,419,180) | 1,429,177 | ||||||
| Other assets less liabilities: 5.2% | 78,941 | ||||||
| NET ASSETS: 100.0% | $ | 1,508,118 | |||||
| * | Non-income producing |
(a) All or a portion of this security is segregated to meet minimum reserve requirements with the broker for securities sold short transactions.
| Summary of Investments by Sector (unaudited) | % of Investments | Value | ||||||
| Exchange Traded Funds | 51.4 | % | $ | 735,218 | ||||
| Government | 42.0 | 599,810 | ||||||
| Money Market Fund | 6.6 | 94,149 | ||||||
| 100.0 | % | $ | 1,429,177 | |||||
The summary of inputs used to value the Fund’s investments as of December 31, 2016 is as follows:
| Level 2 | Level 3 | ||||||||||||||||
| Level 1 | Significant | Significant | |||||||||||||||
| Quoted | Observable | Unobservable | |||||||||||||||
| Prices | Inputs | Inputs | Value | ||||||||||||||
| Exchange Traded Funds | $ | 735,218 | $ | — | $ | — | $ | 735,218 | |||||||||
| Short-term Investments | |||||||||||||||||
| Government Obligation | — | 599,810 | — | 599,810 | |||||||||||||
| Money Market Fund | 94,149 | — | — | 94,149 | |||||||||||||
| Total | $ | 829,367 | $ | 599,810 | $ | — | $ | 1,429,177 | |||||||||
There were no transfers between levels during the year ended December 31, 2016.
See Notes to Financial Statements
| 8 |
STATEMENT OF ASSETS AND LIABILITIES
December 31, 2016
| Assets: | ||||
| Investments, at value (Cost $1,419,180) | $ | 1,429,177 | ||
| Receivables: | ||||
| Investments sold | 274,020 | |||
| Due from Adviser | 1,547 | |||
| Dividends | 153 | |||
| Prepaid expenses | 35 | |||
| Total assets | 1,704,932 | |||
| Liabilities: | ||||
| Payables: | ||||
| Investments purchased | 146,483 | |||
| Shares of beneficial interest redeemed | 23 | |||
| Due to broker | 21,331 | |||
| Due to Distributor | 321 | |||
| Deferred Trustee fees | 537 | |||
| Accrued expenses | 28,119 | |||
| Total liabilities | 196,814 | |||
| NET ASSETS | $ | 1,508,118 | ||
| Shares of beneficial interest outstanding | 60,972 | |||
| Net asset value, redemption and offering price per share | $ | 24.73 | ||
| Net Assets consist of: | ||||
| Aggregate paid in capital | $ | 1,515,373 | ||
| Net unrealized appreciation | 9,997 | |||
| Accumulated net investment loss | (537 | ) | ||
| Accumulated net realized loss | (16,715 | ) | ||
| $ | 1,508,118 |
See Notes to Financial Statements
| 9 |
VANECK VIP LONG/SHORT EQUITY INDEX FUND
For the Year Ended December 31, 2016
| Income: | ||||||||
| Dividends | $ | 8,986 | ||||||
| Expenses: | ||||||||
| Management fees | $ | 9,109 | ||||||
| Distribution fees | 3,503 | |||||||
| Transfer agent fees | 13,680 | |||||||
| Custodian fees | 1,368 | |||||||
| Professional fees | 22,943 | |||||||
| Reports to shareholders | 15,125 | |||||||
| Insurance | 73 | |||||||
| Trustees’ fees and expenses | 603 | |||||||
| Dividends on securities sold short | 2,768 | |||||||
| Other | 1,953 | |||||||
| Total expenses | 71,125 | |||||||
| Waiver of management fees | (9,109 | ) | ||||||
| Expenses assumed by the Adviser | (45,931 | ) | ||||||
| Net expenses | 16,085 | |||||||
| Net investment loss | (7,099 | ) | ||||||
| Net realized gain (loss) on: | ||||||||
| Investments | 54,590 | |||||||
| Securities sold short | (12,367 | ) | ||||||
| Net realized gain | 42,223 | |||||||
| Net change in unrealized appreciation (depreciation) on: | ||||||||
| Investments | 3,845 | |||||||
| Securities sold short | 8 | |||||||
| Net change in unrealized appreciation (depreciation) | 3,853 | |||||||
| Net Increase in Net Assets Resulting from Operations | $ | 38,977 |
See Notes to Financial Statements
| 10 |
STATEMENT OF CHANGES IN NET ASSETS
| Year Ended December 31, 2016 | Year Ended December 31, 2015 | |||||||
| Operations: | ||||||||
| Net investment income (loss) | $ | (7,099 | ) | $ | 1,747 | |||
| Net realized gain (loss) | 42,223 | (55,317 | ) | |||||
| Net change in unrealized appreciation (depreciation) | 3,853 | 14,593 | ||||||
| Net increase (decrease) in net assets resulting from operations | 38,977 | (38,977 | ) | |||||
| Dividends and Distributions to shareholders from: | ||||||||
| Net investment income | (2,686 | ) | (2,219 | ) | ||||
| Net realized capital gains | — | (19,388 | ) | |||||
| Total dividends and distributions | (2,686 | ) | (21,607 | ) | ||||
| Share transactions*: | ||||||||
| Proceeds from sale of shares | 1,242,320 | 305,328 | ||||||
| Reinvestment of dividends and distributions | 2,686 | 21,607 | ||||||
| Cost of shares redeemed | (1,044,578 | ) | (23,683 | ) | ||||
| Net increase in net assets resulting from share transactions | 200,428 | 303,252 | ||||||
| Total increase in net assets | 236,719 | 242,668 | ||||||
| Net Assets: | ||||||||
| Beginning of year | 1,271,399 | 1,028,731 | ||||||
| End of year (including undistributed (accumulated) net investment income (loss) of $(537) and $2,426, respectively) | $ | 1,508,118 | $ | 1,271,399 | ||||
| * Shares of beneficial interest issued, reinvested and redeemed (unlimited number of $.001 par value shares authorized): | ||||||||
| Shares sold | 51,877 | 12,312 | ||||||
| Shares reinvested | 113 | 887 | ||||||
| Shares redeemed | (43,663 | ) | (975 | ) | ||||
| Net increase | 8,327 | 12,224 | ||||||
See Notes to Financial Statements
| 11 |
VANECK VIP LONG/SHORT EQUITY INDEX FUND
For a share outstanding throughout each year:
| Year Ended December 31, | For the Period September 17, 2014 (a) through December 31, | ||||||||||||||
| 2016 | 2015 | 2014 | |||||||||||||
| Net asset value, beginning of period | $ | 24.15 | $ | 25.45 | $ | 25.15 | |||||||||
| Income from investment operations: | |||||||||||||||
| Net investment income (loss) | (0.12 | ) | 0.03 | 0.05 | |||||||||||
| Net realized and unrealized gain (loss)on investments | 0.75 | (0.82 | ) | 0.25 | |||||||||||
| Total from investment operations | 0.63 | (0.79 | ) | 0.30 | |||||||||||
| Less dividends and distributions from: | |||||||||||||||
| Net investment income | (0.05 | ) | (0.05 | ) | — | ||||||||||
| Net realized capital gains | — | (0.46 | ) | — | |||||||||||
| Total dividends and distributions | (0.05 | ) | (0.51 | ) | — | ||||||||||
| Net asset value, end of period | $ | 24.73 | $ | 24.15 | $ | 25.45 | |||||||||
| Total return (b) | 2.62 | % | (3.10 | )% | 1.19 | %(c) | |||||||||
| Ratios/Supplemental Data | |||||||||||||||
| Net assets, end of period (000’s) | $ | 1,508 | $ | 1,271 | $ | 1,029 | |||||||||
| Ratio of gross expenses to average net assets (e) | 5.07 | % | 8.12 | % | 21.70 | %(d) | |||||||||
| Ratio of net expenses to average net assets (e) | 1.15 | % | 1.06 | % | 1.53 | %(d) | |||||||||
| Ratio of net expenses, excluding dividends on securities sold short, to average net assets (e) | 0.95 | % | 0.95 | % | 0.95 | %(d) | |||||||||
| Ratio of net investment income (loss) to average net assets (e) | (0.51 | )% | 0.15 | % | 0.73 | %(d) | |||||||||
| Portfolio turnover rate | 798 | % | 454 | % | 276 | %(c) | |||||||||
| (a) | Commencement of operations |
| (b) | Total return is calculated assuming an initial investment made at the net asset value at the beginning of the period, reinvestment of any dividends and distributions at net asset value on the dividend/distribution payment date and a redemption at the net asset value on the last day of the period. The return does not reflect the deduction of taxes that a shareholder would pay on Fund dividends/distributions or the redemption of Fund shares. |
| (c) | Not annualized |
| (d) | Annualized |
| (e) | The ratios presented do not reflect the Fund’s proportionate share of income and expenses from the Fund’s investments in underlying Funds |
See Notes to Financial Statements
| 12 |
December 31, 2016
Note 1—Fund Organization—VanEck VIP Trust (the “Trust”) (formerly Van Eck VIP Trust) is registered under the Investment Company Act of 1940, as amended, as an open-end management investment company. The Trust was organized as a Massachusetts business trust on January 7, 1987. The VanEck VIP Long/Short Equity Index Fund (the “Fund”) is a non-diversified series of the Trust and was created to provide investors with the opportunity to purchase a security representing a proportionate undivided interest in a portfolio of securities, consisting of substantially all of the same weighting in the MVIS North America Long/Short Equity Index, which is published by MV Index Solutions GmbH, a wholly-owned subsidiary of Van Eck Associates Corporation (the “Adviser”). The Fund currently offers a single class of shares: Class S Shares.
Note 2—Significant Accounting Policies—The preparation of financial statements in conformity with U.S. generally accepted accounting principles (“GAAP”) requires management to make estimates and assumptions that affect the reported amounts and disclosures in the financial statements. Actual results could differ from those estimates.
The Fund is an investment company and is following accounting and reporting requirements of Accounting Standards Codification (“ASC”) 946 Financial Services-Investment Companies.
The following is a summary of significant accounting policies followed by the Fund.
| A. | Security Valuation—The Fund values its investments in securities and other assets and liabilities at fair value daily. Fair value is the price that would be received to sell an asset or paid to transfer a liability in an orderly transaction between market participants on the measurement date. Exchange traded funds as well as closed-end publicly listed fund investments are valued at their official market closing price and are categorized as Level 1 in the fair value hierarchy (as described below). Money market fund investments are valued at net asset value and are classified as Level 1 in the fair value hierarchy. Securities traded on national exchanges or traded on the NASDAQ National Market System are valued at the last sales price as reported at the close of each business day. Securities traded on the NASDAQ Stock Market are valued at the NASDAQ official closing price. Over-the-counter securities not included in the NASDAQ National Market System and listed securities for which no sale was reported are valued at the mean of the bid and ask prices. To the extent these securities are actively traded they are categorized as Level 1 in the fair value hierarchy. Short-term obligations with more than sixty days |
| 13 |
VANECK VIP LONG/SHORT EQUITY INDEX FUND
NOTES TO FINANCIAL STATEMENTS
(continued)
remaining to maturity are valued at market value. Short-term obligations with sixty days or less to maturity are valued at amortized cost, which with accrued interest approximates market value. Securities for which quotations are not readily available are stated at fair value as determined by the Pricing Committee of the Adviser. The Pricing Committee provides oversight of the Fund’s valuation policies and procedures, which are approved by the Fund’s Board of Trustees. Among other things, these procedures allow the Fund to utilize independent pricing services, quotations from securities dealers, and other market sources to determine fair value. The Pricing Committee convenes regularly to review the fair value of financial instruments for which market prices are not readily available. The Pricing Committee employs various methods for calibrating the valuation approaches utilized to determine fair value, including a regular review of key inputs and assumptions, transactional back-testing and disposition analysis.
Certain factors such as economic conditions, political events, market trends, the nature of and duration of any restrictions on disposition, trading in similar securities of the issuer or comparable issuers and other security specific information are used to determine the fair value of these securities. Depending on the relative significance of valuation inputs, these securities may be classified either as Level 2 or Level 3 in the fair value hierarchy. The price which the Fund may realize upon sale of an investment may differ materially from the value presented in the Schedule of Investments.
The Fund utilizes various methods to measure the fair value of its investments on a recurring basis, which includes a hierarchy that prioritizes inputs to valuation methods used to measure fair value. The fair value hierarchy gives highest priority to unadjusted quoted prices in active markets for identical assets and liabilities (Level 1 measurements) and the lowest priority to unobservable inputs (Level 3 measurements). The inputs or methodologies used for valuing securities are not necessarily an indication of the risk associated with investing in those securities. The transfers between levels of the fair value hierarchy assume the financial instruments were transferred at the beginning of the reporting period. The three levels of the fair value hierarchy are described below:
Level 1 – Quoted prices in active markets for identical securities.
Level 2 – Significant observable inputs (including quoted prices for similar securities, interest rates, prepayment speeds, credit risk, etc.).
Level 3 – Significant unobservable inputs (including the Fund’s own assumptions in determining the fair value of investments).
| 14 |
A summary of the inputs, the levels used to value the Fund’s investments, and transfers between levels are located in the Schedule of Investments. Additionally, tables that reconcile the valuation of the Fund’s Level 3 investments and that present additional information about valuation methodologies and unobservable inputs, if applicable, are located in the Schedule of Investments.
| B. | Federal Income Taxes—It is the Fund’s policy to comply with the provisions of the Internal Revenue Code applicable to regulated investment companies and to distribute all of its taxable income to its shareholders. Therefore, no federal income tax provision is required. |
| C. | Dividends and Distributions to Shareholders—Dividends to shareholders from net investment income and distributions from net realized capital gains, if any, are declared and paid annually. Income dividends and capital gain distributions are determined in accordance with U.S. income tax regulations, which may differ from such amounts determined in accordance with GAAP. |
| D. | Securities Sold Short—A short sale occurs when a Fund sells a security, which it does not own, by borrowing it from a broker. Proceeds from securities sold short are reported as liabilities on the Statement of Assets and Liabilities and are marked to market daily in accordance with the fair value methodology described in Note 2A. Gains and losses are classified as realized when short positions are closed. In the event that the value of the security that the Fund sold short declines, the Fund will gain as it repurchases the security in the market at the lower price. If the price of the security increases, the Fund will suffer a loss, as it will have to repurchase the security at the higher price. Short sales may incur higher transaction costs than regular securities transactions. Dividends and interest on short sales are recorded as an expense by the Fund on the ex-dividend date or interest payment date, respectively. Cash as collected is deposited in a segregated account, maintained by the Fund, for its open short sales. Until the Fund replaces the borrowed security, the Fund maintains securities or permissible liquid assets in a segregated account with a broker or custodian sufficient to cover its short positions. At December 31, 2016, the Fund held no open short positions. |
| E. | Restricted Securities—The Fund may invest in securities that are subject to legal or contractual restrictions on resale. These securities generally may be resold in transactions exempt from registration or to the public if the securities are registered. Disposal of these securities may involve time-consuming negotiations and expense, and prompt sale at an acceptable |
| 15 |
VANECK VIP LONG/SHORT EQUITY INDEX FUND
NOTES TO FINANCIAL STATEMENTS
(continued)
price may be difficult. Information regarding restricted securities, if any, is included at the end of the Fund’s Schedule of Investments.
| F. | Use of Derivative Instruments—The Fund may make investments in derivative instruments, including, but not limited to, options, futures, swaps and other derivatives relating to foreign currency transactions. A derivative is an instrument whose value is derived from underlying assets, indices, reference rates or a combination of these factors. Derivative instruments may be privately negotiated contracts (often referred to as over the counter (“OTC”) derivatives) or they may be listed and traded on an exchange. Derivative contracts may involve future commitments to purchase or sell financial instruments or commodities at specified terms on a specified date, or to exchange interest payment streams or currencies based on a notional or contractual amount. Derivative instruments may involve a high degree of financial risk. The use of derivative instruments also involves the risk of loss if the investment adviser is incorrect in its expectation of the timing or level of fluctuations in securities prices, interest rates or currency prices. Investments in derivative instruments also include the risk of default by the counterparty, the risk that the investment may not be liquid and the risk that a small movement in the price of the underlying security or benchmark may result in a disproportionately large movement, unfavorable or favorable, in the price of the derivative instrument. The Fund held no derivative instruments during the year ended December 31, 2016. |
| G. | Other—Security transactions are accounted for on trade date. Dividend income is recorded on the ex-dividend date. Interest income, including amortization of premiums and discounts, is accrued as earned. Realized gains and losses are calculated on the identified cost basis. |
In the normal course of business, the Fund enters into contracts that contain a variety of general indemnifications. The Fund’s maximum exposure under these agreements is unknown as this would involve future claims that may be made against the Fund that have not yet occurred. However, the Adviser believes the risk of loss under these arrangements to be remote.
Note 3—Investment Management and Other Agreements—The Adviser is the investment adviser to the Fund. The Adviser receives a management fee, calculated daily and payable monthly based on annual rate of 0.65% of the Fund’s average daily net assets. The Adviser has agreed, until at least May 1, 2017, to voluntarily waive management fees and assume expenses to prevent the Fund’s total annual operating expenses (excluding acquired fund fees and expenses, interest expense, trading expenses, dividend and interest payments on securities sold short, taxes and extraordinary expenses) from exceeding
| 16 |
0.95% of the Fund’s average daily net assets. For the year ended December 31, 2016, the Adviser waived management fees in the amount of $9,109 and assumed other expenses of $45,931.
In addition, Van Eck Securities Corporation, an affiliate of the Adviser, acts as the Fund’s distributor (the “Distributor”). Certain officers and trustees of the Trust are officers, directors or stockholders of the Adviser and Distributor.
Note 4—12b-1 Plan of Distribution—The Trust and the Distributor are parties to a distribution agreement dated May 1, 2006. The Fund has adopted a Distribution Plan (the “Plan”) in accordance with Rule 12b-1 under the 1940 Act. Pursuant to the Plan, the Fund is authorized to incur distribution expenses which will principally be payments to securities dealers who have sold shares and serviced shareholder accounts and payments to the Distributor for reimbursement of other actual promotion and distribution expenses incurred by the Distributor on behalf of the Fund. The amount paid in any one year is 0.25% of average daily net assets.
Note 5—Investments—For the year ended December 31, 2016, the cost of purchases and proceeds from sales of investments, excluding U.S. government securities and short-term obligations, aggregated to $4,020,422 and $4,352,405, respectively. Proceeds of short sales and the cost of purchases of short sale covers aggregated to $1,985,001 and $2,024,946, respectively.
Note 6—Income Taxes—For Federal income tax purposes, the identified cost of investments owned at December 31, 2016 was $1,419,464 and net unrealized appreciation aggregated to $9,713, of which $9,997 related to appreciated securities and $284 related to depreciated securities.
At December 31, 2016, the components of accumulated earnings, on a tax basis, were as follows:
| Undistributed ordinary income | $ | — | ||
| Accumulated capital losses | (16,431 | ) | ||
| Other temporary differences | (537 | ) | ||
| Unrealized appreciation | 9,713 | |||
| Total | $ | (7,255 | ) |
The tax character of dividends and distributions paid to shareholders was as follows:
| Year Ended | Year Ended | ||
| December 31, 2016 | December 31, 2015 | ||
| Ordinary income | $2,686 | $21,607* |
| * | Includes short-term capital gains |
| 17 |
VANECK VIP LONG/SHORT EQUITY INDEX FUND
NOTES TO FINANCIAL STATEMENTS
(continued)
At December 31, 2016, the Fund had capital loss carryforwards available to offset future capital gains as follows:
| Post-Effective No Expiration | |
| Short-Term Capital Losses | |
| $16,431 |
During the year ended December 31, 2016, the Fund utilized $38,729 of capital loss carryforwards.
During the year ended December 31, 2016, as a result of permanent book to tax differences, the Fund decreased accumulated net investment loss by $6,822, increased accumulated net realized loss on investments by $1,801 and decreased aggregate paid in capital by $5,021. Net assets were not affected by this reclassification. These differences are primarily due to securities sold short and net operating losses.
The Fund recognizes the tax benefits of uncertain tax positions only where the position is “more-likely-than-not” to be sustained assuming examination by applicable tax authorities. Management has analyzed the Fund’s tax positions, and has concluded that no liability for unrecognized tax benefits should be recorded related to uncertain tax positions taken on return filings for all open tax years. Therefore, no provision for income tax is required in the Fund’s financial statements.
The Fund recognizes interest and penalties, if any, related to uncertain tax positions as income tax expense on the Statement of Operations. During the year ended December 31, 2016, the Fund did not incur any interest or penalties.
Note 7—Concentration Risk—The Fund may concentrate its investments in exchange traded products that invest directly in, or have exposure to, equity and debt securities, as well as other asset categories such as commodities and derivative instruments. Such investments may subject the exchange traded product to greater volatility than investments in traditional securities. The Fund may indirectly own foreign securities. Securities of foreign issuers involve special risks and considerations not typically associated with investing in U.S. issuers. These risks include devaluation of currencies, less reliable information about issuers, different securities transaction clearance and settlement practices, and future adverse political and economic developments. These risks are heightened for investments in emerging market countries. Moreover, securities of many foreign issuers and their markets may be less liquid and their prices more volatile than those of comparable U.S. issuers.
| 18 |
The United Kingdom recently decided to leave the European Union (“EU”), creating economic and political uncertainty in its wake. Significant uncertainty exists regarding the timing of the United Kingdom’s withdrawal from the EU and the effects such withdrawal will have on the Euro, European economies and the global markets. This may further impact the value of the Euro and the British pound sterling, and has caused volatility and uncertainty in European and global markets.
At December 31, 2016, the Distributor owned approximately 67% of the Fund’s outstanding shares of beneficial interest. The aggregate shareholder accounts owned by one insurance company is approximately 32% of the Fund’s outstanding shares of beneficial interest.
Note 8—Trustee Deferred Compensation Plan—The Trust has a Deferred Compensation Plan (the “Deferred Plan”) for Trustees under which the Trustees can elect to defer receipt of their trustee fees until retirement, disability or termination from the Board of Trustees. The fees otherwise payable to the participating Trustees are deemed invested in shares of eligible Funds of the Trust and the VanEck Funds (another registered investment company managed by the Adviser) as directed by the Trustees.
The expense for the Deferred Plan is included in “Trustees’ fees and expenses” on the Statement of Operations. The liability for the Deferred Plan is shown as “Deferred Trustee fees” on the Statement of Assets and Liabilities.
Note 9—Bank Line of Credit—The Trust participates with VanEck Funds (collectively the “VE/VIP Funds”) in a $30 million committed credit facility (the “Facility”) to be utilized for temporary financing until the settlement of sales or purchases of portfolio securities, the repurchase or redemption of shares of the Fund and other temporary or emergency purposes. The participating VE/VIP Funds have agreed to pay commitment fees, pro rata, based on the unused but available balance. Interest is charged to the VE/VIP Funds at rates based on prevailing market rates in effect at the time of borrowings. During the year ended December 31, 2016, the Fund had no borrowings under the Facility.
Note 10—Recent Accounting Pronouncements and Regulatory Requirements—The Fund adopted Accounting Standards Update No. 2014-15 (“ASU 2014-15”), Disclosure of Uncertainties about an Entity’s Ability to Continue as a Going Concern, which requires management to assess the Fund’s ability to continue as a going concern and to provide related disclosures in certain circumstances. Under the new standard, disclosures are required when conditions give rise to substantial doubt about a company’s ability to continue as a going concern within one year from the financial statement
| 19 |
VANECK VIP LONG/SHORT EQUITY INDEX FUND
NOTES TO FINANCIAL STATEMENTS
(continued)
issuance date. Based on management’s evaluation, there are no conditions or events that could adversely affect the Fund’s ability to meet its obligations within one year after the date the financial statements are issued. Accordingly, no disclosures are required specific to going concern uncertainties in the Fund’s financial statements.
In October 2016, the Securities and Exchange Commission (the “SEC”) released its Final Rule on Investment Company Reporting Modernization (the “Rule”). The Rule, which introduces two new regulatory reporting forms for investment companies-Form N-PORT and Form N-CEN-also contains amendments to Regulation S-X which impact financial statement presentation, particularly the presentation of derivative investments. Although still evaluating the impact of the Rule, management believes that many of the Regulation S-X amendments are consistent with the Fund’s current financial statement presentation and expects that the Fund will be able to comply with the Rule’s Regulation S-X amendments by the August 1, 2017 compliance date.
Note 11—Subsequent Event Review—The Fund has evaluated subsequent events and transactions for potential recognition or disclosure through the date the financial statements were issued.
| 20 |
REPORT OF INDEPENDENT REGISTERED PUBLIC ACCOUNTING FIRM
The Board of Trustees of VanEck VIP Trust and Shareholders of VanEck VIP Long/Short Equity Index Fund
We have audited the accompanying statement of assets and liabilities, including the schedule of investments, of VanEck VIP Long/Short Equity Index Fund (one of the series constituting VanEck VIP Trust) (the “Fund”) as of December 31, 2016, and the related statement of operations for the year then ended, the statement of changes in net assets for each of the two years in the period then ended, and the financial highlights for the periods indicated therein. These financial statements and financial highlights are the responsibility of the Fund’s management. Our responsibility is to express an opinion on these financial statements and financial highlights based on our audits.
We conducted our audits in accordance with the standards of the Public Company Accounting Oversight Board (United States). Those standards require that we plan and perform the audit to obtain reasonable assurance about whether the financial statements and financial highlights are free of material misstatement. We were not engaged to perform an audit of the Fund’s internal control over financial reporting. Our audits included consideration of internal control over financial reporting as a basis for designing audit procedures that are appropriate in the circumstances, but not for the purpose of expressing an opinion on the effectiveness of the Fund’s internal control over financial reporting. Accordingly, we express no such opinion. An audit also includes examining, on a test basis, evidence supporting the amounts and disclosures in the financial statements and financial highlights, assessing the accounting principles used and significant estimates made by management, and evaluating the overall financial statement presentation. Our procedures included confirmation of securities owned as of December 31, 2016, by correspondence with the custodian and brokers or by other appropriate auditing procedures where replies from brokers were not received. We believe that our audits provide a reasonable basis for our opinion.
In our opinion, the financial statements and financial highlights referred to above present fairly, in all material respects, the financial position of VanEck VIP Long/Short Equity Index Fund (one of the series constituting VanEck VIP Trust) at December 31, 2016, the results of its operations for the year then ended, the changes in its net assets for each of the two years in the period then ended, and the financial highlights for the periods indicated therein, in conformity with U.S. generally accepted accounting principles.

New York, New York
February 15, 2017
| 21 |
VANECK VIP LONG/SHORT EQUITY INDEX FUND
(unaudited)
For the 2016 fiscal year, 100% of the ordinary income dividends paid by the Fund qualified for the Corporate Dividends Received Deduction.
| 22 |
VANECK VIP TRUST
BOARD OF TRUSTEES AND OFFICERS
December 31, 2016 (unaudited)
| Trustee’s Name, Address(1) and Year of Birth | Position(s) Held With Trust, Term of Office(2) and Length of Time Served | Principal Occupation(s) During Past Five Years | Number of Portfolios In Fund Complex(3) Overseen By Trustee | Other Directorships Held Outside The Fund Complex(3) During The Past Five Years | ||||
| Independent Trustees: | ||||||||
| Jon Lukomnik 1956 (A)(G) | Trustee since March 2006 | Managing Partner, Sinclair Capital LLC (consulting firm), 2000 to present; Executive Director, Investor Responsibility Research Center Institute, 2008 to present. | 12 | Member of the Deloitte Audit Quality Advisory Committee; Chairman of the Advisory Committee of Legion Partners; Member of the Standing Advisory Group to the Public Company Accounting Oversight Board; formerly Chairman of the Board of the New York Classical Theatre; formerly Director of The Governance Fund, LLC. | ||||
| Jane DiRenzo Pigott 1957 (A)(G) | Trustee since July 2007; Currently, Chairperson of the Governance Committee | Managing Director, R3 Group LLC (consulting firm), 2002 to present. | 12 | Formerly, Director and Chair of Audit Committee of 3E Company (environmental services); formerly Director of MetLife Investment Funds, Inc. | ||||
| Wayne H. Shaner 1947 (A)(G) | Trustee since March 2006 | Managing Partner, Rockledge Partners LLC, 2003 to present (investment adviser); Public Member of the Investment Committee, Maryland State Retirement System, 1991 to 2014. | 12 | Director, The Torray Funds (1 portfolio), since 1993 (Chairman of the Board since December 2005). | ||||
| 23 |
VANECK VIP TRUST
BOARD OF TRUSTEES AND OFFICERS
December 31, 2016 (unaudited) (continued)
| Trustee’s Name, Address(1) and Year of Birth | Position(s) Held With Trust, Term of Office(2) and Length of Time Served | Principal Occupation(s) During Past Five Years | Number of Portfolios In Fund Complex(3) Overseen By Trustee | Other Directorships Held Outside The Fund Complex(3) During The Past Five Years | ||||
| R. Alastair Short 1953 (A)(G) | Trustee since June 2004; Currently, Vice Chairperson of the Board and Chairperson of the Audit Committee | President, Apex Capital Corporation (personal investment vehicle), January 1988 to present; Vice Chairman, W.P. Stewart & Co., Ltd. (asset management firm), September 2007 to September 2008. | 70 | Chairman and Independent Director, EULAV Asset Management; Independent Director, Tremont offshore funds; Director, Kenyon Review; formerly Director of The Medici Archive Project. | ||||
| Richard D. Stamberger 1959 (A)(G) | Trustee since 1995; Currently, Chairperson of the Board | Director, President and CEO, SmartBrief, Inc. (business media company), 1999 to present. | 70 | Director, SmartBrief, Inc.; Director, Food and Friends, Inc. | ||||
| Robert L. Stelzl 1945 (A)(G) | Trustee since July 2007 | President, Rivas Capital, Inc. (real estate property management services company), 2004 to present; Co-Trustee, the estate of Donald Koll, 2012 to present; Trustee, Robert D. MacDonald Trust, 2015 to present; Trustee, Joslyn Family Trusts, 2003 to 2014. | 12 | Director and Chairman, Brookfield Properties, Inc. and Brookfield Residential Properties, Inc. |
| (1) | The address for each Trustee and officer is 666 Third Avenue, 9th Floor, New York, New York 10017. |
| (2) | Each Trustee serves until resignation, death, retirement or removal. The Board established a mandatory retirement policy applicable to all Independent Trustees, which provides that Independent Trustees shall resign from the Board on December 31 of the year such Trustee reaches the age of 75. |
| (3) | The Fund Complex consists of VanEck Funds, VanEck VIP Trust and VanEck Vectors ETF Trust. |
| (A) | Member of the Audit Committee. |
| (G) | Member of the Governance Committee. |
| 24 |
| Officer’s Name, Address(1) And Year of Birth | Position(s) Held With Trust | Term of Office And Length of Time Served(2) | Principal Occupations During The Past Five Years | |||
| Matthew A. Babinsky, 1983 | Assistant Vice President and Assistant Secretary | Since 2016 | Assistant Vice President and Assistant General Counsel of the Adviser, Van Eck Securities Corporation (VESC) and Van Eck Absolute Return Advisers VEARA (since 2016); Associate, Clifford Chance US LLP (October 2011 to April 2016); Officer of other investment companies advised by the Adviser. | |||
| Russell G. Brennan, 1964 | Assistant Vice President and Assistant Treasurer | Since 2008 | Assistant Vice President of the Adviser (since 2008); Officer of other investment companies advised by the Adviser. | |||
| Charles T. Cameron, 1960 | Vice President | Since 1996 | Director of Trading (since 1995) and Portfolio Manager (since 1997) for the Adviser; Officer of other investment companies advised by the Adviser. | |||
| John J. Crimmins, 1957 | Vice President, Treasurer, Chief Financial Officer and Principal Accounting Officer | Since 2009 (Treasurer); since 2012 (Vice President, Chief Financial Officer and Principal Accounting Officer) | Vice President of Portfolio Administration of the Adviser (since 2009); Vice President of Van Eck Securities Corporation (VESC) and Van Eck Absolute Return Advisers (VEARA) (since 2009); Officer of other investment companies advised by the Adviser. | |||
| Susan C. Lashley, 1955 | Vice President | Since 1998 | Vice President of the Adviser and VESC; Officer of other investment companies advised by the Adviser. | |||
| Laura I. Martínez, 1980 | Assistant Vice President and Assistant Secretary | Since 2008 | Vice President (since 2016), Associate General Counsel and Assistant Secretary of the Adviser, VESC and VEARA (since 2008); Officer of other investment companies advised by the Adviser. | |||
| James Parker, 1969 | Assistant Treasurer | Since 2014 | Manager, Portfolio Administration of the Adviser, VESC and VEARA (since 2010); Vice President of J.P. Morgan Financial Reporting and Fund Administration (2002-2010). | |||
| Jonathan R. Simon, 1974 | Vice President, Secretary and Chief Legal Officer | Since 2006 (Vice President and until 2014, also Assistant Secretary); since 2014 (Secretary and Chief Legal Officer) | Senior Vice President (since 2016), General Counsel and Secretary (since 2014) of the Adviser, VESC and VEARA; Associate General Counsel and Assistant Secretary of the Adviser, VESC and VEARA (2006-2014); Officer of other investment companies advised by the Adviser. |
| 25 |
VANECK VIP TRUST
BOARD OF TRUSTEES AND OFFICERS
December 31, 2016 (unaudited) (continued)
| Officer’s Name, Address(1) And Year of Birth | Position(s) Held With Trust | Term of Office And Length of Time Served(2) | Principal Occupations During The Past Five Years | |||
| Bruce J. Smith, 1955 | Senior Vice President | Since 1985 | Senior Vice President, Chief Financial Officer, Treasurer and Controller of the Adviser, VESC and VEARA (since 1997); Director of the Adviser, VESC and VEARA (since October 2010); Officer of other investment companies advised by the Adviser. | |||
| Janet Squitieri, 1961 | Chief Compliance Officer | Since 2013 | Vice President, Global Head of Compliance of the Adviser, VESC and VEARA (since September 2013); Chief Compliance Officer and Senior Vice President of HSBC Global Asset Management North America (August 2010-September 2013); Chief Compliance Officer of Babcock & Brown LP North America (July 2008-June 2010). | |||
| Jan F. van Eck, 1963 | Chief Executive Officer and President | Since 2005 (serves as Chief Executive Officer and President since 2010, prior thereto, served as Executive Vice President) | President, Director and Owner of the Adviser (since July 1993); Executive Vice President of the Adviser (January 1985-October 2010); Director (since November 1985), President (since October 2010) and Executive Vice President (June 1991-October 2010) of VESC; Director and President of VEARA (since May 1997); Trustee (since 2006), President and Chief Executive Officer of Market Vectors ETF Trust (since 2009); Officer of other investment companies advised by the Adviser. |
| (1) | The address for each Executive Officer is 666 Third Avenue, 9th Floor, New York, NY 10017. |
| (2) | Officers are elected yearly by the Board. |
| 26 |
This report is intended for the Fund’s shareholders. It may not be distributed to prospective investors unless it is preceded or accompanied by the Fund’s prospectus, which includes more complete information. An investor should consider the investment objective, risks, and charges and expenses of the Fund carefully before investing. The prospectus contains this and other information about the investment company. Please read the prospectus carefully before investing.
Additional information about the VanEck VIP (the “Trust”) Board of Trustees/Officers and a description of the policies and procedures the Trust uses to determine how to vote proxies relating to portfolio securities are provided in the Statement of Additional Information. The Statement of Additional Information and information regarding how the Trust voted proxies relating to portfolio securities during the most recent twelve month period ending June 30 is available, without charge, by calling 800.826.2333, or by visiting vaneck.com, or on the Securities and Exchange Commission’s website at https://www.sec.gov.
The Trust files its complete schedule of portfolio holdings with the Securities and Exchange Commission for the first and third quarters of each fiscal year on Form N-Q. The Trust’s Form N-Qs are available on the Commission’s website at https://www.sec.gov and may be reviewed and copied at the Commission’s Public Reference Room in Washington, D.C. Information on the operation of the Public Reference Room may be obtained by calling 202.942.8090. The Fund’s complete schedule of portfolio holdings is also available by calling 800.826.2333 or by visiting vaneck.com.

| Investment Adviser: | Van Eck Associates Corporation | |
| Distributor: | Van Eck Securities Corporation | |
| 666 Third Avenue, New York, NY 10017 | ||
| vaneck.com | ||
| Account Assistance: | 800.544.4653 | VIPLSEAR |
| ANNUAL REPORT | ||
| December 31, 2016 | ||
VanEck VIP Trust
VanEck VIP Unconstrained Emerging Markets Bond Fund
| 800.826.2333 | vaneck.com |
The information contained in this shareholder letter represents the personal opinions of the investment team members and may differ from those of other portfolio managers or of the firm as a whole. This information is not intended to be a forecast of future events, a guarantee of future results or investment advice. Also, unless otherwise specifically noted, any discussion of the Fund’s holdings, the Fund’s performance, and the views of the investment team members are as of December 31, 2016.
| PRIVACY NOTICE |
| (unaudited) |
| FACTS | WHAT DOES VANECK DO WITH YOUR PERSONAL INFORMATION? |
| Why? | Financial companies choose how they share your personal information. Federal law gives consumers the right to limit some but not all sharing. Federal law also requires us to tell you how we collect, share, and protect your personal information. Please read this notice carefully to understand what we do. |
| What? | The types of personal information we collect and share depend on the product or service you have with us. This information can include: ■ Social Security number and account balances ■ assets and payment history ■ risk tolerance and transaction history |
| How? | All financial companies need to share customers’ personal information to run their everyday business. In the section below, we list the reasons financial companies can share their customers’ personal information; the reasons VanEck chooses to share; and whether you can limit this sharing. |
| Reasons we can share your personal information | Does VanEck share? | Can you limit this sharing? | To limit our sharing | Questions? |
| For our everyday business purposes—such as to process your transactions, maintain your account(s), respond to court orders and legal investigations, or report to credit bureaus | Yes | No | Call us at 800.826.2333. Please note: If you are a new customer, we can begin sharing your information 30 days from the date we sent this notice. When you are no longer our customer, we continue to share your information as described in this notice. However, you can contact us at any time to limit our sharing. | 800.826.2333 |
| For our marketing purposes—to offer our products and services to you | Yes | No | ||
| For joint marketing with other financial companies | Yes | No | ||
| For our affiliates’ everyday business purposes—information about your transactions and experiences | Yes | No | ||
| For our affiliates’ everyday business purposes—information about your creditworthiness | No | We don’t share | ||
| For our affiliates to market to you | Yes | Yes | ||
| For nonaffiliates to market to you | No | We don’t share |
| PRIVACY NOTICE |
| (unaudited) (continued) |
| Who we are | |
| Who is providing this notice? | Van Eck Associates Corporation, its affiliates and funds sponsored or managed by Van Eck (collectively “VanEck”). |
| What we do | |
| How does VanEck protect my personal information? | To protect your personal information from unauthorized access and use, we use security measures that comply with federal law. These measures include computer safeguards and secured files and buildings. |
| How does VanEck collect my personal information? | We collect your personal information, for example, when you |
| n open an account or give us your income information | |
| n provide employment information or give us your contact information | |
| n tell us about your investment or retirement portfolio | |
| We also collect your personal information from others, such as credit bureaus, affiliates, or other companies. | |
| Why can’t I limit all sharing? | Federal law gives you the right to limit only |
| n sharing for affiliates’ everyday business purposes—information about your creditworthiness | |
| n affiliates from using your information to market to you | |
| n sharing for nonaffiliates to market to you | |
| State laws and individual companies may give you additional rights to limit sharing. See below for more on your rights under state law. | |
| What happens when I limit sharing for an account I hold jointly with someone else? | Your choices will apply to everyone on your account—unless you tell us otherwise. |
| Definitions | |
| Affiliates | Companies related by common ownership or control. They can be financial and nonfinancial companies. |
| n Our affiliates include companies with a VanEck name such as Van Eck Securities Corporation and others such as MV Index Solutions GmbH. | |
| Nonaffiliates | Companies not related by common ownership or control. They can be financial and nonfinancial companies. |
| n VanEck does not share with nonaffiliates so they can market to you. | |
| Joint marketing | A formal agreement between nonaffiliated financial companies that together market financial products or services to you. |
| n Our joint marketing partners include financial services companies. | |
| Other important information | |
| California Residents—In accordance with California law, we will not share information we collect about California residents with nonaffiliates except as permitted by law, such as with the consent of the customer or to service the customer’s accounts. We also will limit the sharing of information about you with our affiliates to the extent required by applicable California law. | |
| Vermont Residents—In accordance with Vermont law, we will not share information we collect about Vermont residents with nonaffiliates except as permitted by law, such as with the consent of the customer or to service the customer’s accounts. We will not share creditworthiness information about Vermont residents among VanEck’s affiliates except with the authorization or consent of the Vermont resident. | |
| VANECK VIP UNCONSTRAINED |
| EMERGING MARKETS BOND FUND |
| December 31, 2016 (unaudited) |
Dear Shareholder:
The Initial Class shares of the VanEck VIP Unconstrained Emerging Markets Bond Fund (the “Fund”) gained 6.42% over the 12 month period ended December 31, 2016, while the Fund’s benchmark—a blended index consisting of 50% J.P. Morgan Emerging Markets Bond Index Global Diversified Index1 (EMBI) and 50% J.P. Morgan Government Bond Index-Emerging Markets Global Diversified Index2 (GBI-EM) gained 10.15% over the same period. To compare, the GBI-EM local currency index was up 9.94%, while the EMBI hard currency index returned 10.15% over the 12 month period.
In 2016, the emerging markets bond market was volatile. Big shifts in commodity prices, continuing concerns over Chinese macroeconomic imbalances and the stability of the exchange rate regime, and stronger political noise in systemically important emerging markets countries (Brazil, Venezuela, Turkey, South Africa, and Poland) impacted the emerging markets bond market. Moreover, the unexpected outcomes of several global political events (Brexit,3 U.S. presidential election, and the Italian referendum), combined with the more hawkish policy narrative at major central banks drove asset prices. Inflows to the asset class as a whole were equally volatile, with several major reversals during the year. Given all these risks and vulnerabilities, the Fund’s stance from the start of the 2016 was (and remains) defensive in the form of low to moderate duration and low to no local currency debt exposures. Although this position allowed us to generally outperform in down periods, it did hurt in 2016 as the chase for yield lifted the asset class substantially.
However, the Bank of Japan’s actions to steepen its yield curve and the election of Republican Donald Trump as U.S. president accelerated some of the trends we were anticipating. Since his election, we have seen a rout in bond markets globally, while equity markets have rallied. Emerging markets local currencies4 were impacted most due to concerns over potential trade policies, but duration also affected performance of local bond markets. This fueled our concern about duration for several reasons. First, there was a too-broad consensus that inflation would remain low “forever”. The market consistently underpriced the Fed’s “dots”.5 Second, headline inflation was rising. And lastly, an end to quantitative easing (QE) was in sight. The Fund recouped a good portion of the year’s underperformance during the fourth quarter of 2016, outperforming its 50/50 benchmark by 3.71%. We believe that some of
| 1 |
| VANECK VIP UNCONSTRAINED |
| EMERGING MARKETS BOND FUND |
| (unaudited) (continued) |
these risks remain and asset price outcomes continue to be asymmetric. The magnitude of a downside not only seems larger to us than an upside, but also more likely.
From a country perspective, the Fund’s performance compared to the 50/50 blended benchmark was aided by long-term positions in Argentina and Brazil, as well as positions in Mexico, the Philippines, and South Korea. Conversely, the Fund’s performance was affected negatively by lack of exposure to South Africa, Russia, Colombia, and Venezuela. Other than Russia, these are higher-beta countries that rallied in the first part of the year, as the chase for yield continued, before getting slammed in the fourth quarter. Our key goal remains to have a portfolio that is well positioned to deal with the potentially strong headwinds of 2017. In particular, we continue to be concerned about duration. The new Trump administration’s possible fiscal stimulus, taken in the context of tight labor markets, should increase inflation pressures. The new administration could also boost animal spirits,6 as evidenced by a historic rise in small business confidence. As we mentioned, an end of QE is also now in sight, according to Fed observers, putting further upward pressure on yields. Finally, if lower trade deficits is the goal of the current U.S. administration, it means lower trade surpluses recycled into U.S. Treasuries.
Market and Fund Review
Brazil’s macroeconomic and policy story improved significantly in 2016 despite a few episodes of higher uncertainty surrounding the impeachment of President Dilma Rousseff. The new government has a much clearer policy agenda that is focused on putting the country’s performance on a more sustainable path. The government has managed to pass the first set of constitutional amendments associated with the spending cap and, before yearend, submitted to parliament its proposals regarding pension reform. Meanwhile inflation pressure and expectations are steadily declining which should allow the central bank to continue easing—hopefully generating a virtuous feedback loop in 2017.
Argentina also remained a bright spot in 2016. The new market-friendly government was a real game-changer as regards the resolution of the long-standing holdouts issue and regaining access to the international financial markets. Argentina’s macroeconomic background remains largely supportive and debt ratios are still low. Fiscal policy has suffered a setback recently, but it is our view that this is only to get through 2017 local elections and that reform momentum will continue. The recent resignation of Finance Minister Prat-Gay makes us more confident of this
| 2 |
view of the future, as he was supportive of a slower fiscal policy adjustment.
In the 12 month period under review, we also liked having exposure to so-called “bunker” bonds in South Korea. The country is a net sovereign creditor, i.e., it has more U.S. dollar (USD) reserves than U.S. dollar liabilities, with solid fiscal accounts and large external surpluses. What made these bonds particularly appealing is that they are proven to outperform in a risk-off environment.
Local currency bonds in South Africa and Turkey detracted from the Fund’s performance—this was mostly related to the fallout from the major political shocks in both countries. In Turkey the unsuccessful military coup in the middle of July generated a lot of additional headline risk, as well as rating downgrades. The economic performance has faltered and, as of yearend, markets remained uncertain as to whether the central bank will be able to maintain its independence. In South Africa the stand-off between President Zuma and Minister of Finance Gordhan produced much headline risk despite the ANC’s (African National Congress party) weak performance in local elections. Fiscal uncertainties and concerns about state-owned enterprise reform are also back on the table—with higher risks of further rating downgrades down the road.
Other detracting positions included hard currency7 debt exposure in Venezuela, Iraq, and Ecuador. The post-election period generated political uncertainty and social unrest in Venezuela. President Maduro’s main focus is on his own political survival, while the opposition is preoccupied with removing him from power. The end result is that economic issues (especially floating the exchange rate) were largely ignored and unaddressed.
Our view on local currency-denominated bonds changed over the course of the year. After having no local exposure in early 2016, we became cautiously positive in early March, increasing exposure to approximately 50% of the Fund’s assets under management by the end of March. However, the growth outlook in emerging markets continued to remain uncertain, commodity prices started to weaken again, the initial “bump” to China’s activity indicators from an earlier policy stimulus started to wane, and capital outflows from emerging markets intensified. Accordingly, we retracted and approached mid-May having only minimal local bonds exposure (less than 5%) in our portfolio.
The local debt tailwinds8 became stronger early in the third quarter as the final stretch of central bank forbearance pushed global interest rates
| 3 |
| VANECK VIP UNCONSTRAINED |
| EMERGING MARKETS BOND FUND |
| (unaudited) (continued) |
down. During this time, we increased our exposure to local debt to roughly 50% of our overall exposure by early August 2016. In the fall, there were several changes in the previously placid inflation landscape in the U.S. and some other developed markets, as reflected in rising market-based inflation expectations. The quality of the U.S. macro-flow improved and the Federal Open Market Committee (FOMC) started to signal that it was ready to resume policy tightening. To reflect these changes, we finalized the portfolio’s adjustment towards high-quality/idiosyncratic U.S. dollar-denominated debt, and away from local currency debt. By the end of the year, we only had minimal local debt exposure in Brazil.
We also continued to reduce the portfolio’s duration in the second half of the year.
Concerns over illiquidity in the corporate bond market remained strong in 2016 and we only owned selected U.S. dollar-denominated (mostly short-duration) corporate bonds with diversifier characteristics in countries like Mexico, Argentina, Russia, and Peru.
During the 12 month period, the Fund used derivatives, specifically non-deliverable and deliverable foreign exchange forwards, to hedge the currency component of fixed income holdings. In particular, the Fund directly hedged the euro risk encumbered in euro-denominated bonds, particularly Argentine euro-denominated bonds. The Fund also used cross-currency hedges for its Chilean peso bond exposure by buying USD/PEN (Peruvian sol), and for its Russian ruble bond exposure by buying USD/TRY (Turkish lira). The derivatives positions in 2016 had a minimal impact on the Fund’s performance, especially when taking into consideration the opposing positions that those derivatives were trying to hedge.
Portfolio Positioning and Outlook
We are cautious overall on emerging markets debt and especially on local currency-denominated debt. In particular, rising U.S. Treasury yields (mostly due to risk-negative factors), a stronger U.S. dollar, rising attention to risks in China and Europe, and “protectionism” could arise following the U.S. presidential election. Headline inflation in the U.S. continues to rise and any fiscal stimulus under a Trump presidency will occur in the context of the tight labor market, so the impact on wages, inflation expectations, and term premium could be significant (albeit it remains to be seen whether the final outcome of Trump’s policy agenda will be stag- or reflationary).
| 4 |
A unique feature of the Trump presidency that might negatively affect emerging markets asset prices (while potentially being positive for U.S. asset prices) lies in the president’s promise to introduce a number of protectionist measures, many of which can be implemented through executive fiat. One of the elements of Trump’s campaign was that foreign workers prospered at the expense of U.S. workers under globalization.
In China, while the government is trying the chase the “impossible trinity” (control over an exchange rate, an independent monetary policy, and free international capital flows), macroeconomic imbalances are worsening and capital outflows intensify. China is struggling with the “float” of its currency as it is necessitating rising capital controls and volatile upward spikes in local interest rates that the authorities use to curb U.S. dollar longs and buy time (while hitting growth, leverage, and confidence).
Europe faces a basic contradiction as the Eurozone has one currency, but many fiscal policies and many financial systems. The promise of fiscal federalization has not been fulfilled, so it is hard for us to see how any new hit to confidence gets credibly addressed in the future. An adverse outcome to the forthcoming elections (French, Dutch, and German) is not reflected in European or global asset prices.
These risks notwithstanding, as an unconstrained blended emerging markets debt fund, we have the flexibility to adjust to this environment. Our current portfolio continues to have low duration and low emerging markets local currency exposure, which was key to our outperformance in the turbulent fourth quarter of 2016. We expect it to give us an edge in 2017.
Our focus is on liquid names that have de-risked and have convincing macro stories behind them (Brazil, Russia, and Argentina). We also try to include off-index names in our portfolio—both in the corporate and the sovereign space (as long as they are liquid). One interesting example of such exposure is Mongolia where the new government surprised on the positive side with a strong reform push delivering more than the International Monetary Fund (IMF) would have expected. The IMF program would be a major policy anchor, improving the country’s access to the international capital markets and unlocking additional sources of financing. We always focus on liquidity, and are trying to make sure that potentially illiquid bonds are not in the portfolio.
As an unconstrained long-only fund, we seek to find the best investment opportunities across the emerging markets debt universe, including sovereigns and corporates in hard and local currencies. We believe that this flexibility gives us a greater ability to manage risks in the emerging
| 5 |
VANECK VIP UNCONSTRAINED
EMERGING MARKETS BOND FUND
(unaudited) (continued)
markets space, especially interest rates, currency, and country risks. We also believe this flexibility also allows for a greater ability to find opportunities with higher yields.
The Fund is subject to risks associated with its investments in emerging markets debt securities. Investing in foreign denominated and/or domiciled securities may involve heightened risk due to currency fluctuations, and economic and political risks, which may be enhanced in emerging markets. As the Fund may invest in securities denominated in foreign currencies and some of the income received by the Fund will be in foreign currencies, changes in currency exchange rates may negatively impact the Fund’s return. Derivatives may involve certain costs and risks such as liquidity, interest rate, market, credit, management and the risk that a position could not be closed when most advantageous. The Fund may also be subject to credit risk, interest rate risk, sovereign debt risk, tax risk, hedging risk, non-diversification risk, and risks associated with noninvestment grade securities. Please see the prospectus for information on these and other risk considerations.
We thoroughly appreciate your participation in the VanEck VIP Unconstrained Emerging Markets Bond Fund, and we look forward to helping you meet your investment goals in the future.
 |  | |
| Eric Fine | David Austerweil | |
| Portfolio Manager | Deputy Portfolio Manager | |
| January 23, 2017 |
Represents the opinions of the investment adviser. Past performance is no guarantee of future results. Not intended to be a forecast of future events, a guarantee of future results or investment advice. Current market conditions may not continue.
| 6 |
All indices are unmanaged and include the reinvestment of all dividends, but do not reflect the payment of transaction costs, advisory fees or expenses that are associated with an investment in the Fund. An index’s performance is not illustrative of the Fund’s performance. Indices are not securities in which investments can be made. Results reflect past performance and do not guarantee future results.
| 1 | J.P. Morgan Emerging Markets Bond Index Global Diversified Index (EMBI) tracks returns for actively traded external debt instruments in emerging markets, and is also J.P. Morgan’s most liquid U.S. dollar emerging markets debt benchmark. |
| 2 | J.P. Morgan Government Bond Index-Emerging Markets Global Diversified Index (GBI-EM) tracks local currency bonds issued by emerging markets governments. The index spans over 15 countries. |
| 3 | British withdrawal from the European Union. |
| 4 | Emerging markets local currency bonds are bonds denominated in the local currency of the issuer. |
| 5 | Federal Reserve officials publish their forecasts for the central bank’s key interest rate on a chart known as the “dot plot”. |
| 6 | Animal spirits is the term John Maynard Keynes used in his 1936 book, The General Theory of Employment, Interest and Money, to describe the instincts, proclivities and emotions that ostensibly influence and guide human behavior, and which can be measured in terms of, for example, consumer confidence. |
| 7 | Hard currency refers to currencies that are generally widely accepted around the world such as the U.S. dollar, euro, or yen. |
| 8 | Tailwinds describes a condition or situation that will help move growth higher and increase growth of an economy. |
| 7 |
VANECK VIP UNCONSTRAINED
EMERGING MARKETS BOND FUND
December 31, 2016 (unaudited)
| This chart shows the value of a hypothetical $10,000 investment in the Fund over the past 10 fiscal year periods or since inception (for funds lacking 10-year records). The result is compared with the Fund’s benchmark, and may include a broad-based market index | Hypothetical Growth of $10,000 (Ten Year: Initial Class) |
On May 1, 2013, the Van Eck VIP Global Bond Fund implemented changes to its principal investment strategies and changed its name to the Van Eck VIP Unconstrained Emerging Markets Bond Fund. On May 1, 2015, the Van Eck VIP Unconstrained Emerging Markets Bond Fund changed its primary benchmark from the GBI-EM to the blended benchmark of 50% EMBI and 50% GBI-EM to reflect the unconstrained long-only nature of the Fund.
| Average Annual Total Return 12/31/16 | Fund Initial Class | GBI-EM | EMBI | 50% GBI-EM 50% EMBI | ||||||||||||
| One Year | 6.42 | % | 9.94 | % | 10.15 | % | 10.15 | % | ||||||||
| Five Year | (1.95 | )% | (1.29 | )% | 5.91 | % | 2.32 | % | ||||||||
| Ten Year | 2.29 | % | 3.82 | % | 6.88 | % | 5.42 | % | ||||||||
The performance quoted represents past performance. Past performance is no guarantee of future results; current performance may be lower or higher than the performance data quoted. Performance information reflects temporary waivers of expenses and/or fees and does not include insurance/annuity fees and expenses. Investment returns would have been reduced had these fees/expenses been included. Investment return and the value of the shares of the Fund will fluctuate so that an investor’s shares, when redeemed, may be worth more or less than their original cost. Fund returns assume that dividends and capital gains distributions have been reinvested in the Fund at NAV. Performance information current to the most recent month end is available by calling 800.826.2333 or by visiting vaneck.com.
The Fund is only available to life insurance and annuity companies to fund their variable annuity and variable life insurance products. These contracts offer life insurance and tax benefits to the beneficial owners of the Fund. Your insurance or annuity company charges fees and expenses for these benefits that are not reflected in this report or in the Fund’s performance, since they are not direct expenses of the Fund. For insurance products, performance figures do not reflect the cost for insurance and if they did, the performance shown would be significantly lower. A review of your particular life and/or annuity contract will provide you with much greater detail regarding these costs and benefits.
All indices listed are unmanaged indices and include the reinvestment of all dividends, but do not reflect the payment of transaction costs, advisory fees or expenses that are
| 8 |
associated with an investment in the Fund. An index’s performance is not illustrative of the Fund’s performance. Indices are not securities in which investments can be made.
The 50/50 benchmark (“the Index”) is a blended index consisting of 50% J.P Morgan Emerging Markets Bond Index (EMBI) Global Diversified and 50% J.P. Morgan Government Bond Index-Emerging Markets Global Diversified (GBI-EM). The J.P. Morgan Government Bond Index-Emerging Markets Global Diversified (GBI-EM) tracks local currency bonds issued by Emerging Markets governments. The index spans over 15 countries. J.P Morgan Emerging Markets Bond Index (EMBI) Global Diversified tracks returns for actively traded external debt instruments in emerging markets, and is also J.P. Morgan’s most liquid U.S-dollar emerging markets debt benchmark.
| 9 |
VANECK VIP UNCONSTRAINED
EMERGING MARKETS BOND FUND
(unaudited)
As a shareholder of the Fund, you incur two types of costs: (1) transaction costs, including program fees on purchase payments; and (2) ongoing costs, including management fees and other Fund expenses. This disclosure is intended to help you understand the ongoing costs (in dollars) of investing in the Fund and to compare these costs with the ongoing costs of investing in other mutual funds.
The disclosure is based on an investment of $1,000 invested at the beginning of the period and held for the entire period, July 1, 2016 to December 31, 2016.
Actual Expenses
The first line in the table below provides information about account values and actual expenses. You may use the information in this line, together with the amount you invested, to estimate the expenses that you paid over the period. Simply divide your account value by $1,000 (for example, an $8,600 account value divided by $1,000 = 8.6), then multiply the result by the number in the first line under the heading entitled “Expenses Paid During the Period.”
Hypothetical Example for Comparison Purposes
The second line in the table below provides information about hypothetical account values and hypothetical expenses based on the Fund’s actual expense ratio and an assumed rate of return of 5% per year before expenses, which is not the Fund’s actual return. The hypothetical account values and expenses may not be used to estimate the actual ending account balance or expenses you paid for the period. You may use this information to compare the ongoing costs of investing in the Fund and other funds. To do so, compare this 5% hypothetical example with the 5% hypothetical examples that appear in the shareholder reports of other funds.
Please note that the expenses shown in the table are meant to highlight your ongoing costs only and do not reflect any transactional costs, such as fees on purchase payments. Therefore, the second line of the table is useful in comparing ongoing costs only, and will not help you determine the relative costs of owning different funds. In addition, if these transactional costs were included, your costs would have been higher.
| 10 |
| Beginning Account Value July 1, 2016 | Ending Account Value December 31, 2016 | Expenses Paid During the Period* July 1, 2016 - December 31, 2016 | |||||||
| VanEck VIP Unconstrained Emerging Markets Bond Fund | |||||||||
| Actual | $1,000.00 | $ 993.90 | $5.51 | ||||||
| Hypothetical** | $1,000.00 | $1,019.61 | $5.58 | ||||||
| * | Expenses are equal to the Fund’s annualized expense ratio (for the six months ended December 31, 2016), of 1.10%, multiplied by the average account value over the period, multiplied by the number of days in the most recent fiscal half year divided by the number of the days in the fiscal year (to reflect the one-half year period). |
| ** | Assumes annual return of 5% before expenses |
| 11 |
VANECK VIP UNCONSTRAINED
EMERGING MARKETS BOND FUND
December 31, 2016
| Principal Amount | Value | |||||||
| CORPORATE BONDS: 48.5% | ||||||||
| Argentina: 10.1% | ||||||||
| USD | 360,000 | Arcor SAIC 6.00%, 07/06/20 (c) 144A | $ | 376,200 | ||||
| 320,000 | Banco Hipotecario SA 9.75%, 11/30/20 144A | 341,600 | ||||||
| 229,000 | Cia General de Combustibles SA 9.50%, 11/07/19 (c) 144A | 231,519 | ||||||
| 305,000 | IRSA Propiedades Comerciales SA 8.75%, 03/23/20 (c) 144A | 323,681 | ||||||
| 120,000 | Pan American Energy LLC 7.88%, 05/07/21 Reg S | 126,300 | ||||||
| 273,000 | Petrobras Argentina SA 7.38%, 07/21/20 (c) Reg S | 266,857 | ||||||
| YPF SA | ||||||||
| 205,882 | 8.41%, 08/15/18 (f) Reg S | 208,971 | ||||||
| 760,000 | 8.50%, 03/23/21 Reg S | 817,076 | ||||||
| 27,000 | 8.88%, 12/19/18 Reg S | 29,437 | ||||||
| 2,721,641 | ||||||||
| Brazil: 1.4% | ||||||||
| 364,000 | Centrais Eletricas Brasileiras SA 6.88%, 07/30/19 Reg S | 382,655 | ||||||
| Principal Amount | Value | |||||||
| British Virgin Islands: 0.8% | ||||||||
| USD | 217,032 | QGOG Atlantic / Alaskan Rigs Ltd. 5.25%, 01/30/17 (c) Reg S | $ | 208,350 | ||||
| Cayman Islands: 0.4% | ||||||||
| 103,000 | Lima Metro Line 2 Finance Ltd. 5.88%, 07/05/34 Reg S | 109,180 | ||||||
| Georgia: 1.3% | ||||||||
| 350,000 | BGEO Group JSC 6.00%, 07/26/23 144A | 351,575 | ||||||
| Indonesia: 3.0% | ||||||||
| Pertamina Persero PT | ||||||||
| 529,000 | 4.88%, 05/03/22 Reg S | 545,002 | ||||||
| 256,000 | 5.25%, 05/23/21 Reg S | 270,025 | ||||||
| 815,027 | ||||||||
| Ireland: 1.7% | ||||||||
| 276,000 | MMC Norilsk Nickel OJSC via MMC Finance Ltd. 6.63%, 10/14/22 Reg S | 308,292 | ||||||
| 137,000 | Novolipetsk Steel via Steel Funding DAC 4.50%, 06/15/23 Reg S | 136,618 | ||||||
| 444,910 | ||||||||
| Israel: 3.0% | ||||||||
| Israel Electric Corp. Ltd. | ||||||||
| 260,000 | 5.00%, 11/12/24 Reg S 144A | 271,198 | ||||||
| 522,000 | 5.63%, 06/21/18 Reg S | 544,394 | ||||||
| 815,592 | ||||||||
See Notes to Financial Statements
| 12 |
| Principal Amount | Value | |||||||
| Kazakhstan: 3.7% | ||||||||
| KazMunayGas National Co. JSC | ||||||||
| USD | 126,000 | 7.00%, 05/05/20 Reg S | $ | 138,761 | ||||
| 471,000 | 9.13%, 07/02/18 Reg S | 512,837 | ||||||
| 362,000 | Zhaikmunai LLP 6.38%, 02/14/17 (c) Reg S | 353,855 | ||||||
| 1,005,453 | ||||||||
| Luxembourg: 4.6% | ||||||||
| 125,000 | Evraz Group SA 8.25%, 01/28/21 Reg S | 137,662 | ||||||
| Gazprom OAO Via Gaz Capital SA | ||||||||
| 536,000 | 3.85%, 02/06/20 Reg S | 544,873 | ||||||
| 240,000 | 8.15%, 04/11/18 Reg S | 256,772 | ||||||
| 126,000 | 9.25%, 04/23/19 (p) Reg S | 142,975 | ||||||
| 228,000 | QGOG Constellation SA 6.25%, 01/30/17 (c) Reg S | 151,620 | ||||||
| 1,233,902 | ||||||||
| Mexico: 4.9% | ||||||||
| 489,000 | Coca-Cola Femsa SAB de CV 3.88%, 11/26/23 | 500,617 | ||||||
| 120,000 | Corp. GEO SAB de CV 9.25%, 01/30/17 (c) (d) * Reg S | 30 | ||||||
| 421,000 | Gruma SAB de CV 4.88%, 09/01/24 (c) Reg S | 441,208 | ||||||
| Principal Amount | Value | |||||||
| Mexico: (continued) | ||||||||
| USD | 114,000 | Petroleos Mexicanos 4.61%, 03/11/22 (f) 144A | $ | 117,705 | ||||
| TV Azteca SAB de CV | ||||||||
| 117,000 | 7.50%, 01/30/17 (c) Reg S | 104,715 | ||||||
| 214,000 | 7.63%, 09/18/17 (c) Reg S | 170,665 | ||||||
| 1,334,940 | ||||||||
| Netherlands: 9.1% | ||||||||
| 137,000 | Kazakhstan Temir Zholy Finance BV 6.38%, 10/06/20 Reg S | 147,483 | ||||||
| 300,000 | Lukoil International Finance BV 4.56%, 04/24/23 Reg S | 303,477 | ||||||
| Petrobras Global Finance BV | ||||||||
| 733,000 | 5.38%, 01/27/21 | 718,706 | ||||||
| 472,000 | 7.88%, 03/15/19 | 507,088 | ||||||
| 720,000 | 8.38%, 05/23/21 | 777,600 | ||||||
| 2,454,354 | ||||||||
| Peru: 2.1% | ||||||||
| 115,000 | Banco de Credito del Peru 2.25%, 10/25/19 144A | 113,706 | ||||||
| 266,000 | Cia Minera Ares SAC 7.75%, 01/23/18 (c) Reg S | 286,615 | ||||||
| 146,000 | Minsur SA 6.25%, 02/07/24 Reg S | 152,935 | ||||||
| 553,256 | ||||||||
See Notes to Financial Statements
| 13 |
VANECK VIP UNCONSTRAINED
EMERGING MARKETS BOND FUND
SCHEDULE OF INVESTMENTS
(continued)
| Principal Amount | Value | |||||||
| United Kingdom: 2.4% | ||||||||
| AngloGold Ashanti Holdings Plc | ||||||||
| USD | 167,000 | 5.13%, 08/01/22 | $ | 166,641 | ||||
| 82,000 | 5.38%, 04/15/20 | 84,460 | ||||||
| 390,000 | Vedanta Resources Plc 6.00%, 01/31/19 Reg S | 393,900 | ||||||
| 645,001 | ||||||||
| Total Corporate Bonds (Cost: $12,949,137) | 13,075,836 | |||||||
| FOREIGN GOVERNMENT OBLIGATIONS: 47.7% | ||||||||
| Argentina: 1.3% | ||||||||
| ARS | 176 | Argentine Republic Government International Bond | ||||||
| 5.83%, 12/31/33 | 78 | |||||||
| USD | 346,000 | Provincia de Buenos Aires 5.75%, 06/15/19 144A | 361,207 | |||||
| 361,285 | ||||||||
| Armenia: 0.8% | ||||||||
| 206,000 | Republic of Armenia International Bond 6.00%, 09/30/20 Reg S | 213,334 | ||||||
| Belarus: 2.5% | ||||||||
| 640,000 | Republic of Belarus International Bond 8.95%, 01/26/18 Reg S | 664,768 | ||||||
| Brazil: 4.4% | ||||||||
| BRL | 3,995,000 | Nota do Tesouro Nacional, Series F 10.17%, 01/01/21 | 1,185,144 | |||||
| Principal Amount | Value | |||||||
| Costa Rica: 2.0% | ||||||||
| Costa Rica Government International Bonds | ||||||||
| USD | 143,000 | 4.25%, 01/26/23 Reg S | $ | 131,203 | ||||
| 354,000 | 10.00%, 08/01/20 Reg S | 418,527 | ||||||
| 549,730 | ||||||||
| Dominican Republic: 0.8% | ||||||||
| 189,000 | Dominican Republic International Bond 7.50%, 05/06/21 Reg S | 205,602 | ||||||
| Egypt: 0.5% | ||||||||
| 133,000 | Egypt Government International Bond 5.75%, 04/29/20 Reg S | 134,842 | ||||||
| El Salvador: 1.7% | ||||||||
| 456,000 | El Salvador Government International Bond 7.38%, 12/01/19 Reg S | 473,100 | ||||||
| Guatemala: 0.7% | ||||||||
| 210,000 | Guatemala Government Bond 4.50%, 05/03/26 144A | 202,387 | ||||||
| Honduras: 0.5% | ||||||||
| 114,000 | Honduras Government International Bond 8.75%, 12/16/20 Reg S | 127,498 | ||||||
| Indonesia: 0.4% | ||||||||
| 114,000 | Indonesia Government International Bond 3.70%, 01/08/22 144A | 114,541 | ||||||
See Notes to Financial Statements
| 14 |
| Principal Amount | Value | |||||||
| Ivory Coast: 1.8% | ||||||||
| USD | 490,000 | Ivory Coast Government International Bond 5.38%, 07/23/24 Reg S | $ | 473,690 | ||||
| Jordan: 0.2% | ||||||||
| 57,000 | Jordan Government International Bond 5.75%, 01/31/27 144A | 54,138 | ||||||
| Mongolia: 6.8% | ||||||||
| Mongolia Government International Bonds | ||||||||
| 343,000 | 4.13%, 01/05/18 Reg S | 333,567 | ||||||
| 467,000 | 5.13%, 12/05/22 Reg S | 400,464 | ||||||
| 1,039,000 | 10.88%, 04/06/21 Reg S | 1,094,917 | ||||||
| 1,828,948 | ||||||||
| Pakistan: 3.4% | ||||||||
| 173,000 | Pakistan Government International Bond 7.25%, 04/15/19 Reg S | 183,787 | ||||||
| 356,000 | Second Pakistan International Sukuk Co. Ltd. 6.75%, 12/03/19 Reg S | 377,521 | ||||||
| 357,000 | Third Pakistan International Sukuk Co. Ltd. 5.50%, 10/13/21 144A | 363,216 | ||||||
| 924,524 | ||||||||
| Principal Amount | Value | |||||||
| Paraguay: 0.5% | ||||||||
| USD | 124,000 | Paraguay Government International Bond 5.00%, 04/15/26 144A | $ | 126,480 | ||||
| Peru: 3.4% | ||||||||
| Corp. Financiera de Desarrollo SA | ||||||||
| 633,000 | 3.25%, 07/15/19 Reg S | 642,495 | ||||||
| 26,000 | 4.75%, 02/08/22 Reg S | 27,300 | ||||||
| 254,000 | Fondo Mivivienda SA 3.38%, 04/02/19 Reg S | 258,445 | ||||||
| 928,240 | ||||||||
| Rwanda: 1.3% | ||||||||
| 350,000 | Rwanda Government International Bond 6.63%, 05/02/23 Reg S | 347,803 | ||||||
| Serbia: 1.0% | ||||||||
| 240,000 | Serbia International Bond 7.25%, 09/28/21 Reg S | 268,267 | ||||||
| South Korea: 4.8% | ||||||||
| Export-Import Bank of Korea | ||||||||
| 346,000 | 1.34%, 10/21/19 (f) | 345,152 | ||||||
| 357,000 | 2.13%, 02/11/21 | 348,422 | ||||||
| 599,000 | Korea Development Bank 1.38%, 09/12/19 | 588,997 | ||||||
| 1,282,571 | ||||||||
See Notes to Financial Statements
| 15 |
VANECK VIP UNCONSTRAINED
EMERGING MARKETS BOND FUND
SCHEDULE OF INVESTMENTS
(continued)
| Principal Amount | Value | |||||||
| Suriname: 2.5% | ||||||||
| USD | 687,000 | Republic of Suriname International Bond | ||||||
| 9.25%, 10/26/26 144A | $ | 672,229 | ||||||
| Turkey: 4.6% | ||||||||
| 421,000 | Export Credit Bank of Turkey | |||||||
| 5.88%, 04/24/19 Reg S | 431,601 | |||||||
| 770,000 | Turkey Government International Bond | |||||||
| 7.00%, 03/11/19 | 820,050 | |||||||
| 1,251,651 | ||||||||
| Ukraine: 0.5% | ||||||||
| 144,000 | Ukraine Government International Bond | |||||||
| 7.75%, 09/01/19 Reg S | 145,230 | |||||||
| Principal Amount | Value | |||||||
| Vietnam: 1.3% | ||||||||
| USD | 343,200 | Vietnam Government International Bond | ||||||
| 4.00%, 02/02/17 (c) (s) | $ | 342,630 | ||||||
| Total Foreign Government Obligations (Cost: $12,865,305) | 12,878,632 | |||||||
| Number of Shares | ||||||||
| MONEY MARKET FUND: 2.4% (Cost: $650,356) | ||||||||
| 650,356 | AIM Treasury Portfolio — Institutional Class | 650,356 | ||||||
| Total Investments: 98.6% (Cost: $26,464,798) | 26,604,824 | |||||||
| Other assets less liabilities: 1.4% | 372,318 | |||||||
| NET ASSETS: 100.0% | $ | 26,977,142 | ||||||
| ARS | Argentine Peso |
| BRL | Brazilian Real |
| USD | United States Dollar |
| (c) | Callable Security – the redemption date shown is when the security may be redeemed by the issuer |
| (d) | Security in default |
| (f) | Floating Rate Bond – coupon reflects the rate in effect at the end of the reporting period |
| (p) | Puttable Security – the redemption date shown is when the security may be redeemed by the investor |
| (s) | Step Bond – coupon increases periodically based upon a predetermined schedule. The rate shown reflects the rate in effect at the end of the reporting period |
| * | Non-income producing |
| Reg S | Security was purchased pursuant to Regulation S under the Securities Act of 1933, which exempts from registration securities offered and sold outside of the United States. Such a security cannot be sold in the United States without either an effective registration statement filed pursuant to the Securities Act of 1933, or pursuant to an exemption from registration. |
| 144A | Security exempt from registration under Rule 144A of the Securities Act of 1933, as amended, or otherwise restricted. These securities may be resold in transactions exempt from registration, unless otherwise noted, and the value amounted to $4,021,382, or 14.9% of net assets. |
See Notes to Financial Statements
| 16 |
| Summary of Investments by Sector (unaudited) | % of Investments | Value | ||||||
| Basic Materials | 6.3 | % | $ | 1,667,123 | ||||
| Communications | 1.0 | 275,380 | ||||||
| Consumer, Non-cyclical | 5.0 | 1,318,025 | ||||||
| Energy | 27.2 | 7,229,806 | ||||||
| Financial | 4.2 | 1,130,562 | ||||||
| Government | 48.4 | 12,878,632 | ||||||
| Industrial | 1.0 | 256,693 | ||||||
| Utilities | 4.5 | 1,198,247 | ||||||
| Money Market Fund | 2.4 | 650,356 | ||||||
| 100.0 | % | $ | 26,604,824 | |||||
The summary of inputs used to value the Fund’s investments as of December 31, 2016 is as follows:
| Level 1 Quoted Prices | Level 2 Significant Observable Inputs | Level 3 Significant Unobservable Inputs | Value | ||||||||||||||
| Corporate Bonds* | $ | — | $ | 13,075,836 | $ | — | $ | 13,075,836 | |||||||||
| Foreign Government Obligations* | — | 12,878,632 | — | 12,878,632 | |||||||||||||
| Money Market Fund | 650,356 | — | — | 650,356 | |||||||||||||
| Total | $ | 650,356 | $ | 25,954,468 | $ | — | $ | 26,604,824 | |||||||||
* See Schedule of Investments for security type and geographic country breakouts.
There were no transfers between levels during the year ended December 31, 2016.
See Notes to Financial Statements
| 17 |
VANECK VIP UNCONSTRAINED
EMERGING MARKETS BOND FUND
STATEMENT OF ASSETS AND LIABILITIES
December 31, 2016
| Assets: | ||||
| Investments, at value (Cost $26,464,798) | $ | 26,604,824 | ||
| Cash denominated in foreign currency, at value (Cost $48) | 46 | |||
| Receivables: | ||||
| Shares of beneficial interest sold | 10,826 | |||
| Dividends and interest | 448,757 | |||
| Prepaid expenses | 745 | |||
| Total assets | 27,065,198 | |||
| Liabilities: | ||||
| Payables: | ||||
| Shares of beneficial interest redeemed | 20,883 | |||
| Due to Adviser | 20,005 | |||
| Deferred Trustee fees | 12,929 | |||
| Accrued expenses | 34,239 | |||
| Total liabilities | 88,056 | |||
| NET ASSETS | $ | 26,977,142 | ||
| Shares of beneficial interest outstanding | 3,322,604 | |||
| Net asset value, redemption and offering price per share | $ | 8.12 | ||
| Net Assets consist of: | ||||
| Aggregate paid in capital | $ | 29,725,257 | ||
| Net unrealized appreciation | 142,564 | |||
| Undistributed net investment income | 627,990 | |||
| Accumulated net realized loss | (3,518,669 | ) | ||
| $ | 26,977,142 |
See Notes to Financial Statements
| 18 |
For the Year Ended December 31, 2016
| Income: | ||||||||
| Dividends | $ | 3,995 | ||||||
| Interest (net of foreign taxes withheld of $6,005) | 1,512,847 | |||||||
| Total income | 1,516,842 | |||||||
| Expenses: | ||||||||
| Management fees | $ | 293,931 | ||||||
| Transfer agent fees | 19,957 | |||||||
| Custodian fees | 20,520 | |||||||
| Professional fees | 33,109 | |||||||
| Reports to shareholders | 17,742 | |||||||
| Insurance | 1,906 | |||||||
| Trustees’ fees and expenses | 1,209 | |||||||
| Interest | 804 | |||||||
| Other | 6,062 | |||||||
| Total expenses | 395,240 | |||||||
| Waiver of management fees | (72,120 | ) | ||||||
| Net expenses | 323,120 | |||||||
| Net investment income | 1,193,722 | |||||||
| Net realized gain (loss) on: | ||||||||
| Investments (net of foreign taxes of $7,871) | 850,155 | |||||||
| Foreign foreign currency contracts, foreign currency transactions and foreign denominated assets and liabilities | (161,531 | ) | ||||||
| Net realized gain | 688,624 | |||||||
| Net change in unrealized appreciation (depreciation) on: | ||||||||
| Investments | 23,142 | |||||||
| Forward foreign currency contracts, foreign currency transactions and foreign denominated assets and liabilities | 28,809 | |||||||
| Net change in unrealized appreciation (depreciation) | 51,951 | |||||||
| Net Increase in Net Assets Resulting from Operations | $ | 1,934,297 |
See Notes to Financial Statements
| 19 |
| VANECK VIP UNCONSTRAINED |
| EMERGING MARKETS BOND FUND |
| STATEMENT OF CHANGES IN NET ASSETS |
| Year Ended December 31, 2016 | Year Ended December 31, 2015 | ||||||||
| Operations: | |||||||||
| Net investment income | $ | 1,193,722 | $ | 2,173,798 | |||||
| Net realized gain (loss) | 688,624 | (6,509,727 | ) | ||||||
| Net change in unrealized appreciation (depreciation) | 51,951 | (397,688 | ) | ||||||
| Net increase (decrease) in net assets resulting from operations | 1,934,297 | (4,733,617 | ) | ||||||
| Dividends to shareholders from: | |||||||||
| Net investment income | — | (2,211,375 | ) | ||||||
| Share transactions*: | |||||||||
| Proceeds from sale of shares | 7,898,583 | 6,357,141 | |||||||
| Reinvestment of dividends | — | 2,211,375 | |||||||
| Cost of shares redeemed | (12,338,375 | ) | (9,166,533 | ) | |||||
| Net decrease in net assets resulting from share transactions | (4,439,792 | ) | (598,017 | ) | |||||
| Total decrease in net assets | (2,505,495 | ) | (7,543,009 | ) | |||||
| Net Assets: | |||||||||
| Beginning of year | 29,482,637 | 37,025,646 | |||||||
| End of year (including undistributed (accumulated) net investment income (loss) of $627,990 and $(13,871), respectively) | $ | 26,977,142 | $ | 29,482,637 | |||||
| * Shares of beneficial interest issued, reinvested and redeemed (unlimited number of $.001 par value shares authorized): | |||||||||
| Shares sold | 992,481 | 759,538 | |||||||
| Shares reinvested | — | 247,912 | |||||||
| Shares redeemed | (1,534,308 | ) | (1,110,550 | ) | |||||
| Net decrease | (541,827 | ) | (103,100 | ) | |||||
See Notes to Financial Statements
| 20 |
| FINANCIAL HIGHLIGHTS |
| For a share outstanding throughout each year: |
| Initial Class Shares | ||||||||||||||||||||
| Year Ended December 31, | ||||||||||||||||||||
| 2016 | 2015 | 2014 | 2013 | 2012 | ||||||||||||||||
| Net asset value, beginning of year | $ 7.63 | $ 9.33 | $10.60 | $11.92 | $11.71 | |||||||||||||||
| Income from investment operations: | ||||||||||||||||||||
| Net investment income | 0.36 | 0.56 | 0.67 | 0.60 | 0.24 | |||||||||||||||
| Net realized and unrealized gain (loss) on investments | 0.13 | (1.70 | ) | (0.49 | ) | (1.67 | ) | 0.39 | ||||||||||||
| Total from investment operations | 0.49 | (1.14 | ) | 0.18 | (1.07 | ) | 0.63 | |||||||||||||
| Less dividends and distributions from: | ||||||||||||||||||||
| Net investment income | — | (0.56 | ) | (0.56 | ) | (0.25 | ) | (0.26 | ) | |||||||||||
| Net realized capital gains | — | — | (0.89 | ) | — | (b) | (0.16 | ) | ||||||||||||
| Total dividends and distributions | — | (0.56 | ) | (1.45 | ) | (0.25 | ) | (0.42 | ) | |||||||||||
| Redemption fees | — | — | — | — | — | (b) | ||||||||||||||
| Net asset value, end of year | $ 8.12 | $ 7.63 | $ 9.33 | $10.60 | $11.92 | |||||||||||||||
| Total return (a) | 6.42 | % | (13.09 | )% | 2.18 | % | (9.17 | )% | 5.55 | % | ||||||||||
| Ratios/Supplemental Data | ||||||||||||||||||||
| Net assets, end of year (000’s) | $26,977 | $29,483 | $37,026 | $39,857 | $54,529 | |||||||||||||||
| Ratio of gross expenses to average net assets | 1.34 | % | 1.34 | % | 1.20 | % | 1.43 | % | 1.18 | % | ||||||||||
| Ratio of net expenses to average net assets | 1.10 | % | 1.10 | % | 1.10 | % | 1.10 | % | 1.10 | % | ||||||||||
| Ratio of net expenses, excluding interest expense, to average net assets | 1.10 | % | 1.10 | % | 1.10 | % | 1.10 | % | 1.10 | % | ||||||||||
| Ratio of net investment income to average net assets | 4.06 | % | 6.38 | % | 6.34 | % | 4.87 | % | 2.10 | % | ||||||||||
| Portfolio turnover rate | 595 | % | 572 | % | 441 | % | 483 | % | 0 | % | ||||||||||
| (a) | Total return is calculated assuming an initial investment made at the net asset value at the beginning of the year, reinvestment of any dividends and distributions at net asset value on the dividend/distribution payment date and a redemption at the net asset value on the last day of the year. The return does not reflect the deduction of taxes that a shareholder would pay on Fund dividends/distributions or the redemption of Fund shares. |
| (b) | Amount represents less than $0.005 per share |
See Notes to Financial Statements
| 21 |
VANECK VIP UNCONSTRAINED
EMERGING MARKETS BOND FUND
December 31, 2016
Note 1—Fund Organization—VanEck VIP Trust (the “Trust”) (formerly Van Eck VIP Trust) is registered under the Investment Company Act of 1940, as amended, as an open-end management investment company. The Trust was organized as a Massachusetts business trust on January 7, 1987. The VanEck VIP Unconstrained Emerging Markets Bond Fund (the “Fund”) is a non-diversified series of the Trust and seeks high total return (income plus capital appreciation) by investing globally, primarily in a variety of debt securities. The Fund currently offers a single class of shares: Initial Class Shares.
Note 2—Significant Accounting Policies—The preparation of financial statements in conformity with U.S. generally accepted accounting principles (“GAAP”) requires management to make estimates and assumptions that affect the reported amounts and disclosures in the financial statements. Actual results could differ from those estimates.
The Fund is an investment company and is following accounting and reporting requirements of Accounting Standards Codification (“ASC”) 946 Financial Services – Investment Companies.
The following is a summary of significant accounting policies followed by the Fund.
| A. | Security Valuation—The Fund values its investments in securities and other assets and liabilities at fair value daily. Fair value is the price that would be received to sell an asset or paid to transfer a liability in an orderly transaction between market participants on the measurement date. Debt securities are valued on the basis of evaluated prices furnished by an independent pricing service approved by the Board of Trustees or provided by securities dealers. The pricing services may use valuation models or matrix pricing, which consider: (i) yield or price with respect to bonds that are considered comparable in characteristics such as rating, interest rate and maturity date and/or (ii) quotations from bond dealers to determine current value and are categorized as Level 2 in the fair value hierarchy (as described below). Short-term obligations with more than sixty days remaining to maturity are valued at market value. Short-term obligations with sixty days or less to maturity are valued at amortized cost, which with accrued interest approximates fair value. Money market fund investments are valued at net asset value. Forward foreign currency contracts are valued at the spot currency rate plus an amount (“points”), which reflects the differences in interest rates between the U.S. and foreign markets and are categorized as Level 2 in the fair value hierarchy. Securities for which quotations are not available are stated at fair value as determined by the Pricing Committee of Van Eck Associates Corporation (the “Adviser”). The |
| 22 |
| Pricing Committee provides oversight of the Fund’s valuation policies and procedures, which are approved by the Fund’s Board of Trustees. Among other things, these procedures allow the Fund to utilize independent pricing services, quotations from securities dealers, and other market sources to determine fair value. The Pricing Committee convenes regularly to review the fair value of financial instruments for which market prices are not readily available. The Pricing Committee employs various methods for calibrating the valuation approaches utilized to determine fair value, including a regular review of key inputs and assumptions, transactional back-testing and disposition analysis. | ||
| Certain factors such as economic conditions, political events, market trends, the nature of and duration of any restrictions on disposition, trading in similar securities of the issuer or comparable issuers and other security specific information are used to determine the fair value of these securities. Depending on the relative significance of valuation inputs, these securities may be classified either as Level 2 or Level 3 in the fair value hierarchy. The price which the Fund may realize upon sale of an investment may differ materially from the value presented on the Schedule of Investments. | ||
| The Fund utilizes various methods to measure the fair value of its investments on a recurring basis, which includes a hierarchy that prioritizes inputs to valuation methods used to measure fair value. The fair value hierarchy gives highest priority to unadjusted quoted prices in active markets for identical assets and liabilities (Level 1 measurements) and the lowest priority to unobservable inputs (Level 3 measurements). The inputs or methodologies used for valuing securities are not necessarily an indication of the risk associated with investing in those securities. The transfers between levels of the fair value hierarchy assume the financial instruments were transferred at the beginning of the reporting period. The three levels of the fair value hierarchy are described below: | ||
| Level 1 – Quoted prices in active markets for identical securities. | ||
| Level 2 – Significant observable inputs (including quoted prices for similar securities, interest rates, prepayment speeds, credit risk, etc.). | ||
| Level 3 – Significant unobservable inputs (including the Fund’s own assumptions in determining the fair value of investments). | ||
| A summary of the inputs, the levels used to value the Fund’s investments, and transfers between levels are located in the Schedule of Investments. Additionally, tables that reconcile the valuation of the Fund’s Level 3 investments and that present additional information about valuation |
| 23 |
VANECK VIP UNCONSTRAINED
EMERGING MARKETS BOND FUND
NOTES TO FINANCIAL STATEMENTS
(continued)
| methodologies and unobservable inputs, if applicable, are located in the Schedule of Investments. | ||
| B. | Federal Income Taxes—It is the Fund’s policy to comply with the provisions of the Internal Revenue Code applicable to regulated investment companies and to distribute all of its taxable income to its shareholders. Therefore, no federal income tax provision is required. | |
| C. | Currency Translation—Assets and liabilities denominated in foreign currencies and commitments under foreign currency contracts are translated into U.S. dollars at the closing prices of such currencies each business day. Purchases and sales of investments are translated at the exchange rates prevailing when such investments are acquired or sold. Foreign denominated income and expenses are translated at the exchange rates prevailing when accrued. The portion of realized and unrealized gains and losses on investments that result from fluctuations in foreign currency exchange rates is not separately disclosed in the financial statements. Recognized gains or losses attributable to foreign currency fluctuations on foreign currency denominated assets, other than investments, and liabilities are recorded as net realized gain (loss) on forward foreign currency contracts, foreign currency transactions and foreign denominated assets and liabilities in the Statement of Operations. | |
| D. | Dividends and Distributions to Shareholders—Dividends to shareholders from net investment income and distributions from net realized capital gains, if any, are declared and paid annually. Income dividends and capital gain distributions are determined in accordance with U.S. income tax regulations, which may differ from such amounts determined in accordance with GAAP. | |
| E. | Use of Derivative Instruments—The Fund may make investments in derivative instruments, including, but not limited to, options, futures, swaps and other derivatives relating to foreign currency transactions. A derivative is an instrument whose value is derived from underlying assets, indices, reference rates or a combination of these factors. Derivative instruments may be privately negotiated contracts (often referred to as over-the-counter (“OTC”) derivatives) or they may be listed and traded on an exchange. Derivative contracts may involve future commitments to purchase or sell financial instruments or commodities at specified terms on a specified date, or to exchange interest payment streams or currencies based on a notional or contractual amount. Derivative instruments may involve a high degree of financial risk. The use of derivative instruments also involves the risk of loss if the investment adviser is incorrect in its expectation of the timing or level |
| 24 |
| of fluctuations in securities prices, interest rates or currency prices. Investments in derivative instruments also include the risk of default by the counterparty, the risk that the investment may not be liquid and the risk that a small movement in the price of the underlying security or benchmark may result in a disproportionately large movement, unfavorable or favorable, in the price of the derivative instrument. GAAP requires enhanced disclosures about the Fund’s derivative instruments and hedging activities. Details of this disclosure are found below. At December 31, 2016, the Fund held no derivative instruments. | ||
| Forward Foreign Currency Contracts—The Fund is subject to foreign currency risk in the normal course of pursuing its investment objectives. The Fund may buy and sell forward foreign currency contracts to settle purchases and sales of foreign denominated securities, gain currency exposure or to hedge foreign denominated assets. Realized gains and losses from forward foreign currency contracts, if any, are included in net realized gain (loss) on forward foreign currency contracts, foreign currency transactions and foreign denominated assets and liabilities in the Statement of Operations. The Fund may incur additional risk from investments in forward foreign currency contracts if the counterparty is unable to fulfill its obligation or there are unanticipated movements of the foreign currency relative to the U.S. dollar. The Fund held forward foreign currency contracts for seven months during the year ended December 31, 2016 with an average unrealized depreciation of $2,923. At December 31, 2016, the Fund held no forward foreign currency contracts. | ||
| The impact of transactions in derivative instruments during the year ended December 31, 2016, was as follows: |
| Foreign Currency Risk | |||
| Realized gain (loss): | |||
| Forward foreign currency contacts2 | $(86,563 | ) | |
| Net change in unrealized appreciation (depreciation): | |||
| Forward foreign currency contracts3 | (2,411 | ) | |
| 2 | Statement of Operations location: Net realized gain (loss) on forward foreign currency contracts, foreign currency transactions and foreign denominated assets and liabilities | |
| 3 | Statement of Operations location: Net change in unrealized appreciation (depreciation) on forward foreign currency contracts, foreign currency transactions and foreign denominated assets and liabilities |
| F. | Offsetting Assets and Liabilities—In the ordinary course of business, the Fund enters into transactions subject to enforceable master netting or other similar agreements. Generally, the right of setoff in those agreements allows the Fund to set off any exposure to a specific counterparty with |
| 25 |
VANECK VIP UNCONSTRAINED
EMERGING MARKETS BOND FUND
NOTES TO FINANCIAL STATEMENTS
(continued)
| any collateral received or delivered to that counterparty based on the terms of the agreements. The Fund may pledge or receive cash and/or securities as collateral for derivative instruments. Collateral, if any, held at December 31, 2016 is presented in the Schedule of Investments. | ||
| G. | Other—Security transactions are accounted for on trade date. Dividend income is recorded on the ex-dividend date. Interest income, including amortization of premiums and discounts, is accrued as earned. Realized gains and losses are calculated on the identified cost basis. Estimated foreign taxes that are expected to be withheld from proceeds at the sale of certain foreign investments are accrued by the Fund and decrease the unrealized gain on investments. The Fund received redemption fees from Class R1 Shares prior to its closing on April 30, 2012 which are reflected in the Financial Highlights. | |
| In the normal course of business, the Fund enters into contracts that contain a variety of general indemnifications. The Fund’s maximum exposure under these agreements is unknown as this would involve future claims that may be made against the Fund that have not yet occurred. However, the Adviser believes the risk of loss under these arrangements to be remote. |
Note 3—Investment Management and Other Agreements—The Adviser is the investment adviser to the Fund. The Adviser receives a management fee, calculated daily and payable monthly based on an annual rate of 1.00% of the first $500 million of average daily net assets, 0.90% of the next $250 million of average daily net assets and 0.70% of the average daily net assets in excess of $750 million. The Adviser has agreed, until at least May 1, 2017, to voluntarily waive management fees and assume expenses to prevent the Fund’s total annual operating expenses (excluding acquired fund fees and expenses, interest expense, trading expenses, dividend and interest payments on securities sold short, taxes, and extraordinary expenses) from exceeding 1.10% of the Fund’s average daily net assets. For the year ended December 31, 2016, the Adviser waived management fees in the amount of $72,120.
In addition, Van Eck Securities Corporation, an affiliate of the Adviser, acts as the Fund’s distributor (the “Distributor”). Certain officers and trustees of the Trust are officers, directors or stockholders of the Adviser and Distributor.
Note 4—Investments—For the year ended December 31, 2016, the cost of purchases and proceeds from sales of investments, excluding U.S. government securities and short-term obligations, aggregated to $163,236,201 and $163,652,481, respectively.
| 26 |
Note 5—Income Taxes—For Federal income tax purposes, the identified cost of investments owned at December 31, 2016 was $26,492,985 and net unrealized appreciation aggregated to $111,839, of which $388,663 related to appreciated securities and $276,824 related to depreciated securities.
At December 31, 2016, the components of accumulated earnings, on a tax basis, were as follows:
| Undistributed ordinary income | $ | 640,916 | ||
| Accumulated capital losses | (3,490,482 | ) | ||
| Other temporary differences | (12,929 | ) | ||
| Unrealized appreciation | 114,377 | |||
| Total | $ | (2,748,118 | ) |
The tax character of dividends and distributions paid to shareholders was as follows:
| Year Ended December 31, 2016 | Year Ended December 31, 2015 | |||||||
| Ordinary income | $ | — | $ | 2,211,375 | ||||
At December 31, 2016, the Fund had capital loss carryforwards available to offset future capital gains as follows:
| Post-Effective No Expiration Long-Term Capital Losses | Post-Effective No Expiration Short-Term Capital Losses | ||
| $70,543 | $3,419,939 |
During the year ended December 31, 2016, the Fund utilized $1,132,619 of capital loss carryforwards.
During the year ended December 31, 2016, as a result of permanent book to tax differences, the Fund decreased undistributed net investment income by $551,861, decreased accumulated net realized loss on investments by $462,968 and increased aggregate paid in capital by $88,893. Net assets were not affected by this reclassification. These differences are primarily due to foreign currency transactions, adjustment on defaulted bonds and tax treatment of gain/loss on debt instruments denominated in foreign currency.
The Fund recognizes the tax benefits of uncertain tax positions only where the position is “more-likely-than-not” to be sustained assuming examination by applicable tax authorities. Management has analyzed the Fund’s tax positions, and has concluded that no liability for unrecognized tax benefits should be recorded related to uncertain tax positions taken on returns filed for all open tax years. The Fund does not have exposure for additional years that might still be open in certain foreign jurisdictions. Therefore, no provision for income tax is required in the Fund’s financial statements.
| 27 |
VANECK VIP UNCONSTRAINED
EMERGING MARKETS BOND FUND
NOTES TO FINANCIAL STATEMENTS
(continued)
The Fund recognizes interest and penalties, if any, related to uncertain tax positions as income tax expense in the Statement of Operations. During the year ended December 31, 2016, the Fund did not incur any interest or penalties.
Note 6—Concentration of Risk—The Fund may purchase securities on foreign exchanges. Securities of foreign issuers involve special risks and considerations not typically associated with investing in U.S. issuers. These risks include devaluation of currencies, less reliable information about issuers, different security transaction clearance and settlement practices and future adverse political and economic developments. These risks are heightened for investments in emerging markets countries. Moreover, securities of many foreign issuers and their markets may be less liquid and their prices more volatile than those of comparable U.S. issuers. The Fund may invest in debt securities which are rated below investment grade by rating agencies. Such securities involve more risk of default than higher rated securities and are subject to greater price variability.
As a result of events involving Ukraine and the Russian Federation, the United States and the European Union (“EU”) have imposed sanctions on certain Russian individuals and companies. These sanctions do not currently impact the Fund. Additional economic sanctions may be imposed or other actions may be taken that may adversely affect the value and liquidity of the Russian-related issuers’ held by the Fund.
Further, the United Kingdom recently decided to leave the EU, creating economic and political uncertainty in its wake. Significant uncertainty exists regarding the timing of the United Kingdom’s withdrawal from the EU and the effects such withdrawal will have on the Euro, European economies and the global markets. This may further impact the value of the Euro and the British pound sterling, and has caused volatility and uncertainty in European and global markets.
At December 31, 2016, the aggregate shareholder accounts of five insurance companies own approximately 49%, 22%, 9%, 6% and 5% of the Fund’s outstanding shares of beneficial interest.
Note 7—Trustee Deferred Compensation Plan—The Trust has a Deferred Compensation Plan (the “Deferred Plan”) for Trustees under which the Trustees can elect to defer receipt of their trustee fees until retirement, disability or termination from the Board of Trustees. The fees otherwise payable to the participating Trustees are deemed invested in shares of eligible Funds of the Trust and the VanEck Funds (another registered investment company managed by the Adviser) as directed by the Trustees.
| 28 |
The expense for the Deferred Plan is included in “Trustees’ fees and expenses” on the Statement of Operations. The liability for the Deferred Plan is shown as “Deferred Trustee fees” on the Statement of Assets and Liabilities.
Note 8—Bank Line of Credit—The Trust participates with VanEck Funds (collectively the “VE/VIP Funds”) in a $30 million committed credit facility (the “Facility”) to be utilized for temporary financing until the settlement of sales or purchases of portfolio securities, the repurchase or redemption of shares of the Fund and other temporary or emergency purposes. The participating VE/VIP Funds have agreed to pay commitment fees, pro rata, based on the unused but available balance. Interest is charged to the VE/VIP Funds at rates based on prevailing market rates in effect at the time of borrowings. During the year ended December 31, 2016, the average daily loan balance during the 25 day period for which a loan was outstanding amounted to $686,943 and the average interest rate was 1.75%. At December 31, 2016, the Fund had no outstanding borrowings under the Facility.
Note 9—Recent Accounting Pronouncements and Regulatory Requirements—The Fund adopted Accounting Standards Update No. 2014-15 (“ASU 2014-15”), Disclosure of Uncertainties about an Entity’s Ability to Continue as a Going Concern, which requires management to assess the Fund’s ability to continue as a going concern and to provide related disclosures in certain circumstances. Under the new standard, disclosures are required when conditions give rise to substantial doubt about a company’s ability to continue as a going concern within one year from the financial statement issuance date. Based on management’s evaluation, there are no conditions or events that could adversely affect the Fund’s ability to meet its obligations within one year after the date the financial statements are issued. Accordingly, no disclosures are required specific to going concern uncertainties in the Fund’s financial statements.
In October 2016, the Securities and Exchange Commission (the “SEC”) released its Final Rule on Investment Company Reporting Modernization (the “Rule”). The Rule, which introduces two new regulatory reporting forms for investment companies – Form N-PORT and Form N-CEN – also contains amendments to Regulation S-X which impact financial statement presentation, particularly the presentation of derivative investments. Although still evaluating the impact of the Rule, management believes that many of the Regulation S-X amendments are consistent with the Fund’s current financial statement presentation and expects that the Fund will be able to comply with the Rule’s Regulation S-X amendments by the August 1, 2017 compliance date.
| 29 |
VANECK VIP UNCONSTRAINED
EMERGING MARKETS BOND FUND
NOTES TO FINANCIAL STATEMENTS
(continued)
Note 10—Subsequent Event Review—The Fund has evaluated subsequent events and transactions for potential recognition or disclosure through the date the financial statements were issued.
A dividend of $0.194 per share from net investment income was declared and paid on January 31, 2017 to shareholders of record of the Initial Class Shares as of January 30, 2017 with a reinvestment date of January 31, 2017.
| 30 |
REPORT OF INDEPENDENT REGISTERED PUBLIC ACCOUNTING FIRM
The Board of Trustees of VanEck VIP Trust and Shareholders of VanEck VIP Unconstrained Emerging Markets Bond Fund
We have audited the accompanying statement of assets and liabilities, including the schedule of investments, of VanEck VIP Unconstrained Emerging Markets Bond Fund (one of the series constituting VanEck VIP Trust) (the “Fund”) as of December 31, 2016, and the related statement of operations for the year then ended, the statements of changes in net assets for each of the two years in the period then ended, and the financial highlights for each of the five years in the period then ended. These financial statements and financial highlights are the responsibility of the Fund’s management. Our responsibility is to express an opinion on these financial statements and financial highlights based on our audits.
We conducted our audits in accordance with the standards of the Public Company Accounting Oversight Board (United States). Those standards require that we plan and perform the audit to obtain reasonable assurance about whether the financial statements and financial highlights are free of material misstatement. We were not engaged to perform an audit of the Fund’s internal control over financial reporting. Our audits included consideration of internal control over financial reporting as a basis for designing audit procedures that are appropriate in the circumstances, but not for the purpose of expressing an opinion on the effectiveness of the Fund’s internal control over financial reporting. Accordingly, we express no such opinion. An audit also includes examining, on a test basis, evidence supporting the amounts and disclosures in the financial statements and financial highlights, assessing the accounting principles used and significant estimates made by management, and evaluating the overall financial statement presentation. Our procedures included confirmation of securities owned as of December 31, 2016, by correspondence with the custodian and brokers or by other appropriate auditing procedures where replies from brokers were not received. We believe that our audits provide a reasonable basis for our opinion.
In our opinion, the financial statements and financial highlights referred to above present fairly, in all material respects, the financial position of VanEck VIP Unconstrained Emerging Markets Bond Fund (one of the series constituting VanEck VIP Trust) at December 31, 2016, the results of its operations for the year then ended, the changes in its net assets for each of the two years in the period then ended, and the financial highlights for each of the five years in the period then ended, in conformity with U.S. generally accepted accounting principles.

New York, New York
February 15, 2017
| 31 |
VAN ECK VIP UNCONSTRAINED
EMERGING MARKETS BOND FUND
(unaudited)
The Fund intends to pass through foreign tax credits in the maximum amounts shown. The gross foreign source income earned during the fiscal year 2016 by the Fund is shown below.
| Fund Foreign Tax Credits | Gross Foreign Source Income | ||
| $13,875 | $1,676,690 |
| 32 |
VANECK VIP TRUST
BOARD OF TRUSTEES AND OFFICERS
December 31, 2016 (unaudited)
| Trustee’s Name, Address(1) and Year of Birth | Position(s) Held With Trust, Term of Office(2) and Length of Time Served | Principal Occupation(s) During Past Five Years | Number of Portfolios In Fund Complex(3) Overseen By Trustee | Other Directorships Held Outside The Fund Complex(3) During The Past Five Years | ||||
| Independent Trustees: | ||||||||
| Jon Lukomnik 1956 (A)(G) | Trustee since March 2006 | Managing Partner, Sinclair Capital LLC (consulting firm), 2000 to present; Executive Director, Investor Responsibility Research Center Institute, 2008 to present. | 12 | Member of the Deloitte Audit Quality Advisory Committee; Chairman of the Advisory Committee of Legion Partners; Member of the Standing Advisory Group to the Public Company Accounting Oversight Board; formerly Chairman of the Board of the New York Classical Theatre; formerly Director of The Governance Fund, LLC. | ||||
| Jane DiRenzo Pigott 1957 (A)(G) | Trustee since July 2007; Currently, Chairperson of the Governance Committee | Managing Director, R3 Group LLC (consulting firm), 2002 to present. | 12 | Formerly, Director and Chair of Audit Committee of 3E Company (environmental services); formerly Director of MetLife Investment Funds, Inc. | ||||
| Wayne H. Shaner 1947 (A)(G) | Trustee since March 2006 | Managing Partner, Rockledge Partners LLC, 2003 to present (investment adviser); Public Member of the Investment Committee, Maryland State Retirement System, 1991 to 2014. | 12 | Director, The Torray Funds (1 portfolio), since 1993 (Chairman of the Board since December 2005). | ||||
| 33 |
VANECK VIP TRUST
BOARD OF TRUSTEES AND OFFICERS
December 31, 2016 (unaudited) (continued)
| Trustee’s Name, Address(1) and Year of Birth | Position(s) Held With Trust, Term of Office(2) and Length of Time Served | Principal Occupation(s) During Past Five Years | Number of Portfolios In Fund Complex(3) Overseen By Trustee | Other Directorships Held Outside The Fund Complex(3) During The Past Five Years | ||||
| R. Alastair Short 1953 (A)(G) | Trustee since June 2004; Currently, Vice Chairperson of the Board and Chairperson of the Audit Committee | President, Apex Capital Corporation (personal investment vehicle), January 1988 to present; Vice Chairman, W.P. Stewart & Co., Ltd. (asset management firm), September 2007 to September 2008. | 70 | Chairman and Independent Director, EULAV Asset Management; Independent Director, Tremont offshore funds; Director, Kenyon Review; formerly Director of The Medici Archive Project. | ||||
| Richard D. Stamberger 1959 (A)(G) | Trustee since 1995; Currently, Chairperson of the Board | Director, President and CEO, SmartBrief, Inc. (business media company), 1999 to present. | 70 | Director, SmartBrief, Inc.; Director, Food and Friends, Inc. | ||||
| Robert L. Stelzl 1945 (A)(G) | Trustee since July 2007 | President, Rivas Capital, Inc. (real estate property management services company), 2004 to present; Co-Trustee, the estate of Donald Koll, 2012 to present; Trustee, Robert D. MacDonald Trust, 2015 to present; Trustee, Joslyn Family Trusts, 2003 to 2014. | 12 | Director and Chairman, Brookfield Properties, Inc. and Brookfield Residential Properties, Inc. |
| (1) | The address for each Trustee and officer is 666 Third Avenue, 9th Floor, New York, New York 10017. |
| (2) | Each Trustee serves until resignation, death, retirement or removal. The Board established a mandatory retirement policy applicable to all Independent Trustees, which provides that |
| Independent Trustees shall resign from the Board on December 31 of the year such Trustee reaches the age of 75. | |
| (3) | The Fund Complex consists of VanEck Funds, VanEck VIP Trust and VanEck Vectors ETF Trust. |
| (A) | Member of the Audit Committee. |
| (G) | Member of the Governance Committee. |
| 34 |
| Officer’s Name, Address(1) And Year of Birth | Position(s) Held With Trust | Term of Office And Length of Time Served(2) | Principal Occupations During The Past Five Years | |||
| Matthew A. Babinsky, 1983 | Assistant Vice President and Assistant Secretary | Since 2016 | Assistant Vice President and Assistant General Counsel of the Adviser, Van Eck Securities Corporation (VESC) and Van Eck Absolute Return Advisers VEARA (since 2016); Associate, Clifford Chance US LLP (October 2011 to April 2016); Officer of other investment companies advised by the Adviser. | |||
| Russell G. Brennan, 1964 | Assistant Vice President and Assistant Treasurer | Since 2008 | Assistant Vice President of the Adviser (since 2008); Officer of other investment companies advised by the Adviser. | |||
| Charles T. Cameron, 1960 | Vice President | Since 1996 | Director of Trading (since 1995) and Portfolio Manager (since 1997) for the Adviser; Officer of other investment companies advised by the Adviser. | |||
| John J. Crimmins, 1957 | Vice President, Treasurer, Chief Financial Officer and Principal Accounting Officer | Since 2009 (Treasurer); since 2012 (Vice President, Chief Financial Officer and Principal Accounting Officer) | Vice President of Portfolio Administration of the Adviser (since 2009); Vice President of Van Eck Securities Corporation (VESC) and Van Eck Absolute Return Advisers (VEARA) (since 2009); Officer of other investment companies advised by the Adviser. | |||
| Susan C. Lashley, 1955 | Vice President | Since 1998 | Vice President of the Adviser and VESC; Officer of other investment companies advised by the Adviser. | |||
| Laura I. Martínez, 1980 | Assistant Vice President and Assistant Secretary | Since 2008 | Vice President (since 2016), Associate General Counsel and Assistant Secretary of the Adviser, VESC and VEARA (since 2008); Officer of other investment companies advised by the Adviser. | |||
| James Parker, 1969 | Assistant Treasurer | Since 2014 | Manager, Portfolio Administration of the Adviser, VESC and VEARA (since 2010); Vice President of J.P. Morgan Financial Reporting and Fund Administration (2002-2010). | |||
| Jonathan R. Simon, 1974 | Vice President, Secretary and Chief Legal Officer | Since 2006 (Vice President and until 2014, also Assistant Secretary); since 2014 (Secretary and Chief Legal Officer) | Senior Vice President (since 2016), General Counsel and Secretary (since 2014) of the Adviser, VESC and VEARA; Associate General Counsel and Assistant Secretary of the Adviser, VESC and VEARA (2006-2014); Officer of other investment companies advised by the Adviser. |
| 35 |
VANECK VIP TRUST
BOARD OF TRUSTEES AND OFFICERS
December 31, 2016 (unaudited) (continued)
| Officer’s Name, Address(1) And Year of Birth | Position(s) Held With Trust | Term of Office And Length of Time Served(2) | Principal Occupations During The Past Five Years | |||
| Bruce J. Smith, 1955 | Senior Vice President | Since 1985 | Senior Vice President, Chief Financial Officer, Treasurer and Controller of the Adviser, VESC and VEARA (since 1997); Director of the Adviser, VESC and VEARA (since October 2010); Officer of other investment companies advised by the Adviser. | |||
| Janet Squitieri, 1961 | Chief Compliance Officer | Since 2013 | Vice President, Global Head of Compliance of the Adviser, VESC and VEARA (since September 2013); Chief Compliance Officer and Senior Vice President of HSBC Global Asset Management North America (August 2010-September 2013); Chief Compliance Officer of Babcock & Brown LP North America (July 2008-June 2010). | |||
| Jan F. van Eck, 1963 | Chief Executive Officer and President | Since 2005 (serves as Chief Executive Officer and President since 2010, prior thereto, served as Executive Vice President) | President, Director and Owner of the Adviser (since July 1993); Executive Vice President of the Adviser (January 1985-October 2010); Director (since November 1985), President (since October 2010) and Executive Vice President (June 1991-October 2010) of VESC; Director and President of VEARA (since May 1997); Trustee (since 2006), President and Chief Executive Officer of Market Vectors ETF Trust (since 2009); Officer of other investment companies advised by the Adviser. |
| (1) | The address for each Executive Officer is 666 Third Avenue, 9th Floor, New York, NY 10017. |
| (2) | Officers are elected yearly by the Board. |
| 36 |
This report is intended for the Fund’s shareholders. It may not be distributed to prospective investors unless it is preceded or accompanied by the Fund’s prospectus, which includes more complete information. An investor should consider the investment objective, risks, and charges and expenses of the Fund carefully before investing. The prospectus contains this and other information about the investment company. Please read the prospectus carefully before investing.
Additional information about the VanEck VIP (the “Trust”) Board of Trustees/Officers and a description of the policies and procedures the Trust uses to determine how to vote proxies relating to portfolio securities are provided in the Statement of Additional Information. The Statement of Additional Information and information regarding how the Trust voted proxies relating to portfolio securities during the most recent twelve month period ending June 30 is available, without charge, by calling 800.826.2333, or by visiting vaneck.com, or on the Securities and Exchange Commission’s website at https://www.sec.gov.
The Trust files its complete schedule of portfolio holdings with the Securities and Exchange Commission for the first and third quarters of each fiscal year on Form N-Q. The Trust’s Form N-Qs are available on the Commission’s website at https://www.sec.gov and may be reviewed and copied at the Commission’s Public Reference Room in Washington, D.C. Information on the operation of the Public Reference Room may be obtained by calling 202.942.8090. The Fund’s complete schedule of portfolio holdings is also available by calling 800.826.2333 or by visiting vaneck.com.

| Investment Adviser: | Van Eck Associates Corporation | |
| Distributor: | Van Eck Securities Corporation | |
| 666 Third Avenue, New York, NY 10017 | ||
| vaneck.com | ||
| Account Assistance: | 800.544.4653 | VIPUEMBAR |
Item 2. CODE OF ETHICS.

(a)  The Registrant has adopted a code of ethics (the "Code of Ethics") that
     applies to the principal executive officer, principal financial officer,
     principal accounting officer or controller, or persons performing
     similar functions.

(b)  Not applicable.

(c)  The Registrant has not amended its Code of Ethics during the period
     covered by the shareholder report presented in Item 1 hereto.

(d)  The Registrant has not granted a waiver or an implicit waiver from a
     provision of its Code of Ethics during the period covered by the
     shareholder report presented in Item 1 hereto.

(e)  Not applicable.

(f)  The Registrant's Code of Ethics is attached as an Exhibit hereto.

Item 3. AUDIT COMMITTEE FINANCIAL EXPERT.

     The Registrant's Board of Trustees has determined that R. Alastair Short
     member of the Audit and Governance Committees, is an "audit committee
     financial expert" and "independent" as such terms are defined in the
     instructions to Form N-CSR Item 3(a)(2).

Item 4. PRINCIPAL ACCOUNTANT FEES AND SERVICES.

     The principal accountant fees disclosed in Item 4(a), 4(b), 4(c), 4(d) and
     4(g) are for the Funds of the Registrant for which the fiscal year end is
     December 31.

(a)  Audit Fees. The aggregate Audit Fees of Ernst & Young for professional
     services billed for the audits of the financial statements, or services
     that are normally provided in connection with statutory and regulatory
     filings or engagements for the fiscal years ended December 31, 2016 and
     December 31, 2015, were $145,333 and $150,330, respectively.

(b)  Audit-Related Fees. Not applicable.

(c)  Tax Fees. The aggregate Tax Fees of Ernst & Young for professional
     services billed for the review of Federal, state and excise tax returns
     and other tax compliance consultations for the fiscal years ended
     December 31, 2016 and December 31, 2015, were $57,443 and $30,515,
     respectively.

(d)  All Other Fees

     None.

(e)  The Audit Committee will pre-approve all audit and non-audit services,
     to be provided to the Funds, by the independent accountants as required by
     Section 10A of the Securities Exchange Act of 1934. The Audit Committee
     has authorized the Chairman of the Audit Committee to approve, between
     meeting dates, appropriate non-audit services.

     The Audit Committee after considering all factors, including a review of
     independence issues, will recommend to the Board of Trustees the
     independent auditors to be selected to audit the financial statements of
     the Funds.


(f)  Not applicable.

(g)  Not applicable.

(h)  Not applicable.

Item 5. AUDIT COMMITTEE OF LISTED REGISTRANTS.

     The Registrant's Board has an Audit Committee established in accordance
     with Section 3(a)(58)(A) of the Exchange Act (15 U.S.C. 78c(a)(58)(A))
     consisting of six Independent Trustees. Messrs. Lukomnik, Shaner, Short,
     Stamberger, and Stelzl and Ms. Pigott currently serve as members of the
     Audit Committee. Mr. Short is the Chairman of the Audit Committee.


Item 6. SCHEDULE OF INVESTMENTS.

     Information included in Item 1.

Item 7. DISCLOSURE OF PROXY VOTING POLICIES AND PROCEDURES FOR CLOSED-END
        MANAGEMENT INVESTMENT COMPANIES.

     Not applicable.

Item 8. PORTFOLIO MANAGER OF CLOSED-END MANAGEMENT INVESTMENT COMPANIES.

     Not applicable.

Item 9. PURCHASE OF EQUITY SECURITIES BY CLOSED-END MANAGEMENT INVESTMENT
        COMPANY AND AFFILIATED PURCHASERS.

     Not applicable.

Item 10. SUBMISSION OF MATTERS TO A VOTE OF SECURITY HOLDERS.

     None.

Item 11. CONTROLS AND PROCEDURES.

(a)  The registrant's principal executive and principal financial officers, or
     persons performing similar functions, have concluded that the registrant's
     disclosure controls and procedures (as defined in Rule 30a-3(c) under the
     Investment Company Act of 1940, as amended (the "1940 Act") (17 CFR
     270.30a-3 (c)) are effective, as of a date within 90 days of the filing
     date of the report that includes the disclosure required by this
     paragraph, based on their evaluation of these controls and procedures
     required by Rule 30a-3(b) under the 1940 Act (17 CFR 270.30a-3(b)) and
     Rules 13a-15(b) or 15d-15(b) under the Securities Exchange Act of 1934, as
     amended (17 CFR 240.13a-15(b) or 240.15d-15 (b)).

(b)  There were no changes in the registrant's internal control over financial
     reporting (as defined in Rule 30a-3(d) under the 1940 Act (17 CFR
     270.30a(d)) that occurred during the second fiscal quarter of the period
     covered by this report that has materially affected, or is reasonably
     likely to materially affect, the registrant's internal control over
     financial reporting.

Item 12. EXHIBITS.

(a)(1) The code of ethics is attached as EX-99.CODE ETH

(a)(2) A separate certification for each principal executive officer and
       principal financial officer of the registrant as required by Rule 30a-2
       under the Act (17 CFR 270.30a-2) is attached as Exhibit 99.CERT.

(b)  Certification pursuant to Section 906 of the Sarbanes-Oxley Act of 2002 is
     furnished as Exhibit 99.906CERT.


                                   SIGNATURES


Pursuant to the requirements of the Securities Exchange Act of 1934 and the
Investment Company Act of 1940, the registrant has duly caused this report to be
signed on its behalf by the undersigned, thereunto duly authorized.

(Registrant) VANECK VIP TRUST

By (Signature and Title) /s/ John J. Crimmins, Treasurer and CFO
                         ---------------------------------------
Date March 10, 2017
     --------------

Pursuant to the requirements of the Securities Exchange Act of 1934 and the
Investment Company Act of 1940, this report has been signed below by the
following persons on behalf of the registrant and in the capacities and on the
dates indicated.

By (Signature and Title) /s/ Jan F. van Eck, CEO
                        --------------------------
Date March 10, 2017
     --------------

By (Signature and Title)  /s/ John J. Crimmins, Treasurer and CFO
                        ------------------------------------------

Date March 10, 2017
     --------------