February, 2011
Dear Fellow Shareholder:
Like a jigsaw puzzle piece, Churchill Tax-Free Fund of Kentucky’s portfolio manager must decide whether any municipal bond under consideration for addition to the Fund’s portfolio has the potential to fit correctly into place. Otherwise, the addition might distort the overall picture.
Specifically, any bond under consideration must “fit” in terms of the principal amount, quality, maturity, liquidity and sector diversification.
For example, let’s say the Fund has $500,000 to invest. The portfolio manager must first find bonds available for purchase in the marketplace within that size range. Then, it must be decided whether to purchase one bond for the full amount of $500,000, several $100,000 offerings or some other combination. If the portfolio already possesses a significant holding in “Issuer A,” the portfolio manager may decide to purchase a smaller additional offering so as not to overweight the portfolio in that particular issuer.
The bonds available for purchase must also be looked at in terms of quality, maturity and sector diversification. As you know, the municipal bonds in Churchill Tax-Free Fund of Kentucky must be rated investment grade – within the top four credit ratings assigned by a Nationally Recognized Statistical Rating Organization (NRSRO) like Moody’s or Standard & Poor’s – or, if unrated, must be determined to be of comparable quality. The portfolio is also managed to have an intermediate maturity (as of December 31, 2010, the Fund’s average maturity was 13.67 years) and a reasonable degree of diversification among varying projects.
So, if both a transportation and a school bond are available with identical maturities and quality rating, the portfolio manager may decide for sector diversification purposes
NOT A PART OF THE ANNUAL REPORT
to purchase the transportation bond if the portfolio already contains a sufficient amount of school bonds.
The last piece of the puzzle is an ongoing attempt to keep the overall portfolio functioning smoothly, such that when one bond is removed, another complementary one is sought in an effort to keep the “picture just right”.
| | |
Lacy B. Herrmann
Founder and Chairman Emeritus | Diana P. Herrmann
President |
Consideration should be given to the risks of investing, including potential loss of value, market risk, interest rate risk, credit risk, and geographic concentration. Past performance does not guarantee future results. Investment return and principal value will fluctuate so that an investor's shares, when redeemed, may be worth more or less than their original cost. For certain investors, some dividends may be subject to Federal and state taxes including the Alternative Minimum Tax (AMT).
NOT A PART OF THE ANNUAL REPORT
| Serving Kentucky Investors For More Than Two Decades Churchill Tax-Free Fund of Kentucky ANNUAL REPORT Management Discussion | |
Last year we predicted 2010 would be a challenging year. However, we just did not expect all the challenges to be concentrated in the last two months of November and December. If 2010 had only been ten months instead of twelve, we would be reporting on another solid performance year and one that would have bettered our expectations. The Class A shares of Churchill Tax-Free Fund of Kentucky started the year at a net asset value of $10.51. The value maintained a reasonably narrow range as inflation fears failed to materialize and Treasury yields declined throughout the summer months. The Fund hit its yearly high in late August at $10.86 for the Class A shares. Values then declined slightly until mid-November when the fixed income markets overall experienced a substantial decline. From November 4th to November 15th, the 10-year Treasury yield jumped from 2.49% to 2.96% and the Fund’s Class A share net asset value declined from $10.72 to $10.57. Events that the markets were digesting were the November election results and the tax package compromise reached by President Obama and Congress.
Early December saw Treasury yields again increasing as the Federal deficit became a concern and fears of collapse within the European Union dissipated, thus removing the safe haven purchase for U.S. Treasuries. The yield on the 10-year Treasury climbed to the 3.50% range. During December and continuing into January, 2011, the municipal market faced its own set of problems. The result was a decline in the Fund’s value to $10.26 for the Class A shares at year end or a decline of twenty-five cents or 2.38% for 2010. Income return for the year equaled $0.401 per share. Thus, total return for 2010 equaled a positive 1.44% on the Class A shares.
Several factors impacted the municipal market at year end. First, the Build America Bond program which was initiated in 2009 as part of the economic stimulus package was expected to be extended beyond its December, 2010, expiration date. However, the program failed to receive the expected extension. The result was a rush to market by municipalities before year end increasing both tax-free and taxable yield levels. Moreover, sentiment believed the Build America Bond program kept yields on maturities of twenty years and longer lower than they otherwise would have been. With the program expiring, the yield curve steepened. By year end, the municipal/Treasury yield ratio was over one, meaning tax-free yields were higher than taxable yields.
Adding to the volatility for municipals was headline risk. An analyst appeared on “60 Minutes” and forecast significant municipal defaults within the next twelve months. Although we disagree with the analyst’s assessment, the result was substantial outflows from municipal bond funds throughout the country. The resulting mass liquidation drove municipal yields higher and prices lower. As prices fell, further liquidations occurred.
MANAGEMENT DISCUSSION (continued)
We acknowledge that there is considerable pressure on State and Local government budgets. In addition, municipal bonds can no longer necessarily rely on the backstop of municipal bond insurance, so credit risk is certainly a concern. As for widespread municipal defaults, during the past four years, 2008 was the worst year for defaults with $8.2 billion. That is a very small percentage of the $2.8 trillion municipal bond market. Debt service for the typical municipality represents between 5% and 10% of the municipal budget. We expect a combination of tax increases and expense cutbacks to resolve the vast majority of municipal deficits. Furthermore, we take pride in the fact that at year end 2010, 99.36% of the Fund’s portfolio was rated in the top three credit rating categories.
Thus, as we head into 2011, opportunity exists. Hopefully, the economy will continue to improve which would not only positively impact corporate profits but local revenues as well. We do have inflation concerns and believe that the housing market will remain weak and employment will remain a problem. The result, in our view, is an improving economy but at a slower pace than many believe. Paying down debt is a theme just beginning which we believe will have a major impact on economic growth for several years.
We believe that the recent factors impacting municipals have been overblown and have caused municipal bonds to become relatively cheap. The year ahead should allow us to nudge income higher without abandoning our long held belief of buying solid credits with intermediate maturities.
Performance data represents past performance, but does not guarantee future results. Investment return and principal value will fluctuate; shares, when redeemed, may be worth more or less than their original cost; current performance may be lower or higher than the data presented.
NOT FDIC INSURED – NO BANK GUARANTEE – MAY LOSE VALUE
PERFORMANCE REPORT
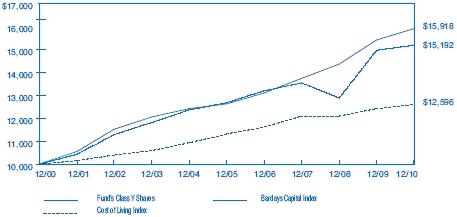
The following graph illustrates the value of $10,000 invested in the Class Y shares of Churchill Tax-Free Fund of Kentucky for the 10-year period ended December 31, 2010 as compared with the Barclays Capital Quality Intermediate Municipal Bond Index (the “Barclays Capital Index”) and the Consumer Price Index (a cost of living index). The performance of each of the other classes is not shown in the graph but is included in the table below. In prior “Performance Reports”, Class A shares performance was graphed. The chart below now shows Class Y shares which is consistent with the bar chart disclosure in the Fund’s prospectus. It should be noted that the Barclays Capital Index does not include any operating expenses nor sales charges, and being nationally oriented, does not reflect state specific bond market performance.
| | | | | | | | | | | | | |
| | | Average Annual Total Return | |
| | | for periods ended December 31, 2010 | |
| | | | | | | | | | | | Since | |
| Class and Inception Date | | 1 Year | | | 5 Years | | | 10 Years | | | Inception | |
| Class A (commenced operations on 5/21/87) | | | | | | | | | | | | |
| With Maximum Sales Charge | | | (2.69 | )% | | | 2.70 | % | | | 3.69 | % | | | 5.47 | % |
| Without Sales Charge | | | 1.38 | | | | 3.54 | | | | 4.11 | | | | 5.66 | |
| Class C (commenced operations on 4/01/96) | | | | | | | | | | | | | | | | |
| With CDSC | | | (0.58 | ) | | | 2.66 | | | | 3.23 | | | | 3.61 | |
| Without CDSC | | | 0.42 | | | | 2.66 | | | | 3.23 | | | | 3.61 | |
| Class I (commenced operations on 8/06/01) | | | | | | | | | | | | | | | | |
| No Sales Charge | | | 1.13 | | | | 3.39 | | | | n/a | | | | 3.85 | |
| Class Y (commenced operations on 4/01/96) | | | | | | | | | | | | | | | | |
| No Sales Charge | | | 1.44 | | | | 3.67 | | | | 4.27 | | | | 4.63 | |
| Barclays Capital Index | | | 3.21 | | | | 4.73 | | | | 4.76 | | | | 5.80 | (Class A) |
| | | | | | | | | | | | | | | | 5.02 | (Class C&Y) |
| | | | | | | | | | | | | | | | 4.58 | (Class I) |
Total return figures shown for the Fund reflect any change in price and assume all distributions within the period were invested in additional shares. Returns for Class A shares are calculated with and without the effect of the initial 4% maximum sales charge. Returns for Class C shares are calculated with and without the effect of the 1% contingent deferred sales charge (CDSC), imposed on redemptions made within the first 12 months after purchase. Class I and Y shares are sold without any sales charge. The rates of return will vary and the principal value of an investment will fluctuate with market conditions. Shares, if redeemed, may be worth more or less than their original cost. A portion of each class’s income may be subject to Federal and state income taxes and/or the Federal alternative minimum tax. Past performance is not predictive of future investment results.
REPORT OF INDEPENDENT REGISTERED PUBLIC ACCOUNTING FIRM
To the Board of Trustees and Shareholders of
Churchill Tax-Free Fund of Kentucky:
We have audited the accompanying statement of assets and liabilities, including the schedule of investments, of Churchill Tax-Free Fund of Kentucky as of December 31, 2010 and the related statement of operations for the year then ended, the statements of changes in net assets for each of the two years in the period then ended, and the financial highlights for each of the five years in the period then ended. These financial statements and financial highlights are the responsibility of the Fund’s management. Our responsibility is to express an opinion on these financial statements and financial highlights based on our audits.
We conducted our audits in accordance with the standards of the Public Company Accounting Oversight Board (United States). Those standards require that we plan and perform the audit to obtain reasonable assurance about whether the financial statements and financial highlights are free of material misstatement. The Fund is not required to have, nor were we engaged to perform, an audit of the Fund’s internal control over financial reporting. Our audits included consideration of internal control over financial reporting as a basis for designing audit procedures that are appropriate in the circumstances, but not for the purpose of expressing an opinion on the effectiveness of the Fund’s internal control over financial reporting. Accordingly, we express no such opinion. An audit also includes examining, on a test basis, evidence supporting the amounts and disclosures in the financial statements. Our procedures included confirmation of securities owned as of December 31, 2010, by correspondence with the custodian. An audit also includes assessing the accounting principles used and significant estimates made by management, as well as evaluating the overall financial statement presentation. We believe that our audits provide a reasonable basis for our opinion.
In our opinion, the financial statements and financial highlights referred to above present fairly, in all material respects, the financial position of Churchill Tax-Free Fund of Kentucky as of December 31, 2010, the results of its operations for the year then ended, the changes in its net assets for each of the two years in the period then ended, and the financial highlights for each of the five years in the period then ended, in conformity with accounting principles generally accepted in the United States of America.
TAIT, WELLER & BAKER LLP
Philadelphia, Pennsylvania
February 25, 2011
| | | | | | | | |
| CHURCHILL TAX-FREE FUND OF KENTUCKY | |
| SCHEDULE OF INVESTMENTS | |
| DECEMBER 31, 2010 | |
| | |
| | |
| | | | | Rating | | | |
| Principal | | | | Moody’s/S&P | | | |
| Amount | | General Obligation Bonds (4.3%) | | (unaudited) | | Value | |
| $ | 500,000 | | 2.000%, 06/01/15 | | Aa2/AA- | | $ | 503,155 | |
| | | | Campbell County, Kentucky Public Project | | | | | | |
| | 1,625,000 | | 4.375%, 12/01/25 Syncora Guarantee, Inc. Insured | | Aa2/NR | | | 1,603,046 | |
| | | | Henderson County, Kentucky | | | | | | |
| | 330,000 | | 3.000%, 11/01/20 | | Aa3/NR | | | 313,833 | |
| | | | Highland Heights, Kentucky | | | | | | |
| | 235,000 | | 4.500%, 12/01/25 | | A1/NR | | | 235,317 | |
| | 370,000 | | 4.600%, 12/01/27 | | A1/NR | | | 368,265 | |
| | 500,000 | | 5.125%, 12/01/38 | | A1/NR | | | 486,590 | |
| | | | Kenton County, Kentucky Public Project | | | | | | |
| | 500,000 | | 4.625%, 04/01/34 | | Aa2/NR | | | 471,740 | |
| | | | Lexington-Fayette Urban County, Kentucky | | | | | | |
| | 4,175,000 | | 4.250%, 05/01/23 NPFG Insured | | Aa2/AA | | | 4,215,581 | |
| | | | Louisville & Jefferson County, Kentucky | | | | | | |
| | 955,000 | | 4.200%, 11/01/22 NPFG Insured | | Aa1/AA+**** | | | 970,251 | |
| | | | Wilder, Kentucky | | | | | | |
| | 1,090,000 | | 4.900%, 12/01/29 AGMC Insured | | Aa3/AA+ | | | 1,103,429 | |
| | | | Total General Obligation Bonds | | | | | 10,271,207 | |
| | |
| | | | Revenue Bonds (96.1%) | | | | | | |
| | |
| | | | State Agencies (15.1%) | | | | | | |
| | | | Kentucky Area Development District Financing | | | | | | |
| | 500,000 | | 5.000%, 12/01/23 LOC Wachovia Bank | | NR/AA | | | 529,800 | |
| | | | Kentucky Asset & Liability Commission Federal | | | | | | |
| | | | Highway Notes | | | | | | |
| | 1,000,000 | | 5.000%, 09/01/22 Series A | | Aa2/AA | | | 1,077,730 | |
| | | | Kentucky Asset & Liability Commission University | | | | | | |
| | | | of Kentucky Project | | | | | | |
| | 1,500,000 | | 4.500%, 10/01/22 NPFG FGIC Insured | | Aa2/AA- | | | 1,521,000 | |
| | 500,000 | | 5.000%, 10/01/25 Series B | | Aa2/AA- | | | 517,300 | |
| | 750,000 | | 5.000%, 10/01/26 Series B | | Aa2/AA- | | | 770,662 | |
| | 1,000,000 | | 5.000%, 10/01/27 Series B | | Aa2/AA- | | | 1,021,720 | |
| | | | Kentucky Economic Development Finance | | | | | | |
| | | | Authority Louisville Arena Project | | | | | | |
| | 5,725,000 | | 5.750%, 12/01/28 AGMC Insured | | Aa3/AA+ | | | 5,937,512 | |
| | | | | | | | |
| CHURCHILL TAX-FREE FUND OF KENTUCKY | |
| SCHEDULE OF INVESTMENTS (continued) | |
| DECEMBER 31, 2010 | |
| | |
| | | | | Rating | | | |
| Principal | | | | Moody’s/S&P | | | |
| Amount | | Revenue Bonds (continued) | | (unaudited) | | Value | |
| | | State Agencies (continued) | | | | | |
| | | Kentucky Infrastructure Authority | | | | | |
| $ | 230,000 | | 5.000%, 06/01/2 | | Aa2/A+ | | $ | 232,298 | |
| | | | Kentucky State Property and Buildings Commission | | | | | | |
| | 1,000,000 | | 5.000%, 11/01/17 AMBAC Insured | | Aa3/A+ | | | 1,073,910 | |
| | 6,000,000 | | 5.250%, 10/01/18 | | Aa2/A+ | | | 6,047,400 | |
| | 1,925,000 | | 5.000%, 10/01/19 | | Aa2/A+ | | | 1,937,686 | |
| | 3,000,000 | | 5.000%, 11/01/19 AGMC Insured | | Aa2/AA+ | | | 3,116,880 | |
| | 1,020,000 | | 5.000%, 11/01/20 | | Aa2/A+ | | | 1,094,960 | |
| | 1,375,000 | | 5.375%, 11/01/23 | | Aa2/A+ | | | 1,474,110 | |
| | 2,820,000 | | 5.750%, 04/01/24 Project 91 | | Aa3/A+ | | | 3,010,378 | |
| | 1,300,000 | | 5.250%, 02/01/28 AGMC Insured | | Aa2/AA+ | | | 1,331,720 | |
| | 750,000 | | 5.500%, 11/01/28 | | Aa2/A+ | | | 779,880 | |
| | 2,500,000 | | 5.000%, 02/01/29 AGMC Insured | | Aa2/AA+ | | | 2,476,425 | |
| | 2,625,000 | | 5.750%, 04/01/29 Project 91 | | Aa3/A+ | | | 2,733,413 | |
| | | | Total State Agencies | | | | | 36,684,784 | |
| | | | County Agencies (2.7%) | | | | | | |
| | | | Jefferson County, Kentucky Capital Projects | | | | | | |
| | 1,575,000 | | 4.250%, 06/01/23 AGMC Insured | | Aa2/NR** | | | 1,575,819 | |
| | 2,640,000 | | 4.375%, 06/01/28 AGMC Insured | | Aa2/NR** | | | 2,448,230 | |
| | | | Kentucky Association of Counties Finance Corp. | | | | | | |
| | | | Financing Program Revenue | | | | | | |
| | 1,145,000 | | 4.250%, 02/01/24 | | NR/A+ | | | 1,078,098 | |
| | | | Lexington-Fayette Urban County, Kentucky Public | | | | | | |
| | | | Facilities Revenue | | | | | | |
| | 500,000 | | 4.125%, 10/01/23 NPFG Insured | | Aa2/NR | | | 491,460 | |
| | 500,000 | | 4.250%, 10/01/26 NPFG Insured | | Aa2/NR | | | 469,460 | |
| | | | Warren County, Kentucky Justice Center | | | | | | |
| | 365,000 | | 4.300%, 09/01/22 NPFG Insured | | Aa2/NR | | | 367,431 | |
| | | | Total County Agencies | | | | | 6,430,498 | |
| | | | Colleges and Universities (5.6%) | | | | | | |
| | | | Berea, Kentucky Educational Facilities (Berea College) | | | | | | |
| | 1,000,000 | | 4.125%, 06/01/25 | | Aaa/NR | | | 1,004,570 | |
| | | | | | | | |
| CHURCHILL TAX-FREE FUND OF KENTUCKY | |
| SCHEDULE OF INVESTMENTS (continued) | |
| DECEMBER 31, 2010 | |
| | |
| | | | | Rating | | | |
| Principal | | | | Moody’s/S&P | | | |
| Amount | | Revenue Bonds (continued) | | (unaudited) | | Value | |
| | | Colleges and Universities (continued) | | | | | |
| | | Boyle County, Kentucky College Refunding & | | | | | |
| | | Improvement | | | | | |
| $ | 1,035,000 | | 4.500%, 06/01/22 CIFG Insured | | A3/A- | | $ | 1,062,779 | |
| | 200,000 | | 4.625%, 06/01/24 CIFG Insured | | A3/A- | | | 204,048 | |
| | | | Louisville & Jefferson County, Kentucky University | | | | | | |
| | | | of Louisville | | | | | | |
| | 525,000 | | 5.000%, 06/01/20 AMBAC Insured | | NR/NR* | | | 546,641 | |
| | 1,000,000 | | 4.500%, 10/01/32 | | Aa2/AA- | | | 894,090 | |
| | | | Murray State University Project, Kentucky General | | | | | | |
| | | | Receipts Revenue | | | | | | |
| | 745,000 | | 4.500%, 09/01/23 AMBAC Insured | | Aa2/A+ | | | 733,661 | |
| | | | University of Kentucky General Receipts | | | | | | |
| | 885,000 | | 4.500%, 10/01/22 Syncora Guarantee, Inc. Insured | | Aa2/AA- | | | 901,080 | |
| | 1,545,000 | | 4.500%, 10/01/23 Syncora Guarantee, Inc. Insured | | Aa2/AA- | | | 1,563,617 | |
| | 1,625,000 | | 4.500%, 10/01/25 Syncora Guarantee, Inc. Insured | | Aa2/AA- | | | 1,612,796 | |
| | 1,010,000 | | 4.500%, 10/01/26 Syncora Guarantee, Inc. Insured | | Aa2/AA- | | | 989,840 | |
| | | | Western Kentucky University Revenue General | | | | | | |
| | | | Receipts | | | | | | |
| | 2,000,000 | | 4.200%, 09/01/25 Series A NPFG Insured | | Aa2/A+ | | | 1,840,160 | |
| | 2,475,000 | | 4.200%, 09/01/26 Series A NPFG Insured | | Aa2/A+ | | | 2,234,554 | |
| | | | Total Colleges and Universities | | | | | 13,587,836 | |
| | |
| | | | Hospitals (12.5%) | | | | | | |
| | | | Jefferson County, Kentucky Health Facilities, Jewish | | | | | | |
| | | | Healthcare | | | | | | |
| | 1,715,000 | | 5.650%, 01/01/17 AMBAC Insured | | Baa1/A- | | | 1,720,385 | |
| | | | Jefferson County, Kentucky Health Facilities | | | | | | |
| | | | University Hospital | | | | | | |
| | 1,000,000 | | 5.250%, 07/01/22 NPFG Insured | | Baa1/BBB | | | 1,002,180 | |
| | | | Jefferson County, Kentucky, Louisville Medical Center | | | | | | |
| | 2,200,000 | | 5.250%, 05/01/17 | | NR/A | | | 2,284,744 | |
| | 2,000,000 | | 5.500%, 05/01/22 | | NR/A | | | 2,075,520 | |
| | | | Kentucky Economic Development Finance Authority, | | | | | | |
| | | | Baptist Healthcare System | | | | | | |
| | 2,170,000 | | 5.375%, 08/15/24 | | Aa3/NR** | | | 2,274,203 | |
| | | | | | | | |
| CHURCHILL TAX-FREE FUND OF KENTUCKY | |
| SCHEDULE OF INVESTMENTS (continued) | |
| DECEMBER 31, 2010 | |
| | |
| | |
| | | | | Rating | | | |
| Principal | | | | Moody’s/S&P | | | |
| Amount | | Revenue Bonds (continued) | | (unaudited) | | Value | |
| | | Hospitals (continued) | | | | | |
| | | Kentucky Economic Development Finance Authority, | | | | | |
| | | Catholic Health | | | | | |
| $ | 2,000,000 | | 5.000%, 05/01/29 | | Aa2/AA | | $ | 1,957,580 | |
| | 1,000,000 | | 5.000%, 05/01/29 | | Aa2/AA | | | 978,790 | |
| | | | Kentucky Economic Development Finance Authority, | | | | | | |
| | | | Hospital Facilities St. Elizabeth Healthcare | | | | | | |
| | 1,000,000 | | 5.500%, 05/01/39 | | NR/AA-** | | | 1,005,880 | |
| | | | Kentucky Economic Development Finance Authority, | | | | | | |
| | | | Kings Daughter Medical Center | | | | | | |
| | 1,000,000 | | 5.000%, 02/01/30 | | A1/A+ | | | 944,730 | |
| | | | Louisville & Jefferson County, Kentucky Metropolitan | | | | | | |
| | | | Government Health System, Sisters of Mercy | | | | | | |
| | 1,000,000 | | 5.000%, 10/01/35 | | NR/NR*** | | | 917,590 | |
| | | | Louisville & Jefferson County, Kentucky, Louisville | | | | | | |
| | | | Medical Center | | | | | | |
| | 1,000,000 | | 5.000%, 06/01/18 | | NR/A | | | 1,033,400 | |
| | | | Louisville & Jefferson County, Kentucky Metro Health, | | | | | | |
| | | | Jewish Hospital Revenue | | | | | | |
| | 1,250,000 | | 6.000%, 02/01/22 | | Baa1/A- | | | 1,273,275 | |
| | 1,800,000 | | 6.125%, 02/01/37 | | Baa1/A- | | | 1,815,804 | |
| | | | Louisville & Jefferson County, Kentucky Metropolitan | | | | | | |
| | | | Government Health System, Norton | | | | | | |
| | 7,925,000 | | 5.000%, 10/01/26 | | NR/A-*** | | | 7,391,965 | |
| | 4,000,000 | | 5.000%, 10/01/30 | | NR/A-*** | | | 3,564,280 | |
| | | | Total Hospitals | | | | | 30,240,326 | |
| | | | | | | | | | |
| | | | Housing (14.0%) | | | | | | |
| | | | Kentucky Housing Corporation Housing Revenue | | | | | | |
| | 555,000 | | 4.200%, 01/01/17 | | Aaa/AAA | | | 560,561 | |
| | 65,000 | | 5.125%, 07/01/17 | | Aaa/AAA | | | 65,035 | |
| | 470,000 | | 4.800%, 01/01/18 AMT | | Aaa/AAA | | | 474,531 | |
| | 285,000 | | 4.250%, 01/01/18 | | Aaa/AAA | | | 286,753 | |
| | 575,000 | | 4.800%, 07/01/18 AMT | | Aaa/AAA | | | 580,543 | |
| | 180,000 | | 4.250%, 07/01/18 | | Aaa/AAA | | | 181,102 | |
| | | | | | | | |
| CHURCHILL TAX-FREE FUND OF KENTUCKY | |
| SCHEDULE OF INVESTMENTS (continued) | |
| DECEMBER 31, 2010 | |
| | |
| | |
| | | | | Rating | | | |
| Principal | | | | Moody’s/S&P | | | |
| Amount | | Revenue Bonds (continued) | | (unaudited) | | Value | |
| | | Housing (continued) | | | | | |
| | | Kentucky Housing Corporation Housing Revenue | | | | | |
| | | (continued) | | | | | |
| $ | 900,000 | | 4.800%, 07/01/20 AMT | | Aaa/AAA | | $ | 903,879 | |
| | 1,150,000 | | 5.350%, 01/01/21 AMT FNMA collateralized | | Aaa/AAA | | | 1,152,013 | |
| | 6,025,000 | | 5.450%, 07/01/22 AMT | | Aaa/AAA | | | 6,049,642 | |
| | 4,565,000 | | 5.250%, 07/01/22 AMT | | Aaa/AAA | | | 4,577,143 | |
| | 245,000 | | 5.200%, 07/01/22 | | Aaa/AAA | | | 246,112 | |
| | 415,000 | | 5.100%, 07/01/22 AMT | | Aaa/AAA | | | 415,527 | |
| | 2,570,000 | | 4.800%, 07/01/22 AMT | | Aaa/AAA | | | 2,558,769 | |
| | 2,000,000 | | 4.700%, 07/01/22 Series E AMT | | Aaa/AAA | | | 1,972,060 | |
| | 1,635,000 | | 5.000%, 01/01/23 AMT | | Aaa/AAA | | | 1,642,178 | |
| | 665,000 | | 5.000%, 07/01/24 FHA Insured | | Aaa/AAA | | | 677,755 | |
| | 4,140,000 | | 5.200%, 07/01/25 AMT | | Aaa/AAA | | | 4,135,777 | |
| | 600,000 | | 4.750%, 07/01/26 | | Aaa/AAA | | | 590,304 | |
| | 235,000 | | 5.375%, 07/01/27 | | Aaa/AAA | | | 235,996 | |
| | 2,300,000 | | 5.000%, 07/01/27 Series N AMT | | Aaa/AAA | | | 2,214,969 | |
| | 1,000,000 | | 4.750%, 07/01/27 Series E AMT | | Aaa/AAA | | | 924,810 | |
| | 315,000 | | 4.850%, 07/01/29 | | Aaa/AAA | | | 312,341 | |
| | 445,000 | | 5.550%, 07/01/33 | | Aaa/AAA | | | 445,080 | |
| | 930,000 | | 4.625%, 07/01/33 | | Aaa/AAA | | | 867,113 | |
| | 600,000 | | 5.150%, 07/01/39 | | Aaa/AAA | | | 596,448 | |
| | | | Kentucky Housing Multifamily Mortgage Revenue | | | | | | |
| | 1,325,000 | | 5.000%, 06/01/35 AMT | | NR/AAA | | | 1,310,465 | |
| | | | Total Housing | | | | | 33,976,906 | |
| | |
| | | | School Building Revenue (24.8%) | | | | | | |
| | | | Barren County, Kentucky School Building Revenue | | | | | | |
| | 1,265,000 | | 4.250%, 08/01/25 CIFG Insured | | Aa2/NR | | | 1,224,849 | |
| | 1,670,000 | | 4.375%, 08/01/26 CIFG Insured | | Aa2/NR | | | 1,617,662 | |
| | | | Boone County, Kentucky School District Finance | | | | | | |
| | | | Corp. School Building Revenue | | | | | | |
| | 140,000 | | 4.750%, 06/01/20 AGMC Insured (pre-refunded) | | Aa2/AA+ | | | 148,058 | |
| | 1,000,000 | | 4.125%, 08/01/22 Syncora Guarantee, Inc. Insured | | Aa2/NR | | | 982,360 | |
| | 1,580,000 | | 4.500%, 08/01/23 AGMC Insured | | Aa2/NR | | | 1,592,340 | |
| | 1,250,000 | | 4.125%, 03/01/25 AGMC Insured | | Aa2/NR | | | 1,141,012 | |
| | | | | | | | |
| CHURCHILL TAX-FREE FUND OF KENTUCKY | |
| SCHEDULE OF INVESTMENTS (continued) | |
| DECEMBER 31, 2010 | |
| | |
| | | | | Rating | | | |
| Principal | | | | Moody’s/S&P | | | |
| Amount | | Revenue Bonds (continued) | | (unaudited) | | Value | |
| | | School Building Revenue (continued) | | | | | |
| | | Bullitt County, Kentucky School District Finance Corp. | | | |
| $ | 200,000 | | 4.300%, 10/01/21 NPFG Insured | | Aa2/NR | | $ | 202,470 | |
| | 2,455,000 | | 4.500%, 10/01/22 NPFG Insured | | Aa2/NR | | | 2,489,444 | |
| | 2,590,000 | | 4.500%, 10/01/23 NPFG Insured | | Aa2/NR | | | 2,613,802 | |
| | 1,145,000 | | 4.500%, 04/01/27 | | Aa2/NR | | | 1,119,112 | |
| | 1,200,000 | | 4.500%, 04/01/28 | | Aa2/NR | | | 1,158,024 | |
| | | | Christian County, Kentucky School District Finance | | | | | | |
| | | | Corp. | | | | | | |
| | 855,000 | | 4.000%, 08/01/20 Syncora Guarantee, Inc. Insured | | Aa2/NR | | | 857,821 | |
| | 905,000 | | 4.000%, 08/01/21 Syncora Guarantee, Inc. Insured | | Aa2/NR | | | 906,475 | |
| | 1,525,000 | | 4.125%, 08/01/23 Syncora Guarantee, Inc. Insured | | Aa2/NR | | | 1,508,011 | |
| | 1,590,000 | | 4.125%, 08/01/24 Syncora Guarantee, Inc. Insured | | Aa2/NR | | | 1,544,049 | |
| | | | Daviess County, Kentucky School District Finance | | | | | | |
| | | | Corp. | | | | | | |
| | 200,000 | | 5.000%, 06/01/24 | | Aa2/NR | | | 204,638 | |
| | | | Fayette County, Kentucky School District Finance | | | | | | |
| | | | Corp. | | | | | | |
| | 5,000,000 | | 4.250%, 04/01/23 AGMC Insured | | Aa2/AA+ | | | 5,007,400 | |
| | 4,335,000 | | 4.375%, 05/01/26 AGMC Insured | | Aa2/AA+ | | | 4,191,295 | |
| | | | Floyd County, Kentucky School Finance Corporation | | | | | | |
| | | | School Building | | | | | | |
| | 1,320,000 | | 4.000%, 03/01/23 Syncora Guarantee, Inc. Insured | | Aa2/NR | | | 1,302,431 | |
| | 1,255,000 | | 4.125%, 03/01/26 Syncora Guarantee, Inc. Insured | | Aa2/NR | | | 1,199,642 | |
| | | | Fort Thomas, Kentucky Independent School District | | | | | | |
| | | | Finance Corp. | | | | | | |
| | 785,000 | | 4.375%, 04/01/21 | | Aa2/NR | | | 795,778 | |
| | 610,000 | | 4.375%, 04/01/25 | | Aa2/NR | | | 593,872 | |
| | | | Franklin County, Kentucky School District Finance | | | | | | |
| | | | Corp. | | | | | | |
| | 1,000,000 | | 5.000%, 04/01/24 | | Aa2/NR | | | 1,022,100 | |
| | | | Graves County, Kentucky School Building Revenue | | | | | | |
| | 1,260,000 | | 5.000%, 06/01/22 | | Aa2/NR | | | 1,297,321 | |
| | 1,320,000 | | 5.000%, 06/01/23 | | Aa2/NR | | | 1,351,152 | |
| | | | | | | | |
| CHURCHILL TAX-FREE FUND OF KENTUCKY | |
| SCHEDULE OF INVESTMENTS (continued) | |
| DECEMBER 31, 2010 | |
| | |
| | | | | Rating | | | |
| Principal | | | | Moody’s/S&P | | | |
| Amount | | Revenue Bonds (continued) | | (unaudited) | | Value | |
| | | School Building Revenue (continued) | | | | | |
| | | Jefferson County, Kentucky School District Finance | | | | | |
| | | Corp. School Building | | | | | |
| $ | 150,000 | | 5.000%, 04/01/20 AGMC Insured (pre-refunded) | | Aa2/AA+ | | $ | 153,180 | |
| | 1,360,000 | | 4.250%, 06/01/21 AGMC Insured | | Aa2/AA+ | | | 1,374,661 | |
| | | | Kenton County, Kentucky School District Finance Corp. | | | | | | |
| | 445,000 | | 4.300%, 04/01/22 CIFG Insured | | Aa2/NR | | | 445,801 | |
| | 4,250,000 | | 5.000%, 06/01/22 NPFG Insured | | Aa2/NR | | | 4,458,420 | |
| | 590,000 | | 4.250%, 10/01/22 AGMC Insured | | Aa2/NR | | | 592,655 | |
| | 750,000 | | 4.375%, 04/01/24 CIFG Insured | | Aa2/NR | | | 740,677 | |
| | 325,000 | | 4.400%, 04/01/26 CIFG Insured | | Aa2/NR | | | 314,112 | |
| | | | Larue County, Kentucky School District Finance Corp. | | | | | | |
| | 270,000 | | 4.500%, 07/01/21 NPFG Insured | | Aa2/NR | | | 275,792 | |
| | 470,000 | | 4.500%, 07/01/22 NPFG Insured | | Aa2/NR | | | 478,690 | |
| | 785,000 | | 4.500%, 07/01/23 NPFG Insured | | Aa2/NR | | | 794,899 | |
| | | | Laurel County, Kentucky School District Finance Corp. | | | | | | |
| | 300,000 | | 4.000%, 06/01/16 AGMC Insured | | Aa2/NR | | | 325,620 | |
| | | | Magoffin County, Kentucky School District | | | | | | |
| | 375,000 | | 4.250%, 08/01/23 AMBAC Insured | | Aa2/NR | | | 375,173 | |
| | 475,000 | | 4.250%, 08/01/25 AMBAC Insured | | Aa2/NR | | | 462,393 | |
| | | | Meade County, Kentucky School District | | | | | | |
| | 490,000 | | 4.250%, 09/01/26 NPFG Insured | | Aa2/NR | | | 472,576 | |
| | | | Ohio County, Kentucky School Building Revenue | | | | | | |
| | 790,000 | | 4.500%, 05/01/24 | | Aa2/NR | | | 796,826 | |
| | 325,000 | | 4.500%, 05/01/25 | | Aa2/NR | | | 325,182 | |
| | | | Oldham County, Kentucky School District Finance Corp. | | | | | | |
| | 500,000 | | 5.000%, 05/01/19 NPFG Insured | | Aa2/NR | | | 526,675 | |
| | 1,000,000 | | 4.500%, 09/01/27 NPFG Insured | | Aa2/NR | | | 958,060 | |
| | | | Owensboro, Kentucky Independent School District | | | | | | |
| | | | Finance Corp. School Building Revenue | | | | | | |
| | 390,000 | | 4.375%, 09/01/24 | | Aa2/NR | | | 392,886 | |
| | | | Pendleton County, Kentucky School District Finance | | | | | | |
| | | | Corp. School Building Revenue | | | | | | |
| | 730,000 | | 4.000%, 02/01/23 NPFG Insured | | Aa2/NR | | | 710,195 | |
| | | | | | | | |
| CHURCHILL TAX-FREE FUND OF KENTUCKY | |
| SCHEDULE OF INVESTMENTS (continued) | |
| DECEMBER 31, 2010 | |
| | |
| | |
| | | | | Rating | | | |
| Principal | | | | Moody’s/S&P | | | |
| Amount | | Revenue Bonds (continued) | | (unaudited) | | Value | |
| | | School Building Revenue (continued) | | | | | |
| | | Pike County, Kentucky School Building Revenue | | | | | |
| $ | 1,355,000 | | 4.375%, 10/01/26 NPFG Insured | | Aa2/NR $ | | | 1,312,182 | |
| | | | Scott County, Kentucky School District Finance Corp. | | | | | | |
| | 1,115,000 | | 4.200%, 01/01/22 AMBAC Insured | | Aa2/NR | | | 1,131,357 | |
| | 1,955,000 | | 4.250%, 01/01/23 AMBAC Insured | | Aa2/NR | | | 1,977,170 | |
| | 1,560,000 | | 4.300%, 01/01/24 AMBAC Insured | | Aa2/NR | | | 1,572,511 | |
| | 1,000,000 | | 4.250%, 02/01/27 AGMC Insured | | Aa2/NR | | | 926,630 | |
| | | | Spencer County, Kentucky School District Finance | | | | | | |
| | | | Corp., School Building Revenue | | | | | | |
| | 1,000,000 | | 4.500%, 08/01/27 AGMC Insured | | Aa2/NR | | | 991,900 | |
| | | | Warren County, Kentucky School District Finance Corp. | | | | | | |
| | 295,000 | | 4.125%, 02/01/23 NPFG Insured | | Aa2/NR | | | 291,811 | |
| | 1,000,000 | | 4.375%, 04/01/27 AGMC Insured | | Aa2/NR | | | 908,850 | |
| | | | Total School Building Revenue | | | | | 60,158,002 | |
| | |
| | | | Transportation (10.2%) | | | | | | |
| | | | Kenton County, Kentucky Airport Board Airport Revenue | | | | | | |
| | 1,300,000 | | 5.000%, 03/01/23 NPFG Insured AMT | | A3/A- | | | 1,274,403 | |
| | | | Kentucky State Turnpike Authority Revenue | | | | | | |
| | 3,000,000 | | 4.450%, 07/01/22 Series B | | Aa2/AA+ | | | 3,062,970 | |
| | 3,500,000 | | 5.000%, 07/01/25 | | Aa2/AA+ | | | 3,657,500 | |
| | 2,250,000 | | 5.000%, 07/01/27 | | Aa2/AA+ | | | 2,307,892 | |
| | 1,100,000 | | 5.000%, 07/01/28 | | Aa2/AA+ | | | 1,121,318 | |
| | 1,165,000 | | 5.000%, 07/01/29 | | Aa2/AA+ | | | 1,182,708 | |
| | | | Louisville, Kentucky Regional Airport Authority | | | | | | |
| | 1,000,000 | | 5.250%, 07/01/23 AGMC Insured AMT | | Aa3/AA+ | | | 1,011,090 | |
| | 2,610,000 | | 5.000%, 07/01/24 AMBAC Insured AMT | | A1/A+ | | | 2,490,488 | |
| | | | Louisville & Jefferson County Regional Airport, Kentucky | | | | | | |
| | 1,000,000 | | 5.250%, 07/01/18 AGMC Insured AMT | | Aa3/AA+ | | | 1,031,720 | |
| | 2,000,000 | | 5.250%, 07/01/20 AGMC Insured AMT | | Aa3/AA+ | | | 2,035,400 | |
| | 1,370,000 | | 5.250%, 07/01/21 AGMC Insured AMT | | Aa3/AA+ | | | 1,388,454 | |
| | 3,390,000 | | 5.250%, 07/01/22 AGMC Insured AMT | | Aa3/AA+ | | | 3,424,578 | |
| | 275,000 | | 5.375%, 07/01/23 AGMC Insured AMT | | Aa3/AA+ | | | 276,969 | |
| | 500,000 | | 5.000%, 07/01/25 NPFG Insured AMT | | A1/A+ | | | 471,440 | |
| | | | Total Transportation | | | | | 24,736,930 | |
| | | | | | | | |
| CHURCHILL TAX-FREE FUND OF KENTUCKY | |
| SCHEDULE OF INVESTMENTS (continued) | |
| DECEMBER 31, 2010 | |
| | |
| | | | | Rating | | | |
| Principal | | | | Moody’s/S&P | | | |
| Amount | | Revenue Bonds (continued) | | (unaudited) | | Value | |
| | | Utilities (11.2%) | | | | | |
| | | Campbell & Kenton Counties, Kentucky (Sanitation | | | | | |
| | | District) Revenue | | | | | |
| $ | 1,695,000 | | 4.300%, 08/01/24 NPFG Insured | | Aa2/AA | | $ | 1,699,119 | |
| | 2,370,000 | | 4.000%, 08/01/27 | | Aa2/AA | | | 2,170,944 | |
| | 300,000 | | 4.300%, 08/01/27 NPFG Insured | | Aa2/AA | | | 289,296 | |
| | 1,450,000 | | 4.300%, 08/01/28 NPFG Insured | | Aa2/AA | | | 1,379,429 | |
| | | | Carroll County, Kentucky Environmental Facilities | | | | | | |
| | | | Revenue (Kentucky Utilities) AMT | | | | | | |
| | 1,500,000 | | 5.750%, 02/01/26 AMBAC Insured | | A2/BBB+ | | | 1,536,210 | |
| | | | Kentucky Rural Water Finance Corp. | | | | | | |
| | 205,000 | | 4.250%, 08/01/19 NPFG Insured | | Baa1/AA- | | | 209,176 | |
| | 595,000 | | 5.000%, 02/01/20 NPFG Insured | | Baa1/AA- | | | 614,814 | |
| | 210,000 | | 4.250%, 08/01/20 NPFG Insured | | Baa1/AA- | | | 212,909 | |
| | 200,000 | | 4.375%, 08/01/22 NPFG Insured | | Baa1/AA- | | | 203,008 | |
| | 240,000 | | 4.500%, 08/01/23 NPFG Insured | | Baa1/AA- | | | 243,658 | |
| | 200,000 | | 4.500%, 02/01/24 NPFG Insured | | Baa1/AA- | | | 203,266 | |
| | 255,000 | | 4.500%, 08/01/24 NPFG Insured | | Baa1/AA- | | | 257,369 | |
| | 355,000 | | 4.600%, 02/01/25 | | NR/AA- | | | 357,332 | |
| | 290,000 | | 4.500%, 08/01/27 NPFG Insured | | Baa1/AA- | | | 284,345 | |
| | 245,000 | | 4.600%, 08/01/28 NPFG Insured | | Baa1/AA- | | | 239,505 | |
| | 315,000 | | 4.625%, 08/01/29 NPFG Insured | | Baa1/AA- | | | 305,251 | |
| | | | Kentucky State Municipal Power Agency, Prairie St. | | | | | | |
| | | | Project | | | | | | |
| | 1,000,000 | | 5.000%, 09/01/23 AGMC Insured | | Aa3/AA+ | | | 1,037,160 | |
| | | | Louisville & Jefferson County, Kentucky Metropolitan | | | | | | |
| | | | Sewer District | | | | | | |
| | 2,380,000 | | 4.250%, 05/15/20 AGMC Insured | | Aa3/AA+ | | | 2,447,640 | |
| | 2,510,000 | | 4.250%, 05/15/21 AGMC Insured | | Aa3/AA+ | | | 2,566,048 | |
| | 1,500,000 | | 5.000%, 05/15/26 AGMC Insured | | Aa3/AA+ | | | 1,537,680 | |
| | | | Northern Kentucky Water District | | | | | | |
| | 660,000 | | 5.000%, 02/01/23 NPFG FGIC Insured | | Aa3/NR | | | 672,692 | |
| | 1,825,000 | | 6.000%, 02/01/28 AGMC Insured | | Aa3/NR | | | 1,996,495 | |
| | | | | | | | | |
| CHURCHILL TAX-FREE FUND OF KENTUCKY | |
| SCHEDULE OF INVESTMENTS (continued) | |
| DECEMBER 31, 2010 | |
| | |
| | |
| | | | | Rating | | | |
| Principal | | | | Moody’s/S&P | | | |
| Amount | | Revenue Bonds (continued) | | (unaudited) | | Value | |
| | | Utilities (continued) | | | | | | |
| | | Owensboro, Kentucky Electric and Power | | | | | | |
| $ | 1,555,000 | | 5.000%, 01/01/20 AGMC Insured (pre-refunded) | | Aa3/AAA | | $ | 1,555,000 | |
| | 1,000,000 | | 5.000%, 01/01/21 AGMC Insured | | Aa3/AA+ | | | 1,046,410 | |
| | | | Owensboro, Kentucky Water Revenue | | | | | | | |
| | 500,000 | | 5.000%, 09/15/27 AGMC Insured | | Aa3/NR | | | 516,730 | |
| | | | Owensboro-Daviess County, Kentucky Regional | | | | | | | |
| | | | Water Resource Agency Wastewater Refunding | | | | | | | |
| | | | & Improvement Revenue | | | | | | | |
| | 930,000 | | 4.375%, 01/01/27 Series A Syncora Guarantee, Inc. | | | | | | | |
| | | | Insured | | NR/AA- | | | 854,930 | |
| | | | Trimble County, Kentucky Environmental Facilities | | | | | | | |
| | 3,000,000 | | 4.600%, 06/01/33 AMBAC Insured | | A2/A | | | 2,708,160 | |
| | | | Total Utilities | | | | | | | 27,144,576 | |
| | | | Total Revenue Bonds | | | | | | | 232,959,858 | |
| | | | Total Investments (cost $244,165,695-note 4) | | | 100.4 | % | | | 243,231,065 | |
| | | | Other assets less liabilities | | | (0.4 | ) | | | (909,015 | ) |
| | | | Net Assets | | | 100.0 | % | | $ | 242,322,050 | |
| | * | Any security not rated (NR) by any of the approved credit rating services has been determined by the Investment Adviser to have sufficient quality to be ranked in the top four credit ratings if a credit rating were to be assigned by a rating service. | |
| | | | |
| | Fitch ratings | |
| | ** | AA | |
| | *** | A | |
| | **** | AAA | |
| |
| CHURCHILL TAX-FREE FUND OF KENTUCKY |
| SCHEDULE OF INVESTMENTS (continued) |
| DECEMBER 31, 2010 |
| | | | | | |
| | | | Percent of | | |
| | Portfolio Distribution By Quality Rating | | Portfolio† | | |
| | | | |
| | Aaa of Moody’s or AAA of S&P or Fitch | | | 14.8 | % | |
| | Pre-refunded bonds††/ Escrowed to maturity bonds | | | 0.8 | | |
| | Aa of Moody’s or AA of S&P or Fitch | | | 69.4 | | |
| | A of Moody’s or S&P or Fitch | | | 14.4 | | |
| | Baa of Moody’s or BBB of S&P | | | 0.4 | | |
| | Not rated* | | | 0.2 | | |
| | | | | 100.0 | % | |
| | † | Calculated using the highest rating of the two rating services. | |
| | †† | Pre-refunded bonds are bonds for which U.S. Government Obligations have been placed in escrow to retire the bonds at their earliest call date. | |
| | | |
| | PORTFOLIO ABBREVIATIONS | |
| | AGMC - Assured Guaranty Municipal Corp. | |
| | AMBAC - American Municipal Bond Assurance Corp. | |
| | AMT - Alternative Minimum Tax | |
| | CIFG - CDC IXIS Financial Guaranty | |
| | FGIC - Financial Guaranty Insurance Co. | |
| | FHA - Financial Housing Administration | |
| | FNMA - Federal National Mortgage Association | |
| | LOC - Letter of Credit | |
| | NPFG - National Public Finance Guarantee | |
| | NR - Not Rated | |
See accompanying notes to financial statements.
| | |
| CHURCHILL TAX-FREE FUND OF KENTUCKY |
| STATEMENT OF ASSETS AND LIABILITIES |
| DECEMBER 31, 2010 |
| |
| ASSETS | |
| Investments at value (cost $244,165,695) | $243,231,065 |
| Interest receivable | 3,675,390 |
| Receivable for Fund shares sold | 115,468 |
| Other assets | 14,061 |
| Total assets | 247,035,984 |
| LIABILITIES | |
| Cash overdraft | 3,662,180 |
| Dividends payable | 531,430 |
| Payable for Fund shares redeemed | 366,397 |
| Management fee payable | 84,017 |
| Distribution and service fees payable | 2,081 |
| Accrued expenses | 67,829 |
| Total liabilities | 4,713,934 |
| NET ASSETS | $242,322,050 |
| Net Assets consist of: | |
| Capital Stock - Authorized an unlimited number of shares, par value $0.01 per share | $ 236,209 |
| Additional paid-in capital | 243,314,224 |
| Net unrealized depreciation on investments (note 4) | (934,630) |
| Undistributed net investment income | 110,451 |
| Accumulated net realized loss on investments | (404,204) |
| | $242,322,050 |
| CLASS A | |
| Net Assets | $186,297,707 |
| Capital shares outstanding | 18,161,132 |
| Net asset value and redemption price per share | $ 10.26 |
| Maximum offering price per share (100/96 of $10.26 adjusted to nearest cent) | $ 10.69 |
| CLASS C | |
| Net Assets | $ 8,657,448 |
| Capital shares outstanding | 844,433 |
| Net asset value and offering price per share | $ 10.25 |
| Redemption price per share (*a charge of 1% is imposed on the redemption | |
| proceeds of the shares, or on the original price, whichever is lower, if redeemed | |
| during the first 12 months after purchase) | $ 10.25* |
| CLASS I | |
| Net Assets | $ 7,428,535 |
| Capital shares outstanding | 724,530 |
| Net asset value, offering and redemption price per share | $ 10.25 |
| CLASS Y | |
| Net Assets | $ 39,938,360 |
| Capital shares outstanding | 3,890,849 |
| Net asset value, offering and redemption price per share | $ 10.26 |
See accompanying notes to financial statements.
| | | | | | | |
| CHURCHILL TAX-FREE FUND OF KENTUCKY | |
| STATEMENT OF OPERATIONS | |
| YEAR ENDED DECEMBER 31, 2010 | |
| | |
| Investment Income: | | | | | | |
| | |
| Interest income | | | | | $ | 11,615,189 | |
| | |
| Expenses: | | | | | | | |
| | |
| Management fee (note 3) | | $ | 1,022,782 | | | | | |
| Distribution and service fees (note 3) | | | 376,366 | | | | | |
| Transfer and shareholder servicing agent fees (note 3) | | | 126,246 | | | | | |
| Trustees’ fees and expenses (note 8) | | | 121,972 | | | | | |
| Legal fees (note 3) | | | 73,844 | | | | | |
| Shareholders’ reports and proxy statements | | | 43,175 | | | | | |
| Fund accounting fees | | | 36,422 | | | | | |
| Auditing and tax fees | | | 23,358 | | | | | |
| Custodian fees (note 6) | | | 22,580 | | | | | |
| Insurance | | | 13,219 | | | | | |
| Registration fees and dues | | | 12,883 | | | | | |
| Chief compliance officer (note 3) | | | 4,507 | | | | | |
| Miscellaneous | | | 30,783 | | | | | |
| Total expenses | | | 1,908,137 | | | | | |
| | |
| Expenses paid indirectly (note 6) | | | (182 | ) | | | | |
| Net expenses | | | | | | | 1,907,955 | |
| Net investment income | | | | | | | 9,707,234 | |
| | |
| Realized and Unrealized Gain (Loss) on Investments: | | | | | | | | |
| | |
| Net realized gain (loss) from securities transactions | | | 294,298 | | | | | |
| Change in unrealized appreciation on investments | | | (6,494,881 | ) | | | | |
| | |
| Net realized and unrealized gain (loss) on investments | | | | | | | (6,200,583 | ) |
| Net change in net assets resulting from operations | | | | | | $ | 3,506,651 | |
See accompanying notes to financial statements.
| | | | | | | |
| CHURCHILL TAX-FREE FUND OF KENTUCKY | |
| STATEMENTS OF CHANGES IN NET ASSETS | |
| | |
| | | Year Ended | | | Year Ended | |
| | | December 31, 2010 | | | December 31, 2009 | |
| OPERATIONS: | | | | | | |
| Net investment income | | $ | 9,707,234 | | | $ | 9,481,325 | |
| Net realized gain (loss) from securities transactions | | | 294,298 | | | | (200,761 | ) |
| Change in unrealized appreciation (depreciation) on investments | | | (6,494,881 | ) | | | 25,337,616 | |
| Change in net assets from operations | | | 3,506,651 | | | | 34,618,180 | |
| DISTRIBUTIONS TO SHAREHOLDERS (note 10): | | | | | | | | |
| Class A Shares: | | | | | | | | |
| Net investment income | | | (7,511,295 | ) | | | (7,313,389 | ) |
| Class C Shares: | | | | | | | | |
| Net investment income | | | (180,927 | ) | | | (98,972 | ) |
| Class I Shares: | | | | | | | | |
| Net investment income | | | (293,441 | ) | | | (307,836 | ) |
| Class Y Shares: | | | | | | | | |
| Net investment income | | | (1,687,816 | ) | | | (1,750,804 | ) |
| Change in net assets from distributions | | | (9,673,479 | ) | | | (9,471,001 | ) |
| CAPITAL SHARE TRANSACTIONS (note 7): | | | | | | | | |
| Proceeds from shares sold | | | 29,705,865 | | | | 35,468,477 | |
| Reinvested dividends and distributions | | | 3,954,939 | | | | 3,804,880 | |
| Cost of shares redeemed | | | (38,196,770 | ) | | | (28,780,114 | ) |
| Change in net assets from capital share transactions | | | (4,535,966 | ) | | | 10,493,243 | |
| Change in net assets | | | (10,702,794 | ) | | | 35,640,422 | |
| NET ASSETS: | | | | | | | | |
| Beginning of period | | | 253,024,844 | | | | 217,384,422 | |
| End of period* | | $ | 242,322,050 | | | $ | 253,024,844 | |
| | |
| * Includes undistributed net investment income of: | | $ | 110,451 | | | $ | 76,631 | |
See accompanying notes to financial statements.
| |
| CHURCHILL TAX-FREE FUND OF KENTUCKY |
| NOTES TO FINANCIAL STATEMENTS |
| DECEMBER 31, 2010 |
1. Organization
Churchill Tax-Free Fund of Kentucky (the “Fund”), a non-diversified, open-end investment company, was organized in March, 1987 as a Massachusetts business trust and commenced operations on May 21, 1987. The Fund is authorized to issue an unlimited number of shares and, since its inception to April 1, 1996, offered only one class of shares. On that date, the Fund began offering two additional classes of shares, Class C and Class Y Shares. All shares outstanding prior to that date were designated as Class A Shares and are sold at net asset value plus a sales charge (of varying size depending upon a variety of factors) paid at the time of purchase and bear a distribution fee. Class C Shares are sold at net asset value with no sales charge payable at the time of purchase but with a level charge for service and distribution fees for six years thereafter. Class C Shares automatically convert to Class A Shares after six years. Class Y Shares are sold only through institutions acting for investors in a fiduciary, advisory, agency, custodial or similar capacity, and are not offered directly to retail customers. Class Y Shares are sold at net asset value with no sales charge, no redemption fee, no contingent deferred sales charge (“CDSC”) and no distribution fee. On April 30, 1998, the Fund established Class I Shares which are offered and sold only through financial intermediaries and are not offered directly to retail customers. Class I Shares are sold at net asset value with no sales charge and no redemption fee or CDSC, although a financial intermediary may charge a fee for effecting a purchase or other transaction on behalf of its customers. Class I Shares may carry a distribution and a service fee. All classes of shares represent interests in the same portfolio of investments and are identical as to rights and privileges but differ with respect to the effect of sales charges, the distribution and/or service fees borne by each class, expenses specific to each class, voting rights on matters affecting a single class and the exchange privileges of each class.
2. Significant Accounting Policies
The following is a summary of significant accounting policies followed by the Fund in the preparation of its financial statements. The policies are in conformity with accounting principles generally accepted in the United States of America for investment companies.
| a) | Portfolio valuation: Municipal securities which have remaining maturities of more than 60 days are valued each business day based upon information provided by a nationally prominent independent pricing service and periodically verified through other pricing services. In the case of securities for which market quotations are readily available, securities are valued by the pricing service at the mean of bid and asked quotations. If a market quotation or a valuation from the pricing service is not readily available, the security is valued at fair value determined in good faith under procedures established by and under the general supervision of the Board of Trustees. Securities which mature in 60 days or less are valued at amortized cost if their term to maturity at purchase is 60 days or less, or by amortizing their unrealized appreciation or depreciation on the 61st day prior to maturity, if their term to maturity at purchase exceeds 60 days. |
| b) | Fair Value Measurements: The Fund follows a fair value hierarchy that distinguishes between market data obtained from independent sources (observable inputs) and the Fund’s own market assumptions (unobservable inputs). These inputs are used in determining the value of the Fund’s investments and are summarized in the following fair value hierarchy. |
Level 1 – Unadjusted quoted prices in inactive markets for identical assets or liabilities that the Fund has the ability to access.
| |
| CHURCHILL TAX-FREE FUND OF KENTUCKY |
| NOTES TO FINANCIAL STATEMENTS (continued) |
| DECEMBER 31, 2010 |
Level 2 – Observable inputs other than quoted prices included in Level 1 that are observable for the asset or liability, either directly or indirectly. These inputs may include quoted prices for the identical instrument on an inactive market, prices for similar instruments, interest rates, prepayment speeds, credit risk, yield curves, default rates and similar data.
Level 3 – Unobservable inputs for the asset or liability, to the extent relevant observable inputs are not available, representing the Fund’s own assumptions about the assumptions a market participant would use in valuing the asset or liability, and would be based on the best information available.
The inputs or methodology used for valuing securities are not an indication of the risk associated with investing in those securities.
The following is a summary of the valuation inputs, representing 100% of the Fund’s investments, used to value the Fund’s net assets as of December 31, 2010:
| | | | |
| Valuation Inputs | | | Investments in Securities | |
| Level 1 – Quoted Prices | | $ | — | |
| Level 2 – Other Significant Observable Inputs — | | | | |
| Municipal Bonds* | | | 243,231,065 | |
| Level 3 – Significant Unobservable Inputs | | | — | |
| Total | | $ | 243,231,065 | |
* See schedule of investments for a detailed listing of securities.
| c) | Subsequent events: In preparing these financial statements, the Fund has evaluated events and transactions for potential recognition or disclosure through the date these financial statements were issued. |
| d) | Securities transactions and related investment income: Securities transactions are recorded on the trade date. Realized gains and losses from securities transactions are reported on the identified cost basis. Interest income is recorded daily on the accrual basis and is adjusted for amortization of premium and accretion of original issue and market discount. |
| e) | Federal income taxes: It is the policy of the Fund to continue to qualify as a regulated investment company by complying with the provisions of the Internal Revenue Code applicable to certain investment companies. The Fund intends to make distributions of income and securities profits sufficient to relieve it from all, or substantially all, Federal income and excise taxes. |
Management has reviewed the tax positions for each of the open tax years (2007-2009) or expected to be taken in the Fund’s 2010 tax returns and has concluded that there are no significant uncertain tax positions that would require recognition in the financial statements.
| f) | Multiple class allocations: All income, expenses (other than class-specific expenses), and realized and unrealized gains or losses are allocated daily to each class of shares based on the relative net assets of each class. Class-specific expenses, which include distribution and service fees and any other items that are specifically attributed to a particular class, are also charged directly to such class on a daily basis. |
| g) | Use of estimates: The preparation of financial statements in conformity with accounting principles generally accepted in the United States of America requires management to make estimates and assumptions that affect the reported amounts of assets and liabilities and disclosure of contingent assets and liabilities at the date of the financial statements and the reported amounts of increases and decreases in net assets from operations during the reporting period. Actual results could differ from those estimates. |
| |
| CHURCHILL TAX-FREE FUND OF KENTUCKY |
| NOTES TO FINANCIAL STATEMENTS (continued) |
| DECEMBER 31, 2010 |
| h) | Reclassification of capital accounts: Accounting principles generally accepted in the United States of America require that certain components of net assets relating to permanent differences be reclassified between financial and tax reporting. On December 31, 2010 the Fund increased undistributed net investment income by $65 and decreased additional paid-in capital by $65. These reclassifications had no effect on net assets or net asset value per share. |
| i) | Accounting pronouncement: In January 2010, the Financial Accounting Standards Board (“FASB”) issued Accounting Standards Update “Improving Disclosures about Fair Value Measurements” (“ASU”). The ASU requires enhanced disclosures about a) transfers into and out of Levels 1 and 2, and b) purchases, sales, issuances, and settlements on a gross basis relating to Level 3 measurements. The first disclosure became effective for the first reporting period beginning after December 15, 2009, and for interim periods within those fiscal years. There were no significant transfers into and out of Levels 1 and 2 during the current period presented. |
The second disclosure will become effective for fiscal year ends beginning after December 15, 2010, and for interim periods within those fiscal years. Management has evaluated the impact and has incorporated the appropriate disclosures required by the ASU in its financial statement disclosures.
3. Fees and Related Party Transactions
a) Management Arrangements:
Aquila Investment Management LLC (the “Manager”), a wholly-owned subsidiary of Aquila Management Corporation, the Fund’s founder and sponsor, serves as the Manager for the Fund under an Advisory and Administration Agreement with the Fund. Under the Advisory and Administration Agreement, the Manager provides all investment management and administrative services to the Fund. The Manager’s services include providing the office of the Fund and all related services as well as managing relationships with all of the various support organizations to the Fund such as the shareholder servicing agent, custodian, legal counsel, fund accounting agent, auditors and distributor. For its services, the Manager is entitled to receive a fee which is payable monthly and computed as of the close of business each day at the annual rate of 0.40 of 1% on the Fund’s average net assets.
Under a Compliance Agreement with the Manager, the Manager is compensated for Chief Compliance Officer related services provided to enable the Fund to comply with Rule 38a-1 of the Investment Company Act of 1940.
Specific details as to the nature and extent of the services provided by the Manager are more fully defined in the Fund’s Prospectus and Statement of Additional Information. b) Distribution and Service Fees:
The Fund has adopted a Distribution Plan (the “Plan”) pursuant to Rule 12b-1 (the “Rule”) under the Investment Company Act of 1940. Under one part of the Plan, with respect to Class A Shares, the Fund is authorized to make distribution fee payments to broker-dealers (“Qualified Recipients”) or others selected by Aquila Distributors, Inc. (the “Distributor”) including, but not limited to, any principal underwriter of the Fund, with which the Distributor has entered into written agreements contemplated by the Rule and which have rendered assistance in the distribution and/or retention of the Fund’s shares or servicing of shareholder accounts. The Fund makes payment of this distribution fee at the annual rate of 0.15% of the Fund’s average
| |
| CHURCHILL TAX-FREE FUND OF KENTUCKY |
| NOTES TO FINANCIAL STATEMENTS (continued) |
| DECEMBER 31, 2010 |
net assets represented by Class A Shares. For the year ended December 31, 2010, distribution fees on Class A Shares amounted to $297,723 of which the Distributor retained $11,094.
Under another part of the Plan, the Fund is authorized to make payments with respect to Class C Shares to Qualified Recipients which have rendered assistance in the distribution and/or retention of the Fund’s Class C shares or servicing of shareholder accounts. These payments are made at the annual rate of 0.75% of the Fund’s average net assets represented by Class C Shares and for the year ended December 31, 2010, amounted to $46,855. In addition, under a Shareholder Services Plan, the Fund is authorized to make service fee payments with respect to Class C Shares to Qualified Recipients for providing personal services and/or maintenance of shareholder accounts. These payments are made at the annual rate of 0.25% of the Fund’s average net assets represented by Class C Shares and for the year ended December 31, 2010, amounted to $15,618. The total of these payments with respect to Class C Shares amounted to $62,473 of which the Distributor retained $6,591.
Under another part of the Plan, the Fund is authorized to make payments with respect to Class I Shares to Qualified Recipients. Class I payments, under the Plan, may not exceed for any fiscal year of the Fund a rate (currently 0.20%), set from time to time by the Board of Trustees, of not more than 0.25% of the average annual net assets represented by the Class I Shares. In addition, Class I has a Shareholder Services Plan under which it may pay service fees (currently 0.15%) of not more than 0.25% of the average annual net assets represented by Class I Shares. That is, the total payments under both plans will not exceed 0.50% of such net assets. For the year ended December 31, 2010, these payments were made at the average annual rate of 0.35% of such net assets and amounted to $28,297 of which $16,170 related to the Plan and $12,127 related to the Shareholder Services Plan.
Specific details about the Plans are more fully defined in the Fund’s Prospectus and Statement of Additional Information.
Under a Distribution Agreement, the Distributor serves as the exclusive distributor of the Fund’s shares. Through agreements between the Distributor and various brokerage and advisory firms (“intermediaries”), the Fund’s shares are sold primarily through the facilities of intermediaries having offices within Kentucky, with the bulk of any sales commissions inuring to such intermediaries. For the year ended December 31, 2010, total commissions on sales of Class A Shares amounted to $277,793 of which the Distributor received $26,548.
c) Other Related Party Transactions:
For the year ended December 31, 2010, the Fund incurred $73,559 of legal fees allocable to Butzel Long PC, counsel to the Fund, for legal services in conjunction with the Fund’s ongoing operations. The Secretary of the Fund is Of Counsel to that firm.
4. Purchases and Sales of Securities
During the year ended December 31, 2010, purchases of securities and proceeds from the sales of securities aggregated $21,290,215 and $20,890,637, respectively.
At December 31, 2010, the aggregate tax cost for all securities was $244,055,244. At December 31, 2010, the aggregate gross unrealized appreciation for all securities in which there is an excess of value over tax cost amounted to $3,167,084 and aggregate gross unrealized depreciation for all securities in which there is an excess of tax cost over value amounted to $3,991,263 for a net unrealized depreciation of $824,179.
| |
| CHURCHILL TAX-FREE FUND OF KENTUCKY |
| NOTES TO FINANCIAL STATEMENTS (continued) |
| DECEMBER 31, 2010 |
5. Portfolio Orientation
Since the Fund invests principally and may invest entirely in double tax-free municipal obligations of issuers within Kentucky, it is subject to possible risks associated with economic, political, or legal developments or industrial or regional matters specifically affecting Kentucky and whatever effects these may have upon Kentucky issuers’ ability to meet their obligations.
6. Expenses
The Fund has negotiated an expense offset arrangement with its custodian wherein it receives credit toward the reduction of custodian fees and other Fund expenses whenever there are uninvested cash balances. The Statement of Operations reflects the total expenses before any offset, the amount of offset and the net expenses.
7. Capital Share Transactions
Transactions in Capital Shares of the Fund were as follows:
| | | | | | | | | | | | | |
| | | Year Ended | | | Year Ended | |
| | | December 31, 2010 | | | December 31, 2009 | |
| | | Shares | | | Amount | | | Shares | | | Amount | |
| | |
| Class A Shares: | | | | | | | | | | | | |
| Proceeds from shares sold . | | | 1,803,306 | | | $ | 19,131,302 | | | | 2,169,858 | | | $ | 22,316,773 | |
| Reinvested distributions | | | 327,573 | | | | 3,470,108 | | | | 327,487 | | | | 3,368,846 | |
| Cost of shares redeemed | | | (2,503,968 | ) | | | (26,349,593 | ) | | | (1,956,408 | ) | | | (19,972,149 | ) |
| Net change | | | (373,089 | ) | | | (3,748,183 | ) | | | 540,937 | | | | 5,713,470 | |
| | |
| Class C Shares: | | | | | | | | | | | | | | | | |
| Proceeds from shares sold . | | | 525,293 | | | | 5,584,681 | | | | 211,585 | | | | 2,187,246 | |
| Reinvested distributions | | | 12,084 | | | | 127,918 | | | | 6,556 | | | | 67,529 | |
| Cost of shares redeemed | | | (93,357 | ) | | | (983,541 | ) | | | (103,685 | ) | | | (1,058,133 | ) |
| Net change | | | 444,020 | | | | 4,729,058 | | | | 114,456 | | | | 1,196,642 | |
| | |
| Class I Shares: | | | | | | | | | | | | | | | | |
| Proceeds from shares sold . | | | 10,426 | | | | 112,001 | | | | 13,106 | | | | 136,866 | |
| Reinvested distributions | | | 26,665 | | | | 282,514 | | | | 28,913 | | | | 297,017 | |
| Cost of shares redeemed | | | (106,910 | ) | | | (1,137,940 | ) | | | (76,705 | ) | | | (769,822 | ) |
| Net change | | | (69,819 | ) | | | (743,425 | ) | | | (34,686 | ) | | | (335,939 | ) |
| | |
| Class Y Shares: | | | | | | | | | | | | | | | | |
| Proceeds from shares sold . | | | 459,533 | | | | 4,877,881 | | | | 1,061,868 | | | | 10,827,592 | |
| Reinvested distributions | | | 7,017 | | | | 74,399 | | | | 6,966 | | | | 71,488 | |
| Cost of shares redeemed | | | (916,419 | ) | | | (9,725,696 | ) | | | (683,019 | ) | | | (6,980,010 | ) |
| Net change | | | (449,869 | ) | | | (4,773,416 | ) | | | 385,815 | | | | 3,919,070 | |
| Total transactions in Fund | | | | | | | | | | | | | | | | |
| shares | | | (448,757 | ) | | $ | (4,535,966 | ) | | | 1,006,522 | | | $ | 10,493,243 | |
CHURCHILL TAX-FREE FUND OF KENTUCKY
NOTES TO FINANCIAL STATEMENTS (continued)
DECEMBER 31, 2010
8. Trustees’ Fees and Expenses
At December 31, 2010 there were 8 Trustees, one of whom is affiliated with the Manager and is not paid any fees. The total amount of Trustees’ service fees (for carrying out their responsibilities) and attendance fees paid during the year ended December 31, 2010 was $91,376. Attendance fees are paid to those in attendance at regularly scheduled quarterly Board Meetings and meetings of the independent Trustees held prior to each quarterly Board Meeting, as well as additional meetings (such as Audit, Nominating, Shareholder and special meetings). Trustees are reimbursed for their expenses such as travel, accommodations and meals incurred in connection with attendance at Board Meetings and at the Annual Meeting of Shareholders. For the year ended December 31, 2010, such meeting-related expenses amounted to $30,596.
9. Securities Traded on a When-Issued Basis
The Fund may purchase or sell securities on a when-issued basis. When-issued transactions arise when securities are purchased or sold by the Fund with payment and delivery taking place in the future in order to secure what is considered to be an advantageous price and yield to the Fund at the time of entering into the transaction. Beginning on the date the Fund enters into a when-issued transaction, cash or other liquid securities are segregated in an amount equal to or greater than the value of the when-issued transaction. These transactions are subject to market fluctuations and their current value is determined in the same manner as for other securities.
10. Income Tax Information and Distributions
The Fund declares dividends daily from net investment income and makes payments monthly. Net realized capital gains, if any, are distributed annually and are taxable. Dividends and capital gains distributions are paid in additional shares at the net asset value per share, in cash, or in a combination of both, at the shareholder’s option.
The Fund intends to maintain, to the maximum extent possible, the tax-exempt status of interest payments received from portfolio municipal securities in order to allow dividends paid to shareholders from net investment income to be exempt from regular Federal and Commonwealth of Kentucky income taxes. Due to differences between financial statement reporting and Federal income tax reporting requirements, distributions made by the Fund may not be the same as the Fund’s net investment income, and/or net realized securities gains. Further, a small portion of the dividends may, under some circumstances, be subject to taxes at ordinary income and/or capital gain rates. For certain shareholders, some dividend income may, under some circumstances, be subject to the alternative minimum tax. As of December 31, 2010, the Fund had a capital loss carryover of $287,861 of which $112,779 expires in 2016 and $175,082 expires in 2017 if not offset by future capital gains.
As of December 31, 2010, there were post-October capital loss deferrals of $116,344, which will be recognized in the following year.
| |
| CHURCHILL TAX-FREE FUND OF KENTUCKY |
| NOTES TO FINANCIAL STATEMENTS (continued) |
| DECEMBER 31, 2010 |
The tax character of distributions:
| | | | | | | |
| | | Year Ended December 31, | |
| | | 2010 | | | 2009 | |
| Net tax-exempt income | | $ | 9,673,479 | | | $ | 9,470,948 | |
| Taxable income | | | – | | | | 53 | |
| Net realized gain on investments | | | – | | | | – | |
| | | $ | 9,673,479 | | | $ | 9,471,001 | |
As of December 31, 2010, the components of distributable earnings on a tax basis were as follows:
| | | | |
| Capital loss carry forward | | $ | (287,861 | ) |
| Unrealized depreciation | | | (824,179 | ) |
| Undistributed tax-exempt income | | | 531,430 | |
| Other accumulated losses | | | (116,344 | ) |
| Other temporary differences | | | (531,430 | ) |
| | | $ | (1,228,384 | ) |
The difference between book basis and tax basis unrealized appreciation is attributable primarily to premium/discount adjustments.The difference between book basis and tax basis undistributed income is due to the timing difference in recognizing dividends paid.
11. Ongoing Development
The three major rating agencies (Standard & Poor’s, Moody’s and Fitch) have downgraded or eliminated ratings of the majority of the municipal bond insurance companies since December 2007 due to loss of capital from investments in subprime mortgages. As such, only a few are now deemed to be investment grade. Thus, while certain bonds still have insurance, some are no longer rated based upon the ratings of their insurers. Furthermore, because the ability of many of the Fund’s insurers to pay claims has been downgraded, the protection of such insurance has been diminished, and there is no assurance that some of them may be relied on for payment.
| | | | | | | | | | | | | | | | | | | | | | | | | | | | | | | |
| CHURCHILL TAX-FREE FUND OF KENTUCKY | |
| FINANCIAL HIGHLIGHTS | |
| | |
| For a share outstanding throughout each period | |
| | |
| | | Class A | | Class C |
| | | Year Ended December 31, | | Year Ended December 31, |
| | | 2010 | | 2009 | | 2008 | | 2007 | | 2006 | | 2010 | | 2009 | | 2008 | | 2007 | | 2006 |
| Net asset value, beginning of period | | $ | 10.51 | | | $ | 9.42 | | | $ | 10.38 | | | $ | 10.59 | | | $ | 10.60 | | | $ | 10.51 | | | $ | 9.42 | | | $ | 10.38 | | | $ | 10.58 | | | $ | 10.59 | |
| Income (loss) from investment operations: | | | | | | | | | | | | | | | | | | | | | | | | | | | | | | | | | | | | | | | |
| Net investment income | | | 0.40 | (1) | | | 0.41 | (1) | | | 0.40 | (1) | | | 0.39 | (1) | | | 0.39 | (2) | | | 0.31 | (1) | | | 0.32 | (1) | | | 0.31 | (1) | | | 0.31 | (1) | | | 0.30 | (2) |
| Net gain (loss) on securities (both | | | | | | | | | | | | | | | | | | | | | | | | | | | | | | | | | | | | | | | | |
| realized and unrealized) | | | (0.25 | ) | | | 1.09 | | | | (0.92 | ) | | | (0.15 | ) | | | 0.03 | | | | (0.26 | ) | | | 1.09 | | | | (0.91 | ) | | | (0.15 | ) | | | 0.03 | |
| Total from investment operations | | | 0.15 | | | | 1.50 | | | | (0.52 | ) | | | 0.24 | | | | 0.42 | | | | 0.05 | | | | 1.41 | | | | (0.60 | ) | | | 0.16 | | | | 0.33 | |
| Less distributions (note 10): | | | | | | | | | | | | | | | | | | | | | | | | | | | | | | | | | | | | | | | | |
| Dividends from net investment income | | | (0.40 | ) | | | (0.41 | ) | | | (0.39 | ) | | | (0.39 | ) | | | (0.40 | ) | | | (0.31 | ) | | | (0.32 | ) | | | (0.31 | ) | | | (0.30 | ) | | | (0.31 | ) |
| Distributions from capital gains | | | – | | | | – | | | | (0.05 | ) | | | (0.06 | ) | | | (0.03 | ) | | | – | | | | – | | | | (0.05 | ) | | | (0.06 | ) | | | (0.03 | ) |
| Total distributions | | | (0.40 | ) | | | (0.41 | ) | | | (0.44 | ) | | | (0.45 | ) | | | (0.43 | ) | | | (0.31 | ) | | | (0.32 | ) | | | (0.36 | ) | | | (0.36 | ) | | | (0.34 | ) |
| Net asset value, end of period | | $ | 10.26 | | | $ | 10.51 | | | $ | 9.42 | | | $ | 10.38 | | | $ | 10.59 | | | $ | 10.25 | | | $ | 10.51 | | | $ | 9.42 | | | $ | 10.38 | | | $ | 10.58 | |
| Total return | | | 1.38 | %(3) | | | 16.05 | %(3) | | | (5.05 | )%(3) | | | 2.38 | %(3) | | | 4.02 | %(3) | | | 0.42 | %(4) | | | 15.06 | %(4) | | | (5.85 | )%(4) | | | 1.61 | %(4) | | | 3.15 | %(4) |
| Ratios/supplemental data | | | | | | | | | | | | | | | | | | | | | | | | | | | | | | | | | | | | | | | | |
| Net assets, end of period | | | | | | | | | | | | | | | | | | | | | | | | | | | | | | | | | | | | | | | | |
| (in thousands) | | $ | 186,298 | | | $ | 194,816 | | | $ | 169,582 | | | $ | 194,140 | | | $ | 211,501 | | | $ | 8,657 | | | $ | 4,207 | | | $ | 2,694 | | | $ | 4,120 | | | $ | 5,686 | |
| Ratio of expenses to average | | | | | | | | | | | | | | | | | | | | | | | | | | | | | | | | | | | | | | | | |
| net assets | | | 0.75 | % | | | 0.76 | % | | | 0.79 | % | | | 0.75 | % | | | 0.76 | % | | | 1.59 | % | | | 1.60 | % | | | 1.64 | % | | | 1.60 | % | | | 1.62 | % |
| Ratio of net investment income to | | | | | | | | | | | | | | | | | | | | | | | | | | | | | | | | | | | | | | | | |
| average net assets | | | 3.80 | % | | | 3.96 | % | | | 3.97 | % | | | 3.77 | % | | | 3.71 | % | | | 2.90 | % | | | 3.06 | % | | | 3.10 | % | | | 2.92 | % | | | 2.87 | % |
| Portfolio turnover rate | | | 8.32 | % | | | 8.18 | % | | | 13.76 | % | | | 18.92 | % | | | 19.07 | % | | | 8.32 | % | | | 8.18 | % | | | 13.76 | % | | | 18.92 | % | | | 19.07 | % |
| The expense ratios after giving effect to the expense offset for uninvested cash balances were: | |
| Ratio of expenses to average | | | | | | | | | | | | | | | | | | | | | | | | | | | | | | | | | | | | | | | | |
| net assets | | | 0.75 | % | | | 0.76 | % | | | 0.78 | % | | | 0.74 | % | | | 0.76 | % | | | 1.59 | % | | | 1.60 | % | | | 1.63 | % | | | 1.59 | % | | | 1.61 | % |
___________
(1) Per share amounts have been calculated using the daily average shares method.
(2) Per share amounts have been calculated using the monthly average shares method.
(3) Not reflecting sales charges.
(4) Not reflecting CDSC.
See accompanying notes to financial statements.
| | | | | | | | | | | | | | | | | | | | | | | | | | | | | | | |
| CHURCHILL TAX-FREE FUND OF KENTUCKY | |
| FINANCIAL HIGHLIGHTS (continued) | |
| | |
| For a share outstanding throughout each period | |
| | |
| | | Class I | | Class Y |
| | | Year Ended December 31, | | Year Ended December 31, |
| | | 2010 | | 2009 | | 2008 | | 2007 | | 2006 | | 2010 | | 2009 | | 2008 | | 2007 | | 2006 |
| Net asset value, beginning of period | | $ | 10.51 | | | $ | 9.42 | | | $ | 10.38 | | | $ | 10.58 | | | $ | 10.59 | | | $ | 10.52 | | | $ | 9.43 | | | $ | 10.39 | | | $ | 10.59 | | | $ | 10.61 | |
| Income (loss) from investment operations: | | | | | | | | | | | | | | | | | | | | | | | | | | | | | | | | | | | | | | | | |
| Net investment income | | | 0.39 | (1) | | | 0.39 | (1) | | | 0.38 | (1) | | | 0.38 | (1) | | | 0.38 | (2) | | | 0.42 | (1) | | | 0.42 | (1) | | | 0.41 | (1) | | | 0.41 | (1) | | | 0.41 | (2) |
| Net gain (loss) on securities (both | | | | | | | | | | | | | | | | | | | | | | | | | | | | | | | | | | | | | | | | |
| realized and unrealized) | | | (0.27 | ) | | | 1.09 | | | | (0.91 | ) | | | (0.14 | ) | | | 0.02 | | | | (0.26 | ) | | | 1.09 | | | | (0.91 | ) | | | (0.14 | ) | | | 0.01 | |
| Total from investment operations | | | 0.12 | | | | 1.48 | | | | (0.53 | ) | | | 0.24 | | | | 0.40 | | | | 0.16 | | | | 1.51 | | | | (0.50 | ) | | | 0.27 | | | | 0.42 | |
| Less distributions (note 10): | | | | | | | | | | | | | | | | | | | | | | | | | | | | | | | | | | | | | | | | |
| Dividends from net investment income | | | (0.38 | ) | | | (0.39 | ) | | | (0.38 | ) | | | (0.38 | ) | | | (0.38 | ) | | | (0.42 | ) | | | (0.42 | ) | | | (0.41 | ) | | | (0.41 | ) | | | (0.41 | ) |
| Distributions from capital gains | | | – | | | | – | | | | (0.05 | ) | | | (0.06 | ) | | | (0.03 | ) | | | – | | | | – | | | | (0.05 | ) | | | (0.06 | ) | | | (0.03 | ) |
| Total distributions | | | (0.38 | ) | | | (0.39 | ) | | | (0.43 | ) | | | (0.44 | ) | | | (0.41 | ) | | | (0.42 | ) | | | (0.42 | ) | | | (0.46 | ) | | | (0.47 | ) | | | (0.44 | ) |
| Net asset value, end of period | | $ | 10.25 | | | $ | 10.51 | | | $ | 9.42 | | | $ | 10.38 | | | $ | 10.58 | | | $ | 10.26 | | | $ | 10.52 | | | $ | 9.43 | | | $ | 10.39 | | | $ | 10.59 | |
| Total return | | | 1.13 | % | | | 15.89 | % | | | (5.16 | )% | | | 2.33 | % | | | 3.87 | % | | | 1.44 | % | | | 16.21 | % | | | (4.88 | )% | | | 2.63 | % | | | 4.08 | % |
| Ratios/supplemental data | | | | | | | | | | | | | | | | | | | | | | | | | | | | | | | | | | | | | | | | |
| Net assets, end of period | | | | | | | | | | | | | | | | | | | | | | | | | | | | | | | | | | | | | | | | |
| (in thousands) | | $ | 7,429 | | | $ | 8,345 | | | $ | 7,810 | | | $ | 8,363 | | | $ | 8,018 | | | $ | 39,938 | | | $ | 45,657 | | | $ | 37,299 | | | $ | 41,648 | | | $ | 46,625 | |
| Ratio of expenses to average | | | | | | | | | | | | | | | | | | | | | | | | | | | | | | | | | | | | | | | | |
| net assets | | | 0.90 | % | | | 0.90 | % | | | 0.93 | % | | | 0.89 | % | | | 0.91 | % | | | 0.60 | % | | | 0.61 | % | | | 0.64 | % | | | 0.60 | % | | | 0.61 | % |
| Ratio of net investment income to | | | | | | | | | | | | | | | | | | | | | | | | | | | | | | | | | | | | | | | | |
| average net assets | | | 3.64 | % | | | 3.82 | % | | | 3.83 | % | | | 3.62 | % | | | 3.57 | % | | | 3.95 | % | | | 4.10 | % | | | 4.12 | % | | | 3.92 | % | | | 3.86 | % |
| Portfolio turnover rate | | | 8.32 | % | | | 8.18 | % | | | 13.76 | % | | | 18.92 | % | | | 19.07 | % | | | 8.32 | % | | | 8.18 | % | | | 13.76 | % | | | 18.92 | % | | | 19.07 | % |
| The expense ratios after giving effect to the expense offset for uninvested cash balances were: | |
| Ratio of expenses to average | | | | | | | | | | | | | | | | | | | | | | | | | | | | | | | | | | | | | | | | |
| net assets | | | 0.90 | % | | | 0.90 | % | | | 0.92 | % | | | 0.88 | % | | | 0.90 | % | | | 0.60 | % | | | 0.61 | % | | | 0.63 | % | | | 0.59 | % | | | 0.61 | % |
___________
(1) Per share amounts have been calculated using the daily average shares method.
(2) Per share amounts have been calculated using the monthly average shares method.
See accompanying notes to financial statements.
Analysis of Expenses (unaudited)
As a shareholder of the Fund, you may incur two types of costs: (1) transaction costs, including front-end sales charges with respect to Class A shares or contingent deferred sales charges (“CDSC”) with respect to Class C shares; and (2) ongoing costs, including management fees; distribution and/or service (12b-1) fees; and other Fund expenses. The table below is intended to help you understand your ongoing costs (in dollars) of investing in the Fund and to compare these costs with the ongoing costs of investing in other mutual funds.
The table below is based on an investment of $1,000 invested on July 1, 2010 and held for the six months ended December 31, 2010.
Actual Expenses
This table provides information about actual account values and actual expenses. You may use the information provided in this table, together with the amount you invested, to estimate the expenses that you paid over the period. To estimate the expenses you paid on your account, divide your ending account value by $1,000 (for example, an $8,600 ending account value divided by $1,000 = 8.6), then multiply the result by the number under the heading entitled “Expenses Paid During the Period”.
| | | | | |
| Six months ended December 31, 2010 |
| | Actual | | | |
| | Total Return | Beginning | Ending | Expenses |
| | Without | Account | Account | Paid During |
| | Sales Charges(1) | Value | Value | the Period(2) |
| Class A | (1.28)% | $1,000.00 | $987.20 | $3.76 |
| Class C | (1.80)% | $1,000.00 | $982.00 | $7.99 |
| Class I | (1.46)% | $1,000.00 | $985.40 | $4.60 |
| Class Y | (1.30)% | $1,000.00 | $987.00 | $3.00 |
| (1) | Assumes reinvestment of all dividends and capital gain distributions, if any, at net asset value and does not reflect the deduction of the applicable sales charges with respect to Class A shares or the applicable contingent deferred sales charges (“CDSC”) with respect to Class C shares. Total return is not annualized, as it may not be representative of the total return for the year. |
| (2) | Expenses are equal to the annualized expense ratio of 0.75%, 1.60%, 0.92% and 0.60% for the Fund’s Class A, C, I and Y shares, respectively, multiplied by the average account value over the period, multiplied by 184/365 (to reflect the one-half year period). |
Analysis of Expenses (unaudited) (continued)
Hypothetical Example for Comparison Purposes
The table below provides information about hypothetical account values and hypothetical expenses based on the actual expense ratio and an assumed rate of return of 5.00% per year before expenses, which is not the Fund’s actual return. The hypothetical account values and expenses may not be used to estimate the actual ending account balance or expenses you paid for the period. You may use the information provided in this table to compare the ongoing costs of investing in the Fund and other mutual funds. To do so, compare this 5.00% hypothetical example relating to the Fund with the 5.00% hypothetical examples that appear in the shareholder reports of other mutual funds.
Please note that the expenses shown in the table below are meant to highlight your ongoing costs only and do not reflect any transactional costs with respect to Class A shares. The example does not reflect the deduction of contingent deferred sales charges (“CDSC”) with respect to Class C shares. Therefore, the table is useful in comparing ongoing costs only, and will not help you determine the relative total costs of owning different mutual funds. In addition, if these transaction costs were included, your costs would have been higher.
| | | | | |
| Six months ended December 31, 2010 |
| | Hypothetical | | | |
| | Annualized | Beginning | Ending | Expenses |
| | Total | Account | Account | Paid During |
| | Return | Value | Value | the Period(1) |
| Class A | 5.00% | $1,000.00 | $1,021.42 | $3.82 |
| Class C | 5.00% | $1,000.00 | $1,017.14 | $8.13 |
| Class I | 5.00% | $1,000.00 | $1,020.57 | $4.69 |
| Class Y | 5.00% | $1,000.00 | $1,022.18 | $3.06 |
| (1) | Expenses are equal to the annualized expense ratio of 0.75%, 1.60%, 0.92% and 0.60% for the Fund’s Class A, C, I and Y shares, respectively, multiplied by the average account value over the period, multiplied by 184/365 (to reflect the one-half year period). |
Information Available (unaudited)
Much of the information that the funds in the Aquila Group of Funds produce is automatically sent to you and all other shareholders. Specifically, you are routinely sent your Fund’s entire list of portfolio securities twice a year in the semi-annual and annual reports you receive. Additionally, under Fund policies, the Manager publicly discloses the complete schedule of the Fund’s portfolio holdings, as of each calendar quarter, generally by the 15th day after the end of each calendar quarter. Such information remains accessible until the next schedule is made publicly available. You may obtain a copy of the Fund’s portfolio holdings schedule for the most recently completed period by visiting the Fund’s website at www.aquilafunds.com. The Fund may also disclose other portfolio holdings as of a specified date (currently the Fund discloses its five largest holdings by value as of the close of the last business day of each calendar month in a posting to its website on approximately the 5th business day following the month end). This information remains on the website until the next such posting. Whenever you wish to see a listing of your Fund’s portfolio other than in your shareholder reports, please check our website at www.aquilafunds.com or call us at 1-800-437-1020.
The Fund additionally files a complete list of its portfolio holdings with the SEC for the first and third quarters of each fiscal year on Form N-Q. Forms N-Q are available free of charge on the SEC website at www.sec.gov. You may also review or, for a fee, copy the forms at the SEC’s Public Reference Room in Washington, D.C. or by calling 1-800-SEC-0330.
Proxy Voting Record (unaudited)
The Fund does not invest in equity securities. Accordingly, there were no matters relating to a portfolio security considered at any shareholder meeting held during the 12 months ended June 30, 2010 with respect to which the Fund was entitled to vote. Applicable regulations require us to inform you that the foregoing proxy voting information is available on the SEC website at www.sec.gov.
Federal Tax Status of Distributions (unaudited)
This information is presented in order to comply with a requirement of the Internal Revenue Code and no action on the part of shareholders is required.
For the calendar year ended December 31, 2010, $9,673,478 of dividends paid by Churchill Tax-Free Fund of Kentucky, constituting 100% of total dividends paid during calendar year 2010, were exempt-interest dividends.
Prior to February 15, 2011, shareholders were mailed the appropriate tax form(s) which contained information on the status of distributions paid for the 2010 calendar year.
| | | | | | | | | |
| Additional Information (unaudited) | | | | | | |
| | | | | | | | | |
Trustees(1) | | | | | | | | |
| and Officers | | | | | | | | |
| | | | | | | Number of | | |
| | | Positions | | | | Portfolios | | Other Directorships |
| | | Held with | | | | in Fund | | Held by Trustee |
| Name, | | Fund and | | Principal | | Complex(4) | | (The position held is |
Address(2) | | Length of | | Occupation(s) | | Overseen | | a directorship unless |
| and Date of Birth | | Service(3) | | During Past 5 Years | | by Trustee | | indicated otherwise.) |
| | | | | | | | | |
Interested Trustee(5) | | | | | | | | |
| | | | | | | | | |
Diana P. Herrmann New York, NY (02/25/58) | | Trustee since 1995 and President since 1999 | | Vice Chair and Chief Executive Officer of Aquila Management Corporation, Founder of the Aquila Group of Funds(6) and parent of Aquila Investment Management LLC, Manager since 2004, President since 1997, Chief Operating Officer, 1997-2008, a Director since 1984, Secretary since 1986 and previously its Executive Vice President, Senior Vice President or Vice President, 1986-1997; Chief Executive Officer and Vice Chair since 2004, President and Manager since 2003, and Chief Operating Officer (2003-2008), of the Manager; Chair, Vice Chair, President, Executive Vice President and/or Senior Vice President of funds in the Aquila Group of Funds since 1986; Director of the Distributor since 1997; Governor, Investment Company Institute (the trade organization for the U.S. mutual fund industry dedicated to protecting shareholder interests and educating the public about investing) for various periods since 2004, and head of its Small Funds Committee, 2004-2009; active in charitable and volunteer organizations. | | 12 | | ICI Mutual Insurance Company, a Risk Retention Group (2006-2009 and since 2010) |
| | | | | | | | | |
Non-interested Trustees |
| | | | | | | | | |
Thomas A. Christopher Danville, KY (12/19/47) | | Chair of the Board of Trustees since 2005 and Trustee since 1992 | | Vice President of Robinson, Hughes & Christopher, C.P.A.s, P.S.C., since 1977; President, A Good Place for Fun, Inc., a sports facility, since 1987; Director, Sunrise Children’s Services Inc. (2010); currently or formerly active with various professional and community organizations. | | 5 | | None |
| | | | | | | | | |
| | | | | | | Number of | | |
| | | Positions | | | | Portfolios | | Other Directorships |
| | | Held with | | | | in Fund | | Held by Trustee |
| Name, | | Fund and | | Principal | | Complex(4) | | (The position held is |
Address(2) | | Length of | | Occupation(s) | | Overseen | | a directorship unless |
| and Date of Birth | | Service(3) | | During Past 5 Years | | by Trustee | | indicated otherwise.) |
| | | | | | | | | |
David A. Duffy North Kingstown, RI (08/07/39) | | Trustee since 2009 | | Chairman, Rhode Island Convention Center Authority since 2003; director (advisory board) of Citizens Bank of Rhode Island and Connecticut since 1999; retired Founder, formerly President, Duffy & Shanley, Inc., a marketing communications firm, 1973-2003; past National Chairman, National Conference for Community and Justice (NCCJ); Past Chair, Providence College President’s Council; Past Vice Chair, Providence College Board of Trustees; officer or director of numerous civic and non-profit organizations. | | 2 | | Delta Dental of Rhode Island |
| | | | | | | | | |
Theodore T. Mason Hastings-on-Hudson, NY (11/24/35) | | Trustee since 1987 | | Executive Director, East Wind Power Partners LTD since 1994 and Louisiana Power Partners, 1999-2003; Assistant Treasurer, Fort Schuyler Maritime Alumni Association, Inc., successor to Alumni Association of SUNY Maritime College, since 2010 (Treasurer, 2004-2009, President, 2002-2003, First Vice President, 2000-2001, Second Vice President, 1998-2000) and director of the same organization since 1997; Director, STCM Management Company, Inc., 1973-2004; twice national officer of Association of the United States Navy (formerly Naval Reserve Association), Commanding Officer of four naval reserve units and Captain, USNR (Ret); director, The Navy League of the United States New York Council since 2002; trustee, The Maritime Industry Museum at Fort Schuyler, 2000-2004; and Fort Schuyler Maritime Foundation, Inc., successor to the Maritime College at Fort Schuyler Foundation, Inc., since 2000. | | 9 | | None |
| | | | | | | | | |
| | | | | | | Number of | | |
| | | Positions | | | | Portfolios | | Other Directorships |
| | | Held with | | | | in Fund | | Held by Trustee |
| Name, | | Fund and | | Principal | | Complex(4) | | (The position held is |
Address(2) | | Length of | | Occupation(s) | | Overseen | | a directorship unless |
| and Date of Birth | | Service(3) | | During Past 5 Years | | by Trustee | | indicated otherwise.) |
| | | | | | | | | |
Anne J. Mills Castle Rock, CO (12/23/38) | | Trustee since 1987 | | President, Loring Consulting Company since 2001; Vice President for Business Management and CFO, Ottawa University, 1992-2001, 2006-2008; IBM Corporation, 1965-1991; currently active with various charitable, educational and religious organizations. | | 5 | | None |
| | | | | | | | | |
John J. Partridge Providence, RI (05/05/40) | | Trustee since 2009 | | Founding Partner, Partridge Snow & Hahn LLP, a law firm, Providence, Rhode Island, since 1988, Senior Counsel, since January 1, 2007; Assistant Secretary – Advisor to the Board, Narragansett Insured Tax-Free Income Fund, 2005-2008, Trustee 2002-2005; director or trustee of various educational, civic and charitable organizations, including Ocean State Charities Trust, Memorial Hospital of Rhode Island, and The Pawtucket Foundation. | | 5 | | None |
| | | | | | | | | |
James R. Ramsey Louisville, KY (11/14/48) | | Trustee since 1987 | | President, University of Louisville since November 2002; Professor of Economics, University of Louisville, 1999-present; Kentucky Governor’s Senior Policy Advisor and State Budget Director, 1999-2002; Vice Chancellor for Finance and Administration, the University of North Carolina at Chapel Hill, 1998 to 1999; previously Vice President for Finance and Administration at Western Kentucky University, State Budget Director for the Commonwealth of Kentucky, Chief State Economist and Executive Director for the Office of Financial Management and Economic Analysis for the Commonwealth of Kentucky, Adjunct Professor at the University of Kentucky, Associate Professor at Loyola University-New Orleans and Assistant Professor at Middle Tennessee State University. | | 2 | | Community Bank and Trust, Pikeville, KY and Texas Roadhouse Inc. |
| | | | | | | | | |
| | | | | | | Number of | | |
| | | Positions | | | | Portfolios | | Other Directorships |
| | | Held with | | | | in Fund | | Held by Trustee |
| Name, | | Fund and | | Principal | | Complex(4) | | (The position held is |
Address(2) | | Length of | | Occupation(s) | | Overseen | | a directorship unless |
| and Date of Birth | | Service(3) | | During Past 5 Years | | by Trustee | | indicated otherwise.) |
| | | | | | | | | |
Laureen L. White North Kingstown, RI (11/18/59) | | Trustee since 2009 | | President, Greater Providence Chamber of Commerce, since 2005, Executive Vice President 2004-2005 and Senior Vice President, 1989-2002; Executive Counselor to the Governor of Rhode Island for Policy and Communications, 2003-2004. | | 2 | | None |
| | | | | | | | | |
Other Individuals
Chairman Emeritus(7) |
| | | | | | | | | |
Lacy B. Herrmann New York, NY (05/12/29) | | Founder and Chairman Emeritus since 2005, Chairman of the Board of Trustees, 1987-2005 | | Founder and Chairman of the Board, Aquila Management Corporation, the sponsoring organization and parent of the Manager or Administrator and/or Adviser to each fund of the Aquila Group of Funds; Chairman of the Manager or Administrator and/or Adviser to each since 2004; Founder and Chairman Emeritus of each fund in the Aquila Group of Funds; previously Chairman and a Trustee of each fund in the Aquila Group of Funds since its establishment until 2004 or 2005; Director of the Distributor since 1981 and formerly Vice President or Secretary, 1981-1998; Director or trustee, Premier VIT, 1994-2009; Oppenheimer Quest Value Funds Group, Oppenheimer Small Cap Value Fund, Oppenheimer Midcap Fund, 1987-2009, and Oppenheimer Rochester Group of Funds, 1995-2009; Trustee Emeritus, Brown University and the Hopkins School; active in university, school and charitable organizations. | | N/A | | N/A |
| | | | | | | | | |
| | | | | | | Number of | | |
| | | Positions | | | | Portfolios | | Other Directorships |
| | | Held with | | | | in Fund | | Held by Trustee |
| Name, | | Fund and | | Principal | | Complex(4) | | (The position held is |
Address(2) | | Length of | | Occupation(s) | | Overseen | | a directorship unless |
| and Date of Birth | | Service(3) | | During Past 5 Years | | by Trustee | | indicated otherwise.) |
| | | | | | | | | |
| Officers | | | | | | | | |
| | | | | | | | | |
Charles E. Childs, III New York, NY (04/01/57) | | Executive Vice President since 2003 | | Executive Vice President of all funds in the Aquila Group of Funds and the Manager and the Manager’s parent since 2003; Chief Operating Officer of the Manager and the Manager’s parent since 2008; formerly Senior Vice President, corporate development, Vice President, Assistant Vice President and Associate of the Manager’s parent since 1987; Senior Vice President, Vice President or Assistant Vice President of the Aquila Money-Market Funds, 1988-2003. | | N/A | | N/A |
| | | | | | | | | |
Marie E. Aro Denver, CO (02/10/55) | | Senior Vice President since 2010 | | Co-President of the Distributor since 2010, Vice President, 1993-1997; Senior Vice President, Aquila Three Peaks Opportunity Growth Fund since 2004; Senior Vice President, Tax-Free Trust of Arizona since 2010 and Vice President, 2004-2010; Senior Vice President, Aquila Three Peaks High Income Fund since 2006; Senior Vice President, Hawaiian Tax-Free Trust, Tax-Free Fund For Utah, Tax-Free Fund of Colorado, Tax-Free Trust of Oregon, Churchill Tax-Free Fund of Kentucky and Narragansett Insured Tax-Free Income Fund since 2010; Vice President, INVESCO Funds Group, 1998-2003. | | N/A | | N/A |
| | | | | | | | | |
Paul G. O’Brien Charlotte, NC (11/28/59) | | Senior Vice President since 2010 | | Co-President, Aquila Distributors, Inc. since 2010, Managing Director, 2009-2010; Senior Vice President of Aquila Three Peaks Opportunity Growth Fund, Aquila Three Peaks High Income Fund, and each of the Aquila Municipal Bond Funds since 2010; held various positions to Senior Vice President and Chief Administrative Officer of Evergreen Investments Services, Inc., 1997 - 2008; Mergers and Acquisitions Coordinator for Wachovia Corporation, 1994 - 1997. | | N/A | | N/A |
| | | | | | | | | |
| | | | | | | Number of | | |
| | | Positions | | | | Portfolios | | Other Directorships |
| | | Held with | | | | in Fund | | Held by Trustee |
| Name, | | Fund and | | Principal | | Complex(4) | | (The position held is |
Address(2) | | Length of | | Occupation(s) | | Overseen | | a directorship unless |
| and Date of Birth | | Service(3) | | During Past 5 Years | | by Trustee | | indicated otherwise.) |
| | | | | | | | | |
Todd W. Curtis Phoenix, AZ (06/08/49) | | Vice President since 2004 | | Senior Vice President and Portfolio Manager, Tax-Free Trust of Arizona, since August 2004; Vice President and Portfolio Manager, Churchill Tax-Free Fund of Kentucky, since 2009, backup portfolio manager, 2004-2009; Vice President and Co-Portfolio Manager, Tax-Free Fund For Utah, since 2009; Vice President and Portfolio Manager, Banc One Investment Advisors, Inc. and its predecessors, 1981-2004. | | N/A | | N/A |
| | | | | | | | | |
James Thompson Bountiful, UT (03/17/55) | | Assistant Vice President since 2009 | | Vice President and Co-Portfolio Manager, Tax-Free Fund For Utah, since 2009; Assistant Vice President and Backup Portfolio Manager, Tax-Free Trust of Arizona and Churchill Tax-Free Fund of Kentucky, since 2009; Senior Vice President, First Security Bank/Wells Fargo Brokerage Services LLC, Salt Lake City, UT, 1991-2009. | | N/A | | N/A |
| | | | | | | | | |
Jason T. McGrew Elizabethtown, KY (08/14/71) | | Vice President since 2001 | | Vice President, Churchill Tax-Free Fund of Kentucky since 2001, Assistant Vice President, 2000-2001; Vice President, Aquila Three Peaks Opportunity Growth Fund since 2006; Investment Broker with Raymond James Financial Services 1999-2000 and with J.C. Bradford and Company 1997-1999; Associate Broker at Prudential Securities 1996-1997. | | N/A | | N/A |
| | | | | | | | | |
| | | | | | | Number of | | |
| | | Positions | | | | Portfolios | | Other Directorships |
| | | Held with | | | | in Fund | | Held by Trustee |
| Name, | | Fund and | | Principal | | Complex(4) | | (The position held is |
Address(2) | | Length of | | Occupation(s) | | Overseen | | a directorship unless |
| and Date of Birth | | Service(3) | | During Past 5 Years | | by Trustee | | indicated otherwise.) |
| | | | | | | | | |
Robert S. Driessen New York, NY (10/12/47) | | Chief Compliance Officer since 2009 | | Chief Compliance Officer of each fund in the Aquila Group of Funds, the Manager and the Distributor since December 2009; Vice President, Chief Compliance Officer, Curian Capital, LLC, 2004-2008; Vice President, Chief Compliance Officer, Phoenix Investment Partners, Ltd., 1999-2004; Vice President, Risk Liaison, Corporate Compliance, Bank of America, 1996-1999; Vice President, Securities Compliance, Prudential Insurance Company of America, 1993-1996; various positions to Branch Chief, U.S. Securities and Exchange Commission, 1972-1993. | | N/A | | N/A |
| | | | | | | | | |
Joseph P. DiMaggio New York, NY (11/06/56) | | Chief Financial Officer since 2003 and Treasurer since 2000 | | Chief Financial Officer of each fund in the Aquila Group of Funds since 2003 and Treasurer since 2000. | | N/A | | N/A |
| | | | | | | | | |
Edward M. W. Hines New York, NY (12/16/39) | | Secretary since 1987 | | Of Counsel to Butzel Long, a professional corporation, counsel to the Trust/Fund, since 2010 and previously Shareholder since 2007; Partner of Hollyer Brady Barrett & Hines LLP, its predecessor as counsel, 1989-2007; Secretary of each fund in the Aquila Group of Funds. | | N/A | | N/A |
| | | | | | | | | |
John M. Herndon New York, NY (12/17/39) | | Assistant Secretary since 1995 | | Assistant Secretary of each fund in the Aquila Group of Funds since 1995 and Vice President of the three Aquila Money-Market Funds since 1990; Vice President of the Manager or its predecessor and current parent since 1990. | | N/A | | N/A |
| | | | | | | | | |
| | | | | | | Number of | | |
| | | Positions | | | | Portfolios | | Other Directorships |
| | | Held with | | | | in Fund | | Held by Trustee |
| Name, | | Fund and | | Principal | | Complex(4) | | (The position held is |
Address(2) | | Length of | | Occupation(s) | | Overseen | | a directorship unless |
| and Date of Birth | | Service(3) | | During Past 5 Years | | by Trustee | | indicated otherwise.) |
| | | | | | | | | |
Yolonda S. Reynolds New York, NY (04/23/60) | | Assistant Treasurer since 2010 | | Director of Fund Accounting for the Aquila Group of Funds since 2007; Investment Accountant, TIIA-CREF, 2007; Sr. Fund Accountant, JP Morgan Chase, 2003-2006. | | N/A | | N/A |
| | | | | | | | | |
Lori A. Vindigni New York, NY (11/02/66) | | Assistant Treasurer since 2000 | | Assistant Treasurer of each fund in the Aquila Group of Funds since 2000; Assistant Vice President of the Manager or its predecessor and current parent since 1998; Fund Accountant for the Aquila Group of Funds, 1995-1998. | | N/A | | N/A |
______________________
(1) The Fund’s Statement of Additional Information includes additional information about the Trustees and is available, without charge, upon request by calling 800-437-1020 (toll-free) or by visiting www.aquilafunds.com or the EDGAR Database at the SEC’s internet site at www.sec.gov.
(2) The mailing address of each Trustee and officer is c/o Churchill Tax-Free Fund of Kentucky, 380 Madison Avenue, Suite 2300, New York, NY 10017.
(3) Each Trustee holds office until the next annual meeting of shareholders or until his or her successor is elected and qualifies. The term of office of each officer is one year.
(4) Includes certain Aquila-sponsored funds that are dormant and have no public shareholders.
(5) Ms. Herrmann is an interested person of the Fund as an officer of the Fund, as a director, officer and shareholder of the Manager’s corporate parent, as an officer and Manager of the Manager, and as a shareholder and director of the Distributor. Ms. Herrmann is the daughter of Lacy B. Herrmann, the Founder and Chairman Emeritus of the Fund.
(6) In this material Pacific Capital Cash Assets Trust, Pacific Capital U.S. Government Securities Cash Assets Trust and Pacific Capital Tax-Free Cash Assets Trust, each of which is a money-market fund, are called the “Aquila Money-Market Funds”; Tax-Free Trust of Arizona, Tax-Free Fund of Colorado, Hawaiian Tax-Free Trust, Churchill Tax-Free Fund of Kentucky, Tax-Free Trust of Oregon, Narragansett Insured Tax-Free Income Fund and Tax-Free Fund For Utah, each of which is a tax-free municipal bond fund, are called the “Aquila Municipal Bond Funds”; Aquila Three Peaks Opportunity Growth Fund (formerly known as Aquila Rocky Mountain Equity Fund) is an equity fund; and Aquila Three Peaks High Income Fund is a high income corporate bond fund; considered together, these 12 funds, which do not include the dormant funds described in footnote 4, are called the “Aquila Group of Funds.”
(7) The Chairman Emeritus may attend Board meetings but has no voting power.
PRIVACY NOTICE (unaudited)
Churchill Tax-Free Fund of Kentucky
Our Privacy Policy. In providing services to you as an individual who owns or is considering investing in shares of the Fund, we collect certain non-public personal information about you. Our policy is to keep this information strictly safeguarded and confidential, and to use or disclose it only as necessary to provide services to you or as otherwise permitted by law. Our privacy policy applies equally to former shareholders and persons who inquire about the Fund.
Information We Collect. ”Non-public personal information” is personally identifiable financial information about you as an individual or your family. The kinds of non-public personal information we have about you may include the information you provide us on your share purchase application or in telephone calls or correspondence with us, and information about your fund transactions and holdings, how you voted your shares and the account where your shares are held.
Information We Disclose. We disclose non-public personal information about you to companies that provide necessary services to us, such as the Fund’s transfer agent, distributor, investment adviser or sub-adviser, if any, as permitted or required by law, or as authorized by you. Any other use is strictly prohibited. We do not sell information about you or any of our fund shareholders to anyone.
Non-California Residents: We also may disclose some of this information to another fund in the Aquila Group of Funds (or its service providers) under joint marketing agreements that permit the funds to use the information only to provide you with information about other funds in the Aquila Group of Funds or new services we are offering that may be of interest to you.
California Residents Only: In addition, unless you “opt-out” of the following disclosures using the form that was mailed to you under separate cover, we may disclose some of this information to another fund in the Aquila Group of Funds (or its sevice providers) under joint marketing agreements that permit the funds to use the information only to provide you with information about other funds in the Aquila Group of Funds or new services we are offering that may be of interest to you.
How We Safeguard Your Information. We restrict access to non-public personal information about you to only those persons who need it to provide services to you or who are permitted by law to receive it. We maintain physical, electronic and procedural safeguards to protect the confidentiality of all non-public personal information we have about you.
If you have any questions regarding our Privacy Policy, please contact us at 1-800-437-1020.
Aquila Distributors, Inc.
Aquila Investment Management LLC
This Privacy Policy also has been adopted by Aquila Distributors, Inc. and Aquila Investment Management LLC and applies to all non-public information about you that each of these companies may obtain in connection with services provided to the Fund or to you as a shareholder of the Fund.
| |
| Founders |
| Lacy B. Herrmann, Chairman Emeritus |
| Aquila Management Corporation |
| |
| Manager |
| AQUILA INVESTMENT MANAGEMENT LLC |
| 380 Madison Avenue, Suite 2300 |
| New York, New York 10017 |
| |
| Board of Trustees |
| Thomas A. Christopher, Chair |
| David A. Duffy |
| Diana P. Herrmann |
| Theodore T. Mason |
| Anne J. Mills |
| John J. Partridge |
| James R. Ramsey |
| Laureen L. White |
| |
| Officers |
| Diana P. Herrmann, President |
| Marie E. Aro, Senior Vice President |
| Paul G. O’Brien, Senior Vice President |
| Todd W. Curtis, Vice President |
| and Portfolio Manager |
| Jason T. McGrew, Vice President |
| Robert S. Driessen, Chief Compliance Officer |
| Joseph P. DiMaggio, Chief Financial Officer |
| and Treasurer |
| Edward M.W. Hines, Secretary |
| |
| Distributor |
| AQUILA DISTRIBUTORS, INC. |
| 380 Madison Avenue, Suite 2300 |
| New York, New York 10017 |
| |
| Transfer and Shareholder Servicing Agent |
| BNY MELLON INVESTMENT SERVICING (US) INC. |
| 101 Sabin Street |
| Pawtucket, Rhode Island 02860 |
| |
| Custodian |
| JPMORGAN CHASE BANK, N.A. |
| 1111 Polaris Parkway |
| Columbus, Ohio 43240 |
| |
| Independent Registered Public Accounting Firm |
| TAIT, WELLER & BAKER LLP |
| 1818 Market Street, Suite 2400 |
| Philadelphia, Pennsylvania 19103 |
| |
| Further information is contained in the Prospectus, |
| which must precede or accompany this report. |
(a) As of December 31, 2010 (the end of the reporting period) the Fund has adopted a code of ethics that applies to the Fund's principal executive officer(s)and principal financial officer(s) and persons performing similar functions ("Covered Officers") as defined in the Aquila Group of Funds Code of Ethics for Principal Executive and Senior Financial Officers under Section 406 of the Sarbanes-Oxley Act of 2002;
(f)(1) Pursuant to Item 10(a)(1), a copy of the Fund’s Code of Ethics that applies to the Fund’s principal executive officer(s) and principal financial officer(s) and persons performing similar functions is included as an exhibit to its annual report on this Form N-CSR;
(f)(2) The text of the Fund’s Code of Ethics that applies to the Fund’s principal executive officer(s) and principal financial officer(s) and persons performing similar functions has been posted on its Internet website which can be found at the Fund’s Internet address at aquilafunds.com.
| ITEM 3. | AUDIT COMMITTEE FINANCIAL EXPERT. |
(a)(1)(ii) The Board of Trustees of the Fund has determined that it does not have at least one audit committee financial expert serving on its audit committee. The Fund does not have such a person serving on the audit committee because none of the persons currently serving as Trustees happens to have the technical accounting and auditing expertise included in the definition of "audit committee financial expert" recently adopted by the Securities and Exchange Commission in connection with this Form N-CSR, and the Board has not heretofore deemed it necessary to seek such a person for election to the Board.
The primary mission of the Board, which is that of oversight over the operations and affairs of the Fund, confronts the Trustees with a wide and expanding range of issues and responsibilities. The Trustees believe that, accordingly, it is essential that the Board's membership consist of persons with as extensive experience as possible in fulfilling the duties and responsibilities of mutual fund directors and audit committee members and, ideally, with extensive experience and background relating to the economic and financial sectors and securities in which the Fund invests, including exposure to the financial and accounting matters commonly encountered with respect to those sectors and securities. The Board believes that its current membership satisfies those criteria. It recognizes that it would also be helpful to have a member with the relatively focused accounting and auditing expertise reflected in the applicable definition of "audit committee financial expert," just as additional members with similarly focused technical expertise in other areas relevant to the Fund's operations and affairs would also contribute added value. However, the Board believes that the Fund is better served, and its assets better employed, by a policy of hiring experts in various the specialized area of technical accounting and auditing matters, if and as the Board identifies the need, rather than by seeking to expand its numbers by adding technical experts in the areas constituting its domain of responsibility. The Fund's Audit Committee Charter explicitly authorizes the Committee to retain such experts as it deems necessary in fulfilling its duties
| ITEM 4. | PRINCIPAL ACCOUNTANT FEES AND SERVICES. |
a) Audit Fees - The aggregate fees billed for professional services rendered by the principal accountant for the audit of the Registrant's annual financial statements were $17,600 in 2009 and $18,500 in 2010.
b) Audit Related Fees - There were no amounts billed for audit-related fees over the past two years.
c) Tax Fees - The Registrant was billed by the principal accountant $3,200 and $3,300 in 2009 and 2010, respectively, for return preparation and tax compliance.
d) All Other Fees - There were no additional fees paid for audit and non-audit services other than those disclosed in a) through c) above.
e)(1) Currently, the audit committee of the Registrant pre-approves audit services and fees on an engagement-by-engagement basis
e)(2) None of the services described in b) through d) above were approved by the audit committee pursuant to paragraph (c)(7)(i)(C) of Rule 2-01 of Regulation S-X, all were pre-approved on an engagement-by-engagement basis.
f) No applicable.
g) There were no non-audit services fees billed by the Registrant's accountant to the Registrant's investment adviser or distributor over the past two years
h) Not applicable.
| ITEM 5. | AUDIT COMMITTEE OF LISTED REGISTRANTS. |
Not applicable.
| ITEM 6. | SCHEDULE OF INVESTMENTS. |
Included in Item 1 above
| ITEM 7. | DISCLOSURE OF PROXY VOTING POLICIES AND PROCEDURES FOR CLOSED-END MANAGEMENT INVESTMENT COMPANIES. |
Not applicable.
| ITEM 8. | PORTFOLIO MANAGERS OF CLOSED-END MANAGEMENT INVESTMENT COMPANIES. |
Not applicable.
| ITEM 9. | PURCHASES OF EQUITY SECURITIES BY CLOSED-END MANAGEMENT INVESTMENT COMPANY AND AFFILIATED PURCHASERS. |
Not applicable.
| ITEM 10. | SUBMISSION OF MATTERS TO A VOTE OF SECURITY HOLDERS. |
The Board of Directors of the Registrant has adopted a Nominating Committee Charter which provides that the Nominating Committee (the 'Committee') may consider and evaluate nominee candidates properly submitted by shareholders if a vacancy among the Independent Trustees of the Registrant occurs and if, based on the Board's then current size, composition and structure, the Committee determines that the vacancy should be filled. The Committee will consider candidates submitted by shareholders on the same basis as it considers and evaluates candidates recommended by other sources. A copy of the qualifications and procedures that must be met or followed by shareholders to properly submit a nominee candidate to the Committee may be obtained by submitting a request in writing to the Secretary of the Registrant.
(a) Based on their evaluation of the registrant's disclosure controls and procedures (as defined in Rule 30a-2(c) under the Investment Company Act of 1940) as of a date within 90 days of the filing of this report, the registrant's chief financial and executive officers have concluded that the disclosure controls and procedures of the registrant are appropriately designed to ensure that information required to be disclosed in the registrant's reports that are filed under the Securities Exchange Act of 1934 are accumulated and communicated to registrant's management, including its principal executive officer(s) and principal financial officer(s), to allow timely decisions regarding required disclosure and is recorded, processed, summarized and reported, within the time periods specified in the rules and forms adopted by the Securities and Exchange Commission.
(b) There have been no significant changes in registrant's internal controls or in other factors that could significantly affect registrant's internal controls subsequent to the date of the most recent evaluation, including no significant deficiencies or material weaknesses that required corrective action.
(a)(1) Aquila Group of Funds Code of Ethics for Principal Executive and Senior Financial Officers under Section 406 of the Sarbanes-Oxley Act of 2002, as amended.
(a)(2) Certifications of principal executive officer and principal financial officer as required by Rule 30a-2(a) under the Investment Company Act of 1940.
(b) Certifications of principal executive officer and principal financial officer as required by Rule 30a-2(b) under the Investment Company Act of 1940.
SIGNATURES
Pursuant to the requirements of the Securities Exchange Act of 1934 and the Investment Company Act of 1940, the registrant has duly caused this report to be signed on its behalf by the undersigned thereunto duly authorized.
| By: | /s/ Diana P. Herrmann | |
| | March 7, 2011 | |
| | | |
| | | |
| By: | /s/ Joseph P. DiMaggio | |
| | Chief Financial Officer and Treasurer | |
Pursuant to the requirements of the Securities Exchange Act of 1934 and the Investment Company Act of 1940, this report has been signed below by the following persons on behalf of the registrant and in the capacities and on the dates indicated.
| By: | /s/ Diana P. Herrmann | |
| | Diana P. Herrmann President and Trustee | |
| | | |
| | | |
| By: | /s/ Joseph P. DiMaggio | |
| | Joseph P. DiMaggioChief Financial Officer and Treasurer | |
EXHIBIT INDEX
(a)(1) Aquila Group of Funds Code of Ethics for Principal Executive and Senior Financial Officers under Section 406 of the Sarbanes-Oxley Act of 2002, as amended.
(a)(2) Certifications of principal executive officer and principal financial officer as required by Rule 30a-2(a) under the Investment Company Act of 1940.
(b) Certifications of principal executive officer and principal financial officer as required by Rule 30a-2(b) under the Investment Company Act of 1940.