UNITED STATES
SECURITIES AND EXCHANGE COMMISSION
WASHINGTON, D.C. 20549
FORM N-CSR
CERTIFIED SHAREHOLDER REPORT OF REGISTERED MANAGEMENT
INVESTMENT COMPANIES
Investment Company Act file number: 811-05088
THE AB PORTFOLIOS
(Exact name of registrant as specified in charter)
1345 Avenue of the Americas, New York, New York 10105
(Address of principal executive offices) (Zip code)
Joseph J. Mantineo
AllianceBernstein L.P.
1345 Avenue of the Americas
New York, New York 10105
(Name and address of agent for service)
Registrant’s telephone number, including area code: (800) 221-5672
Date of fiscal year end: August 31, 2016
Date of reporting period: February 29, 2016
ITEM 1. REPORTS TO STOCKHOLDERS.
FEB 02.29.16

SEMI-ANNUAL REPORT
AB TAX-MANAGED WEALTH
STRATEGIES
| + | AB WEALTH APPRECIATION STRATEGY |
| + | AB BALANCED WEALTH STRATEGY |
| + | AB CONSERVATIVE WEALTH STRATEGY |
Investment Products Offered
• Are Not FDIC Insured • May Lose Value • Are Not Bank Guaranteed |
Investors should consider the investment objectives, risks, charges and expenses of the Fund carefully before investing. For copies of our prospectus or summary prospectus, which contain this and other information, visit us online at www.abglobal.com or contact your AB representative. Please read the prospectus and/or summary prospectus carefully before investing.
This shareholder report must be preceded or accompanied by the Fund’s prospectus for individuals who are not current shareholders of the Fund.
You may obtain a description of the Fund’s proxy voting policies and procedures, and information regarding how the Fund voted proxies relating to portfolio securities during the most recent 12-month period ended June 30, without charge. Simply visit AB’s website at www.abglobal.com, or go to the Securities and Exchange Commission’s (the “Commission”) website at www.sec.gov, or call AB at (800) 227-4618.
The Fund files its complete schedule of portfolio holdings with the Commission for the first and third quarters of each fiscal year on Form N-Q. The Fund’s Forms N-Q are available on the Commission’s website at www.sec.gov. The Fund’s Forms N-Q may also be reviewed and copied at the Commission’s Public Reference Room in Washington, DC; information on the operation of the Public Reference Room may be obtained by calling (800) SEC-0330. AB publishes full portfolio holdings for the Fund monthly at www.abglobal.com.
AllianceBernstein Investments, Inc. (ABI) is the distributor of the AB family of mutual funds. ABI is a member of FINRA and is an affiliate of AllianceBernstein L.P., the Adviser of the funds.
The [A/B] logo is a registered service mark of AllianceBernstein and AllianceBernstein® is a registered service mark used by permission of the owner, AllianceBernstein L.P.
April 10, 2016
Semi-Annual Report
This report provides management’s discussion of fund performance for the portfolios of AB Tax-Managed Wealth Strategies (the “Strategies” and individually a “Strategy”) for the semi-annual reporting period ended February 29, 2016.
All of the Strategies invest in Underlying Portfolios that are intended to provide additional diversification by seeking returns that are less sensitive to the general direction of the equity markets. These Underlying Portfolios include the Multi-Manager Alternative Strategies Fund, which is designed to provide exposure to non-traditional and alternative investment strategies through investments allocated to various sub-advisers selected and overseen by AllianceBernstein L.P. (the “Adviser”). These investments will be primarily in four different alternative investment strategies—long/short equity, special situations, credit and global macro. Also in this category is the Multi-Asset Real Return Portfolio, which invests primarily in instruments that the Adviser expects to outperform broad equity markets during periods of rising inflation. This Underlying Portfolio invests primarily in inflation-indexed securities, commodity-related equity securities, commodities (principally through derivative instruments) and real estate securities. As part of their diversification investments, the Strategies invest in the Volatility Management Portfolio, which is managed by the Adviser. This Underlying Portfolio is designed to reduce the overall effect of equity market volatility on the Strategies’
portfolios and the effects of adverse market conditions on their performance. Under normal market conditions, this Underlying Portfolio will invest predominantly in equity securities. If the Adviser determines that the equity markets pose disproportionate risks, the Adviser will reduce the Underlying Portfolio’s equity investments and invest in fixed-income securities or other non-equity asset classes to reduce the risks of the Strategies’ investments in equity securities.
For the Strategies’ traditional equity investments, the Adviser selects growth and value equity securities by drawing from a variety of its fundamental growth and value investment disciplines to produce a blended portfolio. Within each investment discipline, the Adviser is able to draw on the resources and expertise of multiple growth and value equity investment teams, specializing in different capitalization ranges and geographic regions (US and non-US), which are supported by equity research analysts specializing in growth research, and equity research analysts specializing in value research.
The Strategies also may enter into forward commitments, make short sales of securities or maintain a short position, invest in rights or warrants, and may invest in the securities of companies in emerging markets.
Currencies can have a dramatic impact on equity returns, significantly adding to returns in some years and greatly diminishing them in others. Currency and equity positions are evaluated
| AB TAX-MANAGED WEALTH STRATEGIES • | 1 |
separately. The Adviser may seek to hedge the currency exposure resulting from securities positions when it finds the currency exposure unattractive. To hedge all or a portion of its currency risk, the Strategies may, from time to time, invest in currency-related derivatives, including forward currency exchange contracts, futures, options on futures, swaps and options. The Adviser may also seek investment opportunities by taking long or short positions in currencies through the use of currency-related derivatives. The Strategies may enter into other derivatives transactions, such as options, futures contracts, forwards and swaps.
AB Tax-Managed Wealth Appreciation Strategy
Investment Objective and Policies
AB Tax-Managed Wealth Appreciation Strategy’s investment objective is long-term growth of capital. The Strategy invests in a portfolio of equity securities that is designed as a solution for investors who seek tax-efficient equity returns but also want broad diversification of the related risks across styles, capitalization ranges and geographic regions. The Strategy may also invest in certain Underlying Portfolios with additional investment styles, which, while not necessarily tax-efficient, are designed to add diversification to the Strategy’s investments. The Strategy targets a weighting of approximately 73% in equity securities of companies, or traditional equity investments, and approximately 28% in diversification investments. In managing the Strategy, the Adviser efficiently diversifies between growth and value
equity investment styles, between US and non-US markets and among diversification investments. Normally, the Strategy targets an equal weighting of growth and value style stocks (50% each) for the traditional equity component of the Strategy, with approximately 60% of each equity style invested in US companies and the remaining 40% in non-US companies.
The Adviser will allow the relative weightings of the Strategy’s investments in traditional equity growth and value, and in US and non-US company securities to vary in response to market conditions, but ordinarily, only by ±5% of the Strategy’s net assets. Beyond those ranges, the Adviser will rebalance the Strategy toward the targeted blend. However, under extraordinary circumstances, such as when market conditions favoring one investment style are compelling, the range may expand to ±10% of the Strategy’s net assets. The Strategy’s targeted percentages may change from time to time without notice to shareholders based on the Adviser’s assessment of market conditions.
The Strategy invests approximately 8% of its assets in the Multi-Manager Alternative Strategies Fund, approximately 5% in the Multi-Asset Real Return Portfolio and approximately 15% in the Volatility Management Portfolio.
AB Tax-Managed Balanced Wealth Strategy
Investment Objective and Policies
AB Tax-Managed Balanced Wealth Strategy’s investment objective is to
| 2 | • AB TAX-MANAGED WEALTH STRATEGIES |
achieve the highest total return consistent with the Adviser’s determination of reasonable risk. The Strategy invests in a portfolio of equity and debt securities that is designed as a solution for investors who seek a moderate tilt toward tax-efficient equity returns but also want the risk diversification offered by tax-exempt debt securities and the broad diversification of their equity risk across styles, capitalization ranges and geographic regions. The Strategy may also invest in certain Underlying Portfolios with additional investment styles, which, while not necessarily tax-efficient, are designed to add diversification to the Strategy’s investments. In managing the Strategy, the Adviser efficiently diversifies between the debt and equity investment styles and in diversification investments to produce the desired risk/return profile of the Strategy. The Strategy targets a weighting of 29% equity securities of companies, or traditional equity investments, 41% traditional tax-exempt debt securities and 30% diversification investments (a portion of which includes tax-exempt debt securities) with a goal of providing moderate upside potential without excessive volatility. Within the Strategy’s traditional equity component, the targeted blend is an equal weighting of growth and value style stocks (50% each), with approximately 60% of each equity style invested in US companies and the remaining 40% in non-US companies.
The Adviser will allow the relative weightings of the Strategy’s investments in equity and debt, growth and
value, and in US and non-US company securities to vary in response to market conditions, but ordinarily, only by ±5% of the Strategy’s net assets. Beyond those ranges, the Adviser will rebalance the Strategy toward the targeted blend. However, under extraordinary circumstances, such as when market conditions favoring one investment style are compelling, the range may expand to ±10% of the Strategy’s net assets. The Strategy’s targeted percentages may change from time to time without notice to shareholders based on the Adviser’s assessment of market conditions.
The Strategy invests approximately 6% of its assets in the Multi-Manager Alternative Strategies Fund, approximately 3% in the Multi-Asset Real Return Portfolio and approximately 11% in the Volatility Management Portfolio.
The Strategy intends to meet the tax requirement for passing municipal bond interest through to Strategy shareholders as tax exempt interest dividends (currently requires that at least 50% of the Strategy’s assets be invested in tax-exempt debt securities). In the event that the Internal Revenue Code or the related rules, regulations and interpretations of the Internal Revenue Service should, in the future, change so as to permit the Strategy to pass through tax-exempt dividends when the Strategy invests less than 50% of its assets in tax-exempt debt securities, the targeted blend for the Strategy may become 60% equity securities and 40% debt securities.
| AB TAX-MANAGED WEALTH STRATEGIES • | 3 |
In selecting tax-exempt fixed-income investments for the Strategy’s debt investments, the Adviser may draw on the capabilities of separate investment teams that specialize in different areas that are generally defined by the maturity of the debt securities and/or their ratings, which may include subspecialties. These fixed-income teams draw on the resources and expertise of the Adviser’s internal fixed-income research staff, which includes fixed-income research analysts and economists. The Strategy’s fixed-income securities will primarily be investment grade debt securities, but may also include lower-rated securities (“junk bonds”). The Strategy will not invest more than 25% of its total assets in securities rated at the time of purchase below investment grade.
With the goal of protecting against inflation risk in addition to its investment in the Multi-Asset Real Return Underlying Portfolio, the Strategy may (i) allocate approximately 10% of the Strategy’s portfolio from traditional municipal bonds to inflation-indexed securities, including inflation-indexed municipal securities, (ii) enter into inflation Consumer Price Index (“CPI”) swap agreements or other types of swap agreements that the Adviser believes offer protection against inflation risk, with a combined notional amount of approximately 10% of the Strategy’s assets, or (iii) use a combination of the foregoing so that approximately 10% of the Strategy’s direct investments are “inflation-indexed”.
The Strategy may invest up to 10% of its total assets in the securities of companies in emerging markets.
AB Tax-Managed Conservative Wealth Strategy
Investment Objective and Policies
AB Tax-Managed Conservative Wealth Strategy’s investment objective is to achieve a high total return without, in the opinion of the Adviser, undue risk to principal. The Strategy invests in a portfolio of equity and debt securities that is designed as a solution for investors who seek some opportunity for tax-efficient equity returns if the related risks are broadly diversified and overall portfolio volatility reflects a preponderance of debt securities. The Strategy may also invest in certain Underlying Portfolios with additional investment styles, which, while not necessarily tax-efficient, are designed to add diversification to the Strategy’s investments. The Strategy targets a weighting of 19% equity securities of companies, or traditional equity investments, 58% traditional tax-exempt debt securities and 24% diversification investments with a goal of providing reduced volatility and modest upside potential. In managing the Strategy, the Adviser efficiently diversifies between the debt and equity investment styles and in diversification investments to produce the desired risk/return profile of the Strategy. Within the traditional equity component, the Strategy’s targeted blend is an equal weighting of growth and value style stocks (50% each), with approximately 60% of each equity style invested in US companies and the remaining 40% in non-US companies.
The Adviser will allow the relative weightings of the Strategy’s investments in equity and debt, growth and value, and in US and non-US company
| 4 | • AB TAX-MANAGED WEALTH STRATEGIES |
securities to vary in response to market conditions, but ordinarily, only by ±5% of the Strategy’s net assets. Beyond those ranges, the Adviser will rebalance the Strategy toward the targeted blend. However, under extraordinary circumstances, such as when market conditions favoring one investment style are compelling, the range may expand to ±10% of the Strategy’s net assets. The Strategy’s targeted percentages may change from time to time without notice to shareholders based on the Adviser’s assessment of market conditions.
The Strategy invests approximately 4% of its assets in the Multi-Manager Alternative Strategies Fund, approximately 1% in the Multi-Asset Real Return Portfolio and approximately 9% in the Volatility Management Portfolio.
In selecting tax-exempt fixed-income investments for the Strategy’s traditional debt investments, the Adviser may draw on the capabilities of separate investment teams that specialize in different areas that are generally defined by the maturity of the debt securities and/or their ratings and that may include subspecialties. In selecting debt securities for the Strategy, these fixed-income teams draw on the resources and expertise of the Adviser’s internal fixed-income research staff, which includes fixed-income research analysts and economists. All fixed-income securities held by the Strategy will be of investment grade at the time of purchase. In the event that the rating of any security held by the Strategy falls below investment grade, the Strategy will not be obligated to dispose of such
security and may continue to hold the obligation if, in the opinion of the Adviser, such investment is appropriate under the circumstances.
With the goal of protecting against inflation risk in addition to its investment in the Multi-Asset Real Return Underlying Portfolio, the Strategy may (i) allocate approximately 10% of the Strategy’s portfolio from traditional municipal bonds to inflation-indexed securities, including inflation-indexed municipal securities, (ii) enter into inflation CPI swap agreements or other types of swap agreements that the Adviser believes offer protection against inflation risk, with a combined notional amount of approximately 10% of the Strategy’s assets, or (iii) use a combination of the foregoing so that approximately 10% of the Strategy’s direct investments are “inflation-indexed”.
The Strategy may invest up to 10% of its total assets in the securities of companies in emerging markets.
Investment Results
The tables on pages 11-13 show performance for each Strategy compared to its respective benchmarks for the six- and 12-month periods ended February 29, 2016. Each Strategy’s blended benchmark is as follows: AB Tax-Managed Wealth Appreciation Strategy, 60% Standard & Poor’s (“S&P”) 500 Index / 40% Morgan Stanley Capital International All Country World Index (“MSCI ACWI”) ex-US; AB Tax-Managed Balanced Wealth Strategy, 50% Barclays 5-Year General Obligation
| AB TAX-MANAGED WEALTH STRATEGIES • | 5 |
(“GO”) Municipal Bond Index / 50% S&P 500 Index; and AB Tax-Managed Conservative Wealth Strategy, 70% Barclays 5-Year GO Municipal Bond Index / 30% S&P 500 Index.
All share classes of the Tax-Managed Wealth Appreciation, Tax-Managed Balanced Wealth and Tax-Managed Conservative Wealth Strategies underperformed the primary and blended benchmarks for both periods, before sales charges. Versus the secondary benchmark, all share classes of the Tax-Managed Wealth Appreciation Strategy outperformed for both periods; for the six-month period, all share classes of the Balanced Wealth Strategy underperformed, while all share classes outperformed for the 12-month period; Class B and C shares of the Tax-Managed Conservative Wealth Strategy underperformed for the six-month period, while all share classes outperformed for the 12-month period.
For both periods, on an absolute level, all components negatively impacted the performance of the Tax-Managed Wealth Appreciation Strategy as the environment for equities was particularly difficult. The US growth, non-US value and non-US growth components did outperform their respective style benchmarks. The Volatility Management, Multi-Asset Real Return Strategy and Multi-Manager Alternative Strategies Fund all detracted from performance.
All equity components of the Tax-Managed Balanced Wealth Strategy negatively impacted performance, while
the intermediate-term municipal bond and inflation-protection fixed-income components contributed on an absolute level, for both periods. The US growth, non-US value and non-US growth components did outperform their respective style benchmarks. The Volatility Management, Multi-Asset Real Return Strategy and Multi-Manager Alternative Strategies Fund all detracted from performance.
The fixed-income components of the Tax-Managed Conservative Wealth Strategy contributed on an absolute level, including short-term and intermediate-term municipals and the inflation protection components, for both periods. The US growth, non-US value and non-US growth components did outperform their respective style benchmarks, but posted negative absolute returns. The Volatility Management, Multi-Asset Real Return Strategy and Multi-Manager Alternative Strategies Fund all detracted from performance.
The Tax-Managed Wealth Appreciation Strategy, Tax-Managed Balanced Wealth Strategy and Tax-Managed Conservative Wealth Strategy utilized derivatives in the form of futures and forwards for hedging and investment purposes. In the Tax-Managed Wealth Appreciation Strategy and the Balanced Wealth Strategy, futures detracted from performance, while forwards added to performance in absolute terms, for both periods; both forwards and futures contributed to performance of the Tax-Managed Conservative Wealth Strategy. The Tax-Managed Balanced Wealth Strategy and the Tax-Managed
| 6 | • AB TAX-MANAGED WEALTH STRATEGIES |
Conservative Wealth Strategy utilized inflation swaps and interest rate swaps for hedging and investment purposes; interest rate swaps detracted for both periods and inflation swaps detracted for the six-month period. For the 12-month period, inflation swaps detracted in the Tax-Managed Balanced Wealth Strategy and contributed in the Tax-Managed Conservative Wealth Strategy. The Tax-Managed Conservative Wealth Strategy utilized credit default swaps for hedging and investment purposes, which added to performance for both periods.
Market Review and Investment Strategy
Global equities charted a rocky path over the six-month period. Markets mainly rallied through the first half, recovering losses from August’s sharp sell-off. However, 2016 ushered in another dramatic pullback that punished stocks worldwide. The steep decline led to losses for the period, with international and emerging market equities hit hardest. US dollar-based investors also saw a strong US dollar dampen their returns. As 2015 drew to a close, markets fluctuated as concerns over uneven global growth gave way to hopes for central bank intervention. A US interest rate hike, the first in nine years, helped offset negative sentiment due to inaction from the European Central Bank and a further retrenchment in commodities and oil. However, uncertainty spilled over into the new year, which began on a sour note as concerns about China’s fiscal policy, slowing growth and oversupply in oil sparked a fresh bout of turmoil in financial markets worldwide. While February offered a modest respite,
investors remained cautious by the end of the reporting period.
Bond markets were volatile for the six-month period, as growth trends and monetary policies in the world’s biggest economies headed in different directions. Inflation continued to fall throughout the developed world, driven primarily by decreasing commodity prices. Oil prices reached their lowest level since 2003, causing volatility within government bond yields. Adding to the volatility was the rate hike by the US Federal Reserve (the “Fed”). Fixed-income returns diverged between regions and sectors: credit securities generally underperformed developed-market Treasuries; developed-market Treasuries generally outperformed emerging-market local currency Treasuries; and investment-grade securities generally outperformed high-yield, which posted some of the worst returns across the fixed-income markets, specifically within the energy and commodities sectors.
A glut of supply overwhelmed solid demand to drive the price of oil to record lows. Commodities suffered and inflation expectations, measured by the spread between the yield on nominal Treasuries and Treasury Inflation-Protected Securities, fell sharply and the US dollar rose, all of which was negative for inflation assets. In February, however, commodity prices and market inflation expectations bounced back backed by a dovish Fed policy and a reversal in the sentiment around China.
| AB TAX-MANAGED WEALTH STRATEGIES • | 7 |
Natural resources stocks were similarly weighed down by the collapse in commodity prices, high volatility, and headwinds from a strong dollar. With the Fed moving to a more dovish stance in the new year, this trend was reversed. Metal and mining stocks were especially strong.
Real estate investment trusts (“REITs”) were expensive and faced the risk of interest rate hikes. The rate risk, however, began to diminish and REITs outperformed over the six-month period.
The municipal components may purchase municipal securities that are insured under policies issued by certain insurance companies. Historically, insured municipal securities typically received a higher credit rating, which meant that the issuer of the securities paid a lower interest rate. As a result of declines in the credit quality and associated downgrades of most fund insurers, insurance has less value than it did in the past. The market now values insured municipal securities primarily based on the credit quality of the issuer of the security with little value given to the insurance feature. In purchasing such insured securities, the Adviser evaluates the risk and return of municipal securities through its own research. If an insurance company’s rating is downgraded or the company becomes insolvent, the
prices of municipal securities insured by the insurance company may decline. As of February 29, 2016, the Strategies’ percentages of total investments in insured bonds and in insured bonds that have been prefunded (a type of bond issued to fund another callable bond, where the issuer actually decides to exercise its right to buy its bonds back before the scheduled maturity date) are as follows:
| Portfolio | Insured Bonds* | Prerefunded/ ETM† | ||||||
Tax-Managed Balanced Wealth Strategy | 6.82 | % | 0.00 | % | ||||
Tax-Managed Conservative Wealth Strategy | 8.24 | % | 0.00 | % | ||||
| * | Breakdowns expressed as a percentage of investments in municipal bonds. |
| † | Escrowed to maturity. |
The Fund’s Senior Investment Management Team believes that downgrades in insurance company ratings or insurance company insolvencies present limited risk to the Strategies. The municipal components generally invest in investment-grade securities, as the underlying credit quality of the insured municipal securities reduces the risk of a significant reduction in the value of the insured municipal security.
| 8 | • AB TAX-MANAGED WEALTH STRATEGIES |
DISCLOSURES AND RISKS
Benchmark Disclosure
The S&P 500® Index, the MSCI ACWI ex-US, and the Barclays 5-Year GO Municipal Bond Index are unmanaged and do not reflect fees and expenses associated with the active management of a mutual fund portfolio. The S&P 500 Index includes 500 US stocks and is a common representation of the performance of the overall US stock market. The Barclays 5-Year GO Municipal Bond Index represents the performance of long-term, investment-grade tax-exempt bonds with maturities ranging from four to six years. The MSCI ACWI ex-US (free float-adjusted, market capitalization weighted) represents the equity market performance of developed and emerging markets, excluding the United States. Net returns include the reinvestment of dividends after deduction of non-US withholding tax; gross returns include reinvestment of dividends prior to such deduction. MSCI makes no express or implied warranties or representations, and shall have no liability whatsoever with respect to any MSCI data contained herein. The MSCI data may not be further redistributed or used as a basis for other indices, any securities or financial products. This report is not approved, reviewed or produced by MSCI. An investor cannot invest directly in an index, and its results are not indicative of the performance for any specific investment, including the Strategies.
A Word About Risk
The Strategies may employ strategies that take into account the tax impact of buy and sell decisions on the Strategies’ shareholders. While the Strategies seek to maximize after-tax returns, there can be no assurance that the strategies will be effective, and the use of these strategies may affect the gross returns of the Strategies. The Strategies may not be suitable for tax-advantaged accounts, such as qualified retirement plans. The Strategies allocate their investments among multiple asset classes which will include US and foreign securities. The Tax-Managed Balanced Wealth and Tax-Managed Conservative Wealth Strategies will include both equity and fixed-income securities.
Market Risk: The value of the Strategies’ assets will fluctuate as the stock, bond or commodities markets fluctuate. The value of their investments may decline, sometimes rapidly and unpredictably, simply because of economic changes or other events that affect large portions of the market. It includes the risk that a particular style of investing, such as growth or value, may be underperforming the stock market generally.
Foreign (Non-US) Risk: The Strategies’ investments in securities of non-US issuers may involve more risk than those of US issuers. These securities may fluctuate more widely in price and may be less liquid due to adverse market, economic, political, regulatory or other factors. These risks may be heightened if the Strategies invest in securities of emerging market countries.
Currency Risk: Fluctuations in currency exchange rates may negatively affect the value of the Strategies’ investments or reduce their returns.
Capitalization Risk: Investments in small- and mid-capitalization companies by the Underlying Portfolios may be more volatile than investments in large-capitalization companies. Investments in small-capitalization companies may have additional risks because these companies have limited product lines, markets, or financial resources.
Derivatives Risk: Derivatives may be illiquid, difficult to price, and leveraged so that small changes may produce disproportionate losses for the Strategies and may be subject to counterparty risk to a greater degree than more traditional investments.
Allocation Risk: The allocation of investments among different investment styles, such as equity or debt, growth or value, US or non-US securities, or diversification strategies, may have a more significant effect on the Strategies’ net asset value (“NAV”), when one of these investments is performing more poorly than another.
Credit Risk: (Tax-Managed Balanced Wealth and Tax-Managed Conservative Wealth Strategies) An issuer or guarantor of a fixed-income security, or the counterparty to a
(Disclosures, Risks and Note about Historical Performance continued on next page)
| AB TAX-MANAGED WEALTH STRATEGIES • | 9 |
Disclosures and risks
DISCLOSURES AND RISKS
(continued from previous page)
derivatives or other contract, may be unable or unwilling to make timely payments of interest or principal, or to otherwise honor its obligations. The issuer or guarantor may default, causing a loss of the full principal amount of a security and accrued interest. The degree of risk for a particular security may be reflected in its credit rating. There is the possibility that the credit rating of a fixed-income security may be downgraded after purchase, which may adversely affect the value of the security. Investments in fixed-income securities with lower ratings (commonly known as “junk bonds”) are subject to a higher probability that an issuer will default or fail to meet its payment obligations.
Interest Rate Risk: (Tax-Managed Balanced Wealth and Tax-Managed Conservative Wealth Strategies) Changes in interest rates will affect the value of the Strategies’ investments in fixed-income securities. When interest rates rise, the value of investments in fixed-income securities tends to fall and this decrease in value may not be offset by higher income from new investments. The Strategies may be subject to a heightened risk of rising interest rates as the recent period of historically low rates is beginning to end and rates have begun rising. Interest rate risk is generally greater for fixed-income securities with longer maturities or durations.
Municipal Market Risk: (Tax-Managed Balanced Wealth and Tax-Managed Conservative Wealth Strategies) This is the risk that special factors may adversely affect the value of municipal securities and have a significant effect on the yield or value of the Strategies’ investments in municipal securities. These factors include economic conditions, political or legislative changes, uncertainties related to the tax status of municipal securities, or the rights of investors in these securities. To the extent that the Strategies invest more of their assets in a particular state’s municipal securities, the Strategies may be vulnerable to events adversely affecting that state, including economic, political and regulatory occurrences, court decisions, terrorism and catastrophic natural disasters, such as hurricanes or earthquakes. The Strategies’ investments in certain municipal securities with principal and interest payments that are made from the revenues of a specific project or facility, and not general tax revenues, may have increased risks. Factors affecting the project or facility, such as local business or economic conditions, could have a significant effect on the project’s ability to make payments of principal and interest on these securities.
These risks are fully discussed in the Strategies’ prospectus. As with all investments, you may lose money by investing in the Strategies.
An Important Note About Historical Performance
The investment return and principal value of an investment in the Strategies will fluctuate as the prices of the individual securities in which it invests fluctuate, so that your shares, when redeemed, may be worth more or less than their original cost. Performance shown on the following pages represents past performance and does not guarantee future results. Current performance may be lower or higher than the performance information shown. You may obtain performance information current to the most recent month-end by visiting www.abglobal.com.
All fees and expenses related to the operation of the Strategies have been deducted. NAV returns do not reflect sales charges; if sales charges were reflected, the Strategies’ quoted performance would be lower. SEC returns reflect the applicable sales charges for each share class: a 4.25% maximum front-end sales charge for Class A shares; the applicable contingent deferred sales charge for Class B shares (4% year 1, 3% year 2, 2% year 3, 1% year 4); a 1% 1-year contingent deferred sales charge for Class C shares. Returns for the different share classes will vary due to different expenses associated with each class. Performance assumes reinvestment of distributions and does not account for taxes.
| 10 | • AB TAX-MANAGED WEALTH STRATEGIES |
Disclosures and Risks
AB TAX-MANAGED WEALTH APPRECIATION STRATEGY
HISTORICAL PERFORMANCE
THE STRATEGY VS. ITS BENCHMARKS PERIODS ENDED FEBRUARY 29, 2016 (unaudited) | NAV Returns | |||||||||
| 6 Months | 12 Months | |||||||||
| AB Tax-Managed Wealth Appreciation Strategy* | ||||||||||
Class A | -5.44% | -11.21% | ||||||||
| ||||||||||
Class B† | -5.81% | -11.90% | ||||||||
| ||||||||||
Class C | -5.85% | -11.89% | ||||||||
| ||||||||||
Advisor Class‡ | -5.30% | -10.99% | ||||||||
| ||||||||||
| Primary Benchmark: S&P 500 Index | -0.92% | -6.19% | ||||||||
| ||||||||||
| Secondary Benchmark: MSCI ACWI ex-US | -9.29% | -17.37% | ||||||||
| ||||||||||
| Blended Benchmark: 60% S&P 500 Index / 40% MSCI ACWI ex-US | -4.34% | -10.78% | ||||||||
| ||||||||||
* Includes the impact of proceeds received and credited to the Strategy resulting from class action settlements, which enhanced the performance of all share classes of the Strategy for the six- and 12-month periods ended February 29, 2016, by 0.01% and 0.05%, respectively.
† Effective January 31, 2009, Class B shares are no longer available for purchase to new investors. See Note A for additional information.
‡ Please note that this share class is for investors purchasing shares through accounts established under certain fee-based programs sponsored and maintained by certain broker-dealers and financial intermediaries, institutional pension plans and/or investment advisory clients of, and certain other persons associated with, the Adviser and its affiliates or the Strategies. | ||||||||||
See Disclosures, Risks and Note about Historical Performance on pages 9-10.
(Historical Performance continued on next page)
| AB TAX-MANAGED WEALTH STRATEGIES • | 11 |
Historical Performance
AB TAX-MANAGED BALANCED WEALTH STRATEGY
HISTORICAL PERFORMANCE
(continued from previous page)
THE STRATEGY VS. ITS BENCHMARKS PERIODS ENDED FEBRUARY 29, 2016 (unaudited) | NAV Returns | |||||||||
| 6 Months | 12 Months | |||||||||
| AB Tax-Managed Balanced Wealth Strategy* | ||||||||||
Class A | -1.42% | -4.57% | ||||||||
| ||||||||||
Class B† | -1.76% | -5.33% | ||||||||
| ||||||||||
Class C | -1.70% | -5.26% | ||||||||
| ||||||||||
Advisor Class‡ | -1.20% | -4.29% | ||||||||
| ||||||||||
| Primary Benchmark: Barclays 5-Year GO Municipal Bond Index | 2.82% | 3.11% | ||||||||
| ||||||||||
| Secondary Benchmark: S&P 500 Index | -0.92% | -6.19% | ||||||||
| ||||||||||
Blended Benchmark: 50% Barclays 5-Year GO Municipal Bond Index/50% S&P 500 Index | 1.07% | -1.45% | ||||||||
| ||||||||||
* Includes the impact of proceeds received and credited to the Strategy resulting from class action settlements, which enhanced the performance of all share classes of the Strategy for the six- and 12-month periods ended February 29, 2016, by 0.01% and 0.05%, respectively.
† Effective January 31, 2009, Class B shares are no longer available for purchase to new investors. See Note A for additional information.
‡ Please note that this share class is for investors purchasing shares through accounts established under certain fee-based programs sponsored and maintained by certain broker-dealers and financial intermediaries, institutional pension plans and/or investment advisory clients of, and certain other persons associated with, the Adviser and its affiliates or the Strategies. | ||||||||||
See Disclosures, Risks and Note about Historical Performance on pages 9-10.
(Historical Performance continued on next page)
| 12 | • AB TAX-MANAGED WEALTH STRATEGIES |
Historical Performance
AB TAX-MANAGED CONSERVATIVE WEALTH STRATEGY
HISTORICAL PERFORMANCE
(continued from previous page)
THE STRATEGY VS. ITS BENCHMARKS PERIODS ENDED FEBRUARY 29, 2016 (unaudited) | NAV Returns | |||||||||
| 6 Months | 12 Months | |||||||||
| AB Tax-Managed Conservative Wealth Strategy* | ||||||||||
Class A | -0.87% | -3.11% | ||||||||
| ||||||||||
Class B† | -1.17% | -3.67% | ||||||||
| ||||||||||
Class C | -1.21% | -3.71% | ||||||||
| ||||||||||
Advisor Class‡ | -0.73% | -2.79% | ||||||||
| ||||||||||
| Primary Benchmark: Barclays 5-Year GO Municipal Bond Index | 2.82% | 3.11% | ||||||||
| ||||||||||
| Secondary Benchmark: S&P 500 Index | -0.92% | -6.19% | ||||||||
| ||||||||||
| Blended Benchmark: 70% Barclays 5-Year GO Municipal Bond Index / 30% S&P 500 Index | 1.80% | 0.40% | ||||||||
| ||||||||||
* Includes the impact of proceeds received and credited to the Strategy resulting from class action settlements, which enhanced the performance of all share classes of the Strategy for the six- and 12-month periods ended February 29, 2016, by 0.01% and 0.04%, respectively.
† Effective January 31, 2009, Class B shares are no longer available for purchase to new investors. See Note A for additional information.
‡ Please note that this share class is for investors purchasing shares through accounts established under certain fee-based programs sponsored and maintained by certain broker-dealers and financial intermediaries, institutional pension plans and/or investment advisory clients of, and certain other persons associated with, the Adviser and its affiliates or the Strategies. | ||||||||||
See Disclosures, Risks and Note about Historical Performance on pages 9-10.
(Historical Performance continued on next page)
| AB TAX-MANAGED WEALTH STRATEGIES • | 13 |
Historical Performance
AB TAX-MANAGED WEALTH APPRECIATION STRATEGY
HISTORICAL PERFORMANCE
(continued from previous page)
| AVERAGE ANNUAL RETURNS AS OF FEBRUARY 29, 2016 (unaudited) | ||||||||
| NAV Returns | SEC Returns (reflects applicable | |||||||
| Class A Shares | ||||||||
1 Year | -11.21 | % | -14.99 | % | ||||
5 Years | 3.88 | % | 2.98 | % | ||||
10 Years | 1.95 | % | 1.51 | % | ||||
| Class B Shares | ||||||||
1 Year | -11.90 | % | -15.21 | % | ||||
5 Years | 3.11 | % | 3.11 | % | ||||
10 Years(a) | 1.36 | % | 1.36 | % | ||||
| Class C Shares | ||||||||
1 Year | -11.89 | % | -12.72 | % | ||||
5 Years | 3.13 | % | 3.13 | % | ||||
10 Years | 1.22 | % | 1.22 | % | ||||
| Advisor Class Shares* | ||||||||
1 Year | -10.99 | % | -10.99 | % | ||||
5 Years | 4.17 | % | 4.17 | % | ||||
10 Years | 2.24 | % | 2.24 | % | ||||
The Strategy’s current prospectus fee table shows the Strategy’s total annual operating expense ratios as 1.24%, 2.01%, 2.00% and 1.00% for Class A, Class B, Class C and Advisor Class shares, respectively, gross of any fee waivers or expense reimbursements. Contractual fee waivers and/or expense reimbursements limit the Strategy’s annual operating expense ratios to 1.17%, 1.93%, 1.92% and 0.92% for Class A, Class B, Class C and Advisor Class shares, respectively. These waivers/reimbursements may not be terminated before December 31, 2016. Absent reimbursements or waivers, performance would have been lower. The net and gross expenses shown include the total operating expenses of the Strategy and the indirect expenses of the Strategy’s Underlying Portfolios, as based upon the allocation of the Strategy’s assets among the Underlying Portfolios. The Financial Highlights section of this report sets forth expense ratio data for the current reporting period; the expense ratios shown above may differ from the expense ratios in the Financial Highlights section since they are based on different time periods.
| (a) | Assumes conversion of Class B shares into Class A shares after eight years. |
| * | This share class is offered at NAV to eligible investors and its SEC returns are the same as its NAV returns. Please note that this share class is for investors purchasing shares through accounts established under certain fee-based programs sponsored and maintained by certain broker-dealers and financial intermediaries, institutional pension plans and/or investment advisory clients of, and certain other persons associated with, the Adviser and its affiliates or the Strategies. |
See Disclosures, Risks and Note about Historical Performance on pages 9-10.
(Historical Performance continued on next page)
| 14 | • AB TAX-MANAGED WEALTH STRATEGIES |
Historical Performance
AB TAX-MANAGED WEALTH APPRECIATION STRATEGY
HISTORICAL PERFORMANCE
(continued from previous page)
SEC AVERAGE ANNUAL RETURNS AS OF THE MOST RECENT CALENDAR QUARTER-END MARCH 31, 2016 (unaudited) | ||||
SEC Returns (reflects applicable | ||||
| Class A Shares | ||||
1 Year | -8.69 | % | ||
5 Years | 4.40 | % | ||
10 Years | 2.01 | % | ||
| Class B Shares | ||||
1 Year | -9.01 | % | ||
5 Years | 4.53 | % | ||
10 Years(a) | 1.85 | % | ||
| Class C Shares | ||||
1 Year | -6.31 | % | ||
5 Years | 4.56 | % | ||
10 Years | 1.71 | % | ||
| Advisor Class Shares* | ||||
1 Year | -4.36 | % | ||
5 Years | 5.63 | % | ||
10 Years | 2.75 | % | ||
| (a) | Assumes conversion of Class B shares into Class A shares after eight years. |
| * | Please note that this share class is for investors purchasing shares through accounts established under certain fee-based programs sponsored and maintained by certain broker-dealers and financial intermediaries, institutional pension plans and/or investment advisory clients of, and certain other persons associated with, the Adviser and its affiliates or the Strategies. |
See Disclosures, Risks and Note about Historical Performance on pages 9-10.
(Historical Performance continued on next page)
| AB TAX-MANAGED WEALTH STRATEGIES • | 15 |
Historical Performance
AB TAX-MANAGED WEALTH APPRECIATION STRATEGY
HISTORICAL PERFORMANCE
(continued from previous page)
RETURNS AFTER TAXES ON DISTRIBUTIONS AS OF THE MOST RECENT CALENDAR QUARTER-END MARCH 31, 2016 (unaudited) | ||||
| Returns | ||||
| Class A Shares | ||||
1 Year | -10.26 | % | ||
5 Years | 3.69 | % | ||
10 Years | 1.54 | % | ||
| Class B Shares | ||||
1 Year | -10.38 | % | ||
5 Years | 4.05 | % | ||
10 Years(a) | 1.50 | % | ||
| Class C Shares | ||||
1 Year | -7.75 | % | ||
5 Years | 4.03 | % | ||
10 Years | 1.39 | % | ||
| Advisor Class Shares* | ||||
1 Year | -6.08 | % | ||
5 Years | 4.84 | % | ||
10 Years | 2.22 | % | ||
RETURNS AFTER TAXES ON DISTRIBUTIONS AND SALE OF FUND SHARES AS OF THE MOST RECENT CALENDAR QUARTER-END MARCH 31, 2016 (unaudited) | ||||
| Class A Shares | ||||
1 Year | -3.68 | % | ||
5 Years | 3.35 | % | ||
10 Years | 1.57 | % | ||
| Class B Shares | ||||
1 Year | -3.95 | % | ||
5 Years | 3.50 | % | ||
10 Years(a) | 1.44 | % | ||
| Class C Shares | ||||
1 Year | -2.38 | % | ||
5 Years | 3.51 | % | ||
10 Years | 1.34 | % | ||
| Advisor Class Shares* | ||||
1 Year | -1.15 | % | ||
5 Years | 4.32 | % | ||
10 Years | 2.15 | % | ||
| (a) | Assumes conversion of Class B shares into Class A shares after eight years. |
| * | Please note that this share class is for investors purchasing shares through accounts established under certain fee-based programs sponsored and maintained by certain broker-dealers and financial intermediaries, institutional pension plans and/or investment advisory clients of, and certain other persons associated with, the Adviser and its affiliates or the Strategies. |
See Disclosures, Risks and Note about Historical Performance on pages 9-10.
(Historical Performance continued on next page)
| 16 | • AB TAX-MANAGED WEALTH STRATEGIES |
Historical Performance
AB TAX-MANAGED BALANCED WEALTH STRATEGY
HISTORICAL PERFORMANCE
(continued from previous page)
| AVERAGE ANNUAL RETURNS AS OF FEBRUARY 29, 2016 (unaudited) | ||||||||
| NAV Returns | SEC Returns (reflects applicable | |||||||
| Class A Shares | ||||||||
1 Year | -4.57 | % | -8.62 | % | ||||
5 Years | 3.07 | % | 2.18 | % | ||||
10 Years | 2.83 | % | 2.39 | % | ||||
| Class B Shares | ||||||||
1 Year | -5.33 | % | -8.98 | % | ||||
5 Years | 2.32 | % | 2.32 | % | ||||
10 Years(a) | 2.24 | % | 2.24 | % | ||||
| Class C Shares | ||||||||
1 Year | -5.26 | % | -6.17 | % | ||||
5 Years | 2.35 | % | 2.35 | % | ||||
10 Years | 2.11 | % | 2.11 | % | ||||
| Advisor Class Shares* | ||||||||
1 Year | -4.29 | % | -4.29 | % | ||||
5 Years | 3.38 | % | 3.38 | % | ||||
10 Years | 3.14 | % | 3.14 | % | ||||
The Strategy’s current prospectus fee table shows the Strategy’s total annual operating expense ratios as 1.35%, 2.11%, 2.11% and 1.11% for Class A, Class B, Class C and Advisor Class shares, respectively, gross of any fee waivers or expense reimbursements. Contractual fee waivers and/or expense reimbursements limit the Strategy’s annual operating expense ratios to 1.30%, 2.05%, 2.05% and 1.05% for Class A, Class B, Class C and Advisor Class shares, respectively. These waivers/reimbursements may not be terminated before December 31, 2016. Absent reimbursements or waivers, performance would have been lower. The net and gross expenses shown include the total operating expenses of the Strategy and the indirect expenses of the Strategy’s Underlying Portfolios, as based upon the allocation of the Strategy’s assets among the Underlying Portfolios. The Financial Highlights section of this report sets forth expense ratio data for the current reporting period; the expense ratios shown above may differ from the expense ratios in the Financial Highlights section since they are based on different time periods.
| (a) | Assumes conversion of Class B shares into Class A shares after eight years. |
| * | This share class is offered at NAV to eligible investors and its SEC returns are the same as its NAV returns. Please note that this share class is for investors purchasing shares through accounts established under certain fee-based programs sponsored and maintained by certain broker-dealers and financial intermediaries, institutional pension plans and/or investment advisory clients of, and certain other persons associated with, the Adviser and its affiliates or the Strategies. |
See Disclosures, Risks and Note about Historical Performance on pages 9-10.
(Historical Performance continued on next page)
| AB TAX-MANAGED WEALTH STRATEGIES • | 17 |
Historical Performance
AB TAX-MANAGED BALANCED WEALTH STRATEGY
HISTORICAL PERFORMANCE
(continued from previous page)
SEC AVERAGE ANNUAL RETURNS AS OF THE MOST RECENT CALENDAR QUARTER-END MARCH 31, 2016 (unaudited) | ||||
SEC Returns (reflects applicable | ||||
| Class A Shares | ||||
1 Year | -5.44 | % | ||
5 Years | 2.85 | % | ||
10 Years | 2.66 | % | ||
| Class B Shares | ||||
1 Year | -5.76 | % | ||
5 Years | 3.00 | % | ||
10 Years(a) | 2.51 | % | ||
| Class C Shares | ||||
1 Year | -2.91 | % | ||
5 Years | 3.02 | % | ||
10 Years | 2.37 | % | ||
| Advisor Class Shares* | ||||
1 Year | -1.03 | % | ||
5 Years | 4.04 | % | ||
10 Years | 3.40 | % | ||
| (a) | Assumes conversion of Class B shares into Class A shares after eight years. |
| * | Please note that this share class is for investors purchasing shares through accounts established under certain fee-based programs sponsored and maintained by certain broker-dealers and financial intermediaries, institutional pension plans and/or investment advisory clients of, and certain other persons associated with, the Adviser and its affiliates or the Strategies. |
See Disclosures, Risks and Note about Historical Performance on pages 9-10.
(Historical Performance continued on next page)
| 18 | • AB TAX-MANAGED WEALTH STRATEGIES |
Historical Performance
AB TAX-MANAGED BALANCED WEALTH STRATEGY
HISTORICAL PERFORMANCE
(continued from previous page)
RETURNS AFTER TAXES ON DISTRIBUTIONS AS OF THE MOST RECENT CALENDAR QUARTER-END MARCH 31, 2016 (unaudited) | ||||
Returns (reflects applicable | ||||
| Class A Shares | ||||
1 Year | -6.41 | % | ||
5 Years | 2.35 | % | ||
10 Years | 2.35 | % | ||
| Class B Shares | ||||
1 Year | -6.56 | % | ||
5 Years | 2.60 | % | ||
10 Years(a) | 2.24 | % | ||
| Class C Shares | ||||
1 Year | -3.79 | % | ||
5 Years | 2.60 | % | ||
10 Years | 2.13 | % | ||
| Advisor Class Shares* | ||||
1 Year | -2.07 | % | ||
5 Years | 3.50 | % | ||
10 Years | 3.06 | % | ||
RETURNS AFTER TAXES ON DISTRIBUTIONS AND SALE OF FUND SHARES AS OF THE MOST RECENT CALENDAR QUARTER-END MARCH 31, 2016 (unaudited) | ||||
| Class A Shares | ||||
1 Year | -2.04 | % | ||
5 Years | 2.36 | % | ||
10 Years | 2.29 | % | ||
| Class B Shares | ||||
1 Year | -2.58 | % | ||
5 Years | 2.39 | % | ||
10 Years(a) | 2.09 | % | ||
| Class C Shares | ||||
1 Year | -0.79 | % | ||
5 Years | 2.42 | % | ||
10 Years | 1.98 | % | ||
| Advisor Class Shares* | ||||
1 Year | 0.58 | % | ||
5 Years | 3.32 | % | ||
10 Years | 2.91 | % | ||
| (a) | Assumes conversion of Class B shares into Class A shares after eight years. |
| * | Please note that this share class is for investors purchasing shares through accounts established under certain fee-based programs sponsored and maintained by certain broker-dealers and financial intermediaries, institutional pension plans and/or investment advisory clients of, and certain other persons associated with, the Adviser and its affiliates or the Strategies. |
See Disclosures, Risks and Note about Historical Performance on pages 9-10.
(Historical Performance continued on next page)
| AB TAX-MANAGED WEALTH STRATEGIES • | 19 |
Historical Performance
AB TAX-MANAGED CONSERVATIVE WEALTH STRATEGY
HISTORICAL PERFORMANCE
(continued from previous page)
| AVERAGE ANNUAL RETURNS AS OF FEBRUARY 29, 2016 (unaudited) | ||||||||
| NAV Returns | SEC Returns (reflects applicable | |||||||
| Class A Shares | ||||||||
1 Year | -3.11 | % | -7.21 | % | ||||
5 Years | 2.06 | % | 1.18 | % | ||||
10 Years | 2.32 | % | 1.88 | % | ||||
| Class B Shares | ||||||||
1 Year | -3.67 | % | -7.39 | % | ||||
5 Years | 1.36 | % | 1.36 | % | ||||
10 Years(a) | 1.75 | % | 1.75 | % | ||||
| Class C Shares | ||||||||
1 Year | -3.71 | % | -4.63 | % | ||||
5 Years | 1.35 | % | 1.35 | % | ||||
10 Years | 1.60 | % | 1.60 | % | ||||
| Advisor Class Shares* | ||||||||
1 Year | -2.79 | % | -2.79 | % | ||||
5 Years | 2.36 | % | 2.36 | % | ||||
10 Years | 2.63 | % | 2.63 | % | ||||
The Strategy’s current prospectus fee table shows the Strategy’s total annual operating expense ratios as 1.79%, 2.55%, 2.54% and 1.54% for Class A, Class B, Class C and Advisor Class shares, respectively, gross of any fee waivers or expense reimbursements. Contractual fee waivers and/or expense reimbursements limit the Strategy’s annual operating expense ratios exclusive of interest expense to 1.15%, 1.90%, 1.90% and 0.90% for Class A, Class B, Class C and Advisor Class shares, respectively. These waivers/reimbursements may not be terminated before December 31, 2016. Absent reimbursements or waivers, performance would have been lower. The net and gross expenses shown include the total operating expenses of the Strategy and the indirect expenses of the Strategy’s Underlying Portfolios, as based upon the allocation of the Strategy’s assets among the Underlying Portfolios. The Financial Highlights section of this report sets forth expense ratio data for the current reporting period; the expense ratios shown above may differ from the expense ratios in the Financial Highlights section since they are based on different time periods.
| (a) | Assumes conversion of Class B shares into Class A shares after eight years. |
| * | This share class is offered at NAV to eligible investors and its SEC returns are the same as its NAV returns. Please note that this share class is for investors purchasing shares through accounts established under certain fee-based programs sponsored and maintained by certain broker-dealers and financial intermediaries, institutional pension plans and/or investment advisory clients of, and certain other persons associated with, the Adviser and its affiliates or the Strategies. |
See Disclosures, Risks and Note about Historical Performance on pages 9-10.
(Historical Performance continued on next page)
| 20 | • AB TAX-MANAGED WEALTH STRATEGIES |
Historical Performance
AB TAX-MANAGED CONSERVATIVE WEALTH STRATEGY
HISTORICAL PERFORMANCE
(continued from previous page)
SEC AVERAGE ANNUAL RETURNS AS OF THE MOST RECENT CALENDAR QUARTER-END MARCH 31, 2016 (unaudited) | ||||
SEC Returns (reflects applicable | ||||
| Class A Shares | ||||
1 Year | -5.07 | % | ||
5 Years | 1.60 | % | ||
10 Years | 2.05 | % | ||
| Class B Shares | ||||
1 Year | -5.31 | % | ||
5 Years | 1.79 | % | ||
10 Years(a) | 1.91 | % | ||
| Class C Shares | ||||
1 Year | -2.49 | % | ||
5 Years | 1.77 | % | ||
10 Years | 1.77 | % | ||
| Advisor Class Shares* | ||||
1 Year | -0.54 | % | ||
5 Years | 2.79 | % | ||
10 Years | 2.80 | % | ||
| (a) | Assumes conversion of Class B shares into Class A shares after eight years. |
| * | Please note that this share class is for investors purchasing shares through accounts established under certain fee-based programs sponsored and maintained by certain broker-dealers and financial intermediaries, institutional pension plans and/or investment advisory clients of, and certain other persons associated with, the Adviser and its affiliates or the Strategies. |
See Disclosures, Risks and Note about Historical Performance on pages 9-10.
(Historical Performance continued on next page)
| AB TAX-MANAGED WEALTH STRATEGIES • | 21 |
Historical Performance
AB TAX-MANAGED CONSERVATIVE WEALTH STRATEGY
HISTORICAL PERFORMANCE
(continued from previous page)
RETURNS AFTER TAXES ON DISTRIBUTIONS AS OF THE MOST RECENT CALENDAR QUARTER-END MARCH 31, 2016 (unaudited) | ||||
| Returns | ||||
| Class A Shares | ||||
1 Year | -5.88 | % | ||
5 Years | 1.03 | % | ||
10 Years | 1.65 | % | ||
| Class B Shares | ||||
1 Year | -6.01 | % | ||
5 Years | 1.33 | % | ||
10 Years(a) | 1.56 | % | ||
| Class C Shares | ||||
1 Year | -3.23 | % | ||
5 Years | 1.29 | % | ||
10 Years | 1.44 | % | ||
| Advisor Class Shares* | ||||
1 Year | -1.42 | % | ||
5 Years | 2.18 | % | ||
10 Years | 2.37 | % | ||
RETURNS AFTER TAXES ON DISTRIBUTIONS AND SALE OF FUND SHARES AS OF THE MOST RECENT CALENDAR QUARTER-END MARCH 31, 2016 (unaudited) | ||||
| Class A Shares | ||||
1 Year | -1.76 | % | ||
5 Years | 1.36 | % | ||
10 Years | 1.85 | % | ||
| Class B Shares | ||||
1 Year | -2.30 | % | ||
5 Years | 1.42 | % | ||
10 Years(a) | 1.66 | % | ||
| Class C Shares | ||||
1 Year | -0.54 | % | ||
5 Years | 1.43 | % | ||
10 Years | 1.54 | % | ||
| Advisor Class Shares* | ||||
1 Year | 0.95 | % | ||
5 Years | 2.31 | % | ||
10 Years | 2.48 | % | ||
| (a) | Assumes conversion of Class B shares into Class A shares after eight years. |
| * | Please note that this share class is for investors purchasing shares through accounts established under certain fee-based programs sponsored and maintained by certain broker-dealers and financial intermediaries, institutional pension plans and/or investment advisory clients of, and certain other persons associated with, the Adviser and its affiliates or the Strategies. |
See Disclosures, Risks and Note about Historical Performance on pages 9-10.
| 22 | • AB TAX-MANAGED WEALTH STRATEGIES |
Historical Performance
EXPENSE EXAMPLE
(unaudited)
As a shareholder of the Strategy, you incur two types of costs: (1) transaction costs, including sales charges (loads) on purchase payments, contingent deferred sales charges on redemptions and (2) ongoing costs, including management fees; distribution (12b-1) fees; and other Strategy expenses. This example is intended to help you understand your ongoing costs (in dollars) of investing in the Strategy and to compare these costs with the ongoing costs of investing in other mutual funds.
The Example is based on an investment of $1,000 invested at the beginning of the period and held for the entire period as indicated below.
Actual Expenses
The table below provides information about actual account values and actual expenses. You may use the information, together with the amount you invested, to estimate the expenses that you paid over the period. Simply divide your account value by $1,000 (for example, an $8,600 account value divided by $1,000 = 8.6), then multiply the result by the number under the heading entitled “Expenses Paid During Period” to estimate the expenses you paid on your account during this period.
Hypothetical Example for Comparison Purposes
The table below also provides information about hypothetical account values and hypothetical expenses based on the Strategy’s actual expense ratio and an assumed annual rate of return of 5% before expenses, which is not the Strategy’s actual return. The hypothetical account values and expenses may not be used to estimate the actual ending account balance or expenses you paid for the period. You may use this information to compare the ongoing costs of investing in the Strategy and other funds by comparing this 5% hypothetical example with the 5% hypothetical examples that appear in the shareholder reports of other funds.
Please note that the expenses shown in the table are meant to highlight your ongoing costs only and do not reflect any transactional costs, such as sales charges (loads), or contingent deferred sales charges on redemptions. Therefore, the hypothetical example is useful in comparing ongoing costs only, and will not help you determine the relative total costs of owning different funds. In addition, if these transactional costs were included, your costs would have been higher.
AB Tax-Managed Wealth Appreciation Strategy
| Beginning Account Value September 1, 2015 | Ending Account Value February 29, 2016 | Expenses Paid During Period* | Annualized Expense Ratio* | |||||||||||||
| Class A | ||||||||||||||||
Actual | $ | 1,000 | $ | 945.60 | $ | 4.50 | 0.93 | % | ||||||||
Hypothetical** | $ | 1,000 | $ | 1,020.24 | $ | 4.67 | 0.93 | % | ||||||||
| Class B | ||||||||||||||||
Actual | $ | 1,000 | $ | 941.90 | $ | 8.30 | 1.72 | % | ||||||||
Hypothetical** | $ | 1,000 | $ | 1,016.31 | $ | 8.62 | 1.72 | % | ||||||||
| Class C | ||||||||||||||||
Actual | $ | 1,000 | $ | 941.50 | $ | 8.11 | 1.68 | % | ||||||||
Hypothetical** | $ | 1,000 | $ | 1,016.51 | $ | 8.42 | 1.68 | % | ||||||||
| Advisor Class | ||||||||||||||||
Actual | $ | 1,000 | $ | 947.00 | $ | 3.29 | 0.68 | % | ||||||||
Hypothetical** | $ | 1,000 | $ | 1,021.48 | $ | 3.42 | 0.68 | % | ||||||||
| AB TAX-MANAGED WEALTH STRATEGIES • | 23 |
Expense Example
EXPENSE EXAMPLE
(unaudited)
(continued from previous page)
AB Tax-Managed Balanced Wealth Strategy
| Beginning Account Value September 1, 2015 | Ending Account Value February 29, 2016 | Expenses Paid During Period* | Annualized Expense Ratio* | |||||||||||||
| Class A | ||||||||||||||||
Actual | $ | 1,000 | $ | 985.80 | $ | 5.63 | 1.14 | % | ||||||||
Hypothetical** | $ | 1,000 | $ | 1,019.19 | $ | 5.72 | 1.14 | % | ||||||||
| Class B | ||||||||||||||||
Actual | $ | 1,000 | $ | 982.40 | $ | 9.46 | 1.92 | % | ||||||||
Hypothetical** | $ | 1,000 | $ | 1,015.32 | $ | 9.62 | 1.92 | % | ||||||||
| Class C | ||||||||||||||||
Actual | $ | 1,000 | $ | 983.00 | $ | 9.32 | 1.89 | % | ||||||||
Hypothetical** | $ | 1,000 | $ | 1,015.47 | $ | 9.47 | 1.89 | % | ||||||||
| Advisor Class | ||||||||||||||||
Actual | $ | 1,000 | $ | 988.00 | $ | 4.40 | 0.89 | % | ||||||||
Hypothetical** | $ | 1,000 | $ | 1,020.44 | $ | 4.47 | 0.89 | % | ||||||||
AB Tax-Managed Conservative Wealth Strategy
| Beginning Account Value September 1, 2015 | Ending Account Value February 29, 2016 | Expenses Paid During Period* | Annualized Expense Ratio* | |||||||||||||
| Class A | ||||||||||||||||
Actual | $ | 1,000 | $ | 991.30 | $ | 5.45 | 1.10 | % | ||||||||
Hypothetical** | $ | 1,000 | $ | 1,019.39 | $ | 5.52 | 1.10 | % | ||||||||
| Class B | ||||||||||||||||
Actual | $ | 1,000 | $ | 988.30 | $ | 9.00 | 1.82 | % | ||||||||
Hypothetical** | $ | 1,000 | $ | 1,015.81 | $ | 9.12 | 1.82 | % | ||||||||
| Class C | ||||||||||||||||
Actual | $ | 1,000 | $ | 987.90 | $ | 9.00 | 1.82 | % | ||||||||
Hypothetical** | $ | 1,000 | $ | 1,015.81 | $ | 9.12 | 1.82 | % | ||||||||
| Advisor Class | ||||||||||||||||
Actual | $ | 1,000 | $ | 992.70 | $ | 4.06 | 0.82 | % | ||||||||
Hypothetical** | $ | 1,000 | $ | 1,020.79 | $ | 4.12 | 0.82 | % | ||||||||
| * | Expenses are equal to the classes’ annualized expense ratios multiplied by the average account value over the period, multiplied by 182/366 (to reflect the one-half year period). |
| ** | Assumes 5% annual return before expenses. |
| 24 | • AB TAX-MANAGED WEALTH STRATEGIES |
Expense Example
AB TAX-MANAGED WEALTH APPRECIATION STRATEGY
PORTFOLIO SUMMARY
February 29, 2016 (unaudited)
PORTFOLIO STATISTICS
Net Assets ($mil): $655.0
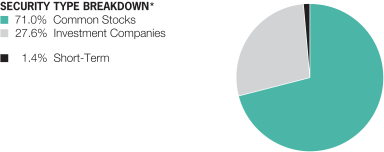
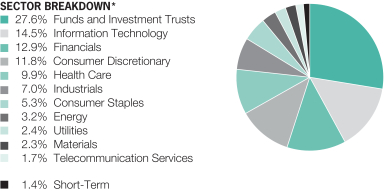
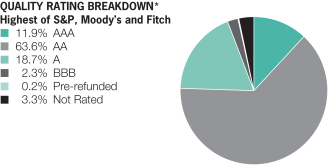
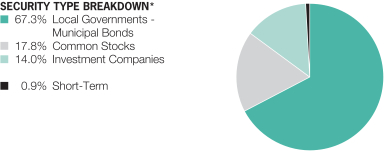
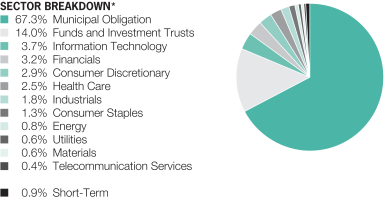
| * | All data are as of February 29, 2016. The Strategy’s security type and sector breakdowns are expressed as a percentage of total investments and may vary over time. The Strategy also enters into derivative transactions, which may be used for hedging or investment purposes (see “Portfolio of Investments” section of the report for additional details). |
Please note: The sector classifications presented herein are based on the Global Industry Classification Standard (GICS) which was developed by MSCI and S&P. The components are divided into sector, industry group, and industry sub-indices as classified by the GICS for each of the market capitalization indices in the broad market. These sector classifications are broadly defined. The “Portfolio of Investments” section of the report reflects more specific industry information and is consistent with the investment restrictions discussed in the Strategy’s prospectus.
| AB TAX-MANAGED WEALTH STRATEGIES • | 25 |
Portfolio Summary
AB TAX-MANAGED BALANCED WEALTH STRATEGY
PORTFOLIO SUMMARY
February 29, 2016 (unaudited)
PORTFOLIO STATISTICS
Net Assets ($mil): $140.2
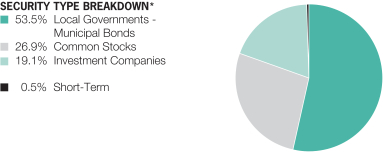
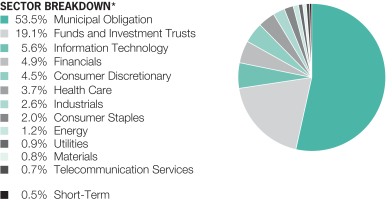
| * | All data are as of February 29, 2016. The Strategy’s security type and sector breakdowns are expressed as a percentage of total investments and may vary over time. The Strategy also enters into derivative transactions, which may be used for hedging or investment purposes (see “Portfolio of Investments” section of the report for additional details). |
Please note: The sector classifications presented herein are based on the GICS which was developed by MSCI and S&P. The components are divided into sector, industry group, and industry sub-indices as classified by the GICS for each of the market capitalization indices in the broad market. These sector classifications are broadly defined. The “Portfolio of Investments” section of the report reflects more specific industry information and is consistent with the investment restrictions discussed in the Strategy’s prospectus.
| 26 | • AB TAX-MANAGED WEALTH STRATEGIES |
Portfolio Summary
AB TAX-MANAGED BALANCED WEALTH STRATEGY
PORTFOLIO SUMMARY
February 29, 2016 (unaudited)
| * | All data are as of February 29, 2016. The Strategy’s quality rating breakdown is expressed as a percentage of the Strategy’s total investments in municipal securities and may vary over time. The Strategy also enters into derivative transactions, which may be used for hedging or investment purposes (see “Portfolio of Investments” section of the report for additional details). The quality ratings are determined by using the S&P Ratings Services, Moody’s Investors Services, Inc. (“Moody’s”) and Fitch Ratings, Ltd. (“Fitch”). The Strategy considers the credit ratings issued by S&P, Moody’s and Fitch and uses the highest rating issued by the agencies. These ratings are a measure of the quality and safety of a bond or portfolio, based on the issuer’s financial condition. AAA is the highest (best) and D is the lowest (worst). If applicable, the prerefunded category includes bonds which are secured by US government securities and therefore are deemed high-quality investment grade by the Adviser. If applicable, Not Applicable (N/A) includes non creditworthy investments; such as, equities, currency contracts, futures and options. If applicable, the Not Rated category includes bonds that are not rated by a nationally recognized statistical rating organization. The Adviser evaluates the creditworthiness of non-rated securities based on a number of factors including, but not limited to, cash flows, enterprise value and economic environment. |
| AB TAX-MANAGED WEALTH STRATEGIES • | 27 |
Portfolio Summary
AB TAX-MANAGED CONSERVATIVE WEALTH STRATEGY
PORTFOLIO SUMMARY
February 29, 2016 (unaudited)
PORTFOLIO STATISTICS
Net Assets ($mil): $44.7
| * | All data are as of February 29, 2016. The Strategy’s security type and sector breakdowns are expressed as a percentage of total investments and may vary over time. The Strategy also enters into derivative transactions, which may be used for hedging or investment purposes (see “Portfolio of Investments” section of the report for additional details.) |
Please note: The sector classifications presented herein are based on GICS which was developed by MSCI and S&P. The components are divided into sector, industry group, and industry sub-indices as classified by the GICS for each of the market capitalization indices in the broad market. These sector classifications are broadly defined. The “Portfolio of Investments” section of the report reflects more specific industry information and is consistent with the investment restrictions discussed in the Strategy’s prospectus.
| 28 | • AB TAX-MANAGED WEALTH STRATEGIES |
Portfolio Summary
AB TAX-MANAGED CONSERVATIVE WEALTH STRATEGY
PORTFOLIO SUMMARY
February 29, 2016 (unaudited)
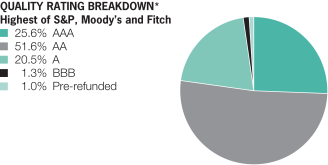
| * | All data are as of February 29, 2016. The Strategy’s quality rating breakdown is expressed as a percentage of the Strategy’s total investments in municipal securities and may vary over time. The Strategy also enters into derivative transactions, which may be used for hedging or investment purposes (see “Portfolio of Investments” section of the report for additional details). The quality ratings are determined by using S&P Ratings Services, Moody’s and Fitch. The Strategy considers the credit ratings issued by S&P, Moody’s and Fitch and uses the highest rating issued by the agencies. These ratings are a measure of the quality and safety of a bond or portfolio, based on the issuer’s financial condition. AAA is the highest (best) and D is the lowest (worst). If applicable, the pre-refunded category includes bonds which are secured by US government securities and therefore are deemed high-quality investment grade by the Adviser. If applicable, Not Applicable (N/A) includes non creditworthy investments; such as, equities, currency contracts, futures and options. If applicable, the Not Rated category includes bonds that are not rated by a nationally recognized statistical rating organization. The Adviser evaluates the creditworthiness of non-rated securities based on a number of factors including, but not limited to, cash flows, enterprise value and economic environment. |
| AB TAX-MANAGED WEALTH STRATEGIES • | 29 |
Portfolio Summary
AB TAX-MANAGED WEALTH APPRECIATION
PORTFOLIO OF INVESTMENTS
February 29, 2016 (unaudited)
| Company | Shares | U.S. $ Value | ||||||
| ||||||||
COMMON STOCKS – 70.8% | ||||||||
Information Technology – 14.5% | ||||||||
Communications Equipment – 0.8% | ||||||||
Arista Networks, Inc.(a) | 23,510 | $ | 1,611,375 | |||||
Cisco Systems, Inc. | 75,668 | 1,980,988 | ||||||
Palo Alto Networks, Inc.(a) | 9,720 | 1,407,359 | ||||||
|
| |||||||
| 4,999,722 | ||||||||
|
| |||||||
Electronic Equipment, Instruments & Components – 0.8% | ||||||||
Amphenol Corp. – Class A | 44,175 | 2,344,367 | ||||||
China Railway Signal & Communication Corp., Ltd. – Class H(a)(b) | 1,324,010 | 697,873 | ||||||
Keysight Technologies, Inc.(a) | 61,478 | 1,603,961 | ||||||
Largan Precision Co., Ltd. | 8,000 | 604,856 | ||||||
PAX Global Technology Ltd. | 193,000 | 203,064 | ||||||
|
| |||||||
| 5,454,121 | ||||||||
|
| |||||||
Internet Software & Services – 3.4% | ||||||||
Alphabet, Inc. – Class A(a) | 2,335 | 1,674,709 | ||||||
Alphabet, Inc. – Class C(a) | 10,904 | 7,608,485 | ||||||
Baidu, Inc. (Sponsored ADR)(a) | 10,820 | 1,876,404 | ||||||
Facebook, Inc. – Class A(a) | 73,271 | 7,834,135 | ||||||
Tencent Holdings Ltd. | 144,700 | 2,649,517 | ||||||
Twitter, Inc.(a) | 44,550 | 807,246 | ||||||
|
| |||||||
| 22,450,496 | ||||||||
|
| |||||||
IT Services – 2.1% | ||||||||
Cognizant Technology Solutions Corp. – Class A(a) | 37,160 | 2,117,377 | ||||||
Tata Consultancy Services Ltd. | 52,720 | 1,672,782 | ||||||
Vantiv, Inc. – Class A(a) | 24,180 | 1,258,327 | ||||||
Visa, Inc. – Class A | 74,524 | 5,394,792 | ||||||
Wirecard AG | 25,690 | 1,013,516 | ||||||
Worldpay Group PLC(a)(b) | 228,046 | 910,585 | ||||||
Xerox Corp. | 130,011 | 1,249,406 | ||||||
|
| |||||||
| 13,616,785 | ||||||||
|
| |||||||
Semiconductors & Semiconductor Equipment – 2.8% | ||||||||
Advanced Semiconductor Engineering, Inc. | 513,000 | 580,450 | ||||||
Applied Materials, Inc. | 120,808 | 2,279,647 | ||||||
ARM Holdings PLC | 53,160 | 730,501 | ||||||
ASML Holding NV | 14,600 | 1,330,028 | ||||||
Infineon Technologies AG | 77,540 | 941,136 | ||||||
Intel Corp. | 68,450 | 2,025,435 | ||||||
Novatek Microelectronics Corp. | 256,000 | 1,052,571 | ||||||
NVIDIA Corp. | 100,448 | 3,150,050 | ||||||
SCREEN Holdings Co., Ltd. | 181,000 | 1,344,103 | ||||||
| 30 | • AB TAX-MANAGED WEALTH STRATEGIES |
AB Tax-Managed Wealth Appreciation—Portfolio of Investments
| Company | Shares | U.S. $ Value | ||||||
| ||||||||
Sumco Corp. | 135,800 | $ | 862,727 | |||||
Taiwan Semiconductor Manufacturing Co., Ltd. | 261,000 | 1,167,697 | ||||||
Tokyo Electron Ltd. | 10,900 | 657,024 | ||||||
Xilinx, Inc. | 39,082 | 1,845,452 | ||||||
|
| |||||||
| 17,966,821 | ||||||||
|
| |||||||
Software – 2.9% | ||||||||
Adobe Systems, Inc.(a) | 14,640 | 1,246,596 | ||||||
ANSYS, Inc.(a) | 15,022 | 1,247,126 | ||||||
Aspen Technology, Inc.(a) | 39,470 | 1,301,326 | ||||||
Constellation Software, Inc./Canada | 8,870 | 3,700,881 | ||||||
Dassault Systemes | 25,220 | 1,910,367 | ||||||
Microsoft Corp. | 75,853 | 3,859,401 | ||||||
Mobileye NV(a) | 33,913 | 1,100,816 | ||||||
Nintendo Co., Ltd. | 6,200 | 867,839 | ||||||
Oracle Corp. | 57,107 | 2,100,395 | ||||||
ServiceNow, Inc.(a) | 23,138 | 1,272,359 | ||||||
Tableau Software, Inc. – Class A(a) | 12,930 | 590,255 | ||||||
|
| |||||||
| 19,197,361 | ||||||||
|
| |||||||
Technology Hardware, Storage & Peripherals – 1.7% | ||||||||
Apple, Inc. | 67,484 | 6,525,028 | ||||||
Hewlett Packard Enterprise Co. | 100,100 | 1,328,327 | ||||||
HP, Inc. | 126,936 | 1,356,946 | ||||||
Samsung Electronics Co., Ltd. | 2,110 | 2,011,499 | ||||||
|
| |||||||
| 11,221,800 | ||||||||
|
| |||||||
| 94,907,106 | ||||||||
|
| |||||||
Financials – 12.8% | ||||||||
Banks – 4.8% | ||||||||
Axis Bank Ltd. | 99,480 | 548,337 | ||||||
Banco Macro SA (ADR)(a) | 12,220 | 821,184 | ||||||
Bank Hapoalim BM | 72,400 | 353,672 | ||||||
Bank of America Corp. | 334,873 | 4,192,610 | ||||||
Bank of Baroda | 259,160 | 501,610 | ||||||
Bank of Montreal | 9,030 | 498,218 | ||||||
Bank of Queensland Ltd. | 180,032 | 1,352,304 | ||||||
Citigroup, Inc. | 13,573 | 527,311 | ||||||
Citizens Financial Group, Inc. | 53,330 | 1,025,536 | ||||||
CYBG PLC(a) | 230,894 | 607,389 | ||||||
Danske Bank A/S | 65,620 | 1,790,923 | ||||||
Fifth Third Bancorp | 12,631 | 192,749 | ||||||
HDFC Bank Ltd. | 63,430 | 1,034,533 | ||||||
ING Groep NV | 156,373 | 1,864,175 | ||||||
Intesa Sanpaolo SpA | 253,420 | 640,106 | ||||||
JPMorgan Chase & Co. | 57,302 | 3,226,103 | ||||||
KB Financial Group, Inc. | 26,222 | 627,823 | ||||||
Mitsubishi UFJ Financial Group, Inc. | 584,000 | 2,520,138 | ||||||
| AB TAX-MANAGED WEALTH STRATEGIES • | 31 |
AB Tax-Managed Wealth Appreciation—Portfolio of Investments
| Company | Shares | U.S. $ Value | ||||||
| ||||||||
OTP Bank PLC | 22,630 | $ | 470,786 | |||||
PNC Financial Services Group, Inc. (The) | 16,440 | 1,336,737 | ||||||
Shinhan Financial Group Co., Ltd. | 14,070 | 433,742 | ||||||
SunTrust Banks, Inc. | 8,050 | 267,099 | ||||||
Toronto-Dominion Bank (The) | 22,900 | 887,396 | ||||||
UniCredit SpA | 154,760 | 574,870 | ||||||
US Bancorp | 17,777 | 684,770 | ||||||
Wells Fargo & Co. | 99,873 | 4,686,041 | ||||||
|
| |||||||
| 31,666,162 | ||||||||
|
| |||||||
Capital Markets – 1.5% | ||||||||
Amundi SA(a)(b) | 11,420 | 475,811 | ||||||
Azimut Holding SpA | 29,230 | 560,870 | ||||||
Bank of New York Mellon Corp. (The) | 15,300 | 541,467 | ||||||
BlackRock, Inc. – Class A | 3,520 | 1,098,099 | ||||||
Credit Suisse Group AG (REG)(a) | 62,496 | 836,459 | ||||||
E*TRADE Financial Corp.(a) | 15,549 | 364,779 | ||||||
Goldman Sachs Group, Inc. (The) | 7,102 | 1,061,962 | ||||||
Morgan Stanley | 24,159 | 596,727 | ||||||
Partners Group Holding AG | 4,553 | 1,648,008 | ||||||
UBS Group AG | 181,119 | 2,766,951 | ||||||
|
| |||||||
| 9,951,133 | ||||||||
|
| |||||||
Consumer Finance – 1.1% | ||||||||
Capital One Financial Corp. | 42,194 | 2,773,412 | ||||||
Discover Financial Services | 30,593 | 1,420,127 | ||||||
OneMain Holdings, Inc.(a) | 43,890 | 990,597 | ||||||
Shriram Transport Finance Co., Ltd. | 45,288 | 529,969 | ||||||
Synchrony Financial(a) | 62,431 | 1,682,516 | ||||||
|
| |||||||
| 7,396,621 | ||||||||
|
| |||||||
Diversified Financial Services – 0.5% | ||||||||
Berkshire Hathaway, Inc. – Class B(a) | 9,400 | 1,261,198 | ||||||
BM&FBovespa SA – Bolsa de Valores Mercadorias e Futuros | 170,700 | 493,963 | ||||||
Challenger Ltd./Australia | 150,840 | 806,866 | ||||||
GRENKELEASING AG | 4,190 | 830,924 | ||||||
|
| |||||||
| 3,392,951 | ||||||||
|
| |||||||
Insurance – 3.6% | ||||||||
Admiral Group PLC | 85,580 | 2,055,035 | ||||||
Aflac, Inc. | 6,766 | 402,712 | ||||||
AIA Group Ltd. | 692,800 | 3,523,599 | ||||||
Allstate Corp. (The) | 38,582 | 2,448,414 | ||||||
American Financial Group, Inc./OH | 11,875 | 796,575 | ||||||
American International Group, Inc. | 32,055 | 1,609,161 | ||||||
Aviva PLC | 97,746 | 593,083 | ||||||
Chubb Ltd. | 2,234 | 258,094 | ||||||
Dongbu Insurance Co., Ltd. | 10,360 | 565,087 | ||||||
First American Financial Corp. | 19,305 | 714,864 | ||||||
| 32 | • AB TAX-MANAGED WEALTH STRATEGIES |
AB Tax-Managed Wealth Appreciation—Portfolio of Investments
| Company | Shares | U.S. $ Value | ||||||
| ||||||||
FNF Group | 36,638 | $ | 1,208,321 | |||||
Hartford Financial Services Group, Inc. (The) | 6,610 | 278,413 | ||||||
Muenchener Rueckversicherungs-Gesellschaft AG in Muenchen (REG) | 5,460 | 1,071,776 | ||||||
NN Group NV | 32,865 | 1,012,348 | ||||||
Ping An Insurance Group Co. of China Ltd. – Class H | 91,500 | 388,388 | ||||||
Progressive Corp. (The) | 9,400 | 300,048 | ||||||
Prudential PLC | 148,100 | 2,579,041 | ||||||
Reinsurance Group of America, Inc. – Class A | 9,981 | 899,288 | ||||||
Suncorp Group Ltd. | 72,493 | 577,728 | ||||||
Travelers Cos., Inc. (The) | 15,264 | 1,641,185 | ||||||
Zurich Insurance Group AG(a) | 2,950 | 624,842 | ||||||
|
| |||||||
| 23,548,002 | ||||||||
|
| |||||||
Real Estate Investment Trusts (REITs) – 0.2% | ||||||||
Emlak Konut Gayrimenkul Yatirim Ortakligi AS | 545,530 | 473,266 | ||||||
RLJ Lodging Trust | 34,836 | 730,511 | ||||||
|
| |||||||
| 1,203,777 | ||||||||
|
| |||||||
Real Estate Management & Development – 0.6% | ||||||||
Ayala Land, Inc. | 1,065,700 | 734,744 | ||||||
China Overseas Land & Investment Ltd. | 166,000 | 494,841 | ||||||
Global Logistic Properties Ltd. | 1,242,000 | 1,561,572 | ||||||
LendLease Group | 85,780 | 795,167 | ||||||
SM Prime Holdings, Inc. | 265,800 | 115,608 | ||||||
|
| |||||||
| 3,701,932 | ||||||||
|
| |||||||
Thrifts & Mortgage Finance – 0.5% | ||||||||
Housing Development Finance Corp., Ltd. | 163,580 | 2,548,172 | ||||||
LIC Housing Finance Ltd. | 79,037 | 487,127 | ||||||
|
| |||||||
| 3,035,299 | ||||||||
|
| |||||||
| 83,895,877 | ||||||||
|
| |||||||
Consumer Discretionary – 11.8% | ||||||||
Auto Components – 1.5% | ||||||||
Continental AG | 6,570 | 1,307,675 | ||||||
Goodyear Tire & Rubber Co. (The) | 39,368 | 1,185,764 | ||||||
Hankook Tire Co., Ltd. | 25,300 | 1,091,762 | ||||||
Lear Corp. | 13,803 | 1,398,934 | ||||||
Magna International, Inc. – Class A | 67,952 | 2,639,935 | ||||||
Plastic Omnium SA | 19,320 | 613,564 | ||||||
Sumitomo Electric Industries Ltd. | 78,300 | 938,949 | ||||||
Valeo SA | 6,050 | 836,428 | ||||||
|
| |||||||
| 10,013,011 | ||||||||
|
| |||||||
Automobiles – 0.8% | ||||||||
General Motors Co. | 25,027 | 736,795 | ||||||
Honda Motor Co., Ltd. | 49,800 | 1,280,800 | ||||||
| AB TAX-MANAGED WEALTH STRATEGIES • | 33 |
AB Tax-Managed Wealth Appreciation—Portfolio of Investments
| Company | Shares | U.S. $ Value | ||||||
| ||||||||
Isuzu Motors Ltd. | 63,800 | $ | 638,295 | |||||
Peugeot SA(a) | 84,500 | 1,267,802 | ||||||
Tata Motors Ltd.(a) | 93,618 | 410,054 | ||||||
Tata Motors Ltd. – Class A(a) | 143,026 | 491,288 | ||||||
Toyota Motor Corp. | 8,500 | 443,169 | ||||||
|
| |||||||
| 5,268,203 | ||||||||
|
| |||||||
Diversified Consumer Services – 0.1% | ||||||||
TAL Education Group (ADR)(a) | 14,296 | 739,818 | ||||||
|
| |||||||
Hotels, Restaurants & Leisure – 0.8% | ||||||||
IMAX China Holding, Inc.(a)(b) | 105,600 | 626,358 | ||||||
Melco International Development Ltd. | 607,000 | 707,538 | ||||||
Starbucks Corp. | 50,860 | 2,960,560 | ||||||
Yum! Brands, Inc. | 11,010 | 797,895 | ||||||
|
| |||||||
| 5,092,351 | ||||||||
|
| |||||||
Household Durables – 0.0% | ||||||||
PulteGroup, Inc. | 8,900 | 152,991 | ||||||
|
| |||||||
Internet & Catalog Retail – 1.0% | ||||||||
Ctrip.com International Ltd. (ADR)(a) | 21,150 | 865,458 | ||||||
JD.com, Inc. (ADR)(a) | 14,330 | 368,424 | ||||||
Priceline Group, Inc. (The)(a) | 3,248 | 4,109,402 | ||||||
Vipshop Holdings Ltd. (ADR)(a) | 71,300 | 792,143 | ||||||
|
| |||||||
| 6,135,427 | ||||||||
|
| |||||||
Leisure Products – 0.1% | ||||||||
Bandai Namco Holdings, Inc. | 30,700 | 611,817 | ||||||
Mattel, Inc. | 5,224 | 169,885 | ||||||
|
| |||||||
| 781,702 | ||||||||
|
| |||||||
Media – 2.8% | ||||||||
AMC Networks, Inc. – Class A(a) | 30,021 | 1,967,576 | ||||||
Comcast Corp. – Class A | 98,869 | 5,707,708 | ||||||
CTS Eventim AG & Co. KGaA | 44,668 | 1,563,483 | ||||||
Liberty Global PLC – Series C(a) | 34,767 | 1,250,221 | ||||||
Naspers Ltd. – Class N | 17,445 | 2,062,702 | ||||||
Thomson Reuters Corp. | 5,543 | 202,874 | ||||||
Time Warner Cable, Inc. – Class A | 4,164 | 794,741 | ||||||
Twenty-First Century Fox, Inc. – Class A | 5,947 | 160,688 | ||||||
Vivendi SA | 62,189 | 1,290,001 | ||||||
Walt Disney Co. (The) | 35,558 | 3,396,500 | ||||||
|
| |||||||
| 18,396,494 | ||||||||
|
| |||||||
Multiline Retail – 1.0% | ||||||||
B&M European Value Retail SA | 422,771 | 1,676,448 | ||||||
Dollar General Corp. | 19,606 | 1,455,746 | ||||||
Dollar Tree, Inc.(a) | 43,370 | 3,480,443 | ||||||
|
| |||||||
| 6,612,637 | ||||||||
|
| |||||||
| 34 | • AB TAX-MANAGED WEALTH STRATEGIES |
AB Tax-Managed Wealth Appreciation—Portfolio of Investments
| Company | Shares | U.S. $ Value | ||||||
| ||||||||
Specialty Retail – 2.5% | ||||||||
Foot Locker, Inc. | 17,809 | $ | 1,113,062 | |||||
GameStop Corp. – Class A | 39,100 | 1,205,062 | ||||||
Home Depot, Inc. (The) | 46,088 | 5,720,443 | ||||||
Kingfisher PLC | 97,080 | 448,442 | ||||||
L Brands, Inc. | 16,280 | 1,380,381 | ||||||
L’Occitane International SA | 182,500 | 365,526 | ||||||
O’Reilly Automotive, Inc.(a) | 5,040 | 1,312,013 | ||||||
Ross Stores, Inc. | 13,356 | 734,313 | ||||||
Sports Direct International PLC(a) | 148,782 | 833,071 | ||||||
TJX Cos., Inc. (The) | 10,022 | 742,630 | ||||||
Ulta Salon Cosmetics & Fragrance, Inc.(a) | 14,607 | 2,412,930 | ||||||
|
| |||||||
| 16,267,873 | ||||||||
|
| |||||||
Textiles, Apparel & Luxury Goods – 1.2% | ||||||||
Cie Financiere Richemont SA | 23,895 | 1,517,348 | ||||||
HUGO BOSS AG | 12,924 | 735,083 | ||||||
Kering | 2,130 | 370,605 | ||||||
NIKE, Inc. – Class B | 66,239 | 4,079,660 | ||||||
Samsonite International SA | 261,000 | 764,846 | ||||||
|
| |||||||
| 7,467,542 | ||||||||
|
| |||||||
| 76,928,049 | ||||||||
|
| |||||||
Health Care – 9.9% | ||||||||
Biotechnology – 2.0% | ||||||||
Alexion Pharmaceuticals, Inc.(a) | 18,294 | 2,575,795 | ||||||
Biogen, Inc.(a) | 23,945 | 6,211,812 | ||||||
Gilead Sciences, Inc. | 46,040 | 4,016,990 | ||||||
|
| |||||||
| 12,804,597 | ||||||||
|
| |||||||
Health Care Equipment & Supplies – 1.9% | ||||||||
Align Technology, Inc.(a) | 33,017 | 2,180,112 | ||||||
Edwards Lifesciences Corp.(a) | 12,630 | 1,098,810 | ||||||
Essilor International SA | 4,390 | 521,460 | ||||||
Intuitive Surgical, Inc.(a) | 11,760 | 6,621,586 | ||||||
Sartorius AG (Preference Shares) | 8,776 | 2,253,123 | ||||||
|
| |||||||
| 12,675,091 | ||||||||
|
| |||||||
Health Care Providers & Services – 2.0% | ||||||||
Aetna, Inc. | 25,101 | 2,726,722 | ||||||
Express Scripts Holding Co.(a) | 11,400 | 802,332 | ||||||
Premier, Inc. – Class A(a) | 37,275 | 1,212,183 | ||||||
Quest Diagnostics, Inc. | 11,843 | 787,915 | ||||||
Ramsay Health Care Ltd. | 16,267 | 767,051 | ||||||
UnitedHealth Group, Inc. | 59,921 | 7,136,591 | ||||||
|
| |||||||
| 13,432,794 | ||||||||
|
| |||||||
Life Sciences Tools & Services – 0.9% | ||||||||
Eurofins Scientific SE | 9,200 | 3,272,531 | ||||||
Illumina, Inc.(a) | 8,814 | 1,324,215 | ||||||
Mettler-Toledo International, Inc.(a) | 4,219 | 1,328,605 | ||||||
|
| |||||||
| 5,925,351 | ||||||||
|
| |||||||
| AB TAX-MANAGED WEALTH STRATEGIES • | 35 |
AB Tax-Managed Wealth Appreciation—Portfolio of Investments
| Company | Shares | U.S. $ Value | ||||||
| ||||||||
Pharmaceuticals – 3.1% | ||||||||
Aspen Pharmacare Holdings Ltd.(a) | 54,130 | $ | 956,653 | |||||
GlaxoSmithKline PLC | 66,160 | 1,282,184 | ||||||
Johnson & Johnson | 44,953 | 4,729,505 | ||||||
Merck & Co., Inc. | 35,035 | 1,759,107 | ||||||
Novo Nordisk A/S – Class B | 38,622 | 1,988,440 | ||||||
Pfizer, Inc. | 138,168 | 4,099,445 | ||||||
Roche Holding AG | 9,510 | 2,438,509 | ||||||
Shire PLC | 35,020 | 1,826,979 | ||||||
Sun Pharmaceutical Industries Ltd. | 82,480 | 1,031,722 | ||||||
|
| |||||||
| 20,112,544 | ||||||||
|
| |||||||
| 64,950,377 | ||||||||
|
| |||||||
Industrials – 7.0% | ||||||||
Aerospace & Defense – 1.1% | ||||||||
Airbus Group SE | 16,480 | 1,063,565 | ||||||
L-3 Communications Holdings, Inc. | 13,796 | 1,618,409 | ||||||
Northrop Grumman Corp. | 3,800 | 730,436 | ||||||
Rockwell Collins, Inc. | 14,540 | 1,273,268 | ||||||
United Technologies Corp. | 12,644 | 1,221,663 | ||||||
Zodiac Aerospace | 60,840 | 1,013,336 | ||||||
|
| |||||||
| 6,920,677 | ||||||||
|
| |||||||
Airlines – 1.1% | ||||||||
Air Canada(a) | 60,930 | 325,140 | ||||||
Alaska Air Group, Inc. | 13,934 | 1,029,722 | ||||||
Delta Air Lines, Inc. | 33,382 | 1,610,348 | ||||||
International Consolidated Airlines Group SA | 169,850 | 1,291,319 | ||||||
Japan Airlines Co., Ltd. | 26,900 | 962,523 | ||||||
JetBlue Airways Corp.(a) | 68,774 | 1,513,028 | ||||||
Qantas Airways Ltd.(a) | 245,871 | 675,378 | ||||||
|
| |||||||
| 7,407,458 | ||||||||
|
| |||||||
Building Products – 0.1% | ||||||||
AO Smith Corp. | 8,600 | 605,268 | ||||||
|
| |||||||
Commercial Services & Supplies – 0.6% | ||||||||
Babcock International Group PLC | 209,684 | 2,653,090 | ||||||
Regus PLC | 323,592 | 1,298,280 | ||||||
|
| |||||||
| 3,951,370 | ||||||||
|
| |||||||
Construction & Engineering – 0.1% | ||||||||
IRB Infrastructure Developers Ltd. | 83,146 | 261,970 | ||||||
Quanta Services, Inc.(a) | 17,748 | 360,107 | ||||||
|
| |||||||
| 622,077 | ||||||||
|
| |||||||
Electrical Equipment – 0.5% | ||||||||
Acuity Brands, Inc. | 6,747 | 1,413,024 | ||||||
Eaton Corp. PLC | 37,824 | 2,144,999 | ||||||
|
| |||||||
| 3,558,023 | ||||||||
|
| |||||||
| 36 | • AB TAX-MANAGED WEALTH STRATEGIES |
AB Tax-Managed Wealth Appreciation—Portfolio of Investments
| Company | Shares | U.S. $ Value | ||||||
| ||||||||
Industrial Conglomerates – 0.9% | ||||||||
Danaher Corp. | 22,534 | $ | 2,011,610 | |||||
General Electric Co. | 72,112 | 2,101,344 | ||||||
Rheinmetall AG | 12,200 | 866,496 | ||||||
Roper Technologies, Inc. | 4,860 | 816,140 | ||||||
|
| |||||||
| 5,795,590 | ||||||||
|
| |||||||
Machinery – 0.8% | ||||||||
Hoshizaki Electric Co., Ltd. | 28,800 | 2,228,891 | ||||||
IHI Corp. | 371,000 | 660,569 | ||||||
ITT Corp. | 32,705 | 1,153,178 | ||||||
JTEKT Corp. | 97,100 | 1,325,630 | ||||||
|
| |||||||
| 5,368,268 | ||||||||
|
| |||||||
Marine – 0.1% | ||||||||
AP Moeller – Maersk A/S – Class B | 316 | 415,288 | ||||||
|
| |||||||
Professional Services – 1.0% | ||||||||
Bureau Veritas SA | 97,149 | 1,935,328 | ||||||
Capita PLC | 171,759 | 2,381,706 | ||||||
Robert Half International, Inc. | 19,170 | 755,106 | ||||||
Teleperformance | 20,719 | 1,599,578 | ||||||
|
| |||||||
| 6,671,718 | ||||||||
|
| |||||||
Road & Rail – 0.4% | ||||||||
Canadian National Railway Co. | 7,330 | 425,822 | ||||||
CAR, Inc.(a) | 147,000 | 167,704 | ||||||
Central Japan Railway Co. | 9,500 | 1,699,708 | ||||||
|
| |||||||
| 2,293,234 | ||||||||
|
| |||||||
Trading Companies & Distributors – 0.3% | ||||||||
Brenntag AG | 10,540 | 508,737 | ||||||
Bunzl PLC | 41,220 | 1,103,184 | ||||||
WESCO International, Inc.(a) | 12,941 | 570,051 | ||||||
|
| |||||||
| 2,181,972 | ||||||||
|
| |||||||
| 45,790,943 | ||||||||
|
| |||||||
Consumer Staples – 5.2% | ||||||||
Beverages – 0.4% | ||||||||
Asahi Group Holdings Ltd. | 10,700 | 314,442 | ||||||
Monster Beverage Corp.(a) | 20,302 | 2,547,901 | ||||||
|
| |||||||
| 2,862,343 | ||||||||
|
| |||||||
Food & Staples Retailing – 1.9% | ||||||||
Alimentation Couche-Tard, Inc. – Class B | 11,590 | 524,420 | ||||||
Costco Wholesale Corp. | 12,820 | 1,923,384 | ||||||
CP ALL PCL | 586,800 | 712,296 | ||||||
CVS Health Corp. | 50,596 | 4,916,413 | ||||||
Delhaize Group | 19,670 | 1,989,143 | ||||||
Lenta Ltd. (GDR)(a)(b) | 142,422 | 802,047 | ||||||
| AB TAX-MANAGED WEALTH STRATEGIES • | 37 |
AB Tax-Managed Wealth Appreciation—Portfolio of Investments
| Company | Shares | U.S. $ Value | ||||||
| ||||||||
Magnit PJSC (Sponsored GDR)(b) | 10,364 | $ | 347,194 | |||||
Olam International Ltd. | 689,805 | 782,720 | ||||||
X5 Retail Group NV (GDR)(a)(b) | 22,764 | 424,549 | ||||||
|
| |||||||
| 12,422,166 | ||||||||
|
| |||||||
Food Products – 0.8% | ||||||||
Archer-Daniels-Midland Co. | 9,579 | 334,882 | ||||||
Bunge Ltd. | 2,357 | 117,190 | ||||||
First Resources Ltd. | 187,900 | 254,506 | ||||||
Ingredion, Inc. | 8,983 | 909,259 | ||||||
JBS SA | 167,900 | 476,662 | ||||||
Mondelez International, Inc. – Class A | 25,445 | 1,031,286 | ||||||
Tyson Foods, Inc. – Class A | 18,054 | 1,168,996 | ||||||
Universal Robina Corp. | 78,970 | 328,653 | ||||||
WhiteWave Foods Co. (The)(a) | 11,594 | 448,920 | ||||||
|
| |||||||
| 5,070,354 | ||||||||
|
| |||||||
Household Products – 0.2% | ||||||||
Kimberly-Clark Corp. | 1,180 | 153,754 | ||||||
Procter & Gamble Co. (The) | 18,689 | 1,500,540 | ||||||
|
| |||||||
| 1,654,294 | ||||||||
|
| |||||||
Personal Products – 0.7% | ||||||||
Estee Lauder Cos., Inc. (The) – Class A | 29,612 | 2,704,464 | ||||||
Hengan International Group Co., Ltd. | 103,500 | 819,298 | ||||||
Unilever PLC | 17,980 | 768,151 | ||||||
|
| |||||||
| 4,291,913 | ||||||||
|
| |||||||
Tobacco – 1.2% | ||||||||
Altria Group, Inc. | 29,939 | 1,843,344 | ||||||
British American Tobacco PLC | 91,396 | 4,972,329 | ||||||
Imperial Brands PLC | 11,601 | 598,795 | ||||||
Philip Morris International, Inc. | 6,660 | 606,260 | ||||||
|
| |||||||
| 8,020,728 | ||||||||
|
| |||||||
| 34,321,798 | ||||||||
|
| |||||||
Energy – 3.2% | ||||||||
Energy Equipment & Services – 0.4% | ||||||||
Aker Solutions ASA(b) | 48,460 | 143,750 | ||||||
Schlumberger Ltd. | 34,244 | 2,455,980 | ||||||
|
| |||||||
| 2,599,730 | ||||||||
|
| |||||||
Oil, Gas & Consumable Fuels – 2.8% | ||||||||
California Resources Corp. | 589 | 331 | ||||||
Canadian Natural Resources Ltd. | 13,150 | 274,857 | ||||||
Chevron Corp. | 8,865 | 739,696 | ||||||
EOG Resources, Inc. | 28,159 | 1,823,014 | ||||||
Exxon Mobil Corp. | 57,691 | 4,623,934 | ||||||
HollyFrontier Corp. | 35,110 | 1,187,420 | ||||||
JX Holdings, Inc. | 406,000 | 1,577,044 | ||||||
| 38 | • AB TAX-MANAGED WEALTH STRATEGIES |
AB Tax-Managed Wealth Appreciation—Portfolio of Investments
| Company | Shares | U.S. $ Value | ||||||
| ||||||||
LUKOIL PJSC (Sponsored ADR) | 10,360 | $ | 366,043 | |||||
Occidental Petroleum Corp. | 6,263 | 431,020 | ||||||
Phillips 66 | 8,397 | 666,638 | ||||||
QEP Resources, Inc. | 77,373 | 755,160 | ||||||
Royal Dutch Shell PLC – Class A | 122,230 | 2,788,558 | ||||||
TOTAL SA | 22,215 | 995,686 | ||||||
Tupras Turkiye Petrol Rafinerileri AS(a) | 28,310 | 723,355 | ||||||
Valero Energy Corp. | 24,565 | 1,475,865 | ||||||
|
| |||||||
| 18,428,621 | ||||||||
|
| |||||||
| 21,028,351 | ||||||||
|
| |||||||
Utilities – 2.4% | ||||||||
Electric Utilities – 1.5% | ||||||||
American Electric Power Co., Inc. | 25,400 | 1,568,450 | ||||||
Edison International | 22,279 | 1,518,537 | ||||||
EDP �� Energias de Portugal SA | 388,840 | 1,204,234 | ||||||
Enel SpA | 167,860 | 670,842 | ||||||
Exelon Corp. | 38,359 | 1,207,925 | ||||||
FirstEnergy Corp. | 6,551 | 219,262 | ||||||
Korea Electric Power Corp. | 15,450 | 732,967 | ||||||
PPL Corp. | 55,888 | 1,955,521 | ||||||
Westar Energy, Inc. | 19,800 | 860,508 | ||||||
|
| |||||||
| 9,938,246 | ||||||||
|
| |||||||
Independent Power and Renewable Electricity Producers – 0.3% | ||||||||
Huadian Power International Corp., Ltd. – Class H | 1,234,000 | 667,997 | ||||||
Huaneng Power International, Inc. – Class H | 954,000 | 748,106 | ||||||
TerraForm Global, Inc. – Class A | 131,212 | 415,942 | ||||||
|
| |||||||
| 1,832,045 | ||||||||
|
| |||||||
Multi-Utilities – 0.5% | ||||||||
NiSource, Inc. | 66,671 | 1,432,093 | ||||||
PG&E Corp. | 23,403 | 1,327,652 | ||||||
Public Service Enterprise Group, Inc. | 8,000 | 341,280 | ||||||
|
| |||||||
| 3,101,025 | ||||||||
|
| |||||||
Water Utilities – 0.1% | ||||||||
Cia de Saneamento Basico do Estado de Sao Paulo | 106,500 | 599,660 | ||||||
|
| |||||||
| 15,470,976 | ||||||||
|
| |||||||
Materials – 2.3% | ||||||||
Chemicals – 2.0% | ||||||||
Agrium, Inc. (Toronto) | 6,130 | 527,869 | ||||||
Arkema SA | 16,475 | 1,005,848 | ||||||
CF Industries Holdings, Inc. | 67,090 | 2,446,101 | ||||||
Covestro AG(a)(b) | 15,507 | 494,222 | ||||||
Dow Chemical Co. (The) | 22,413 | 1,089,496 | ||||||
Essentra PLC | 298,730 | 3,451,537 | ||||||
| AB TAX-MANAGED WEALTH STRATEGIES • | 39 |
AB Tax-Managed Wealth Appreciation—Portfolio of Investments
| Company | Shares | U.S. $ Value | ||||||
| ||||||||
JSR Corp. | 46,500 | $ | 651,848 | |||||
Koninklijke DSM NV | 17,417 | 856,792 | ||||||
LG Chem Ltd. | 1,800 | 437,550 | ||||||
LyondellBasell Industries NV – Class A | 27,362 | 2,194,706 | ||||||
|
| |||||||
| 13,155,969 | ||||||||
|
| |||||||
Metals & Mining – 0.2% | ||||||||
Goldcorp, Inc. | 31,380 | 450,870 | ||||||
Novolipetsk Steel AO (GDR)(b) | 57,300 | 558,995 | ||||||
|
| |||||||
| 1,009,865 | ||||||||
|
| |||||||
Paper & Forest Products – 0.1% | ||||||||
Mondi PLC | 38,320 | 683,679 | ||||||
|
| |||||||
| 14,849,513 | ||||||||
|
| |||||||
Telecommunication Services – 1.7% | ||||||||
Diversified Telecommunication Services – 1.2% | ||||||||
AT&T, Inc. | 9,781 | 361,408 | ||||||
BT Group PLC | 348,160 | 2,344,564 | ||||||
Nippon Telegraph & Telephone Corp. | 60,000 | 2,540,839 | ||||||
Telefonica Brasil SA (Preference Shares) | 81,800 | 778,164 | ||||||
Verizon Communications, Inc. | 36,851 | 1,869,451 | ||||||
|
| |||||||
| 7,894,426 | ||||||||
|
| |||||||
Wireless Telecommunication Services – 0.5% | ||||||||
Rogers Communications, Inc. – Class B | 9,490 | 351,263 | ||||||
SoftBank Group Corp. | 11,300 | 555,291 | ||||||
Tower Bersama Infrastructure Tbk PT(a) | 805,500 | 347,401 | ||||||
Turkcell Iletisim Hizmetleri AS | 161,720 | 602,814 | ||||||
Vodafone Group PLC | 524,357 | 1,590,321 | ||||||
|
| |||||||
| 3,447,090 | ||||||||
|
| |||||||
| 11,341,516 | ||||||||
|
| |||||||
Total Common Stocks | 463,484,506 | |||||||
|
| |||||||
INVESTMENT COMPANIES – 27.5% | ||||||||
Funds and Investment Trusts – 27.5% | ||||||||
AB Multi-Manager Alternative Strategies Fund – Class Z(a)(c) | 5,442,245 | 52,408,816 | ||||||
AB Pooling Portfolio-AB Multi-Asset Real Return Portfolio(c) | 5,549,799 | 29,802,421 | ||||||
AB Pooling Portfolio-AB Volatility Management Portfolio(c) | 9,847,483 | 98,080,934 | ||||||
|
| |||||||
Total Investment Companies | 180,292,171 | |||||||
|
| |||||||
| 40 | • AB TAX-MANAGED WEALTH STRATEGIES |
AB Tax-Managed Wealth Appreciation—Portfolio of Investments
| Company | Shares | U.S. $ Value | ||||||
| ||||||||
SHORT-TERM INVESTMENTS – 1.4% | ||||||||
Investment Companies – 1.4% | ||||||||
AB Fixed Income Shares, Inc. – Government STIF Portfolio, | 9,306,540 | $ | 9,306,540 | |||||
|
| |||||||
Total Investments – 99.7% | 653,083,217 | |||||||
Other assets less liabilities – 0.3% | 1,927,723 | |||||||
|
| |||||||
Net Assets – 100.0% | $ | 655,010,940 | ||||||
|
| |||||||
FUTURES (see Note D)
| Type | Number of Contracts | Expiration Month | Original Value | Value at February 29, 2016 | Unrealized Appreciation/ (Depreciation) | |||||||||||||||
Purchased Contracts | ||||||||||||||||||||
EURO STOXX 50 Index Futures | 3 | March 2016 | $ | 101,892 | $ | 95,753 | $ | (6,139 | ) | |||||||||||
TOPIX Index Futures | 1 | March 2016 | 140,843 | 114,230 | (26,613 | ) | ||||||||||||||
|
| |||||||||||||||||||
| $ | (32,752 | ) | ||||||||||||||||||
|
| |||||||||||||||||||
FORWARD CURRENCY EXCHANGE CONTRACTS (see Note D)
| Counterparty | Contracts to Deliver (000) | In Exchange For (000) | Settlement Date | Unrealized Appreciation/ (Depreciation) | ||||||||||||||||||||
Bank of America, NA | USD | 1,234 | NOK | 10,572 | 5/18/16 | $ | (20,015 | ) | ||||||||||||||||
Barclays Bank PLC | JPY | 89,509 | USD | 788 | 5/18/16 | (7,620 | ) | |||||||||||||||||
BNP Paribas SA | CAD | 1,027 | USD | 736 | 5/18/16 | (23,443 | ) | |||||||||||||||||
BNP Paribas SA | KRW | 1,694,177 | USD | 1,390 | 5/18/16 | 25,716 | ||||||||||||||||||
Citibank | RUB | 26,144 | USD | 336 | 4/07/16 | (8,081 | ) | |||||||||||||||||
Citibank | EUR | 5,252 | USD | 5,930 | 5/18/16 | 202,387 | ||||||||||||||||||
Citibank | GBP | 4,422 | USD | 6,381 | 5/18/16 | 224,167 | ||||||||||||||||||
Citibank | USD | 1,872 | AUD | 2,662 | 5/18/16 | 21,137 | ||||||||||||||||||
Credit Suisse International | JPY | 223,927 | USD | 1,853 | 5/18/16 | (137,408 | ) | |||||||||||||||||
Credit Suisse International | USD | 1,128 | EUR | 1,010 | 5/18/16 | (26,787 | ) | |||||||||||||||||
Credit Suisse International | USD | 875 | NOK | 7,652 | 5/18/16 | 3,857 | ||||||||||||||||||
Deutsche Bank AG | BRL | 4,600 | USD | 1,130 | 3/02/16 | (15,214 | ) | |||||||||||||||||
Deutsche Bank AG | USD | 1,156 | BRL | 4,600 | 3/02/16 | (10,348 | ) | |||||||||||||||||
Deutsche Bank AG | JPY | 71,223 | USD | 607 | 5/18/16 | (26,507 | ) | |||||||||||||||||
HSBC Bank USA | BRL | 4,600 | USD | 1,156 | 3/02/16 | 10,348 | ||||||||||||||||||
HSBC Bank USA | USD | 1,164 | BRL | 4,600 | 3/02/16 | (18,863 | ) | |||||||||||||||||
HSBC Bank USA | BRL | 4,600 | USD | 1,154 | 4/04/16 | 18,236 | ||||||||||||||||||
HSBC Bank USA | CAD | 702 | USD | 487 | 5/18/16 | (31,901 | ) | |||||||||||||||||
HSBC Bank USA | HKD | 33,199 | USD | 4,258 | 5/18/16 | (11,405 | ) | |||||||||||||||||
HSBC Bank USA | USD | 1,082 | JPY | 126,206 | 5/18/16 | 39,831 | ||||||||||||||||||
HSBC Bank USA | USD | 4,036 | SEK | 33,890 | 5/18/16 | (65,988 | ) | |||||||||||||||||
| AB TAX-MANAGED WEALTH STRATEGIES • | 41 |
AB Tax-Managed Wealth Appreciation—Portfolio of Investments
| Counterparty | Contracts to Deliver (000) | In Exchange For (000) | Settlement Date | Unrealized Appreciation/ (Depreciation) | ||||||||||||||||||||
JPMorgan Chase Bank | USD | 950 | CHF | 952 | 5/18/16 | $ | 6,727 | |||||||||||||||||
Morgan Stanley & Co., Inc. | EUR | 426 | USD | 464 | 5/18/16 | (696 | ) | |||||||||||||||||
Morgan Stanley & Co., Inc. | USD | 667 | CAD | 947 | 5/18/16 | 32,890 | ||||||||||||||||||
Royal Bank of Scotland PLC | EUR | 1,608 | USD | 1,825 | 5/18/16 | 72,032 | ||||||||||||||||||
Royal Bank of Scotland PLC | KRW | 949,356 | USD | 791 | 5/18/16 | 26,278 | ||||||||||||||||||
Royal Bank of Scotland PLC | USD | 1,817 | CHF | 1,762 | 5/18/16 | (45,840 | ) | |||||||||||||||||
Societe Generale | GBP | 2,759 | USD | 3,893 | 5/18/16 | 51,518 | ||||||||||||||||||
Standard Chartered Bank | JPY | 98,742 | USD | 862 | 5/18/16 | (15,669 | ) | |||||||||||||||||
Standard Chartered Bank | USD | 7,872 | JPY | 901,596 | 5/18/16 | 143,067 | ||||||||||||||||||
State Street Bank & Trust Co. | EUR | 1,070 | USD | 1,182 | 5/18/16 | 15,147 | ||||||||||||||||||
State Street Bank & Trust Co. | GBP | 186 | USD | 268 | 5/18/16 | 9,206 | ||||||||||||||||||
State Street Bank & Trust Co. | USD | 1,467 | CHF | 1,418 | 5/18/16 | (41,188 | ) | |||||||||||||||||
State Street Bank & Trust Co. | USD | 453 | JPY | 51,029 | 5/18/16 | 345 | ||||||||||||||||||
UBS AG | CAD | 2,061 | USD | 1,425 | 5/18/16 | (98,432 | ) | |||||||||||||||||
|
| |||||||||||||||||||||||
| $ | 297,484 | |||||||||||||||||||||||
|
| |||||||||||||||||||||||
| (a) | Non-income producing security. |
| (b) | Security is exempt from registration under Rule 144A of the Securities Act of 1933. These securities are considered liquid and may be resold in transactions exempt from registration, normally to qualified institutional buyers. At February 29, 2016, the aggregate market value of these securities amounted to $5,481,384 or 0.8% of net assets. |
| (c) | To obtain a copy of the fund’s financial statements, please go to the Securities and Exchange Commission’s website at www.sec.gov, or call AB at (800) 227-4618. |
| (d) | Investment in affiliated money market mutual fund. The rate shown represents the 7-day yield as of period end. |
Currency Abbreviations:
| AUD | – Australian Dollar |
| BRL | – Brazilian Real |
| CAD | – Canadian Dollar |
| CHF | – Swiss Franc |
| EUR | – Euro |
| GBP | – Great British Pound |
| HKD | – Hong Kong Dollar |
| JPY | – Japanese Yen |
| KRW | – South Korean Won |
| NOK | – Norwegian Krone |
| RUB | – Russian Ruble |
| SEK | – Swedish Krona |
| USD | – United States Dollar |
Glossary:
| ADR | – American Depositary Receipt |
| GDR | – Global Depositary Receipt |
| PJSC | – Public Joint Stock Company |
| REG | – Registered Shares |
| TOPIX | – Tokyo Price Index |
See notes to financial statements.
| 42 | • AB TAX-MANAGED WEALTH STRATEGIES |
AB Tax-Managed Wealth Appreciation—Portfolio of Investments
AB TAX-MANAGED BALANCED WEALTH STRATEGY
PORTFOLIO OF INVESTMENTS
February 29, 2016 (unaudited)
| Principal Amount (000) | U.S. $ Value | |||||||
| ||||||||
MUNICIPAL OBLIGATIONS – 53.6% |
| |||||||
Long-Term Municipal Bonds – 53.6% |
| |||||||
Alabama – 4.9% | ||||||||
Alabama Public School & College Authority | $ | 2,040 | $ | 2,227,802 | ||||
Birmingham Water Works Board | 3,980 | 4,672,958 | ||||||
|
| |||||||
| 6,900,760 | ||||||||
|
| |||||||
Arizona – 2.2% | ||||||||
Arizona Department of Transportation State Highway Fund Revenue | 2,100 | 2,505,825 | ||||||
City of Glendale AZ | 410 | 495,936 | ||||||
Industrial Development Authority of the County of Pima (The) | 140 | 141,277 | ||||||
|
| |||||||
| 3,143,038 | ||||||||
|
| |||||||
California – 1.9% | ||||||||
City of Los Angeles Department of Airports | 365 | 424,736 | ||||||
State of California Department of Water Resources Power Supply Revenue | 1,905 | 2,228,374 | ||||||
|
| |||||||
| 2,653,110 | ||||||||
|
| |||||||
Colorado – 2.4% | ||||||||
City & County of Denver CO Airport System Revenue | 1,220 | 1,431,682 | ||||||
PV Water & Sanitation Metropolitan District | 710 | 248,500 | ||||||
Regional Transportation District COP | 1,475 | 1,729,644 | ||||||
|
| |||||||
| 3,409,826 | ||||||||
|
| |||||||
| AB TAX-MANAGED WEALTH STRATEGIES • | 43 |
AB Tax-Managed Balanced Wealth Strategy—Portfolio of Investments
| Principal Amount (000) | U.S. $ Value | |||||||
| ||||||||
Connecticut – 4.5% | ||||||||
State of Connecticut | $ | 3,275 | $ | 3,460,234 | ||||
State of Connecticut Special Tax Revenue | 2,390 | 2,840,371 | ||||||
|
| |||||||
| 6,300,605 | ||||||||
|
| |||||||
District of Columbia – 1.0% | ||||||||
District of Columbia | 1,200 | 1,320,516 | ||||||
|
| |||||||
Florida – 4.6% | ||||||||
County of Miami-Dade FL | 1,000 | 1,190,130 | ||||||
County of Miami-Dade FL Aviation Revenue | 665 | 817,405 | ||||||
Series 2015A | 200 | 238,776 | ||||||
County of Miami-Dade FL Spl Tax | 560 | 666,859 | ||||||
Florida State Board of Education | 285 | 301,219 | ||||||
Overoaks Community Development District | 25 | 12,500 | ||||||
Series 2010A-1 | 15 | 15,019 | ||||||
Series 2010A-2 | 35 | 35,037 | ||||||
Series 2010B | 40 | 40,206 | ||||||
Parkway Center Community Development District | 70 | 73,309 | ||||||
Sarasota County School Board COP | 1,165 | 1,352,739 | ||||||
Tampa Bay Water | 1,380 | 1,660,443 | ||||||
|
| |||||||
| 6,403,642 | ||||||||
|
| |||||||
| 44 | • AB TAX-MANAGED WEALTH STRATEGIES |
AB Tax-Managed Balanced Wealth Strategy—Portfolio of Investments
| Principal Amount (000) | U.S. $ Value | |||||||
| ||||||||
Georgia – 1.7% | ||||||||
City of Atlanta Department of Aviation | $ | 1,980 | $ | 2,364,041 | ||||
|
| |||||||
Illinois – 0.7% | ||||||||
Illinois Finance Authority | 150 | 180,826 | ||||||
Illinois State Toll Highway Authority | 305 | 339,172 | ||||||
State of Illinois | 315 | 355,698 | ||||||
Series 2014 | 75 | 83,240 | ||||||
|
| |||||||
| 958,936 | ||||||||
|
| |||||||
Indiana – 2.2% | ||||||||
Indiana Bond Bank | 1,945 | 2,183,262 | ||||||
Indiana Finance Authority | 145 | 169,778 | ||||||
Richmond Hospital Authority | 580 | 697,259 | ||||||
|
| |||||||
| 3,050,299 | ||||||||
|
| |||||||
Massachusetts – 0.5% | ||||||||
Commonwealth of Massachusetts | 100 | 91,244 | ||||||
AGM Series 2006B | 500 | 634,865 | ||||||
|
| |||||||
| 726,109 | ||||||||
|
| |||||||
Michigan – 1.9% | ||||||||
Michigan Finance Authority | 955 | 1,087,458 | ||||||
| AB TAX-MANAGED WEALTH STRATEGIES • | 45 |
AB Tax-Managed Balanced Wealth Strategy—Portfolio of Investments
| Principal Amount (000) | U.S. $ Value | |||||||
| ||||||||
Michigan Finance Authority | $ | 325 | $ | 379,347 | ||||
Michigan Finance Authority | 1,000 | 1,167,220 | ||||||
|
| |||||||
| 2,634,025 | ||||||||
|
| |||||||
Mississippi – 0.3% | ||||||||
State of Mississippi Gaming | 370 | 440,607 | ||||||
|
| |||||||
Nebraska – 0.1% | ||||||||
Douglas County Hospital Authority No 2 | 155 | 177,029 | ||||||
|
| |||||||
Nevada – 0.3% | ||||||||
Clark County School District | 315 | 345,023 | ||||||
|
| |||||||
New Jersey – 4.3% | ||||||||
New Jersey Economic Development Authority | 1,195 | 1,376,796 | ||||||
New Jersey Transit Corp. | 300 | 338,262 | ||||||
New Jersey Transportation Trust Fund Authority | 1,840 | 2,001,014 | ||||||
New Jersey Turnpike Authority | 100 | 92,059 | ||||||
Series 2014A | 1,870 | 2,219,447 | ||||||
|
| |||||||
| 6,027,578 | ||||||||
|
| |||||||
| 46 | • AB TAX-MANAGED WEALTH STRATEGIES |
AB Tax-Managed Balanced Wealth Strategy—Portfolio of Investments
| Principal Amount (000) | U.S. $ Value | |||||||
| ||||||||
New York – 5.3% | ||||||||
Metropolitan Transportation Authority | $ | 460 | $ | 560,942 | ||||
New York City Transitional Finance Authority Future Tax Secured Revenue | 2,275 | 2,753,842 | ||||||
New York State Dormitory Authority | 205 | 246,410 | ||||||
New York State Energy Research & Development Authority | 375 | 333,233 | ||||||
XLCA Series 2004A | 400 | 354,752 | ||||||
New York State Thruway Authority | 425 | 479,179 | ||||||
Triborough Bridge & Tunnel Authority | 1,000 | 1,219,440 | ||||||
Series 2013B | 1,215 | 1,439,423 | ||||||
|
| |||||||
| 7,387,221 | ||||||||
|
| |||||||
North Carolina – 0.1% | ||||||||
North Carolina Eastern Municipal Power Agency | 150 | 178,207 | ||||||
|
| |||||||
Pennsylvania – 1.6% | ||||||||
Pennsylvania Higher Educational Facilities Authority | 1,000 | 1,084,150 | ||||||
Pennsylvania Turnpike Commission | 1,000 | 1,206,580 | ||||||
Philadelphia Authority for Industrial Development | 55 | 550 | ||||||
|
| |||||||
| 2,291,280 | ||||||||
|
| |||||||
| AB TAX-MANAGED WEALTH STRATEGIES • | 47 |
AB Tax-Managed Balanced Wealth Strategy—Portfolio of Investments
| Principal Amount (000) | U.S. $ Value | |||||||
| ||||||||
Texas – 6.9% | ||||||||
Bryan Independent School District | $ | 1,000 | $ | 1,067,230 | ||||
City of Houston TX Airport System Revenue | 2,815 | 3,089,501 | ||||||
Grand Parkway Transportation Corp. | 1,710 | 1,742,011 | ||||||
Harris County-Houston Sports Authority | 615 | 752,286 | ||||||
Texas A&M University | 2,765 | 3,027,288 | ||||||
|
| |||||||
| 9,678,316 | ||||||||
|
| |||||||
Utah – 0.5% | ||||||||
State of Utah | 675 | 715,608 | ||||||
|
| |||||||
Virginia – 1.1% | ||||||||
Virginia College Building Authority | 1,190 | 1,465,080 | ||||||
|
| |||||||
Washington – 2.4% | ||||||||
Chelan County Public Utility District No 1 | 1,815 | 2,178,163 | ||||||
State of Washington | 535 | 648,618 | ||||||
State of Washington | 145 | 181,495 | ||||||
State of Washington COP | 225 | 247,023 | ||||||
Washington State Housing Finance Commission | 165 | 167,086 | ||||||
|
| |||||||
| 3,422,385 | ||||||||
|
| |||||||
| 48 | • AB TAX-MANAGED WEALTH STRATEGIES |
AB Tax-Managed Balanced Wealth Strategy—Portfolio of Investments
| Principal Amount (000) | U.S. $ Value | |||||||
| ||||||||
Wisconsin – 2.2% | ||||||||
City of Milwaukee WI | $ | 430 | $ | 441,292 | ||||
State of Wisconsin | 2,470 | 2,700,179 | ||||||
|
| |||||||
| 3,141,471 | ||||||||
|
| |||||||
Total Municipal Obligations | 75,134,712 | |||||||
|
| |||||||
| Shares | ||||||||
COMMON STOCKS – 26.9% | ||||||||
Information Technology – 5.6% | ||||||||
Communications Equipment – 0.3% | ||||||||
Arista Networks, Inc.(f) | 1,930 | 132,282 | ||||||
Cisco Systems, Inc. | 6,423 | 168,154 | ||||||
Palo Alto Networks, Inc.(f) | 800 | 115,832 | ||||||
|
| |||||||
| 416,268 | ||||||||
|
| |||||||
Electronic Equipment, Instruments & Components – 0.3% | ||||||||
Amphenol Corp. – Class A | 3,623 | 192,273 | ||||||
China Railway Signal & Communication Corp., Ltd. – Class H(a)(f) | 106,000 | 55,872 | ||||||
Keysight Technologies, Inc.(f) | 5,114 | 133,424 | ||||||
PAX Global Technology Ltd. | 36,000 | 37,877 | ||||||
|
| |||||||
| 419,446 | ||||||||
|
| |||||||
Internet Software & Services – 1.3% | ||||||||
Alphabet, Inc. – Class A(f) | 187 | 134,120 | ||||||
Alphabet, Inc. – Class C(f) | 894 | 623,807 | ||||||
Baidu, Inc. (Sponsored ADR)(f) | 858 | 148,794 | ||||||
Facebook, Inc. – Class A(f) | 5,930 | 634,036 | ||||||
Tencent Holdings Ltd. | 11,400 | 208,739 | ||||||
Twitter, Inc.(f) | 3,710 | 67,225 | ||||||
|
| |||||||
| 1,816,721 | ||||||||
|
| |||||||
IT Services – 0.8% | ||||||||
Cognizant Technology Solutions Corp. – Class A(f) | 3,330 | 189,743 | ||||||
HCL Technologies Ltd. | 3,120 | 37,144 | ||||||
Tata Consultancy Services Ltd. | 3,990 | 126,601 | ||||||
Vantiv, Inc. – Class A(f) | 2,000 | 104,080 | ||||||
Visa, Inc. – Class A | 6,090 | 440,855 | ||||||
Wirecard AG | 2,020 | 79,692 | ||||||
Worldpay Group PLC(a)(f) | 18,152 | 72,481 | ||||||
Xerox Corp. | 11,588 | 111,361 | ||||||
|
| |||||||
| 1,161,957 | ||||||||
|
| |||||||
| AB TAX-MANAGED WEALTH STRATEGIES • | 49 |
AB Tax-Managed Balanced Wealth Strategy—Portfolio of Investments
| Company | Shares | U.S. $ Value | ||||||
| ||||||||
Semiconductors & Semiconductor | ||||||||
Advanced Semiconductor Engineering, Inc. | 71,000 | $ | 80,335 | |||||
Applied Materials, Inc. | 9,975 | 188,228 | ||||||
ARM Holdings PLC | 4,257 | 58,498 | ||||||
ASML Holding NV | 1,150 | 104,762 | ||||||
Infineon Technologies AG | 6,300 | 76,466 | ||||||
Intel Corp. | 5,598 | 165,645 | ||||||
Novatek Microelectronics Corp. | 20,000 | 82,232 | ||||||
NVIDIA Corp. | 8,024 | 251,632 | ||||||
SCREEN Holdings Co., Ltd. | 15,000 | 111,390 | ||||||
Sumco Corp. | 10,200 | 64,800 | ||||||
Taiwan Semiconductor Manufacturing Co., Ltd. | 21,000 | 93,953 | ||||||
Tokyo Electron Ltd. | 900 | 54,250 | ||||||
Xilinx, Inc. | 3,496 | 165,081 | ||||||
|
| |||||||
| 1,497,272 | ||||||||
|
| |||||||
Software – 1.1% | ||||||||
Adobe Systems, Inc.(f) | 1,160 | 98,774 | ||||||
ANSYS, Inc.(f) | 1,183 | 98,213 | ||||||
Aspen Technology, Inc.(f) | 3,240 | 106,823 | ||||||
Constellation Software, Inc./Canada | 710 | 296,237 | ||||||
Dassault Systemes | 1,980 | 149,981 | ||||||
Microsoft Corp. | 6,156 | 313,217 | ||||||
Mobileye NV(f) | 2,819 | 91,505 | ||||||
Nintendo Co., Ltd. | 500 | 69,987 | ||||||
Oracle Corp. | 4,850 | 178,383 | ||||||
ServiceNow, Inc.(f) | 1,906 | 104,811 | ||||||
Tableau Software, Inc. – Class A(f) | 1,070 | 48,846 | ||||||
|
| |||||||
| 1,556,777 | ||||||||
|
| |||||||
Technology Hardware, Storage & | ||||||||
Apple, Inc. | 5,532 | 534,889 | ||||||
Hewlett Packard Enterprise Co. | 8,836 | 117,254 | ||||||
HP, Inc. | 10,148 | 108,482 | ||||||
Samsung Electronics Co., Ltd. | 175 | 166,830 | ||||||
|
| |||||||
| 927,455 | ||||||||
|
| |||||||
| 7,795,896 | ||||||||
|
| |||||||
Financials – 4.9% | ||||||||
Banks – 1.9% | ||||||||
Axis Bank Ltd. | 7,750 | 42,718 | ||||||
Banco Macro SA (ADR)(f) | 1,015 | 68,208 | ||||||
Bank Hapoalim BM | 5,890 | 28,772 | ||||||
Bank of America Corp. | 28,115 | 352,000 | ||||||
Bank of Baroda | 21,360 | 41,343 | ||||||
Bank of Montreal | 690 | 38,070 | ||||||
| 50 | • AB TAX-MANAGED WEALTH STRATEGIES |
AB Tax-Managed Balanced Wealth Strategy—Portfolio of Investments
| Company | Shares | U.S. $ Value | ||||||
| ||||||||
Bank of Queensland Ltd. | 14,482 | $ | 108,781 | |||||
Citigroup, Inc. | 1,477 | 57,381 | ||||||
Citizens Financial Group, Inc. | 8,208 | 157,840 | ||||||
CYBG PLC(f) | 17,785 | 46,785 | ||||||
Danske Bank A/S | 5,490 | 149,835 | ||||||
Fifth Third Bancorp | 1,030 | 15,718 | ||||||
HDFC Bank Ltd. | 4,950 | 80,734 | ||||||
ING Groep NV | 13,714 | 163,489 | ||||||
Intesa Sanpaolo SpA | 20,480 | 51,730 | ||||||
JPMorgan Chase & Co. | 4,599 | 258,924 | ||||||
KB Financial Group, Inc. | 2,420 | 57,941 | ||||||
Mitsubishi UFJ Financial Group, Inc. | 47,100 | 203,251 | ||||||
OTP Bank PLC | 1,920 | 39,943 | ||||||
PNC Financial Services Group, Inc. (The) | 1,105 | 89,848 | ||||||
Shinhan Financial Group Co., Ltd. | 1,130 | 34,835 | ||||||
SunTrust Banks, Inc. | 657 | 21,799 | ||||||
Toronto-Dominion Bank (The) | 1,780 | 68,977 | ||||||
UniCredit SpA | 13,100 | 48,661 | ||||||
US Bancorp | 1,418 | 54,621 | ||||||
Wells Fargo & Co. | 7,899 | 370,621 | ||||||
|
| |||||||
| 2,652,825 | ||||||||
|
| |||||||
Capital Markets – 0.5% | ||||||||
Amundi SA(a)(f) | 895 | 37,290 | ||||||
Azimut Holding SpA | 2,200 | 42,214 | ||||||
Bank of New York Mellon Corp. (The) | 1,250 | 44,237 | ||||||
BlackRock, Inc. – Class A | 284 | 88,597 | ||||||
Credit Suisse Group AG (REG)(f) | 3,826 | 51,208 | ||||||
Goldman Sachs Group, Inc. (The) | 593 | 88,671 | ||||||
Morgan Stanley | 2,091 | 51,648 | ||||||
Partners Group Holding AG | 355 | 128,496 | ||||||
UBS Group AG | 14,433 | 220,493 | ||||||
|
| |||||||
| 752,854 | ||||||||
|
| |||||||
Consumer Finance – 0.4% | ||||||||
Capital One Financial Corp. | 3,472 | 228,215 | ||||||
Discover Financial Services | 2,522 | 117,071 | ||||||
OneMain Holdings, Inc.(f) | 4,191 | 94,591 | ||||||
Shriram Transport Finance Co., Ltd. | 3,530 | 41,309 | ||||||
Synchrony Financial(f) | 5,737 | 154,612 | ||||||
|
| |||||||
| 635,798 | ||||||||
|
| |||||||
Diversified Financial Services – 0.2% | ||||||||
Berkshire Hathaway, Inc. – Class B(f) | 754 | 101,164 | ||||||
BM&FBovespa SA – Bolsa de Valores Mercadorias e Futuros | 13,500 | 39,065 | ||||||
Challenger Ltd./Australia | 13,260 | 70,930 | ||||||
GRENKELEASING AG | 330 | 65,443 | ||||||
|
| |||||||
| 276,602 | ||||||||
|
| |||||||
| AB TAX-MANAGED WEALTH STRATEGIES • | 51 |
AB Tax-Managed Balanced Wealth Strategy—Portfolio of Investments
| Company | Shares | U.S. $ Value | ||||||
| ||||||||
Insurance – 1.4% | ||||||||
Admiral Group PLC | 6,890 | $ | 165,450 | |||||
Aflac, Inc. | 552 | 32,855 | ||||||
AIA Group Ltd. | 52,800 | 268,542 | ||||||
Allstate Corp. (The) | 3,223 | 204,532 | ||||||
American Financial Group, Inc./OH | 1,800 | 120,744 | ||||||
American International Group, Inc. | 2,635 | 132,277 | ||||||
Aviva PLC | 7,200 | 43,687 | ||||||
Chubb Ltd. | 196 | 22,644 | ||||||
Dongbu Insurance Co., Ltd. | 820 | 44,727 | ||||||
First American Financial Corp. | 1,505 | 55,730 | ||||||
FNF Group | 3,136 | 103,425 | ||||||
Hartford Financial Services Group, Inc. (The) | 396 | 16,679 | ||||||
Muenchener Rueckversicherungs-Gesellschaft AG in Muenchen (REG) | 420 | 82,444 | ||||||
NN Group NV | 2,796 | 86,126 | ||||||
Ping An Insurance Group Co. of China Ltd. – Class H | 7,500 | 31,835 | ||||||
Progressive Corp. (The) | 850 | 27,132 | ||||||
Prudential PLC | 11,620 | 202,353 | ||||||
Reinsurance Group of America, Inc. – Class A | 798 | 71,900 | ||||||
Suncorp Group Ltd. | 5,650 | 45,027 | ||||||
Travelers Cos., Inc. (The) | 1,219 | 131,067 | ||||||
Zurich Insurance Group AG(f) | 230 | 48,716 | ||||||
|
| |||||||
| 1,937,892 | ||||||||
|
| |||||||
Real Estate Investment Trusts (REITs) – 0.1% | ||||||||
Emlak Konut Gayrimenkul Yatirim Ortakligi AS | 45,910 | 39,828 | ||||||
RLJ Lodging Trust | 2,741 | 57,479 | ||||||
|
| |||||||
| 97,307 | ||||||||
|
| |||||||
Real Estate Management & Development – 0.2% | ||||||||
Ayala Land, Inc. | 79,600 | 54,880 | ||||||
China Overseas Land & Investment Ltd. | 12,000 | 35,772 | ||||||
Daito Trust Construction Co., Ltd. | 100 | 13,544 | ||||||
Global Logistic Properties Ltd. | 98,000 | 123,216 | ||||||
LendLease Group | 6,770 | 62,757 | ||||||
SM Prime Holdings, Inc. | 20,900 | 9,090 | ||||||
|
| |||||||
| 299,259 | ||||||||
|
| |||||||
Thrifts & Mortgage Finance – 0.2% | ||||||||
Housing Development Finance Corp., Ltd. | 13,160 | 205,000 | ||||||
LIC Housing Finance Ltd. | 6,950 | 42,835 | ||||||
|
| |||||||
| 247,835 | ||||||||
|
| |||||||
| 6,900,372 | ||||||||
|
| |||||||
| 52 | • AB TAX-MANAGED WEALTH STRATEGIES |
AB Tax-Managed Balanced Wealth Strategy—Portfolio of Investments
| Company | Shares | U.S. $ Value | ||||||
| ||||||||
Consumer Discretionary – 4.5% | ||||||||
Auto Components – 0.6% | ||||||||
Continental AG | 515 | $ | 102,504 | |||||
Goodyear Tire & Rubber Co. (The) | 3,566 | 107,408 | ||||||
Hankook Tire Co., Ltd. | 1,960 | 84,579 | ||||||
Lear Corp. | 1,048 | 106,215 | ||||||
Magna International, Inc. – Class A | 5,618 | 218,259 | ||||||
Plastic Omnium SA | 1,540 | 48,908 | ||||||
Sumitomo Electric Industries Ltd. | 6,000 | 71,950 | ||||||
Valeo SA | 456 | 63,043 | ||||||
|
| |||||||
| 802,866 | ||||||||
|
| |||||||
Automobiles – 0.3% | ||||||||
General Motors Co. | 2,175 | 64,032 | ||||||
Honda Motor Co., Ltd. | 4,100 | 105,447 | ||||||
Isuzu Motors Ltd. | 5,300 | 53,024 | ||||||
Peugeot SA(f) | 6,320 | 94,823 | ||||||
Tata Motors Ltd.(f) | 6,206 | 27,183 | ||||||
Tata Motors Ltd. – Class A(f) | 13,359 | 45,888 | ||||||
Toyota Motor Corp. | 700 | 36,496 | ||||||
|
| |||||||
| 426,893 | ||||||||
|
| |||||||
Diversified Consumer Services – 0.0% | ||||||||
TAL Education Group (ADR)(f) | 1,153 | 59,668 | ||||||
|
| |||||||
Hotels, Restaurants & Leisure – 0.3% | ||||||||
IMAX China Holding, Inc.(a)(f) | 8,000 | 47,451 | ||||||
Melco International Development Ltd. | 47,000 | 54,785 | ||||||
Starbucks Corp. | 4,380 | 254,960 | ||||||
Yum! Brands, Inc. | 870 | 63,049 | ||||||
|
| |||||||
| 420,245 | ||||||||
|
| |||||||
Internet & Catalog Retail – 0.4% | ||||||||
Ctrip.com International Ltd. (ADR)(f) | 1,750 | 71,610 | ||||||
JD.com, Inc. (ADR)(f) | 1,100 | 28,281 | ||||||
Priceline Group, Inc. (The)(f) | 258 | 326,424 | ||||||
Vipshop Holdings Ltd. (ADR)(f) | 5,670 | 62,994 | ||||||
|
| |||||||
| 489,309 | ||||||||
|
| |||||||
Leisure Products – 0.1% | ||||||||
Bandai Namco Holdings, Inc. | 2,600 | 51,815 | ||||||
Mattel, Inc. | 431 | 14,016 | ||||||
|
| |||||||
| 65,831 | ||||||||
|
| |||||||
Media – 1.1% | ||||||||
AMC Networks, Inc. – Class A(f) | 2,468 | 161,753 | ||||||
Comcast Corp. – Class A | 8,407 | 485,336 | ||||||
CTS Eventim AG & Co. KGaA | 3,325 | 116,383 | ||||||
Liberty Global PLC – Series C(f) | 3,314 | 119,171 | ||||||
Naspers Ltd. – Class N | 1,495 | 176,769 | ||||||
| AB TAX-MANAGED WEALTH STRATEGIES • | 53 |
AB Tax-Managed Balanced Wealth Strategy—Portfolio of Investments
| Company | Shares | U.S. $ Value | ||||||
| ||||||||
Thomson Reuters Corp. | 488 | $ | 17,861 | |||||
Time Warner Cable, Inc. – Class A | 333 | 63,556 | ||||||
Twenty-First Century Fox, Inc. – Class A | 491 | 13,267 | ||||||
Vivendi SA | 4,900 | 101,642 | ||||||
Walt Disney Co. (The) | 2,972 | 283,885 | ||||||
|
| |||||||
| 1,539,623 | ||||||||
|
| |||||||
Multiline Retail – 0.4% | ||||||||
B&M European Value Retail SA | 33,025 | 130,957 | ||||||
Dollar General Corp. | 1,700 | 126,225 | ||||||
Dollar Tree, Inc.(f) | 3,570 | 286,492 | ||||||
|
| |||||||
| 543,674 | ||||||||
|
| |||||||
Specialty Retail – 0.9% | ||||||||
Foot Locker, Inc. | 1,266 | 79,125 | ||||||
GameStop Corp. – Class A | 3,400 | 104,788 | ||||||
Home Depot, Inc. (The) | 3,705 | 459,864 | ||||||
Kingfisher PLC | 7,700 | 35,569 | ||||||
L Brands, Inc. | 1,330 | 112,771 | ||||||
L’Occitane International SA | 13,000 | 26,037 | ||||||
O’Reilly Automotive, Inc.(f) | 410 | 106,731 | ||||||
Ross Stores, Inc. | 1,102 | 60,588 | ||||||
Sports Direct International PLC(f) | 11,762 | 65,859 | ||||||
TJX Cos., Inc. (The) | 869 | 64,393 | ||||||
Ulta Salon Cosmetics & Fragrance, Inc.(f) | 1,247 | 205,992 | ||||||
|
| |||||||
| 1,321,717 | ||||||||
|
| |||||||
Textiles, Apparel & Luxury Goods – 0.4% | ||||||||
Cie Financiere Richemont SA | 1,905 | 120,969 | ||||||
HUGO BOSS AG | 1,020 | 58,015 | ||||||
Kering | 180 | 31,319 | ||||||
NIKE, Inc. – Class B | 5,306 | 326,796 | ||||||
Samsonite International SA | 20,200 | 59,195 | ||||||
|
| |||||||
| 596,294 | ||||||||
|
| |||||||
| 6,266,120 | ||||||||
|
| |||||||
Health Care – 3.7% | ||||||||
Biotechnology – 0.8% | ||||||||
Alexion Pharmaceuticals, Inc.(f) | 1,523 | 214,438 | ||||||
Biogen, Inc.(f) | 1,984 | 514,689 | ||||||
Gilead Sciences, Inc. | 3,939 | 343,678 | ||||||
|
| |||||||
| 1,072,805 | ||||||||
|
| |||||||
Health Care Equipment & Supplies – 0.7% | ||||||||
Align Technology, Inc.(f) | 2,686 | 177,357 | ||||||
Edwards Lifesciences Corp.(f) | 1,030 | 89,610 | ||||||
Essilor International SA | 345 | 40,980 | ||||||
Intuitive Surgical, Inc.(f) | 973 | 547,857 | ||||||
Sartorius AG (Preference Shares) | 768 | 197,174 | ||||||
|
| |||||||
| 1,052,978 | ||||||||
|
| |||||||
| 54 | • AB TAX-MANAGED WEALTH STRATEGIES |
AB Tax-Managed Balanced Wealth Strategy—Portfolio of Investments
| Company | Shares | U.S. $ Value | ||||||
| ||||||||
Health Care Providers & Services – 0.8% | ||||||||
Aetna, Inc. | 1,979 | $ | 214,979 | |||||
Express Scripts Holding Co.(f) | 1,100 | 77,418 | ||||||
Premier, Inc. – Class A(f) | 3,039 | 98,828 | ||||||
Quest Diagnostics, Inc. | 1,100 | 73,183 | ||||||
Ramsay Health Care Ltd. | 1,210 | 57,056 | ||||||
UnitedHealth Group, Inc. | 4,935 | 587,759 | ||||||
|
| |||||||
| 1,109,223 | ||||||||
|
| |||||||
Life Sciences Tools & Services – 0.3% | ||||||||
Eurofins Scientific SE | 741 | 263,581 | ||||||
Illumina, Inc.(f) | 739 | 111,027 | ||||||
Mettler-Toledo International, Inc.(f) | 333 | 104,865 | ||||||
|
| |||||||
| 479,473 | ||||||||
|
| |||||||
Pharmaceuticals – 1.1% | ||||||||
Aspen Pharmacare Holdings Ltd.(f) | 4,130 | 72,991 | ||||||
GlaxoSmithKline PLC | 5,210 | 100,970 | ||||||
Johnson & Johnson | 3,010 | 316,682 | ||||||
Merck & Co., Inc. | 3,128 | 157,057 | ||||||
Novo Nordisk A/S – Class B | 3,070 | 158,058 | ||||||
Pfizer, Inc. | 10,492 | 311,298 | ||||||
Roche Holding AG | 750 | 192,311 | ||||||
Shire PLC | 2,800 | 146,075 | ||||||
Sun Pharmaceutical Industries Ltd. | 6,550 | 81,932 | ||||||
|
| |||||||
| 1,537,374 | ||||||||
|
| |||||||
| 5,251,853 | ||||||||
|
| |||||||
Industrials – 2.6% | ||||||||
Aerospace & Defense – 0.4% | ||||||||
Airbus Group SE | 1,330 | 85,834 | ||||||
L-3 Communications Holdings, Inc. | 1,089 | 127,751 | ||||||
Northrop Grumman Corp. | 230 | 44,211 | ||||||
Rockwell Collins, Inc. | 1,160 | 101,581 | ||||||
United Technologies Corp. | 650 | 62,803 | ||||||
Zodiac Aerospace | 4,955 | 82,529 | ||||||
|
| |||||||
| 504,709 | ||||||||
|
| |||||||
Airlines – 0.4% | ||||||||
Air Canada(f) | 6,620 | 35,326 | ||||||
Alaska Air Group, Inc. | 1,095 | 80,920 | ||||||
Delta Air Lines, Inc. | 2,521 | 121,613 | ||||||
International Consolidated Airlines Group SA | 13,540 | 102,941 | ||||||
Japan Airlines Co., Ltd. | 2,300 | 82,298 | ||||||
JetBlue Airways Corp.(f) | 5,580 | 122,760 | ||||||
Qantas Airways Ltd.(f) | 20,232 | 55,575 | ||||||
|
| |||||||
| 601,433 | ||||||||
|
| |||||||
Building Products – 0.0% | ||||||||
AO Smith Corp. | 690 | 48,562 | ||||||
|
| |||||||
| AB TAX-MANAGED WEALTH STRATEGIES • | 55 |
AB Tax-Managed Balanced Wealth Strategy—Portfolio of Investments
| Company | Shares | U.S. $ Value | ||||||
| ||||||||
Commercial Services & Supplies – 0.3% | ||||||||
Babcock International Group PLC | 16,030 | $ | 202,824 | |||||
Regus PLC | 30,642 | 122,938 | ||||||
Republic Services, Inc. – Class A | 308 | 14,076 | ||||||
|
| |||||||
| 339,838 | ||||||||
|
| |||||||
Construction & Engineering – 0.0% | ||||||||
IRB Infrastructure Developers Ltd. | 6,290 | 19,818 | ||||||
Quanta Services, Inc.(f) | 1,399 | 28,386 | ||||||
|
| |||||||
| 48,204 | ||||||||
|
| |||||||
Electrical Equipment – 0.2% | ||||||||
Acuity Brands, Inc. | 554 | 116,024 | ||||||
Eaton Corp. PLC | 2,897 | 164,289 | ||||||
|
| |||||||
| 280,313 | ||||||||
|
| |||||||
Industrial Conglomerates – 0.4% | ||||||||
Danaher Corp. | 1,877 | 167,560 | ||||||
General Electric Co. | 5,659 | 164,903 | ||||||
Rheinmetall AG | 1,080 | 76,706 | ||||||
Roper Technologies, Inc. | 390 | 65,493 | ||||||
|
| |||||||
| 474,662 | ||||||||
|
| |||||||
Machinery – 0.3% | ||||||||
Hoshizaki Electric Co., Ltd. | 2,200 | 170,262 | ||||||
IHI Corp. | 29,000 | 51,635 | ||||||
ITT Corp. | 2,618 | 92,311 | ||||||
JTEKT Corp. | 7,700 | 105,122 | ||||||
|
| |||||||
| 419,330 | ||||||||
|
| |||||||
Marine – 0.0% | ||||||||
AP Moeller – Maersk A/S – Class B | 29 | 38,112 | ||||||
|
| |||||||
Professional Services – 0.4% | ||||||||
Bureau Veritas SA | 7,752 | 154,429 | ||||||
Capita PLC | 16,308 | 226,136 | ||||||
Robert Half International, Inc. | 1,890 | 74,447 | ||||||
Teleperformance | 1,655 | 127,772 | ||||||
|
| |||||||
| 582,784 | ||||||||
|
| |||||||
Road & Rail – 0.1% | ||||||||
Canadian National Railway Co. | 510 | 29,627 | ||||||
CAR, Inc.(f) | 11,000 | 12,549 | ||||||
Central Japan Railway Co. | 700 | 125,242 | ||||||
|
| |||||||
| 167,418 | ||||||||
|
| |||||||
Trading Companies & Distributors – 0.1% | ||||||||
Brenntag AG | 800 | 38,614 | ||||||
Bunzl PLC | 3,317 | 88,774 | ||||||
WESCO International, Inc.(f) | 1,491 | 65,678 | ||||||
|
| |||||||
| 193,066 | ||||||||
|
| |||||||
| 3,698,431 | ||||||||
|
| |||||||
| 56 | • AB TAX-MANAGED WEALTH STRATEGIES |
AB Tax-Managed Balanced Wealth Strategy—Portfolio of Investments
| Company | Shares | U.S. $ Value | ||||||
| ||||||||
Consumer Staples – 2.0% | ||||||||
Beverages – 0.2% | ||||||||
Asahi Group Holdings Ltd. | 900 | $ | 26,448 | |||||
Monster Beverage Corp.(f) | 1,678 | 210,589 | ||||||
|
| |||||||
| 237,037 | ||||||||
|
| |||||||
Food & Staples Retailing – 0.7% | ||||||||
Alimentation Couche-Tard, Inc. – Class B | 910 | 41,175 | ||||||
Costco Wholesale Corp. | 1,065 | 159,782 | ||||||
CP ALL PCL | 64,800 | 78,658 | ||||||
CVS Health Corp. | 4,149 | 403,158 | ||||||
Delhaize Group | 1,570 | 158,768 | ||||||
Lenta Ltd. (GDR)(a)(f) | 11,401 | 64,205 | ||||||
Magnit PJSC (Sponsored GDR)(a) | 750 | 25,125 | ||||||
Olam International Ltd. | 54,836 | 62,222 | ||||||
X5 Retail Group NV (GDR)(a)(f) | 1,593 | 29,710 | ||||||
|
| |||||||
| 1,022,803 | ||||||||
|
| |||||||
Food Products – 0.3% | ||||||||
Archer-Daniels-Midland Co. | 791 | 27,653 | ||||||
Bunge Ltd. | 174 | 8,651 | ||||||
ConAgra Foods, Inc. | 460 | 19,348 | ||||||
First Resources Ltd. | 14,500 | 19,640 | ||||||
Ingredion, Inc. | 705 | 71,360 | ||||||
JBS SA | 13,600 | 38,610 | ||||||
Mondelez International, Inc. – Class A | 2,030 | 82,276 | ||||||
Tyson Foods, Inc. – Class A | 1,490 | 96,477 | ||||||
Universal Robina Corp. | 5,050 | 21,017 | ||||||
WhiteWave Foods Co. (The)(f) | 982 | 38,023 | ||||||
|
| |||||||
| 423,055 | ||||||||
|
| |||||||
Household Products – 0.1% | ||||||||
Kimberly-Clark Corp. | 95 | 12,378 | ||||||
Procter & Gamble Co. (The) | 1,317 | 105,742 | ||||||
|
| |||||||
| 118,120 | ||||||||
|
| |||||||
Personal Products – 0.2% | ||||||||
Estee Lauder Cos., Inc. (The) – Class A | 2,460 | 224,672 | ||||||
Hengan International Group Co., Ltd. | 8,500 | 67,285 | ||||||
Unilever PLC | 460 | 19,653 | ||||||
|
| |||||||
| 311,610 | ||||||||
|
| |||||||
Tobacco – 0.5% | ||||||||
Altria Group, Inc. | 2,301 | 141,672 | ||||||
British American Tobacco PLC | 7,155 | 389,263 | ||||||
Imperial Brands PLC | 960 | 49,551 | ||||||
Philip Morris International, Inc. | 719 | 65,451 | ||||||
|
| |||||||
| 645,937 | ||||||||
|
| |||||||
| 2,758,562 | ||||||||
|
| |||||||
| AB TAX-MANAGED WEALTH STRATEGIES • | 57 |
AB Tax-Managed Balanced Wealth Strategy—Portfolio of Investments
| Company | Shares | U.S. $ Value | ||||||
| ||||||||
Energy – 1.2% | ||||||||
Energy Equipment & Services – 0.2% | ||||||||
Aker Solutions ASA(a) | 5,430 | $ | 16,108 | |||||
Schlumberger Ltd. | 2,778 | 199,238 | ||||||
|
| |||||||
| 215,346 | ||||||||
|
| |||||||
Oil, Gas & Consumable Fuels – 1.0% | ||||||||
California Resources Corp. | 48 | 27 | ||||||
Canadian Natural Resources Ltd. | 1,270 | 26,545 | ||||||
Chevron Corp. | 1,200 | 100,128 | ||||||
EOG Resources, Inc. | 2,366 | 153,175 | ||||||
Exxon Mobil Corp. | 3,954 | 316,913 | ||||||
HollyFrontier Corp. | 3,012 | 101,866 | ||||||
JX Holdings, Inc. | 31,400 | 121,968 | ||||||
LUKOIL PJSC (Sponsored ADR) | 760 | 26,843 | ||||||
Occidental Petroleum Corp. | 507 | 34,892 | ||||||
Phillips 66 | 672 | 53,350 | ||||||
QEP Resources, Inc. | 4,426 | 43,198 | ||||||
Royal Dutch Shell PLC – Class A | 10,598 | 241,783 | ||||||
TOTAL SA | 1,783 | 79,915 | ||||||
Tupras Turkiye Petrol Rafinerileri AS(f) | 2,280 | 58,257 | ||||||
Valero Energy Corp. | 1,929 | 115,894 | ||||||
|
| |||||||
| 1,474,754 | ||||||||
|
| |||||||
| 1,690,100 | ||||||||
|
| |||||||
Utilities – 0.9% | ||||||||
Electric Utilities – 0.6% | ||||||||
American Electric Power Co., Inc. | 2,088 | 128,934 | ||||||
Edison International | 1,827 | 124,528 | ||||||
EDP – Energias de Portugal SA | 31,440 | 97,370 | ||||||
Enel SpA | 12,870 | 51,434 | ||||||
Eversource Energy | 404 | 21,937 | ||||||
Exelon Corp. | 2,734 | 86,094 | ||||||
FirstEnergy Corp. | 573 | 19,178 | ||||||
Korea Electric Power Corp. | 1,210 | 57,404 | ||||||
NextEra Energy, Inc. | 274 | 30,913 | ||||||
PPL Corp. | 4,479 | 156,720 | ||||||
Westar Energy, Inc. | 2,000 | 86,920 | ||||||
|
| |||||||
| 861,432 | ||||||||
|
| |||||||
Independent Power and Renewable Electricity Producers – 0.1% | ||||||||
Huadian Power International Corp., Ltd. – Class H | 98,000 | 53,050 | ||||||
Huaneng Power International, Inc. – Class H | 74,000 | 58,029 | ||||||
TerraForm Global, Inc. – Class A | 10,442 | 33,101 | ||||||
|
| |||||||
| 144,180 | ||||||||
|
| |||||||
| 58 | • AB TAX-MANAGED WEALTH STRATEGIES |
AB Tax-Managed Balanced Wealth Strategy—Portfolio of Investments
| Company | Shares | U.S. $ Value | ||||||
| ||||||||
Multi-Utilities – 0.2% | ||||||||
DTE Energy Co. | 228 | $ | 19,179 | |||||
NiSource, Inc. | 5,171 | 111,073 | ||||||
PG&E Corp. | 1,620 | 91,903 | ||||||
Public Service Enterprise Group, Inc. | 700 | 29,862 | ||||||
|
| |||||||
| 252,017 | ||||||||
|
| |||||||
Water Utilities – 0.0% | ||||||||
Cia de Saneamento Basico do Estado de Sao Paulo | 10,400 | 58,558 | ||||||
|
| |||||||
| 1,316,187 | ||||||||
|
| |||||||
Materials – 0.8% | ||||||||
Chemicals – 0.7% | ||||||||
Agrium, Inc. (Toronto) | 500 | 43,056 | ||||||
Arkema SA | 1,230 | 75,095 | ||||||
CF Industries Holdings, Inc. | 5,384 | 196,301 | ||||||
Covestro AG(a)(f) | 1,239 | 39,488 | ||||||
Dow Chemical Co. (The) | 1,771 | 86,088 | ||||||
Essentra PLC | 22,336 | 258,071 | ||||||
JSR Corp. | 3,700 | 51,868 | ||||||
Koninklijke DSM NV | 1,310 | 64,443 | ||||||
LG Chem Ltd. | 140 | 34,032 | ||||||
LyondellBasell Industries NV – Class A | 2,247 | 180,232 | ||||||
|
| |||||||
| 1,028,674 | ||||||||
|
| |||||||
Metals & Mining – 0.1% | ||||||||
Goldcorp, Inc. | 2,530 | 36,351 | ||||||
Novolipetsk Steel AO (GDR)(a) | 4,400 | 42,925 | ||||||
|
| |||||||
| 79,276 | ||||||||
|
| |||||||
Paper & Forest Products – 0.0% | ||||||||
Mondi PLC | 3,011 | 53,720 | ||||||
|
| |||||||
| 1,161,670 | ||||||||
|
| |||||||
Telecommunication Services – 0.7% | ||||||||
Diversified Telecommunication | ||||||||
AT&T, Inc. | 784 | 28,969 | ||||||
BT Group PLC | 27,900 | 187,883 | ||||||
Nippon Telegraph & Telephone Corp. | 4,800 | 203,267 | ||||||
Telefonica Brasil SA (ADR) | 238 | 2,280 | ||||||
Telefonica Brasil SA (Preference Shares) | 6,300 | 59,932 | ||||||
Verizon Communications, Inc. | 2,982 | 151,277 | ||||||
|
| |||||||
| 633,608 | ||||||||
|
| |||||||
Wireless Telecommunication | ||||||||
Rogers Communications, Inc. – Class B | 780 | 28,871 | ||||||
SoftBank Group Corp. | 900 | 44,227 | ||||||
Tower Bersama Infrastructure Tbk PT(f) | 62,000 | 26,740 | ||||||
| AB TAX-MANAGED WEALTH STRATEGIES • | 59 |
AB Tax-Managed Balanced Wealth Strategy—Portfolio of Investments
| Company | Shares | U.S. $ Value | ||||||
| ||||||||
Turkcell Iletisim Hizmetleri AS | 13,480 | $ | 50,247 | |||||
Vodafone Group PLC | 41,790 | 126,745 | ||||||
|
| |||||||
| 276,830 | ||||||||
|
| |||||||
| 910,438 | ||||||||
|
| |||||||
Total Common Stocks | 37,749,629 | |||||||
|
| |||||||
INVESTMENT COMPANIES – 19.2% | ||||||||
Funds and Investment Trusts – 19.2% | ||||||||
AB Multi-Manager Alternative Strategies Fund – Class Z(f)(h) | 837,174 | 8,061,988 | ||||||
AB Pooling Portfolio – AB Multi-Asset Real Return Portfolio(h) | 742,782 | 3,988,740 | ||||||
AB Pooling Portfolio – AB Volatility Management Portfolio(h) | 1,487,065 | 14,811,166 | ||||||
|
| |||||||
Total Investment Companies | 26,861,894 | |||||||
|
| |||||||
SHORT-TERM INVESTMENTS – 0.5% | ||||||||
Investment Companies – 0.5% | ||||||||
AB Fixed Income Shares, Inc. – Government STIF Portfolio, 0.40%(h)(i) | 721,587 | 721,587 | ||||||
|
| |||||||
Total Investments – 100.2% | 140,467,822 | |||||||
Other assets less liabilities – (0.2)% | (244,902 | ) | ||||||
|
| |||||||
Net Assets – 100.0% | $ | 140,222,920 | ||||||
|
| |||||||
FUTURES (see Note D)
| Type | Number of Contracts | Expiration Month | Original Value | Value at February 29, 2016 | Unrealized Appreciation/ (Depreciation) | |||||||||||||||
Purchased Contracts | ||||||||||||||||||||
EURO STOXX 50 Index Futures | 1 | March 2016 | $ | 33,986 | $ | 31,918 | $ | (2,068 | ) | |||||||||||
FORWARD CURRENCY EXCHANGE CONTRACTS (see Note D)
| Counterparty | Contracts to (000) | In Exchange (000) | Settlement Date | Unrealized Appreciation/ (Depreciation) | ||||||||||||||||||||
BNP Paribas SA | KRW | 138,423 | USD | 114 | 5/18/16 | $ | 2,101 | |||||||||||||||||
Citibank | RUB | 1,909 | USD | 25 | 4/07/16 | (590 | ) | |||||||||||||||||
Citibank | EUR | 387 | USD | 437 | 5/18/16 | 14,913 | ||||||||||||||||||
Deutsche Bank AG | BRL | 382 | USD | 94 | 3/02/16 | (1,263 | ) | |||||||||||||||||
| 60 | • AB TAX-MANAGED WEALTH STRATEGIES |
AB Tax-Managed Balanced Wealth Strategy—Portfolio of Investments
| Counterparty | Contracts to (000) | In Exchange (000) | Settlement Date | Unrealized Appreciation/ (Depreciation) | ||||||||||||||||||||
Deutsche Bank AG | USD | 96 | BRL | 382 | 3/02/16 | $ | (859 | ) | ||||||||||||||||
HSBC Bank USA | BRL | 493 | USD | 124 | 3/02/16 | 1,109 | ||||||||||||||||||
HSBC Bank USA | USD | 125 | BRL | 493 | 3/02/16 | (2,022 | ) | |||||||||||||||||
HSBC Bank USA | BRL | 493 | USD | 124 | 4/04/16 | 1,954 | ||||||||||||||||||
Morgan Stanley & Co., Inc. | BRL | 111 | USD | 28 | 3/02/16 | 398 | ||||||||||||||||||
Morgan Stanley & Co., Inc. | USD | 28 | BRL | 111 | 3/02/16 | (250 | ) | |||||||||||||||||
Standard Chartered Bank | KRW | 78,993 | USD | 65 | 5/18/16 | 1,415 | ||||||||||||||||||
Standard Chartered Bank | USD | 624 | JPY | 71,506 | 5/18/16 | 11,346 | ||||||||||||||||||
State Street Bank & Trust Co. | CAD | 301 | USD | 211 | 5/18/16 | (11,690 | ) | |||||||||||||||||
State Street Bank & Trust Co. | EUR | 331 | USD | 372 | 5/18/16 | 11,498 | ||||||||||||||||||
State Street Bank & Trust Co. | GBP | 585 | USD | 838 | 5/18/16 | 23,743 | ||||||||||||||||||
State Street Bank & Trust Co. | HKD | 2,444 | USD | 313 | 5/18/16 | (894 | ) | |||||||||||||||||
State Street Bank & Trust Co. | JPY | 29,608 | USD | 249 | 5/18/16 | (13,871 | ) | |||||||||||||||||
State Street Bank & Trust Co. | JPY | 4,456 | USD | 40 | 5/18/16 | 311 | ||||||||||||||||||
State Street Bank & Trust Co. | USD | 149 | AUD | 212 | 5/18/16 | 1,682 | ||||||||||||||||||
State Street Bank & Trust Co. | USD | 32 | AUD | 45 | 5/18/16 | (233 | ) | |||||||||||||||||
State Street Bank & Trust Co. | USD | 62 | CAD | 88 | 5/18/16 | 3,269 | ||||||||||||||||||
State Street Bank & Trust Co. | USD | 334 | CHF | 323 | 5/18/16 | (8,868 | ) | |||||||||||||||||
State Street Bank & Trust Co. | USD | 52 | CHF | 52 | 5/18/16 | 589 | ||||||||||||||||||
State Street Bank & Trust Co. | USD | 175 | EUR | 156 | 5/18/16 | (4,566 | ) | |||||||||||||||||
State Street Bank & Trust Co. | USD | 52 | JPY | 5,883 | 5/18/16 | (55 | ) | |||||||||||||||||
State Street Bank & Trust Co. | USD | 102 | JPY | 11,919 | 5/18/16 | 4,321 | ||||||||||||||||||
State Street Bank & Trust Co. | USD | 95 | NOK | 810 | 5/18/16 | (1,470 | ) | |||||||||||||||||
State Street Bank & Trust Co. | USD | 66 | NOK | 576 | 5/18/16 | 374 | ||||||||||||||||||
State Street Bank & Trust Co. | USD | 314 | SEK | 2,631 | 5/18/16 | (6,087 | ) | |||||||||||||||||
|
| |||||||||||||||||||||||
| $ | 26,305 | |||||||||||||||||||||||
|
| |||||||||||||||||||||||
INFLATION (CPI) SWAPS (see Note D)
| Rate Type | ||||||||||||||||
| Swap Counterparty | Notional Amount (000) | Termination Date | Payments by the | Payments received by the Fund | Unrealized Appreciation/ (Depreciation) | |||||||||||
Bank of America, NA | $ | 200 | 9/02/20 | 1.548% | CPI# | $ | (2,075 | ) | ||||||||
Bank of America, NA | 900 | 3/04/24 | 2.493% | CPI# | (103,636 | ) | ||||||||||
Bank of America, NA | 600 | 7/09/24 | 2.613% | CPI# | (78,219 | ) | ||||||||||
Barclays Bank PLC | 2,000 | 1/31/19 | 2.385% | CPI# | (171,045 | ) | ||||||||||
Barclays Bank PLC | 200 | 5/05/25 | 2.125% | CPI# | (10,823 | ) | ||||||||||
Barclays Bank PLC | 1,800 | 1/31/27 | 2.628% | CPI# | (324,804 | ) | ||||||||||
Citibank, NA | 2,000 | 5/05/18 | 1.843% | CPI# | (33,407 | ) | ||||||||||
Citibank, NA | 450 | 8/26/20 | 2.298% | CPI# | (34,589 | ) | ||||||||||
Citibank, NA | 1,580 | 12/14/20 | 1.548% | CPI# | (7,908 | ) | ||||||||||
Citibank, NA | 300 | 5/24/23 | 2.533% | CPI# | (39,262 | ) | ||||||||||
Deutsche Bank AG | 700 | 7/15/20 | 1.265% | CPI# | 10,369 | |||||||||||
Goldman Sachs Bank USA | 1,400 | 1/31/22 | 2.515% | CPI# | (179,000 | ) | ||||||||||
Morgan Stanley Capital Services LLC | 250 | 4/16/23 | 2.690% | CPI# | (37,588 | ) | ||||||||||
|
| |||||||||||||||
| $ | (1,011,987 | ) | ||||||||||||||
|
| |||||||||||||||
| # | Variable interest rate based on the rate of inflation as determined by the Consumer Price Index (CPI). |
| AB TAX-MANAGED WEALTH STRATEGIES • | 61 |
AB Tax-Managed Balanced Wealth Strategy—Portfolio of Investments
INTEREST RATE SWAPS (see Note D)
| Rate Type | ||||||||||||||||
| Swap Counterparty | Notional Amount (000) | Termination Date | Payments by the | Payments received by the Fund | Unrealized Appreciation/ (Depreciation) | |||||||||||
Citibank, NA | $ | 840 | 3/01/23 | 0.904% | SIFMA* | $ | (750 | ) | ||||||||
JPMorgan Chase Bank, NA | 700 | 10/26/22 | 1.123% | SIFMA* | (12,722 | ) | ||||||||||
JPMorgan Chase Bank, NA | 450 | 2/22/23 | 0.902% | SIFMA* | (478 | ) | ||||||||||
JPMorgan Chase Bank, NA | 830 | 11/06/23 | 1.321% | SIFMA* | (23,566 | ) | ||||||||||
|
| |||||||||||||||
| $ | (37,516 | ) | ||||||||||||||
|
| |||||||||||||||
| * | Variable interest rate based on the Securities Industry & Financial Markets Association (SIFMA) Municipal Swap Index. |
| (a) | Security is exempt from registration under Rule 144A of the Securities Act of 1933. These securities are considered liquid and may be resold in transactions exempt from registration, normally to qualified institutional buyers. At February 29, 2016, the aggregate market value of these securities amounted to $739,018 or 0.5% of net assets. |
| (b) | Position, or a portion thereof, has been segregated to collateralize OTC derivatives outstanding. |
| (c) | Illiquid security. |
| (d) | Security is in default and is non-income producing. |
| (e) | Defaulted matured security. |
| (f) | Non-income producing security. |
| (g) | An auction rate security whose interest rate resets at each auction date. Auctions are typically held every week or month. The rate shown is as of February 29, 2016 and the aggregate market value of these securities amounted to $871,288 or 0.62% of net assets. |
| (h) | To obtain a copy of the fund’s financial statements, please go to the Securities and Exchange Commission’s website at www.sec.gov, or call AB at (800) 227-4618. |
| (i) | Investment in affiliated money market mutual fund. The rate shown represents the 7-day yield as of period end. |
As of February 29, 2016, the Strategy’s percentages of investments in municipal bonds that are insured and in insured municipal bonds that have been pre-refunded or escrowed to maturity are 6.8% and 0.0%, respectively.
Currency Abbreviations:
| AUD | – Australian Dollar |
| BRL | – Brazilian Real |
| CAD | – Canadian Dollar |
| CHF | – Swiss Franc |
| EUR | – Euro |
| GBP | – Great British Pound |
| HKD | – Hong Kong Dollar |
| JPY | – Japanese Yen |
| KRW | – South Korean Won |
| NOK | – Norwegian Krone |
| RUB | – Russian Ruble |
| SEK | – Swedish Krona |
| USD | – United States Dollar |
| 62 | • AB TAX-MANAGED WEALTH STRATEGIES |
AB Tax-Managed Balanced Wealth Strategy—Portfolio of Investments
Glossary:
| ADR | – American Depositary Receipt |
| AGM | – Assured Guaranty Municipal |
| AMBAC | – Ambac Assurance Corporation |
| COP | – Certificate of Participation |
| ETM | – Escrowed to Maturity |
| GDR | – Global Depositary Receipt |
| NATL | – National Interstate Corporation |
| OSF | – Order of St. Francis |
| PJSC | – Public Joint Stock Company |
| REG | – Registered Shares |
| XLCA | – XL Capital Assurance Inc. |
See notes to financial statements.
| AB TAX-MANAGED WEALTH STRATEGIES • | 63 |
AB Tax-Managed Balanced Wealth Strategy—Portfolio of Investments
AB TAX-MANAGED CONSERVATIVE WEALTH STRATEGY
PORTFOLIO OF INVESTMENTS
February 29, 2016 (unaudited)
| Principal Amount (000) | U.S. $ Value | |||||||
| ||||||||
MUNICIPAL OBLIGATIONS – 67.4% | ||||||||
Long-Term Municipal Bonds – 67.4% | ||||||||
Alabama – 1.4% | ||||||||
Alabama Public School & College Authority | $ | 590 | $ | 615,942 | ||||
|
| |||||||
Alaska – 1.2% | ||||||||
Municipality of Anchorage AK | 430 | 536,786 | ||||||
|
| |||||||
Arizona – 1.8% | ||||||||
Arizona Department of Transportation State | 675 | 805,828 | ||||||
|
| |||||||
Arkansas – 0.3% | ||||||||
State of Arkansas | 140 | 143,779 | ||||||
|
| |||||||
California – 1.1% | ||||||||
State of California | 270 | 318,263 | ||||||
State of California Department of Water | 130 | 159,424 | ||||||
|
| |||||||
| 477,687 | ||||||||
|
| |||||||
Colorado – 2.2% | ||||||||
City & County of Denver CO Airport System | 500 | 554,900 | ||||||
Denver Urban Renewal Authority | 415 | 444,480 | ||||||
|
| |||||||
| 999,380 | ||||||||
|
| |||||||
Connecticut – 0.2% | ||||||||
State of Connecticut | 70 | 82,333 | ||||||
|
| |||||||
| 64 | • AB TAX-MANAGED WEALTH STRATEGIES |
AB Tax-Managed Conservative Wealth Strategy—Portfolio of Investments
| Principal Amount (000) | U.S. $ Value | |||||||
| ||||||||
District of Columbia – 0.6% | ||||||||
Metropolitan Washington Airports Authority | $ | 275 | $ | 282,147 | ||||
|
| |||||||
Florida – 5.9% | ||||||||
Central Florida Expressway Authority | 155 | 187,317 | ||||||
Citizens Property Insurance Corp. | 110 | 131,777 | ||||||
City of Jacksonville FL | 450 | 513,445 | ||||||
County of Broward FL Airport System Revenue | 205 | 245,941 | ||||||
County of Miami-Dade FL Solid Waste System Revenue | 205 | 234,215 | ||||||
Florida Department of Environmental Protection | 425 | 451,503 | ||||||
Florida State Hurricane Catastrophe Fund | 300 | 304,524 | ||||||
State of Florida | 550 | 583,011 | ||||||
|
| |||||||
| 2,651,733 | ||||||||
|
| |||||||
Georgia – 3.4% | ||||||||
Fulton County Development Authority | 305 | 339,175 | ||||||
Main Street Natural Gas, Inc. | 385 | 400,466 | ||||||
Municipal Electric Authority of Georgia | 190 | 197,477 | ||||||
| AB TAX-MANAGED WEALTH STRATEGIES • | 65 |
AB Tax-Managed Conservative Wealth Strategy—Portfolio of Investments
| Principal Amount (000) | U.S. $ Value | |||||||
| ||||||||
Series 2012B | $ | 555 | $ | 599,000 | ||||
|
| |||||||
| 1,536,118 | ||||||||
|
| |||||||
Hawaii – 1.3% | ||||||||
State of Hawaii | 460 | 578,496 | ||||||
|
| |||||||
Illinois – 0.9% | ||||||||
Metropolitan Pier & Exposition Authority | 40 | 43,474 | ||||||
State of Illinois | 160 | 179,446 | ||||||
Series 2014 | 160 | 177,861 | ||||||
|
| |||||||
| 400,781 | ||||||||
|
| |||||||
Indiana – 1.3% | ||||||||
County of Jasper IN | 75 | 77,281 | ||||||
Indiana Bond Bank | 150 | 171,180 | ||||||
Indiana Finance Authority | 275 | 324,258 | ||||||
|
| |||||||
| 572,719 | ||||||||
|
| |||||||
Iowa – 0.7% | ||||||||
Iowa Finance Authority | 280 | 308,806 | ||||||
|
| |||||||
Kansas – 1.6% | ||||||||
Sedgwick County Unified School District No 266 Maize | 435 | 482,202 | ||||||
State of Kansas Department of Transportation | 170 | 209,885 | ||||||
|
| |||||||
| 692,087 | ||||||||
|
| |||||||
| 66 | • AB TAX-MANAGED WEALTH STRATEGIES |
AB Tax-Managed Conservative Wealth Strategy—Portfolio of Investments
| Principal Amount (000) | U.S. $ Value | |||||||
| ||||||||
Kentucky – 2.0% | ||||||||
Kentucky Asset Liability Commission | $ | 440 | $ | 533,082 | ||||
Kentucky Turnpike Authority | 335 | 366,808 | ||||||
|
| |||||||
| 899,890 | ||||||||
|
| |||||||
Maryland – 0.3% | ||||||||
University System of Maryland | 135 | 147,276 | ||||||
|
| |||||||
Massachusetts – 0.7% | ||||||||
Commonwealth of Massachusetts | 300 | 304,086 | ||||||
|
| |||||||
Michigan – 3.2% | ||||||||
City of Detroit MI Sewage Disposal System Revenue | 410 | 374,437 | ||||||
Michigan Finance Authority | 915 | 1,040,620 | ||||||
|
| |||||||
| 1,415,057 | ||||||||
|
| |||||||
Minnesota – 0.7% | ||||||||
Elk River Independent School District No 728 | 300 | 324,804 | ||||||
|
| |||||||
Missouri – 2.0% | ||||||||
City of Springfield MO Public Utility Revenue | 235 | 282,604 | ||||||
City of St Louis MO Airport Revenue | 375 | 381,191 | ||||||
Missouri Highway & Transportation Commission | 230 | 242,133 | ||||||
|
| |||||||
| 905,928 | ||||||||
|
| |||||||
| AB TAX-MANAGED WEALTH STRATEGIES • | 67 |
AB Tax-Managed Conservative Wealth Strategy—Portfolio of Investments
| Principal Amount (000) | U.S. $ Value | |||||||
| ||||||||
Nevada – 1.8% | ||||||||
State of Nevada | $ | 685 | $ | 708,660 | ||||
State of Nevada | 90 | 111,144 | ||||||
|
| |||||||
| 819,804 | ||||||||
|
| |||||||
New Jersey – 2.0% | ||||||||
New Jersey Economic Development Authority | 250 | 260,208 | ||||||
Series 2015X | 285 | 309,473 | ||||||
New Jersey Economic Development Authority | 330 | 333,224 | ||||||
|
| |||||||
| 902,905 | ||||||||
|
| |||||||
New Mexico – 1.3% | ||||||||
State of New Mexico Severance Tax Permanent Fund | 540 | 593,779 | ||||||
|
| |||||||
New York – 8.2% | ||||||||
City of New York NY | 160 | 170,650 | ||||||
Metropolitan Transportation Authority | 475 | 575,415 | ||||||
New York State Dormitory Authority | 150 | 152,358 | ||||||
New York State Dormitory Authority | 1,000 | 1,097,640 | ||||||
New York State Dormitory Authority | 385 | 403,318 | ||||||
| 68 | • AB TAX-MANAGED WEALTH STRATEGIES |
AB Tax-Managed Conservative Wealth Strategy—Portfolio of Investments
| Principal Amount (000) | U.S. $ Value | |||||||
| ||||||||
Series 2013A | $ | 355 | $ | 410,906 | ||||
Series 2014A | 190 | 228,606 | ||||||
New York State Thruway Authority | 270 | 293,684 | ||||||
New York State Thruway Authority | 165 | 186,034 | ||||||
Port Authority of New York & New Jersey | 120 | 142,392 | ||||||
|
| |||||||
| 3,661,003 | ||||||||
|
| |||||||
Ohio – 0.8% | ||||||||
County of Cuyahoga OH | 285 | 341,131 | ||||||
|
| |||||||
Pennsylvania – 3.6% | ||||||||
Pennsylvania Economic Development Financing Authority | 220 | 233,083 | ||||||
Philadelphia Gas Works Co. | 420 | 448,279 | ||||||
Philadelphia Parking Authority (The) | 800 | 930,888 | ||||||
|
| |||||||
| 1,612,250 | ||||||||
|
| |||||||
Rhode Island – 1.5% | ||||||||
Rhode Island Commerce Corp. | 600 | 657,846 | ||||||
|
| |||||||
Texas – 7.7% | ||||||||
City of Houston TX Combined Utility System Revenue | 160 | 192,243 | ||||||
| AB TAX-MANAGED WEALTH STRATEGIES • | 69 |
AB Tax-Managed Conservative Wealth Strategy—Portfolio of Investments
| Principal Amount (000) | U.S. $ Value | |||||||
| ||||||||
City of San Antonio TX Util Drainage System Revenue | $ | 135 | $ | 160,730 | ||||
City of San Antonio TX Water System Revenue | 680 | 687,446 | ||||||
County of Harris TX | 290 | 360,058 | ||||||
Northwest Independent School District | 200 | 213,284 | ||||||
SA Energy Acquisition Public Facility Corp. | 460 | 551,209 | ||||||
Spring Branch Independent School District | 100 | 126,424 | ||||||
Spring Independent School District | 600 | 694,836 | ||||||
Texas Public Finance Authority | 420 | 447,506 | ||||||
|
| |||||||
| 3,433,736 | ||||||||
|
| |||||||
Virginia – 1.4% | ||||||||
County of Fairfax VA | 580 | 608,727 | ||||||
|
| |||||||
Washington – 5.0% | ||||||||
Energy Northwest | 255 | 282,053 | ||||||
Series 2012A | 620 | 704,896 | ||||||
State of Washington | 650 | 689,013 | ||||||
University of Washington | 500 | 558,915 | ||||||
|
| |||||||
| 2,234,877 | ||||||||
|
| |||||||
| 70 | • AB TAX-MANAGED WEALTH STRATEGIES |
AB Tax-Managed Conservative Wealth Strategy—Portfolio of Investments
| Principal Amount (000) | U.S. $ Value | |||||||
| ||||||||
Wisconsin – 1.3% | ||||||||
State of Wisconsin | $ | 575 | $ | 579,675 | ||||
|
| |||||||
Total Municipal Obligations | 30,127,396 | |||||||
|
| |||||||
| Shares | ||||||||
COMMON STOCKS – 17.8% | ||||||||
Information Technology – 3.7% | ||||||||
Communications Equipment – 0.2% | ||||||||
Arista Networks, Inc.(c) | 397 | 27,210 | ||||||
Cisco Systems, Inc. | 1,283 | 33,589 | ||||||
Palo Alto Networks, Inc.(c) | 181 | 26,207 | ||||||
|
| |||||||
| 87,006 | ||||||||
|
| |||||||
Electronic Equipment, Instruments & Components – 0.2% | ||||||||
Amphenol Corp. – Class A | 740 | 39,272 | ||||||
China Railway Signal & Communication Corp., Ltd. – Class H(c)(d) | 22,680 | 11,954 | ||||||
Keysight Technologies, Inc.(c) | 1,052 | 27,447 | ||||||
PAX Global Technology Ltd. | 3,000 | 3,156 | ||||||
|
| |||||||
| 81,829 | ||||||||
|
| |||||||
Internet Software & Services – 0.9% | ||||||||
Alphabet, Inc. – Class A(c) | 41 | 29,406 | ||||||
Alphabet, Inc. – Class C(c) | 188 | 131,181 | ||||||
Baidu, Inc. (Sponsored ADR)(c) | 180 | 31,216 | ||||||
Facebook, Inc. – Class A(c) | 1,265 | 135,254 | ||||||
Tencent Holdings Ltd. | 2,500 | 45,776 | ||||||
Twitter, Inc.(c) | 760 | 13,771 | ||||||
|
| |||||||
| 386,604 | ||||||||
|
| |||||||
IT Services – 0.5% | ||||||||
Cognizant Technology Solutions Corp. – Class A(c) | 664 | 37,835 | ||||||
Tata Consultancy Services Ltd. | 880 | 27,922 | ||||||
Vantiv, Inc. – Class A(c) | 416 | 21,649 | ||||||
Visa, Inc. – Class A | 1,279 | 92,587 | ||||||
Wirecard AG | 528 | 20,830 | ||||||
Worldpay Group PLC(c)(d) | 4,018 | 16,044 | ||||||
Xerox Corp. | 2,141 | 20,575 | ||||||
|
| |||||||
| 237,442 | ||||||||
|
| |||||||
Semiconductors & Semiconductor Equipment – 0.7% | ||||||||
Advanced Semiconductor Engineering, Inc. | 15,000 | 16,972 | ||||||
| AB TAX-MANAGED WEALTH STRATEGIES • | 71 |
AB Tax-Managed Conservative Wealth Strategy—Portfolio of Investments
| Company | Shares | U.S. $ Value | ||||||
| ||||||||
Applied Materials, Inc. | 2,260 | $ | 42,646 | |||||
ARM Holdings PLC | 930 | 12,780 | ||||||
ASML Holding NV | 240 | 21,863 | ||||||
Infineon Technologies AG | 1,350 | 16,386 | ||||||
Intel Corp. | 1,158 | 34,265 | ||||||
Novatek Microelectronics Corp. | 4,000 | 16,446 | ||||||
NVIDIA Corp. | 1,659 | 52,026 | ||||||
SCREEN Holdings Co., Ltd. | 3,000 | 22,278 | ||||||
Sumco Corp. | 2,200 | 13,976 | ||||||
Taiwan Semiconductor Manufacturing Co., Ltd. | 4,000 | 17,896 | ||||||
Tokyo Electron Ltd. | 200 | 12,056 | ||||||
Xilinx, Inc. | 752 | 35,510 | ||||||
|
| |||||||
| 315,100 | ||||||||
|
| |||||||
Software – 0.8% | ||||||||
Adobe Systems, Inc.(c) | 244 | 20,777 | ||||||
ANSYS, Inc.(c) | 251 | 20,838 | ||||||
Aspen Technology, Inc.(c) | 667 | 21,991 | ||||||
Constellation Software, Inc./Canada | 149 | 62,168 | ||||||
Dassault Systemes | 479 | 36,283 | ||||||
Microsoft Corp. | 1,260 | 64,109 | ||||||
Mobileye NV(c) | 578 | 18,762 | ||||||
Nintendo Co., Ltd. | 100 | 13,997 | ||||||
Oracle Corp. | 1,021 | 37,552 | ||||||
ServiceNow, Inc.(c) | 418 | 22,986 | ||||||
Tableau Software, Inc. – Class A(c) | 218 | 9,952 | ||||||
|
| |||||||
| 329,415 | ||||||||
|
| |||||||
Technology Hardware, Storage & Peripherals – 0.4% | ||||||||
Apple, Inc. | 1,130 | 109,260 | ||||||
Hewlett Packard Enterprise Co. | 1,675 | 22,227 | ||||||
HP, Inc. | 2,100 | 22,449 | ||||||
Samsung Electronics Co., Ltd. | 42 | 40,039 | ||||||
|
| |||||||
| 193,975 | ||||||||
|
| |||||||
| 1,631,371 | ||||||||
|
| |||||||
Financials – 3.2% | ||||||||
Banks – 1.2% | ||||||||
Axis Bank Ltd. | 1,700 | 9,370 | ||||||
Banco Macro SA (ADR)(c) | 200 | 13,440 | ||||||
Bank Hapoalim BM | 1,200 | 5,862 | ||||||
Bank of America Corp. | 5,750 | 71,990 | ||||||
Bank of Baroda | 3,880 | 7,510 | ||||||
Bank of Montreal | 160 | 8,828 | ||||||
Bank of Queensland Ltd. | 3,032 | 22,775 | ||||||
Citigroup, Inc. | 296 | 11,500 | ||||||
Citizens Financial Group, Inc. | 887 | 17,057 | ||||||
CYBG PLC(c) | 4,400 | 11,575 | ||||||
| 72 | • AB TAX-MANAGED WEALTH STRATEGIES |
AB Tax-Managed Conservative Wealth Strategy—Portfolio of Investments
| Company | Shares | U.S. $ Value | ||||||
| ||||||||
Danske Bank A/S | 1,160 | $ | 31,659 | |||||
Fifth Third Bancorp | 210 | 3,205 | ||||||
HDFC Bank Ltd. | 1,053 | 17,174 | ||||||
ING Groep NV | 2,740 | 32,664 | ||||||
Intesa Sanpaolo SpA | 4,230 | 10,684 | ||||||
JPMorgan Chase & Co. | 991 | 55,793 | ||||||
KB Financial Group, Inc. | 420 | 10,056 | ||||||
Mitsubishi UFJ Financial Group, Inc. | 10,300 | 44,448 | ||||||
OTP Bank PLC | 380 | 7,905 | ||||||
PNC Financial Services Group, Inc. (The) | 275 | 22,360 | ||||||
Shinhan Financial Group Co., Ltd. | 240 | 7,399 | ||||||
SunTrust Banks, Inc. | 131 | 4,347 | ||||||
Toronto-Dominion Bank (The) | 380 | 14,725 | ||||||
UniCredit SpA | 2,730 | 10,141 | ||||||
US Bancorp | 289 | 11,132 | ||||||
Wells Fargo & Co. | 1,664 | 78,075 | ||||||
|
| |||||||
| 541,674 | ||||||||
|
| |||||||
Capital Markets – 0.4% | ||||||||
Amundi SA(c)(d) | 197 | 8,208 | ||||||
Azimut Holding SpA | 500 | 9,594 | ||||||
Bank of New York Mellon Corp. (The) | 450 | 15,925 | ||||||
BlackRock, Inc. – Class A | 59 | 18,406 | ||||||
Credit Suisse Group AG (REG)(c) | 1,020 | 13,652 | ||||||
Goldman Sachs Group, Inc. (The) | 127 | 18,990 | ||||||
Morgan Stanley | 385 | 9,510 | ||||||
Partners Group Holding AG | 80 | 28,957 | ||||||
UBS Group AG | 3,003 | 45,877 | ||||||
|
| |||||||
| 169,119 | ||||||||
|
| |||||||
Consumer Finance – 0.3% | ||||||||
Capital One Financial Corp. | 707 | 46,471 | ||||||
Discover Financial Services | 509 | 23,628 | ||||||
OneMain Holdings, Inc.(c) | 851 | 19,207 | ||||||
Shriram Transport Finance Co., Ltd. | 630 | 7,372 | ||||||
Synchrony Financial(c) | 1,117 | 30,103 | ||||||
|
| |||||||
| 126,781 | ||||||||
|
| |||||||
Diversified Financial Services – 0.1% | ||||||||
Berkshire Hathaway, Inc. – Class B(c) | 161 | 21,601 | ||||||
BM&FBovespa SA – Bolsa de Valores Mercadorias e Futuros | 3,000 | 8,681 | ||||||
Challenger Ltd./Australia | 2,760 | 14,764 | ||||||
GRENKELEASING AG | 70 | 13,882 | ||||||
|
| |||||||
| 58,928 | ||||||||
|
| |||||||
Insurance – 0.9% | ||||||||
Admiral Group PLC | 1,412 | 33,906 | ||||||
Aflac, Inc. | 112 | 6,666 | ||||||
AIA Group Ltd. | 11,800 | 60,015 | ||||||
| AB TAX-MANAGED WEALTH STRATEGIES • | 73 |
AB Tax-Managed Conservative Wealth Strategy—Portfolio of Investments
| Company | Shares | U.S. $ Value | ||||||
| ||||||||
Allstate Corp. (The) | 654 | $ | 41,503 | |||||
American Financial Group, Inc./OH | 198 | 13,282 | ||||||
American International Group, Inc. | 537 | 26,957 | ||||||
Aviva PLC | 1,650 | 10,012 | ||||||
Chubb Ltd. | 40 | 4,621 | ||||||
Dongbu Insurance Co., Ltd. | 170 | 9,273 | ||||||
First American Financial Corp. | 305 | 11,294 | ||||||
FNF Group | 606 | 19,986 | ||||||
Hanover Insurance Group, Inc. (The) | 185 | 15,346 | ||||||
Hartford Financial Services Group, Inc. (The) | 109 | 4,591 | ||||||
Muenchener Rueckversicherungs-Gesellschaft AG in Muenchen (REG) | 90 | 17,667 | ||||||
NN Group NV | 577 | 17,773 | ||||||
Ping An Insurance Group Co. of China Ltd. – Class H | 1,500 | 6,367 | ||||||
Progressive Corp. (The) | 175 | 5,586 | ||||||
Prudential PLC | 2,485 | 43,274 | ||||||
Reinsurance Group of America, Inc. – Class A | 151 | 13,605 | ||||||
Suncorp Group Ltd. | 1,230 | 9,802 | ||||||
Travelers Cos., Inc. (The) | 248 | 26,665 | ||||||
Zurich Insurance Group AG(c) | 50 | 10,591 | ||||||
|
| |||||||
| 408,782 | ||||||||
|
| |||||||
Real Estate Investment Trusts (REITs) – 0.1% | ||||||||
Emlak Konut Gayrimenkul Yatirim Ortakligi AS | 8,970 | 7,782 | ||||||
RLJ Lodging Trust | 599 | 12,561 | ||||||
|
| |||||||
| 20,343 | ||||||||
|
| |||||||
Real Estate Management & Development – 0.1% | ||||||||
Ayala Land, Inc. | 17,700 | 12,203 | ||||||
China Overseas Land & Investment Ltd. | 3,000 | 8,943 | ||||||
Global Logistic Properties Ltd. | 21,000 | 26,404 | ||||||
LendLease Group | 1,480 | 13,719 | ||||||
|
| |||||||
| 61,269 | ||||||||
|
| |||||||
Thrifts & Mortgage Finance – 0.1% | ||||||||
Housing Development Finance Corp., Ltd. | 2,880 | 44,863 | ||||||
LIC Housing Finance Ltd. | 1,460 | 8,999 | ||||||
|
| |||||||
| 53,862 | ||||||||
|
| |||||||
| 1,440,758 | ||||||||
|
| |||||||
Consumer Discretionary – 2.9% | ||||||||
Auto Components – 0.4% | ||||||||
Continental AG | 99 | 19,705 | ||||||
Goodyear Tire & Rubber Co. (The) | 724 | 21,807 | ||||||
Hankook Tire Co., Ltd.(c) | 410 | 17,692 | ||||||
Lear Corp. | 230 | 23,310 | ||||||
Magna International, Inc. – Class A | 1,179 | 45,804 | ||||||
| 74 | • AB TAX-MANAGED WEALTH STRATEGIES |
AB Tax-Managed Conservative Wealth Strategy—Portfolio of Investments
| Company | Shares | U.S. $ Value | ||||||
| ||||||||
Plastic Omnium SA | 290 | $ | 9,210 | |||||
Sumitomo Electric Industries Ltd. | 1,300 | 15,589 | ||||||
Valeo SA | 110 | 15,208 | ||||||
|
| |||||||
| 168,325 | ||||||||
|
| |||||||
Automobiles – 0.2% | ||||||||
General Motors Co. | 400 | 11,776 | ||||||
Honda Motor Co., Ltd. | 900 | 23,147 | ||||||
Isuzu Motors Ltd. | 1,100 | 11,005 | ||||||
Peugeot SA(c) | 1,390 | 20,855 | ||||||
Tata Motors Ltd.(c) | 1,530 | 6,702 | ||||||
Tata Motors Ltd. – Class A(c) | 2,500 | 8,587 | ||||||
Toyota Motor Corp. | 100 | 5,214 | ||||||
|
| |||||||
| 87,286 | ||||||||
|
| |||||||
Diversified Consumer Services – 0.0% | ||||||||
TAL Education Group (ADR)(c) | 237 | 12,265 | ||||||
|
| |||||||
Hotels, Restaurants & Leisure – 0.2% | ||||||||
IMAX China Holding, Inc.(c)(d) | 1,600 | 9,490 | ||||||
Melco International Development Ltd. | 11,000 | 12,822 | ||||||
Starbucks Corp. | 936 | 54,485 | ||||||
Yum! Brands, Inc. | 185 | 13,407 | ||||||
|
| |||||||
| 90,204 | ||||||||
|
| |||||||
Internet & Catalog Retail – 0.2% | ||||||||
Ctrip.com International Ltd. (ADR)(c) | 140 | 5,729 | ||||||
JD.com, Inc. (ADR)(c) | 240 | 6,170 | ||||||
Priceline Group, Inc. (The)(c) | 55 | 69,587 | ||||||
Vipshop Holdings Ltd. (ADR)(c) | 1,230 | 13,665 | ||||||
|
| |||||||
| 95,151 | ||||||||
|
| |||||||
Leisure Products – 0.0% | ||||||||
Bandai Namco Holdings, Inc. | 600 | 11,957 | ||||||
Mattel, Inc. | 90 | 2,927 | ||||||
|
| |||||||
| 14,884 | ||||||||
|
| |||||||
Media – 0.7% | ||||||||
AMC Networks, Inc. – Class A(c) | 506 | 33,163 | ||||||
Comcast Corp. – Class A | 1,724 | 99,527 | ||||||
CTS Eventim AG & Co. KGaA | 860 | 30,102 | ||||||
Interpublic Group of Cos., Inc. (The) | 260 | 5,561 | ||||||
Liberty Global PLC – Series C(c) | 688 | 24,740 | ||||||
Naspers Ltd. – Class N | 316 | 37,364 | ||||||
Thomson Reuters Corp. | 100 | 3,660 | ||||||
Time Warner Cable, Inc. – Class A | 64 | 12,215 | ||||||
Twenty-First Century Fox, Inc. – Class A | 100 | 2,702 | ||||||
Vivendi SA | 1,026 | 21,283 | ||||||
Walt Disney Co. (The) | 611 | 58,363 | ||||||
|
| |||||||
| 328,680 | ||||||||
|
| |||||||
| AB TAX-MANAGED WEALTH STRATEGIES • | 75 |
AB Tax-Managed Conservative Wealth Strategy—Portfolio of Investments
| Company | Shares | U.S. $ Value | ||||||
| ||||||||
Multiline Retail – 0.3% | ||||||||
B&M European Value Retail SA | 7,040 | $ | 27,916 | |||||
Dollar General Corp. | 327 | 24,280 | ||||||
Dollar Tree, Inc.(c) | 730 | 58,582 | ||||||
|
| |||||||
| 110,778 | ||||||||
|
| |||||||
Specialty Retail – 0.6% | ||||||||
Foot Locker, Inc. | 298 | 18,625 | ||||||
GameStop Corp. – Class A | 631 | 19,447 | ||||||
Home Depot, Inc. (The) | 778 | 96,565 | ||||||
Kingfisher PLC | 1,630 | 7,529 | ||||||
L Brands, Inc. | 275 | 23,317 | ||||||
L’Occitane International SA | 3,000 | 6,009 | ||||||
O’Reilly Automotive, Inc.(c) | 86 | 22,388 | ||||||
Ross Stores, Inc. | 220 | 12,096 | ||||||
Sports Direct International PLC(c) | 2,539 | 14,217 | ||||||
TJX Cos., Inc. (The) | 170 | 12,597 | ||||||
Ulta Salon Cosmetics & Fragrance, Inc.(c) | 264 | 43,610 | ||||||
|
| |||||||
| 276,400 | ||||||||
|
| |||||||
Textiles, Apparel & Luxury Goods – 0.3% | ||||||||
Cie Financiere Richemont SA | 409 | 25,972 | ||||||
HUGO BOSS AG | 271 | 15,414 | ||||||
Kering | 40 | 6,960 | ||||||
NIKE, Inc. – Class B | 1,130 | 69,596 | ||||||
Samsonite International SA | 4,500 | 13,187 | ||||||
|
| |||||||
| 131,129 | ||||||||
|
| |||||||
| 1,315,102 | ||||||||
|
| |||||||
Health Care – 2.5% | ||||||||
Biotechnology – 0.5% | ||||||||
Alexion Pharmaceuticals, Inc.(c) | 299 | 42,099 | ||||||
Biogen, Inc.(c) | 418 | 108,438 | ||||||
Gilead Sciences, Inc. | 805 | 70,236 | ||||||
|
| |||||||
| 220,773 | ||||||||
|
| |||||||
Health Care Equipment & Supplies – 0.5% | ||||||||
Align Technology, Inc.(c) | 550 | 36,317 | ||||||
Edwards Lifesciences Corp.(c) | 214 | 18,618 | ||||||
Essilor International SA | 72 | 8,552 | ||||||
Intuitive Surgical, Inc.(c) | 203 | 114,301 | ||||||
Sartorius AG (Preference Shares) | 160 | 41,078 | ||||||
|
| |||||||
| 218,866 | ||||||||
|
| |||||||
Health Care Providers & Services – 0.5% | ||||||||
Aetna, Inc. | 407 | 44,213 | ||||||
Express Scripts Holding Co.(c) | 220 | 15,484 | ||||||
Premier, Inc. – Class A(c) | 591 | 19,219 | ||||||
Quest Diagnostics, Inc. | 244 | 16,233 | ||||||
Ramsay Health Care Ltd. | 360 | 16,975 | ||||||
UnitedHealth Group, Inc. | 1,012 | 120,529 | ||||||
|
| |||||||
| 232,653 | ||||||||
|
| |||||||
| 76 | • AB TAX-MANAGED WEALTH STRATEGIES |
AB Tax-Managed Conservative Wealth Strategy—Portfolio of Investments
| Company | Shares | U.S. $ Value | ||||||
| ||||||||
Life Sciences Tools & Services – 0.2% | ||||||||
Eurofins Scientific SE | 156 | $ | 55,491 | |||||
Illumina, Inc.(c) | 151 | 22,686 | ||||||
Mettler-Toledo International, Inc.(c) | 71 | 22,359 | ||||||
|
| |||||||
| 100,536 | ||||||||
|
| |||||||
Pharmaceuticals – 0.8% | ||||||||
Aspen Pharmacare Holdings Ltd.(c) | 900 | 15,906 | ||||||
GlaxoSmithKline PLC | 1,100 | 21,318 | ||||||
Johnson & Johnson | 625 | 65,756 | ||||||
Merck & Co., Inc. | 578 | 29,021 | ||||||
Novo Nordisk A/S – Class B | 604 | 31,097 | ||||||
Pfizer, Inc. | 2,342 | 69,487 | ||||||
Roche Holding AG | 170 | 43,591 | ||||||
Shire PLC | 600 | 31,302 | ||||||
Sun Pharmaceutical Industries Ltd. | 1,370 | 17,137 | ||||||
|
| |||||||
| 324,615 | ||||||||
|
| |||||||
| 1,097,443 | ||||||||
|
| |||||||
Industrials – 1.8% | ||||||||
Aerospace & Defense – 0.3% | ||||||||
Airbus Group SE | 280 | 18,070 | ||||||
L-3 Communications Holdings, Inc. | 229 | 26,864 | ||||||
Northrop Grumman Corp. | 100 | 19,222 | ||||||
Rockwell Collins, Inc. | 243 | 21,280 | ||||||
United Technologies Corp. | 199 | 19,227 | ||||||
Zodiac Aerospace | 1,082 | 18,022 | ||||||
|
| |||||||
| 122,685 | ||||||||
|
| |||||||
Airlines – 0.3% | ||||||||
Air Canada(c) | 1,030 | 5,496 | ||||||
Alaska Air Group, Inc. | 233 | 17,219 | ||||||
Delta Air Lines, Inc. | 568 | 27,400 | ||||||
International Consolidated Airlines Group SA | 2,990 | 22,732 | ||||||
Japan Airlines Co., Ltd. | 500 | 17,891 | ||||||
JetBlue Airways Corp.(c) | 1,316 | 28,952 | ||||||
Qantas Airways Ltd.(c) | 4,022 | 11,048 | ||||||
|
| |||||||
| 130,738 | ||||||||
|
| |||||||
Building Products – 0.0% | ||||||||
AO Smith Corp. | 147 | 10,346 | ||||||
Assa Abloy AB – Class B | 430 | 8,244 | ||||||
|
| |||||||
| 18,590 | ||||||||
|
| |||||||
Commercial Services & Supplies – 0.2% | ||||||||
Babcock International Group PLC | 3,267 | 41,337 | ||||||
Regus PLC | 6,754 | 27,098 | ||||||
Republic Services, Inc. – Class A | 63 | 2,879 | ||||||
|
| |||||||
| 71,314 | ||||||||
|
| |||||||
| AB TAX-MANAGED WEALTH STRATEGIES • | 77 |
AB Tax-Managed Conservative Wealth Strategy—Portfolio of Investments
| Company | Shares | U.S. $ Value | ||||||
| ||||||||
Construction & Engineering – 0.0% | ||||||||
IRB Infrastructure Developers Ltd. | 2,780 | $ | 8,759 | |||||
Quanta Services, Inc.(c) | 304 | 6,168 | ||||||
|
| |||||||
| 14,927 | ||||||||
|
| |||||||
Electrical Equipment – 0.1% | ||||||||
Acuity Brands, Inc. | 117 | 24,503 | ||||||
Eaton Corp. PLC | 636 | 36,068 | ||||||
|
| |||||||
| 60,571 | ||||||||
|
| |||||||
Industrial Conglomerates – 0.2% | ||||||||
Danaher Corp. | 384 | 34,280 | ||||||
General Electric Co. | 1,135 | 33,074 | ||||||
Rheinmetall AG | 230 | 16,335 | ||||||
Roper Technologies, Inc. | 84 | 14,106 | ||||||
|
| |||||||
| 97,795 | ||||||||
|
| |||||||
Machinery – 0.2% | ||||||||
Hoshizaki Electric Co., Ltd. | 500 | 38,696 | ||||||
IHI Corp. | 6,000 | 10,683 | ||||||
ITT Corp. | 536 | 18,899 | ||||||
JTEKT Corp. | 1,700 | 23,209 | ||||||
|
| |||||||
| 91,487 | ||||||||
|
| |||||||
Marine – 0.0% | ||||||||
AP Moeller – Maersk A/S – Class B | 5 | 6,571 | ||||||
|
| |||||||
Professional Services – 0.3% | ||||||||
Bureau Veritas SA | 1,700 | 33,866 | ||||||
Capita PLC | 3,648 | 50,585 | ||||||
Robert Half International, Inc. | 403 | 15,874 | ||||||
Teleperformance | 343 | 26,481 | ||||||
|
| |||||||
| 126,806 | ||||||||
|
| |||||||
Road & Rail – 0.1% | ||||||||
Canadian National Railway Co. | 110 | 6,390 | ||||||
CAR, Inc.(c) | 2,000 | 2,282 | ||||||
Central Japan Railway Co. | 200 | 35,783 | ||||||
|
| |||||||
| 44,455 | ||||||||
|
| |||||||
Trading Companies & Distributors – 0.1% | ||||||||
Brenntag AG | 255 | 12,308 | ||||||
Bunzl PLC | 680 | 18,199 | ||||||
WESCO International, Inc.(c) | 228 | 10,044 | ||||||
|
| |||||||
| 40,551 | ||||||||
|
| |||||||
| 826,490 | ||||||||
|
| |||||||
Consumer Staples – 1.3% | ||||||||
Beverages – 0.1% | ||||||||
Asahi Group Holdings Ltd. | 200 | 5,877 | ||||||
Monster Beverage Corp.(c) | 351 | 44,051 | ||||||
|
| |||||||
| 49,928 | ||||||||
|
| |||||||
| 78 | • AB TAX-MANAGED WEALTH STRATEGIES |
AB Tax-Managed Conservative Wealth Strategy—Portfolio of Investments
| Company | Shares | U.S. $ Value | ||||||
| ||||||||
Food & Staples Retailing – 0.5% | ||||||||
Alimentation Couche-Tard, Inc. – Class B | 190 | $ | 8,597 | |||||
Costco Wholesale Corp. | 222 | 33,307 | ||||||
CP ALL PCL | 10,200 | 12,381 | ||||||
CVS Health Corp. | 864 | 83,955 | ||||||
Delhaize Group | 345 | 34,888 | ||||||
Lenta Ltd. (GDR)(c)(d) | 2,413 | 13,589 | ||||||
Magnit PJSC (Sponsored GDR)(d) | 170 | 5,695 | ||||||
Olam International Ltd. | 11,936 | 13,544 | ||||||
X5 Retail Group NV (GDR)(c)(d) | 360 | 6,714 | ||||||
|
| |||||||
| 212,670 | ||||||||
|
| |||||||
Food Products – 0.2% | ||||||||
Archer-Daniels-Midland Co. | 166 | 5,803 | ||||||
ConAgra Foods, Inc. | 96 | 4,038 | ||||||
Ingredion, Inc. | 137 | 13,867 | ||||||
JBS SA | 2,800 | 7,949 | ||||||
Mondelez International, Inc. – Class A | 434 | 17,590 | ||||||
Tyson Foods, Inc. – Class A | 302 | 19,555 | ||||||
Universal Robina Corp. | 2,190 | 9,114 | ||||||
WhiteWave Foods Co. (The)(c) | 189 | 7,318 | ||||||
|
| |||||||
| 85,234 | ||||||||
|
| |||||||
Household Products – 0.1% | ||||||||
Kimberly-Clark Corp. | 19 | 2,476 | ||||||
Procter & Gamble Co. (The) | 286 | 22,963 | ||||||
|
| |||||||
| 25,439 | ||||||||
|
| |||||||
Personal Products – 0.1% | ||||||||
Estee Lauder Cos., Inc. (The) – Class A | 490 | 44,752 | ||||||
Hengan International Group Co., Ltd. | 2,000 | 15,832 | ||||||
Unilever PLC | 230 | 9,826 | ||||||
|
| |||||||
| 70,410 | ||||||||
|
| |||||||
Tobacco – 0.3% | ||||||||
Altria Group, Inc. | 510 | 31,401 | ||||||
British American Tobacco PLC | 1,559 | 84,816 | ||||||
Imperial Brands PLC | 194 | 10,013 | ||||||
Philip Morris International, Inc. | 102 | 9,285 | ||||||
|
| |||||||
| 135,515 | ||||||||
|
| |||||||
| 579,196 | ||||||||
|
| |||||||
Energy – 0.8% | ||||||||
Energy Equipment & Services – 0.1% | ||||||||
Aker Solutions ASA(d) | 1,200 | 3,560 | ||||||
Schlumberger Ltd. | 566 | 40,593 | ||||||
|
| |||||||
| 44,153 | ||||||||
|
| |||||||
Oil, Gas & Consumable Fuels – 0.7% | ||||||||
California Resources Corp. | 10 | 6 | ||||||
Canadian Natural Resources Ltd. | 240 | 5,016 | ||||||
| AB TAX-MANAGED WEALTH STRATEGIES • | 79 |
AB Tax-Managed Conservative Wealth Strategy—Portfolio of Investments
| Company | Shares | U.S. $ Value | ||||||
| ||||||||
Chevron Corp. | 188 | $ | 15,687 | |||||
EOG Resources, Inc. | 487 | 31,528 | ||||||
Exxon Mobil Corp. | 815 | 65,322 | ||||||
HollyFrontier Corp. | 627 | 21,205 | ||||||
JX Holdings, Inc. | 6,800 | 26,414 | ||||||
LUKOIL PJSC (Sponsored ADR) | 170 | 6,004 | ||||||
Occidental Petroleum Corp. | 104 | 7,157 | ||||||
Phillips 66 | 140 | 11,115 | ||||||
QEP Resources, Inc. | 1,278 | 12,473 | ||||||
Royal Dutch Shell PLC – Class A | 2,540 | 57,948 | ||||||
TOTAL SA | 377 | 16,897 | ||||||
Tupras Turkiye Petrol Rafinerileri AS(c) | 480 | 12,265 | ||||||
Valero Energy Corp. | 399 | 23,972 | ||||||
|
| |||||||
| 313,009 | ||||||||
|
| |||||||
| 357,162 | ||||||||
|
| |||||||
Utilities – 0.6% | ||||||||
Electric Utilities – 0.4% | ||||||||
American Electric Power Co., Inc. | 423 | 26,120 | ||||||
Edison International | 371 | 25,287 | ||||||
EDP – Energias de Portugal SA | 6,570 | 20,347 | ||||||
Enel SpA | 2,880 | 11,510 | ||||||
Eversource Energy | 82 | 4,453 | ||||||
Exelon Corp. | 651 | 20,500 | ||||||
FirstEnergy Corp. | 119 | 3,983 | ||||||
Korea Electric Power Corp. | 260 | 12,335 | ||||||
PPL Corp. | 936 | 32,751 | ||||||
Westar Energy, Inc. | 450 | 19,557 | ||||||
|
| |||||||
| 176,843 | ||||||||
|
| |||||||
Independent Power and Renewable Electricity Producers – 0.1% | ||||||||
Huadian Power International Corp., Ltd. – Class H | 20,000 | 10,827 | ||||||
Huaneng Power International, Inc. – Class H | 16,000 | 12,547 | ||||||
TerraForm Global, Inc. – Class A | 2,308 | 7,316 | ||||||
|
| |||||||
| 30,690 | ||||||||
|
| |||||||
Multi-Utilities – 0.1% |
| |||||||
NiSource, Inc. | 1,050 | 22,554 | ||||||
PG&E Corp. | 407 | 23,089 | ||||||
Public Service Enterprise Group, Inc. | 150 | 6,399 | ||||||
|
| |||||||
| 52,042 | ||||||||
|
| |||||||
Water Utilities – 0.0% | ||||||||
Cia de Saneamento Basico do Estado de Sao Paulo | 2,000 | 11,261 | ||||||
|
| |||||||
| 270,836 | ||||||||
|
| |||||||
Materials – 0.6% | ||||||||
Chemicals – 0.5% | ||||||||
Agrium, Inc. (Toronto) | 110 | 9,472 | ||||||
Arkema SA | 280 | 17,095 | ||||||
| 80 | • AB TAX-MANAGED WEALTH STRATEGIES |
AB Tax-Managed Conservative Wealth Strategy—Portfolio of Investments
| Company | Shares | U.S. $ Value | ||||||
| ||||||||
CF Industries Holdings, Inc. | 1,139 | $ | 41,528 | |||||
Covestro AG(c)(d) | 252 | 8,031 | ||||||
Dow Chemical Co. (The) | 406 | 19,736 | ||||||
Essentra PLC | 5,420 | 62,623 | ||||||
JSR Corp. | 800 | 11,215 | ||||||
Koninklijke DSM NV | 303 | 14,905 | ||||||
LG Chem Ltd. | 30 | 7,292 | ||||||
LyondellBasell Industries NV – Class A | 474 | 38,020 | ||||||
|
| |||||||
| 229,917 | ||||||||
|
| |||||||
Metals & Mining – 0.1% | ||||||||
Goldcorp, Inc. | 720 | 10,345 | ||||||
Novolipetsk Steel AO (GDR)(d) | 800 | 7,804 | ||||||
|
| |||||||
| 18,149 | ||||||||
|
| |||||||
Paper & Forest Products – 0.0% | ||||||||
Mondi PLC | 582 | 10,384 | ||||||
|
| |||||||
| 258,450 | ||||||||
|
| |||||||
Telecommunication Services – 0.4% | ||||||||
Diversified Telecommunication Services – 0.3% | ||||||||
AT&T, Inc. | 202 | 7,464 | ||||||
BT Group PLC | 6,160 | 41,482 | ||||||
Nippon Telegraph & Telephone Corp. | 1,000 | 42,347 | ||||||
Telefonica Brasil SA (Preference Shares) | 1,396 | 13,280 | ||||||
Verizon Communications, Inc. | 609 | 30,895 | ||||||
|
| |||||||
| 135,468 | ||||||||
|
| |||||||
Wireless Telecommunication Services – 0.1% | ||||||||
Rogers Communications, Inc. – Class B | 170 | 6,292 | ||||||
SoftBank Group Corp. | 200 | 9,828 | ||||||
Tower Bersama Infrastructure Tbk PT(c) | 14,500 | 6,254 | ||||||
Turkcell Iletisim Hizmetleri AS | 2,750 | 10,251 | ||||||
Vodafone Group PLC | 8,790 | 26,659 | ||||||
|
| |||||||
| 59,284 | ||||||||
|
| |||||||
| 194,752 | ||||||||
|
| |||||||
Total Common Stocks | 7,971,560 | |||||||
|
| |||||||
INVESTMENT COMPANIES – 14.0% |
| |||||||
Funds and Investment Trusts – 14.0% |
| |||||||
AB Multi-Manager Alternative Strategies Fund – Class Z(c)(e) | 185,425 | 1,785,640 | ||||||
AB Pooling Portfolio-AB Multi-Asset Real Return Portfolio(e) | 80,977 | 434,846 | ||||||
AB Pooling Portfolio-AB Volatility Management Portfolio(e) | 405,476 | 4,038,541 | ||||||
|
| |||||||
Total Investment Companies | 6,259,027 | |||||||
|
| |||||||
| AB TAX-MANAGED WEALTH STRATEGIES • | 81 |
AB Tax-Managed Conservative Wealth Strategy—Portfolio of Investments
| Company | Shares | U.S. $ Value | ||||||
| ||||||||
SHORT-TERM INVESTMENTS – 0.9% | ||||||||
Investment Companies – 0.9% | ||||||||
AB Fixed Income Shares, Inc. – | 381,411 | $ | 381,411 | |||||
|
| |||||||
Total Investments – 100.1% | 44,739,394 | |||||||
Other assets less liabilities – (0.1)% | (32,264 | ) | ||||||
|
| |||||||
Net Assets – 100.0% | $ | 44,707,130 | ||||||
|
| |||||||
FUTURES (see Note D)
| Type | Number of Contracts | Expiration Month | Original Value | Value at February 29, 2016 | Unrealized Appreciation/ (Depreciation) | |||||||||||||||
Purchased Contracts |
| |||||||||||||||||||
EURO STOXX 50 Index Futures | 2 | March 2016 | $ | 63,054 | $ | 63,835 | $ | 781 | ||||||||||||
FORWARD CURRENCY EXCHANGE CONTRACTS (see Note D)
| Counterparty | Contracts to Deliver (000) | In Exchange For (000) | Settlement Date | Unrealized Appreciation/ (Depreciation) | ||||||||||||||||||||
BNP Paribas SA | KRW | 39,020 | USD | 32 | 5/18/16 | $ | 592 | |||||||||||||||||
Citibank | RUB | 432 | USD | 6 | 4/07/16 | (134 | ) | |||||||||||||||||
Deutsche Bank AG | BRL | 112 | USD | 28 | 3/02/16 | (370 | ) | |||||||||||||||||
Deutsche Bank AG | USD | 28 | BRL | 112 | 3/02/16 | (252 | ) | |||||||||||||||||
HSBC Bank USA | BRL | 112 | USD | 28 | 3/02/16 | 252 | ||||||||||||||||||
HSBC Bank USA | USD | 28 | BRL | 112 | 3/02/16 | (459 | ) | |||||||||||||||||
HSBC Bank USA | BRL | 112 | USD | 28 | 4/04/16 | 444 | ||||||||||||||||||
State Street Bank & Trust Co. | CAD | 49 | USD | 34 | 5/18/16 | (1,763 | ) | |||||||||||||||||
State Street Bank & Trust Co. | EUR | 153 | USD | 173 | 5/18/16 | 5,840 | ||||||||||||||||||
State Street Bank & Trust Co. | GBP | 148 | USD | 211 | 5/18/16 | 5,041 | ||||||||||||||||||
State Street Bank & Trust Co. | HKD | 537 | USD | 69 | 5/18/16 | (196 | ) | |||||||||||||||||
State Street Bank & Trust Co. | JPY | 1,864 | USD | 17 | 5/18/16 | 130 | ||||||||||||||||||
State Street Bank & Trust Co. | JPY | 7,238 | USD | 61 | 5/18/16 | (3,178 | ) | |||||||||||||||||
State Street Bank & Trust Co. | KRW | 14,231 | USD | 12 | 5/18/16 | 261 | ||||||||||||||||||
State Street Bank & Trust Co. | USD | 32 | AUD | 45 | 5/18/16 | 357 | ||||||||||||||||||
State Street Bank & Trust Co. | USD | 15 | CHF | 15 | 5/18/16 | 170 | ||||||||||||||||||
State Street Bank & Trust Co. | USD | 68 | CHF | 66 | 5/18/16 | (1,565 | ) | |||||||||||||||||
State Street Bank & Trust Co. | USD | 57 | EUR | 51 | 5/18/16 | (1,499 | ) | |||||||||||||||||
State Street Bank & Trust Co. | USD | 18 | GBP | 13 | 5/18/16 | (399 | ) | |||||||||||||||||
State Street Bank & Trust Co. | USD | 158 | JPY | 18,226 | 5/18/16 | 3,747 | ||||||||||||||||||
State Street Bank & Trust Co. | USD | 18 | JPY | 2,064 | 5/18/16 | (57 | ) | |||||||||||||||||
State Street Bank & Trust Co. | USD | 14 | NOK | 123 | 5/18/16 | 80 | ||||||||||||||||||
State Street Bank & Trust Co. | USD | 21 | NOK | 179 | 5/18/16 | (325 | ) | |||||||||||||||||
| 82 | • AB TAX-MANAGED WEALTH STRATEGIES |
AB Tax-Managed Conservative Wealth Strategy—Portfolio of Investments
| Counterparty | Contracts to Deliver (000) | In Exchange For (000) | Settlement Date | Unrealized Appreciation/ (Depreciation) | ||||||||||||||||||||
State Street Bank & Trust Co. | USD | 68 | SEK | 569 | 5/18/16 | $ | (1,316 | ) | ||||||||||||||||
|
| |||||||||||||||||||||||
| $ | 5,401 | |||||||||||||||||||||||
|
| |||||||||||||||||||||||
CENTRALLY CLEARED CREDIT DEFAULT SWAPS (see Note D)
| Clearing Broker/(Exchange) & Referenced Obligation | Fixed Rate (Pay) Receive | Implied Credit Spread at February 29, 2016 | Notional Amount (000) | Market Value | Unrealized Appreciation/ (Depreciation) | |||||||||||||||
Sale Contracts |
| |||||||||||||||||||
Morgan Stanley & Co. LLC/(INTRCONX) | 1.00 | % | 1.07 | % | $ | 50 | $ | (66 | ) | $ | 154 | |||||||||
| * | Termination date |
CENTRALLY CLEARED INTEREST RATE SWAPS (see Note D)
| Rate Type | ||||||||||||||||||||
| Clearing Broker/ (Exchange) | Notional Amount (000) | Termination Date | Payments made by the Fund | Payments received by the Fund | Unrealized Appreciation/ (Depreciation) | |||||||||||||||
Morgan Stanley & Co., LLC/(CME) | $ | 1,210 | 3/31/19 | 3 Month LIBOR | 1.056 | % | $ | 276 | ||||||||||||
INFLATION (CPI) SWAPS (see Note D)
| Rate Type | ||||||||||||||||||||
| Swap Counterparty | Notional Amount (000) | Termination Date | Payments made by the Fund | Payments received by the Fund | Unrealized Appreciation/ (Depreciation) | |||||||||||||||
Bank of America, NA | $ | 250 | 7/09/24 | 2.613 | % | CPI | # | $ | (32,591 | ) | ||||||||||
Barclays Bank PLC | 500 | 7/19/17 | 2.038 | % | CPI | # | (18,614 | ) | ||||||||||||
Barclays Bank PLC | 300 | 10/05/22 | 2.765 | % | CPI | # | (45,530 | ) | ||||||||||||
Barclays Bank PLC | 200 | 5/05/25 | 2.125 | % | CPI | # | (10,823 | ) | ||||||||||||
Citibank, NA | 250 | 8/26/20 | 2.298 | % | CPI | # | (19,216 | ) | ||||||||||||
Citibank, NA | 630 | 12/14/20 | 1.548 | % | CPI | # | (3,153 | ) | ||||||||||||
Deutsche Bank AG | 250 | 7/15/20 | 1.265 | % | CPI | # | 3,703 | |||||||||||||
Deutsche Bank AG | 200 | 9/02/25 | 1.880 | % | CPI | # | (5,485 | ) | ||||||||||||
JPMorgan Chase Bank, NA | 200 | 3/04/24 | 2.493 | % | CPI | # | (23,141 | ) | ||||||||||||
Morgan Stanley Capital Services LLC | 1,500 | 10/31/18 | 1.960 | % | CPI | # | (125,188 | ) | ||||||||||||
Morgan Stanley Capital Services LLC | 150 | 4/16/23 | 2.690 | % | CPI | # | (22,553 | ) | ||||||||||||
|
| |||||||||||||||||||
| $ | (302,591 | ) | ||||||||||||||||||
|
| |||||||||||||||||||
| # | Variable interest rate based on the rate of inflation as determined by the Consumer Price Index (CPI). |
| AB TAX-MANAGED WEALTH STRATEGIES • | 83 |
AB Tax-Managed Conservative Wealth Strategy—Portfolio of Investments
INTEREST RATE SWAPS (see Note D)
| Rate Type | ||||||||||||||||
| Swap Counterparty | Notional Amount (000) | Termination Date | Payments made by the Fund | Payments received by the Fund | Unrealized Appreciation/ (Depreciation) | |||||||||||
Citibank, NA | $ | 630 | 3/01/23 | 0.904% | SIFMA* | $ | (562 | ) | ||||||||
| * | Variable interest rate based on the Securities Industry & Financial Markets Association (SIFMA) Municipal Swap Index. |
| (a) | Variable rate coupon, rate shown as of February 29, 2016. |
| (b) | Floating Rate Security. Stated interest rate was in effect at February 29, 2016. |
| (c) | Non-income producing security. |
| (d) | Security is exempt from registration under Rule 144A of the Securities Act of 1933. These securities are considered liquid and may be resold in transactions exempt from registration, normally to qualified institutional buyers. At February 29, 2016, the aggregate market value of these securities amounted to $91,089 or 0.2% of net assets. |
| (e) | To obtain a copy of the fund’s financial statements, please go to the Securities and Exchange Commission’s website at www.sec.gov, or call AB at (800) 227-4618. |
| (f) | Investment in affiliated money market mutual fund. The rate shown represents the 7-day yield as of period end. |
As of February 29, 2016, the Strategy’s percentages of investments in municipal bonds that are insured and in insured municipal bonds that have been pre-refunded or escrowed to maturity are 8.2% and 0.0%, respectively.
Currency Abbreviations:
| AUD | – Australian Dollar |
| BRL | – Brazilian Real |
| CAD | – Canadian Dollar |
| CHF | – Swiss Franc |
| EUR | – Euro |
| GBP | – Great British Pound |
| HKD | – Hong Kong Dollar |
| JPY | – Japanese Yen |
| KRW | – South Korean Won |
| NOK | – Norwegian Krone |
| RUB | – Russian Ruble |
| SEK | – Swedish Krona |
| USD | – United States Dollar |
| Glossary: |
| ADR | – American Depositary Receipt |
| AGC | – Assured Guaranty Corporation |
| AGM | – Assured Guaranty Municipal |
| CDX-NAIG | – North American Investment Grade Credit Default Swap Index |
| CME | – Chicago Mercantile Exchange |
| CPI | – Consumer Price Index |
| ETM | – Escrowed to Maturity |
| GDR | – Global Depositary Receipt |
| INTRCONX | – Inter-Continental Exchange |
| LIBOR | – London Interbank Offered Rates |
| NATL | – National Interstate Corporation |
| PJSC | – Public Joint Stock Company |
| REG | – Registered Shares |
| SRF | – State Revolving Fund |
| See | notes to financial statements. |
| 84 | • AB TAX-MANAGED WEALTH STRATEGIES |
AB Tax-Managed Conservative Wealth Strategy—Portfolio of Investments
STATEMENT OF ASSETS & LIABILITIES
February 29, 2016 (unaudited)
| AB Tax-Managed Wealth Appreciation Strategy | AB Tax-Managed Balanced Wealth Strategy | AB Tax-Managed Conservative Wealth Strategy | ||||||||||
| Assets | ||||||||||||
Investments in securities, at value | ||||||||||||
Unaffiliated issuers (cost $435,835,822, $106,190,154 and $36,321,825, respectively) | $ | 463,484,506 | $ | 112,884,341 | $ | 38,098,956 | ||||||
Affiliated issuers (cost $213,057,560, $30,907,088 and $7,105,417, respectively) | 189,598,711 | 27,583,481 | 6,640,438 | |||||||||
Cash collateral due from broker | 18,597 | 17,630 | 7,934 | |||||||||
Foreign currencies, at value (cost $2,148,293, $164,622 and $39,249, respectively) | 2,145,561 | 164,025 | 39,081 | |||||||||
Receivable for investment securities sold and foreign currency transactions | 2,289,505 | 222,816 | 47,229 | |||||||||
Dividends and interest receivable | 1,047,618 | 880,898 | 341,737 | |||||||||
Receivable for shares of beneficial interest sold | 772,320 | 16,013 | 576 | |||||||||
Unrealized appreciation of forward currency exchange contracts | 902,889 | 79,023 | 16,914 | |||||||||
Receivable for variation margin on exchange-traded derivatives | – 0 | – | 55 | 455 | ||||||||
Unrealized appreciation on inflation swaps | – 0 | – | 10,369 | 3,703 | ||||||||
Receivable due from Adviser | – 0 | – | – 0 | – | 8,023 | |||||||
|
|
|
|
|
| |||||||
Total assets | 660,259,707 | 141,858,651 | 45,205,046 | |||||||||
|
|
|
|
|
| |||||||
| Liabilities | ||||||||||||
Due to custodian | 273 | 54 | 732 | |||||||||
Payable for investment securities purchased and foreign currency transactions | 3,704,861 | 126,629 | 46,731 | |||||||||
Upfront premium received on inflation swaps | – 0 | – | 500 | – 0 | – | |||||||
Payable for variation margin on exchange-traded derivatives | 2,526 | – 0 | – | – 0 | – | |||||||
Payable for shares of beneficial interest redeemed | 488,291 | 159,418 | 342 | |||||||||
Unrealized depreciation on interest rate swaps | – 0 | – | 37,516 | 562 | ||||||||
Unrealized depreciation on inflation swaps | – 0 | – | 1,022,356 | 306,294 | ||||||||
Unrealized depreciation of forward currency exchange contracts | 605,405 | 52,718 | 11,513 | |||||||||
Advisory fee payable | 291,880 | 54,702 | – 0 | – | ||||||||
Distribution fee payable | 17,549 | 36,446 | 15,268 | |||||||||
Transfer Agent fee payable | 10,586 | 9,973 | 3,822 | |||||||||
Administrative fee payable | 185 | – 0 | – | – 0 | – | |||||||
Audit and tax fee payable | 32,267 | 38,284 | 39,363 | |||||||||
Accrued expenses | 94,944 | 97,135 | 73,289 | |||||||||
|
|
|
|
|
| |||||||
Total liabilities | 5,248,767 | 1,635,731 | 497,916 | |||||||||
|
|
|
|
|
| |||||||
Net Assets | $ | 655,010,940 | $ | 140,222,920 | $ | 44,707,130 | ||||||
|
|
|
|
|
| |||||||
See notes to financial statements.
| AB TAX-MANAGED WEALTH STRATEGIES • | 85 |
Statement of Assets & Liabilities
| AB Tax-Managed Wealth Appreciation Strategy | AB Tax-Managed Balanced Wealth Strategy | AB Tax-Managed Conservative Wealth Strategy | ||||||||||
| Composition of Net Assets | ||||||||||||
Shares of beneficial interest, at par | $ | 482 | $ | 112 | $ | 42 | ||||||
Additional paid-in capital | 649,485,021 | 135,797,685 | 43,411,737 | |||||||||
Undistributed net investment income (distributions in excess of net investment income) | (223,027 | ) | 1,113,100 | 17,517 | ||||||||
Accumulated net realized gain on investment and foreign currency transactions | 1,324,269 | 969,373 | 262,772 | |||||||||
Net unrealized appreciation on investments and foreign currency denominated assets and liabilities | 4,424,195 | 2,342,650 | 1,015,062 | |||||||||
|
|
|
|
|
| |||||||
Net Assets | $ | 655,010,940 | $ | 140,222,920 | $ | 44,707,130 | ||||||
|
|
|
|
|
| |||||||
Net Asset Value Per Share—unlimited shares authorized, $.00001 par value
| AB Tax-Managed Wealth Appreciation Strategy | Net Assets | Shares Outstanding | Net Asset Value | |||||||||
| ||||||||||||
| Class A | $ | 31,206,546 | 2,303,694 | $ | 13.55 | * | ||||||
| ||||||||||||
| Class B | $ | 629,056 | 46,817 | $ | 13.44 | |||||||
| ||||||||||||
| Class C | $ | 13,972,805 | 1,045,898 | $ | 13.36 | |||||||
| ||||||||||||
| Advisor Class | $ | 609,202,533 | 44,843,261 | $ | 13.59 | |||||||
| ||||||||||||
| AB Tax-Managed Balanced Wealth Strategy | ||||||||||||
| ||||||||||||
| Class A | $ | 74,266,694 | 5,943,767 | $ | 12.49 | * | ||||||
| ||||||||||||
| Class B | $ | 1,778,444 | 141,134 | $ | 12.60 | |||||||
| ||||||||||||
| Class C | $ | 25,598,690 | 2,042,142 | $ | 12.54 | |||||||
| ||||||||||||
| Advisor Class | $ | 38,579,092 | 3,082,179 | $ | 12.52 | |||||||
| ||||||||||||
| AB Tax-Managed Conservative Wealth Strategy | ||||||||||||
| ||||||||||||
| Class A | $ | 28,603,603 | 2,685,107 | $ | 10.65 | * | ||||||
| ||||||||||||
| Class B | $ | 581,859 | 52,723 | $ | 11.04 | |||||||
| ||||||||||||
| Class C | $ | 11,597,124 | 1,056,527 | $ | 10.98 | |||||||
| ||||||||||||
| Advisor Class | $ | 3,924,544 | 367,108 | $ | 10.69 | |||||||
| ||||||||||||
| * | The maximum offering price per share for Class A shares of Tax-Managed Wealth Appreciation Strategy, Tax-Managed Balanced Wealth Strategy and Tax-Managed Conservative Wealth Strategy was $14.15, $13.04 and $11.12, respectively, which reflects a sales charge of 4.25%. |
See notes to financial statements.
| 86 | • AB TAX-MANAGED WEALTH STRATEGIES |
Statement of Assets & Liabilities
STATEMENT OF OPERATIONS
Six Months Ended February 29, 2016 (unaudited)
| AB Tax-Managed Wealth Appreciation Strategy | AB Tax-Managed Balanced Wealth Strategy | AB Tax-Managed Conservative Wealth Strategy | ||||||||||
| Investment Income | ||||||||||||
Dividends | ||||||||||||
Affiliated issuers | $ | 4,711,936 | $ | 652,220 | $ | 156,617 | ||||||
Unaffiliated issuers (net of foreign taxes withheld of $123,468, $9,733 and $2,216, respectively) | 3,833,928 | 304,815 | 64,378 | |||||||||
Interest | – 0 | – | 1,066,784 | 352,486 | ||||||||
|
|
|
|
|
| |||||||
Total income | 8,545,864 | 2,023,819 | 573,481 | |||||||||
|
|
|
|
|
| |||||||
| Expenses | ||||||||||||
Advisory fee (see Note B) | 2,235,205 | 396,879 | 126,894 | |||||||||
Distribution fee – Class A | 42,106 | 96,615 | 42,298 | |||||||||
Distribution fee – Class B | 3,622 | 10,128 | 3,409 | |||||||||
Distribution fee – Class C | 76,133 | 131,996 | 59,295 | |||||||||
Transfer agency – Class A | 4,070 | 32,682 | 14,746 | |||||||||
Transfer agency – Class B | 242 | 1,162 | 412 | |||||||||
Transfer agency – Class C | 2,074 | 11,616 | 6,076 | |||||||||
Transfer agency – Advisor Class | 77,196 | 16,331 | 1,888 | |||||||||
Custodian | 125,980 | 80,583 | 69,846 | |||||||||
Audit and tax | 28,609 | 32,722 | 32,722 | |||||||||
Registration fees | 31,402 | 26,486 | 30,467 | |||||||||
Legal | 27,870 | 29,992 | 27,009 | |||||||||
Printing | 23,067 | 27,917 | 12,427 | |||||||||
Trustees’ fees | 10,816 | 10,874 | 10,816 | |||||||||
Administrative | 19,866 | – 0 | – | – 0 | – | |||||||
Miscellaneous | 24,419 | 17,070 | 15,688 | |||||||||
|
|
|
|
|
| |||||||
Total expenses | 2,732,677 | 923,053 | 453,993 | |||||||||
Less: expenses waived and reimbursed by the Adviser | (273,689 | ) | (41,382 | ) | (159,662 | ) | ||||||
|
|
|
|
|
| |||||||
Net expenses | 2,458,988 | 881,671 | 294,331 | |||||||||
|
|
|
|
|
| |||||||
Net investment income | 6,086,876 | 1,142,148 | 279,150 | |||||||||
|
|
|
|
|
| |||||||
See notes to financial statements.
| AB TAX-MANAGED WEALTH STRATEGIES • | 87 |
Statement of Operations
| AB Tax-Managed Wealth Appreciation Strategy | AB Tax-Managed Balanced Wealth Strategy | AB Tax-Managed Conservative Wealth Strategy | ||||||||||
| Realized and Unrealized Gain (Loss) on Investment and Foreign Currency Transactions | ||||||||||||
Net realized gain (loss) on: | ||||||||||||
Affiliated Underlying Portfolios | $ | (770,903 | ) | $ | (22,647 | ) | $ | 8,147 | ||||
Investment transactions | 224,494 | 134,781 | 184,750 | |||||||||
Futures | (59,251 | ) | (1,396 | ) | – 0 | – | ||||||
Swaps | – 0 | – | (4,729 | ) | (95 | ) | ||||||
Foreign currency transactions | 491,644 | 51,802 | 8,381 | |||||||||
Net realized gain distributions received from affiliated Underlying Portfolios | 2,491,063 | 349,339 | 97,226 | |||||||||
Net change in unrealized appreciation/depreciation of: | ||||||||||||
Affiliated Underlying Portfolios | (18,719,956 | ) | (2,705,749 | ) | (627,121 | ) | ||||||
Investments(a) | (27,513,730 | ) | (710,546 | ) | (324,495 | ) | ||||||
Futures | (1,126 | ) | 22 | 781 | ||||||||
Swaps | – 0 | – | (224,570 | ) | (41,968 | ) | ||||||
Foreign currency denominated assets and liabilities | 239,320 | 25,380 | 5,237 | |||||||||
|
|
|
|
|
| |||||||
Net loss on investment and foreign currency transactions | (43,618,445 | ) | (3,108,313 | ) | (689,157 | ) | ||||||
|
|
|
|
|
| |||||||
Net Decrease in Net Assets from Operations | $ | (37,531,569 | ) | $ | (1,966,165 | ) | $ | (410,007 | ) | |||
|
|
|
|
|
| |||||||
| (a) | Net of increase in accrued foreign capital gains taxes of $16,805, $1,416 and $288, respectively. |
See notes to financial statements.
| 88 | • AB TAX-MANAGED WEALTH STRATEGIES |
Statement of Operations
STATEMENT OF CHANGES IN NET ASSETS
| AB Tax-Managed Wealth Appreciation Strategy | ||||||||
| Six Months Ended February 29, 2016 (unaudited) | Year Ended August 31, 2015 | |||||||
| Increase (Decrease) in Net Assets from Operations | ||||||||
Net investment income | $ | 6,086,876 | $ | 10,613,368 | ||||
Net realized gain (loss) on affiliated Underlying Portfolios | (770,903 | ) | – 0 | – | ||||
Net realized gain on investment transactions and foreign currency transactions | 656,887 | 50,272,511 | ||||||
Net realized gain distributions received from affiliated Underlying Portfolios | 2,491,063 | 2,854,184 | ||||||
Net change in unrealized appreciation/depreciation of investments and foreign currency denominated assets and liabilities | (45,995,492 | ) | (92,767,749 | ) | ||||
|
|
|
| |||||
Net decrease in net assets from operations | (37,531,569 | ) | (29,027,686 | ) | ||||
| Dividends and Distributions to Shareholders from | ||||||||
Net investment income | ||||||||
Class A | (361,483 | ) | (594,095 | ) | ||||
Class B | – 0 | – | (9,007 | ) | ||||
Class C | (40,174 | ) | (150,441 | ) | ||||
Advisor Class | (8,548,992 | ) | (12,450,617 | ) | ||||
Net realized gain on investment transactions | ||||||||
Class A | (2,065,522 | ) | (324,756 | ) | ||||
Class B | (44,662 | ) | (13,689 | ) | ||||
Class C | (955,499 | ) | (149,683 | ) | ||||
Advisor Class | (39,003,215 | ) | (5,755,081 | ) | ||||
| Transactions in Shares of Beneficial Interest | ||||||||
Net increase | 43,693,362 | 1,512,538 | ||||||
|
|
|
| |||||
Total decrease | (44,857,754 | ) | (46,962,517 | ) | ||||
| Net Assets | ||||||||
Beginning of period | 699,868,694 | 746,831,211 | ||||||
|
|
|
| |||||
End of period (including distributions in excess of net investment income of ($223,027) and undistributed net investment income of $2,640,746, respectively) | $ | 655,010,940 | $ | 699,868,694 | ||||
|
|
|
| |||||
See notes to financial statements.
| AB TAX-MANAGED WEALTH STRATEGIES • | 89 |
Statement of Changes in Net Assets
| AB Tax-Managed Balanced Wealth Strategy | ||||||||
| Six Months Ended February 29, 2016 (unaudited) | Year Ended August 31, 2015 | |||||||
| Increase (Decrease) in Net Assets from Operations | ||||||||
Net investment income | $ | 1,142,148 | $ | 2,112,961 | ||||
Net realized gain (loss) on affiliated Underlying Portfolios | (22,647 | ) | – 0 | – | ||||
Net realized gain on investment transactions and foreign currency transactions | 180,458 | 5,262,281 | ||||||
Net realized gain distributions from Underlying Portfolios | 349,339 | 452,681 | ||||||
Net change in unrealized appreciation/depreciation of investments and foreign currency denominated assets and liabilities | (3,615,463 | ) | (11,402,988 | ) | ||||
|
|
|
| |||||
Net decrease in net assets from operations | (1,966,165 | ) | (3,575,065 | ) | ||||
| Dividends and Distributions to Shareholders from | ||||||||
Net investment income | ||||||||
Class A | (1,242,662 | ) | (394,952 | ) | ||||
Class B | (3,540 | ) | – 0 | – | ||||
Class C | (208,427 | ) | (25,988 | ) | ||||
Advisor Class | (715,637 | ) | (239,626 | ) | ||||
Net realized gain on investment transactions | ||||||||
Class A | (2,596,598 | ) | (2,919,890 | ) | ||||
Class B | (68,008 | ) | (120,811 | ) | ||||
Class C | (891,518 | ) | (957,457 | ) | ||||
Advisor Class | (1,269,237 | ) | (1,313,966 | ) | ||||
| Transactions in Shares of Beneficial Interest | ||||||||
Net decrease | (472,977 | ) | (11,942,619 | ) | ||||
|
|
|
| |||||
Total decrease | (9,434,769 | ) | (21,490,374 | ) | ||||
| Net Assets | ||||||||
Beginning of period | 149,657,689 | 171,148,063 | ||||||
|
|
|
| |||||
End of period (including undistributed net investment income of $1,113,100 and $2,141,218, respectively) | $ | 140,222,920 | $ | 149,657,689 | ||||
|
|
|
| |||||
See notes to financial statements.
| 90 | • AB TAX-MANAGED WEALTH STRATEGIES |
Statement of Changes in Net Assets
| AB Tax-Managed Conservative Wealth Strategy | ||||||||
| Six Months Ended February 29, 2016 (unaudited) | Year Ended August 31, 2015 | |||||||
| Increase (Decrease) in Net Assets from Operations | ||||||||
Net investment income | $ | 279,150 | $ | 520,940 | ||||
Net realized gain (loss) on affiliated Underlying Portfolios | 8,147 | – 0 | – | |||||
Net realized gain on investment transactions and foreign currency transactions | 193,036 | 1,193,423 | ||||||
Net realized gain distributions from Underlying Portfolios | 97,226 | 126,651 | ||||||
Net change in unrealized appreciation/depreciation of investments and foreign currency denominated assets and liabilities | (987,566 | ) | (2,749,413 | ) | ||||
|
|
|
| |||||
Net decrease in net assets from operations | (410,007 | ) | (908,399 | ) | ||||
| Dividends and Distributions to Shareholders from | ||||||||
Net investment income | ||||||||
Class A | (568,355 | ) | (131,571 | ) | ||||
Class B | (3,703 | ) | – 0 | – | ||||
Class C | (125,362 | ) | (2,881 | ) | ||||
Advisor Class | (82,584 | ) | (25,574 | ) | ||||
Net realized gain on investment transactions | ||||||||
Class A | (841,123 | ) | (1,158,534 | ) | ||||
Class B | (17,920 | ) | (35,959 | ) | ||||
Class C | (326,003 | ) | (453,614 | ) | ||||
Advisor Class | (104,969 | ) | (162,353 | ) | ||||
| Transactions in Shares of Beneficial Interest | ||||||||
Net decrease | (1,706,417 | ) | (6,086,556 | ) | ||||
|
|
|
| |||||
Total decrease | (4,186,443 | ) | (8,965,441 | ) | ||||
| Net Assets | ||||||||
Beginning of period | 48,893,573 | 57,859,014 | ||||||
|
|
|
| |||||
End of period (including undistributed net investment income of $17,517 and $518,371, respectively) | $ | 44,707,130 | $ | 48,893,573 | ||||
|
|
|
| |||||
See notes to financial statements.
| AB TAX-MANAGED WEALTH STRATEGIES • | 91 |
Statement of Changes in Net Assets
NOTES TO FINANCIAL STATEMENTS
February 29, 2016 (unaudited)
NOTE A
Significant Accounting Policies
The AB Portfolios (the “Trust”) was organized as a Massachusetts Business Trust on March 26, 1987 and is registered under the Investment Company Act of 1940 as a diversified, open end management investment company. The Trust operates as a series company currently comprised of seven series: AB Growth Fund, AB Wealth Appreciation Strategy, AB Balanced Wealth Strategy, AB Conservative Wealth Strategy, AB Tax-Managed Wealth Appreciation Strategy, AB Tax-Managed Balanced Wealth Strategy and AB Tax-Managed Conservative Wealth Strategy. Each series is considered to be a separate entity for financial reporting and tax purposes. This report relates only to AB Tax-Managed Wealth Appreciation Strategy, AB Tax-Managed Balanced Wealth Strategy and AB Tax-Managed Conservative Wealth Strategy (the “Strategies”). The Strategies offer Class A, Class B, Class C and Advisor Class shares. Class A shares are sold with a front-end sales charge of up to 4.25% for purchases not exceeding $1,000,000. With respect to purchases of $1,000,000 or more, Class A shares redeemed within one year of purchase may be subject to a contingent deferred sales charge of 1%. Class B shares are currently sold with a contingent deferred sales charge which declines from 4% to zero depending on the period of time the shares are held. Effective January 31, 2009, sales of Class B shares of the Strategies to new investors were suspended. Class B shares will only be issued (i) upon the exchange of Class B shares from another AB Mutual Fund, (ii) for purposes of dividend reinvestment, (iii) through the Strategies’ Automatic Investment Program (the “Program”) for accounts that established the Program prior to January 31, 2009, and (iv) for purchases of additional shares by Class B shareholders as of January 31, 2009. The ability to establish a new Program for accounts containing Class B shares was suspended as of January 31, 2009. Class B shares will automatically convert to Class A shares eight years after the end of the calendar month of purchase. Class C shares are subject to a contingent deferred sales charge of 1% on redemptions made within the first year after purchase. Advisor Class shares are sold without any initial or contingent deferred sales charge and are not subject to ongoing distribution expenses. All four classes of shares have identical voting, dividend, liquidation and other rights, except that the classes bear different distribution and transfer agency expenses. Each class has exclusive voting rights with respect to its distribution plan. The financial statements have been prepared in conformity with U.S. generally accepted accounting principles (“U.S. GAAP”) which require management to make certain estimates and assumptions that affect the reported amounts of assets and liabilities in the financial statements and amounts of income and expenses during the reporting period. Actual results could differ from those estimates. The Trust is an investment company under U.S. GAAP and follows the accounting and reporting guidance applicable to investment companies. The following is a summary of significant accounting policies followed by the Strategies.
| 92 | • AB TAX-MANAGED WEALTH STRATEGIES |
Notes to Financial Statements
1. Security Valuation
Portfolio securities are valued at their current market value determined on the basis of market quotations or, if market quotations are not readily available or are deemed unreliable, at “fair value” as determined in accordance with procedures established by and under the general supervision of the Trust’s Board of Trustees (the “Board”).
In general, the market values of securities which are readily available and deemed reliable are determined as follows: securities listed on a national securities exchange (other than securities listed on the NASDAQ Stock Market, Inc. (“NASDAQ”)) or on a foreign securities exchange are valued at the last sale price at the close of the exchange or foreign securities exchange. If there has been no sale on such day, the securities are valued at the last traded price from the previous day. Securities listed on more than one exchange are valued by reference to the principal exchange on which the securities are traded; securities listed only on NASDAQ are valued in accordance with the NASDAQ Official Closing Price; listed or over the counter (“OTC”) market put or call options are valued at the mid level between the current bid and ask prices. If either a current bid or current ask price is unavailable, AllianceBernstein L.P. (the “Adviser”) will have discretion to determine the best valuation (e.g. last trade price in the case of listed options); open futures are valued using the closing settlement price or, in the absence of such a price, the most recent quoted bid price. If there are no quotations available for the day of valuation, the last available closing settlement price is used; U.S. Government securities and any other debt instruments having 60 days or less remaining until maturity are generally valued at market by an independent pricing vendor, if a market price is available. If a market price is not available, the securities are valued at amortized cost. This methodology is commonly used for short term securities that have an original maturity of 60 days or less, as well as short term securities that had an original term to maturity that exceeded 60 days. In instances when amortized cost is utilized, the Valuation Committee (the “Committee”) must reasonably conclude that the utilization of amortized cost is approximately the same as the fair value of the security. Such factors the Committee will consider include, but are not limited to, an impairment of the creditworthiness of the issuer or material changes in interest rates. Fixed-income securities, including mortgage-backed and asset-backed securities, may be valued on the basis of prices provided by a pricing service or at a price obtained from one or more of the major broker-dealers. In cases where broker-dealer quotes are obtained, the Adviser may establish procedures whereby changes in market yields or spreads are used to adjust, on a daily basis, a recently obtained quoted price on a security. Swaps and other derivatives are valued daily, primarily using independent pricing services, independent pricing models using market inputs, as well as third party broker-dealers or counterparties. Investment companies are valued at their net asset value each day.
Securities for which market quotations are not readily available (including restricted securities) or are deemed unreliable are valued at fair value. Factors
| AB TAX-MANAGED WEALTH STRATEGIES • | 93 |
Notes to Financial Statements
considered in making this determination may include, but are not limited to, information obtained by contacting the issuer, analysts, analysis of the issuer’s financial statements or other available documents. In addition, the Strategies may use fair value pricing for securities primarily traded in non-U.S. markets because most foreign markets close well before the Strategies value their securities at 4:00 p.m., Eastern Time. The earlier close of these foreign markets gives rise to the possibility that significant events, including broad market moves, may have occurred in the interim and may materially affect the value of those securities. To account for this, the Strategies may frequently value many of its foreign equity securities using fair value prices based on third party vendor modeling tools to the extent available.
2. Fair Value Measurements
In accordance with U.S. GAAP regarding fair value measurements, fair value is defined as the price that the Strategies would receive to sell an asset or pay to transfer a liability in an orderly transaction between market participants at the measurement date. U.S. GAAP establishes a framework for measuring fair value, and a three-level hierarchy for fair value measurements based upon the transparency of inputs to the valuation of an asset or liability (including those valued based on their market value as described in Note A.1 above). Inputs may be observable or unobservable and refer broadly to the assumptions that market participants would use in pricing the asset or liability. Observable inputs reflect the assumptions market participants would use in pricing the asset or liability based on market data obtained from sources independent of the Strategies. Unobservable inputs reflect the Strategies’ own assumptions about the assumptions that market participants would use in pricing the asset or liability based on the best information available in the circumstances. Each investment is assigned a level based upon the observability of the inputs which are significant to the overall valuation. The three-tier hierarchy of inputs is summarized below.
| • | Level 1—quoted prices in active markets for identical investments |
| • | Level 2—other significant observable inputs (including quoted prices for similar investments, interest rates, prepayment speeds, credit risk, etc.) |
| • | Level 3—significant unobservable inputs (including the Strategies’ own assumptions in determining the fair value of investments) |
The fair value of debt instruments, such as bonds, and over-the-counter derivatives is generally based on market price quotations, recently executed market transactions (where observable) or industry recognized modeling techniques and are generally classified as Level 2. Pricing vendor inputs to Level 2 valuations may include quoted prices for similar investments in active markets, interest rate curves, coupon rates, currency rates, yield curves, option adjusted spreads, default rates, credit spreads and other unique security features in order to estimate the relevant cash flows which are then discounted to calculate fair values. If these inputs are unobservable and significant to the fair value, these investments will be classified as Level 3. In addition, non-agency rated investments are classified as Level 3.
| 94 | • AB TAX-MANAGED WEALTH STRATEGIES |
Notes to Financial Statements
Where readily available market prices or relevant bid prices are not available for certain equity investments, such investments may be valued based on similar publicly traded investments, movements in relevant indices since last available prices or based upon underlying company fundamentals and comparable company data (such as multiples to earnings or other multiples to equity). Where an investment is valued using an observable input, such as another publicly traded security, the investment will be classified as Level 2. If management determines that an adjustment is appropriate based on restrictions on resale, illiquidity or uncertainty, and such adjustment is a significant component of the valuation, the investment will be classified as Level 3. An investment will also be classified as Level 3 where management uses company fundamentals and other significant inputs to determine the valuation.
Other fixed income investments, including non-U.S. government and corporate debt, are generally valued using quoted market prices, if available, which are typically impacted by current interest rates, maturity dates and any perceived credit risk of the issuer. Additionally, in the absence of quoted market prices, these inputs are used by pricing vendors to derive a valuation based upon industry or proprietary models which incorporate issuer specific data with relevant yield/spread comparisons with more widely quoted bonds with similar key characteristics. Those investments for which there are observable inputs are classified as Level 2. Where the inputs are not observable, the investments are classified as Level 3.
The following tables summarize the valuation of the Strategies’ investments by the above fair value hierarchy levels as of February 29, 2016:
| AB Tax-Managed Wealth Appreciation Strategy | ||||||||||||||||
| Investments in Securities: | Level 1 | Level 2 | Level 3 | Total | ||||||||||||
Assets: |
| |||||||||||||||
Common Stocks: | ||||||||||||||||
Information Technology | $ | 73,698,971 | $ | 21,208,135 | $ | – 0 | – | $ | 94,907,106 | |||||||
Financials | 43,001,387 | 40,894,490 | – 0 | – | 83,895,877 | |||||||||||
Consumer Discretionary | 55,711,443 | 21,216,606 | – 0 | – | 76,928,049 | |||||||||||
Health Care | 48,611,725 | 16,338,652 | – 0 | – | 64,950,377 | |||||||||||
Industrials | 21,678,663 | 24,112,280 | – 0 | – | 45,790,943 | |||||||||||
Consumer Staples | 21,979,418 | 12,342,380 | – 0 | – | 34,321,798 | |||||||||||
Energy | 14,459,823 | 6,568,528 | – 0 | – | 21,028,351 | |||||||||||
Utilities | 11,446,830 | 4,024,146 | – 0 | – | 15,470,976 | |||||||||||
Materials | 6,709,042 | 8,140,471 | – 0 | – | 14,849,513 | |||||||||||
Telecommunication Services | 3,360,286 | 7,981,230 | – 0 | – | 11,341,516 | |||||||||||
Investment Companies | 180,292,171 | – 0 | – | – 0 | – | 180,292,171 | ||||||||||
Short-Term Investments | 9,306,540 | – 0 | – | – 0 | – | 9,306,540 | ||||||||||
|
|
|
|
|
|
|
| |||||||||
Total Investments in Securities | 490,256,299 | 162,826,918 | – 0 | – | 653,083,217 | |||||||||||
| AB TAX-MANAGED WEALTH STRATEGIES • | 95 |
Notes to Financial Statements
| Investments in Securities: | Level 1 | Level 2 | Level 3 | Total | ||||||||||||
Other Financial Instruments*: | ||||||||||||||||
Assets: | ||||||||||||||||
Forward Currency Exchange Contracts | $ | – 0 | – | $ | 902,889 | $ | – 0 | – | $ | 902,889 | ||||||
Liabilities: | ||||||||||||||||
Futures | – 0 | – | (32,752 | ) | – 0 | – | (32,752 | )# | ||||||||
Forward Currency Exchange Contracts | – 0 | – | (605,405 | ) | – 0 | – | (605,405 | ) | ||||||||
|
|
|
|
|
|
|
| |||||||||
Total^ | $ | 490,256,299 | $ | 163,091,650 | $ | – 0 | – | $ | 653,347,949 | |||||||
|
|
|
|
|
|
|
| |||||||||
| AB Tax-Managed Balanced Wealth Strategy | ||||||||||||||||
| Investments in Securities: | Level 1 | Level 2 | Level 3 | Total | ||||||||||||
Assets: |
| |||||||||||||||
Municipal Obligations | $ | – 0 | – | $ | 74,401,228 | $ | 733,484 | $ | 75,134,712 | |||||||
Common Stock: | ||||||||||||||||
Information Technology | 6,064,006 | 1,731,890 | – 0 | – | 7,795,896 | |||||||||||
Financials | 3,622,417 | 3,277,955 | – 0 | – | 6,900,372 | |||||||||||
Consumer Discretionary | 4,586,467 | 1,679,653 | – 0 | – | 6,266,120 | |||||||||||
Health Care | 3,940,725 | 1,311,128 | – 0 | – | 5,251,853 | |||||||||||
Industrials | 1,728,321 | 1,970,110 | – 0 | – | 3,698,431 | |||||||||||
Consumer Staples | 1,801,852 | 956,710 | – 0 | – | 2,758,562 | |||||||||||
Energy | 1,145,226 | 544,874 | – 0 | – | 1,690,100 | |||||||||||
Utilities | 998,900 | 317,287 | – 0 | – | 1,316,187 | |||||||||||
Materials | 542,028 | 619,642 | – 0 | – | 1,161,670 | |||||||||||
Telecommunication Services | 271,329 | 639,109 | – 0 | – | 910,438 | |||||||||||
Investment Companies | 26,861,894 | – 0 | – | – 0 | – | 26,861,894 | ||||||||||
Short-Term Investments | 721,587 | – 0 | – | – 0 | – | 721,587 | ||||||||||
|
|
|
|
|
|
|
| |||||||||
Total Investments in Securities | 52,284,752 | 87,449,586 | 733,484 | 140,467,822 | ||||||||||||
Other Financial Instruments*: | ||||||||||||||||
Assets: | ||||||||||||||||
Forward Currency Exchange Contracts | – 0 | – | 79,023 | – 0 | – | 79,023 | ||||||||||
Inflation (CPI) Swaps | – 0 | – | 10,369 | – 0 | – | 10,369 | ||||||||||
| 96 | • AB TAX-MANAGED WEALTH STRATEGIES |
Notes to Financial Statements
| Investments in Securities: | Level 1 | Level 2 | Level 3 | Total | ||||||||||||
Liabilities: | ||||||||||||||||
Futures | $ | – 0 | – | $ | (2,068 | ) | $ | – 0 | – | $ | (2,068 | )# | ||||
Forward Currency Exchange Contracts | – 0 | – | (52,718 | ) | – 0 | – | (52,718 | ) | ||||||||
Inflation (CPI) Swaps | – 0 | – | (1,022,356 | ) | – 0 | – | (1,022,356 | ) | ||||||||
Interest Rate Swaps | – 0 | – | (37,516 | ) | – 0 | – | (37,516 | ) | ||||||||
|
|
|
|
|
|
|
| |||||||||
Total^ | $ | 52,284,752 | $ | 86,424,320 | $ | 733,484 | $ | 139,442,556 | ||||||||
|
|
|
|
|
|
|
| |||||||||
| AB Tax-Managed Conservative Wealth Strategy | ||||||||||||||||
| Investments in Securities: | Level 1 | Level 2 | Level 3 | Total | ||||||||||||
Assets: | ||||||||||||||||
Municipal Obligations | $ | – 0 | – | $ | 30,127,396 | $ | – 0 | – | $ | 30,127,396 | ||||||
Common Stocks: | ||||||||||||||||
Information Technology | 1,264,717 | 366,654 | – 0 | – | 1,631,371 | |||||||||||
Financials | 747,420 | 693,338 | – 0 | – | 1,440,758 | |||||||||||
Consumer Discretionary | 949,882 | 365,220 | – 0 | – | 1,315,102 | |||||||||||
Health Care | 814,996 | 282,447 | – 0 | – | 1,097,443 | |||||||||||
Industrials | 378,291 | 448,199 | – 0 | – | 826,490 | |||||||||||
Consumer Staples | 369,316 | 209,880 | – 0 | – | 579,196 | |||||||||||
Energy | 234,074 | 123,088 | – 0 | – | 357,162 | |||||||||||
Utilities | 203,270 | 67,566 | – 0 | – | 270,836 | |||||||||||
Materials | 119,101 | 139,349 | – 0 | – | 258,450 | |||||||||||
Telecommunication Services | 57,931 | 136,821 | – 0 | – | 194,752 | |||||||||||
Investment Companies | 6,259,027 | – 0 | – | – 0 | – | 6,259,027 | ||||||||||
Short-Term Investments | 381,411 | – 0 | – | – 0 | – | 381,411 | ||||||||||
|
|
|
|
|
|
|
| |||||||||
Total Investments in Securities | 11,779,436 | 32,959,958 | – 0 | – | 44,739,394 | |||||||||||
Other Financial Instruments*: | ||||||||||||||||
Assets: | ||||||||||||||||
Futures | – 0 | – | 781 | – 0 | – | 781 | # | |||||||||
Forward Currency Exchange Contracts | – 0 | – | 16,914 | – 0 | – | 16,914 | ||||||||||
Centrally Cleared Credit Default Swaps | – 0 | – | 154 | – 0 | – | 154 | # | |||||||||
Centrally Cleared Interest Rate Swaps | – 0 | – | 276 | – 0 | – | 276 | # | |||||||||
Inflation (CPI) Swaps | – 0 | – | 3,703 | – 0 | – | 3,703 | ||||||||||
| AB TAX-MANAGED WEALTH STRATEGIES • | 97 |
Notes to Financial Statements
| Investments in Securities: | Level 1 | Level 2 | Level 3 | Total | ||||||||||||
Liabilities: | ||||||||||||||||
Forward Currency Exchange Contracts | $ | – 0 | – | $ | (11,513 | ) | $ | – 0 | – | $ | (11,513 | ) | ||||
Inflation (CPI) Swaps | – 0 | – | (306,294 | ) | – 0 | – | (306,294 | ) | ||||||||
Interest Rate Swaps | – 0 | – | (562 | ) | – 0 | – | (562 | ) | ||||||||
|
|
|
|
|
|
|
| |||||||||
Total^ | $ | 11,779,436 | $ | 32,663,417 | $ | – 0 | – | $ | 44,442,853 | |||||||
|
|
|
|
|
|
|
| |||||||||
| * | Other financial instruments are derivative instruments, such as futures, forwards and swaps, which are valued at the unrealized appreciation/depreciation on the instrument. |
| # | Only variation margin receivable/payable at period end is reported within the statement of assets and liabilities. This amount reflects cumulative appreciation/(depreciation) of exchange-traded derivatives as reported in the portfolio of investments. |
| ^ | There were de minimis transfers under 1% of net assets between Level 1 and Level 2 during the reporting period. |
The Strategies recognize all transfers between levels of the fair value hierarchy assuming the financial instruments were transferred at the beginning of the reporting period.
The following is a reconciliation of investments in which significant unobservable inputs (Level 3) were used in determining fair value.
AB Tax-Managed Balanced Wealth Strategy | Municipal Obligations | Total | ||||||
Balance as of 8/31/15 | $ | 1,130,576 | $ | 1,130,576 | ||||
Accrued discounts/(premiums) | 390 | 390 | ||||||
Realized gain (loss) | (147,810 | ) | (147,810 | ) | ||||
Change in unrealized appreciation/depreciation | 161,728 | 161,728 | ||||||
Purchases | – 0 | – | – 0 | – | ||||
Sales | (411,400 | ) | (411,400 | ) | ||||
Transfers in to Level 3 | – 0 | – | – 0 | – | ||||
Transfers out of Level 3 | – 0 | – | – 0 | – | ||||
|
|
|
| |||||
Balance as of 2/29/16 | $ | 733,484 | $ | 733,484 | ||||
|
|
|
| |||||
Net change in unrealized appreciation/depreciation from investments held as of 2/29/16* | $ | (7,376 | ) | $ | (7,376 | ) | ||
|
|
|
| |||||
| * | The unrealized appreciation/depreciation is included in net change in unrealized appreciation/depreciation on investments and other financial instruments in the accompanying statement of operations. |
The Adviser established the Committee to oversee the pricing and valuation of all securities held in the Strategies. The Committee operates under pricing and valuation policies and procedures established by the Adviser and approved by the Board, including pricing policies which set forth the mechanisms and processes to be employed on a daily basis to implement these policies and procedures. In
| 98 | • AB TAX-MANAGED WEALTH STRATEGIES |
Notes to Financial Statements
particular, the pricing policies describe how to determine market quotations for securities and other instruments. The Committee’s responsibilities include: 1) fair value and liquidity determinations (and oversight of any third parties to whom any responsibility for fair value and liquidity determinations is delegated), and 2) regular monitoring of the Adviser’s pricing and valuation policies and procedures and modification or enhancement of these policies and procedures (or recommendation of the modification of these policies and procedures) as the Committee believes appropriate.
The Committee is also responsible for monitoring the implementation of the pricing policies by the Adviser’s Pricing Group (the “Pricing Group”) and a third party which performs certain pricing functions in accordance with the pricing policies. The Pricing Group is responsible for the oversight of the third party on a day-to-day basis. The Committee and the Pricing Group perform a series of activities to provide reasonable assurance of the accuracy of prices including: 1) periodic vendor due diligence meetings, review of methodologies, new developments and processes at vendors, 2) daily comparison of security valuation versus prior day for all securities that exceeded established thresholds, and 3) daily review of unpriced, stale, and variance reports with exceptions reviewed by senior management and the Committee.
In addition, several processes outside of the pricing process are used to monitor valuation issues including: 1) performance and performance attribution reports are monitored for anomalous impacts based upon benchmark performance, and 2) portfolio managers review all portfolios for performance and analytics (which are generated using the Adviser’s prices).
3. Currency Translation
Assets and liabilities denominated in foreign currencies and commitments under forward currency exchange contracts are translated into U.S. dollars at the mean of the quoted bid and ask prices of such currencies against the U.S. dollar. Purchases and sales of portfolio securities are translated into U.S. dollars at the rates of exchange prevailing when such securities were acquired or sold. Income and expenses are translated into U.S. dollars at rates of exchange prevailing when accrued.
Net realized gain or loss on foreign currency transactions represents foreign exchange gains and losses from sales and maturities of foreign fixed income investments, foreign currency exchange contracts, holding of foreign currencies, currency gains or losses realized between the trade and settlement dates on foreign investment transactions, and the difference between the amounts of dividends, interest and foreign withholding taxes recorded on the Strategies’ books and the U.S. dollar equivalent amounts actually received or paid. Net unrealized currency gains and losses from valuing foreign currency denominated assets and liabilities at period end exchange rates are reflected as a component of net unrealized appreciation or depreciation of foreign currency denominated assets and liabilities.
| AB TAX-MANAGED WEALTH STRATEGIES • | 99 |
Notes to Financial Statements
4. Taxes
It is each Strategy’s policy to meet the requirements of the Internal Revenue Code applicable to regulated investment companies and to distribute all of its investment company taxable income and net realized gains, if any, to shareholders. Therefore, no provisions for federal income or excise taxes are required. The Strategies may be subject to taxes imposed by countries in which they invest. Such taxes are generally based on income and/or capital gains earned or repatriated. Taxes are accrued and applied to net investment income, net realized gains and net unrealized appreciation/depreciation as such income and/or gains are earned.
In accordance with U.S. GAAP requirements regarding accounting for uncertainties in income taxes, management has analyzed the Strategies’ tax positions taken or expected to be taken on federal and state income tax returns for all open tax years (the current and the prior three tax years) and has concluded that no provision for income tax is required in the Strategies’ financial statements.
5. Investment Income and Investment Transactions
Dividend income is recorded on the ex-dividend date or as soon as the Strategies are informed of the dividend. Interest income is accrued daily. Investment transactions are accounted for on the date the securities are purchased or sold. Investment gains or losses are determined on the identified cost basis. The Strategies amortize premiums and accrete discounts as adjustments to interest income.
6. Class Allocations
All income earned and expenses incurred by the Strategies are borne on a pro-rata basis by each outstanding class of shares, based on the proportionate interest in the Strategy represented by the net assets of such class, except for class specific expenses which are allocated to the respective class. Expenses of the Trust are charged proportionately to each Strategy or based on other appropriate methods. Realized and unrealized gains and losses are allocated among the various share classes based on respective net assets.
7. Dividends and Distributions
Dividends and distributions to shareholders, if any, are recorded on the ex-dividend date. Income dividends and capital gains distributions are determined in accordance with federal tax regulations and may differ from those determined in accordance with U.S. GAAP. To the extent these differences are permanent, such amounts are reclassified within the capital accounts based on their federal tax basis treatment; temporary differences do not require such reclassification.
| 100 | • AB TAX-MANAGED WEALTH STRATEGIES |
Notes to Financial Statements
NOTE B
Advisory Fee and Other Transactions with Affiliates
Under the terms of the investment advisory agreement, the Strategies pay the Adviser at the annual rates as follows:
| Average Daily Net Assets | ||||||||||||
| AB Tax-Managed Strategy | First $2.5 Billion | Next $2.5 Billion | In Excess of $5 Billion | |||||||||
Wealth Appreciation | .65 | % | .55 | % | .50 | % | ||||||
Balanced Wealth | .55 | % | .45 | % | .40 | % | ||||||
Conservative Wealth | .55 | % | .45 | % | .40 | % | ||||||
Such fees are accrued daily and paid monthly.
The Adviser has agreed to waive its fees and bear certain expenses to the extent necessary to limit total operating expenses, inclusive of implied acquired fund fees and expenses relating to AB Multi-Manager Alternative Strategies Fund (“MMAS”), AB Pooling Portfolio—Volatility Management Portfolio (“PPVM”) and AB Pooling Portfolio—Multi-Asset Real Return Portfolio (“PPMRR”) on an annual basis as follows:
| Prior to December 31, 2015 | ||||||||||||||||
| AB Tax-Managed Strategy | Class A | Class B | Class C | Advisor Class | ||||||||||||
Conservative Wealth | 1.20 | % | 1.90 | % | 1.90 | % | .90 | % | ||||||||
| Effective December 31, 2015 | ||||||||||||||||
| AB Tax-Managed Strategy | Class A | Class B | Class C | Advisor Class | ||||||||||||
Conservative Wealth | 1.15 | % | 1.90 | % | 1.90 | % | .90 | % | ||||||||
For the six months ended February 29, 2016, such waiver/reimbursement amounted to $159,662 for the AB Tax-Managed Conservative Wealth Strategy. This agreement will remain in effect until December 31, 2016 and then may be extended by the Adviser for additional one-year terms. In addition, the Adviser has agreed to waive/reimburse additional fees and expenses, as discussed on the following page.
Effective January 1, 2015, AB Wealth Appreciation Strategy may reimburse the Adviser for certain legal and accounting services provided to Strategy by the Adviser. For the six months ended February 29, 2016, the reimbursement for such services amounted to $19,866.
The Strategies compensate AllianceBernstein Investor Services, Inc. (“ABIS”), a wholly-owned subsidiary of the Adviser, under a Transfer Agency Agreement for providing personnel and facilities to perform transfer agency services for the Strategies. ABIS may make payments to intermediaries that provide omnibus account services, sub-accounting services and/or networking services. Such compensation retained by ABIS amounted to $54,168, $30,356 and $10,679 for the AB Tax-Managed Wealth Appreciation Strategy, AB Tax-Managed
| AB TAX-MANAGED WEALTH STRATEGIES • | 101 |
Notes to Financial Statements
Balanced Wealth Strategy and AB Tax-Managed Conservative Wealth Strategy, respectively, for the six months ended February 29, 2016.
The Strategies may invest in the AB Fixed-Income Shares, Inc.—Government STIF Portfolio (“Government STIF Portfolio”), an open-end management investment company managed by the Adviser. The Government STIF Portfolio is offered as a cash management option to mutual funds and other institutional accounts of the Adviser, and is not currently available for direct purchase by members of the public. The Government STIF Portfolio currently pays no investment management fees but does bear its own expenses. A summary of the Strategies’ transactions in shares of the Government STIF Portfolio for the six months ended February 29, 2016 is as follows:
| AB Tax- Managed Strategy | Market Value August 31, 2015 (000) | Purchases at Cost (000) | Sales Proceeds (000) | Market Value February 29, 2016 (000) | Dividend Income (000) | |||||||||||||||
Wealth Appreciation | $ | 12,755 | $ | 66,716 | $ | 70,164 | $ | 9,307 | $ | 10 | ||||||||||
Balanced Wealth | 2,220 | 14,700 | 16,198 | 722 | 1 | |||||||||||||||
Conservative Wealth | 732 | 7,990 | 8,341 | 381 | 1 | |||||||||||||||
The Strategies may invest in MMAS, PPVM and PPMRR, open-end management investment companies managed by the Adviser. In connection with AB Tax-Managed Wealth Appreciation Strategy’s and AB Tax Managed Balanced Wealth Strategy’s investments in MMAS, the Adviser has contractually agreed to (i) waive the portion of its advisory fee attributable to its services after paying sub-advisory fees to sub-advisors and (ii) waive an additional portion of the advisory fee in an amount equal to, or reimburse the Strategy for, the total other expenses of MMAS (excluding interest and short sales expenses), in each case as paid by a Strategy as an acquired fund fee and expense. The fee waiver will remain in effect until December 31, 2016. For the six months ended February 29, 2016, the advisory fees paid were reduced by $273,689 and $41,382 for the AB Tax-Managed Wealth Appreciation Strategy and AB Tax-Managed Balanced Wealth Strategy, respectively.
A summary of the Strategies’ transactions in such holdings for the six months ended February 29, 2016 is as follows:
| AB Multi-Manager Alternative Strategies Fund | ||||||||||||||||||||||||||||||||
| Distributions | ||||||||||||||||||||||||||||||||
AB Tax-Managed | Market Value 08/31/15 (000) | Purchases at Cost (000) | Sales Proceeds (000) | Realized Gain (Loss) (000) | Change in Unrealized Appr./(Depr.) (000) | Market Value 02/29/16 (000) | Income (000) | Realized Gains (000) | ||||||||||||||||||||||||
Wealth Appreciation | $ | 57,377 | $ | 6,497 | $ | 9,099 | $ | (152 | ) | $ | (2,214 | ) | $ | 52,409 | $ | 414 | $ | – 0 | – | |||||||||||||
Balanced Wealth | 8,495 | 420 | 501 | (10 | ) | (342 | ) | 8,062 | 60 | – 0 | – | |||||||||||||||||||||
Conservative Wealth | 1,977 | 16 | 131 | – 0 | –* | (76 | ) | 1,786 | 14 | – 0 | – | |||||||||||||||||||||
| 102 | • AB TAX-MANAGED WEALTH STRATEGIES |
Notes to Financial Statements
| AB Pooling Portfolio—Volatility Management Portfolio | ||||||||||||||||||||||||||||||||
| Distributions | ||||||||||||||||||||||||||||||||
AB Tax-Managed | Market Value 08/31/15 (000) | Purchases at Cost (000) | Sales Proceeds (000) | Realized Gain (Loss) (000) | Change in Unrealized Appr./(Depr.) (000) | Market Value 02/29/16 (000) | Income (000) | Realized Gains (000) | ||||||||||||||||||||||||
Wealth Appreciation | $ | 103,722 | $ | 9,131 | $ | 2,457 | $ | (87 | ) | $ | (12,228 | ) | $ | 98,081 | $ | 3,263 | $ | 2,491 | ||||||||||||||
Balanced Wealth | 14,916 | 2,425 | 793 | 29 | (1,766 | ) | 14,811 | 582 | 225 | |||||||||||||||||||||||
Conservative Wealth | 4,243 | 568 | 300 | 8 | (480 | ) | 4,039 | 127 | 97 | |||||||||||||||||||||||
| AB Pooling Portfolio—Multi-Asset Real Return Portfolio | ||||||||||||||||||||||||||||||||
| Distributions | ||||||||||||||||||||||||||||||||
AB Tax-Managed Strategy | Market Value 08/31/15 (000) | Purchases at Cost (000) | Sales Proceeds (000) | Realized Gain (Loss) (000) | Change in Unrealized Appr./(Depr.) (000) | Market Value 02/29/16 (000) | Income (000) | Realized Gains (000) | ||||||||||||||||||||||||
Wealth Appreciation | $ | 31,987 | $ | 5,079 | $ | 2,454 | $ | (532 | ) | $ | (4,278 | ) | $ | 29,802 | $ | 1,025 | $ | – 0 | – | |||||||||||||
Balanced Wealth | 4,187 | 519 | 78 | (41 | ) | (598 | ) | 3,989 | 133 | – 0 | – | |||||||||||||||||||||
Conservative Wealth | 464 | 51 | 10 | – 0 | –* | (70 | ) | 435 | 15 | – 0 | – | |||||||||||||||||||||
| * | Amount is less than $500. |
AllianceBernstein Investments, Inc. (the “Distributor”), a wholly-owned subsidiary of the Adviser, serves as the distributor of the Strategies’ shares. The Distributor has advised the Strategies that it has retained front-end sales charges from the sale of Class A shares and received contingent deferred sales charges imposed upon redemptions by shareholders of Class A, Class B and Class C shares for each Strategy for the six months ended February 29, 2016 as follows:
| Front-End Sales Charges | Contingent Deferred Sales Charges | |||||||||||||||
| AB Tax-Managed Strategies | Class A | Class A | Class B | Class C | ||||||||||||
Wealth Appreciation | $ | 1,211 | $ | – 0 | – | $ | – 0 | – | $ | 293 | ||||||
Balanced Wealth | 543 | 40 | 145 | 541 | ||||||||||||
Conservative Wealth | 231 | 24 | 65 | – 0 | – | |||||||||||
Brokerage commissions paid on investment transactions for the six months ended February 29, 2016 amounted to $207,720, $15,417 and $3,429 for the AB Tax-Managed Wealth Appreciation Strategy, AB Tax-Managed Balanced Wealth Strategy and AB Tax-Managed Conservative Wealth Strategy, respectively, of which $13 and $0; $1 and $0; and $0 and $0 were paid, respectively, to Sanford C. Bernstein & Co. LLC and Sanford C. Bernstein Limited, affiliates of the Adviser.
NOTE C
Distribution Plans
The Strategies have adopted a plan for each class of shares of the Strategies pursuant to Rule 12b-1 under the Investment Company Act of 1940 (each a “Plan”
| AB TAX-MANAGED WEALTH STRATEGIES • | 103 |
Notes to Financial Statements
and collectively the “Plans”). Under the Plans, the Strategies pay distribution and servicing fees to the Distributor at an annual rate of up to .50% of the Strategies’ average daily net assets attributable to Class A shares and 1% of the Strategies’ average daily net assets attributable to both Class B and Class C shares. There are no distribution and servicing fees on the Advisor Class shares. The fees are accrued daily and paid monthly. Effective August 1, 2014, payments under the Class A Plan for AB Tax-Managed Wealth Appreciation Strategy and AB Tax-Managed Balanced Wealth Strategy are limited to an annual rate of .25% of Class A shares’ average daily net assets. Prior to August 1, 2014, payments under Class A Plan for AB Tax-Managed Wealth Appreciation Strategy and AB Tax-Managed Balanced Wealth Strategy were limited to an annual rate of .30% of Class A shares’ average daily net assets. Effective December 31, 2015, payments under the Class A Plan for Tax-Managed Conservative Wealth Strategy are limited to an annual rate of .25% of Class A shares’ average daily net assets. Prior to December 31, 2015, payments under the Class A Plan for AB Tax-Managed Conservative Wealth Strategy were limited to .30% of Class A shares’ average daily net assets. The Plans provide that the Distributor will use such payments in their entirety for distribution assistance and promotional activities. The Strategies are not obligated under the Plans to pay any distribution services fee in excess of the amounts set forth above. The purpose of the payments to the Distributor under the Plans is to compensate the Distributor for its distribution services with respect to the sale of the Strategies’ shares. Since the Distributor’s compensation is not directly tied to its expenses, the amount of compensation received by it under the Plan during any year may be more or less than its actual expenses. For this reason, the Plans are characterized by the staff of the Securities Exchange Commission as being a “compensation” plan.
In the event that a Plan is terminated or not continued, no distribution services fees (other than current amounts accrued but not yet paid) would be owed by the Strategies to the Distributor with respect to the relevant class. The Plans also provide that the Adviser may use its own resources to finance the distribution of the Strategies’ shares.
NOTE D
Investment Transactions
Purchases and sales of investment securities (excluding short-term investments) for the six months ended February 29, 2016, were as follows:
| AB Tax-Managed Strategy | Purchases | Sales | ||||||
Wealth Appreciation | $ | 178,248,528 | $ | 172,090,176 | ||||
Balanced Wealth | 19,509,404 | 22,843,803 | ||||||
Conservative Wealth | 7,479,970 | 10,426,046 | ||||||
There were no investment transactions in U.S. government securities during the six months ended February 29, 2016.
The cost of investments for federal income tax purposes was substantially the same as the cost for financial reporting purposes. Accordingly, gross unrealized
| 104 | • AB TAX-MANAGED WEALTH STRATEGIES |
Notes to Financial Statements
appreciation and unrealized depreciation (excluding futures, foreign currency, written options and swap transactions) are as follows:
| Gross Unrealized | Net Unrealized Appreciation (Depreciation) | |||||||||||
AB Tax-Managed Strategies | Appreciation | (Depreciation) | ||||||||||
Wealth Appreciation | $ | 63,648,690 | $ | (59,458,855 | ) | $ | 4,189,835 | |||||
Balanced Wealth | 9,944,895 | (6,574,315 | ) | 3,370,580 | ||||||||
Conservative Wealth | 2,423,565 | (1,111,413 | ) | 1,312,152 | ||||||||
1. Derivative Financial Instruments
The Strategies may use derivatives in an effort to earn income and enhance returns, to replace more traditional direct investments, to obtain exposure to otherwise inaccessible markets (collectively, “investment purposes”), or to hedge or adjust the risk profile of its portfolio.
The principal types of derivatives utilized by the Strategies, as well as the methods in which they may be used are:
| • | Futures |
The Strategies may buy or sell futures for investment purposes or for the purpose of hedging their portfolios against adverse effects of potential movements in the market. The Strategy bears the market risk that arises from changes in the value of these instruments and the imperfect correlation between movements in the price of the futures and movements in the price of the assets, reference rates or indices which they are designed to track. Among other things, the Strategies may purchase or sell futures for foreign currencies or options thereon for non-hedging purposes as a means of making direct investment in foreign currencies, as described below under “Currency Transactions”.
At the time the Strategy enters into futures, the Strategy deposits and maintains as collateral an initial margin with the broker, as required by the exchange on which the transaction is effected. Such amount is shown as cash collateral due from broker on the statement of assets and liabilities. Pursuant to the contract, the Strategy agrees to receive from or pay to the broker an amount of cash equal to the daily fluctuation in the value of the contract. Such receipts or payments are known as variation margin and are recorded by the Strategy as unrealized gains or losses. Risks may arise from the potential inability of a counterparty to meet the terms of the contract. The credit/counterparty risk for exchange-traded futures is generally less than privately negotiated futures, since the clearinghouse, which is the issuer or counterparty to each exchange-traded future, has robust risk mitigation standards, including the requirement to provide initial and variation margin. When the contract is closed, the Strategy records a realized gain or loss equal to the difference between the value of the contract at the time it was opened and the time it was closed.
| AB TAX-MANAGED WEALTH STRATEGIES • | 105 |
Notes to Financial Statements
Use of long futures subjects the Strategy to risk of loss in excess of the amounts shown on the statement of assets and liabilities, up to the notional value of the futures. Use of short futures subjects the Strategy to unlimited risk of loss. Under some circumstances, futures exchanges may establish daily limits on the amount that the price of futures can vary from the previous day’s settlement price, which could effectively prevent liquidation of unfavorable positions.
During the six months ended February 29, 2016, the Strategies held futures for hedging and non-hedging purposes.
| • | Forward Currency Exchange Contracts |
The Strategies may enter into forward currency exchange contracts in order to hedge their exposure to changes in foreign currency exchange rates on their foreign portfolio holdings, to hedge certain firm purchase and sale commitments denominated in foreign currencies and for non-hedging purposes as a means of making direct investments in foreign currencies, as described below under “Currency Transactions”.
A forward currency exchange contract is a commitment to purchase or sell a foreign currency at a future date at a negotiated forward rate. The gain or loss arising from the difference between the original contract and the closing of such contract would be included in net realized gain or loss on foreign currency transactions. Fluctuations in the value of open forward currency exchange contracts are recorded for financial reporting purposes as unrealized appreciation and/or depreciation by the Strategy. Risks may arise from the potential inability of a counterparty to meet the terms of a contract and from unanticipated movements in the value of a foreign currency relative to the U.S. dollar.
During the six months ended February 29, 2016, the Strategies held forward currency exchange contracts for hedging and non-hedging purposes.
| • | Swaps |
The Strategy may enter into swaps to hedge their exposure to interest rates, credit risk, or currencies. The Strategy may also enter into swaps for non-hedging purposes as a means of gaining market exposures, including by making direct investments in foreign currencies, as described below under “Currency Transactions”. A swap is an agreement that obligates two parties to exchange a series of cash flows at specified intervals based upon or calculated by reference to changes in specified prices or rates for a specified amount of an underlying asset. The payment flows are usually netted against each other, with the difference being paid by one party to the other. In addition, collateral may be pledged or received by the Strategy in accordance with the terms of the respective swaps to provide value and recourse to the Strategy or its counterparties in the event of default, bankruptcy or insolvency by one of the parties to the swap.
| 106 | • AB TAX-MANAGED WEALTH STRATEGIES |
Notes to Financial Statements
Risks may arise as a result of the failure of the counterparty to the swap to comply with the terms of the swap. The loss incurred by the failure of a counterparty is generally limited to the net interim payment to be received by the Strategy, and/or the termination value at the end of the contract. Therefore, the Strategy considers the creditworthiness of each counterparty to a swap in evaluating potential counterparty risk. This risk is mitigated by having a netting arrangement between the Strategy and the counterparty and by the posting of collateral by the counterparty to the Strategy to cover the Strategy’ exposure to the counterparty. Additionally, risks may arise from unanticipated movements in interest rates or in the value of the underlying securities. The Strategy accrues for the interim payments on swaps on a daily basis, with the net amount recorded within unrealized appreciation/depreciation of swaps on the statement of assets and liabilities, where applicable. Once the interim payments are settled in cash, the net amount is recorded as realized gain/(loss) on swaps on the statement of operations, in addition to any realized gain/(loss) recorded upon the termination of swaps. Upfront premiums paid or received are recognized as cost or proceeds on the statement of assets and liabilities and are amortized on a straight line basis over the life of the contract. Amortized upfront premiums are included in net realized gain/(loss) from swaps on the statement of operations. Fluctuations in the value of swaps are recorded as a component of net change in unrealized appreciation/depreciation of swaps on the statement of operations.
Certain standardized swaps, including certain interest rate swaps and credit default swaps, are (or soon will be) subject to mandatory central clearing. Cleared swaps are transacted through futures commission merchants (“FCMs”) that are members of central clearinghouses, with the clearinghouse serving as central counterparty, similar to transactions in futures contracts. Centralized clearing will be required for additional categories of swaps on a phased-in basis based on requirements published by the Securities and Exchange Commission and Commodity Futures Trading Commission.
At the time the Strategy enters into a centrally cleared swap, the Strategy deposits and maintains as collateral an initial margin with the broker, as required by the clearinghouse on which the transaction is effected. Such amount is shown as cash collateral due from broker on the statement of assets and liabilities. Pursuant to the contract, the Strategy agrees to receive from or pay to the broker an amount of cash equal to the daily fluctuation in the value of the contract. Such receipts or payments are known as variation margin and are recorded by the Strategy as unrealized gains or losses. Risks may arise from the potential of a counterparty to meet the terms of the contract. The credit/counterparty risk for centrally cleared swaps is generally less than non-centrally cleared swaps, since the clearinghouse, which is the issuer or counterparty to each centrally cleared
| AB TAX-MANAGED WEALTH STRATEGIES • | 107 |
Notes to Financial Statements
swap, has robust risk mitigation standards, including the requirement to provide initial and variation margin. When the contract is closed, the Strategy records a realized gain or loss equal to the difference between the value of the contract at the time it was opened and the time it was closed.
Interest Rate Swaps:
The Strategy is subject to interest rate risk exposure in the normal course of pursuing its investment objectives. Because the Strategy holds fixed rate bonds, the value of these bonds may decrease if interest rates rise. To help hedge against this risk and to maintain its ability to generate income at prevailing market rates, the Strategy may enter into interest rate swaps. Interest rate swaps are agreements between two parties to exchange cash flows based on a notional amount. The Strategy may elect to pay a fixed rate and receive a floating rate, or, receive a fixed rate and pay a floating rate on a notional amount.
In addition, the Strategy may also enter into interest rate swap transactions to preserve a return or spread on a particular investment or portion of its portfolio, or protecting against an increase in the price of securities the Strategy anticipates purchasing at a later date. Interest rate swaps involve the exchange by a Strategy with another party of their respective commitments to pay or receive interest (e.g., an exchange of floating rate payments for fixed rate payments) computed based on a contractually-based principal (or “notional”) amount. Interest rate swaps are entered into on a net basis (i.e., the two payment streams are netted out, with the Strategy receiving or paying, as the case may be, only the net amount of the two payments).
During the six months ended February 29, 2016, AB Tax-Managed Balanced Wealth Strategy and AB Tax-Managed Conservative Strategy held interest rate swaps for hedging and non-hedging purposes.
Inflation (CPI) Swaps:
Inflation swaps are contracts in which one party agrees to pay the cumulative percentage increase in a price index (the Consumer Price Index with respect to CPI swaps) over the term of the swap (with some lag on the inflation index), and the other pays a compounded fixed rate. Inflation swaps may be used to protect the net asset value, or NAV, of a Strategy against an unexpected change in the rate of inflation measured by an inflation index since the value of these agreements is expected to increase if unexpected inflation increases.
During the six months ended February 29, 2016, the AB Tax-Managed Balanced Wealth Strategy and AB Tax-Managed Conservative Strategy held inflation (CPI) swaps for hedging and non-hedging purposes.
Credit Default Swaps:
The Strategy may enter into credit default swaps, including to manage its exposure to the market or certain sectors of the market, to reduce its risk
| 108 | • AB TAX-MANAGED WEALTH STRATEGIES |
Notes to Financial Statements
exposure to defaults by corporate and sovereign issuers held by the Strategy, or to create exposure to corporate or sovereign issuers to which it is not otherwise exposed. The Strategy may purchase credit protection (“Buy Contract”) or provide credit protection (“Sale Contract”) on the referenced obligation of the credit default swap. During the term of the swap, the Strategy receives/(pays) fixed payments from/(to) the respective counterparty, calculated at the agreed upon rate applied to the notional amount. If the Strategy is a buyer/(seller) of protection and a credit event occurs, as defined under the terms of the swap, the Strategy will either (i) receive from the seller/(pay to the buyer) of protection an amount equal to the notional amount of the swap (the “Maximum Payout Amount”) and deliver/(take delivery of) the referenced obligation or (ii) receive/(pay) a net settlement amount in the form of cash or securities equal to the notional amount of the swap less the recovery value of the referenced obligation.
In certain circumstances Maximum Payout Amounts may be partially offset by recovery values of the respective referenced obligations, upfront premium received upon entering into the agreement, or net amounts received from settlement of buy protection credit default swaps entered into by the Strategy for the same reference obligation with the same counterparty. As of February 29, 2016, the Strategy did not have Buy Contracts outstanding with respect to the same referenced obligation and same counterparty for its Sale Contracts outstanding.
Credit default swaps may involve greater risks than if a Strategy had invested in the referenced obligation directly. Credit default swaps are subject to general market risk, liquidity risk, counterparty risk and credit risk. If the Strategy is a buyer of protection and no credit event occurs, it will lose the payments it made to its counterparty. If the Strategy is a seller of protection and a credit event occurs, the value of the referenced obligation received by the Strategy coupled with the periodic payments previously received, may be less than the Maximum Payout Amount it pays to the buyer, resulting in a net loss to the Strategy.
During the six months ended February 29, 2016, the AB Tax-Managed Conservative Strategy held credit default swaps for hedging and non-hedging purposes.
Implied credit spreads over U.S. Treasuries of comparable maturity utilized in determining the market value of credit default swaps on issuers as of period end are disclosed in the portfolio of investments. The implied spreads serve as an indicator of the current status of the payment/performance risk and typically reflect the likelihood of default by the issuer of the referenced obligation. The implied credit spread of a particular reference obligation also reflects the cost of buying/selling protection and may reflect upfront payments required to be made to enter into the
| AB TAX-MANAGED WEALTH STRATEGIES • | 109 |
Notes to Financial Statements
agreement. Widening credit spreads typically represent a deterioration of the referenced obligation’s credit soundness and greater likelihood of default or other credit event occurring as defined under the terms of the agreement. A credit spread identified as “Defaulted” indicates a credit event has occurred for the referenced obligation.
The Strategy typically enter into International Swaps and Derivatives Association, Inc. Master Agreements (“ISDA Master Agreement”) or similar master agreements (collectively, “Master Agreements”) with its derivative contract counterparties in order to, among other things, reduce its credit risk to counterparties. ISDA Master Agreements include provisions for general obligations, representations, collateral and events of default or termination. Under an ISDA Master Agreement, the Strategy typically may offset with the counterparty certain derivative financial instrument’s payables and/or receivables with collateral held and/or posted and create one single net payment (close-out netting) in the event of default or termination.
Various Master Agreements govern the terms of certain transactions with counterparties, including transactions such as derivative transactions, repurchase and reverse repurchase agreements. These Master Agreements typically attempt to reduce the counterparty risk associated with such transactions by specifying credit protection mechanisms and providing standardization that improves legal certainty. Cross-termination provisions under Master Agreements typically provide that a default in connection with one transaction between the Strategy and a counterparty gives the non-defaulting party the right to terminate any other transactions in place with the defaulting party to create one single net payment due to/due from the defaulting party. In the event of a default by a Master Agreements counterparty, the return of collateral with market value in excess of the Strategy’ net liability, held by the defaulting party, may be delayed or denied.
The Strategy Master Agreements may contain provisions for early termination of OTC derivative transactions in the event the net assets of the Strategy decline below specific levels (“net asset contingent features”). If these levels are triggered, the Strategy counterparty has the right to terminate such transaction and require the Strategy to pay or receive a settlement amount in connection with the terminated transaction. For additional details, please refer to netting arrangements by counterparty tables below.
| 110 | • AB TAX-MANAGED WEALTH STRATEGIES |
Notes to Financial Statements
At February 29, 2016, the Strategy had entered into the following derivatives:
| AB Tax-Managed Wealth Appreciation Strategy | ||||||||||||
Asset Derivatives | Liability Derivatives | |||||||||||
| Derivative Type | Statement of Assets and Liabilities Location | Fair Value | Statement of Assets and Liabilities Location | Fair Value | ||||||||
Equity contracts | Receivable/Payable for variation margin on exchange-traded derivatives | $ | 32,752 | * | ||||||||
Foreign exchange contracts | Unrealized appreciation on forward currency exchange contracts | $ | 902,889 |
| Unrealized depreciation on forward currency exchange contracts |
| 605,405 |
| ||||
|
|
|
| |||||||||
Total | $ | 902,889 | $ | 638,157 | ||||||||
|
|
|
| |||||||||
| * | Only variation margin receivable/payable at period end is reported within the statement of assets and liabilities. This amount reflects cumulative appreciation/(depreciation) of exchange-traded derivatives as reported in the portfolio of investments. |
The effect of derivative instruments on the statement of operations for the six months ended February 29, 2016:
Derivative Type | Location of | Realized Gain or (Loss) on Derivatives | Change in Unrealized Appreciation or (Depreciation) | |||||||
Equity contracts | Net realized gain (loss) on futures; Net change in unrealized appreciation/depreciation of futures | $ | (59,251 | ) | $ | (1,126 | ) | |||
Foreign exchange contracts | Net realized gain (loss) on foreign currency transactions; Net change in unrealized appreciation/depreciation of foreign currency denominated assets and liabilities |
| 354,772 |
|
| 145,962 |
| |||
|
|
|
| |||||||
Total | $ | 295,521 | $ | 144,836 | ||||||
|
|
|
| |||||||
| AB TAX-MANAGED WEALTH STRATEGIES • | 111 |
Notes to Financial Statements
| AB Tax-Managed Balanced Wealth Strategy | ||||||||||||
Asset Derivatives | Liability Derivatives | |||||||||||
| Derivative Type | Statement of Assets and Liabilities Location | Fair Value | Statement of Assets and Liabilities Location | Fair Value | ||||||||
Equity contracts | Receivable/Payable for variation margin on exchange-traded derivatives | $ | 2,068 | * | ||||||||
Foreign exchange contracts | Unrealized appreciation on forward currency exchange contracts | $ | 79,023 |
| Unrealized depreciation on forward currency exchange contracts | | 52,718 | | ||||
Interest rate contracts | Unrealized depreciation on interest rate swaps |
| 37,516 |
| ||||||||
Interest rate contracts | Unrealized appreciation on inflation swaps |
| 10,369 |
| Unrealized depreciation on inflation swaps | | 1,022,356 | | ||||
|
|
|
| |||||||||
Total | $ | 89,392 | $ | 1,114,658 | ||||||||
|
|
|
| |||||||||
| * | Only variation margin receivable/payable at period end is reported within the statement of assets and liabilities. This amount reflects cumulative appreciation/(depreciation) of exchange-traded derivatives as reported in the portfolio of investments. |
The effect of derivative instruments on the statement of operations for the six months ended February 29, 2016:
Derivative Type | Location of | Realized Gain or (Loss) on Derivatives | Change in Unrealized Appreciation or (Depreciation) | |||||||
Equity contracts | Net realized gain (loss) on futures; Net change in unrealized appreciation/depreciation of futures | $ | (1,396 | ) | $ | 22 | ||||
Foreign exchange contracts | Net realized gain (loss) on foreign currency transactions; Net change in unrealized appreciation/depreciation of foreign currency denominated assets and liabilities | 33,336 | 23,673 | |||||||
Interest rate contracts | Net realized gain (loss) on swaps; Net change in unrealized appreciation/depreciation of swaps | (4,729 | ) | (224,570 | ) | |||||
|
|
|
| |||||||
Total | $ | 27,211 | $ | (200,875 | ) | |||||
|
|
|
| |||||||
| 112 | • AB TAX-MANAGED WEALTH STRATEGIES |
Notes to Financial Statements
| AB Tax-Managed Conservative Wealth Strategy | ||||||||||||
Asset Derivatives | Liability Derivatives | |||||||||||
| Derivative Type | Statement of Assets and Liabilities Location | Fair Value | Statement of Assets and Liabilities Location | Fair Value | ||||||||
Interest rate contracts | Receivable/Payable for variation margin on exchange-traded derivatives | $ | 276 | * | ||||||||
Credit contracts | Receivable/Payable for variation margin on exchange-traded derivatives | 154 | * | |||||||||
Equity contracts | Receivable/Payable for variation margin on exchange-traded derivatives | 781 | * | |||||||||
Foreign exchange contracts | Unrealized appreciation on forward currency exchange contracts |
| 16,914 |
| Unrealized depreciation on forward currency exchange contracts | $ | 11,513 |
| ||||
Interest rate contracts | Unrealized depreciation on interest rate swaps |
| 562 |
| ||||||||
Interest rate contracts | Unrealized appreciation on inflation swaps |
| 3,703 |
| Unrealized depreciation on inflation swaps |
| 306,294 |
| ||||
|
|
|
| |||||||||
Total | $ | 21,828 | $ | 318,369 | ||||||||
|
|
|
| |||||||||
| * | Only variation margin receivable/payable at period end is reported within the statement of assets and liabilities. This amount reflects cumulative appreciation/(depreciation) of exchange-traded derivatives as reported in the portfolio of investments. |
The effect of derivative instruments on the statement of operations for the six months ended February 29, 2016:
Derivative Type | Location of | Realized Gain or (Loss) on Derivatives | Change in Unrealized Appreciation or (Depreciation) | |||||||
Equity contracts | Net realized gain (loss) on futures; Net change in unrealized appreciation/depreciation of futures | $ | – 0 | – | $ | 781 | ||||
| AB TAX-MANAGED WEALTH STRATEGIES • | 113 |
Notes to Financial Statements
Derivative Type | Location of | Realized Gain or (Loss) on Derivatives | Change in Unrealized Appreciation or (Depreciation) | |||||||
Foreign exchange contracts | Net realized gain (loss) on foreign currency transactions; Net change in unrealized appreciation/depreciation of foreign currency denominated assets and liabilities | $ | 4,235 |
| $ | 4,751 |
| |||
Interest rate contracts | Net realized gain (loss) on swaps; Net change in unrealized appreciation/depreciation of swaps | – 0 | – | (42,122 | ) | |||||
Credit contracts | Net realized gain (loss) on swaps; Net change in unrealized appreciation/depreciation of swaps | (95 | ) | 154 | ||||||
|
|
|
| |||||||
Total | $ | 4,140 | $ | (36,436 | ) | |||||
|
|
|
| |||||||
The following tables represent the average monthly volume of the Strategy’ derivative transactions during the six months ended February 29, 2016:
AB Tax-Managed Wealth Appreciation Strategy |
| |||
Futures: | ||||
Average original value of buy contracts | $ | 391,261 | ||
Forward Currency Exchange Contracts: | ||||
Average principal amount of buy contracts | $ | 38,615,323 | ||
Average principal amount of sale contracts | $ | 51,171,660 | ||
AB Tax-Managed Balanced Wealth Strategy | ||||
Futures: | ||||
Average original value of buy contracts | $ | 35,499 | (a) | |
Forward Currency Exchange Contracts: | ||||
Average principal amount of buy contracts | $ | 2,979,506 | ||
Average principal amount of sale contracts | $ | 3,993,278 | ||
Interest Rate Swaps: | ||||
Average notional amount | $ | 1,622,000 | ||
Inflation Swaps: | ||||
Average notional amount | $ | 10,877,143 | ||
(a) Positions were open for less than one month during the period. |
| |||
| 114 | • AB TAX-MANAGED WEALTH STRATEGIES |
Notes to Financial Statements
AB Tax-Managed Conservative Wealth Strategy | ||||
Futures: | ||||
Average original value of buy contracts | $ | 63,542 | (a) | |
Forward Currency Exchange Contracts: | ||||
Average principal amount of buy contracts | $ | 683,495 | ||
Average principal amount of sale contracts | $ | 893,845 | ||
Interest Rate Swaps: | ||||
Average notional amount | $ | 630,000 | (a) | |
Inflation Swaps: | ||||
Average notional amount | $ | 3,855,714 | ||
Centrally Cleared Interest Rate Swaps: | ||||
Average notional amount | $ | 1,210,000 | (a) | |
Centrally Cleared Credit Default Swaps: | ||||
Average notional amount of sale contracts | $ | 50,000 | ||
(a) Positions were open for less than one month during the period. |
| |||
For financial reporting purposes, the Strategy do not offset derivative assets and derivative liabilities that are subject to netting arrangements in the statement of assets and liabilities.
All derivatives held at period end were subject to netting arrangements. The following tables present the Strategy’ derivative assets and liabilities by counterparty net of amounts available for offset under Master Agreements (“MA”) and net of the related collateral received/ pledged by the Strategy as of February 29, 2016:
AB Tax-Managed Wealth Appreciation Strategy
| Counterparty | Derivative Assets Subject to a MA | Derivative Available for Offset | Cash Collateral Received | Security Collateral Received | Net Amount of Derivatives Assets | |||||||||||||||
OTC Derivatives: |
| |||||||||||||||||||
BNP Paribas SA | $ | 25,716 | $ | (23,443 | ) | $ | – 0 | – | $ | – 0 | – | $ | 2,273 | |||||||
Citibank | 447,691 | (8,081 | ) | – 0 | – | – 0 | – | 439,610 | ||||||||||||
Credit Suisse International | 3,857 | (3,857 | ) | – 0 | – | – 0 | – | – 0 | – | |||||||||||
HSBC Bank USA | 68,415 | (68,415 | ) | – 0 | – | – 0 | – | – 0 | – | |||||||||||
JPMorgan Chase Bank, | 6,727 | – 0 | – | – 0 | – | – 0 | – | 6,727 | ||||||||||||
Morgan Stanley & Co., Inc. | 32,890 | (696 | ) | – 0 | – | – 0 | – | 32,194 | ||||||||||||
Royal Bank of Scotland PLC | 98,310 | (45,840 | ) | – 0 | – | – 0 | – | 52,470 | ||||||||||||
Societe Generale | 51,518 | – 0 | – | – 0 | – | – 0 | – | 51,518 | ||||||||||||
Standard Chartered Bank | 143,067 | (15,669 | ) | – 0 | – | – 0 | – | 127,398 | ||||||||||||
State Street Bank & Trust Co. | 24,698 | (24,698 | ) | – 0 | – | – 0 | – | – 0 | – | |||||||||||
|
|
|
|
|
|
|
|
|
| |||||||||||
Total | $ | 902,889 | $ | (190,699 | ) | $ | – 0 | – | $ | – 0 | – | $ | 712,190 | ^ | ||||||
|
|
|
|
|
|
|
|
|
| |||||||||||
| AB TAX-MANAGED WEALTH STRATEGIES • | 115 |
Notes to Financial Statements
| Counterparty | Derivative Liabilities Subject to a MA | Derivative Available for Offset | Cash Collateral Pledged | Security Collateral Pledged | Net Amount of Derivatives Liabilities | |||||||||||||||
Exchange-Traded Derivatives: |
| |||||||||||||||||||
Goldman Sachs & Co.** | $ | 2,526 | $ | – 0 | – | $ | – 0 | – | $ | – 0 | – | $ | 2,526 | |||||||
|
|
|
|
|
|
|
|
|
| |||||||||||
Total | $ | 2,526 | $ | – 0 | – | $ | – 0 | – | $ | – 0 | – | $ | 2,526 | |||||||
|
|
|
|
|
|
|
|
|
| |||||||||||
OTC Derivatives: |
| |||||||||||||||||||
BNP Paribas SA | $ | 23,443 | $ | (23,443 | ) | $ | – 0 | – | $ | – 0 | – | $ | – 0 | – | ||||||
Bank of America, NA | 20,015 | – 0 | – | – 0 | – | – 0 | – | 20,015 | ||||||||||||
Barclays Bank PLC | 7,620 | – 0 | – | – 0 | – | – 0 | – | 7,620 | ||||||||||||
Citibank | 8,081 | (8,081 | ) | – 0 | – | – 0 | – | – 0 | – | |||||||||||
Credit Suisse International | 164,195 | (3,857 | ) | – 0 | – | – 0 | – | 160,338 | ||||||||||||
Deutsche Bank AG | 52,070 | – 0 | – | – 0 | – | – 0 | – | 52,070 | ||||||||||||
HSBC Bank USA | 128,156 | (68,415 | ) | – 0 | – | – 0 | – | 59,741 | ||||||||||||
Morgan Stanley & Co., Inc. | 696 | (696 | ) | – 0 | – | – 0 | – | – 0 | – | |||||||||||
Royal Bank of Scotland PLC | 45,840 | (45,840 | ) | – 0 | – | – 0 | – | – 0 | – | |||||||||||
Standard Chartered Bank | 15,669 | (15,669 | ) | – 0 | – | – 0 | – | – 0 | – | |||||||||||
State Street Bank & Trust Co. | 41,188 | (24,698 | ) | – 0 | – | – 0 | – | 16,490 | ||||||||||||
UBS AG | 98,432 | – 0 | – | – 0 | – | – 0 | – | 98,432 | ||||||||||||
|
|
|
|
|
|
|
|
|
| |||||||||||
Total | $ | 605,405 | $ | (190,699 | ) | $ | – 0 | – | $ | – 0 | – | $ | 414,706 | ^ | ||||||
|
|
|
|
|
|
|
|
|
| |||||||||||
| ^ | Net amount represents the net receivable/payable that would be due from/to the counterparty in the event of default or termination. The net amount from OTC financial derivative instruments can only be netted across transactions governed under the same master agreement with the same counterparty. |
| ** | Cash has been posted for initial margin requirements for exchange traded derivatives outstanding at February 29, 2016. |
AB Tax-Managed Balanced Wealth Strategy
| Counterparty | Derivative Assets Subject to a MA | Derivative Available for Offset | Cash Collateral Received | Security Collateral Received | Net Amount of Derivatives Assets | |||||||||||||||
Exchange-Traded Derivatives: |
| |||||||||||||||||||
Goldman Sachs & Co.** | $ | 55 | $ | – 0 | – | $ | – 0 | – | $ | – 0 | – | $ | 55 | |||||||
|
|
|
|
|
|
|
|
|
| |||||||||||
Total | $ | 55 | $ | – 0 | – | $ | – 0 | – | $ | – 0 | – | $ | 55 | |||||||
|
|
|
|
|
|
|
|
|
| |||||||||||
| 116 | • AB TAX-MANAGED WEALTH STRATEGIES |
Notes to Financial Statements
| Counterparty | Derivative Assets Subject to a MA | Derivative Available for Offset | Cash Collateral Received | Security Collateral Received | Net Amount of Derivatives Assets | |||||||||||||||
OTC Derivatives: |
| |||||||||||||||||||
BNP Paribas SA | $ | 2,101 | $ | – 0 | – | $ | – 0 | – | $ | – 0 | – | $ | 2,101 | |||||||
Citibank/Citibank, NA | 14,913 | (14,913 | ) | – 0 | – | – 0 | – | – 0 | – | |||||||||||
Deutsche Bank AG | 10,369 | (2,122 | ) | – 0 | – | – 0 | – | 8,247 | ||||||||||||
HSBC Bank USA | 3,063 | (2,022 | ) | – 0 | – | – 0 | – | 1,041 | ||||||||||||
Morgan Stanley & Co., Inc./ Morgan Stanley Capital Services LLC | 398 | (398 | ) | – 0 | – | – 0 | – | – 0 | – | |||||||||||
Standard Chartered Bank | 12,761 | – 0 | – | – 0 | – | – 0 | – | 12,761 | ||||||||||||
State Street Bank & Trust Co. | 45,787 | (45,787 | ) | – 0 | – | – 0 | – | – 0 | – | |||||||||||
|
|
|
|
|
|
|
|
|
| |||||||||||
Total | $ | 89,392 | $ | (65,242 | ) | $ | – 0 | – | $ | – 0 | – | $ | 24,150 | ^ | ||||||
|
|
|
|
|
|
|
|
|
| |||||||||||
| Counterparty | Derivative Liabilities Subject to a MA | Derivative Available for Offset | Cash Collateral Pledged | Security Collateral Pledged | Net Amount of Derivatives Liabilities | |||||||||||||||
OTC Derivatives: |
| |||||||||||||||||||
Bank of America, NA | $ | 183,930 | $ | – 0 | – | $ | – 0 | – | $ | – 0 | – | $ | 183,930 | |||||||
Barclays Bank PLC | 506,672 | – 0 | – | – 0 | – | – 0 | – | 506,672 | ||||||||||||
Citibank/Citibank, NA | 116,506 | (14,913 | ) | – 0 | – | – 0 | – | 101,593 | ||||||||||||
Deutsche Bank AG | 2,122 | (2,122 | ) | – 0 | – | – 0 | – | – 0 | – | |||||||||||
Goldman Sachs Bank USA | 179,000 | – 0 | – | – 0 | – | – 0 | – | 179,000 | ||||||||||||
HSBC Bank USA | 2,022 | (2,022 | ) | – 0 | – | – 0 | – | – 0 | – | |||||||||||
JPMorgan Chase Bank, NA | 36,766 | – 0 | – | – 0 | – | – 0 | – | 36,766 | ||||||||||||
Morgan Stanley & Co., Inc./ Morgan Stanley Capital Services LLC | 37,838 | – 0 | – | – 0 | – | – 0 | – | 37,838 | ||||||||||||
State Street Bank & Trust Co. | 47,734 | (45,787 | ) | – 0 | – | – 0 | – | 1,947 | ||||||||||||
|
|
|
|
|
|
|
|
|
| |||||||||||
Total | $ | 1,112,590 | $ | (64,844 | ) | $ | – 0 | – | $ | – 0 | – | $ | 1,047,746 | ^ | ||||||
|
|
|
|
|
|
|
|
|
| |||||||||||
| ** | Cash has been posted for initial margin requirements for exchange traded derivatives outstanding at February 29, 2016. |
| ^ | Net amount represents the net receivable/payable that would be due from/to the counterparty in the event of default or termination. The net amount from OTC financial derivative instruments can only be netted across transactions governed under the same master agreement with the same counterparty. |
| AB TAX-MANAGED WEALTH STRATEGIES • | 117 |
Notes to Financial Statements
AB Tax-Managed Conservative Wealth Strategies
| Counterparty | Derivative Assets Subject to a MA | Derivative Available for Offset | Cash Collateral Received | Security Collateral Received | Net Amount of Derivatives Assets | |||||||||||||||
Exchange-Traded Derivatives: |
| |||||||||||||||||||
Goldman Sachs & Co.** | $ | 83 | $ | – 0 | – | $ | – 0 | – | $ | – 0 | – | $ | 83 | |||||||
Morgan Stanley & Co., LLC** | 372 | – 0 | – | – 0 | – | – 0 | – | 372 | ||||||||||||
|
|
|
|
|
|
|
|
|
| |||||||||||
Total | $ | 455 | $ | – 0 | – | $ | – 0 | – | $ | – 0 | – | $ | 455 | |||||||
|
|
|
|
|
|
|
|
|
| |||||||||||
OTC Derivatives: | ||||||||||||||||||||
BNP Paribas SA | $ | 592 | $ | – 0 | – | $ | – 0 | – | $ | – 0 | – | $ | 592 | |||||||
Deutsche Bank AG | 3,703 | (3,703 | ) | – 0 | – | – 0 | – | – 0 | – | |||||||||||
HSBC Bank USA | 696 | (459 | ) | – 0 | – | – 0 | – | 237 | ||||||||||||
State Street Bank & Trust Co. | 15,626 | (10,298 | ) | – 0 | – | – 0 | – | 5,328 | ||||||||||||
|
|
|
|
|
|
|
|
|
| |||||||||||
Total | $ | 20,617 | $ | (14,460 | ) | $ | – 0 | – | $ | – 0 | – | $ | 6,157 | ^ | ||||||
|
|
|
|
|
|
|
|
|
| |||||||||||
| Counterparty | Derivative Liabilities Subject to a MA | Derivative Available for Offset | Cash Collateral Pledged | Security Collateral Pledged | Net Amount of Derivatives Liabilities | |||||||||||||||
OTC Derivatives: |
| |||||||||||||||||||
Bank of America, NA | $ | 32,591 | $ | – 0 | – | $ | – 0 | – | $ | – 0 | – | $ | 32,591 | |||||||
Barclays Bank PLC | 74,967 | – 0 | – | – 0 | – | – 0 | – | 74,967 | ||||||||||||
Citibank/ Citibank, NA | 23,065 | – 0 | – | – 0 | – | – 0 | – | 23,065 | ||||||||||||
Deutsche Bank AG | 6,107 | (3,703 | ) | – 0 | – | – 0 | – | 2,404 | ||||||||||||
HSBC Bank USA | 459 | (459 | ) | – 0 | – | – 0 | – | – 0 | – | |||||||||||
JPMorgan Chase Bank, NA | 23,141 | – 0 | – | – 0 | – | – 0 | – | 23,141 | ||||||||||||
Morgan Stanley Capital Services LLC | 147,741 | – 0 | – | – 0 | – | – 0 | – | 147,741 | ||||||||||||
State Street Bank & Trust Co. | 10,298 | (10,298 | ) | – 0 | – | – 0 | – | – 0 | – | |||||||||||
|
|
|
|
|
|
|
|
|
| |||||||||||
Total | $ | 318,369 | $ | (14,460 | ) | $ | – 0 | – | $ | – 0 | – | $ | 303,909 | ^ | ||||||
|
|
|
|
|
|
|
|
|
| |||||||||||
| ** | Cash has been posted for initial margin requirements for exchange traded derivatives outstanding at February 29, 2016. |
| ^ | Net amount represents the net receivable/payable that would be due from/to the counterparty in the event of default or termination. The net amount from OTC financial derivative instruments can only be netted across transactions governed under the same master agreement with the same counterparty. |
| 118 | • AB TAX-MANAGED WEALTH STRATEGIES |
Notes to Financial Statements
2. Currency Transactions
The Strategy may invest in non-U.S. dollar securities on a currency hedged or unhedged basis. The Strategy may seek investment opportunities by taking long or short positions in currencies through the use of currency-related derivatives, including forward currency exchange contracts, futures and options on futures, swaps, and other options. The Strategy may enter into transactions for investment opportunities when it anticipates that a foreign currency will appreciate or depreciate in value but securities denominated in that currency are not held by the Strategy and do not present attractive investment opportunities. Such transactions may also be used when the Adviser believes that it may be more efficient than a direct investment in a foreign currency-denominated security. The Strategy may also conduct currency exchange contracts on a spot basis (i.e., for cash at the spot rate prevailing in the currency exchange market for buying or selling currencies).
NOTE E
Shares of Beneficial Interest
Transactions in shares of beneficial interest for each class were as follows:
| AB Tax-Managed Wealth Appreciation Strategy | ||||||||||||||||||||
| Shares | Amount | |||||||||||||||||||
| Six Months Ended February 29, 2016 (unaudited) | Year Ended 2015 | Six Months Ended February 29, 2016 (unaudited) | Year Ended 2015 | |||||||||||||||||
|
| |||||||||||||||||||
| Class A | ||||||||||||||||||||
Shares sold | 50,185 | 113,909 | $ | 756,878 | $ | 1,850,080 | ||||||||||||||
| ||||||||||||||||||||
Shares issued in reinvestment of dividends and distributions | 154,337 | 53,129 | 2,254,865 | 834,136 | ||||||||||||||||
| ||||||||||||||||||||
Shares converted from Class B | 8,838 | 47,515 | 130,715 | 774,366 | ||||||||||||||||
| ||||||||||||||||||||
Shares redeemed | (168,580 | ) | (350,717 | ) | (2,510,251 | ) | (5,669,990 | ) | ||||||||||||
| ||||||||||||||||||||
Net increase (decrease) | 44,780 | (136,164 | ) | $ | 632,207 | $ | (2,211,408 | ) | ||||||||||||
| ||||||||||||||||||||
| Class B | ||||||||||||||||||||
Shares sold | 955 | 5,624 | $ | 13,850 | $ | 88,809 | ||||||||||||||
| ||||||||||||||||||||
Shares issued in reinvestment of dividends and distributions | 2,958 | 1,367 | 42,919 | 21,284 | ||||||||||||||||
| ||||||||||||||||||||
Shares converted to Class A | (8,939 | ) | (48,128 | ) | (130,715 | ) | (774,366 | ) | ||||||||||||
| ||||||||||||||||||||
Shares redeemed | (2,207 | ) | (17,941 | ) | (34,631 | ) | (288,170 | ) | ||||||||||||
| ||||||||||||||||||||
Net decrease | (7,233 | ) | (59,078 | ) | $ | (108,577 | ) | $ | (952,443 | ) | ||||||||||
| ||||||||||||||||||||
| AB TAX-MANAGED WEALTH STRATEGIES • | 119 |
Notes to Financial Statements
| AB Tax-Managed Wealth Appreciation Strategy | ||||||||||||||||||||
| Shares | Amount | |||||||||||||||||||
| Six Months Ended February 29, 2016 (unaudited) | Year Ended 2015 | Six Months Ended February 29, 2016 (unaudited) | Year Ended 2015 | |||||||||||||||||
|
| |||||||||||||||||||
| Class C | ||||||||||||||||||||
Shares sold | 16,105 | 71,346 | $ | 237,995 | $ | 1,146,118 | ||||||||||||||
| ||||||||||||||||||||
Shares issued in reinvestment of dividends and distributions | 54,517 | 14,793 | 786,682 | 229,587 | ||||||||||||||||
| ||||||||||||||||||||
Shares redeemed | (87,764 | ) | (129,709 | ) | (1,303,273 | ) | (2,087,752 | ) | ||||||||||||
| ||||||||||||||||||||
Net decrease | (17,142 | ) | (43,570 | ) | $ | (278,596 | ) | $ | (712,047 | ) | ||||||||||
| ||||||||||||||||||||
| Advisor Class | ||||||||||||||||||||
Shares sold | 3,499,668 | 5,770,342 | $ | 51,246,422 | $ | 93,100,649 | ||||||||||||||
| ||||||||||||||||||||
Shares issued in reinvestment of dividends and distributions | 3,136,331 | 1,061,233 | 45,915,883 | 16,703,802 | ||||||||||||||||
| ||||||||||||||||||||
Shares redeemed | (3,676,563 | ) | (6,415,000 | ) | (53,713,977 | ) | (104,416,015 | ) | ||||||||||||
| ||||||||||||||||||||
Net increase | 2,959,436 | 416,575 | $ | 43,448,328 | $ | 5,388,436 | ||||||||||||||
| ||||||||||||||||||||
| AB Tax-Managed Balanced Wealth Strategy | ||||||||||||||||||||
| Shares | Amount | |||||||||||||||||||
| Six Months Ended February 29, 2016 (unaudited) | Year Ended August 31, 2015 | Six Months Ended February 29, 2016 (unaudited) | Year Ended August 31, 2015 | |||||||||||||||||
|
| |||||||||||||||||||
| Class A | ||||||||||||||||||||
Shares sold | 100,884 | 154,901 | $ | 1,301,736 | $ | 2,132,050 | ||||||||||||||
| ||||||||||||||||||||
Shares issued in reinvestment of dividends and distributions | 268,617 | 224,112 | 3,446,354 | 3,016,559 | ||||||||||||||||
| ||||||||||||||||||||
Shares converted from Class B | 36,073 | 127,675 | 470,635 | 1,761,304 | ||||||||||||||||
| ||||||||||||||||||||
Shares redeemed | (412,916 | ) | (1,286,792 | ) | (5,360,193 | ) | (17,636,929 | ) | ||||||||||||
| ||||||||||||||||||||
Net decrease | (7,342 | ) | (780,104 | ) | $ | (141,468 | ) | $ | (10,727,016 | ) | ||||||||||
| ||||||||||||||||||||
| Class B | ||||||||||||||||||||
Shares sold | 2,308 | 8,243 | $ | 30,188 | $ | 113,166 | ||||||||||||||
| ||||||||||||||||||||
Shares issued in reinvestment of dividends and distributions | 5,305 | 8,645 | 68,811 | 116,703 | ||||||||||||||||
| ||||||||||||||||||||
Shares converted to Class A | (36,000 | ) | (127,588 | ) | (470,635 | ) | (1,761,304 | ) | ||||||||||||
| ||||||||||||||||||||
Shares redeemed | (5,234 | ) | (41,872 | ) | (67,536 | ) | (578,283 | ) | ||||||||||||
| ||||||||||||||||||||
Net decrease | (33,621 | ) | (152,572 | ) | $ | (439,172 | ) | $ | (2,109,718 | ) | ||||||||||
| ||||||||||||||||||||
| 120 | • AB TAX-MANAGED WEALTH STRATEGIES |
Notes to Financial Statements
| AB Tax-Managed Balanced Wealth Strategy | ||||||||||||||||||||
| Shares | Amount | |||||||||||||||||||
| Six Months Ended February 29, 2016 (unaudited) | Year Ended August 31, 2015 | Six Months Ended February 29, 2016 (unaudited) | Year Ended August 31, 2015 | |||||||||||||||||
|
| |||||||||||||||||||
| Class C | ||||||||||||||||||||
Shares sold | 82,210 | 74,071 | $ | 1,075,995 | $ | 1,020,848 | ||||||||||||||
| ||||||||||||||||||||
Shares issued in reinvestment of dividends and distributions | 74,375 | 64,213 | 959,442 | 867,516 | ||||||||||||||||
| ||||||||||||||||||||
Shares redeemed | (158,258 | ) | (291,777 | ) | (2,055,726 | ) | (4,004,092 | ) | ||||||||||||
| ||||||||||||||||||||
Net decrease | (1,673 | ) | (153,493 | ) | $ | (20,289 | ) | $ | (2,115,728 | ) | ||||||||||
| ||||||||||||||||||||
| Advisor Class | ||||||||||||||||||||
Shares sold | 342,347 | 786,404 | $ | 4,435,906 | $ | 10,834,341 | ||||||||||||||
| ||||||||||||||||||||
Shares issued in reinvestment of dividends and distributions | 130,158 | 99,088 | 1,672,520 | 1,335,704 | ||||||||||||||||
| ||||||||||||||||||||
Shares redeemed | (453,379 | ) | (664,168 | ) | (5,980,474 | ) | (9,160,202 | ) | ||||||||||||
| ||||||||||||||||||||
Net increase | 19,126 | 221,324 | $ | 127,952 | $ | 3,009,843 | ||||||||||||||
| ||||||||||||||||||||
| AB Tax-Managed Conservative Wealth Strategy | ||||||||||||||||||||
| Shares | Amount | |||||||||||||||||||
| Six Months Ended February 29, 2016 (unaudited) | Year Ended August 31, 2015 | Six Months Ended February 29, 2016 (unaudited) | Year Ended August 31, 2015 | |||||||||||||||||
|
| |||||||||||||||||||
| Class A | ||||||||||||||||||||
Shares sold | 48,723 | 50,903 | $ | 543,755 | $ | 585,698 | ||||||||||||||
| ||||||||||||||||||||
Shares issued in reinvestment of dividends and distributions | 106,934 | 94,775 | 1,159,162 | 1,074,748 | ||||||||||||||||
| ||||||||||||||||||||
Shares converted from Class B | 8,932 | 30,805 | 99,223 | 357,996 | ||||||||||||||||
| ||||||||||||||||||||
Shares redeemed | (209,194 | ) | (523,063 | ) | (2,322,313 | ) | (6,043,966 | ) | ||||||||||||
| ||||||||||||||||||||
Net decrease | (44,605 | ) | (346,580 | ) | $ | (520,173 | ) | $ | (4,025,524 | ) | ||||||||||
| ||||||||||||||||||||
| Class B | ||||||||||||||||||||
Shares sold | 685 | 2,315 | $ | 7,799 | $ | 27,405 | ||||||||||||||
| ||||||||||||||||||||
Shares issued in reinvestment of dividends and distributions | 1,780 | 2,781 | 20,030 | 32,485 | ||||||||||||||||
| ||||||||||||||||||||
Shares converted to Class A | (8,674 | ) | (29,993 | ) | (99,223 | ) | (357,996 | ) | ||||||||||||
| ||||||||||||||||||||
Shares redeemed | (9,020 | ) | (13,387 | ) | (103,653 | ) | (159,382 | ) | ||||||||||||
| ||||||||||||||||||||
Net decrease | (15,229 | ) | (38,284 | ) | $ | (175,047 | ) | $ | (457,488 | ) | ||||||||||
| ||||||||||||||||||||
| AB TAX-MANAGED WEALTH STRATEGIES • | 121 |
Notes to Financial Statements
| AB Tax-Managed Conservative Wealth Strategy | ||||||||||||||||||||
| Shares | Amount | |||||||||||||||||||
| Six Months Ended February 29, 2016 (unaudited) | Year Ended August 31, 2015 | Six Months Ended February 29, 2016 (unaudited) | Year Ended August 31, 2015 | |||||||||||||||||
|
| |||||||||||||||||||
| Class C | ||||||||||||||||||||
Shares sold | 36,089 | 43,269 | $ | 404,068 | $ | 513,709 | ||||||||||||||
| ||||||||||||||||||||
Shares issued in reinvestment of dividends and distributions | 34,977 | 34,366 | 391,390 | 401,396 | ||||||||||||||||
| ||||||||||||||||||||
Shares redeemed | (67,536 | ) | (226,097 | ) | (767,650 | ) | (2,679,903 | ) | ||||||||||||
| ||||||||||||||||||||
Net increase (decrease) | 3,530 | (148,462 | ) | $ | 27,808 | $ | (1,764,798 | ) | ||||||||||||
| ||||||||||||||||||||
| Advisor Class | ||||||||||||||||||||
Shares sold | 66,197 | 134,128 | $ | 723,948 | $ | 1,548,401 | ||||||||||||||
| ||||||||||||||||||||
Shares issued in reinvestment of dividends and distributions | 12,940 | 12,904 | 140,659 | 146,712 | ||||||||||||||||
| ||||||||||||||||||||
Shares redeemed | (169,070 | ) | (131,711 | ) | (1,903,612 | ) | (1,533,859 | ) | ||||||||||||
| ||||||||||||||||||||
Net increase (decrease) | (89,933 | ) | 15,321 | $ | (1,039,005 | ) | $ | 161,254 | ||||||||||||
| ||||||||||||||||||||
NOTE F
Risks Involved in Investing in the Strategy
Interest Rate Risk and Credit Risk—Interest rate risk is the risk that changes in interest rates will affect the value of the Strategy’ investments in fixed-income debt securities such as bonds or notes. Increases in interest rates may cause the value of the Strategy’ investments to decline. Credit risk is the risk that the issuer or guarantor of a debt security, or the counterparty to a derivative contract, will be unable or unwilling to make timely principal and/or interest payments, or to otherwise honor its obligations. The degree of risk for a particular security may be reflected in its credit rating. Credit risk is greater for medium quality and lower-rated securities. Lower-rated debt securities and similar unrated securities (commonly known as “junk bonds”) have speculative elements or are predominantly speculative risks.
Foreign (Non-U.S.) Risk—Investments in securities of non-U.S. issuers may involve more risk than those of U.S. issuers. These securities may fluctuate more widely in price and may be less liquid due to adverse market, economic, political, regulatory or other factors.
Currency Risk—Fluctuations in currency exchange rates may negatively affect the value of the Strategy’ investments or reduce its returns.
Capitalization Risk—Investments in small- and mid-capitalization companies may be more volatile than investments in large-capitalization companies.
| 122 | • AB TAX-MANAGED WEALTH STRATEGIES |
Notes to Financial Statements
Investments in small-capitalization companies may have additional risks because these companies have limited product lines, markets or financial resources.
Allocation Risk—The allocation of investments among different investment styles, such as equity or debt, growth or value, U.S. or non-U.S. securities, or diversification Strategy, may have a more significant effect on the Strategy’ net asset value, or NAV, when one of these investments is performing more poorly than another.
Derivatives Risk—The Strategy may enter into derivative transactions such as forwards, options, futures and swaps. Derivatives may be illiquid, difficult to price, and leveraged so that small changes may produce disproportionate losses for the Strategy, and subject to counterparty risk to a greater degree than more traditional investments. Derivatives may result in significant losses, including losses that are far greater than the value of the derivatives reflected in the statement of assets and liabilities.
Municipal Market Risk—This is the risk that special factors may adversely affect the value of municipal securities and have a significant effect on the yield or value of the Strategy’ investments in municipal securities. These factors include economic conditions, political or legislative changes, uncertainties related to the tax status of municipal securities, or the rights of investors in these securities. To the extent that the Strategy invest more of its assets in a particular state’s municipal securities, the Strategy’ may be vulnerable to events adversely affecting that state, including economic, political and regulatory occurrences, court decisions, terrorism and catastrophic natural disasters, such as hurricanes or earthquakes. The Strategy’ investments in certain municipal securities with principal and interest payments that are made from the revenues of a specific project or facility, and not general tax revenues, may have increased risks. Factors affecting the project or facility, such as local business or economic conditions, could have a significant effect on the project’s ability to make payments of principal and interest on these securities.
Indemnification Risk—In the ordinary course of business, the Strategy enter into contracts that contain a variety of indemnifications. The Strategy’ maximum exposure under these arrangements is unknown. However, the Strategy have not had prior claims or losses pursuant to these indemnification provisions and expect the risk of loss thereunder to be remote. Therefore, the Strategy have not accrued any liability in connection with these indemnification provisions.
NOTE G
Joint Credit Facility
A number of open-end mutual funds managed by the Adviser, including the Strategy, participate in a $280 million revolving credit facility (the “Facility”) intended to provide short-term financing, if necessary, subject to certain restrictions in connection with abnormal redemption activity. Commitment fees
| AB TAX-MANAGED WEALTH STRATEGIES • | 123 |
Notes to Financial Statements
related to the Facility are paid by the participating funds and are included in miscellaneous expenses in the statement of operations. The Strategy did not utilize the Facility during the six months ended February 29, 2016.
NOTE H
Distributions to Shareholders
The tax character of distributions to be paid for the year ending August 31, 2016 will be determined at the end of the current fiscal year. The tax character of distributions paid during the fiscal years ended August 31, 2015 and August 31, 2014 were as follows:
| AB Tax-Managed Wealth Appreciation Strategy | 2015 | 2014 | ||||||
Distributions paid from: | ||||||||
Ordinary income | $ | 13,204,160 | $ | 15,777,828 | ||||
Long-term capital gains | 6,243,209 | – 0 | – | |||||
|
|
|
| |||||
Total taxable distributions | 19,447,369 | 15,777,828 | ||||||
|
|
|
| |||||
Total distributions paid | $ | 19,447,369 | $ | 15,777,828 | ||||
|
|
|
| |||||
| AB Tax-Managed Balanced Wealth Strategy | 2015 | 2014 | ||||||
Distributions paid from: | ||||||||
Ordinary income | $ | 655,723 | $ | 1,703,104 | ||||
Long-term capital gains | 5,312,124 | – 0 | – | |||||
|
|
|
| |||||
Total taxable distributions | 5,967,847 | 1,703,104 | ||||||
Tax exempt distributions | 4,843 | 1,224,406 | ||||||
|
|
|
| |||||
Total distributions paid | $ | 5,972,690 | $ | 2,927,510 | ||||
|
|
|
| |||||
| AB Tax-Managed Conservative Wealth Strategy | 2015 | 2014 | ||||||
Distributions paid from: | ||||||||
Ordinary income | $ | 384,875 | $ | 428,506 | ||||
Long-term capital gains | 1,580,013 | 1,610,362 | ||||||
|
|
|
| |||||
Total taxable distributions | 1,964,888 | 2,038,868 | ||||||
Tax exempt distributions | 5,598 | 314,603 | ||||||
|
|
|
| |||||
Total distributions paid | $ | 1,970,486 | $ | 2,353,471 | ||||
|
|
|
| |||||
As of August 31, 2015, the components of accumulated earnings/(deficit) on a tax basis were as follows:
| AB Tax-Managed Strategy | Undistributed Ordinary Income(a) | Accumulated Capital and | Unrealized Appreciation/ (Depreciation)(c) | Total Accumulated Earnings/ (Deficit)(d) | ||||||||||||
Wealth Appreciation | $ | 2,901,318 | $ | 42,646,437 | $ | 48,528,795 | $ | 94,076,550 | ||||||||
Balanced Wealth | 2,158,464 | 5,491,813 | 5,738,428 | 13,388,705 | ||||||||||||
Conservative Wealth | 522,257 | 1,286,687 | 1,966,425 | 3,775,369 | ||||||||||||
| 124 | • AB TAX-MANAGED WEALTH STRATEGIES |
Notes to Financial Statements
| (a) | Includes tax exempt income as shown below: |
Wealth Appreciation | $ | – 0 | – | |
Balanced Wealth | 970,322 | |||
Conservative Wealth | 236,119 |
| (b) | During the fiscal year ended August 31, 2015, Tax-Managed Wealth Appreciation Strategy utilized $2,219,328 of capital loss carryforwards to offset current year net realized gains. |
| (c) | The differences between book-basis and tax-basis unrealized appreciation/(depreciation) are attributable primarily to the tax deferral of losses on wash sales, the tax treatment of passive foreign investment companies (PFICs), return of capital distributions received from underlying securities, and the realization for tax purposes of gains/losses on certain derivative instruments. |
| (d) | For Tax-Managed Balanced Wealth Strategy, the difference between book-basis and tax-basis components of accumulated earnings/(deficit) is attributable primarily to the tax treatment of defaulted securities. |
For tax purposes, net capital losses may be carried over to offset future capital gains, if any. Funds are permitted to carry forward capital losses incurred for an indefinite period, and such losses will retain their character as either short-term or long-term capital losses. As of August 31, 2015, none of the Strategy had any capital loss carryforwards.
New Accounting Pronouncement
In May 2015, the Financial Accounting Standards Board issued an Accounting Standards Update, ASU 2015-07 (the “ASU”) which removes the requirement to categorize within the fair value hierarchy all investments for which fair value is measured using the net asset value per share practical expedient. The ASU also removes the requirement to make certain disclosures for investments that are eligible to be measured at fair value using the net asset value per share practical expedient but do not utilize that practical expedient.
The ASU is effective for annual periods beginning after December 15, 2015 and interim periods within those annual periods. At this time, management is evaluating the implications of these changes on the financial statements.
NOTE I
Subsequent Events
Management has evaluated subsequent events for possible recognition or disclosure in the financial statements through the date the financial statements are issued. Management has determined that there are no material events that would require disclosure in the Strategy’ financial statements through this date.
| AB TAX-MANAGED WEALTH STRATEGIES • | 125 |
Notes to Financial Statements
FINANCIAL HIGHLIGHTS
Selected Data For A Share Of Beneficial Interest Outstanding Throughout Each Period
| AB Tax-Managed Wealth Appreciation Strategy | ||||||||||||||||||||||||
| Class A | ||||||||||||||||||||||||
Six Months Ended (unaudited) | Year Ended August 31, | |||||||||||||||||||||||
| 2015 | 2014 | 2013 | 2012 | 2011 | ||||||||||||||||||||
|
| |||||||||||||||||||||||
Net asset value, beginning | $ 15.41 | $ 16.51 | $ 13.86 | $ 11.85 | $ 11.36 | $ 10.18 | ||||||||||||||||||
|
| |||||||||||||||||||||||
Income From | ||||||||||||||||||||||||
Net investment | .11 | (b) | .20 | (b) | .32 | (b) | .10 | .11 | .10 | |||||||||||||||
Net realized and | (.87 | ) | (.91 | ) | 2.65 | 1.98 | .53 | 1.20 | ||||||||||||||||
|
| |||||||||||||||||||||||
Net increase (decrease) in | (.76 | ) | (.71 | ) | 2.97 | 2.08 | .64 | 1.30 | ||||||||||||||||
|
| |||||||||||||||||||||||
Less: Dividends and Distributions | ||||||||||||||||||||||||
Dividends from net | (.16 | ) | (.25 | ) | (.32 | ) | (.07 | ) | (.15 | ) | (.12 | ) | ||||||||||||
Distributions from net | (.94 | ) | (.14 | ) | – 0 | – | – 0 | – | – 0 | – | – 0 | – | ||||||||||||
|
| |||||||||||||||||||||||
Total dividends and | (1.10 | ) | (.39 | ) | (.32 | ) | (.07 | ) | (.15 | ) | (.12 | ) | ||||||||||||
|
| |||||||||||||||||||||||
Net asset value, end of period | $ 13.55 | $ 15.41 | $ 16.51 | $ 13.86 | $ 11.85 | $ 11.36 | ||||||||||||||||||
|
| |||||||||||||||||||||||
Total Return | ||||||||||||||||||||||||
Total investment return | (5.44 | )%* | (4.34 | )%* | 21.66 | % | 17.65 | %* | 5.76 | %* | 12.74 | %* | ||||||||||||
Ratios/Supplemental | ||||||||||||||||||||||||
Net assets, end of period | $31,206 | $34,813 | $39,534 | $32,587 | $33,959 | $39,441 | ||||||||||||||||||
Ratio to average net | ||||||||||||||||||||||||
Expenses, net of | .93 | %(d)^ | .93 | %(d) | 1.04 | %(d) | 1.07 | % | 1.08 | % | 1.05 | %+ | ||||||||||||
Expenses, before | 1.01 | %(d)^ | 1.00 | %(d) | 1.04 | %(d) | 1.07 | % | 1.08 | % | 1.05 | %+ | ||||||||||||
Net investment | 1.55 | %(b)^ | 1.24 | %(b) | 2.05 | %(b) | .80 | % | .93 | % | .82 | %+ | ||||||||||||
Portfolio turnover rate | 25 | % | 49 | % | 61 | % | 46 | % | 93 | % | 73 | % | ||||||||||||
See footnote summary on page 138.
| 126 | • AB TAX-MANAGED WEALTH STRATEGIES |
Financial Highlights
Selected Data For A Share Of Beneficial Interest Outstanding Throughout Each Period
| AB Tax-Managed Wealth Appreciation Strategy | ||||||||||||||||||||||||
| Class B | ||||||||||||||||||||||||
Six Months (unaudited) | Year Ended August 31, | |||||||||||||||||||||||
| 2015 | 2014 | 2013 | 2012 | 2011 | ||||||||||||||||||||
|
| |||||||||||||||||||||||
Net asset value, beginning | $ 15.19 | $ 16.24 | $ 13.61 | $ 11.66 | $ 11.14 | $ 9.99 | ||||||||||||||||||
|
| |||||||||||||||||||||||
Income From | ||||||||||||||||||||||||
Net investment | .05 | (b) | .08 | (b) | .22 | (b) | .01 | .02 | .01 | |||||||||||||||
Net realized and | (.86 | ) | (.90 | ) | 2.59 | 1.94 | .54 | 1.17 | ||||||||||||||||
|
| |||||||||||||||||||||||
Net increase (decrease) in | (.81 | ) | (.82 | ) | 2.81 | 1.95 | .56 | 1.18 | ||||||||||||||||
|
| |||||||||||||||||||||||
Less: Dividends and | ||||||||||||||||||||||||
Dividends from net | – 0 | – | (.09 | ) | (.18 | ) | – 0 | – | (.04 | ) | (.03 | ) | ||||||||||||
Distributions from net | (.94 | ) | (.14 | ) | – 0 | – | – 0 | – | – 0 | – | – 0 | – | ||||||||||||
|
| |||||||||||||||||||||||
Total dividends and | (.94 | ) | (.23 | ) | (.18 | ) | – 0 | – | (.04 | ) | (.03 | ) | ||||||||||||
|
| |||||||||||||||||||||||
Net asset value, end of | $ 13.44 | $ 15.19 | $ 16.24 | $ 13.61 | $ 11.66 | $ 11.14 | ||||||||||||||||||
|
| |||||||||||||||||||||||
Total Return | ||||||||||||||||||||||||
Total investment return | (5.81 | )%* | (5.09 | )%* | 20.79 | % | 16.72 | %* | 5.08 | %* | 11.83 | %* | ||||||||||||
Ratios/Supplemental | ||||||||||||||||||||||||
Net assets, end of period | $629 | $821 | $1,837 | $2,709 | $4,043 | $7,297 | ||||||||||||||||||
Ratio to average net | ||||||||||||||||||||||||
Expenses, net of | 1.72 | %(d)^ | 1.69 | %(d) | 1.76 | %(d) | 1.80 | % | 1.82 | % | 1.81 | %+ | ||||||||||||
Expenses, before | 1.80 | %(d)^ | 1.77 | %(d) | 1.76 | %(d) | 1.80 | % | 1.82 | % | 1.81 | %+ | ||||||||||||
Net investment | .74 | %(b)^ | .51 | %(b) | 1.43 | %(b) | .08 | % | .19 | % | .07 | %+ | ||||||||||||
Portfolio turnover rate | 25 | % | 49 | % | 61 | % | 46 | % | 93 | % | 73 | % | ||||||||||||
See footnote summary on page 138.
| AB TAX-MANAGED WEALTH STRATEGIES • | 127 |
Financial Highlights
Selected Data For A Share Of Beneficial Interest Outstanding Throughout Each Period
| AB Tax-Managed Wealth Appreciation Strategy | ||||||||||||||||||||||||
| Class C | ||||||||||||||||||||||||
Six Months (unaudited) | Year Ended August 31, | |||||||||||||||||||||||
| 2015 | 2014 | 2013 | 2012 | 2011 | ||||||||||||||||||||
|
| |||||||||||||||||||||||
Net asset value, beginning | $ 15.15 | $ 16.23 | $ 13.62 | $ 11.67 | $ 11.16 | $ 10.00 | ||||||||||||||||||
|
| |||||||||||||||||||||||
Income From | ||||||||||||||||||||||||
Net investment | .06 | (b) | .07 | (b) | .21 | (b) | .01 | .03 | .01 | |||||||||||||||
Net realized and | (.87 | ) | (.87 | ) | 2.60 | 1.94 | .53 | 1.18 | ||||||||||||||||
|
| |||||||||||||||||||||||
Net increase (decrease) in | (.81 | ) | (.80 | ) | 2.81 | 1.95 | .56 | 1.19 | ||||||||||||||||
|
| |||||||||||||||||||||||
Less: Dividends and | ||||||||||||||||||||||||
Dividends from net | (.04 | ) | (.14 | ) | (.20 | ) | – 0 | – | (.05 | ) | (.03 | ) | ||||||||||||
Distributions from net | (.94 | ) | (.14 | ) | – 0 | – | – 0 | – | – 0 | – | – 0 | – | ||||||||||||
|
| |||||||||||||||||||||||
Total dividends and | (.98 | ) | (.28 | ) | (.20 | ) | – 0 | – | (.05 | ) | (.03 | ) | ||||||||||||
|
| |||||||||||||||||||||||
Net asset value, end of | $ 13.36 | $ 15.15 | $ 16.23 | $ 13.62 | $ 11.67 | $ 11.16 | ||||||||||||||||||
|
| |||||||||||||||||||||||
Total Return | ||||||||||||||||||||||||
Total investment return | (5.85 | )%* | (4.99 | )%* | 20.83 | % | 16.71 | %* | 5.09 | %* | 11.92 | %* | ||||||||||||
Ratios/Supplemental | ||||||||||||||||||||||||
Net assets, end of period | $13,973 | $16,102 | $17,964 | $16,589 | $18,337 | $22,611 | ||||||||||||||||||
Ratio to average net | ||||||||||||||||||||||||
Expenses, net of | 1.68 | %(d)^ | 1.68 | %(d) | 1.75 | %(d) | 1.78 | % | 1.79 | % | 1.78 | %+ | ||||||||||||
Expenses, before | 1.76 | %(d)^ | 1.76 | %(d) | 1.75 | %(d) | 1.78 | % | 1.79 | % | 1.78 | %+ | ||||||||||||
Net investment | .82 | %(b)^ | .47 | %(b) | 1.35 | %(b) | .10 | % | .22 | % | .10 | %+ | ||||||||||||
Portfolio turnover rate | 25 | % | 49 | % | 61 | % | 46 | % | 93 | % | 73 | % | ||||||||||||
See footnote summary on page 138.
| 128 | • AB TAX-MANAGED WEALTH STRATEGIES |
Financial Highlights
Selected Data For A Share Of Beneficial Interest Outstanding Throughout Each Period
| AB Tax-Managed Wealth Appreciation Strategy | ||||||||||||||||||||||||
| Advisor Class | ||||||||||||||||||||||||
Six Months (unaudited) | Year Ended August 31, | |||||||||||||||||||||||
| 2015 | 2014 | 2013 | 2012 | 2011 | ||||||||||||||||||||
|
| |||||||||||||||||||||||
Net asset value, beginning | $ 15.47 | $ 16.58 | $ 13.91 | $ 11.90 | $ 11.42 | $ 10.23 | ||||||||||||||||||
|
| |||||||||||||||||||||||
Income From | ||||||||||||||||||||||||
Net investment | .13 | (b) | .24 | (b) | .37 | (b) | .14 | .14 | .14 | |||||||||||||||
Net realized and | (.86 | ) | (.91 | ) | 2.66 | 1.98 | .53 | 1.21 | ||||||||||||||||
|
| |||||||||||||||||||||||
Net increase (decrease) in | (.73 | ) | (.67 | ) | 3.03 | 2.12 | .67 | 1.35 | ||||||||||||||||
|
| |||||||||||||||||||||||
Less: Dividends and | ||||||||||||||||||||||||
Dividends from net | (.21 | ) | (.30 | ) | (.36 | ) | (.11 | ) | (.19 | ) | (.16 | ) | ||||||||||||
Distributions from net | (.94 | ) | (.14 | ) | – 0 | – | – 0 | – | – 0 | – | – 0 | – | ||||||||||||
|
| |||||||||||||||||||||||
Total dividends and | (1.15 | ) | (.44 | ) | (.36 | ) | (.11 | ) | (.19 | ) | (.16 | ) | ||||||||||||
|
| |||||||||||||||||||||||
Net asset value, end of | $ 13.59 | $ 15.47 | $ 16.58 | $ 13.91 | $ 11.90 | $ 11.42 | ||||||||||||||||||
|
| |||||||||||||||||||||||
Total Return | ||||||||||||||||||||||||
Total investment return | (5.30 | )%* | (4.10 | )%* | 22.08 | % | 17.95 | %* | 6.04 | %* | 13.13 | %* | ||||||||||||
Ratios/Supplemental | ||||||||||||||||||||||||
Net assets, end of period | $609,203 | $648,133 | $687,496 | $585,431 | $552,610 | $511,697 | ||||||||||||||||||
Ratio to average net | ||||||||||||||||||||||||
Expenses, net of | .68 | %(d)^ | .68 | %(d) | .74 | %(d) | .77 | % | .78 | % | .77 | %+ | ||||||||||||
Expenses, before | .76 | %(d)^ | .76 | %(d) | .74 | %(d) | .77 | % | .78 | % | .77 | %+ | ||||||||||||
Net investment | 1.81 | %(b)^ | 1.46 | %(b) | 2.36 | %(b) | 1.09 | % | 1.23 | % | 1.13 | %+ | ||||||||||||
Portfolio turnover rate | 25 | % | 49 | % | 61 | % | 46 | % | 93 | % | 73 | % | ||||||||||||
| See | footnote summary on page 138. |
| AB TAX-MANAGED WEALTH STRATEGIES • | 129 |
Financial Highlights
Selected Data For A Share Of Beneficial Interest Outstanding Throughout Each Period
| AB Tax-Managed Balanced Wealth Strategy | ||||||||||||||||||||||||
| Class A | ||||||||||||||||||||||||
Six Months (unaudited) | Year Ended August 31, | |||||||||||||||||||||||
| 2015 | 2014 | 2013 | 2012 | 2011 | ||||||||||||||||||||
|
| |||||||||||||||||||||||
Net asset value, beginning | $ 13.32 | $ 14.13 | $ 12.87 | $ 12.28 | $ 11.88 | $ 11.29 | ||||||||||||||||||
|
| |||||||||||||||||||||||
Income From | ||||||||||||||||||||||||
Net investment | .11 | (b) | .19 | (b) | .28 | (b) | .17 | .18 | .21 | |||||||||||||||
Net realized and | (.28 | ) | (.49 | ) | 1.24 | .57 | .44 | .63 | ||||||||||||||||
|
| |||||||||||||||||||||||
Net increase (decrease) in | (.17 | ) | (.30 | ) | 1.52 | .74 | .62 | .84 | ||||||||||||||||
|
| |||||||||||||||||||||||
Less: Dividends and Distributions | ||||||||||||||||||||||||
Dividends from net | (.21 | ) | (.06 | ) | (.26 | ) | (.15 | ) | (.22 | ) | (.25 | ) | ||||||||||||
Distributions from net | (.45 | ) | (.45 | ) | – 0 | – | – 0 | – | – 0 | – | – 0 | – | ||||||||||||
|
| |||||||||||||||||||||||
Total dividends and | (.66 | ) | (.51 | ) | (.26 | ) | (.15 | ) | (.22 | ) | (.25 | ) | ||||||||||||
|
| |||||||||||||||||||||||
Net asset value, end of | $ 12.49 | $ 13.32 | $ 14.13 | $ 12.87 | $ 12.28 | $ 11.88 | ||||||||||||||||||
|
| |||||||||||||||||||||||
Total Return | ||||||||||||||||||||||||
Total investment return | (1.42 | )% | (2.19 | )% | 11.89 | % | 6.08 | % | 5.26 | % | 7.39 | % | ||||||||||||
Ratios/Supplemental | ||||||||||||||||||||||||
Net assets, end of period | $74,267 | $79,242 | $95,133 | $89,453 | $97,866 | $115,446 | ||||||||||||||||||
Ratio to average net | ||||||||||||||||||||||||
Expenses, net of | 1.14 | %(d)^ | 1.13 | %(d) | 1.19 | %(d) | 1.24 | % | 1.19 | % | 1.17 | %+ | ||||||||||||
Expenses, before | 1.20 | %(d)^ | 1.18 | %(d) | 1.20 | %(d) | 1.24 | % | 1.19 | % | 1.17 | %+ | ||||||||||||
Net investment | 1.67 | %(b)^ | 1.39 | %(b) | 2.03 | %(b) | 1.32 | % | 1.53 | % | 1.71 | %+ | ||||||||||||
Portfolio turnover rate | 14 | % | 29 | % | 58 | % | 32 | % | 55 | % | 41 | % | ||||||||||||
| See | footnote summary on page 138. |
| 130 | • AB TAX-MANAGED WEALTH STRATEGIES |
Financial Highlights
Selected Data For A Share Of Beneficial Interest Outstanding Throughout Each Period
| AB Tax-Managed Balanced Wealth Strategy | ||||||||||||||||||||||||
| Class B | ||||||||||||||||||||||||
Six Months (unaudited) | Year Ended August 31, | |||||||||||||||||||||||
| 2015 | 2014 | 2013 | 2012 | 2011 | ||||||||||||||||||||
|
| |||||||||||||||||||||||
Net asset value, beginning | $ 13.29 | $ 14.15 | $ 12.90 | $ 12.29 | $ 11.88 | $ 11.30 | ||||||||||||||||||
|
| |||||||||||||||||||||||
Income From | ||||||||||||||||||||||||
Net investment | .06 | (b) | .09 | (b) | .19 | (b) | .08 | .10 | .12 | |||||||||||||||
Net realized and | (.28 | ) | (.50 | ) | 1.24 | .58 | .43 | .62 | ||||||||||||||||
|
| |||||||||||||||||||||||
Net increase (decrease) in | (.22 | ) | (.41 | ) | 1.43 | .66 | .53 | .74 | ||||||||||||||||
|
| |||||||||||||||||||||||
Less: Dividends and | ||||||||||||||||||||||||
Dividends from net | (.02 | ) | – 0 | – | (.18 | ) | (.05 | ) | (.12 | ) | (.16 | ) | ||||||||||||
Distributions from net | (.45 | ) | (.45 | ) | – 0 | – | – 0 | – | – 0 | – | – 0 | – | ||||||||||||
|
| |||||||||||||||||||||||
Total dividends and | (.47 | ) | (.45 | ) | (.18 | ) | (.05 | ) | (.12 | ) | (.16 | ) | ||||||||||||
|
| |||||||||||||||||||||||
Net asset value, end of | $ 12.60 | $ 13.29 | $ 14.15 | $ 12.90 | $ 12.29 | $ 11.88 | ||||||||||||||||||
|
| |||||||||||||||||||||||
Total Return | ||||||||||||||||||||||||
Total investment return | (1.76 | )% | (2.98 | )% | 11.14 | % | 5.39 | % | 4.49 | % | 6.54 | % | ||||||||||||
Ratios/Supplemental | ||||||||||||||||||||||||
Net assets, end of period | $1,778 | $2,322 | $4,631 | $7,066 | $11,386 | $19,606 | ||||||||||||||||||
Ratio to average net | ||||||||||||||||||||||||
Expenses, net of | 1.92 | %(d)^ | 1.88 | %(d) | 1.91 | %(d) | 1.96 | % | 1.91 | % | 1.89 | %+ | ||||||||||||
Expenses, before | 1.98 | %(d)^ | 1.94 | %(d) | 1.91 | %(d) | 1.96 | % | 1.91 | % | 1.89 | %+ | ||||||||||||
Net investment | .88 | %(b)^ | .68 | %(b) | 1.41 | %(b) | .62 | % | .82 | % | .98 | %+ | ||||||||||||
Portfolio turnover rate | 14 | % | 29 | % | 58 | % | 32 | % | 55 | % | 41 | % | ||||||||||||
| See | footnote summary on page 138. |
| AB TAX-MANAGED WEALTH STRATEGIES • | 131 |
Financial Highlights
Selected Data For A Share Of Beneficial Interest Outstanding Throughout Each Period
| AB Tax-Managed Balanced Wealth Strategy | ||||||||||||||||||||||||
| Class C | ||||||||||||||||||||||||
Six Months (unaudited) | Year Ended August 31, | |||||||||||||||||||||||
| 2015 | 2014 | 2013 | 2012 | 2011 | ||||||||||||||||||||
|
| |||||||||||||||||||||||
Net asset value, beginning | $ 13.30 | $ 14.17 | $ 12.92 | $ 12.32 | $ 11.92 | $ 11.33 | ||||||||||||||||||
|
| |||||||||||||||||||||||
Income From | ||||||||||||||||||||||||
Net investment | .06 | (b) | .09 | (b) | .18 | (b) | .08 | .10 | .12 | |||||||||||||||
Net realized and | (.27 | ) | (.50 | ) | 1.25 | .58 | .43 | .63 | ||||||||||||||||
|
| |||||||||||||||||||||||
Net increase (decrease) in | (.21 | ) | (.41 | ) | 1.43 | .66 | .53 | .75 | ||||||||||||||||
|
| |||||||||||||||||||||||
Less: Dividends and | ||||||||||||||||||||||||
Dividends from net | (.10 | ) | (.01 | ) | (.18 | ) | (.06 | ) | (.13 | ) | (.16 | ) | ||||||||||||
Distributions from net | (.45 | ) | (.45 | ) | – 0 | – | – 0 | – | – 0 | – | – 0 | – | ||||||||||||
|
| |||||||||||||||||||||||
Total dividends and | (.55 | ) | (.46 | ) | (.18 | ) | (.06 | ) | (.13 | ) | (.16 | ) | ||||||||||||
|
| |||||||||||||||||||||||
Net asset value, end of | $ 12.54 | $ 13.30 | $ 14.17 | $ 12.92 | $ 12.32 | $ 11.92 | ||||||||||||||||||
|
| |||||||||||||||||||||||
Total Return | ||||||||||||||||||||||||
Total investment return | (1.70 | )% | (2.96 | )% | 11.17 | % | 5.36 | % | 4.48 | % | 6.62 | % | ||||||||||||
Ratios/Supplemental | ||||||||||||||||||||||||
Net assets, end of period | $25,599 | $27,177 | $31,135 | $30,434 | $35,615 | $43,257 | ||||||||||||||||||
Ratio to average net | ||||||||||||||||||||||||
Expenses, net of | 1.89 | %(d)^ | 1.88 | %(d) | 1.90 | %(d) | 1.95 | % | 1.90 | % | 1.87 | %+ | ||||||||||||
Expenses, before | 1.95 | %(d)^ | 1.94 | %(d) | 1.90 | %(d) | 1.95 | % | 1.90 | % | 1.87 | %+ | ||||||||||||
Net investment | .91 | %(b)^ | .63 | %(b) | 1.33 | %(b) | .62 | % | .83 | % | 1.00 | %+ | ||||||||||||
Portfolio turnover rate | 14 | % | 29 | % | 58 | % | 32 | % | 55 | % | 41 | % | ||||||||||||
See footnote summary on page 138.
| 132 | • AB TAX-MANAGED WEALTH STRATEGIES |
Financial Highlights
Selected Data For A Share Of Beneficial Interest Outstanding Throughout Each Period
| AB Tax-Managed Balanced Wealth Strategy | ||||||||||||||||||||||||
| Advisor Class | ||||||||||||||||||||||||
Six Months (unaudited) | Year Ended August 31, | |||||||||||||||||||||||
| 2015 | 2014 | 2013 | 2012 | 2011 | ||||||||||||||||||||
|
| |||||||||||||||||||||||
Net asset value, beginning | $ 13.36 | $ 14.16 | $ 12.88 | $ 12.29 | $ 11.89 | $ 11.31 | ||||||||||||||||||
|
| |||||||||||||||||||||||
Income From | ||||||||||||||||||||||||
Net investment | .12 | (b) | .22 | (b) | .31 | (b) | .21 | .22 | .25 | |||||||||||||||
Net realized and | (.26 | ) | (.49 | ) | 1.26 | .57 | .44 | .61 | ||||||||||||||||
|
| |||||||||||||||||||||||
Net increase (decrease) in | (.14 | ) | (.27 | ) | 1.57 |
| .78 |
| .66 | .86 | ||||||||||||||
|
| |||||||||||||||||||||||
Less: Dividends and | ||||||||||||||||||||||||
Dividends from net | (.25 | ) | (.08 | ) | (.29 | ) | (.19 | ) | (.26 | ) | (.28 | ) | ||||||||||||
Distributions from net | (.45 | ) | (.45 | ) | – 0 | – | – 0 | – | – 0 | – | – 0 | – | ||||||||||||
|
| |||||||||||||||||||||||
Total dividends and | (.70 | ) | (.53 | ) | (.29 | ) | (.19 | ) | (.26 | ) | (.28 | ) | ||||||||||||
|
| |||||||||||||||||||||||
Net asset value, end of | $ 12.52 | $ 13.36 | $ 14.16 | $ 12.88 | $ 12.29 | $ 11.89 | ||||||||||||||||||
|
| |||||||||||||||||||||||
Total Return | ||||||||||||||||||||||||
Total investment return | (1.20 | )% | (1.96 | )% | 12.29 | % | 6.37 | % | 5.58 | % | 7.59 | % | ||||||||||||
Ratios/Supplemental | ||||||||||||||||||||||||
Net assets, end of period | $38,579 | $40,917 | $40,249 | $27,789 | $22,824 | $17,257 | ||||||||||||||||||
Ratio to average net | ||||||||||||||||||||||||
Expenses, net of | .89 | %(d)^ | .88 | %(d) | .89 | %(d) | .94 | % | .90 | % | .87 | %+ | ||||||||||||
Expenses, before | .95 | %(d)^ | .94 | %(d) | .90 | %(d) | .94 | % | .90 | % | .87 | %+ | ||||||||||||
Net investment | 1.91 | %(b)^ | 1.61 | %(b) | 2.24 | %(b) | 1.60 | % | 1.83 | % | 2.02 | %+ | ||||||||||||
Portfolio turnover rate | 14 | % | 29 | % | 58 | % | 32 | % | 55 | % | 41 | % | ||||||||||||
See footnote summary on page 138.
| AB TAX-MANAGED WEALTH STRATEGIES • | 133 |
Financial Highlights
Selected Data For A Share Of Beneficial Interest Outstanding Throughout Each Period
| AB Tax-Managed Conservative Wealth Strategy | ||||||||||||||||||||||||
| Class A | ||||||||||||||||||||||||
Six Months (unaudited) | Year Ended August 31, | |||||||||||||||||||||||
| 2015 | 2014 | 2013 | 2012 | 2011 | ||||||||||||||||||||
|
| |||||||||||||||||||||||
Net asset value, beginning | $ 11.27 | $ 11.90 | $ 11.47 | $ 11.19 | $ 10.94 | $ 10.59 | ||||||||||||||||||
|
| |||||||||||||||||||||||
Income From | ||||||||||||||||||||||||
Net investment | .08 | .13 | .17 | .10 | .13 | .16 | ||||||||||||||||||
Net realized and | (.17 | ) | (.33 | ) | .72 | .27 | .27 | .39 | ||||||||||||||||
|
| |||||||||||||||||||||||
Net increase (decrease) in | (.09 | ) | (.20 | ) | .89 | .37 | .40 | .55 | ||||||||||||||||
|
| |||||||||||||||||||||||
Less: Dividends and | ||||||||||||||||||||||||
Dividends from net | (.21 | ) | (.04 | ) | (.16 | ) | (.09 | ) | (.15 | ) | (.20 | ) | ||||||||||||
Distributions from net | (.32 | ) | (.39 | ) | (.30 | ) | – 0 | – | – 0 | – | – 0 | – | ||||||||||||
|
| |||||||||||||||||||||||
Total dividends and | (.53 | ) | (.43 | ) | (.46 | ) | (.09 | ) | (.15 | ) | (.20 | ) | ||||||||||||
|
| |||||||||||||||||||||||
Net asset value, end of | $ 10.65 | $ 11.27 | $ 11.90 | $ 11.47 | $ 11.19 | $ 10.94 | ||||||||||||||||||
|
| |||||||||||||||||||||||
Total Return | ||||||||||||||||||||||||
Total investment return | (.87 | )%* | (1.63 | )%* | 7.89 | % | 3.30 | %* | 3.72 | %* | 5.19 | % | ||||||||||||
Ratios/Supplemental Data | ||||||||||||||||||||||||
Net assets, end of period | $28,604 | $30,770 | $36,605 | $40,879 | $45,221 | $54,035 | ||||||||||||||||||
Ratio to average net | ||||||||||||||||||||||||
Expenses, net of | 1.10 | %(d)^ | 1.12 | %(d) | 1.19 | %(d) | 1.20 | % | 1.20 | % | 1.20 | %+ | ||||||||||||
Expenses, before | 1.80 | %(d)^ | 1.72 | %(d) | 1.60 | %(d) | 1.56 | % | 1.47 | % | 1.35 | %+ | ||||||||||||
Net investment | 1.38 | %^ | 1.14 | % | 1.44 | % | .85 | % | 1.18 | % | 1.49 | %+ | ||||||||||||
Portfolio turnover rate | 16 | % | 24 | % | 31 | % | 29 | % | 51 | % | 37 | % | ||||||||||||
See footnote summary on page 138.
| 134 | • AB TAX-MANAGED WEALTH STRATEGIES |
Financial Highlights
Selected Data For A Share Of Beneficial Interest Outstanding Throughout Each Period
| AB Tax-Managed Conservative Wealth Strategy | ||||||||||||||||||||||||
| Class B | ||||||||||||||||||||||||
Six Months (unaudited) | Year Ended August 31, | |||||||||||||||||||||||
| 2015 | 2014 | 2013 | 2012 | 2011 | ||||||||||||||||||||
|
| |||||||||||||||||||||||
Net asset value, beginning | $ 11.55 | $ 12.22 | $ 11.78 | $ 11.50 | $ 11.23 | $ 10.86 | ||||||||||||||||||
|
| |||||||||||||||||||||||
Income From | ||||||||||||||||||||||||
Net investment | .04 | .06 | .10 | .02 | .06 | .09 | ||||||||||||||||||
Net realized and | (.17 | ) | (.34 | ) | .73 | .28 | .27 | .40 | ||||||||||||||||
|
| |||||||||||||||||||||||
Net increase (decrease) in | (.13 | ) | (.28 | ) | .83 | .30 | .33 | .49 | ||||||||||||||||
|
| |||||||||||||||||||||||
Less: Dividends and | ||||||||||||||||||||||||
Dividends from net | (.06 | ) | – 0 | – | (.09 | ) | (.02 | ) | (.06 | ) | (.12 | ) | ||||||||||||
Distributions from net | (.32 | ) | (.39 | ) | (.30 | ) | – 0 | – | – 0 | – | – 0 | – | ||||||||||||
|
| |||||||||||||||||||||||
Total dividends and | (.38 | ) | (.39 | ) | (.39 | ) | (.02 | ) | (.06 | ) | (.12 | ) | ||||||||||||
|
| |||||||||||||||||||||||
Net asset value, end of | $ 11.04 | $ 11.55 | $ 12.22 | $ 11.78 | $ 11.50 | $ 11.23 | ||||||||||||||||||
|
| |||||||||||||||||||||||
Total Return | ||||||||||||||||||||||||
Total investment return | (1.17 | )%* | (2.30 | )%* | 7.17 | % | 2.57 | %* | 2.93 | %* | 4.46 | % | ||||||||||||
Ratios/Supplemental | ||||||||||||||||||||||||
Net assets, end of period | $582 | $785 | $1,298 | $2,629 | $4,562 | $7,758 | ||||||||||||||||||
Ratio to average net | ||||||||||||||||||||||||
Expenses, net of | 1.82 | %(d)^ | 1.82 | %(d) | 1.89 | %(d) | 1.90 | % | 1.90 | % | 1.90 | %+ | ||||||||||||
Expenses, before | 2.53 | %(d)^ | 2.43 | %(d) | 2.31 | %(d) | 2.26 | % | 2.20 | % | 2.07 | %+ | ||||||||||||
Net investment | .63 | %^ | .46 | % | .84 | % | .16 | % | .50 | % | .78 | %+ | ||||||||||||
Portfolio turnover rate | 16 | % | 24 | % | 31 | % | 29 | % | 51 | % | 37 | % | ||||||||||||
See footnote summary on page 138.
| AB TAX-MANAGED WEALTH STRATEGIES • | 135 |
Financial Highlights
Selected Data For A Share Of Beneficial Interest Outstanding Throughout Each Period
| AB Tax-Managed Conservative Wealth Strategy | ||||||||||||||||||||||||
| Class C | ||||||||||||||||||||||||
Six Months February 29, (unaudited) | Year Ended August 31, | |||||||||||||||||||||||
| 2015 | 2014 | 2013 | 2012 | 2011 | ||||||||||||||||||||
|
| |||||||||||||||||||||||
Net asset value, beginning | $ 11.55 | $ 12.22 | $ 11.78 | $ 11.51 | $ 11.24 | $ 10.88 | ||||||||||||||||||
|
| |||||||||||||||||||||||
Income From | ||||||||||||||||||||||||
Net investment | .04 | .05 | .09 | .02 | .05 | .09 | ||||||||||||||||||
Net realized and | (.17 | ) | (.33 | ) | .74 | .27 | .29 | .39 | ||||||||||||||||
|
| |||||||||||||||||||||||
Net increase (decrease) in | (.13 | ) | (.28 | ) | .83 | .29 | .34 | .48 | ||||||||||||||||
|
| |||||||||||||||||||||||
Less: Dividends and | ||||||||||||||||||||||||
Dividends from net | (.12 | ) | (.00 | )(e) | (.09 | ) | (.02 | ) | (.07 | ) | (.12 | ) | ||||||||||||
Distributions from net | (.32 | ) | (.39 | ) | (.30 | ) | – 0 | – | – 0 | – | – 0 | – | ||||||||||||
|
| |||||||||||||||||||||||
Total dividends and | (.44 | ) | (.39 | ) | (.39 | ) | (.02 | ) | (.07 | ) | (.12 | ) | ||||||||||||
|
| |||||||||||||||||||||||
Net asset value, end of | $ 10.98 | $ 11.55 | $ 12.22 | $ 11.78 | $ 11.51 | $ 11.24 | ||||||||||||||||||
|
| |||||||||||||||||||||||
Total Return | ||||||||||||||||||||||||
Total investment return | (1.21 | )%* | (2.28 | )%* | 7.20 | % | 2.53 | %* | 3.02 | %* | 4.37 | % | ||||||||||||
Ratios/Supplemental | ||||||||||||||||||||||||
Net assets, end of period | $11,597 | $12,160 | $14,682 | $15,498 | $18,499 | $22,580 | ||||||||||||||||||
Ratio to average net | ||||||||||||||||||||||||
Expenses, net of | 1.82 | %(d)^ | 1.82 | %(d) | 1.89 | %(d) | 1.90 | % | 1.90 | % | 1.90 | %+ | ||||||||||||
Expenses, before | 2.52 | %(d)^ | 2.42 | %(d) | 2.30 | %(d) | 2.26 | % | 2.17 | % | 2.05 | %+ | ||||||||||||
Net investment | .67 | %^ | .45 | % | .73 | % | .16 | % | .48 | % | .79 | %+ | ||||||||||||
Portfolio turnover rate | 16 | % | 24 | % | 31 | % | 29 | % | 51 | % | 37 | % | ||||||||||||
See footnote summary on page 138.
| 136 | • AB TAX-MANAGED WEALTH STRATEGIES |
Financial Highlights
Selected Data For A Share Of Beneficial Interest Outstanding Throughout Each Period
| AB Tax-Managed Conservative Wealth Strategy | ||||||||||||||||||||||||
| Advisor Class | ||||||||||||||||||||||||
Six Months (unaudited) | Year Ended August 31, | |||||||||||||||||||||||
| 2015 | 2014 | 2013 | 2012 | 2011 | ||||||||||||||||||||
|
| |||||||||||||||||||||||
Net asset value, beginning | $ 11.33 | $ 11.94 | $ 11.50 | $ 11.21 | $ 10.96 | $ 10.61 | ||||||||||||||||||
|
| |||||||||||||||||||||||
Income From | ||||||||||||||||||||||||
Net investment | .09 | .16 | .20 | .13 | .16 | .20 | ||||||||||||||||||
Net realized and | (.16 | ) | (.32 | ) | .72 | .27 | .28 | .38 | ||||||||||||||||
|
| |||||||||||||||||||||||
Net increase (decrease) in | (.07 | ) | (.16 | ) | .92 | .40 | .44 | .58 | ||||||||||||||||
|
| |||||||||||||||||||||||
Less: Dividends and | ||||||||||||||||||||||||
Dividends from net | (.25 | ) | (.06 | ) | (.18 | ) | (.11 | ) | (.19 | ) | (.23 | ) | ||||||||||||
Distributions from net | (.32 | ) | (.39 | ) | (.30 | ) | – 0 | – | – 0 | – | – 0 | – | ||||||||||||
|
| |||||||||||||||||||||||
Total dividends and | (.57 | ) | (.45 | ) | (.48 | ) | (.11 | ) | (.19 | ) | (.23 | ) | ||||||||||||
|
| |||||||||||||||||||||||
Net asset value, end of | $ 10.69 | $ 11.33 | $ 11.94 | $ 11.50 | $ 11.21 | $ 10.96 | ||||||||||||||||||
|
| |||||||||||||||||||||||
Total Return | ||||||||||||||||||||||||
Total investment return | (.73 | )%* | (1.31 | )%* | 8.20 | % | 3.62 | %* | 4.04 | %* | 5.51 | % | ||||||||||||
Ratios/Supplemental | ||||||||||||||||||||||||
Net assets, end of period | $3,924 | $5,178 | $5,274 | $5,734 | $4,909 | $4,913 | ||||||||||||||||||
Ratio to average net | ||||||||||||||||||||||||
Expenses, net of | .82 | %(d)^ | .82 | %(d) | .89 | %(d) | .90 | % | .90 | % | .90 | %+ | ||||||||||||
Expenses, before | 1.51 | %(d)^ | 1.42 | %(d) | 1.29 | %(d) | 1.26 | % | 1.17 | % | 1.05 | %+ | ||||||||||||
Net investment | 1.66 | %^ | 1.41 | % | 1.74 | % | 1.15 | % | 1.47 | % | 1.79 | %+ | ||||||||||||
Portfolio turnover rate | 16 | % | 24 | % | 31 | % | 29 | % | 51 | % | 37 | % | ||||||||||||
| See | footnote summary on page 138. |
| AB TAX-MANAGED WEALTH STRATEGIES • | 137 |
Financial Highlights
| (a) | Based on average shares outstanding. |
| (b) | Net of fees and expenses waived/reimbursed by the Adviser. |
| (c) | Total investment return is calculated assuming an initial investment made at the net asset value at the beginning of the period, reinvestment of all dividends and distributions at net asset value during the period, and redemption on the last day of the period. Initial sales charges or contingent deferred sales charges are not reflected in the calculation of total investment return. Total return does not reflect the deduction of taxes that a shareholder would pay on Strategy distributions or the redemption of Strategy shares. Total investment return calculated for a period of less than one year is not annualized. |
| (d) | Expense ratios do not include expenses of PPVM, PPMRR and MMAS in which the Strategy invests. For the periods shown below, the estimated annualized blended expense ratios of PPVM, PPMRR and MMAS, including interest expense, were as follows: |
| Six Months Ended February 29, 2016 (unaudited) | Year Ended August 31, | |||||||||||
| 2015 | 2014 | |||||||||||
AB Tax-Managed Wealth Appreciation Strategy | .22 | %^ | .23 | % | .01 | % | ||||||
AB Tax-Managed Balanced Wealth Strategy | .17 | %^ | .17 | % | .01 | % | ||||||
AB Tax-Managed Conservative Wealth Strategy | .11 | %^ | .11 | % | .01 | % | ||||||
| (e) | Amount is less than $.005. |
| * | Includes the impact of proceeds received and credited to the Strategy resulting from class action settlements, which enhanced the performance for AB Tax-Managed Wealth Appreciation Strategy for the six months ended February 29, 2016, and for years ended August 31, 2015, August 31, 2013, August 31, 2012, and August 31, 2011 by 0.01%, 0.04%, 0.01%, 0.01% and 0.01%, respectively, AB Tax-Managed Balanced Wealth Strategy for the six months ended February 29, 2016, and for the years ended August 31, 2015, August 31, 2014, August 31, 2013, August 31, 2012, and August 31, 2011 by 0.01%, 0.05%, 0.01%, 0.01%, 0.02% and 0.01%, respectively, and AB Tax-Managed Conservative Wealth Strategy for the six months ended February 29, 2016, and for the years ended August 31, 2015, August 31, 2013 and August 31, 2012 by 0.01%, 0.04% 0.01% , and 0.01%, respectively. |
| ^ | Annualized. |
| + | The ratio includes expenses attributable to costs of proxy solicitation. |
See notes to financial statements.
| 138 | • AB TAX-MANAGED WEALTH STRATEGIES |
Financial Highlights
TRUSTEES
Marshall C. Turner, Jr.(1), Chairman John H. Dobkin(1) Michael J. Downey(1) William H. Foulk, Jr.(1) D. James Guzy(1) | Nancy P. Jacklin(1) Robert M. Keith, President and Garry L. Moody(1) Earl D. Weiner(1) |
OFFICERS
Philip L. Kirstein, Senior Vice President and Independent Compliance Officer Daniel J. Loewy(2), Vice President Christopher H. Nikolich(2), Vice President | Vadim Zlotnikov(2), Vice President Emilie D. Wrapp, Clerk Joseph J. Mantineo, Treasurer and Chief Financial Officer Phyllis J. Clarke, Controller and Chief Accounting Officer Vincent S. Noto, Chief Compliance Officer |
Custodian and Accounting Agent State Street Bank and Trust Company State Street Corporation CCB/5 1 Iron Street Boston, MA 02210
Principal Underwriter AllianceBernstein Investments, Inc. 1345 Avenue of the Americas New York, NY 10105
Legal Counsel Seward & Kissel LLP One Battery Park Plaza New York, NY 10004 | Transfer Agent AllianceBernstein Investor Services, Inc. P.O. Box 786003 San Antonio, TX 78278-6003 Toll-Free (800) 221-5672
Independent Registered Public Accounting Firm Ernst & Young LLP 5 Times Square New York, NY 10036 |
| (1) | Member of the Audit Committee, the Governance and Nominating Committee and the Independent Directors Committee. |
| (2) | The day-to-day management of, and investment decisions for, each Strategy’s portfolio are made by the Adviser’s Multi-Asset Solutions Team. Messrs. Loewy, Nikolich and Zlotnikov are the investment professionals primarily responsible for the day-to-day management of each Strategy’s portfolio. |
| AB TAX-MANAGED WEALTH STRATEGIES • | 139 |
Trustees
THE FOLLOWING IS NOT PART OF THE SHAREHOLDER REPORT OR THE FINANCIAL STATEMENTS
SUMMARY OF SENIOR OFFICER’S EVALUATION OF INVESTMENT ADVISORY AGREEMENT1
The following is a summary of the evaluation of the Investment Advisory Agreement between AllianceBernstein L.P. (the “Adviser”) and The AB Portfolios (the “Trust”) in respect of AB Tax-Managed Balanced Wealth Strategy, AB Tax-Managed Wealth Appreciation Strategy and AB Tax-Managed Conservative Wealth Strategy (each a “Strategy” and collectively the “Strategies”),2 prepared by Philip L. Kirstein, the Senior Officer of the Trust for the Board of Trustees, as required by the August 2004 agreement between the Adviser and the New York State Attorney General (the “NYAG”). The Senior Officer’s evaluation of the Investment Advisory Agreement is not meant to diminish the responsibility or authority of the Board of Trustees of the Trust to perform its duties pursuant to Section 15 of the Investment Company Act of 1940 (the “40 Act”) and applicable state law. The purpose of the summary is to provide shareholders with a synopsis of the independent evaluation of the reasonableness of the advisory fees proposed to be paid by the Strategies which was provided to the Trustees in connection with their review of the proposed approval of the continuance of the Investment Advisory Agreement.
The investment objective of the Strategies is to achieve the highest total return consistent with the Adviser’s determination of reasonable risk. The Strategies seek to maximize after-tax returns by pursuing a number of strategies that take into account the tax impact of buy and sell investment decisions on shareholders as well as investing their debt portion in tax-exempt securities. The Adviser utilizes separate portfolio accounts (or “portfolio sleeves”) to manage the equity and fixed income (tax-exempt) securities of the Strategies, while investing in AB Multi-Manager Alternative Strategies Fund (“MMAS”), Multi-Asset Real Return Portfolio, and Volatility Management Portfolio of The Pooling Portfolios to manage the Strategies’ volatility created by the equity and fixed income (tax-exempt) securities of the Strategies.3,4 Each portfolio sleeve is managed according to the investment style/asset class of the portfolio securities held within the sleeve.
| 1 | The information in the fee evaluation was completed on July 23, 2015 and discussed with the Board of Trustees on August 4-5, 2015. |
| 2 | Future references to the Strategies do not include “AB.” References in the fee summary pertaining to performance and expense ratios refer to Class A shares of the Strategies. |
| 3 | Since August 2014, the Strategies had the ability to invest a portion of their investments in Multi-Asset Real Return Portfolio of The Pooling Portfolios. |
| 4 | To cite an example, Tax-Managed Balanced Wealth Strategy is managed using separate sleeves for Intermediate Municipal, Tax-Aware Intermediate Municipals, U.S. Growth, U.S. Value, Non-U.S. Growth and Non-U.S. Value, and investing in Volatility Management Portfolio. |
| 140 | • AB TAX-MANAGED WEALTH STRATEGIES |
The Senior Officer’s evaluation considered the following factors:
| 1. | Advisory fees charged to institutional and other clients of the Adviser for like services; |
| 2. | Advisory fees charged by other mutual fund companies for like services; |
| 3. | Costs to the Adviser and its affiliates of supplying services pursuant to the advisory agreement, excluding any intra-corporate profit; |
| 4. | Profit margins of the Adviser and its affiliates from supplying such services; |
| 5. | Possible economies of scale as the Strategies grow larger; and |
| 6. | Nature and quality of the Adviser’s services including the performance of the Strategies. |
These factors, with the exception of the first factor, are generally referred to as the “Gartenberg factors,” which were articulated by the United States Court of Appeals for the Second Circuit in 1982. Gartenberg v. Merrill Lynch Asset Management, Inc., 694 F. 2d 923 (2d Cir. 1982). On March 30, 2010, the Supreme Court held the Gartenberg decision was correct in its basic formulation of what Section 36(b) requires: to face liability under Section 36(b), “an investment adviser must charge a fee that is so disproportionately large that it bears no reasonable relationship to the services rendered and could not have been the product of arm’s length bargaining.” Jones v. Harris Associates L.P., 130 S. Ct. 1418 (2010). In Jones, the Court stated the Gartenberg approach fully incorporates the correct understanding of fiduciary duty within the context of Section 36(b) and noted with approval that “Gartenberg insists that all relevant circumstances be taken into account” and “uses the range of fees that might result from arm’s length bargaining as the benchmark for reviewing challenged fees.”5
ADVISORY FEES, NET ASSETS, & EXPENSE RATIOS
The Adviser proposed that each Strategy pays the advisory fee set forth in the table below for receiving the services to be provided pursuant to the Investment Advisory Agreement. The fee schedule below, implemented in January 2004 in consideration of the Adviser’s settlement with the NYAG in December 2003, is based on a master schedule that contemplates eight categories of funds with almost all funds in each category having the same advisory fee schedule.6
In connection with the Strategies’ investments in MMAS, the Adviser will waive its advisory fee from each Strategy in an amount equal to the portion of the MMAS management fee that the Adviser retains – i.e., does not pay to MMAS’ sub-advisers, except for Tax-Managed Conservative Wealth Strategy. Specifically,
| 5 | Jones v. Harris at 1427. |
| 6 | Most of the AB Mutual Funds, which the Adviser manages, were affected by the Adviser’s settlement with the NYAG. |
| AB TAX-MANAGED WEALTH STRATEGIES • | 141 |
MMAS’ management fee is 1.90%, and out of this fee, the Adviser will generally pay the sub-advisers a fee of 1.00%. Accordingly, the MMAS management fee rate for each Strategy, except for Tax-Managed Conservative Wealth, would be reduced by approximately 0.90%. The Adviser will also waive other MMAS fees and operating expenses until December 31, 2015.7 The shareholders of the Strategies will indirectly bear their proportionate share of the portion of the management fee that is paid to the sub-advisers as well as other MMAS expenses. To the extent that a sub-advisory fee is greater or less than the 1.00% rate agreed to by all of the proposed initial MMAS sub-advisers, the amount of the advisory fee retained by the Adviser and, therefore, the amount of the Adviser’s fee waiver would change. In addition to the foregoing, the Adviser intends to waive additional fees payable by the Strategies for a period of at least one year in order to eliminate the expense ratio impact of MMAS’ non-advisory other fees and expenses.
With respect to Tax-Managed Conservative Wealth Strategy, pursuant to the Strategy’s expense limitation undertaking, the Strategies’ Class A expenses are capped at 1.20%; Class B and Class C expenses are capped at 1.90%; and Advisor Class expenses are capped at 0.90%. The Strategy’s share of the advisory fee paid by MMAS is subject to the Strategy’s expense cap, but not of the other operating expenses of MMAS and the Multi-Asset Real Return Portfolio of The Pooling Portfolios, resulting in a minimal increase in the expenses borne by the Strategy of approximately 0.01%.
| Category | Advisory Fees Based on a percentage of | Net 6/30/15 ($MIL) | Strategy | |||||
| Balanced | 0.55% on 1st $2.5 billion 0.45% on next $2.5 billion 0.40% on the balance | $ | 157.4 | Tax-Managed Balanced Wealth Strategy | ||||
| Blend | 0.65% on 1st $2.5 billion 0.55% on next $2.5 billion 0.50% on the balance | $ | 746.5 | Tax-Managed Wealth Appreciation Strategy | ||||
| Balanced | 0.55% on 1st $2.5 billion 0.45% on next $2.5 billion 0.40% on the balance | $ | 50.4 | Tax-Managed Conservative Wealth Strategy | ||||
With respect to Tax-Managed Wealth Appreciation Strategy, the Strategy’s Investment Advisory Agreement provides for the Adviser to be reimbursed for certain clerical, legal, accounting, administrative and other services provided to the Strategy. In May 2015, the Board authorized reimbursement payments under these provisions for the first time.
| 7 | The impact of the other MMAS fees and operating expenses waiver for each Strategy will range up to 1 basis point, depending on the size of the Strategy. |
| 142 | • AB TAX-MANAGED WEALTH STRATEGIES |
The Adviser has agreed to reimburse Tax-Managed Conservative Wealth Strategy for that portion of the Strategy’s total operating expenses to the degree necessary to limit the Strategy’s expense ratios to the amounts set forth below for the Strategy’s fiscal year. The terms of the expense limitation undertaking permit modification or termination by the Adviser upon at least 60 days’ notice prior to the Strategy’s prospectus update. Set forth below are Tax-Managed Conservative Wealth Strategy’s gross expense ratios for the most recent semi-annual period:8
Expense Cap Pursuant to Expense Limitation Undertaking9 | Acquired Fund Fees and Expenses | Fiscal Year End | ||||||||||||||||||
| Strategy | Cap | Net | Gross | |||||||||||||||||
| Tax-Managed Conservative Wealth Strategy10,11 | Class A Class B Class C Advisor |
| 1.15 1.90 1.90 0.90 | % % % % |
| 1.16 1.86 1.86 0.86 | % % % % |
| 1.70 2.42 2.41 1.40 | % % % % |
| 0.04 0.04 0.04 0.04 | % % % % | August 31 (ratios as of February 28, 2015) | ||||||
Set forth below are Tax-Managed Balanced Wealth and Tax-Managed Wealth Appreciation Strategy’s total expense ratios for the most recent semi-annual period:8
| Total Expense Ratio9 | Acquired Fund Fees and Expenses | Fiscal Year End | ||||||||||||||
| Strategy | Net | Gross | ||||||||||||||
| Tax-Managed Balanced Wealth Strategy12 | Class A Class B Class C Advisor |
| 1.24 2.01 2.00 0.99 | % % % % |
| 1.30 2.06 2.05 1.05 | % % % % |
| 0.15 0.15 0.15 0.15 | % % % % | August 31 (ratios as of February 28, 2015) | |||||
| Tax-Managed Wealth Appreciation Strategy12 | Class A Class B Class C Advisor |
| 1.13 1.90 1.88 0.88 | % % % % |
| 1.21 1.98 1.96 0.96 | % % % % |
| 0.21 0.21 0.21 0.21 | % % % % | August 31 (ratios as of February 28, 2015) | |||||
| 8 | Semi-annual total expense ratios are unaudited. |
| 9 | Includes acquired fund fees and expenses. |
| 10 | Prior to August 1, 2014, the expense cap of the Strategy’s Class A shares was 1.20%. The new expense cap reflects the reduction of 12b-1 fees from 0.30% to 0.25% effective August 1, 2014. |
| 11 | Under the Strategy’s expense limitation undertaking, the Strategy’s share of the advisory fee paid by MMAS would be subject to the Strategy’s expense cap, but not of the other operating expenses of MMAS and the Multi-Asset Real Return Portfolio of The Pooling Portfolios, resulting in a minimal increase in the expenses borne by the Strategy of approximately 0.01%. |
| 12 | The semi-annual total expense ratio for the Strategy’s Class A shares reflects the reduction in 12b-1 fees from 0.30% to 0.25% effective August 1, 2014. |
| AB TAX-MANAGED WEALTH STRATEGIES • | 143 |
| I. | ADVISORY FEES CHARGED TO INSTITUTIONAL AND OTHER CLIENTS |
The advisory fees charged to investment companies which the Adviser manages and sponsors are normally higher than those charged to similar sized institutional accounts, including pension plans and sub-advised investment companies. The fee differential reflects, among other things, different services provided to such clients, and different liabilities assumed. Services provided by the Adviser to the Strategies that are not provided to non-investment company clients and sub-advised investment companies include providing office space and personnel to serve as Fund Officers, who among other responsibilities make the certifications required under the Sarbanes–Oxley Act of 2002, and coordinating with and monitoring the Strategies’ third party service providers such as Fund counsel, auditors, custodians, transfer agents and pricing services. The accounting, administrative, legal and compliance requirements for the Strategies are more costly than those for institutional assets due to the greater complexities and time required for investment companies, although as previously noted, Tax-Managed Wealth Appreciation is entitled to be reimbursed for providing some of these services. Also, retail mutual funds managed by the Adviser are widely held. Servicing the Strategies’ investors is more time consuming and labor intensive compared to institutional clients since the Adviser needs to communicate with a more extensive network of financial intermediaries and shareholders. The Adviser also believes that it incurs substantial entrepreneurial risk when offering a new mutual fund since establishing a new mutual fund requires a large upfront investment and it may take a long time for the fund to achieve profitability since the fund must be priced to scale from inception in order to be competitive and assets are acquired one account at a time. In addition, managing the cash flow of an investment company may be more difficult than managing that of a stable pool of assets, such as an institutional account with little cash movement in either direction, particularly, if a fund is in net redemption and the Adviser is frequently forced to sell securities to raise cash for redemptions. However, managing a fund with positive cash flow may be easier at times than managing a stable pool of assets. Finally, in recent years, investment advisers have been sued by institutional clients and have suffered reputational damage both by the attendant publicity and outcomes other than complete victories. Accordingly, the legal and reputational risks associated with institutional accounts are greater than previously thought, although still not equal to those related to the mutual fund industry.
Notwithstanding the Adviser’s view that managing an investment company is not comparable to managing other institutional accounts because the services provided are different, the Supreme Court has indicated consideration should be given to the advisory fees charged to institutional accounts with a similar investment style as the Strategies.13 However, the Adviser represented that there are no categories in the Form ADV for institutional products that have a substantially similar investment style as any of the Strategies.
| 13 | The Supreme Court stated that “courts may give such comparisons the weight that they merit in light of the similarities and differences between the services that the clients in question require, but the courts must be wary of inapt comparisons.” Among the significant differences the Supreme Court noted that may exist between services provided to mutual funds and institutional accounts are “higher marketing costs.” Jones v. Harris at 1428. |
| 144 | • AB TAX-MANAGED WEALTH STRATEGIES |
The Adviser represented that it does not sub-advise any registered investment companies with a substantially similar investment style as any of the Strategies.
| II. | MANAGEMENT FEES CHARGED BY OTHER MUTUAL FUND COMPANIES FOR LIKE SERVICES. |
Lipper, Inc. (“Lipper”), an analytical service that is not affiliated with the Adviser, compared the fees charged to the Strategies with fees charged to other investment companies for similar services offered by other investment advisers.14 Lipper’s analysis included the comparison of each Strategy’s contractual management fee, estimated at the approximate current asset level of the Strategy, to the median of the Strategy’s Lipper Expense Group (“EG”)15 and the Strategy’s contractual management fee ranking.16
Lipper describes an EG as a representative sample of comparable funds. Lipper’s standard methodology for screening funds to be included in an EG entails the consideration of several fund criteria, including fund type, investment classification/objective, load type and similar 12b-1/non-12b-1 service fees, asset (size) comparability, expense components, operating structure, and expense attributes. An EG will typically consist of seven to twenty funds.
| Strategy | Contractual Management Fee (%)17 | Lipper EG Median (%) | Lipper EG Rank | |||||||
| Tax-Managed Balanced Wealth Strategy | 0.550 | 0.650 | 1/10 | |||||||
| Tax-Managed Wealth Appreciation Strategy | 0.650 | 0.915 | 1/11 | |||||||
| Tax-Managed Conservative Wealth Strategy | 0.550 | 0.650 | 3/11 | |||||||
To reflect the Strategies’ investment in MMAS, Lipper also compared each Strategy’s most recently completed semi-annual total expense ratio to the medians of the Strategy’s EG and Lipper Expense Universe (“EU”). The EU is as a broader
| 14 | The Supreme Court cautioned against accepting mutual fund fee comparisons without careful scrutiny since “these comparisons are problematic because these fees, like those challenged, may not be the product of the negotiations conducted at arm’s-length.” Jones v. Harris at 1429. |
| 15 | Lipper does not consider average account size when constructing EGs. Funds with relatively small average account sizes tend to have higher transfer agent expense ratio than comparable sized funds that have relatively large average account sizes. There are limitations to Lipper expense category data because different funds categorize expenses differently. |
| 16 | The contractual management fee is calculated by Lipper using each Strategy’s contractual management fee rate at a hypothetical asset level. The hypothetical asset level is based on the combined net assets of all classes of each Strategy, rounded up to the next $25 million. Lipper’s total expense ratio information is based on the most recent annual report except as otherwise noted. A ranking of “1” would mean that the Strategy had the lowest effective fee rate in the Lipper peer group. |
| 17 | The contractual management fee does not reflect any advisory fee waiver or expense reimbursements for expense caps that would effectively reduce the actual management fee. |
| AB TAX-MANAGED WEALTH STRATEGIES • | 145 |
group compared to the EG, consisting of all funds that have the same investment classification/objective and load type as the subject Strategy.18 The Strategies’ total expense ratio rankings are also shown below:
| Strategy | Total Expense Ratio (%)19 | Lipper EG | Lipper EG Rank | Lipper EU Median (%) | Lipper EU Rank | |||||||||||
| Tax-Managed Balanced Wealth Strategy | 1.243 | 1.174 | 8/10 | 1.129 | 27/38 | |||||||||||
| Tax-Managed Wealth Appreciation Strategy | 1.129 | 1.416 | 1/11 | 1.419 | 5/37 | |||||||||||
| Tax-Managed Conservative Wealth Strategy | 1.156 | 1.080 | 10/11 | 1.063 | 23/26 | |||||||||||
Based on the information provided, the Strategies have lower contractual management fees than their respective EG medians. Except for Tax-Managed Wealth Appreciation Strategy, whose total expense ratio is lower than the Strategy’s EG median, the Strategies have a higher total expense ratio than each of their respective EG medians.
| III. | COSTS TO THE ADVISER AND ITS AFFILIATES OF SUPPLYING SERVICES PURSUANT TO THE MANAGEMENT FEE ARRANGEMENT, EXCLUDING ANY INTRA-CORPORATE PROFIT. |
The Adviser utilizes two profitability reporting systems, which operate independently but are aligned with each other, to estimate the Adviser’s profitability in connection with investment advisory services provided to the Strategies. The Senior Officer has retained a consultant to provide independent advice regarding the alignment of the two profitability systems as well as the methodologies and allocations utilized by both profitability systems. See Section IV for additional discussion.
| IV. | PROFIT MARGINS OF THE ADVISER AND ITS AFFILIATES FOR SUPPLYING SUCH SERVICES. |
The Strategies’ profitability information, prepared by the Adviser for the Board of Trustees, was reviewed by the Senior Officer and the consultant. Except for Tax-Managed Balanced Wealth Strategy, the Adviser’s profitability from providing investment advisory services to the Strategies decreased during calendar year 2014, relative to 2013.
| 18 | Except for asset (size) comparability, Lipper uses the same criteria for selecting an EG peer when selecting an EU peer. Unlike the EG, the EU allows for the same adviser to be represented by more than just one fund. |
| 19 | The Class A shares total expense ratio shown for each Strategy is for the semi-annual period ending February 28, 2015. |
| 146 | • AB TAX-MANAGED WEALTH STRATEGIES |
In addition to the Adviser’s direct profits from managing the Strategies, certain of the Adviser’s affiliates have business relationships with the Strategies and may earn a profit from providing other services to the Strategies. The courts have referred to this type of business opportunity as “fall-out benefits” to the Adviser and indicated that such benefits should be factored into the evaluation of the total relationship between the Strategies and the Adviser. Neither case law nor common business practice precludes the Adviser’s affiliates from earning a reasonable profit on this type of relationship provided the affiliates’ charges and services are competitive and the relationship otherwise complies with the 40 Act restrictions. These affiliates provide transfer agent, distribution and brokerage related services to the Strategies and receive transfer agent fees, Rule 12b-1 payments, front-end sales loads, contingent deferred sales charges (“CDSC”) and brokerage commissions. In addition, the Adviser benefits from soft dollar arrangements which offset expenses the Adviser would otherwise incur.
AB Investments, Inc. (“ABI”), an affiliate of the Adviser, is the Trust’s principal underwriter. ABI and the Adviser have disclosed in the Strategies’ prospectus that they may make revenue sharing payments from their own resources, in addition to resources derived from sales loads and Rule 12b-1 fees, to firms that sell shares of the Trust. In 2014, ABI paid approximately 0.05% of the average monthly assets of the AB Mutual Funds or approximately $20.4 million for distribution services and educational support (revenue sharing payments).
ABI retained the following front-end load sales charges from sales of the Strategies’ Class A shares during the Strategies’ most recently completed fiscal year:
| Strategy | Amount Received | |||
| Tax-Managed Balanced Wealth Strategy | $ | 5,519 | ||
| Tax-Managed Wealth Appreciation Strategy | $ | 2,763 | ||
| Tax-Managed Conservative Wealth Strategy | $ | 802 | ||
ABI received the amounts set forth below in Rule 12b-1 fees and CDSC for the Strategies during the Strategies’ most recently completed fiscal year:
| Strategy | 12b-1 Fees Received | CDSC Received | ||||||
| Tax-Managed Balanced Wealth Strategy | $ | 652,991 | $ | 3,307 | ||||
| Tax-Managed Wealth Appreciation Strategy | $ | 305,777 | $ | 654 | ||||
| Tax-Managed Conservative Wealth Strategy | $ | 287,367 | $ | 745 | ||||
Fees and reimbursements for out of pocket expenses charged by AB Investor Services, Inc. (“ABIS”), the affiliated transfer agent for the Strategies, are based on the level of the network account and the class of shares held by the account.
| AB TAX-MANAGED WEALTH STRATEGIES • | 147 |
ABIS also receives a fee per shareholder sub-account for each account maintained by an intermediary on an omnibus basis. ABIS received the following net fees from the Strategies in the most recently completed fiscal year:
| Strategy | ABIS Fee | |||
| Tax-Managed Balanced Wealth Strategy | $ | 75,011 | ||
| Tax-Managed Wealth Appreciation Strategy | $ | 109,964 | ||
| Tax-Managed Conservative Wealth Strategy | $ | 28,243 | ||
The Strategies effected brokerage transactions through the Adviser’s affiliate, Sanford C. Bernstein & Co., LLC (“SCB & Co.”) and/or its U.K. affiliate, Sanford C. Bernstein Limited (“SCB Ltd.”), collectively “SCB,” and pay commissions for such transactions during the Strategies’ most recently completed fiscal year. The Adviser represented that SCB’s profitability from business conducted with the Strategies is comparable to the profitability of SCB’s dealings with other similar third party clients. In the ordinary course of business, SCB receives and pays liquidity rebates from electronic communications networks (“ECNs”) derived from trading for its clients. These credits and charges are not being passed onto any SCB client. The Adviser also receives certain soft dollar benefits from brokers that execute agency trades for the Strategies and other clients. These soft dollar benefits reduce the Adviser’s cost of doing business and increase its profitability.
| V. | POSSIBLE ECONOMIES OF SCALE |
The Adviser has indicated that economies of scale are being shared with shareholders through pricing to scale, breakpoints, fee reductions/waivers and enhancement to services.
In May 2012, an independent consultant, retained by the Senior Officer, provided the Board of Trustees information on the Adviser’s firm-wide average costs from 2005 through 2011 and the potential economies of scale. The independent consultant noted that from 2005 through 2007 the Adviser experienced significant growth in assets under management (“AUM”). During this period, operating expenses increased, in part to keep up with growth, and in part reflecting market returns. However, from 2008 through the first quarter of 2009, AUM rapidly and significantly decreased due to declines in market value and client withdrawals. When AUM rapidly decreased, some operating expenses categories, including base compensation and office space, adjusted more slowly during this period, resulting in an increase in average costs. Since 2009, AUM has experienced less significant changes. The independent consultant noted that changes in operating expenses reflect changes in business composition and business practices in response to changes in financial markets. Finally, the independent consultant concluded that the increase in average cost and the decline in net operating margin across the Adviser since late 2008 are inconsistent with the view that there are currently reductions in average costs due to economies of scale that can be shared with the AB Mutual Funds managed by the Adviser through lower fees.
| 148 | • AB TAX-MANAGED WEALTH STRATEGIES |
Previously, in February 2008, the independent consultant provided the Board of Trustees an update of the Deli20 study on advisory fees and various fund characteristics.21 The independent consultant first reiterated the results of his previous two dimensional comparison analysis (fund size and family size) with the Board of Trustees.22 The independent consultant then discussed the results of the regression model that was utilized to study the effects of various factors on advisory fees. The regression model output indicated that the bulk of the variation in fees predicted were explained by various factors, but substantially by fund AUM, family AUM, index fund indicator and investment style. The independent consultant also compared the advisory fees of the AB Mutual Funds to similar funds managed by 19 other large asset managers, regardless of the fund size and each Adviser’s proportion of mutual fund assets to non-mutual fund assets.
| VI. | NATURE AND QUALITY OF THE ADVISER’S SERVICES, INCLUDING THE PERFORMANCE OF THE FUND |
With assets under management of approximately $485 billion as of June 30, 2015, the Adviser has the investment experience to manage and provide non-investment services (described in Section I) to the Strategies.
The information prepared by Lipper shows the 1, 3, 5 and 10 year performance returns and rankings23 of the Strategies relative to their Lipper Performance
| 20 | The Deli study, originally published in 2002 based on 1997 data and updated for the February 2008 Presentation, may be of diminished value due to the age of the data used in the presentation and the changes experienced in the industry since 2008. |
| 21 | As mentioned previously, the Supreme Court cautioned against accepting mutual fund fee comparisons without careful scrutiny since the fees may not be the product of negotiations conducted at arm’s length. See Jones V. Harris at 1429. |
| 22 | The two dimensional analysis showed patterns of lower advisory fees for funds with larger asset sizes and funds from larger family sizes compared to funds with smaller asset sizes and funds from smaller family sizes, which according to the independent consultant is indicative of a sharing of economies of scale and scope. However, in less liquid and active markets, such is not the case, as the empirical analysis showed potential for diseconomies of scale in those markets. The empirical analysis also showed diminishing economies of scale and scope as funds surpassed a certain high level of assets. |
| 23 | The performance returns and rankings of the Strategies are for the Strategies’ Class A shares. The performance returns of the Strategies were provided by Lipper. |
| AB TAX-MANAGED WEALTH STRATEGIES • | 149 |
Groups (“PGs”) and Lipper Performance Universes (“PUs”)24 for the periods ended May 31, 2015.25
| Strategy | Portfolio Return (%) | PG Median (%) | PU Median (%) | PG Rank | PU Rank | |||||||||||
| Tax-Managed Balanced Wealth Strategy26 | ||||||||||||||||
1 year | 2.64 | 5.77 | 4.88 | 10/10 | 84/103 | |||||||||||
3 year | 7.57 | 10.92 | 10.42 | 10/10 | 89/100 | |||||||||||
5 year | 6.32 | 10.18 | 9.33 | 10/10 | 81/85 | |||||||||||
10 year | 4.21 | 6.16 | 5.96 | 9/9 | 60/64 | |||||||||||
| Tax-Managed Wealth Appreciation Strategy26 | ||||||||||||||||
1 year | 6.19 | 6.10 | 6.28 | 5/11 | 25/46 | |||||||||||
3 year | 16.50 | 16.50 | 16.41 | 6/11 | 22/44 | |||||||||||
5 year | 11.29 | 12.32 | 12.58 | 8/11 | 25/34 | |||||||||||
10 year | 4.97 | 6.76 | 7.22 | 6/6 | 13/14 | |||||||||||
| Tax-Managed Conservative Wealth Strategy26 | ||||||||||||||||
1 year | 1.75 | 3.44 | 2.94 | 8/11 | 59/76 | |||||||||||
3 year | 4.69 | 7.90 | 7.08 | 9/10 | 58/72 | |||||||||||
5 year | 4.12 | 7.94 | 7.03 | 9/9 | 63/65 | |||||||||||
10 year | 3.21 | 5.52 | 5.23 | 7/7 | 37/39 | |||||||||||
Set forth below are the 1, 3, 5, 10 year and since inception performance returns of the Strategies (in bold) versus their benchmarks for the periods ending May 31, 2015.
| 24 | The Strategies’ PGs are identical to their EGs. A Strategy’s PU may not necessarily be identical to its respective EU. Strategies with negative management fees are excluded from EGs/EUs but not necessarily from PGs/PUs. In addition, PGs/PUs only include funds of the same Lipper investment classification/objective as the Strategies, in contrast to certain of the Strategies’ EGs/EUs, which may include strategies of similar but not the same investment classification/objective. |
| 25 | Note that the current Lipper investment classification/objective dictates the PG and PU throughout the life of each Strategy even if a Strategy had a different investment classification/objective at a different point in time. |
| 26 | Lipper does not have a separate classification for tax-managed funds. Accordingly, unlike the Strategy, many of the Strategy’s Lipper peers are not tax-managed. |
| 150 | • AB TAX-MANAGED WEALTH STRATEGIES |
Performance returns for the 10 month period ending May 31, 2015 are shown for the Wealth Strategies to show their performance since MMAS commenced operations.27
| Periods Ending May 31, 2015 Annualized Net Performance (%) | ||||||||||||||||||||||||
10 Month (%)28 | 1 Year (%) | 3 Year (%) | 5 Year (%) | 10 Year (%) | Since (%) | |||||||||||||||||||
| Tax-Managed Balanced Wealth Strategy | 2.87 | 2.64 | 7.57 | 6.32 | 4.21 | 5.94 | ||||||||||||||||||
| 50% S&P 500 / 50% Barclays Capital 5 Yr. GO Municipal Bond Index | 5.98 | 6.41 | 10.38 | 9.69 | 6.26 | 7.40 | ||||||||||||||||||
| Barclays Capital 5Yr GO Municipal Bond Index | 0.89 | 1.03 | 1.57 | 2.79 | 3.83 | 4.78 | ||||||||||||||||||
| S&P 500 Index | 11.08 | 11.81 | 19.67 | 16.54 | 8.12 | 9.42 | ||||||||||||||||||
| Inception Date: May 4, 1992 | ||||||||||||||||||||||||
| Tax-Managed Wealth Appreciation Strategy | 6.25 | 6.19 | 16.50 | 11.29 | 4.97 | 5.86 | ||||||||||||||||||
| 60% S&P 500 Index / 40% MSCI ACWI Ex USA Net Index | 5.94 | 6.65 | 16.88 | 13.18 | 7.39 | 8.68 | ||||||||||||||||||
| S&P 500 Index | 11.08 | 11.81 | 19.67 | 16.54 | 8.12 | 8.54 | ||||||||||||||||||
| MSCI ACWI Ex USA Net Index | -1.56 | -0.90 | 12.61 | 8.09 | 6.04 | 8.23 | ||||||||||||||||||
| Inception Date: September 2, 2003 | ||||||||||||||||||||||||
| Tax-Managed Conservative Wealth Strategy | 1.75 | 1.75 | 4.69 | 4.12 | 3.21 | 4.83 | ||||||||||||||||||
| 70% Barclays Capital 5 Year GO Muni / 30% S&P 500 Index | 3.95 | 4.25 | 6.80 | 6.93 | 5.35 | 6.42 | ||||||||||||||||||
| Barclays Capital 5 Year GO Muni Bond Index | 0.89 | 1.03 | 1.57 | 2.79 | 3.83 | 4.78 | ||||||||||||||||||
| S&P 500 Index | 11.08 | 11.81 | 19.67 | 16.54 | 8.12 | 9.42 | ||||||||||||||||||
| Inception Date: May 4, 1992 | ||||||||||||||||||||||||
CONCLUSION:
Based on the factors discussed above the Senior Officer’s conclusion is that the proposed advisory fee for each Strategy is reasonable and within the range of what would have been negotiated at arm’s-length in light of all the surrounding circumstances. The Senior Officer recommended that the Trustees continue to monitor the impact of MMAS on the total expense ratios and performance of the Strategies. This conclusion in respect of each Strategy is based on an evaluation of all of these factors and no single factor was dispositive.
Dated: August 28, 2015
| 27 | The performance returns are for the Class A shares of the Strategies. Strategy and benchmark performance return information was provided by the Adviser. |
| 28 | The 10 month returns, which are not annualized, are shown to indicate the Wealth Strategies’ performance for the period since they began investing in MMAS. |
| AB TAX-MANAGED WEALTH STRATEGIES • | 151 |
THIS PAGE IS NOT PART OF THE SHAREHOLDER REPORT OR THE FINANCIAL STATEMENTS
AB FAMILY OF FUNDS
US EQUITY
US Core
Core Opportunities Fund
Select US Equity Portfolio
US Growth
Concentrated Growth Fund
Discovery Growth Fund
Growth Fund
Large Cap Growth Fund
Small Cap Growth Portfolio
US Value
Discovery Value Fund
Equity Income Fund
Growth & Income Fund
Small Cap Value Portfolio
Value Fund
INTERNATIONAL/ GLOBAL EQUITY
International/Global Core
Global Core Equity Portfolio
Global Equity & Covered Call Strategy Fund
Global Thematic Growth Fund
International Portfolio
International Strategic Core Portfolio
Tax-Managed International Portfolio
International/Global Growth
International Growth Fund
International/Global Value
Asia ex-Japan Equity Portfolio
International Value Fund
FIXED INCOME
Municipal
High Income Municipal Portfolio
Intermediate California Municipal Portfolio
Intermediate Diversified Municipal Portfolio
Intermediate New York Municipal Portfolio
Municipal Bond Inflation Strategy
FIXED INCOME (continued)
Tax-Aware Fixed Income Portfolio
National Portfolio
Arizona Portfolio
California Portfolio
Massachusetts Portfolio
Michigan Portfolio
Minnesota Portfolio
New Jersey Portfolio
New York Portfolio
Ohio Portfolio
Pennsylvania Portfolio
Virginia Portfolio
Taxable
Bond Inflation Strategy
Global Bond Fund
High Income Fund
High Yield Portfolio
Intermediate Bond Portfolio
Limited Duration High Income Portfolio
Short Duration Portfolio
ALTERNATIVES
All Market Real Return Portfolio
Credit Long/Short Portfolio
Global Real Estate Investment Fund
Long/Short Multi-Manager Fund
Multi-Manager Alternative Strategies Fund
Select US Long/Short Portfolio
Unconstrained Bond Fund
MULTI-ASSET
All Market Growth Portfolio
All Market Income Portfolio
Emerging Markets Multi-Asset Portfolio
Global Risk Allocation Fund
MULTI-ASSET (continued)
Target-Date
Multi-Manager Select Retirement Allocation Fund
Multi-Manager Select 2010 Fund
Multi-Manager Select 2015 Fund
Multi-Manager Select 2020 Fund
Multi-Manager Select 2025 Fund
Multi-Manager Select 2030 Fund
Multi-Manager Select 2035 Fund
Multi-Manager Select 2040 Fund
Multi-Manager Select 2045 Fund
Multi-Manager Select 2050 Fund
Multi-Manager Select 2055 Fund
Wealth Strategies
Balanced Wealth Strategy
Conservative Wealth Strategy
Wealth Appreciation Strategy
Tax-Managed Balanced Wealth Strategy
Tax-Managed Conservative Wealth Strategy
Tax-Managed Wealth Appreciation Strategy
CLOSED-END FUNDS
AB Multi-Manager Alternative Fund
Alliance California Municipal Income Fund
AllianceBernstein Global High Income Fund
AllianceBernstein Income Fund
AllianceBernstein National Municipal Income Fund
We also offer Exchange Reserves, which serves as the money market fund exchange vehicle for the AB mutual funds. An investment in Exchange Reserves is not a deposit in a bank and is not insured or guaranteed by the Federal Deposit Insurance Corporation or any other government agency. Although the Fund seeks to preserve the value of your investment at $1.00 per share, it is possible to lose money by investing in the Fund.
Investors should consider the investment objectives, risks, charges and expenses of the Fund carefully before investing. For copies of our prospectus or summary prospectus, which contain this and other information, visit us online at www.abglobal.com or contact your AB representative. Please read the prospectus and/or summary prospectus carefully before investing.
| 152 | • AB TAX-MANAGED WEALTH STRATEGIES |
AB Family of Funds
AB TAX-MANAGED WEALTH STRATEGIES
1345 Avenue of the Americas
New York, NY 10105
800.221.5672
| TMW-0152-0216 |  | |
FEB 02.29.16

SEMI-ANNUAL REPORT
AB WEALTH STRATEGIES
| + | AB WEALTH APPRECIATION STRATEGY |
| + | AB BALANCED WEALTH STRATEGY |
| + | AB CONSERVATIVE WEALTH STRATEGY |
Investment Products Offered
• Are Not FDIC Insured • May Lose Value • Are Not Bank Guaranteed |
Investors should consider the investment objectives, risks, charges and expenses of the Fund carefully before investing. For copies of our prospectus or summary prospectus, which contain this and other information, visit us online at www.abglobal.com or contact your AB representative. Please read the prospectus and/or summary prospectus carefully before investing.
This shareholder report must be preceded or accompanied by the Fund’s prospectus for individuals who are not current shareholders of the Fund.
You may obtain a description of the Fund’s proxy voting policies and procedures, and information regarding how the Fund voted proxies relating to portfolio securities during the most recent 12-month period ended June 30, without charge. Simply visit AB’s website at www.abglobal.com, or go to the Securities and Exchange Commission’s (the “Commission”) website at www.sec.gov, or call AB at (800) 227-4618.
The Fund files its complete schedule of portfolio holdings with the Commission for the first and third quarters of each fiscal year on Form N-Q. The Fund’s
Forms N-Q are available on the Commission’s website at www.sec.gov. The Fund’s Forms N-Q may also be reviewed and copied at the Commission’s Public Reference Room in Washington, DC; information on the operation of the Public Reference Room may be obtained by calling (800) SEC-0330. AB publishes full portfolio holdings for the Fund monthly at www.abglobal.com.
AllianceBernstein Investments, Inc. (ABI) is the distributor of the AB family of mutual funds. ABI is a member of FINRA and is an affiliate of AllianceBernstein L.P., the Adviser of the funds.
The [A/B] logo is a registered service mark of AllianceBernstein and AllianceBernstein® is a registered service mark used by permission of the owner, AllianceBernstein L.P.
April 10, 2016
Semi-Annual Report
This report provides management’s discussion of fund performance for the portfolios of AB Wealth Strategies (the “Strategies”, and individually a “Strategy”) for the semi-annual reporting period ended February 29, 2016.
The Strategies allocate, in accordance with their respective investment strategies, varying percentages of their assets to investments in the AB Pooling Portfolios, which represent a variety of asset classes and investment styles.
All of the Strategies invest in Underlying Portfolios that are intended to provide additional diversification by seeking returns that are less sensitive to the general direction of the equity markets. These Underlying Portfolios include the Multi-Manager Alternative Strategies Fund, which is designed to provide exposure to non-traditional and alternative investment strategies through investments allocated to various sub-advisers selected and overseen by AllianceBernstein L.P. (the “Adviser”). These investments will be primarily in four different alternative investment strategies—long/short equity, special situations, credit and global macro. Also in this category is the Multi-Asset Real Return Portfolio, which invests primarily in instruments that the Adviser expects to outperform broad equity markets during periods of rising inflation. This Underlying Portfolio invests primarily in inflation-indexed securities, commodity-related equity securities, commodities (principally through derivative instruments) and real estate securities. As part of their diversification investments, the Strategies invest in the Volatility Management Portfolio, which is designed
to reduce the overall effect of equity market volatility on the Strategies’ portfolios and the effects of adverse market conditions on their performance. Under normal market conditions, this Underlying Portfolio will invest predominantly in equity securities. If the Adviser determines that the equity markets pose disproportionate risks, the Adviser will reduce this Underlying Portfolio’s equity investments and invest in fixed-income securities or other non-equity asset classes to reduce the risks of the Strategies’ investments in equity securities.
For the Underlying Portfolios’ traditional equity investments, the Adviser selects growth and value equity securities by drawing from a variety of its fundamental growth and value investment disciplines to produce a blended portfolio. Within each investment discipline, the Adviser is able to draw on the resources and expertise of multiple growth and value equity investment teams, specializing in different capitalization ranges and geographic regions (US and non-US), which are supported by equity research analysts specializing in growth research, and equity research analysts specializing in value research.
Currencies can have a dramatic impact on equity returns, significantly adding to returns in some years and greatly diminishing them in others. Currency and equity positions are evaluated separately. The Adviser may seek to hedge the currency exposure resulting from securities positions when it finds the currency exposure unattractive. To hedge all or a portion of their currency risk, the Underlying Portfolios may, from time to time, invest in currency related derivatives, including forward
| AB WEALTH STRATEGIES • | 1 |
currency exchange contracts, futures, options on futures, swaps and options. The Adviser may also seek investment opportunities by taking long or short positions in currencies through the use of currency-related derivatives. The Underlying Portfolios may enter into other derivatives transactions, such as options, futures contracts, forwards and swaps.
AB Wealth Appreciation Strategy
Investment Objective and Policies
AB Wealth Appreciation Strategy’s investment objective is long-term growth of capital. The Strategy seeks to achieve its objective by investing in a combination of Underlying Portfolios representing a variety of asset classes and investment styles that are also managed by the Adviser. By allocating its assets among the Underlying Portfolios, the Strategy creates a portfolio that is designed as a solution for investors who seek equity returns without regard to taxes but also want broad diversification of the related risks across styles, capitalization ranges and geographic regions. Through these investments, the Adviser efficiently diversifies the Strategy between growth and value equity investment styles, between US and non-US markets and among diversification investments. The Strategy targets a weighting of approximately 67% of Underlying Portfolios that invest primarily in equity securities of companies, or traditional equity investments, and approximately 33% of Underlying Portfolios that invest primarily in diversification investments.
The Adviser will allow the relative weightings of the Strategy’s investments in growth and value and US and non-US
Underlying Portfolios to vary in response to market conditions, but ordinarily only by ±5% of the Strategy’s net assets. Beyond those ranges, the Adviser will generally rebalance the portfolio toward the targeted blend. However, under extraordinary circumstances, such as when market conditions favoring one investment component are compelling, the range may expand to ±10% of the Strategy’s net assets. The Strategy’s targeted percentages may change from time to time without notice to shareholders based on the Adviser’s assessment of market conditions.
Within the Strategy’s traditional equity component, the target blend is an equal weighting of Underlying Portfolios that invest primarily in growth and value stocks (approximately 50% each) with approximately 60% of each equity style invested in Underlying Portfolios that invest in US companies and the remaining 40% in Underlying Portfolios that invest in non-US companies.
The Strategy invests approximately 12% of its assets in the Multi-Manager Alternative Strategies Fund, approximately 7% in the Multi-Asset Real Return Portfolio and approximately 14% in the Volatility Management Portfolio.
AB Balanced Wealth Strategy
Investment Objective and Policies
AB Balanced Wealth Strategy’s investment objective is to achieve the highest total return consistent with the Adviser’s determination of reasonable risk. The Strategy seeks to achieve its objective by investing in a combination of Underlying Portfolios representing a variety of asset classes and investment styles that are also managed by the
| 2 | • AB WEALTH STRATEGIES |
Adviser. By allocating its assets among the Underlying Portfolios, the Strategy creates a portfolio that is designed as a solution for investors who seek a moderate tilt toward equity returns without regard to taxes but also want the risk diversification offered by debt securities and the broad diversification of their equity risk across styles, capitalization ranges and geographic regions. Through investments in the Underlying Portfolios, the Adviser efficiently diversifies between debt and equity investment styles and in diversification investments to produce the desired risk/return profile of the Strategy. The Strategy targets a weighting of approximately 38% of Underlying Portfolios that invest primarily in equity securities of companies, or traditional equity investments, approximately 25% of Underlying Portfolios that invest primarily in traditional debt securities and approximately 37% of Underlying Portfolios that invest primarily in diversification investments with a goal of providing moderate upside potential without excessive volatility.
The Adviser will allow the relative weightings of the Strategy’s investments in equity and debt, growth and value, and in US and non-US company Underlying Portfolios to vary in response to market conditions, but ordinarily, only by ±5% of the Strategy’s net assets. Beyond those ranges, the Adviser will rebalance the strategy toward the targeted blend. However, under extraordinary circumstances, such as when market conditions favoring one investment style are compelling, the range may expand to ±10% of the Strategy’s net assets. The Strategy’s
targeted percentages may change from time to time without notice to shareholders based on the Adviser’s assessment of market conditions.
Within the Strategy’s traditional equity component, the targeted blend is an equal weighting of Underlying Portfolios that invest primarily in growth and value style stocks (50% each), with approximately 60% of each equity style invested in Underlying Portfolios that invest in US companies and the remaining 40% in Underlying Portfolios that invest in non-US companies.
The Strategy invests approximately 8% of its assets in the Multi-Manager Alternative Strategies Fund, approximately 5% in the Multi-Asset Real Return Portfolio and approximately 17% in the Volatility Management Portfolio.
The Underlying Portfolios’ fixed-income securities will primarily be investment-grade debt securities, but will also include lower-rated securities (“junk bonds”) and preferred stock. The Strategy will not invest more than 25% of its total assets in Underlying Portfolios investing in securities rated, at the time of purchase, below investment grade.
AB Conservative Wealth Strategy
Investment Objective and Policies
AB Conservative Wealth Strategy’s investment objective is to achieve a high total return without, in the opinion of the Adviser, undue risk to principal. The Strategy seeks to achieve its objective by investing in a combination of Underlying Portfolios representing a variety of asset classes and investment styles that are also managed by the Adviser. By allocating
| AB WEALTH STRATEGIES • | 3 |
its assets among the Underlying Portfolios, the Strategy creates a portfolio that is designed as a solution for investors who seek some opportunities for equity returns without regard to taxes if the related risks are broadly diversified and overall portfolio volatility reflects a preponderance of debt securities. Through investments in the Underlying Portfolios, the Adviser efficiently diversifies between debt and equity investment styles and in diversification investments to produce the desired risk/return profile of the Strategy. The Strategy targets a weighting of approximately 20% in Underlying Portfolios that invest primarily in equity securities of companies, or traditional equity investments, approximately 52% in Underlying Portfolios that invest primarily in traditional debt securities and approximately 29% in Underlying Portfolios that invest primarily in diversification investments with a goal of providing reduced volatility and modest upside potential.
The Adviser will allow the relative weightings of the Strategy’s investments in equity and debt, growth and value, and in US and non-US company Underlying Portfolios to vary in response to market conditions, but ordinarily only by ±5% of the Strategy’s net assets. Beyond those ranges, the Adviser will rebalance the Strategy toward the targeted blends. However, under extraordinary circumstances, such as when market conditions favoring one investment style are compelling, the range may expand to ±10% of the Strategy’s net assets. The Strategy’s targeted percentages may change from time to time without notice to shareholders based on the Adviser’s assessment of market conditions.
Within the Strategy’s traditional equity component, the targeted blend is an equal weighting of Underlying Portfolios that invest in growth and value style stocks (approximately 50% each), with approximately 60% of each equity style invested in Underlying Portfolios that invest in US companies and the remaining 40% in Underlying Portfolios that invest in non-US companies.
The Strategy invests approximately 6% of its assets in the Multi-Manager Alternative Strategies Fund, approximately 2% in the Multi-Asset Real Return Portfolio and approximately 12% in the Volatility Management Portfolio.
All fixed-income securities of the Short Duration Bond Underlying Portfolio and Global Core Bond Underlying Portfolio in which the Strategy invests will be of investment grade at the time of purchase. In the event that the rating of any security held by these Underlying Portfolios falls below investment grade, the Strategy will not be obligated to dispose of its investment in such Underlying Portfolio and may continue to hold such investment if, in the opinion of the Adviser, such investment is appropriate under the circumstances.
Investment Results
The tables on pages 11-13 show performance for each Strategy compared to its respective benchmarks for the six- and 12-month periods ended February 29, 2016. Each Strategy’s blended benchmark is as follows: AB Wealth Appreciation Strategy, 60% Standard & Poor’s (“S&P”) 500 Index / 40% Morgan Stanley Capital International All Country World
| 4 | • AB WEALTH STRATEGIES |
Index (“MSCI ACWI”) ex-US; AB Balanced Wealth Strategy, 65% S&P 500 Index / 35% Barclays US Aggregate Bond Index; and AB Conservative Wealth Strategy, 65% Barclays US Aggregate Bond Index / 35% S&P 500 Index. Performance for each of the Underlying Portfolios compared to its respective benchmark may be found on page 14. Additional performance for the Underlying Portfolios may be found on pages 24-27.
All share classes of the Wealth Appreciation Strategy underperformed the primary and blended benchmarks, and outperformed the secondary benchmark, for both periods, before sales charges. On an absolute level, all equity Underlying Portfolios declined for both periods. For the six-month period, performance was most negatively impacted by the allocation to the International Growth and International Value Portfolios, which were affected by the sharp decline in the international equity markets in the first two months of 2016; the allocation to the Volatility Management Portfolio also detracted. For the 12-month period, the allocation to the International Growth and International Value Portfolios detracted; the allocation to the Volatility Management, Multi-Asset Real Return and Small-Mid Cap Growth Portfolios detracted as well.
All share classes of the Balanced Wealth Strategy underperformed the primary, secondary and blended benchmarks for both periods, before sales charges. On an absolute level, for both periods, performance was most negatively impacted by the allocation to the Volatility Management Portfolio, which was affected by the sharp decline in the international
equity markets in the first two months of 2016. For the six-month period, the allocation to the International Growth and International Value Portfolios also detracted, while the allocation to the Global Core Bond and Bond Inflation Protection Portfolios contributed. For the 12-month period, the allocation to the International Growth and International Value Portfolios, as well as the Multi-Asset Real Return Portfolio detracted; while the Global Core Bond Portfolio contributed.
All share classes of the Conservative Wealth Strategy underperformed the primary, secondary and the blended benchmarks for the six-month period, before sales charges; for the 12-month period, all share classes underperformed the primary and blended benchmarks and outperformed the secondary benchmark. On an absolute level, performance for both periods was most negatively impacted by the allocation to the Volatility Management Portfolio, which was affected by the sharp decline in international equity markets in the first two months of 2016. For the six-month period, the allocation to the International Growth and International Value Portfolios, as well as the Volatility Management Portfolio also detracted; the Global Core Bond, Short Duration Bond and Bond Inflation Protection Portfolios contributed. For the 12-month period, the allocation to the International Growth Portfolio and International Value Portfolio detracted; while the Global Core Bond and Short Duration Bond Portfolios contributed.
The US Value Portfolio, US Large Cap Growth Portfolio, Small-Mid Cap
| AB WEALTH STRATEGIES • | 5 |
Value Portfolio and Small-Mid Cap Growth Portfolio did not use derivatives during the six- and 12-month periods. The Multi-Manager Alternative Strategies Fund did not use derivatives directly.
The International Value Portfolio utilized derivatives including futures for investment purposes and currency forwards for hedging and investment purposes, which detracted from returns during the six-month period and added during the 12-month period, in absolute terms. The International Growth Portfolio utilized derivatives in the form of currency forwards for hedging purposes, which added to returns during both periods, in absolute terms.
The Short Duration Bond Portfolio utilized derivatives during both periods, including Treasury futures and interest rate swaps to manage duration and yield-curve positioning. Currency forwards were also utilized during both periods to establish currency positioning. Cross currency swaps for hedging purposes had an immaterial impact during both periods, in absolute terms.
During both periods, the Global Core Bond Portfolio utilized derivatives including Treasury futures to manage duration and yield-curve positioning; currency forwards and purchased and written options for hedging and investment purposes had an immaterial impact on performance, in absolute terms.
The Bond Inflation Protection Portfolio utilized derivatives including interest rate swaps and Treasury futures
during both periods to manage duration and yield-curve positioning. Overall duration and yield-curve positioning had a modest contribution to returns for the six- and 12-month periods in absolute terms. Credit default swaps, inflation swaps and written options were utilized for hedging and investment purposes, which had an immaterial impact during both periods. Currency forwards were utilized to establish currency positioning.
During both periods, the High Yield Portfolio utilized derivatives including credit default swaps for hedging and investment purposes, and purchased options and interest rate swaps for hedging purposes, which detracted from performance in absolute terms; futures for hedging purposes added. Currency forwards for hedging and investment purposes and written options for hedging purposes had an immaterial impact during the six-month period and added during the 12-month period. During both periods, written swaptions for hedging purposes had an immaterial impact and total return swaps for investment purposes detracted.
The Multi-Asset Real Return Portfolio utilized derivatives for hedging and investment purposes in the form of currency forwards, futures, total return swaps, interest rate swaps and written options, which detracted from returns during both periods in absolute terms; inflation swaps detracted during the six-month period and added during the 12-month period, and purchased options had an immaterial impact during the six-month period and added during the 12-month period.
| 6 | • AB WEALTH STRATEGIES |
The Volatility Management Portfolio utilized derivatives for hedging and investment purposes including currency forwards, which added to returns during both periods, in absolute terms; futures, total return swaps and purchased and written options detracted during both periods.
Market Review and Investment Strategy
Global equities charted a rocky path over the six-month period. Markets mainly rallied through the first half, recovering losses from August’s sharp sell-off. However, 2016 ushered in another dramatic pullback that punished stocks worldwide. The steep decline led to losses for the period, with international and emerging market equities hit hardest. US dollar–based investors also saw a strong US dollar dampen their returns.
As 2015 drew to a close, markets fluctuated as concerns over uneven global growth gave way to hopes for central bank intervention. A US interest rate hike, the first in nine years, helped offset negative sentiment due to inaction from the European Central Bank and a further retrenchment in commodities and oil. However, uncertainty spilled over into the New Year, which began on a sour note as concerns about China’s fiscal policy, slowing growth and oversupply in oil sparked a fresh bout of turmoil in financial markets worldwide. While February offered a modest respite, investors remained cautious by the end of the reporting period.
Bond markets were volatile for the six-month period, as growth trends and monetary policies in the world’s biggest economies headed in different directions. Inflation continued to fall throughout the developed world, driven primarily by
decreasing commodity prices. Oil prices reached their lowest level since 2003, causing volatility within government bond yields; the rate hike by the US Federal Reserve (the “Fed”) added to the volatility. Fixed-income returns diverged between regions and sectors: credit securities generally underperformed developed-market Treasuries; developed-market Treasuries generally outperformed emerging-market local currency Treasuries; and investment-grade securities generally outperformed high yield, which posted some of the worst returns across the fixed-income markets, specifically within the energy and commodities sectors.
A glut of supply overwhelmed solid demand to drive the price of oil to record lows. Commodities suffered and inflation expectations, measured by the spread between the yield on nominal Treasuries and Treasury Inflation-Protected Securities fell sharply, and the US dollar rose, all of which was negative for inflation assets. In February, however, commodity prices and market inflation expectations bounced back, bolstered by a dovish Fed policy and a reversal in the sentiment around China.
Natural resources stocks were similarly weighed down by the collapse in commodity prices, high volatility and headwinds from a strong US dollar. With the Fed moving to a more dovish stance in the new year, this trend was reversed. Metal and mining stocks were especially strong.
Real estate investment trusts (“REITs”) were expensive and faced the risk of interest rate hikes. The risk, however, began to diminish and REITs outperformed over the six-month period.
| AB WEALTH STRATEGIES • | 7 |
DISCLOSURES AND RISKS
Benchmark Disclosure
The S&P 500® Index, the MSCI ACWI ex-US and the Barclays US Aggregate Bond Index are unmanaged and do not reflect fees and expenses associated with the active management of a mutual fund portfolio. The S&P 500 Index includes 500 US stocks and is a common representation of the performance of the overall US stock market. The MSCI ACWI ex-US (free float-adjusted, market capitalization weighted) represents the equity market performance of developed and emerging markets, excluding the United States. MSCI makes no express or implied warranties or representations, and shall have no liability whatsoever with respect to any MSCI data contained herein. The MSCI data may not be further redistributed or used as a basis for other indices, any securities or financial products. This report is not approved, reviewed or produced by MSCI. The Barclays US Aggregate Bond Index (US dollar hedged) represents the performance of securities within the US investment-grade fixed-rate bond market, with index components for government and corporate securities, mortgage pass-through securities, asset-backed securities, and commercial mortgage-backed securities. An investor cannot invest directly in an index, and its results are not indicative of the performance for any specific investment, including the Strategies.
The Russell 1000® Value Index was used to represent the allocation to U.S. Value, the Russell 1000® Growth Index to represent U.S. Large Cap Growth, the MSCI ACWI ex-US to represent International Value and International Growth, the Bank of America Merrill Lynch® (“BofA ML”) 1-3 Year Treasury Index to represent Short Duration Bond, Barclays Global Aggregate Bond Index (US dollar hedged) to represent Global Core Bond, the Barclays 1-10 Year TIPS Index to represent Bond Inflation Protection, the Barclays US High Yield 2% Issuer Capped Index to represent High-Yield, the Russell 2500® Value Index to represent Small-Mid Cap Value, the Russell 2500® Growth to represent Small-Mid Cap Growth, the MSCI AC World Commodity Producers Index and the All Market Real Return Portfolio Benchmark to represent Multi-Asset Real Return; the MSCI ACWI to represent Volatility Management and the BofA ML 3-Month US T-Bill Index to represent Multi-Manager Alternative Strategies Fund.
The Russell 1000 Value Index represents the performance of 1,000 large-cap value companies within the US. The Russell 1000 Growth Index represents the performance of 1,000 large-cap growth companies within the US. The AC World Commodity Index (free float-adjusted, market capitalization-weighted) represents the equity market performance of developed and emerging markets. The BofA ML 1-3 Year US Treasury Index represents the performance of US dollar-denominated sovereign debt publicly issued by the US government in its domestic market with a remaining term to final maturity of 1-3 years. The Barclays Global Aggregate Bond Index (US dollar hedged) represents the performance of global investment-grade developed fixed income markets. The Barclays 1-10 Year TIPS Index represents the performance of inflation-protected securities issued by the US Treasury. The Barclays High Yield 2% Issuer Capped Index is the 2% issuer-capped component of the US Corporate High Yield Index, which represents the performance of fixed income securities having a maximum quality rating of Ba1, a minimum amount outstanding of $150 million, and at least one year to maturity. The Russell 2500 Value Index represents the performance of 2,500 small- to mid-cap value companies within the US. The Russell 2500 Growth Index represents the performance of 2,500 small- to mid-cap growth companies within the US. The MSCI AC World Commodity Producers Index (free float-adjusted, market capitalization-weighted) is comprised of commodity producer companies based on the Global Industry Classification Standard (“GICS”). The BofA ML 3-Month US T-Bill Index is an unmanaged index tracking 3-month government securities. The All Market Real Return Portfolio Benchmark is an equally-weighted
(Disclosures, Risks and Note about Historical Performance continued on next page)
| 8 | • AB WEALTH STRATEGIES |
Disclosures and Risks
DISCLOSURES AND RISKS
(continued from previous page)
blend of the MSCI AC World Commodity Producers Index, the FTSE EPRA/NAREIT Global Index and the Dow Jones-UBS Commodity Index. The FTSE EPRA/NAREIT Global Index (market-value-weighted index based upon the last closing price of the month) represents the performance of tax-qualified REITs listed on the NYSE, AMEX and the NASDAQ. The Dow Jones-UBS Commodity Index measures price movements of the commodities included in the appropriate sub index. It does not account for effects of rolling futures contracts or the physical commodity. Commodities sectors include: energy, grains, industrial metals, petroleum, precious metals and softs.
A Word About Risk
The Strategies allocate their investments among multiple asset classes which will include US and foreign securities. The Balanced Wealth and Conservative Wealth Strategies will include both equity and fixed-income securities. Price fluctuation in the Underlying Portfolio securities may be caused by changes in the general level of interest rates or changes in bond credit quality ratings.
Market Risk: The value of the Strategies’ assets will fluctuate as the stock, bond or commodities markets fluctuate. The value of their investments may decline, sometimes rapidly and unpredictably, simply because of economic changes or other events that affect large portions of the market. It includes the risk that a particular style of investing, such as growth or value, may be underperforming the stock market generally.
Foreign (Non-US) Risk: Investments in non-US issuers may involve more risk than investments in US issuers. These securities may fluctuate more widely in price and may be less liquid due to adverse market, economic, political, regulatory or other factors.
Currency Risk: Fluctuations in currency exchange rates may negatively affect the value of the Strategies’ investments or reduce their returns.
Capitalization Risk: Investments in small- and mid-capitalization companies by the Underlying Portfolios may be more volatile than investments in large-capitalization companies. Investments in small-capitalization companies may have additional risks because these companies have limited product lines, markets, or financial resources.
Allocation Risk: The allocation of investments among the Underlying Portfolios’ different investment styles, such as growth or value, US or non-US securities, or diversification strategies, may have a more significant effect on the Strategies’ net asset value (“NAV”) when one of these investments is performing more poorly than another.
Derivatives Risk: Derivatives may be illiquid, difficult to price, and leveraged so that small changes may produce disproportionate losses for the Strategies, and may be subject to counterparty risk to a greater degree than more traditional investments.
Credit Risk: (Balanced Wealth and Conservative Wealth Strategies) An issuer or guarantor of a fixed-income security, or the counterparty to a derivatives or other contract, may be unable or unwilling to make timely payments of interest or principal, or to otherwise honor its obligations. The issuer or guarantor may default, causing a loss of the full principal amount of a security and accrued interest. The degree of risk for a particular security may be reflected in its credit rating. There is the possibility that the credit rating of a fixed-income security may be downgraded after purchase, which may adversely affect the value of the security. Investments in fixed-income securities with lower ratings (commonly known as “junk bonds”) are subject to a higher probability that an issuer will default or fail to meet its payment obligations.
Interest Rate Risk: (Balanced Wealth and Conservative Wealth Strategies) Changes in interest rates will affect the value of the Strategies’ investments in Underlying
(Disclosures, Risks and Note about Historical Performance continued on next page)
| AB WEALTH STRATEGIES • | 9 |
Disclosures and Risks
DISCLOSURES AND RISKS
(continued from previous page)
Portfolios that invest in fixed-income securities. When interest rates rise, the value of investments in fixed-income securities tends to fall and this decrease in value may not be offset by higher income from new investments. The Strategies may be subject to a heightened risk of rising interest rates as the recent period of historically low rates is beginning to end and rates have begun rising. Interest rate risk is generally greater for fixed-income securities with longer maturities or durations.
These risks are fully discussed in the Strategies’ prospectus. As with all investments, you may lose money by investing in the Strategies.
An Important Note About Historical Performance
The investment return and principal value of an investment in the Strategies will fluctuate as the prices of the individual securities in which it invests fluctuate, so that your shares, when redeemed, may be worth more or less than their original cost. Performance shown on the following pages represents past performance and does not guarantee future results. Current performance may be lower or higher than the performance information shown. You may obtain performance information current to the most recent month-end by visiting www.abglobal.com.
All fees and expenses related to the operation of the Strategies have been deducted. NAV returns do not reflect sales charges; if sales charges were reflected, the Strategies’ quoted performance would be lower. SEC returns reflect the applicable sales charges for each share class: a 4.25% maximum front-end sales charge for Class A shares; the applicable contingent deferred sales charge for Class B shares (4% year 1, 3% year 2, 2% year 3, 1% year 4); a 1% 1-year contingent deferred sales charge for Class C shares. Returns for the different share classes will vary due to different expenses associated with each class. Performance assumes reinvestment of distributions and does not account for taxes.
| 10 | • AB WEALTH STRATEGIES |
Disclosures and Risks
AB WEALTH APPRECIATION STRATEGY
HISTORICAL PERFORMANCE
THE STRATEGY VS. ITS BENCHMARKS PERIODS ENDED FEBRUARY 29, 2016 (unaudited) | NAV Returns | |||||||||
| 6 Months | 12 Months | |||||||||
| AB Wealth Appreciation Strategy | ||||||||||
Class A | -6.23% | -11.95% | ||||||||
| ||||||||||
Class B* | -6.60% | -12.60% | ||||||||
| ||||||||||
Class C | -6.61% | -12.63% | ||||||||
| ||||||||||
Advisor Class† | -6.12% | -11.74% | ||||||||
| ||||||||||
Class R† | -6.46% | -12.37% | ||||||||
| ||||||||||
Class K† | -6.27% | -12.08% | ||||||||
| ||||||||||
Class I† | -6.13% | -11.81% | ||||||||
| ||||||||||
| Primary Benchmark: S&P 500 Index | -0.92% | -6.19% | ||||||||
| ||||||||||
| Secondary Benchmark: MSCI ACWI ex-US | -9.29% | -17.37% | ||||||||
| ||||||||||
| Blended Benchmark: 60% S&P 500 Index / 40% MSCI ACWI ex-US | -4.34% | -10.78% | ||||||||
| ||||||||||
* Effective January 31, 2009, Class B shares are no longer available for purchase to new investors. Please see Note A for additional information.
† Please note that these share classes are for investors purchasing shares through accounts established under certain fee-based programs sponsored and maintained by certain broker-dealers and financial intermediaries, institutional pension plans and/or investment advisory clients of, and certain other persons associated with, the Adviser and its affiliates or the Strategies. | ||||||||||
See Disclosures, Risks and Note about Historical Performance on pages 8-10.
(Historical Performance continued on next page)
| AB WEALTH STRATEGIES • | 11 |
Historical Performance
AB BALANCED WEALTH STRATEGY
HISTORICAL PERFORMANCE
(continued from previous page)
THE STRATEGY VS. ITS BENCHMARKS | NAV Returns | |||||||||
| 6 Months | 12 Months | |||||||||
| AB Balanced Wealth Strategy | ||||||||||
Class A | -4.06% | -8.66% | ||||||||
| ||||||||||
Class B* | -4.39% | -9.29% | ||||||||
| ||||||||||
Class C | -4.39% | -9.29% | ||||||||
| ||||||||||
Advisor Class† | -3.92% | -8.38% | ||||||||
| ||||||||||
Class R† | -4.21% | -8.97% | ||||||||
| ||||||||||
Class K† | -4.09% | -8.78% | ||||||||
| ||||||||||
Class I† | -3.96% | -8.43% | ||||||||
| ||||||||||
| Primary Benchmark: S&P 500 Index | -0.92% | -6.19% | ||||||||
| ||||||||||
| Secondary Benchmark: Barclays US Aggregate Bond Index | 2.20% | 1.50% | ||||||||
| ||||||||||
| Blended Benchmark: 65% S&P 500 Index / 35% Barclays US Aggregate Bond Index | 0.30% | -3.38% | ||||||||
| ||||||||||
* Effective January 31, 2009, Class B shares are no longer available for purchase to new investors. Please see Note A for additional information.
† Please note that these share classes are for investors purchasing shares through accounts established under certain fee-based programs sponsored and maintained by certain broker-dealers and financial intermediaries, institutional pension plans and/or investment advisory clients of, and certain other persons associated with, the Adviser and its affiliates or the Strategies. | ||||||||||
See Disclosures, Risks and Note about Historical Performance on pages 8-10.
(Historical Performance continued on next page)
| 12 | • AB WEALTH STRATEGIES |
Historical Performance
AB CONSERVATIVE WEALTH STRATEGY
HISTORICAL PERFORMANCE
(continued from previous page)
THE STRATEGY VS. ITS BENCHMARKS | NAV Returns | |||||||||
| 6 Months | 12 Months | |||||||||
| AB Conservative Wealth Strategy | ||||||||||
Class A | -1.59% | -4.41% | ||||||||
| ||||||||||
Class B* | -1.95% | -5.11% | ||||||||
| ||||||||||
Class C | -1.99% | -5.15% | ||||||||
| ||||||||||
Advisor Class† | -1.49% | -4.15% | ||||||||
| ||||||||||
Class R† | -1.72% | -4.78% | ||||||||
| ||||||||||
Class K† | -1.64% | -4.47% | ||||||||
| ||||||||||
Class I† | -1.51% | -4.18% | ||||||||
| ||||||||||
| Primary Benchmark: Barclays US Aggregate Bond Index | 2.20% | 1.50% | ||||||||
| ||||||||||
| Secondary Benchmark: S&P 500 Index | -0.92% | -6.19% | ||||||||
| ||||||||||
| Blended Benchmark: 65% Barclays US Aggregate Bond Index / 35% S&P 500 Index | 1.23% | -1.07% | ||||||||
| ||||||||||
* Effective January 31, 2009, Class B shares are no longer available for purchase to new investors. Please see Note A for additional information.
† Please note that these share classes are for investors purchasing shares through accounts established under certain fee-based programs sponsored and maintained by certain broker-dealers and financial intermediaries, institutional pension plans and/or investment advisory clients of, and certain other persons associated with, the Adviser and its affiliates or the Strategies. | ||||||||||
See Disclosures, Risks and Note about Historical Performance on pages 8-10.
(Historical Performance continued on next page)
| AB WEALTH STRATEGIES • | 13 |
Historical Performance
THE UNDERLYING PORTFOLIOS
HISTORICAL PERFORMANCE
(continued from previous page)
| EACH UNDERLYING PORTFOLIO* VS. ITS BENCHMARK PERIODS ENDED FEBRUARY 29, 2016 (unaudited) | Returns | |||||||||
| 6 Months | 12 Months | |||||||||
AB U.S. Value Portfolio | -4.72% | -10.67% | ||||||||
| ||||||||||
| Russell 1000 Value Index | -2.87% | -9.41% | ||||||||
| ||||||||||
AB U.S. Large Cap Growth Portfolio | -0.68% | -1.70% | ||||||||
| ||||||||||
| Russell 1000 Growth Index | -1.22% | -5.05% | ||||||||
| ||||||||||
AB International Value Portfolio | -7.36% | -14.73% | ||||||||
| ||||||||||
| MSCI ACWI ex-US | -9.29% | -17.37% | ||||||||
| ||||||||||
AB International Growth Portfolio | -7.34% | -14.24% | ||||||||
| ||||||||||
| MSCI ACWI ex-US | -9.29% | -17.37% | ||||||||
| ||||||||||
AB Short Duration Bond Portfolio | 0.51% | 0.99% | ||||||||
| ||||||||||
| BofA ML 1-3 Year Treasury Index | 0.59% | 0.98% | ||||||||
| ||||||||||
AB Global Core Bond Portfolio | 3.13% | 2.07% | ||||||||
| ||||||||||
| Barclays Global Aggregate Bond Index (US dollar hedged) | 3.15% | 2.19% | ||||||||
| ||||||||||
AB Bond Inflation Protection Portfolio | 0.85% | -0.80% | ||||||||
| ||||||||||
| Barclays 1-10 Year TIPS Index | 1.16% | 0.00% | ||||||||
| ||||||||||
AB High-Yield Portfolio | -6.61% | -8.69% | ||||||||
| ||||||||||
| Barclays US High Yield 2% Issuer Capped Index | -5.57% | -8.26% | ||||||||
| ||||||||||
AB Small-Mid Cap Value Portfolio | -6.73% | -10.86% | ||||||||
| ||||||||||
| Russell 2500 Value Index | -5.93% | -12.06% | ||||||||
| ||||||||||
AB Small-Mid Cap Growth Portfolio | -13.20% | -15.45% | ||||||||
| ||||||||||
| Russell 2500 Growth Index | -11.30% | -14.65% | ||||||||
| ||||||||||
AB Multi-Asset Real Return Portfolio | -11.47% | -24.07% | ||||||||
| ||||||||||
| Primary Benchmark: MSCI AC World Commodity Producers Index | -10.18% | -28.15% | ||||||||
| ||||||||||
| Secondary Benchmark: All Market Real Return Portfolio Benchmark | -8.59% | -21.27% | ||||||||
| ||||||||||
AB Volatility Management Portfolio | -6.22% | -12.54% | ||||||||
| MSCI ACWI | -5.54% | -12.32% | ||||||||
| ||||||||||
AB Multi-Manager Alternative Strategies Fund (Class Z Shares) | -3.39% | -5.92% | ||||||||
| ||||||||||
| BofA ML 3-Month US T-Bill Index | 0.06% | 0.08% | ||||||||
| ||||||||||
* Shares of the Underlying Portfolios (specifically Class Z shares in the case of AB Multi-Manager Alternative Strategies Fund) are offered exclusively to mutual funds advised by, and certain institutional clients of, AllianceBernstein and are not currently offered to the general public. The Underlying Portfolios incur no sales charges or management fees (except in the case of AB Multi-Manager Alternative Strategies Fund). | ||||||||||
See Disclosures, Risks and Note about Historical Performance on pages 8-10.
(Historical Performance continued on next page)
| 14 | • AB WEALTH STRATEGIES |
Historical Performance
AB WEALTH APPRECIATION STRATEGY
HISTORICAL PERFORMANCE
(continued from previous page)
| AVERAGE ANNUAL RETURNS AS OF FEBRUARY 29, 2016 (unaudited) | ||||||||
| NAV Returns | SEC Returns (reflects applicable | |||||||
| Class A Shares | ||||||||
1 Year | -11.95 | % | -15.68 | % | ||||
5 Years | 2.94 | % | 2.05 | % | ||||
10 Years | 2.03 | % | 1.59 | % | ||||
| Class B Shares | ||||||||
1 Year | -12.60 | % | -16.09 | % | ||||
5 Years | 2.18 | % | 2.18 | % | ||||
10 Years | 1.44 | % | 1.44 | % | ||||
| Class C Shares | ||||||||
1 Year | -12.63 | % | -13.50 | % | ||||
5 Years | 2.17 | % | 2.17 | % | ||||
10 Years | 1.30 | % | 1.30 | % | ||||
| Advisor Class Shares* | ||||||||
1 Year | -11.74 | % | -11.74 | % | ||||
5 Years | 3.21 | % | 3.21 | % | ||||
10 Years | 2.33 | % | 2.33 | % | ||||
| Class R Shares* | ||||||||
1 Year | -12.37 | % | -12.37 | % | ||||
5 Years | 2.52 | % | 2.52 | % | ||||
10 Years | 1.66 | % | 1.66 | % | ||||
| Class K Shares* | ||||||||
1 Year | -12.08 | % | -12.08 | % | ||||
5 Years | 2.84 | % | 2.84 | % | ||||
10 Years | 1.97 | % | 1.97 | % | ||||
| Class I Shares* | ||||||||
1 Year | -11.81 | % | -11.81 | % | ||||
5 Years | 3.18 | % | 3.18 | % | ||||
10 Years | 2.32 | % | 2.32 | % | ||||
See Disclosures, Risks and Note about Historical Performance on pages 8-10.
(Historical Performance and footnotes continued on next page)
| AB WEALTH STRATEGIES • | 15 |
Historical Performance
AB WEALTH APPRECIATION STRATEGY
HISTORICAL PERFORMANCE
(continued from previous page)
The Strategy’s current prospectus fee table shows the Strategy’s total annual operating expense ratios as 1.41%, 2.17%, 2.16%, 1.16%, 1.85%, 1.54% and 1.21% for Class A, Class B, Class C, Advisor Class, Class R, Class K and Class I shares, respectively, gross of any fee waivers or expense reimbursements. Contractual fee waivers and/or expense reimbursements limit the Strategy’s annual operating expense ratios to 1.29%, 2.05%, 2.04%, 1.04%, 1.73%, 1.42% and 1.09% for Class A, Class B, Class C, Advisor Class, Class R, Class K and Class I shares, respectively. These waivers/reimbursements may not be terminated before December 31, 2016. Absent reimbursements or waivers, performance would have been lower. The net and gross expenses shown include the total operating expenses of the Strategy and the indirect expenses of the Strategy’s Underlying Portfolios, as based upon the allocation of the Strategy’s assets among the Underlying Portfolios. The Financial Highlights section of this report sets forth expense ratio data for the current reporting period; the expense ratios shown above may differ from the expense ratios in the Financial Highlights section since they are based on different time periods.
| * | These share classes are offered at NAV to eligible investors and their SEC returns are the same as their NAV returns. Please note that these share classes are for investors purchasing shares through accounts established under certain fee-based programs sponsored and maintained by certain broker-dealers and financial intermediaries, institutional pension plans and/or investment advisory clients of, and certain other persons associated with, the Adviser and its affiliates or the Strategies. |
See Disclosures, Risks and Note about Historical Performance on pages 8-10.
(Historical Performance continued on next page)
| 16 | • AB WEALTH STRATEGIES |
Historical Performance
AB WEALTH APPRECIATION STRATEGY
HISTORICAL PERFORMANCE
(continued from previous page)
SEC AVERAGE ANNUAL RETURNS AS OF THE MOST RECENT CALENDAR QUARTER-END MARCH 31, 2016 (unaudited) | ||||
SEC Returns (reflects applicable | ||||
| Class A Shares | ||||
1 Year | -9.59 | % | ||
5 Years | 3.35 | % | ||
10 Years | 2.01 | % | ||
| Class B Shares | ||||
1 Year | -9.96 | % | ||
5 Years | 3.50 | % | ||
10 Years | 1.85 | % | ||
| Class C Shares | ||||
1 Year | -7.13 | % | ||
5 Years | 3.50 | % | ||
10 Years | 1.72 | % | ||
| Advisor Class Shares* | ||||
1 Year | -5.24 | % | ||
5 Years | 4.54 | % | ||
10 Years | 2.75 | % | ||
| Class R Shares* | ||||
1 Year | -5.91 | % | ||
5 Years | 3.85 | % | ||
10 Years | 2.08 | % | ||
| Class K Shares* | ||||
1 Year | -5.66 | % | ||
5 Years | 4.17 | % | ||
10 Years | 2.39 | % | ||
| Class I Shares* | ||||
1 Year | -5.32 | % | ||
5 Years | 4.52 | % | ||
10 Years | 2.74 | % | ||
| * | Please note that these share classes are for investors purchasing shares through accounts established under certain fee-based programs sponsored and maintained by certain broker-dealers and financial intermediaries, institutional pension plans and/or investment advisory clients of, and certain other persons associated with, the Adviser and its affiliates or the Strategies. |
See Disclosures, Risks and Note about Historical Performance on pages 8-10.
(Historical Performance continued on next page)
| AB WEALTH STRATEGIES • | 17 |
Historical Performance
AB BALANCED WEALTH STRATEGY
HISTORICAL PERFORMANCE
(continued from previous page)
| AVERAGE ANNUAL RETURNS AS FEBRUARY 29, 2016 (unaudited) | ||||||||
| NAV Returns | SEC Returns (reflects applicable | |||||||
| Class A Shares | ||||||||
1 Year | -8.66 | % | -12.55 | % | ||||
5 Years | 3.06 | % | 2.17 | % | ||||
10 Years | 3.29 | % | 2.84 | % | ||||
| Class B Shares | ||||||||
1 Year | -9.29 | % | -12.89 | % | ||||
5 Years | 2.31 | % | 2.31 | % | ||||
10 Years | 2.70 | % | 2.70 | % | ||||
| Class C Shares | ||||||||
1 Year | -9.29 | % | -10.18 | % | ||||
5 Years | 2.33 | % | 2.33 | % | ||||
10 Years | 2.55 | % | 2.55 | % | ||||
| Advisor Class Shares* | ||||||||
1 Year | -8.38 | % | -8.38 | % | ||||
5 Years | 3.36 | % | 3.36 | % | ||||
10 Years | 3.59 | % | 3.59 | % | ||||
| Class R Shares* | ||||||||
1 Year | -8.97 | % | -8.97 | % | ||||
5 Years | 2.69 | % | 2.69 | % | ||||
10 Years | 2.92 | % | 2.92 | % | ||||
| Class K Shares* | ||||||||
1 Year | -8.78 | % | -8.78 | % | ||||
5 Years | 3.00 | % | 3.00 | % | ||||
10 Years | 3.22 | % | 3.22 | % | ||||
| Class I Shares* | ||||||||
1 Year | -8.43 | % | -8.43 | % | ||||
5 Years | 3.34 | % | 3.34 | % | ||||
10 Years | 3.57 | % | 3.57 | % | ||||
See Disclosures, Risks and Note about Historical Performance on pages 8-10.
(Historical Performance and footnotes continued on next page)
| 18 | • AB WEALTH STRATEGIES |
Historical Performance
AB BALANCED WEALTH STRATEGY
HISTORICAL PERFORMANCE
(continued from previous page)
The Strategy’s current prospectus fee table shows the Strategy’s total annual operating expense ratios as 1.23%, 1.99%, 1.98%, 0.98%, 1.64%, 1.33% and 1.00% for Class A, Class B, Class C, Advisor Class, Class R, Class K and Class I shares, respectively, gross of any fee waivers or expense reimbursements. Contractual fee waivers and/or expense reimbursements limit the Strategy’s annual operating expense ratios to 1.15%, 1.91%, 1.90%, 0.90%, 1.56%, 1.25% and 0.92% for Class A, Class B, Class C, Advisor Class, Class R, Class K and Class I shares, respectively. These waivers/reimbursements may not be terminated before December 31, 2016. Absent reimbursements or waivers, performance would have been lower. The net and gross expenses shown include the total operating expenses of the Strategy and the indirect expenses of the Strategy’s Underlying Portfolios, as based upon the allocation of the Strategy’s assets among the Underlying Portfolios. The Financial Highlights section of this report sets forth expense ratio data for the current reporting period; the expense ratios shown above may differ from the expense ratios in the Financial Highlights section since they are based on different time periods.
| * | These share classes are offered at NAV to eligible investors and their SEC returns are the same as their NAV returns. Please note that these share classes are for investors purchasing shares through accounts established under certain fee-based programs sponsored and maintained by certain broker-dealers and financial intermediaries, institutional pension plans and/or investment advisory clients of, and certain other persons associated with, the Adviser and its affiliates or the Strategies. |
See Disclosures, Risks and Note about Historical Performance on pages 8-10.
(Historical Performance continued on next page)
| AB WEALTH STRATEGIES • | 19 |
Historical Performance
AB BALANCED WEALTH STRATEGY
HISTORICAL PERFORMANCE
(continued from previous page)
SEC AVERAGE ANNUAL RETURNS AS OF THE MOST RECENT CALENDAR QUARTER-END MARCH 31, 2016 (unaudited) | ||||
SEC Returns (reflects applicable | ||||
| Class A Shares | ||||
1 Year | -7.76 | % | ||
5 Years | 3.18 | % | ||
10 Years | 3.21 | % | ||
| Class B Shares | ||||
1 Year | -8.22 | % | ||
5 Years | 3.30 | % | ||
10 Years | 3.07 | % | ||
| Class C Shares | ||||
1 Year | -5.34 | % | ||
5 Years | 3.33 | % | ||
10 Years | 2.92 | % | ||
| Advisor Class Shares* | ||||
1 Year | -3.43 | % | ||
5 Years | 4.37 | % | ||
10 Years | 3.97 | % | ||
| Class R Shares* | ||||
1 Year | -4.01 | % | ||
5 Years | 3.69 | % | ||
10 Years | 3.28 | % | ||
| Class K Shares* | ||||
1 Year | -3.74 | % | ||
5 Years | 4.02 | % | ||
10 Years | 3.61 | % | ||
| Class I Shares* | ||||
1 Year | -3.47 | % | ||
5 Years | 4.36 | % | ||
10 Years | 3.95 | % | ||
| * | Please note that these share classes are for investors purchasing shares through accounts established under certain fee-based programs sponsored and maintained by certain broker-dealers and financial intermediaries, institutional pension plans and/or investment advisory clients of, and certain other persons associated with, the Adviser and its affiliates or the Strategies. |
See Disclosures, Risks and Note about Historical Performance on pages 8-10.
(Historical Performance continued on next page)
| 20 | • AB WEALTH STRATEGIES |
Historical Performance
AB CONSERVATIVE WEALTH STRATEGY
HISTORICAL PERFORMANCE
(continued from previous page)
| AVERAGE ANNUAL RETURNS AS OF FEBRUARY 29, 2016 (unaudited) | ||||||||
| NAV Returns | SEC Returns (reflects applicable | |||||||
| Class A Shares | ||||||||
1 Year | -4.41 | % | -8.50 | % | ||||
5 Years | 2.35 | % | 1.46 | % | ||||
10 Years | 3.03 | % | 2.58 | % | ||||
| Class B Shares | ||||||||
1 Year | -5.11 | % | -8.86 | % | ||||
5 Years | 1.59 | % | 1.59 | % | ||||
10 Years | 2.44 | % | 2.44 | % | ||||
| Class C Shares | ||||||||
1 Year | -5.15 | % | -6.09 | % | ||||
5 Years | 1.59 | % | 1.59 | % | ||||
10 Years | 2.30 | % | 2.30 | % | ||||
| Advisor Class Shares* | ||||||||
1 Year | -4.15 | % | -4.15 | % | ||||
5 Years | 2.64 | % | 2.64 | % | ||||
10 Years | 3.34 | % | 3.34 | % | ||||
| Class R Shares* | ||||||||
1 Year | -4.78 | % | -4.78 | % | ||||
5 Years | 1.96 | % | 1.96 | % | ||||
10 Years | 2.66 | % | 2.66 | % | ||||
| Class K Shares* | ||||||||
1 Year | -4.47 | % | -4.47 | % | ||||
5 Years | 2.28 | % | 2.28 | % | ||||
10 Years | 2.99 | % | 2.99 | % | ||||
| Class I Shares* | ||||||||
1 Year | -4.18 | % | -4.18 | % | ||||
5 Years | 2.60 | % | 2.60 | % | ||||
10 Years | 3.31 | % | 3.31 | % | ||||
See Disclosures, Risks and Note about Historical Performance on pages 8-10.
(Historical Performance and footnotes continued on next page)
| AB WEALTH STRATEGIES • | 21 |
Historical Performance
AB CONSERVATIVE WEALTH STRATEGY
HISTORICAL PERFORMANCE
(continued from previous page)
The Strategy’s current prospectus fee table shows the Strategy’s total annual operating expense ratios as 1.20%, 1.96%, 1.96%, 0.95%, 1.62%, 1.29% and 0.98% for Class A, Class B, Class C, Advisor Class, Class R, Class K and Class I shares, respectively, gross of any fee waivers or expense reimbursements. Contractual fee waivers and/or expense reimbursements limit the Strategy’s annual operating expense ratios to 1.14%, 1.90%, 1.90%, 0.89%, 1.56%, 1.23% and 0.92% for Class A, Class B, Class C, Advisor Class, Class R, Class K and Class I shares, respectively. These waivers/reimbursements may not be terminated before December 31, 2016. Absent reimbursements or waivers, performance would have been lower. The net and gross expenses shown include the total operating expenses of the Strategy and the indirect expenses of the Strategy’s Underlying Portfolios, as based upon the allocation of the Strategy’s assets among the Underlying Portfolios. The Financial Highlights section of this report sets forth expense ratio data for the current reporting period; the expense ratios shown above may differ from the expense ratios in the Financial Highlights section since they are based on different time periods.
| * | These share classes are offered at NAV to eligible investors and their SEC returns are the same as their NAV returns. Please note that these share classes are for investors purchasing shares through accounts established under certain fee-based programs sponsored and maintained by certain broker-dealers and financial intermediaries, institutional pension plans and/or investment advisory clients of, and certain other persons associated with, the Adviser and its affiliates or the Strategies. |
See Disclosures, Risks and Note about Historical Performance on pages 8-10.
(Historical Performance continued on next page)
| 22 | • AB WEALTH STRATEGIES |
Historical Performance
AB CONSERVATIVE WEALTH STRATEGY
HISTORICAL PERFORMANCE
(continued from previous page)
SEC AVERAGE ANNUAL RETURNS AS OF THE MOST RECENT CALENDAR QUARTER-END | ||||
SEC Returns (reflects applicable | ||||
| Class A Shares | ||||
1 Year | -5.78 | % | ||
5 Years | 2.00 | % | ||
10 Years | 2.82 | % | ||
| Class B Shares | ||||
1 Year | -6.13 | % | ||
5 Years | 2.16 | % | ||
10 Years | 2.69 | % | ||
| Class C Shares | ||||
1 Year | -3.26 | % | ||
5 Years | 2.17 | % | ||
10 Years | 2.54 | % | ||
| Advisor Class Shares* | ||||
1 Year | -1.38 | % | ||
5 Years | 3.20 | % | ||
10 Years | 3.58 | % | ||
| Class R Shares* | ||||
1 Year | -1.95 | % | ||
5 Years | 2.51 | % | ||
10 Years | 2.89 | % | ||
| Class K Shares* | ||||
1 Year | -1.62 | % | ||
5 Years | 2.86 | % | ||
10 Years | 3.22 | % | ||
| Class I Shares* | ||||
1 Year | -1.40 | % | ||
5 Years | 3.17 | % | ||
10 Years | 3.55 | % | ||
| * | Please note that these share classes are for investors purchasing shares through accounts established under certain fee-based programs sponsored and maintained by certain broker-dealers and financial intermediaries, institutional pension plans and/or investment advisory clients of, and certain other persons associated with, the Adviser and its affiliates or the Strategies. |
See Disclosures, Risks and Note about Historical Performance on pages 8-10.
(Historical Performance continued on next page)
| AB WEALTH STRATEGIES • | 23 |
Historical Performance
THE UNDERLYING PORTFOLIOS
HISTORICAL PERFORMANCE
(continued from previous page)
AVERAGE ANNUAL RETURNS FOR THE UNDERLYING PORTFOLIOS* AS OF FEBRUARY 29, 2016 (unaudited) | ||||
| NAV/SEC Returns | ||||
| AB U.S. Value Portfolio | ||||
1 Year | -10.67 | % | ||
5 Years | 8.08 | % | ||
10 Years | 4.01 | % | ||
| AB U.S. Large Cap Growth Portfolio | ||||
1 Year | -1.70 | % | ||
5 Year | 12.19 | % | ||
10 Years | 6.88 | % | ||
| AB International Value Portfolio | ||||
1 Year | -14.73 | % | ||
5 Years | -1.62 | % | ||
10 Years | -0.81 | % | ||
| AB International Growth Portfolio | ||||
1 Year | -14.24 | % | ||
5 Years | -1.80 | % | ||
10 Years | -1.33 | % | ||
| AB Short Duration Bond Portfolio | ||||
1 Year | 0.99 | % | ||
5 Years | 1.08 | % | ||
10 Years | 2.24 | % | ||
| AB Global Core Bond Portfolio | ||||
1 Year | 2.07 | % | ||
5 Years | 4.64 | % | ||
10 Years | 5.57 | % | ||
| AB Bond Inflation Protection Portfolio | ||||
1 Year | -0.80 | % | ||
5 Years | 2.41 | % | ||
10 Years | 4.33 | % | ||
| AB High-Yield Portfolio | ||||
1 Year | -8.69 | % | ||
5 Years | 4.58 | % | ||
10 Years | 7.11 | % | ||
| AB Small-Mid Cap Value Portfolio | ||||
1 Year | -10.86 | % | ||
5 Years | 7.84 | % | ||
10 Years | 7.57 | % | ||
See Disclosures, Risks and Note about Historical Performance on pages 8-10.
(Historical Performance and footnotes continued on next page)
| 24 | • AB WEALTH STRATEGIES |
Historical Performance
THE UNDERLYING PORTFOLIOS
HISTORICAL PERFORMANCE
(continued from previous page)
AVERAGE ANNUAL RETURNS FOR THE UNDERLYING PORTFOLIOS* AS OF FEBRUARY 29, 2016 (unaudited) | ||||
| NAV/SEC Returns | ||||
| AB Small-Mid Cap Growth Portfolio | ||||
1 Year | -15.45 | % | ||
5 Years | 7.53 | % | ||
10 Years | 8.53 | % | ||
| AB Multi-Asset Real Return Portfolio | ||||
1 Year | -24.07 | % | ||
5 Years | -7.94 | % | ||
10 Years | -2.28 | % | ||
| AB Volatility Management Portfolio | ||||
1 Year | -12.54 | % | ||
5 Years | 3.49 | % | ||
Since Inception† | 5.58 | % | ||
| AB Multi-Manager Alternative Strategies Fund | ||||
1 Year | -5.92 | % | ||
Since Inception‡ | -1.91 | % | ||
| * | Please note, shares of the Underlying Portfolios are offered exclusively to mutual funds advised by, and certain institutional clients of, AB that seek a blend of asset classes for investment, like the Strategies. These share classes are not currently offered for direct investment from the general public. The Underlying Portfolios do not contain sales charges or management fees. These Underlying Portfolios are offered at NAV and their SEC returns are the same as their NAV returns. The Underlying Portfolios can be purchased at the relevant NAV without a sales charge or other fee. However, there are sales charges in connection to purchases of other AB share classes invested in these Underlying Portfolios. |
| † | Inception date: 4/16/2010. |
| ‡ | Inception date: 7/31/2014. |
See Disclosures, Risks and Note about Historical Performance on pages 8-10.
(Historical Performance continued on next page)
| AB WEALTH STRATEGIES • | 25 |
Historical Performance
THE UNDERLYING PORTFOLIOS
HISTORICAL PERFORMANCE
(continued from previous page)
SEC AVERAGE ANNUAL RETURNS FOR THE UNDERLYING PORTFOLIOS* MARCH 31, 2016 (unaudited) | ||||
| NAV/SEC Returns | ||||
| AB U.S. Value Portfolio | ||||
1 Year | -3.34 | % | ||
5 Years | 9.51 | % | ||
10 Years | 4.60 | % | ||
| AB U.S. Large Cap Growth Portfolio | ||||
1 Year | 4.12 | % | ||
5 Years | 13.52 | % | ||
10 Years | 7.51 | % | ||
| AB International Value Portfolio | ||||
1 Year | -5.97 | % | ||
5 Years | 0.91 | % | ||
10 Years | -0.45 | % | ||
| AB International Growth Portfolio | ||||
1 Year | -6.64 | % | ||
5 Years | -0.40 | % | ||
10 Years | -0.99 | % | ||
| AB Short Duration Bond Portfolio | ||||
1 Year | 1.03 | % | ||
5 Years | 1.13 | % | ||
10 Years | 2.26 | % | ||
| AB Global Core Bond Portfolio | ||||
1 Year | 2.62 | % | ||
5 Years | 4.85 | % | ||
10 Years | 5.78 | % | ||
| AB Bond Inflation Protection Portfolio | ||||
1 Year | 1.92 | % | ||
5 Years | 2.71 | % | ||
10 Years | 4.67 | % | ||
| AB High-Yield Portfolio | ||||
1 Year | -4.50 | % | ||
5 Years | 5.38 | % | ||
10 Years | 7.55 | % | ||
| AB Small-Mid Cap Value Portfolio | ||||
1 Year | -3.78 | % | ||
5 Years | 9.45 | % | ||
10 Years | 8.26 | % | ||
See Disclosures, Risks and Note about Historical Performance on pages 8-10.
(Historical Performance and footnotes continued on next page)
| 26 | • AB WEALTH STRATEGIES |
Historical Performance
THE UNDERLYING PORTFOLIOS
HISTORICAL PERFORMANCE
(continued from previous page)
SEC AVERAGE ANNUAL RETURNS FOR THE UNDERLYING PORTFOLIOS* MARCH 31, 2016 (unaudited) | ||||
| NAV/SEC Returns | ||||
| AB Small-Mid Cap Growth Portfolio | ||||
1 Year | -9.91 | % | ||
5 Years | 8.04 | % | ||
10 Years | 8.79 | % | ||
| AB Multi-Asset Real Return Portfolio | ||||
1 Year | -14.16 | % | ||
5 Years | -6.69 | % | ||
10 Years | -1.94 | % | ||
| AB Volatility Management Portfolio | ||||
1 Year | -6.83 | % | ||
5 Years | 4.95 | % | ||
Since Inception† | 6.63 | % | ||
| AB Multi-Manager Alternative Strategies Fund | ||||
1 Year | -4.55 | % | ||
Since Inception‡ | -0.96 | % | ||
| * | Please note, shares of the Underlying Portfolios are offered exclusively to mutual funds advised by, and certain institutional clients of, AB that seek a blend of asset classes for investment, like the Strategies. These share classes are not currently offered for direct investment from the general public. The Underlying Portfolios do not contain sales charges or management fees. These Underlying Portfolios are offered at NAV and their SEC returns are the same as their NAV returns. The Underlying Portfolios can be purchased at the relevant NAV without a sales charge or other fee. However, there are sales charges in connection to purchases of other AB share classes invested in these Underlying Portfolios. |
| † | Inception date: 4/16/2010. |
| ‡ | Inception date: 7/31/2014. |
See Disclosures, Risks and Note about Historical Performance on pages 8-10.
| AB WEALTH STRATEGIES • | 27 |
Historical Performance
EXPENSE EXAMPLE
(unaudited)
As a shareholder of the Strategy, you incur two types of costs: (1) transaction costs, including sales charges (loads) on purchase payments, contingent deferred sales charges on redemptions and (2) ongoing costs, including management fees; distribution (12b-1) fees; and other Strategy expenses. This example is intended to help you understand your ongoing costs (in dollars) of investing in the Strategy and to compare these costs with the ongoing costs of investing in other mutual funds.
The Example is based on an investment of $1,000 invested at the beginning of the period and held for the entire period as indicated below.
Actual Expenses
The first line of the table below provides information about actual account values and actual expenses. You may use the information in this line, together with the amount you invested, to estimate the expenses that you paid over the period. Simply divide your account value by $1,000 (for example, an $8,600 account value divided by $1,000 = 8.6), then multiply the result by the number in the first line under the heading entitled “Expenses Paid During Period” to estimate the expenses you paid on your account during this period. Each Strategy will indirectly bear its pro rata share of the expenses incurred by the Underlying Portfolios in which the Strategies invest. These expenses are not included in the table below.
Hypothetical Example for Comparison Purposes
The second line of the table below provides information about hypothetical account values and hypothetical expenses based on the Strategy’s actual expense ratio and an assumed annual rate of return of 5% before expenses, which is not the Strategy’s actual return. The hypothetical account values and expenses may not be used to estimate the actual ending account balance or expenses you paid for the period. You may use this information to compare the ongoing costs of investing in the Strategy and other funds by comparing this 5% hypothetical example with the 5% hypothetical examples that appear in the shareholder reports of other funds. Each Strategy will indirectly bear its pro rata share of the expenses incurred by the Underlying Portfolios in which the Strategies invest. These expenses are not included in the table below.
Please note that the expenses shown in the table are meant to highlight your ongoing costs only and do not reflect any transactional costs, such as sales charges (loads), or contingent deferred sales charges on redemptions. Therefore, the second line of the table is useful in comparing ongoing costs only, and will not help you determine the relative total costs of owning different funds. In addition, if these transactional costs were included, your costs would have been higher.
AB Wealth Appreciation Strategy
| Beginning Account Value September 1, 2015 | Ending Account Value February 29, 2016 | Expenses Paid During Period* | Annualized Expense Ratio* | |||||||||||||
| Class A | ||||||||||||||||
Actual | $ | 1,000 | $ | 937.70 | $ | 4.29 | 0.89 | % | ||||||||
Hypothetical** | $ | 1,000 | $ | 1,020.44 | $ | 4.47 | 0.89 | % | ||||||||
| Class B | ||||||||||||||||
Actual | $ | 1,000 | $ | 934.00 | $ | 8.03 | 1.67 | % | ||||||||
Hypothetical** | $ | 1,000 | $ | 1,016.56 | $ | 8.37 | 1.67 | % | ||||||||
| Class C | ||||||||||||||||
Actual | $ | 1,000 | $ | 933.90 | $ | 7.93 | 1.65 | % | ||||||||
Hypothetical** | $ | 1,000 | $ | 1,016.66 | $ | 8.27 | 1.65 | % | ||||||||
| 28 | • AB WEALTH STRATEGIES |
Expense Example
EXPENSE EXAMPLE
(unaudited)
(continued from previous page)
| Beginning Account Value September 1, 2015 | Ending Account Value February 29, 2016 | Expenses Paid During Period* | Annualized Expense Ratio* | |||||||||||||
| Advisor Class | ||||||||||||||||
Actual | $ | 1,000 | $ | 938.80 | $ | 3.09 | 0.64 | % | ||||||||
Hypothetical** | $ | 1,000 | $ | 1,021.68 | $ | 3.22 | 0.64 | % | ||||||||
Class R | ||||||||||||||||
Actual | $ | 1,000 | $ | 935.40 | $ | 6.40 | 1.33 | % | ||||||||
Hypothetical** | $ | 1,000 | $ | 1,018.25 | $ | 6.67 | 1.33 | % | ||||||||
| Class K | ||||||||||||||||
Actual | $ | 1,000 | $ | 937.30 | $ | 4.91 | 1.02 | % | ||||||||
Hypothetical** | $ | 1,000 | $ | 1,019.79 | $ | 5.12 | 1.02 | % | ||||||||
| Class I | ||||||||||||||||
Actual | $ | 1,000 | $ | 938.70 | $ | 3.33 | 0.69 | % | ||||||||
Hypothetical** | $ | 1,000 | $ | 1,021.43 | $ | 3.47 | 0.69 | % | ||||||||
AB Balanced Wealth Strategy
| Beginning Account Value September 1, 2015 | Ending Account Value February 29, 2016 | Expenses Paid During Period* | Annualized Expense Ratio* | |||||||||||||
| Class A | ||||||||||||||||
Actual | $ | 1,000 | $ | 959.40 | $ | 4.24 | 0.87 | % | ||||||||
Hypothetical** | $ | 1,000 | $ | 1,020.54 | $ | 4.37 | 0.87 | % | ||||||||
| Class B | ||||||||||||||||
Actual | $ | 1,000 | $ | 956.10 | $ | 7.93 | 1.63 | % | ||||||||
Hypothetical** | $ | 1,000 | $ | 1,016.76 | $ | 8.17 | 1.63 | % | ||||||||
| Class C | ||||||||||||||||
Actual | $ | 1,000 | $ | 956.10 | $ | 7.88 | 1.62 | % | ||||||||
Hypothetical** | $ | 1,000 | $ | 1,016.81 | $ | 8.12 | 1.62 | % | ||||||||
| Advisor Class | ||||||||||||||||
Actual | $ | 1,000 | $ | 960.80 | $ | 3.02 | 0.62 | % | ||||||||
Hypothetical** | $ | 1,000 | $ | 1,021.78 | $ | 3.12 | 0.62 | % | ||||||||
| Class R | ||||||||||||||||
Actual | $ | 1,000 | $ | 957.90 | $ | 6.18 | 1.27 | % | ||||||||
Hypothetical** | $ | 1,000 | $ | 1,018.55 | $ | 6.37 | 1.27 | % | ||||||||
| Class K | ||||||||||||||||
Actual | $ | 1,000 | $ | 959.10 | $ | 4.68 | 0.96 | % | ||||||||
Hypothetical** | $ | 1,000 | $ | 1,020.09 | $ | 4.82 | 0.96 | % | ||||||||
| Class I | ||||||||||||||||
Actual | $ | 1,000 | $ | 960.40 | $ | 3.07 | 0.63 | % | ||||||||
Hypothetical** | $ | 1,000 | $ | 1,021.73 | $ | 3.17 | 0.63 | % | ||||||||
| AB WEALTH STRATEGIES • | 29 |
Expense Example
EXPENSE EXAMPLE
(unaudited)
(continued from previous page)
AB Conservative Wealth Strategy
| Beginning Account Value September 1, 2015 | Ending Account Value February 29, 2016 | Expenses Paid During Period* | Annualized Expense Ratio* | |||||||||||||
| Class A | ||||||||||||||||
Actual | $ | 1,000 | $ | 984.10 | $ | 4.69 | 0.95 | % | ||||||||
Hypothetical** | $ | 1,000 | $ | 1,020.14 | $ | 4.77 | 0.95 | % | ||||||||
| Class B | ||||||||||||||||
Actual | $ | 1,000 | $ | 980.50 | $ | 8.37 | 1.70 | % | ||||||||
Hypothetical** | $ | 1,000 | $ | 1,016.41 | $ | 8.52 | 1.70 | % | ||||||||
| Class C | ||||||||||||||||
Actual | $ | 1,000 | $ | 980.10 | $ | 8.37 | 1.70 | % | ||||||||
Hypothetical** | $ | 1,000 | $ | 1,016.41 | $ | 8.52 | 1.70 | % | ||||||||
| Advisor Class | ||||||||||||||||
Actual | $ | 1,000 | $ | 985.10 | $ | 3.45 | 0.70 | % | ||||||||
Hypothetical** | $ | 1,000 | $ | 1,021.38 | $ | 3.52 | 0.70 | % | ||||||||
| Class R | ||||||||||||||||
Actual | $ | 1,000 | $ | 982.80 | $ | 6.56 | 1.33 | % | ||||||||
Hypothetical** | $ | 1,000 | $ | 1,018.25 | $ | 6.67 | 1.33 | % | ||||||||
| Class K | ||||||||||||||||
Actual | $ | 1,000 | $ | 983.60 | $ | 5.13 | 1.04 | % | ||||||||
Hypothetical** | $ | 1,000 | $ | 1,019.69 | $ | 5.22 | 1.04 | % | ||||||||
| Class I | ||||||||||||||||
Actual | $ | 1,000 | $ | 984.90 | $ | 3.55 | 0.72 | % | ||||||||
Hypothetical** | $ | 1,000 | $ | 1,021.28 | $ | 3.62 | 0.72 | % | ||||||||
| * | Expenses are equal to the classes’ annualized expense ratios multiplied by the average account value over the period, multiplied by 182/366 (to reflect the one-half year period). Expenses of the underlying portfolios in which the Strategies invest are not included herein. |
| ** | Assumes 5% annual return before expenses. |
| 30 | • AB WEALTH STRATEGIES |
Expense Example
AB WEALTH APPRECIATION STRATEGY
PORTFOLIO SUMMARY
February 29, 2016 (unaudited)
PORTFOLIO STATISTICS
Net Assets ($mil): $1,267.9
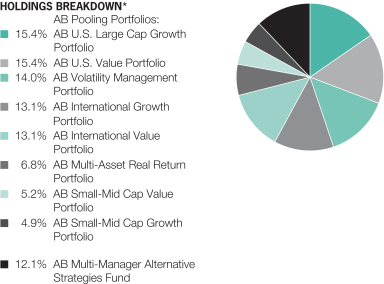
| * | All data are as of February 29, 2016. The Strategy’s holdings breakdown is expressed as a percentage of total investments and may vary over time. |
The Strategy invests in the Underlying Portfolios. Detailed information regarding the Strategy’s holdings, including specific breakdowns within the Underlying Portfolios can be found in the shareholder report filed with the Securities and Exchange Commission’s website at www.sec.gov, or call AB at (800) 227-4618. Performance for each of the Underlying Portfolios compared to its benchmark may be found on page 14. Additional performance for the Underlying Portfolios may be found on pages 24-27.
| AB WEALTH STRATEGIES • | 31 |
Portfolio Summary
AB BALANCED WEALTH STRATEGY
PORTFOLIO SUMMARY
February 29, 2016 (unaudited)
PORTFOLIO STATISTICS
Net Assets ($mil): $1,016.8
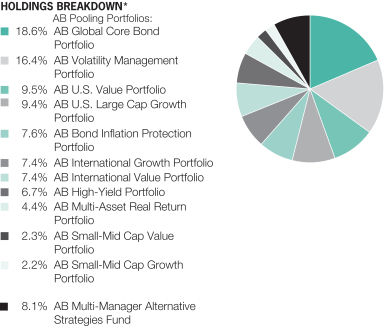
| * | All data are as of February 29, 2016. The Strategy’s holdings breakdown is expressed as a percentage of total investments and may vary over time. |
The Strategy invests in the Underlying Portfolios. Detailed information regarding the Strategy’s holdings, including specific breakdowns within the Underlying Portfolios can be found in the shareholder report filed with the Securities and Exchange Commission’s website at www.sec.gov, or call AB at (800) 227-4618. Performance for each of the Underlying Portfolios compared to its benchmark may be found on page 14. Additional performance for the Underlying Portfolios may be found on pages 24-27.
| 32 | • AB WEALTH STRATEGIES |
Portfolio Summary
AB CONSERVATIVE WEALTH STRATEGY
PORTFOLIO SUMMARY
February 29, 2016 (unaudited)
PORTFOLIO STATISTICS
Net Assets ($mil): $292.9
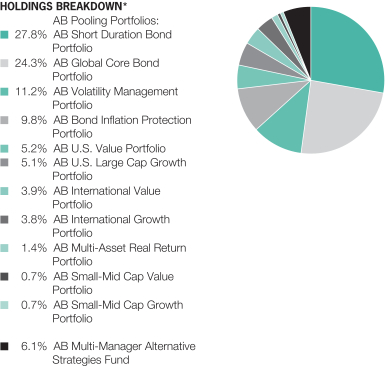
| * | All data are as of February 29, 2016. The Strategy’s holdings breakdown is expressed as a percentage of total investments and may vary over time. |
The Strategy invests in the Underlying Portfolios. Detailed information regarding the Strategy’s holdings, including specific breakdowns within the Underlying Portfolios can be found in the shareholder report filed with the Securities and Exchange Commission’s website at www.sec.gov, or call AB at (800) 227-4618. Performance for each of the Underlying Portfolios compared to its benchmark may be found on page 14. Additional performance for the Underlying Portfolios may be found on pages 24-27.
| AB WEALTH STRATEGIES • | 33 |
Portfolio Summary
AB WEALTH APPRECIATION STRATEGY
PORTFOLIO OF INVESTMENTS
February 29, 2016 (unaudited)
| Company | Shares | U.S. $ Value | ||||||
| ||||||||
INVESTMENT COMPANIES – 100.0% | ||||||||
Funds and Investment Trusts – 100.0%* | ||||||||
AB Multi-Manager Alternative Strategies Fund Class Z(a) | 15,880,896 | $ | 152,933,032 | |||||
AB Pooling Portfolio – AB International Growth Portfolio | 21,963,687 | 166,484,745 | ||||||
AB Pooling Portfolio – AB International Value Portfolio | 26,896,553 | 165,951,732 | ||||||
AB Pooling Portfolio – AB Multi-Asset Real Return Portfolio | 16,111,621 | 86,519,408 | ||||||
AB Pooling Portfolio – AB Small-Mid Cap Growth Portfolio | 7,648,199 | 62,332,818 | ||||||
AB Pooling Portfolio – AB Small-Mid Cap Value Portfolio | 7,269,926 | 66,301,729 | ||||||
AB Pooling Portfolio – AB U.S. Large Cap Growth Portfolio | 21,120,577 | 195,576,539 | ||||||
AB Pooling Portfolio – AB U.S. Value Portfolio | 16,454,888 | 195,154,967 | ||||||
AB Pooling Portfolio – AB Volatility Management Portfolio | 17,783,861 | 177,127,261 | ||||||
|
| |||||||
Total Investments – 100.0% | 1,268,382,231 | |||||||
Other assets less liabilities – 0.0% | (454,529 | ) | ||||||
|
| |||||||
Net Assets – 100.0% | $ | 1,267,927,702 | ||||||
|
| |||||||
| * | To obtain a copy of the fund’s financial statements, please go to the Securities and Exchange Commission’s website at www.sec.gov, or call AB at (800) 227-4618. |
| (a) | Non-income producing security. |
See notes to financial statements.
| 34 | • AB WEALTH STRATEGIES |
AB Wealth Appreciation Strategy—Portfolio of Investments
AB BALANCED WEALTH STRATEGY
PORTFOLIO OF INVESTMENTS
February 29, 2016 (unaudited)
| Company | Shares | U.S. $ Value | ||||||
| ||||||||
INVESTMENT COMPANIES – 100.2% | ||||||||
Funds and Investment Trusts – 100.2%* | ||||||||
AB Multi-Manager Alternative Strategies Fund Class Z(a) | 8,565,892 | $ | 82,489,537 | |||||
AB Pooling Portfolio – AB Bond Inflation Protection Portfolio | 8,198,973 | 77,726,263 | ||||||
AB Pooling Portfolio – AB Global Core Bond Portfolio | 19,068,060 | 189,727,195 | ||||||
AB Pooling Portfolio – AB High-Yield Portfolio | 7,586,170 | 67,668,638 | ||||||
AB Pooling Portfolio – AB International Growth Portfolio | 9,997,331 | 75,779,771 | ||||||
AB Pooling Portfolio – AB International Value Portfolio | 12,243,620 | 75,543,137 | ||||||
AB Pooling Portfolio – AB Multi-Asset Real Return Portfolio | 8,355,567 | 44,869,397 | ||||||
AB Pooling Portfolio – AB Small-Mid Cap Growth Portfolio | 2,693,493 | 21,951,969 | ||||||
AB Pooling Portfolio – AB Small-Mid Cap Value Portfolio | 2,548,210 | 23,239,676 | ||||||
AB Pooling Portfolio – AB U.S. Large Cap Growth Portfolio | 10,373,409 | 96,057,772 | ||||||
AB Pooling Portfolio – AB U.S. Value Portfolio | 8,175,752 | 96,964,414 | ||||||
AB Pooling Portfolio – AB Volatility Management Portfolio | 16,717,376 | 166,505,061 | ||||||
|
| |||||||
Total Investments – 100.2% | 1,018,522,830 | |||||||
Other assets less liabilities – (0.2)% | (1,761,824 | ) | ||||||
|
| |||||||
Net Assets – 100.0% | $ | 1,016,761,006 | ||||||
|
| |||||||
| * | To obtain a copy of the fund’s financial statements, please go to the Securities and Exchange Commission’s website at www.sec.gov, or call AB at (800) 227-4618. |
| (a) | Non-income producing security. |
See notes to financial statements.
| AB WEALTH STRATEGIES • | 35 |
AB Balanced Wealth Strategy—Portfolio of Investments
AB CONSERVATIVE WEALTH STRATEGY
PORTFOLIO OF INVESTMENTS
February 29, 2016 (unaudited)
| Company | Shares | U.S. $ Value | ||||||
| ||||||||
INVESTMENT COMPANIES – 100.2% | ||||||||
Funds and Investment Trusts – 100.2%* | ||||||||
AB Multi-Manager Alternative Strategies Fund Class Z(a) | 1,871,476 | $ | 18,022,316 | |||||
AB Pooling Portfolio – AB Bond Inflation Protection Portfolio | 3,032,046 | 28,743,791 | ||||||
AB Pooling Portfolio – AB Global Core Bond Portfolio | 7,177,465 | 71,415,774 | ||||||
AB Pooling Portfolio – AB International Growth Portfolio | 1,469,417 | 11,138,177 | ||||||
AB Pooling Portfolio – AB International Value Portfolio | 1,828,389 | 11,281,162 | ||||||
AB Pooling Portfolio – AB Multi-Asset Real Return Portfolio | 770,504 | 4,137,606 | ||||||
AB Pooling Portfolio – AB Short Duration Bond Portfolio | 8,641,195 | 81,400,060 | ||||||
AB Pooling Portfolio – AB Small-Mid Cap Growth Portfolio | 251,143 | 2,046,816 | ||||||
AB Pooling Portfolio – AB Small-Mid Cap Value Portfolio | 239,501 | 2,184,250 | ||||||
AB Pooling Portfolio – AB U.S. Large Cap Growth Portfolio | 1,614,121 | 14,946,764 | ||||||
AB Pooling Portfolio – AB U.S. Value Portfolio | 1,277,423 | 15,150,234 | ||||||
AB Pooling Portfolio – AB Volatility Management Portfolio | 3,301,006 | 32,878,019 | ||||||
|
| |||||||
Total Investments – 100.2% | 293,344,969 | |||||||
Other assets less liabilities – (0.2)% | (462,793 | ) | ||||||
|
| |||||||
Net Assets – 100.0% | $ | 292,882,176 | ||||||
|
| |||||||
| * | To obtain a copy of the fund’s financial statements, please go to the Securities and Exchange Commission’s website at www.sec.gov, or call AB at (800) 227-4618. |
| (a) | Non-income producing security. |
See notes to financial statements.
| 36 | • AB WEALTH STRATEGIES |
AB Conservative Wealth Strategy—Portfolio of Investments
STATEMENT OF ASSETS & LIABILITIES
February 29, 2016 (unaudited)
| AB Wealth Appreciation Strategy | ||||
| Assets | ||||
Investments in affiliated Underlying Portfolios, at value | $ | 1,268,382,231 | ||
Receivable for shares of beneficial interest sold | 1,372,833 | |||
|
| |||
Total assets | 1,269,755,064 | |||
|
| |||
| Liabilities | ||||
Payable for shares of beneficial interest redeemed | 843,886 | |||
Advisory fee payable | 523,364 | |||
Distribution fee payable | 158,269 | |||
Transfer Agent fee payable | 104,403 | |||
Payable for investments purchased | 53,856 | |||
Administrative fee payable | 185 | |||
Accrued expenses | 143,399 | |||
|
| |||
Total liabilities | 1,827,362 | |||
|
| |||
Net Assets | $ | 1,267,927,702 | ||
|
| |||
| Composition of Net Assets | ||||
Shares of beneficial interest, at par | $ | 941 | ||
Additional paid-in capital | 1,396,252,024 | |||
Undistributed net investment income | 20,031,622 | |||
Accumulated net realized loss on investment transactions | (56,262,255 | ) | ||
Net unrealized depreciation on investments | (92,094,630 | ) | ||
|
| |||
| $ | 1,267,927,702 | |||
|
| |||
Net Asset Value Per Share—unlimited shares authorized, $.00001 par value
| Class | Net Assets | Shares Outstanding | Net Asset Value | |||||||||
| ||||||||||||
| A | $ | 334,644,834 | 24,777,127 | $ | 13.51 | * | ||||||
| ||||||||||||
| B | $ | 17,656,992 | 1,301,490 | $ | 13.57 | |||||||
| ||||||||||||
| C | $ | 95,540,940 | 7,101,826 | $ | 13.45 | |||||||
| ||||||||||||
| Advisor | $ | 801,061,363 | 59,460,862 | $ | 13.47 | |||||||
| ||||||||||||
| R | $ | 3,361,635 | 250,305 | $ | 13.43 | |||||||
| ||||||||||||
| K | $ | 14,134,400 | 1,052,305 | $ | 13.43 | |||||||
| ||||||||||||
| I | $ | 1,527,538 | 113,552 | $ | 13.45 | |||||||
| ||||||||||||
| * | The maximum offering price per share for Class A shares was $14.11 which reflects a sales charge of 4.25%. |
See notes to financial statements.
| AB WEALTH STRATEGIES • | 37 |
Statement of Assets & Liabilities
| AB Balanced Wealth Strategy | ||||
| Assets | ||||
Investments in affiliated Underlying Portfolios, at value | $ | 1,018,522,830 | ||
Receivable for investments sold | 3,267,894 | |||
Receivable for shares of beneficial interest sold | 317,798 | |||
|
| |||
Total assets | 1,022,108,522 | |||
|
| |||
| Liabilities | ||||
Payable for shares of beneficial interest redeemed | 4,389,664 | |||
Advisory fee payable | 374,557 | |||
Distribution fee payable | 320,396 | |||
Transfer Agent fee payable | 99,346 | |||
Accrued expenses | 163,553 | |||
|
| |||
Total liabilities | 5,347,516 | |||
|
| |||
Net Assets | $ | 1,016,761,006 | ||
|
| |||
| Composition of Net Assets | ||||
Shares of beneficial interest, at par | $ | 805 | ||
Additional paid-in capital | 1,167,453,096 | |||
Undistributed net investment income | 11,757,180 | |||
Accumulated net realized loss on investment transactions | (135,041,483 | ) | ||
Net unrealized depreciation on investments | (27,408,592 | ) | ||
|
| |||
| $ | 1,016,761,006 | |||
|
| |||
Net Asset Value Per Share—unlimited shares authorized, $.00001 par value
| Class | Net Assets | Shares Outstanding | Net Asset Value | |||||||||
| ||||||||||||
| A | $ | 658,110,868 | 52,057,050 | $ | 12.64 | * | ||||||
| ||||||||||||
| B | $ | 33,512,018 | 2,657,794 | $ | 12.61 | |||||||
| ||||||||||||
| C | $ | 198,113,422 | 15,798,371 | $ | 12.54 | |||||||
| ||||||||||||
| Advisor | $ | 82,421,475 | 6,485,709 | $ | 12.71 | |||||||
| ||||||||||||
| R | $ | 6,926,256 | 549,762 | $ | 12.60 | |||||||
| ||||||||||||
| K | $ | 27,279,387 | 2,164,331 | $ | 12.60 | |||||||
| ||||||||||||
| I | $ | 10,397,580 | 820,621 | $ | 12.67 | |||||||
| ||||||||||||
| * | The maximum offering price per share for Class A shares was $13.20 which reflects a sales charge of 4.25%. |
See notes to financial statements.
| 38 | • AB WEALTH STRATEGIES |
Statement of Assets & Liabilities
| AB Conservative Wealth Strategy | ||||
| Assets | ||||
Investments in affiliated Underlying Portfolios, at value | $ | 293,344,969 | ||
Receivable for investments sold | 161,735 | |||
Receivable for shares of beneficial interest sold | 54,427 | |||
|
| |||
Total assets | 293,561,131 | |||
|
| |||
| Liabilities | ||||
Payable for shares of beneficial interest redeemed | 369,786 | |||
Advisory fee payable | 113,626 | |||
Distribution fee payable | 109,440 | |||
Transfer Agent fee payable | 23,097 | |||
Accrued expenses | 63,006 | |||
|
| |||
Total liabilities | 678,955 | |||
|
| |||
Net Assets | $ | 292,882,176 | ||
|
| |||
| Composition of Net Assets | ||||
Shares of beneficial interest, at par | $ | 251 | ||
Additional paid-in capital | 303,385,936 | |||
Undistributed net investment income | 5,354,482 | |||
Accumulated net realized loss on investment transactions | (21,851,672 | ) | ||
Net unrealized appreciation on investments | 5,993,179 | |||
|
| |||
| $ | 292,882,176 | |||
|
| |||
Net Asset Value Per Share—unlimited shares authorized, $.00001 par value
| Class | Net Assets | Shares Outstanding | Net Asset Value | |||||||||
| ||||||||||||
| A | $ | 178,509,545 | 15,218,431 | $ | 11.73 | * | ||||||
| ||||||||||||
| B | $ | 11,975,505 | 1,029,906 | $ | 11.63 | |||||||
| ||||||||||||
| C | $ | 77,563,425 | 6,701,919 | $ | 11.57 | |||||||
| ||||||||||||
| Advisor | $ | 12,258,717 | 1,040,550 | $ | 11.78 | |||||||
| ||||||||||||
| R | $ | 4,175,982 | 356,087 | $ | 11.73 | |||||||
| ||||||||||||
| K | $ | 7,948,829 | 679,308 | $ | 11.70 | |||||||
| ||||||||||||
| I | $ | 450,173 | 38,304 | $ | 11.75 | |||||||
| ||||||||||||
| * | The maximum offering price per share for Class A shares was $12.25 which reflects a sales charge of 4.25%. |
See notes to financial statements.
| AB WEALTH STRATEGIES • | 39 |
Statement of Assets & Liabilities
STATEMENT OF OPERATIONS
Six Months Ended February 29, 2016 (unaudited)
| AB Wealth Appreciation Strategy | AB Balanced Wealth Strategy | AB Conservative Wealth Strategy | ||||||||||
| Investment Income | ||||||||||||
Income distributions from affiliated Underlying Portfolios | $ | 32,190,521 | $ | 30,915,260 | $ | 7,167,319 | ||||||
|
|
|
|
|
| |||||||
| Expenses | ||||||||||||
Advisory fee (see Note B) | 4,361,695 | 2,973,669 | 846,634 | |||||||||
Distribution fee – Class A | 445,344 | 862,096 | 231,139 | |||||||||
Distribution fee – Class B | 109,772 | 209,459 | 75,861 | |||||||||
Distribution fee – Class C | 517,156 | 1,054,700 | 402,843 | |||||||||
Distribution fee – Class R | 9,119 | 20,839 | 12,273 | |||||||||
Distribution fee – Class K | 18,915 | 35,995 | 10,099 | |||||||||
Transfer agency – Class A | 130,376 | 371,704 | 92,744 | |||||||||
Transfer agency – Class B | 11,705 | 25,674 | 8,464 | |||||||||
Transfer agency – Class C | 41,450 | 117,791 | 41,749 | |||||||||
Transfer agency – Advisor Class | 307,493 | 48,695 | 6,903 | |||||||||
Transfer agency – Class R | 4,742 | 10,836 | 5,747 | |||||||||
Transfer agency – Class K | 15,131 | 28,796 | 7,811 | |||||||||
Transfer agency – Class I | 970 | 6,772 | 270 | |||||||||
Printing | 73,455 | 72,113 | 21,957 | |||||||||
Registration fees | 54,592 | 52,565 | 47,547 | |||||||||
Custodian | 32,763 | 32,763 | 32,763 | |||||||||
Legal | 30,340 | 29,995 | 27,525 | |||||||||
Audit and tax | 15,756 | 15,756 | 15,756 | |||||||||
Trustees’ fees | 10,816 | 10,816 | 10,816 | |||||||||
Administrative | 20,132 | – 0 | – | – 0 | – | |||||||
Miscellaneous | 17,495 | 15,401 | 6,121 | |||||||||
|
|
|
|
|
| |||||||
Total expenses | 6,229,217 | 5,996,435 | 1,905,022 | |||||||||
Less: expenses waived and reimbursed by the Adviser (see Note B) | (808,770 | ) | (437,628 | ) | (92,705 | ) | ||||||
|
|
|
|
|
| |||||||
Net expenses | 5,420,447 | 5,558,807 | 1,812,317 | |||||||||
|
|
|
|
|
| |||||||
Net investment income | 26,770,074 | 25,356,453 | 5,355,002 | |||||||||
|
|
|
|
|
| |||||||
| Realized and Unrealized Gain (Loss) on Investment Transactions | ||||||||||||
Net realized gain (loss) on sale of affiliated Underlying Portfolio shares | 1,609,477 | 410,096 | (122,452 | ) | ||||||||
Net realized gain distributions received from affiliated Underlying Portfolios | 75,517,267 | 36,391,249 | 5,423,193 | |||||||||
Net change in unrealized appreciation/depreciation of investments in affiliated Underlying Portfolios | (188,210,873 | ) | (106,905,098 | ) | (15,814,858 | ) | ||||||
|
|
|
|
|
| |||||||
Net loss on transactions | (111,084,129 | ) | (70,103,753 | ) | (10,514,117 | ) | ||||||
|
|
|
|
|
| |||||||
Net Decrease in Net Assets from Operations | $ | (84,314,055 | ) | $ | (44,747,300 | ) | $ | (5,159,115 | ) | |||
|
|
|
|
|
| |||||||
See notes to financial statements.
| 40 | • AB WEALTH STRATEGIES |
Statement of Operations
STATEMENT OF CHANGES IN NET ASSETS
| AB Wealth Appreciation Strategy | ||||||||
| Six Months Ended February 29, 2016 (unaudited) | Year Ended August 31, 2015 | |||||||
| Increase (Decrease) in Net Assets from Operations | ||||||||
Net investment income | $ | 26,770,074 | $ | 33,826,827 | ||||
Net realized gain on sale of affiliated Underlying Portfolio shares | 1,609,477 | 6,050,579 | ||||||
Net realized gain distributions from affiliated Underlying Portfolios | 75,517,267 | 100,448,793 | ||||||
Net change in unrealized appreciation/depreciation of investments in affiliated Underlying Portfolios | (188,210,873 | ) | (211,090,253 | ) | ||||
|
|
|
| |||||
Net decrease in net assets from operations | (84,314,055 | ) | (70,764,054 | ) | ||||
| Dividends to Shareholders from | ||||||||
Net investment income | ||||||||
Class A | (5,720,211 | ) | (8,925,808 | ) | ||||
Class B | (59,865 | ) | (620,967 | ) | ||||
Class C | (777,204 | ) | (1,928,927 | ) | ||||
Advisor Class | (15,798,469 | ) | (22,985,759 | ) | ||||
Class R | (39,826 | ) | (102,368 | ) | ||||
Class K | (218,945 | ) | (323,868 | ) | ||||
Class I | (29,121 | ) | (112,616 | ) | ||||
| Transactions in Shares of Beneficial Interest | ||||||||
Net decrease | (9,249,303 | ) | (69,738,524 | ) | ||||
|
|
|
| |||||
Total decrease | (116,206,999 | ) | (175,502,891 | ) | ||||
| Net Assets | ||||||||
Beginning of period | 1,384,134,701 | 1,559,637,592 | ||||||
|
|
|
| |||||
End of period (including undistributed net investment income of $20,031,622 and $15,905,189, respectively) | $ | 1,267,927,702 | $ | 1,384,134,701 | ||||
|
|
|
| |||||
See notes to financial statements.
| AB WEALTH STRATEGIES • | 41 |
Statement of Changes in Net Assets
| AB Balanced Wealth Strategy | ||||||||
| Six Months Ended February 29, 2016 (unaudited) | Year Ended August 31, 2015 | |||||||
| Increase (Decrease) in Net Assets from Operations | ||||||||
Net investment income | $ | 25,356,453 | $ | 36,644,617 | ||||
Net realized gain on sale of affiliated Underlying Portfolio shares | 410,096 | 11,821,705 | ||||||
Net realized gain distributions from affiliated Underlying Portfolios | 36,391,249 | 53,787,961 | ||||||
Net change in unrealized appreciation/depreciation of investments in affiliated Underlying Portfolios | (106,905,098 | ) | (145,426,128 | ) | ||||
|
|
|
| |||||
Net decrease in net assets from operations | (44,747,300 | ) | (43,171,845 | ) | ||||
| Dividends to Shareholders from | ||||||||
Net investment income | ||||||||
Class A | (16,168,585 | ) | (17,334,528 | ) | ||||
Class B | (398,255 | ) | (1,542,609 | ) | ||||
Class C | (3,265,158 | ) | (4,302,459 | ) | ||||
Advisor Class | (2,323,739 | ) | (2,645,297 | ) | ||||
Class R | (147,616 | ) | (229,982 | ) | ||||
Class K | (646,694 | ) | (602,439 | ) | ||||
Class I | (291,278 | ) | (345,251 | ) | ||||
| Transactions in Shares of Beneficial Interest | ||||||||
Net decrease | (49,579,856 | ) | (128,179,111 | ) | ||||
|
|
|
| |||||
Total decrease | (117,568,481 | ) | (198,353,521 | ) | ||||
| Net Assets | ||||||||
Beginning of period | 1,134,329,487 | 1,332,683,008 | ||||||
|
|
|
| |||||
End of period (including undistributed net investment income of $11,757,180 and $9,642,052, respectively) | $ | 1,016,761,006 | $ | 1,134,329,487 | ||||
|
|
|
| |||||
See notes to financial statements.
| 42 | • AB WEALTH STRATEGIES |
Statement of Changes in Net Assets
| AB Conservative Wealth Strategy | ||||||||
| Six Months Ended February 29, 2016 (unaudited) | Year Ended August 31, 2015 | |||||||
| Increase (Decrease) in Net Assets from Operations | ||||||||
Net investment income | $ | 5,355,002 | $ | 7,229,380 | ||||
Net realized gain (loss) on sale of affiliated Underlying Portfolio shares | (122,452 | ) | 2,571,538 | |||||
Net realized gain distributions from affiliated Underlying Portfolios | 5,423,193 | 8,594,360 | ||||||
Net change in unrealized appreciation/depreciation of investments in affiliated Underlying Portfolios | (15,814,858 | ) | (24,470,061 | ) | ||||
|
|
|
| |||||
Net decrease in net assets from operations | (5,159,115 | ) | (6,074,783 | ) | ||||
| Dividends to Shareholders from | ||||||||
Net investment income | ||||||||
Class A | (3,973,134 | ) | (851,439 | ) | ||||
Class B | (168,366 | ) | – 0 | – | ||||
Class C | (1,305,359 | ) | – 0 | – | ||||
Advisor Class | (332,915 | ) | (101,878 | ) | ||||
Class R | (93,967 | ) | (11,762 | ) | ||||
Class K | (171,049 | ) | (31,582 | ) | ||||
Class I | (10,497 | ) | (4,138 | ) | ||||
| Transactions in Shares of Beneficial Interest | ||||||||
Net decrease | (16,026,654 | ) | (47,466,391 | ) | ||||
|
|
|
| |||||
Total decrease | (27,241,056 | ) | (54,541,973 | ) | ||||
| Net Assets | ||||||||
Beginning of period | 320,123,232 | 374,665,205 | ||||||
|
|
|
| |||||
End of period (including undistributed net investment income of $5,354,482 and $6,054,767, respectively) | $ | 292,882,176 | $ | 320,123,232 | ||||
|
|
|
| |||||
See notes to financial statements.
| AB WEALTH STRATEGIES • | 43 |
Statement of Changes in Net Assets
NOTES TO FINANCIAL STATEMENTS
February 29, 2016 (unaudited)
NOTE A
Significant Accounting Policies
The AB Portfolios (the “Trust”) was organized as a Massachusetts Business Trust on March 26, 1987 and is registered under the Investment Company Act of 1940 as a diversified, open end management investment company. The Trust operates as a series company currently comprised of seven series: AB Growth Fund, AB Wealth Appreciation Strategy, AB Balanced Wealth Strategy, AB Conservative Wealth Strategy, AB Tax-Managed Wealth Appreciation Strategy, AB Tax-Managed Balanced Wealth Strategy and AB Tax-Managed Conservative Wealth Strategy. Each series is considered to be a separate entity for financial reporting and tax purposes. This report relates only to AB Wealth Appreciation Strategy, AB Balanced Wealth Strategy and AB Conservative Wealth Strategy (the “Strategies”). The Strategies offer Class A, Class B, Class C, Advisor Class, Class R, Class K and Class I shares. Class A shares are sold with a front-end sales charge of up to 4.25% for purchases not exceeding $1,000,000. With respect to purchases of $1,000,000 or more, Class A shares redeemed within one year of purchase may be subject to a contingent deferred sales charge of 1%. Class B shares are currently sold with a contingent deferred sales charge which declines from 4% to zero depending on the period of time the shares are held. Effective January 31, 2009, sales of Class B shares of the Strategies to new investors were suspended. Class B shares will only be issued (i) upon the exchange of Class B shares from another AB Mutual Fund, (ii) for purposes of dividend reinvestment, (iii) through the Strategies’ Automatic Investment Program (the “Program”) for accounts that established the Program prior to January 31, 2009, and (iv) for purchases of additional shares by Class B shareholders as of January 31, 2009. The ability to establish a new Program for accounts containing Class B shares was suspended as of January 31, 2009. Class B shares will automatically convert to Class A shares eight years after the end of the calendar month of purchase. Class C shares are subject to a contingent deferred sales charge of 1% on redemptions made within the first year after purchase. Class R and Class K shares are sold without an initial or contingent deferred sales charge. Advisor Class and Class I shares are sold without an initial or contingent deferred sales charge and are not subject to ongoing distribution expenses. All seven classes of shares have identical voting, dividend, liquidation and other rights, except that the classes bear different distribution and transfer agency expenses. Each class has exclusive voting rights with respect to its distribution plan. The Strategies invest primarily in a combination of portfolios of The AB Mutual Funds (the “Underlying Portfolios”) representing a variety of asset classes and investment styles that are managed by AllianceBernstein L.P. (the “Adviser”). The financial statements have been prepared in conformity with U.S. generally accepted accounting principles (“U.S. GAAP”) which require management to make certain estimates and assumptions that affect the reported amounts of assets and liabilities in the financial statements and amounts of income and expenses during the reporting period. Actual results could differ from those estimates. The Trust is an investment company under U.S. GAAP
| 44 | • AB WEALTH STRATEGIES |
Notes to Financial Statements
and follows the accounting and reporting guidance applicable to investment companies. The following is a summary of significant accounting policies followed by the Strategies.
1. Security Valuation
Net asset value per share of the Strategies, which may be based on the NAVs of the Underlying Portfolios, is calculated as of the close of business of the New York Stock Exchange, normally 4:00 p.m., Eastern Time. Investments in the Underlying Portfolios are valued at their net asset value each business day.
2. Fair Value Measurements
In accordance with U.S. GAAP regarding fair value measurements, fair value is defined as the price that the Strategies would receive to sell an asset or pay to transfer a liability in an orderly transaction between market participants at the measurement date. U.S. GAAP establishes a framework for measuring fair value, and a three-level hierarchy for fair value measurements based upon the transparency of inputs to the valuation of an asset or liability (including those valued based on their market values as described in Note A.1 above). Inputs may be observable or unobservable and refer broadly to the assumptions that market participants would use in pricing the asset or liability. Observable inputs reflect the assumptions market participants would use in pricing the asset or liability based on market data obtained from sources independent of the Strategies. Unobservable inputs reflect the Strategies’ own assumptions about the assumptions that market participants would use in pricing the asset or liability based on the best information available in the circumstances. Each investment is assigned a level based upon the observability of the inputs which are significant to the overall valuation. The three-tier hierarchy of inputs is summarized below.
| • | Level 1—quoted prices in active markets for identical investments |
| • | Level 2—other significant observable inputs (including quoted prices for similar investments, interest rates, prepayment speeds, credit risk, etc.) |
| • | Level 3—significant unobservable inputs (including the Strategies’ own assumptions in determining the fair value of investments) |
The following table summarizes the valuation of the Strategies’ investments by the above fair value hierarchy levels as of February 29, 2016:
| Investments in Underlying Portfolios* | Level 1 | Level 2 | Level 3 | Total | ||||||||||||
AB Wealth Appreciation Strategy | ||||||||||||||||
Investment Companies | $ | 293,344,969 | $ | – 0 | – | $ | – 0 | – | $ | 1,268,382,231 | ||||||
|
|
|
|
|
|
|
| |||||||||
AB Balanced Wealth Strategy | ||||||||||||||||
Investment Companies | 1,018,522,830 | – 0 | – | – 0 | – | 1,018,522,830 | ||||||||||
|
|
|
|
|
|
|
| |||||||||
AB Conservative Wealth Strategy | ||||||||||||||||
Investment Companies | 1,268,382,231 | – 0 | – | – 0 | – | 293,344,969 | ||||||||||
|
|
|
|
|
|
|
| |||||||||
| * | There were no transfers between any levels during the reporting period. |
| AB WEALTH STRATEGIES • | 45 |
Notes to Financial Statements
The Strategies recognize all transfers between levels of the fair value hierarchy assuming the financial instruments were transferred at the beginning of the reporting period.
The Adviser established a Valuation Committee (the “Committee”) to oversee the pricing and valuation of all securities held in the Strategies. The Committee operates under pricing and valuation policies and procedures established by the Adviser and approved by the Board, including pricing policies which set forth the mechanisms and processes to be employed on a daily basis to implement these policies and procedures. In particular, the pricing policies describe how to determine market quotations for securities and other instruments. The Committee’s responsibilities include: 1) fair value and liquidity determinations (and oversight of any third parties to whom any responsibility for fair value and liquidity determinations is delegated), and 2) regular monitoring of the Adviser’s pricing and valuation policies and procedures and modification or enhancement of these policies and procedures (or recommendation of the modification of these policies and procedures) as the Committee believes appropriate.
The Committee is also responsible for monitoring the implementation of the pricing policies by the Adviser’s Pricing Group (the “Pricing Group”) and a third party which performs certain pricing functions in accordance with the pricing policies. The Pricing Group is responsible for the oversight of the third party on a day-to-day basis. The Committee and the Pricing Group perform a series of activities to provide reasonable assurance of the accuracy of prices including: 1) periodic vendor due diligence meetings, review of methodologies, new developments and processes at vendors, 2) daily comparison of security valuation versus prior day for all securities that exceeded established thresholds, and 3) daily review of unpriced, stale, and variance reports with exceptions reviewed by senior management and the Committee.
In addition, several processes outside of the pricing process are used to monitor valuation issues including: 1) performance and performance attribution reports are monitored for anomalous impacts based upon benchmark performance, and 2) portfolio managers review all portfolios for performance and analytics (which are generated using the Adviser’s prices).
3. Taxes
It is each Strategies’ policy to meet the requirements of the Internal Revenue Code applicable to regulated investment companies and to distribute all of its investment company taxable income and net realized gains, if any, to shareholders. Therefore, no provisions for federal income or excise taxes are required. Taxes are accrued and applied to net investment income, net realized gains and net unrealized appreciation/depreciation as such income and/or gains are earned.
| 46 | • AB WEALTH STRATEGIES |
Notes to Financial Statements
In accordance with U.S. GAAP requirements regarding accounting for uncertainties in income taxes, management has analyzed the Strategies’ tax positions taken or expected to be taken on federal and state income tax returns for all open tax years (the current and the prior three tax years) and has concluded that no provision for income tax is required in the Strategies’ financial statements.
4. Investment Income and Investment Transactions
Income and capital gain distributions from the Underlying Portfolios, if any, are recorded on the ex-dividend date. Transactions in shares of the Underlying Portfolios are accounted for on the trade date. Investment gains and losses are determined on the identified cost basis.
5. Class Allocations
All income earned and expenses incurred by the Strategies are borne on a pro-rata basis by each settled class of shares, based on the proportionate interest in each Strategy represented by the net assets of such class, except for class specific expenses which are allocated to the respective class. Expenses included in the accompanying statements of operations do not include any expenses of the Underlying Portfolios. Expenses of the Trust are charged proportionately to each Strategy or based on other appropriate methods. Realized and unrealized gains and losses are allocated among the various share classes based on respective net assets.
6. Dividends and Distributions
Dividends and distributions to shareholders, if any, are recorded on the ex-dividend date. Income dividends and capital gains distributions are determined in accordance with federal tax regulations and may differ from those determined in accordance with U.S. GAAP. To the extent these differences are permanent, such amounts are reclassified within the capital accounts based on their federal tax basis treatment; temporary differences do not require such reclassification.
NOTE B
Advisory Fee and Other Transactions with Affiliates
Under the terms of the investment advisory agreement, the Strategies pay the Adviser at the annual rates as follows:
| Average Daily Net Assets | ||||||||||||
| Strategies | First $2.5 Billion | Next $2.5 Billion | In Excess of $5 Billion | |||||||||
AB Wealth Appreciation | .65 | % | .55 | % | .50 | % | ||||||
AB Balanced Wealth | .55 | % | .45 | % | .40 | % | ||||||
AB Conservative Wealth | .55 | % | .45 | % | .40 | % | ||||||
Such fees are accrued daily and paid monthly.
| AB WEALTH STRATEGIES • | 47 |
Notes to Financial Statements
Effective January 1, 2015, AB Wealth Appreciation Strategy may reimburse the Adviser for certain legal and accounting services provided to Strategy by the Adviser. For the six months ended February 29, 2016, the reimbursement for such services amounted to $20,132.
The Strategies compensate AllianceBernstein Investor Services, Inc. (“ABIS”), a wholly-owned subsidiary of the Adviser, under a Transfer Agency Agreement for providing personnel and facilities to perform transfer agency services for the Strategies. ABIS may make payments to intermediaries that provide omnibus account services, sub-accounting services and/or networking services.
Such compensation retained by ABIS amounted to $205,073, $185,095 and $50,026 for the AB Wealth Appreciation Strategy, AB Balanced Wealth Strategy and AB Conservative Wealth Strategy, respectively, for the six months ended February 29, 2016.
In connection with their investments in AB Cap Fund—Multi-Manager Alternative Strategies Fund (“MMAS”), the Adviser has contractually agreed to (i) waive the portion of its management fee attributable to its services after paying sub advisory fees to sub-advisers and (ii) waive an additional portion of the Strategies investment advisory fee payable under the Advisory Agreement in an amount equal to, or reimburse the Strategies for, the total other expenses of MMAS (excluding interest and short sales expenses), in each case as paid by a Strategies as an acquired fund fee and expense. This fee waiver will remain in effect until December 31, 2016. For the six months ended February 29, 2016, the advisory fees paid were reduced by $808,770, $437,628 and $92,705 for the AB Wealth Appreciation Strategy, AB Balanced Wealth Strategy and AB Conservative Wealth Strategy, respectively.
AllianceBernstein Investments, Inc. (the “Distributor”), a wholly-owned subsidiary of the Adviser, serves as the distributor of the Strategies’ shares. The Distributor has advised the Strategies that it has retained front-end sales charges from the sale of Class A shares and received contingent deferred sales charges imposed upon redemptions by shareholders of Class A, Class B and Class C shares for each Strategy for the six months ended February 29, 2016 as follows:
| Front-End Sales Charges | Contingent Deferred Sales Charges | |||||||||||||||
| Strategies | Class A | Class A | Class B | Class C | ||||||||||||
AB Wealth Appreciation | $ | 7,822 | $ | 2,279 | $ | 2,166 | $ | 2,710 | ||||||||
AB Balanced Wealth | 12,028 | 2,381 | 4,562 | 3,508 | ||||||||||||
AB Conservative Wealth | 2,405 | 958 | 1,028 | 1,966 | ||||||||||||
| 48 | • AB WEALTH STRATEGIES |
Notes to Financial Statements
A summary of the Strategies’ affiliated Underlying Portfolio transactions for the period ended February 29, 2016 is as follows:
| AB Multi-Manager Alternative Strategies Fund | ||||||||||||||||||||||||||||||||
| Distributions | ||||||||||||||||||||||||||||||||
Market Value 08/31/15 (000) | Purchases at Cost (000) | Sales Proceeds | Realized Gain (Loss) (000) | Change in Unrealized Appr./(Depr.) (000) | Market Value 02/29/16 (000) | Income (000) | Realized Gains (000) | |||||||||||||||||||||||||
AB Wealth Appreciation | $ | 172,392 | $ | 1,206 | $ | 13,759 | $ | (346 | ) | $ | (6,560 | ) | $ | 152,933 | $ | 1,206 | $ | – 0 | – | |||||||||||||
AB Balanced Wealth | 93,338 | 645 | 7,823 | (130 | ) | (3,540 | ) | 82,490 | 645 | – 0 | – | |||||||||||||||||||||
AB Conservative Wealth | 19,522 | 136 | 865 | (1 | ) | (770 | ) | 18,022 | 137 | – 0 | – | |||||||||||||||||||||
| AB Pooling Portfolio — Bond Inflation Portfolio | ||||||||||||||||||||||||||||||||
| Distributions | ||||||||||||||||||||||||||||||||
Market Value 08/31/15 (000) | Purchases at Cost (000) | Sales Proceeds (000) | Realized Gain (Loss) (000) | Change in Unrealized Appr./(Depr.) (000) | Market Value 02/29/16 (000) | Income (000) | Realized Gains (000) | |||||||||||||||||||||||||
AB Balanced Wealth | $ | 88,940 | $ | 2,088 | $ | 11,862 | $ | (1,638 | ) | $ | 198 | $ | 77,726 | $ | 2,088 | $ | – 0 | – | ||||||||||||||
AB Conservative Wealth | 31,490 | 746 | 2,988 | (71 | ) | (433 | ) | 28,744 | 747 | – 0 | – | |||||||||||||||||||||
| AB Pooling Portfolio — Global Core Bond Portfolio | ||||||||||||||||||||||||||||||||
| Distributions | ||||||||||||||||||||||||||||||||
| Market Value 08/31/15 (000) | Purchases at Cost (000) | Sales Proceeds (000) | Realized Gain (Loss) (000) | Change in Unrealized Appr./(Depr.) (000) | Market Value 02/29/16 (000) | Income (000) | Realized Gains (000) | |||||||||||||||||||||||||
AB Balanced Wealth | $ | 214,138 | $ | 8,112 | $ | 30,532 | $ | (101 | ) | $ | (1,890 | ) | $ | 189,727 | $ | 8,112 | $ | – 0 | – | |||||||||||||
AB Conservative Wealth | 78,352 | 3,091 | 9,321 | (85 | ) | (621 | ) | 71,416 | 2,983 | – 0 | – | |||||||||||||||||||||
| AB Pooling Portfolio — High-Yield Portfolio | ||||||||||||||||||||||||||||||||
| Distributions | ||||||||||||||||||||||||||||||||
| Market Value 08/31/15 (000) | Purchases at Cost (000) | Sales Proceeds (000) | Realized Gain (Loss) (000) | Change in Unrealized Appr./(Depr.) (000) | Market Value 02/29/16 (000) | Income (000) | Realized Gains (000) | |||||||||||||||||||||||||
AB Balanced Wealth | $ | 77,170 | $ | 2,714 | $ | 4,572 | $ | (431 | ) | $ | (7,212 | ) | $ | 67,669 | $ | 2,714 | $ | – 0 | – | |||||||||||||
| AB Pooling Portfolio — International Growth Portfolio | ||||||||||||||||||||||||||||||||
| Distributions | ||||||||||||||||||||||||||||||||
Market Value | Purchases at Cost (000) | Sales Proceeds (000) | Realized Gain (Loss) (000) | Change in Unrealized Appr./(Depr.) (000) | Market Value | Income (000) | Realized Gains (000) | |||||||||||||||||||||||||
AB Wealth Appreciation | $ | 181,043 | $ | 4,070 | $ | 2,193 | $ | (812 | ) | $ | (15,623 | ) | $ | 166,485 | $ | 3,367 | $ | – 0 | – | |||||||||||||
AB Balanced Wealth | 82,698 | 3,124 | 2,783 | (242 | ) | (7,017 | ) | 75,780 | 1,507 | – 0 | – | |||||||||||||||||||||
AB Conservative Wealth | 12,126 | 227 | 110 | (5 | ) | (1,100 | ) | 11,138 | 227 | – 0 | – | |||||||||||||||||||||
| AB WEALTH STRATEGIES • | 49 |
Notes to Financial Statements
| AB Pooling Portfolio — International Value Portfolio | ||||||||||||||||||||||||||||||||
| Distributions | ||||||||||||||||||||||||||||||||
Market Value | Purchases at Cost (000) | Sales Proceeds (000) | Realized Gain (Loss) (000) | Change in Unrealized Appr./(Depr.) (000) | Market Value | Income (000) | Realized Gains (000) | |||||||||||||||||||||||||
AB Wealth Appreciation | $ | 178,924 | $ | 10,333 | $ | – 0 | – | $ | – 0 | – | $ | (23,305 | ) | $ | 165,952 | $ | 10,121 | $ | – 0 | – | ||||||||||||
AB Balanced Wealth | 82,289 | 4,919 | 1,103 | (304 | ) | (10,258 | ) | 75,543 | 4,616 | – 0 | – | |||||||||||||||||||||
AB Conservative Wealth | 12,116 | 752 | – 0 | – | – 0 | – | (1,587 | ) | 11,281 | 689 | – 0 | – | ||||||||||||||||||||
| AB Pooling Portfolio — U.S. Large Cap Growth Portfolio | ||||||||||||||||||||||||||||||||
| Distributions | ||||||||||||||||||||||||||||||||
Market Value 08/31/15 (000) | Purchases at Cost (000) | Sales Proceeds (000) | Realized Gain (Loss) (000) | Change in Unrealized Appr./(Depr.) (000) | Market Value 02/29/16 (000) | Income (000) | Realized Gains (000) | |||||||||||||||||||||||||
AB Wealth Appreciation | $ | 214,860 | $ | 56,952 | $ | 18,866 | $ | 2,563 | $ | (59,932 | ) | $ | 195,577 | $ | 4,574 | $ | 52,379 | |||||||||||||||
AB Balanced Wealth | 107,402 | 27,898 | 11,376 | 2,675 | (30,541 | ) | 96,058 | 2,241 | 25,596 | |||||||||||||||||||||||
AB Conservative Wealth | 16,449 | 4,324 | 1,497 | 288 | (4,617 | ) | 14,947 | 348 | 3,976 | |||||||||||||||||||||||
| AB Pooling Portfolio — Multi-Asset Real Return Portfolio | ||||||||||||||||||||||||||||||||
| Distributions | ||||||||||||||||||||||||||||||||
Market Value 08/31/15 (000) | Purchases at Cost (000) | Sales Proceeds (000) | Realized Gain (Loss) (000) | Change in Unrealized Appr./(Depr.) (000) | Market Value 02/29/16 (000) | Income (000) | Realized Gains (000) | |||||||||||||||||||||||||
AB Wealth Appreciation | $ | 88,539 | $ | 11,491 | $ | – 0 | – | $ | – 0 | – | $ | (13,511 | ) | $ | 86,519 | $ | 2,858 | $ | – 0 | – | ||||||||||||
AB Balanced Wealth | 48,974 | 3,096 | – 0 | – | – 0 | – | (7,201 | ) | 44,869 | 1,530 | – 0 | – | ||||||||||||||||||||
AB Conservative Wealth | 4,582 | 235 | – 0 | – | – 0 | – | (679 | ) | 4,138 | 143 | – 0 | – | ||||||||||||||||||||
| AB Pooling Portfolio — Short Duration Portfolio | ||||||||||||||||||||||||||||||||
| Distributions | ||||||||||||||||||||||||||||||||
Market Value 08/31/15 (000) | Purchases at Cost (000) | Sales Proceeds (000) | Realized Gain (Loss) (000) | Change in Unrealized Appr./(Depr.) (000) | Market Value 02/29/16 (000) | Income (000) | Realized Gains (000) | |||||||||||||||||||||||||
AB Conservative Wealth | $ | 89,681 | $ | 533 | $ | 8,715 | $ | (418 | ) | $ | 319 | $ | 81,400 | $ | 533 | $ | – 0 | – | ||||||||||||||
| AB Pooling Portfolio — Small-Mid Cap Growth Portfolio | ||||||||||||||||||||||||||||||||
| Distributions | ||||||||||||||||||||||||||||||||
Market Value 08/31/15 (000) | Purchases at Cost (000) | Sales Proceeds (000) | Realized Gain (Loss) (000) | Change in Unrealized Appr./(Depr.) (000) | Market Value 02/29/16 (000) | Income (000) | Realized Gains (000) | |||||||||||||||||||||||||
AB Wealth Appreciation | $ | 71,384 | $ | 10,453 | $ | – 0 | – | $ | – 0 | – | $ | (19,504 | ) | $ | 62,333 | $ | 307 | $ | 9,810 | |||||||||||||
AB Balanced Wealth | 25,528 | 3,662 | 344 | (35 | ) | (6,859 | ) | 21,952 | 108 | 3,461 | ||||||||||||||||||||||
AB Conservative Wealth | 2,358 | 334 | – 0 | – | – 0 | – | (645 | ) | 2,047 | 10 | 324 | |||||||||||||||||||||
| 50 | • AB WEALTH STRATEGIES |
Notes to Financial Statements
| AB Pooling Portfolio — Small-Mid Cap Value Portfolio | ||||||||||||||||||||||||||||||||
| Distributions | ||||||||||||||||||||||||||||||||
Market Value 08/31/15 (000) | Purchases at Cost (000) | Sales Proceeds (000) | Realized Gain (Loss) (000) | Change in Unrealized Appr./(Depr.) (000) | Market Value 02/29/16 (000) | Income (000) | Realized Gains (000) | |||||||||||||||||||||||||
AB Wealth Appreciation | $ | 71,661 | $ | 9,430 | $ | 580 | $ | (118 | ) | $ | (14,091 | ) | $ | 66,302 | $ | 669 | $ | 8,760 | ||||||||||||||
AB Balanced Wealth | 25,955 | 3,308 | 1,064 | 28 | (4,987 | ) | 23,240 | 237 | 3,070 | |||||||||||||||||||||||
AB Conservative Wealth | 2,367 | 311 | 26 | 6 | (474 | ) | 2,184 | 22 | 289 | |||||||||||||||||||||||
| AB Pooling Portfolio — U.S. Value Portfolio | ||||||||||||||||||||||||||||||||
| Distributions | ||||||||||||||||||||||||||||||||
Market Value 08/31/15 (000) | Purchases at Cost (000) | Sales Proceeds (000) | Realized Gain (Loss) (000) | Change in Unrealized Appr./(Depr.) (000) | Market Value 02/29/16 (000) | Income (000) | Realized Gains (000) | |||||||||||||||||||||||||
AB Wealth Appreciation | $ | 212,181 | $ | 3,105 | $ | 7,234 | $ | 873 | $ | (13,770 | ) | $ | 195,155 | $ | 3,105 | $ | – 0 | – | ||||||||||||||
AB Balanced Wealth | 106,061 | 1,531 | 4,410 | 761 | (6,979 | ) | 96,964 | 1,531 | – 0 | – | ||||||||||||||||||||||
AB Conservative Wealth | 16,335 | 236 | 456 | 163 | (1,128 | ) | 15,150 | 236 | – 0 | – | ||||||||||||||||||||||
| AB Pooling Portfolio — Volatility Management Portfolio | ||||||||||||||||||||||||||||||||
| Distributions | ||||||||||||||||||||||||||||||||
| Market Value 08/31/15 (000) | Purchases at Cost (000) | Sales Proceeds (000) | Realized Gain (Loss) (000) | Change in Unrealized Appr./(Depr.) (000) | Market Value 02/29/16 (000) | Income (000) | Realized Gains (000) | |||||||||||||||||||||||||
AB Wealth Appreciation | $ | 193,378 | $ | 10,553 | $ | 4,339 | $ | (551 | ) | $ | (21,914 | ) | $ | 177,127 | $ | 5,984 | $ | 4,569 | ||||||||||||||
AB Balanced Wealth | 183,212 | 9,880 | 5,794 | (173 | ) | (20,620 | ) | 166,505 | 5,585 | 4,264 | ||||||||||||||||||||||
AB Conservative Wealth | 35,280 | 2,509 | 831 | – 0 | –* | (4,080 | ) | 32,878 | 1,093 | 835 | ||||||||||||||||||||||
| * | Amount is less than $500 |
NOTE C
Distribution Plans
The Strategies have adopted a Plan for each class of shares of the Strategies pursuant to Rule 12b-1 under the Investment Company Act of 1940 (each a “Plan” and collectively the “Plans”). Under the Plans, the Strategies pay distribution and servicing fees to the Distributor at an annual rate of up to .50% of each Strategies’ average daily net assets attributable to Class A shares, 1% of the Strategies’ average daily net assets attributable to both Class B and Class C shares, .50% of the Strategies’ average daily net assets attributable to Class R shares and .25% of the Strategies’ average daily net assets attributable to Class K shares. There are no distribution and servicing fees on the Advisor Class and Class I shares. The fees are accrued daily and paid monthly. Effective August 1, 2014, payments under the Agreement in respect of Class A shares are limited to an
| AB WEALTH STRATEGIES • | 51 |
Notes to Financial Statements
annual rate of .25% of each Strategies’ Class A shares’ average daily net assets. Prior to August 1, 2014, payments under Class A shares were limited to an annual rate of ..30% of each Strategies Class A shares’ average daily net assets. The Plans provide that the Distributor will use such payments in their entirety for distribution assistance and promotional activities. The Strategies are not obligated under the Plans to pay any distribution services fee in excess of the amounts set forth above. The purpose of the payments to the Distributor under the Plans is to compensate the Distributor for its distribution services with respect to the sale of each Strategies’ shares. Since the Distributor’s compensation is not directly tied to its expenses, the amount of compensation received by it under the Plan during any year may be more or less than its actual expenses. For this reason, the Plans are characterized by the staff of the Securities and Exchange Commission as being of the “compensation” variety.
In the event that a Plan is terminated or not continued, no distribution services fees (other than current amounts accrued but not yet paid) would be owed by the Strategies to the Distributor with respect to the relevant class. The Plans also provide that the Adviser may use its own resources to finance the distribution of the Strategies’ shares.
NOTE D
Investment Transactions
Purchases and sales of investments in the Underlying Portfolios for the six months ended February 29, 2016 were as follows:
| Strategies | Purchases | Sales | ||||||
AB Wealth Appreciation | $ | 117,591,906 | $ | 46,971,433 | ||||
AB Balanced Wealth | 70,978,858 | 81,667,273 | ||||||
AB Conservative Wealth | 13,434,080 | 24,810,548 | ||||||
The cost of investments for federal income tax purposes was substantially the same as the cost for financial reporting purposes. Accordingly, gross unrealized appreciation and unrealized depreciation are as follows:
| Gross Unrealized | Net Unrealized Appreciation (Depreciation) | |||||||||||
Strategies | Appreciation | (Depreciation) | ||||||||||
AB Wealth Appreciation | $ | 54,921,089 | $ | (147,015,719 | ) | $ | (92,094,630 | ) | ||||
AB Balanced Wealth | 39,316,636 | (66,725,228 | ) | (27,408,592 | ) | |||||||
AB Conservative Wealth | 10,407,837 | (4,414,658 | ) | 5,993,179 | ||||||||
1. Currency Translation
A Strategy may invest in non-U.S. dollar securities on a currency hedged or unhedged basis through its investments in an Underlying Portfolio. A Strategy or an Underlying Portfolio may seek investment opportunities by taking long or short positions in currencies through the use of currency-related derivatives,
| 52 | • AB WEALTH STRATEGIES |
Notes to Financial Statements
including forward currency exchange contracts, futures and options on futures, swaps, and other options. A Strategy or an Underlying Portfolio may enter into transactions for investment opportunities when it anticipates that a foreign currency will appreciate or depreciate in value but securities denominated in that currency are not held by the Strategy or the Underlying Portfolio and do not present attractive investment opportunities. Such transactions may also be used when the Adviser believes that it may be more efficient than a direct investment in a foreign currency-denominated security. A Strategy or an Underlying Portfolio may also conduct currency exchange contracts on a spot basis (i.e., for cash at the spot rate prevailing in the currency exchange market for buying or selling currencies).
NOTE E
Shares of Beneficial Interest
Transactions in shares of beneficial interest for each class were as follows:
| AB Wealth Appreciation Strategy | ||||||||||||||||||||
| Shares | Amount | |||||||||||||||||||
Six Months Ended February 29, 2016 (unaudited) | Year Ended August 31, 2015 | Six Months Ended February 29, 2016 (unaudited) | Year Ended August 31, 2015 | |||||||||||||||||
|
| |||||||||||||||||||
| Class A | ||||||||||||||||||||
Shares sold | 670,815 | 1,341,253 | $ | 9,539,530 | $ | 20,512,484 | ||||||||||||||
| ||||||||||||||||||||
Shares issued in reinvestment of dividends | 380,388 | 584,309 | 5,435,751 | 8,507,539 | ||||||||||||||||
| ||||||||||||||||||||
Shares converted from Class B | 488,386 | 1,449,755 | 7,080,118 | 22,459,502 | ||||||||||||||||
| ||||||||||||||||||||
Shares redeemed | (1,902,259 | ) | (4,725,105 | ) | (27,104,597 | ) | (72,599,508 | ) | ||||||||||||
| ||||||||||||||||||||
Net decrease | (362,670 | ) | (1,349,788 | ) | $ | (5,049,198 | ) | $ | (21,119,983 | ) | ||||||||||
| ||||||||||||||||||||
| Class B | ||||||||||||||||||||
Shares sold | 18,806 | 45,046 | $ | 270,373 | $ | 689,793 | ||||||||||||||
| ||||||||||||||||||||
Shares issued in reinvestment of dividends | 4,036 | 40,767 | 57,993 | 593,976 | ||||||||||||||||
| ||||||||||||||||||||
Shares converted to Class A | (489,593 | ) | (1,455,373 | ) | (7,080,118 | ) | (22,459,502 | ) | ||||||||||||
| ||||||||||||||||||||
Shares redeemed | (81,584 | ) | (459,997 | ) | (1,160,495 | ) | (7,027,738 | ) | ||||||||||||
| ||||||||||||||||||||
Net decrease | (548,335 | ) | (1,829,557 | ) | $ | (7,912,247 | ) | $ | (28,203,471 | ) | ||||||||||
| ||||||||||||||||||||
| Class C | ||||||||||||||||||||
Shares sold | 103,408 | 345,327 | $ | 1,452,109 | $ | 5,246,916 | ||||||||||||||
| ||||||||||||||||||||
Shares issued in reinvestment of dividends | 49,520 | 120,844 | 705,671 | 1,753,455 | ||||||||||||||||
| ||||||||||||||||||||
Shares redeemed | (551,658 | ) | (1,588,929 | ) | (7,794,490 | ) | (24,289,933 | ) | ||||||||||||
| ||||||||||||||||||||
Net decrease | (398,730 | ) | (1,122,758 | ) | $ | (5,636,710 | ) | $ | (17,289,562 | ) | ||||||||||
| ||||||||||||||||||||
| AB WEALTH STRATEGIES • | 53 |
Notes to Financial Statements
| AB Wealth Appreciation Strategy | ||||||||||||||||||||
| Shares | Amount | |||||||||||||||||||
Six Months Ended February 29, 2016 (unaudited) | Year Ended August 31, 2015 | Six Months Ended February 29, 2016 (unaudited) | Year Ended August 31, 2015 | |||||||||||||||||
|
| |||||||||||||||||||
| Advisor Class | ||||||||||||||||||||
Shares sold | 4,263,935 | 8,425,597 | $ | 60,673,262 | $ | 129,143,853 | ||||||||||||||
| ||||||||||||||||||||
Shares issued in reinvestment of dividends | 1,042,901 | 1,505,441 | 14,850,914 | 21,858,999 | ||||||||||||||||
| ||||||||||||||||||||
Shares redeemed | (4,575,191 | ) | (9,735,795 | ) | (65,047,496 | ) | (149,611,476 | ) | ||||||||||||
| ||||||||||||||||||||
Net increase | 731,645 | 195,243 | $ | 10,476,680 | $ | 1,391,376 | ||||||||||||||
| ||||||||||||||||||||
| Class R | ||||||||||||||||||||
Shares sold | 48,734 | 63,558 | $ | 677,233 | $ | 975,134 | ||||||||||||||
| ||||||||||||||||||||
Shares issued in reinvestment of dividends | 2,801 | 7,070 | 39,826 | 102,367 | ||||||||||||||||
| ||||||||||||||||||||
Shares redeemed | (91,563 | ) | (142,831 | ) | (1,287,035 | ) | (2,175,560 | ) | ||||||||||||
| ||||||||||||||||||||
Net decrease | (40,028 | ) | (72,203 | ) | $ | (569,976 | ) | $ | (1,098,059 | ) | ||||||||||
| ||||||||||||||||||||
| Class K | ||||||||||||||||||||
Shares sold | 63,201 | 229,856 | $ | 897,362 | $ | 3,467,711 | ||||||||||||||
| ||||||||||||||||||||
Shares issued in reinvestment of dividends | 15,408 | 22,351 | 218,944 | 323,867 | ||||||||||||||||
| ||||||||||||||||||||
Shares redeemed | (109,240 | ) | (310,254 | ) | (1,551,934 | ) | (4,676,238 | ) | ||||||||||||
| ||||||||||||||||||||
Net decrease | (30,631 | ) | (58,047 | ) | $ | (435,628 | ) | $ | (884,660 | ) | ||||||||||
| ||||||||||||||||||||
| Class I | ||||||||||||||||||||
Shares sold | 6,227 | 13,745 | $ | 87,889 | $ | 211,126 | ||||||||||||||
| ||||||||||||||||||||
Shares issued in reinvestment of dividends | 2,048 | 7,767 | 29,120 | 112,616 | ||||||||||||||||
| ||||||||||||||||||||
Shares redeemed | (16,790 | ) | (190,575 | ) | (239,233 | ) | (2,857,907 | ) | ||||||||||||
| ||||||||||||||||||||
Net decrease | (8,515 | ) | (169,063 | ) | $ | (122,224 | ) | $ | (2,534,165 | ) | ||||||||||
| ||||||||||||||||||||
| AB Balanced Wealth Strategy | ||||||||||||||||||||
| Shares | Amount | |||||||||||||||||||
Six Months Ended February 29, 2016 (unaudited) | Year Ended August 31, 2015 | Six Months Ended February 29, 2016 | Year Ended August 31, 2015 | |||||||||||||||||
|
| |||||||||||||||||||
| Class A | ||||||||||||||||||||
Shares sold | 1,312,570 | 2,688,884 | $ | 17,185,133 | $ | 37,724,352 | ||||||||||||||
| ||||||||||||||||||||
Shares issued in reinvestment of dividends | 1,153,448 | 1,204,936 | 15,040,965 | 16,182,296 | ||||||||||||||||
| ||||||||||||||||||||
Shares converted from Class B | 1,097,478 | 3,735,097 | 14,619,257 | 52,608,142 | ||||||||||||||||
| ||||||||||||||||||||
Shares redeemed | (4,394,730 | ) | (9,404,272 | ) | (57,933,462 | ) | (131,891,786 | ) | ||||||||||||
| ||||||||||||||||||||
Net decrease | (831,234 | ) | (1,775,355 | ) | $ | (11,088,107 | ) | $ | (25,376,996 | ) | ||||||||||
| ||||||||||||||||||||
| 54 | • AB WEALTH STRATEGIES |
Notes to Financial Statements
| AB Balanced Wealth Strategy | ||||||||||||||||||||
| Shares | Amount | |||||||||||||||||||
Six Months Ended February 29, 2016 (unaudited) | Year Ended August 31, 2015 | Six Months Ended February 29, 2016 | Year Ended August 31, 2015 | |||||||||||||||||
|
| |||||||||||||||||||
| Class B | ||||||||||||||||||||
Shares sold | 30,413 | 78,353 | $ | 402,212 | $ | 1,085,633 | ||||||||||||||
| ||||||||||||||||||||
Shares issued in reinvestment of dividends | 29,205 | 110,185 | 380,540 | 1,468,771 | ||||||||||||||||
| ||||||||||||||||||||
Shares converted to Class A | (1,108,026 | ) | (3,775,262 | ) | (14,619,257 | ) | (52,608,142 | ) | ||||||||||||
| ||||||||||||||||||||
Shares redeemed | (204,153 | ) | (894,792 | ) | (2,684,434 | ) | (12,421,557 | ) | ||||||||||||
| ||||||||||||||||||||
Net decrease | (1,252,561 | ) | (4,481,516 | ) | $ | (16,520,939 | ) | $ | (62,475,295 | ) | ||||||||||
| ||||||||||||||||||||
| Class C | ||||||||||||||||||||
Shares sold | 309,091 | 584,829 | $ | 4,073,646 | $ | 8,117,691 | ||||||||||||||
| ||||||||||||||||||||
Shares issued in reinvestment of dividends | 220,830 | 285,609 | 2,859,754 | 3,807,168 | ||||||||||||||||
| ||||||||||||||||||||
Shares redeemed | (1,293,302 | ) | (3,159,867 | ) | (16,787,675 | ) | (43,877,253 | ) | ||||||||||||
| ||||||||||||||||||||
Net decrease | (763,381 | ) | (2,289,429 | ) | $ | (9,854,275 | ) | $ | (31,952,394 | ) | ||||||||||
| ||||||||||||||||||||
| Advisor Class | ||||||||||||||||||||
Shares sold | 642,529 | 1,357,573 | $ | 8,531,408 | $ | 19,153,006 | ||||||||||||||
| ||||||||||||||||||||
Shares issued in reinvestment of dividends | 139,057 | 139,418 | 1,821,651 | 1,880,744 | ||||||||||||||||
| ||||||||||||||||||||
Shares redeemed | (1,287,048 | ) | (2,118,001 | ) | (16,963,181 | ) | (29,784,828 | ) | ||||||||||||
| ||||||||||||||||||||
Net decrease | (505,462 | ) | (621,010 | ) | $ | (6,610,122 | ) | $ | (8,751,078 | ) | ||||||||||
| ||||||||||||||||||||
| Class R | ||||||||||||||||||||
Shares sold | 102,701 | 219,678 | $ | 1,372,764 | $ | 3,031,153 | ||||||||||||||
| ||||||||||||||||||||
Shares issued in reinvestment of dividends | 11,346 | 16,925 | 147,616 | 226,287 | ||||||||||||||||
| ||||||||||||||||||||
Shares redeemed | (367,883 | ) | (260,477 | ) | (4,899,654 | ) | (3,619,365 | ) | ||||||||||||
| ||||||||||||||||||||
Net decrease | (253,836 | ) | (23,874 | ) | $ | (3,379,274 | ) | $ | (361,925 | ) | ||||||||||
| ||||||||||||||||||||
| Class K | ||||||||||||||||||||
Shares sold | 78,821 | 609,388 | $ | 1,026,177 | $ | 8,409,837 | ||||||||||||||
| ||||||||||||||||||||
Shares issued in reinvestment of dividends | 49,746 | 44,992 | 646,692 | 602,438 | ||||||||||||||||
| ||||||||||||||||||||
Shares redeemed | (228,261 | ) | (481,063 | ) | (3,003,889 | ) | (6,736,432 | ) | ||||||||||||
| ||||||||||||||||||||
Net increase (decrease) | (99,694 | ) | 173,317 | $ | (1,331,020 | ) | $ | 2,275,843 | ||||||||||||
| ||||||||||||||||||||
| AB WEALTH STRATEGIES • | 55 |
Notes to Financial Statements
| AB Balanced Wealth Strategy | ||||||||||||||||||||
| Shares | Amount | |||||||||||||||||||
Six Months Ended February 29, 2016 (unaudited) | Year Ended August 31, 2015 | Six Months Ended February 29, 2016 | Year Ended August 31, 2015 | |||||||||||||||||
|
| |||||||||||||||||||
| Class I | ||||||||||||||||||||
Shares sold | 19,646 | 45,810 | $ | 259,321 | $ | 646,442 | ||||||||||||||
| ||||||||||||||||||||
Shares issued in reinvestment of dividends | 22,222 | 25,588 | 290,212 | 344,159 | ||||||||||||||||
| ||||||||||||||||||||
Shares redeemed | (101,239 | ) | (181,164 | ) | (1,345,652 | ) | (2,527,867 | ) | ||||||||||||
| ||||||||||||||||||||
Net decrease | (59,371 | ) | (109,766 | ) | $ | (796,119 | ) | $ | (1,537,266 | ) | ||||||||||
| ||||||||||||||||||||
| AB Conservative Wealth Strategy | ||||||||||||||||||||
| Shares | Amount | |||||||||||||||||||
| Six Months Ended February 29, 2016 (unaudited) | Year Ended 2015 | Six Months Ended (unaudited) | Year Ended 2015 | |||||||||||||||||
|
| |||||||||||||||||||
| Class A | ||||||||||||||||||||
Shares sold | 373,327 | 922,459 | $ | 4,483,271 | $ | 11,419,751 | ||||||||||||||
| ||||||||||||||||||||
Shares issued in reinvestment of dividends | 303,529 | 63,987 | 3,605,924 | 776,805 | ||||||||||||||||
| ||||||||||||||||||||
Shares converted from Class B | 465,948 | 1,102,272 | 5,628,232 | 13,739,402 | ||||||||||||||||
| ||||||||||||||||||||
Shares redeemed | (1,505,837 | ) | (3,334,740 | ) | (18,064,773 | ) | (41,377,385 | ) | ||||||||||||
| ||||||||||||||||||||
Net decrease | (363,033 | ) | (1,246,022 | ) | $ | (4,347,346 | ) | $ | (15,441,427 | ) | ||||||||||
| ||||||||||||||||||||
| Class B | ||||||||||||||||||||
Shares sold | 5,945 | 22,955 | $ | 70,830 | $ | 282,348 | ||||||||||||||
| ||||||||||||||||||||
Shares issued in reinvestment of dividends | 13,385 | – 0 | – | 157,810 | – 0 | – | ||||||||||||||
| ||||||||||||||||||||
Shares converted to Class A | (471,939 | ) | (1,115,839 | ) | (5,628,232 | ) | (13,739,402 | ) | ||||||||||||
| ||||||||||||||||||||
Shares redeemed | (76,608 | ) | (373,678 | ) | (907,785 | ) | (4,578,846 | ) | ||||||||||||
| ||||||||||||||||||||
Net decrease | (529,217 | ) | (1,466,562 | ) | $ | (6,307,377 | ) | $ | (18,035,900 | ) | ||||||||||
| ||||||||||||||||||||
| Class C | ||||||||||||||||||||
Shares sold | 169,458 | 380,754 | $ | 2,001,084 | $ | 4,675,458 | ||||||||||||||
| ||||||||||||||||||||
Shares issued in reinvestment of dividends | 97,595 | – 0 | – | 1,145,769 | – 0 | – | ||||||||||||||
| ||||||||||||||||||||
Shares redeemed | (531,249 | ) | (1,155,352 | ) | (6,306,626 | ) | (14,144,825 | ) | ||||||||||||
| ||||||||||||||||||||
Net decrease | (264,196 | ) | (774,598 | ) | $ | (3,159,773 | ) | $ | (9,469,367 | ) | ||||||||||
| ||||||||||||||||||||
| 56 | • AB WEALTH STRATEGIES |
Notes to Financial Statements
| AB Conservative Wealth Strategy | ||||||||||||||||||||
| Shares | Amount | |||||||||||||||||||
| Six Months Ended February 29, 2016 (unaudited) | Year Ended 2015 | Six Months Ended (unaudited) | Year Ended 2015 | |||||||||||||||||
|
| |||||||||||||||||||
| Advisor Class | ||||||||||||||||||||
Shares sold | 209,317 | 208,158 | $ | 2,529,145 | $ | 2,599,961 | ||||||||||||||
| ||||||||||||||||||||
Shares issued in reinvestment of dividends | 22,760 | 6,926 | 271,299 | 84,352 | ||||||||||||||||
| ||||||||||||||||||||
Shares redeemed | (319,448 | ) | (432,798 | ) | (3,791,090 | ) | (5,415,936 | ) | ||||||||||||
| ||||||||||||||||||||
| Net decrease | (87,371 | ) | (217,714 | ) | $ | (990,646 | ) | $ | (2,731,623 | ) | ||||||||||
| ||||||||||||||||||||
Class R | ||||||||||||||||||||
Shares sold | 34,499 | 93,670 | $ | 413,084 | $ | 1,159,921 | ||||||||||||||
| ||||||||||||||||||||
Shares issued in reinvestment of dividends | 7,910 | 968 | 93,967 | 11,762 | ||||||||||||||||
| ||||||||||||||||||||
Shares redeemed | (149,783 | ) | (213,739 | ) | (1,789,531 | ) | (2,647,963 | ) | ||||||||||||
| ||||||||||||||||||||
| Net decrease | (107,374 | ) | (119,101 | ) | $ | (1,282,480 | ) | $ | (1,476,280 | ) | ||||||||||
| ||||||||||||||||||||
Class K | ||||||||||||||||||||
Shares sold | 22,034 | 75,661 | $ | 261,017 | $ | 934,068 | ||||||||||||||
| ||||||||||||||||||||
Shares issued in reinvestment of dividends | 14,434 | 2,605 | 171,048 | 31,582 | ||||||||||||||||
| ||||||||||||||||||||
Shares redeemed | (32,492 | ) | (97,076 | ) | (384,258 | ) | (1,205,294 | ) | ||||||||||||
| ||||||||||||||||||||
Net increase (decrease) | 3,976 | (18,810 | ) | $ | 47,807 | $ | (239,644 | ) | ||||||||||||
| ||||||||||||||||||||
Class I | ||||||||||||||||||||
Shares sold | 1,624 | 16,446 | $ | 19,558 | $ | 203,890 | ||||||||||||||
| ||||||||||||||||||||
Shares issued in reinvestment of dividends | 883 | 341 | 10,497 | 4,138 | ||||||||||||||||
| ||||||||||||||||||||
Shares redeemed | (1,413 | ) | (22,743 | ) | (16,894 | ) | (280,178 | ) | ||||||||||||
| ||||||||||||||||||||
Net increase (decrease) | 1,094 | (5,956 | ) | $ | 13,161 | $ | (72,150 | ) | ||||||||||||
| ||||||||||||||||||||
NOTE F
Risks Involved in Investing in the Strategies
Interest Rate Risk and Credit Risk—Interest rate risk is the risk that changes in interest rates will affect the value of the Strategies’ investments in fixed-income debt securities such as bonds or notes. Increases in interest rates may cause the value of the Strategies’ investments to decline. Credit risk is the risk that the issuer or guarantor of a debt security, or the counterparty to a derivative contract, will be unable or unwilling to make timely principal and/or interest payments, or to otherwise honor its obligations. The degree of risk for a particular security may be reflected in its credit rating. Credit risk is greater for medium
| AB WEALTH STRATEGIES • | 57 |
Notes to Financial Statements
quality and lower-rated securities. Lower-rated debt securities and similar unrated securities (commonly known as “junk bonds”) have speculative elements or are predominantly speculative risks.
Foreign (Non-U.S.) Risk—Investments in securities of non-U.S. issuers may involve more risk than those of U.S. issuers. These securities may fluctuate more widely in price and may be less liquid due to adverse market, economic, political, regulatory or other factors.
Currency Risk—Fluctuations in currency exchange rates may negatively affect the value of the Strategies’ investments or reduce its returns.
Capitalization Risk—Investments in small- and mid-capitalization companies by Underlying Portfolios may be more volatile than investments in large-capitalization companies. Investments in small-capitalization companies may have additional risks because these companies often have limited product lines, markets, or financial resources.
Allocation Risk—The allocation of investments among the Underlying Portfolios’ different investment styles, such as equity or debt, growth or value, U.S. or non-U.S securities, or diversification strategies, may have a more significant effect on the Strategy’s net asset value, or NAV, when one of these investments is performing more poorly than another.
Derivatives Risk—The Strategies may enter into derivative transactions such as forwards, options, futures and swaps. Derivatives may be illiquid, difficult to price, and leveraged so that small changes may produce disproportionate losses for the Strategies, and subject to counterparty risk to a greater degree than more traditional investments. Derivatives may result in significant losses, including losses that are far greater than the value of the derivatives reflected in the statement of assets and liabilities.
Indemnification Risk—In the ordinary course of business, the Strategies enter into contracts that contain a variety of indemnifications. The Strategies’ maximum exposure under these arrangements is unknown. However, the Strategies have not had prior claims or losses pursuant to these indemnification provisions and expect the risk of loss thereunder to be remote. Therefore, the Strategies have not accrued any liability in connection with these indemnification provisions.
NOTE G
Joint Credit Facility
A number of open-end mutual funds managed by the Adviser, including the Strategies, participate in a $280 million revolving credit facility (the “Facility”) intended to provide short-term financing, if necessary, subject to certain restrictions in connection with abnormal redemption activity. Commitment fees related to the Facility are paid by the participating funds and are included in miscellaneous expenses in the statement of operations. The Strategies did not utilize the Facility during the six months ended February 29, 2016.
| 58 | • AB WEALTH STRATEGIES |
Notes to Financial Statements
NOTE H
Distributions to Shareholders
The tax character of distributions to be paid for the year ending August 31, 2016 will be determined at the end of the current fiscal year. The tax character of distributions paid during the fiscal years ended August 31, 2015 and August 31, 2014 were as follows:
| AB Wealth Appreciation Strategy | 2015 | 2014 | ||||||
Distributions paid from: | ||||||||
Ordinary income | $ | 35,000,313 | $ | 29,005,366 | ||||
|
|
|
| |||||
Total taxable distributions | 35,000,313 | 29,005,366 | ||||||
|
|
|
| |||||
Total distributions paid | $ | 35,000,313 | $ | 29,005,366 | ||||
|
|
|
| |||||
| AB Balanced Wealth Strategy | 2015 | 2014 | ||||||
Distributions paid from: | ||||||||
Ordinary income | $ | 27,002,565 | $ | 36,767,347 | ||||
|
|
|
| |||||
Total taxable distributions | 27,002,565 | 36,767,347 | ||||||
|
|
|
| |||||
Total distributions paid | $ | 27,002,565 | $ | 36,767,347 | ||||
|
|
|
| |||||
| AB Conservative Wealth Strategy | 2015 | 2014 | ||||||
Distributions paid from: | ||||||||
Ordinary income | $ | 1,000,799 | $ | 6,636,081 | ||||
|
|
|
| |||||
Total taxable distributions | 1,000,799 | 6,636,081 | ||||||
|
|
|
| |||||
Total distributions paid | $ | 1,000,799 | $ | 6,636,081 | ||||
|
|
|
| |||||
As of August 31, 2015, the components of accumulated earnings/(deficit) on a tax basis were as follows:
| Strategies | Undistributed Ordinary Income | Accumulated Capital and Other Losses(a) | Unrealized Appreciation/ (Depreciation)(b) | Total Accumulated Earnings/ (Deficit) | ||||||||||||
AB Wealth Appreciation | $ | 15,905,189 | $ | (26,057,110 | ) | $ | (11,215,645 | ) | $ | (21,367,566 | ) | |||||
AB Balanced Wealth | 9,642,052 | (121,833,707 | ) | 29,487,385 | (82,704,270 | ) | ||||||||||
AB Conservative Wealth | 6,050,749 | (20,678,507 | ) | 15,338,150 | 710,392 | |||||||||||
| (a) | During the fiscal year ended August 31, 2015 all three Strategies utilized capital loss carryforwards to offset current year net realized gains. AB Wealth Appreciation Strategy utilized $107,831,917 of capital loss carryforwards during the fiscal year, and had a net capital loss carryforward of $26,057,110 at fiscal year end. AB Balanced Wealth Strategy utilized $66,230,804 of capital loss carryforwards during the year, and had a net capital loss carryforward of $121,833,707 at fiscal year end. AB Conservative Wealth Strategy utilized $10,430,963 of capital loss carryforwards during the fiscal year, and had a net capital loss carryforward of $20,678,507 at fiscal year end. |
| (b) | The differences between book-basis and tax-basis unrealized appreciation/(depreciation) are attributable primarily to the tax deferral of losses on wash sales and return of capital distributions received from underlying securities. |
| AB WEALTH STRATEGIES • | 59 |
Notes to Financial Statements
For tax purposes, net capital losses may be carried over to offset future capital gains, if any. Funds are permitted to carry forward capital losses incurred in taxable years beginning after December 22, 2010 for an indefinite period. These post-December 22, 2010 capital losses must be utilized prior to the earlier capital losses, which are subject to expiration. Post-December 22, 2010 capital loss carryforwards will retain their character as either short-term or long-term capital losses rather than being considered short-term as under previous regulation.
As of August 31, 2015, the Strategies had net capital loss carryforwards which will expire as follows:
| Strategy | SHORT-TERM AMOUNT | LONG-TERM AMOUNT | EXPIRATION | |||||
AB Wealth Appreciation | $ | 26,057,110 | n/a | 2019 | ||||
AB Balanced Wealth | 41,776,268 | n/a | 2018 | |||||
AB Balanced Wealth | 80,057,439 | n/a | 2019 | |||||
AB Conservative Wealth | 7,038,072 | n/a | 2018 | |||||
AB Conservative Wealth | 13,640,435 | n/a | 2019 | |||||
NOTE I
New Accounting Pronouncement
In May 2015, the Financial Accounting Standards Board issued an Accounting Standards Update, ASU 2015-07 (the “ASU”) which removes the requirement to categorize within the fair value hierarchy all investments for which fair value is measured using the net asset value per share practical expedient. The ASU also removes the requirement to make certain disclosures for investments that are eligible to be measured at fair value using the net asset value per share practical expedient but do not utilize that practical expedient. The ASU is effective for annual periods beginning after December 15, 2015 and interim periods within those annual periods. At this time, management is evaluating the implications of these changes on the financial statements.
NOTE J
Subsequent Event
Management has evaluated subsequent events for possible recognition or disclosure in the financial statements through the date the financial statements are issued. Management has determined that there are no material events that would require disclosure in the Strategies’ financial statements through this date.
| 60 | • AB WEALTH STRATEGIES |
Notes to Financial Statements
FINANCIAL HIGHLIGHTS
Selected Data For A Share Of Beneficial Interest Outstanding Throughout Each Period
| AB Wealth Appreciation Strategy | ||||||||||||||||||||||||
| Class A | ||||||||||||||||||||||||
Six Months (unaudited) | Year Ended August 31, | |||||||||||||||||||||||
| 2015 | 2014 | 2013 | 2012 | 2011 | ||||||||||||||||||||
|
| |||||||||||||||||||||||
Net asset value, beginning of period | $ 14.64 | $ 15.76 | $ 13.36 | $ 11.63 | $ 11.26 | $ 10.00 | ||||||||||||||||||
|
| |||||||||||||||||||||||
Income From Investment Operations | ||||||||||||||||||||||||
Net investment income(a) | .28 | (b) | .34 | (b) | .37 | (b) | .06 | .10 | .19 | |||||||||||||||
Net realized and unrealized gain (loss) on investment transactions | (1.18 | ) | (1.11 | ) | 2.30 | 1.77 | .46 | 1.17 | ||||||||||||||||
|
| |||||||||||||||||||||||
Net increase (decrease) in net asset value from operations | (.90 | ) | (.77 | ) | 2.67 | 1.83 | .56 | 1.36 | ||||||||||||||||
|
| |||||||||||||||||||||||
Less: Dividends | ||||||||||||||||||||||||
Dividends from net investment income | (.23 | ) | (.35 | ) | (.27 | ) | (.10 | ) | (.19 | ) | (.10 | ) | ||||||||||||
|
| |||||||||||||||||||||||
Net asset value, end of period | $ 13.51 | $ 14.64 | $ 15.76 | $ 13.36 | $ 11.63 | $ 11.26 | ||||||||||||||||||
|
| |||||||||||||||||||||||
Total Return | ||||||||||||||||||||||||
Total investment return based on net asset value(c) | (6.23 | )% | (4.89 | )% | 20.21 | % | 15.86 | % | 5.11 | % | 13.58 | % | ||||||||||||
Ratios/Supplemental Data | ||||||||||||||||||||||||
Net assets, end of period (000’s omitted) | $334,645 | $367,939 | $417,381 | $382,178 | $406,461 | $471,196 | ||||||||||||||||||
Ratio to average net assets of: |
| |||||||||||||||||||||||
Expenses, net of waivers/reimbursements(d) | .89 | %^ | .88 | % | 1.05 | % | 1.07 | % | 1.09 | % | 1.09 | %+ | ||||||||||||
Expenses, before waivers/reimbursements(d) | 1.01 | %^ | 1.00 | % | 1.06 | % | 1.07 | % | 1.09 | % | 1.09 | %+ | ||||||||||||
Net investment income | 3.92 | %^(b) | 2.18 | %(b) | 2.52 | %(b) | .48 | % | .88 | % | 1.60 | %+ | ||||||||||||
Portfolio turnover rate | 3 | % | 9 | % | 20 | % | 4 | % | 29 | % | 4 | % | ||||||||||||
See footnote summary on page 82.
| AB WEALTH STRATEGIES • | 61 |
Financial Highlights
Selected Data For A Share Of Beneficial Interest Outstanding Throughout Each Period
| AB Wealth Appreciation Strategy | ||||||||||||||||||||||||
| Class B | ||||||||||||||||||||||||
Six Months (unaudited) | Year Ended August 31, | |||||||||||||||||||||||
| 2015 | 2014 | 2013 | 2012 | 2011 | ||||||||||||||||||||
|
| |||||||||||||||||||||||
Net asset value, beginning of period | $ 14.57 | $ 15.64 | $ 13.20 | $ 11.47 | $ 11.08 | $ 9.84 | ||||||||||||||||||
|
| |||||||||||||||||||||||
Income From Investment Operations | ||||||||||||||||||||||||
Net investment income (loss)(a) | .21 | (b) | .28 | (b) | .31 | (b) | (.02 | ) | .02 | .10 | ||||||||||||||
Net realized and unrealized gain (loss) on investment transactions | (1.17 | ) | (1.15 | ) | 2.23 | 1.75 | .45 | 1.16 | ||||||||||||||||
|
| |||||||||||||||||||||||
Net increase (decrease) in net asset value from operations | (.96 | ) | (.87 | ) | 2.54 | 1.73 | .47 | 1.26 | ||||||||||||||||
|
| |||||||||||||||||||||||
Less: Dividends | ||||||||||||||||||||||||
Dividends from net investment income | (.04 | ) | (.20 | ) | (.10 | ) | – 0 | – | (.08 | ) | (.02 | ) | ||||||||||||
|
| |||||||||||||||||||||||
Net asset value, end of period | $ 13.57 | $ 14.57 | $ 15.64 | $ 13.20 | $ 11.47 | $ 11.08 | ||||||||||||||||||
|
| |||||||||||||||||||||||
Total Return | ||||||||||||||||||||||||
Total investment return based on net asset value(c) | (6.60 | )% | (5.59 | )% | 19.33 | % | 15.08 | % | 4.29 | % | 12.76 | % | ||||||||||||
Ratios/Supplemental Data | ||||||||||||||||||||||||
Net assets, end of period (000’s omitted) | $17,657 | $26,943 | $57,541 | $77,795 | $99,167 | $135,139 | ||||||||||||||||||
Ratio to average net assets of: |
| |||||||||||||||||||||||
Expenses, net of waivers/reimbursements(d) | 1.67 | %^ | 1.64 | % | 1.76 | % | 1.79 | % | 1.82 | % | 1.83 | %+ | ||||||||||||
Expenses, before waivers/reimbursements(d) | 1.79 | %^ | 1.76 | % | 1.77 | % | 1.79 | % | 1.82 | % | 1.83 | %+ | ||||||||||||
Net investment income (loss) | 3.00 | %^(b) | 1.85 | %(b) | 2.10 | %(b) | (.17 | )% | .21 | % | .85 | %+ | ||||||||||||
Portfolio turnover rate | 3 | % | 9 | % | 20 | % | 4 | % | 29 | % | 4 | % | ||||||||||||
See footnote summary on page 82.
| 62 | • AB WEALTH STRATEGIES |
Financial Highlights
Selected Data For A Share Of Beneficial Interest Outstanding Throughout Each Period
| AB Wealth Appreciation Strategy | ||||||||||||||||||||||||
| Class C | ||||||||||||||||||||||||
Six Months (unaudited) | Year Ended August 31, | |||||||||||||||||||||||
| 2015 | 2014 | 2013 | 2012 | 2011 | ||||||||||||||||||||
|
| |||||||||||||||||||||||
Net asset value, beginning of period | $ 14.51 | $ 15.62 | $ 13.21 | $ 11.49 | $ 11.09 | $ 9.85 | ||||||||||||||||||
|
| |||||||||||||||||||||||
Income From Investment Operations | ||||||||||||||||||||||||
Net investment income (loss)(a) | .22 | (b) | .23 | (b) | .27 | (b) | (.03 | ) | .02 | .10 | ||||||||||||||
Net realized and unrealized gain (loss) on investment transactions | (1.17 | ) | (1.11 | ) | 2.27 | 1.76 | .46 | 1.16 | ||||||||||||||||
|
| |||||||||||||||||||||||
Net increase (decrease) in net asset value from operations | (.95 | ) | (.88 | ) | 2.54 | 1.73 | .48 | 1.26 | ||||||||||||||||
|
| |||||||||||||||||||||||
Less: Dividends | ||||||||||||||||||||||||
Dividends from net investment income | (.11 | ) | (.23 | ) | (.13 | ) | (.01 | ) | (.08 | ) | (.02 | ) | ||||||||||||
|
| |||||||||||||||||||||||
Net asset value, end of period | $ 13.45 | $ 14.51 | $ 15.62 | $ 13.21 | $ 11.49 | $ 11.09 | ||||||||||||||||||
|
| |||||||||||||||||||||||
Total Return | ||||||||||||||||||||||||
Total investment return based on net asset value(c) | (6.61 | )% | (5.62 | )% | 19.36 | % | 15.02 | % | 4.39 | % | 12.74 | % | ||||||||||||
Ratios/Supplemental Data | ||||||||||||||||||||||||
Net assets, end of period (000’s omitted) | $95,541 | $108,828 | $134,675 | $129,818 | $141,224 | $173,437 | ||||||||||||||||||
Ratio to average net assets of: |
| |||||||||||||||||||||||
Expenses, net of waivers/reimbursements(d) | 1.65 | %^ | 1.63 | % | 1.75 | % | 1.78 | % | 1.80 | % | 1.80 | %+ | ||||||||||||
Expenses, before waivers/reimbursements(d) | 1.77 | %^ | 1.75 | % | 1.76 | % | 1.78 | % | 1.80 | % | 1.80 | %+ | ||||||||||||
Net investment income (loss) | 3.14 | %^(b) | 1.51 | %(b) | 1.84 | %(b) | (.22 | )% | .19 | % | .88 | %+ | ||||||||||||
Portfolio turnover rate | 3 | % | 9 | % | 20 | % | 4 | % | 29 | % | 4 | % | ||||||||||||
See footnote summary on page 82.
| AB WEALTH STRATEGIES • | 63 |
Financial Highlights
Selected Data For A Share Of Beneficial Interest Outstanding Throughout Each Period
| AB Wealth Appreciation Strategy | ||||||||||||||||||||||||
| Advisor Class | ||||||||||||||||||||||||
Six Months (unaudited) | Year Ended August 31, | |||||||||||||||||||||||
| 2015 | 2014 | 2013 | 2012 | 2011 | ||||||||||||||||||||
|
| |||||||||||||||||||||||
Net asset value, beginning of period | $ 14.62 | $ 15.75 | $ 13.37 | $ 11.64 | $ 11.29 | $ 10.02 | ||||||||||||||||||
|
| |||||||||||||||||||||||
Income From Investment Operations | ||||||||||||||||||||||||
Net investment income(a) | .30 | (b) | .37 | (b) | .41 | (b) | .09 | .12 | .22 | |||||||||||||||
Net realized and unrealized gain (loss) on investment transactions | (1.18 | ) | (1.11 | ) | 2.30 | 1.79 | .46 | 1.19 | ||||||||||||||||
|
| |||||||||||||||||||||||
Net increase (decrease) in net asset value from operations | (.88 | ) | (.74 | ) | 2.71 | 1.88 | .58 | 1.41 | ||||||||||||||||
|
| |||||||||||||||||||||||
Less: Dividends | ||||||||||||||||||||||||
Dividends from net investment income | (.27 | ) | (.39 | ) | (.33 | ) | (.15 | ) | (.23 | ) | (.14 | ) | ||||||||||||
|
| |||||||||||||||||||||||
Net asset value, end of period | $ 13.47 | $ 14.62 | $ 15.75 | $ 13.37 | $ 11.64 | $ 11.29 | ||||||||||||||||||
|
| |||||||||||||||||||||||
Total Return | ||||||||||||||||||||||||
Total investment return based on net asset value(c) | (6.12 | )% | (4.66 | )% | 20.53 | % | 16.27 | % | 5.36 | % | 13.99 | % | ||||||||||||
Ratios/Supplemental Data | ||||||||||||||||||||||||
Net assets, end of period (000’s omitted) | $801,061 | $858,681 | $921,935 | $800,563 | $766,969 | $716,998 | ||||||||||||||||||
Ratio to average net assets of: |
| |||||||||||||||||||||||
Expenses, net of waivers/reimbursements(d) | .64 | %^ | .63 | % | .75 | % | .77 | % | .79 | % | .79 | %+ | ||||||||||||
Expenses, before waivers/reimbursements(d) | .76 | %^ | .75 | % | .76 | % | .77 | % | .79 | % | .79 | %+ | ||||||||||||
Net investment income | 4.16 | %^(b) | 2.42 | %(b) | 2.77 | %(b) | .74 | % | 1.07 | % | 1.79 | %+ | ||||||||||||
Portfolio turnover rate | 3 | % | 9 | % | 20 | % | 4 | % | 29 | % | 4 | % | ||||||||||||
See footnote summary on page 82.
| 64 | • AB WEALTH STRATEGIES |
Financial Highlights
Selected Data For A Share Of Beneficial Interest Outstanding Throughout Each Period
| AB Wealth Appreciation Strategy | ||||||||||||||||||||||||
| Class R | ||||||||||||||||||||||||
Six Months (unaudited) | Year Ended August 31, | |||||||||||||||||||||||
| 2015 | 2014 | 2013 | 2012 | 2011 | ||||||||||||||||||||
|
| |||||||||||||||||||||||
Net asset value, beginning of period | $ 14.51 | $ 15.63 | $ 13.22 | $ 11.45 | $ 11.07 | $ 9.83 | ||||||||||||||||||
|
| |||||||||||||||||||||||
Income From Investment Operations | ||||||||||||||||||||||||
Net investment income(a) | .25 | (b) | .31 | (b) | .33 | (b) | .03 | .08 | .14 | |||||||||||||||
Net realized and unrealized gain (loss) on investment transactions | (1.18 | ) | (1.14 | ) | 2.26 | 1.74 | .44 | 1.16 | ||||||||||||||||
|
| |||||||||||||||||||||||
Net increase (decrease) in net asset value from operations | (.93 | ) | (.83 | ) | 2.59 | 1.77 | .52 | 1.30 | ||||||||||||||||
|
| |||||||||||||||||||||||
Less: Dividends | ||||||||||||||||||||||||
Dividends from net investment income | (.15 | ) | (.29 | ) | (.18 | ) | – 0 | – | (.14 | ) | (.06 | ) | ||||||||||||
|
| |||||||||||||||||||||||
Net asset value, end of period | $ 13.43 | $ 14.51 | $ 15.63 | $ 13.22 | $ 11.45 | $ 11.07 | ||||||||||||||||||
|
| |||||||||||||||||||||||
Total Return | ||||||||||||||||||||||||
Total investment return based on net asset value(c) | (6.46 | )% | (5.33 | )% | 19.75 | % | 15.46 | % | 4.78 | % | 13.21 | % | ||||||||||||
Ratios/Supplemental Data | ||||||||||||||||||||||||
Net assets, end of period (000’s omitted) | $3,362 | $4,212 | $5,665 | $5,953 | $8,045 | $17,480 | ||||||||||||||||||
Ratio to average net assets of: |
| |||||||||||||||||||||||
Expenses, net of waivers/reimbursements(d) | 1.33 | %^ | 1.32 | % | 1.43 | % | 1.41 | % | 1.45 | % | 1.46 | %+ | ||||||||||||
Expenses, before waivers/reimbursements(d) | 1.45 | %^ | 1.44 | % | 1.44 | % | 1.41 | % | 1.45 | % | 1.46 | %+ | ||||||||||||
Net investment income | 3.59 | %^(b) | 2.02 | %(b) | 2.27 | %(b) | .21 | % | .69 | % | 1.17 | %+ | ||||||||||||
Portfolio turnover rate | 3 | % | 9 | % | 20 | % | 4 | % | 29 | % | 4 | % | ||||||||||||
See footnote summary on page 82.
| AB WEALTH STRATEGIES • | 65 |
Financial Highlights
Selected Data For A Share Of Beneficial Interest Outstanding Throughout Each Period
| AB Wealth Appreciation Strategy | ||||||||||||||||||||||||
| Class K | ||||||||||||||||||||||||
Six Months (unaudited) | Year Ended August 31, | |||||||||||||||||||||||
| 2015 | 2014 | 2013 | 2012 | 2011 | ||||||||||||||||||||
|
| |||||||||||||||||||||||
Net asset value, beginning of period | $ 14.54 | $ 15.66 | $ 13.28 | $ 11.57 | $ 11.18 | $ 9.93 | ||||||||||||||||||
|
| |||||||||||||||||||||||
Income From Investment Operations | ||||||||||||||||||||||||
Net investment income(a) | .26 | (b) | .28 | (b) | .37 | (b) | .05 | .09 | .17 | |||||||||||||||
Net realized and unrealized gain (loss) on investment transactions | (1.16 | ) | (1.07 | ) | 2.27 | 1.76 | .46 | 1.18 | ||||||||||||||||
|
| |||||||||||||||||||||||
Net increase (decrease) in net asset value from operations | (.90 | ) | (.79 | ) | 2.64 | 1.81 | .55 | 1.35 | ||||||||||||||||
|
| |||||||||||||||||||||||
Less: Dividends | ||||||||||||||||||||||||
Dividends from net investment income | (.21 | ) | (.33 | ) | (.26 | ) | (.10 | ) | (.16 | ) | (.10 | ) | ||||||||||||
|
| |||||||||||||||||||||||
Net asset value, end of period | $ 13.43 | $ 14.54 | $ 15.66 | $ 13.28 | $ 11.57 | $ 11.18 | ||||||||||||||||||
|
| |||||||||||||||||||||||
Total Return | ||||||||||||||||||||||||
Total investment return based on net asset value(c) | (6.27 | )% | (5.07 | )% | 20.12 | % | 15.78 | % | 5.07 | % | 13.53 | % | ||||||||||||
Ratios/Supplemental Data | ||||||||||||||||||||||||
Net assets, end of period (000’s omitted) | $14,134 | $15,751 | $17,865 | $16,319 | $16,616 | $21,677 | ||||||||||||||||||
Ratio to average net assets of: |
| |||||||||||||||||||||||
Expenses, net of waivers/reimbursements(d) | 1.02 | %^ | 1.01 | % | 1.12 | % | 1.11 | % | 1.13 | % | 1.15 | %+ | ||||||||||||
Expenses, before waivers/reimbursements(d) | 1.14 | %^ | 1.13 | % | 1.13 | % | 1.11 | % | 1.13 | % | 1.15 | %+ | ||||||||||||
Net investment income | 3.70 | %^(b) | 1.85 | %(b) | 2.48 | %(b) | .42 | % | .83 | % | 1.45 | %+ | ||||||||||||
Portfolio turnover rate | 3 | % | 9 | % | 20 | % | 4 | % | 29 | % | 4 | % | ||||||||||||
See footnote summary on page 82.
| 66 | • AB WEALTH STRATEGIES |
Financial Highlights
Selected Data For A Share Of Beneficial Interest Outstanding Throughout Each Period
| AB Wealth Appreciation Strategy | ||||||||||||||||||||||||
| Class I | ||||||||||||||||||||||||
Six Months (unaudited) | Year Ended August 31, | |||||||||||||||||||||||
| 2015 | 2014 | 2013 | 2012 | 2011 | ||||||||||||||||||||
|
| |||||||||||||||||||||||
Net asset value, beginning of period | $ 14.59 | $ 15.72 | $ 13.34 | $ 11.61 | $ 11.25 | $ 9.99 | ||||||||||||||||||
|
| |||||||||||||||||||||||
Income From Investment Operations | ||||||||||||||||||||||||
Net investment income(a) | .29 | (b) | .62 | (b) | .41 | (b) | .09 | .18 | .22 | |||||||||||||||
Net realized and unrealized gain (loss) on investment transactions | (1.17 | ) | (1.36 | ) | 2.29 | 1.77 | .41 | 1.18 | ||||||||||||||||
|
| |||||||||||||||||||||||
Net increase (decrease) in net asset value from operations | (.88 | ) | (.74 | ) | 2.70 | 1.86 | .59 | 1.40 | ||||||||||||||||
|
| |||||||||||||||||||||||
Less: Dividends | ||||||||||||||||||||||||
Dividends from net investment income | (.26 | ) | (.39 | ) | (.32 | ) | (.13 | ) | (.23 | ) | (.14 | ) | ||||||||||||
|
| |||||||||||||||||||||||
Net asset value, end of period | $ 13.45 | $ 14.59 | $ 15.72 | $ 13.34 | $ 11.61 | $ 11.25 | ||||||||||||||||||
|
| |||||||||||||||||||||||
Total Return | ||||||||||||||||||||||||
Total investment return based on net asset value(c) | (6.13 | )% | (4.72 | )% | 20.53 | % | 16.16 | % | 5.43 | % | 13.90 | % | ||||||||||||
Ratios/Supplemental Data | ||||||||||||||||||||||||
Net assets, end of period (000’s omitted) | $1,528 | $1,781 | $4,576 | $3,886 | $3,934 | $10,552 | ||||||||||||||||||
Ratio to average net assets of: |
| |||||||||||||||||||||||
Expenses, net of waivers/reimbursements(d) | .69 | %^ | .68 | % | .79 | % | .79 | % | .80 | % | .82 | %+ | ||||||||||||
Expenses, before waivers/reimbursements(d) | .81 | %^ | .80 | % | .81 | % | .79 | % | .80 | % | .82 | %+ | ||||||||||||
Net investment income | 4.10 | %^(b) | 3.99 | %(b) | 2.78 | %(b) | .72 | % | 1.53 | % | 1.82 | %+ | ||||||||||||
Portfolio turnover rate | 3 | % | 9 | % | 20 | % | 4 | % | 29 | % | 4 | % | ||||||||||||
See footnote summary on page 82.
| AB WEALTH STRATEGIES • | 67 |
Financial Highlights
Selected Data For A Share Of Beneficial Interest Outstanding Throughout Each Period
| AB Balanced Wealth Strategy | ||||||||||||||||||||||||
| Class A | ||||||||||||||||||||||||
Six Months (unaudited) | Year Ended August 31, | |||||||||||||||||||||||
| 2015 | 2014 | 2013 | 2012 | 2011 | ||||||||||||||||||||
|
| |||||||||||||||||||||||
Net asset value, beginning of period | $ 13.49 | $ 14.31 | $ 12.74 | $ 11.85 | $ 11.47 | $ 10.61 | ||||||||||||||||||
|
| |||||||||||||||||||||||
Income From Investment Operations | ||||||||||||||||||||||||
Net investment income(a) | .32 | (b) | .43 | (b) | .39 | (b) | .23 | .22 | .33 | |||||||||||||||
Net realized and unrealized gain (loss) on investment transactions | (.86 | ) | (.93 | ) | 1.56 | .89 | .44 | .83 | ||||||||||||||||
|
| |||||||||||||||||||||||
Net increase (decrease) in net asset value from operations | (.54 | ) | (.50 | ) | 1.95 | 1.12 | .66 | 1.16 | ||||||||||||||||
|
| |||||||||||||||||||||||
Less: Dividends and Distributions | ||||||||||||||||||||||||
Dividends from net investment income | (.31 | ) | (.32 | ) | (.38 | ) | (.23 | ) | (.26 | ) | (.30 | ) | ||||||||||||
Tax return of capital | – 0 | – | – 0 | – | – 0 | – | .00 | (e) | (.02 | ) | – 0 | – | ||||||||||||
|
| |||||||||||||||||||||||
Total dividends and distributions | (.31 | ) | (.32 | ) | (.38 | ) | (.23 | ) | (.28 | ) | (.30 | ) | ||||||||||||
|
| |||||||||||||||||||||||
Net asset value, end of period | $ 12.64 | $ 13.49 | $ 14.31 | $ 12.74 | $ 11.85 | $ 11.47 | ||||||||||||||||||
|
| |||||||||||||||||||||||
Total Return | ||||||||||||||||||||||||
Total investment return based on net asset value(c) | (4.06 | )% | (3.46 | )% | 15.56 | % | 9.49 | % | 5.81 | % | 10.86 | % | ||||||||||||
Ratios/Supplemental Data | ||||||||||||||||||||||||
Net assets, end of period (000’s omitted) | $658,112 | $713,524 | $782,044 | $732,322 | $790,583 | $926,599 | ||||||||||||||||||
Ratio to average net assets of: |
| |||||||||||||||||||||||
Expenses, net of waivers/reimbursements(d) | .87 | %^ | .85 | % | .98 | % | .99 | % | 1.00 | % | .99 | %+ | ||||||||||||
Expenses, before waivers/reimbursements(d) | .95 | %^ | .93 | % | .99 | % | .99 | % | 1.00 | % | .99 | %+ | ||||||||||||
Net investment income | 4.85 | %(b)^ | 3.07 | %(b) | 2.87 | %(b) | 1.87 | % | 1.93 | % | 2.77 | %+ | ||||||||||||
Portfolio turnover rate | 7 | % | 9 | % | 15 | % | 4 | % | 34 | % | 4 | % | ||||||||||||
See footnote summary on page 82.
| 68 | • AB WEALTH STRATEGIES |
Financial Highlights
Selected Data For A Share Of Beneficial Interest Outstanding Throughout Each Period
| AB Balanced Wealth Strategy | ||||||||||||||||||||||||
| Class B | ||||||||||||||||||||||||
Six Months (unaudited) | Year Ended August 31, | |||||||||||||||||||||||
| 2015 | 2014 | 2013 | 2012 | 2011 | ||||||||||||||||||||
|
| |||||||||||||||||||||||
Net asset value, beginning of period | $ 13.32 | $ 14.13 | $ 12.64 | $ 11.80 | $ 11.40 | $ 10.55 | ||||||||||||||||||
|
| |||||||||||||||||||||||
Income From Investment Operations | ||||||||||||||||||||||||
Net investment income(a) | .26 | (b) | .39 | (b) | .33 | (b) | .16 | .14 | .24 | |||||||||||||||
Net realized and unrealized gain (loss) on investment transactions | (.84 | ) | (.98 | ) | 1.50 | .86 | .43 | .82 | ||||||||||||||||
|
| |||||||||||||||||||||||
Net increase (decrease) in net asset value from operations | (.58 | ) | (.59 | ) | 1.83 | 1.02 | .57 | 1.06 | ||||||||||||||||
|
| |||||||||||||||||||||||
Less: Dividends and Distributions | ||||||||||||||||||||||||
Dividends from net investment income | (.13 | ) | (.22 | ) | (.34 | ) | (.18 | ) | (.16 | ) | (.21 | ) | ||||||||||||
Tax return of capital | – 0 | – | – 0 | – | – 0 | – | .00 | (e) | (.01 | ) | – 0 | – | ||||||||||||
|
| |||||||||||||||||||||||
Total dividends and distributions | (.13 | ) | (.22 | ) | (.34 | ) | (.18 | ) | (.17 | ) | (.21 | ) | ||||||||||||
|
| |||||||||||||||||||||||
Net asset value, end of period | $ 12.61 | $ 13.32 | $ 14.13 | $ 12.64 | $ 11.80 | $ 11.40 | ||||||||||||||||||
|
| |||||||||||||||||||||||
Total Return | ||||||||||||||||||||||||
Total investment return based on net asset value(c) | (4.39 | )% | (4.19 | )% | 14.75 | % | 8.66 | % | 5.06 | % | 10.04 | % | ||||||||||||
Ratios/Supplemental Data | ||||||||||||||||||||||||
Net assets, end of period (000’s omitted) | $33,512 | $52,097 | $118,556 | $166,923 | $230,241 | $309,895 | ||||||||||||||||||
Ratio to average net assets of: |
| |||||||||||||||||||||||
Expenses, net of waivers/reimbursements(d) | 1.63 | %^ | 1.61 | % | 1.69 | % | 1.70 | % | 1.72 | % | 1.72 | %+ | ||||||||||||
Expenses, before waivers/reimbursements(d) | 1.71 | %^ | 1.69 | % | 1.70 | % | 1.70 | % | 1.72 | % | 1.72 | %+ | ||||||||||||
Net investment income | 3.94 | %^(b) | 2.79 | %(b) | 2.41 | %(b) | 1.26 | % | 1.25 | % | 2.06 | %+ | ||||||||||||
Portfolio turnover rate | 7 | % | 9 | % | 15 | % | 4 | % | 34 | % | 4 | % | ||||||||||||
See footnote summary on page 82.
| AB WEALTH STRATEGIES • | 69 |
Financial Highlights
Selected Data For A Share Of Beneficial Interest Outstanding Throughout Each Period
| AB Balanced Wealth Strategy | ||||||||||||||||||||||||
| Class C | ||||||||||||||||||||||||
Six Months (unaudited) | Year Ended August 31, | |||||||||||||||||||||||
| 2015 | 2014 | 2013 | 2012 | 2011 | ||||||||||||||||||||
|
| |||||||||||||||||||||||
Net asset value, beginning of period | $ 13.32 | $ 14.15 | $ 12.66 | $ 11.82 | $ 11.42 | $ 10.56 | ||||||||||||||||||
|
| |||||||||||||||||||||||
Income From Investment Operations | ||||||||||||||||||||||||
Net investment income(a) | .27 | (b) | .33 | (b) | .30 | (b) | .15 | .14 | .24 | |||||||||||||||
Net realized and unrealized gain (loss) on investment transactions | (.85 | ) | (.92 | ) | 1.54 | .87 | .43 | .83 | ||||||||||||||||
|
| |||||||||||||||||||||||
Net increase (decrease) in net asset value from operations | (.58 | ) | (.59 | ) | 1.84 | 1.02 | .57 | 1.07 | ||||||||||||||||
|
| |||||||||||||||||||||||
Less: Dividends and Distributions | ||||||||||||||||||||||||
Dividends from net investment income | (.20 | ) | (.24 | ) | (.35 | ) | (.18 | ) | (.16 | ) | (.21 | ) | ||||||||||||
Tax return of capital | – 0 | – | – 0 | – | – 0 | – | .00 | (e) | (.01 | ) | – 0 | – | ||||||||||||
|
| |||||||||||||||||||||||
Total dividends and distributions | (.20 | ) | (.24 | ) | (.35 | ) | (.18 | ) | (.17 | ) | (.21 | ) | ||||||||||||
|
| |||||||||||||||||||||||
Net asset value, end of period | $ 12.54 | $ 13.32 | $ 14.15 | $ 12.66 | $ 11.82 | $ 11.42 | ||||||||||||||||||
|
| |||||||||||||||||||||||
Total Return | ||||||||||||||||||||||||
Total investment return based on net asset value(c) | (4.39 | )% | (4.19 | )% | 14.74 | % | 8.67 | % | 5.08 | % | 10.12 | % | ||||||||||||
Ratios/Supplemental Data | ||||||||||||||||||||||||
Net assets, end of period (000’s omitted) | $198,113 | $220,663 | $266,720 | $262,751 | $296,426 | $375,644 | ||||||||||||||||||
Ratio to average net assets of: |
| |||||||||||||||||||||||
Expenses, net of waivers/reimbursements(d) | 1.62 | %^ | 1.60 | % | 1.69 | % | 1.69 | % | 1.70 | % | 1.70 | %+ | ||||||||||||
Expenses, before waivers/reimbursements(d) | 1.70 | %^ | 1.68 | % | 1.69 | % | 1.69 | % | 1.70 | % | 1.70 | %+ | ||||||||||||
Net investment income | 4.11 | %^(b) | 2.40 | %(b) | 2.20 | %(b) | 1.17 | % | 1.24 | % | 2.07 | %+ | ||||||||||||
Portfolio turnover rate | 7 | % | 9 | % | 15 | % | 4 | % | 34 | % | 4 | % | ||||||||||||
See footnote summary on page 82.
| 70 | • AB WEALTH STRATEGIES |
Financial Highlights
Selected Data For A Share Of Beneficial Interest Outstanding Throughout Each Period
| AB Balanced Wealth Strategy | ||||||||||||||||||||||||
| Advisor Class | ||||||||||||||||||||||||
Six Months (unaudited) | Year Ended August 31, | |||||||||||||||||||||||
| 2015 | 2014 | 2013 | 2012 | 2011 | ||||||||||||||||||||
|
| |||||||||||||||||||||||
Net asset value, beginning of period | $ 13.58 | $ 14.40 | $ 12.79 | $ 11.88 | $ 11.51 | $ 10.64 | ||||||||||||||||||
|
| |||||||||||||||||||||||
Income From Investment Operations | ||||||||||||||||||||||||
Net investment income(a) | .34 | (b) | .48 | (b) | .43 | (b) | .27 | .24 | .35 | |||||||||||||||
Net realized and unrealized gain (loss) on investment transactions | (.86 | ) | (.94 | ) | 1.57 | .89 | .45 | .85 | ||||||||||||||||
|
| |||||||||||||||||||||||
Net increase (decrease) in net asset value from operations | (.52 | ) | (.46 | ) | 2.00 | 1.16 | .69 | 1.20 | ||||||||||||||||
|
| |||||||||||||||||||||||
Less: Dividends and Distributions | ||||||||||||||||||||||||
Dividends from net investment income | (.35 | ) | (.36 | ) | (.39 | ) | (.25 | ) | (.30 | ) | (.33 | ) | ||||||||||||
Tax return of capital | – 0 | – | – 0 | – | – 0 | – | .00 | (e) | (.02 | ) | – 0 | – | ||||||||||||
|
| |||||||||||||||||||||||
Total dividends and distributions | (.35 | ) | (.36 | ) | (.39 | ) | (.25 | ) | (.32 | ) | (.33 | ) | ||||||||||||
|
| |||||||||||||||||||||||
Net asset value, end of period | $ 12.71 | $ 13.58 | $ 14.40 | $ 12.79 | $ 11.88 | $ 11.51 | ||||||||||||||||||
|
| |||||||||||||||||||||||
Total Return | ||||||||||||||||||||||||
Total investment return based on net asset value(c) | (3.92 | )% | (3.21 | )% | 15.94 | % | 9.81 | % | 6.09 | % | 11.24 | % | ||||||||||||
Ratios/Supplemental Data | ||||||||||||||||||||||||
Net assets, end of period (000’s omitted) | $82,421 | $94,932 | $109,579 | $95,982 | $103,716 | $103,772 | ||||||||||||||||||
Ratio to average net assets of: |
| |||||||||||||||||||||||
Expenses, net of waivers/reimbursements(d) | .62 | %^ | .60 | % | .68 | % | .69 | % | .70 | % | .69 | %+ | ||||||||||||
Expenses, before waivers/reimbursements(d) | .70 | %^ | .68 | % | .69 | % | .69 | % | .70 | % | .69 | %+ | ||||||||||||
Net investment income | 5.10 | %^(b) | 3.42 | %(b) | 3.17 | %(b) | 2.14 | % | 2.12 | % | 2.93 | %+ | ||||||||||||
Portfolio turnover rate | 7 | % | 9 | % | 15 | % | 4 | % | 34 | % | 4 | % | ||||||||||||
See footnote summary on page 82.
| AB WEALTH STRATEGIES • | 71 |
Financial Highlights
Selected Data For A Share Of Beneficial Interest Outstanding Throughout Each Period
| AB Balanced Wealth Strategy | ||||||||||||||||||||||||
| Class R | ||||||||||||||||||||||||
Six Months (unaudited) | Year Ended August 31, | |||||||||||||||||||||||
| 2015 | 2014 | 2013 | 2012 | 2011 | ||||||||||||||||||||
|
| |||||||||||||||||||||||
Net asset value, beginning of period | $ 13.39 | $ 14.21 | $ 12.69 | $ 11.82 | $ 11.44 | $ 10.58 | ||||||||||||||||||
|
| |||||||||||||||||||||||
Income From Investment Operations | ||||||||||||||||||||||||
Net investment income(a) | .30 | (b) | .38 | (b) | .41 | (b) | .20 | .18 | .25 | |||||||||||||||
Net realized and unrealized gain (loss) on investment transactions | (.86 | ) | (.92 | ) | 1.47 | .87 | .42 | .87 | ||||||||||||||||
|
| |||||||||||||||||||||||
Net increase (decrease) in net asset value from operations | (.56 | ) | (.54 | ) | 1.88 | 1.07 | .60 | 1.12 | ||||||||||||||||
|
| |||||||||||||||||||||||
Less: Dividends and Distributions | �� | |||||||||||||||||||||||
Dividends from net investment income | (.23 | ) | (.28 | ) | (.36 | ) | (.20 | ) | (.20 | ) | (.26 | ) | ||||||||||||
Tax return of capital | – 0 | – | – 0 | – | – 0 | – | .00 | (e) | (.02 | ) | – 0 | – | ||||||||||||
|
| |||||||||||||||||||||||
Total dividends and distributions | (.23 | ) | (.28 | ) | (.36 | ) | (.20 | ) | (.22 | ) | (.26 | ) | ||||||||||||
|
| |||||||||||||||||||||||
Net asset value, end of period | $ 12.60 | $ 13.39 | $ 14.21 | $ 12.69 | $ 11.82 | $ 11.44 | ||||||||||||||||||
|
| |||||||||||||||||||||||
Total Return | ||||||||||||||||||||||||
Total investment return based on net asset value(c) | (4.21 | )% | (3.82 | )% | 15.09 | % | 9.13 | % | 5.35 | % | 10.55 | % | ||||||||||||
Ratios/Supplemental Data | ||||||||||||||||||||||||
Net assets, end of period (000’s omitted) | $6,926 | $10,762 | $11,761 | $17,316 | $20,020 | $34,602 | ||||||||||||||||||
Ratio to average net assets of: |
| |||||||||||||||||||||||
Expenses, net of waivers/reimbursements(d) | 1.27 | %^ | 1.26 | % | 1.34 | % | 1.35 | % | 1.35 | % | 1.35 | %+ | ||||||||||||
Expenses, before waivers/reimbursements(d) | 1.35 | %^ | 1.34 | % | 1.35 | % | 1.35 | % | 1.35 | % | 1.35 | %+ | ||||||||||||
Net investment income | 4.51 | %^(b) | 2.71 | %(b) | 3.05 | %(b) | 1.62 | % | 1.56 | % | 2.08 | %+ | ||||||||||||
Portfolio turnover rate | 7 | % | 9 | % | 15 | % | 4 | % | 34 | % | 4 | % | ||||||||||||
See footnote summary on page 82.
| 72 | • AB WEALTH STRATEGIES |
Financial Highlights
Selected Data For A Share Of Beneficial Interest Outstanding Throughout Each Period
| AB Balanced Wealth Strategy | ||||||||||||||||||||||||
| Class K | ||||||||||||||||||||||||
Six Months (unaudited) | Year Ended August 31, | |||||||||||||||||||||||
| 2015 | 2014 | 2013 | 2012 | 2011 | ||||||||||||||||||||
|
| |||||||||||||||||||||||
Net asset value, beginning of period | $ 13.44 | $ 14.26 | $ 12.71 | $ 11.83 | $ 11.45 | $ 10.60 | ||||||||||||||||||
|
| |||||||||||||||||||||||
Income From Investment Operations | ||||||||||||||||||||||||
Net investment income(a) | .31 | (b) | .38 | (b) | .35 | (b) | .22 | .23 | .32 | |||||||||||||||
Net realized and unrealized gain (loss) on investment transactions | (.85 | ) | (.89 | ) | 1.58 | .88 | .43 | .82 | ||||||||||||||||
|
| |||||||||||||||||||||||
Net increase (decrease) in net asset value from operations | (.54 | ) | (.51 | ) | 1.93 | 1.10 | .66 | 1.14 | ||||||||||||||||
|
| |||||||||||||||||||||||
Less: Dividends and Distributions | ||||||||||||||||||||||||
Dividends from net investment income | (.30 | ) | (.31 | ) | (.38 | ) | (.22 | ) | (.26 | ) | (.29 | ) | ||||||||||||
Tax return of capital | – 0 | – | – 0 | – | – 0 | – | .00 | (e) | (.02 | ) | – 0 | – | ||||||||||||
|
| |||||||||||||||||||||||
Total dividends and distributions | (.30 | ) | (.31 | ) | (.38 | ) | (.22 | ) | (.28 | ) | (.29 | ) | ||||||||||||
|
| |||||||||||||||||||||||
Net asset value, end of period | $ 12.60 | $ 13.44 | $ 14.26 | $ 12.71 | $ 11.83 | $ 11.45 | ||||||||||||||||||
|
| |||||||||||||||||||||||
Total Return | ||||||||||||||||||||||||
Total investment return based on net asset value(c) | (4.09 | )% | (3.55 | )% | 15.44 | % | 9.40 | % | 5.85 | % | 10.74 | % | ||||||||||||
Ratios/Supplemental Data | ||||||||||||||||||||||||
Net assets, end of period (000’s omitted) | $27,279 | $30,439 | $29,819 | $25,081 | $30,538 | $26,355 | ||||||||||||||||||
Ratio to average net assets of: |
| |||||||||||||||||||||||
Expenses, net of waivers/reimbursements(d) | .96 | %^ | .95 | % | 1.03 | % | 1.04 | % | 1.02 | % | 1.04 | %+ | ||||||||||||
Expenses, before waivers/ reimbursements(d) | 1.04 | %^ | 1.03 | % | 1.04 | % | 1.04 | % | 1.02 | % | 1.04 | %+ | ||||||||||||
Net investment income | 4.76 | %^(b) | 2.74 | %(b) | 2.59 | %(b) | 1.76 | % | 1.95 | % | 2.72 | %+ | ||||||||||||
Portfolio turnover rate | 7 | % | 9 | % | 15 | % | 4 | % | 34 | % | 4 | % | ||||||||||||
See footnote summary on page 82.
| AB WEALTH STRATEGIES • | 73 |
Financial Highlights
Selected Data For A Share Of Beneficial Interest Outstanding Throughout Each Period
| AB Balanced Wealth Strategy | ||||||||||||||||||||||||
| Class I | ||||||||||||||||||||||||
Six Months (unaudited) | Year Ended August 31, | |||||||||||||||||||||||
| 2015 | 2014 | 2013 | 2012 | 2011 | ||||||||||||||||||||
|
| |||||||||||||||||||||||
Net asset value, beginning of period | $ 13.54 | $ 14.35 | $ 12.76 | $ 11.85 | $ 11.48 | $ 10.62 | ||||||||||||||||||
|
| |||||||||||||||||||||||
Income From Investment Operations | ||||||||||||||||||||||||
Net investment income(a) | .34 | (b) | .49 | (b) | .43 | (b) | .26 | .27 | .36 | |||||||||||||||
Net realized and unrealized gain (loss) on investment transactions | (.87 | ) | (.95 | ) | 1.55 | .89 | .42 | .83 | ||||||||||||||||
|
| |||||||||||||||||||||||
Net increase (decrease) in net asset value from operations | (.53 | ) | (.46 | ) | 1.98 | 1.15 | .69 | 1.19 | ||||||||||||||||
|
| |||||||||||||||||||||||
Less: Dividends and Distributions | ||||||||||||||||||||||||
Dividends from net investment income | (.34 | ) | (.35 | ) | (.39 | ) | (.24 | ) | (.30 | ) | (.33 | ) | ||||||||||||
Tax return of capital | – 0 | – | – 0 | – | – 0 | – | .00 | (e) | (.02 | ) | – 0 | – | ||||||||||||
|
| |||||||||||||||||||||||
Total dividends and distributions | (.34 | ) | (.35 | ) | (.39 | ) | (.24 | ) | (.32 | ) | (.33 | ) | ||||||||||||
|
| |||||||||||||||||||||||
Net asset value, end of period | $ 12.67 | $ 13.54 | $ 14.35 | $ 12.76 | $ 11.85 | $ 11.48 | ||||||||||||||||||
|
| |||||||||||||||||||||||
Total Return | ||||||||||||||||||||||||
Total investment return based on net asset value(c) | (3.96 | )% | (3.18 | )% | 15.82 | % | 9.82 | % | 6.10 | % | 11.14 | % | ||||||||||||
Ratios/Supplemental Data | ||||||||||||||||||||||||
Net assets, end of period (000’s omitted) | $10,398 | $11,912 | $14,204 | $12,653 | $12,925 | $21,796 | ||||||||||||||||||
Ratio to average net assets of: |
| |||||||||||||||||||||||
Expenses, net of waivers/reimbursements(d) | .63 | %^ | .62 | % | .70 | % | .71 | % | .70 | % | .71 | %+ | ||||||||||||
Expenses, before waivers/ | .71 | %^ | .70 | % | .71 | % | .71 | % | .70 | % | .71 | %+ | ||||||||||||
Net investment income | 5.10 | %^(b) | 3.45 | %(b) | 3.14 | %(b) | 2.12 | % | 2.34 | % | 3.00 | %+ | ||||||||||||
Portfolio turnover rate | 7 | % | 9 | % | 15 | % | 4 | % | 34 | % | 4 | % | ||||||||||||
See footnote summary on page 82.
| 74 | • AB WEALTH STRATEGIES |
Financial Highlights
Selected Data For A Share Of Beneficial Interest Outstanding Throughout Each Period
| AB Conservative Wealth Strategy | ||||||||||||||||||||||||
| Class A | ||||||||||||||||||||||||
Six Months (unaudited) | Year Ended August 31, | |||||||||||||||||||||||
| 2015 | 2014 | 2013 | 2012 | 2011 | ||||||||||||||||||||
|
| |||||||||||||||||||||||
Net asset value, beginning of period | $ 12.18 | $ 12.43 | $ 11.59 | $ 11.34 | $ 11.17 | $ 10.66 | ||||||||||||||||||
|
| |||||||||||||||||||||||
Income From Investment Operations | ||||||||||||||||||||||||
Net investment income(a) | .22 | (b) | .28 | (b) | .23 | (b) | .20 | .23 | .26 | |||||||||||||||
Net realized and unrealized gain (loss) on investment transactions | (.41 | ) | (.48 | ) | .82 | .25 | .20 | .51 | ||||||||||||||||
|
| |||||||||||||||||||||||
Net increase (decrease) in net asset value from operations | (.19 | ) | (.20 | ) | 1.05 | .45 | .43 | .77 | ||||||||||||||||
|
| |||||||||||||||||||||||
Less: Dividends | ||||||||||||||||||||||||
Dividends from net investment income | (.26 | ) | (.05 | ) | (.21 | ) | (.20 | ) | (.26 | ) | (.26 | ) | ||||||||||||
|
| |||||||||||||||||||||||
Net asset value, end of period | $ 11.73 | $ 12.18 | $ 12.43 | $ 11.59 | $ 11.34 | $ 11.17 | ||||||||||||||||||
|
| |||||||||||||||||||||||
Total Return | ||||||||||||||||||||||||
Total investment return based on net asset value(c) | (1.59 | )% | (1.59 | )% | 9.20 | % | 3.93 | % | 3.93 | % | 7.23 | % | ||||||||||||
Ratios/Supplemental Data | ||||||||||||||||||||||||
Net assets, end of period (000’s omitted) | $178,509 | $189,751 | $209,189 | $219,653 | $255,748 | $292,825 | ||||||||||||||||||
Ratio to average net assets of: |
| |||||||||||||||||||||||
Expenses, net of waivers/reimbursements(d) | .95 | %^ | .92 | % | 1.02 | % | 1.03 | % | 1.02 | % | 1.01 | %+ | ||||||||||||
Expenses, before waivers/reimbursements(d) | 1.01 | %^ | .98 | % | 1.03 | % | 1.03 | % | 1.02 | % | 1.01 | %+ | ||||||||||||
Net investment income | 3.72 | %^(b) | 2.28 | %(b) | 1.88 | %(b) | 1.70 | % | 2.08 | % | 2.34 | %+ | ||||||||||||
Portfolio turnover rate | 4 | % | 6 | % | 11 | % | 4 | % | 21 | % | 4 | % | ||||||||||||
See footnote summary on page 82.
| AB WEALTH STRATEGIES • | 75 |
Financial Highlights
Selected Data For A Share Of Beneficial Interest Outstanding Throughout Each Period
| AB Conservative Wealth Strategy | ||||||||||||||||||||||||
| Class B | ||||||||||||||||||||||||
Six Months (unaudited) | Year Ended August 31, | |||||||||||||||||||||||
| 2015 | 2014 | 2013 | 2012 | 2011 | ||||||||||||||||||||
|
| |||||||||||||||||||||||
Net asset value, beginning of period | $ 12.00 | $ 12.29 | $ 11.50 | $ 11.29 | $ 11.10 | $ 10.60 | ||||||||||||||||||
|
| |||||||||||||||||||||||
Income From Investment Operations | ||||||||||||||||||||||||
Net investment income(a) | .17 | (b) | .22 | (b) | .15 | (b) | .12 | .16 | .18 | |||||||||||||||
Net realized and unrealized gain (loss) on investment transactions | (.40 | ) | (.51 | ) | .81 | .24 | .19 | .50 | ||||||||||||||||
|
| |||||||||||||||||||||||
Net increase (decrease) in net asset value from operations | (.23 | ) | (.29 | ) | .96 | .36 | .35 | .68 | ||||||||||||||||
|
| |||||||||||||||||||||||
Less: Dividends | ||||||||||||||||||||||||
Dividends from net investment income | (.14 | ) | – 0 | – | (.17 | ) | (.15 | ) | (.16 | ) | (.18 | ) | ||||||||||||
|
| |||||||||||||||||||||||
Net asset value, end of period | $ 11.63 | $ 12.00 | $ 12.29 | $ 11.50 | $ 11.29 | $ 11.10 | ||||||||||||||||||
|
| |||||||||||||||||||||||
Total Return | ||||||||||||||||||||||||
Total investment return based on net asset value(c) | (1.95 | )% | (2.36 | )% | 8.46 | % | 3.17 | % | 3.21 | % | 6.43 | % | ||||||||||||
Ratios/Supplemental Data | ||||||||||||||||||||||||
Net assets, end of period (000’s omitted) | $11,976 | $18,706 | $37,181 | $52,372 | $76,229 | $101,883 | ||||||||||||||||||
Ratio to average net assets of: |
| |||||||||||||||||||||||
Expenses, net of waivers/reimbursements(d) | 1.70 | %^ | 1.68 | % | 1.73 | % | 1.74 | % | 1.75 | % | 1.74 | %+ | ||||||||||||
Expenses, before waivers/reimbursements(d) | 1.76 | %^ | 1.74 | % | 1.74 | % | 1.74 | % | 1.75 | % | 1.74 | %+ | ||||||||||||
Net investment income | 2.78 | %^(b) | 1.80 | %(b) | 1.28 | %(b) | 1.06 | % | 1.42 | % | 1.61 | %+ | ||||||||||||
Portfolio turnover rate | 4 | % | 6 | % | 11 | % | 4 | % | 21 | % | 4 | % | ||||||||||||
See footnote summary on page 82.
| 76 | • AB WEALTH STRATEGIES |
Financial Highlights
Selected Data For A Share Of Beneficial Interest Outstanding Throughout Each Period
| AB Conservative Wealth Strategy | ||||||||||||||||||||||||
| Class C | ||||||||||||||||||||||||
Six Months (unaudited) | Year Ended August 31, | |||||||||||||||||||||||
| 2015 | 2014 | 2013 | 2012 | 2011 | ||||||||||||||||||||
|
| |||||||||||||||||||||||
Net asset value, beginning of period | $ 12.00 | $ 12.29 | $ 11.50 | $ 11.29 | $ 11.10 | $ 10.60 | ||||||||||||||||||
|
| |||||||||||||||||||||||
Income From Investment Operations | ||||||||||||||||||||||||
Net investment income(a) | .17 | (b) | .19 | (b) | .14 | (b) | .11 | .15 | .18 | |||||||||||||||
Net realized and unrealized gain (loss) on investment transactions | (.41 | ) | (.48 | ) | .82 | .25 | .21 | .50 | ||||||||||||||||
|
| |||||||||||||||||||||||
Net increase (decrease) in net asset value from operations | (.24 | ) | (.29 | ) | .96 | .36 | .36 | .68 | ||||||||||||||||
|
| |||||||||||||||||||||||
Less: Dividends | ||||||||||||||||||||||||
Dividends from net investment income | (.19 | ) | – 0 | – | (.17 | ) | (.15 | ) | (.17 | ) | (.18 | ) | ||||||||||||
|
| |||||||||||||||||||||||
Net asset value, end of period | $ 11.57 | $ 12.00 | $ 12.29 | $ 11.50 | $ 11.29 | $ 11.10 | ||||||||||||||||||
|
| |||||||||||||||||||||||
Total Return | ||||||||||||||||||||||||
Total investment return based on net asset value(c) | (1.99 | )% | (2.36 | )% | 8.47 | % | 3.18 | % | 3.24 | % | 6.43 | % | ||||||||||||
Ratios/Supplemental Data | ||||||||||||||||||||||||
Net assets, end of period (000’s omitted) | $77,563 | $83,574 | $95,109 | $104,830 | $124,847 | $148,245 | ||||||||||||||||||
Ratio to average net assets of: |
| |||||||||||||||||||||||
Expenses, net of waivers/reimbursements(d) | 1.70 | %^ | 1.68 | % | 1.73 | % | 1.73 | % | 1.73 | % | 1.72 | %+ | ||||||||||||
Expenses, before waivers/reimbursements(d) | 1.76 | %^ | 1.74 | % | 1.73 | % | 1.73 | % | 1.73 | % | 1.72 | %+ | ||||||||||||
Net investment income | 2.93 | %^(b) | 1.54 | %(b) | 1.20 | %(b) | .98 | % | 1.39 | % | 1.63 | %+ | ||||||||||||
Portfolio turnover rate | 4 | % | 6 | % | 11 | % | 4 | % | 21 | % | 4 | % | ||||||||||||
See footnote summary on page 82.
| AB WEALTH STRATEGIES • | 77 |
Financial Highlights
Selected Data For A Share Of Beneficial Interest Outstanding Throughout Each Period
| AB Conservative Wealth Strategy | ||||||||||||||||||||||||
| Advisor Class | ||||||||||||||||||||||||
Six Months (unaudited) | Year Ended August 31, | |||||||||||||||||||||||
| 2015 | 2014 | 2013 | 2012 | 2011 | ||||||||||||||||||||
|
| |||||||||||||||||||||||
Net asset value, beginning of period | $ 12.24 | $ 12.48 | $ 11.62 | $ 11.35 | $ 11.19 | $ 10.68 | ||||||||||||||||||
|
| |||||||||||||||||||||||
Income From Investment Operations | ||||||||||||||||||||||||
Net investment income(a) | .25 | (b) | .33 | (b) | .24 | (b) | .24 | .27 | .29 | |||||||||||||||
Net realized and unrealized gain (loss) on investment transactions | (.43 | ) | (.49 | ) | .85 | .24 | .19 | .51 | ||||||||||||||||
|
| |||||||||||||||||||||||
Net increase (decrease) in net asset value from operations | (.18 | ) | (.16 | ) | 1.09 | .48 | .46 | .80 | ||||||||||||||||
|
| |||||||||||||||||||||||
Less: Dividends | ||||||||||||||||||||||||
Dividends from net investment income | (.28 | ) | (.08 | ) | (.23 | ) | (.21 | ) | (.30 | ) | (.29 | ) | ||||||||||||
|
| |||||||||||||||||||||||
Net asset value, end of period | $ 11.78 | $ 12.24 | $ 12.48 | $ 11.62 | $ 11.35 | $ 11.19 | ||||||||||||||||||
|
| |||||||||||||||||||||||
Total Return | ||||||||||||||||||||||||
Total investment return based on net asset value(c) | (1.49 | )% | (1.31 | )% | 9.52 | % | 4.27 | % | 4.22 | % | 7.52 | % | ||||||||||||
Ratios/Supplemental Data | ||||||||||||||||||||||||
Net assets, end of period (000’s omitted) | $12,259 | $13,802 | $16,800 | $11,701 | $13,501 | $17,706 | ||||||||||||||||||
Ratio to average net assets of: |
| |||||||||||||||||||||||
Expenses, net of waivers/reimbursements(d) | .70 | %^ | .67 | % | .72 | % | .73 | % | .72 | % | .71 | %+ | ||||||||||||
Expenses, before waivers/reimbursements(d) | .76 | %^ | .73 | % | .73 | % | .73 | % | .72 | % | .71 | %+ | ||||||||||||
Net investment income | 4.11 | %^(b) | 2.66 | %(b) | 1.97 | %(b) | 2.03 | % | 2.40 | % | 2.63 | %+ | ||||||||||||
Portfolio turnover rate | 4 | % | 6 | % | 11 | % | 4 | % | 21 | % | 4 | % | ||||||||||||
See footnote summary on page 82.
| 78 | • AB WEALTH STRATEGIES |
Financial Highlights
Selected Data For A Share Of Beneficial Interest Outstanding Throughout Each Period
| AB Conservative Wealth Strategy | ||||||||||||||||||||||||
| Class R | ||||||||||||||||||||||||
Six Months (unaudited) | Year Ended August 31, | |||||||||||||||||||||||
| 2015 | 2014 | 2013 | 2012 | 2011 | ||||||||||||||||||||
|
| |||||||||||||||||||||||
Net asset value, beginning of period | $ 12.15 | $ 12.42 | $ 11.60 | $ 11.37 | $ 11.19 | $ 10.67 | ||||||||||||||||||
|
| |||||||||||||||||||||||
Income From Investment Operations | ||||||||||||||||||||||||
Net investment income(a) | .22 | (b) | .25 | (b) | .19 | (b) | .15 | .22 | .21 | |||||||||||||||
Net realized and unrealized gain (loss) on investment transactions | (.43 | ) | (.50 | ) | .82 | .25 | .16 | .53 | ||||||||||||||||
|
| |||||||||||||||||||||||
Net increase (decrease) in net asset value from operations | (.21 | ) | (.25 | ) | 1.01 | .40 | .38 | .74 | ||||||||||||||||
|
| |||||||||||||||||||||||
Less: Dividends | ||||||||||||||||||||||||
Dividends from net investment income | (.21 | ) | (.02 | ) | (.19 | ) | (.17 | ) | (.20 | ) | (.22 | ) | ||||||||||||
|
| |||||||||||||||||||||||
Net asset value, end of period | $ 11.73 | $ 12.15 | $ 12.42 | $ 11.60 | $ 11.37 | $ 11.19 | ||||||||||||||||||
|
| |||||||||||||||||||||||
Total Return | ||||||||||||||||||||||||
Total investment return based on net asset value(c) | (1.72 | )% | (2.02 | )% | 8.84 | % | 3.53 | % | 3.46 | % | 6.93 | % | ||||||||||||
Ratios/Supplemental Data | ||||||||||||||||||||||||
Net assets, end of period (000’s omitted) | $4,176 | $5,632 | $7,237 | $7,280 | $8,059 | $15,068 | ||||||||||||||||||
Ratio to average net assets of: |
| |||||||||||||||||||||||
Expenses, net of waivers/reimbursements(d) | 1.33 | %^ | 1.34 | % | 1.39 | % | 1.39 | % | 1.39 | % | 1.39 | %+ | ||||||||||||
Expenses, before waivers/reimbursements(d) | 1.39 | %^ | 1.40 | % | 1.39 | % | 1.39 | % | 1.39 | % | 1.39 | %+ | ||||||||||||
Net investment income | 3.65 | %^(b) | 2.00 | %(b) | 1.54 | %(b) | 1.27 | % | 1.94 | % | 1.86 | %+ | ||||||||||||
Portfolio turnover rate | 4 | % | 6 | % | 11 | % | 4 | % | 21 | % | 4 | % | ||||||||||||
See footnote summary on page 82.
| AB WEALTH STRATEGIES • | 79 |
Financial Highlights
Selected Data For A Share Of Beneficial Interest Outstanding Throughout Each Period
| AB Conservative Wealth Strategy | ||||||||||||||||||||||||
| Class K | ||||||||||||||||||||||||
Six Months (unaudited) | Year Ended August 31, | |||||||||||||||||||||||
| 2015 | 2014 | 2013 | 2012 | 2011 | ||||||||||||||||||||
|
| |||||||||||||||||||||||
Net asset value, beginning of period | $ 12.15 | $ 12.41 | $ 11.57 | $ 11.32 | $ 11.16 | $ 10.65 | ||||||||||||||||||
|
| |||||||||||||||||||||||
Income From Investment Operations | ||||||||||||||||||||||||
Net investment income(a) | .22 | (b) | .27 | (b) | .24 | (b) | .18 | .20 | .23 | |||||||||||||||
Net realized and unrealized gain (loss) on investment transactions | (.42 | ) | (.49 | ) | .81 | .26 | .22 | .53 | ||||||||||||||||
|
| |||||||||||||||||||||||
Net increase (decrease) in net asset value from operations | (.20 | ) | (.22 | ) | 1.05 | .44 | .42 | .76 | ||||||||||||||||
|
| |||||||||||||||||||||||
Less: Dividends | ||||||||||||||||||||||||
Dividends from net investment income | (.25 | ) | (.04 | ) | (.21 | ) | (.19 | ) | (.26 | ) | (.25 | ) | ||||||||||||
|
| |||||||||||||||||||||||
Net asset value, end of period | $ 11.70 | $ 12.15 | $ 12.41 | $ 11.57 | $ 11.32 | $ 11.16 | ||||||||||||||||||
|
| |||||||||||||||||||||||
Total Return | ||||||||||||||||||||||||
Total investment return based on net asset value(c) | (1.64 | )% | (1.73 | )% | 9.22 | % | 3.91 | % | 3.82 | % | 7.18 | % | ||||||||||||
Ratios/Supplemental Data | ||||||||||||||||||||||||
Net assets, end of period (000’s omitted) | $7,949 | $8,204 | $8,611 | $8,519 | $9,039 | $7,684 | ||||||||||||||||||
Ratio to average net assets of: |
| |||||||||||||||||||||||
Expenses, net of waivers/reimbursements(d) | 1.04 | %^ | 1.01 | % | 1.08 | % | 1.07 | % | 1.05 | % | 1.08 | %+ | ||||||||||||
Expenses, before waivers/reimbursements(d) | 1.10 | %^ | 1.07 | % | 1.08 | % | 1.07 | % | 1.05 | % | 1.08 | %+ | ||||||||||||
Net investment income | 3.61 | %^(b) | 2.19 | %(b) | 1.97 | %(b) | 1.58 | % | 1.82 | % | 2.05 | %+ | ||||||||||||
Portfolio turnover rate | 4 | % | 6 | % | 11 | % | 4 | % | 21 | % | 4 | % | ||||||||||||
See footnote summary on page 82.
| 80 | • AB WEALTH STRATEGIES |
Financial Highlights
Selected Data For A Share Of Beneficial Interest Outstanding Throughout Each Period
| AB Conservative Wealth Strategy | ||||||||||||||||||||||||
| Class I | ||||||||||||||||||||||||
Six Months (unaudited) | Year Ended August 31, | |||||||||||||||||||||||
| 2015 | 2014 | 2013 | 2012 | 2011 | ||||||||||||||||||||
|
| |||||||||||||||||||||||
Net asset value, beginning of period | $ 12.21 | $ 12.46 | $ 11.60 | $ 11.33 | $ 11.17 | $ 10.66 | ||||||||||||||||||
|
| |||||||||||||||||||||||
Income From Investment Operations | ||||||||||||||||||||||||
Net investment income(a) | .24 | (b) | .41 | (b) | .31 | (b) | .23 | .35 | .28 | |||||||||||||||
Net realized and unrealized gain (loss) on investment transactions | (.42 | ) | (.59 | ) | .78 | .25 | .11 | .52 | ||||||||||||||||
|
| |||||||||||||||||||||||
Net increase (decrease) in net asset value from operations | (.18 | ) | (.18 | ) | 1.09 | .48 | .46 | .80 | ||||||||||||||||
|
| |||||||||||||||||||||||
Less: Dividends | ||||||||||||||||||||||||
Dividends from net investment income | (.28 | ) | (.07 | ) | (.23 | ) | (.21 | ) | (.30 | ) | (.29 | ) | ||||||||||||
|
| |||||||||||||||||||||||
Net asset value, end of period | $ 11.75 | $ 12.21 | $ 12.46 | $ 11.60 | $ 11.33 | $ 11.17 | ||||||||||||||||||
|
| |||||||||||||||||||||||
Total Return | ||||||||||||||||||||||||
Total investment return based on net asset value(c) | (1.51 | )% | (1.41 | )% | 9.54 | % | 4.26 | % | 4.19 | % | 7.49 | % | ||||||||||||
Ratios/Supplemental Data | ||||||||||||||||||||||||
Net assets, end of period (000’s omitted) | $450 | $454 | $538 | $874 | $1,118 | $2,868 | ||||||||||||||||||
Ratio to average net assets of: |
| |||||||||||||||||||||||
Expenses, net of waivers/reimbursements(d) | .72 | %^ | .70 | % | .75 | % | .75 | % | .73 | % | .74 | %+ | ||||||||||||
Expenses, before waivers/reimbursements(d) | .78 | %^ | .76 | % | .75 | % | .75 | % | .73 | % | .74 | %+ | ||||||||||||
Net investment income | 3.96 | %^(b) | 3.32 | %(b) | 2.56 | %(b) | 1.98 | % | 3.04 | % | 2.45 | %+ | ||||||||||||
Portfolio turnover rate | 4 | % | 6 % | 11 | % | 4 | % | 21 | % | 4 | % | |||||||||||||
See footnote summary on page 82.
| AB WEALTH STRATEGIES • | 81 |
Financial Highlights
| (a) | Based on average shares outstanding. |
| (b) | Net of fees and expenses waived/reimbursed by the Adviser. |
| (c) | Total investment return is calculated assuming an initial investment made at the net asset value at the beginning of the period, reinvestment of all dividends and distributions at net asset value during the period, and redemption on the last day of the period. Initial sales charges or contingent deferred sales charges are not reflected in the calculation of total investment return. Total return does not reflect the deduction of taxes that a shareholder would pay on Strategy distributions or the redemption of Strategy shares. Total investment return calculated for a period of less than one year is not annualized. |
| (d) | Expense ratios do not include expenses of the AB Pooling Portfolios and MMAS in which the Strategy invests. For the periods shown below, the estimated annualized blended expense ratios of the AB Pooling Portfolios and MMAS including interest expense were as follows: |
Six Months Ended February 29, 2016 (unaudited) | Year Ended August 31, | |||||||||||||||||||||||
| 2015 | 2014 | 2013 | 2012 | 2011 | ||||||||||||||||||||
|
| |||||||||||||||||||||||
AB Wealth Appreciation Strategy | .39 | %^ | .38 | % | .05 | % | .04 | % | .03 | % | .03 | % | ||||||||||||
AB Balanced Wealth Strategy | .29 | %^ | .27 | % | .05 | % | .04 | % | .03 | % | .03 | % | ||||||||||||
AB Conservative Wealth Strategy | .22 | %^ | .21 | % | .04 | % | .03 | % | .03 | % | .03 | % | ||||||||||||
| (e) | Amount is less than $.005 |
| ^ | Annualized. |
| + | The ratio includes expenses attributable to costs of proxy solicitation. |
See notes to financial statements.
| 82 | • AB WEALTH STRATEGIES |
Financial Highlights
TRUSTEES
Marshall C. Turner, Jr.(1), Chairman John H. Dobkin(1) Michael J. Downey(1) William H. Foulk, Jr.(1) D. James Guzy(1) | Nancy P. Jacklin(1) Robert M. Keith, President and Chief Executive Officer Garry L. Moody(1) Earl D. Weiner(1) | |
| OFFICERS | ||
Philip L. Kirstein, Senior Vice President and Independent Compliance Officer Daniel J. Loewy(2), Vice President Christopher H. Nikolich(2), Vice President Vadim Zlotnikov(2), Vice President | Emilie D. Wrapp, Clerk Joseph J. Mantineo, Treasurer and Chief Financial Officer Phyllis J. Clarke, Controller and Chief Accounting Officer Vincent S. Noto, Chief Compliance Officer | |
Custodian and Accounting Agent State Street Bank and Trust Company
Principal Underwriter AllianceBernstein Investments, Inc.
Legal Counsel Seward & Kissel LLP | Transfer Agent AllianceBernstein Investor
Independent Registered Public Accounting Firm Ernst & Young LLP |
| (1) | Member of the Audit Committee, the Governance and Nominating Committee and the Independent Directors Committee. |
| (2) | The day-to-day management of, and investment decisions for, each Strategy’s portfolio are made by the Adviser’s Multi-Asset Solutions Team. Messrs. Loewy, Nikolich and Zlotnikov are the investment professionals primarily responsible for the day-to-day management of each Strategy’s portfolio. |
| AB WEALTH STRATEGIES • | 83 |
Trustees
THE FOLLOWING IS NOT PART OF THE SHAREHOLDER REPORT OR THE FINANCIAL STATEMENTS
SUMMARY OF SENIOR OFFICER’S EVALUATION OF INVESTMENT ADVISORY AGREEMENT1
The following is a summary of the evaluation of the Investment Advisory Agreement between AllianceBernstein L.P. (the “Adviser”) and The AB Portfolios (the “Trust”) in respect of AB Balanced Wealth Strategy, AB Wealth Appreciation Strategy and AB Conservative Wealth Strategy (each a “Strategy” and collectively the “Strategies”),2 prepared by Philip L. Kirstein, the Senior Officer of the Trust, for the Board of Trustees, as required by the August 2004 agreement between the Adviser and the New York State Attorney General (the “NYAG”). The Senior Officer’s evaluation of the Investment Advisory Agreement is not meant to diminish the responsibility or authority of the Board of Trustees of the Trust to perform its duties pursuant to Section 15 of the Investment Company Act of 1940 (the “40 Act”) and applicable state law. The purpose of the summary is to provide shareholders with a synopsis of the independent evaluation of the reasonableness of the advisory fees proposed to be paid by the Strategies which was provided to the Trustees in connection with their review of the proposed approval of the continuance of the Investment Advisory Agreement.
The Strategies seek to achieve their investment objectives by investing in a combination of the AB Pooling Portfolios (the “Pooling Portfolios”),3 which represent a variety of asset classes and investment styles, and AB Multi-Manager Alternative Strategies Fund (“MMAS”). As a result, certain expenses will be minimal, such as custodian charges, or non-existent, such as brokerage commissions, except as incurred indirectly through the Pooling Portfolios.
The Senior Officer’s evaluation considered the following factors:
| 1. | Advisory fees charged to institutional and other clients of the Adviser for like services; |
| 2. | Advisory fees charged by other mutual fund companies for like services; |
| 1 | The information in the fee evaluation was completed on July 23, 2015 and discussed with the Board of Trustees on August 4-5, 2015. |
| 2 | Future references to the Strategies do not include “AB.” References in the fee summary pertaining to performance and expense ratios refer to Class A shares of the Strategies. |
| 3 | The AB Pooling Portfolios include U.S. Value Portfolio, U.S. Large Cap Growth Portfolio, Multi-Asset Real Return Portfolio, International Value Portfolio, International Growth Portfolio, Small-Mid Cap Value Portfolio, Small-Mid Cap Growth Portfolio, Short Duration Bond Portfolio, Global Core Bond Portfolio, Bond Inflation Protection Portfolio, High Yield Portfolio and Volatility Management Portfolio. |
| 84 | • AB WEALTH STRATEGIES |
| 3. | Costs to the Adviser and its affiliates of supplying services pursuant to the advisory agreement, excluding any intra-corporate profit; |
| 4. | Profit margins of the Adviser and its affiliates from supplying such services; |
| 5. | Possible economies of scale as the Strategies grows larger; and |
| 6. | Nature and quality of the Adviser’s services including the performance of the Strategies. |
These factors, with the exception of the first factor, are generally referred to as the “Gartenberg factors,” which were articulated by the United States Court of Appeals for the Second Circuit in 1982. Gartenberg v. Merrill Lynch Asset Management, Inc., 694 F. 2d 923 (2d Cir. 1982). On March 30, 2010, the Supreme Court held the Gartenberg decision was correct in its basic formulation of what Section 36(b) requires: to face liability under Section 36(b), “an investment adviser must charge a fee that is so disproportionately large that it bears no reasonable relationship to the services rendered and could not have been the product of arm’s length bargaining.”Jones v. Harris Associates L.P., 130 S. Ct. 1418 (2010). In Jones, the Court stated the Gartenberg approach fully incorporates the correct understanding of fiduciary duty within the context of Section 36(b) and noted with approval that “Gartenberg insists that all relevant circumstances be taken into account” and “uses the range of fees that might result from arm’s length bargaining as the benchmark for reviewing challenged fees.”4
ADVISORY FEES, NET ASSETS, & EXPENSE RATIOS
The Adviser proposed that each Strategy pays the advisory fee set forth in the table below for receiving the services to be provided pursuant to the Investment Advisory Agreement. The fee schedule below, implemented in January 2004 in consideration of the Adviser’s settlement with the NYAG in December 2003, is based on a master schedule that contemplates eight categories of funds with almost all funds in each category having the same advisory fee schedule.5
In connection with the Strategies’ investments in MMAS, the Adviser will waive its advisory fee from each Strategy in an amount equal to the portion of the MMAS management fee that the Adviser retains—i.e., does not pay to MMAS’ sub-advisers. Specifically, MMAS’ management fee is 1.90%, and out of this fee, the Adviser will generally pay the sub-advisers a fee of 1.00%. Accordingly, the fee rate payable by each Strategy in respect of its assets invested in MMAS would be reduced by approximately 0.90%. The Adviser will also waive other MMAS
| 4 | Jones v. Harris at 1427. |
| 5 | Most of the AB Mutual Funds, which the Adviser manages, were affected by the Adviser’s settlement with the NYAG. |
| AB WEALTH STRATEGIES • | 85 |
fees and operating expenses until December 31, 2015.6 The shareholders of the Strategies will indirectly bear their proportionate share of the portion of the management fee that is paid to the sub-advisers as well as other MMAS expenses. To the extent that a sub-advisory fee is greater or less than the 1.00% rate agreed to by all of the proposed initial MMAS sub-advisers, the amount of the advisory fee retained by the Adviser and, therefore, the amount of the Adviser’s fee waiver would change. In addition to the foregoing, the Adviser intends to waive additional fees payable by the Strategies for a period of at least one year in order to eliminate the expense ratio impact of MMAS’ non-advisory other fees and expenses.
| Category | Advisory Fees Based on a percentage of | Net 6/30/15 ($MIL) | Strategy | |||||
| Balanced | 0.55% on 1st $2.5 billion 0.45% on next $2.5 billion 0.40% on the balance | $ | 1,206.5 | Balanced Wealth Strategy | ||||
| Blend | 0.65% on 1st $2.5 billion 0.55% on next $2.5 billion 0.50% on the balance | $ | 1,485.4 | Wealth Appreciation Strategy | ||||
| Balanced | 0.55% on 1st $2.5 billion 0.45% on next $2.5 billion 0.40% on the balance | $ | 333.9 | Conservative Wealth Strategy | ||||
With respect to the Wealth Appreciation Strategy, the Investment Advisory Agreement was amended on January 6, 2011 to permit reimbursement to the Adviser for certain clerical, legal, accounting, administrative, and other expenses. In May 2015, the Board authorized reimbursement payments under these provisions for the first time. The Investment Advisory Agreement for Balanced Wealth Strategy and Conservative Wealth Strategy does not provide for reimbursements to the Adviser for the above described expenses.
| 6 | The impact of the other MMAS fees and operating expenses waiver for each Wealth Strategy will range up to 1 basis point, depending on the size of the Wealth Strategy. |
| 86 | • AB WEALTH STRATEGIES |
Set forth below are the annualized total expense ratios of the Strategies for the most recent semi-annual period:7,8
| Total Expense Ratio9 | Acquired Fund Fees and Expenses | Fiscal Year End | ||||||||||||||
| Strategy | Net | Gross | ||||||||||||||
| Balanced Wealth Strategy10 | Class A Class B Class C Advisor Class R Class K Class I |
| 1.11 1.87 1.87 0.86 1.52 1.21 0.88 | % % % % % % % |
| 1.19 1.95 1.95 0.94 1.60 1.29 0.96 | % % % % % % % |
| 0.25 0.25 0.25 0.25 0.25 0.25 0.25 | % % % % % % % | August 31 (ratios as of February 28, 2015) | |||||
| Wealth Appreciation Strategy10 | Class A Class B Class C Advisor Class R Class K Class I |
| 1.24 2.00 1.99 0.99 1.67 1.36 1.03 | % % % % % % % |
| 1.36 2.12 2.11 1.11 1.79 1.48 1.14 | % % % % % % % |
| 0.35 0.35 0.35 0.35 0.35 0.35 0.35 | % % % % % % % | August 31 (ratios as of February 28, 2015) | |||||
| Conservative Wealth Strategy10 | Class A Class B Class C Advisor Class R Class K Class I |
| 1.12 1.87 1.87 0.87 1.53 1.22 0.89 | % % % % % % % |
| 1.18 1.93 1.93 0.93 1.59 1.28 0.95 | % % % % % % % |
| 0.19 0.19 0.19 0.19 0.19 0.19 0.19 | % % % % % % % | August 31 (ratios as of February 28, 2015) | |||||
| I. | ADVISORY FEES CHARGED TO INSTITUTIONAL AND OTHER CLIENTS |
The advisory fees charged to investment companies which the Adviser manages and sponsors are normally higher than those charged to similar sized institutional accounts, including pension plans and sub-advised investment companies. The fee differential reflects, among other things, different services provided to such clients, and different liabilities assumed. Services provided by the Adviser to the Strategies that are not provided to non-investment company clients and sub-advised investment companies include providing office space and personnel to serve as Fund Officers, who among other responsibilities make the certifications required under the Sarbanes–Oxley Act of 2002, and coordinating with and
| 7 | The expense ratios include expenses of the underlying Pooling Portfolios and MMAS in which the Strategies invest. With respect to Balanced Wealth Strategy, Wealth Appreciation Strategy and Conservative Wealth Strategy, for the six-month period ended February 28, 2013, the estimated annualized acquired fund fees and expenses related to the Pooling Portfolios were 0.04%, 0.04% and 0.03%, respectively. |
| 8 | Semi-annual total expense ratios are unaudited. |
| 9 | Includes acquired fund fees and expenses. |
| 10 | The semi-annual total expense ratio for the Fund’s Class A shares reflects the reduction in 12b-1 fees from 0.30% to 0.25% effective August 1, 2014. |
| AB WEALTH STRATEGIES • | 87 |
monitoring the Strategies’ third party service providers such as Fund counsel, auditors, custodians, transfer agents and pricing services. The accounting, administrative, legal and compliance requirements for the Strategies are more costly than those for institutional assets due to the greater complexities and time required for investment companies. Also, retail mutual funds managed by the Adviser are widely held. Servicing the Strategies’ investors is more time consuming and labor intensive compared to institutional clients since the Adviser needs to communicate with a more extensive network of financial intermediaries and shareholders. The Adviser also believes that it incurs substantial entrepreneurial risk when offering a new mutual fund since establishing a new mutual fund requires a large upfront investment and it may take a long time for the fund to achieve profitability since the fund must be priced to scale from inception in order to be competitive and assets are acquired one account at a time. In addition, managing the cash flow of an investment company may be more difficult than managing that of a stable pool of assets, such as an institutional account with little cash movement in either direction, particularly, if a fund is in net redemption and the Adviser is frequently forced to sell securities to raise cash for redemptions. However, managing a fund with positive cash flow may be easier at times than managing a stable pool of assets. Finally, in recent years, investment advisers have been sued by institutional clients and have suffered reputational damage both by the attendant publicity and outcomes other than complete victories. Accordingly, the legal and reputational risks associated with institutional accounts are greater than previously thought, although still not equal to those related to the mutual fund industry.
Notwithstanding the Adviser’s view that managing an investment company is not comparable to managing other institutional accounts because the services provided are different, the Supreme Court has indicated consideration should be given to the advisory fees charged to institutional accounts with a similar investment style as the Strategies.11 However, the Adviser represented that there are no categories in the Form ADV for institutional products that have a substantially similar investment style as any of the Strategies.
The AB Variable Products Series Fund, Inc. (“AVPS”), which is managed by the Adviser and is available through variable annuity and variable life contracts offered by other financial institutions, offers policyholders the option to utilize certain AVPS portfolios as the investment option underlying their insurance
| 11 | The Supreme Court stated that “courts may give such comparisons the weight that they merit in light of the similarities and differences between the services that the clients in question require, but the courts must be wary of inapt comparisons.” Among the significant differences the Supreme Court noted that may exist between services provided to mutual funds and institutional accounts are “higher marketing costs.” Jones v. Harris at 1428. |
| 88 | • AB WEALTH STRATEGIES |
contracts. Set forth below is the fee schedule of AVPS – Balanced Wealth Strategy Portfolio, which has a similar investment style as Balanced Wealth Strategy.12
| Strategy | AVPS Portfolio | Fee Schedule | ||
| Balanced Wealth Strategy | Balanced Wealth Strategy Portfolio | 0.55% on first $2.5 billion 0.45% on next $2.5 billion 0.40% Excess of $5 billion |
The AB Investment Trust Management mutual funds (“ITM”), which are offered to investors in Japan, have an “all-in” fee to compensate the Adviser for investment advisory as well as fund accounting and administrative services, but not for distribution-related services. The fee schedules of the ITM mutual funds that have a somewhat similar investment style as the Strategies are as follows:
| Strategy | ITM Mutual Fund | Fee | ||
| Balanced Wealth Strategy | Alliance Global Balanced – Neutral | 0.70% | ||
| Wealth Appreciation Strategy | Alliance Global Balanced – Aggressive | 0.75% | ||
| Conservative Wealth Strategy | Alliance Global Balanced – Conservative | 0.65% |
The Adviser represented that it does not provide any sub-advisory investment services to other investment companies that have a substantially similar investment style as the Strategies.
| II. | MANAGEMENT FEES CHARGED BY OTHER MUTUAL FUND COMPANIES FOR LIKE SERVICES. |
Lipper, Inc. (“Lipper”), an analytical service that is not affiliated with the Adviser, compared the fees charged to the Strategies with fees charged to other investment companies for similar services offered by other investment advisers.13 Lipper’s analysis included the comparison of each Strategy’s contractual management fee, estimated at the approximate current asset level of the Strategy,
| 12 | The AVPS portfolio was also affected by the settlement between the Adviser and the NYAG. As a result, Balanced Wealth Strategy has the same breakpoints in its advisory fee schedule as the AVPS portfolio. |
| 13 | The Supreme Court cautioned against accepting mutual fund fee comparisons without careful scrutiny since “these comparisons are problematic because these fees, like those challenged, may not be the product of the negotiations conducted at arm’s-length.” Jones v. Harris at 1429. |
| AB WEALTH STRATEGIES • | 89 |
to the median of the Strategy’s Lipper Expense Group (“EG”)14 and the Strategy’s contractual management fee ranking.15
Lipper describes an EG as a representative sample of comparable funds. Lipper’s standard methodology for screening funds to be included in an EG entails the consideration of several fund criteria, including fund type, investment classification/objective, load type and similar 12b-1/non-12b-1 service fees, asset (size) comparability, expense components, operating structure, and expense attributes. An EG will typically consist of seven to twenty funds.
The original EGs for Balanced Wealth Strategy and Wealth Appreciation Strategy had an insufficient number of peers in the view of the Senior Officer and the Adviser. Consequently, Lipper expanded the Strategies’ EGs to include peers that have a similar but not the same Lipper investment classification/objective.
| Strategy | Contractual Management Fee (%)16 | Lipper EG Median (%) | Lipper EG Rank | |||||||
| Balanced Wealth Strategy17 | 0.550 | 0.638 | 5/15 | |||||||
| Wealth Appreciation Strategy18 | 0.650 | 0.650 | 7/13 | |||||||
| Conservative Wealth Strategy | 0.550 | 0.610 | 4/10 | |||||||
However, because Lipper had expanded the EGs of Balanced Wealth Strategy and Wealth Appreciation Strategy, under Lipper’s standard guidelines, the Lipper Expense Universes (“EUs”) for these Strategies were also expanded to include the universe of those peers that had a similar but not the same Lipper investment classification/objective. A “normal” EU will include funds that have the same investment classification/objective as the subject Strategy.19
| 14 | Lipper does not consider average account size when constructing EGs. Funds with relatively small average account sizes tend to have higher transfer agent expense ratio than comparable sized funds that have relatively large average account sizes. There are limitations to Lipper expense category data because different funds categorize expenses differently. |
| 15 | The contractual management fee is calculated by Lipper using each Strategy’s contractual management fee rate at a hypothetical asset level. The hypothetical asset level is based on the combined net assets of all classes of each Strategy, rounded up to the next $25 million. Lipper’s total expense ratio information is based on the most recent annual report except as otherwise noted. A ranking of “1” would mean that the Strategy had the lowest effective fee rate in the Lipper peer group. |
| 16 | The contractual management fee does not reflect any advisory fee waiver or expense reimbursements for expense caps that would effectively reduce the actual management fee. |
| 17 | The Strategy’s EG includes the Strategy, six other Mixed-Asset Target Allocation Moderate (“MTAM”) funds and eight Mixed-Asset Target Allocation Growth (“MTAG”) funds. |
| 18 | The Strategy’s EG includes the Strategy, which is a MTAA fund, and 12 MTAG funds. |
| 19 | Except for asset (size) comparability, Lipper uses the same criteria for selecting an EG peer when selecting an EU peer. Unlike the EG, the EU allows for the same adviser to be represented by more than just one fund. |
| 90 | • AB WEALTH STRATEGIES |
Set forth below is a comparison of the Strategies’ total expense ratios and the medians of the Strategies’ EGs and EUs. To reflect the Strategies’ investment in MMAS, the Strategies’ total expense ratios shown are for semi-annual period ending February 28, 2015.
| Strategy | Expense Ratio (%)20 | Lipper EG Median (%) | Lipper EG Rank | Lipper EU Median (%) | Lipper EU Rank | |||||||||||
| Balanced Wealth Strategy21 | 1.113 | 1.113 | 8/15 | 1.157 | 29/74 | |||||||||||
| Wealth Appreciation Strategy22 | 1.237 | 1.165 | 12/13 | 1.173 | 26/37 | |||||||||||
| Conservative Wealth Strategy | 1.120 | 1.068 | 8/10 | 1.069 | 20/27 | |||||||||||
Based on this analysis, the Strategies have a more favorable ranking on a contractual management fee basis than on a total expense ratio basis.
| III. | COSTS TO THE ADVISER AND ITS AFFILIATES OF SUPPLYING SERVICES PURSUANT TO THE MANAGEMENT FEE ARRANGEMENT, EXCLUDING ANY INTRA-CORPORATE PROFIT. |
The Adviser utilizes two profitability reporting systems, which operate independently but are aligned with each other, to estimate the Adviser’s profitability in connection with investment advisory services provided to the Strategies. The Senior Officer has retained a consultant to provide independent advice regarding the alignment of the two profitability systems as well as the methodologies and allocations utilized by both profitability systems. See Section IV for additional discussion.
| IV. | PROFIT MARGINS OF THE ADVISER AND ITS AFFILIATES FOR SUPPLYING SUCH SERVICES. |
The Strategies’ profitability information, prepared by the Adviser for the Board of Trustees, was reviewed by the Senior Officer and the consultant. The Adviser’s profitability from providing investment advisory services to the Strategies decreased during calendar year 2014, relative to 2013.
In addition to the Adviser’s direct profits from managing the Strategies, certain of the Adviser’s affiliates have business relationships with the Strategies and may earn a profit from providing other services to the Strategies. The courts have referred to this type of business opportunity as “fall-out benefits” to the Adviser
| 20 | The Class A shares total expense ratio shown for each Strategy is for the semi-annual period ending February 28, 2015. |
| 21 | The Strategy’s EU includes the Strategy, the EG, and all other retail front-end MTAM and MTAG funds, excluding outliers. |
| 22 | The Strategy’s EU includes the Strategy, the EG and all other MTAG funds, excluding outliers. |
| AB WEALTH STRATEGIES • | 91 |
and indicated that such benefits should be factored into the evaluation of the total relationship between the Strategies and the Adviser. Neither case law nor common business practice precludes the Adviser’s affiliates from earning a reasonable profit on this type of relationship provided the affiliates’ charges and services are competitive and the relationship otherwise complies with the 40 Act restrictions. These affiliates provide transfer agent, distribution and brokerage related services to the Strategies and/or the Pooling Portfolios and receive transfer agent fees, Rule 12b-1 payments, front-end sales loads, contingent deferred sales charges (“CDSC”) and brokerage commissions. In addition, the Adviser benefits from soft dollar arrangements which offset expenses the Adviser would otherwise incur.
AB Investments, Inc. (“ABI”), an affiliate of the Adviser, is the Trust’s principal underwriter. ABI and the Adviser have disclosed in the Strategies’ prospectus that they may make revenue sharing payments from their own resources, in addition to resources derived from sales loads and Rule 12b-1 fees, to firms that sell shares of the Strategies. In 2014, ABI paid approximately 0.05% of the average monthly assets of the AB Mutual Funds or approximately $20.4 million for distribution services and educational support (revenue sharing payments).
ABI retained the following front-end load sales charges from sales of the Strategies’ Class A shares during the Strategies’ most recently completed fiscal year:
| Strategy | Amount Received | |||
| Balanced Wealth Strategy | $ | 47,168 | ||
| Wealth Appreciation Strategy | $ | 22,635 | ||
| Conservative Wealth Strategy | $ | 11,262 | ||
ABI received the amounts set forth below in Rule 12b-1 fees and CDSC fees from the Strategies during the Strategies’ most recently completed fiscal year:
| Strategy | 12b-1 Fees Received | CDSC Received | ||||||
| Balanced Wealth Strategy | $ | 6,593,325 | $ | 36,597 | ||||
| Wealth Appreciation Strategy | $ | 3,354,986 | $ | 22,326 | ||||
| Conservative Wealth Strategy | $ | 2,146,607 | $ | 10,089 | ||||
Fees and reimbursements for out of pocket expenses charged by AB Investor Services, Inc. (“ABIS”), the affiliated transfer agent for the Strategies are based on the level of the network account and the class of shares held by the account. ABIS also receives a fee per shareholder sub-account for each account maintained by an intermediary on an omnibus basis. ABIS received the following net fees from the Strategies during the most recently completed fiscal year:
| Strategy | ABIS Fee | |||
| Balanced Wealth Strategy | $ | 521,597 | ||
| Wealth Appreciation Strategy | $ | 541,791 | ||
| Conservative Wealth Strategy | $ | 143,136 | ||
| 92 | • AB WEALTH STRATEGIES |
There are no portfolio transactions for the Strategies since the Strategies pursue their investment objectives through investing in combinations of the Pooling Portfolios. However, the Pooling Portfolios do engage in portfolio transactions. Multi-Asset Real Return Portfolio, International Value Portfolio, Small-Mid Cap Growth Portfolio and MMAS effected brokerage transactions through the Adviser’s affiliate, Sanford C. Bernstein & Co., LLC (“SCB & Co.”) and/or its U.K. affiliate, Sanford C. Bernstein Limited (“SCB Ltd.”), collectively “SCB,” and pay commissions for such transactions during the Pooling Portfolios’ most recently completed fiscal year. The Adviser represented that SCB’s profitability from business conducted with the Pooling Portfolios is comparable to the profitability of SCB’s dealings with other similar third party clients. In the ordinary course of business, SCB receives and pays liquidity rebates from electronic communications networks (“ECNs”) derived from trading for its clients. These credits and charges are not being passed onto any SCB client. The Adviser also receives certain soft dollar benefits from brokers that execute agency trades for its clients. These soft dollar benefits reduce the Adviser’s cost of doing business and increase its profitability.
| V. | POSSIBLE ECONOMIES OF SCALE |
The Adviser has indicated that economies of scale are being shared with shareholders through pricing to scale, breakpoints, fee reductions/waivers and enhancement to services.
In May 2012, an independent consultant, retained by the Senior Officer, provided the Board of Trustees information on the Adviser’s firm-wide average costs from 2005 through 2011 and the potential economies of scale. The independent consultant noted that from 2005 through 2007 the Adviser experienced significant growth in assets under management (“AUM”). During this period, operating expenses increased, in part to keep up with growth, and in part reflecting market returns. However, from 2008 through the first quarter of 2009, AUM rapidly and significantly decreased due to declines in market value and client withdrawals. When AUM rapidly decreased, some operating expenses categories, including base compensation and office space, adjusted more slowly during this period, resulting in an increase in average costs. Since 2009, AUM has experienced less significant changes. The independent consultant noted that changes in operating expenses reflect changes in business composition and business practices in response to changes in financial markets. Finally, the independent consultant concluded that the increase in average cost and the decline in net operating margin across the Adviser since late 2008 are inconsistent with the view that there are currently reductions in average costs due to economies of scale that can be shared with the AB Mutual Funds managed by the Adviser through lower fees.
| AB WEALTH STRATEGIES • | 93 |
Previously, in February 2008, the independent consultant provided the Board of Trustees an update of the Deli23 study on advisory fees and various fund characteristics.24 The independent consultant first reiterated the results of his previous two dimensional comparison analysis (fund size and family size) with the Board of Trustees.25 The independent consultant then discussed the results of the regression model that was utilized to study the effects of various factors on advisory fees. The regression model output indicated that the bulk of the variation in fees predicted were explained by various factors, but substantially by fund AUM, family AUM, index fund indicator and investment style. The independent consultant also compared the advisory fees of the AB Mutual Funds to similar funds managed by 19 other large asset managers, regardless of the fund size and each Adviser’s proportion of mutual fund assets to non-mutual fund assets.
| VI. | NATURE AND QUALITY OF THE ADVISER’S SERVICES, INCLUDING THE PERFORMANCE OF THE FUND |
With assets under management of approximately $485 billion as of June 30, 2015, the Adviser has the investment experience to manage and provide non-investment services (described in Section I) to the Strategies.
The information prepared by Lipper shows the 1, 3, 5 and 10 year performance rankings26 of the Strategies relative to their Lipper Performance Group (“PG”) and Lipper Performance Universe (“PU”)27 for the periods ended May 31, 2015.28
| 23 | The Deli study, originally published in 2002 based on 1997 data and updated for the February 2008 Presentation, may be of diminished value due to the age of the data used in the presentation and the changes experienced in the industry since 2008. |
| 24 | The Supreme Court cautioned against accepting mutual fund fee comparisons without careful scrutiny since the fees may not be the product of negotiations conducted at arm’s length. See Jones v. Harris at 1429. |
| 25 | The two dimensional analysis showed patterns of lower advisory fees for funds with larger asset sizes and funds from larger family sizes compared to funds with smaller asset sizes and funds from smaller family sizes, which according to the independent consultant is indicative of a sharing of economies of scale and scope. However, in less liquid and active markets, such is not the case, as the empirical analysis showed potential for diseconomies of scale in those markets. The empirical analysis also showed diminishing economies of scale and scope as funds surpassed a certain high level of assets. |
| 26 | The performance returns and rankings of the Strategies are for the Strategies’ Class A shares. The performance returns of the Strategies were provided by Lipper. |
| 27 | A Strategy’s PG/PU may not necessarily be identical to its respective EG/EU. Strategies with negative management fees are excluded from EGs/EUs but not necessarily from PGs/PUs. In addition, PGs/PUs only include strategies of the same Lipper investment classification/objective as the Strategies, in contrast to certain of the Strategies’ EGs/EUs, which may include strategies of similar but not the same investment classification/objective. |
| 28 | Lipper investment classification/objective dictates the PG and PU throughout the life of each Strategy even if a Strategy had a different investment classification/objective at a different point in time. |
| 94 | • AB WEALTH STRATEGIES |
| Strategy | Fund Return | PG Median (%) | PU Median (%) | PG Rank | PU Rank | |||||||||||||||
| Balanced Wealth Strategy | ||||||||||||||||||||
1 year | 4.45 | 4.45 | 4.88 | 4/7 | 58/103 | |||||||||||||||
3 year | 10.86 | 11.01 | 10.42 | 5/7 | 43/100 | |||||||||||||||
5 year | 8.78 | 10.65 | 9.33 | 7/7 | 57/85 | |||||||||||||||
10 year | 5.51 | 6.69 | 5.96 | 5/6 | 42/64 | |||||||||||||||
| Wealth Appreciation Strategy29 | ||||||||||||||||||||
1 year | 5.38 | N/A | 7.09 | 1/1 | 23/29 | |||||||||||||||
3 year | 15.26 | N/A | 15.85 | 1/1 | 18/29 | |||||||||||||||
5 year | 10.76 | N/A | 12.32 | 1/1 | 23/25 | |||||||||||||||
10 year | 5.22 | N/A | 6.61 | 1/1 | 17/17 | |||||||||||||||
| Conservative Wealth Strategy | ||||||||||||||||||||
1 year | 3.13 | 3.44 | 2.94 | 8/10 | 34/76 | |||||||||||||||
3 year | 5.96 | 7.90 | 7.08 | 8/10 | 48/72 | |||||||||||||||
5 year | 5.55 | 7.94 | 7.03 | 9/9 | 51/65 | |||||||||||||||
10 year | 4.21 | 5.52 | 5.23 | 7/7 | 32/39 | |||||||||||||||
Set forth below are the 1, 3, 5, 10 year and since inception performance returns of the Strategies (in bold) versus their benchmarks for the periods ending May 31, 2015. Performance returns for the 10 month period ending May 31, 2015 are shown for the Wealth Strategies to show their performance since MMAS commenced operations.30
| Periods Ending May 31, 2015 Annualized Net Performance (%) | ||||||||||||||||||||||||
10 Month (%)31 | 1 Year (%) | 3 Year (%) | 5 Year (%) | 10 Year (%) | Since (%) | |||||||||||||||||||
| Balanced Wealth Strategy | 4.38 | 4.46 | 10.86 | 8.78 | 5.51 | 6.18 | ||||||||||||||||||
| 65% S&P 500 / 35% Barclays Capital U.S. Aggregate Index | 8.38 | 8.77 | 13.38 | 12.18 | 7.16 | 7.57 | ||||||||||||||||||
| S&P 500 Index | 11.08 | 11.81 | 19.67 | 16.54 | 8.12 | 8.54 | ||||||||||||||||||
| Barclays Capital U.S. Aggregate Index | 3.24 | 3.03 | 2.21 | 3.90 | 4.61 | 4.76 | ||||||||||||||||||
| Inception Date: September 2, 2003 | ||||||||||||||||||||||||
| Wealth Appreciation Strategy | 5.52 | 5.38 | 15.26 | 10.76 | 5.22 | 6.20 | ||||||||||||||||||
| 60% S&P 500 Index / 40% MSCI ACWI Ex USA Net Index | 5.94 | 6.65 | 16.88 | 13.18 | 7.39 | 8.68 | ||||||||||||||||||
| S&P 500 Index | 11.08 | 11.81 | 19.67 | 16.54 | 8.12 | 8.54 | ||||||||||||||||||
| MSCI ACWI Ex USA Net Index | -1.56 | -0.90 | 12.61 | 8.09 | 6.04 | 8.23 | ||||||||||||||||||
| Inception Date: September 2, 2003 | ||||||||||||||||||||||||
| 29 | The Strategy’s PG is omitted since the Strategy has no PG peers. Generally, a PG will consist of EG peers of the same Lipper investment classification/objective as the subject Strategy. |
| 30 | The performance returns are for the Class A shares of the Strategies. Strategy and benchmark performance return information was provided by the Adviser. |
| 31 | The 10 month returns, which are not annualized, are shown to indicate the Wealth Strategies’ performance for the period since they began investing in MMAS. |
| AB WEALTH STRATEGIES • | 95 |
| Periods Ending May 31, 2015 Annualized Net Performance (%) | ||||||||||||||||||||||||
10 Month (%)31 | 1 Year (%) | 3 Year (%) | 5 Year (%) | 10 Year (%) | Since (%) | |||||||||||||||||||
| Conservative Wealth Strategy | 3.04 | 3.13 | 5.96 | 5.55 | 4.21 | 4.66 | ||||||||||||||||||
| 65% Barclays Capital U.S. Aggregate / 35% S&P 500 Index | 6.03 | 6.14 | 8.14 | 8.38 | 6.10 | 6.27 | ||||||||||||||||||
| Barclays Capital U.S. Aggregate Index | 3.24 | 3.03 | 2.21 | 3.90 | 4.61 | 4.76 | ||||||||||||||||||
| S&P 500 Index | 11.08 | 11.81 | 19.67 | 16.54 | 8.12 | 8.54 | ||||||||||||||||||
| Inception Date: September 2, 2003 | ||||||||||||||||||||||||
CONCLUSION:
Based on the factors discussed above the Senior Officer’s conclusion is that the proposed advisory fee for each Strategy is reasonable and within the range of what would have been negotiated at arm’s-length in light of all the surrounding circumstances. The Senior Officer recommended that the Trustees continue to monitor the impact of MMAS on the total expense ratios and performance of the Strategies. This conclusion in respect of each Strategy is based on an evaluation of all of these factors and no single factor was dispositive.
Dated: August 28, 2015
| 96 | • AB WEALTH STRATEGIES |
THIS PAGE IS NOT PART OF THE SHAREHOLDER REPORT OR THE FINANCIAL STATEMENTS
AB FAMILY OF FUNDS
US EQUITY
US Core
Core Opportunities Fund
Select US Equity Portfolio
US Growth
Concentrated Growth Fund
Discovery Growth Fund
Growth Fund
Large Cap Growth Fund
Small Cap Growth Portfolio
US Value
Discovery Value Fund
Equity Income Fund
Growth & Income Fund
Small Cap Value Portfolio
Value Fund
INTERNATIONAL/ GLOBAL EQUITY
International/Global Core
Global Core Equity Portfolio
Global Equity & Covered Call Strategy Fund
Global Thematic Growth Fund
International Portfolio
International Strategic Core Portfolio
Tax-Managed International Portfolio
International/Global Growth
International Growth Fund
International/Global Value
Asia ex-Japan Equity Portfolio
International Value Fund
FIXED INCOME
Municipal
High Income Municipal Portfolio
Intermediate California Municipal Portfolio
Intermediate Diversified Municipal Portfolio
Intermediate New York Municipal Portfolio
Municipal Bond Inflation Strategy
FIXED INCOME (continued)
Tax-Aware Fixed Income Portfolio
National Portfolio
Arizona Portfolio
California Portfolio
Massachusetts Portfolio
Michigan Portfolio
Minnesota Portfolio
New Jersey Portfolio
New York Portfolio
Ohio Portfolio
Pennsylvania Portfolio
Virginia Portfolio
Taxable
Bond Inflation Strategy
Global Bond Fund
High Income Fund
High Yield Portfolio
Intermediate Bond Portfolio
Limited Duration High Income Portfolio
Short Duration Portfolio
ALTERNATIVES
All Market Real Return Portfolio
Credit Long/Short Portfolio
Global Real Estate Investment Fund
Long/Short Multi-Manager Fund
Multi-Manager Alternative Strategies Fund
Select US Long/Short Portfolio
Unconstrained Bond Fund
MULTI-ASSET
All Market Growth Portfolio
All Market Income Portfolio
Emerging Markets Multi-Asset Portfolio
Global Risk Allocation Fund
MULTI-ASSET (continued)
Target-Date
Multi-Manager Select Retirement Allocation Fund
Multi-Manager Select 2010 Fund
Multi-Manager Select 2015 Fund
Multi-Manager Select 2020 Fund
Multi-Manager Select 2025 Fund
Multi-Manager Select 2030 Fund
Multi-Manager Select 2035 Fund
Multi-Manager Select 2040 Fund
Multi-Manager Select 2045 Fund
Multi-Manager Select 2050 Fund
Multi-Manager Select 2055 Fund
Wealth Strategies
Balanced Wealth Strategy
Conservative Wealth Strategy
Wealth Appreciation Strategy
Tax-Managed Balanced Wealth Strategy
Tax-Managed Conservative Wealth Strategy
Tax-Managed Wealth Appreciation Strategy
CLOSED-END FUNDS
AB Multi-Manager Alternative Fund
Alliance California Municipal Income Fund
AllianceBernstein Global High Income Fund
AllianceBernstein Income Fund
AllianceBernstein National Municipal Income Fund
We also offer Exchange Reserves, which serves as the money market fund exchange vehicle for the AB mutual funds. An investment in Exchange Reserves is not a deposit in a bank and is not insured or guaranteed by the Federal Deposit Insurance Corporation or any other government agency. Although the Fund seeks to preserve the value of your investment at $1.00 per share, it is possible to lose money by investing in the Fund.
Investors should consider the investment objectives, risks, charges and expenses of the Fund carefully before investing. For copies of our prospectus or summary prospectus, which contain this and other information, visit us online at www.abglobal.com or contact your AB representative. Please read the prospectus and/or summary prospectus carefully before investing.
| AB WEALTH STRATEGIES • | 97 |
AB Family of Funds
NOTES
| 98 | • AB WEALTH STRATEGIES |
NOTES
| AB WEALTH STRATEGIES • | 99 |
NOTES
| 100 | • AB WEALTH STRATEGIES |
AB WEALTH STRATEGIES
1345 Avenue of the Americas
New York, NY 10105
800.221.5672
WS-0152-0216 
ITEM 2. CODE OF ETHICS.
Not applicable when filing a semi-annual report to shareholders.
ITEM 3. AUDIT COMMITTEE FINANCIAL EXPERT.
Not applicable when filing a semi-annual report to shareholders.
ITEM 4. PRINCIPAL ACCOUNTANT FEES AND SERVICES.
Not applicable when filing a semi-annual report to shareholders.
ITEM 5. AUDIT COMMITTEE OF LISTED REGISTRANTS.
Not applicable to the registrant.
ITEM 6. SCHEDULE OF INVESTMENTS.
Please see Schedule of Investments contained in the Report to Shareholders included under Item 1 of this Form N-CSR.
ITEM 7. DISCLOSURE OF PROXY VOTING POLICIES AND PROCEDURES FOR CLOSED-END MANAGEMENT INVESTMENT COMPANIES.
Not applicable to the registrant.
ITEM 8. PORTFOLIO MANAGERS OF CLOSED-END MANAGEMENT INVESTMENT COMPANIES.
Not applicable to the registrant.
ITEM 9. PURCHASES OF EQUITY SECURITIES BY CLOSED-END MANAGEMENT INVESTMENT COMPANY AND AFFILIATED PURCHASERS.
Not applicable to the registrant.
ITEM 10. SUBMISSION OF MATTERS TO A VOTE OF SECURITY HOLDERS.
There have been no material changes to the procedures by which shareholders may recommend nominees to the Fund’s Board of Directors since the Fund last provided disclosure in response to this item.
ITEM 11. CONTROLS AND PROCEDURES.
(a) The registrant’s principal executive officer and principal financial officer have concluded that the registrant’s disclosure controls and procedures (as defined in Rule 30a-2(c) under the Investment Company Act of 1940, as amended) are effective at the reasonable assurance level based on their evaluation of these controls and procedures as of a date within 90 days of the filing date of this document.
(b) There were no changes in the registrant’s internal controls over financial reporting that occurred during the second fiscal quarter of the period that has materially affected, or is reasonably likely to materially affect, the registrant’s internal control over financial reporting.
ITEM 12. EXHIBITS.
The following exhibits are attached to this Form N-CSR:
EXHIBIT NO. | DESCRIPTION OF EXHIBIT | |
| 12 (b) (1) | Certification of Principal Executive Officer Pursuant to Section 302 of the Sarbanes-Oxley Act of 2002 | |
| 12 (b) (2) | Certification of Principal Financial Officer Pursuant to Section 302 of the Sarbanes-Oxley Act of 2002 | |
| 12 (c) | Certification of Principal Executive Officer and Principal Financial Officer Pursuant to Section 906 of the Sarbanes-Oxley Act of 2002 | |
SIGNATURES
Pursuant to the requirements of the Securities Exchange Act of 1934 and the Investment Company Act of 1940, the registrant has duly caused this report to be signed on its behalf by the undersigned, thereunto duly authorized.
(Registrant): The AB Portfolios
| By: | /s/ Robert M. Keith | |
Robert M. Keith President | ||
| Date: | April 26, 2016 | |
Pursuant to the requirements of the Securities Exchange Act of 1934 and the Investment Company Act of 1940, this report has been signed below by the following persons on behalf of the registrant and in the capacities and on the dates indicated.
| By: | /s/ Robert M. Keith | |
Robert M. Keith President | ||
| Date: | April 26, 2016 | |
| By: | /s/ Joseph J. Mantineo | |
Joseph J. Mantineo Treasurer and Chief Financial Officer | ||
| Date: | April 26, 2016 | |