UNITED STATES
SECURITIES AND EXCHANGE COMMISSION
Washington, D.C. 20549
FORM N-CSR
CERTIFIED SHAREHOLDER REPORT OF REGISTERED
MANAGEMENT INVESTMENT COMPANIES
Investment Company Act file number 811-00649
Fidelity Puritan Trust
(Exact name of registrant as specified in charter)
245 Summer St., Boston, Massachusetts 02210
(Address of principal executive offices) (Zip code)
Margaret Carey, Secretary
245 Summer St.
Boston, Massachusetts 02210
(Name and address of agent for service)
Registrant's telephone number, including area code:
617-563-7000
| |
Date of fiscal year end: | August 31 |
|
|
Date of reporting period: | August 31, 2023 |
Item 1.
Reports to Stockholders
Fidelity® Puritan® Fund
Annual Report
August 31, 2023
Contents
To view a fund's proxy voting guidelines and proxy voting record for the 12-month period ended June 30, visit http://www.fidelity.com/proxyvotingresults or visit the Securities and Exchange Commission's (SEC) web site at http://www.sec.gov.
You may also call 1-800-544-8544 if you're an individual investing directly with Fidelity, call 1-800-835-5092 if you're a plan sponsor or participant with Fidelity as your recordkeeper or call 1-877-208-0098 on institutional accounts or if you're an advisor or invest through one to request a free copy of the proxy voting guidelines.
Standard & Poor's, S&P and S&P 500 are registered service marks of The McGraw-Hill Companies, Inc. and have been licensed for use by Fidelity Distributors Corporation.
Other third-party marks appearing herein are the property of their respective owners.
All other marks appearing herein are registered or unregistered trademarks or service marks of FMR LLC or an affiliated company. © 2023 FMR LLC. All rights reserved.
This report and the financial statements contained herein are submitted for the general information of the shareholders of the Fund. This report is not authorized for distribution to prospective investors in the Fund unless preceded or accompanied by an effective prospectus.
A fund files its complete schedule of portfolio holdings with the SEC for the first and third quarters of each fiscal year on Form N-PORT. Forms N-PORT are available on the SEC's web site at http://www.sec.gov. A fund's Forms N-PORT may be reviewed and copied at the SEC's Public Reference Room in Washington, DC. Information regarding the operation of the SEC's Public Reference Room may be obtained by calling 1-800-SEC-0330.
For a complete list of a fund's portfolio holdings, view the most recent holdings listing, semiannual report, or annual report on Fidelity's web site at http://www.fidelity.com, http://www.institutional.fidelity.com, or http://www.401k.com, as applicable.
NOT FDIC INSURED •MAY LOSE VALUE •NO BANK GUARANTEE
Neither the Fund nor Fidelity Distributors Corporation is a bank.
Average annual total return reflects the change in the value of an investment, assuming reinvestment of distributions from dividend income and capital gains (the profits earned upon the sale of securities that have grown in value, if any) and assuming a constant rate of performance each year. The hypothetical investment and the average annual total returns do not reflect the deduction of taxes that a shareholder would pay on fund distributions or the redemption of fund shares. During periods of reimbursement by Fidelity, a fund's total return will be greater than it would be had the reimbursement not occurred. How a fund did yesterday is no guarantee of how it will do tomorrow.
| Average Annual Total Returns |
| | | | |
Periods ended August 31, 2023 | Past 1 year | Past 5 years | Past 10 years |
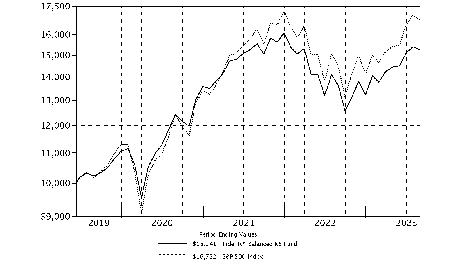
| Fidelity® Puritan® Fund | 12.00% | 7.82% | 9.34% |
| Class K | 12.10% | 7.90% | 9.43% |
| $10,000 Over 10 Years |
| |
Let's say hypothetically that $10,000 was invested in Fidelity® Puritan® Fund, a class of the fund, on August 31, 2013. The chart shows how the value of your investment would have changed, and also shows how the S&P 500® Index performed over the same period. |
|
|
Market Recap:
U.S. equities gained 15.94% for the 12 months ending August 31, 2023, according to the S&P 500® index, as continued global economic expansion, falling commodity prices and a slowing in the pace of inflation provided a favorable backdrop for higher-risk assets. Large-cap stocks spearheaded the rally, which was driven by the shares of a narrow set of mega-cap companies in the information technology and communication services sectors, largely due to exuberance related to generative artificial intelligence. Aggressive monetary tightening by the U.S. Federal Reserve continued amid consistent pressure on core inflation, a measure that excludes food and energy. Since March 2022, the Fed has hiked its benchmark interest rate 11 times. The latest bump came in late July, a fourth consecutive raise of a stepped-down 25 basis points. The S&P 500® gained 3.21% in July but snapped a five-month rally in August (-1.59%), held back by softness in manufacturing and jobs. Still, U.S. stocks ended August up 18.73% year to date. In fixed income, the Bloomberg U.S. Aggregate Bond Index returned -1.19%, as taxable investment-grade bonds showed year-to-date improvement after returning -13.01% in 2022. For the full 12 months, short-term bonds outpaced long-term issues, while lower-quality (higher yielding) bonds topped higher-quality debt. Higher-risk assets, including corporate bonds and asset-backed securities, fared better than U.S. Treasuries.
Comments from Portfolio Manager Daniel Kelley:
For the fiscal year, the fund's share classes gained roughly 12%, outperforming the 9.04% advance of the Fidelity Puritan Composite IndexSM - a 60/40 blend of the S&P 500® and the Bloomberg U.S. Aggregate Bond Index. Security selection in the equities subportfolio contributed to the fund's outperformance of the Composite index the past 12 months. Investment choices and an underweight among investment-grade bonds also helped the fund's relative result. Among stocks, my picks in the industrials sector gave the biggest boost by far. The top individual contributor was an overweight in semiconductor company Nvidia (+247%). I notably increased exposure to Nvidia the past 12 months, making it the fund's No. 2 holding as of August 31. Elsewhere, a non-Composite stake in ride-share company Uber Technologies (+64%) and an overweight in Facebook parent Meta Platforms (+81%) boosted the fund's result versus the Composite. I added to Meta this period, a large holding at the end of August. In fixed income, the fund benefited from an overweight in lower-rated corporate bonds. Conversely, stock selection and an underweight in the information technology sector detracted from relative performance for the 12 months. Positioning in the materials sector also hurt. An underweight in consumer electronics leader Apple (+20%) was the largest individual relative detractor, followed by an underweight in e-commerce giant Amazon.com (+9%).
The views expressed above reflect those of the portfolio manager(s) only through the end of the period as stated on the cover of this report and do not necessarily represent the views of Fidelity or any other person in the Fidelity organization. Any such views are subject to change at any time based upon market or other conditions and Fidelity disclaims any responsibility to update such views. These views may not be relied on as investment advice and, because investment decisions for a Fidelity fund are based on numerous factors, may not be relied on as an indication of trading intent on behalf of any Fidelity fund.
The information in the following tables is based on the combined Investments of the Fund and its pro-rata share of investments in Fidelity's Central Funds, other than the Money Market Central Funds.
Top Holdings (% of Fund's net assets) |
| |
| Microsoft Corp. | 5.8 | |
| NVIDIA Corp. | 3.7 | |
| Alphabet, Inc. Class C | 3.4 | |
| Amazon.com, Inc. | 2.2 | |
| Meta Platforms, Inc. Class A | 2.2 | |
| Eaton Corp. PLC | 1.9 | |
| Apple, Inc. | 1.8 | |
| MasterCard, Inc. Class A | 1.7 | |
| Eli Lilly & Co. | 1.4 | |
| The Boeing Co. | 1.4 | |
| | 25.5 | |
| |
| Top Bond Issuers (% of Fund's net assets) |
(with maturities greater than one year) |
| U.S. Treasury Obligations | 11.5 | |
| Fannie Mae | 2.2 | |
| Freddie Mac | 1.9 | |
| Ginnie Mae | 1.2 | |
| Uniform Mortgage Backed Securities | 1.0 | |
| JPMorgan Chase & Co. | 0.7 | |
| Morgan Stanley | 0.4 | |
| Bank of America Corp. | 0.4 | |
| Citigroup, Inc. | 0.3 | |
| Ally Financial, Inc. | 0.2 | |
| | 19.8 | |
| |
| Market Sectors (% of Fund's net assets) |
| |
| Information Technology | 20.5 | |
| Financials | 11.3 | |
| Industrials | 10.0 | |
| Health Care | 8.5 | |
| Communication Services | 8.4 | |
| Consumer Discretionary | 7.6 | |
| Energy | 4.6 | |
| Materials | 2.5 | |
| Consumer Staples | 2.2 | |
| Real Estate | 0.9 | |
| Utilities | 0.6 | |
| |
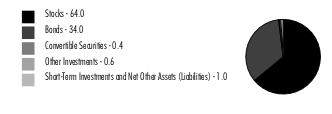
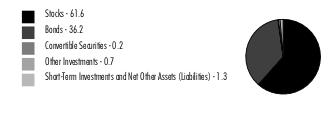
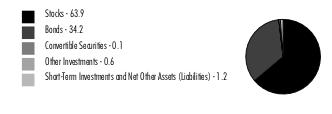
Asset Allocation (% of Fund's net assets) |
|
Futures and Swaps - 0.7% |
|
An unaudited holdings listing for the fund, which presents direct holdings as well as the pro-rata share of any securities and other investments held indirectly through its investment in underlying Fidelity Central Funds, other than the Money Market Central Funds, is available at fidelity.com and/or institutional.fidelity.com, as applicable.
Showing Percentage of Net Assets
| Common Stocks - 63.8% |
| | | Shares | Value ($) (000s) |
| COMMUNICATION SERVICES - 6.9% | | | |
| Entertainment - 0.8% | | | |
| Electronic Arts, Inc. | | 77,767 | 9,330 |
| LiveOne, Inc. (a)(b)(c) | | 6,716,730 | 14,374 |
| Netflix, Inc. (a) | | 408,485 | 177,152 |
| Spotify Technology SA (a) | | 54,582 | 8,404 |
| Universal Music Group NV | | 704,536 | 17,468 |
| | | | 226,728 |
| Interactive Media & Services - 5.6% | | | |
| Alphabet, Inc. Class C (a) | | 6,896,198 | 947,193 |
| Meta Platforms, Inc. Class A (a) | | 2,006,396 | 593,673 |
| | | | 1,540,866 |
| Media - 0.5% | | | |
| Comcast Corp. Class A | | 2,989,582 | 139,793 |
| Vice Holding, Inc. (a)(d) | | 1,498,461 | 0 |
| | | | 139,793 |
TOTAL COMMUNICATION SERVICES | | | 1,907,387 |
| CONSUMER DISCRETIONARY - 6.7% | | | |
| Automobile Components - 0.1% | | | |
| Aptiv PLC (a) | | 168,566 | 17,101 |
| Automobiles - 0.0% | | | |
| Li Auto, Inc. ADR (a) | | 89,482 | 3,727 |
| Neutron Holdings, Inc. (a)(d)(e) | | 4,168,198 | 120 |
| | | | 3,847 |
| Broadline Retail - 2.3% | | | |
| Amazon.com, Inc. (a) | | 4,383,213 | 604,927 |
| Global-e Online Ltd. (a)(b) | | 741,350 | 29,380 |
| | | | 634,307 |
| Hotels, Restaurants & Leisure - 1.7% | | | |
| Airbnb, Inc. Class A (a) | | 650,425 | 85,563 |
| Caesars Entertainment, Inc. (a) | | 656,130 | 36,258 |
| Compass Group PLC | | 1,097,683 | 27,680 |
| Domino's Pizza, Inc. | | 139,122 | 53,896 |
| Flutter Entertainment PLC (a) | | 207,435 | 37,866 |
| Hilton Worldwide Holdings, Inc. | | 743,661 | 110,545 |
| Marriott International, Inc. Class A | | 294,472 | 59,928 |
| McDonald's Corp. | | 201,848 | 56,750 |
| | | | 468,486 |
| Household Durables - 0.1% | | | |
| Blu Investments LLC (a)(d)(e) | | 14,988,638 | 5 |
| Chervon Holdings Ltd. | | 1,418,113 | 4,683 |
| D.R. Horton, Inc. | | 245,619 | 29,234 |
| | | | 33,922 |
| Specialty Retail - 1.7% | | | |
| Lowe's Companies, Inc. | | 747,175 | 172,209 |
| Revolve Group, Inc. (a) | | 216,646 | 3,174 |
| RH (a) | | 75,687 | 27,640 |
| TJX Companies, Inc. | | 2,787,226 | 257,763 |
| | | | 460,786 |
| Textiles, Apparel & Luxury Goods - 0.8% | | | |
| Brunello Cucinelli SpA | | 1,210,391 | 100,274 |
| LVMH Moet Hennessy Louis Vuitton SE | | 43,663 | 36,924 |
| Moncler SpA | | 103,050 | 7,000 |
| NIKE, Inc. Class B | | 34,146 | 3,473 |
| On Holding AG (a) | | 53,478 | 1,542 |
| Ralph Lauren Corp. | | 270,199 | 31,513 |
| Tapestry, Inc. | | 327,872 | 10,925 |
| Tory Burch LLC: | | | |
| Class A (a)(d)(e)(f) | | 702,741 | 22,722 |
| Class B (a)(d)(e)(f) | | 324,840 | 11,363 |
| | | | 225,736 |
TOTAL CONSUMER DISCRETIONARY | | | 1,844,185 |
| CONSUMER STAPLES - 1.5% | | | |
| Beverages - 0.7% | | | |
| Boston Beer Co., Inc. Class A (a) | | 59,122 | 21,605 |
| Monster Beverage Corp. | | 2,979,795 | 171,070 |
| | | | 192,675 |
| Consumer Staples Distribution & Retail - 0.0% | | | |
| Performance Food Group Co. (a) | | 86,782 | 5,392 |
| Household Products - 0.3% | | | |
| The Clorox Co. | | 513,636 | 80,358 |
| Personal Care Products - 0.2% | | | |
| Estee Lauder Companies, Inc. Class A | | 163,800 | 26,295 |
| Kenvue, Inc. | | 1,346,877 | 31,046 |
| L'Oreal SA (a) | | 10,418 | 4,584 |
| | | | 61,925 |
| Tobacco - 0.3% | | | |
| Philip Morris International, Inc. | | 858,800 | 82,496 |
TOTAL CONSUMER STAPLES | | | 422,846 |
| ENERGY - 3.0% | | | |
| Energy Equipment & Services - 1.7% | | | |
| Baker Hughes Co. Class A | | 4,136,759 | 149,709 |
| NOV, Inc. | | 3,766,084 | 79,577 |
| Schlumberger Ltd. | | 3,024,433 | 178,321 |
| TechnipFMC PLC | | 3,707,313 | 70,587 |
| Weatherford International PLC (a) | | 49,890 | 4,416 |
| | | | 482,610 |
| Oil, Gas & Consumable Fuels - 1.3% | | | |
| Antero Resources Corp. (a) | | 621,246 | 17,190 |
| Exxon Mobil Corp. | | 1,199,737 | 133,399 |
| Hess Corp. | | 939,233 | 145,111 |
| Range Resources Corp. | | 1,644,870 | 53,261 |
| | | | 348,961 |
TOTAL ENERGY | | | 831,571 |
| FINANCIALS - 6.8% | | | |
| Banks - 0.5% | | | |
| JPMorgan Chase & Co. | | 619,643 | 90,672 |
| Starling Bank Ltd. Series D (a)(d)(e) | | 7,254,400 | 29,775 |
| | | | 120,447 |
| Capital Markets - 2.3% | | | |
| Ares Management Corp. | | 960,205 | 99,324 |
| BlackRock, Inc. Class A | | 127,345 | 89,210 |
| Cboe Global Markets, Inc. | | 249,423 | 37,341 |
| CME Group, Inc. | | 233,856 | 47,398 |
| Deutsche Borse AG | | 157,536 | 27,966 |
| Goldman Sachs Group, Inc. | | 131,643 | 43,141 |
| Intercontinental Exchange, Inc. | | 680,534 | 80,296 |
| KKR & Co. LP | | 384,722 | 24,164 |
| London Stock Exchange Group PLC | | 116,976 | 12,102 |
| Moody's Corp. | | 66,986 | 22,561 |
| Morgan Stanley | | 1,131,737 | 96,367 |
| Raymond James Financial, Inc. | | 130,219 | 13,620 |
| TulCo LLC (a)(d)(e)(f) | | 42,857 | 35,091 |
| | | | 628,581 |
| Consumer Finance - 0.2% | | | |
| American Express Co. | | 260,875 | 41,216 |
| Capital One Financial Corp. | | 223,355 | 22,869 |
| | | | 64,085 |
| Financial Services - 2.7% | | | |
| Berkshire Hathaway, Inc. Class B (a) | | 199,181 | 71,745 |
| Block, Inc. Class A (a) | | 703,917 | 40,581 |
| MasterCard, Inc. Class A | | 1,123,277 | 463,509 |
| New Moda LLC Class 1 (a)(d) | | 62,880 | 45 |
| Toast, Inc. (a) | | 1,304,139 | 28,913 |
| Visa, Inc. Class A | | 614,793 | 151,042 |
| | | | 755,835 |
| Insurance - 1.1% | | | |
| Arthur J. Gallagher & Co. | | 456,172 | 105,139 |
| Chubb Ltd. | | 111,282 | 22,353 |
| Globe Life, Inc. | | 226,584 | 25,280 |
| Hartford Financial Services Group, Inc. | | 251,233 | 18,044 |
| Marsh & McLennan Companies, Inc. | | 418,040 | 81,514 |
| The Travelers Companies, Inc. | | 365,893 | 58,993 |
| | | | 311,323 |
TOTAL FINANCIALS | | | 1,880,271 |
| HEALTH CARE - 7.6% | | | |
| Biotechnology - 1.5% | | | |
| Argenx SE ADR (a) | | 133,881 | 67,274 |
| Exact Sciences Corp. (a) | | 847,973 | 70,950 |
| Karuna Therapeutics, Inc. (a) | | 66,679 | 12,520 |
| Legend Biotech Corp. ADR (a) | | 962,760 | 66,777 |
| Moderna, Inc. (a) | | 265,315 | 29,999 |
| Nuvalent, Inc. Class A (a) | | 136,206 | 6,207 |
| Prothena Corp. PLC (a) | | 157,706 | 8,330 |
| Regeneron Pharmaceuticals, Inc. (a) | | 108,033 | 89,288 |
| Vertex Pharmaceuticals, Inc. (a) | | 196,688 | 68,514 |
| | | | 419,859 |
| Health Care Equipment & Supplies - 1.9% | | | |
| Baxter International, Inc. | | 172,865 | 7,018 |
| Boston Scientific Corp. (a) | | 5,254,152 | 283,409 |
| Intuitive Surgical, Inc. (a) | | 176,801 | 55,282 |
| Penumbra, Inc. (a) | | 11,798 | 3,121 |
| Stryker Corp. | | 624,623 | 177,112 |
| | | | 525,942 |
| Health Care Providers & Services - 1.6% | | | |
| agilon health, Inc. (a) | | 3,845,119 | 68,136 |
| Cardinal Health, Inc. | | 139,449 | 12,178 |
| Cigna Group | | 35,007 | 9,671 |
| CVS Health Corp. | | 815,934 | 53,174 |
| UnitedHealth Group, Inc. | | 616,054 | 293,599 |
| | | | 436,758 |
| Health Care Technology - 0.1% | | | |
| Evolent Health, Inc. (e) | | 976,600 | 23,667 |
| Life Sciences Tools & Services - 0.2% | | | |
| Agilent Technologies, Inc. | | 241,902 | 29,287 |
| Thermo Fisher Scientific, Inc. | | 38,653 | 21,534 |
| | | | 50,821 |
| Pharmaceuticals - 2.3% | | | |
| AstraZeneca PLC sponsored ADR | | 99,126 | 6,723 |
| Eli Lilly & Co. | | 713,203 | 395,257 |
| Merck & Co., Inc. | | 1,833,043 | 199,765 |
| Novo Nordisk A/S Series B | | 203,959 | 37,621 |
| | | | 639,366 |
TOTAL HEALTH CARE | | | 2,096,413 |
| INDUSTRIALS - 9.1% | | | |
| Aerospace & Defense - 2.4% | | | |
| BWX Technologies, Inc. | | 25,995 | 1,917 |
| Howmet Aerospace, Inc. | | 1,154,213 | 57,099 |
| Lockheed Martin Corp. | | 322,957 | 144,798 |
| Space Exploration Technologies Corp.: | | | |
| Class A (a)(d)(e) | | 411,220 | 33,309 |
| Class C (a)(d)(e) | | 56,070 | 4,542 |
| The Boeing Co. (a) | | 1,702,487 | 381,408 |
| TransDigm Group, Inc. | | 40,185 | 36,321 |
| | | | 659,394 |
| Building Products - 0.7% | | | |
| ASSA ABLOY AB (B Shares) | | 179,923 | 4,049 |
| Fortune Brands Home & Security, Inc. (b) | | 415,423 | 28,672 |
| Johnson Controls International PLC | | 530,310 | 31,320 |
| Trane Technologies PLC | | 583,934 | 119,858 |
| | | | 183,899 |
| Commercial Services & Supplies - 0.3% | | | |
| Cintas Corp. | | 147,978 | 74,606 |
| Copart, Inc. | | 51,578 | 2,312 |
| | | | 76,918 |
| Construction & Engineering - 0.2% | | | |
| Fluor Corp. (a) | | 1,262,735 | 44,183 |
| Willscot Mobile Mini Holdings (a) | | 112,777 | 4,626 |
| | | | 48,809 |
| Electrical Equipment - 2.4% | | | |
| Eaton Corp. PLC | | 2,282,838 | 525,897 |
| Hubbell, Inc. Class B | | 152,555 | 49,741 |
| Prysmian SpA | | 396,837 | 16,261 |
| Regal Rexnord Corp. | | 33,483 | 5,431 |
| Vertiv Holdings Co. | | 1,676,313 | 66,030 |
| | | | 663,360 |
| Ground Transportation - 1.0% | | | |
| Canadian Pacific Kansas City Ltd. | | 156,925 | 12,457 |
| Lyft, Inc. (a) | | 1,474,270 | 17,367 |
| Uber Technologies, Inc. (a) | | 5,218,050 | 246,449 |
| | | | 276,273 |
| Industrial Conglomerates - 0.8% | | | |
| General Electric Co. | | 2,055,130 | 235,230 |
| Machinery - 0.8% | | | |
| Caterpillar, Inc. | | 652,600 | 183,465 |
| PACCAR, Inc. | | 94,610 | 7,785 |
| Parker Hannifin Corp. | | 17,296 | 7,211 |
| Pentair PLC | | 287,877 | 20,226 |
| | | | 218,687 |
| Passenger Airlines - 0.2% | | | |
| Copa Holdings SA Class A (b) | | 414,319 | 42,136 |
| Delta Air Lines, Inc. | | 404,342 | 17,338 |
| | | | 59,474 |
| Professional Services - 0.2% | | | |
| Equifax, Inc. | | 263,459 | 54,457 |
| Paycom Software, Inc. | | 44,481 | 13,115 |
| | | | 67,572 |
| Trading Companies & Distributors - 0.1% | | | |
| Bunzl PLC | | 59,932 | 2,149 |
| W.W. Grainger, Inc. | | 39,183 | 27,982 |
| | | | 30,131 |
TOTAL INDUSTRIALS | | | 2,519,747 |
| INFORMATION TECHNOLOGY - 20.0% | | | |
| Electronic Equipment, Instruments & Components - 0.4% | | | |
| Amphenol Corp. Class A | | 884,476 | 78,170 |
| Flex Ltd. (a) | | 1,341,113 | 37,001 |
| | | | 115,171 |
| IT Services - 1.4% | | | |
| Accenture PLC Class A | | 392,681 | 127,138 |
| Shopify, Inc. Class A (a) | | 3,536,603 | 235,149 |
| Snowflake, Inc. (a) | | 198,573 | 31,146 |
| X Holdings Corp. Class A (d)(e) | | 172,430 | 6,651 |
| | | | 400,084 |
| Semiconductors & Semiconductor Equipment - 8.1% | | | |
| Advanced Micro Devices, Inc. (a) | | 728,361 | 77,002 |
| Analog Devices, Inc. | | 816,197 | 148,368 |
| Applied Materials, Inc. | | 215,235 | 32,879 |
| ASML Holding NV (depository receipt) | | 89,081 | 58,841 |
| First Solar, Inc. (a) | | 331,333 | 62,662 |
| GlobalFoundries, Inc. (a) | | 1,170,500 | 64,670 |
| Lam Research Corp. | | 82,821 | 58,173 |
| Lattice Semiconductor Corp. (a) | | 235,683 | 22,923 |
| Marvell Technology, Inc. | | 5,899,991 | 343,674 |
| Monolithic Power Systems, Inc. | | 69,386 | 36,165 |
| NVIDIA Corp. | | 2,059,165 | 1,016,301 |
| NXP Semiconductors NV | | 353,728 | 72,769 |
| ON Semiconductor Corp. (a) | | 626,534 | 61,689 |
| Taiwan Semiconductor Manufacturing Co. Ltd. sponsored ADR | | 1,471,872 | 137,723 |
| Universal Display Corp. | | 220,743 | 35,884 |
| | | | 2,229,723 |
| Software - 8.3% | | | |
| Adobe, Inc. (a) | | 217,331 | 121,562 |
| Atom Tickets LLC (a)(d)(e)(f) | | 2,580,511 | 0 |
| Autodesk, Inc. (a) | | 77,776 | 17,262 |
| Confluent, Inc. (a) | | 256,248 | 8,479 |
| Dynatrace, Inc. (a) | | 1,936,913 | 93,359 |
| Fair Isaac Corp. (a) | | 16,298 | 14,743 |
| HubSpot, Inc. (a) | | 53,888 | 29,451 |
| Microsoft Corp. | | 4,911,038 | 1,609,639 |
| Oracle Corp. | | 1,152,210 | 138,715 |
| Salesforce, Inc. (a) | | 424,201 | 93,944 |
| Synopsys, Inc. (a) | | 142,288 | 65,295 |
| Tenable Holdings, Inc. (a) | | 101,460 | 4,603 |
| UiPath, Inc. Class A (a) | | 316,636 | 5,006 |
| Workday, Inc. Class A (a) | | 370,318 | 90,543 |
| | | | 2,292,601 |
| Technology Hardware, Storage & Peripherals - 1.8% | | | |
| Apple, Inc. | | 2,571,692 | 483,144 |
| Samsung Electronics Co. Ltd. | | 100,000 | 5,049 |
| | | | 488,193 |
TOTAL INFORMATION TECHNOLOGY | | | 5,525,772 |
| MATERIALS - 2.2% | | | |
| Chemicals - 1.6% | | | |
| Linde PLC | | 551,275 | 213,365 |
| Sherwin-Williams Co. | | 825,635 | 224,342 |
| | | | 437,707 |
| Construction Materials - 0.0% | | | |
| Martin Marietta Materials, Inc. | | 12,297 | 5,490 |
| Containers & Packaging - 0.1% | | | |
| Aptargroup, Inc. | | 14,694 | 1,948 |
| Ball Corp. | | 402,659 | 21,925 |
| | | | 23,873 |
| Metals & Mining - 0.5% | | | |
| First Quantum Minerals Ltd. | | 1,529,169 | 41,081 |
| Franco-Nevada Corp. | | 37,930 | 5,464 |
| Freeport-McMoRan, Inc. | | 87,751 | 3,502 |
| Newcrest Mining Ltd. | | 1,180,197 | 19,670 |
| Newmont Corp. | | 1,492,933 | 58,851 |
| Nucor Corp. | | 22,741 | 3,914 |
| Wheaton Precious Metals Corp. | | 236,299 | 10,307 |
| | | | 142,789 |
TOTAL MATERIALS | | | 609,859 |
| TOTAL COMMON STOCKS (Cost $11,466,456) | | | 17,638,051 |
| | | | |
| Preferred Stocks - 0.3% |
| | | Shares | Value ($) (000s) |
| Convertible Preferred Stocks - 0.3% | | | |
| COMMUNICATION SERVICES - 0.1% | | | |
| Interactive Media & Services - 0.1% | | | |
| ByteDance Ltd. Series E1 (a)(d)(e) | | 145,676 | 32,936 |
| Reddit, Inc. Series E (a)(d)(e) | | 28,500 | 1,019 |
| | | | 33,955 |
| CONSUMER DISCRETIONARY - 0.1% | | | |
| Textiles, Apparel & Luxury Goods - 0.1% | | | |
| Goop International Holdings, Inc.: | | | |
| Series C(a)(d)(e) | | 1,881,874 | 13,361 |
| Series D(a)(d)(e) | | 342,241 | 2,430 |
| | | | 15,791 |
| HEALTH CARE - 0.0% | | | |
| Health Care Providers & Services - 0.0% | | | |
| Get Heal, Inc. Series B (a)(d)(e) | | 8,512,822 | 1 |
| | | | |
| INDUSTRIALS - 0.1% | | | |
| Aerospace & Defense - 0.1% | | | |
| Space Exploration Technologies Corp. Series H (a)(d)(e) | | 51,921 | 42,056 |
| | | | |
| TOTAL CONVERTIBLE PREFERRED STOCKS | | | 91,803 |
| Nonconvertible Preferred Stocks - 0.0% | | | |
| CONSUMER DISCRETIONARY - 0.0% | | | |
| Automobiles - 0.0% | | | |
| Neutron Holdings, Inc.: | | | |
| Series 1C(a)(d)(e) | | 38,589,900 | 1,108 |
| Series 1D(a)(d)(e) | | 40,824,742 | 1,172 |
| | | | 2,280 |
| TOTAL PREFERRED STOCKS (Cost $66,156) | | | 94,083 |
| | | | |
| Corporate Bonds - 0.0% |
| | | Principal Amount (g) (000s) | Value ($) (000s) |
| Convertible Bonds - 0.0% | | | |
| CONSUMER DISCRETIONARY - 0.0% | | | |
| Automobiles - 0.0% | | | |
| Neutron Holdings, Inc.: | | | |
| 4% 5/22/27(d)(e) | | 1,371 | 1,609 |
| 4% 6/12/27(d)(e) | | 354 | 416 |
| | | | 2,025 |
| Nonconvertible Bonds - 0.0% | | | |
| FINANCIALS - 0.0% | | | |
| Financial Services - 0.0% | | | |
| Ant International Co. Ltd. 3.55% 8/14/24 (d)(e) | | 3,617 | 3,599 |
| | | | |
| TOTAL CORPORATE BONDS (Cost $5,342) | | | 5,624 |
| | | | |
| Fixed-Income Funds - 35.4% |
| | | Shares | Value ($) (000s) |
| Fidelity High Income Central Fund (h) | | 12,201,623 | 1,251,032 |
| Fidelity Investment Grade Bond Central Fund (h) | | 88,606,556 | 8,540,786 |
| TOTAL FIXED-INCOME FUNDS (Cost $10,957,775) | | | 9,791,818 |
| | | | |
| Other - 0.0% |
| | | Shares | Value ($) (000s) |
| Other - 0.0% | | | |
Fidelity Private Credit Central Fund LLC (e) (Cost $5,439) | | 543,678 | 5,469 |
| | | | |
| Money Market Funds - 0.7% |
| | | Shares | Value ($) (000s) |
| Fidelity Cash Central Fund 5.43% (i) | | 119,191,365 | 119,215 |
| Fidelity Securities Lending Cash Central Fund 5.44% (i)(j) | | 69,415,773 | 69,423 |
| TOTAL MONEY MARKET FUNDS (Cost $188,638) | | | 188,638 |
| | | | |
| TOTAL INVESTMENT IN SECURITIES - 100.2% (Cost $22,689,806) | 27,723,683 |
NET OTHER ASSETS (LIABILITIES) - (0.2)% | (62,242) |
| NET ASSETS - 100.0% | 27,661,441 |
| | |
Any values shown as $0 in the Consolidated Schedule of Investments may reflect amounts less than $500
Legend
| (b) | Security or a portion of the security is on loan at period end. |
| (e) | Restricted securities (including private placements) - Investment in securities not registered under the Securities Act of 1933 (excluding 144A issues). At the end of the period, the value of restricted securities (excluding 144A issues) amounted to $272,421,000 or 1.0% of net assets. |
| (f) | Investment is owned by a wholly-owned subsidiary (Subsidiary) that is treated as a corporation for U.S. tax purposes. |
| (g) | Amount is stated in United States dollars unless otherwise noted. |
| (h) | Affiliated fund that is generally available only to investment companies and other accounts managed by Fidelity Investments. A complete unaudited schedule of portfolio holdings for each Fidelity Central Fund is filed with the SEC for the first and third quarters of each fiscal year on Form N-PORT and is available upon request or at the SEC's website at www.sec.gov. An unaudited holdings listing for the Fund, which presents direct holdings as well as the pro-rata share of securities and other investments held indirectly through its investment in underlying non-money market Fidelity Central Funds, is available at fidelity.com and/or institutional.fidelity.com, as applicable. In addition, each Fidelity Central Fund's financial statements,which are not covered by the Fund's Report of Independent Registered Public Accounting Firm, are available on the SEC's website or upon request. |
| (i) | Affiliated fund that is generally available only to investment companies and other accounts managed by Fidelity Investments. The rate quoted is the annualized seven-day yield of the fund at period end. A complete unaudited listing of the fund's holdings as of its most recent quarter end is available upon request. In addition, each Fidelity Central Fund's financial statements, which are not covered by the Fund's Report of Independent Registered Public Accounting Firm, are available on the SEC's website or upon request. |
| (j) | Investment made with cash collateral received from securities on loan. |
| Additional information on each restricted holding is as follows: |
| Security | Acquisition Date | Acquisition Cost ($) (000s) |
| Ant International Co. Ltd. 3.55% 8/14/24 | 8/14/23 | 3,617 |
| | | |
| Atom Tickets LLC | 8/15/17 | 15,000 |
| | | |
| Blu Investments LLC | 5/21/20 | 26 |
| | | |
| ByteDance Ltd. Series E1 | 11/18/20 | 15,962 |
| | | |
| Evolent Health, Inc. | 3/28/23 | 28,321 |
| | | |
| Fidelity Private Credit Central Fund LLC | 5/26/23 - 8/29/23 | 5,439 |
| | | |
| Get Heal, Inc. Series B | 8/17/23 | 18 |
| | | |
| Goop International Holdings, Inc. Series C | 12/15/17 | 20,000 |
| | | |
| Goop International Holdings, Inc. Series D | 6/21/19 | 5,000 |
| | | |
| Neutron Holdings, Inc. | 2/04/21 | 42 |
| | | |
| Neutron Holdings, Inc. Series 1C | 7/03/18 - 1/25/19 | 7,056 |
| | | |
| Neutron Holdings, Inc. Series 1D | 7/03/18 - 1/25/19 | 9,900 |
| | | |
| Neutron Holdings, Inc. 4% 5/22/27 | 6/04/20 | 1,371 |
| | | |
| Neutron Holdings, Inc. 4% 6/12/27 | 6/12/20 | 354 |
| | | |
| Reddit, Inc. Series E | 5/18/21 | 1,211 |
| | | |
| Space Exploration Technologies Corp. Class A | 9/11/17 | 5,551 |
| | | |
| Space Exploration Technologies Corp. Class C | 9/11/17 | 757 |
| | | |
| Space Exploration Technologies Corp. Series H | 8/04/17 | 7,009 |
| | | |
| Starling Bank Ltd. Series D | 6/18/21 - 4/05/22 | 13,909 |
| | | |
| Tory Burch LLC Class A | 5/14/15 | 50,000 |
| | | |
| Tory Burch LLC Class B | 12/31/12 | 17,505 |
| | | |
| TulCo LLC | 8/24/17 - 12/14/17 | 15,000 |
| | | |
| X Holdings Corp. Class A | 10/25/22 | 17,243 |
| | | |
Affiliated Central Funds
Fiscal year to date information regarding the Fund's investments in Fidelity Central Funds, including the ownership percentage, is presented below.
| Affiliate (Amounts in thousands) | Value, beginning of period ($) | Purchases ($) | Sales Proceeds ($) | Dividend Income ($) | Realized Gain (loss) ($) | Change in Unrealized appreciation (depreciation) ($) | Value, end of period ($) | % ownership, end of period |
| Fidelity Cash Central Fund 5.43% | 642,362 | 5,174,596 | 5,697,743 | 12,041 | - | - | 119,215 | 0.3% |
| Fidelity High Income Central Fund | 1,577,613 | 104,176 | 425,436 | 104,177 | (31,806) | 26,485 | 1,251,032 | 85.0% |
| Fidelity Investment Grade Bond Central Fund | 8,577,708 | 312,325 | 5,004 | 312,325 | 102 | (344,345) | 8,540,786 | 22.7% |
| Fidelity Private Credit Central Fund LLC | - | 5,439 | - | 46 | - | 30 | 5,469 | 0.8% |
| Fidelity Securities Lending Cash Central Fund 5.44% | 117,626 | 878,367 | 926,570 | 284 | - | - | 69,423 | 0.2% |
| Total | 10,915,309 | 6,474,903 | 7,054,753 | 428,873 | (31,704) | (317,830) | 9,985,925 | |
| | | | | | | | | |
Amounts in the dividend income column in the above table include any capital gain distributions from underlying funds, which are presented in the corresponding line item in the Consolidated Statement of Operations, if applicable.
Amounts in the dividend income column for Fidelity Securities Lending Cash Central Fund represents the income earned on investing cash collateral, less rebates paid to borrowers and any lending agent fees associated with the loan, plus any premium payments received for lending certain types of securities.
Amounts included in the purchases and sales proceeds columns may include in-kind transactions, if applicable.
Other Affiliated Issuers
An affiliated company is a company in which the Fund has ownership of at least 5% of the voting securities. Fiscal year to date transactions with companies which are or were affiliates are presented in the table below. Certain corporate actions, such as mergers, are excluded from the amounts in this table if applicable. A dash in the Value end of period ($) column means either the issuer is no longer held at period end, or the issuer is held at period end but is no longer an affiliate.
| Affiliate (Amounts in thousands) | Value, beginning of period ($) | Purchases ($) | Sales Proceeds ($) | Dividend Income ($) | Realized Gain (loss) ($) | Change in Unrealized appreciation (depreciation) ($) | Value, end of period ($) |
| LiveOne, Inc. | 6,720 | - | 4 | - | (4) | 7,662 | 14,374 |
| Total | 6,720 | - | 4 | - | (4) | 7,662 | 14,374 |
Amounts included in the purchases and sales proceeds columns may include in-kind transactions, if applicable.
Investment Valuation
The following is a summary of the inputs used, as of August 31, 2023, involving the Fund's assets and liabilities carried at fair value. The inputs or methodology used for valuing securities may not be an indication of the risk associated with investing in those securities. For more information on valuation inputs, and their aggregation into the levels used below, please refer to the Investment Valuation section in the accompanying Notes to Consolidated Financial Statements.
| Valuation Inputs at Reporting Date: |
Description (Amounts in thousands) | Total ($) | Level 1 ($) | Level 2 ($) | Level 3 ($) |
Investments in Securities: | | | | |
|
| Equities: | | | | |
Communication Services | 1,941,342 | 1,889,919 | 17,468 | 33,955 |
Consumer Discretionary | 1,862,256 | 1,745,371 | 64,604 | 52,281 |
Consumer Staples | 422,846 | 422,846 | - | - |
Energy | 831,571 | 831,571 | - | - |
Financials | 1,880,271 | 1,775,292 | 40,068 | 64,911 |
Health Care | 2,096,414 | 2,035,125 | 61,288 | 1 |
Industrials | 2,561,803 | 2,477,847 | 4,049 | 79,907 |
Information Technology | 5,525,772 | 5,519,121 | - | 6,651 |
Materials | 609,859 | 590,189 | 19,670 | - |
|
| Corporate Bonds | 5,624 | - | - | 5,624 |
|
| Fixed-Income Funds | 9,791,818 | 9,791,818 | - | - |
|
| Other | 5,469 | - | 5,469 | - |
|
| Money Market Funds | 188,638 | 188,638 | - | - |
| Total Investments in Securities: | 27,723,683 | 27,267,737 | 212,616 | 243,330 |
| Consolidated Statement of Assets and Liabilities |
| Amounts in thousands (except per-share amounts) | | | | August 31, 2023 |
| | | | | |
| Assets | | | | |
| Investment in securities, at value (including securities loaned of $66,822) - See accompanying schedule: | | | | |
Unaffiliated issuers (cost $11,517,513) | $ | 17,723,384 | | |
Fidelity Central Funds (cost $11,151,852) | | 9,985,925 | | |
Other affiliated issuers (cost $20,441) | | 14,374 | | |
| | | | | |
| | | | | |
| Total Investment in Securities (cost $22,689,806) | | | $ | 27,723,683 |
| Cash | | | | 32 |
| Restricted cash | | | | 891 |
| Receivable for investments sold | | | | 76,444 |
| Receivable for fund shares sold | | | | 7,163 |
| Dividends receivable | | | | 10,585 |
| Interest receivable | | | | 228 |
| Distributions receivable from Fidelity Central Funds | | | | 1,306 |
| Prepaid expenses | | | | 47 |
| Other receivables | | | | 1,387 |
Total assets | | | | 27,821,766 |
| Liabilities | | | | |
| Payable for investments purchased | $ | 65,306 | | |
| Payable for fund shares redeemed | | 13,063 | | |
| Accrued management fee | | 8,571 | | |
| Other affiliated payables | | 2,734 | | |
| Other payables and accrued expenses | | 1,218 | | |
| Collateral on securities loaned | | 69,433 | | |
| Total Liabilities | | | | 160,325 |
| Commitments and contingent liabilities (see Commitments note) | | | | |
| Net Assets | | | $ | 27,661,441 |
| Net Assets consist of: | | | | |
| Paid in capital | | | $ | 21,746,957 |
| Total accumulated earnings (loss) | | | | 5,914,484 |
| Net Assets | | | $ | 27,661,441 |
| | | | | |
| Net Asset Value and Maximum Offering Price | | | | |
| Puritan : | | | | |
Net Asset Value, offering price and redemption price per share ($23,958,959 ÷ 1,033,465 shares) | | | $ | 23.18 |
| Class K : | | | | |
Net Asset Value, offering price and redemption price per share ($3,702,482 ÷ 159,855 shares) | | | $ | 23.16 |
| Consolidated Statement of Operations |
| Amounts in thousands | | | | Year ended August 31, 2023 |
| Investment Income | | | | |
| Dividends | | | $ | 179,623 |
| Interest | | | | 622 |
| Income from Fidelity Central Funds (including $284 from security lending) | | | | 427,595 |
| Total Income | | | | 607,840 |
| Expenses | | | | |
| Management fee | $ | 100,725 | | |
| Transfer agent fees | | 29,822 | | |
| Accounting fees | | 2,151 | | |
| Custodian fees and expenses | | 198 | | |
| Independent trustees' fees and expenses | | 149 | | |
| Registration fees | | 158 | | |
| Audit | | 224 | | |
| Legal | | 36 | | |
| Interest | | 1 | | |
| Miscellaneous | | 131 | | |
| Total expenses before reductions | | 133,595 | | |
| Expense reductions | | (1,352) | | |
| Total expenses after reductions | | | | 132,243 |
| Net Investment income (loss) | | | | 475,597 |
| Realized and Unrealized Gain (Loss) | | | | |
| Net realized gain (loss) on: | | | | |
| Investment Securities: | | | | |
| Unaffiliated issuers | | 918,114 | | |
| Redemptions in-kind | | 4,410 | | |
| Fidelity Central Funds | | (31,704) | | |
| Other affiliated issuers | | (4) | | |
| Foreign currency transactions | | (189) | | |
| Written options | | 24,780 | | |
| Capital gain distributions from Fidelity Central Funds | | 1,278 | | |
| Total net realized gain (loss) | | | | 916,685 |
| Change in net unrealized appreciation (depreciation) on: | | | | |
| Investment Securities: | | | | |
| Investments | | 1,940,265 | | |
| Fidelity Central Funds | | (317,830) | | |
| Other affiliated issuers | | 7,662 | | |
| Assets and liabilities in foreign currencies | | 59 | | |
| Total change in net unrealized appreciation (depreciation) | | | | 1,630,156 |
| Net gain (loss) | | | | 2,546,841 |
| Net increase (decrease) in net assets resulting from operations | | | $ | 3,022,438 |
| Consolidated Statement of Changes in Net Assets |
| |
| Amount in thousands | | Year ended August 31, 2023 | | Year ended August 31, 2022 |
| Increase (Decrease) in Net Assets | | | | |
| Operations | | | | |
| Net investment income (loss) | $ | 475,597 | $ | 420,398 |
| Net realized gain (loss) | | 916,685 | | 2,620,374 |
| Change in net unrealized appreciation (depreciation) | | 1,630,156 | | (7,070,717) |
| Net increase (decrease) in net assets resulting from operations | | 3,022,438 | | (4,029,945) |
| Distributions to shareholders | | (2,340,895) | | (4,259,091) |
| | | | | |
| Share transactions - net increase (decrease) | | (699,333) | | 1,462,727 |
| Total increase (decrease) in net assets | | (17,790) | | (6,826,309) |
| | | | | |
| Net Assets | | | | |
| Beginning of period | | 27,679,231 | | 34,505,540 |
| End of period | $ | 27,661,441 | $ | 27,679,231 |
| | | | | |
| | | | | |
Consolidated Financial Highlights
| Years ended August 31, | | 2023 | | 2022 | | 2021 | | 2020 | | 2019 |
Selected Per-Share Data | | | | | | | | | | |
| Net asset value, beginning of period | $ | 22.76 | $ | 29.62 | $ | 25.87 | $ | 22.17 | $ | 25.10 |
| Income from Investment Operations | | | | | | | | | | |
Net investment income (loss) A,B | | .38 | | .33 | | .25 | | .30 | | .34 |
| Net realized and unrealized gain (loss) | | 1.98 | | (3.57) | | 4.79 | | 4.35 | | (.27) |
| Total from investment operations | | 2.36 | | (3.24) | | 5.04 | | 4.65 | | .07 |
| Distributions from net investment income | | (.35) | | (.39) C | | (.25) | | (.32) | | (.36) |
| Distributions from net realized gain | | (1.59) | | (3.23) C | | (1.04) | | (.63) | | (2.63) |
| Total distributions | | (1.94) | | (3.62) | | (1.29) | | (.95) | | (3.00) D |
| Net asset value, end of period | $ | 23.18 | $ | 22.76 | $ | 29.62 | $ | 25.87 | $ | 22.17 |
Total Return E | | 12.00% | | (12.30)% | | 20.33% | | 21.84% | | 1.17% |
Ratios to Average Net Assets B,F,G | | | | | | | | | | |
| Expenses before reductions | | .51% | | .50% | | .51% | | .52% | | .53% |
| Expenses net of fee waivers, if any | | .50% | | .50% | | .51% | | .52% | | .53% |
| Expenses net of all reductions | | .50% | | .50% | | .50% | | .52% | | .53% |
| Net investment income (loss) | | 1.76% | | 1.31% | | .93% | | 1.33% | | 1.58% |
| Supplemental Data | | | | | | | | | | |
| Net assets, end of period (in millions) | $ | 23,959 | $ | 23,519 | $ | 28,846 | $ | 24,168 | $ | 21,319 |
Portfolio turnover rate H | | 52% I | | 62% I | | 58% I | | 55% I | | 132% I |
ACalculated based on average shares outstanding during the period.
BNet investment income (loss) is affected by the timing of the declaration of dividends by any underlying mutual funds or exchange-traded funds (ETFs). Net investment income (loss) of any mutual funds or ETFs is not included in the Fund's net investment income (loss) ratio.
CThe amount shown reflects reclassifications related to book to tax differences that were made in the year shown.
DTotal distributions per share do not sum due to rounding.
ETotal returns would have been lower if certain expenses had not been reduced during the applicable periods shown.
FExpense ratios reflect operating expenses of the class. Expenses before reductions do not reflect amounts reimbursed, waived, or reduced through arrangements with the investment adviser, brokerage services, or other offset arrangements, if applicable, and do not represent the amount paid by the class during periods when reimbursements, waivers or reductions occur.
GFees and expenses of any underlying mutual funds or exchange-traded funds (ETFs) are not included in the Fund's expense ratio. The Fund indirectly bears its proportionate share of these expenses. For additional expense information related to investments in Fidelity Central Funds, please refer to the "Investments in Fidelity Central Funds" note found in the Notes to consolidated Financial Statements section of the most recent Annual or Semi-Annual report. For additional expense information related to investments in Fidelity Private Credit Central Fund LLC, please refer to the Investment in Fidelity Private Credit Central Fund LLC note found in the Notes to consolidated Financial Statements section of the most recent Annual or Semi-Annual report.
HAmount does not include the portfolio activity of any underlying mutual funds or exchange-traded funds (ETFs).
IPortfolio turnover rate excludes securities received or delivered in-kind.
| Fidelity® Puritan® Fund Class K |
| |
| Years ended August 31, | | 2023 | | 2022 | | 2021 | | 2020 | | 2019 |
Selected Per-Share Data | | | | | | | | | | |
| Net asset value, beginning of period | $ | 22.74 | $ | 29.60 | $ | 25.85 | $ | 22.15 | $ | 25.09 |
| Income from Investment Operations | | | | | | | | | | |
Net investment income (loss) A,B | | .40 | | .35 | | .27 | | .32 | | .36 |
| Net realized and unrealized gain (loss) | | 1.98 | | (3.57) | | 4.79 | | 4.35 | | (.28) |
| Total from investment operations | | 2.38 | | (3.22) | | 5.06 | | 4.67 | | .08 |
| Distributions from net investment income | | (.37) | | (.41) C | | (.27) | | (.34) | | (.38) |
| Distributions from net realized gain | | (1.59) | | (3.23) C | | (1.04) | | (.63) | | (2.63) |
| Total distributions | | (1.96) | | (3.64) | | (1.31) | | (.97) | | (3.02) D |
| Net asset value, end of period | $ | 23.16 | $ | 22.74 | $ | 29.60 | $ | 25.85 | $ | 22.15 |
Total Return E | | 12.10% | | (12.24)% | | 20.43% | | 21.97% | | 1.22% |
Ratios to Average Net Assets B,F,G | | | | | | | | | | |
| Expenses before reductions | | .43% | | .43% | | .43% | | .44% | | .45% |
| Expenses net of fee waivers, if any | | .42% | | .42% | | .43% | | .44% | | .45% |
| Expenses net of all reductions | | .42% | | .42% | | .43% | | .43% | | .44% |
| Net investment income (loss) | | 1.84% | | 1.39% | | 1.00% | | 1.41% | | 1.67% |
| Supplemental Data | | | | | | | | | | |
| Net assets, end of period (in millions) | $ | 3,702 | $ | 4,160 | $ | 5,659 | $ | 5,478 | $ | 5,662 |
Portfolio turnover rate H | | 52% I | | 62% I | | 58% I | | 55% I | | 132% I |
ACalculated based on average shares outstanding during the period.
BNet investment income (loss) is affected by the timing of the declaration of dividends by any underlying mutual funds or exchange-traded funds (ETFs). Net investment income (loss) of any mutual funds or ETFs is not included in the Fund's net investment income (loss) ratio.
CThe amount shown reflects reclassifications related to book to tax differences that were made in the year shown.
DTotal distributions per share do not sum due to rounding.
ETotal returns would have been lower if certain expenses had not been reduced during the applicable periods shown.
FExpense ratios reflect operating expenses of the class. Expenses before reductions do not reflect amounts reimbursed, waived, or reduced through arrangements with the investment adviser, brokerage services, or other offset arrangements, if applicable, and do not represent the amount paid by the class during periods when reimbursements, waivers or reductions occur.
GFees and expenses of any underlying mutual funds or exchange-traded funds (ETFs) are not included in the Fund's expense ratio. The Fund indirectly bears its proportionate share of these expenses. For additional expense information related to investments in Fidelity Central Funds, please refer to the "Investments in Fidelity Central Funds" note found in the Notes to consolidated Financial Statements section of the most recent Annual or Semi-Annual report. For additional expense information related to investments in Fidelity Private Credit Central Fund LLC, please refer to the Investment in Fidelity Private Credit Central Fund LLC note found in the Notes to consolidated Financial Statements section of the most recent Annual or Semi-Annual report.
HAmount does not include the portfolio activity of any underlying mutual funds or exchange-traded funds (ETFs).
IPortfolio turnover rate excludes securities received or delivered in-kind.
For the period ended August 31, 2023
(Amounts in thousands except percentages)
1. Organization.
Fidelity Puritan Fund (the Fund) is a fund of Fidelity Puritan Trust (the Trust) and is authorized to issue an unlimited number of shares. The Trust is registered under the Investment Company Act of 1940, as amended (the 1940 Act), as an open-end management investment company organized as a Massachusetts business trust. The Fund offers Puritan and Class K shares, each of which has equal rights as to assets and voting privileges. Each class has exclusive voting rights with respect to matters that affect that class.
2. Investments in Fidelity Central Funds.
Funds may invest in Fidelity Central Funds, which are open-end investment companies generally available only to other investment companies and accounts managed by the investment adviser and its affiliates. The Consolidated Schedule of Investments lists any Fidelity Central Funds held as an investment as of period end, but does not include the underlying holdings of each Fidelity Central Fund. An investing fund indirectly bears its proportionate share of the expenses of the underlying Fidelity Central Funds.
Based on its investment objective, each Fidelity Central Fund may invest or participate in various investment vehicles or strategies that are similar to those of the investing fund. These strategies are consistent with the investment objectives of the investing fund and may involve certain economic risks which may cause a decline in value of each of the Fidelity Central Funds and thus a decline in the value of the investing fund.
| Fidelity Central Fund | Investment Manager | Investment Objective | Investment Practices | Expense RatioA |
| Fidelity High Income Central Fund | Fidelity Management & Research Company LLC (FMR) | Seeks a high level of income and may also seek capital appreciation by investing primarily in debt securities, preferred stocks, and convertible securities, with an emphasis on lower-quality debt securities. | Loans & Direct Debt Instruments Restricted Securities | .03% |
| Fidelity Investment Grade Bond Central Fund | Fidelity Management & Research Company LLC (FMR) | Seeks a high level of income by normally investing in investment-grade debt securities. | Delayed Delivery & When Issued Securities Futures Options Restricted Securities Swaps | Less than .005% |
| Fidelity Money Market Central Funds | Fidelity Management & Research Company LLC (FMR) | Each fund seeks to obtain a high level of current income consistent with the preservation of capital and liquidity. | Short-term Investments | Less than .005% |
A Expenses expressed as a percentage of average net assets and are as of each underlying Central Fund's most recent annual or semi-annual shareholder report.
An unaudited holdings listing for the investing fund, which presents direct holdings as well as the pro-rata share of any securities and other investments held indirectly through its investment in underlying non-money market Fidelity Central Funds, is available at fidelity.com and/or institutional.fidelity.com, as applicable. A complete unaudited list of holdings for each Fidelity Central Fund is available upon request or at the Securities and Exchange Commission website at www.sec.gov. In addition, the financial statements of the Fidelity Central Funds which contain the significant accounting policies (including investment valuation policies) of those funds, and are not covered by the Report of Independent Registered Public Accounting Firm, are available on the Securities and Exchange Commission website or upon request.
3. Investment in Fidelity Private Credit Central Fund LLC.
The Fund invests in Fidelity Private Credit Central Fund LLC (formerly Fidelity Direct Lending Fund, LP), which is a limited liability company available only to certain investment companies managed by the investment adviser and its affiliates. On June 1, 2023, Fidelity Private Credit Central Fund elected to be regulated as a business development company (BDC). Fidelity Private Credit Central Fund LLC's units are not registered under the Securities Act of 1933 and are subject to substantial restrictions on transfer. The Fund has no redemption rights under Fidelity Private Credit Central Fund LLC's limited liability company agreement. There will be no trading market for the units.
Based on its investment objective, Fidelity Private Credit Central Fund LLC may invest or participate in various investments or strategies that are similar to those in which the Fund may invest or participate. These strategies are consistent with the investment objectives of the Fund and may involve certain economic risks which may cause a decline in value of Fidelity Private Credit Central Fund LLC and thus a decline in the value of the Fund. Fidelity Private Credit Central Fund LLC intends to invest primarily in directly originated loans to private companies but also with liquid credit investments, like broadly syndicated loans, and other select private credit investments.
The Consolidated Schedule of Investments lists Fidelity Private Credit Central Fund LLC as an investment as of period end, but does not include the underlying holdings of Fidelity Private Credit Central Fund LLC. Fidelity Private Credit Central Fund LLC represented less than 5% of the Fund's net assets at period end. The Fund indirectly bears its proportionate share of the expenses of Fidelity Private Credit Central Fund LLC. The annualized expense ratio for Fidelity Private Credit Central Fund LLC for the six month period ended June 30, 2023 was 8.51%.
4. Significant Accounting Policies.
The Fund is an investment company and applies the accounting and reporting guidance of the Financial Accounting Standards Board (FASB) Accounting Standards Codification Topic 946 Financial Services - Investment Companies. The consolidated financial statements have been prepared in conformity with accounting principles generally accepted in the United States of America (GAAP), which require management to make certain estimates and assumptions at the date of the consolidated financial statements. Actual results could differ from those estimates. Subsequent events, if any, through the date that the consolidated financial statements were issued have been evaluated in the preparation of the consolidated financial statements. The Fund's Consolidated Schedule of Investments lists any underlying mutual funds or exchange-traded funds (ETFs) but does not include the underlying holdings of these funds. The following summarizes the significant accounting policies of the Fund:
Investment Valuation. Investments are valued as of 4:00 p.m. Eastern time on the last calendar day of the period. The Board of Trustees (the Board) has designated the Fund's investment adviser as the valuation designee responsible for the fair valuation function and performing fair value determinations as needed. The investment adviser has established a Fair Value Committee (the Committee) to carry out the day-to-day fair valuation responsibilities and has adopted policies and procedures to govern the fair valuation process and the activities of the Committee. In accordance with these fair valuation policies and procedures, which have been approved by the Board, the Fund attempts to obtain prices from one or more third party pricing services or brokers to value its investments. When current market prices, quotations or currency exchange rates are not readily available or reliable, investments will be fair valued in good faith by the Committee, in accordance with the policies and procedures. Factors used in determining fair value vary by investment type and may include market or investment specific events, transaction data, estimated cash flows, and market observations of comparable investments. The frequency that the fair valuation procedures are used cannot be predicted and they may be utilized to a significant extent. The Committee manages the Fund's fair valuation practices and maintains the fair valuation policies and procedures. The Fund's investment adviser reports to the Board information regarding the fair valuation process and related material matters.
The Fund categorizes the inputs to valuation techniques used to value its investments into a disclosure hierarchy consisting of three levels as shown below:
Level 1 - unadjusted quoted prices in active markets for identical investments
Level 2 - other significant observable inputs (including quoted prices for similar investments, interest rates, prepayment speeds, etc.)
Level 3 - unobservable inputs (including the Fund's own assumptions based on the best information available)
Valuation techniques used to value the Fund's investments by major category are as follows:
Equity securities, including restricted securities, for which market quotations are readily available, are valued at the last reported sale price or official closing price as reported by a third party pricing service on the primary market or exchange on which they are traded and are categorized as Level 1 in the hierarchy. In the event there were no sales during the day or closing prices are not available, securities are valued at the last quoted bid price or may be valued using the last available price and are generally categorized as Level 2 in the hierarchy. For foreign equity securities, when market or security specific events arise, comparisons to the valuation of American Depositary Receipts (ADRs), futures contracts, ETFs and certain indexes as well as quoted prices for similar securities may be used and would be categorized as Level 2 in the hierarchy. For equity securities, including restricted securities, where observable inputs are limited, assumptions about market activity and risk are used and these securities may be categorized as Level 3 in the hierarchy.
Debt securities, including restricted securities, are valued based on evaluated prices received from third party pricing services or from brokers who make markets in such securities. Corporate bonds are valued by pricing services who utilize matrix pricing which considers yield or price of bonds of comparable quality, coupon, maturity and type or by broker-supplied prices. When independent prices are unavailable or unreliable, debt securities may be valued utilizing pricing methodologies which consider similar factors that would be used by third party pricing services. Debt securities are generally categorized as Level 2 in the hierarchy but may be Level 3 depending on the circumstances.
Investments in open-end mutual funds, including the Fidelity Central Funds, are valued at their closing net asset value (NAV) each business day and are categorized as Level 1 in the hierarchy.
Fidelity Private Credit Central Fund LLC is valued at its net asset value (NAV) each month end and is categorized as Level 2 in the hierarchy.
Changes in valuation techniques may result in transfers in or out of an assigned level within the disclosure hierarchy. The aggregate value of investments by input level as of August 31, 2023 is included at the end of the Fund's Consolidated Schedule of Investments.
Foreign Currency. Certain Funds may use foreign currency contracts to facilitate transactions in foreign-denominated securities. Gains and losses from these transactions may arise from changes in the value of the foreign currency or if the counterparties do not perform under the contracts' terms.
Foreign-denominated assets, including investment securities, and liabilities are translated into U.S. dollars at the exchange rates at period end. Purchases and sales of investment securities, income and dividends received, and expenses denominated in foreign currencies are translated into U.S. dollars at the exchange rate in effect on the transaction date.
The effects of exchange rate fluctuations on investments are included with the net realized and unrealized gain (loss) on investment securities. Other foreign currency transactions resulting in realized and unrealized gain (loss) are disclosed separately.
Investment Transactions and Income. For financial reporting purposes, the Fund's investment holdings and NAV include trades executed through the end of the last business day of the period. The NAV per share for processing shareholder transactions is calculated as of the close of business of the New York Stock Exchange (NYSE), normally 4:00 p.m. Eastern time and includes trades executed through the end of the prior business day. Gains and losses on securities sold are determined on the basis of identified cost and include proceeds received from litigation. Commissions paid to certain brokers with whom the investment adviser, or its affiliates, places trades on behalf of a fund include an amount in addition to trade execution, which may be rebated back to a fund. Any such rebates are included in net realized gain (loss) on investments in the Consolidated Statement of Operations. Dividend income is recorded on the ex-dividend date, except for certain dividends from foreign securities where the ex-dividend date may have passed, which are recorded as soon as the Fund is informed of the ex-dividend date. Non-cash dividends included in dividend income, if any, are recorded at the fair market value of the securities received. Income and capital gain distributions from Fidelity Central Funds, if any, are recorded on the ex-dividend date. Certain distributions received by the Fund represent a return of capital or capital gain. The Fund determines the components of these distributions subsequent to the ex-dividend date, based upon receipt of tax filings or other correspondence relating to the underlying investment. These distributions are recorded as a reduction of cost of investments and/or as a realized gain. Interest income is accrued as earned and includes coupon interest and amortization of premium and accretion of discount on debt securities as applicable. Investment income is recorded net of foreign taxes withheld where recovery of such taxes is uncertain. Debt obligations may be placed on non-accrual status and related interest income may be reduced by ceasing current accruals and writing off interest receivables when the collection of all or a portion of interest has become doubtful based on consistently applied procedures. A debt obligation is removed from non-accrual status when the issuer resumes interest payments or when collectability of interest is reasonably assured. Funds may file withholding tax reclaims in certain jurisdictions to recover a portion of amounts previously withheld. Any withholding tax reclaims income is included in the Consolidated Statement of Operations in dividends. Any receivables for withholding tax reclaims are included in the Consolidated Statement of Assets and Liabilities in dividends receivable.
Class Allocations and Expenses. Investment income, realized and unrealized capital gains and losses, common expenses of a fund, and certain fund-level expense reductions, if any, are allocated daily on a pro-rata basis to each class based on the relative net assets of each class to the total net assets of a fund. Each class differs with respect to transfer agent and distribution and service plan fees incurred, as applicable. Certain expense reductions may also differ by class, if applicable. For the reporting period, the allocated portion of income and expenses to each class as a percent of its average net assets may vary due to the timing of recording these transactions in relation to fluctuating net assets of the classes. Expenses directly attributable to a fund are charged to that fund. Expenses attributable to more than one fund are allocated among the respective funds on the basis of relative net assets or other appropriate methods. Expenses included in the accompanying consolidated financial statements reflect the expenses of that fund and do not include any expenses associated with any underlying mutual funds or exchange-traded funds (ETFs). Although not included in a fund's expenses, a fund indirectly bears its proportionate share of these expenses through the net asset value of each underlying mutual fund or exchange-traded fund (ETF). Expense estimates are accrued in the period to which they relate and adjustments are made when actual amounts are known.
Deferred Trustee Compensation. Under a Deferred Compensation Plan (the Plan) for certain Funds, certain independent Trustees have elected to defer receipt of a portion of their annual compensation. Deferred amounts are invested in affiliated mutual funds, are marked-to-market and remain in a fund until distributed in accordance with the Plan. The investment of deferred amounts and the offsetting payable to the Trustees presented below are included in the accompanying Consolidated Statement of Assets and Liabilities in other receivables and other payables and accrued expenses, as applicable.
| Fidelity Puritan Fund | $1,042 |
Income Tax Information and Distributions to Shareholders. Each year, the Fund intends to qualify as a regulated investment company under Subchapter M of the Internal Revenue Code, including distributing substantially all of its taxable income and realized gains. As a result, no provision for U.S. Federal income taxes is required. As of August 31, 2023, the Fund did not have any unrecognized tax benefits in the consolidated financial statements; nor is the Fund aware of any tax positions for which it is reasonably possible that the total amounts of unrecognized tax benefits will significantly change in the next twelve months. The Fund files a U.S. federal tax return, in addition to state and local tax returns as required. The Fund's federal income tax returns are subject to examination by the Internal Revenue Service (IRS) for a period of three fiscal years after they are filed. State and local tax returns may be subject to examination for an additional fiscal year depending on the jurisdiction. Foreign taxes are provided for based on the Fund's understanding of the tax rules and rates that exist in the foreign markets in which it invests.
Distributions are declared and recorded on the ex-dividend date. Income and capital gain distributions are declared separately for each class. Income and capital gain distributions are determined in accordance with income tax regulations, which may differ from GAAP. In addition, the Fund claimed a portion of the payment made to redeeming shareholders as a distribution for income tax purposes.
Capital accounts within the consolidated financial statements are adjusted for permanent book-tax differences. These adjustments have no impact on net assets or the results of operations. Capital accounts are not adjusted for temporary book-tax differences which will reverse in a subsequent period.
Book-tax differences are primarily due to foreign currency transactions, redemptions in-kind and losses deferred due to wash sales.
As of period end, the cost and unrealized appreciation (depreciation) in securities, and derivatives if applicable, for federal income tax purposes were as follows:
| Gross unrealized appreciation | $6,483,005 |
| Gross unrealized depreciation | (1,480,466) |
| Net unrealized appreciation (depreciation) | $5,002,539 |
| Tax Cost | $22,721,145 |
The tax-based components of distributable earnings as of period end were as follows:
| Undistributed ordinary income | $82,916 |
| Undistributed long-term capital gain | $829,045 |
| Net unrealized appreciation (depreciation) on securities and other investments | $5,002,523 |
The tax character of distributions paid was as follows:
| | August 31, 2023 | August 31, 2022 |
| Ordinary Income | $433,341 | $1,197,159 |
| Long-term Capital Gains | 1,907,554 | 3,061,932 |
| Total | $2,340,895 | $4,259,091 |
Restricted Securities (including Private Placements). Funds may invest in securities that are subject to legal or contractual restrictions on resale. These securities generally may be resold in transactions exempt from registration or to the public if the securities are registered. Disposal of these securities may involve time-consuming negotiations and expense, and prompt sale at an acceptable price may be difficult. Information regarding restricted securities held at period end is included at the end of the Consolidated Schedule of Investments, if applicable.
Commitments. A commitment is an agreement to acquire an investment at a future date (subject to conditions) in connection with a potential public or non-public offering. The amount of commitments outstanding at period end are presented in the table below. These commitments are not included in the net assets of the Fund at period end.
| | Investment to be Acquired | Commitment Amount |
| Fidelity Puritan Fund | Fidelity Private Credit Central Fund LLC | $52,407 |
Consolidated Subsidiary. The Funds included in the table below hold certain investments through a wholly-owned subsidiary ("Subsidiary"), which may be subject to federal and state taxes upon disposition.
As of period end, investments in Subsidiaries were as follows:
| | $ Amount | % of Net Assets |
| Fidelity Puritan Fund | 70,067 | .25 |
The financial statements have been consolidated to include the Subsidiary accounts where applicable. Accordingly, all inter-company transactions and balances have been eliminated.
At period end, any estimated tax liability for these investments is presented as "Deferred taxes" in the Consolidated Statement of Assets and Liabilities and included in "Change in net unrealized appreciation (depreciation) on investment securities" in the Consolidated Statement of Operations. The tax liability incurred may differ materially depending on conditions when these investments are disposed. Any cash held by a Subsidiary is restricted as to its use and is presented as "Restricted cash" in the Consolidated Statement of Assets and Liabilities, if applicable.
5. Derivative Instruments.
Risk Exposures and the Use of Derivative Instruments. The Fund's investment objectives allow for various types of derivative instruments, including options. Derivatives are investments whose value is primarily derived from underlying assets, indices or reference rates and may be transacted on an exchange or over-the-counter (OTC). Derivatives may involve a future commitment to buy or sell a specified asset based on specified terms, to exchange future cash flows at periodic intervals based on a notional principal amount, or for one party to make one or more payments upon the occurrence of specified events in exchange for periodic payments from the other party.
Derivatives were used to increase returns and to manage exposure to certain risks as defined below. The success of any strategy involving derivatives depends on analysis of numerous economic factors, and if the strategies for investment do not work as intended, the objectives may not be achieved.
Derivatives were used to increase or decrease exposure to the following risk(s):
| | |
| Equity Risk | Equity risk relates to the fluctuations in the value of financial instruments as a result of changes in market prices (other than those arising from interest rate risk or foreign exchange risk), whether caused by factors specific to an individual investment, its issuer, or all factors affecting all instruments traded in a market or market segment. |
Funds are also exposed to additional risks from investing in derivatives, such as liquidity risk and counterparty credit risk. Liquidity risk is the risk that a fund will be unable to close out the derivative in the open market in a timely manner. Counterparty credit risk is the risk that the counterparty will not be able to fulfill its obligation to a fund. Counterparty credit risk related to exchange-traded contracts may be mitigated by the protection provided by the exchange on which they trade.
Investing in derivatives may involve greater risks than investing in the underlying assets directly and, to varying degrees, may involve risk of loss in excess of any initial investment and collateral received and amounts recognized in the Consolidated Statement of Assets and Liabilities. In addition, there may be the risk that the change in value of the derivative contract does not correspond to the change in value of the underlying instrument.
Options. Options give the purchaser the right, but not the obligation, to buy (call) or sell (put) an underlying security or financial instrument at an agreed exercise or strike price between or on certain dates. Options obligate the seller (writer) to buy (put) or sell (call) an underlying instrument at the exercise or strike price or cash settle an underlying derivative instrument if the holder exercises the option on or before the expiration date.
Exchange-traded written covered call options were used to manage exposure to the market. When a fund writes a covered call option, a fund holds the underlying instrument which must be delivered to the holder upon the exercise of the option.
Upon entering into a written options contract, a fund will receive a premium. Premiums received are reflected as a liability on the Consolidated Statement of Assets and Liabilities. Options are valued daily and any unrealized appreciation (depreciation) is reflected in total accumulated earnings (loss) in the Consolidated Statement of Assets and Liabilities. When a written option is exercised, the premium is added to the proceeds from the sale of the underlying instrument in determining the gain or loss realized on that investment. When an option is closed, a gain or loss is realized depending on whether the proceeds or amount paid for the closing sale transaction are greater or less than the premium received. When an option expires, gains and losses are realized to the extent of premiums received. The net realized gain (loss) on closed and expired written options and the change in net unrealized appreciation (depreciation) on written options are presented in the Consolidated Statement of Operations.
Writing call options tends to decrease exposure to the underlying instrument and risk of loss is the change in value in excess of the premium received.
Any open options at period end are presented in the Consolidated Schedule of Investments under the caption "Written Options", and are representative of volume of activity during the period unless an average contracts amount is presented.
6. Purchases and Sales of Investments.
Purchases and sales of securities, other than short-term securities and in-kind transactions, as applicable, are noted in the table below.
| | Purchases ($) | Sales ($) |
| Fidelity Puritan Fund | 13,832,717 | 15,796,822 |
Unaffiliated Redemptions In-Kind. Shares that were redeemed in-kind for investments, including accrued interest and cash, if any, are shown in the table below. The net realized gain or loss on investments delivered through in-kind redemptions is included in the "Net realized gain (loss) on: Redemptions in-kind" line in the accompanying Consolidated Statement of Operations. The amount of the in-kind redemptions is included in share transactions in the accompanying Consolidated Statement of Changes in Net Assets. There was no gain or loss for federal income tax purposes.
| | Shares | Total net realized gain or loss ($) | Total Proceeds ($) | Participating classes |
| Fidelity Puritan Fund | 710 | 4,410 | 15,422 | Class K |
Prior Fiscal Year Unaffiliated Redemptions In-Kind. Shares that were redeemed in-kind for investments, including accrued interest and cash, if any, are shown in the table below; along with realized gain or loss on investments delivered through in-kind redemptions. The amount of the in-kind redemptions is included in share transactions in the accompanying Consolidated Statement of Changes in Net Assets. There was no gain or loss for federal income tax purposes.
| | Shares | Total net realized gain or loss ($) | Total Proceeds ($) | Participating classes |
| Fidelity Puritan Fund | 11,361 | 114,304 | 291,485 | Puritan and Class K |
7. Fees and Other Transactions with Affiliates.
Management Fee. Fidelity Management & Research Company LLC (the investment adviser) and its affiliates provide the Fund with investment management related services for which the Fund pays a monthly management fee. The management fee is the sum of an individual fund fee rate that is based on an annual rate of .15% of the Fund's average net assets and an annualized group fee rate that averaged .23% during the period. The group fee rate is based upon the monthly average net assets of a group of registered investment companies with which the investment adviser has management contracts. The group fee rate decreases as assets under management increase and increases as assets under management decrease. For the reporting period, the total annual management fee rate was .38% of the Fund's average net assets.
Transfer Agent Fees. Fidelity Investments Institutional Operations Company LLC (FIIOC), an affiliate of the investment adviser, is the transfer, dividend disbursing and shareholder servicing agent for each class of the Fund. FIIOC receives account fees and asset-based fees that vary according to the account size and type of account of the shareholders of the respective classes of the Fund, except for Class K. FIIOC receives an asset-based fee of Class K's average net assets. FIIOC pays for typesetting, printing and mailing of shareholder reports, except proxy statements.
For the period, transfer agent fees for each class were as follows:
| | Amount | % of Class-Level Average Net Assets |
| Puritan | $28,162 | .12 |
| Class K | 1,660 | .04 |
| | $29,822 | |
Accounting Fees. Fidelity Service Company, Inc. (FSC), an affiliate of the investment adviser, maintains the Fund's accounting records. The accounting fee is based on the level of average net assets for each month. For the period, the fees were equivalent to the following annual rates:
| | % of Average Net Assets |
| Fidelity Puritan Fund | .01 |
Brokerage Commissions. A portion of portfolio transactions were placed with brokerage firms which are affiliates of the investment adviser. Brokerage commissions are included in net realized gain (loss) and change in net unrealized appreciation (depreciation) in the Consolidated Statement of Operations. The commissions paid to these affiliated firms were as follows:
| | Amount |
| Fidelity Puritan Fund | $ 319 |
Interfund Lending Program. Pursuant to an Exemptive Order issued by the Securities and Exchange Commission (the SEC), the Fund, along with other registered investment companies having management contracts with Fidelity Management & Research Company LLC (FMR), or other affiliated entities of FMR, may participate in an interfund lending program. This program provides an alternative credit facility allowing the Fund to borrow from, or lend money to, other participating affiliated funds. At period end, there were no interfund loans outstanding. Activity in this program during the period for which loans were outstanding was as follows:
| | Borrower or Lender | Average Loan Balance | Weighted Average Interest Rate | Interest Expense |
| Fidelity Puritan Fund | Borrower | $6,684 | 3.32% | $1 |
Interfund Trades. Funds may purchase from or sell securities to other Fidelity Funds under procedures adopted by the Board. The procedures have been designed to ensure these interfund trades are executed in accordance with Rule 17a-7 of the 1940 Act. Any interfund trades are included within the respective purchases and sales amounts shown in the Purchases and Sales of Investments note. Interfund trades during the period are noted in the table below.
| | Purchases ($) | Sales ($) | Realized Gain (Loss) ($) |
| Fidelity Puritan Fund | 630,251 | 908,915 | 83,544 |
8. Committed Line of Credit.
Certain Funds participate with other funds managed by the investment adviser or an affiliate in a $4.25 billion credit facility (the "line of credit") to be utilized for temporary or emergency purposes to fund shareholder redemptions or for other short-term liquidity purposes. The participating funds have agreed to pay commitment fees on their pro-rata portion of the line of credit, which are reflected in Miscellaneous expenses on the Consolidated Statement of Operations, and are listed below. During the period, there were no borrowings on this line of credit.
| | Amount |
| Fidelity Puritan Fund | $50 |
9. Security Lending.
Funds lend portfolio securities from time to time in order to earn additional income. Lending agents are used, including National Financial Services (NFS), an affiliate of the investment adviser. Pursuant to a securities lending agreement, NFS will receive a fee, which is capped at 9.9% of a fund's daily lending revenue, for its services as lending agent. A fund may lend securities to certain qualified borrowers, including NFS. On the settlement date of the loan, a fund receives collateral (in the form of U.S. Treasury obligations, letters of credit and/or cash) against the loaned securities and maintains collateral in an amount not less than 100% of the market value of the loaned securities during the period of the loan. The market value of the loaned securities is determined at the close of business of a fund and any additional required collateral is delivered to a fund on the next business day. A fund or borrower may terminate the loan at any time, and if the borrower defaults on its obligation to return the securities loaned because of insolvency or other reasons, a fund may apply collateral received from the borrower against the obligation. A fund may experience delays and costs in recovering the securities loaned. Any cash collateral received is invested in the Fidelity Securities Lending Cash Central Fund. Any loaned securities are identified as such in the Consolidated Schedule of Investments, and the value of loaned securities and cash collateral at period end, as applicable, are presented in the Consolidated Statement of Assets and Liabilities. Security lending income represents the income earned on investing cash collateral, less rebates paid to borrowers and any lending agent fees associated with the loan, plus any premium payments received for lending certain types of securities. Security lending income is presented in the Consolidated Statement of Operations as a component of income from Fidelity Central Funds. Affiliated security lending activity, if any, was as follows:
| | Total Security Lending Fees Paid to NFS | Security Lending Income From Securities Loaned to NFS | Value of Securities Loaned to NFS at Period End |
| Fidelity Puritan Fund | $29 | $5 | $- |
10. Expense Reductions.
The investment adviser has contractually agreed to waive the Fund's management fee with respect to the portion of the Fund's assets invested in Fidelity Private Credit Central Fund LLC until December 31, 2024. During the period, this waiver reduced the Fund's management fee by $2.
Through arrangements with the Fund's custodian, credits realized as a result of certain uninvested cash balances were used to reduce the Fund's expenses. During the period, custodian credits reduced the Fund's expenses by $3.
In addition, during the period the investment adviser or an affiliate reimbursed and/or waived a portion of fund-level operating expenses in the amount of $1,347.
11. Distributions to Shareholders.
Distributions to shareholders of each class were as follows:
| | Year ended August 31, 2023 | Year ended August 31, 2022 |
| Fidelity Puritan Fund | | |
| Distributions to shareholders | | |
| Puritan | $ 1,987,615 | $3,565,291 |
| Class K | 353,280 | 693,800 |
Total | $2,340,895 | $4,259,091 |
12. Share Transactions.
Share transactions for each class were as follows and may contain in-kind transactions, automatic conversions between classes or exchanges between affiliated funds:
| | Shares | Shares | Dollars | Dollars |
| | Year ended August 31, 2023 | Year ended August 31, 2022 | Year ended August 31, 2023 | Year ended August 31, 2022 |
| Fidelity Puritan Fund | | | | |
| Puritan | | | | |
| Shares sold | 52,955 | 76,593 | $1,149,216 | $1,980,329 |
| Reinvestment of distributions | 94,555 | 128,760 | 1,862,907 | 3,364,271 |
| Shares redeemed | (147,229) | (145,883) | (3,168,970) | (3,687,223) |
| Net increase (decrease) | 281 | 59,470 | $(156,847) | $1,657,377 |
| Class K | | | | |
| Shares sold | 17,434 | 18,873 | $375,693 | $482,080 |
| Reinvestment of distributions | 17,952 | 26,573 | 353,263 | 693,798 |
| Shares redeemed | (58,447) | (53,712) | (1,271,442) | (1,370,528) |
| Net increase (decrease) | (23,061) | (8,266) | $(542,486) | $(194,650) |
13. Other.
A fund's organizational documents provide former and current trustees and officers with a limited indemnification against liabilities arising in connection with the performance of their duties to the fund. In the normal course of business, a fund may also enter into contracts that provide general indemnifications. A fund's maximum exposure under these arrangements is unknown as this would be dependent on future claims that may be made against a fund. The risk of material loss from such claims is considered remote.
14. Risk and Uncertainties.
Many factors affect a fund's performance. Developments that disrupt global economies and financial markets, such as pandemics, epidemics, outbreaks of infectious diseases, war, terrorism, and environmental disasters, may significantly affect a fund's investment performance. The effects of these developments to a fund will be impacted by the types of securities in which a fund invests, the financial condition, industry, economic sector, and geographic location of an issuer, and a fund's level of investment in the securities of that issuer. Significant concentrations in security types, issuers, industries, sectors, and geographic locations may magnify the factors that affect a fund's performance.
To the Board of Trustees of Fidelity Puritan Trust and Shareholders of Fidelity Puritan Fund
Opinion on the Financial Statements
We have audited the accompanying consolidated statement of assets and liabilities, including the consolidated schedule of investments, of Fidelity Puritan Fund and its subsidiaries (one of the funds constituting Fidelity Puritan Trust, referred to hereafter as the "Fund") as of August 31, 2023, the related consolidated statement of operations for the year ended August 31, 2023, the consolidated statement of changes in net assets for each of the two years in the period ended August 31, 2023, including the related notes, and the consolidated financial highlights for each of the five years in the period ended August 31, 2023 (collectively referred to as the "consolidated financial statements"). In our opinion, the consolidated financial statements present fairly, in all material respects, the financial position of the Fund as of August 31, 2023, the results of its operations for the year then ended, the changes in its net assets for each of the two years in the period ended August 31, 2023 and the financial highlights for each of the five years in the period ended August 31, 2023 in conformity with accounting principles generally accepted in the United States of America.
Basis for Opinion
These consolidated financial statements are the responsibility of the Fund's management. Our responsibility is to express an opinion on the Fund's consolidated financial statements based on our audits. We are a public accounting firm registered with the Public Company Accounting Oversight Board (United States) (PCAOB) and are required to be independent with respect to the Fund in accordance with the U.S. federal securities laws and the applicable rules and regulations of the Securities and Exchange Commission and the PCAOB.
We conducted our audits of these consolidated financial statements in accordance with the standards of the PCAOB. Those standards require that we plan and perform the audit to obtain reasonable assurance about whether the consolidated financial statements are free of material misstatement, whether due to error or fraud.
Our audits included performing procedures to assess the risks of material misstatement of the consolidated financial statements, whether due to error or fraud, and performing procedures that respond to those risks. Such procedures included examining, on a test basis, evidence regarding the amounts and disclosures in the consolidated financial statements. Our audits also included evaluating the accounting principles used and significant estimates made by management, as well as evaluating the overall presentation of the consolidated financial statements. Our procedures included confirmation of securities owned as of August 31, 2023 by correspondence with the custodian, issuers of privately offered securities and brokers; when replies were not received from brokers, we performed other auditing procedures. We believe that our audits provide a reasonable basis for our opinion.
/s/ PricewaterhouseCoopers LLP
Boston, Massachusetts
October 13, 2023
We have served as the auditor of one or more investment companies in the Fidelity group of funds since 1932.
The Trustees, Members of the Advisory Board (if any), and officers of the trust and fund, as applicable, are listed below. The Board of Trustees governs the fund and is responsible for protecting the interests of shareholders. The Trustees are experienced executives who meet periodically throughout the year to oversee the fund's activities, review contractual arrangements with companies that provide services to the fund, oversee management of the risks associated with such activities and contractual arrangements, and review the fund's performance. Except for Jonathan Chiel, each of the Trustees oversees 322 funds. Mr. Chiel oversees 191 funds.
The Trustees hold office without limit in time except that (a) any Trustee may resign; (b) any Trustee may be removed by written instrument, signed by at least two-thirds of the number of Trustees prior to such removal; (c) any Trustee who requests to be retired or who has become incapacitated by illness or injury may be retired by written instrument signed by a majority of the other Trustees; and (d) any Trustee may be removed at any special meeting of shareholders by a two-thirds vote of the outstanding voting securities of the trust. Each Trustee who is not an interested person (as defined in the 1940 Act) of the trust and the fund is referred to herein as an Independent Trustee. Each Independent Trustee shall retire not later than the last day of the calendar year in which his or her 75th birthday occurs. The Independent Trustees may waive this mandatory retirement age policy with respect to individual Trustees. Officers and Advisory Board Members hold office without limit in time, except that any officer or Advisory Board Member may resign or may be removed by a vote of a majority of the Trustees at any regular meeting or any special meeting of the Trustees. Except as indicated, each individual has held the office shown or other offices in the same company for the past five years.
The fund's Statement of Additional Information (SAI) includes more information about the Trustees. To request a free copy, call Fidelity at 1-800-544-8544 if you're an individual investing directly with Fidelity, call 1-800-835-5092 if you're a plan sponsor or participant with Fidelity as your recordkeeper or call 1-877-208-0098 on institutional accounts or if you're an advisor or invest through one.
Experience, Skills, Attributes, and Qualifications of the Trustees. The Governance and Nominating Committee has adopted a statement of policy that describes the experience, qualifications, attributes, and skills that are necessary and desirable for potential Independent Trustee candidates (Statement of Policy). The Board believes that each Trustee satisfied at the time he or she was initially elected or appointed a Trustee, and continues to satisfy, the standards contemplated by the Statement of Policy. The Governance and Nominating Committee also engages professional search firms to help identify potential Independent Trustee candidates who have the experience, qualifications, attributes, and skills consistent with the Statement of Policy. From time to time, additional criteria based on the composition and skills of the current Independent Trustees, as well as experience or skills that may be appropriate in light of future changes to board composition, business conditions, and regulatory or other developments, have also been considered by the professional search firms and the Governance and Nominating Committee. In addition, the Board takes into account the Trustees' commitment and participation in Board and committee meetings, as well as their leadership of standing and ad hoc committees throughout their tenure.
In determining that a particular Trustee was and continues to be qualified to serve as a Trustee, the Board has considered a variety of criteria, none of which, in isolation, was controlling. The Board believes that, collectively, the Trustees have balanced and diverse experience, qualifications, attributes, and skills, which allow the Board to operate effectively in governing the fund and protecting the interests of shareholders. Information about the specific experience, skills, attributes, and qualifications of each Trustee, which in each case led to the Board's conclusion that the Trustee should serve (or continue to serve) as a trustee of the fund, is provided below.
Board Structure and Oversight Function. Robert A. Lawrence is an interested person and currently serves as Chair. The Trustees have determined that an interested Chair is appropriate and benefits shareholders because an interested Chair has a personal and professional stake in the quality and continuity of services provided to the fund. Independent Trustees exercise their informed business judgment to appoint an individual of their choosing to serve as Chair, regardless of whether the Trustee happens to be independent or a member of management. The Independent Trustees have determined that they can act independently and effectively without having an Independent Trustee serve as Chair and that a key structural component for assuring that they are in a position to do so is for the Independent Trustees to constitute a substantial majority for the Board. The Independent Trustees also regularly meet in executive session. David M. Thomas serves as Lead Independent Trustee and as such (i) acts as a liaison between the Independent Trustees and management with respect to matters important to the Independent Trustees and (ii) with management prepares agendas for Board meetings.
Fidelity® funds are overseen by different Boards of Trustees. The fund's Board oversees Fidelity's high income and certain equity funds, and other Boards oversee Fidelity's alternative investment, investment-grade bond, money market, asset allocation, and other equity funds. The asset allocation funds may invest in Fidelity® funds overseen by the fund's Board. The use of separate Boards, each with its own committee structure, allows the Trustees of each group of Fidelity® funds to focus on the unique issues of the funds they oversee, including common research, investment, and operational issues. On occasion, the separate Boards establish joint committees to address issues of overlapping consequences for the Fidelity® funds overseen by each Board.
The Trustees operate using a system of committees to facilitate the timely and efficient consideration of all matters of importance to the Trustees, the fund, and fund shareholders and to facilitate compliance with legal and regulatory requirements and oversight of the fund's activities and associated risks. The Board, acting through its committees, has charged FMR and its affiliates with (i) identifying events or circumstances the occurrence of which could have demonstrably adverse effects on the fund's business and/or reputation; (ii) implementing processes and controls to lessen the possibility that such events or circumstances occur or to mitigate the effects of such events or circumstances if they do occur; and (iii) creating and maintaining a system designed to evaluate continuously business and market conditions in order to facilitate the identification and implementation processes described in (i) and (ii) above. Because the day-to-day operations and activities of the fund are carried out by or through FMR, its affiliates, and other service providers, the fund's exposure to risks is mitigated but not eliminated by the processes overseen by the Trustees. While each of the Board's committees has responsibility for overseeing different aspects of the fund's activities, oversight is exercised primarily through the Operations, Audit, and Compliance Committees. Appropriate personnel, including but not limited to the fund's Chief Compliance Officer (CCO), FMR's internal auditor, the independent accountants, the fund's Treasurer and portfolio management personnel, make periodic reports to the Board's committees, as appropriate, including an annual review of Fidelity's risk management program for the Fidelity® funds. The responsibilities of each standing committee, including their oversight responsibilities, are described further under "Standing Committees of the Trustees."
Interested Trustees*:
Correspondence intended for a Trustee who is an interested person may be sent to Fidelity Investments, 245 Summer Street, Boston, Massachusetts 02210.
Name, Year of Birth; Principal Occupations and Other Relevant Experience+
Jonathan Chiel (1957)
Year of Election or Appointment: 2016
Trustee
Mr. Chiel also serves as Trustee of other Fidelity® funds. Mr. Chiel is Executive Vice President and General Counsel for FMR LLC (diversified financial services company, 2012-present). Previously, Mr. Chiel served as general counsel (2004-2012) and senior vice president and deputy general counsel (2000-2004) for John Hancock Financial Services; a partner with Choate, Hall & Stewart (1996-2000) (law firm); and an Assistant United States Attorney for the United States Attorney's Office of the District of Massachusetts (1986-95), including Chief of the Criminal Division (1993-1995). Mr. Chiel is a director on the boards of the Boston Bar Foundation and the Maimonides School.
Bettina Doulton (1964)
Year of Election or Appointment: 2021
Trustee
Ms. Doulton also serves as Trustee of other Fidelity® funds. Prior to her retirement, Ms. Doulton served in a variety of positions at Fidelity Investments, including as a managing director of research (2006-2007), portfolio manager to certain Fidelity® funds (1993-2005), equity analyst and portfolio assistant (1990-1993), and research assistant (1987-1990). Ms. Doulton currently owns and operates Phi Builders + Architects and Cellardoor Winery. Previously, Ms. Doulton served as a member of the Board of Brown Capital Management, LLC (2014-2018).
Robert A. Lawrence (1952)
Year of Election or Appointment: 2020
Trustee
Chair of the Board of Trustees
Mr. Lawrence also serves as Trustee of other funds. Previously, Mr. Lawrence served as a Trustee and Member of the Advisory Board of certain funds. Prior to his retirement in 2008, Mr. Lawrence served as Vice President of certain Fidelity® funds (2006-2008), Senior Vice President, Head of High Income Division of Fidelity Management & Research Company (investment adviser firm, 2006-2008), and President of Fidelity Strategic Investments (investment adviser firm, 2002-2005).
* Determined to be an "Interested Trustee" by virtue of, among other things, his or her affiliation with the trust or various entities under common control with FMR.
+ The information includes the Trustee's principal occupation during the last five years and other information relating to the experience, attributes, and skills relevant to the Trustee's qualifications to serve as a Trustee, which led to the conclusion that the Trustee should serve as a Trustee for the fund.
Independent Trustees:
Correspondence intended for an Independent Trustee may be sent to Fidelity Investments, P.O. Box 55235, Boston, Massachusetts 02205-5235.
Name, Year of Birth; Principal Occupations and Other Relevant Experience+
Thomas P. Bostick (1956)
Year of Election or Appointment: 2021
Trustee
Lieutenant General Bostick also serves as Trustee of other Fidelity® funds. Prior to his retirement, General Bostick (United States Army, Retired) held a variety of positions within the U.S. Army, including Commanding General and Chief of Engineers, U.S. Army Corps of Engineers (2012-2016) and Deputy Chief of Staff and Director of Human Resources, U.S. Army (2009-2012). General Bostick currently serves as a member of the Board and Finance and Governance & Sustainability Committees of CSX Corporation (transportation, 2020-present) and a member of the Board and Corporate Governance and Nominating Committee of Perma-Fix Environmental Services, Inc. (nuclear waste management, 2020-present). General Bostick serves as Chief Executive Officer of Bostick Global Strategies, LLC (consulting, 2016-present), as a member of the Board of HireVue, Inc. (video interview and assessment, 2020-present), as a member of the Board of Allonnia (biotechnology and engineering solutions, 2022-present) and on the Advisory Board of Solugen, Inc. (specialty bio-based chemicals manufacturer, 2022-present). Previously, General Bostick served as a Member of the Advisory Board of certain Fidelity® funds (2021), President, Intrexon Bioengineering (2018-2020) and Chief Operating Officer (2017-2020) and Senior Vice President of the Environment Sector (2016-2017) of Intrexon Corporation (biopharmaceutical company).
Dennis J. Dirks (1948)
Year of Election or Appointment: 2005
Trustee
Mr. Dirks also serves as Trustee of other Fidelity® funds. Prior to his retirement in May 2003, Mr. Dirks served as Chief Operating Officer and as a member of the Board of The Depository Trust & Clearing Corporation (financial markets infrastructure), President, Chief Operating Officer and a member of the Board of The Depository Trust Company (DTC), President and a member of the Board of the National Securities Clearing Corporation (NSCC), Chief Executive Officer and a member of the Board of the Government Securities Clearing Corporation and Chief Executive Officer and a member of the Board of the Mortgage-Backed Securities Clearing Corporation. Mr. Dirks currently serves as a member of the Finance Committee (2016-present) and Board (2017-present) and is Treasurer (2018-present) of the Asolo Repertory Theatre.
Donald F. Donahue (1950)
Year of Election or Appointment: 2018
Trustee
Mr. Donahue also serves as Trustee of other Fidelity® funds. Mr. Donahue serves as President and Chief Executive Officer of Miranda Partners, LLC (risk consulting for the financial services industry, 2012-present). Previously, Mr. Donahue served as Chief Executive Officer (2006-2012), Chief Operating Officer (2003-2006) and Managing Director, Customer Marketing and Development (1999-2003) of The Depository Trust & Clearing Corporation (financial markets infrastructure). Mr. Donahue currently serves as a member (2007-present) and Co-Chairman (2016-present) of the Board of United Way of New York. Mr. Donahue previously served as a member of the Advisory Board of certain Fidelity® funds (2015-2018) and as a member of the Board of The Leadership Academy (previously NYC Leadership Academy) (2012-2022).
Vicki L. Fuller (1957)
Year of Election or Appointment: 2020
Trustee
Ms. Fuller also serves as Trustee of other Fidelity® funds. Previously, Ms. Fuller served as a member of the Advisory Board of certain Fidelity® funds (2018-2020), Chief Investment Officer of the New York State Common Retirement Fund (2012-2018) and held a variety of positions at AllianceBernstein L.P. (global asset management, 1985-2012), including Managing Director (2006-2012) and Senior Vice President and Senior Portfolio Manager (2001-2006). Ms. Fuller currently serves as a member of the Board, Audit Committee and Nominating and Governance Committee of two Blackstone business development companies (2020-present), as a member of the Board of Treliant, LLC (consulting, 2019-present), as a member of the Board of Ariel Alternatives, LLC (private equity, 2022-present) and as a member of the Board and Chair of the Audit Committee of Gusto, Inc. (software, 2021-present). In addition, Ms. Fuller currently serves as a member of the Board of Roosevelt University (2019-present) and as a member of the Executive Board of New York University's Stern School of Business. Ms. Fuller previously served as a member of the Board, Audit Committee and Nominating and Governance Committee of The Williams Companies, Inc. (natural gas infrastructure, 2018-2021).
Patricia L. Kampling (1959)
Year of Election or Appointment: 2020
Trustee
Ms. Kampling also serves as Trustee of other Fidelity® funds. Prior to her retirement, Ms. Kampling served as Chairman of the Board and Chief Executive Officer (2012-2019), President and Chief Operating Officer (2011-2012) and Executive Vice President and Chief Financial Officer (2010-2011) of Alliant Energy Corporation. Ms. Kampling currently serves as a member of the Board, Finance Committee and Governance, Compensation and Nominating Committee of Xcel Energy Inc. (utilities company, 2020-present) and as a member of the Board, Audit, Finance and Risk Committee and Safety, Environmental, Technology and Operations Committee and Chair of the Executive Development and Compensation Committee of American Water Works Company, Inc. (utilities company, 2019-present). In addition, Ms. Kampling currently serves as a member of the Board of the Nature Conservancy, Wisconsin Chapter (2019-present). Previously, Ms. Kampling served as a Member of the Advisory Board of certain Fidelity® funds (2020), a member of the Board, Compensation Committee and Executive Committee and Chair of the Audit Committee of Briggs & Stratton Corporation (manufacturing, 2011-2021), a member of the Board of Interstate Power and Light Company (2012-2019) and Wisconsin Power and Light Company (2012-2019) (each a subsidiary of Alliant Energy Corporation) and as a member of the Board and Workforce Development Committee of the Business Roundtable (2018-2019).
Thomas A. Kennedy (1955)
Year of Election or Appointment: 2021
Trustee
Mr. Kennedy also serves as Trustee of other Fidelity® funds. Previously, Mr. Kennedy served as a Member of the Advisory Board of certain Fidelity® funds (2020) and held a variety of positions at Raytheon Company (aerospace and defense, 1983-2020), including Chairman and Chief Executive Officer (2014-2020) and Executive Vice President and Chief Operating Officer (2013-2014). Mr. Kennedy served as Executive Chairman of the Board of Directors of Raytheon Technologies Corporation (aerospace and defense, 2020-2021). Mr. Kennedy serves as a Director of the Board of Directors of Textron Inc. (aerospace and defense, 2023-present).
Oscar Munoz (1959)
Year of Election or Appointment: 2021
Trustee
Mr. Munoz also serves as Trustee of other Fidelity® funds. Prior to his retirement, Mr. Munoz served as Executive Chairman (2020-2021), Chief Executive Officer (2015-2020), President (2015-2016) and a member of the Board (2010-2021) of United Airlines Holdings, Inc. Mr. Munoz currently serves as a member of the Board of CBRE Group, Inc. (commercial real estate, 2020-present), a member of the Board of Univision Communications, Inc. (Hispanic media, 2020-present), a member of the Board of Archer Aviation Inc. (2021-present), a member of the Defense Business Board of the United States Department of Defense (2021-present) and a member of the Board of Salesforce.com, Inc. (cloud-based software, 2022-present). Previously, Mr. Munoz served as a Member of the Advisory Board of certain Fidelity® funds (2021).
David M. Thomas (1949)
Year of Election or Appointment: 2008
Trustee
Lead Independent Trustee
Mr. Thomas also serves as Trustee of other Fidelity® funds. Previously, Mr. Thomas served as Executive Chairman (2005-2006) and Chairman and Chief Executive Officer (2000-2005) of IMS Health, Inc. (pharmaceutical and healthcare information solutions). Mr. Thomas currently serves as a member of the Board of Fortune Brands Home and Security (home and security products, 2004-present) and as Director (2013-present) and Non-Executive Chairman of the Board (2022-present) of Interpublic Group of Companies, Inc. (marketing communication).
Susan Tomasky (1953)
Year of Election or Appointment: 2020
Trustee
Ms. Tomasky also serves as Trustee of other Fidelity® funds. Prior to her retirement, Ms. Tomasky served in various executive officer positions at American Electric Power Company, Inc. (1998-2011), including most recently as President of AEP Transmission (2007-2011). Ms. Tomasky currently serves as a member of the Board and Sustainability Committee and as Chair of the Audit Committee of Marathon Petroleum Corporation (2018-present) and as a member of the Board, Executive Committee, Corporate Governance Committee and Organization and Compensation Committee and as Lead Director of the Board of Public Service Enterprise Group, Inc. (utilities company, 2012-present) and as a member of the Board of its subsidiary company, Public Service Electric and Gas Co. (2021-present). In addition, Ms. Tomasky currently serves as a member (2009-present) and President (2020-present) of the Board of the Royal Shakespeare Company - America (2009-present), as a member of the Board of the Columbus Association for the Performing Arts (2011-present) and as a member of the Board and Kenyon in the World Committee of Kenyon College (2016-present). Previously, Ms. Tomasky served as a Member of the Advisory Board of certain Fidelity® funds (2020), as a member of the Board of the Columbus Regional Airport Authority (2007-2020), as a member of the Board (2011-2018) and Lead Independent Director (2015-2018) of Andeavor Corporation (previously Tesoro Corporation) (independent oil refiner and marketer) and as a member of the Board of Summit Midstream Partners LP (energy, 2012-2018).
Michael E. Wiley (1950)
Year of Election or Appointment: 2020
Trustee
Mr. Wiley also serves as Trustee of other Fidelity® funds. Previously, Mr. Wiley served as a member of the Advisory Board of certain Fidelity® funds (2018-2020), Chairman, President and CEO of Baker Hughes, Inc. (oilfield services, 2000-2004). Mr. Wiley also previously served as a member of the Board of Andeavor Corporation (independent oil refiner and marketer, 2005-2018), a member of the Board of Andeavor Logistics LP (natural resources logistics, 2015-2018) and a member of the Board of High Point Resources (exploration and production, 2005-2020).
+ The information includes the Trustee's principal occupation during the last five years and other information relating to the experience, attributes, and skills relevant to the Trustee's qualifications to serve as a Trustee, which led to the conclusion that the Trustee should serve as a Trustee for the fund.
Advisory Board Members and Officers:
Correspondence intended for a Member of the Advisory Board (if any) may be sent to Fidelity Investments, P.O. Box 55235, Boston, Massachusetts 02205-5235. Correspondence intended for an officer or Peter S. Lynch may be sent to Fidelity Investments, 245 Summer Street, Boston, Massachusetts 02210. Officers appear below in alphabetical order.
Name, Year of Birth; Principal Occupation
Vijay C. Advani (1960)
Year of Election or Appointment: 2023
Member of the Advisory Board
Mr. Advani also serves as Trustee or Member of the Advisory Board of other funds. Previously, Mr. Advani served as Executive Chairman (2020-2022), Chief Executive Officer (2017-2020) and Chief Operating Officer (2016-2017) of Nuveen (global investment manager). He also served in various capacities at Franklin Resources (global investment manager), including Co-President (2015-2016), Executive Vice President, Global Advisory Services (2008-2015), Head of Global Retail Distribution (2005-2008), Executive Managing Director, International Retail Development (2002-2005), Managing Director, Product Developments, Sales & Marketing, Asia, Eastern Europe and Africa (2000-2002) and President, Templeton Asset Management India (1995-2000). Mr. Advani also served as Senior Investment Officer of International Finance Corporation (private equity and venture capital arm of The World Bank, 1984-1995). Mr. Advani is Chairman Emeritus of the U.S. India Business Council (2018-present), a Director of The Global Impact Investing Network (2019-present), a Director of LOK Capital (Mauritius) (2022-present), a member of the Advisory Council of LOK Capital (2022-present), a Senior Advisor of Neuberger Berman (2021-present), a Senior Advisor of Seviora Holdings Pte. Ltd (Temasek-Singapore) (2021-present), a Director of Seviora Capital (Singapore) (2021-present) and an Advisor of EQUIAM (2021-present). Mr. Advani formerly served as a member of the Board of BowX Acquisition Corp. (special purpose acquisition company, 2020-2021), a member of the Board of Intellecap (advisory arm of The Aavishkaar Group, 2018-2020), a member of the Board of Nuveen Investments, Inc. (2017-2020) and a member of the Board of Docusign (software, 2016-2019).
Peter S. Lynch (1944)
Year of Election or Appointment: 2003
Member of the Advisory Board
Mr. Lynch also serves as a Member of the Advisory Board of other Fidelity® funds. Mr. Lynch is Vice Chairman and a Director of Fidelity Management & Research Company LLC (investment adviser firm). In addition, Mr. Lynch serves as a Trustee of Boston College and as the Chairman of the Inner-City Scholarship Fund. Previously, Mr. Lynch served as Vice Chairman and a Director of FMR Co., Inc. (investment adviser firm) and on the Special Olympics International Board of Directors (1997-2006).
Karen B. Peetz (1955)
Year of Election or Appointment: 2023
Member of the Advisory Board
Ms. Peetz also serves as a Member of the Advisory Board of other funds. Previously, Ms. Peetz served as Chief Administration Officer (2020-2023) of Citigroup Inc. (a diversified financial service company). She also served in various capacities at Bank of New York Mellon Corporation, including President (2013-2016), Vice Chairman, Senior Executive Vice President and Chief Executive Officer of Financial Markets & Treasury Services (2010-2013), Senior Executive Vice President and Chief Executive Officer of Global Corporate Trust (2003-2008), Senior Vice President and Division Manager of Global Payments & Trade Services (2002-2003) and Senior Vice President and Division Manager of Domestic Corporate Trust (1998-2002). Ms. Peetz also served in various capacities at Chase Manhattan Corporation (1982-1998), including Senior Vice President and Manager of Corporate Trust International Business (1996-1998), Managing Director and Manager of Corporate Trust Services (1994-1996) and Managing Director and Group Manager of Financial Institution Sales (1990-1993). Ms. Peetz currently serves as Chair of Amherst Holdings Advisory Council (2018-present), Trustee of Johns Hopkins University (2016-present), Chair of the Carey Business School Advisory Council, Member of the Johns Hopkins Medicine Board and Finance Committee and Chair of the Lyme and Tick Related Disease Institute Advisory Council. Ms. Peetz previously served as a member of the Board of Guardian Life Insurance Company of America (2019-2023), a member of the Board of Trane Technologies (2018-2022), a member of the Board of Wells Fargo Corp. (2017-2019), a member of the Board of SunCoke Energy Inc. (2012-2016), a member of the Board of Private Export Funding Corporation (2010-2016) and as a Trustee of Penn State University (2010-2014) and the United Way of New York City (2008-2010).
Heather Bonner (1977)
Year of Election or Appointment: 2023
Assistant Treasurer
Ms. Bonner also serves as an officer of other funds. Ms. Bonner serves as Senior Vice President (2022-present), and is an employee of Fidelity Investments. Ms. Bonner serves as Assistant Treasurer of Fidelity CRET Trustee LLC (2022-present). Prior to joining Fidelity, Ms. Bonner served as Managing Director at AQR Capital Management (2013-2022) and was the Treasurer and Principal Financial Officer of the AQR Funds (2013-2022).
Craig S. Brown (1977)
Year of Election or Appointment: 2022
Deputy Treasurer
Mr. Brown also serves as an officer of other funds. Mr. Brown serves as Assistant Treasurer of FIMM, LLC (2021-present) and is an employee of Fidelity Investments (2013-present). Previously, Mr. Brown served as Assistant Treasurer of certain Fidelity® funds (2019-2022).
John J. Burke III (1964)
Year of Election or Appointment: 2018
Chief Financial Officer
Mr. Burke also serves as Chief Financial Officer of other funds. Mr. Burke serves as Head of Investment Operations for Fidelity Fund and Investment Operations (2018-present) and is an employee of Fidelity Investments (1998-present). Previously Mr. Burke served as head of Asset Management Investment Operations (2012-2018).
Margaret Carey (1973)
Year of Election or Appointment: 2023
Secretary and Chief Legal Officer (CLO)
Ms. Carey also serves as an officer of other funds and as CLO of certain other Fidelity entities. She is a Senior Vice President and Deputy General Counsel of FMR LLC (diversified financial services company, 2019-present), and is an employee of Fidelity Investments.
William C. Coffey (1969)
Year of Election or Appointment: 2019
Assistant Secretary
Mr. Coffey also serves as Assistant Secretary of other funds. He is Senior Vice President and Deputy General Counsel of FMR LLC (diversified financial services company, 2010-present), and is an employee of Fidelity Investments. Previously, Mr. Coffey served as Secretary and CLO of certain funds (2018-2019); CLO, Secretary, and Senior Vice President of Fidelity Management & Research Company and FMR Co., Inc. (investment adviser firms, 2018-2019); Secretary of Fidelity SelectCo, LLC and Fidelity Investments Money Management, Inc. (investment adviser firms, 2018-2019); CLO of Fidelity Management & Research (Hong Kong) Limited, FMR Investment Management (UK) Limited, and Fidelity Management & Research (Japan) Limited (investment adviser firms, 2018-2019); and Assistant Secretary of certain funds (2009-2018).
Timothy M. Cohen (1969)
Year of Election or Appointment: 2018
Vice President
Mr. Cohen also serves as Vice President of other funds. Mr. Cohen serves as Co-Head of Equity (2018-present), a Director of Fidelity Management & Research (Japan) Limited (investment adviser firm, 2016-present), and is an employee of Fidelity Investments. Previously, Mr. Cohen served as Executive Vice President of Fidelity SelectCo, LLC (2019), Head of Global Equity Research (2016-2018), Chief Investment Officer - Equity and a Director of Fidelity Management & Research (U.K.) Inc. (investment adviser firm, 2013-2015) and as a Director of Fidelity Management & Research (Hong Kong) Limited (investment adviser firm, 2017).
Jonathan Davis (1968)
Year of Election or Appointment: 2010
Assistant Treasurer
Mr. Davis also serves as an officer of other funds. Mr. Davis serves as Vice President Assistant Treasurer and is an employee of Fidelity Investments. Mr. Davis serves as Assistant Treasurer of certain Fidelity entities.
Laura M. Del Prato (1964)
Year of Election or Appointment: 2018
Assistant Treasurer
Ms. Del Prato also serves as an officer of other funds. Ms. Del Prato serves as Assistant Treasurer of FIMM, LLC (2021-present) and is an employee of Fidelity Investments (2017-present). Previously, Ms. Del Prato served as President and Treasurer of The North Carolina Capital Management Trust: Cash Portfolio and Term Portfolio (2018-2020). Prior to joining Fidelity Investments, Ms. Del Prato served as a Managing Director and Treasurer of the JPMorgan Mutual Funds (2014-2017). Prior to JPMorgan, Ms. Del Prato served as a partner at Cohen Fund Audit Services (accounting firm, 2012-2013) and KPMG LLP (accounting firm, 2004-2012).
Colm A. Hogan (1973)
Year of Election or Appointment: 2020
Assistant Treasurer
Mr. Hogan also serves as an officer of other funds. Mr. Hogan serves as Assistant Treasurer of FIMM, LLC (2021-present) and FMR Capital, Inc. (2017-present) and is an employee of Fidelity Investments (2005-present). Previously, Mr. Hogan served as Deputy Treasurer of certain Fidelity® funds (2016-2020) and Assistant Treasurer of certain Fidelity® funds (2016-2018).
Pamela R. Holding (1964)
Year of Election or Appointment: 2018
Vice President
Ms. Holding also serves as Vice President of other funds. Ms. Holding serves as Co-Head of Equity (2018-present) and is an employee of Fidelity Investments (2013-present). Previously, Ms. Holding served as Executive Vice President of Fidelity SelectCo, LLC (2019) and as Chief Investment Officer of Fidelity Institutional Asset Management (2013-2018).
Chris Maher (1972)
Year of Election or Appointment: 2020
Deputy Treasurer
Mr. Maher also serves as an officer of other funds. Mr. Maher serves as Assistant Treasurer of FIMM, LLC (2021-present) and FMR Capital, Inc. (2017-present), and is an employee of Fidelity Investments (2008-present). Previously, Mr. Maher served as Assistant Treasurer of certain funds (2013-2020); Vice President of Asset Management Compliance (2013), Vice President of the Program Management Group of FMR (investment adviser firm, 2010-2013), and Vice President of Valuation Oversight (2008-2010).
Jason P. Pogorelec (1975)
Year of Election or Appointment: 2020
Chief Compliance Officer
Mr. Pogorelec also serves as Chief Compliance Officer of other funds. Mr. Pogorelec is a Senior Vice President of Asset Management Compliance for Fidelity Investments and is an employee of Fidelity Investments. Mr. Pogorelec serves as Compliance Officer of Fidelity Management & Research Company LLC (investment adviser firm, 2023-present). Previously, Mr. Pogorelec served as Vice President, Associate General Counsel for Fidelity Investments (2010-2020) and Assistant Secretary of certain Fidelity® funds (2015-2020).
Brett Segaloff (1972)
Year of Election or Appointment: 2021
Anti-Money Laundering (AML) Officer
Mr. Segaloff also serves as an AML Officer of other funds and other related entities. He is Director, Anti-Money Laundering (2007-present) of FMR LLC (diversified financial services company) and is an employee of Fidelity Investments (1996-present).
Stacie M. Smith (1974)
Year of Election or Appointment: 2016
President and Treasurer
Ms. Smith also serves as an officer of other funds. Ms. Smith serves as Assistant Treasurer of certain Fidelity entities, is an employee of Fidelity Investments, and has served in other fund officer roles.
Jim Wegmann (1979)
Year of Election or Appointment: 2019
Assistant Treasurer
Mr. Wegmann also serves as an officer of other funds. Mr. Wegmann serves as Assistant Treasurer of FIMM, LLC (2021-present) and is an employee of Fidelity Investments (2011-present). Previously, Mr. Wegmann served as Assistant Treasurer of certain Fidelity® funds (2019-2021).
As a shareholder, you incur two types of costs: (1) transaction costs, which may include sales charges (loads) on purchase payments or redemption proceeds, as applicable and (2) ongoing costs, which generally include management fees, distribution and/or service (12b-1) fees and other Fund expenses. This Example is intended to help you understand your ongoing costs (in dollars) of investing in a fund and to compare these costs with the ongoing costs of investing in other mutual funds.
| The Example is based on an investment of $1,000 invested at the beginning of the period and held for the entire period (March 1, 2023 to August 31, 2023). |
Actual Expenses
The first line of the accompanying table provides information about actual account values and actual expenses. You may use the information in this line, together with the amount you invested, to estimate the expenses that you paid over the period. Simply divide your account value by $1,000.00 (for example, an $8,600 account value divided by $1,000.00 = 8.6), then multiply the result by the number in the first line for a class/Fund under the heading entitled "Expenses Paid During Period" to estimate the expenses you paid on your account during this period. If any fund is a shareholder of any underlying mutual funds or exchange-traded funds (ETFs) (the Underlying Funds), such fund indirectly bears its proportional share of the expenses of the Underlying Funds in addition to the direct expenses incurred presented in the table. These fees and expenses are not included in the annualized expense ratio used to calculate the expense estimate in the table below.
Hypothetical Example for Comparison Purposes
The second line of the accompanying table provides information about hypothetical account values and hypothetical expenses based on the actual expense ratio and an assumed rate of return of 5% per year before expenses, which is not the actual return. The hypothetical account values and expenses may not be used to estimate the actual ending account balance or expenses you paid for the period. You may use this information to compare the ongoing costs of investing in the Fund and other funds. To do so, compare this 5% hypothetical example with the 5% hypothetical examples that appear in the shareholder reports of the other funds. If any fund is a shareholder of any Underlying Funds, such fund indirectly bears its proportional share of the expenses of the Underlying Funds in addition to the direct expenses as presented in the table. These fees and expenses are not included in the annualized expense ratio used to calculate the expense estimate in the table below.
Please note that the expenses shown in the table are meant to highlight your ongoing costs only and do not reflect any transaction costs. Therefore, the second line of the table is useful in comparing ongoing costs only, and will not help you determine the relative total costs of owning different funds. In addition, if these transactional costs were included, your costs would have been higher.
| | | | | Annualized Expense Ratio- A | | Beginning Account Value March 1, 2023 | | Ending Account Value August 31, 2023 | | Expenses Paid During Period- C March 1, 2023 to August 31, 2023 |
| Fidelity® Puritan® Fund | | | | | | | | | | |
| Fidelity® Puritan® Fund | | | | .50% | | | | | | |
| Actual | | | | | | $ 1,000 | | $ 1,108.40 | | $ 2.66 |
Hypothetical-B | | | | | | $ 1,000 | | $ 1,022.68 | | $ 2.55 |
| Class K | | | | .42% | | | | | | |
| Actual | | | | | | $ 1,000 | | $ 1,109.00 | | $ 2.23 |
Hypothetical-B | | | | | | $ 1,000 | | $ 1,023.09 | | $ 2.14 |
| |
A Annualized expense ratio reflects expenses net of applicable fee waivers.
B 5% return per year before expenses
C Expenses are equal to the annualized expense ratio, multiplied by the average account value over the period, multiplied by 184/ 365 (to reflect the one-half year period). The fees and expenses of any Underlying Funds are not included in each annualized expense ratio.
The dividend and capital gains distributions for the fund(s) are available on Fidelity.com or Institutional.Fidelity.com.
The fund hereby designates as a capital gain dividend with respect to the taxable year ended August 31, 2023, $886,714,874, or, if subsequently determined to be different, the net capital gain of such year.
A total of 13.91% of the dividends distributed during the fiscal year was derived from interest on U.S. Government securities which is generally exempt from state income tax.
The fund designates $216,907,640 of distributions paid in the calendar year in 2022 as qualifying to be taxed as interest-related dividends for nonresident alien shareholders.
The fund designates $212,784,842 of distributions paid during the fiscal year ended 2023 as qualifying to be taxed as section 163(j) interest dividends.
Puritan designates 25%, 40%, 40%, and 40% and Class K designates 24%, 38%, 38%, and 38% of the dividends distributed in October, December, April, and July, respectively during the fiscal year as qualifying for the dividends-received deduction for corporate shareholders.
Puritan designates 27.11%, 42.91%, 46.96%, and 46.95% and Class K designates 25.97%, 40.68%, 45.00%, and 45.05% of dividends distributed in October, December, April, and July, respectively during the fiscal year as amounts which may be taken into account as a dividend for purposes of the maximum rate under section 1(h)(11) of the Internal Revenue Code.
Puritan designates 0.41%, and 0.64% and Class K designates 0.39% and 0.61% of the dividends distributed in October and December, respectively during the fiscal year as a section 199A dividend.
The fund will notify shareholders in January 2024 of amounts for use in preparing 2023 income tax returns.
Board Approval of Investment Advisory Contracts and Management Fees
Fidelity Puritan Fund
Each year, the Board of Trustees, including the Independent Trustees (together, the Board), considers the renewal of the fund's management contract with Fidelity Management & Research Company LLC (FMR) and the sub-advisory agreements (together, the Advisory Contracts) for the fund. FMR and the sub-advisers are referred to herein as the Investment Advisers. The Board, assisted by the advice of fund counsel and Independent Trustees' counsel, requests and considers a broad range of information relevant to the renewal of the Advisory Contracts throughout the year.
The Board meets regularly and, at each of its meetings, covers an extensive agenda of topics and materials and considers factors that are relevant to its annual consideration of the renewal of the fund's Advisory Contracts, including the services and support provided to the fund and its shareholders. The Board, acting directly and through its Committees (each of which is composed of and chaired by Independent Trustees), requests and receives information concerning the annual consideration of the renewal of the fund's Advisory Contracts. The Board also meets as needed to review matters specifically related to the Board's annual consideration of the renewal of the Advisory Contracts. Members of the Board may also meet with trustees of other Fidelity funds through joint ad hoc committees to discuss certain matters relevant to all of the Fidelity funds.
Approval of Stub Period Continuation. At its May 2023 meeting, the Board of Trustees voted to continue the fund's management contract with FMR, and the sub-advisory agreements and sub-sub-advisory agreements, in each case, where applicable (together, the Advisory Contracts), without modification, for two months from June 1, 2023 through July 31, 2023. The Board considered that the approval of the fund's Advisory Contracts will not result in any changes in (i) the investment process or strategies employed in the management of the fund's assets; (ii) the fees and expenses paid by shareholders; (iii) the nature, extent or quality of services provided under the fund's Advisory Contracts; or (iv) the day-to-day management of the fund or the persons primarily responsible for such management. The Board also considered that since its last approval of the fund's Advisory Contracts, FMR had provided additional information on the fund in support of the annual contract renewal process, including competitive analyses on total expenses and management fees and in-depth reviews of fund performance and fund profitability information. The Board concluded that the fund's Advisory Contracts are fair and reasonable, and that the fund's Advisory Contracts should be renewed, without modification, through July 31, 2023, with the understanding that the Board would consider the annual renewal for a full one year period in July 2023.
At its July 2023 meeting, the Board unanimously determined to renew the fund's Advisory Contracts. In reaching its determination, the Board considered all factors it believed relevant, including (i) the nature, extent, and quality of the services provided to the fund and its shareholders (including the investment performance of the fund); (ii) the competitiveness relative to peer funds of the fund's management fee and the total expense ratio of a representative class (the retail class, which was selected because it is the largest class); (iii) the total costs of the services provided by and the profits realized by FMR and its affiliates (Fidelity) from its relationships with the fund; and (iv) the extent to which, if any, economies of scale exist and are realized as the fund grows, and whether any economies of scale are appropriately shared with fund shareholders. The Board also considered the broad range of investment choices available to shareholders from FMR's competitors and that the fund's shareholders have chosen to invest in the fund, which is part of the Fidelity family of funds. The Board's decision to renew the Advisory Contracts was not based on any single factor.
The Board reached a determination, with the assistance of fund counsel and Independent Trustees' counsel and through the exercise of its business judgment, that the renewal of the Advisory Contracts was in the best interests of the fund and its shareholders and that the compensation payable under the Advisory Contracts was fair and reasonable in light of all of the surrounding circumstances.
Nature, Extent, and Quality of Services Provided. The Board considered staffing as it relates to the fund, including the backgrounds and experience of investment personnel of the Investment Advisers, and also considered the Investment Advisers' implementation of the fund's investment program. The Independent Trustees also had discussions with senior management of Fidelity's investment operations and investment groups. The Board considered the structure of the investment personnel compensation program and whether this structure provides appropriate incentives to act in the best interests of the fund. Additionally, the Board considered the portfolio managers' investments, if any, in the funds that they manage.
Resources Dedicated to Investment Management and Support Services. The Board and the Fund Oversight and Research Committees reviewed the general qualifications and capabilities of Fidelity's investment staff, including its size, education, experience, and resources, as well as Fidelity's approach to recruiting, training, managing, and compensating investment personnel. The Board noted the resources devoted to expansion of Fidelity's global investment organization, and that Fidelity's analysts have extensive resources, tools, and capabilities that allow them to conduct sophisticated quantitative and fundamental analysis, as well as credit analysis of issuers, counterparties, and guarantors. Further, the Board considered that Fidelity's investment professionals have sufficient access to global information and data so as to provide competitive investment results over time, and that those professionals also have access to sophisticated tools that permit them to assess portfolio construction and risk and performance attribution characteristics continuously, as well as to transmit new information and research conclusions rapidly around the world. Additionally, in its deliberations, the Board considered Fidelity's trading, risk management, compliance, and technology and operations capabilities and resources, which are integral parts of the investment management process.
Shareholder and Administrative Services. The Board considered (i) the nature, extent, quality, and cost of advisory, administrative, and shareholder services performed by the Investment Advisers and their affiliates under the Advisory Contracts and under separate agreements covering transfer agency, pricing and bookkeeping, and securities lending services for the fund; (ii) the nature and extent of Fidelity's supervision of third party service providers, principally custodians, subcustodians, and pricing vendors; and (iii) the resources devoted by Fidelity to, and the record of compliance with, the fund's compliance policies and procedures. The Board also reviewed the allocation of fund brokerage, including allocations to brokers affiliated with the Investment Advisers, the use of brokerage commissions to pay fund expenses, and the use of "soft" commission dollars to pay for research services. The Board also considered the fund's securities lending activities and any payments made to Fidelity relating to securities lending.
The Board noted that the growth of fund assets over time across the complex allows Fidelity to reinvest in the development of services designed to enhance the value and convenience of the Fidelity funds as investment vehicles. These services include 24-hour access to account information and market information over the Internet and through telephone representatives, investor education materials, and asset allocation tools. The Board also considered that it reviews customer service metrics such as telephone response times, continuity of services on the website and metrics addressing services at Fidelity Investor Centers.
Investment in a Large Fund Family. The Board considered the benefits to shareholders of investing in a fund that is part of a large family of funds offering a variety of investment disciplines and providing a large variety of fund investor services. The Board noted that Fidelity had taken, or had made recommendations that resulted in the Fidelity funds taking, a number of actions over the previous year that benefited particular funds and/or the Fidelity funds in general.
Investment Performance. The Board took into account discussions that occur with representatives of the Investment Advisers, and reports that it receives, at Board meetings throughout the year, relating to fund investment performance. In this regard the Board noted that as part of regularly scheduled fund reviews and other reports to the Board on fund performance, the Board considered annualized return information for the fund for different time periods, measured against an appropriate securities market index (benchmark index) and an appropriate peer group of funds with similar objectives (peer group). The Board also considered information about performance attribution. In its ongoing evaluation of fund investment performance, the Board gives particular attention to information indicating changes in performance of the funds over different time periods and discussed with the Investment Advisers the reasons for any overperformance or underperformance.
In addition to reviewing absolute and relative fund performance, the Independent Trustees periodically consider the appropriateness of fund performance metrics in evaluating the results achieved. The Independent Trustees generally give greater weight to fund performance over longer time periods than over shorter time periods. Depending on the circumstances, the Independent Trustees may be satisfied with a fund's performance notwithstanding that it lags its benchmark index or peer group for certain periods.
Based on its review, the Board concluded that the nature, extent, and quality of services provided to the fund under the Advisory Contracts should continue to benefit the shareholders of the fund.
Competitiveness of Management Fee and Total Expense Ratio. The Board was provided with information regarding industry trends in management fees and expenses. In its review of the fund's management fee and the total expense ratio of the retail class, the Board considered the fund's management fee rate as well as other fund or class expenses, as applicable, such as transfer agent fees, pricing and bookkeeping fees, and custodial, legal, and audit fees. The Board noted that Fidelity may agree to waive fees or reimburse expenses from time to time, and the extent to which, if any, it has done so for the fund.
Comparisons of Management Fees and Total Expense Ratios. Among other things, the Board reviewed data for selected groups of competitive funds and classes (referred to as "mapped groups") that were compiled by Fidelity based on combining similar investment objective categories (as classified by Lipper) that have comparable investment mandates. The data reviewed by the Board included (i) gross management fee comparisons (before taking into account expense reimbursements or caps) relative to the total universe of funds within the mapped group; (ii) gross management fee comparisons relative to a subset of non-Fidelity funds in the mapped group that are similar in size and management fee structure to the fund (referred to as the "asset size peer group"); (iii) total expense comparisons of the retail class of the fund relative to funds and classes in the mapped group that have a similar sales load structure to the retail class of the fund (referred to as the "similar sales load structure group"); and (iv) total expense comparisons of the retail class of the fund relative to funds and classes in the similar sales load structure group that are similar in size and management fee structure to the fund (referred to as the "total expense asset size peer group"). The total expense asset size peer group comparison excludes performance adjustments and fund-paid 12b-1 fees to eliminate variability in fee structures.
The information provided to the Board indicated that the fund's management fee rate ranked below the competitive median of the mapped group for the 12-month period ended September 30, 2022 and below the competitive median of the asset size peer group for the 12-month period ended September 30, 2022. Further, the information provided to the Board indicated that the total expense ratio of the retail class of the fund ranked below the competitive median of the similar sales load structure group for the 12-month period ended September 30, 2022 and below the competitive median of the total expense asset size peer group for the 12-month period ended September 30, 2022.
The Board also considered that, for funds subject to the group fee, FMR agreed to voluntarily waive fees over a specified period of time in amounts designed to account for assets converted from certain funds to certain collective investment trusts.
Fees Charged to Other Fidelity Clients. The Board also considered Fidelity fee structures and other information with respect to clients of Fidelity, such as other funds advised or subadvised by Fidelity, pension plan clients, and other institutional clients with similar mandates. The Board noted that a joint ad hoc committee created by it and the boards of other Fidelity funds periodically reviews and compares Fidelity's institutional investment advisory business with its business of providing services to the Fidelity funds and also noted the most recent findings of the committee. The Board noted that the committee's review included a consideration of the differences in services provided, fees charged, and costs incurred, as well as competition in the markets serving the different categories of clients.
Based on its review, the Board concluded that the fund's management fee is fair and reasonable in light of the services that the fund receives and the other factors considered. Further, based on its review of total expense ratios and fees charged to other Fidelity clients, the Board concluded that the total expense ratio of each class of the fund was reasonable in light of the services that the fund and its shareholders receive and the other factors considered.
Costs of the Services and Profitability. The Board considered the revenues earned and the expenses incurred by Fidelity in conducting the business of developing, marketing, distributing, managing, administering and servicing the fund and servicing the fund's shareholders. The Board also considered the level of Fidelity's profits in respect of all the Fidelity funds.
On an annual basis, Fidelity presents to the Board information about the profitability of its relationships with the fund. Fidelity calculates profitability information for each fund, as well as aggregate profitability information for groups of Fidelity funds and all Fidelity funds, using a series of detailed revenue and cost allocation methodologies which originate with the books and records of Fidelity on which Fidelity's audited financial statements are based. The Audit Committee of the Board reviews any significant changes from the prior year's methodologies and the full Board approves such changes.
A public accounting firm has been engaged annually by the Board as part of the Board's assessment of Fidelity's profitability analysis. The engagement includes the review and assessment of the methodologies used by Fidelity in determining the revenues and expenses attributable to Fidelity's fund business, and completion of agreed-upon procedures in respect of the mathematical accuracy of certain fund profitability information and its conformity to established allocation methodologies. After considering the reports issued under the engagement and information provided by Fidelity, the Board concluded that while other allocation methods may also be reasonable, Fidelity's profitability methodologies are reasonable in all material respects.
The Board also reviewed Fidelity's non-fund businesses and potential indirect benefits such businesses may have received as a result of their association with Fidelity's fund business (i.e., fall-out benefits) as well as cases where Fidelity's affiliates may benefit from the funds' business. The Board considered areas where potential indirect benefits to the Fidelity funds from their relationships with Fidelity may exist. The Board's consideration of these matters was informed by the findings of a joint ad hoc committee created by it and the boards of other Fidelity funds to evaluate potential fall-out benefits.
The Board considered the costs of the services provided by and the profits realized by Fidelity in connection with the operation of the fund and was satisfied that the profitability was not excessive.
Economies of Scale. The Board considered whether there have been economies of scale in respect of the management of the Fidelity funds, whether the Fidelity funds (including the fund) have appropriately benefited from any such economies of scale, and whether there is potential for realization of any further economies of scale. The Board considered the extent to which the fund will benefit from economies of scale as assets grow through increased services to the fund, through waivers or reimbursements, or through fee or expense ratio reductions. The Board also noted that a committee (the Economies of Scale Committee) created by it and the boards of other Fidelity funds periodically analyzes whether Fidelity attains economies of scale in respect of the management and servicing of the Fidelity funds, whether the Fidelity funds have appropriately benefited from such economies of scale, and whether there is potential for realization of any further economies of scale.
The Board recognized that the fund's management contract incorporates a "group fee" structure, which provides for lower group fee rates as total "group assets" increase, and for higher group fee rates as total "group assets" decrease ("group assets" as defined in the management contract). FMR calculates the group fee rates based on a tiered asset "breakpoint" schedule that varies based on asset class. The Board considered that the group fee is designed to deliver the benefits of economies of scale to fund shareholders when total Fidelity fund assets increase, even if assets of any particular fund are unchanged or have declined, because some portion of Fidelity's costs are attributable to services provided to all Fidelity funds, and all funds benefit if those costs can be allocated among more assets. The Board further considered that Fidelity agreed to impose a temporary fee waiver in the form of additional breakpoints to the current breakpoint schedule. The Board concluded that, given the group fee structure, fund shareholders will benefit from lower management fees as "group assets" increase at the fund complex level, regardless of whether Fidelity achieves any such economies of scale.
The Board concluded, taking into account the analysis of the Economies of Scale Committee, that economies of scale, if any, are being appropriately shared between fund shareholders and Fidelity.
Additional Information Requested by the Board. In order to develop fully the factual basis for consideration of the Fidelity funds' advisory contracts, the Board requested and received additional information on certain topics, including: (i) fund flow and performance trends, in particular the underperformance of certain funds and strategies, and Fidelity's long-term strategies for certain funds, including any consideration of fund liquidations or mergers; (ii) the operation of performance fees and competitor use of performance fees; (iii) Fidelity's pricing philosophy compared to competitors; (iv) fund profitability methodology and data; (v) evaluation of competitive fund data and peer group classifications and fee and expense comparisons; (vi) the management fee and expense structures for different funds and classes and information about the differences between various fee and expense structures; (vii) group fee breakpoints and related voluntary fee waivers; and (viii) information regarding other accounts managed by Fidelity and the funds' sub-advisory arrangements.
Conclusion. Based on its evaluation of all of the conclusions noted above, and after considering all factors it believed relevant, the Board, including the Independent Trustees, concluded that the advisory and sub-advisory fee arrangements are fair and reasonable in light of all of the surrounding circumstances and that the fund's Advisory Contracts should be renewed through July 31, 2024.
1.536193.127
PUR-ANN-1023
Fidelity® Balanced Fund
Annual Report
August 31, 2023
Contents
To view a fund's proxy voting guidelines and proxy voting record for the 12-month period ended June 30, visit http://www.fidelity.com/proxyvotingresults or visit the Securities and Exchange Commission's (SEC) web site at http://www.sec.gov.
You may also call 1-800-544-8544 if you're an individual investing directly with Fidelity, call 1-800-835-5092 if you're a plan sponsor or participant with Fidelity as your recordkeeper or call 1-877-208-0098 on institutional accounts or if you're an advisor or invest through one to request a free copy of the proxy voting guidelines.
Standard & Poor's, S&P and S&P 500 are registered service marks of The McGraw-Hill Companies, Inc. and have been licensed for use by Fidelity Distributors Corporation.
Other third-party marks appearing herein are the property of their respective owners.
All other marks appearing herein are registered or unregistered trademarks or service marks of FMR LLC or an affiliated company. © 2023 FMR LLC. All rights reserved.
This report and the financial statements contained herein are submitted for the general information of the shareholders of the Fund. This report is not authorized for distribution to prospective investors in the Fund unless preceded or accompanied by an effective prospectus.
A fund files its complete schedule of portfolio holdings with the SEC for the first and third quarters of each fiscal year on Form N-PORT. Forms N-PORT are available on the SEC's web site at http://www.sec.gov. A fund's Forms N-PORT may be reviewed and copied at the SEC's Public Reference Room in Washington, DC. Information regarding the operation of the SEC's Public Reference Room may be obtained by calling 1-800-SEC-0330.
For a complete list of a fund's portfolio holdings, view the most recent holdings listing, semiannual report, or annual report on Fidelity's web site at http://www.fidelity.com, http://www.institutional.fidelity.com, or http://www.401k.com, as applicable.
NOT FDIC INSURED •MAY LOSE VALUE •NO BANK GUARANTEE
Neither the Fund nor Fidelity Distributors Corporation is a bank.
Average annual total return reflects the change in the value of an investment, assuming reinvestment of distributions from dividend income and capital gains (the profits earned upon the sale of securities that have grown in value, if any) and assuming a constant rate of performance each year. The hypothetical investment and the average annual total returns do not reflect the deduction of taxes that a shareholder would pay on fund distributions or the redemption of fund shares. During periods of reimbursement by Fidelity, a fund's total return will be greater than it would be had the reimbursement not occurred. How a fund did yesterday is no guarantee of how it will do tomorrow.
| Average Annual Total Returns |
| | | | |
Periods ended August 31, 2023 | Past 1 year | Past 5 years | Past 10 years |
| Fidelity® Balanced Fund | 11.60% | 8.64% | 9.53% |
| Class K | 11.72% | 8.74% | 9.63% |
| $10,000 Over 10 Years |
| |
Let's say hypothetically that $10,000 was invested in Fidelity® Balanced Fund, a class of the fund, on August 31, 2013. The chart shows how the value of your investment would have changed, and also shows how the S&P 500® Index performed over the same period. |
|
|
Market Recap:
U.S. equities gained 15.94% for the 12 months ending August 31, 2023, according to the S&P 500® index, as continued global economic expansion, falling commodity prices and a slowing in the pace of inflation provided a favorable backdrop for higher-risk assets. Large-cap stocks spearheaded the rally, which was driven by the shares of a narrow set of mega-cap companies in the information technology and communication services sectors, largely due to exuberance related to generative artificial intelligence. Aggressive monetary tightening by the U.S. Federal Reserve continued amid consistent pressure on core inflation, a measure that excludes food and energy. Since March 2022, the Fed has hiked its benchmark interest rate 11 times. The latest bump came in late July, a fourth consecutive raise of a stepped-down 25 basis points. The S&P 500® gained 3.21% in July but snapped a five-month rally in August (-1.59%), held back by softness in manufacturing and jobs. Still, U.S. stocks ended August up 18.73% year to date. In fixed income, the Bloomberg U.S. Aggregate Bond Index returned -1.19%, as taxable investment-grade bonds showed year-to-date improvement after returning -13.01% in 2022. For the full 12 months, short-term bonds outpaced long-term issues, while lower-quality (higher yielding) bonds topped higher-quality debt. Higher-risk assets, including corporate bonds and asset-backed securities, fared better than U.S. Treasuries.
Comments from Co-Portfolio Manager Christopher Lee:
For the fiscal year, the fund's share classes gained about 12%, topping the 9.04% advance of the Fidelity Balanced Hybrid Composite Index. Versus the Composite index, security selection in the equity subportfolio contributed most. The fund's stock investments returned 19.99% the past 12 months, versus 15.94% for the S&P 500®. Stock picks particularly helped in the industrials sector, with consumer discretionary and energy contributing to a lesser extent. Notably, active management added value in all sectors but one. The top relative contributor among individual holdings was Nvidia, where the portfolio's overweight position rose 226% the past 12 months. Nvidia was one of our biggest holdings on August 31. An overweight in Eli Lilly also aided relative performance, gaining 85%. Lilly was also a major holding at period end. Further bolstering the equity subportfolio's relative result was an overweight stake in Meta Platforms (+81%), a major holding as well. On the flip side, the financials sector detracted a bit this period. At the stock level, avoiding Broadcom, a Composite index component that rose about 90%, detracted the most on a relative basis. Non-Composite exposure to Royalty Pharma (-27%) also hurt. The investment-grade bond central fund returned -0.38%, outpacing the -1.19% result of the Bloomberg U.S. Aggregate Bond Index. The central fund benefited from its overweight in credit, especially lower-rated corporate bonds, which continued to gain in the economy's post-COVID recovery, while favorable supply/demand trends and low issuer default rates resulted in tighter corporate-bond spreads. Other beneficial factors included exposure to AAA-rated collateralized loan obligations and an underweight in the lagging mortgage debt category.
Notes to shareholders:
After nearly four decades with Fidelity, Robert Stansky retired on December 31, 2022, and Chris Lee assumed Stansky's responsibilities for the fund. On January 1, 2023, Jody Simes retired after nearly 30 years with Fidelity, and Ashley Fernandes assumed sole responsibility for management of the equity subportfolio's materials sleeve.
The views expressed above reflect those of the portfolio manager(s) only through the end of the period as stated on the cover of this report and do not necessarily represent the views of Fidelity or any other person in the Fidelity organization. Any such views are subject to change at any time based upon market or other conditions and Fidelity disclaims any responsibility to update such views. These views may not be relied on as investment advice and, because investment decisions for a Fidelity fund are based on numerous factors, may not be relied on as an indication of trading intent on behalf of any Fidelity fund.
The information in the following tables is based on the combined Investments of the Fund and its pro-rata share of investments in Fidelity's Central Funds, other than the Money Market Central Funds.
Top Holdings (% of Fund's net assets) |
| |
| Microsoft Corp. | 4.7 | |
| Apple, Inc. | 3.8 | |
| Amazon.com, Inc. | 2.5 | |
| NVIDIA Corp. | 2.3 | |
| Alphabet, Inc. Class A | 1.6 | |
| Meta Platforms, Inc. Class A | 1.3 | |
| Exxon Mobil Corp. | 1.2 | |
| UnitedHealth Group, Inc. | 1.2 | |
| Eli Lilly & Co. | 1.1 | |
| Tesla, Inc. | 1.0 | |
| | 20.7 | |
| |
| Top Bond Issuers (% of Fund's net assets) |
(with maturities greater than one year) |
| U.S. Treasury Obligations | 13.7 | |
| Fannie Mae | 2.6 | |
| Freddie Mac | 2.4 | |
| Ginnie Mae | 1.4 | |
| Uniform Mortgage Backed Securities | 1.1 | |
| JPMorgan Chase & Co. | 0.7 | |
| Morgan Stanley | 0.5 | |
| Citigroup, Inc. | 0.5 | |
| Bank of America Corp. | 0.3 | |
| Petroleos Mexicanos | 0.2 | |
| | 23.4 | |
| |
| Market Sectors (% of Fund's net assets) |
| |
| Information Technology | 16.8 | |
| Financials | 12.8 | |
| Health Care | 8.8 | |
| Consumer Discretionary | 6.9 | |
| Communication Services | 6.3 | |
| Industrials | 5.8 | |
| Consumer Staples | 4.8 | |
| Energy | 3.8 | |
| Real Estate | 2.5 | |
| Utilities | 1.9 | |
| Materials | 1.6 | |
| |
Quality Diversification (% of Fund's net assets) |
|
| |
| We have used ratings from Moody's Investors Service, Inc. Where Moody's® ratings are not available, we have used S&P® ratings. All ratings are as of the date indicated and do not reflect subsequent changes. |
Asset Allocation (% of Fund's net assets) |
|
Futures and Swaps - 1.7% |
|
Percentages in the above tables are adjusted for the effect of TBA Sale Commitments.
An unaudited holdings listing for the fund, which presents direct holdings as well as the pro-rata share of any securities and other investments held indirectly through its investment in underlying Fidelity Central Funds, other than the Money Market Central Funds, is available at fidelity.com and/or institutional.fidelity.com, as applicable.
Showing Percentage of Net Assets
| Common Stocks - 61.5% |
| | | Shares | Value ($) (000s) |
| COMMUNICATION SERVICES - 5.4% | | | |
| Diversified Telecommunication Services - 0.4% | | | |
| AT&T, Inc. | | 8,167,840 | 120,802 |
| Cellnex Telecom SA (a) | | 398,400 | 15,250 |
| Liberty Global PLC Class C (b) | | 571,729 | 11,343 |
| | | | 147,395 |
| Entertainment - 0.8% | | | |
| Cinemark Holdings, Inc. (b)(c) | | 655,287 | 10,668 |
| Netflix, Inc. (b) | | 398,877 | 172,985 |
| Sea Ltd. ADR (b) | | 1,020,946 | 38,418 |
| Take-Two Interactive Software, Inc. (b) | | 238,937 | 33,977 |
| The Walt Disney Co. (b) | | 736,529 | 61,633 |
| World Wrestling Entertainment, Inc. Class A (c) | | 192,779 | 18,613 |
| | | | 336,294 |
| Interactive Media & Services - 3.5% | | | |
| Alphabet, Inc.: | | | |
| Class A (b) | | 4,832,669 | 658,065 |
| Class C (b) | | 1,512,118 | 207,689 |
| Epic Games, Inc. (b)(d)(e) | | 12,272 | 7,643 |
| Meta Platforms, Inc. Class A (b) | | 1,781,209 | 527,042 |
| Pinterest, Inc. Class A (b) | | 554,540 | 15,244 |
| Snap, Inc. Class A (b) | | 3,368,610 | 34,865 |
| | | | 1,450,548 |
| Media - 0.5% | | | |
| Altice U.S.A., Inc. Class A (b) | | 897,635 | 2,756 |
| Charter Communications, Inc. Class A (b) | | 87,694 | 38,420 |
| Comcast Corp. Class A | | 1,750,000 | 81,830 |
| Liberty Broadband Corp.: | | | |
| Class A (b) | | 513,718 | 48,105 |
| Class C (b)(c) | | 273,537 | 25,592 |
| | | | 196,703 |
| Wireless Telecommunication Services - 0.2% | | | |
| T-Mobile U.S., Inc. (b) | | 603,608 | 82,242 |
TOTAL COMMUNICATION SERVICES | | | 2,213,182 |
| CONSUMER DISCRETIONARY - 6.6% | | | |
| Automobile Components - 0.1% | | | |
| Adient PLC (b) | | 699,915 | 27,416 |
| Automobiles - 1.1% | | | |
| Ferrari NV | | 84,361 | 26,805 |
| Tesla, Inc. (b) | | 1,595,474 | 411,760 |
| | | | 438,565 |
| Broadline Retail - 2.6% | | | |
| Amazon.com, Inc. (b) | | 7,355,489 | 1,015,131 |
| eBay, Inc. | | 1,138,456 | 50,980 |
| | | | 1,066,111 |
| Hotels, Restaurants & Leisure - 1.2% | | | |
| Booking Holdings, Inc. (b) | | 38,508 | 119,568 |
| Caesars Entertainment, Inc. (b) | | 571,600 | 31,587 |
| Churchill Downs, Inc. | | 406,853 | 50,971 |
| Domino's Pizza, Inc. | | 101,422 | 39,291 |
| Marriott International, Inc. Class A | | 555,023 | 112,953 |
| McDonald's Corp. | | 256,683 | 72,166 |
| Penn Entertainment, Inc. (b) | | 254,626 | 6,032 |
| Red Rock Resorts, Inc. | | 164,100 | 7,209 |
| Sweetgreen, Inc. Class A (b) | | 72,846 | 1,046 |
| Yum! Brands, Inc. | | 546,028 | 70,645 |
| | | | 511,468 |
| Household Durables - 0.0% | | | |
| D.R. Horton, Inc. | | 17,701 | 2,107 |
| Mohawk Industries, Inc. (b) | | 179,822 | 18,232 |
| | | | 20,339 |
| Specialty Retail - 1.3% | | | |
| Cazoo Group Ltd. (b)(d) | | 19,377 | 22 |
| Fast Retailing Co. Ltd. | | 82,428 | 18,968 |
| Lowe's Companies, Inc. | | 780,073 | 179,791 |
| The Home Depot, Inc. | | 359,648 | 118,792 |
| TJX Companies, Inc. | | 2,106,297 | 194,790 |
| Valvoline, Inc. | | 728,661 | 25,095 |
| | | | 537,458 |
| Textiles, Apparel & Luxury Goods - 0.3% | | | |
| NIKE, Inc. Class B | | 490,942 | 49,934 |
| PVH Corp. | | 378,554 | 31,647 |
| Tapestry, Inc. | | 981,086 | 32,690 |
| | | | 114,271 |
TOTAL CONSUMER DISCRETIONARY | | | 2,715,628 |
| CONSUMER STAPLES - 4.2% | | | |
| Beverages - 1.5% | | | |
| Boston Beer Co., Inc. Class A (b) | | 45,983 | 16,804 |
| Celsius Holdings, Inc. (b) | | 170,017 | 33,330 |
| Constellation Brands, Inc. Class A (sub. vtg.) | | 272,173 | 70,917 |
| Diageo PLC | | 243,330 | 9,965 |
| Duckhorn Portfolio, Inc. (b) | | 627,767 | 7,809 |
| Keurig Dr. Pepper, Inc. | | 1,187,927 | 39,974 |
| Monster Beverage Corp. | | 1,223,507 | 70,242 |
| PepsiCo, Inc. | | 957,359 | 170,333 |
| Pernod Ricard SA | | 109,048 | 21,426 |
| The Coca-Cola Co. | | 3,088,116 | 184,762 |
| The Vita Coco Co., Inc. (b) | | 394,907 | 11,172 |
| | | | 636,734 |
| Consumer Staples Distribution & Retail - 1.2% | | | |
| Alimentation Couche-Tard, Inc. Class A (multi-vtg.) | | 491,379 | 25,696 |
| BJ's Wholesale Club Holdings, Inc. (b) | | 131,162 | 8,839 |
| Costco Wholesale Corp. | | 334,666 | 183,825 |
| Dollar General Corp. | | 113,489 | 15,718 |
| Dollar Tree, Inc. (b) | | 203,829 | 24,941 |
| Target Corp. | | 39,489 | 4,997 |
| U.S. Foods Holding Corp. (b) | | 723,119 | 29,236 |
| Walmart, Inc. | | 1,221,002 | 198,547 |
| | | | 491,799 |
| Food Products - 0.5% | | | |
| Freshpet, Inc. (b)(c) | | 226,377 | 17,094 |
| Lamb Weston Holdings, Inc. | | 186,774 | 18,194 |
| McCormick & Co., Inc. (non-vtg.) | | 346,145 | 28,412 |
| Mondelez International, Inc. | | 1,317,418 | 93,879 |
| The Hershey Co. | | 168,206 | 36,141 |
| | | | 193,720 |
| Household Products - 0.8% | | | |
| Colgate-Palmolive Co. | | 519,470 | 38,165 |
| Energizer Holdings, Inc. | | 210,139 | 7,218 |
| Procter & Gamble Co. | | 1,957,535 | 302,126 |
| | | | 347,509 |
| Personal Care Products - 0.2% | | | |
| elf Beauty, Inc. (b) | | 105,470 | 14,630 |
| Estee Lauder Companies, Inc. Class A | | 216,417 | 34,741 |
| Kenvue, Inc. | | 670,520 | 15,455 |
| | | | 64,826 |
TOTAL CONSUMER STAPLES | | | 1,734,588 |
| ENERGY - 2.8% | | | |
| Energy Equipment & Services - 0.3% | | | |
| Expro Group Holdings NV (b) | | 1,350,652 | 31,754 |
| Schlumberger Ltd. | | 867,820 | 51,167 |
| Weatherford International PLC (b) | | 517,427 | 45,803 |
| | | | 128,724 |
| Oil, Gas & Consumable Fuels - 2.5% | | | |
| Africa Oil Corp. | | 11,280,022 | 27,131 |
| Athabasca Oil Corp. (b) | | 5,993,095 | 16,633 |
| Canadian Natural Resources Ltd. | | 701,452 | 45,383 |
| Eco Atlantic Oil & Gas Ltd. (b) | | 8,711,000 | 1,805 |
| Exxon Mobil Corp. | | 4,529,221 | 503,604 |
| Hess Corp. | | 698,350 | 107,895 |
| Imperial Oil Ltd. | | 1,553,717 | 88,230 |
| Kosmos Energy Ltd. (b) | | 3,812,970 | 27,758 |
| MEG Energy Corp. (b) | | 3,799,699 | 67,968 |
| Phillips 66 Co. | | 521,729 | 59,561 |
| Valero Energy Corp. | | 562,343 | 73,048 |
| | | | 1,019,016 |
TOTAL ENERGY | | | 1,147,740 |
| FINANCIALS - 8.0% | | | |
| Banks - 2.5% | | | |
| AIB Group PLC | | 2,352,493 | 10,719 |
| Bank of America Corp. | | 4,263,589 | 122,237 |
| BNP Paribas SA | | 1,007,403 | 65,146 |
| Citigroup, Inc. | | 639,618 | 26,410 |
| DNB Bank ASA | | 1,027,993 | 20,320 |
| Eurobank Ergasias Services and Holdings SA (b) | | 17,624,956 | 30,636 |
| JPMorgan Chase & Co. | | 2,477,560 | 362,541 |
| KBC Group NV | | 177,684 | 11,668 |
| KeyCorp | | 3,878,578 | 43,944 |
| M&T Bank Corp. | | 212,484 | 26,571 |
| Piraeus Financial Holdings SA (b) | | 5,393,594 | 18,669 |
| PNC Financial Services Group, Inc. | | 422,996 | 51,068 |
| Starling Bank Ltd. Series D (b)(d)(e) | | 5,092,112 | 20,900 |
| UniCredit SpA | | 647,371 | 15,772 |
| Wells Fargo & Co. | | 4,670,866 | 192,860 |
| Zions Bancorp NA | | 266,487 | 9,460 |
| | | | 1,028,921 |
| Capital Markets - 1.4% | | | |
| Bank of New York Mellon Corp. | | 1,309,781 | 58,770 |
| BlackRock, Inc. Class A | | 136,429 | 95,574 |
| Brookfield Corp. Class A | | 556,465 | 18,981 |
| Cboe Global Markets, Inc. | | 175,461 | 26,268 |
| CME Group, Inc. | | 299,012 | 60,604 |
| Interactive Brokers Group, Inc. | | 345,098 | 31,432 |
| MarketAxess Holdings, Inc. | | 128,300 | 30,911 |
| Morgan Stanley | | 1,417,533 | 120,703 |
| State Street Corp. | | 548,510 | 37,705 |
| StepStone Group, Inc. Class A | | 576,556 | 17,798 |
| UBS Group AG | | 2,391,810 | 63,885 |
| Virtu Financial, Inc. Class A | | 561,600 | 10,524 |
| | | | 573,155 |
| Consumer Finance - 0.1% | | | |
| OneMain Holdings, Inc. | | 695,793 | 28,882 |
| Shriram Transport Finance Co. Ltd. | | 579,403 | 13,508 |
| | | | 42,390 |
| Financial Services - 2.3% | | | |
| Apollo Global Management, Inc. | | 1,093,819 | 95,534 |
| Berkshire Hathaway, Inc.: | | | |
| Class A (b) | | 79 | 43,191 |
| Class B (b) | | 129,828 | 46,764 |
| Block, Inc. Class A (b) | | 857,409 | 49,430 |
| Dlocal Ltd. (b) | | 1,250,094 | 26,802 |
| Fiserv, Inc. (b) | | 752,309 | 91,323 |
| FleetCor Technologies, Inc. (b) | | 117,185 | 31,843 |
| Global Payments, Inc. | | 492,575 | 62,404 |
| Jumo World Ltd. (b)(e) | | 1,163 | 1,042 |
| One97 Communications Ltd. (b) | | 3,304,900 | 34,120 |
| UWM Holdings Corp. Class A (c) | | 1,129,641 | 6,733 |
| Visa, Inc. Class A | | 1,609,166 | 395,340 |
| Voya Financial, Inc. | | 265,724 | 18,516 |
| Worldline SA (a)(b) | | 570,002 | 18,592 |
| | | | 921,634 |
| Insurance - 1.7% | | | |
| Arthur J. Gallagher & Co. | | 401,716 | 92,588 |
| Chubb Ltd. | | 547,070 | 109,890 |
| Direct Line Insurance Group PLC | | 9,138,809 | 18,772 |
| Everest Re Group Ltd. | | 130,405 | 47,034 |
| Fairfax Financial Holdings Ltd. (sub. vtg.) | | 49,361 | 40,706 |
| Globe Life, Inc. | | 228,201 | 25,460 |
| Hartford Financial Services Group, Inc. | | 861,530 | 61,875 |
| Marsh & McLennan Companies, Inc. | | 532,997 | 103,929 |
| Progressive Corp. | | 631,919 | 84,342 |
| Prudential PLC | | 1,057,440 | 12,879 |
| The Travelers Companies, Inc. | | 463,927 | 74,799 |
| Unum Group | | 840,234 | 41,331 |
| | | | 713,605 |
TOTAL FINANCIALS | | | 3,279,705 |
| HEALTH CARE - 8.1% | | | |
| Biotechnology - 1.4% | | | |
| Biogen, Inc. (b) | | 147,220 | 39,361 |
| Exact Sciences Corp. (b) | | 452,580 | 37,867 |
| Gilead Sciences, Inc. | | 2,576,104 | 197,020 |
| Legend Biotech Corp. ADR (b) | | 367,760 | 25,508 |
| PTC Therapeutics, Inc. (b) | | 404,842 | 15,991 |
| Regeneron Pharmaceuticals, Inc. (b) | | 60,147 | 49,711 |
| Sarepta Therapeutics, Inc. (b) | | 128,656 | 15,569 |
| Vertex Pharmaceuticals, Inc. (b) | | 554,726 | 193,233 |
| | | | 574,260 |
| Health Care Equipment & Supplies - 1.7% | | | |
| Abbott Laboratories | | 353,247 | 36,349 |
| Boston Scientific Corp. (b) | | 5,048,770 | 272,331 |
| Intuitive Surgical, Inc. (b) | | 397,273 | 124,219 |
| Masimo Corp. (b) | | 81,200 | 9,280 |
| Penumbra, Inc. (b) | | 176,052 | 46,566 |
| PROCEPT BioRobotics Corp. (b) | | 156,259 | 5,330 |
| Stryker Corp. | | 756,046 | 214,377 |
| | | | 708,452 |
| Health Care Providers & Services - 2.3% | | | |
| agilon health, Inc. (b) | | 1,815,720 | 32,175 |
| Cencora, Inc. | | 909,087 | 159,981 |
| Cigna Group | | 374,106 | 103,351 |
| Humana, Inc. | | 148,536 | 68,569 |
| Surgery Partners, Inc. (b) | | 2,880,648 | 104,452 |
| UnitedHealth Group, Inc. | | 1,011,444 | 482,034 |
| | | | 950,562 |
| Life Sciences Tools & Services - 0.6% | | | |
| 10X Genomics, Inc. (b) | | 409,881 | 21,252 |
| Danaher Corp. | | 253,015 | 67,049 |
| Gerresheimer AG | | 704,665 | 91,616 |
| IQVIA Holdings, Inc. (b) | | 105,201 | 23,421 |
| Thermo Fisher Scientific, Inc. | | 78,681 | 43,833 |
| | | | 247,171 |
| Pharmaceuticals - 2.1% | | | |
| AstraZeneca PLC sponsored ADR | | 2,048,253 | 138,913 |
| Eli Lilly & Co. | | 791,922 | 438,883 |
| Indivior PLC (b) | | 2,021,618 | 46,610 |
| Merck & Co., Inc. | | 1,525,060 | 166,201 |
| Royalty Pharma PLC | | 1,820,448 | 54,286 |
| | | | 844,893 |
TOTAL HEALTH CARE | | | 3,325,338 |
| INDUSTRIALS - 5.5% | | | |
| Aerospace & Defense - 1.2% | | | |
| Howmet Aerospace, Inc. | | 1,063,049 | 52,589 |
| Lockheed Martin Corp. | | 311,590 | 139,701 |
| Northrop Grumman Corp. | | 111,457 | 48,271 |
| RTX Corp. | | 379,173 | 32,624 |
| Space Exploration Technologies Corp. Class A (b)(d)(e) | | 117,000 | 9,477 |
| The Boeing Co. (b) | | 657,843 | 147,377 |
| TransDigm Group, Inc. | | 73,235 | 66,193 |
| | | | 496,232 |
| Air Freight & Logistics - 0.1% | | | |
| United Parcel Service, Inc. Class B | | 179,756 | 30,451 |
| Building Products - 0.4% | | | |
| Trane Technologies PLC | | 787,155 | 161,571 |
| Electrical Equipment - 0.6% | | | |
| AMETEK, Inc. | | 1,027,130 | 163,838 |
| Eaton Corp. PLC | | 340,115 | 78,352 |
| | | | 242,190 |
| Ground Transportation - 0.9% | | | |
| CSX Corp. | | 2,629,426 | 79,409 |
| Old Dominion Freight Lines, Inc. | | 292,670 | 125,078 |
| Uber Technologies, Inc. (b) | | 1,449,629 | 68,466 |
| Union Pacific Corp. | | 402,084 | 88,688 |
| | | | 361,641 |
| Industrial Conglomerates - 0.4% | | | |
| General Electric Co. | | 1,412,778 | 161,707 |
| Honeywell International, Inc. | | 110,901 | 20,843 |
| | | | 182,550 |
| Machinery - 1.8% | | | |
| Caterpillar, Inc. | | 418,097 | 117,540 |
| Deere & Co. | | 100,468 | 41,286 |
| Dover Corp. | | 796,353 | 118,099 |
| Fortive Corp. | | 2,125,396 | 167,587 |
| Ingersoll Rand, Inc. | | 1,768,462 | 123,103 |
| Parker Hannifin Corp. | | 411,868 | 171,708 |
| | | | 739,323 |
| Passenger Airlines - 0.1% | | | |
| Delta Air Lines, Inc. | | 573,154 | 24,577 |
| Professional Services - 0.0% | | | |
| Dun & Bradstreet Holdings, Inc. | | 1,810,831 | 19,738 |
TOTAL INDUSTRIALS | | | 2,258,273 |
| INFORMATION TECHNOLOGY - 16.4% | | | |
| Electronic Equipment, Instruments & Components - 0.2% | | | |
| Amphenol Corp. Class A | | 912,014 | 80,604 |
| IT Services - 0.8% | | | |
| Accenture PLC Class A | | 139,526 | 45,174 |
| Capgemini SA | | 187,207 | 34,937 |
| EPAM Systems, Inc. (b) | | 182,477 | 47,260 |
| MongoDB, Inc. Class A (b) | | 214,372 | 81,740 |
| Shopify, Inc. Class A (b) | | 379,098 | 25,206 |
| Snowflake, Inc. (b) | | 219,618 | 34,447 |
| Twilio, Inc. Class A (b) | | 549,005 | 34,977 |
| Wix.com Ltd. (b) | | 319,372 | 31,544 |
| | | | 335,285 |
| Semiconductors & Semiconductor Equipment - 4.1% | | | |
| Advanced Micro Devices, Inc. (b) | | 901,733 | 95,331 |
| ASML Holding NV (Netherlands) | | 80,514 | 52,940 |
| Lam Research Corp. | | 143,562 | 100,838 |
| Marvell Technology, Inc. | | 1,191,746 | 69,419 |
| Micron Technology, Inc. | | 2,046,867 | 143,158 |
| NVIDIA Corp. | | 1,894,465 | 935,013 |
| NXP Semiconductors NV | | 411,707 | 84,696 |
| Renesas Electronics Corp. (b) | | 2,825,127 | 47,066 |
| SolarEdge Technologies, Inc. (b) | | 228,545 | 37,155 |
| Taiwan Semiconductor Manufacturing Co. Ltd. | | 5,593,000 | 96,055 |
| | | | 1,661,671 |
| Software - 7.4% | | | |
| Adobe, Inc. (b) | | 512,667 | 286,755 |
| Autodesk, Inc. (b) | | 385,116 | 85,473 |
| CCC Intelligent Solutions Holdings, Inc. (b)(d) | | 253,848 | 2,716 |
| Elastic NV (b) | | 397,069 | 24,571 |
| Five9, Inc. (b) | | 542,618 | 39,269 |
| HubSpot, Inc. (b) | | 162,220 | 88,656 |
| Intuit, Inc. | | 350,804 | 190,069 |
| Microsoft Corp. | | 5,868,167 | 1,923,353 |
| Salesforce, Inc. (b) | | 979,389 | 216,895 |
| Stripe, Inc. Class B (b)(d)(e) | | 110,500 | 2,051 |
| Synopsys, Inc. (b) | | 212,945 | 97,718 |
| Tenable Holdings, Inc. (b) | | 430,567 | 19,535 |
| Workday, Inc. Class A (b) | | 279,425 | 68,319 |
| | | | 3,045,380 |
| Technology Hardware, Storage & Peripherals - 3.9% | | | |
| Apple, Inc. | | 8,351,220 | 1,568,944 |
| Samsung Electronics Co. Ltd. | | 636,060 | 32,117 |
| | | | 1,601,061 |
TOTAL INFORMATION TECHNOLOGY | | | 6,724,001 |
| MATERIALS - 1.5% | | | |
| Chemicals - 1.0% | | | |
| Air Products & Chemicals, Inc. | | 136,643 | 40,377 |
| Cabot Corp. | | 206,351 | 14,952 |
| Celanese Corp. Class A | | 243,408 | 30,757 |
| Chemtrade Logistics Income Fund | | 1,227,981 | 7,734 |
| Corteva, Inc. | | 610,041 | 30,813 |
| DuPont de Nemours, Inc. | | 396,786 | 30,509 |
| Linde PLC | | 438,188 | 169,596 |
| LyondellBasell Industries NV Class A | | 396,485 | 39,161 |
| Nutrien Ltd. | | 104,076 | 6,593 |
| Olin Corp. | | 239,355 | 13,887 |
| The Chemours Co. LLC | | 558,199 | 18,990 |
| Tronox Holdings PLC | | 998,364 | 13,618 |
| Westlake Corp. | | 64,458 | 8,443 |
| | | | 425,430 |
| Construction Materials - 0.1% | | | |
| Martin Marietta Materials, Inc. | | 46,140 | 20,597 |
| Vulcan Materials Co. | | 98,801 | 21,563 |
| | | | 42,160 |
| Containers & Packaging - 0.1% | | | |
| Aptargroup, Inc. | | 116,603 | 15,457 |
| Greif, Inc. Class A | | 203,765 | 14,791 |
| | | | 30,248 |
| Metals & Mining - 0.3% | | | |
| First Quantum Minerals Ltd. | | 1,341,203 | 36,031 |
| Franco-Nevada Corp. | | 116,597 | 16,797 |
| Freeport-McMoRan, Inc. | | 1,226,732 | 48,959 |
| Horizonte Minerals PLC (b) | | 2,358,192 | 3,899 |
| Ivanhoe Mines Ltd. (b) | | 914,987 | 8,140 |
| Major Drilling Group International, Inc. (b) | | 479,282 | 3,086 |
| Reliance Steel & Aluminum Co. | | 64,251 | 18,309 |
| | | | 135,221 |
TOTAL MATERIALS | | | 633,059 |
| REAL ESTATE - 1.5% | | | |
| Equity Real Estate Investment Trusts (REITs) - 1.5% | | | |
| American Tower Corp. | | 351,953 | 63,816 |
| Corporate Office Properties Trust (SBI) | | 503,566 | 13,032 |
| Crown Castle International Corp. | | 334,225 | 33,590 |
| CubeSmart | | 80,732 | 3,367 |
| Digital Realty Trust, Inc. | | 386,276 | 50,880 |
| Equinix, Inc. | | 102,468 | 80,066 |
| Equity Lifestyle Properties, Inc. | | 597,760 | 40,026 |
| Essex Property Trust, Inc. | | 166,341 | 39,654 |
| Extra Space Storage, Inc. | | 12,031 | 1,548 |
| Invitation Homes, Inc. | | 1,046,250 | 35,667 |
| Mid-America Apartment Communities, Inc. | | 326,660 | 47,441 |
| Prologis (REIT), Inc. | | 721,073 | 89,557 |
| Simon Property Group, Inc. | | 259,127 | 29,408 |
| Ventas, Inc. | | 480,570 | 20,991 |
| Welltower, Inc. | | 655,728 | 54,347 |
| | | | 603,390 |
| UTILITIES - 1.5% | | | |
| Electric Utilities - 1.1% | | | |
| Constellation Energy Corp. | | 586,059 | 61,044 |
| Edison International | | 458,363 | 31,558 |
| Exelon Corp. | | 503,576 | 20,203 |
| FirstEnergy Corp. | | 375,261 | 13,536 |
| NextEra Energy, Inc. | | 1,642,098 | 109,692 |
| NRG Energy, Inc. | | 206,028 | 7,736 |
| PG&E Corp. (b) | | 4,377,788 | 71,358 |
| PPL Corp. | | 1,180,232 | 29,411 |
| Southern Co. | | 1,573,955 | 106,604 |
| | | | 451,142 |
| Independent Power and Renewable Electricity Producers - 0.0% | | | |
| The AES Corp. | | 463,707 | 8,314 |
| Multi-Utilities - 0.3% | | | |
| Dominion Energy, Inc. | | 799,009 | 38,784 |
| NiSource, Inc. | | 905,901 | 24,242 |
| Sempra | | 971,606 | 68,226 |
| | | | 131,252 |
| Water Utilities - 0.1% | | | |
| American Water Works Co., Inc. | | 220,811 | 30,635 |
TOTAL UTILITIES | | | 621,343 |
| TOTAL COMMON STOCKS (Cost $15,693,705) | | | 25,256,247 |
| | | | |
| Preferred Stocks - 0.3% |
| | | Shares | Value ($) (000s) |
| Convertible Preferred Stocks - 0.2% | | | |
| COMMUNICATION SERVICES - 0.1% | | | |
| Interactive Media & Services - 0.1% | | | |
| ByteDance Ltd. Series E1 (b)(d)(e) | | 143,672 | 32,483 |
| | | | |
| FINANCIALS - 0.0% | | | |
| Financial Services - 0.0% | | | |
| Circle Internet Financial Ltd. Series F (b)(d)(e) | | 239,407 | 5,150 |
| | | | |
| INDUSTRIALS - 0.0% | | | |
| Aerospace & Defense - 0.0% | | | |
| ABL Space Systems: | | | |
| Series B(b)(d)(e) | | 120,349 | 3,305 |
| Series B2(b)(d)(e) | | 54,288 | 1,454 |
| | | | 4,759 |
| Construction & Engineering - 0.0% | | | |
| Beta Technologies, Inc. Series A (b)(d)(e) | | 49,193 | 5,573 |
| | | | |
TOTAL INDUSTRIALS | | | 10,332 |
| | | | |
| INFORMATION TECHNOLOGY - 0.1% | | | |
| Communications Equipment - 0.0% | | | |
| Astranis Space Technologies Corp. Series C (b)(d)(e) | | 412,038 | 7,446 |
| | | | |
| Semiconductors & Semiconductor Equipment - 0.0% | | | |
| Astera Labs, Inc. Series C (b)(d)(e) | | 947,200 | 8,979 |
| GaN Systems, Inc.: | | | |
| Series F1(b)(d)(e) | | 97,586 | 1,080 |
| Series F2(b)(d)(e) | | 51,529 | 570 |
| Xsight Labs Ltd. Series D (b)(d)(e) | | 450,873 | 2,593 |
| | | | 13,222 |
| Software - 0.1% | | | |
| Algolia, Inc. Series D (b)(d)(e) | | 189,206 | 2,734 |
| Bolt Technology OU Series E (b)(d)(e) | | 41,382 | 5,343 |
| Databricks, Inc.: | | | |
| Series G(b)(d)(e) | | 30,576 | 2,247 |
| Series H(b)(d)(e) | | 125,490 | 9,224 |
| Skyryse, Inc. Series B (b)(d)(e) | | 332,947 | 7,684 |
| Stripe, Inc. Series H (b)(d)(e) | | 135,605 | 2,517 |
| | | | 29,749 |
TOTAL INFORMATION TECHNOLOGY | | | 50,417 |
| | | | |
| TOTAL CONVERTIBLE PREFERRED STOCKS | | | 98,382 |
| Nonconvertible Preferred Stocks - 0.1% | | | |
| FINANCIALS - 0.1% | | | |
| Financial Services - 0.1% | | | |
| Circle Internet Financial Ltd. Series E (b)(d)(e) | | 467,381 | 10,053 |
| | | | |
| INDUSTRIALS - 0.0% | | | |
| Professional Services - 0.0% | | | |
| Checkr, Inc. Series E (b)(e) | | 588,051 | 5,675 |
| | | | |
| INFORMATION TECHNOLOGY - 0.0% | | | |
| IT Services - 0.0% | | | |
| Gupshup, Inc. (b)(d)(e) | | 403,701 | 5,046 |
| | | | |
| TOTAL NONCONVERTIBLE PREFERRED STOCKS | | | 20,774 |
| TOTAL PREFERRED STOCKS (Cost $124,007) | | | 119,156 |
| | | | |
| Nonconvertible Bonds - 0.0% |
| | | Principal Amount (f) (000s) | Value ($) (000s) |
| FINANCIALS - 0.0% | | | |
| Financial Services - 0.0% | | | |
Ant International Co. Ltd. 3.55% 8/14/24 (d)(e) (Cost $10,087) | | 10,087 | 10,036 |
| | | | |
| U.S. Treasury Obligations - 0.0% |
| | | Principal Amount (f) (000s) | Value ($) (000s) |
U.S. Treasury Bills, yield at date of purchase 5.15% to 5.34% 9/14/23 to 10/26/23 (g) (Cost $17,044) | | 17,170 | 17,043 |
| | | | |
| Preferred Securities - 0.0% |
| | | Principal Amount (f) (000s) | Value ($) (000s) |
| INFORMATION TECHNOLOGY - 0.0% | | | |
| Semiconductors & Semiconductor Equipment - 0.0% | | | |
GaN Systems, Inc. 0% (d)(e)(h) (Cost $2,287) | | 2,287 | 2,815 |
| | | | |
| Fixed-Income Funds - 36.7% |
| | | Shares | Value ($) (000s) |
Fidelity Investment Grade Bond Central Fund (i) (Cost $17,225,401) | | 156,243,571 | 15,060,318 |
| | | | |
| Money Market Funds - 1.5% |
| | | Shares | Value ($) (000s) |
| Fidelity Cash Central Fund 5.43% (j) | | 564,482,660 | 564,596 |
| Fidelity Securities Lending Cash Central Fund 5.44% (j)(k) | | 36,229,077 | 36,233 |
| TOTAL MONEY MARKET FUNDS (Cost $600,825) | | | 600,829 |
| | | | |
| TOTAL INVESTMENT IN SECURITIES - 100.0% (Cost $33,673,356) | 41,066,444 |
NET OTHER ASSETS (LIABILITIES) - 0.0% | (11,511) |
| NET ASSETS - 100.0% | 41,054,933 |
| | |
| Futures Contracts |
| | Number of contracts | Expiration Date | Notional Amount ($) (000s) | Value ($) (000s) | Unrealized Appreciation/ (Depreciation) ($) (000s) |
| Purchased | | | | | |
| | | | | | |
| Equity Index Contracts | | | | | |
| CME E-mini S&P 500 Index Contracts (United States) | 1,443 | Sep 2023 | 325,829 | 10,121 | 10,121 |
| | | | | | |
| The notional amount of futures purchased as a percentage of Net Assets is 0.8% |
Any values shown as $0 in the Schedule of Investments may reflect amounts less than $500.
Legend
| (a) | Security exempt from registration under Rule 144A of the Securities Act of 1933. These securities may be resold in transactions exempt from registration, normally to qualified institutional buyers. At the end of the period, the value of these securities amounted to $33,842,000 or 0.1% of net assets. |
| (c) | Security or a portion of the security is on loan at period end. |
| (d) | Restricted securities (including private placements) - Investment in securities not registered under the Securities Act of 1933 (excluding 144A issues). At the end of the period, the value of restricted securities (excluding 144A issues) amounted to $169,141,000 or 0.4% of net assets. |
| (f) | Amount is stated in United States dollars unless otherwise noted. |
| (g) | Security or a portion of the security was pledged to cover margin requirements for futures contracts. At period end, the value of securities pledged amounted to $17,023,000. |
| (h) | Security is perpetual in nature with no stated maturity date. |
| (i) | Affiliated fund that is generally available only to investment companies and other accounts managed by Fidelity Investments. A complete unaudited schedule of portfolio holdings for each Fidelity Central Fund is filed with the SEC for the first and third quarters of each fiscal year on Form N-PORT and is available upon request or at the SEC's website at www.sec.gov. An unaudited holdings listing for the Fund, which presents direct holdings as well as the pro-rata share of securities and other investments held indirectly through its investment in underlying non-money market Fidelity Central Funds, is available at fidelity.com and/or institutional.fidelity.com, as applicable. In addition, each Fidelity Central Fund's financial statements,which are not covered by the Fund's Report of Independent Registered Public Accounting Firm, are available on the SEC's website or upon request. |
| (j) | Affiliated fund that is generally available only to investment companies and other accounts managed by Fidelity Investments. The rate quoted is the annualized seven-day yield of the fund at period end. A complete unaudited listing of the fund's holdings as of its most recent quarter end is available upon request. In addition, each Fidelity Central Fund's financial statements, which are not covered by the Fund's Report of Independent Registered Public Accounting Firm, are available on the SEC's website or upon request. |
| (k) | Investment made with cash collateral received from securities on loan. |
| Additional information on each restricted holding is as follows: |
| Security | Acquisition Date | Acquisition Cost ($) (000s) |
| ABL Space Systems Series B | 3/24/21 | 5,420 |
| | | |
| ABL Space Systems Series B2 | 10/22/21 | 3,691 |
| | | |
| Algolia, Inc. Series D | 7/23/21 | 5,533 |
| | | |
| Ant International Co. Ltd. 3.55% 8/14/24 | 8/14/23 | 10,087 |
| | | |
| Astera Labs, Inc. Series C | 8/24/21 | 3,184 |
| | | |
| Astranis Space Technologies Corp. Series C | 3/19/21 | 9,032 |
| | | |
| Beta Technologies, Inc. Series A | 4/09/21 | 3,604 |
| | | |
| Bolt Technology OU Series E | 1/03/22 | 10,751 |
| | | |
| ByteDance Ltd. Series E1 | 11/18/20 | 15,743 |
| | | |
| Cazoo Group Ltd. | 3/28/21 | 3,875 |
| | | |
| CCC Intelligent Solutions Holdings, Inc. | 2/02/21 | 2,538 |
| | | |
| Circle Internet Financial Ltd. Series E | 5/11/21 | 7,586 |
| | | |
| Circle Internet Financial Ltd. Series F | 5/09/22 | 10,089 |
| | | |
| Databricks, Inc. Series G | 2/01/21 | 1,808 |
| | | |
| Databricks, Inc. Series H | 8/31/21 | 9,222 |
| | | |
| Epic Games, Inc. | 3/29/21 | 10,861 |
| | | |
| GaN Systems, Inc. Series F1 | 11/30/21 | 828 |
| | | |
| GaN Systems, Inc. Series F2 | 11/30/21 | 437 |
| | | |
| GaN Systems, Inc. 0% | 11/30/21 | 2,287 |
| | | |
| Gupshup, Inc. | 6/08/21 | 9,231 |
| | | |
| Skyryse, Inc. Series B | 10/21/21 | 8,217 |
| | | |
| Space Exploration Technologies Corp. Class A | 2/16/21 | 4,914 |
| | | |
| Starling Bank Ltd. Series D | 6/18/21 | 9,104 |
| | | |
| Stripe, Inc. Class B | 5/18/21 | 4,434 |
| | | |
| Stripe, Inc. Series H | 3/15/21 - 5/25/23 | 5,441 |
| | | |
| Xsight Labs Ltd. Series D | 2/16/21 | 3,605 |
| | | |
Affiliated Central Funds
Fiscal year to date information regarding the Fund's investments in Fidelity Central Funds, including the ownership percentage, is presented below.
| Affiliate (Amounts in thousands) | Value, beginning of period ($) | Purchases ($) | Sales Proceeds ($) | Dividend Income ($) | Realized Gain (loss) ($) | Change in Unrealized appreciation (depreciation) ($) | Value, end of period ($) | % ownership, end of period |
| Fidelity Cash Central Fund 5.43% | 300,528 | 8,219,742 | 7,955,674 | 17,295 | 11 | (11) | 564,596 | 1.4% |
| Fidelity Investment Grade Bond Central Fund | 12,494,979 | 3,223,209 | 107,385 | 505,556 | 1,867 | (552,352) | 15,060,318 | 40.1% |
| Fidelity Securities Lending Cash Central Fund 5.44% | 48,085 | 782,128 | 793,980 | 549 | - | - | 36,233 | 0.1% |
| Total | 12,843,592 | 12,225,079 | 8,857,039 | 523,400 | 1,878 | (552,363) | 15,661,147 | |
| | | | | | | | | |
Amounts in the dividend income column in the above table include any capital gain distributions from underlying funds, which are presented in the corresponding line item in the Statement of Operations, if applicable.
Amounts in the dividend income column for Fidelity Securities Lending Cash Central Fund represents the income earned on investing cash collateral, less rebates paid to borrowers and any lending agent fees associated with the loan, plus any premium payments received for lending certain types of securities.
Amounts included in the purchases and sales proceeds columns may include in-kind transactions, if applicable.
Investment Valuation
The following is a summary of the inputs used, as of August 31, 2023, involving the Fund's assets and liabilities carried at fair value. The inputs or methodology used for valuing securities may not be an indication of the risk associated with investing in those securities. For more information on valuation inputs, and their aggregation into the levels used below, please refer to the Investment Valuation section in the accompanying Notes to Financial Statements.
| Valuation Inputs at Reporting Date: |
Description (Amounts in thousands) | Total ($) | Level 1 ($) | Level 2 ($) | Level 3 ($) |
Investments in Securities: | | | | |
|
| Equities: | | | | |
Communication Services | 2,245,665 | 2,205,539 | - | 40,126 |
Consumer Discretionary | 2,715,628 | 2,715,628 | - | - |
Consumer Staples | 1,734,588 | 1,724,623 | 9,965 | - |
Energy | 1,147,740 | 1,147,740 | - | - |
Financials | 3,294,908 | 3,143,646 | 114,117 | 37,145 |
Health Care | 3,325,338 | 3,325,338 | - | - |
Industrials | 2,274,280 | 2,248,796 | - | 25,484 |
Information Technology | 6,779,464 | 6,490,952 | 230,998 | 57,514 |
Materials | 633,059 | 633,059 | - | - |
Real Estate | 603,390 | 603,390 | - | - |
Utilities | 621,343 | 621,343 | - | - |
|
| Corporate Bonds | 10,036 | - | - | 10,036 |
|
| U.S. Government and Government Agency Obligations | 17,043 | - | 17,043 | - |
|
| Preferred Securities | 2,815 | - | - | 2,815 |
|
| Fixed-Income Funds | 15,060,318 | 15,060,318 | - | - |
|
| Money Market Funds | 600,829 | 600,829 | - | - |
| Total Investments in Securities: | 41,066,444 | 40,521,201 | 372,123 | 173,120 |
Derivative Instruments: | | | | |
|
| Assets | | | | |
Futures Contracts | 10,121 | 10,121 | - | - |
| Total Assets | 10,121 | 10,121 | - | - |
| Total Derivative Instruments: | 10,121 | 10,121 | - | - |
Value of Derivative Instruments
The following table is a summary of the Fund's value of derivative instruments by primary risk exposure as of August 31, 2023. For additional information on derivative instruments, please refer to the Derivative Instruments section in the accompanying Notes to Financial Statements.
Primary Risk Exposure / Derivative Type | Value |
| (Amounts in thousands) | Asset ($) | Liability ($) |
| Equity Risk | | |
Futures Contracts (a) | 10,121 | 0 |
| Total Equity Risk | 10,121 | 0 |
| Total Value of Derivatives | 10,121 | 0 |
(a)Reflects gross cumulative appreciation (depreciation) on futures contracts as presented in the Schedule of Investments. In the Statement of Assets and Liabilities, the period end daily variation margin is included in receivable or payable for daily variation margin on futures contracts, and the net cumulative appreciation (depreciation) is included in Total accumulated earnings (loss).
| Statement of Assets and Liabilities |
| Amounts in thousands (except per-share amounts) | | | | August 31, 2023 |
| | | | | |
| Assets | | | | |
| Investment in securities, at value (including securities loaned of $33,956) - See accompanying schedule: | | | | |
Unaffiliated issuers (cost $15,847,130) | $ | 25,405,297 | | |
Fidelity Central Funds (cost $17,826,226) | | 15,661,147 | | |
| | | | | |
| | | | | |
| Total Investment in Securities (cost $33,673,356) | | | $ | 41,066,444 |
| Foreign currency held at value (cost $77) | | | | 77 |
| Receivable for investments sold | | | | 48,178 |
| Receivable for fund shares sold | | | | 23,134 |
| Dividends receivable | | | | 34,304 |
| Interest receivable | | | | 14 |
| Distributions receivable from Fidelity Central Funds | | | | 2,862 |
| Prepaid expenses | | | | 69 |
| Other receivables | | | | 1,554 |
Total assets | | | | 41,176,636 |
| Liabilities | | | | |
| Payable for investments purchased | $ | 44,225 | | |
| Payable for fund shares redeemed | | 21,409 | | |
| Accrued management fee | | 12,635 | | |
| Payable for daily variation margin on futures contracts | | 595 | | |
| Other affiliated payables | | 3,752 | | |
| Other payables and accrued expenses | | 2,854 | | |
| Collateral on securities loaned | | 36,233 | | |
| Total Liabilities | | | | 121,703 |
| Net Assets | | | $ | 41,054,933 |
| Net Assets consist of: | | | | |
| Paid in capital | | | $ | 33,167,632 |
| Total accumulated earnings (loss) | | | | 7,887,301 |
| Net Assets | | | $ | 41,054,933 |
| | | | | |
| Net Asset Value and Maximum Offering Price | | | | |
| Balanced : | | | | |
Net Asset Value, offering price and redemption price per share ($33,113,351 ÷ 1,265,723 shares) | | | $ | 26.16 |
| Class K : | | | | |
Net Asset Value, offering price and redemption price per share ($7,941,582 ÷ 303,512 shares) | | | $ | 26.17 |
| Statement of Operations |
| Amounts in thousands | | | | Year ended August 31, 2023 |
| Investment Income | | | | |
| Dividends | | | $ | 324,010 |
| Interest | | | | 754 |
| Income from Fidelity Central Funds (including $549 from security lending) | | | | 523,400 |
| Total Income | | | | 848,164 |
| Expenses | | | | |
| Management fee | $ | 144,714 | | |
| Transfer agent fees | | 40,701 | | |
| Accounting fees | | 2,374 | | |
| Custodian fees and expenses | | 370 | | |
| Independent trustees' fees and expenses | | 212 | | |
| Registration fees | | 377 | | |
| Audit | | 191 | | |
| Legal | | 65 | | |
| Interest | | 80 | | |
| Miscellaneous | | 190 | | |
| Total expenses before reductions | | 189,274 | | |
| Expense reductions | | (1,934) | | |
| Total expenses after reductions | | | | 187,340 |
| Net Investment income (loss) | | | | 660,824 |
| Realized and Unrealized Gain (Loss) | | | | |
| Net realized gain (loss) on: | | | | |
| Investment Securities: | | | | |
| Unaffiliated issuers (net of foreign taxes of $35) | | 876,766 | | |
| Redemptions in-kind | | 97,766 | | |
| Fidelity Central Funds | | 1,878 | | |
| Foreign currency transactions | | (184) | | |
| Futures contracts | | 15,716 | | |
| Total net realized gain (loss) | | | | 991,942 |
| Change in net unrealized appreciation (depreciation) on: | | | | |
| Investment Securities: | | | | |
| Unaffiliated issuers(net of increase in deferred foreign taxes of $455) | | 3,120,713 | | |
| Fidelity Central Funds | | (552,363) | | |
| Unfunded commitments | | 726 | | |
| Assets and liabilities in foreign currencies | | 196 | | |
| Futures contracts | | 12,148 | | |
| Total change in net unrealized appreciation (depreciation) | | | | 2,581,420 |
| Net gain (loss) | | | | 3,573,362 |
| Net increase (decrease) in net assets resulting from operations | | | $ | 4,234,186 |
| Statement of Changes in Net Assets |
| |
| Amount in thousands | | Year ended August 31, 2023 | | Year ended August 31, 2022 |
| Increase (Decrease) in Net Assets | | | | |
| Operations | | | | |
| Net investment income (loss) | $ | 660,824 | $ | 475,512 |
| Net realized gain (loss) | | 991,942 | | 2,615,408 |
| Change in net unrealized appreciation (depreciation) | | 2,581,420 | | (9,077,818) |
| Net increase (decrease) in net assets resulting from operations | | 4,234,186 | | (5,986,898) |
| Distributions to shareholders | | (2,942,116) | | (4,444,353) |
| | | | | |
| Share transactions - net increase (decrease) | | 423,615 | | 1,859,354 |
| Total increase (decrease) in net assets | | 1,715,685 | | (8,571,897) |
| | | | | |
| Net Assets | | | | |
| Beginning of period | | 39,339,248 | | 47,911,145 |
| End of period | $ | 41,054,933 | $ | 39,339,248 |
| | | | | |
| | | | | |
Financial Highlights
| Years ended August 31, | | 2023 | | 2022 | | 2021 | | 2020 | | 2019 |
Selected Per-Share Data | | | | | | | | | | |
| Net asset value, beginning of period | $ | 25.49 | $ | 32.24 | $ | 27.37 | $ | 23.54 | $ | 25.33 |
| Income from Investment Operations | | | | | | | | | | |
Net investment income (loss) A,B | | .42 | | .30 | | .29 | | .38 | | .42 |
| Net realized and unrealized gain (loss) | | 2.17 | | (4.09) | | 6.17 | | 4.49 | | .08 |
| Total from investment operations | | 2.59 | | (3.79) | | 6.46 | | 4.87 | | .50 |
| Distributions from net investment income | | (.41) | | (.29) | | (.29) | | (.41) | | (.40) |
| Distributions from net realized gain | | (1.51) | | (2.67) | | (1.31) | | (.62) | | (1.89) |
| Total distributions | | (1.92) | | (2.96) | | (1.59) C | | (1.04) C | | (2.29) |
| Net asset value, end of period | $ | 26.16 | $ | 25.49 | $ | 32.24 | $ | 27.37 | $ | 23.54 |
Total Return D | | 11.60% | | (12.80)% | | 24.83% | | 21.44% | | 2.61% |
Ratios to Average Net Assets B,E,F | | | | | | | | | | |
| Expenses before reductions | | .51% | | .50% | | .51% | | .52% | | .53% |
| Expenses net of fee waivers, if any | | .50% | | .50% | | .50% | | .52% | | .53% |
| Expenses net of all reductions | | .50% | | .50% | | .50% | | .51% | | .53% |
| Net investment income (loss) | | 1.70% | | 1.05% | | .98% | | 1.57% | | 1.82% |
| Supplemental Data | | | | | | | | | | |
| Net assets, end of period (in millions) | $ | 33,113 | $ | 31,647 | $ | 37,819 | $ | 28,805 | $ | 24,969 |
Portfolio turnover rate G | | 29% H | | 36% H | | 40% H | | 95% H | | 60% |
ACalculated based on average shares outstanding during the period.
BNet investment income (loss) is affected by the timing of the declaration of dividends by any underlying mutual funds or exchange-traded funds (ETFs). Net investment income (loss) of any mutual funds or ETFs is not included in the Fund's net investment income (loss) ratio.
CTotal distributions per share do not sum due to rounding.
DTotal returns would have been lower if certain expenses had not been reduced during the applicable periods shown.
EFees and expenses of any underlying mutual funds or exchange-traded funds (ETFs) are not included in the Fund's expense ratio. The Fund indirectly bears its proportionate share of these expenses. For additional expense information related to investments in Fidelity Central Funds, please refer to the "Investments in Fidelity Central Funds" note found in the Notes to Financial Statements section of the most recent Annual or Semi-Annual report.
FExpense ratios reflect operating expenses of the class. Expenses before reductions do not reflect amounts reimbursed, waived, or reduced through arrangements with the investment adviser, brokerage services, or other offset arrangements, if applicable, and do not represent the amount paid by the class during periods when reimbursements, waivers or reductions occur.
GAmount does not include the portfolio activity of any underlying mutual funds or exchange-traded funds (ETFs).
HPortfolio turnover rate excludes securities received or delivered in-kind.
| Fidelity® Balanced Fund Class K |
| |
| Years ended August 31, | | 2023 | | 2022 | | 2021 | | 2020 | | 2019 |
Selected Per-Share Data | | | | | | | | | | |
| Net asset value, beginning of period | $ | 25.49 | $ | 32.24 | $ | 27.37 | $ | 23.55 | $ | 25.33 |
| Income from Investment Operations | | | | | | | | | | |
Net investment income (loss) A,B | | .43 | | .32 | | .31 | | .40 | | .44 |
| Net realized and unrealized gain (loss) | | 2.19 | | (4.09) | | 6.17 | | 4.48 | | .09 |
| Total from investment operations | | 2.62 | | (3.77) | | 6.48 | | 4.88 | | .53 |
| Distributions from net investment income | | (.42) | | (.31) | | (.31) | | (.43) | | (.42) |
| Distributions from net realized gain | | (1.51) | | (2.67) | | (1.31) | | (.62) | | (1.89) |
| Total distributions | | (1.94) C | | (2.98) | | (1.61) C | | (1.06) C | | (2.31) |
| Net asset value, end of period | $ | 26.17 | $ | 25.49 | $ | 32.24 | $ | 27.37 | $ | 23.55 |
Total Return D | | 11.72% | | (12.73)% | | 24.92% | | 21.49% | | 2.74% |
Ratios to Average Net Assets B,E,F | | | | | | | | | | |
| Expenses before reductions | | .43% | | .43% | | .43% | | .44% | | .45% |
| Expenses net of fee waivers, if any | | .42% | | .42% | | .43% | | .44% | | .45% |
| Expenses net of all reductions | | .42% | | .42% | | .43% | | .43% | | .44% |
| Net investment income (loss) | | 1.78% | | 1.12% | | 1.06% | | 1.65% | | 1.91% |
| Supplemental Data | | | | | | | | | | |
| Net assets, end of period (in millions) | $ | 7,942 | $ | 7,692 | $ | 10,092 | $ | 9,033 | $ | 8,429 |
Portfolio turnover rate G | | 29% H | | 36% H | | 40% H | | 95% H | | 60% |
ACalculated based on average shares outstanding during the period.
BNet investment income (loss) is affected by the timing of the declaration of dividends by any underlying mutual funds or exchange-traded funds (ETFs). Net investment income (loss) of any mutual funds or ETFs is not included in the Fund's net investment income (loss) ratio.
CTotal distributions per share do not sum due to rounding.
DTotal returns would have been lower if certain expenses had not been reduced during the applicable periods shown.
EFees and expenses of any underlying mutual funds or exchange-traded funds (ETFs) are not included in the Fund's expense ratio. The Fund indirectly bears its proportionate share of these expenses. For additional expense information related to investments in Fidelity Central Funds, please refer to the "Investments in Fidelity Central Funds" note found in the Notes to Financial Statements section of the most recent Annual or Semi-Annual report.
FExpense ratios reflect operating expenses of the class. Expenses before reductions do not reflect amounts reimbursed, waived, or reduced through arrangements with the investment adviser, brokerage services, or other offset arrangements, if applicable, and do not represent the amount paid by the class during periods when reimbursements, waivers or reductions occur.
GAmount does not include the portfolio activity of any underlying mutual funds or exchange-traded funds (ETFs).
HPortfolio turnover rate excludes securities received or delivered in-kind.
For the period ended August 31, 2023
(Amounts in thousands except percentages)
1. Organization.
Fidelity Balanced Fund (the Fund) is a fund of Fidelity Puritan Trust (the Trust) and is authorized to issue an unlimited number of shares. The Trust is registered under the Investment Company Act of 1940, as amended (the 1940 Act), as an open-end management investment company organized as a Massachusetts business trust. The Fund offers Balanced and Class K shares, each of which has equal rights as to assets and voting privileges. Each class has exclusive voting rights with respect to matters that affect that class.
2. Investments in Fidelity Central Funds.
Funds may invest in Fidelity Central Funds, which are open-end investment companies generally available only to other investment companies and accounts managed by the investment adviser and its affiliates. The Schedule of Investments lists any Fidelity Central Funds held as an investment as of period end, but does not include the underlying holdings of each Fidelity Central Fund. An investing fund indirectly bears its proportionate share of the expenses of the underlying Fidelity Central Funds.
Based on its investment objective, each Fidelity Central Fund may invest or participate in various investment vehicles or strategies that are similar to those of the investing fund. These strategies are consistent with the investment objectives of the investing fund and may involve certain economic risks which may cause a decline in value of each of the Fidelity Central Funds and thus a decline in the value of the investing fund.
| Fidelity Central Fund | Investment Manager | Investment Objective | Investment Practices | Expense RatioA |
| Fidelity Investment Grade Bond Central Fund | Fidelity Management & Research Company LLC (FMR) | Seeks a high level of income by normally investing in investment-grade debt securities. | Delayed Delivery & When Issued Securities Futures Options Restricted Securities Swaps | Less than .005% |
| Fidelity Money Market Central Funds | Fidelity Management & Research Company LLC (FMR) | Each fund seeks to obtain a high level of current income consistent with the preservation of capital and liquidity. | Short-term Investments | Less than .005% |
A Expenses expressed as a percentage of average net assets and are as of each underlying Central Fund's most recent annual or semi-annual shareholder report.
An unaudited holdings listing for the investing fund, which presents direct holdings as well as the pro-rata share of any securities and other investments held indirectly through its investment in underlying non-money market Fidelity Central Funds, is available at fidelity.com and/or institutional.fidelity.com, as applicable. A complete unaudited list of holdings for each Fidelity Central Fund is available upon request or at the Securities and Exchange Commission website at www.sec.gov. In addition, the financial statements of the Fidelity Central Funds which contain the significant accounting policies (including investment valuation policies) of those funds, and are not covered by the Report of Independent Registered Public Accounting Firm, are available on the Securities and Exchange Commission website or upon request.
3. Significant Accounting Policies.
The Fund is an investment company and applies the accounting and reporting guidance of the Financial Accounting Standards Board (FASB) Accounting Standards Codification Topic 946 Financial Services - Investment Companies. The financial statements have been prepared in conformity with accounting principles generally accepted in the United States of America (GAAP), which require management to make certain estimates and assumptions at the date of the financial statements. Actual results could differ from those estimates. Subsequent events, if any, through the date that the financial statements were issued have been evaluated in the preparation of the financial statements. The Fund's Schedule of Investments lists any underlying mutual funds or exchange-traded funds (ETFs) but does not include the underlying holdings of these funds. The following summarizes the significant accounting policies of the Fund:
Investment Valuation. Investments are valued as of 4:00 p.m. Eastern time on the last calendar day of the period. The Board of Trustees (the Board) has designated the Fund's investment adviser as the valuation designee responsible for the fair valuation function and performing fair value determinations as needed. The investment adviser has established a Fair Value Committee (the Committee) to carry out the day-to-day fair valuation responsibilities and has adopted policies and procedures to govern the fair valuation process and the activities of the Committee. In accordance with these fair valuation policies and procedures, which have been approved by the Board, the Fund attempts to obtain prices from one or more third party pricing services or brokers to value its investments. When current market prices, quotations or currency exchange rates are not readily available or reliable, investments will be fair valued in good faith by the Committee, in accordance with the policies and procedures. Factors used in determining fair value vary by investment type and may include market or investment specific events, transaction data, estimated cash flows, and market observations of comparable investments. The frequency that the fair valuation procedures are used cannot be predicted and they may be utilized to a significant extent. The Committee manages the Fund's fair valuation practices and maintains the fair valuation policies and procedures. The Fund's investment adviser reports to the Board information regarding the fair valuation process and related material matters.
The Fund categorizes the inputs to valuation techniques used to value its investments into a disclosure hierarchy consisting of three levels as shown below:
Level 1 - unadjusted quoted prices in active markets for identical investments
Level 2 - other significant observable inputs (including quoted prices for similar investments, interest rates, prepayment speeds, etc.)
Level 3 - unobservable inputs (including the Fund's own assumptions based on the best information available)
Valuation techniques used to value the Fund's investments by major category are as follows:
Equity securities, including restricted securities, for which market quotations are readily available, are valued at the last reported sale price or official closing price as reported by a third party pricing service on the primary market or exchange on which they are traded and are categorized as Level 1 in the hierarchy. In the event there were no sales during the day or closing prices are not available, securities are valued at the last quoted bid price or may be valued using the last available price and are generally categorized as Level 2 in the hierarchy. For foreign equity securities, when market or security specific events arise, comparisons to the valuation of American Depositary Receipts (ADRs), futures contracts, ETFs and certain indexes as well as quoted prices for similar securities may be used and would be categorized as Level 2 in the hierarchy. For equity securities, including restricted securities, where observable inputs are limited, assumptions about market activity and risk are used and these securities may be categorized as Level 3 in the hierarchy.
Debt securities, including restricted securities, are valued based on evaluated prices received from third party pricing services or from brokers who make markets in such securities. Corporate bonds, preferred securities and U.S. government and government agency obligations are valued by pricing services who utilize matrix pricing which considers yield or price of bonds of comparable quality, coupon, maturity and type or by broker-supplied prices. When independent prices are unavailable or unreliable, debt securities may be valued utilizing pricing methodologies which consider similar factors that would be used by third party pricing services. Debt securities are generally categorized as Level 2 in the hierarchy but may be Level 3 depending on the circumstances.
Futures contracts are valued at the settlement price established each day by the board of trade or exchange on which they are traded and are categorized as Level 1 in the hierarchy. Investments in open-end mutual funds, including the Fidelity Central Funds, are valued at their closing net asset value (NAV) each business day and are categorized as Level 1 in the hierarchy.
Changes in valuation techniques may result in transfers in or out of an assigned level within the disclosure hierarchy. The aggregate value of investments by input level as of August 31, 2023 is included at the end of the Fund's Schedule of Investments.
Foreign Currency. Certain Funds may use foreign currency contracts to facilitate transactions in foreign-denominated securities. Gains and losses from these transactions may arise from changes in the value of the foreign currency or if the counterparties do not perform under the contracts' terms.
Foreign-denominated assets, including investment securities, and liabilities are translated into U.S. dollars at the exchange rates at period end. Purchases and sales of investment securities, income and dividends received, and expenses denominated in foreign currencies are translated into U.S. dollars at the exchange rate in effect on the transaction date.
The effects of exchange rate fluctuations on investments are included with the net realized and unrealized gain (loss) on investment securities. Other foreign currency transactions resulting in realized and unrealized gain (loss) are disclosed separately.
Investment Transactions and Income. For financial reporting purposes, the Fund's investment holdings and NAV include trades executed through the end of the last business day of the period. The NAV per share for processing shareholder transactions is calculated as of the close of business of the New York Stock Exchange (NYSE), normally 4:00 p.m. Eastern time and includes trades executed through the end of the prior business day. Gains and losses on securities sold are determined on the basis of identified cost and include proceeds received from litigation. Commissions paid to certain brokers with whom the investment adviser, or its affiliates, places trades on behalf of a fund include an amount in addition to trade execution, which may be rebated back to a fund. Any such rebates are included in net realized gain (loss) on investments in the Statement of Operations. Dividend income is recorded on the ex-dividend date, except for certain dividends from foreign securities where the ex-dividend date may have passed, which are recorded as soon as the Fund is informed of the ex-dividend date. Non-cash dividends included in dividend income, if any, are recorded at the fair market value of the securities received. Income and capital gain distributions from Fidelity Central Funds, if any, are recorded on the ex-dividend date. Certain distributions received by the Fund represent a return of capital or capital gain. The Fund determines the components of these distributions subsequent to the ex-dividend date, based upon receipt of tax filings or other correspondence relating to the underlying investment. These distributions are recorded as a reduction of cost of investments and/or as a realized gain. Interest income is accrued as earned and includes coupon interest and amortization of premium and accretion of discount on debt securities as applicable. Investment income is recorded net of foreign taxes withheld where recovery of such taxes is uncertain. Debt obligations may be placed on non-accrual status and related interest income may be reduced by ceasing current accruals and writing off interest receivables when the collection of all or a portion of interest has become doubtful based on consistently applied procedures. A debt obligation is removed from non-accrual status when the issuer resumes interest payments or when collectability of interest is reasonably assured. Funds may file withholding tax reclaims in certain jurisdictions to recover a portion of amounts previously withheld. Any withholding tax reclaims income is included in the Statement of Operations in dividends. Any receivables for withholding tax reclaims are included in the Statement of Assets and Liabilities in dividends receivable.
Class Allocations and Expenses. Investment income, realized and unrealized capital gains and losses, common expenses of a fund, and certain fund-level expense reductions, if any, are allocated daily on a pro-rata basis to each class based on the relative net assets of each class to the total net assets of a fund. Each class differs with respect to transfer agent and distribution and service plan fees incurred, as applicable. Certain expense reductions may also differ by class, if applicable. For the reporting period, the allocated portion of income and expenses to each class as a percent of its average net assets may vary due to the timing of recording these transactions in relation to fluctuating net assets of the classes. Expenses directly attributable to a fund are charged to that fund. Expenses attributable to more than one fund are allocated among the respective funds on the basis of relative net assets or other appropriate methods. Expenses included in the accompanying financial statements reflect the expenses of that fund and do not include any expenses associated with any underlying mutual funds or ETFs. Although not included in a fund's expenses, a fund indirectly bears its proportionate share of these expenses through the net asset value of each underlying mutual fund or ETF. Expense estimates are accrued in the period to which they relate and adjustments are made when actual amounts are known.
Deferred Trustee Compensation. Under a Deferred Compensation Plan (the Plan) for certain Funds, certain independent Trustees have elected to defer receipt of a portion of their annual compensation. Deferred amounts are invested in affiliated mutual funds, are marked-to-market and remain in a fund until distributed in accordance with the Plan. The investment of deferred amounts and the offsetting payable to the Trustees presented below are included in the accompanying Statement of Assets and Liabilities in other receivables and other payables and accrued expenses, as applicable.
| Fidelity Balanced Fund | $1,171 |
Income Tax Information and Distributions to Shareholders. Each year, the Fund intends to qualify as a regulated investment company under Subchapter M of the Internal Revenue Code, including distributing substantially all of its taxable income and realized gains. As a result, no provision for U.S. Federal income taxes is required. As of August 31, 2023, the Fund did not have any unrecognized tax benefits in the financial statements; nor is the Fund aware of any tax positions for which it is reasonably possible that the total amounts of unrecognized tax benefits will significantly change in the next twelve months. The Fund files a U.S. federal tax return, in addition to state and local tax returns as required. The Fund's federal income tax returns are subject to examination by the Internal Revenue Service (IRS) for a period of three fiscal years after they are filed. State and local tax returns may be subject to examination for an additional fiscal year depending on the jurisdiction. Foreign taxes are provided for based on the Fund's understanding of the tax rules and rates that exist in the foreign markets in which it invests. The Fund is subject to a tax imposed on capital gains by certain countries in which it invests. An estimated deferred tax liability for net unrealized appreciation on the applicable securities is included in Other payables and accrued expenses on the Statement of Assets & Liabilities.
Distributions are declared and recorded on the ex-dividend date. Income and capital gain distributions are declared separately for each class. Income and capital gain distributions are determined in accordance with income tax regulations, which may differ from GAAP. In addition, the Fund claimed a portion of the payment made to redeeming shareholders as a distribution for income tax purposes.
Capital accounts within the financial statements are adjusted for permanent book-tax differences. These adjustments have no impact on net assets or the results of operations. Capital accounts are not adjusted for temporary book-tax differences which will reverse in a subsequent period.
Book-tax differences are primarily due to the futures contracts, foreign currency transactions, certain foreign taxes, passive foreign investment companies (PFIC), market discount, redemptions in kind, partnerships and losses deferred due to wash sales and excise tax regulations.
As of period end, the cost and unrealized appreciation (depreciation) in securities, and derivatives if applicable, for federal income tax purposes were as follows:
| Gross unrealized appreciation | $10,264,558 |
| Gross unrealized depreciation | (2,928,263) |
| Net unrealized appreciation (depreciation) | $7,336,295 |
| Tax Cost | $33,730,149 |
The tax-based components of distributable earnings as of period end were as follows:
| Undistributed ordinary income | $136,624 |
| Undistributed long-term capital gain | $415,780 |
| Net unrealized appreciation (depreciation) on securities and other investments | $7,336,249 |
The tax character of distributions paid was as follows:
| | August 31, 2023 | August 31, 2022 |
| Ordinary Income | $640,900 | $1,821,812 |
| Long-term Capital Gains | 2,301,216 | 2,622,541 |
| Total | $2,942,116 | $4,444,353 |
Restricted Securities (including Private Placements). Funds may invest in securities that are subject to legal or contractual restrictions on resale. These securities generally may be resold in transactions exempt from registration or to the public if the securities are registered. Disposal of these securities may involve time-consuming negotiations and expense, and prompt sale at an acceptable price may be difficult. Information regarding restricted securities held at period end is included at the end of the Schedule of Investments, if applicable.
4. Derivative Instruments.
Risk Exposures and the Use of Derivative Instruments. The Fund's investment objectives allow for various types of derivative instruments, including futures contracts. Derivatives are investments whose value is primarily derived from underlying assets, indices or reference rates and may be transacted on an exchange or over-the-counter (OTC). Derivatives may involve a future commitment to buy or sell a specified asset based on specified terms, to exchange future cash flows at periodic intervals based on a notional principal amount, or for one party to make one or more payments upon the occurrence of specified events in exchange for periodic payments from the other party.
Derivatives were used to increase returns and to manage exposure to certain risks as defined below. The success of any strategy involving derivatives depends on analysis of numerous economic factors, and if the strategies for investment do not work as intended, the objectives may not be achieved.
Derivatives were used to increase or decrease exposure to the following risk(s):
| | |
| Equity Risk | Equity risk relates to the fluctuations in the value of financial instruments as a result of changes in market prices (other than those arising from interest rate risk or foreign exchange risk), whether caused by factors specific to an individual investment, its issuer, or all factors affecting all instruments traded in a market or market segment. |
Funds are also exposed to additional risks from investing in derivatives, such as liquidity risk and counterparty credit risk. Liquidity risk is the risk that a fund will be unable to close out the derivative in the open market in a timely manner. Counterparty credit risk is the risk that the counterparty will not be able to fulfill its obligation to a fund. Counterparty credit risk related to exchange-traded contracts may be mitigated by the protection provided by the exchange on which they trade.
Investing in derivatives may involve greater risks than investing in the underlying assets directly and, to varying degrees, may involve risk of loss in excess of any initial investment and collateral received and amounts recognized in the Statement of Assets and Liabilities. In addition, there may be the risk that the change in value of the derivative contract does not correspond to the change in value of the underlying instrument.
Futures Contracts. A futures contract is an agreement between two parties to buy or sell a specified underlying instrument for a fixed price at a specified future date. Futures contracts were used to manage exposure to the stock market.
Upon entering into a futures contract, a fund is required to deposit either cash or securities (initial margin) with a clearing broker in an amount equal to a certain percentage of the face value of the contract. Futures contracts are marked-to-market daily and subsequent daily payments are made or received by a fund depending on the daily fluctuations in the value of the futures contracts and are recorded as unrealized appreciation or (depreciation). This receivable and/or payable, if any, is included in daily variation margin on futures contracts in the Statement of Assets and Liabilities. Realized gain or (loss) is recorded upon the expiration or closing of a futures contract. The net realized gain (loss) and change in net unrealized appreciation (depreciation) on futures contracts during the period is presented in the Statement of Operations.
Any open futures contracts at period end are presented in the Schedule of Investments under the caption "Futures Contracts". The notional amount at value reflects each contract's exposure to the underlying instrument or index at period end, and is representative of volume of activity during the period unless an average notional amount is presented. Any securities deposited to meet initial margin requirements are identified in the Schedule of Investments. Any cash deposited to meet initial margin requirements is presented as segregated cash with brokers for derivative instruments in the Statement of Assets and Liabilities.
5. Purchases and Sales of Investments.
Purchases and sales of securities, other than short-term securities, U.S. government securities and in-kind transactions, as applicable, are noted in the table below.
| | Purchases ($) | Sales ($) |
| Fidelity Balanced Fund | 10,929,642 | 12,679,674 |
Unaffiliated Redemptions In-Kind. Shares that were redeemed in-kind for investments, including accrued interest and cash, if any, are shown in the table below. The net realized gain or loss on investments delivered through in-kind redemptions is included in the "Net realized gain (loss) on: Redemptions in-kind" line in the accompanying Statement of Operations. The amount of the in-kind redemptions is included in share transactions in the accompanying Statement of Changes in Net Assets. There was no gain or loss for federal income tax purposes.
| | Shares | Total net realized gain or loss ($) | Total Proceeds ($) | Participating classes |
| Fidelity Balanced Fund | 13,857 | 97,766 | 327,304 | Balanced, Class K |
Prior Fiscal Year Unaffiliated Redemptions In-Kind. Shares that were redeemed in-kind for investments, including accrued interest and cash, if any, are shown in the table below; along with realized gain or loss on investments delivered through in-kind redemptions. The amount of the in-kind redemptions is included in share transactions in the accompanying Statement of Changes in Net Assets. There was no gain or loss for federal income tax purposes.
| | Shares | Total net realized gain or loss ($) | Total Proceeds ($) | Participating classes |
| Fidelity Balanced Fund | 7,482 | 79,467 | 216,180 | Balanced, Class K |
6. Fees and Other Transactions with Affiliates.
Management Fee. Fidelity Management & Research Company LLC (the investment adviser) and its affiliates provide the Fund with investment management related services for which the Fund pays a monthly management fee. The management fee is the sum of an individual fund fee rate that is based on an annual rate of .15% of the Fund's average net assets and an annualized group fee rate that averaged .23% during the period. The group fee rate is based upon the monthly average net assets of a group of registered investment companies with which the investment adviser has management contracts. The group fee rate decreases as assets under management increase and increases as assets under management decrease. For the reporting period, the total annual management fee rate was .38% of the Fund's average net assets.
Transfer Agent Fees. Fidelity Investments Institutional Operations Company LLC (FIIOC), an affiliate of the investment adviser, is the transfer, dividend disbursing and shareholder servicing agent for each class of the Fund. FIIOC receives account fees and asset-based fees that vary according to the account size and type of account of the shareholders of the respective classes of the Fund, except for Class K. FIIOC receives an asset-based fee of Class K's average net assets. FIIOC pays for typesetting, printing and mailing of shareholder reports, except proxy statements.
For the period, transfer agent fees for each class were as follows:
| | Amount | % of Class-Level Average Net Assets |
| Balanced | $ 37,518 | .12 |
| Class K | 3,183 | .04 |
| | $40,701 | |
Accounting Fees. Fidelity Service Company, Inc. (FSC), an affiliate of the investment adviser, maintains the Fund's accounting records. The accounting fee is based on the level of average net assets for each month. For the period, the fees were equivalent to the following annual rates:
| | % of Average Net Assets |
| Fidelity Balanced Fund | .01 |
Brokerage Commissions. A portion of portfolio transactions were placed with brokerage firms which are affiliates of the investment adviser. Brokerage commissions are included in net realized gain (loss) and change in net unrealized appreciation (depreciation) in the Statement of Operations. The commissions paid to these affiliated firms were as follows:
| | Amount |
| Fidelity Balanced Fund | $ 157 |
Interfund Lending Program. Pursuant to an Exemptive Order issued by the Securities and Exchange Commission (the SEC), the Fund, along with other registered investment companies having management contracts with Fidelity Management & Research Company LLC (FMR), or other affiliated entities of FMR, may participate in an interfund lending program. This program provides an alternative credit facility allowing the Fund to borrow from, or lend money to, other participating affiliated funds. At period end, there were no interfund loans outstanding. Activity in this program during the period for which loans were outstanding was as follows:
| | Borrower or Lender | Average Loan Balance | Weighted Average Interest Rate | Interest Expense |
| Fidelity Balanced Fund | Borrower | $92,240 | 4.43% | $80 |
Interfund Trades. Funds may purchase from or sell securities to other Fidelity Funds under procedures adopted by the Board. The procedures have been designed to ensure these interfund trades are executed in accordance with Rule 17a-7 of the 1940 Act. Any interfund trades are included within the respective purchases and sales amounts shown in the Purchases and Sales of Investments note. Interfund trades during the period are noted in the table below.
| | Purchases ($) | Sales ($) | Realized Gain (Loss) ($) |
| Fidelity Balanced Fund | 339,731 | 683,623 | 33,608 |
Other. During the period, the investment adviser reimbursed the Fund for certain losses as follows:
| | Amount ($) |
| Fidelity Balanced Fund | 105 |
7. Committed Line of Credit.
Certain Funds participate with other funds managed by the investment adviser or an affiliate in a $4.25 billion credit facility (the "line of credit") to be utilized for temporary or emergency purposes to fund shareholder redemptions or for other short-term liquidity purposes. The participating funds have agreed to pay commitment fees on their pro-rata portion of the line of credit, which are reflected in Miscellaneous expenses on the Statement of Operations, and are listed below. During the period, there were no borrowings on this line of credit.
| | Amount |
| Fidelity Balanced Fund | $71 |
8. Security Lending.
Funds lend portfolio securities from time to time in order to earn additional income. Lending agents are used, including National Financial Services (NFS), an affiliate of the investment adviser. Pursuant to a securities lending agreement, NFS will receive a fee, which is capped at 9.9% of a fund's daily lending revenue, for its services as lending agent. A fund may lend securities to certain qualified borrowers, including NFS. On the settlement date of the loan, a fund receives collateral (in the form of U.S. Treasury obligations, letters of credit and/or cash) against the loaned securities and maintains collateral in an amount not less than 100% of the market value of the loaned securities during the period of the loan. The market value of the loaned securities is determined at the close of business of a fund and any additional required collateral is delivered to a fund on the next business day. A fund or borrower may terminate the loan at any time, and if the borrower defaults on its obligation to return the securities loaned because of insolvency or other reasons, a fund may apply collateral received from the borrower against the obligation. A fund may experience delays and costs in recovering the securities loaned. Any cash collateral received is invested in the Fidelity Securities Lending Cash Central Fund. Any loaned securities are identified as such in the Schedule of Investments, and the value of loaned securities and cash collateral at period end, as applicable, are presented in the Statement of Assets and Liabilities. Security lending income represents the income earned on investing cash collateral, less rebates paid to borrowers and any lending agent fees associated with the loan, plus any premium payments received for lending certain types of securities. Security lending income is presented in the Statement of Operations as a component of income from Fidelity Central Funds. Affiliated security lending activity, if any, was as follows:
| | Total Security Lending Fees Paid to NFS | Security Lending Income From Securities Loaned to NFS | Value of Securities Loaned to NFS at Period End |
| Fidelity Balanced Fund | $58 | $33 | $- |
9. Expense Reductions.
During the period the investment adviser or an affiliate reimbursed and/or waived a portion of fund-level operating expenses in the amount of $1,934.
10. Distributions to Shareholders.
Distributions to shareholders of each class were as follows:
| | Year ended August 31, 2023 | Year ended August 31, 2022 |
| Fidelity Balanced Fund | | |
| Distributions to shareholders | | |
| Balanced | $ 2,360,180 | $3,513,610 |
| Class K | 581,936 | 930,743 |
Total | $2,942,116 | $4,444,353 |
11. Share Transactions.
Share transactions for each class were as follows and may contain in-kind transactions, automatic conversions between classes or exchanges between affiliated funds:
| | Shares | Shares | Dollars | Dollars |
| | Year ended August 31, 2023 | Year ended August 31, 2022 | Year ended August 31, 2023 | Year ended August 31, 2022 |
| Fidelity Balanced Fund | | | | |
| Balanced | | | | |
| Shares sold | 128,865 | 153,031 | $3,183,932 | $4,421,713 |
| Reinvestment of distributions | 98,805 | 113,479 | 2,193,993 | 3,307,115 |
| Shares redeemed | (203,664) | (197,918) | (4,945,165) | (5,573,068) |
| Net increase (decrease) | 24,006 | 68,592 | $432,760 | $2,155,760 |
| Class K | | | | |
| Shares sold | 33,384 | 31,940 | $818,833 | $913,583 |
| Reinvestment of distributions | 26,192 | 31,940 | 581,936 | 930,743 |
| Shares redeemed | (57,853) | (75,095) | (1,409,914) | (2,140,732) |
| Net increase (decrease) | 1,723 | (11,215) | $(9,145) | $(296,406) |
12. Other.
A fund's organizational documents provide former and current trustees and officers with a limited indemnification against liabilities arising in connection with the performance of their duties to the fund. In the normal course of business, a fund may also enter into contracts that provide general indemnifications. A fund's maximum exposure under these arrangements is unknown as this would be dependent on future claims that may be made against a fund. The risk of material loss from such claims is considered remote.
13. Risk and Uncertainties.
Many factors affect a fund's performance. Developments that disrupt global economies and financial markets, such as pandemics, epidemics, outbreaks of infectious diseases, war, terrorism, and environmental disasters, may significantly affect a fund's investment performance. The effects of these developments to a fund will be impacted by the types of securities in which a fund invests, the financial condition, industry, economic sector, and geographic location of an issuer, and a fund's level of investment in the securities of that issuer. Significant concentrations in security types, issuers, industries, sectors, and geographic locations may magnify the factors that affect a fund's performance.
To the Board of Trustees of Fidelity Puritan Trust and Shareholders of Fidelity Balanced Fund
Opinion on the Financial Statements
We have audited the accompanying statement of assets and liabilities, including the schedule of investments, of Fidelity Balanced Fund (one of the funds constituting Fidelity Puritan Trust, referred to hereafter as the "Fund") as of August 31, 2023, the related statement of operations for the year ended August 31, 2023, the statement of changes in net assets for each of the two years in the period ended August 31, 2023, including the related notes, and the financial highlights for each of the five years in the period ended August 31, 2023 (collectively referred to as the "financial statements"). In our opinion, the financial statements present fairly, in all material respects, the financial position of the Fund as of August 31, 2023, the results of its operations for the year then ended, the changes in its net assets for each of the two years in the period ended August 31, 2023 and the financial highlights for each of the five years in the period ended August 31, 2023 in conformity with accounting principles generally accepted in the United States of America.
Basis for Opinion
These financial statements are the responsibility of the Fund's management. Our responsibility is to express an opinion on the Fund's financial statements based on our audits. We are a public accounting firm registered with the Public Company Accounting Oversight Board (United States) (PCAOB) and are required to be independent with respect to the Fund in accordance with the U.S. federal securities laws and the applicable rules and regulations of the Securities and Exchange Commission and the PCAOB.
We conducted our audits of these financial statements in accordance with the standards of the PCAOB. Those standards require that we plan and perform the audit to obtain reasonable assurance about whether the financial statements are free of material misstatement, whether due to error or fraud.
Our audits included performing procedures to assess the risks of material misstatement of the financial statements, whether due to error or fraud, and performing procedures that respond to those risks. Such procedures included examining, on a test basis, evidence regarding the amounts and disclosures in the financial statements. Our audits also included evaluating the accounting principles used and significant estimates made by management, as well as evaluating the overall presentation of the financial statements. Our procedures included confirmation of securities owned as of August 31, 2023 by correspondence with the custodian, issuers of privately offered securities and brokers; when replies were not received from brokers, we performed other auditing procedures. We believe that our audits provide a reasonable basis for our opinion.
/s/ PricewaterhouseCoopers LLP
Boston, Massachusetts
October 13, 2023
We have served as the auditor of one or more investment companies in the Fidelity group of funds since 1932.
The Trustees, Members of the Advisory Board (if any), and officers of the trust and fund, as applicable, are listed below. The Board of Trustees governs the fund and is responsible for protecting the interests of shareholders. The Trustees are experienced executives who meet periodically throughout the year to oversee the fund's activities, review contractual arrangements with companies that provide services to the fund, oversee management of the risks associated with such activities and contractual arrangements, and review the fund's performance. Except for Jonathan Chiel, each of the Trustees oversees 322 funds. Mr. Chiel oversees 191 funds.
The Trustees hold office without limit in time except that (a) any Trustee may resign; (b) any Trustee may be removed by written instrument, signed by at least two-thirds of the number of Trustees prior to such removal; (c) any Trustee who requests to be retired or who has become incapacitated by illness or injury may be retired by written instrument signed by a majority of the other Trustees; and (d) any Trustee may be removed at any special meeting of shareholders by a two-thirds vote of the outstanding voting securities of the trust. Each Trustee who is not an interested person (as defined in the 1940 Act) of the trust and the fund is referred to herein as an Independent Trustee. Each Independent Trustee shall retire not later than the last day of the calendar year in which his or her 75th birthday occurs. The Independent Trustees may waive this mandatory retirement age policy with respect to individual Trustees. Officers and Advisory Board Members hold office without limit in time, except that any officer or Advisory Board Member may resign or may be removed by a vote of a majority of the Trustees at any regular meeting or any special meeting of the Trustees. Except as indicated, each individual has held the office shown or other offices in the same company for the past five years.
The fund's Statement of Additional Information (SAI) includes more information about the Trustees. To request a free copy, call Fidelity at 1-800-544-8544 if you're an individual investing directly with Fidelity, call 1-800-835-5092 if you're a plan sponsor or participant with Fidelity as your recordkeeper or call 1-877-208-0098 on institutional accounts or if you're an advisor or invest through one.
Experience, Skills, Attributes, and Qualifications of the Trustees. The Governance and Nominating Committee has adopted a statement of policy that describes the experience, qualifications, attributes, and skills that are necessary and desirable for potential Independent Trustee candidates (Statement of Policy). The Board believes that each Trustee satisfied at the time he or she was initially elected or appointed a Trustee, and continues to satisfy, the standards contemplated by the Statement of Policy. The Governance and Nominating Committee also engages professional search firms to help identify potential Independent Trustee candidates who have the experience, qualifications, attributes, and skills consistent with the Statement of Policy. From time to time, additional criteria based on the composition and skills of the current Independent Trustees, as well as experience or skills that may be appropriate in light of future changes to board composition, business conditions, and regulatory or other developments, have also been considered by the professional search firms and the Governance and Nominating Committee. In addition, the Board takes into account the Trustees' commitment and participation in Board and committee meetings, as well as their leadership of standing and ad hoc committees throughout their tenure.
In determining that a particular Trustee was and continues to be qualified to serve as a Trustee, the Board has considered a variety of criteria, none of which, in isolation, was controlling. The Board believes that, collectively, the Trustees have balanced and diverse experience, qualifications, attributes, and skills, which allow the Board to operate effectively in governing the fund and protecting the interests of shareholders. Information about the specific experience, skills, attributes, and qualifications of each Trustee, which in each case led to the Board's conclusion that the Trustee should serve (or continue to serve) as a trustee of the fund, is provided below.
Board Structure and Oversight Function. Robert A. Lawrence is an interested person and currently serves as Chair. The Trustees have determined that an interested Chair is appropriate and benefits shareholders because an interested Chair has a personal and professional stake in the quality and continuity of services provided to the fund. Independent Trustees exercise their informed business judgment to appoint an individual of their choosing to serve as Chair, regardless of whether the Trustee happens to be independent or a member of management. The Independent Trustees have determined that they can act independently and effectively without having an Independent Trustee serve as Chair and that a key structural component for assuring that they are in a position to do so is for the Independent Trustees to constitute a substantial majority for the Board. The Independent Trustees also regularly meet in executive session. David M. Thomas serves as Lead Independent Trustee and as such (i) acts as a liaison between the Independent Trustees and management with respect to matters important to the Independent Trustees and (ii) with management prepares agendas for Board meetings.
Fidelity® funds are overseen by different Boards of Trustees. The fund's Board oversees Fidelity's high income and certain equity funds, and other Boards oversee Fidelity's alternative investment, investment-grade bond, money market, asset allocation, and other equity funds. The asset allocation funds may invest in Fidelity® funds overseen by the fund's Board. The use of separate Boards, each with its own committee structure, allows the Trustees of each group of Fidelity® funds to focus on the unique issues of the funds they oversee, including common research, investment, and operational issues. On occasion, the separate Boards establish joint committees to address issues of overlapping consequences for the Fidelity® funds overseen by each Board.
The Trustees operate using a system of committees to facilitate the timely and efficient consideration of all matters of importance to the Trustees, the fund, and fund shareholders and to facilitate compliance with legal and regulatory requirements and oversight of the fund's activities and associated risks. The Board, acting through its committees, has charged FMR and its affiliates with (i) identifying events or circumstances the occurrence of which could have demonstrably adverse effects on the fund's business and/or reputation; (ii) implementing processes and controls to lessen the possibility that such events or circumstances occur or to mitigate the effects of such events or circumstances if they do occur; and (iii) creating and maintaining a system designed to evaluate continuously business and market conditions in order to facilitate the identification and implementation processes described in (i) and (ii) above. Because the day-to-day operations and activities of the fund are carried out by or through FMR, its affiliates, and other service providers, the fund's exposure to risks is mitigated but not eliminated by the processes overseen by the Trustees. While each of the Board's committees has responsibility for overseeing different aspects of the fund's activities, oversight is exercised primarily through the Operations, Audit, and Compliance Committees. Appropriate personnel, including but not limited to the fund's Chief Compliance Officer (CCO), FMR's internal auditor, the independent accountants, the fund's Treasurer and portfolio management personnel, make periodic reports to the Board's committees, as appropriate, including an annual review of Fidelity's risk management program for the Fidelity® funds. The responsibilities of each standing committee, including their oversight responsibilities, are described further under "Standing Committees of the Trustees."
Interested Trustees*:
Correspondence intended for a Trustee who is an interested person may be sent to Fidelity Investments, 245 Summer Street, Boston, Massachusetts 02210.
Name, Year of Birth; Principal Occupations and Other Relevant Experience+
Jonathan Chiel (1957)
Year of Election or Appointment: 2016
Trustee
Mr. Chiel also serves as Trustee of other Fidelity® funds. Mr. Chiel is Executive Vice President and General Counsel for FMR LLC (diversified financial services company, 2012-present). Previously, Mr. Chiel served as general counsel (2004-2012) and senior vice president and deputy general counsel (2000-2004) for John Hancock Financial Services; a partner with Choate, Hall & Stewart (1996-2000) (law firm); and an Assistant United States Attorney for the United States Attorney's Office of the District of Massachusetts (1986-95), including Chief of the Criminal Division (1993-1995). Mr. Chiel is a director on the boards of the Boston Bar Foundation and the Maimonides School.
Bettina Doulton (1964)
Year of Election or Appointment: 2021
Trustee
Ms. Doulton also serves as Trustee of other Fidelity® funds. Prior to her retirement, Ms. Doulton served in a variety of positions at Fidelity Investments, including as a managing director of research (2006-2007), portfolio manager to certain Fidelity® funds (1993-2005), equity analyst and portfolio assistant (1990-1993), and research assistant (1987-1990). Ms. Doulton currently owns and operates Phi Builders + Architects and Cellardoor Winery. Previously, Ms. Doulton served as a member of the Board of Brown Capital Management, LLC (2014-2018).
Robert A. Lawrence (1952)
Year of Election or Appointment: 2020
Trustee
Chair of the Board of Trustees
Mr. Lawrence also serves as Trustee of other funds. Previously, Mr. Lawrence served as a Trustee and Member of the Advisory Board of certain funds. Prior to his retirement in 2008, Mr. Lawrence served as Vice President of certain Fidelity® funds (2006-2008), Senior Vice President, Head of High Income Division of Fidelity Management & Research Company (investment adviser firm, 2006-2008), and President of Fidelity Strategic Investments (investment adviser firm, 2002-2005).
* Determined to be an "Interested Trustee" by virtue of, among other things, his or her affiliation with the trust or various entities under common control with FMR.
+ The information includes the Trustee's principal occupation during the last five years and other information relating to the experience, attributes, and skills relevant to the Trustee's qualifications to serve as a Trustee, which led to the conclusion that the Trustee should serve as a Trustee for the fund.
Independent Trustees:
Correspondence intended for an Independent Trustee may be sent to Fidelity Investments, P.O. Box 55235, Boston, Massachusetts 02205-5235.
Name, Year of Birth; Principal Occupations and Other Relevant Experience+
Thomas P. Bostick (1956)
Year of Election or Appointment: 2021
Trustee
Lieutenant General Bostick also serves as Trustee of other Fidelity® funds. Prior to his retirement, General Bostick (United States Army, Retired) held a variety of positions within the U.S. Army, including Commanding General and Chief of Engineers, U.S. Army Corps of Engineers (2012-2016) and Deputy Chief of Staff and Director of Human Resources, U.S. Army (2009-2012). General Bostick currently serves as a member of the Board and Finance and Governance & Sustainability Committees of CSX Corporation (transportation, 2020-present) and a member of the Board and Corporate Governance and Nominating Committee of Perma-Fix Environmental Services, Inc. (nuclear waste management, 2020-present). General Bostick serves as Chief Executive Officer of Bostick Global Strategies, LLC (consulting, 2016-present), as a member of the Board of HireVue, Inc. (video interview and assessment, 2020-present), as a member of the Board of Allonnia (biotechnology and engineering solutions, 2022-present) and on the Advisory Board of Solugen, Inc. (specialty bio-based chemicals manufacturer, 2022-present). Previously, General Bostick served as a Member of the Advisory Board of certain Fidelity® funds (2021), President, Intrexon Bioengineering (2018-2020) and Chief Operating Officer (2017-2020) and Senior Vice President of the Environment Sector (2016-2017) of Intrexon Corporation (biopharmaceutical company).
Dennis J. Dirks (1948)
Year of Election or Appointment: 2005
Trustee
Mr. Dirks also serves as Trustee of other Fidelity® funds. Prior to his retirement in May 2003, Mr. Dirks served as Chief Operating Officer and as a member of the Board of The Depository Trust & Clearing Corporation (financial markets infrastructure), President, Chief Operating Officer and a member of the Board of The Depository Trust Company (DTC), President and a member of the Board of the National Securities Clearing Corporation (NSCC), Chief Executive Officer and a member of the Board of the Government Securities Clearing Corporation and Chief Executive Officer and a member of the Board of the Mortgage-Backed Securities Clearing Corporation. Mr. Dirks currently serves as a member of the Finance Committee (2016-present) and Board (2017-present) and is Treasurer (2018-present) of the Asolo Repertory Theatre.
Donald F. Donahue (1950)
Year of Election or Appointment: 2018
Trustee
Mr. Donahue also serves as Trustee of other Fidelity® funds. Mr. Donahue serves as President and Chief Executive Officer of Miranda Partners, LLC (risk consulting for the financial services industry, 2012-present). Previously, Mr. Donahue served as Chief Executive Officer (2006-2012), Chief Operating Officer (2003-2006) and Managing Director, Customer Marketing and Development (1999-2003) of The Depository Trust & Clearing Corporation (financial markets infrastructure). Mr. Donahue currently serves as a member (2007-present) and Co-Chairman (2016-present) of the Board of United Way of New York. Mr. Donahue previously served as a member of the Advisory Board of certain Fidelity® funds (2015-2018) and as a member of the Board of The Leadership Academy (previously NYC Leadership Academy) (2012-2022).
Vicki L. Fuller (1957)
Year of Election or Appointment: 2020
Trustee
Ms. Fuller also serves as Trustee of other Fidelity® funds. Previously, Ms. Fuller served as a member of the Advisory Board of certain Fidelity® funds (2018-2020), Chief Investment Officer of the New York State Common Retirement Fund (2012-2018) and held a variety of positions at AllianceBernstein L.P. (global asset management, 1985-2012), including Managing Director (2006-2012) and Senior Vice President and Senior Portfolio Manager (2001-2006). Ms. Fuller currently serves as a member of the Board, Audit Committee and Nominating and Governance Committee of two Blackstone business development companies (2020-present), as a member of the Board of Treliant, LLC (consulting, 2019-present), as a member of the Board of Ariel Alternatives, LLC (private equity, 2022-present) and as a member of the Board and Chair of the Audit Committee of Gusto, Inc. (software, 2021-present). In addition, Ms. Fuller currently serves as a member of the Board of Roosevelt University (2019-present) and as a member of the Executive Board of New York University's Stern School of Business. Ms. Fuller previously served as a member of the Board, Audit Committee and Nominating and Governance Committee of The Williams Companies, Inc. (natural gas infrastructure, 2018-2021).
Patricia L. Kampling (1959)
Year of Election or Appointment: 2020
Trustee
Ms. Kampling also serves as Trustee of other Fidelity® funds. Prior to her retirement, Ms. Kampling served as Chairman of the Board and Chief Executive Officer (2012-2019), President and Chief Operating Officer (2011-2012) and Executive Vice President and Chief Financial Officer (2010-2011) of Alliant Energy Corporation. Ms. Kampling currently serves as a member of the Board, Finance Committee and Governance, Compensation and Nominating Committee of Xcel Energy Inc. (utilities company, 2020-present) and as a member of the Board, Audit, Finance and Risk Committee and Safety, Environmental, Technology and Operations Committee and Chair of the Executive Development and Compensation Committee of American Water Works Company, Inc. (utilities company, 2019-present). In addition, Ms. Kampling currently serves as a member of the Board of the Nature Conservancy, Wisconsin Chapter (2019-present). Previously, Ms. Kampling served as a Member of the Advisory Board of certain Fidelity® funds (2020), a member of the Board, Compensation Committee and Executive Committee and Chair of the Audit Committee of Briggs & Stratton Corporation (manufacturing, 2011-2021), a member of the Board of Interstate Power and Light Company (2012-2019) and Wisconsin Power and Light Company (2012-2019) (each a subsidiary of Alliant Energy Corporation) and as a member of the Board and Workforce Development Committee of the Business Roundtable (2018-2019).
Thomas A. Kennedy (1955)
Year of Election or Appointment: 2021
Trustee
Mr. Kennedy also serves as Trustee of other Fidelity® funds. Previously, Mr. Kennedy served as a Member of the Advisory Board of certain Fidelity® funds (2020) and held a variety of positions at Raytheon Company (aerospace and defense, 1983-2020), including Chairman and Chief Executive Officer (2014-2020) and Executive Vice President and Chief Operating Officer (2013-2014). Mr. Kennedy served as Executive Chairman of the Board of Directors of Raytheon Technologies Corporation (aerospace and defense, 2020-2021). Mr. Kennedy serves as a Director of the Board of Directors of Textron Inc. (aerospace and defense, 2023-present).
Oscar Munoz (1959)
Year of Election or Appointment: 2021
Trustee
Mr. Munoz also serves as Trustee of other Fidelity® funds. Prior to his retirement, Mr. Munoz served as Executive Chairman (2020-2021), Chief Executive Officer (2015-2020), President (2015-2016) and a member of the Board (2010-2021) of United Airlines Holdings, Inc. Mr. Munoz currently serves as a member of the Board of CBRE Group, Inc. (commercial real estate, 2020-present), a member of the Board of Univision Communications, Inc. (Hispanic media, 2020-present), a member of the Board of Archer Aviation Inc. (2021-present), a member of the Defense Business Board of the United States Department of Defense (2021-present) and a member of the Board of Salesforce.com, Inc. (cloud-based software, 2022-present). Previously, Mr. Munoz served as a Member of the Advisory Board of certain Fidelity® funds (2021).
David M. Thomas (1949)
Year of Election or Appointment: 2008
Trustee
Lead Independent Trustee
Mr. Thomas also serves as Trustee of other Fidelity® funds. Previously, Mr. Thomas served as Executive Chairman (2005-2006) and Chairman and Chief Executive Officer (2000-2005) of IMS Health, Inc. (pharmaceutical and healthcare information solutions). Mr. Thomas currently serves as a member of the Board of Fortune Brands Home and Security (home and security products, 2004-present) and as Director (2013-present) and Non-Executive Chairman of the Board (2022-present) of Interpublic Group of Companies, Inc. (marketing communication).
Susan Tomasky (1953)
Year of Election or Appointment: 2020
Trustee
Ms. Tomasky also serves as Trustee of other Fidelity® funds. Prior to her retirement, Ms. Tomasky served in various executive officer positions at American Electric Power Company, Inc. (1998-2011), including most recently as President of AEP Transmission (2007-2011). Ms. Tomasky currently serves as a member of the Board and Sustainability Committee and as Chair of the Audit Committee of Marathon Petroleum Corporation (2018-present) and as a member of the Board, Executive Committee, Corporate Governance Committee and Organization and Compensation Committee and as Lead Director of the Board of Public Service Enterprise Group, Inc. (utilities company, 2012-present) and as a member of the Board of its subsidiary company, Public Service Electric and Gas Co. (2021-present). In addition, Ms. Tomasky currently serves as a member (2009-present) and President (2020-present) of the Board of the Royal Shakespeare Company - America (2009-present), as a member of the Board of the Columbus Association for the Performing Arts (2011-present) and as a member of the Board and Kenyon in the World Committee of Kenyon College (2016-present). Previously, Ms. Tomasky served as a Member of the Advisory Board of certain Fidelity® funds (2020), as a member of the Board of the Columbus Regional Airport Authority (2007-2020), as a member of the Board (2011-2018) and Lead Independent Director (2015-2018) of Andeavor Corporation (previously Tesoro Corporation) (independent oil refiner and marketer) and as a member of the Board of Summit Midstream Partners LP (energy, 2012-2018).
Michael E. Wiley (1950)
Year of Election or Appointment: 2020
Trustee
Mr. Wiley also serves as Trustee of other Fidelity® funds. Previously, Mr. Wiley served as a member of the Advisory Board of certain Fidelity® funds (2018-2020), Chairman, President and CEO of Baker Hughes, Inc. (oilfield services, 2000-2004). Mr. Wiley also previously served as a member of the Board of Andeavor Corporation (independent oil refiner and marketer, 2005-2018), a member of the Board of Andeavor Logistics LP (natural resources logistics, 2015-2018) and a member of the Board of High Point Resources (exploration and production, 2005-2020).
+ The information includes the Trustee's principal occupation during the last five years and other information relating to the experience, attributes, and skills relevant to the Trustee's qualifications to serve as a Trustee, which led to the conclusion that the Trustee should serve as a Trustee for the fund.
Advisory Board Members and Officers:
Correspondence intended for a Member of the Advisory Board (if any) may be sent to Fidelity Investments, P.O. Box 55235, Boston, Massachusetts 02205-5235. Correspondence intended for an officer or Peter S. Lynch may be sent to Fidelity Investments, 245 Summer Street, Boston, Massachusetts 02210. Officers appear below in alphabetical order.
Name, Year of Birth; Principal Occupation
Vijay C. Advani (1960)
Year of Election or Appointment: 2023
Member of the Advisory Board
Mr. Advani also serves as Trustee or Member of the Advisory Board of other funds. Previously, Mr. Advani served as Executive Chairman (2020-2022), Chief Executive Officer (2017-2020) and Chief Operating Officer (2016-2017) of Nuveen (global investment manager). He also served in various capacities at Franklin Resources (global investment manager), including Co-President (2015-2016), Executive Vice President, Global Advisory Services (2008-2015), Head of Global Retail Distribution (2005-2008), Executive Managing Director, International Retail Development (2002-2005), Managing Director, Product Developments, Sales & Marketing, Asia, Eastern Europe and Africa (2000-2002) and President, Templeton Asset Management India (1995-2000). Mr. Advani also served as Senior Investment Officer of International Finance Corporation (private equity and venture capital arm of The World Bank, 1984-1995). Mr. Advani is Chairman Emeritus of the U.S. India Business Council (2018-present), a Director of The Global Impact Investing Network (2019-present), a Director of LOK Capital (Mauritius) (2022-present), a member of the Advisory Council of LOK Capital (2022-present), a Senior Advisor of Neuberger Berman (2021-present), a Senior Advisor of Seviora Holdings Pte. Ltd (Temasek-Singapore) (2021-present), a Director of Seviora Capital (Singapore) (2021-present) and an Advisor of EQUIAM (2021-present). Mr. Advani formerly served as a member of the Board of BowX Acquisition Corp. (special purpose acquisition company, 2020-2021), a member of the Board of Intellecap (advisory arm of The Aavishkaar Group, 2018-2020), a member of the Board of Nuveen Investments, Inc. (2017-2020) and a member of the Board of Docusign (software, 2016-2019).
Peter S. Lynch (1944)
Year of Election or Appointment: 2003
Member of the Advisory Board
Mr. Lynch also serves as a Member of the Advisory Board of other Fidelity® funds. Mr. Lynch is Vice Chairman and a Director of Fidelity Management & Research Company LLC (investment adviser firm). In addition, Mr. Lynch serves as a Trustee of Boston College and as the Chairman of the Inner-City Scholarship Fund. Previously, Mr. Lynch served as Vice Chairman and a Director of FMR Co., Inc. (investment adviser firm) and on the Special Olympics International Board of Directors (1997-2006).
Karen B. Peetz (1955)
Year of Election or Appointment: 2023
Member of the Advisory Board
Ms. Peetz also serves as a Member of the Advisory Board of other funds. Previously, Ms. Peetz served as Chief Administration Officer (2020-2023) of Citigroup Inc. (a diversified financial service company). She also served in various capacities at Bank of New York Mellon Corporation, including President (2013-2016), Vice Chairman, Senior Executive Vice President and Chief Executive Officer of Financial Markets & Treasury Services (2010-2013), Senior Executive Vice President and Chief Executive Officer of Global Corporate Trust (2003-2008), Senior Vice President and Division Manager of Global Payments & Trade Services (2002-2003) and Senior Vice President and Division Manager of Domestic Corporate Trust (1998-2002). Ms. Peetz also served in various capacities at Chase Manhattan Corporation (1982-1998), including Senior Vice President and Manager of Corporate Trust International Business (1996-1998), Managing Director and Manager of Corporate Trust Services (1994-1996) and Managing Director and Group Manager of Financial Institution Sales (1990-1993). Ms. Peetz currently serves as Chair of Amherst Holdings Advisory Council (2018-present), Trustee of Johns Hopkins University (2016-present), Chair of the Carey Business School Advisory Council, Member of the Johns Hopkins Medicine Board and Finance Committee and Chair of the Lyme and Tick Related Disease Institute Advisory Council. Ms. Peetz previously served as a member of the Board of Guardian Life Insurance Company of America (2019-2023), a member of the Board of Trane Technologies (2018-2022), a member of the Board of Wells Fargo Corp. (2017-2019), a member of the Board of SunCoke Energy Inc. (2012-2016), a member of the Board of Private Export Funding Corporation (2010-2016) and as a Trustee of Penn State University (2010-2014) and the United Way of New York City (2008-2010).
Heather Bonner (1977)
Year of Election or Appointment: 2023
Assistant Treasurer
Ms. Bonner also serves as an officer of other funds. Ms. Bonner serves as Senior Vice President (2022-present), and is an employee of Fidelity Investments. Ms. Bonner serves as Assistant Treasurer of Fidelity CRET Trustee LLC (2022-present). Prior to joining Fidelity, Ms. Bonner served as Managing Director at AQR Capital Management (2013-2022) and was the Treasurer and Principal Financial Officer of the AQR Funds (2013-2022).
Craig S. Brown (1977)
Year of Election or Appointment: 2022
Deputy Treasurer
Mr. Brown also serves as an officer of other funds. Mr. Brown serves as Assistant Treasurer of FIMM, LLC (2021-present) and is an employee of Fidelity Investments (2013-present). Previously, Mr. Brown served as Assistant Treasurer of certain Fidelity® funds (2019-2022).
John J. Burke III (1964)
Year of Election or Appointment: 2018
Chief Financial Officer
Mr. Burke also serves as Chief Financial Officer of other funds. Mr. Burke serves as Head of Investment Operations for Fidelity Fund and Investment Operations (2018-present) and is an employee of Fidelity Investments (1998-present). Previously Mr. Burke served as head of Asset Management Investment Operations (2012-2018).
Margaret Carey (1973)
Year of Election or Appointment: 2023
Secretary and Chief Legal Officer (CLO)
Ms. Carey also serves as an officer of other funds and as CLO of certain other Fidelity entities. She is a Senior Vice President and Deputy General Counsel of FMR LLC (diversified financial services company, 2019-present), and is an employee of Fidelity Investments.
William C. Coffey (1969)
Year of Election or Appointment: 2019
Assistant Secretary
Mr. Coffey also serves as Assistant Secretary of other funds. He is Senior Vice President and Deputy General Counsel of FMR LLC (diversified financial services company, 2010-present), and is an employee of Fidelity Investments. Previously, Mr. Coffey served as Secretary and CLO of certain funds (2018-2019); CLO, Secretary, and Senior Vice President of Fidelity Management & Research Company and FMR Co., Inc. (investment adviser firms, 2018-2019); Secretary of Fidelity SelectCo, LLC and Fidelity Investments Money Management, Inc. (investment adviser firms, 2018-2019); CLO of Fidelity Management & Research (Hong Kong) Limited, FMR Investment Management (UK) Limited, and Fidelity Management & Research (Japan) Limited (investment adviser firms, 2018-2019); and Assistant Secretary of certain funds (2009-2018).
Timothy M. Cohen (1969)
Year of Election or Appointment: 2018
Vice President
Mr. Cohen also serves as Vice President of other funds. Mr. Cohen serves as Co-Head of Equity (2018-present), a Director of Fidelity Management & Research (Japan) Limited (investment adviser firm, 2016-present), and is an employee of Fidelity Investments. Previously, Mr. Cohen served as Executive Vice President of Fidelity SelectCo, LLC (2019), Head of Global Equity Research (2016-2018), Chief Investment Officer - Equity and a Director of Fidelity Management & Research (U.K.) Inc. (investment adviser firm, 2013-2015) and as a Director of Fidelity Management & Research (Hong Kong) Limited (investment adviser firm, 2017).
Jonathan Davis (1968)
Year of Election or Appointment: 2010
Assistant Treasurer
Mr. Davis also serves as an officer of other funds. Mr. Davis serves as Vice President Assistant Treasurer and is an employee of Fidelity Investments. Mr. Davis serves as Assistant Treasurer of certain Fidelity entities.
Laura M. Del Prato (1964)
Year of Election or Appointment: 2018
Assistant Treasurer
Ms. Del Prato also serves as an officer of other funds. Ms. Del Prato serves as Assistant Treasurer of FIMM, LLC (2021-present) and is an employee of Fidelity Investments (2017-present). Previously, Ms. Del Prato served as President and Treasurer of The North Carolina Capital Management Trust: Cash Portfolio and Term Portfolio (2018-2020). Prior to joining Fidelity Investments, Ms. Del Prato served as a Managing Director and Treasurer of the JPMorgan Mutual Funds (2014-2017). Prior to JPMorgan, Ms. Del Prato served as a partner at Cohen Fund Audit Services (accounting firm, 2012-2013) and KPMG LLP (accounting firm, 2004-2012).
Colm A. Hogan (1973)
Year of Election or Appointment: 2020
Assistant Treasurer
Mr. Hogan also serves as an officer of other funds. Mr. Hogan serves as Assistant Treasurer of FIMM, LLC (2021-present) and FMR Capital, Inc. (2017-present) and is an employee of Fidelity Investments (2005-present). Previously, Mr. Hogan served as Deputy Treasurer of certain Fidelity® funds (2016-2020) and Assistant Treasurer of certain Fidelity® funds (2016-2018).
Pamela R. Holding (1964)
Year of Election or Appointment: 2018
Vice President
Ms. Holding also serves as Vice President of other funds. Ms. Holding serves as Co-Head of Equity (2018-present) and is an employee of Fidelity Investments (2013-present). Previously, Ms. Holding served as Executive Vice President of Fidelity SelectCo, LLC (2019) and as Chief Investment Officer of Fidelity Institutional Asset Management (2013-2018).
Chris Maher (1972)
Year of Election or Appointment: 2020
Deputy Treasurer
Mr. Maher also serves as an officer of other funds. Mr. Maher serves as Assistant Treasurer of FIMM, LLC (2021-present) and FMR Capital, Inc. (2017-present), and is an employee of Fidelity Investments (2008-present). Previously, Mr. Maher served as Assistant Treasurer of certain funds (2013-2020); Vice President of Asset Management Compliance (2013), Vice President of the Program Management Group of FMR (investment adviser firm, 2010-2013), and Vice President of Valuation Oversight (2008-2010).
Jason P. Pogorelec (1975)
Year of Election or Appointment: 2020
Chief Compliance Officer
Mr. Pogorelec also serves as Chief Compliance Officer of other funds. Mr. Pogorelec is a Senior Vice President of Asset Management Compliance for Fidelity Investments and is an employee of Fidelity Investments. Mr. Pogorelec serves as Compliance Officer of Fidelity Management & Research Company LLC (investment adviser firm, 2023-present). Previously, Mr. Pogorelec served as Vice President, Associate General Counsel for Fidelity Investments (2010-2020) and Assistant Secretary of certain Fidelity® funds (2015-2020).
Brett Segaloff (1972)
Year of Election or Appointment: 2021
Anti-Money Laundering (AML) Officer
Mr. Segaloff also serves as an AML Officer of other funds and other related entities. He is Director, Anti-Money Laundering (2007-present) of FMR LLC (diversified financial services company) and is an employee of Fidelity Investments (1996-present).
Stacie M. Smith (1974)
Year of Election or Appointment: 2016
President and Treasurer
Ms. Smith also serves as an officer of other funds. Ms. Smith serves as Assistant Treasurer of certain Fidelity entities, is an employee of Fidelity Investments, and has served in other fund officer roles.
Jim Wegmann (1979)
Year of Election or Appointment: 2019
Assistant Treasurer
Mr. Wegmann also serves as an officer of other funds. Mr. Wegmann serves as Assistant Treasurer of FIMM, LLC (2021-present) and is an employee of Fidelity Investments (2011-present). Previously, Mr. Wegmann served as Assistant Treasurer of certain Fidelity® funds (2019-2021).
As a shareholder, you incur two types of costs: (1) transaction costs, which may include sales charges (loads) on purchase payments or redemption proceeds, as applicable and (2) ongoing costs, which generally include management fees, distribution and/or service (12b-1) fees and other Fund expenses. This Example is intended to help you understand your ongoing costs (in dollars) of investing in a fund and to compare these costs with the ongoing costs of investing in other mutual funds.
| The Example is based on an investment of $1,000 invested at the beginning of the period and held for the entire period (March 1, 2023 to August 31, 2023). |
Actual Expenses
The first line of the accompanying table provides information about actual account values and actual expenses. You may use the information in this line, together with the amount you invested, to estimate the expenses that you paid over the period. Simply divide your account value by $1,000.00 (for example, an $8,600 account value divided by $1,000.00 = 8.6), then multiply the result by the number in the first line for a class/Fund under the heading entitled "Expenses Paid During Period" to estimate the expenses you paid on your account during this period. If any fund is a shareholder of any underlying mutual funds or exchange-traded funds (ETFs) (the Underlying Funds), such fund indirectly bears its proportional share of the expenses of the Underlying Funds in addition to the direct expenses incurred presented in the table. These fees and expenses are not included in the annualized expense ratio used to calculate the expense estimate in the table below.
Hypothetical Example for Comparison Purposes
The second line of the accompanying table provides information about hypothetical account values and hypothetical expenses based on the actual expense ratio and an assumed rate of return of 5% per year before expenses, which is not the actual return. The hypothetical account values and expenses may not be used to estimate the actual ending account balance or expenses you paid for the period. You may use this information to compare the ongoing costs of investing in the Fund and other funds. To do so, compare this 5% hypothetical example with the 5% hypothetical examples that appear in the shareholder reports of the other funds. If any fund is a shareholder of any Underlying Funds, such fund indirectly bears its proportional share of the expenses of the Underlying Funds in addition to the direct expenses as presented in the table. These fees and expenses are not included in the annualized expense ratio used to calculate the expense estimate in the table below.
Please note that the expenses shown in the table are meant to highlight your ongoing costs only and do not reflect any transaction costs. Therefore, the second line of the table is useful in comparing ongoing costs only, and will not help you determine the relative total costs of owning different funds. In addition, if these transactional costs were included, your costs would have been higher.
| | | | | Annualized Expense Ratio- A | | Beginning Account Value March 1, 2023 | | Ending Account Value August 31, 2023 | | Expenses Paid During Period- C March 1, 2023 to August 31, 2023 |
| Fidelity® Balanced Fund | | | | | | | | | | |
| Fidelity® Balanced Fund | | | | .50% | | | | | | |
| Actual | | | | | | $ 1,000 | | $ 1,106.40 | | $ 2.65 |
Hypothetical-B | | | | | | $ 1,000 | | $ 1,022.68 | | $ 2.55 |
| Class K | | | | .42% | | | | | | |
| Actual | | | | | | $ 1,000 | | $ 1,107.10 | | $ 2.23 |
Hypothetical-B | | | | | | $ 1,000 | | $ 1,023.09 | | $ 2.14 |
| |
A Annualized expense ratio reflects expenses net of applicable fee waivers.
B 5% return per year before expenses
C Expenses are equal to the annualized expense ratio, multiplied by the average account value over the period, multiplied by 184/ 365 (to reflect the one-half year period). The fees and expenses of any Underlying Funds are not included in each annualized expense ratio.
The dividend and capital gains distributions for the fund(s) are available on Fidelity.com or Institutional.Fidelity.com.
The fund hereby designates as a capital gain dividend with respect to the taxable year ended August 31, 2023, $425,851,250, or, if subsequently determined to be different, the net capital gain of such year.
A total of 16.37% of the dividends distributed during the fiscal year was derived from interest on U.S. Government securities which is generally exempt from state income tax.
The fund designates $228,512,716 of distributions paid in the calendar year 2022 as qualifying to be taxed as interest-related dividends for nonresident alien shareholders.
The fund designates $264,385,465 of distributions paid during the fiscal year ended 2023 as qualifying to be taxed as section 163(j) interest dividends.
Balanced designates 11%, 47%, 50%, and 51%; Class K designates 10%, 45%, 49%, and 49% of the dividends distributed in October, December, April, and July, respectively during the fiscal year as qualifying for the dividends-received deduction for corporate shareholders.
Balanced designates 12.76%, 44.47%, 61.89%, and 62.12%; Class K designates 12.12%, 42.45%, 60.53%, and 59.62% of the dividends distributed in October, December, April, and July, respectively during the fiscal year as amounts which may be taken into account as a dividend for purposes of the maximum rate under section 1(h)(11) of the Internal Revenue Code.
Balanced designates 3.30%, 3.29%, 1.57%, and 1.57%; and Class K designates 3.13%, 3.14%, 1.53%, and 1.51% of the dividends distributed in October, December, April, and July, respectively during the fiscal year as a section 199A dividend.
The fund will notify shareholders in January 2024 of amounts for use in preparing 2023 income tax returns.
Board Approval of Investment Advisory Contracts and Management Fees
Fidelity Balanced Fund
Each year, the Board of Trustees, including the Independent Trustees (together, the Board), considers the renewal of the fund's management contract with Fidelity Management & Research Company LLC (FMR) and the sub-advisory agreements (together, the Advisory Contracts) for the fund. FMR and the sub-advisers are referred to herein as the Investment Advisers. The Board, assisted by the advice of fund counsel and Independent Trustees' counsel, requests and considers a broad range of information relevant to the renewal of the Advisory Contracts throughout the year.
The Board meets regularly and, at each of its meetings, covers an extensive agenda of topics and materials and considers factors that are relevant to its annual consideration of the renewal of the fund's Advisory Contracts, including the services and support provided to the fund and its shareholders. The Board, acting directly and through its Committees (each of which is composed of and chaired by Independent Trustees), requests and receives information concerning the annual consideration of the renewal of the fund's Advisory Contracts. The Board also meets as needed to review matters specifically related to the Board's annual consideration of the renewal of the Advisory Contracts. Members of the Board may also meet with trustees of other Fidelity funds through joint ad hoc committees to discuss certain matters relevant to all of the Fidelity funds.
Approval of Stub Period Continuation. At its May 2023 meeting, the Board of Trustees voted to continue the fund's management contract with FMR, and the sub-advisory agreements and sub-sub-advisory agreements, in each case, where applicable (together, the Advisory Contracts), without modification, for two months from June 1, 2023 through July 31, 2023. The Board considered that the approval of the fund's Advisory Contracts will not result in any changes in (i) the investment process or strategies employed in the management of the fund's assets; (ii) the fees and expenses paid by shareholders; (iii) the nature, extent or quality of services provided under the fund's Advisory Contracts; or (iv) the day-to-day management of the fund or the persons primarily responsible for such management. The Board also considered that since its last approval of the fund's Advisory Contracts, FMR had provided additional information on the fund in support of the annual contract renewal process, including competitive analyses on total expenses and management fees and in-depth reviews of fund performance and fund profitability information. The Board concluded that the fund's Advisory Contracts are fair and reasonable, and that the fund's Advisory Contracts should be renewed, without modification, through July 31, 2023, with the understanding that the Board would consider the annual renewal for a full one year period in July 2023.
At its July 2023 meeting, the Board unanimously determined to renew the fund's Advisory Contracts. In reaching its determination, the Board considered all factors it believed relevant, including (i) the nature, extent, and quality of the services provided to the fund and its shareholders (including the investment performance of the fund); (ii) the competitiveness relative to peer funds of the fund's management fee and the total expense ratio of a representative class (the retail class, which was selected because it is the largest class); (iii) the total costs of the services provided by and the profits realized by FMR and its affiliates (Fidelity) from its relationships with the fund; and (iv) the extent to which, if any, economies of scale exist and are realized as the fund grows, and whether any economies of scale are appropriately shared with fund shareholders. The Board also considered the broad range of investment choices available to shareholders from FMR's competitors and that the fund's shareholders have chosen to invest in the fund, which is part of the Fidelity family of funds. The Board's decision to renew the Advisory Contracts was not based on any single factor.
The Board reached a determination, with the assistance of fund counsel and Independent Trustees' counsel and through the exercise of its business judgment, that the renewal of the Advisory Contracts was in the best interests of the fund and its shareholders and that the compensation payable under the Advisory Contracts was fair and reasonable in light of all of the surrounding circumstances.
Nature, Extent, and Quality of Services Provided. The Board considered staffing as it relates to the fund, including the backgrounds and experience of investment personnel of the Investment Advisers, and also considered the Investments Advisers' implementation of the fund's investment program. The Independent Trustees also had discussions with senior management of Fidelity's investment operations and investment groups. The Board considered the structure of the investment personnel compensation program and whether this structure provides appropriate incentives to act in the best interests of the fund. Additionally, the Board considered the portfolio managers' investments, if any, in the funds that they manage.
Resources Dedicated to Investment Management and Support Services. The Board and the Fund Oversight and Research Committees reviewed the general qualifications and capabilities of Fidelity's investment staff, including its size, education, experience, and resources, as well as Fidelity's approach to recruiting, training, managing, and compensating investment personnel. The Board noted the resources devoted to expansion of Fidelity's global investment organization, and that Fidelity's analysts have extensive resources, tools and capabilities that allow them to conduct sophisticated quantitative and fundamental analysis, as well as credit analysis of issuers, counterparties and guarantors. Further, the Board considered that Fidelity's investment professionals have sufficient access to global information and data so as to provide competitive investment results over time, and that those professionals also have access to sophisticated tools that permit them to assess portfolio construction and risk and performance attribution characteristics continuously, as well as to transmit new information and research conclusions rapidly around the world. Additionally, in its deliberations, the Board considered Fidelity's trading, risk management, compliance, and technology and operations capabilities and resources, which are integral parts of the investment management process.
Shareholder and Administrative Services. The Board considered (i) the nature, extent, quality, and cost of advisory, administrative, and shareholder services performed by the Investment Advisers and their affiliates under the Advisory Contracts and under separate agreements covering transfer agency, pricing and bookkeeping, and securities lending services for the fund; (ii) the nature and extent of Fidelity's supervision of third party service providers, principally custodians, subcustodians, and pricing vendors; and (iii) the resources devoted by Fidelity to, and the record of compliance with, the fund's compliance policies and procedures. The Board also reviewed the allocation of fund brokerage, including allocations to brokers affiliated with the Investment Advisers, the use of brokerage commissions to pay fund expenses, and the use of "soft" commission dollars to pay for research services. The Board also considered the fund's securities lending activities and any payments made to Fidelity relating to securities lending.
The Board noted that the growth of fund assets over time across the complex allows Fidelity to reinvest in the development of services designed to enhance the value and convenience of the Fidelity funds as investment vehicles. These services include 24-hour access to account information and market information over the Internet and through telephone representatives, investor education materials and asset allocation tools. The Board also considered that it reviews customer service metrics such as telephone response times, continuity of services on the website and metrics addressing services at Fidelity Investor Centers.
Investment in a Large Fund Family. The Board considered the benefits to shareholders of investing in a fund that is part of a large family of funds offering a variety of investment disciplines and providing a large variety of fund investor services. The Board noted that Fidelity had taken, or had made recommendations that resulted in the Fidelity funds taking, a number of actions over the previous year that benefited particular funds and/or the Fidelity funds in general.
Investment Performance. The Board took into account discussions that occur with representatives of the Investment Advisers, and reports that it receives, at Board meetings throughout the year, relating to fund investment performance. In this regard the Board noted that as part of regularly scheduled fund reviews and other reports to the Board on fund performance, the Board considered annualized return information for the fund for different time periods, measured against an appropriate securities market index (benchmark index) and an appropriate peer group of funds with similar objectives (peer group). The Board also considered information about performance attribution. In its ongoing evaluation of fund investment performance, the Board gives particular attention to information indicating changes in performance of the funds over different time periods and discussed with the Investment Advisers the reasons for any overperformance or underperformance.
In addition to reviewing absolute and relative fund performance, the Independent Trustees periodically consider the appropriateness of fund performance metrics in evaluating the results achieved. The Independent Trustees generally give greater weight to fund performance over longer time periods than over shorter time periods. Depending on the circumstances, the Independent Trustees may be satisfied with a fund's performance notwithstanding that it lags its benchmark index or peer group for certain periods.
Based on its review, the Board concluded that the nature, extent, and quality of services provided to the fund under the Advisory Contracts should continue to benefit the shareholders of the fund.
Competitiveness of Management Fee and Total Expense Ratio. The Board was provided with information regarding industry trends in management fees and expenses. In its review of the fund's management fee and the total expense ratio of the retail class, the Board considered the fund's management fee rate as well as other fund or class expenses, as applicable, such as transfer agent fees, pricing and bookkeeping fees, and custodial, legal, and audit fees. The Board noted that Fidelity may agree to waive fees or reimburse expenses from time to time, and the extent to which, if any, it has done so for the fund.
Comparisons of Management Fees and Total Expense Ratios. Among other things, the Board reviewed data for selected groups of competitive funds and classes (referred to as "mapped groups") that were compiled by Fidelity based on combining similar investment objective categories (as classified by Lipper) that have comparable investment mandates. The data reviewed by the Board included (i) gross management fee comparisons (before taking into account expense reimbursements or caps) relative to the total universe of funds within the mapped group; (ii) gross management fee comparisons relative to a subset of non-Fidelity funds in the mapped group that are similar in size and management fee structure to the fund (referred to as the "asset size peer group"); (iii) total expense comparisons of the retail class of the fund relative to funds and classes in the mapped group that have a similar sales load structure to the retail class of the fund (referred to as the "similar sales load structure group"); and (iv) total expense comparisons of the retail class of the fund relative to funds and classes in the similar sales load structure group that are similar in size and management fee structure to the fund (referred to as the "total expense asset size peer group"). The total expense asset size peer group comparison excludes performance adjustments and fund-paid 12b-1 fees to eliminate variability in fee structures.
The information provided to the Board indicated that the fund's management fee rate ranked below the competitive median of the mapped group for the 12-month period ended September 30, 2022 and below the competitive median of the asset size peer group for the 12-month period ended September 30, 2022. Further, the information provided to the Board indicated that the total expense ratio of the retail class of the fund ranked below the competitive median of the similar sales load structure group for the 12-month period ended September 30, 2022 and below the competitive median of the total expense asset size peer group for the 12-month period ended September 30, 2022.
The Board also considered that, for funds subject to the group fee, FMR agreed to voluntarily waive fees over a specified period of time in amounts designed to account for assets converted from certain funds to certain collective investment trusts.
Fees Charged to Other Fidelity Clients. The Board also considered Fidelity fee structures and other information with respect to clients of Fidelity, such as other funds advised or subadvised by Fidelity, pension plan clients, and other institutional clients with similar mandates. The Board noted that a joint ad hoc committee created by it and the boards of other Fidelity funds periodically reviews and compares Fidelity's institutional investment advisory business with its business of providing services to the Fidelity funds and also noted the most recent findings of the committee. The Board noted that the committee's review included a consideration of the differences in services provided, fees charged, and costs incurred, as well as competition in the markets serving the different categories of clients.
Based on its review, the Board concluded that the fund's management fee is fair and reasonable in light of the services that the fund receives and the other factors considered. Further, based on its review of total expense ratios and fees charged to other Fidelity clients, the Board concluded that the total expense ratio of each class of the fund was reasonable in light of the services that the fund and its shareholders receive and the other factors considered.
Costs of the Services and Profitability. The Board considered the revenues earned and the expenses incurred by Fidelity in conducting the business of developing, marketing, distributing, managing, administering and servicing the fund and servicing the fund's shareholders. The Board also considered the level of Fidelity's profits in respect of all the Fidelity funds.
On an annual basis, Fidelity presents to the Board information about the profitability of its relationships with the fund. Fidelity calculates profitability information for each fund, as well as aggregate profitability information for groups of Fidelity funds and all Fidelity funds, using a series of detailed revenue and cost allocation methodologies which originate with the books and records of Fidelity on which Fidelity's audited financial statements are based. The Audit Committee of the Board reviews any significant changes from the prior year's methodologies and the full Board approves such changes.
A public accounting firm has been engaged annually by the Board as part of the Board's assessment of Fidelity's profitability analysis. The engagement includes the review and assessment of the methodologies used by Fidelity in determining the revenues and expenses attributable to Fidelity's fund business, and completion of agreed-upon procedures in respect of the mathematical accuracy of certain fund profitability information and its conformity to established allocation methodologies. After considering the reports issued under the engagement and information provided by Fidelity, the Board concluded that while other allocation methods may also be reasonable, Fidelity's profitability methodologies are reasonable in all material respects.
The Board also reviewed Fidelity's non-fund businesses and potential indirect benefits such businesses may have received as a result of their association with Fidelity's fund business (i.e., fall-out benefits) as well as cases where Fidelity's affiliates may benefit from the funds' business. The Board considered areas where potential indirect benefits to the Fidelity funds from their relationships with Fidelity may exist. The Board's consideration of these matters was informed by the findings of a joint ad hoc committee created by it and the boards of other Fidelity funds to evaluate potential fall-out benefits.
The Board considered the costs of the services provided by and the profits realized by Fidelity in connection with the operation of the fund and was satisfied that the profitability was not excessive.
Economies of Scale. The Board considered whether there have been economies of scale in respect of the management of the Fidelity funds, whether the Fidelity funds (including the fund) have appropriately benefited from any such economies of scale, and whether there is potential for realization of any further economies of scale. The Board considered the extent to which the fund will benefit from economies of scale as assets grow through increased services to the fund, through waivers or reimbursements, or through fee or expense ratio reductions. The Board also noted that a committee (the Economies of Scale Committee) created by it and the boards of other Fidelity funds periodically analyzes whether Fidelity attains economies of scale in respect of the management and servicing of the Fidelity funds, whether the Fidelity funds have appropriately benefited from such economies of scale, and whether there is potential for realization of any further economies of scale.
The Board recognized that the fund's management contract incorporates a "group fee" structure, which provides for lower group fee rates as total "group assets" increase, and for higher group fee rates as total "group assets" decrease ("group assets" as defined in the management contract). FMR calculates the group fee rates based on a tiered asset "breakpoint" schedule that varies based on asset class. The Board considered that the group fee is designed to deliver the benefits of economies of scale to fund shareholders when total Fidelity fund assets increase, even if assets of any particular fund are unchanged or have declined, because some portion of Fidelity's costs are attributable to services provided to all Fidelity funds, and all funds benefit if those costs can be allocated among more assets. The Board further considered that Fidelity agreed to impose a temporary fee waiver in the form of additional breakpoints to the current breakpoint schedule. The Board concluded that, given the group fee structure, fund shareholders will benefit from lower management fees as "group assets" increase at the fund complex level, regardless of whether Fidelity achieves any such economies of scale.
The Board concluded, taking into account the analysis of the Economies of Scale Committee, that economies of scale, if any, are being appropriately shared between fund shareholders and Fidelity.
Additional Information Requested by the Board. In order to develop fully the factual basis for consideration of the Fidelity funds' advisory contracts, the Board requested and received additional information on certain topics, including: (i) fund flow and performance trends, in particular the underperformance of certain funds and strategies, and Fidelity's long-term strategies for certain funds, including any consideration of fund liquidations or mergers; (ii) the operation of performance fees and competitor use of performance fees; (iii) Fidelity's pricing philosophy compared to competitors; (iv) fund profitability methodology and data; (v) evaluation of competitive fund data and peer group classifications and fee and expense comparisons; (vi) the management fee and expense structures for different funds and classes and information about the differences between various fee and expense structures; (vii) group fee breakpoints and related voluntary fee waivers; and (viii) information regarding other accounts managed by Fidelity and the funds' sub-advisory arrangements.
Conclusion. Based on its evaluation of all of the conclusions noted above, and after considering all factors it believed relevant, the Board, including the Independent Trustees, concluded that the advisory and sub-advisory fee arrangements are fair and reasonable in light of all of the surrounding circumstances and that the fund's Advisory Contracts should be renewed through July 31, 2024.
1.536127.127
BAL-ANN-1023
Fidelity® Puritan® K6 Fund
Annual Report
August 31, 2023
Contents
To view a fund's proxy voting guidelines and proxy voting record for the 12-month period ended June 30, visit http://www.fidelity.com/proxyvotingresults or visit the Securities and Exchange Commission's (SEC) web site at http://www.sec.gov.
You may also call 1-800-835-5092 to request a free copy of the proxy voting guidelines.
Standard & Poor's, S&P and S&P 500 are registered service marks of The McGraw-Hill Companies, Inc. and have been licensed for use by Fidelity Distributors Corporation.
Other third-party marks appearing herein are the property of their respective owners.
All other marks appearing herein are registered or unregistered trademarks or service marks of FMR LLC or an affiliated company. © 2023 FMR LLC. All rights reserved.
This report and the financial statements contained herein are submitted for the general information of the shareholders of the Fund. This report is not authorized for distribution to prospective investors in the Fund unless preceded or accompanied by an effective prospectus.
A fund files its complete schedule of portfolio holdings with the SEC for the first and third quarters of each fiscal year on Form N-PORT. Forms N-PORT are available on the SEC's web site at http://www.sec.gov. A fund's Forms N-PORT may be reviewed and copied at the SEC's Public Reference Room in Washington, DC. Information regarding the operation of the SEC's Public Reference Room may be obtained by calling 1-800-SEC-0330.
For a complete list of a fund's portfolio holdings, view the most recent holdings listing, semiannual report, or annual report on Fidelity's web site at http://www.fidelity.com, http://www.institutional.fidelity.com, or http://www.401k.com, as applicable.
NOT FDIC INSURED •MAY LOSE VALUE •NO BANK GUARANTEE
Neither the Fund nor Fidelity Distributors Corporation is a bank.
Average annual total return reflects the change in the value of an investment, assuming reinvestment of distributions from dividend income and capital gains (the profits earned upon the sale of securities that have grown in value, if any) and assuming a constant rate of performance each year. The hypothetical investment and the average annual total returns do not reflect the deduction of taxes that a shareholder would pay on fund distributions or the redemption of fund shares. During periods of reimbursement by Fidelity, a fund's total return will be greater than it would be had the reimbursement not occurred. How a fund did yesterday is no guarantee of how it will do tomorrow.
| Average Annual Total Returns |
| | | | |
Periods ended August 31, 2023 | Past 1 year | Life of Fund A |
| Fidelity® Puritan® K6 Fund | 12.05% | 9.78% |
A From June 14, 2019
| $10,000 Over Life of Fund |
| |
Let's say hypothetically that $10,000 was invested in Fidelity® Puritan® K6 Fund, on June 14, 2019, when the fund started. The chart shows how the value of your investment would have changed, and also shows how the S&P 500® Index performed over the same period. |
|
|
Market Recap:
U.S. equities gained 15.94% for the 12 months ending August 31, 2023, according to the S&P 500® index, as continued global economic expansion, falling commodity prices and a slowing in the pace of inflation provided a favorable backdrop for higher-risk assets. Large-cap stocks spearheaded the rally, which was driven by the shares of a narrow set of mega-cap companies in the information technology and communication services sectors, largely due to exuberance related to generative artificial intelligence. Aggressive monetary tightening by the U.S. Federal Reserve continued amid consistent pressure on core inflation, a measure that excludes food and energy. Since March 2022, the Fed has hiked its benchmark interest rate 11 times. The latest bump came in late July, a fourth consecutive raise of a stepped-down 25 basis points. The S&P 500® gained 3.21% in July but snapped a five-month rally in August (-1.59%), held back by softness in manufacturing and jobs. Still, U.S. stocks ended August up 18.73% year to date. In fixed income, the Bloomberg U.S. Aggregate Bond Index returned -1.19%, as taxable investment-grade bonds showed year-to-date improvement after returning -13.01% in 2022. For the full 12 months, short-term bonds outpaced long-term issues, while lower-quality (higher yielding) bonds topped higher-quality debt. Higher-risk assets, including corporate bonds and asset-backed securities, fared better than U.S. Treasuries.
Comments from Portfolio Manager Daniel Kelley:
For the fiscal year, the fund gained 12.05%, outperforming the 9.04% advance of the Fidelity Puritan Composite IndexSM - a 60/40 blend of the S&P 500® and the Bloomberg U.S. Aggregate Bond Index. Security selection in the equities subportfolio contributed to the fund's outperformance of the Composite index the past 12 months. Investment choices and an underweight among investment-grade bonds also helped the fund's relative result. Among stocks, my picks in the industrials sector gave the biggest boost by far. The top individual contributor was an overweight in semiconductor company Nvidia (+269%). I notably increased exposure to Nvidia the past 12 months, making it the fund's No. 2 holding as of August 31. Elsewhere, an overweight in Facebook parent Meta Platforms (+84%) and a non-Composite stake in ride-share company Uber Technologies (+65%) boosted the fund's result versus the Composite. I added to Meta this period, a large holding at the end of August. In fixed income, the fund benefited from an overweight in lower-rated corporate bonds. Conversely, stock selection and an underweight in the information technology sector detracted from relative performance for the 12 months. Positioning in the financials sector also detracted. An underweight in consumer electronics leader Apple (+20%) was the largest individual relative detractor, followed by an underweight in e-commerce giant Amazon.com (+8%).
The views expressed above reflect those of the portfolio manager(s) only through the end of the period as stated on the cover of this report and do not necessarily represent the views of Fidelity or any other person in the Fidelity organization. Any such views are subject to change at any time based upon market or other conditions and Fidelity disclaims any responsibility to update such views. These views may not be relied on as investment advice and, because investment decisions for a Fidelity fund are based on numerous factors, may not be relied on as an indication of trading intent on behalf of any Fidelity fund.
The information in the following tables is based on the combined Investments of the Fund and its pro-rata share of investments in Fidelity's Central Funds, other than the Money Market Central Funds.
Top Holdings (% of Fund's net assets) |
| |
| Microsoft Corp. | 5.9 | |
| NVIDIA Corp. | 3.8 | |
| Alphabet, Inc. Class C | 3.5 | |
| Amazon.com, Inc. | 2.2 | |
| Meta Platforms, Inc. Class A | 2.2 | |
| Eaton Corp. PLC | 1.9 | |
| Apple, Inc. | 1.8 | |
| MasterCard, Inc. Class A | 1.7 | |
| Eli Lilly & Co. | 1.5 | |
| The Boeing Co. | 1.4 | |
| | 25.9 | |
| |
| Top Bond Issuers (% of Fund's net assets) |
(with maturities greater than one year) |
| U.S. Treasury Obligations | 11.5 | |
| Fannie Mae | 2.2 | |
| Freddie Mac | 1.9 | |
| Ginnie Mae | 1.2 | |
| Uniform Mortgage Backed Securities | 1.0 | |
| JPMorgan Chase & Co. | 0.7 | |
| Morgan Stanley | 0.4 | |
| Bank of America Corp. | 0.4 | |
| Citigroup, Inc. | 0.3 | |
| Ally Financial, Inc. | 0.2 | |
| | 19.8 | |
| |
| Market Sectors (% of Fund's net assets) |
| |
| Information Technology | 20.4 | |
| Financials | 11.3 | |
| Industrials | 10.0 | |
| Health Care | 8.4 | |
| Communication Services | 8.4 | |
| Consumer Discretionary | 7.5 | |
| Energy | 4.6 | |
| Materials | 2.5 | |
| Consumer Staples | 2.2 | |
| Real Estate | 0.9 | |
| Utilities | 0.6 | |
| |
Asset Allocation (% of Fund's net assets) |
|
Futures and Swaps - 0.7% |
|
An unaudited holdings listing for the fund, which presents direct holdings as well as the pro-rata share of any securities and other investments held indirectly through its investment in underlying Fidelity Central Funds, other than the Money Market Central Funds, is available at fidelity.com and/or institutional.fidelity.com, as applicable.
Showing Percentage of Net Assets
| Common Stocks - 63.7% |
| | | Shares | Value ($) |
| COMMUNICATION SERVICES - 7.0% | | | |
| Entertainment - 0.8% | | | |
| Electronic Arts, Inc. | | 3,999 | 479,800 |
| LiveOne, Inc. (a)(b) | | 325,553 | 696,683 |
| Netflix, Inc. (a) | | 20,807 | 9,023,580 |
| Spotify Technology SA (a) | | 2,497 | 384,463 |
| Universal Music Group NV | | 35,670 | 884,373 |
| | | | 11,468,899 |
| Interactive Media & Services - 5.7% | | | |
| Alphabet, Inc. Class C (a) | | 348,489 | 47,864,964 |
| Meta Platforms, Inc. Class A (a) | | 102,166 | 30,229,898 |
| | | | 78,094,862 |
| Media - 0.5% | | | |
| Comcast Corp. Class A | | 152,277 | 7,120,473 |
TOTAL COMMUNICATION SERVICES | | | 96,684,234 |
| CONSUMER DISCRETIONARY - 6.7% | | | |
| Automobile Components - 0.1% | | | |
| Aptiv PLC (a) | | 8,551 | 867,499 |
| Automobiles - 0.0% | | | |
| Li Auto, Inc. ADR (a) | | 4,558 | 189,841 |
| Broadline Retail - 2.3% | | | |
| Amazon.com, Inc. (a) | | 223,195 | 30,803,142 |
| Global-e Online Ltd. (a) | | 37,533 | 1,487,433 |
| | | | 32,290,575 |
| Hotels, Restaurants & Leisure - 1.8% | | | |
| Airbnb, Inc. Class A (a) | | 33,119 | 4,356,804 |
| Caesars Entertainment, Inc. (a) | | 33,410 | 1,846,237 |
| Compass Group PLC | | 71,233 | 1,796,264 |
| Domino's Pizza, Inc. | | 7,087 | 2,745,504 |
| Flutter Entertainment PLC (a) | | 10,509 | 1,918,375 |
| Hilton Worldwide Holdings, Inc. | | 37,867 | 5,628,930 |
| Marriott International, Inc. Class A | | 15,388 | 3,131,612 |
| McDonald's Corp. | | 10,436 | 2,934,081 |
| | | | 24,357,807 |
| Household Durables - 0.1% | | | |
| Chervon Holdings Ltd. | | 287 | 948 |
| D.R. Horton, Inc. | | 12,457 | 1,482,632 |
| | | | 1,483,580 |
| Specialty Retail - 1.6% | | | |
| Lowe's Companies, Inc. | | 35,194 | 8,111,513 |
| Revolve Group, Inc. (a) | | 3,215 | 47,100 |
| RH (a) | | 3,854 | 1,407,442 |
| TJX Companies, Inc. | | 141,970 | 13,129,386 |
| | | | 22,695,441 |
| Textiles, Apparel & Luxury Goods - 0.8% | | | |
| Brunello Cucinelli SpA | | 61,463 | 5,091,862 |
| LVMH Moet Hennessy Louis Vuitton SE | | 3,588 | 3,034,220 |
| Moncler SpA | | 6,501 | 441,572 |
| NIKE, Inc. Class B | | 1,740 | 176,975 |
| On Holding AG (a) | | 2,478 | 71,441 |
| Ralph Lauren Corp. | | 14,322 | 1,670,375 |
| Tapestry, Inc. | | 22,064 | 735,172 |
| | | | 11,221,617 |
TOTAL CONSUMER DISCRETIONARY | | | 93,106,360 |
| CONSUMER STAPLES - 1.5% | | | |
| Beverages - 0.7% | | | |
| Boston Beer Co., Inc. Class A (a) | | 2,556 | 934,039 |
| Monster Beverage Corp. | | 151,675 | 8,707,662 |
| | | | 9,641,701 |
| Consumer Staples Distribution & Retail - 0.0% | | | |
| Performance Food Group Co. (a) | | 4,421 | 274,677 |
| Household Products - 0.3% | | | |
| The Clorox Co. | | 26,163 | 4,093,201 |
| Personal Care Products - 0.2% | | | |
| Estee Lauder Companies, Inc. Class A | | 8,861 | 1,422,456 |
| Kenvue, Inc. | | 64,886 | 1,495,622 |
| L'Oreal SA (a) | | 182 | 80,085 |
| | | | 2,998,163 |
| Tobacco - 0.3% | | | |
| Philip Morris International, Inc. | | 43,730 | 4,200,704 |
TOTAL CONSUMER STAPLES | | | 21,208,446 |
| ENERGY - 3.0% | | | |
| Energy Equipment & Services - 1.8% | | | |
| Baker Hughes Co. Class A | | 212,269 | 7,682,015 |
| NOV, Inc. | | 182,457 | 3,855,316 |
| Schlumberger Ltd. | | 154,005 | 9,080,135 |
| TechnipFMC PLC | | 183,273 | 3,489,518 |
| Weatherford International PLC (a) | | 10 | 885 |
| | | | 24,107,869 |
| Oil, Gas & Consumable Fuels - 1.2% | | | |
| Antero Resources Corp. (a) | | 29,716 | 822,242 |
| Exxon Mobil Corp. | | 60,741 | 6,753,792 |
| Hess Corp. | | 47,240 | 7,298,580 |
| Range Resources Corp. | | 70,166 | 2,271,975 |
| | | | 17,146,589 |
TOTAL ENERGY | | | 41,254,458 |
| FINANCIALS - 6.7% | | | |
| Banks - 0.4% | | | |
| JPMorgan Chase & Co. | | 33,864 | 4,955,319 |
| Capital Markets - 2.2% | | | |
| Ares Management Corp. | | 48,909 | 5,059,147 |
| BlackRock, Inc. Class A | | 6,461 | 4,526,189 |
| Cboe Global Markets, Inc. | | 12,705 | 1,902,066 |
| CME Group, Inc. | | 11,908 | 2,413,513 |
| Deutsche Borse AG | | 7,990 | 1,418,417 |
| Goldman Sachs Group, Inc. | | 6,938 | 2,273,652 |
| Intercontinental Exchange, Inc. | | 34,469 | 4,066,997 |
| KKR & Co. LP | | 19,597 | 1,230,888 |
| London Stock Exchange Group PLC | | 6,881 | 711,868 |
| Moody's Corp. | | 3,363 | 1,132,658 |
| Morgan Stanley | | 57,509 | 4,896,891 |
| Raymond James Financial, Inc. | | 6,593 | 689,562 |
| | | | 30,321,848 |
| Consumer Finance - 0.2% | | | |
| American Express Co. | | 13,915 | 2,198,431 |
| Capital One Financial Corp. | | 12,080 | 1,236,871 |
| | | | 3,435,302 |
| Financial Services - 2.8% | | | |
| Berkshire Hathaway, Inc. Class B (a) | | 10,029 | 3,612,446 |
| Block, Inc. Class A (a) | | 35,701 | 2,058,163 |
| MasterCard, Inc. Class A | | 57,197 | 23,601,770 |
| Toast, Inc. (a) | | 66,103 | 1,465,504 |
| Visa, Inc. Class A | | 31,315 | 7,693,469 |
| | | | 38,431,352 |
| Insurance - 1.1% | | | |
| Arthur J. Gallagher & Co. | | 23,223 | 5,352,437 |
| Chubb Ltd. | | 5,635 | 1,131,902 |
| Globe Life, Inc. | | 11,472 | 1,279,931 |
| Hartford Financial Services Group, Inc. | | 12,720 | 913,550 |
| Marsh & McLennan Companies, Inc. | | 21,185 | 4,130,863 |
| The Travelers Companies, Inc. | | 18,405 | 2,967,438 |
| | | | 15,776,121 |
TOTAL FINANCIALS | | | 92,919,942 |
| HEALTH CARE - 7.5% | | | |
| Biotechnology - 1.5% | | | |
| Argenx SE ADR (a) | | 6,759 | 3,396,330 |
| Exact Sciences Corp. (a) | | 42,860 | 3,586,096 |
| Karuna Therapeutics, Inc. (a) | | 21 | 3,943 |
| Legend Biotech Corp. ADR (a) | | 48,956 | 3,395,588 |
| Moderna, Inc. (a) | | 13,433 | 1,518,869 |
| Nuvalent, Inc. Class A (a) | | 5,530 | 252,002 |
| Prothena Corp. PLC (a) | | 6,178 | 326,322 |
| Regeneron Pharmaceuticals, Inc. (a) | | 5,501 | 4,546,521 |
| Vertex Pharmaceuticals, Inc. (a) | | 9,936 | 3,461,106 |
| | | | 20,486,777 |
| Health Care Equipment & Supplies - 1.9% | | | |
| Baxter International, Inc. | | 8,552 | 347,211 |
| Boston Scientific Corp. (a) | | 261,512 | 14,105,957 |
| Intuitive Surgical, Inc. (a) | | 9,262 | 2,896,042 |
| Penumbra, Inc. (a) | | 435 | 115,058 |
| Stryker Corp. | | 31,816 | 9,021,427 |
| | | | 26,485,695 |
| Health Care Providers & Services - 1.6% | | | |
| agilon health, Inc. (a) | | 143,356 | 2,540,268 |
| Cardinal Health, Inc. | | 6,375 | 556,729 |
| Cigna Group | | 2,751 | 759,991 |
| CVS Health Corp. | | 41,561 | 2,708,530 |
| UnitedHealth Group, Inc. | | 31,380 | 14,955,080 |
| | | | 21,520,598 |
| Life Sciences Tools & Services - 0.2% | | | |
| Agilent Technologies, Inc. | | 12,248 | 1,482,865 |
| Thermo Fisher Scientific, Inc. | | 1,961 | 1,092,473 |
| | | | 2,575,338 |
| Pharmaceuticals - 2.3% | | | |
| AstraZeneca PLC sponsored ADR | | 4,924 | 333,946 |
| Eli Lilly & Co. | | 36,328 | 20,132,978 |
| Merck & Co., Inc. | | 93,339 | 10,172,084 |
| Novo Nordisk A/S Series B | | 10,389 | 1,916,290 |
| | | | 32,555,298 |
TOTAL HEALTH CARE | | | 103,623,706 |
| INDUSTRIALS - 9.2% | | | |
| Aerospace & Defense - 2.3% | | | |
| BWX Technologies, Inc. | | 5 | 369 |
| Howmet Aerospace, Inc. | | 60,400 | 2,987,988 |
| Lockheed Martin Corp. | | 16,602 | 7,443,507 |
| The Boeing Co. (a) | | 86,317 | 19,337,598 |
| TransDigm Group, Inc. | | 2,035 | 1,839,335 |
| | | | 31,608,797 |
| Building Products - 0.7% | | | |
| ASSA ABLOY AB (B Shares) | | 7,781 | 175,119 |
| Fortune Brands Home & Security, Inc. (b) | | 21,032 | 1,451,629 |
| Johnson Controls International PLC | | 27,012 | 1,595,329 |
| Trane Technologies PLC | | 28,737 | 5,898,557 |
| | | | 9,120,634 |
| Commercial Services & Supplies - 0.3% | | | |
| Cintas Corp. | | 7,538 | 3,800,433 |
| Copart, Inc. | | 1,792 | 80,335 |
| | | | 3,880,768 |
| Construction & Engineering - 0.2% | | | |
| Fluor Corp. (a) | | 63,335 | 2,216,092 |
| Willscot Mobile Mini Holdings (a) | | 4,094 | 167,936 |
| | | | 2,384,028 |
| Electrical Equipment - 2.5% | | | |
| Eaton Corp. PLC | | 116,243 | 26,778,900 |
| Hubbell, Inc. Class B | | 8,001 | 2,608,726 |
| Prysmian SpA | | 21,488 | 880,526 |
| Regal Rexnord Corp. | | 1,262 | 204,684 |
| Vertiv Holdings Co. | | 87,159 | 3,433,193 |
| | | | 33,906,029 |
| Ground Transportation - 1.0% | | | |
| Canadian Pacific Kansas City Ltd. | | 7,946 | 630,753 |
| Lyft, Inc. (a) | | 113,733 | 1,339,775 |
| Uber Technologies, Inc. (a) | | 265,705 | 12,549,247 |
| | | | 14,519,775 |
| Industrial Conglomerates - 0.9% | | | |
| General Electric Co. | | 104,127 | 11,918,376 |
| Machinery - 0.8% | | | |
| Caterpillar, Inc. | | 33,241 | 9,345,042 |
| PACCAR, Inc. | | 5,879 | 483,783 |
| Parker Hannifin Corp. | | 881 | 367,289 |
| Pentair PLC | | 14,575 | 1,024,040 |
| | | | 11,220,154 |
| Passenger Airlines - 0.2% | | | |
| Copa Holdings SA Class A (b) | | 20,977 | 2,133,361 |
| Delta Air Lines, Inc. | | 20,596 | 883,156 |
| | | | 3,016,517 |
| Professional Services - 0.2% | | | |
| Equifax, Inc. | | 13,415 | 2,772,881 |
| Paycom Software, Inc. | | 2,252 | 663,980 |
| | | | 3,436,861 |
| Trading Companies & Distributors - 0.1% | | | |
| Bunzl PLC | | 2,082 | 74,641 |
| W.W. Grainger, Inc. | | 1,984 | 1,416,854 |
| | | | 1,491,495 |
TOTAL INDUSTRIALS | | | 126,503,434 |
| INFORMATION TECHNOLOGY - 19.9% | | | |
| Electronic Equipment, Instruments & Components - 0.4% | | | |
| Amphenol Corp. Class A | | 44,858 | 3,964,550 |
| Flex Ltd. (a) | | 50,237 | 1,386,039 |
| | | | 5,350,589 |
| IT Services - 1.4% | | | |
| Accenture PLC Class A | | 20,270 | 6,562,818 |
| Shopify, Inc. Class A (a) | | 173,785 | 11,554,965 |
| Snowflake, Inc. (a) | | 10,111 | 1,585,910 |
| X Holdings Corp. Class A (c)(e) | | 4,690 | 180,893 |
| | | | 19,884,586 |
| Semiconductors & Semiconductor Equipment - 7.9% | | | |
| Advanced Micro Devices, Inc. (a) | | 37,050 | 3,916,926 |
| Analog Devices, Inc. | | 41,574 | 7,557,322 |
| Applied Materials, Inc. | | 10,915 | 1,667,375 |
| ASML Holding NV (depository receipt) | | 4,662 | 3,079,391 |
| First Solar, Inc. (a) | | 16,807 | 3,178,540 |
| GlobalFoundries, Inc. (a) | | 59,602 | 3,293,011 |
| Lam Research Corp. | | 4,217 | 2,962,021 |
| Lattice Semiconductor Corp. (a) | | 11,986 | 1,165,758 |
| Marvell Technology, Inc. | | 225,266 | 13,121,745 |
| Monolithic Power Systems, Inc. | | 3,521 | 1,835,180 |
| NVIDIA Corp. | | 104,853 | 51,750,198 |
| NXP Semiconductors NV | | 16,312 | 3,355,705 |
| ON Semiconductor Corp. (a) | | 31,914 | 3,142,252 |
| Taiwan Semiconductor Manufacturing Co. Ltd. sponsored ADR | | 74,971 | 7,015,036 |
| Universal Display Corp. | | 11,198 | 1,820,347 |
| | | | 108,860,807 |
| Software - 8.4% | | | |
| Adobe, Inc. (a) | | 11,070 | 6,191,894 |
| Autodesk, Inc. (a) | | 3,962 | 879,326 |
| Confluent, Inc. (a) | | 13,053 | 431,924 |
| Dynatrace, Inc. (a) | | 98,192 | 4,732,854 |
| Fair Isaac Corp. (a) | | 926 | 837,650 |
| HubSpot, Inc. (a) | | 2,729 | 1,491,453 |
| Microsoft Corp. | | 250,072 | 81,963,597 |
| Oracle Corp. | | 58,689 | 7,065,569 |
| Salesforce, Inc. (a) | | 21,608 | 4,785,308 |
| Synopsys, Inc. (a) | | 7,245 | 3,324,658 |
| Tenable Holdings, Inc. (a) | | 4,106 | 186,289 |
| UiPath, Inc. Class A (a) | | 15,876 | 251,000 |
| Workday, Inc. Class A (a) | | 18,793 | 4,594,889 |
| | | | 116,736,411 |
| Technology Hardware, Storage & Peripherals - 1.8% | | | |
| Apple, Inc. | | 130,992 | 24,609,467 |
| Samsung Electronics Co. Ltd. | | 3,738 | 188,746 |
| | | | 24,798,213 |
TOTAL INFORMATION TECHNOLOGY | | | 275,630,606 |
| MATERIALS - 2.2% | | | |
| Chemicals - 1.6% | | | |
| Linde PLC | | 28,071 | 10,864,600 |
| Sherwin-Williams Co. | | 41,874 | 11,378,003 |
| | | | 22,242,603 |
| Construction Materials - 0.0% | | | |
| Martin Marietta Materials, Inc. | | 629 | 280,792 |
| Containers & Packaging - 0.1% | | | |
| Aptargroup, Inc. | | 497 | 65,882 |
| Ball Corp. | | 20,482 | 1,115,245 |
| | | | 1,181,127 |
| Metals & Mining - 0.5% | | | |
| First Quantum Minerals Ltd. | | 77,497 | 2,081,958 |
| Franco-Nevada Corp. | | 1,675 | 241,308 |
| Freeport-McMoRan, Inc. | | 3,317 | 132,381 |
| Newcrest Mining Ltd. | | 59,867 | 997,783 |
| Newmont Corp. | | 75,884 | 2,991,347 |
| Nucor Corp. | | 1,157 | 199,120 |
| Wheaton Precious Metals Corp. | | 13,175 | 574,700 |
| | | | 7,218,597 |
TOTAL MATERIALS | | | 30,923,119 |
| TOTAL COMMON STOCKS (Cost $712,485,215) | | | 881,854,305 |
| | | | |
| Fixed-Income Funds - 35.7% |
| | | Shares | Value ($) |
| Fidelity High Income Central Fund (d) | | 627,445 | 64,331,981 |
| Fidelity Investment Grade Bond Central Fund (d) | | 4,451,108 | 429,042,334 |
| TOTAL FIXED-INCOME FUNDS (Cost $537,489,089) | | | 493,374,315 |
| | | | |
| Other - 0.0% |
| | | Shares | Value ($) |
| Other - 0.0% | | | |
Fidelity Private Credit Central Fund LLC (e) (Cost $206,745) | | 20,665 | 207,892 |
| | | | |
| Money Market Funds - 1.1% |
| | | Shares | Value ($) |
| Fidelity Cash Central Fund 5.43% (f) | | 11,331,939 | 11,334,206 |
| Fidelity Securities Lending Cash Central Fund 5.44% (f)(g) | | 3,700,680 | 3,701,050 |
| TOTAL MONEY MARKET FUNDS (Cost $15,035,255) | | | 15,035,256 |
| | | | |
| TOTAL INVESTMENT IN SECURITIES - 100.5% (Cost $1,265,216,304) | 1,390,471,768 |
NET OTHER ASSETS (LIABILITIES) - (0.5)% | (6,607,311) |
| NET ASSETS - 100.0% | 1,383,864,457 |
| | |
Legend
| (b) | Security or a portion of the security is on loan at period end. |
| (d) | Affiliated fund that is generally available only to investment companies and other accounts managed by Fidelity Investments. A complete unaudited schedule of portfolio holdings for each Fidelity Central Fund is filed with the SEC for the first and third quarters of each fiscal year on Form N-PORT and is available upon request or at the SEC's website at www.sec.gov. An unaudited holdings listing for the Fund, which presents direct holdings as well as the pro-rata share of securities and other investments held indirectly through its investment in underlying non-money market Fidelity Central Funds, is available at fidelity.com and/or institutional.fidelity.com, as applicable. In addition, each Fidelity Central Fund's financial statements,which are not covered by the Fund's Report of Independent Registered Public Accounting Firm, are available on the SEC's website or upon request. |
| (e) | Restricted securities (including private placements) - Investment in securities not registered under the Securities Act of 1933 (excluding 144A issues). At the end of the period, the value of restricted securities (excluding 144A issues) amounted to $388,785 or 0.0% of net assets. |
| (f) | Affiliated fund that is generally available only to investment companies and other accounts managed by Fidelity Investments. The rate quoted is the annualized seven-day yield of the fund at period end. A complete unaudited listing of the fund's holdings as of its most recent quarter end is available upon request. In addition, each Fidelity Central Fund's financial statements, which are not covered by the Fund's Report of Independent Registered Public Accounting Firm, are available on the SEC's website or upon request. |
| (g) | Investment made with cash collateral received from securities on loan. |
| Additional information on each restricted holding is as follows: |
| Security | Acquisition Date | Acquisition Cost ($) |
| Fidelity Private Credit Central Fund LLC | 5/26/23 - 8/29/23 | 206,745 |
| | | |
| X Holdings Corp. Class A | 10/25/22 | 469,000 |
| | | |
Affiliated Central Funds
Fiscal year to date information regarding the Fund's investments in Fidelity Central Funds, including the ownership percentage, is presented below.
| Affiliate | Value, beginning of period ($) | Purchases ($) | Sales Proceeds ($) | Dividend Income ($) | Realized Gain (loss) ($) | Change in Unrealized appreciation (depreciation) ($) | Value, end of period ($) | % ownership, end of period |
| Fidelity Cash Central Fund 5.43% | 19,963,778 | 576,388,258 | 585,017,830 | 594,870 | - | - | 11,334,206 | 0.0% |
| Fidelity High Income Central Fund | 46,460,925 | 22,190,118 | 4,005,602 | 3,660,297 | (471,666) | 158,206 | 64,331,981 | 4.4% |
| Fidelity Investment Grade Bond Central Fund | 252,910,330 | 189,120,466 | 596,201 | 11,083,800 | (99,458) | (12,292,803) | 429,042,334 | 1.1% |
| Fidelity Private Credit Central Fund LLC | - | 206,746 | - | 1,745 | - | 1,146 | 207,892 | 0.0% |
| Fidelity Securities Lending Cash Central Fund 5.44% | 496,200 | 11,317,994 | 8,113,144 | 12,553 | - | - | 3,701,050 | 0.0% |
| Total | 319,831,233 | 799,223,582 | 597,732,777 | 15,353,265 | (571,124) | (12,133,451) | 508,617,463 | |
| | | | | | | | | |
Amounts in the dividend income column in the above table include any capital gain distributions from underlying funds, which are presented in the corresponding line item in the Statement of Operations, if applicable.
Amounts in the dividend income column for Fidelity Securities Lending Cash Central Fund represents the income earned on investing cash collateral, less rebates paid to borrowers and any lending agent fees associated with the loan, plus any premium payments received for lending certain types of securities.
Amounts included in the purchases and sales proceeds columns may include in-kind transactions, if applicable.
Investment Valuation
The following is a summary of the inputs used, as of August 31, 2023, involving the Fund's assets and liabilities carried at fair value. The inputs or methodology used for valuing securities may not be an indication of the risk associated with investing in those securities. For more information on valuation inputs, and their aggregation into the levels used below, please refer to the Investment Valuation section in the accompanying Notes to Financial Statements.
| Valuation Inputs at Reporting Date: |
| Description | Total ($) | Level 1 ($) | Level 2 ($) | Level 3 ($) |
Investments in Securities: | | | | |
|
| Equities: | | | | |
Communication Services | 96,684,234 | 95,799,861 | 884,373 | - |
Consumer Discretionary | 93,106,360 | 88,275,876 | 4,830,484 | - |
Consumer Staples | 21,208,446 | 21,208,446 | - | - |
Energy | 41,254,458 | 41,254,458 | - | - |
Financials | 92,919,942 | 90,789,657 | 2,130,285 | - |
Health Care | 103,623,706 | 101,707,416 | 1,916,290 | - |
Industrials | 126,503,434 | 126,328,315 | 175,119 | - |
Information Technology | 275,630,606 | 275,449,713 | - | 180,893 |
Materials | 30,923,119 | 29,925,336 | 997,783 | - |
|
| Fixed-Income Funds | 493,374,315 | 493,374,315 | - | - |
|
| Other | 207,892 | - | 207,892 | - |
|
| Money Market Funds | 15,035,256 | 15,035,256 | - | - |
| Total Investments in Securities: | 1,390,471,768 | 1,379,148,649 | 11,142,226 | 180,893 |
| Statement of Assets and Liabilities |
| | | | August 31, 2023 |
| | | | | |
| Assets | | | | |
| Investment in securities, at value (including securities loaned of $3,569,916) - See accompanying schedule: | | | | |
Unaffiliated issuers (cost $712,485,215) | $ | 881,854,305 | | |
Fidelity Central Funds (cost $552,731,089) | | 508,617,463 | | |
| | | | | |
| | | | | |
| Total Investment in Securities (cost $1,265,216,304) | | | $ | 1,390,471,768 |
| Cash | | | | 13,804 |
| Foreign currency held at value (cost $49) | | | | 49 |
| Receivable for investments sold | | | | 6,250,662 |
| Receivable for fund shares sold | | | | 359,676 |
| Dividends receivable | | | | 550,400 |
| Distributions receivable from Fidelity Central Funds | | | | 67,546 |
| Other receivables | | | | 4,514 |
Total assets | | | | 1,397,718,419 |
| Liabilities | | | | |
| Payable for investments purchased | $ | 8,836,052 | | |
| Payable for fund shares redeemed | | 953,813 | | |
| Accrued management fee | | 363,047 | | |
| Collateral on securities loaned | | 3,701,050 | | |
| Total Liabilities | | | | 13,853,962 |
| Commitments and contingent liabilities (see Commitments note) | | | | |
| Net Assets | | | $ | 1,383,864,457 |
| Net Assets consist of: | | | | |
| Paid in capital | | | $ | 1,286,663,086 |
| Total accumulated earnings (loss) | | | | 97,201,371 |
| Net Assets | | | $ | 1,383,864,457 |
Net Asset Value, offering price and redemption price per share ($1,383,864,457 ÷ 102,420,767 shares) | | | $ | 13.51 |
| Statement of Operations |
| | | | Year ended August 31, 2023 |
| Investment Income | | | | |
| Dividends | | | $ | 6,473,371 |
| Income from Fidelity Central Funds (including $12,553 from security lending) | | | | 15,313,807 |
| Total Income | | | | 21,787,178 |
| Expenses | | | | |
| Management fee | $ | 3,065,575 | | |
| Independent trustees' fees and expenses | | 4,841 | | |
| Total expenses before reductions | | 3,070,416 | | |
| Expense reductions | | (3,743) | | |
| Total expenses after reductions | | | | 3,066,673 |
| Net Investment income (loss) | | | | 18,720,505 |
| Realized and Unrealized Gain (Loss) | | | | |
| Net realized gain (loss) on: | | | | |
| Investment Securities: | | | | |
| Unaffiliated issuers | | (21,994,949) | | |
| Fidelity Central Funds | | (571,124) | | |
| Foreign currency transactions | | (680) | | |
| Written options | | 807,175 | | |
| Capital gain distributions from Fidelity Central Funds | | 39,458 | | |
| Total net realized gain (loss) | | | | (21,720,120) |
| Change in net unrealized appreciation (depreciation) on: | | | | |
| Investment Securities: | | | | |
| Unaffiliated issuers | | 125,618,970 | | |
| Fidelity Central Funds | | (12,133,451) | | |
| Assets and liabilities in foreign currencies | | 1,383 | | |
| Total change in net unrealized appreciation (depreciation) | | | | 113,486,902 |
| Net gain (loss) | | | | 91,766,782 |
| Net increase (decrease) in net assets resulting from operations | | | $ | 110,487,287 |
| Statement of Changes in Net Assets |
| |
| | Year ended August 31, 2023 | | Year ended August 31, 2022 |
| Increase (Decrease) in Net Assets | | | | |
| Operations | | | | |
| Net investment income (loss) | $ | 18,720,505 | $ | 11,260,586 |
| Net realized gain (loss) | | (21,720,120) | | (6,122,323) |
| Change in net unrealized appreciation (depreciation) | | 113,486,902 | | (113,520,029) |
| Net increase (decrease) in net assets resulting from operations | | 110,487,287 | | (108,381,766) |
| Distributions to shareholders | | (17,241,436) | | (31,218,292) |
| | | | | |
| Share transactions | | | | |
| Proceeds from sales of shares | | 590,724,615 | | 432,759,445 |
| Reinvestment of distributions | | 17,241,436 | | 31,218,292 |
| Cost of shares redeemed | | (148,653,415) | | (143,613,464) |
| | | | | |
Net increase (decrease) in net assets resulting from share transactions | | 459,312,636 | | 320,364,273 |
| Total increase (decrease) in net assets | | 552,558,487 | | 180,764,215 |
| | | | | |
| Net Assets | | | | |
| Beginning of period | | 831,305,970 | | 650,541,755 |
| End of period | $ | 1,383,864,457 | $ | 831,305,970 |
| | | | | |
| Other Information | | | | |
| Shares | | | | |
| Sold | | 45,291,468 | | 31,710,032 |
| Issued in reinvestment of distributions | | 1,403,797 | | 2,257,174 |
| Redeemed | | (11,910,163) | | (10,625,081) |
| Net increase (decrease) | | 34,785,102 | | 23,342,125 |
| | | | | |
Financial Highlights
| Fidelity® Puritan® K6 Fund |
| |
| Years ended August 31, | | 2023 | | 2022 | | 2021 | | 2020 | | 2019 A |
Selected Per-Share Data | | | | | | | | | | |
| Net asset value, beginning of period | $ | 12.29 | $ | 14.69 | $ | 12.36 | $ | 10.26 | $ | 10.00 |
| Income from Investment Operations | | | | | | | | | | |
Net investment income (loss) B,C | | .24 | | .20 | | .16 | | .16 | | .03 |
| Net realized and unrealized gain (loss) | | 1.22 | | (1.94) | | 2.36 | | 2.07 | | .24 |
| Total from investment operations | | 1.46 | | (1.74) | | 2.52 | | 2.23 | | .27 |
| Distributions from net investment income | | (.24) | | (.18) | | (.14) | | (.13) | | (.01) |
| Distributions from net realized gain | | - | | (.47) | | (.05) | | - | | - |
| Total distributions | | (.24) | | (.66) D | | (.19) | | (.13) | | (.01) |
| Net asset value, end of period | $ | 13.51 | $ | 12.29 | $ | 14.69 | $ | 12.36 | $ | 10.26 |
Total Return E,F | | 12.05% | | (12.35)% | | 20.55% | | 21.95% | | 2.65% |
Ratios to Average Net Assets C,G,H | | | | | | | | | | |
| Expenses before reductions | | .32% | | .32% | | .32% | | .32% | | .31% I,J |
| Expenses net of fee waivers, if any | | .32% | | .32% | | .32% | | .32% | | .31% I,J |
| Expenses net of all reductions | | .32% | | .32% | | .31% | | .32% | | .31% I,J |
| Net investment income (loss) | | 1.95% | | 1.46% | | 1.17% | | 1.48% | | 1.62% J |
| Supplemental Data | | | | | | | | | | |
| Net assets, end of period (000 omitted) | $ | 1,383,864 | $ | 831,306 | $ | 650,542 | $ | 371,252 | $ | 83,185 |
Portfolio turnover rate K,L | | 58% | | 72% | | 65% | | 67% | | 99% M |
AFor the period June 14, 2019 (commencement of operations) through August 31, 2019.
BCalculated based on average shares outstanding during the period.
CNet investment income (loss) is affected by the timing of the declaration of dividends by any underlying mutual funds or exchange-traded funds (ETFs). Net investment income (loss) of any mutual funds or ETFs is not included in the Fund's net investment income (loss) ratio.
DTotal distributions per share do not sum due to rounding.
ETotal returns for periods of less than one year are not annualized.
FTotal returns would have been lower if certain expenses had not been reduced during the applicable periods shown.
GFees and expenses of any underlying mutual funds or exchange-traded funds (ETFs) are not included in the Fund's expense ratio. The Fund indirectly bears its proportionate share of these expenses. For additional expense information related to investments in Fidelity Central Funds, please refer to the "Investments in Fidelity Central Funds" note found in the Notes to Financial Statements section of the most recent Annual or Semi-Annual report. For additional expense information related to investments in Fidelity Private Credit Central Fund LLC, please refer to the Investment in Fidelity Private Credit Central Fund LLC note found in the Notes to Financial Statements section of the most recent Annual or Semi-Annual report.
HExpense ratios reflect operating expenses of the class. Expenses before reductions do not reflect amounts reimbursed, waived, or reduced through arrangements with the investment adviser, brokerage services, or other offset arrangements, if applicable, and do not represent the amount paid by the class during periods when reimbursements, waivers or reductions occur.
IThe size and fluctuation of net assets and expense amounts may cause ratios to differ from contractual rates.
JAnnualized.
KAmount does not include the portfolio activity of any underlying mutual funds or exchange-traded funds (ETFs).
LPortfolio turnover rate excludes securities received or delivered in-kind.
MAmount not annualized.
For the period ended August 31, 2023
1. Organization.
Fidelity Puritan K6 Fund (the Fund) is a fund of Fidelity Puritan Trust (the Trust) and is authorized to issue an unlimited number of shares. Share transactions on the Statement of Changes in Net Assets may contain exchanges between affiliated funds. The Trust is registered under the Investment Company Act of 1940, as amended (the 1940 Act), as an open-end management investment company organized as a Massachusetts business trust. Shares generally are available only to employer-sponsored retirement plans that are recordkept by Fidelity, or to certain employer-sponsored retirement plans that are not recordkept by Fidelity.
2. Investments in Fidelity Central Funds.
Funds may invest in Fidelity Central Funds, which are open-end investment companies generally available only to other investment companies and accounts managed by the investment adviser and its affiliates. The Schedule of Investments lists any Fidelity Central Funds held as an investment as of period end, but does not include the underlying holdings of each Fidelity Central Fund. An investing fund indirectly bears its proportionate share of the expenses of the underlying Fidelity Central Funds.
Based on its investment objective, each Fidelity Central Fund may invest or participate in various investment vehicles or strategies that are similar to those of the investing fund. These strategies are consistent with the investment objectives of the investing fund and may involve certain economic risks which may cause a decline in value of each of the Fidelity Central Funds and thus a decline in the value of the investing fund.
| Fidelity Central Fund | Investment Manager | Investment Objective | Investment Practices | Expense RatioA |
| Fidelity High Income Central Fund | Fidelity Management & Research Company LLC (FMR) | Seeks a high level of income and may also seek capital appreciation by investing primarily in debt securities, preferred stocks, and convertible securities, with an emphasis on lower-quality debt securities. | Loans & Direct Debt Instruments Restricted Securities | .03% |
| Fidelity Investment Grade Bond Central Fund | Fidelity Management & Research Company LLC (FMR) | Seeks a high level of income by normally investing in investment-grade debt securities. | Delayed Delivery & When Issued Securities Futures Options Restricted Securities Swaps | Less than .005% |
| Fidelity Money Market Central Funds | Fidelity Management & Research Company LLC (FMR) | Each fund seeks to obtain a high level of current income consistent with the preservation of capital and liquidity. | Short-term Investments | Less than .005% |
A Expenses expressed as a percentage of average net assets and are as of each underlying Central Fund's most recent annual or semi-annual shareholder report.
An unaudited holdings listing for the investing fund, which presents direct holdings as well as the pro-rata share of any securities and other investments held indirectly through its investment in underlying non-money market Fidelity Central Funds, is available at fidelity.com and/or institutional.fidelity.com, as applicable. A complete unaudited list of holdings for each Fidelity Central Fund is available upon request or at the Securities and Exchange Commission website at www.sec.gov. In addition, the financial statements of the Fidelity Central Funds which contain the significant accounting policies (including investment valuation policies) of those funds, and are not covered by the Report of Independent Registered Public Accounting Firm, are available on the Securities and Exchange Commission website or upon request.
3. Investment in Fidelity Private Credit Central Fund LLC.
The Fund invests in Fidelity Private Credit Central Fund LLC (formerly Fidelity Direct Lending Fund, LP), which is a limited liability company available only to certain investment companies managed by the investment adviser and its affiliates. On June 1, 2023, Fidelity Private Credit Central Fund elected to be regulated as a business development company (BDC). Fidelity Private Credit Central Fund LLC's units are not registered under the Securities Act of 1933 and are subject to substantial restrictions on transfer. The Fund has no redemption rights under Fidelity Private Credit Central Fund LLC's limited liability company agreement. There will be no trading market for the units.
Based on its investment objective, Fidelity Private Credit Central Fund LLC may invest or participate in various investments or strategies that are similar to those in which the Fund may invest or participate. These strategies are consistent with the investment objectives of the Fund and may involve certain economic risks which may cause a decline in value of Fidelity Private Credit Central Fund LLC and thus a decline in the value of the Fund. Fidelity Private Credit Central Fund LLC intends to invest primarily in directly originated loans to private companies but also with liquid credit investments, like broadly syndicated loans, and other select private credit investments.
The Schedule of Investments lists Fidelity Private Credit Central Fund LLC as an investment as of period end, but does not include the underlying holdings of Fidelity Private Credit Central Fund LLC. Fidelity Private Credit Central Fund LLC represented less than 5% of the Fund's net assets at period end. The Fund indirectly bears its proportionate share of the expenses of Fidelity Private Credit Central Fund LLC. The annualized expense ratio for Fidelity Private Credit Central Fund LLC for the six month period ended June 30, 2023 was 8.51%.
4. Significant Accounting Policies.
The Fund is an investment company and applies the accounting and reporting guidance of the Financial Accounting Standards Board (FASB) Accounting Standards Codification Topic 946 Financial Services - Investment Companies. The financial statements have been prepared in conformity with accounting principles generally accepted in the United States of America (GAAP), which require management to make certain estimates and assumptions at the date of the financial statements. Actual results could differ from those estimates. Subsequent events, if any, through the date that the financial statements were issued have been evaluated in the preparation of the financial statements. The Fund's Schedule of Investments lists any underlying mutual funds or exchange-traded funds (ETFs) but does not include the underlying holdings of these funds. The following summarizes the significant accounting policies of the Fund:
Investment Valuation. Investments are valued as of 4:00 p.m. Eastern time on the last calendar day of the period. The Board of Trustees (the Board) has designated the Fund's investment adviser as the valuation designee responsible for the fair valuation function and performing fair value determinations as needed. The investment adviser has established a Fair Value Committee (the Committee) to carry out the day-to-day fair valuation responsibilities and has adopted policies and procedures to govern the fair valuation process and the activities of the Committee. In accordance with these fair valuation policies and procedures, which have been approved by the Board, the Fund attempts to obtain prices from one or more third party pricing services or brokers to value its investments. When current market prices, quotations or currency exchange rates are not readily available or reliable, investments will be fair valued in good faith by the Committee, in accordance with the policies and procedures. Factors used in determining fair value vary by investment type and may include market or investment specific events, transaction data, estimated cash flows, and market observations of comparable investments. The frequency that the fair valuation procedures are used cannot be predicted and they may be utilized to a significant extent. The Committee manages the Fund's fair valuation practices and maintains the fair valuation policies and procedures. The Fund's investment adviser reports to the Board information regarding the fair valuation process and related material matters.
The Fund categorizes the inputs to valuation techniques used to value its investments into a disclosure hierarchy consisting of three levels as shown below:
Level 1 - unadjusted quoted prices in active markets for identical investments
Level 2 - other significant observable inputs (including quoted prices for similar investments, interest rates, prepayment speeds, etc.)
Level 3 - unobservable inputs (including the Fund's own assumptions based on the best information available)
Valuation techniques used to value the Fund's investments by major category are as follows:
Equity securities, including restricted securities, for which market quotations are readily available, are valued at the last reported sale price or official closing price as reported by a third party pricing service on the primary market or exchange on which they are traded and are categorized as Level 1 in the hierarchy. In the event there were no sales during the day or closing prices are not available, securities are valued at the last quoted bid price or may be valued using the last available price and are generally categorized as Level 2 in the hierarchy. For foreign equity securities, when market or security specific events arise, comparisons to the valuation of American Depositary Receipts (ADRs), futures contracts, ETFs and certain indexes as well as quoted prices for similar securities may be used and would be categorized as Level 2 in the hierarchy. For equity securities, including restricted securities, where observable inputs are limited, assumptions about market activity and risk are used and these securities may be categorized as Level 3 in the hierarchy.
Investments in open-end mutual funds, including the Fidelity Central Funds, are valued at their closing net asset value (NAV) each business day and are categorized as Level 1 in the hierarchy.
Fidelity Private Credit Central Fund LLC is valued at its net asset value (NAV) each month end and is categorized as Level 2 in the hierarchy.
Changes in valuation techniques may result in transfers in or out of an assigned level within the disclosure hierarchy. The aggregate value of investments by input level as of August 31, 2023 is included at the end of the Fund's Schedule of Investments.
Foreign Currency. Certain Funds may use foreign currency contracts to facilitate transactions in foreign-denominated securities. Gains and losses from these transactions may arise from changes in the value of the foreign currency or if the counterparties do not perform under the contracts' terms.
Foreign-denominated assets, including investment securities, and liabilities are translated into U.S. dollars at the exchange rates at period end. Purchases and sales of investment securities, income and dividends received, and expenses denominated in foreign currencies are translated into U.S. dollars at the exchange rate in effect on the transaction date.
The effects of exchange rate fluctuations on investments are included with the net realized and unrealized gain (loss) on investment securities. Other foreign currency transactions resulting in realized and unrealized gain (loss) are disclosed separately.
Investment Transactions and Income. For financial reporting purposes, the Fund's investment holdings and NAV include trades executed through the end of the last business day of the period. The NAV per share for processing shareholder transactions is calculated as of the close of business of the New York Stock Exchange (NYSE), normally 4:00 p.m. Eastern time and includes trades executed through the end of the prior business day. Gains and losses on securities sold are determined on the basis of identified cost and include proceeds received from litigation. Commissions paid to certain brokers with whom the investment adviser, or its affiliates, places trades on behalf of a fund include an amount in addition to trade execution, which may be rebated back to a fund. Any such rebates are included in net realized gain (loss) on investments in the Statement of Operations. Dividend income is recorded on the ex-dividend date, except for certain dividends from foreign securities where the ex-dividend date may have passed, which are recorded as soon as the Fund is informed of the ex-dividend date. Non-cash dividends included in dividend income, if any, are recorded at the fair market value of the securities received. Income and capital gain distributions from Fidelity Central Funds, if any, are recorded on the ex-dividend date. Certain distributions received by the Fund represent a return of capital or capital gain. The Fund determines the components of these distributions subsequent to the ex-dividend date, based upon receipt of tax filings or other correspondence relating to the underlying investment. These distributions are recorded as a reduction of cost of investments and/or as a realized gain. Investment income is recorded net of foreign taxes withheld where recovery of such taxes is uncertain. Debt obligations may be placed on non-accrual status and related interest income may be reduced by ceasing current accruals and writing off interest receivables when the collection of all or a portion of interest has become doubtful based on consistently applied procedures. A debt obligation is removed from non-accrual status when the issuer resumes interest payments or when collectability of interest is reasonably assured. Funds may file withholding tax reclaims in certain jurisdictions to recover a portion of amounts previously withheld. Any withholding tax reclaims income is included in the Statement of Operations in dividends. Any receivables for withholding tax reclaims are included in the Statement of Assets and Liabilities in dividends receivable.
Expenses. Expenses directly attributable to a fund are charged to that fund. Expenses attributable to more than one fund are allocated among the respective funds on the basis of relative net assets or other appropriate methods. Expenses included in the accompanying financial statements reflect the expenses of that fund and do not include any expenses associated with any underlying mutual funds or exchange-traded funds. Although not included in a fund's expenses, a fund indirectly bears its proportionate share of these expenses through the net asset value of each underlying mutual fund or exchange-traded fund. Expense estimates are accrued in the period to which they relate and adjustments are made when actual amounts are known.
Income Tax Information and Distributions to Shareholders. Each year, the Fund intends to qualify as a regulated investment company under Subchapter M of the Internal Revenue Code, including distributing substantially all of its taxable income and realized gains. As a result, no provision for U.S. Federal income taxes is required. As of August 31, 2023, the Fund did not have any unrecognized tax benefits in the financial statements; nor is the Fund aware of any tax positions for which it is reasonably possible that the total amounts of unrecognized tax benefits will significantly change in the next twelve months. The Fund files a U.S. federal tax return, in addition to state and local tax returns as required. The Fund's federal income tax returns are subject to examination by the Internal Revenue Service (IRS) for a period of three fiscal years after they are filed. State and local tax returns may be subject to examination for an additional fiscal year depending on the jurisdiction. Foreign taxes are provided for based on the Fund's understanding of the tax rules and rates that exist in the foreign markets in which it invests.
Distributions are declared and recorded on the ex-dividend date. Income and capital gain distributions are determined in accordance with income tax regulations, which may differ from GAAP.
Capital accounts within the financial statements are adjusted for permanent book-tax differences. These adjustments have no impact on net assets or the results of operations. Capital accounts are not adjusted for temporary book-tax differences which will reverse in a subsequent period.
Book-tax differences are primarily due to the short-term gain distributions from the underlying mutual funds or exchange-traded funds (ETFs), foreign currency transactions, capital loss carryforwards and losses deferred due to wash sales and excise tax regulations.
As of period end, the cost and unrealized appreciation (depreciation) in securities, and derivatives if applicable, for federal income tax purposes were as follows:
| Gross unrealized appreciation | $176,164,957 |
| Gross unrealized depreciation | (55,784,565) |
| Net unrealized appreciation (depreciation) | $120,380,392 |
| Tax Cost | $1,270,091,376 |
The tax-based components of distributable earnings as of period end were as follows:
| Undistributed ordinary income | $4,217,068 |
| Capital loss carryforward | $(27,396,104) |
| Net unrealized appreciation (depreciation) on securities and other investments | $120,380,408 |
Capital loss carryforwards are only available to offset future capital gains of the Fund to the extent provided by regulations and may be limited. The capital loss carryforward information presented below, including any applicable limitation, is estimated as of fiscal period end and is subject to adjustment.
Short-term | $(27,396,104) |
Long-term | (-) |
| Total capital loss carryforward | $(27,396,104) |
The tax character of distributions paid was as follows:
| | August 31, 2023 | August 31, 2022 |
| Ordinary Income | $17,241,436 | $10,863,052 |
| Long-term Capital Gains | - | 20,355,240 |
| Total | $17,241,436 | $31,218,292 |
Restricted Securities (including Private Placements). Funds may invest in securities that are subject to legal or contractual restrictions on resale. These securities generally may be resold in transactions exempt from registration or to the public if the securities are registered. Disposal of these securities may involve time-consuming negotiations and expense, and prompt sale at an acceptable price may be difficult. Information regarding restricted securities held at period end is included at the end of the Schedule of Investments, if applicable.
Commitments. A commitment is an agreement to acquire an investment at a future date (subject to conditions) in connection with a potential public or non-public offering. The amount of commitments outstanding at period end are presented in the table below. These commitments are not included in the net assets of the Fund at period end.
| | Investment to be Acquired | Commitment Amount |
| Fidelity Puritan K6 Fund | Fidelity Private Credit Central Fund LLC | $1,995,000 |
5. Derivative Instruments.
Risk Exposures and the Use of Derivative Instruments. The Fund's investment objectives allow for various types of derivative instruments, including options. Derivatives are investments whose value is primarily derived from underlying assets, indices or reference rates and may be transacted on an exchange or over-the-counter (OTC). Derivatives may involve a future commitment to buy or sell a specified asset based on specified terms, to exchange future cash flows at periodic intervals based on a notional principal amount, or for one party to make one or more payments upon the occurrence of specified events in exchange for periodic payments from the other party.
Derivatives were used to increase returns and to manage exposure to certain risks as defined below. The success of any strategy involving derivatives depends on analysis of numerous economic factors, and if the strategies for investment do not work as intended, the objectives may not be achieved.
Derivatives were used to increase or decrease exposure to the following risk(s):
| | |
| Equity Risk | Equity risk relates to the fluctuations in the value of financial instruments as a result of changes in market prices (other than those arising from interest rate risk or foreign exchange risk), whether caused by factors specific to an individual investment, its issuer, or all factors affecting all instruments traded in a market or market segment. |
Funds are also exposed to additional risks from investing in derivatives, such as liquidity risk and counterparty credit risk. Liquidity risk is the risk that a fund will be unable to close out the derivative in the open market in a timely manner. Counterparty credit risk is the risk that the counterparty will not be able to fulfill its obligation to a fund. Counterparty credit risk related to exchange-traded contracts may be mitigated by the protection provided by the exchange on which they trade.
Investing in derivatives may involve greater risks than investing in the underlying assets directly and, to varying degrees, may involve risk of loss in excess of any initial investment and collateral received and amounts recognized in the Statement of Assets and Liabilities. In addition, there may be the risk that the change in value of the derivative contract does not correspond to the change in value of the underlying instrument.
Options. Options give the purchaser the right, but not the obligation, to buy (call) or sell (put) an underlying security or financial instrument at an agreed exercise or strike price between or on certain dates. Options obligate the seller (writer) to buy (put) or sell (call) an underlying instrument at the exercise or strike price or cash settle an underlying derivative instrument if the holder exercises the option on or before the expiration date.
Exchange-traded written covered call options were used to manage exposure to the market. When a fund writes a covered call option, a fund holds the underlying instrument which must be delivered to the holder upon the exercise of the option.
Upon entering into a written options contract, a fund will receive a premium. Premiums received are reflected as a liability on the Statement of Assets and Liabilities. Options are valued daily and any unrealized appreciation (depreciation) is reflected in total accumulated earnings (loss) in the Statement of Assets and Liabilities. When a written option is exercised, the premium is added to the proceeds from the sale of the underlying instrument in determining the gain or loss realized on that investment. When an option is closed, a gain or loss is realized depending on whether the proceeds or amount paid for the closing sale transaction are greater or less than the premium received. When an option expires, gains and losses are realized to the extent of premiums received. The net realized gain (loss) on closed and expired written options and the change in net unrealized appreciation (depreciation) on written options are presented in the Statement of Operations.
Writing call options tends to decrease exposure to the underlying instrument and risk of loss is the change in value in excess of the premium received.
Any open options at period end are presented in the Schedule of Investments under the caption "Written Options", and are representative of volume of activity during the period unless an average contracts amount is presented.
6. Purchases and Sales of Investments.
Purchases and sales of securities, other than short-term securities and in-kind transactions, as applicable, are noted in the table below.
| | Purchases ($) | Sales ($) |
| Fidelity Puritan K6 Fund | 1,018,305,251 | 559,939,588 |
Unaffiliated Exchanges In-Kind. Shares that were exchanged for investments, including accrued interest and cash, if any, are shown in the table below. The amount of in-kind exchanges is included in share transactions in the accompanying Statement of Changes in Net Assets.
| | Shares | Total Proceeds ($) | |
| Fidelity Puritan K6 Fund | 1,245,767 | 15,422,345 | |
Prior Year Unaffiliated Exchanges In-Kind. Shares that were exchanged for investments, including accrued interest and cash, if any, are shown in the table below. The amount of in-kind exchanges is included in share transactions in the accompanying Statement of Changes in Net Assets.
| | Shares | Total Proceeds ($) | |
| Fidelity Puritan K6 Fund | 21,090,269 | 291,484,955 | |
7. Fees and Other Transactions with Affiliates.
Management Fee. Fidelity Management & Research Company LLC (the investment adviser) and its affiliates provide the Fund with investment management related services for which the Fund pays a monthly management fee that is based on an annual rate of .32% of average net assets. Under the management contract, the investment adviser or an affiliate pays all other expenses of the Fund, excluding fees and expenses of the independent Trustees, and certain miscellaneous expenses such as proxy and shareholder meeting expenses.
Brokerage Commissions. A portion of portfolio transactions were placed with brokerage firms which are affiliates of the investment adviser. Brokerage commissions are included in net realized gain (loss) and change in net unrealized appreciation (depreciation) in the Statement of Operations. The commissions paid to these affiliated firms were as follows:
| | Amount |
| Fidelity Puritan K6 Fund | $ 6,718 |
Interfund Trades. Funds may purchase from or sell securities to other Fidelity Funds under procedures adopted by the Board. The procedures have been designed to ensure these interfund trades are executed in accordance with Rule 17a-7 of the 1940 Act. Any interfund trades are included within the respective purchases and sales amounts shown in the Purchases and Sales of Investments note. Interfund trades during the period are noted in the table below.
| | Purchases ($) | Sales ($) | Realized Gain (Loss) ($) |
| Fidelity Puritan K6 Fund | 19,748,335 | 27,097,545 | (50,151) |
8. Committed Line of Credit.
Certain Funds participate with other funds managed by the investment adviser or an affiliate in a $4.25 billion credit facility (the "line of credit") to be utilized for temporary or emergency purposes to fund shareholder redemptions or for other short-term liquidity purposes. The commitment fees on the pro-rata portion of the line of credit are borne by the investment adviser. During the period, there were no borrowings on this line of credit.
9. Security Lending.
Funds lend portfolio securities from time to time in order to earn additional income. Lending agents are used, including National Financial Services (NFS), an affiliate of the investment adviser. Pursuant to a securities lending agreement, NFS will receive a fee, which is capped at 9.9% of a fund's daily lending revenue, for its services as lending agent. A fund may lend securities to certain qualified borrowers, including NFS. On the settlement date of the loan, a fund receives collateral (in the form of U.S. Treasury obligations, letters of credit and/or cash) against the loaned securities and maintains collateral in an amount not less than 100% of the market value of the loaned securities during the period of the loan. The market value of the loaned securities is determined at the close of business of a fund and any additional required collateral is delivered to a fund on the next business day. A fund or borrower may terminate the loan at any time, and if the borrower defaults on its obligation to return the securities loaned because of insolvency or other reasons, a fund may apply collateral received from the borrower against the obligation. A fund may experience delays and costs in recovering the securities loaned. Any cash collateral received is invested in the Fidelity Securities Lending Cash Central Fund. Any loaned securities are identified as such in the Schedule of Investments, and the value of loaned securities and cash collateral at period end, as applicable, are presented in the Statement of Assets and Liabilities. Security lending income represents the income earned on investing cash collateral, less rebates paid to borrowers and any lending agent fees associated with the loan, plus any premium payments received for lending certain types of securities. Security lending income is presented in the Statement of Operations as a component of income from Fidelity Central Funds. Affiliated security lending activity, if any, was as follows:
| | Total Security Lending Fees Paid to NFS | Security Lending Income From Securities Loaned to NFS | Value of Securities Loaned to NFS at Period End |
| Fidelity Puritan K6 Fund | $1,254 | $ 499 | $5,136 |
10. Expense Reductions.
The investment adviser has contractually agreed to waive the Fund's management fee with respect to the portion of the Fund's assets invested in Fidelity Private Credit Central Fund LLC until December 31, 2024. During the period, this waiver reduced the Fund's management fee by $65.
Through arrangements with the Fund's custodian, credits realized as a result of certain uninvested cash balances were used to reduce the Fund's expenses by $678.
In addition, during the period the investment adviser or an affiliate reimbursed and/or waived a portion of operating expenses in the amount of $3,000.
11. Other.
A fund's organizational documents provide former and current trustees and officers with a limited indemnification against liabilities arising in connection with the performance of their duties to the fund. In the normal course of business, a fund may also enter into contracts that provide general indemnifications. A fund's maximum exposure under these arrangements is unknown as this would be dependent on future claims that may be made against a fund. The risk of material loss from such claims is considered remote.
12. Risk and Uncertainties.
Many factors affect a fund's performance. Developments that disrupt global economies and financial markets, such as pandemics, epidemics, outbreaks of infectious diseases, war, terrorism, and environmental disasters, may significantly affect a fund's investment performance. The effects of these developments to a fund will be impacted by the types of securities in which a fund invests, the financial condition, industry, economic sector, and geographic location of an issuer, and a fund's level of investment in the securities of that issuer. Significant concentrations in security types, issuers, industries, sectors, and geographic locations may magnify the factors that affect a fund's performance.
To the Board of Trustees of Fidelity Puritan Trust and Shareholders of Fidelity Puritan K6 Fund
Opinion on the Financial Statements
We have audited the accompanying statement of assets and liabilities, including the schedule of investments, of Fidelity Puritan K6 Fund (one of the funds constituting Fidelity Puritan Trust, referred to hereafter as the "Fund") as of August 31, 2023, the related statement of operations for the year ended August 31, 2023, the statement of changes in net assets for each of the two years in the period ended August 31, 2023, including the related notes, and the financial highlights for each of the four years in the period ended August 31, 2023 and for the period June 14, 2019 (commencement of operations) through August 31, 2019 (collectively referred to as the "financial statements"). In our opinion, the financial statements present fairly, in all material respects, the financial position of the Fund as of August 31, 2023, the results of its operations for the year then ended, the changes in its net assets for each of the two years in the period ended August 31, 2023 and the financial highlights for each of the four years in the period ended August 31, 2023 and for the period June 14, 2019 (commencement of operations) through August 31, 2019 in conformity with accounting principles generally accepted in the United States of America.
Basis for Opinion
These financial statements are the responsibility of the Fund's management. Our responsibility is to express an opinion on the Fund's financial statements based on our audits. We are a public accounting firm registered with the Public Company Accounting Oversight Board (United States) (PCAOB) and are required to be independent with respect to the Fund in accordance with the U.S. federal securities laws and the applicable rules and regulations of the Securities and Exchange Commission and the PCAOB.
We conducted our audits of these financial statements in accordance with the standards of the PCAOB. Those standards require that we plan and perform the audit to obtain reasonable assurance about whether the financial statements are free of material misstatement, whether due to error or fraud.
Our audits included performing procedures to assess the risks of material misstatement of the financial statements, whether due to error or fraud, and performing procedures that respond to those risks. Such procedures included examining, on a test basis, evidence regarding the amounts and disclosures in the financial statements. Our audits also included evaluating the accounting principles used and significant estimates made by management, as well as evaluating the overall presentation of the financial statements. Our procedures included confirmation of securities owned as of August 31, 2023 by correspondence with the custodian, issuers of privately offered securities and brokers; when replies were not received from brokers, we performed other auditing procedures. We believe that our audits provide a reasonable basis for our opinion.
/s/ PricewaterhouseCoopers LLP
Boston, Massachusetts
October 13, 2023
We have served as the auditor of one or more investment companies in the Fidelity group of funds since 1932.
The Trustees, Members of the Advisory Board (if any), and officers of the trust and fund, as applicable, are listed below. The Board of Trustees governs the fund and is responsible for protecting the interests of shareholders. The Trustees are experienced executives who meet periodically throughout the year to oversee the fund's activities, review contractual arrangements with companies that provide services to the fund, oversee management of the risks associated with such activities and contractual arrangements, and review the fund's performance. Except for Jonathan Chiel, each of the Trustees oversees 322 funds. Mr. Chiel oversees 191 funds.
The Trustees hold office without limit in time except that (a) any Trustee may resign; (b) any Trustee may be removed by written instrument, signed by at least two-thirds of the number of Trustees prior to such removal; (c) any Trustee who requests to be retired or who has become incapacitated by illness or injury may be retired by written instrument signed by a majority of the other Trustees; and (d) any Trustee may be removed at any special meeting of shareholders by a two-thirds vote of the outstanding voting securities of the trust. Each Trustee who is not an interested person (as defined in the 1940 Act) of the trust and the fund is referred to herein as an Independent Trustee. Each Independent Trustee shall retire not later than the last day of the calendar year in which his or her 75th birthday occurs. The Independent Trustees may waive this mandatory retirement age policy with respect to individual Trustees. Officers and Advisory Board Members hold office without limit in time, except that any officer or Advisory Board Member may resign or may be removed by a vote of a majority of the Trustees at any regular meeting or any special meeting of the Trustees. Except as indicated, each individual has held the office shown or other offices in the same company for the past five years.
The fund's Statement of Additional Information (SAI) includes more information about the Trustees. To request a free copy, call Fidelity at 1-800-835-5092.
Experience, Skills, Attributes, and Qualifications of the Trustees. The Governance and Nominating Committee has adopted a statement of policy that describes the experience, qualifications, attributes, and skills that are necessary and desirable for potential Independent Trustee candidates (Statement of Policy). The Board believes that each Trustee satisfied at the time he or she was initially elected or appointed a Trustee, and continues to satisfy, the standards contemplated by the Statement of Policy. The Governance and Nominating Committee also engages professional search firms to help identify potential Independent Trustee candidates who have the experience, qualifications, attributes, and skills consistent with the Statement of Policy. From time to time, additional criteria based on the composition and skills of the current Independent Trustees, as well as experience or skills that may be appropriate in light of future changes to board composition, business conditions, and regulatory or other developments, have also been considered by the professional search firms and the Governance and Nominating Committee. In addition, the Board takes into account the Trustees' commitment and participation in Board and committee meetings, as well as their leadership of standing and ad hoc committees throughout their tenure.
In determining that a particular Trustee was and continues to be qualified to serve as a Trustee, the Board has considered a variety of criteria, none of which, in isolation, was controlling. The Board believes that, collectively, the Trustees have balanced and diverse experience, qualifications, attributes, and skills, which allow the Board to operate effectively in governing the fund and protecting the interests of shareholders. Information about the specific experience, skills, attributes, and qualifications of each Trustee, which in each case led to the Board's conclusion that the Trustee should serve (or continue to serve) as a trustee of the fund, is provided below.
Board Structure and Oversight Function. Robert A. Lawrence is an interested person and currently serves as Chair. The Trustees have determined that an interested Chair is appropriate and benefits shareholders because an interested Chair has a personal and professional stake in the quality and continuity of services provided to the fund. Independent Trustees exercise their informed business judgment to appoint an individual of their choosing to serve as Chair, regardless of whether the Trustee happens to be independent or a member of management. The Independent Trustees have determined that they can act independently and effectively without having an Independent Trustee serve as Chair and that a key structural component for assuring that they are in a position to do so is for the Independent Trustees to constitute a substantial majority for the Board. The Independent Trustees also regularly meet in executive session. David M. Thomas serves as Lead Independent Trustee and as such (i) acts as a liaison between the Independent Trustees and management with respect to matters important to the Independent Trustees and (ii) with management prepares agendas for Board meetings.
Fidelity® funds are overseen by different Boards of Trustees. The fund's Board oversees Fidelity's high income and certain equity funds, and other Boards oversee Fidelity's alternative investment, investment-grade bond, money market, asset allocation, and other equity funds. The asset allocation funds may invest in Fidelity® funds overseen by the fund's Board. The use of separate Boards, each with its own committee structure, allows the Trustees of each group of Fidelity® funds to focus on the unique issues of the funds they oversee, including common research, investment, and operational issues. On occasion, the separate Boards establish joint committees to address issues of overlapping consequences for the Fidelity® funds overseen by each Board.
The Trustees operate using a system of committees to facilitate the timely and efficient consideration of all matters of importance to the Trustees, the fund, and fund shareholders and to facilitate compliance with legal and regulatory requirements and oversight of the fund's activities and associated risks. The Board, acting through its committees, has charged FMR and its affiliates with (i) identifying events or circumstances the occurrence of which could have demonstrably adverse effects on the fund's business and/or reputation; (ii) implementing processes and controls to lessen the possibility that such events or circumstances occur or to mitigate the effects of such events or circumstances if they do occur; and (iii) creating and maintaining a system designed to evaluate continuously business and market conditions in order to facilitate the identification and implementation processes described in (i) and (ii) above. Because the day-to-day operations and activities of the fund are carried out by or through FMR, its affiliates, and other service providers, the fund's exposure to risks is mitigated but not eliminated by the processes overseen by the Trustees. While each of the Board's committees has responsibility for overseeing different aspects of the fund's activities, oversight is exercised primarily through the Operations, Audit, and Compliance Committees. Appropriate personnel, including but not limited to the fund's Chief Compliance Officer (CCO), FMR's internal auditor, the independent accountants, the fund's Treasurer and portfolio management personnel, make periodic reports to the Board's committees, as appropriate, including an annual review of Fidelity's risk management program for the Fidelity® funds. The responsibilities of each standing committee, including their oversight responsibilities, are described further under "Standing Committees of the Trustees."
Interested Trustees*:
Correspondence intended for a Trustee who is an interested person may be sent to Fidelity Investments, 245 Summer Street, Boston, Massachusetts 02210.
Name, Year of Birth; Principal Occupations and Other Relevant Experience+
Jonathan Chiel (1957)
Year of Election or Appointment: 2016
Trustee
Mr. Chiel also serves as Trustee of other Fidelity® funds. Mr. Chiel is Executive Vice President and General Counsel for FMR LLC (diversified financial services company, 2012-present). Previously, Mr. Chiel served as general counsel (2004-2012) and senior vice president and deputy general counsel (2000-2004) for John Hancock Financial Services; a partner with Choate, Hall & Stewart (1996-2000) (law firm); and an Assistant United States Attorney for the United States Attorney's Office of the District of Massachusetts (1986-95), including Chief of the Criminal Division (1993-1995). Mr. Chiel is a director on the boards of the Boston Bar Foundation and the Maimonides School.
Bettina Doulton (1964)
Year of Election or Appointment: 2021
Trustee
Ms. Doulton also serves as Trustee of other Fidelity® funds. Prior to her retirement, Ms. Doulton served in a variety of positions at Fidelity Investments, including as a managing director of research (2006-2007), portfolio manager to certain Fidelity® funds (1993-2005), equity analyst and portfolio assistant (1990-1993), and research assistant (1987-1990). Ms. Doulton currently owns and operates Phi Builders + Architects and Cellardoor Winery. Previously, Ms. Doulton served as a member of the Board of Brown Capital Management, LLC (2014-2018).
Robert A. Lawrence (1952)
Year of Election or Appointment: 2020
Trustee
Chair of the Board of Trustees
Mr. Lawrence also serves as Trustee of other funds. Previously, Mr. Lawrence served as a Trustee and Member of the Advisory Board of certain funds. Prior to his retirement in 2008, Mr. Lawrence served as Vice President of certain Fidelity® funds (2006-2008), Senior Vice President, Head of High Income Division of Fidelity Management & Research Company (investment adviser firm, 2006-2008), and President of Fidelity Strategic Investments (investment adviser firm, 2002-2005).
* Determined to be an "Interested Trustee" by virtue of, among other things, his or her affiliation with the trust or various entities under common control with FMR.
+ The information includes the Trustee's principal occupation during the last five years and other information relating to the experience, attributes, and skills relevant to the Trustee's qualifications to serve as a Trustee, which led to the conclusion that the Trustee should serve as a Trustee for the fund.
Independent Trustees:
Correspondence intended for an Independent Trustee may be sent to Fidelity Investments, P.O. Box 55235, Boston, Massachusetts 02205-5235.
Name, Year of Birth; Principal Occupations and Other Relevant Experience+
Thomas P. Bostick (1956)
Year of Election or Appointment: 2021
Trustee
Lieutenant General Bostick also serves as Trustee of other Fidelity® funds. Prior to his retirement, General Bostick (United States Army, Retired) held a variety of positions within the U.S. Army, including Commanding General and Chief of Engineers, U.S. Army Corps of Engineers (2012-2016) and Deputy Chief of Staff and Director of Human Resources, U.S. Army (2009-2012). General Bostick currently serves as a member of the Board and Finance and Governance & Sustainability Committees of CSX Corporation (transportation, 2020-present) and a member of the Board and Corporate Governance and Nominating Committee of Perma-Fix Environmental Services, Inc. (nuclear waste management, 2020-present). General Bostick serves as Chief Executive Officer of Bostick Global Strategies, LLC (consulting, 2016-present), as a member of the Board of HireVue, Inc. (video interview and assessment, 2020-present), as a member of the Board of Allonnia (biotechnology and engineering solutions, 2022-present) and on the Advisory Board of Solugen, Inc. (specialty bio-based chemicals manufacturer, 2022-present). Previously, General Bostick served as a Member of the Advisory Board of certain Fidelity® funds (2021), President, Intrexon Bioengineering (2018-2020) and Chief Operating Officer (2017-2020) and Senior Vice President of the Environment Sector (2016-2017) of Intrexon Corporation (biopharmaceutical company).
Dennis J. Dirks (1948)
Year of Election or Appointment: 2005
Trustee
Mr. Dirks also serves as Trustee of other Fidelity® funds. Prior to his retirement in May 2003, Mr. Dirks served as Chief Operating Officer and as a member of the Board of The Depository Trust & Clearing Corporation (financial markets infrastructure), President, Chief Operating Officer and a member of the Board of The Depository Trust Company (DTC), President and a member of the Board of the National Securities Clearing Corporation (NSCC), Chief Executive Officer and a member of the Board of the Government Securities Clearing Corporation and Chief Executive Officer and a member of the Board of the Mortgage-Backed Securities Clearing Corporation. Mr. Dirks currently serves as a member of the Finance Committee (2016-present) and Board (2017-present) and is Treasurer (2018-present) of the Asolo Repertory Theatre.
Donald F. Donahue (1950)
Year of Election or Appointment: 2018
Trustee
Mr. Donahue also serves as Trustee of other Fidelity® funds. Mr. Donahue serves as President and Chief Executive Officer of Miranda Partners, LLC (risk consulting for the financial services industry, 2012-present). Previously, Mr. Donahue served as Chief Executive Officer (2006-2012), Chief Operating Officer (2003-2006) and Managing Director, Customer Marketing and Development (1999-2003) of The Depository Trust & Clearing Corporation (financial markets infrastructure). Mr. Donahue currently serves as a member (2007-present) and Co-Chairman (2016-present) of the Board of United Way of New York. Mr. Donahue previously served as a member of the Advisory Board of certain Fidelity® funds (2015-2018) and as a member of the Board of The Leadership Academy (previously NYC Leadership Academy) (2012-2022).
Vicki L. Fuller (1957)
Year of Election or Appointment: 2020
Trustee
Ms. Fuller also serves as Trustee of other Fidelity® funds. Previously, Ms. Fuller served as a member of the Advisory Board of certain Fidelity® funds (2018-2020), Chief Investment Officer of the New York State Common Retirement Fund (2012-2018) and held a variety of positions at AllianceBernstein L.P. (global asset management, 1985-2012), including Managing Director (2006-2012) and Senior Vice President and Senior Portfolio Manager (2001-2006). Ms. Fuller currently serves as a member of the Board, Audit Committee and Nominating and Governance Committee of two Blackstone business development companies (2020-present), as a member of the Board of Treliant, LLC (consulting, 2019-present), as a member of the Board of Ariel Alternatives, LLC (private equity, 2022-present) and as a member of the Board and Chair of the Audit Committee of Gusto, Inc. (software, 2021-present). In addition, Ms. Fuller currently serves as a member of the Board of Roosevelt University (2019-present) and as a member of the Executive Board of New York University's Stern School of Business. Ms. Fuller previously served as a member of the Board, Audit Committee and Nominating and Governance Committee of The Williams Companies, Inc. (natural gas infrastructure, 2018-2021).
Patricia L. Kampling (1959)
Year of Election or Appointment: 2020
Trustee
Ms. Kampling also serves as Trustee of other Fidelity® funds. Prior to her retirement, Ms. Kampling served as Chairman of the Board and Chief Executive Officer (2012-2019), President and Chief Operating Officer (2011-2012) and Executive Vice President and Chief Financial Officer (2010-2011) of Alliant Energy Corporation. Ms. Kampling currently serves as a member of the Board, Finance Committee and Governance, Compensation and Nominating Committee of Xcel Energy Inc. (utilities company, 2020-present) and as a member of the Board, Audit, Finance and Risk Committee and Safety, Environmental, Technology and Operations Committee and Chair of the Executive Development and Compensation Committee of American Water Works Company, Inc. (utilities company, 2019-present). In addition, Ms. Kampling currently serves as a member of the Board of the Nature Conservancy, Wisconsin Chapter (2019-present). Previously, Ms. Kampling served as a Member of the Advisory Board of certain Fidelity® funds (2020), a member of the Board, Compensation Committee and Executive Committee and Chair of the Audit Committee of Briggs & Stratton Corporation (manufacturing, 2011-2021), a member of the Board of Interstate Power and Light Company (2012-2019) and Wisconsin Power and Light Company (2012-2019) (each a subsidiary of Alliant Energy Corporation) and as a member of the Board and Workforce Development Committee of the Business Roundtable (2018-2019).
Thomas A. Kennedy (1955)
Year of Election or Appointment: 2021
Trustee
Mr. Kennedy also serves as Trustee of other Fidelity® funds. Previously, Mr. Kennedy served as a Member of the Advisory Board of certain Fidelity® funds (2020) and held a variety of positions at Raytheon Company (aerospace and defense, 1983-2020), including Chairman and Chief Executive Officer (2014-2020) and Executive Vice President and Chief Operating Officer (2013-2014). Mr. Kennedy served as Executive Chairman of the Board of Directors of Raytheon Technologies Corporation (aerospace and defense, 2020-2021). Mr. Kennedy serves as a Director of the Board of Directors of Textron Inc. (aerospace and defense, 2023-present).
Oscar Munoz (1959)
Year of Election or Appointment: 2021
Trustee
Mr. Munoz also serves as Trustee of other Fidelity® funds. Prior to his retirement, Mr. Munoz served as Executive Chairman (2020-2021), Chief Executive Officer (2015-2020), President (2015-2016) and a member of the Board (2010-2021) of United Airlines Holdings, Inc. Mr. Munoz currently serves as a member of the Board of CBRE Group, Inc. (commercial real estate, 2020-present), a member of the Board of Univision Communications, Inc. (Hispanic media, 2020-present), a member of the Board of Archer Aviation Inc. (2021-present), a member of the Defense Business Board of the United States Department of Defense (2021-present) and a member of the Board of Salesforce.com, Inc. (cloud-based software, 2022-present). Previously, Mr. Munoz served as a Member of the Advisory Board of certain Fidelity® funds (2021).
David M. Thomas (1949)
Year of Election or Appointment: 2008
Trustee
Lead Independent Trustee
Mr. Thomas also serves as Trustee of other Fidelity® funds. Previously, Mr. Thomas served as Executive Chairman (2005-2006) and Chairman and Chief Executive Officer (2000-2005) of IMS Health, Inc. (pharmaceutical and healthcare information solutions). Mr. Thomas currently serves as a member of the Board of Fortune Brands Home and Security (home and security products, 2004-present) and as Director (2013-present) and Non-Executive Chairman of the Board (2022-present) of Interpublic Group of Companies, Inc. (marketing communication).
Susan Tomasky (1953)
Year of Election or Appointment: 2020
Trustee
Ms. Tomasky also serves as Trustee of other Fidelity® funds. Prior to her retirement, Ms. Tomasky served in various executive officer positions at American Electric Power Company, Inc. (1998-2011), including most recently as President of AEP Transmission (2007-2011). Ms. Tomasky currently serves as a member of the Board and Sustainability Committee and as Chair of the Audit Committee of Marathon Petroleum Corporation (2018-present) and as a member of the Board, Executive Committee, Corporate Governance Committee and Organization and Compensation Committee and as Lead Director of the Board of Public Service Enterprise Group, Inc. (utilities company, 2012-present) and as a member of the Board of its subsidiary company, Public Service Electric and Gas Co. (2021-present). In addition, Ms. Tomasky currently serves as a member (2009-present) and President (2020-present) of the Board of the Royal Shakespeare Company - America (2009-present), as a member of the Board of the Columbus Association for the Performing Arts (2011-present) and as a member of the Board and Kenyon in the World Committee of Kenyon College (2016-present). Previously, Ms. Tomasky served as a Member of the Advisory Board of certain Fidelity® funds (2020), as a member of the Board of the Columbus Regional Airport Authority (2007-2020), as a member of the Board (2011-2018) and Lead Independent Director (2015-2018) of Andeavor Corporation (previously Tesoro Corporation) (independent oil refiner and marketer) and as a member of the Board of Summit Midstream Partners LP (energy, 2012-2018).
Michael E. Wiley (1950)
Year of Election or Appointment: 2020
Trustee
Mr. Wiley also serves as Trustee of other Fidelity® funds. Previously, Mr. Wiley served as a member of the Advisory Board of certain Fidelity® funds (2018-2020), Chairman, President and CEO of Baker Hughes, Inc. (oilfield services, 2000-2004). Mr. Wiley also previously served as a member of the Board of Andeavor Corporation (independent oil refiner and marketer, 2005-2018), a member of the Board of Andeavor Logistics LP (natural resources logistics, 2015-2018) and a member of the Board of High Point Resources (exploration and production, 2005-2020).
+ The information includes the Trustee's principal occupation during the last five years and other information relating to the experience, attributes, and skills relevant to the Trustee's qualifications to serve as a Trustee, which led to the conclusion that the Trustee should serve as a Trustee for the fund.
Advisory Board Members and Officers:
Correspondence intended for a Member of the Advisory Board (if any) may be sent to Fidelity Investments, P.O. Box 55235, Boston, Massachusetts 02205-5235. Correspondence intended for an officer or Peter S. Lynch may be sent to Fidelity Investments, 245 Summer Street, Boston, Massachusetts 02210. Officers appear below in alphabetical order.
Name, Year of Birth; Principal Occupation
Vijay C. Advani (1960)
Year of Election or Appointment: 2023
Member of the Advisory Board
Mr. Advani also serves as Trustee or Member of the Advisory Board of other funds. Previously, Mr. Advani served as Executive Chairman (2020-2022), Chief Executive Officer (2017-2020) and Chief Operating Officer (2016-2017) of Nuveen (global investment manager). He also served in various capacities at Franklin Resources (global investment manager), including Co-President (2015-2016), Executive Vice President, Global Advisory Services (2008-2015), Head of Global Retail Distribution (2005-2008), Executive Managing Director, International Retail Development (2002-2005), Managing Director, Product Developments, Sales & Marketing, Asia, Eastern Europe and Africa (2000-2002) and President, Templeton Asset Management India (1995-2000). Mr. Advani also served as Senior Investment Officer of International Finance Corporation (private equity and venture capital arm of The World Bank, 1984-1995). Mr. Advani is Chairman Emeritus of the U.S. India Business Council (2018-present), a Director of The Global Impact Investing Network (2019-present), a Director of LOK Capital (Mauritius) (2022-present), a member of the Advisory Council of LOK Capital (2022-present), a Senior Advisor of Neuberger Berman (2021-present), a Senior Advisor of Seviora Holdings Pte. Ltd (Temasek-Singapore) (2021-present), a Director of Seviora Capital (Singapore) (2021-present) and an Advisor of EQUIAM (2021-present). Mr. Advani formerly served as a member of the Board of BowX Acquisition Corp. (special purpose acquisition company, 2020-2021), a member of the Board of Intellecap (advisory arm of The Aavishkaar Group, 2018-2020), a member of the Board of Nuveen Investments, Inc. (2017-2020) and a member of the Board of Docusign (software, 2016-2019).
Peter S. Lynch (1944)
Year of Election or Appointment: 2003
Member of the Advisory Board
Mr. Lynch also serves as a Member of the Advisory Board of other Fidelity® funds. Mr. Lynch is Vice Chairman and a Director of Fidelity Management & Research Company LLC (investment adviser firm). In addition, Mr. Lynch serves as a Trustee of Boston College and as the Chairman of the Inner-City Scholarship Fund. Previously, Mr. Lynch served as Vice Chairman and a Director of FMR Co., Inc. (investment adviser firm) and on the Special Olympics International Board of Directors (1997-2006).
Karen B. Peetz (1955)
Year of Election or Appointment: 2023
Member of the Advisory Board
Ms. Peetz also serves as a Member of the Advisory Board of other funds. Previously, Ms. Peetz served as Chief Administration Officer (2020-2023) of Citigroup Inc. (a diversified financial service company). She also served in various capacities at Bank of New York Mellon Corporation, including President (2013-2016), Vice Chairman, Senior Executive Vice President and Chief Executive Officer of Financial Markets & Treasury Services (2010-2013), Senior Executive Vice President and Chief Executive Officer of Global Corporate Trust (2003-2008), Senior Vice President and Division Manager of Global Payments & Trade Services (2002-2003) and Senior Vice President and Division Manager of Domestic Corporate Trust (1998-2002). Ms. Peetz also served in various capacities at Chase Manhattan Corporation (1982-1998), including Senior Vice President and Manager of Corporate Trust International Business (1996-1998), Managing Director and Manager of Corporate Trust Services (1994-1996) and Managing Director and Group Manager of Financial Institution Sales (1990-1993). Ms. Peetz currently serves as Chair of Amherst Holdings Advisory Council (2018-present), Trustee of Johns Hopkins University (2016-present), Chair of the Carey Business School Advisory Council, Member of the Johns Hopkins Medicine Board and Finance Committee and Chair of the Lyme and Tick Related Disease Institute Advisory Council. Ms. Peetz previously served as a member of the Board of Guardian Life Insurance Company of America (2019-2023), a member of the Board of Trane Technologies (2018-2022), a member of the Board of Wells Fargo Corp. (2017-2019), a member of the Board of SunCoke Energy Inc. (2012-2016), a member of the Board of Private Export Funding Corporation (2010-2016) and as a Trustee of Penn State University (2010-2014) and the United Way of New York City (2008-2010).
Heather Bonner (1977)
Year of Election or Appointment: 2023
Assistant Treasurer
Ms. Bonner also serves as an officer of other funds. Ms. Bonner serves as Senior Vice President (2022-present), and is an employee of Fidelity Investments. Ms. Bonner serves as Assistant Treasurer of Fidelity CRET Trustee LLC (2022-present). Prior to joining Fidelity, Ms. Bonner served as Managing Director at AQR Capital Management (2013-2022) and was the Treasurer and Principal Financial Officer of the AQR Funds (2013-2022).
Craig S. Brown (1977)
Year of Election or Appointment: 2022
Deputy Treasurer
Mr. Brown also serves as an officer of other funds. Mr. Brown serves as Assistant Treasurer of FIMM, LLC (2021-present) and is an employee of Fidelity Investments (2013-present). Previously, Mr. Brown served as Assistant Treasurer of certain Fidelity® funds (2019-2022).
John J. Burke III (1964)
Year of Election or Appointment: 2018
Chief Financial Officer
Mr. Burke also serves as Chief Financial Officer of other funds. Mr. Burke serves as Head of Investment Operations for Fidelity Fund and Investment Operations (2018-present) and is an employee of Fidelity Investments (1998-present). Previously Mr. Burke served as head of Asset Management Investment Operations (2012-2018).
Margaret Carey (1973)
Year of Election or Appointment: 2023
Secretary and Chief Legal Officer (CLO)
Ms. Carey also serves as an officer of other funds and as CLO of certain other Fidelity entities. She is a Senior Vice President and Deputy General Counsel of FMR LLC (diversified financial services company, 2019-present), and is an employee of Fidelity Investments.
William C. Coffey (1969)
Year of Election or Appointment: 2019
Assistant Secretary
Mr. Coffey also serves as Assistant Secretary of other funds. He is Senior Vice President and Deputy General Counsel of FMR LLC (diversified financial services company, 2010-present), and is an employee of Fidelity Investments. Previously, Mr. Coffey served as Secretary and CLO of certain funds (2018-2019); CLO, Secretary, and Senior Vice President of Fidelity Management & Research Company and FMR Co., Inc. (investment adviser firms, 2018-2019); Secretary of Fidelity SelectCo, LLC and Fidelity Investments Money Management, Inc. (investment adviser firms, 2018-2019); CLO of Fidelity Management & Research (Hong Kong) Limited, FMR Investment Management (UK) Limited, and Fidelity Management & Research (Japan) Limited (investment adviser firms, 2018-2019); and Assistant Secretary of certain funds (2009-2018).
Timothy M. Cohen (1969)
Year of Election or Appointment: 2018
Vice President
Mr. Cohen also serves as Vice President of other funds. Mr. Cohen serves as Co-Head of Equity (2018-present), a Director of Fidelity Management & Research (Japan) Limited (investment adviser firm, 2016-present), and is an employee of Fidelity Investments. Previously, Mr. Cohen served as Executive Vice President of Fidelity SelectCo, LLC (2019), Head of Global Equity Research (2016-2018), Chief Investment Officer - Equity and a Director of Fidelity Management & Research (U.K.) Inc. (investment adviser firm, 2013-2015) and as a Director of Fidelity Management & Research (Hong Kong) Limited (investment adviser firm, 2017).
Jonathan Davis (1968)
Year of Election or Appointment: 2010
Assistant Treasurer
Mr. Davis also serves as an officer of other funds. Mr. Davis serves as Vice President Assistant Treasurer and is an employee of Fidelity Investments. Mr. Davis serves as Assistant Treasurer of certain Fidelity entities.
Laura M. Del Prato (1964)
Year of Election or Appointment: 2018
Assistant Treasurer
Ms. Del Prato also serves as an officer of other funds. Ms. Del Prato serves as Assistant Treasurer of FIMM, LLC (2021-present) and is an employee of Fidelity Investments (2017-present). Previously, Ms. Del Prato served as President and Treasurer of The North Carolina Capital Management Trust: Cash Portfolio and Term Portfolio (2018-2020). Prior to joining Fidelity Investments, Ms. Del Prato served as a Managing Director and Treasurer of the JPMorgan Mutual Funds (2014-2017). Prior to JPMorgan, Ms. Del Prato served as a partner at Cohen Fund Audit Services (accounting firm, 2012-2013) and KPMG LLP (accounting firm, 2004-2012).
Colm A. Hogan (1973)
Year of Election or Appointment: 2020
Assistant Treasurer
Mr. Hogan also serves as an officer of other funds. Mr. Hogan serves as Assistant Treasurer of FIMM, LLC (2021-present) and FMR Capital, Inc. (2017-present) and is an employee of Fidelity Investments (2005-present). Previously, Mr. Hogan served as Deputy Treasurer of certain Fidelity® funds (2016-2020) and Assistant Treasurer of certain Fidelity® funds (2016-2018).
Pamela R. Holding (1964)
Year of Election or Appointment: 2018
Vice President
Ms. Holding also serves as Vice President of other funds. Ms. Holding serves as Co-Head of Equity (2018-present) and is an employee of Fidelity Investments (2013-present). Previously, Ms. Holding served as Executive Vice President of Fidelity SelectCo, LLC (2019) and as Chief Investment Officer of Fidelity Institutional Asset Management (2013-2018).
Chris Maher (1972)
Year of Election or Appointment: 2020
Deputy Treasurer
Mr. Maher also serves as an officer of other funds. Mr. Maher serves as Assistant Treasurer of FIMM, LLC (2021-present) and FMR Capital, Inc. (2017-present), and is an employee of Fidelity Investments (2008-present). Previously, Mr. Maher served as Assistant Treasurer of certain funds (2013-2020); Vice President of Asset Management Compliance (2013), Vice President of the Program Management Group of FMR (investment adviser firm, 2010-2013), and Vice President of Valuation Oversight (2008-2010).
Jason P. Pogorelec (1975)
Year of Election or Appointment: 2020
Chief Compliance Officer
Mr. Pogorelec also serves as Chief Compliance Officer of other funds. Mr. Pogorelec is a Senior Vice President of Asset Management Compliance for Fidelity Investments and is an employee of Fidelity Investments. Mr. Pogorelec serves as Compliance Officer of Fidelity Management & Research Company LLC (investment adviser firm, 2023-present). Previously, Mr. Pogorelec served as Vice President, Associate General Counsel for Fidelity Investments (2010-2020) and Assistant Secretary of certain Fidelity® funds (2015-2020).
Brett Segaloff (1972)
Year of Election or Appointment: 2021
Anti-Money Laundering (AML) Officer
Mr. Segaloff also serves as an AML Officer of other funds and other related entities. He is Director, Anti-Money Laundering (2007-present) of FMR LLC (diversified financial services company) and is an employee of Fidelity Investments (1996-present).
Stacie M. Smith (1974)
Year of Election or Appointment: 2016
President and Treasurer
Ms. Smith also serves as an officer of other funds. Ms. Smith serves as Assistant Treasurer of certain Fidelity entities, is an employee of Fidelity Investments, and has served in other fund officer roles.
Jim Wegmann (1979)
Year of Election or Appointment: 2019
Assistant Treasurer
Mr. Wegmann also serves as an officer of other funds. Mr. Wegmann serves as Assistant Treasurer of FIMM, LLC (2021-present) and is an employee of Fidelity Investments (2011-present). Previously, Mr. Wegmann served as Assistant Treasurer of certain Fidelity® funds (2019-2021).
As a shareholder, you incur two types of costs: (1) transaction costs, which may include sales charges (loads) on purchase payments or redemption proceeds, as applicable and (2) ongoing costs, which generally include management fees, distribution and/or service (12b-1) fees and other Fund expenses. This Example is intended to help you understand your ongoing costs (in dollars) of investing in a fund and to compare these costs with the ongoing costs of investing in other mutual funds.
| The Example is based on an investment of $1,000 invested at the beginning of the period and held for the entire period (March 1, 2023 to August 31, 2023). |
Actual Expenses
The first line of the accompanying table provides information about actual account values and actual expenses. You may use the information in this line, together with the amount you invested, to estimate the expenses that you paid over the period. Simply divide your account value by $1,000.00 (for example, an $8,600 account value divided by $1,000.00 = 8.6), then multiply the result by the number in the first line for a class/Fund under the heading entitled "Expenses Paid During Period" to estimate the expenses you paid on your account during this period. If any fund is a shareholder of any underlying mutual funds or exchange-traded funds (ETFs) (the Underlying Funds), such fund indirectly bears its proportional share of the expenses of the Underlying Funds in addition to the direct expenses incurred presented in the table. These fees and expenses are not included in the annualized expense ratio used to calculate the expense estimate in the table below.
Hypothetical Example for Comparison Purposes
The second line of the accompanying table provides information about hypothetical account values and hypothetical expenses based on the actual expense ratio and an assumed rate of return of 5% per year before expenses, which is not the actual return. The hypothetical account values and expenses may not be used to estimate the actual ending account balance or expenses you paid for the period. You may use this information to compare the ongoing costs of investing in the Fund and other funds. To do so, compare this 5% hypothetical example with the 5% hypothetical examples that appear in the shareholder reports of the other funds. If any fund is a shareholder of any Underlying Funds, such fund indirectly bears its proportional share of the expenses of the Underlying Funds in addition to the direct expenses as presented in the table. These fees and expenses are not included in the annualized expense ratio used to calculate the expense estimate in the table below.
Please note that the expenses shown in the table are meant to highlight your ongoing costs only and do not reflect any transaction costs. Therefore, the second line of the table is useful in comparing ongoing costs only, and will not help you determine the relative total costs of owning different funds. In addition, if these transactional costs were included, your costs would have been higher.
| | | | | Annualized Expense Ratio- A | | Beginning Account Value March 1, 2023 | | Ending Account Value August 31, 2023 | | Expenses Paid During Period- C March 1, 2023 to August 31, 2023 |
| | | | | | | | | | |
| Fidelity® Puritan® K6 Fund | | | | .32% | | | | | | |
| Actual | | | | | | $ 1,000 | | $ 1,110.60 | | $ 1.70 |
Hypothetical-B | | | | | | $ 1,000 | | $ 1,023.59 | | $ 1.63 |
| |
A Annualized expense ratio reflects expenses net of applicable fee waivers.
B 5% return per year before expenses
C Expenses are equal to the annualized expense ratio, multiplied by the average account value over the period, multiplied by 184/ 365 (to reflect the one-half year period). The fees and expenses of any Underlying Funds are not included in each annualized expense ratio.
The dividend and capital gains distributions for the fund(s) are available on Fidelity.com or Institutional.Fidelity.com.
A total of 13.97% of the dividends distributed during the fiscal year was derived from interest on U.S. Government securities which is generally exempt from state income tax.
The fund designates $9,191,231 of distributions paid during the fiscal year ended 2023 as qualifying to be taxed as section 163(j) interest dividends.
The fund designates 15%, 46%, 35%, and 35% of the dividends distributed in October, December, April, and July, respectively during the fiscal year as qualifying for the dividends-received deduction for corporate shareholders.
The fund designates 13.70%, 41.42%, 44.62%, and 44.62% of the dividends distributed in October, December, April, and July, respectively during the fiscal year as amounts which may be taken into account as a dividend for the purposes of the maximum rate under section 1(h)(11) of the Internal Revenue Code.
The fund designates 0.27% and 0.80% of the dividends distributed in October and December, respectively during the fiscal year as a section 199A dividend.
The fund will notify shareholders in January 2024 of amounts for use in preparing 2023 income tax returns.
Board Approval of Investment Advisory Contracts and Management Fees
Fidelity Puritan K6 Fund
Each year, the Board of Trustees, including the Independent Trustees (together, the Board), considers the renewal of the fund's management contract with Fidelity Management & Research Company LLC (FMR) and the sub-advisory agreements (together, the Advisory Contracts) for the fund. FMR and the sub-advisers are referred to herein as the Investment Advisers. The Board, assisted by the advice of fund counsel and Independent Trustees' counsel, requests and considers a broad range of information relevant to the renewal of the Advisory Contracts throughout the year.
The Board meets regularly and, at each of its meetings, covers an extensive agenda of topics and materials and considers factors that are relevant to its annual consideration of the renewal of the fund's Advisory Contracts, including the services and support provided to the fund and its shareholders. The Board, acting directly and through its Committees (each of which is composed of and chaired by Independent Trustees), requests and receives information concerning the annual consideration of the renewal of the fund's Advisory Contracts. The Board also meets as needed to review matters specifically related to the Board's annual consideration of the renewal of the Advisory Contracts. Members of the Board may also meet with trustees of other Fidelity funds through joint ad hoc committees to discuss certain matters relevant to all of the Fidelity funds.
Approval of Stub Period Continuation. At its May 2023 meeting, the Board of Trustees voted to continue the fund's management contract with FMR, and the sub-advisory agreements and sub-sub-advisory agreements, in each case, where applicable (together, the Advisory Contracts), without modification, for two months from June 1, 2023 through July 31, 2023. The Board considered that the approval of the fund's Advisory Contracts will not result in any changes in (i) the investment process or strategies employed in the management of the fund's assets; (ii) the fees and expenses paid by shareholders; (iii) the nature, extent or quality of services provided under the fund's Advisory Contracts; or (iv) the day-to-day management of the fund or the persons primarily responsible for such management. The Board also considered that since its last approval of the fund's Advisory Contracts, FMR had provided additional information on the fund in support of the annual contract renewal process, including competitive analyses on total expenses and management fees and in-depth reviews of fund performance and fund profitability information. The Board concluded that the fund's Advisory Contracts are fair and reasonable, and that the fund's Advisory Contracts should be renewed, without modification, through July 31, 2023, with the understanding that the Board would consider the annual renewal for a full one year period in July 2023.
At its July 2023 meeting, the Board unanimously determined to renew the fund's Advisory Contracts. In reaching its determination, the Board considered all factors it believed relevant, including (i) the nature, extent, and quality of the services provided to the fund and its shareholders (including the investment performance of the fund); (ii) the competitiveness relative to peer funds of the fund's management fee and total expense ratio; (iii) the total costs of the services provided by and the profits realized by FMR and its affiliates (Fidelity) from its relationships with the fund; and (iv) the extent to which, if any, economies of scale exist and are realized as the fund grows, and whether any economies of scale are appropriately shared with fund shareholders. The Board also considered the broad range of investment choices available to shareholders from FMR's competitors and that the fund's shareholders have chosen to invest in the fund, which is part of the Fidelity family of funds. The Board's decision to renew the Advisory Contracts was not based on any single factor.
The Board reached a determination, with the assistance of fund counsel and Independent Trustees' counsel and through the exercise of its business judgment, that the renewal of the Advisory Contracts was in the best interests of the fund and its shareholders and that the compensation payable under the Advisory Contracts was fair and reasonable in light of all of the surrounding circumstances.
Nature, Extent, and Quality of Services Provided. The Board considered staffing as it relates to the fund, including the backgrounds and experience of investment personnel of the Investment Advisers, and also considered the Investment Advisers' implementation of the fund's investment program. The Independent Trustees also had discussions with senior management of Fidelity's investment operations and investment groups. The Board considered the structure of the investment personnel compensation program and whether this structure provides appropriate incentives to act in the best interests of the fund. Additionally, the Board considered the portfolio managers' investments, if any, in the funds that they manage.
Resources Dedicated to Investment Management and Support Services. The Board and the Fund Oversight and Research Committees reviewed the general qualifications and capabilities of Fidelity's investment staff, including its size, education, experience, and resources, as well as Fidelity's approach to recruiting, training, managing, and compensating investment personnel. The Board noted the resources devoted to expansion of Fidelity's global investment organization, and that Fidelity's analysts have extensive resources, tools, and capabilities that allow them to conduct sophisticated quantitative and fundamental analysis, as well as credit analysis of issuers, counterparties, and guarantors. Further, the Board considered that Fidelity's investment professionals have sufficient access to global information and data so as to provide competitive investment results over time, and that those professionals also have access to sophisticated tools that permit them to assess portfolio construction and risk and performance attribution characteristics continuously, as well as to transmit new information and research conclusions rapidly around the world. Additionally, in its deliberations, the Board considered Fidelity's trading, risk management, compliance, and technology and operations capabilities and resources, which are integral parts of the investment management process.
Shareholder and Administrative Services. The Board considered (i) the nature, extent, quality, and cost of advisory, administrative, and shareholder services performed by the Investment Advisers and their affiliates under the Advisory Contracts and under separate agreements covering transfer agency, pricing and bookkeeping, and securities lending services for the fund; (ii) the nature and extent of Fidelity's supervision of third party service providers, principally custodians, subcustodians, and pricing vendors; and (iii) the resources devoted by Fidelity to, and the record of compliance with, the fund's compliance policies and procedures. The Board also reviewed the allocation of fund brokerage, including allocations to brokers affiliated with the Investment Advisers, the use of brokerage commissions to pay fund expenses, and the use of "soft" commission dollars to pay for research services. The Board also considered the fund's securities lending activities and any payments made to Fidelity relating to securities lending.
The Board noted that the growth of fund assets over time across the complex allows Fidelity to reinvest in the development of services designed to enhance the value and convenience of the Fidelity funds as investment vehicles. These services include 24-hour access to account information and market information over the Internet and through telephone representatives, investor education materials, and asset allocation tools. The Board also considered that it reviews customer service metrics such as telephone response times, continuity of services on the website and metrics addressing services at Fidelity Investor Centers.
Investment in a Large Fund Family. The Board considered the benefits to shareholders of investing in a fund that is part of a large family of funds offering a variety of investment disciplines and providing a large variety of fund investor services. The Board noted that Fidelity had taken, or had made recommendations that resulted in the Fidelity funds taking, a number of actions over the previous year that benefited particular funds and/or the Fidelity funds in general.
Investment Performance. The Board took into account discussions that occur with representatives of the Investment Advisers, and reports that it receives, at Board meetings throughout the year, relating to fund investment performance. In this regard the Board noted that as part of regularly scheduled fund reviews and other reports to the Board on fund performance, the Board considered annualized return information for the fund for different time periods, measured against an appropriate securities market index (benchmark index) and an appropriate peer group of funds with similar objectives (peer group). The Board also considered information about performance attribution. In its ongoing evaluation of fund investment performance, the Board gives particular attention to information indicating changes in performance of the funds over different time periods and discussed with the Investment Advisers the reasons for any overperformance or underperformance.
In addition to reviewing absolute and relative fund performance, the Independent Trustees periodically consider the appropriateness of fund performance metrics in evaluating the results achieved. The Independent Trustees generally give greater weight to fund performance over longer time periods than over shorter time periods. Depending on the circumstances, the Independent Trustees may be satisfied with a fund's performance notwithstanding that it lags its benchmark index or peer group for certain periods.
Based on its review, the Board concluded that the nature, extent, and quality of services provided to the fund under the Advisory Contracts should continue to benefit the shareholders of the fund.
Competitiveness of Management Fee and Total Expense Ratio. The Board was provided with information regarding industry trends in management fees and expenses. In its review of the fund's management fee and total expense ratio, the Board considered the fund's unitary fee rate as well as other fund expenses paid by FMR under the fund's management contract, such as transfer agent fees, pricing and bookkeeping fees, and custodial, legal, and audit fees. The Board noted that Fidelity may agree to waive fees or reimburse expenses from time to time, and the extent to which, if any, it has done so for the fund.
Comparisons of Management Fees and Total Expense Ratios. Among other things, the Board reviewed data for selected groups of competitive funds and classes (referred to as "mapped groups") that were compiled by Fidelity based on combining similar investment objective categories (as classified by Lipper) that have comparable investment mandates. The data reviewed by the Board included (i) gross management fee comparisons (before taking into account expense reimbursements or caps) relative to the total universe of funds within the mapped group; (ii) gross management fee comparisons relative to a subset of non-Fidelity funds in the mapped group that are similar in size and management fee structure to the fund (referred to as the "asset size peer group"); (iii) total expense comparisons of the fund relative to funds and classes in the mapped group that have a similar sales load structure to the fund (referred to as the "similar sales load structure group"); and (iv) total expense comparisons of the fund relative to funds and classes in the similar sales load structure group that are similar in size and management fee structure to the fund (referred to as the "total expense asset size peer group"). The total expense asset size peer group comparison excludes performance adjustments and fund-paid 12b-1 fees to eliminate variability in fee structures.
The information provided to the Board indicated that the fund's management fee rate ranked below the competitive median of the mapped group for the 12-month period ended September 30, 2022 and below the competitive median of the asset size peer group for the 12-month period ended September 30, 2022. Further, the information provided to the Board indicated that the total expense ratio of the fund ranked below the competitive median of the similar sales load structure group for the 12-month period ended September 30, 2022 and below the competitive median of the total expense asset size peer group for the 12-month period ended September 30, 2022.
The Board also considered that, for funds subject to the group fee, FMR agreed to voluntarily waive fees over a specified period of time in amounts designed to account for assets converted from certain funds to certain collective investment trusts.
Fees Charged to Other Fidelity Clients. The Board also considered Fidelity fee structures and other information with respect to clients of Fidelity, such as other funds advised or subadvised by Fidelity, pension plan clients, and other institutional clients with similar mandates. The Board noted that a joint ad hoc committee created by it and the boards of other Fidelity funds periodically reviews and compares Fidelity's institutional investment advisory business with its business of providing services to the Fidelity funds and also noted the most recent findings of the committee. The Board noted that the committee's review included a consideration of the differences in services provided, fees charged, and costs incurred, as well as competition in the markets serving the different categories of clients.
Based on its review, the Board concluded that the fund's management fee is fair and reasonable in light of the services that the fund receives and the other factors considered. Further, based on its review of total expense ratios and fees charged to other Fidelity clients, the Board concluded that the fund's total expense ratio was reasonable in light of the services that the fund and its shareholders receive and the other factors considered.
Costs of the Services and Profitability. The Board considered the revenues earned and the expenses incurred by Fidelity in conducting the business of developing, marketing, distributing, managing, administering and servicing the fund and servicing the fund's shareholders. The Board also considered the level of Fidelity's profits in respect of all the Fidelity funds.
On an annual basis, Fidelity presents to the Board information about the profitability of its relationships with the fund. Fidelity calculates profitability information for each fund, as well as aggregate profitability information for groups of Fidelity funds and all Fidelity funds, using a series of detailed revenue and cost allocation methodologies which originate with the books and records of Fidelity on which Fidelity's audited financial statements are based. The Audit Committee of the Board reviews any significant changes from the prior year's methodologies and the full Board approves such changes.
A public accounting firm has been engaged annually by the Board as part of the Board's assessment of Fidelity's profitability analysis. The engagement includes the review and assessment of the methodologies used by Fidelity in determining the revenues and expenses attributable to Fidelity's fund business, and completion of agreed-upon procedures in respect of the mathematical accuracy of certain fund profitability information and its conformity to established allocation methodologies. After considering the reports issued under the engagement and information provided by Fidelity, the Board concluded that while other allocation methods may also be reasonable, Fidelity's profitability methodologies are reasonable in all material respects.
The Board also reviewed Fidelity's non-fund businesses and potential indirect benefits such businesses may have received as a result of their association with Fidelity's fund business (i.e., fall-out benefits) as well as cases where Fidelity's affiliates may benefit from the funds' business. The Board considered areas where potential indirect benefits to the Fidelity funds from their relationships with Fidelity may exist. The Board's consideration of these matters was informed by the findings of a joint ad hoc committee created by it and the boards of other Fidelity funds to evaluate potential fall-out benefits.
The Board considered the costs of the services provided by and the profits realized by Fidelity in connection with the operation of the fund and was satisfied that the profitability was not excessive.
Economies of Scale. The Board considered whether there have been economies of scale in respect of the management of the Fidelity funds, whether the Fidelity funds (including the fund) have appropriately benefited from any such economies of scale, and whether there is potential for realization of any further economies of scale. The Board considered the extent to which the fund will benefit from economies of scale as assets grow through increased services to the fund, through waivers or reimbursements, or through fee or expense ratio reductions. The Board recognized that, due to the fund's current contractual arrangements, its expense ratio will not decline if the fund's operating costs decrease as assets grow, or rise as assets decrease. The Board also noted that a committee (the Economies of Scale Committee) created by it and the boards of other Fidelity funds periodically analyzes whether Fidelity attains economies of scale in respect of the management and servicing of the Fidelity funds, whether the Fidelity funds have appropriately benefited from such economies of scale, and whether there is potential for realization of any further economies of scale.
The Board concluded, taking into account the analysis of the Economies of Scale Committee, that economies of scale, if any, are being appropriately shared between fund shareholders and Fidelity.
Additional Information Requested by the Board. In order to develop fully the factual basis for consideration of the Fidelity funds' advisory contracts, the Board requested and received additional information on certain topics, including: (i) fund flow and performance trends, in particular the underperformance of certain funds and strategies, and Fidelity's long-term strategies for certain funds, including any consideration of fund liquidations or mergers; (ii) the operation of performance fees and competitor use of performance fees; (iii) Fidelity's pricing philosophy compared to competitors; (iv) fund profitability methodology and data; (v) evaluation of competitive fund data and peer group classifications and fee and expense comparisons; (vi) the management fee and expense structures for different funds and classes and information about the differences between various fee and expense structures; (vii) group fee breakpoints and related voluntary fee waivers; and (viii) information regarding other accounts managed by Fidelity and the funds' sub-advisory arrangements.
Conclusion. Based on its evaluation of all of the conclusions noted above, and after considering all factors it believed relevant, the Board, including the Independent Trustees, concluded that the advisory and sub-advisory fee arrangements are fair and reasonable in light of all of the surrounding circumstances and that the fund's Advisory Contracts should be renewed through July 31, 2024.
1.9893909.104
PUR-K6-ANN-1023
Fidelity® Balanced K6 Fund
Annual Report
August 31, 2023
Contents
To view a fund's proxy voting guidelines and proxy voting record for the 12-month period ended June 30, visit http://www.fidelity.com/proxyvotingresults or visit the Securities and Exchange Commission's (SEC) web site at http://www.sec.gov.
You may also call 1-800-835-5092 to request a free copy of the proxy voting guidelines.
Standard & Poor's, S&P and S&P 500 are registered service marks of The McGraw-Hill Companies, Inc. and have been licensed for use by Fidelity Distributors Corporation.
Other third-party marks appearing herein are the property of their respective owners.
All other marks appearing herein are registered or unregistered trademarks or service marks of FMR LLC or an affiliated company. © 2023 FMR LLC. All rights reserved.
This report and the financial statements contained herein are submitted for the general information of the shareholders of the Fund. This report is not authorized for distribution to prospective investors in the Fund unless preceded or accompanied by an effective prospectus.
A fund files its complete schedule of portfolio holdings with the SEC for the first and third quarters of each fiscal year on Form N-PORT. Forms N-PORT are available on the SEC's web site at http://www.sec.gov. A fund's Forms N-PORT may be reviewed and copied at the SEC's Public Reference Room in Washington, DC. Information regarding the operation of the SEC's Public Reference Room may be obtained by calling 1-800-SEC-0330.
For a complete list of a fund's portfolio holdings, view the most recent holdings listing, semiannual report, or annual report on Fidelity's web site at http://www.fidelity.com, http://www.institutional.fidelity.com, or http://www.401k.com, as applicable.
NOT FDIC INSURED •MAY LOSE VALUE •NO BANK GUARANTEE
Neither the Fund nor Fidelity Distributors Corporation is a bank.
Average annual total return reflects the change in the value of an investment, assuming reinvestment of distributions from dividend income and capital gains (the profits earned upon the sale of securities that have grown in value, if any) and assuming a constant rate of performance each year. The hypothetical investment and the average annual total returns do not reflect the deduction of taxes that a shareholder would pay on fund distributions or the redemption of fund shares. During periods of reimbursement by Fidelity, a fund's total return will be greater than it would be had the reimbursement not occurred. How a fund did yesterday is no guarantee of how it will do tomorrow.
| Average Annual Total Returns |
| | | | |
Periods ended August 31, 2023 | Past 1 year | Life of Fund A |
| Fidelity® Balanced K6 Fund | 12.09% | 10.51% |
A From June 14, 2019
| $10,000 Over Life of Fund |
| |
Let's say hypothetically that $10,000 was invested in Fidelity® Balanced K6 Fund, on June 14, 2019, when the fund started. The chart shows how the value of your investment would have changed, and also shows how the S&P 500® Index performed over the same period. |
|
|
Market Recap:
U.S. equities gained 15.94% for the 12 months ending August 31, 2023, according to the S&P 500® index, as continued global economic expansion, falling commodity prices and a slowing in the pace of inflation provided a favorable backdrop for higher-risk assets. Large-cap stocks spearheaded the rally, which was driven by the shares of a narrow set of mega-cap companies in the information technology and communication services sectors, largely due to exuberance related to generative artificial intelligence. Aggressive monetary tightening by the U.S. Federal Reserve continued amid consistent pressure on core inflation, a measure that excludes food and energy. Since March 2022, the Fed has hiked its benchmark interest rate 11 times. The latest bump came in late July, a fourth consecutive raise of a stepped-down 25 basis points. The S&P 500® gained 3.21% in July but snapped a five-month rally in August (-1.59%), held back by softness in manufacturing and jobs. Still, U.S. stocks ended August up 18.73% year to date. In fixed income, the Bloomberg U.S. Aggregate Bond Index returned -1.19%, as taxable investment-grade bonds showed year-to-date improvement after returning -13.01% in 2022. For the full 12 months, short-term bonds outpaced long-term issues, while lower-quality (higher yielding) bonds topped higher-quality debt. Higher-risk assets, including corporate bonds and asset-backed securities, fared better than U.S. Treasuries.
Comments from Co-Portfolio Manager Christopher Lee:
For the fiscal year, the fund gained 12.09%, topping the 9.04% advance of the Fidelity Balanced Hybrid Composite Index. Versus the Composite index, security selection in the equity subportfolio contributed most. The fund's stock investments returned 20.30% the past 12 months, versus 15.94% for the S&P 500®. Stock picks particularly helped in the industrials sector, with energy and consumer discretionary contributing to a lesser extent. Notably, active management added value in all 11 sectors of the equity subportfolio. The top relative contributor among individual holdings was Nvidia, where the portfolio's overweight position rose 226% the past 12 months. Nvidia was one of our biggest holdings on August 31. An overweight in Eli Lilly also bolstered relative performance, gaining 86%. Lilly was also a major holding at period end. Further bolstering the equity subportfolio's relative result was an overweight stake in Meta Platforms (+81%), a major holding as well. On the flip side, avoiding Broadcom, a Composite index component that rose about 90%, detracted the most this period on a relative basis. Non-Composite exposure to Royalty Pharma (-27%) also hurt. The investment-grade bond central fund returned -0.38%, outpacing the -1.19% result of the Bloomberg U.S. Aggregate Bond Index. The central fund benefited from its overweight in credit, especially lower-rated corporate bonds, which continued to gain in the economy's post-COVID recovery, while favorable supply/demand trends and low issuer default rates resulted in tighter corporate-bond spreads. Other beneficial factors included exposure to AAA-rated collateralized loan obligations and an underweight in the lagging mortgage debt category.
Note to shareholders:
After nearly four decades with Fidelity, Robert Stansky retired from the company on December 31, 2022. On January 1, 2023, Chris Lee assumed Stansky's responsibilities for the fund, and Jody Simes came off of the fund.
The views expressed above reflect those of the portfolio manager(s) only through the end of the period as stated on the cover of this report and do not necessarily represent the views of Fidelity or any other person in the Fidelity organization. Any such views are subject to change at any time based upon market or other conditions and Fidelity disclaims any responsibility to update such views. These views may not be relied on as investment advice and, because investment decisions for a Fidelity fund are based on numerous factors, may not be relied on as an indication of trading intent on behalf of any Fidelity fund.
The information in the following tables is based on the combined Investments of the Fund and its pro-rata share of investments in Fidelity's Central Funds, other than the Money Market Central Funds.
Top Holdings (% of Fund's net assets) |
| |
| Microsoft Corp. | 4.7 | |
| Apple, Inc. | 3.9 | |
| Amazon.com, Inc. | 2.5 | |
| NVIDIA Corp. | 2.3 | |
| Alphabet, Inc. Class A | 1.5 | |
| Meta Platforms, Inc. Class A | 1.3 | |
| Exxon Mobil Corp. | 1.2 | |
| UnitedHealth Group, Inc. | 1.2 | |
| Eli Lilly & Co. | 1.1 | |
| Tesla, Inc. | 1.0 | |
| | 20.7 | |
| |
| Top Bond Issuers (% of Fund's net assets) |
(with maturities greater than one year) |
| U.S. Treasury Obligations | 13.6 | |
| Fannie Mae | 2.6 | |
| Freddie Mac | 2.4 | |
| Ginnie Mae | 1.4 | |
| Uniform Mortgage Backed Securities | 1.1 | |
| JPMorgan Chase & Co. | 0.7 | |
| Morgan Stanley | 0.5 | |
| Citigroup, Inc. | 0.5 | |
| Bank of America Corp. | 0.3 | |
| Petroleos Mexicanos | 0.3 | |
| | 23.4 | |
| |
| Market Sectors (% of Fund's net assets) |
| |
| Information Technology | 17.0 | |
| Financials | 12.7 | |
| Health Care | 8.8 | |
| Consumer Discretionary | 6.9 | |
| Communication Services | 6.2 | |
| Industrials | 5.8 | |
| Consumer Staples | 4.8 | |
| Energy | 3.8 | |
| Real Estate | 2.5 | |
| Utilities | 1.9 | |
| Materials | 1.6 | |
| |
Quality Diversification (% of Fund's net assets) |
|
| |
| We have used ratings from Moody's Investors Service, Inc. Where Moody's® ratings are not available, we have used S&P® ratings. All ratings are as of the date indicated and do not reflect subsequent changes. |
Asset Allocation (% of Fund's net assets) |
|
Futures and Swaps - (2.4)% |
|
Percentages in the above tables are adjusted for the effect of TBA Sale Commitments.
An unaudited holdings listing for the fund, which presents direct holdings as well as the pro-rata share of any securities and other investments held indirectly through its investment in underlying Fidelity Central Funds, other than the Money Market Central Funds, is available at fidelity.com and/or institutional.fidelity.com, as applicable.
Showing Percentage of Net Assets
| Common Stocks - 61.7% |
| | | Shares | Value ($) |
| COMMUNICATION SERVICES - 5.4% | | | |
| Diversified Telecommunication Services - 0.4% | | | |
| AT&T, Inc. | | 318,445 | 4,709,802 |
| Cellnex Telecom SA (a) | | 15,921 | 609,417 |
| Liberty Global PLC Class C (b) | | 22,239 | 441,222 |
| | | | 5,760,441 |
| Entertainment - 0.8% | | | |
| Cinemark Holdings, Inc. (b)(c) | | 25,524 | 415,531 |
| Netflix, Inc. (b) | | 15,536 | 6,737,652 |
| Sea Ltd. ADR (b) | | 39,611 | 1,490,562 |
| Take-Two Interactive Software, Inc. (b) | | 9,241 | 1,314,070 |
| The Walt Disney Co. (b) | | 28,773 | 2,407,725 |
| World Wrestling Entertainment, Inc. Class A (c) | | 7,509 | 724,994 |
| | | | 13,090,534 |
| Interactive Media & Services - 3.5% | | | |
| Alphabet, Inc.: | | | |
| Class A (b) | | 178,089 | 24,250,379 |
| Class C (b) | | 69,602 | 9,559,835 |
| Epic Games, Inc. (b)(d)(e) | | 182 | 113,342 |
| Meta Platforms, Inc. Class A (b) | | 69,572 | 20,585,659 |
| Pinterest, Inc. Class A (b) | | 21,604 | 593,894 |
| Snap, Inc. Class A (b) | | 131,325 | 1,359,214 |
| | | | 56,462,323 |
| Media - 0.5% | | | |
| Altice U.S.A., Inc. Class A (b) | | 32,778 | 100,628 |
| Charter Communications, Inc. Class A (b) | | 3,444 | 1,508,885 |
| Comcast Corp. Class A | | 68,271 | 3,192,352 |
| Liberty Broadband Corp.: | | | |
| Class A (b) | | 20,017 | 1,874,392 |
| Class C (b) | | 10,613 | 992,952 |
| | | | 7,669,209 |
| Wireless Telecommunication Services - 0.2% | | | |
| T-Mobile U.S., Inc. (b) | | 23,505 | 3,202,556 |
TOTAL COMMUNICATION SERVICES | | | 86,185,063 |
| CONSUMER DISCRETIONARY - 6.6% | | | |
| Automobile Components - 0.1% | | | |
| Adient PLC (b) | | 25,672 | 1,005,572 |
| Automobiles - 1.1% | | | |
| Ferrari NV | | 3,292 | 1,046,000 |
| Tesla, Inc. (b) | | 62,231 | 16,060,576 |
| | | | 17,106,576 |
| Broadline Retail - 2.6% | | | |
| Amazon.com, Inc. (b) | | 286,879 | 39,592,171 |
| eBay, Inc. | | 44,408 | 1,988,590 |
| | | | 41,580,761 |
| Hotels, Restaurants & Leisure - 1.2% | | | |
| Booking Holdings, Inc. (b) | | 1,502 | 4,663,755 |
| Caesars Entertainment, Inc. (b) | | 22,295 | 1,232,022 |
| Churchill Downs, Inc. | | 15,868 | 1,987,943 |
| Domino's Pizza, Inc. | | 3,955 | 1,532,167 |
| Marriott International, Inc. Class A | | 21,648 | 4,405,584 |
| McDonald's Corp. | | 10,011 | 2,814,593 |
| Penn Entertainment, Inc. (b) | | 9,928 | 235,194 |
| Red Rock Resorts, Inc. | | 7,228 | 317,526 |
| Sweetgreen, Inc. Class A (b) | | 2,658 | 38,169 |
| Yum! Brands, Inc. | | 21,298 | 2,755,535 |
| | | | 19,982,488 |
| Household Durables - 0.0% | | | |
| D.R. Horton, Inc. | | 786 | 93,550 |
| Mohawk Industries, Inc. (b) | | 7,000 | 709,730 |
| | | | 803,280 |
| Specialty Retail - 1.3% | | | |
| Cazoo Group Ltd. (b)(d) | | 285 | 322 |
| Fast Retailing Co. Ltd. | | 3,211 | 738,886 |
| Lowe's Companies, Inc. | | 30,426 | 7,012,584 |
| The Home Depot, Inc. | | 14,028 | 4,633,448 |
| TJX Companies, Inc. | | 82,156 | 7,597,787 |
| Valvoline, Inc. | | 28,421 | 978,819 |
| | | | 20,961,846 |
| Textiles, Apparel & Luxury Goods - 0.3% | | | |
| NIKE, Inc. Class B | | 19,149 | 1,947,645 |
| PVH Corp. | | 14,766 | 1,234,438 |
| Tapestry, Inc. | | 38,266 | 1,275,023 |
| | | | 4,457,106 |
TOTAL CONSUMER DISCRETIONARY | | | 105,897,629 |
| CONSUMER STAPLES - 4.2% | | | |
| Beverages - 1.5% | | | |
| Boston Beer Co., Inc. Class A (b) | | 1,840 | 672,391 |
| Celsius Holdings, Inc. (b) | | 6,687 | 1,310,919 |
| Constellation Brands, Inc. Class A (sub. vtg.) | | 10,626 | 2,768,711 |
| Diageo PLC | | 9,485 | 388,439 |
| Duckhorn Portfolio, Inc. (b) | | 24,498 | 304,755 |
| Keurig Dr. Pepper, Inc. | | 46,369 | 1,560,317 |
| Monster Beverage Corp. | | 47,766 | 2,742,246 |
| PepsiCo, Inc. | | 37,374 | 6,649,582 |
| Pernod Ricard SA | | 4,256 | 836,237 |
| The Coca-Cola Co. | | 120,537 | 7,211,729 |
| The Vita Coco Co., Inc. (b) | | 15,436 | 436,684 |
| | | | 24,882,010 |
| Consumer Staples Distribution & Retail - 1.2% | | | |
| Alimentation Couche-Tard, Inc. Class A (multi-vtg.) | | 19,166 | 1,002,272 |
| BJ's Wholesale Club Holdings, Inc. (b) | | 5,109 | 344,296 |
| Costco Wholesale Corp. | | 13,065 | 7,176,343 |
| Dollar General Corp. | | 4,472 | 619,372 |
| Dollar Tree, Inc. (b) | | 7,947 | 972,395 |
| Target Corp. | | 1,540 | 194,887 |
| U.S. Foods Holding Corp. (b) | | 28,205 | 1,140,328 |
| Walmart, Inc. | | 47,651 | 7,748,529 |
| | | | 19,198,422 |
| Food Products - 0.5% | | | |
| Freshpet, Inc. (b)(c) | | 8,766 | 661,921 |
| Lamb Weston Holdings, Inc. | | 7,291 | 710,216 |
| McCormick & Co., Inc. (non-vtg.) | | 13,513 | 1,109,147 |
| Mondelez International, Inc. | | 51,430 | 3,664,902 |
| The Hershey Co. | | 6,566 | 1,410,771 |
| | | | 7,556,957 |
| Household Products - 0.8% | | | |
| Colgate-Palmolive Co. | | 20,249 | 1,487,694 |
| Energizer Holdings, Inc. | | 8,192 | 281,395 |
| Procter & Gamble Co. | | 76,420 | 11,794,663 |
| | | | 13,563,752 |
| Personal Care Products - 0.2% | | | |
| elf Beauty, Inc. (b) | | 4,085 | 566,630 |
| Estee Lauder Companies, Inc. Class A | | 8,432 | 1,353,589 |
| Kenvue, Inc. | | 25,974 | 598,701 |
| | | | 2,518,920 |
TOTAL CONSUMER STAPLES | | | 67,720,061 |
| ENERGY - 2.8% | | | |
| Energy Equipment & Services - 0.3% | | | |
| Expro Group Holdings NV (b) | | 51,996 | 1,222,426 |
| Schlumberger Ltd. | | 33,086 | 1,950,751 |
| Weatherford International PLC (b) | | 21,399 | 1,894,239 |
| | | | 5,067,416 |
| Oil, Gas & Consumable Fuels - 2.5% | | | |
| Africa Oil Corp. | | 438,761 | 1,055,338 |
| Athabasca Oil Corp. (b) | | 235,524 | 653,652 |
| Canadian Natural Resources Ltd. | | 26,751 | 1,730,737 |
| Eco Atlantic Oil & Gas Ltd. (b) | | 339,539 | 70,360 |
| Exxon Mobil Corp. | | 178,137 | 19,807,053 |
| Hess Corp. | | 27,010 | 4,173,045 |
| Imperial Oil Ltd. | | 59,848 | 3,398,562 |
| Kosmos Energy Ltd. (b) | | 146,795 | 1,068,668 |
| MEG Energy Corp. (b) | | 146,774 | 2,625,464 |
| Phillips 66 Co. | | 19,836 | 2,264,478 |
| Valero Energy Corp. | | 21,829 | 2,835,587 |
| | | | 39,682,944 |
TOTAL ENERGY | | | 44,750,360 |
| FINANCIALS - 8.0% | | | |
| Banks - 2.5% | | | |
| AIB Group PLC | | 91,347 | 416,217 |
| Bank of America Corp. | | 157,895 | 4,526,850 |
| BNP Paribas SA | | 39,506 | 2,554,760 |
| Citigroup, Inc. | | 25,164 | 1,039,022 |
| DNB Bank ASA | | 39,605 | 782,854 |
| Eurobank Ergasias Services and Holdings SA (b) | | 682,199 | 1,185,807 |
| JPMorgan Chase & Co. | | 100,107 | 14,648,657 |
| KBC Group NV | | 6,923 | 454,621 |
| KeyCorp | | 151,689 | 1,718,636 |
| M&T Bank Corp. | | 8,355 | 1,044,793 |
| Piraeus Financial Holdings SA (b) | | 198,327 | 686,458 |
| PNC Financial Services Group, Inc. | | 16,599 | 2,003,997 |
| Starling Bank Ltd. Series D (b)(d)(e) | | 182,820 | 750,372 |
| UniCredit SpA | | 24,616 | 599,722 |
| Wells Fargo & Co. | | 174,265 | 7,195,402 |
| Zions Bancorp NA | | 10,562 | 374,951 |
| | | | 39,983,119 |
| Capital Markets - 1.4% | | | |
| Bank of New York Mellon Corp. | | 51,655 | 2,317,760 |
| BlackRock, Inc. Class A | | 5,381 | 3,769,606 |
| Brookfield Corp. Class A | | 21,704 | 740,323 |
| Cboe Global Markets, Inc. | | 6,897 | 1,032,550 |
| CME Group, Inc. | | 11,663 | 2,363,857 |
| Interactive Brokers Group, Inc. | | 13,454 | 1,225,390 |
| MarketAxess Holdings, Inc. | | 5,003 | 1,205,373 |
| Morgan Stanley | | 59,516 | 5,067,787 |
| State Street Corp. | | 18,921 | 1,300,630 |
| StepStone Group, Inc. Class A | | 22,015 | 679,603 |
| UBS Group AG | | 93,094 | 2,486,541 |
| Virtu Financial, Inc. Class A | | 21,234 | 397,925 |
| | | | 22,587,345 |
| Consumer Finance - 0.1% | | | |
| OneMain Holdings, Inc. | | 23,557 | 977,851 |
| Shriram Transport Finance Co. Ltd. | | 21,531 | 501,976 |
| | | | 1,479,827 |
| Financial Services - 2.3% | | | |
| Apollo Global Management, Inc. | | 42,933 | 3,749,768 |
| Berkshire Hathaway, Inc.: | | | |
| Class A (b) | | 3 | 1,640,175 |
| Class B (b) | | 6,066 | 2,184,973 |
| Block, Inc. Class A (b) | | 33,906 | 1,954,681 |
| Dlocal Ltd. (b) | | 47,492 | 1,018,228 |
| Fiserv, Inc. (b) | | 29,543 | 3,586,225 |
| FleetCor Technologies, Inc. (b) | | 4,616 | 1,254,306 |
| Global Payments, Inc. | | 19,215 | 2,434,348 |
| One97 Communications Ltd. (b) | | 129,145 | 1,333,302 |
| UWM Holdings Corp. Class A (c) | | 47,008 | 280,168 |
| Visa, Inc. Class A | | 62,305 | 15,307,092 |
| Voya Financial, Inc. | | 10,273 | 715,823 |
| Worldline SA (a)(b) | | 22,508 | 734,149 |
| | | | 36,193,238 |
| Insurance - 1.7% | | | |
| Arthur J. Gallagher & Co. | | 17,320 | 3,991,914 |
| Chubb Ltd. | | 20,868 | 4,191,755 |
| Direct Line Insurance Group PLC | | 352,063 | 723,178 |
| Everest Re Group Ltd. | | 5,174 | 1,866,158 |
| Fairfax Financial Holdings Ltd. (sub. vtg.) | | 1,920 | 1,583,332 |
| Globe Life, Inc. | | 9,520 | 1,062,146 |
| Hartford Financial Services Group, Inc. | | 33,747 | 2,423,710 |
| Marsh & McLennan Companies, Inc. | | 20,672 | 4,030,833 |
| Progressive Corp. | | 24,442 | 3,262,274 |
| Prudential PLC | | 40,324 | 491,109 |
| The Travelers Companies, Inc. | | 17,284 | 2,786,699 |
| Unum Group | | 32,632 | 1,605,168 |
| | | | 28,018,276 |
TOTAL FINANCIALS | | | 128,261,805 |
| HEALTH CARE - 8.1% | | | |
| Biotechnology - 1.4% | | | |
| Biogen, Inc. (b) | | 5,748 | 1,536,785 |
| Exact Sciences Corp. (b) | | 17,549 | 1,468,325 |
| Gilead Sciences, Inc. | | 100,447 | 7,682,187 |
| Legend Biotech Corp. ADR (b) | | 14,138 | 980,612 |
| PTC Therapeutics, Inc. (b) | | 15,393 | 608,024 |
| Regeneron Pharmaceuticals, Inc. (b) | | 2,346 | 1,938,946 |
| Sarepta Therapeutics, Inc. (b) | | 4,996 | 604,566 |
| Vertex Pharmaceuticals, Inc. (b) | | 21,631 | 7,534,943 |
| | | | 22,354,388 |
| Health Care Equipment & Supplies - 1.7% | | | |
| Abbott Laboratories | | 13,713 | 1,411,068 |
| Boston Scientific Corp. (b) | | 196,861 | 10,618,682 |
| Intuitive Surgical, Inc. (b) | | 15,448 | 4,830,281 |
| Masimo Corp. (b) | | 3,172 | 362,496 |
| Penumbra, Inc. (b) | | 6,865 | 1,815,793 |
| PROCEPT BioRobotics Corp. (b) | | 6,200 | 211,482 |
| Stryker Corp. | | 29,479 | 8,358,770 |
| | | | 27,608,572 |
| Health Care Providers & Services - 2.3% | | | |
| agilon health, Inc. (b) | | 70,878 | 1,255,958 |
| Cencora, Inc. | | 35,448 | 6,238,139 |
| Cigna Group | | 14,567 | 4,024,279 |
| Humana, Inc. | | 5,793 | 2,674,223 |
| Surgery Partners, Inc. (b) | | 112,324 | 4,072,868 |
| UnitedHealth Group, Inc. | | 39,431 | 18,792,026 |
| | | | 37,057,493 |
| Life Sciences Tools & Services - 0.6% | | | |
| 10X Genomics, Inc. (b) | | 15,978 | 828,459 |
| Danaher Corp. | | 9,860 | 2,612,900 |
| Gerresheimer AG | | 27,935 | 3,631,929 |
| IQVIA Holdings, Inc. (b) | | 4,103 | 913,451 |
| Thermo Fisher Scientific, Inc. | | 3,085 | 1,718,654 |
| | | | 9,705,393 |
| Pharmaceuticals - 2.1% | | | |
| AstraZeneca PLC sponsored ADR | | 79,882 | 5,417,597 |
| Eli Lilly & Co. | | 30,881 | 17,114,250 |
| Indivior PLC (b) | | 79,328 | 1,828,967 |
| Merck & Co., Inc. | | 59,468 | 6,480,823 |
| Royalty Pharma PLC | | 70,990 | 2,116,922 |
| | | | 32,958,559 |
TOTAL HEALTH CARE | | | 129,684,405 |
| INDUSTRIALS - 5.5% | | | |
| Aerospace & Defense - 1.2% | | | |
| Howmet Aerospace, Inc. | | 41,445 | 2,050,284 |
| Lockheed Martin Corp. | | 12,153 | 5,448,798 |
| Northrop Grumman Corp. | | 4,349 | 1,883,508 |
| RTX Corp. | | 14,789 | 1,272,446 |
| Space Exploration Technologies Corp. Class A (b)(d)(e) | | 2,000 | 162,000 |
| The Boeing Co. (b) | | 25,648 | 5,745,921 |
| TransDigm Group, Inc. | | 2,853 | 2,578,684 |
| | | | 19,141,641 |
| Air Freight & Logistics - 0.1% | | | |
| United Parcel Service, Inc. Class B | | 7,007 | 1,186,986 |
| Building Products - 0.4% | | | |
| Trane Technologies PLC | | 30,686 | 6,298,608 |
| Electrical Equipment - 0.6% | | | |
| AMETEK, Inc. | | 40,043 | 6,387,259 |
| Eaton Corp. PLC | | 13,262 | 3,055,167 |
| | | | 9,442,426 |
| Ground Transportation - 0.9% | | | |
| CSX Corp. | | 102,517 | 3,096,013 |
| Old Dominion Freight Lines, Inc. | | 11,406 | 4,874,582 |
| Uber Technologies, Inc. (b) | | 56,544 | 2,670,573 |
| Union Pacific Corp. | | 15,682 | 3,458,979 |
| | | | 14,100,147 |
| Industrial Conglomerates - 0.4% | | | |
| General Electric Co. | | 55,084 | 6,304,915 |
| Honeywell International, Inc. | | 4,328 | 813,404 |
| | | | 7,118,319 |
| Machinery - 1.8% | | | |
| Caterpillar, Inc. | | 16,300 | 4,582,419 |
| Deere & Co. | | 3,912 | 1,607,597 |
| Dover Corp. | | 31,053 | 4,605,160 |
| Fortive Corp. | | 82,870 | 6,534,300 |
| Ingersoll Rand, Inc. | | 68,953 | 4,799,818 |
| Parker Hannifin Corp. | | 16,062 | 6,696,248 |
| | | | 28,825,542 |
| Passenger Airlines - 0.1% | | | |
| Delta Air Lines, Inc. | | 22,347 | 958,239 |
| Professional Services - 0.0% | | | |
| Dun & Bradstreet Holdings, Inc. | | 69,651 | 759,196 |
TOTAL INDUSTRIALS | | | 87,831,104 |
| INFORMATION TECHNOLOGY - 16.6% | | | |
| Electronic Equipment, Instruments & Components - 0.2% | | | |
| Amphenol Corp. Class A | | 35,986 | 3,180,443 |
| IT Services - 0.8% | | | |
| Accenture PLC Class A | | 5,237 | 1,695,583 |
| Capgemini SA | | 7,310 | 1,364,202 |
| EPAM Systems, Inc. (b) | | 7,176 | 1,858,512 |
| MongoDB, Inc. Class A (b) | | 8,432 | 3,215,122 |
| Shopify, Inc. Class A (b) | | 14,731 | 979,464 |
| Snowflake, Inc. (b) | | 8,394 | 1,316,599 |
| Twilio, Inc. Class A (b) | | 22,002 | 1,401,747 |
| Wix.com Ltd. (b) | | 12,671 | 1,251,515 |
| | | | 13,082,744 |
| Semiconductors & Semiconductor Equipment - 4.1% | | | |
| Advanced Micro Devices, Inc. (b) | | 35,574 | 3,760,883 |
| ASML Holding NV (Netherlands) | | 3,186 | 2,094,885 |
| Lam Research Corp. | | 5,684 | 3,992,442 |
| Marvell Technology, Inc. | | 44,823 | 2,610,940 |
| Micron Technology, Inc. | | 80,823 | 5,652,761 |
| NVIDIA Corp. | | 74,861 | 36,947,647 |
| NXP Semiconductors NV | | 16,210 | 3,334,721 |
| Renesas Electronics Corp. (b) | | 111,552 | 1,858,419 |
| SolarEdge Technologies, Inc. (b) | | 8,842 | 1,437,444 |
| Taiwan Semiconductor Manufacturing Co. Ltd. | | 218,506 | 3,752,635 |
| | | | 65,442,777 |
| Software - 7.5% | | | |
| Adobe, Inc. (b) | | 20,285 | 11,346,212 |
| Autodesk, Inc. (b) | | 15,184 | 3,369,937 |
| CCC Intelligent Solutions Holdings, Inc. (b)(d) | | 3,671 | 39,280 |
| Elastic NV (b) | | 15,357 | 950,291 |
| Five9, Inc. (b) | | 21,359 | 1,545,751 |
| HubSpot, Inc. (b) | | 6,495 | 3,549,647 |
| Intuit, Inc. | | 14,335 | 7,766,846 |
| Microsoft Corp. | | 231,685 | 75,937,080 |
| Salesforce, Inc. (b) | | 38,705 | 8,571,609 |
| Stripe, Inc. Class B (b)(d)(e) | | 1,800 | 33,408 |
| Synopsys, Inc. (b) | | 8,683 | 3,984,542 |
| Tenable Holdings, Inc. (b) | | 17,191 | 779,956 |
| Workday, Inc. Class A (b) | | 10,925 | 2,671,163 |
| | | | 120,545,722 |
| Technology Hardware, Storage & Peripherals - 4.0% | | | |
| Apple, Inc. | | 329,813 | 61,961,968 |
| Samsung Electronics Co. Ltd. | | 25,049 | 1,264,819 |
| | | | 63,226,787 |
TOTAL INFORMATION TECHNOLOGY | | | 265,478,473 |
| MATERIALS - 1.5% | | | |
| Chemicals - 1.0% | | | |
| Air Products & Chemicals, Inc. | | 5,328 | 1,574,371 |
| Cabot Corp. | | 8,051 | 583,375 |
| Celanese Corp. Class A | | 9,501 | 1,200,546 |
| Chemtrade Logistics Income Fund | | 47,918 | 301,793 |
| Corteva, Inc. | | 23,804 | 1,202,340 |
| DuPont de Nemours, Inc. | | 15,484 | 1,190,565 |
| Linde PLC | | 17,088 | 6,613,740 |
| LyondellBasell Industries NV Class A | | 15,483 | 1,529,256 |
| Nutrien Ltd. | | 4,054 | 256,795 |
| Olin Corp. | | 9,344 | 542,139 |
| The Chemours Co. LLC | | 21,788 | 741,228 |
| Tronox Holdings PLC | | 39,552 | 539,489 |
| Westlake Corp. | | 2,518 | 329,808 |
| | | | 16,605,445 |
| Construction Materials - 0.1% | | | |
| Martin Marietta Materials, Inc. | | 1,800 | 803,538 |
| Vulcan Materials Co. | | 3,856 | 841,572 |
| | | | 1,645,110 |
| Containers & Packaging - 0.1% | | | |
| Aptargroup, Inc. | | 4,550 | 603,148 |
| Greif, Inc. Class A | | 7,951 | 577,163 |
| | | | 1,180,311 |
| Metals & Mining - 0.3% | | | |
| First Quantum Minerals Ltd. | | 51,542 | 1,384,676 |
| Franco-Nevada Corp. | | 4,550 | 655,494 |
| Freeport-McMoRan, Inc. | | 47,869 | 1,910,452 |
| Horizonte Minerals PLC (b) | | 91,660 | 151,530 |
| Ivanhoe Mines Ltd. (b) | | 35,711 | 317,678 |
| Major Drilling Group International, Inc. (b) | | 18,702 | 120,417 |
| Reliance Steel & Aluminum Co. | | 2,507 | 714,395 |
| | | | 5,254,642 |
TOTAL MATERIALS | | | 24,685,508 |
| REAL ESTATE - 1.5% | | | |
| Equity Real Estate Investment Trusts (REITs) - 1.5% | | | |
| Alexandria Real Estate Equities, Inc. | | 565 | 65,732 |
| American Tower Corp. | | 14,129 | 2,561,870 |
| Corporate Office Properties Trust (SBI) | | 17,307 | 447,905 |
| Crown Castle International Corp. | | 13,608 | 1,367,604 |
| CubeSmart | | 3,760 | 156,830 |
| Digital Realty Trust, Inc. | | 14,949 | 1,969,082 |
| Equinix, Inc. | | 3,962 | 3,095,828 |
| Equity Lifestyle Properties, Inc. | | 23,506 | 1,573,962 |
| Essex Property Trust, Inc. | | 5,556 | 1,324,495 |
| Extra Space Storage, Inc. | | 537 | 69,101 |
| Invitation Homes, Inc. | | 40,605 | 1,384,224 |
| Mid-America Apartment Communities, Inc. | | 12,929 | 1,877,679 |
| Prologis (REIT), Inc. | | 28,520 | 3,542,184 |
| Simon Property Group, Inc. | | 9,986 | 1,133,311 |
| Ventas, Inc. | | 18,305 | 799,562 |
| Welltower, Inc. | | 22,646 | 1,876,900 |
| | | | 23,246,269 |
| UTILITIES - 1.5% | | | |
| Electric Utilities - 1.1% | | | |
| Constellation Energy Corp. | | 25,450 | 2,650,872 |
| Edison International | | 17,248 | 1,187,525 |
| Exelon Corp. | | 29,683 | 1,190,882 |
| FirstEnergy Corp. | | 14,687 | 529,760 |
| NextEra Energy, Inc. | | 63,952 | 4,271,994 |
| NRG Energy, Inc. | | 8,375 | 314,481 |
| PG&E Corp. (b) | | 154,666 | 2,521,056 |
| PPL Corp. | | 43,813 | 1,091,820 |
| Southern Co. | | 61,575 | 4,170,475 |
| | | | 17,928,865 |
| Independent Power and Renewable Electricity Producers - 0.0% | | | |
| The AES Corp. | | 18,098 | 324,497 |
| Multi-Utilities - 0.3% | | | |
| Dominion Energy, Inc. | | 31,110 | 1,510,079 |
| NiSource, Inc. | | 34,853 | 932,666 |
| Sempra | | 37,880 | 2,659,934 |
| | | | 5,102,679 |
| Water Utilities - 0.1% | | | |
| American Water Works Co., Inc. | | 8,502 | 1,179,567 |
TOTAL UTILITIES | | | 24,535,608 |
| TOTAL COMMON STOCKS (Cost $770,302,081) | | | 988,276,285 |
| | | | |
| Preferred Stocks - 0.1% |
| | | Shares | Value ($) |
| Convertible Preferred Stocks - 0.1% | | | |
| COMMUNICATION SERVICES - 0.0% | | | |
| Interactive Media & Services - 0.0% | | | |
| ByteDance Ltd. Series E1 (b)(d)(e) | | 1,863 | 421,206 |
| | | | |
| INDUSTRIALS - 0.0% | | | |
| Aerospace & Defense - 0.0% | | | |
| ABL Space Systems: | | | |
| Series B(b)(d)(e) | | 1,784 | 48,989 |
| Series B2(b)(d)(e) | | 1,176 | 31,505 |
| | | | 80,494 |
| Construction & Engineering - 0.0% | | | |
| Beta Technologies, Inc. Series A (b)(d)(e) | | 731 | 82,815 |
| | | | |
TOTAL INDUSTRIALS | | | 163,309 |
| | | | |
| INFORMATION TECHNOLOGY - 0.1% | | | |
| Communications Equipment - 0.0% | | | |
| Astranis Space Technologies Corp. Series C (b)(d)(e) | | 6,103 | 110,281 |
| | | | |
| Semiconductors & Semiconductor Equipment - 0.0% | | | |
| Astera Labs, Inc. Series C (b)(d)(e) | | 18,600 | 176,328 |
| GaN Systems, Inc.: | | | |
| Series F1(b)(d)(e) | | 2,171 | 24,033 |
| Series F2(b)(d)(e) | | 1,146 | 12,686 |
| Xsight Labs Ltd. Series D (b)(d)(e) | | 6,632 | 38,134 |
| | | | 251,181 |
| Software - 0.1% | | | |
| Algolia, Inc. Series D (b)(d)(e) | | 3,612 | 52,193 |
| Bolt Technology OU Series E (b)(d)(e) | | 957 | 123,551 |
| Databricks, Inc.: | | | |
| Series G(b)(d)(e) | | 444 | 32,634 |
| Series H(b)(d)(e) | | 2,574 | 189,189 |
| Skyryse, Inc. Series B (b)(d)(e) | | 7,300 | 168,484 |
| Stripe, Inc. Series H (b)(d)(e) | | 2,037 | 37,807 |
| | | | 603,858 |
TOTAL INFORMATION TECHNOLOGY | | | 965,320 |
| | | | |
| TOTAL CONVERTIBLE PREFERRED STOCKS | | | 1,549,835 |
| Nonconvertible Preferred Stocks - 0.0% | | | |
| INDUSTRIALS - 0.0% | | | |
| Professional Services - 0.0% | | | |
| Checkr, Inc. Series E (b)(e) | | 12,063 | 116,408 |
| | | | |
| INFORMATION TECHNOLOGY - 0.0% | | | |
| IT Services - 0.0% | | | |
| Gupshup, Inc. (b)(d)(e) | | 3,298 | 41,225 |
| | | | |
| TOTAL NONCONVERTIBLE PREFERRED STOCKS | | | 157,633 |
| TOTAL PREFERRED STOCKS (Cost $1,819,573) | | | 1,707,468 |
| | | | |
| U.S. Treasury Obligations - 0.0% |
| | | Principal Amount (f) | Value ($) |
U.S. Treasury Bills, yield at date of purchase 5.14% to 5.39% 9/7/23 to 11/30/23 (g) (Cost $744,338) | | 750,000 | 744,323 |
| | | | |
| Preferred Securities - 0.0% |
| | | Principal Amount (f) | Value ($) |
| INFORMATION TECHNOLOGY - 0.0% | | | |
| Semiconductors & Semiconductor Equipment - 0.0% | | | |
GaN Systems, Inc. 0% (d)(e)(h) (Cost $50,872) | | 50,872 | 62,608 |
| | | | |
| Fixed-Income Funds - 36.7% |
| | | Shares | Value ($) |
Fidelity Investment Grade Bond Central Fund (i) (Cost $646,128,890) | | 6,089,917 | 587,007,125 |
| | | | |
| Money Market Funds - 1.5% |
| | | Shares | Value ($) |
| Fidelity Cash Central Fund 5.43% (j) | | 23,103,517 | 23,108,138 |
| Fidelity Securities Lending Cash Central Fund 5.44% (j)(k) | | 1,008,349 | 1,008,450 |
| TOTAL MONEY MARKET FUNDS (Cost $24,116,588) | | | 24,116,588 |
| | | | |
| TOTAL INVESTMENT IN SECURITIES - 100.0% (Cost $1,443,162,342) | 1,601,914,397 |
NET OTHER ASSETS (LIABILITIES) - 0.0% | (318,362) |
| NET ASSETS - 100.0% | 1,601,596,035 |
| | |
| Futures Contracts |
| | Number of contracts | Expiration Date | Notional Amount ($) | Value ($) | Unrealized Appreciation/ (Depreciation) ($) |
| Purchased | | | | | |
| | | | | | |
| Equity Index Contracts | | | | | |
| CME E-mini S&P 500 Index Contracts (United States) | 61 | Sep 2023 | 13,773,800 | 495,853 | 495,853 |
| | | | | | |
| The notional amount of futures purchased as a percentage of Net Assets is 0.9% |
Legend
| (a) | Security exempt from registration under Rule 144A of the Securities Act of 1933. These securities may be resold in transactions exempt from registration, normally to qualified institutional buyers. At the end of the period, the value of these securities amounted to $1,343,566 or 0.1% of net assets. |
| (c) | Security or a portion of the security is on loan at period end. |
| (d) | Restricted securities (including private placements) - Investment in securities not registered under the Securities Act of 1933 (excluding 144A issues). At the end of the period, the value of restricted securities (excluding 144A issues) amounted to $2,752,392 or 0.2% of net assets. |
| (f) | Amount is stated in United States dollars unless otherwise noted. |
| (g) | Security or a portion of the security was pledged to cover margin requirements for futures contracts. At period end, the value of securities pledged amounted to $744,323. |
| (h) | Security is perpetual in nature with no stated maturity date. |
| (i) | Affiliated fund that is generally available only to investment companies and other accounts managed by Fidelity Investments. A complete unaudited schedule of portfolio holdings for each Fidelity Central Fund is filed with the SEC for the first and third quarters of each fiscal year on Form N-PORT and is available upon request or at the SEC's website at www.sec.gov. An unaudited holdings listing for the Fund, which presents direct holdings as well as the pro-rata share of securities and other investments held indirectly through its investment in underlying non-money market Fidelity Central Funds, is available at fidelity.com and/or institutional.fidelity.com, as applicable. In addition, each Fidelity Central Fund's financial statements,which are not covered by the Fund's Report of Independent Registered Public Accounting Firm, are available on the SEC's website or upon request. |
| (j) | Affiliated fund that is generally available only to investment companies and other accounts managed by Fidelity Investments. The rate quoted is the annualized seven-day yield of the fund at period end. A complete unaudited listing of the fund's holdings as of its most recent quarter end is available upon request. In addition, each Fidelity Central Fund's financial statements, which are not covered by the Fund's Report of Independent Registered Public Accounting Firm, are available on the SEC's website or upon request. |
| (k) | Investment made with cash collateral received from securities on loan. |
| Additional information on each restricted holding is as follows: |
| Security | Acquisition Date | Acquisition Cost ($) |
| ABL Space Systems Series B | 3/24/21 | 80,344 |
| | | |
| ABL Space Systems Series B2 | 10/22/21 | 79,963 |
| | | |
| Algolia, Inc. Series D | 7/23/21 | 105,633 |
| | | |
| Astera Labs, Inc. Series C | 8/24/21 | 62,529 |
| | | |
| Astranis Space Technologies Corp. Series C | 3/19/21 | 133,783 |
| | | |
| Beta Technologies, Inc. Series A | 4/09/21 | 53,560 |
| | | |
| Bolt Technology OU Series E | 1/03/22 | 248,626 |
| | | |
| ByteDance Ltd. Series E1 | 11/18/20 | 204,137 |
| | | |
| Cazoo Group Ltd. | 3/28/21 | 57,000 |
| | | |
| CCC Intelligent Solutions Holdings, Inc. | 2/02/21 | 36,710 |
| | | |
| Databricks, Inc. Series G | 2/01/21 | 26,250 |
| | | |
| Databricks, Inc. Series H | 8/31/21 | 189,148 |
| | | |
| Epic Games, Inc. | 3/29/21 | 161,070 |
| | | |
| GaN Systems, Inc. Series F1 | 11/30/21 | 18,410 |
| | | |
| GaN Systems, Inc. Series F2 | 11/30/21 | 9,718 |
| | | |
| GaN Systems, Inc. 0% | 11/30/21 | 50,872 |
| | | |
| Gupshup, Inc. | 6/08/21 | 75,409 |
| | | |
| Skyryse, Inc. Series B | 10/21/21 | 180,164 |
| | | |
| Space Exploration Technologies Corp. Class A | 2/16/21 | 83,998 |
| | | |
| Starling Bank Ltd. Series D | 6/18/21 | 326,861 |
| | | |
| Stripe, Inc. Class B | 5/18/21 | 72,231 |
| | | |
| Stripe, Inc. Series H | 3/15/21 - 5/25/23 | 81,735 |
| | | |
| Xsight Labs Ltd. Series D | 2/16/21 | 53,029 |
| | | |
Affiliated Central Funds
Fiscal year to date information regarding the Fund's investments in Fidelity Central Funds, including the ownership percentage, is presented below.
| Affiliate | Value, beginning of period ($) | Purchases ($) | Sales Proceeds ($) | Dividend Income ($) | Realized Gain (loss) ($) | Change in Unrealized appreciation (depreciation) ($) | Value, end of period ($) | % ownership, end of period |
| Fidelity Cash Central Fund 5.43% | 22,110,015 | 405,619,486 | 404,621,363 | 1,063,547 | - | - | 23,108,138 | 0.1% |
| Fidelity High Income Central Fund | 6 | - | 5 | - | (1) | - | - | 0.0% |
| Fidelity Investment Grade Bond Central Fund | 356,998,527 | 260,167,015 | 12,465,881 | 18,260,819 | (2,035,816) | (15,656,720) | 587,007,125 | 1.6% |
| Fidelity Securities Lending Cash Central Fund 5.44% | 869,750 | 21,462,550 | 21,323,850 | 15,991 | - | - | 1,008,450 | 0.0% |
| Total | 379,978,298 | 687,249,051 | 438,411,099 | 19,340,357 | (2,035,817) | (15,656,720) | 611,123,713 | |
| | | | | | | | | |
Amounts in the dividend income column in the above table include any capital gain distributions from underlying funds, which are presented in the corresponding line item in the Statement of Operations, if applicable.
Amounts in the dividend income column for Fidelity Securities Lending Cash Central Fund represents the income earned on investing cash collateral, less rebates paid to borrowers and any lending agent fees associated with the loan, plus any premium payments received for lending certain types of securities.
Amounts included in the purchases and sales proceeds columns may include in-kind transactions, if applicable.
Investment Valuation
The following is a summary of the inputs used, as of August 31, 2023, involving the Fund's assets and liabilities carried at fair value. The inputs or methodology used for valuing securities may not be an indication of the risk associated with investing in those securities. For more information on valuation inputs, and their aggregation into the levels used below, please refer to the Investment Valuation section in the accompanying Notes to Financial Statements.
| Valuation Inputs at Reporting Date: |
| Description | Total ($) | Level 1 ($) | Level 2 ($) | Level 3 ($) |
Investments in Securities: | | | | |
|
| Equities: | | | | |
Communication Services | 86,606,269 | 86,071,721 | - | 534,548 |
Consumer Discretionary | 105,897,629 | 105,897,629 | - | - |
Consumer Staples | 67,720,061 | 67,331,622 | 388,439 | - |
Energy | 44,750,360 | 44,750,360 | - | - |
Financials | 128,261,805 | 123,082,988 | 4,428,445 | 750,372 |
Health Care | 129,684,405 | 129,684,405 | - | - |
Industrials | 88,110,821 | 87,669,104 | - | 441,717 |
Information Technology | 266,485,018 | 256,374,924 | 9,070,141 | 1,039,953 |
Materials | 24,685,508 | 24,685,508 | - | - |
Real Estate | 23,246,269 | 23,246,269 | - | - |
Utilities | 24,535,608 | 24,535,608 | - | - |
|
| U.S. Government and Government Agency Obligations | 744,323 | - | 744,323 | - |
|
| Preferred Securities | 62,608 | - | - | 62,608 |
|
| Fixed-Income Funds | 587,007,125 | 587,007,125 | - | - |
|
| Money Market Funds | 24,116,588 | 24,116,588 | - | - |
| Total Investments in Securities: | 1,601,914,397 | 1,584,453,851 | 14,631,348 | 2,829,198 |
Derivative Instruments: | | | | |
|
| Assets | | | | |
Futures Contracts | 495,853 | 495,853 | - | - |
| Total Assets | 495,853 | 495,853 | - | - |
| Total Derivative Instruments: | 495,853 | 495,853 | - | - |
Value of Derivative Instruments
The following table is a summary of the Fund's value of derivative instruments by primary risk exposure as of August 31, 2023. For additional information on derivative instruments, please refer to the Derivative Instruments section in the accompanying Notes to Financial Statements.
Primary Risk Exposure / Derivative Type | Value |
| Asset ($) | Liability ($) |
| Equity Risk | | |
Futures Contracts (a) | 495,853 | 0 |
| Total Equity Risk | 495,853 | 0 |
| Total Value of Derivatives | 495,853 | 0 |
(a)Reflects gross cumulative appreciation (depreciation) on futures contracts as presented in the Schedule of Investments. In the Statement of Assets and Liabilities, the period end daily variation margin is included in receivable or payable for daily variation margin on futures contracts, and the net cumulative appreciation (depreciation) is included in Total accumulated earnings (loss).
| Statement of Assets and Liabilities |
| | | | August 31, 2023 |
| | | | | |
| Assets | | | | |
| Investment in securities, at value (including securities loaned of $939,738) - See accompanying schedule: | | | | |
Unaffiliated issuers (cost $772,916,864) | $ | 990,790,684 | | |
Fidelity Central Funds (cost $670,245,478) | | 611,123,713 | | |
| | | | | |
| | | | | |
| Total Investment in Securities (cost $1,443,162,342) | | | $ | 1,601,914,397 |
| Cash | | | | 42,207 |
| Foreign currency held at value (cost $20,957) | | | | 20,954 |
| Receivable for investments sold | | | | 1,848,739 |
| Receivable for fund shares sold | | | | 880,053 |
| Dividends receivable | | | | 1,309,048 |
| Distributions receivable from Fidelity Central Funds | | | | 121,099 |
| Other receivables | | | | 4,842 |
Total assets | | | | 1,606,141,339 |
| Liabilities | | | | |
| Payable for investments purchased | $ | 1,779,498 | | |
| Payable for fund shares redeemed | | 1,266,147 | | |
| Accrued management fee | | 421,064 | | |
| Payable for daily variation margin on futures contracts | | 25,163 | | |
| Other payables and accrued expenses | | 44,982 | | |
| Collateral on securities loaned | | 1,008,450 | | |
| Total Liabilities | | | | 4,545,304 |
| Net Assets | | | $ | 1,601,596,035 |
| Net Assets consist of: | | | | |
| Paid in capital | | | $ | 1,480,898,514 |
| Total accumulated earnings (loss) | | | | 120,697,521 |
| Net Assets | | | $ | 1,601,596,035 |
Net Asset Value, offering price and redemption price per share ($1,601,596,035 ÷ 118,657,458 shares) | | | $ | 13.50 |
| Statement of Operations |
| | | | Year ended August 31, 2023 |
| Investment Income | | | | |
| Dividends | | | $ | 11,551,768 |
| Interest | | | | 51,307 |
| Income from Fidelity Central Funds (including $15,991 from security lending) | | | | 19,340,357 |
| Total Income | | | | 30,943,432 |
| Expenses | | | | |
| Management fee | $ | 4,446,186 | | |
| Independent trustees' fees and expenses | | 7,164 | | |
| Interest | | 1,079 | | |
| Total expenses before reductions | | 4,454,429 | | |
| Expense reductions | | (3,748) | | |
| Total expenses after reductions | | | | 4,450,681 |
| Net Investment income (loss) | | | | 26,492,751 |
| Realized and Unrealized Gain (Loss) | | | | |
| Net realized gain (loss) on: | | | | |
| Investment Securities: | | | | |
| Unaffiliated issuers (net of foreign taxes of $2,209) | | (24,110,790) | | |
| Fidelity Central Funds | | (2,035,817) | | |
| Foreign currency transactions | | (8,119) | | |
| Futures contracts | | 1,475,448 | | |
| Total net realized gain (loss) | | | | (24,679,278) |
| Change in net unrealized appreciation (depreciation) on: | | | | |
| Investment Securities: | | | | |
| Unaffiliated issuers(net of increase in deferred foreign taxes of $33,713) | | 187,851,869 | | |
| Fidelity Central Funds | | (15,656,720) | | |
| Unfunded commitments | | 10,803 | | |
| Assets and liabilities in foreign currencies | | 4,510 | | |
| Futures contracts | | 437,177 | | |
| Total change in net unrealized appreciation (depreciation) | | | | 172,647,639 |
| Net gain (loss) | | | | 147,968,361 |
| Net increase (decrease) in net assets resulting from operations | | | $ | 174,461,112 |
| Statement of Changes in Net Assets |
| |
| | Year ended August 31, 2023 | | Year ended August 31, 2022 |
| Increase (Decrease) in Net Assets | | | | |
| Operations | | | | |
| Net investment income (loss) | $ | 26,492,751 | $ | 13,741,174 |
| Net realized gain (loss) | | (24,679,278) | | 7,522,273 |
| Change in net unrealized appreciation (depreciation) | | 172,647,639 | | (176,784,241) |
| Net increase (decrease) in net assets resulting from operations | | 174,461,112 | | (155,520,794) |
| Distributions to shareholders | | (46,423,529) | | (45,520,342) |
| | | | | |
| Share transactions | | | | |
| Proceeds from sales of shares | | 629,232,728 | | 536,400,126 |
| Reinvestment of distributions | | 43,706,343 | | 45,520,342 |
| Cost of shares redeemed | | (337,292,021) | | (200,420,552) |
| | | | | |
Net increase (decrease) in net assets resulting from share transactions | | 335,647,050 | | 381,499,916 |
| Total increase (decrease) in net assets | | 463,684,633 | | 180,458,780 |
| | | | | |
| Net Assets | | | | |
| Beginning of period | | 1,137,911,402 | | 957,452,622 |
| End of period | $ | 1,601,596,035 | $ | 1,137,911,402 |
| | | | | |
| Other Information | | | | |
| Shares | | | | |
| Sold | | 51,105,312 | | 38,181,249 |
| Issued in reinvestment of distributions | | 3,722,524 | | 3,233,227 |
| Redeemed | | (27,015,596) | | (14,541,851) |
| Net increase (decrease) | | 27,812,240 | | 26,872,625 |
| | | | | |
Financial Highlights
| Fidelity® Balanced K6 Fund |
| |
| Years ended August 31, | | 2023 | | 2022 | | 2021 | | 2020 | | 2019 A |
Selected Per-Share Data | | | | | | | | | | |
| Net asset value, beginning of period | $ | 12.53 | $ | 14.97 | $ | 12.24 | $ | 10.23 | $ | 10.00 |
| Income from Investment Operations | | | | | | | | | | |
Net investment income (loss) B,C | | .24 | | .17 | | .16 | | .19 | | .04 |
| Net realized and unrealized gain (loss) | | 1.20 | | (1.98) | | 2.87 | | 1.97 | | .20 |
| Total from investment operations | | 1.44 | | (1.81) | | 3.03 | | 2.16 | | .24 |
| Distributions from net investment income | | (.22) | | (.16) | | (.14) | | (.14) | | (.01) |
| Distributions from net realized gain | | (.24) | | (.47) | | (.16) | | (.01) | | - |
| Total distributions | | (.47) D | | (.63) | | (.30) | | (.15) | | (.01) |
| Net asset value, end of period | $ | 13.50 | $ | 12.53 | $ | 14.97 | $ | 12.24 | $ | 10.23 |
Total Return E,F | | 12.09% | | (12.52)% | | 25.14% | | 21.36% | | 2.35% |
Ratios to Average Net Assets C,G,H | | | | | | | | | | |
| Expenses before reductions | | .32% | | .32% | | .32% | | .32% | | .32% I |
| Expenses net of fee waivers, if any | | .32% | | .32% | | .32% | | .32% | | .32% I |
| Expenses net of all reductions | | .32% | | .32% | | .32% | | .31% | | .32% I |
| Net investment income (loss) | | 1.91% | | 1.23% | | 1.14% | | 1.75% | | 2.00% I |
| Supplemental Data | | | | | | | | | | |
| Net assets, end of period (000 omitted) | $ | 1,601,596 | $ | 1,137,911 | $ | 957,453 | $ | 426,979 | $ | 1,629 |
Portfolio turnover rate J | | 33% K | | 38% K | | 42% K | | 76% K | | 6% L |
AFor the period June 14, 2019 (commencement of operations) through August 31, 2019.
BCalculated based on average shares outstanding during the period.
CNet investment income (loss) is affected by the timing of the declaration of dividends by any underlying mutual funds or exchange-traded funds (ETFs). Net investment income (loss) of any mutual funds or ETFs is not included in the Fund's net investment income (loss) ratio.
DTotal distributions per share do not sum due to rounding.
ETotal returns for periods of less than one year are not annualized.
FTotal returns would have been lower if certain expenses had not been reduced during the applicable periods shown.
GFees and expenses of any underlying mutual funds or exchange-traded funds (ETFs) are not included in the Fund's expense ratio. The Fund indirectly bears its proportionate share of these expenses. For additional expense information related to investments in Fidelity Central Funds, please refer to the "Investments in Fidelity Central Funds" note found in the Notes to Financial Statements section of the most recent Annual or Semi-Annual report.
HExpense ratios reflect operating expenses of the class. Expenses before reductions do not reflect amounts reimbursed, waived, or reduced through arrangements with the investment adviser, brokerage services, or other offset arrangements, if applicable, and do not represent the amount paid by the class during periods when reimbursements, waivers or reductions occur.
IAnnualized.
JAmount does not include the portfolio activity of any underlying mutual funds or exchange-traded funds (ETFs).
KPortfolio turnover rate excludes securities received or delivered in-kind.
LAmount not annualized.
For the period ended August 31, 2023
1. Organization.
Fidelity Balanced K6 Fund (the Fund) is a fund of Fidelity Puritan Trust (the Trust) and is authorized to issue an unlimited number of shares. Share transactions on the Statement of Changes in Net Assets may contain exchanges between affiliated funds. The Trust is registered under the Investment Company Act of 1940, as amended (the 1940 Act), as an open-end management investment company organized as a Massachusetts business trust. Shares generally are available only to employer-sponsored retirement plans that are recordkept by Fidelity, or to certain employer-sponsored retirement plans that are not recordkept by Fidelity.
2. Investments in Fidelity Central Funds.
Funds may invest in Fidelity Central Funds, which are open-end investment companies generally available only to other investment companies and accounts managed by the investment adviser and its affiliates. The Schedule of Investments lists any Fidelity Central Funds held as an investment as of period end, but does not include the underlying holdings of each Fidelity Central Fund. An investing fund indirectly bears its proportionate share of the expenses of the underlying Fidelity Central Funds.
Based on its investment objective, each Fidelity Central Fund may invest or participate in various investment vehicles or strategies that are similar to those of the investing fund. These strategies are consistent with the investment objectives of the investing fund and may involve certain economic risks which may cause a decline in value of each of the Fidelity Central Funds and thus a decline in the value of the investing fund.
| Fidelity Central Fund | Investment Manager | Investment Objective | Investment Practices | Expense RatioA | | |
| Fidelity High Income Central Fund | Fidelity Management & Research Company LLC (FMR) | Seeks a high level of income and may also seek capital appreciation by investing primarily in debt securities, preferred stocks, and convertible securities, with an emphasis on lower-quality debt securities. | Loans & Direct Debt Instruments Restricted Securities | .03% | | |
| Fidelity Investment Grade Bond Central Fund | Fidelity Management & Research Company LLC (FMR) | Seeks a high level of income by normally investing in investment-grade debt securities. | Delayed Delivery & When Issued Securities Futures Options Restricted Securities Swaps | Less than .005% | | |
| Fidelity Money Market Central Funds | Fidelity Management & Research Company LLC (FMR) | Each fund seeks to obtain a high level of current income consistent with the preservation of capital and liquidity. | Short-term Investments | Less than .005% | | |
| | | | | | | | |
A Expenses expressed as a percentage of average net assets and are as of each underlying Central Fund's most recent annual or semi-annual shareholder report.
An unaudited holdings listing for the investing fund, which presents direct holdings as well as the pro-rata share of any securities and other investments held indirectly through its investment in underlying non-money market Fidelity Central Funds, is available at fidelity.com and/or institutional.fidelity.com, as applicable. A complete unaudited list of holdings for each Fidelity Central Fund is available upon request or at the Securities and Exchange Commission website at www.sec.gov. In addition, the financial statements of the Fidelity Central Funds which contain the significant accounting policies (including investment valuation policies) of those funds, and are not covered by the Report of Independent Registered Public Accounting Firm, are available on the Securities and Exchange Commission website or upon request.
3. Significant Accounting Policies.
The Fund is an investment company and applies the accounting and reporting guidance of the Financial Accounting Standards Board (FASB) Accounting Standards Codification Topic 946 Financial Services - Investment Companies. The financial statements have been prepared in conformity with accounting principles generally accepted in the United States of America (GAAP), which require management to make certain estimates and assumptions at the date of the financial statements. Actual results could differ from those estimates. Subsequent events, if any, through the date that the financial statements were issued have been evaluated in the preparation of the financial statements. The Fund's Schedule of Investments lists any underlying mutual funds or exchange-traded funds (ETFs) but does not include the underlying holdings of these funds. The following summarizes the significant accounting policies of the Fund:
Investment Valuation. Investments are valued as of 4:00 p.m. Eastern time on the last calendar day of the period. The Board of Trustees (the Board) has designated the Fund's investment adviser as the valuation designee responsible for the fair valuation function and performing fair value determinations as needed. The investment adviser has established a Fair Value Committee (the Committee) to carry out the day-to-day fair valuation responsibilities and has adopted policies and procedures to govern the fair valuation process and the activities of the Committee. In accordance with these fair valuation policies and procedures, which have been approved by the Board, the Fund attempts to obtain prices from one or more third party pricing services or brokers to value its investments. When current market prices, quotations or currency exchange rates are not readily available or reliable, investments will be fair valued in good faith by the Committee, in accordance with the policies and procedures. Factors used in determining fair value vary by investment type and may include market or investment specific events, transaction data, estimated cash flows, and market observations of comparable investments. The frequency that the fair valuation procedures are used cannot be predicted and they may be utilized to a significant extent. The Committee manages the Fund's fair valuation practices and maintains the fair valuation policies and procedures. The Fund's investment adviser reports to the Board information regarding the fair valuation process and related material matters.
The Fund categorizes the inputs to valuation techniques used to value its investments into a disclosure hierarchy consisting of three levels as shown below:
Level 1 - unadjusted quoted prices in active markets for identical investments
Level 2 - other significant observable inputs (including quoted prices for similar investments, interest rates, prepayment speeds, etc.)
Level 3 - unobservable inputs (including the Fund's own assumptions based on the best information available)
Valuation techniques used to value the Fund's investments by major category are as follows:
Equity securities, including restricted securities, for which market quotations are readily available, are valued at the last reported sale price or official closing price as reported by a third party pricing service on the primary market or exchange on which they are traded and are categorized as Level 1 in the hierarchy. In the event there were no sales during the day or closing prices are not available, securities are valued at the last quoted bid price or may be valued using the last available price and are generally categorized as Level 2 in the hierarchy. For foreign equity securities, when market or security specific events arise, comparisons to the valuation of American Depositary Receipts (ADRs), futures contracts, ETFs and certain indexes as well as quoted prices for similar securities may be used and would be categorized as Level 2 in the hierarchy. For equity securities, including restricted securities, where observable inputs are limited, assumptions about market activity and risk are used and these securities may be categorized as Level 3 in the hierarchy.
Debt securities, including restricted securities, are valued based on evaluated prices received from third party pricing services or from brokers who make markets in such securities. Preferred securities and U.S. government and government agency obligations are valued by pricing services who utilize matrix pricing which considers yield or price of bonds of comparable quality, coupon, maturity and type or by broker-supplied prices. When independent prices are unavailable or unreliable, debt securities may be valued utilizing pricing methodologies which consider similar factors that would be used by third party pricing services. Debt securities are generally categorized as Level 2 in the hierarchy but may be Level 3 depending on the circumstances.
Futures contracts are valued at the settlement price established each day by the board of trade or exchange on which they are traded and are categorized as Level 1 in the hierarchy. Investments in open-end mutual funds, including the Fidelity Central Funds, are valued at their closing net asset value (NAV) each business day and are categorized as Level 1 in the hierarchy.
Changes in valuation techniques may result in transfers in or out of an assigned level within the disclosure hierarchy. The aggregate value of investments by input level as of August 31, 2023 is included at the end of the Fund's Schedule of Investments.
Foreign Currency. Certain Funds may use foreign currency contracts to facilitate transactions in foreign-denominated securities. Gains and losses from these transactions may arise from changes in the value of the foreign currency or if the counterparties do not perform under the contracts' terms.
Foreign-denominated assets, including investment securities, and liabilities are translated into U.S. dollars at the exchange rates at period end. Purchases and sales of investment securities, income and dividends received, and expenses denominated in foreign currencies are translated into U.S. dollars at the exchange rate in effect on the transaction date.
The effects of exchange rate fluctuations on investments are included with the net realized and unrealized gain (loss) on investment securities. Other foreign currency transactions resulting in realized and unrealized gain (loss) are disclosed separately.
Investment Transactions and Income. For financial reporting purposes, the Fund's investment holdings and NAV include trades executed through the end of the last business day of the period. The NAV per share for processing shareholder transactions is calculated as of the close of business of the New York Stock Exchange (NYSE), normally 4:00 p.m. Eastern time and includes trades executed through the end of the prior business day. Gains and losses on securities sold are determined on the basis of identified cost and include proceeds received from litigation. Commissions paid to certain brokers with whom the investment adviser, or its affiliates, places trades on behalf of a fund include an amount in addition to trade execution, which may be rebated back to a fund. Any such rebates are included in net realized gain (loss) on investments in the Statement of Operations. Dividend income is recorded on the ex-dividend date, except for certain dividends from foreign securities where the ex-dividend date may have passed, which are recorded as soon as the Fund is informed of the ex-dividend date. Non-cash dividends included in dividend income, if any, are recorded at the fair market value of the securities received. Income and capital gain distributions from Fidelity Central Funds, if any, are recorded on the ex-dividend date. Certain distributions received by the Fund represent a return of capital or capital gain. The Fund determines the components of these distributions subsequent to the ex-dividend date, based upon receipt of tax filings or other correspondence relating to the underlying investment. These distributions are recorded as a reduction of cost of investments and/or as a realized gain. Interest income is accrued as earned and includes coupon interest and amortization of premium and accretion of discount on debt securities as applicable. Investment income is recorded net of foreign taxes withheld where recovery of such taxes is uncertain. Funds may file withholding tax reclaims in certain jurisdictions to recover a portion of amounts previously withheld. Any withholding tax reclaims income is included in the Statement of Operations in dividends. Any receivables for withholding tax reclaims are included in the Statement of Assets and Liabilities in dividends receivable.
Expenses. Expenses directly attributable to a fund are charged to that fund. Expenses attributable to more than one fund are allocated among the respective funds on the basis of relative net assets or other appropriate methods. Expenses included in the accompanying financial statements reflect the expenses of that fund and do not include any expenses associated with any underlying mutual funds or exchange-traded funds. Although not included in a fund's expenses, a fund indirectly bears its proportionate share of these expenses through the net asset value of each underlying mutual fund or exchange-traded fund. Expense estimates are accrued in the period to which they relate and adjustments are made when actual amounts are known.
Income Tax Information and Distributions to Shareholders. Each year, the Fund intends to qualify as a regulated investment company under Subchapter M of the Internal Revenue Code, including distributing substantially all of its taxable income and realized gains. As a result, no provision for U.S. Federal income taxes is required. As of August 31, 2023, the Fund did not have any unrecognized tax benefits in the financial statements; nor is the Fund aware of any tax positions for which it is reasonably possible that the total amounts of unrecognized tax benefits will significantly change in the next twelve months. The Fund files a U.S. federal tax return, in addition to state and local tax returns as required. The Fund's federal income tax returns are subject to examination by the Internal Revenue Service (IRS) for a period of three fiscal years after they are filed. State and local tax returns may be subject to examination for an additional fiscal year depending on the jurisdiction. Foreign taxes are provided for based on the Fund's understanding of the tax rules and rates that exist in the foreign markets in which it invests. The Fund is subject to a tax imposed on capital gains by certain countries in which it invests. An estimated deferred tax liability for net unrealized appreciation on the applicable securities is included in Other payables and accrued expenses on the Statement of Assets & Liabilities.
Distributions are declared and recorded on the ex-dividend date. Income and capital gain distributions are determined in accordance with income tax regulations, which may differ from GAAP.
Capital accounts within the financial statements are adjusted for permanent book-tax differences. These adjustments have no impact on net assets or the results of operations. Capital accounts are not adjusted for temporary book-tax differences which will reverse in a subsequent period.
Book-tax differences are primarily due to futures contracts, foreign currency transactions, certain foreign taxes, passive foreign investment companies (PFIC), market discount, partnerships, capital loss carryforwards and losses deferred due to wash sales and excise tax regulations.
As of period end, the cost and unrealized appreciation (depreciation) in securities, and derivatives if applicable, for federal income tax purposes were as follows:
| Gross unrealized appreciation | $244,576,844 |
| Gross unrealized depreciation | (90,960,140) |
| Net unrealized appreciation (depreciation) | $153,616,704 |
| Tax Cost | $1,448,297,693 |
The tax-based components of distributable earnings as of period end were as follows:
| Undistributed ordinary income | $5,548,705 |
| Capital loss carryforward | $(38,423,880) |
| Net unrealized appreciation (depreciation) on securities and other investments | $153,617,679 |
Capital loss carryforwards are only available to offset future capital gains of the Fund to the extent provided by regulations and may be limited. The capital loss carryforward information presented below, including any applicable limitation, is estimated as of fiscal period end and is subject to adjustment.
The tax character of distributions paid was as follows:
| | August 31, 2023 | August 31, 2022 |
| Ordinary Income | $24,493,428 | $ 29,293,650 |
| Long-term Capital Gains | 21,930,101 | 16,226,692 |
| Total | $46,423,529 | $ 45,520,342 |
Restricted Securities (including Private Placements). Funds may invest in securities that are subject to legal or contractual restrictions on resale. These securities generally may be resold in transactions exempt from registration or to the public if the securities are registered. Disposal of these securities may involve time-consuming negotiations and expense, and prompt sale at an acceptable price may be difficult. Information regarding restricted securities held at period end is included at the end of the Schedule of Investments, if applicable.
4. Derivative Instruments.
Risk Exposures and the Use of Derivative Instruments. The Fund's investment objectives allow for various types of derivative instruments, including futures contracts. Derivatives are investments whose value is primarily derived from underlying assets, indices or reference rates and may be transacted on an exchange or over-the-counter (OTC). Derivatives may involve a future commitment to buy or sell a specified asset based on specified terms, to exchange future cash flows at periodic intervals based on a notional principal amount, or for one party to make one or more payments upon the occurrence of specified events in exchange for periodic payments from the other party.
Derivatives were used to increase returns and to manage exposure to certain risks as defined below. The success of any strategy involving derivatives depends on analysis of numerous economic factors, and if the strategies for investment do not work as intended, the objectives may not be achieved.
Derivatives were used to increase or decrease exposure to the following risk(s):
| | |
| Equity Risk | Equity risk relates to the fluctuations in the value of financial instruments as a result of changes in market prices (other than those arising from interest rate risk or foreign exchange risk), whether caused by factors specific to an individual investment, its issuer, or all factors affecting all instruments traded in a market or market segment. |
Funds are also exposed to additional risks from investing in derivatives, such as liquidity risk and counterparty credit risk. Liquidity risk is the risk that a fund will be unable to close out the derivative in the open market in a timely manner. Counterparty credit risk is the risk that the counterparty will not be able to fulfill its obligation to a fund. Counterparty credit risk related to exchange-traded contracts may be mitigated by the protection provided by the exchange on which they trade.
Investing in derivatives may involve greater risks than investing in the underlying assets directly and, to varying degrees, may involve risk of loss in excess of any initial investment and collateral received and amounts recognized in the Statement of Assets and Liabilities. In addition, there may be the risk that the change in value of the derivative contract does not correspond to the change in value of the underlying instrument.
Futures Contracts. A futures contract is an agreement between two parties to buy or sell a specified underlying instrument for a fixed price at a specified future date. Futures contracts were used to manage exposure to the stock market.
Upon entering into a futures contract, a fund is required to deposit either cash or securities (initial margin) with a clearing broker in an amount equal to a certain percentage of the face value of the contract. Futures contracts are marked-to-market daily and subsequent daily payments are made or received by a fund depending on the daily fluctuations in the value of the futures contracts and are recorded as unrealized appreciation or (depreciation). This receivable and/or payable, if any, is included in daily variation margin on futures contracts in the Statement of Assets and Liabilities. Realized gain or (loss) is recorded upon the expiration or closing of a futures contract. The net realized gain (loss) and change in net unrealized appreciation (depreciation) on futures contracts during the period is presented in the Statement of Operations.
Any open futures contracts at period end are presented in the Schedule of Investments under the caption "Futures Contracts". The notional amount at value reflects each contract's exposure to the underlying instrument or index at period end, and is representative of volume of activity during the period unless an average notional amount is presented. Any securities deposited to meet initial margin requirements are identified in the Schedule of Investments. Any cash deposited to meet initial margin requirements is presented as segregated cash with brokers for derivative instruments in the Statement of Assets and Liabilities.
5. Purchases and Sales of Investments.
Purchases and sales of securities, other than short-term securities, U.S. government securities and in-kind transactions, as applicable, are noted in the table below.
| | Purchases ($) | Sales ($) |
| Fidelity Balanced K6 Fund | 448,667,779 | 453,761,957 |
Unaffiliated Exchanges In-Kind. Shares that were exchanged for investments, including accrued interest and cash, if any, are shown in the table below. The amount of in-kind exchanges is included in share transactions in the accompanying Statement of Changes in Net Assets.
| | Shares | Total Proceeds ($) |
| Fidelity Balanced K6 Fund | 26,952,681 | 327,304,143 |
Prior Year Unaffiliated Exchanges In-Kind. Shares that were exchanged for investments, including accrued interest and cash, if any, are shown in the table below. The amount of in-kind exchanges is included in share transactions in the accompanying Statement of Changes in Net Assets.
| | Shares | Total Proceeds ($) |
| Fidelity Balanced K6 Fund | 15,411,272 | 216,180,050 |
6. Fees and Other Transactions with Affiliates.
Management Fee. Fidelity Management & Research Company LLC (the investment adviser) and its affiliates provide the Fund with investment management related services for which the Fund pays a monthly management fee that is based on an annual rate of .32% of average net assets. Under the management contract, the investment adviser or an affiliate pays all other expenses of the Fund, excluding fees and expenses of the independent Trustees, and certain miscellaneous expenses such as proxy and shareholder meeting expenses.
Brokerage Commissions. A portion of portfolio transactions were placed with brokerage firms which are affiliates of the investment adviser. Brokerage commissions are included in net realized gain (loss) and change in net unrealized appreciation (depreciation) in the Statement of Operations. The commissions paid to these affiliated firms were as follows:
| | Amount |
| Fidelity Balanced K6 Fund | $ 5,928 |
Interfund Lending Program. Pursuant to an Exemptive Order issued by the Securities and Exchange Commission (the SEC), the Fund, along with other registered investment companies having management contracts with Fidelity Management & Research Company LLC (FMR), or other affiliated entities of FMR, may participate in an interfund lending program. This program provides an alternative credit facility allowing the Fund to borrow from, or lend money to, other participating affiliated funds. At period end, there were no interfund loans outstanding. Activity in this program during the period for which loans were outstanding was as follows:
| | Borrower or Lender | Average Loan Balance | Weighted Average Interest Rate | Interest Expense |
| Fidelity Balanced K6 Fund | Borrower | $ 7,306,000 | 5.32% | $1,079 |
Interfund Trades. Funds may purchase from or sell securities to other Fidelity Funds under procedures adopted by the Board. The procedures have been designed to ensure these interfund trades are executed in accordance with Rule 17a-7 of the 1940 Act. Any interfund trades are included within the respective purchases and sales amounts shown in the Purchases and Sales of Investments note. Interfund trades during the period are noted in the table below.
| | Purchases ($) | Sales ($) | Realized Gain (Loss) ($) |
| Fidelity Balanced K6 Fund | 19,273,160 | 25,774,726 | (1,580,290) |
Other. During the period, the investment adviser reimbursed the Fund for certain losses as follows:
| | Amount ($) |
| Fidelity Balanced K6 Fund | 4,293 |
7. Committed Line of Credit.
Certain Funds participate with other funds managed by the investment adviser or an affiliate in a $4.25 billion credit facility (the "line of credit") to be utilized for temporary or emergency purposes to fund shareholder redemptions or for other short-term liquidity purposes. The commitment fees on the pro-rata portion of the line of credit are borne by the investment adviser. During the period, there were no borrowings on this line of credit.
8. Security Lending.
Funds lend portfolio securities from time to time in order to earn additional income. Lending agents are used, including National Financial Services (NFS), an affiliate of the investment adviser. Pursuant to a securities lending agreement, NFS will receive a fee, which is capped at 9.9% of a fund's daily lending revenue, for its services as lending agent. A fund may lend securities to certain qualified borrowers, including NFS. On the settlement date of the loan, a fund receives collateral (in the form of U.S. Treasury obligations, letters of credit and/or cash) against the loaned securities and maintains collateral in an amount not less than 100% of the market value of the loaned securities during the period of the loan. The market value of the loaned securities is determined at the close of business of a fund and any additional required collateral is delivered to a fund on the next business day. A fund or borrower may terminate the loan at any time, and if the borrower defaults on its obligation to return the securities loaned because of insolvency or other reasons, a fund may apply collateral received from the borrower against the obligation. A fund may experience delays and costs in recovering the securities loaned. Any cash collateral received is invested in the Fidelity Securities Lending Cash Central Fund. Any loaned securities are identified as such in the Schedule of Investments, and the value of loaned securities and cash collateral at period end, as applicable, are presented in the Statement of Assets and Liabilities. Security lending income represents the income earned on investing cash collateral, less rebates paid to borrowers and any lending agent fees associated with the loan, plus any premium payments received for lending certain types of securities. Security lending income is presented in the Statement of Operations as a component of income from Fidelity Central Funds. Affiliated security lending activity, if any, was as follows:
| | Total Security Lending Fees Paid to NFS | Security Lending Income From Securities Loaned to NFS | Value of Securities Loaned to NFS at Period End |
| Fidelity Balanced K6 Fund | $1,667 | $2,710 | $- |
9. Expense Reductions.
Through arrangements with the Fund's custodian, credits realized as a result of certain uninvested cash balances were used to reduce the Fund's expenses by $3,748.
10. Other.
A fund's organizational documents provide former and current trustees and officers with a limited indemnification against liabilities arising in connection with the performance of their duties to the fund. In the normal course of business, a fund may also enter into contracts that provide general indemnifications. A fund's maximum exposure under these arrangements is unknown as this would be dependent on future claims that may be made against a fund. The risk of material loss from such claims is considered remote.
11. Risk and Uncertainties.
Many factors affect a fund's performance. Developments that disrupt global economies and financial markets, such as pandemics, epidemics, outbreaks of infectious diseases, war, terrorism, and environmental disasters, may significantly affect a fund's investment performance. The effects of these developments to a fund will be impacted by the types of securities in which a fund invests, the financial condition, industry, economic sector, and geographic location of an issuer, and a fund's level of investment in the securities of that issuer. Significant concentrations in security types, issuers, industries, sectors, and geographic locations may magnify the factors that affect a fund's performance.
To the Board of Trustees of Fidelity Puritan Trust and Shareholders of Fidelity Balanced K6 Fund
Opinion on the Financial Statements
We have audited the accompanying statement of assets and liabilities, including the schedule of investments, of Fidelity Balanced K6 Fund (one of the funds constituting Fidelity Puritan Trust, referred to hereafter as the "Fund") as of August 31, 2023, the related statement of operations for the year ended August 31, 2023, the statement of changes in net assets for each of the two years in the period ended August 31, 2023, including the related notes, and the financial highlights for each of the four years in the period ended August 31, 2023 and for the period June 14, 2019 (commencement of operations) through August 31, 2019 (collectively referred to as the "financial statements"). In our opinion, the financial statements present fairly, in all material respects, the financial position of the Fund as of August 31, 2023, the results of its operations for the year then ended, the changes in its net assets for each of the two years in the period ended August 31, 2023 and the financial highlights for each of the four years in the period ended August 31, 2023 and for the period June 14, 2019 (commencement of operations) through August 31, 2019 in conformity with accounting principles generally accepted in the United States of America.
Basis for Opinion
These financial statements are the responsibility of the Fund's management. Our responsibility is to express an opinion on the Fund's financial statements based on our audits. We are a public accounting firm registered with the Public Company Accounting Oversight Board (United States) (PCAOB) and are required to be independent with respect to the Fund in accordance with the U.S. federal securities laws and the applicable rules and regulations of the Securities and Exchange Commission and the PCAOB.
We conducted our audits of these financial statements in accordance with the standards of the PCAOB. Those standards require that we plan and perform the audit to obtain reasonable assurance about whether the financial statements are free of material misstatement, whether due to error or fraud.
Our audits included performing procedures to assess the risks of material misstatement of the financial statements, whether due to error or fraud, and performing procedures that respond to those risks. Such procedures included examining, on a test basis, evidence regarding the amounts and disclosures in the financial statements. Our audits also included evaluating the accounting principles used and significant estimates made by management, as well as evaluating the overall presentation of the financial statements. Our procedures included confirmation of securities owned as of August 31, 2023 by correspondence with the custodian, issuers of privately offered securities and brokers; when replies were not received from brokers, we performed other auditing procedures. We believe that our audits provide a reasonable basis for our opinion.
/s/ PricewaterhouseCoopers LLP
Boston, Massachusetts
October 12, 2023
We have served as the auditor of one or more investment companies in the Fidelity group of funds since 1932.
The Trustees, Members of the Advisory Board (if any), and officers of the trust and fund, as applicable, are listed below. The Board of Trustees governs the fund and is responsible for protecting the interests of shareholders. The Trustees are experienced executives who meet periodically throughout the year to oversee the fund's activities, review contractual arrangements with companies that provide services to the fund, oversee management of the risks associated with such activities and contractual arrangements, and review the fund's performance. Except for Jonathan Chiel, each of the Trustees oversees 322 funds. Mr. Chiel oversees 191 funds.
The Trustees hold office without limit in time except that (a) any Trustee may resign; (b) any Trustee may be removed by written instrument, signed by at least two-thirds of the number of Trustees prior to such removal; (c) any Trustee who requests to be retired or who has become incapacitated by illness or injury may be retired by written instrument signed by a majority of the other Trustees; and (d) any Trustee may be removed at any special meeting of shareholders by a two-thirds vote of the outstanding voting securities of the trust. Each Trustee who is not an interested person (as defined in the 1940 Act) of the trust and the fund is referred to herein as an Independent Trustee. Each Independent Trustee shall retire not later than the last day of the calendar year in which his or her 75th birthday occurs. The Independent Trustees may waive this mandatory retirement age policy with respect to individual Trustees. Officers and Advisory Board Members hold office without limit in time, except that any officer or Advisory Board Member may resign or may be removed by a vote of a majority of the Trustees at any regular meeting or any special meeting of the Trustees. Except as indicated, each individual has held the office shown or other offices in the same company for the past five years.
The fund's Statement of Additional Information (SAI) includes more information about the Trustees. To request a free copy, call Fidelity at 1-800-835-5092.
Experience, Skills, Attributes, and Qualifications of the Trustees. The Governance and Nominating Committee has adopted a statement of policy that describes the experience, qualifications, attributes, and skills that are necessary and desirable for potential Independent Trustee candidates (Statement of Policy). The Board believes that each Trustee satisfied at the time he or she was initially elected or appointed a Trustee, and continues to satisfy, the standards contemplated by the Statement of Policy. The Governance and Nominating Committee also engages professional search firms to help identify potential Independent Trustee candidates who have the experience, qualifications, attributes, and skills consistent with the Statement of Policy. From time to time, additional criteria based on the composition and skills of the current Independent Trustees, as well as experience or skills that may be appropriate in light of future changes to board composition, business conditions, and regulatory or other developments, have also been considered by the professional search firms and the Governance and Nominating Committee. In addition, the Board takes into account the Trustees' commitment and participation in Board and committee meetings, as well as their leadership of standing and ad hoc committees throughout their tenure.
In determining that a particular Trustee was and continues to be qualified to serve as a Trustee, the Board has considered a variety of criteria, none of which, in isolation, was controlling. The Board believes that, collectively, the Trustees have balanced and diverse experience, qualifications, attributes, and skills, which allow the Board to operate effectively in governing the fund and protecting the interests of shareholders. Information about the specific experience, skills, attributes, and qualifications of each Trustee, which in each case led to the Board's conclusion that the Trustee should serve (or continue to serve) as a trustee of the fund, is provided below.
Board Structure and Oversight Function. Robert A. Lawrence is an interested person and currently serves as Chair. The Trustees have determined that an interested Chair is appropriate and benefits shareholders because an interested Chair has a personal and professional stake in the quality and continuity of services provided to the fund. Independent Trustees exercise their informed business judgment to appoint an individual of their choosing to serve as Chair, regardless of whether the Trustee happens to be independent or a member of management. The Independent Trustees have determined that they can act independently and effectively without having an Independent Trustee serve as Chair and that a key structural component for assuring that they are in a position to do so is for the Independent Trustees to constitute a substantial majority for the Board. The Independent Trustees also regularly meet in executive session. David M. Thomas serves as Lead Independent Trustee and as such (i) acts as a liaison between the Independent Trustees and management with respect to matters important to the Independent Trustees and (ii) with management prepares agendas for Board meetings.
Fidelity® funds are overseen by different Boards of Trustees. The fund's Board oversees Fidelity's high income and certain equity funds, and other Boards oversee Fidelity's alternative investment, investment-grade bond, money market, asset allocation, and other equity funds. The asset allocation funds may invest in Fidelity® funds overseen by the fund's Board. The use of separate Boards, each with its own committee structure, allows the Trustees of each group of Fidelity® funds to focus on the unique issues of the funds they oversee, including common research, investment, and operational issues. On occasion, the separate Boards establish joint committees to address issues of overlapping consequences for the Fidelity® funds overseen by each Board.
The Trustees operate using a system of committees to facilitate the timely and efficient consideration of all matters of importance to the Trustees, the fund, and fund shareholders and to facilitate compliance with legal and regulatory requirements and oversight of the fund's activities and associated risks. The Board, acting through its committees, has charged FMR and its affiliates with (i) identifying events or circumstances the occurrence of which could have demonstrably adverse effects on the fund's business and/or reputation; (ii) implementing processes and controls to lessen the possibility that such events or circumstances occur or to mitigate the effects of such events or circumstances if they do occur; and (iii) creating and maintaining a system designed to evaluate continuously business and market conditions in order to facilitate the identification and implementation processes described in (i) and (ii) above. Because the day-to-day operations and activities of the fund are carried out by or through FMR, its affiliates, and other service providers, the fund's exposure to risks is mitigated but not eliminated by the processes overseen by the Trustees. While each of the Board's committees has responsibility for overseeing different aspects of the fund's activities, oversight is exercised primarily through the Operations, Audit, and Compliance Committees. Appropriate personnel, including but not limited to the fund's Chief Compliance Officer (CCO), FMR's internal auditor, the independent accountants, the fund's Treasurer and portfolio management personnel, make periodic reports to the Board's committees, as appropriate, including an annual review of Fidelity's risk management program for the Fidelity® funds. The responsibilities of each standing committee, including their oversight responsibilities, are described further under "Standing Committees of the Trustees."
Interested Trustees*:
Correspondence intended for a Trustee who is an interested person may be sent to Fidelity Investments, 245 Summer Street, Boston, Massachusetts 02210.
Name, Year of Birth; Principal Occupations and Other Relevant Experience+
Jonathan Chiel (1957)
Year of Election or Appointment: 2016
Trustee
Mr. Chiel also serves as Trustee of other Fidelity® funds. Mr. Chiel is Executive Vice President and General Counsel for FMR LLC (diversified financial services company, 2012-present). Previously, Mr. Chiel served as general counsel (2004-2012) and senior vice president and deputy general counsel (2000-2004) for John Hancock Financial Services; a partner with Choate, Hall & Stewart (1996-2000) (law firm); and an Assistant United States Attorney for the United States Attorney's Office of the District of Massachusetts (1986-95), including Chief of the Criminal Division (1993-1995). Mr. Chiel is a director on the boards of the Boston Bar Foundation and the Maimonides School.
Bettina Doulton (1964)
Year of Election or Appointment: 2021
Trustee
Ms. Doulton also serves as Trustee of other Fidelity® funds. Prior to her retirement, Ms. Doulton served in a variety of positions at Fidelity Investments, including as a managing director of research (2006-2007), portfolio manager to certain Fidelity® funds (1993-2005), equity analyst and portfolio assistant (1990-1993), and research assistant (1987-1990). Ms. Doulton currently owns and operates Phi Builders + Architects and Cellardoor Winery. Previously, Ms. Doulton served as a member of the Board of Brown Capital Management, LLC (2014-2018).
Robert A. Lawrence (1952)
Year of Election or Appointment: 2020
Trustee
Chair of the Board of Trustees
Mr. Lawrence also serves as Trustee of other funds. Previously, Mr. Lawrence served as a Trustee and Member of the Advisory Board of certain funds. Prior to his retirement in 2008, Mr. Lawrence served as Vice President of certain Fidelity® funds (2006-2008), Senior Vice President, Head of High Income Division of Fidelity Management & Research Company (investment adviser firm, 2006-2008), and President of Fidelity Strategic Investments (investment adviser firm, 2002-2005).
* Determined to be an "Interested Trustee" by virtue of, among other things, his or her affiliation with the trust or various entities under common control with FMR.
+ The information includes the Trustee's principal occupation during the last five years and other information relating to the experience, attributes, and skills relevant to the Trustee's qualifications to serve as a Trustee, which led to the conclusion that the Trustee should serve as a Trustee for the fund.
Independent Trustees:
Correspondence intended for an Independent Trustee may be sent to Fidelity Investments, P.O. Box 55235, Boston, Massachusetts 02205-5235.
Name, Year of Birth; Principal Occupations and Other Relevant Experience+
Thomas P. Bostick (1956)
Year of Election or Appointment: 2021
Trustee
Lieutenant General Bostick also serves as Trustee of other Fidelity® funds. Prior to his retirement, General Bostick (United States Army, Retired) held a variety of positions within the U.S. Army, including Commanding General and Chief of Engineers, U.S. Army Corps of Engineers (2012-2016) and Deputy Chief of Staff and Director of Human Resources, U.S. Army (2009-2012). General Bostick currently serves as a member of the Board and Finance and Governance & Sustainability Committees of CSX Corporation (transportation, 2020-present) and a member of the Board and Corporate Governance and Nominating Committee of Perma-Fix Environmental Services, Inc. (nuclear waste management, 2020-present). General Bostick serves as Chief Executive Officer of Bostick Global Strategies, LLC (consulting, 2016-present), as a member of the Board of HireVue, Inc. (video interview and assessment, 2020-present), as a member of the Board of Allonnia (biotechnology and engineering solutions, 2022-present) and on the Advisory Board of Solugen, Inc. (specialty bio-based chemicals manufacturer, 2022-present). Previously, General Bostick served as a Member of the Advisory Board of certain Fidelity® funds (2021), President, Intrexon Bioengineering (2018-2020) and Chief Operating Officer (2017-2020) and Senior Vice President of the Environment Sector (2016-2017) of Intrexon Corporation (biopharmaceutical company).
Dennis J. Dirks (1948)
Year of Election or Appointment: 2005
Trustee
Mr. Dirks also serves as Trustee of other Fidelity® funds. Prior to his retirement in May 2003, Mr. Dirks served as Chief Operating Officer and as a member of the Board of The Depository Trust & Clearing Corporation (financial markets infrastructure), President, Chief Operating Officer and a member of the Board of The Depository Trust Company (DTC), President and a member of the Board of the National Securities Clearing Corporation (NSCC), Chief Executive Officer and a member of the Board of the Government Securities Clearing Corporation and Chief Executive Officer and a member of the Board of the Mortgage-Backed Securities Clearing Corporation. Mr. Dirks currently serves as a member of the Finance Committee (2016-present) and Board (2017-present) and is Treasurer (2018-present) of the Asolo Repertory Theatre.
Donald F. Donahue (1950)
Year of Election or Appointment: 2018
Trustee
Mr. Donahue also serves as Trustee of other Fidelity® funds. Mr. Donahue serves as President and Chief Executive Officer of Miranda Partners, LLC (risk consulting for the financial services industry, 2012-present). Previously, Mr. Donahue served as Chief Executive Officer (2006-2012), Chief Operating Officer (2003-2006) and Managing Director, Customer Marketing and Development (1999-2003) of The Depository Trust & Clearing Corporation (financial markets infrastructure). Mr. Donahue currently serves as a member (2007-present) and Co-Chairman (2016-present) of the Board of United Way of New York. Mr. Donahue previously served as a member of the Advisory Board of certain Fidelity® funds (2015-2018) and as a member of the Board of The Leadership Academy (previously NYC Leadership Academy) (2012-2022).
Vicki L. Fuller (1957)
Year of Election or Appointment: 2020
Trustee
Ms. Fuller also serves as Trustee of other Fidelity® funds. Previously, Ms. Fuller served as a member of the Advisory Board of certain Fidelity® funds (2018-2020), Chief Investment Officer of the New York State Common Retirement Fund (2012-2018) and held a variety of positions at AllianceBernstein L.P. (global asset management, 1985-2012), including Managing Director (2006-2012) and Senior Vice President and Senior Portfolio Manager (2001-2006). Ms. Fuller currently serves as a member of the Board, Audit Committee and Nominating and Governance Committee of two Blackstone business development companies (2020-present), as a member of the Board of Treliant, LLC (consulting, 2019-present), as a member of the Board of Ariel Alternatives, LLC (private equity, 2022-present) and as a member of the Board and Chair of the Audit Committee of Gusto, Inc. (software, 2021-present). In addition, Ms. Fuller currently serves as a member of the Board of Roosevelt University (2019-present) and as a member of the Executive Board of New York University's Stern School of Business. Ms. Fuller previously served as a member of the Board, Audit Committee and Nominating and Governance Committee of The Williams Companies, Inc. (natural gas infrastructure, 2018-2021).
Patricia L. Kampling (1959)
Year of Election or Appointment: 2020
Trustee
Ms. Kampling also serves as Trustee of other Fidelity® funds. Prior to her retirement, Ms. Kampling served as Chairman of the Board and Chief Executive Officer (2012-2019), President and Chief Operating Officer (2011-2012) and Executive Vice President and Chief Financial Officer (2010-2011) of Alliant Energy Corporation. Ms. Kampling currently serves as a member of the Board, Finance Committee and Governance, Compensation and Nominating Committee of Xcel Energy Inc. (utilities company, 2020-present) and as a member of the Board, Audit, Finance and Risk Committee and Safety, Environmental, Technology and Operations Committee and Chair of the Executive Development and Compensation Committee of American Water Works Company, Inc. (utilities company, 2019-present). In addition, Ms. Kampling currently serves as a member of the Board of the Nature Conservancy, Wisconsin Chapter (2019-present). Previously, Ms. Kampling served as a Member of the Advisory Board of certain Fidelity® funds (2020), a member of the Board, Compensation Committee and Executive Committee and Chair of the Audit Committee of Briggs & Stratton Corporation (manufacturing, 2011-2021), a member of the Board of Interstate Power and Light Company (2012-2019) and Wisconsin Power and Light Company (2012-2019) (each a subsidiary of Alliant Energy Corporation) and as a member of the Board and Workforce Development Committee of the Business Roundtable (2018-2019).
Thomas A. Kennedy (1955)
Year of Election or Appointment: 2021
Trustee
Mr. Kennedy also serves as Trustee of other Fidelity® funds. Previously, Mr. Kennedy served as a Member of the Advisory Board of certain Fidelity® funds (2020) and held a variety of positions at Raytheon Company (aerospace and defense, 1983-2020), including Chairman and Chief Executive Officer (2014-2020) and Executive Vice President and Chief Operating Officer (2013-2014). Mr. Kennedy served as Executive Chairman of the Board of Directors of Raytheon Technologies Corporation (aerospace and defense, 2020-2021). Mr. Kennedy serves as a Director of the Board of Directors of Textron Inc. (aerospace and defense, 2023-present).
Oscar Munoz (1959)
Year of Election or Appointment: 2021
Trustee
Mr. Munoz also serves as Trustee of other Fidelity® funds. Prior to his retirement, Mr. Munoz served as Executive Chairman (2020-2021), Chief Executive Officer (2015-2020), President (2015-2016) and a member of the Board (2010-2021) of United Airlines Holdings, Inc. Mr. Munoz currently serves as a member of the Board of CBRE Group, Inc. (commercial real estate, 2020-present), a member of the Board of Univision Communications, Inc. (Hispanic media, 2020-present), a member of the Board of Archer Aviation Inc. (2021-present), a member of the Defense Business Board of the United States Department of Defense (2021-present) and a member of the Board of Salesforce.com, Inc. (cloud-based software, 2022-present). Previously, Mr. Munoz served as a Member of the Advisory Board of certain Fidelity® funds (2021).
David M. Thomas (1949)
Year of Election or Appointment: 2008
Trustee
Lead Independent Trustee
Mr. Thomas also serves as Trustee of other Fidelity® funds. Previously, Mr. Thomas served as Executive Chairman (2005-2006) and Chairman and Chief Executive Officer (2000-2005) of IMS Health, Inc. (pharmaceutical and healthcare information solutions). Mr. Thomas currently serves as a member of the Board of Fortune Brands Home and Security (home and security products, 2004-present) and as Director (2013-present) and Non-Executive Chairman of the Board (2022-present) of Interpublic Group of Companies, Inc. (marketing communication).
Susan Tomasky (1953)
Year of Election or Appointment: 2020
Trustee
Ms. Tomasky also serves as Trustee of other Fidelity® funds. Prior to her retirement, Ms. Tomasky served in various executive officer positions at American Electric Power Company, Inc. (1998-2011), including most recently as President of AEP Transmission (2007-2011). Ms. Tomasky currently serves as a member of the Board and Sustainability Committee and as Chair of the Audit Committee of Marathon Petroleum Corporation (2018-present) and as a member of the Board, Executive Committee, Corporate Governance Committee and Organization and Compensation Committee and as Lead Director of the Board of Public Service Enterprise Group, Inc. (utilities company, 2012-present) and as a member of the Board of its subsidiary company, Public Service Electric and Gas Co. (2021-present). In addition, Ms. Tomasky currently serves as a member (2009-present) and President (2020-present) of the Board of the Royal Shakespeare Company - America (2009-present), as a member of the Board of the Columbus Association for the Performing Arts (2011-present) and as a member of the Board and Kenyon in the World Committee of Kenyon College (2016-present). Previously, Ms. Tomasky served as a Member of the Advisory Board of certain Fidelity® funds (2020), as a member of the Board of the Columbus Regional Airport Authority (2007-2020), as a member of the Board (2011-2018) and Lead Independent Director (2015-2018) of Andeavor Corporation (previously Tesoro Corporation) (independent oil refiner and marketer) and as a member of the Board of Summit Midstream Partners LP (energy, 2012-2018).
Michael E. Wiley (1950)
Year of Election or Appointment: 2020
Trustee
Mr. Wiley also serves as Trustee of other Fidelity® funds. Previously, Mr. Wiley served as a member of the Advisory Board of certain Fidelity® funds (2018-2020), Chairman, President and CEO of Baker Hughes, Inc. (oilfield services, 2000-2004). Mr. Wiley also previously served as a member of the Board of Andeavor Corporation (independent oil refiner and marketer, 2005-2018), a member of the Board of Andeavor Logistics LP (natural resources logistics, 2015-2018) and a member of the Board of High Point Resources (exploration and production, 2005-2020).
+ The information includes the Trustee's principal occupation during the last five years and other information relating to the experience, attributes, and skills relevant to the Trustee's qualifications to serve as a Trustee, which led to the conclusion that the Trustee should serve as a Trustee for the fund.
Advisory Board Members and Officers:
Correspondence intended for a Member of the Advisory Board (if any) may be sent to Fidelity Investments, P.O. Box 55235, Boston, Massachusetts 02205-5235. Correspondence intended for an officer or Peter S. Lynch may be sent to Fidelity Investments, 245 Summer Street, Boston, Massachusetts 02210. Officers appear below in alphabetical order.
Name, Year of Birth; Principal Occupation
Vijay C. Advani (1960)
Year of Election or Appointment: 2023
Member of the Advisory Board
Mr. Advani also serves as Trustee or Member of the Advisory Board of other funds. Previously, Mr. Advani served as Executive Chairman (2020-2022), Chief Executive Officer (2017-2020) and Chief Operating Officer (2016-2017) of Nuveen (global investment manager). He also served in various capacities at Franklin Resources (global investment manager), including Co-President (2015-2016), Executive Vice President, Global Advisory Services (2008-2015), Head of Global Retail Distribution (2005-2008), Executive Managing Director, International Retail Development (2002-2005), Managing Director, Product Developments, Sales & Marketing, Asia, Eastern Europe and Africa (2000-2002) and President, Templeton Asset Management India (1995-2000). Mr. Advani also served as Senior Investment Officer of International Finance Corporation (private equity and venture capital arm of The World Bank, 1984-1995). Mr. Advani is Chairman Emeritus of the U.S. India Business Council (2018-present), a Director of The Global Impact Investing Network (2019-present), a Director of LOK Capital (Mauritius) (2022-present), a member of the Advisory Council of LOK Capital (2022-present), a Senior Advisor of Neuberger Berman (2021-present), a Senior Advisor of Seviora Holdings Pte. Ltd (Temasek-Singapore) (2021-present), a Director of Seviora Capital (Singapore) (2021-present) and an Advisor of EQUIAM (2021-present). Mr. Advani formerly served as a member of the Board of BowX Acquisition Corp. (special purpose acquisition company, 2020-2021), a member of the Board of Intellecap (advisory arm of The Aavishkaar Group, 2018-2020), a member of the Board of Nuveen Investments, Inc. (2017-2020) and a member of the Board of Docusign (software, 2016-2019).
Peter S. Lynch (1944)
Year of Election or Appointment: 2003
Member of the Advisory Board
Mr. Lynch also serves as a Member of the Advisory Board of other Fidelity® funds. Mr. Lynch is Vice Chairman and a Director of Fidelity Management & Research Company LLC (investment adviser firm). In addition, Mr. Lynch serves as a Trustee of Boston College and as the Chairman of the Inner-City Scholarship Fund. Previously, Mr. Lynch served as Vice Chairman and a Director of FMR Co., Inc. (investment adviser firm) and on the Special Olympics International Board of Directors (1997-2006).
Karen B. Peetz (1955)
Year of Election or Appointment: 2023
Member of the Advisory Board
Ms. Peetz also serves as a Member of the Advisory Board of other funds. Previously, Ms. Peetz served as Chief Administration Officer (2020-2023) of Citigroup Inc. (a diversified financial service company). She also served in various capacities at Bank of New York Mellon Corporation, including President (2013-2016), Vice Chairman, Senior Executive Vice President and Chief Executive Officer of Financial Markets & Treasury Services (2010-2013), Senior Executive Vice President and Chief Executive Officer of Global Corporate Trust (2003-2008), Senior Vice President and Division Manager of Global Payments & Trade Services (2002-2003) and Senior Vice President and Division Manager of Domestic Corporate Trust (1998-2002). Ms. Peetz also served in various capacities at Chase Manhattan Corporation (1982-1998), including Senior Vice President and Manager of Corporate Trust International Business (1996-1998), Managing Director and Manager of Corporate Trust Services (1994-1996) and Managing Director and Group Manager of Financial Institution Sales (1990-1993). Ms. Peetz currently serves as Chair of Amherst Holdings Advisory Council (2018-present), Trustee of Johns Hopkins University (2016-present), Chair of the Carey Business School Advisory Council, Member of the Johns Hopkins Medicine Board and Finance Committee and Chair of the Lyme and Tick Related Disease Institute Advisory Council. Ms. Peetz previously served as a member of the Board of Guardian Life Insurance Company of America (2019-2023), a member of the Board of Trane Technologies (2018-2022), a member of the Board of Wells Fargo Corp. (2017-2019), a member of the Board of SunCoke Energy Inc. (2012-2016), a member of the Board of Private Export Funding Corporation (2010-2016) and as a Trustee of Penn State University (2010-2014) and the United Way of New York City (2008-2010).
Heather Bonner (1977)
Year of Election or Appointment: 2023
Assistant Treasurer
Ms. Bonner also serves as an officer of other funds. Ms. Bonner serves as Senior Vice President (2022-present), and is an employee of Fidelity Investments. Ms. Bonner serves as Assistant Treasurer of Fidelity CRET Trustee LLC (2022-present). Prior to joining Fidelity, Ms. Bonner served as Managing Director at AQR Capital Management (2013-2022) and was the Treasurer and Principal Financial Officer of the AQR Funds (2013-2022).
Craig S. Brown (1977)
Year of Election or Appointment: 2022
Deputy Treasurer
Mr. Brown also serves as an officer of other funds. Mr. Brown serves as Assistant Treasurer of FIMM, LLC (2021-present) and is an employee of Fidelity Investments (2013-present). Previously, Mr. Brown served as Assistant Treasurer of certain Fidelity® funds (2019-2022).
John J. Burke III (1964)
Year of Election or Appointment: 2018
Chief Financial Officer
Mr. Burke also serves as Chief Financial Officer of other funds. Mr. Burke serves as Head of Investment Operations for Fidelity Fund and Investment Operations (2018-present) and is an employee of Fidelity Investments (1998-present). Previously Mr. Burke served as head of Asset Management Investment Operations (2012-2018).
Margaret Carey (1973)
Year of Election or Appointment: 2023
Secretary and Chief Legal Officer (CLO)
Ms. Carey also serves as an officer of other funds and as CLO of certain other Fidelity entities. She is a Senior Vice President and Deputy General Counsel of FMR LLC (diversified financial services company, 2019-present), and is an employee of Fidelity Investments.
William C. Coffey (1969)
Year of Election or Appointment: 2019
Assistant Secretary
Mr. Coffey also serves as Assistant Secretary of other funds. He is Senior Vice President and Deputy General Counsel of FMR LLC (diversified financial services company, 2010-present), and is an employee of Fidelity Investments. Previously, Mr. Coffey served as Secretary and CLO of certain funds (2018-2019); CLO, Secretary, and Senior Vice President of Fidelity Management & Research Company and FMR Co., Inc. (investment adviser firms, 2018-2019); Secretary of Fidelity SelectCo, LLC and Fidelity Investments Money Management, Inc. (investment adviser firms, 2018-2019); CLO of Fidelity Management & Research (Hong Kong) Limited, FMR Investment Management (UK) Limited, and Fidelity Management & Research (Japan) Limited (investment adviser firms, 2018-2019); and Assistant Secretary of certain funds (2009-2018).
Timothy M. Cohen (1969)
Year of Election or Appointment: 2018
Vice President
Mr. Cohen also serves as Vice President of other funds. Mr. Cohen serves as Co-Head of Equity (2018-present), a Director of Fidelity Management & Research (Japan) Limited (investment adviser firm, 2016-present), and is an employee of Fidelity Investments. Previously, Mr. Cohen served as Executive Vice President of Fidelity SelectCo, LLC (2019), Head of Global Equity Research (2016-2018), Chief Investment Officer - Equity and a Director of Fidelity Management & Research (U.K.) Inc. (investment adviser firm, 2013-2015) and as a Director of Fidelity Management & Research (Hong Kong) Limited (investment adviser firm, 2017).
Jonathan Davis (1968)
Year of Election or Appointment: 2010
Assistant Treasurer
Mr. Davis also serves as an officer of other funds. Mr. Davis serves as Vice President Assistant Treasurer and is an employee of Fidelity Investments. Mr. Davis serves as Assistant Treasurer of certain Fidelity entities.
Laura M. Del Prato (1964)
Year of Election or Appointment: 2018
Assistant Treasurer
Ms. Del Prato also serves as an officer of other funds. Ms. Del Prato serves as Assistant Treasurer of FIMM, LLC (2021-present) and is an employee of Fidelity Investments (2017-present). Previously, Ms. Del Prato served as President and Treasurer of The North Carolina Capital Management Trust: Cash Portfolio and Term Portfolio (2018-2020). Prior to joining Fidelity Investments, Ms. Del Prato served as a Managing Director and Treasurer of the JPMorgan Mutual Funds (2014-2017). Prior to JPMorgan, Ms. Del Prato served as a partner at Cohen Fund Audit Services (accounting firm, 2012-2013) and KPMG LLP (accounting firm, 2004-2012).
Colm A. Hogan (1973)
Year of Election or Appointment: 2020
Assistant Treasurer
Mr. Hogan also serves as an officer of other funds. Mr. Hogan serves as Assistant Treasurer of FIMM, LLC (2021-present) and FMR Capital, Inc. (2017-present) and is an employee of Fidelity Investments (2005-present). Previously, Mr. Hogan served as Deputy Treasurer of certain Fidelity® funds (2016-2020) and Assistant Treasurer of certain Fidelity® funds (2016-2018).
Pamela R. Holding (1964)
Year of Election or Appointment: 2018
Vice President
Ms. Holding also serves as Vice President of other funds. Ms. Holding serves as Co-Head of Equity (2018-present) and is an employee of Fidelity Investments (2013-present). Previously, Ms. Holding served as Executive Vice President of Fidelity SelectCo, LLC (2019) and as Chief Investment Officer of Fidelity Institutional Asset Management (2013-2018).
Chris Maher (1972)
Year of Election or Appointment: 2020
Deputy Treasurer
Mr. Maher also serves as an officer of other funds. Mr. Maher serves as Assistant Treasurer of FIMM, LLC (2021-present) and FMR Capital, Inc. (2017-present), and is an employee of Fidelity Investments (2008-present). Previously, Mr. Maher served as Assistant Treasurer of certain funds (2013-2020); Vice President of Asset Management Compliance (2013), Vice President of the Program Management Group of FMR (investment adviser firm, 2010-2013), and Vice President of Valuation Oversight (2008-2010).
Jason P. Pogorelec (1975)
Year of Election or Appointment: 2020
Chief Compliance Officer
Mr. Pogorelec also serves as Chief Compliance Officer of other funds. Mr. Pogorelec is a Senior Vice President of Asset Management Compliance for Fidelity Investments and is an employee of Fidelity Investments. Mr. Pogorelec serves as Compliance Officer of Fidelity Management & Research Company LLC (investment adviser firm, 2023-present). Previously, Mr. Pogorelec served as Vice President, Associate General Counsel for Fidelity Investments (2010-2020) and Assistant Secretary of certain Fidelity® funds (2015-2020).
Brett Segaloff (1972)
Year of Election or Appointment: 2021
Anti-Money Laundering (AML) Officer
Mr. Segaloff also serves as an AML Officer of other funds and other related entities. He is Director, Anti-Money Laundering (2007-present) of FMR LLC (diversified financial services company) and is an employee of Fidelity Investments (1996-present).
Stacie M. Smith (1974)
Year of Election or Appointment: 2016
President and Treasurer
Ms. Smith also serves as an officer of other funds. Ms. Smith serves as Assistant Treasurer of certain Fidelity entities, is an employee of Fidelity Investments, and has served in other fund officer roles.
Jim Wegmann (1979)
Year of Election or Appointment: 2019
Assistant Treasurer
Mr. Wegmann also serves as an officer of other funds. Mr. Wegmann serves as Assistant Treasurer of FIMM, LLC (2021-present) and is an employee of Fidelity Investments (2011-present). Previously, Mr. Wegmann served as Assistant Treasurer of certain Fidelity® funds (2019-2021).
As a shareholder, you incur two types of costs: (1) transaction costs, which may include sales charges (loads) on purchase payments or redemption proceeds, as applicable and (2) ongoing costs, which generally include management fees, distribution and/or service (12b-1) fees and other Fund expenses. This Example is intended to help you understand your ongoing costs (in dollars) of investing in a fund and to compare these costs with the ongoing costs of investing in other mutual funds.
| The Example is based on an investment of $1,000 invested at the beginning of the period and held for the entire period (March 1, 2023 to August 31, 2023). |
Actual Expenses
The first line of the accompanying table provides information about actual account values and actual expenses. You may use the information in this line, together with the amount you invested, to estimate the expenses that you paid over the period. Simply divide your account value by $1,000.00 (for example, an $8,600 account value divided by $1,000.00 = 8.6), then multiply the result by the number in the first line for a class/Fund under the heading entitled "Expenses Paid During Period" to estimate the expenses you paid on your account during this period. If any fund is a shareholder of any underlying mutual funds or exchange-traded funds (ETFs) (the Underlying Funds), such fund indirectly bears its proportional share of the expenses of the Underlying Funds in addition to the direct expenses incurred presented in the table. These fees and expenses are not included in the annualized expense ratio used to calculate the expense estimate in the table below.
Hypothetical Example for Comparison Purposes
The second line of the accompanying table provides information about hypothetical account values and hypothetical expenses based on the actual expense ratio and an assumed rate of return of 5% per year before expenses, which is not the actual return. The hypothetical account values and expenses may not be used to estimate the actual ending account balance or expenses you paid for the period. You may use this information to compare the ongoing costs of investing in the Fund and other funds. To do so, compare this 5% hypothetical example with the 5% hypothetical examples that appear in the shareholder reports of the other funds. If any fund is a shareholder of any Underlying Funds, such fund indirectly bears its proportional share of the expenses of the Underlying Funds in addition to the direct expenses as presented in the table. These fees and expenses are not included in the annualized expense ratio used to calculate the expense estimate in the table below.
Please note that the expenses shown in the table are meant to highlight your ongoing costs only and do not reflect any transaction costs. Therefore, the second line of the table is useful in comparing ongoing costs only, and will not help you determine the relative total costs of owning different funds. In addition, if these transactional costs were included, your costs would have been higher.
| | | | | Annualized Expense Ratio- A | | Beginning Account Value March 1, 2023 | | Ending Account Value August 31, 2023 | | Expenses Paid During Period- C March 1, 2023 to August 31, 2023 |
| | | | | | | | | | |
| Fidelity® Balanced K6 Fund | | | | .32% | | | | | | |
| Actual | | | | | | $ 1,000 | | $ 1,108.20 | | $ 1.70 |
Hypothetical-B | | | | | | $ 1,000 | | $ 1,023.59 | | $ 1.63 |
| |
A Annualized expense ratio reflects expenses net of applicable fee waivers.
B 5% return per year before expenses
C Expenses are equal to the annualized expense ratio, multiplied by the average account value over the period, multiplied by 184/ 365 (to reflect the one-half year period). The fees and expenses of any Underlying Funds are not included in each annualized expense ratio.
The dividend and capital gains distributions for the fund(s) are available on Fidelity.com or Institutional.Fidelity.com.
A total of 16.45% of the dividends distributed during the fiscal year was derived from interest on U.S. Government securities which is generally exempt from state income tax.
The fund designates $12,106,717 of distributions paid during the fiscal year ended 2023 as qualifying to be taxed as section 163(j) interest dividends.
The fund designates 11%, 45%, 43%, and 43% of the dividends distributed in October, December, April, and July, respectively during the fiscal year as qualifying for the dividends-received deduction for corporate shareholders.
The fund designates 8.95%, 37.00%, 54.97%, and 54.97% of the dividends distributed in October, December, April and July, respectively during the fiscal year as amounts which may be taken into account as a dividend for the purposes of the maximum rate under section 1(h)(11) of the Internal Revenue Code.
The fund designates 0.49%, 2.01%, 2.41%, and 2.41% of the dividends distributed in October, December, April and July, respectively during the fiscal year as a section 199A dividend.
The fund will notify shareholders in January 2024 of amounts for use in preparing 2023 income tax returns.
Board Approval of Investment Advisory Contracts and Management Fees
Fidelity Balanced K6 Fund
Each year, the Board of Trustees, including the Independent Trustees (together, the Board), considers the renewal of the fund's management contract with Fidelity Management & Research Company LLC (FMR) and the sub-advisory agreements (together, the Advisory Contracts) for the fund. FMR and the sub-advisers are referred to herein as the Investment Advisers. The Board, assisted by the advice of fund counsel and Independent Trustees' counsel, requests and considers a broad range of information relevant to the renewal of the Advisory Contracts throughout the year.
The Board meets regularly and, at each of its meetings, covers an extensive agenda of topics and materials and considers factors that are relevant to its annual consideration of the renewal of the fund's Advisory Contracts, including the services and support provided to the fund and its shareholders. The Board, acting directly and through its Committees (each of which is composed of and chaired by Independent Trustees), requests and receives information concerning the annual consideration of the renewal of the fund's Advisory Contracts. The Board also meets as needed to review matters specifically related to the Board's annual consideration of the renewal of the Advisory Contracts. Members of the Board may also meet with trustees of other Fidelity funds through joint ad hoc committees to discuss certain matters relevant to all of the Fidelity funds.
Approval of Stub Period Continuation. At its May 2023 meeting, the Board of Trustees voted to continue the fund's management contract with FMR, and the sub-advisory agreements and sub-sub-advisory agreements, in each case, where applicable (together, the Advisory Contracts), without modification, for two months from June 1, 2023 through July 31, 2023. The Board considered that the approval of the fund's Advisory Contracts will not result in any changes in (i) the investment process or strategies employed in the management of the fund's assets; (ii) the fees and expenses paid by shareholders; (iii) the nature, extent or quality of services provided under the fund's Advisory Contracts; or (iv) the day-to-day management of the fund or the persons primarily responsible for such management. The Board also considered that since its last approval of the fund's Advisory Contracts, FMR had provided additional information on the fund in support of the annual contract renewal process, including competitive analyses on total expenses and management fees and in-depth reviews of fund performance and fund profitability information. The Board concluded that the fund's Advisory Contracts are fair and reasonable, and that the fund's Advisory Contracts should be renewed, without modification, through July 31, 2023, with the understanding that the Board would consider the annual renewal for a full one year period in July 2023.
At its July 2023 meeting, the Board unanimously determined to renew the fund's Advisory Contracts. In reaching its determination, the Board considered all factors it believed relevant, including (i) the nature, extent, and quality of the services provided to the fund and its shareholders (including the investment performance of the fund); (ii) the competitiveness relative to peer funds of the fund's management fee and total expense ratio; (iii) the total costs of the services provided by and the profits realized by FMR and its affiliates (Fidelity) from its relationships with the fund; and (iv) the extent to which, if any, economies of scale exist and are realized as the fund grows, and whether any economies of scale are appropriately shared with fund shareholders. The Board also considered the broad range of investment choices available to shareholders from FMR's competitors and that the fund's shareholders have chosen to invest in the fund, which is part of the Fidelity family of funds. The Board's decision to renew the Advisory Contracts was not based on any single factor.
The Board reached a determination, with the assistance of fund counsel and Independent Trustees' counsel and through the exercise of its business judgment, that the renewal of the Advisory Contracts was in the best interests of the fund and its shareholders and that the compensation payable under the Advisory Contracts was fair and reasonable in light of all of the surrounding circumstances.
Nature, Extent, and Quality of Services Provided. The Board considered staffing as it relates to the fund, including the backgrounds and experience of investment personnel of the Investment Advisers, and also considered the Investment Advisers' implementation of the fund's investment program. The Independent Trustees also had discussions with senior management of Fidelity's investment operations and investment groups. The Board considered the structure of the investment personnel compensation program and whether this structure provides appropriate incentives to act in the best interests of the fund. Additionally, the Board considered the portfolio managers' investments, if any, in the funds that they manage.
Resources Dedicated to Investment Management and Support Services. The Board and the Fund Oversight and Research Committees reviewed the general qualifications and capabilities of Fidelity's investment staff, including its size, education, experience, and resources, as well as Fidelity's approach to recruiting, training, managing, and compensating investment personnel. The Board noted the resources devoted to expansion of Fidelity's global investment organization, and that Fidelity's analysts have extensive resources, tools, and capabilities that allow them to conduct sophisticated quantitative and fundamental analysis, as well as credit analysis of issuers, counterparties, and guarantors. Further, the Board considered that Fidelity's investment professionals have sufficient access to global information and data so as to provide competitive investment results over time, and that those professionals also have access to sophisticated tools that permit them to assess portfolio construction and risk and performance attribution characteristics continuously, as well as to transmit new information and research conclusions rapidly around the world. Additionally, in its deliberations, the Board considered Fidelity's trading, risk management, compliance, and technology and operations capabilities and resources, which are integral parts of the investment management process.
Shareholder and Administrative Services. The Board considered (i) the nature, extent, quality, and cost of advisory, administrative, and shareholder services performed by the Investment Advisers and their affiliates under the Advisory Contracts and under separate agreements covering transfer agency, pricing and bookkeeping, and securities lending services for the fund; (ii) the nature and extent of Fidelity's supervision of third party service providers, principally custodians, subcustodians, and pricing vendors; and (iii) the resources devoted by Fidelity to, and the record of compliance with, the fund's compliance policies and procedures. The Board also reviewed the allocation of fund brokerage, including allocations to brokers affiliated with the Investment Advisers, the use of brokerage commissions to pay fund expenses, and the use of "soft" commission dollars to pay for research services. The Board also considered the fund's securities lending activities and any payments made to Fidelity relating to securities lending.
The Board noted that the growth of fund assets over time across the complex allows Fidelity to reinvest in the development of services designed to enhance the value and convenience of the Fidelity funds as investment vehicles. These services include 24-hour access to account information and market information over the Internet and through telephone representatives, investor education materials, and asset allocation tools. The Board also considered that it reviews customer service metrics such as telephone response times, continuity of services on the website and metrics addressing services at Fidelity Investor Centers.
Investment in a Large Fund Family. The Board considered the benefits to shareholders of investing in a fund that is part of a large family of funds offering a variety of investment disciplines and providing a large variety of fund investor services. The Board noted that Fidelity had taken, or had made recommendations that resulted in the Fidelity funds taking, a number of actions over the previous year that benefited particular funds and/or the Fidelity funds in general.
Investment Performance. The Board took into account discussions that occur with representatives of the Investment Advisers, and reports that it receives, at Board meetings throughout the year, relating to fund investment performance. In this regard the Board noted that as part of regularly scheduled fund reviews and other reports to the Board on fund performance, the Board considered annualized return information for the fund for different time periods, measured against an appropriate securities market index (benchmark index) and an appropriate peer group of funds with similar objectives (peer group). The Board also considered information about performance attribution. In its ongoing evaluation of fund investment performance, the Board gives particular attention to information indicating changes in performance of the funds over different time periods and discussed with the Investment Advisers the reasons for any overperformance or underperformance.
In addition to reviewing absolute and relative fund performance, the Independent Trustees periodically consider the appropriateness of fund performance metrics in evaluating the results achieved. The Independent Trustees generally give greater weight to fund performance over longer time periods than over shorter time periods. Depending on the circumstances, the Independent Trustees may be satisfied with a fund's performance notwithstanding that it lags its benchmark index or peer group for certain periods.
Based on its review, the Board concluded that the nature, extent, and quality of services provided to the fund under the Advisory Contracts should continue to benefit the shareholders of the fund.
Competitiveness of Management Fee and Total Expense Ratio. The Board was provided with information regarding industry trends in management fees and expenses. In its review of the fund's management fee and total expense ratio, the Board considered the fund's unitary fee rate as well as other fund expenses paid by FMR under the fund's management contract, such as transfer agent fees, pricing and bookkeeping fees, and custodial, legal, and audit fees. The Board noted that Fidelity may agree to waive fees or reimburse expenses from time to time, and the extent to which, if any, it has done so for the fund.
Comparisons of Management Fees and Total Expense Ratios. Among other things, the Board reviewed data for selected groups of competitive funds and classes (referred to as "mapped groups") that were compiled by Fidelity based on combining similar investment objective categories (as classified by Lipper) that have comparable investment mandates. The data reviewed by the Board included (i) gross management fee comparisons (before taking into account expense reimbursements or caps) relative to the total universe of funds within the mapped group; (ii) gross management fee comparisons relative to a subset of non-Fidelity funds in the mapped group that are similar in size and management fee structure to the fund (referred to as the "asset size peer group"); (iii) total expense comparisons of the fund relative to funds and classes in the mapped group that have a similar sales load structure to the fund (referred to as the "similar sales load structure group"); and (iv) total expense comparisons of the fund relative to funds and classes in the similar sales load structure group that are similar in size and management fee structure to the fund (referred to as the "total expense asset size peer group"). The total expense asset size peer group comparison excludes performance adjustments and fund-paid 12b-1 fees to eliminate variability in fee structures.
The information provided to the Board indicated that the fund's management fee rate ranked below the competitive median of the mapped group for the 12-month period ended September 30, 2022 and below the competitive median of the asset size peer group for the 12-month period ended September 30, 2022. Further, the information provided to the Board indicated that the total expense ratio of the fund ranked below the competitive median of the similar sales load structure group for the 12-month period ended September 30, 2022 and below the competitive median of the total expense asset size peer group for the 12-month period ended September 30, 2022.
The Board also considered that, for funds subject to the group fee, FMR agreed to voluntarily waive fees over a specified period of time in amounts designed to account for assets converted from certain funds to certain collective investment trusts.
Fees Charged to Other Fidelity Clients. The Board also considered Fidelity fee structures and other information with respect to clients of Fidelity, such as other funds advised or subadvised by Fidelity, pension plan clients, and other institutional clients with similar mandates. The Board noted that a joint ad hoc committee created by it and the boards of other Fidelity funds periodically reviews and compares Fidelity's institutional investment advisory business with its business of providing services to the Fidelity funds and also noted the most recent findings of the committee. The Board noted that the committee's review included a consideration of the differences in services provided, fees charged, and costs incurred, as well as competition in the markets serving the different categories of clients.
Based on its review, the Board concluded that the fund's management fee is fair and reasonable in light of the services that the fund receives and the other factors considered. Further, based on its review of total expense ratios and fees charged to other Fidelity clients, the Board concluded that the fund's total expense ratio was reasonable in light of the services that the fund and its shareholders receive and the other factors considered.
Costs of the Services and Profitability. The Board considered the revenues earned and the expenses incurred by Fidelity in conducting the business of developing, marketing, distributing, managing, administering and servicing the fund and servicing the fund's shareholders. The Board also considered the level of Fidelity's profits in respect of all the Fidelity funds.
On an annual basis, Fidelity presents to the Board information about the profitability of its relationships with the fund. Fidelity calculates profitability information for each fund, as well as aggregate profitability information for groups of Fidelity funds and all Fidelity funds, using a series of detailed revenue and cost allocation methodologies which originate with the books and records of Fidelity on which Fidelity's audited financial statements are based. The Audit Committee of the Board reviews any significant changes from the prior year's methodologies and the full Board approves such changes.
A public accounting firm has been engaged annually by the Board as part of the Board's assessment of Fidelity's profitability analysis. The engagement includes the review and assessment of the methodologies used by Fidelity in determining the revenues and expenses attributable to Fidelity's fund business, and completion of agreed-upon procedures in respect of the mathematical accuracy of certain fund profitability information and its conformity to established allocation methodologies. After considering the reports issued under the engagement and information provided by Fidelity, the Board concluded that while other allocation methods may also be reasonable, Fidelity's profitability methodologies are reasonable in all material respects.
The Board also reviewed Fidelity's non-fund businesses and potential indirect benefits such businesses may have received as a result of their association with Fidelity's fund business (i.e., fall-out benefits) as well as cases where Fidelity's affiliates may benefit from the funds' business. The Board considered areas where potential indirect benefits to the Fidelity funds from their relationships with Fidelity may exist. The Board's consideration of these matters was informed by the findings of a joint ad hoc committee created by it and the boards of other Fidelity funds to evaluate potential fall-out benefits.
The Board considered the costs of the services provided by and the profits realized by Fidelity in connection with the operation of the fund and was satisfied that the profitability was not excessive.
Economies of Scale. The Board considered whether there have been economies of scale in respect of the management of the Fidelity funds, whether the Fidelity funds (including the fund) have appropriately benefited from any such economies of scale, and whether there is potential for realization of any further economies of scale. The Board considered the extent to which the fund will benefit from economies of scale as assets grow through increased services to the fund, through waivers or reimbursements, or through fee or expense ratio reductions. The Board recognized that, due to the fund's current contractual arrangements, its expense ratio will not decline if the fund's operating costs decrease as assets grow, or rise as assets decrease. The Board also noted that a committee (the Economies of Scale Committee) created by it and the boards of other Fidelity funds periodically analyzes whether Fidelity attains economies of scale in respect of the management and servicing of the Fidelity funds, whether the Fidelity funds have appropriately benefited from such economies of scale, and whether there is potential for realization of any further economies of scale.
The Board concluded, taking into account the analysis of the Economies of Scale Committee, that economies of scale, if any, are being appropriately shared between fund shareholders and Fidelity.
Additional Information Requested by the Board. In order to develop fully the factual basis for consideration of the Fidelity funds' advisory contracts, the Board requested and received additional information on certain topics, including: (i) fund flow and performance trends, in particular the underperformance of certain funds and strategies, and Fidelity's long-term strategies for certain funds, including any consideration of fund liquidations or mergers; (ii) the operation of performance fees and competitor use of performance fees; (iii) Fidelity's pricing philosophy compared to competitors; (iv) fund profitability methodology and data; (v) evaluation of competitive fund data and peer group classifications and fee and expense comparisons; (vi) the management fee and expense structures for different funds and classes and information about the differences between various fee and expense structures; (vii) group fee breakpoints and related voluntary fee waivers; and (viii) information regarding other accounts managed by Fidelity and the funds' sub-advisory arrangements.
Conclusion. Based on its evaluation of all of the conclusions noted above, and after considering all factors it believed relevant, the Board, including the Independent Trustees, concluded that the advisory and sub-advisory fee arrangements are fair and reasonable in light of all of the surrounding circumstances and that the fund's Advisory Contracts should be renewed through July 31, 2024.
1.9893903.104
BAL-K6-ANN-1023
Item 2.
Code of Ethics
As of the end of the period, August 31, 2023, Fidelity Puritan Trust (the trust) has adopted a code of ethics, as defined in Item 2 of Form N-CSR, that applies to its President and Treasurer and its Chief Financial Officer. A copy of the code of ethics is filed as an exhibit to this Form N-CSR.
Item 3.
Audit Committee Financial Expert
The Board of Trustees of the trust has determined that Donald F. Donahue is an audit committee financial expert, as defined in Item 3 of Form N-CSR. Mr. Donahue is independent for purposes of Item 3 of Form N-CSR.
Item 4.
Principal Accountant Fees and Services
Fees and Services
The following table presents fees billed by PricewaterhouseCoopers LLP (“PwC”) in each of the last two fiscal years for services rendered to Fidelity Balanced Fund, Fidelity Balanced K6 Fund, Fidelity Puritan Fund, and Fidelity Puritan K6 Fund (the “Funds”):
Services Billed by PwC
August 31, 2023 FeesA
| | | | |
| Audit Fees | Audit-Related Fees | Tax Fees | All Other Fees |
Fidelity Balanced Fund | $108,600 | $7,200 | $43,900 | $2,400 |
Fidelity Balanced K6 Fund | $88,200 | $5,500 | $17,600 | $1,900 |
Fidelity Puritan Fund | $145,200 | $10,300 | $49,400 | $3,500 |
Fidelity Puritan K6 Fund | $86,200 | $5,800 | $17,200 | $2,000 |
| | | | |
| Audit Fees | Audit-Related Fees | Tax Fees | All Other Fees |
Fidelity Balanced Fund | $94,300 | $7,000 | $44,300 | $2,400 |
Fidelity Balanced K6 Fund | $71,400 | $5,500 | $21,400 | $1,900 |
Fidelity Puritan Fund | $143,200 | $10,100 | $149,500 | $3,400 |
Fidelity Puritan K6 Fund | $66,000 | $5,900 | $20,700 | $2,000 |
|
|
|
|
|
A Amounts may reflect rounding.
The following table(s) present(s) fees billed by PwC that were required to be approved by the Audit Committee for services that relate directly to the operations and financial reporting of the Fund(s) and that are rendered on behalf of Fidelity Management & Research Company LLC ("FMR") and entities controlling, controlled by, or under common control with FMR (not including any sub-adviser whose role is primarily portfolio management and is subcontracted with or overseen by another investment adviser) that provide ongoing services to the Fund(s) (“Fund Service Providers”):
Services Billed by PwC
| | |
|
August 31, 2023A |
August 31, 2022A |
Audit-Related Fees | $8,284,200 | $7,914,600 |
Tax Fees | $1,000 | $353,200 |
All Other Fees | $- | $- |
A Amounts may reflect rounding.
“Audit-Related Fees” represent fees billed for assurance and related services that are reasonably related to the performance of the fund audit or the review of the fund's financial statements and that are not reported under Audit Fees.
“Tax Fees” represent fees billed for tax compliance, tax advice or tax planning that relate directly to the operations and financial reporting of the fund.
“All Other Fees” represent fees billed for services provided to the fund or Fund Service Provider, a significant portion of which are assurance related, that relate directly to the operations and financial reporting of the fund, excluding those services that are reported under Audit Fees, Audit-Related Fees or Tax Fees.
Assurance services must be performed by an independent public accountant.
* * *
The aggregate non-audit fees billed by PwC for services rendered to the Fund(s), FMR (not including any sub-adviser whose role is primarily portfolio management and is subcontracted with or overseen by another investment adviser), and any Fund Service Provider for each of the last two fiscal years of the Fund(s) are as follows:
| | |
Billed By | August 31, 2023A | August 31, 2022A |
PwC | $13,754,500 | $13,509,300 |
A Amounts may reflect rounding.
The trust's Audit Committee has considered non-audit services that were not pre-approved that were provided by PwC to Fund Service Providers to be compatible with maintaining the independence of PwC in its(their) audit of the Fund(s), taking into account representations from PwC, in accordance with Public Company Accounting Oversight Board rules, regarding its independence from the Fund(s) and its(their) related entities and FMR’s review of the appropriateness and permissibility under applicable law of such non-audit services prior to their provision to the Fund(s) Service Providers.
Audit Committee Pre-Approval Policies and Procedures
The trust’s Audit Committee must pre-approve all audit and non-audit services provided by a fund’s independent registered public accounting firm relating to the operations or
financial reporting of the fund. Prior to the commencement of any audit or non-audit services to a fund, the Audit Committee reviews the services to determine whether they are appropriate and permissible under applicable law.
The Audit Committee has adopted policies and procedures to, among other purposes, provide a framework for the Committee’s consideration of non-audit services by the audit firms that audit the Fidelity funds. The policies and procedures require that any non-audit service provided by a fund audit firm to a Fidelity fund and any non-audit service provided by a fund auditor to a Fund Service Provider that relates directly to the operations and financial reporting of a Fidelity fund (“Covered Service”) are subject to approval by the Audit Committee before such service is provided.
All Covered Services must be approved in advance of provision of the service either: (i) by formal resolution of the Audit Committee, or (ii) by oral or written approval of the service by the Chair of the Audit Committee (or if the Chair is unavailable, such other member of the Audit Committee as may be designated by the Chair to act in the Chair’s absence). The approval contemplated by (ii) above is permitted where the Treasurer determines that action on such an engagement is necessary before the next meeting of the Audit Committee.
Non-audit services provided by a fund audit firm to a Fund Service Provider that do not relate directly to the operations and financial reporting of a Fidelity fund are reported to the Audit Committee periodically.
Non-Audit Services Approved Pursuant to Rule 2-01(c)(7)(i)(C) and (ii) of Regulation S-X (“De Minimis Exception”)
There were no non-audit services approved or required to be approved by the Audit Committee pursuant to the De Minimis Exception during the Fund’s(s’) last two fiscal years relating to services provided to (i) the Fund(s) or (ii) any Fund Service Provider that relate directly to the operations and financial reporting of the Fund(s).
The Registrant has not retained, for the preparation of the audit report on the financial statements included in the Form N-CSR, a registered public accounting firm that has a branch or office that is located in a foreign jurisdiction and that the Public Company Accounting Oversight Board (the “PCAOB”) has determined that the PCAOB is unable to inspect or investigate completely because of a position taken by an authority in the foreign jurisdiction.
The Registrant is not a “foreign issuer,” as defined in 17 CFR 240.3b-4.
Item 5.
Audit Committee of Listed Registrants
Not applicable.
Item 6.
Investments
(a)
Not applicable.
(b)
Not applicable.
Item 7.
Disclosure of Proxy Voting Policies and Procedures for Closed-End Management Investment Companies
Not applicable.
Item 8.
Portfolio Managers of Closed-End Management Investment Companies
Not applicable.
Item 9.
Purchase of Equity Securities by Closed-End Management Investment Company and Affiliated Purchasers
Not applicable.
Item 10.
Submission of Matters to a Vote of Security Holders
There were no material changes to the procedures by which shareholders may recommend nominees to the trust’s Board of Trustees.
Item 11.
Controls and Procedures
(a)(i) The President and Treasurer and the Chief Financial Officer have concluded that the trust’s disclosure controls and procedures (as defined in Rule 30a-3(c) under the Investment Company Act) provide reasonable assurances that material information relating to the trust is made known to them by the appropriate persons, based on their evaluation of these controls and procedures as of a date within 90 days of the filing date of this report.
(a)(ii) There was no change in the trust’s internal control over financial reporting (as defined in Rule 30a-3(d) under the Investment Company Act) that occurred during the period covered by this report that has materially affected, or is reasonably likely to materially affect, the trust’s internal control over financial reporting.
Item 12.
Disclosure of Securities Lending Activities for Closed-End Management
Investment Companies
Not applicable.
Item 13.
Exhibits
SIGNATURES
Pursuant to the requirements of the Securities Exchange Act of 1934 and the Investment Company Act of 1940, the registrant has duly caused this report to be signed on its behalf by the undersigned, thereunto duly authorized.
Fidelity Puritan Trust
| |
By: | /s/Stacie M. Smith |
| Stacie M. Smith |
| President and Treasurer |
|
|
Date: | October 23, 2023 |
Pursuant to the requirements of the Securities Exchange Act of 1934 and the Investment Company Act of 1940, this report has been signed below by the following persons on behalf of the registrant and in the capacities and on the dates indicated.
| |
By: | /s/Stacie M. Smith |
| Stacie M. Smith |
| President and Treasurer |
|
|
Date: | October 23, 2023 |
| |
By: | /s/John J. Burke III |
| John J. Burke III |
| Chief Financial Officer |
|
|
Date: | October 23, 2023 |