UNITED STATES
SECURITIES AND EXCHANGE COMMISSION
Washington, D.C. 20549
FORM N-CSR
CERTIFIED SHAREHOLDER REPORT OF REGISTERED
MANAGEMENT INVESTMENT COMPANIES
Investment Company Act file number 811-00649
Fidelity Puritan Trust
(Exact name of registrant as specified in charter)
245 Summer St., Boston, MA 02210
(Address of principal executive offices) (Zip code)
Margaret Carey, Secretary
245 Summer St.
Boston, Massachusetts 02210
(Name and address of agent for service)
Registrant's telephone number, including area code:
617-563-7000
| |
Date of fiscal year end: | July 31 |
|
|
Date of reporting period: | January 31, 2024 |
Item 1.
Reports to Stockholders
Fidelity® Series Intrinsic Opportunities Fund
Semi-Annual Report
January 31, 2024
Contents
To view a fund's proxy voting guidelines and proxy voting record for the 12-month period ended June 30, visit http://www.fidelity.com/proxyvotingresults or visit the Securities and Exchange Commission's (SEC) web site at http://www.sec.gov.
You may also call 1-800-544-8544 to request a free copy of the proxy voting guidelines.
Standard & Poor's, S&P and S&P 500 are registered service marks of The McGraw-Hill Companies, Inc. and have been licensed for use by Fidelity Distributors Corporation.
Other third-party marks appearing herein are the property of their respective owners.
All other marks appearing herein are registered or unregistered trademarks or service marks of FMR LLC or an affiliated company. © 2024 FMR LLC. All rights reserved.
This report and the financial statements contained herein are submitted for the general information of the shareholders of the Fund. This report is not authorized for distribution to prospective investors in the Fund unless preceded or accompanied by an effective prospectus.
A fund files its complete schedule of portfolio holdings with the SEC for the first and third quarters of each fiscal year on Form N-PORT. Forms N-PORT are available on the SEC's web site at http://www.sec.gov. A fund's Forms N-PORT may be reviewed and copied at the SEC's Public Reference Room in Washington, DC. Information regarding the operation of the SEC's Public Reference Room may be obtained by calling 1-800-SEC-0330.
For a complete list of a fund's portfolio holdings, view the most recent holdings listing, semiannual report, or annual report on Fidelity's web site at http://www.fidelity.com, http://www.institutional.fidelity.com, or http://www.401k.com, as applicable.
NOT FDIC INSURED •MAY LOSE VALUE •NO BANK GUARANTEE
Neither the Fund nor Fidelity Distributors Corporation is a bank.
Top Holdings (% of Fund's net assets) |
| |
| Wells Fargo & Co. | 2.0 | |
| Sprouts Farmers Market LLC | 1.8 | |
| Seagate Technology Holdings PLC | 1.6 | |
| PG&E Corp. | 1.5 | |
| Cigna Group | 1.2 | |
| Elevance Health, Inc. | 1.2 | |
| UnitedHealth Group, Inc. | 1.2 | |
| Centene Corp. | 1.2 | |
| Ovintiv, Inc. | 1.2 | |
| Discover Financial Services | 1.1 | |
| | 14.0 | |
| |
| Market Sectors (% of Fund's net assets) |
| |
| Financials | 19.1 | |
| Industrials | 18.7 | |
| Information Technology | 14.4 | |
| Consumer Discretionary | 13.0 | |
| Health Care | 10.9 | |
| Energy | 7.8 | |
| Materials | 6.9 | |
| Consumer Staples | 4.1 | |
| Communication Services | 2.0 | |
| Utilities | 1.5 | |
| Real Estate | 0.9 | |
| |
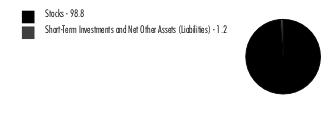
Asset Allocation (% of Fund's net assets) |
|
|
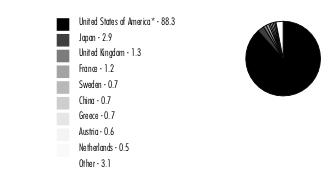
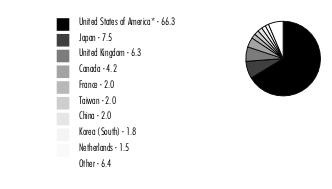
Geographic Diversification (% of Fund's net assets) |
|
* Includes Short-Term investments and Net Other Assets (Liabilities). Percentages are adjusted for the effect of derivatives, if applicable. |
| |
Showing Percentage of Net Assets
| Common Stocks - 99.3% |
| | | Shares | Value ($) |
| COMMUNICATION SERVICES - 2.0% | | | |
| Entertainment - 0.4% | | | |
| International Games Systems Co. Ltd. | | 117,000 | 3,095,959 |
| Warner Bros Discovery, Inc. (a) | | 894,700 | 8,964,894 |
| | | | 12,060,853 |
| Interactive Media & Services - 0.4% | | | |
| Cars.com, Inc. (a) | | 645,100 | 11,244,093 |
| Media - 1.2% | | | |
| Comcast Corp. Class A | | 286,000 | 13,310,440 |
| Nexstar Media Group, Inc. Class A | | 40,600 | 7,215,026 |
| Pico Far East Holdings Ltd. | | 10,600,000 | 2,049,364 |
| Reach PLC | | 2,397,800 | 1,876,417 |
| Thryv Holdings, Inc. (a) | | 366,200 | 7,485,128 |
| | | | 31,936,375 |
TOTAL COMMUNICATION SERVICES | | | 55,241,321 |
| CONSUMER DISCRETIONARY - 13.0% | | | |
| Automobile Components - 2.7% | | | |
| Adient PLC (a) | | 728,300 | 25,279,293 |
| Brembo SpA | | 25,000 | 309,080 |
| Cie Automotive SA | | 274,100 | 7,257,387 |
| DaikyoNishikawa Corp. | | 303,553 | 1,519,048 |
| Lear Corp. | | 109,900 | 14,605,710 |
| Patrick Industries, Inc. | | 273,100 | 27,416,509 |
| | | | 76,387,027 |
| Automobiles - 0.7% | | | |
| General Motors Co. | | 201,200 | 7,806,560 |
| Harley-Davidson, Inc. | | 362,900 | 11,776,105 |
| | | | 19,582,665 |
| Broadline Retail - 1.2% | | | |
| B&M European Value Retail SA | | 1,040,400 | 6,837,735 |
| Big Lots, Inc. (b) | | 406,500 | 2,333,310 |
| Europris ASA (c) | | 616,426 | 4,627,334 |
| Kohl's Corp. (b) | | 121,300 | 3,124,688 |
| Macy's, Inc. (b) | | 163,500 | 2,990,415 |
| Next PLC | | 124,600 | 13,371,445 |
| | | | 33,284,927 |
| Distributors - 0.1% | | | |
| Autohellas SA | | 237,000 | 3,432,087 |
| Diversified Consumer Services - 0.4% | | | |
| H&R Block, Inc. | | 244,100 | 11,433,644 |
| ME Group International PLC | | 357,100 | 574,742 |
| | | | 12,008,386 |
| Hotels, Restaurants & Leisure - 0.4% | | | |
| Brinker International, Inc. (a) | | 229,100 | 9,803,189 |
| Household Durables - 1.7% | | | |
| Ace Bed Co. Ltd. | | 64,537 | 1,231,851 |
| D.R. Horton, Inc. | | 36,000 | 5,144,760 |
| Helen of Troy Ltd. (a)(b) | | 202,400 | 23,174,800 |
| Tempur Sealy International, Inc. | | 246,600 | 12,302,874 |
| TopBuild Corp. (a) | | 18,600 | 6,865,818 |
| | | | 48,720,103 |
| Leisure Products - 0.2% | | | |
| Brunswick Corp. | | 69,600 | 5,615,328 |
| Specialty Retail - 3.6% | | | |
| Academy Sports & Outdoors, Inc. | | 160,600 | 10,074,438 |
| Arcland Sakamoto Co. Ltd. | | 525,000 | 6,012,053 |
| AutoZone, Inc. (a) | | 4,700 | 12,982,011 |
| Dick's Sporting Goods, Inc. | | 153,600 | 22,897,152 |
| Foot Locker, Inc. | | 222,513 | 6,265,966 |
| JD Sports Fashion PLC | | 4,406,900 | 6,537,084 |
| Jumbo SA | | 184,600 | 5,186,928 |
| Maisons du Monde SA (c) | | 240,700 | 1,163,277 |
| Mr. Bricolage SA (a) | | 144,948 | 1,268,827 |
| Sally Beauty Holdings, Inc. (a) | | 718,500 | 8,851,920 |
| Sportsman's Warehouse Holdings, Inc. (a)(b) | | 289,100 | 1,113,035 |
| The Hour Glass Ltd. | | 1,753,400 | 1,983,780 |
| Valvoline, Inc. (a) | | 233,300 | 8,513,117 |
| Williams-Sonoma, Inc. (b) | | 45,300 | 8,760,567 |
| | | | 101,610,155 |
| Textiles, Apparel & Luxury Goods - 2.0% | | | |
| Best Pacific International Holdings Ltd. | | 7,833,068 | 1,078,780 |
| Crocs, Inc. (a) | | 66,500 | 6,748,420 |
| Kontoor Brands, Inc. (b) | | 291,500 | 17,087,730 |
| Levi Strauss & Co. Class A (b) | | 684,300 | 11,140,404 |
| PVH Corp. | | 128,200 | 15,417,332 |
| Wolverine World Wide, Inc. | | 754,600 | 6,308,456 |
| | | | 57,781,122 |
TOTAL CONSUMER DISCRETIONARY | | | 368,224,989 |
| CONSUMER STAPLES - 4.1% | | | |
| Beverages - 0.0% | | | |
| Jinro Distillers Co. Ltd. | | 47,274 | 548,982 |
| Consumer Staples Distribution & Retail - 3.3% | | | |
| Acomo NV | | 207,900 | 3,945,337 |
| Alimentation Couche-Tard, Inc. Class A (multi-vtg.) | | 239,200 | 14,016,271 |
| BJ's Wholesale Club Holdings, Inc. (a) | | 307,500 | 19,784,550 |
| MARR SpA | | 377,200 | 4,598,180 |
| Sprouts Farmers Market LLC (a)(b) | | 1,023,100 | 51,533,547 |
| | | | 93,877,885 |
| Food Products - 0.4% | | | |
| Armanino Foods of Distinction (b) | | 136,328 | 658,464 |
| Lamb Weston Holdings, Inc. | | 73,800 | 7,560,072 |
| LDC SA | | 8,650 | 1,238,617 |
| S Foods, Inc. | | 68,100 | 1,531,357 |
| | | | 10,988,510 |
| Household Products - 0.0% | | | |
| Transaction Co. Ltd. | | 32,500 | 543,395 |
| Personal Care Products - 0.4% | | | |
| Sarantis SA | | 1,069,084 | 10,144,053 |
TOTAL CONSUMER STAPLES | | | 116,102,825 |
| ENERGY - 7.8% | | | |
| Energy Equipment & Services - 0.1% | | | |
| Cactus, Inc. | | 14,300 | 606,892 |
| Vallourec SA (a) | | 37,400 | 538,976 |
| | | | 1,145,868 |
| Oil, Gas & Consumable Fuels - 7.7% | | | |
| Antero Resources Corp. (a) | | 1,416,500 | 31,644,610 |
| Chord Energy Corp. | | 183,500 | 28,214,960 |
| Civitas Resources, Inc. (b) | | 198,408 | 12,858,822 |
| Diamondback Energy, Inc. | | 192,500 | 29,594,950 |
| Enterprise Products Partners LP | | 334,000 | 8,937,840 |
| Northern Oil & Gas, Inc. | | 239,500 | 8,023,250 |
| Ovintiv, Inc. | | 793,300 | 33,651,786 |
| Range Resources Corp. | | 1,111,700 | 32,283,768 |
| Southwestern Energy Co. (a) | | 3,004,100 | 19,376,445 |
| TotalEnergies SE sponsored ADR | | 201,083 | 13,106,590 |
| Unit Corp. | | 9,900 | 394,515 |
| | | | 218,087,536 |
TOTAL ENERGY | | | 219,233,404 |
| FINANCIALS - 19.1% | | | |
| Banks - 9.1% | | | |
| ACNB Corp. | | 17,500 | 683,025 |
| Associated Banc-Corp. | | 993,100 | 20,865,031 |
| Bar Harbor Bankshares | | 183,272 | 4,821,886 |
| Cadence Bank | | 605,400 | 16,115,748 |
| Camden National Corp. (b) | | 44,343 | 1,597,678 |
| Community Trust Bancorp, Inc. | | 58,500 | 2,427,750 |
| East West Bancorp, Inc. | | 113,100 | 8,234,811 |
| First Bancorp, Puerto Rico | | 499,300 | 8,328,324 |
| First Foundation, Inc. | | 98,200 | 934,864 |
| FNB Corp., Pennsylvania | | 910,900 | 12,005,662 |
| Greene County Bancorp, Inc. (b) | | 195,500 | 4,887,500 |
| KeyCorp | | 300,900 | 4,372,077 |
| Nicolet Bankshares, Inc. | | 79,800 | 6,206,046 |
| Plumas Bancorp | | 133,092 | 4,695,486 |
| QCR Holdings, Inc. | | 237,500 | 13,872,375 |
| Southern Missouri Bancorp, Inc. | | 148,300 | 6,467,363 |
| Synovus Financial Corp. | | 426,000 | 16,043,160 |
| U.S. Bancorp | | 274,800 | 11,415,192 |
| United Community Bank, Inc. | | 557,400 | 15,239,316 |
| Washington Trust Bancorp, Inc. | | 168,900 | 4,697,109 |
| Webster Financial Corp. | | 363,500 | 17,985,980 |
| Wells Fargo & Co. | | 1,148,100 | 57,611,660 |
| West Bancorp., Inc. (b) | | 252,500 | 4,749,525 |
| Wintrust Financial Corp. | | 124,900 | 12,112,802 |
| | | | 256,370,370 |
| Capital Markets - 3.1% | | | |
| AllianceBernstein Holding LP | | 274,100 | 9,196,055 |
| Federated Hermes, Inc. | | 380,500 | 13,302,280 |
| Lazard, Inc. Class A | | 477,600 | 18,616,848 |
| LPL Financial | | 44,900 | 10,739,631 |
| Raymond James Financial, Inc. | | 222,200 | 24,481,996 |
| Stifel Financial Corp. | | 144,900 | 10,570,455 |
| Van Lanschot Kempen NV (Bearer) | | 24,700 | 746,077 |
| | | | 87,653,342 |
| Consumer Finance - 1.6% | | | |
| Aeon Credit Service (Asia) Co. Ltd. | | 4,561,940 | 3,138,536 |
| Discover Financial Services | | 308,432 | 32,545,745 |
| OneMain Holdings, Inc. | | 218,700 | 10,410,120 |
| | | | 46,094,401 |
| Financial Services - 1.1% | | | |
| Federal Agricultural Mortgage Corp. Class C (non-vtg.) | | 42,000 | 7,824,180 |
| FleetCor Technologies, Inc. (a) | | 73,700 | 21,367,841 |
| Zenkoku Hosho Co. Ltd. | | 42,500 | 1,581,571 |
| | | | 30,773,592 |
| Insurance - 4.2% | | | |
| American Financial Group, Inc. | | 95,400 | 11,486,160 |
| ASR Nederland NV | | 106,100 | 5,011,888 |
| First American Financial Corp. | | 102,400 | 6,179,840 |
| Hartford Financial Services Group, Inc. | | 49,500 | 4,304,520 |
| NN Group NV | | 134,358 | 5,507,096 |
| Primerica, Inc. | | 41,000 | 9,600,560 |
| Reinsurance Group of America, Inc. | | 178,100 | 30,969,809 |
| Selective Insurance Group, Inc. | | 148,500 | 15,571,710 |
| Stewart Information Services Corp. | | 84,300 | 5,197,938 |
| Talanx AG | | 62,700 | 4,407,781 |
| Unum Group | | 394,000 | 19,045,960 |
| | | | 117,283,262 |
TOTAL FINANCIALS | | | 538,174,967 |
| HEALTH CARE - 10.9% | | | |
| Biotechnology - 1.2% | | | |
| Gilead Sciences, Inc. | | 279,900 | 21,904,974 |
| United Therapeutics Corp. (a) | | 48,100 | 10,330,918 |
| | | | 32,235,892 |
| Health Care Equipment & Supplies - 0.3% | | | |
| Dentsply Sirona, Inc. | | 197,300 | 6,856,175 |
| InBody Co. Ltd. | | 27,900 | 517,552 |
| Value Added Technology Co. Ltd. | | 55,500 | 1,330,900 |
| | | | 8,704,627 |
| Health Care Providers & Services - 8.5% | | | |
| Centene Corp. (a) | | 450,800 | 33,949,748 |
| Cigna Group | | 117,500 | 35,361,625 |
| CVS Health Corp. | | 106,000 | 7,883,220 |
| Elevance Health, Inc. | | 70,900 | 34,984,896 |
| Henry Schein, Inc. (a) | | 112,000 | 8,382,080 |
| Humana, Inc. | | 53,500 | 20,226,210 |
| Laboratory Corp. of America Holdings | | 87,500 | 19,451,250 |
| Quest Diagnostics, Inc. | | 82,600 | 10,608,318 |
| Sinopharm Group Co. Ltd. (H Shares) | | 3,877,437 | 10,195,662 |
| UnitedHealth Group, Inc. | | 67,900 | 34,747,146 |
| Universal Health Services, Inc. Class B | | 154,800 | 24,583,788 |
| | | | 240,373,943 |
| Life Sciences Tools & Services - 0.6% | | | |
| ICON PLC (a) | | 65,500 | 17,086,985 |
| Pharmaceuticals - 0.3% | | | |
| Genomma Lab Internacional SA de CV | | 1,947,600 | 1,597,775 |
| Jazz Pharmaceuticals PLC (a) | | 37,500 | 4,602,000 |
| Sanofi SA | | 18,500 | 1,852,692 |
| | | | 8,052,467 |
TOTAL HEALTH CARE | | | 306,453,914 |
| INDUSTRIALS - 18.7% | | | |
| Aerospace & Defense - 1.6% | | | |
| Cadre Holdings, Inc. (b) | | 668,800 | 22,732,512 |
| Huntington Ingalls Industries, Inc. | | 78,300 | 20,273,436 |
| Leonardo DRS, Inc. (a) | | 88,400 | 1,715,844 |
| | | | 44,721,792 |
| Air Freight & Logistics - 0.2% | | | |
| Compania de Distribucion Integral Logista Holdings SA | | 124,500 | 3,530,517 |
| Hamakyorex Co. Ltd. | | 95,200 | 2,650,762 |
| | | | 6,181,279 |
| Building Products - 1.1% | | | |
| Builders FirstSource, Inc. (a) | | 59,400 | 10,319,562 |
| Euro Ceramics Ltd. (a)(d) | | 5,000 | 63 |
| Hayward Holdings, Inc. (a) | | 1,353,752 | 16,948,975 |
| Janus International Group, Inc. (a) | | 240,600 | 3,404,490 |
| | | | 30,673,090 |
| Commercial Services & Supplies - 0.8% | | | |
| Civeo Corp. | | 192,958 | 4,283,668 |
| CoreCivic, Inc. (a) | | 278,700 | 3,963,114 |
| VSE Corp. (b) | | 225,600 | 14,012,016 |
| | | | 22,258,798 |
| Construction & Engineering - 0.7% | | | |
| Boustead Singapore Ltd. | | 1,438,300 | 931,285 |
| Bowman Consulting Group Ltd. (a) | | 79,500 | 2,497,095 |
| EMCOR Group, Inc. | | 74,000 | 16,880,140 |
| | | | 20,308,520 |
| Electrical Equipment - 1.6% | | | |
| Acuity Brands, Inc. | | 105,800 | 25,197,328 |
| AQ Group AB | | 187,304 | 9,791,179 |
| GrafTech International Ltd. | | 1,824,800 | 2,426,984 |
| nVent Electric PLC | | 129,400 | 7,769,176 |
| | | | 45,184,667 |
| Ground Transportation - 0.3% | | | |
| Stef SA | | 65,760 | 8,599,087 |
| Universal Logistics Holdings, Inc. | | 25,157 | 767,792 |
| | | | 9,366,879 |
| Machinery - 3.3% | | | |
| Crane Co. | | 147,500 | 18,306,225 |
| Daiwa Industries Ltd. | | 598,600 | 6,385,292 |
| EnPro Industries, Inc. | | 50,100 | 7,483,938 |
| ESAB Corp. | | 90,300 | 7,764,897 |
| Estic Corp. | | 45,790 | 286,436 |
| Hillenbrand, Inc. | | 386,600 | 18,003,962 |
| Hy-Lok Corp. | | 17,000 | 316,583 |
| ITT, Inc. | | 148,800 | 17,972,064 |
| JOST Werke AG (c) | | 113,400 | 5,484,174 |
| Miller Industries, Inc. | | 24,600 | 990,150 |
| Timken Co. | | 73,600 | 6,028,576 |
| TK Group Holdings Ltd. | | 11,880,838 | 2,049,681 |
| Tocalo Co. Ltd. | | 149,700 | 1,592,380 |
| | | | 92,664,358 |
| Passenger Airlines - 0.3% | | | |
| Jet2 PLC | | 423,316 | 7,167,217 |
| Professional Services - 4.6% | | | |
| Altech Corp. | | 35,953 | 700,114 |
| Barrett Business Services, Inc. | | 42,300 | 4,749,021 |
| CACI International, Inc. Class A (a) | | 73,500 | 25,264,155 |
| Concentrix Corp. | | 170,000 | 15,107,900 |
| E-Credible Co. Ltd. | | 62,400 | 614,438 |
| Genpact Ltd. | | 645,700 | 23,180,630 |
| KBR, Inc. | | 383,700 | 19,994,607 |
| Maximus, Inc. | | 159,300 | 12,922,416 |
| Quick Co. Ltd. | | 93,627 | 1,662,942 |
| Science Applications International Corp. | | 66,800 | 8,527,688 |
| Verra Mobility Corp. (a) | | 717,200 | 17,148,252 |
| Will Group, Inc. | | 102,800 | 842,478 |
| | | | 130,714,641 |
| Trading Companies & Distributors - 4.2% | | | |
| AerCap Holdings NV (a) | | 70,400 | 5,389,824 |
| Alligo AB (B Shares) | | 357,987 | 4,554,538 |
| Beacon Roofing Supply, Inc. (a) | | 202,600 | 16,793,514 |
| Core & Main, Inc. (a) | | 334,600 | 13,822,326 |
| Ferguson PLC | | 92,600 | 17,395,836 |
| Global Industrial Co. | | 129,096 | 5,490,453 |
| Itochu Corp. | | 224,100 | 10,170,582 |
| Mitani Shoji Co. Ltd. | | 1,847,000 | 24,686,202 |
| Momentum Group Komponenter & Tjanster AB | | 450,000 | 5,902,476 |
| Rush Enterprises, Inc. Class A | | 307,050 | 13,789,616 |
| Totech Corp. | | 21,881 | 823,534 |
| | | | 118,818,901 |
TOTAL INDUSTRIALS | | | 528,060,142 |
| INFORMATION TECHNOLOGY - 14.4% | | | |
| Electronic Equipment, Instruments & Components - 6.9% | | | |
| Advanced Energy Industries, Inc. | | 226,600 | 23,607,188 |
| Belden, Inc. | | 122,200 | 9,064,796 |
| CDW Corp. | | 115,100 | 26,095,472 |
| Crane Nxt Co. (b) | | 367,500 | 21,417,900 |
| Daido Signal Co. Ltd. | | 149,168 | 428,008 |
| Flex Ltd. (a) | | 641,500 | 15,229,210 |
| Insight Enterprises, Inc. (a) | | 152,400 | 28,154,376 |
| Jabil, Inc. | | 107,100 | 13,418,559 |
| Kingboard Chemical Holdings Ltd. | | 1,955,000 | 3,479,716 |
| Methode Electronics, Inc. Class A | | 441,200 | 9,159,312 |
| Redington (India) Ltd. | | 739,442 | 1,599,346 |
| Riken Keiki Co. Ltd. | | 25,400 | 1,254,930 |
| TD SYNNEX Corp. | | 226,150 | 22,610,477 |
| Vontier Corp. | | 457,800 | 15,835,302 |
| VSTECS Holdings Ltd. | | 5,276,100 | 2,842,984 |
| | | | 194,197,576 |
| IT Services - 2.3% | | | |
| Amdocs Ltd. | | 261,600 | 23,983,488 |
| Cognizant Technology Solutions Corp. Class A | | 394,000 | 30,385,280 |
| Sopra Steria Group | | 36,600 | 8,614,778 |
| TDC Soft, Inc. | | 146,707 | 2,268,961 |
| | | | 65,252,507 |
| Semiconductors & Semiconductor Equipment - 2.3% | | | |
| Micron Technology, Inc. | | 240,000 | 20,580,000 |
| MKS Instruments, Inc. | | 216,900 | 23,089,005 |
| Renesas Electronics Corp. (a) | | 515,400 | 8,456,470 |
| Skyworks Solutions, Inc. | | 130,300 | 13,611,138 |
| | | | 65,736,613 |
| Software - 0.1% | | | |
| Cresco Ltd. | | 105,600 | 1,369,278 |
| System Research Co. Ltd. | | 93,800 | 1,897,514 |
| | | | 3,266,792 |
| Technology Hardware, Storage & Peripherals - 2.8% | | | |
| Dell Technologies, Inc. | | 370,900 | 30,740,192 |
| MCJ Co. Ltd. | | 366,800 | 3,075,768 |
| Seagate Technology Holdings PLC | | 534,200 | 45,770,256 |
| | | | 79,586,216 |
TOTAL INFORMATION TECHNOLOGY | | | 408,039,704 |
| MATERIALS - 6.9% | | | |
| Chemicals - 4.4% | | | |
| Axalta Coating Systems Ltd. (a) | | 621,700 | 20,155,514 |
| C. Uyemura & Co. Ltd. | | 86,800 | 6,586,797 |
| Celanese Corp. Class A | | 97,900 | 14,321,791 |
| EcoGreen International Group Ltd. (a)(d) | | 1,000,000 | 60,758 |
| Element Solutions, Inc. | | 647,400 | 14,391,702 |
| Huntsman Corp. | | 667,000 | 16,368,180 |
| LyondellBasell Industries NV Class A | | 315,000 | 29,647,800 |
| Soulbrain Co. Ltd. | | 29,800 | 6,008,905 |
| Tronox Holdings PLC | | 1,220,900 | 16,836,211 |
| | | | 124,377,658 |
| Construction Materials - 1.3% | | | |
| Eagle Materials, Inc. | | 88,300 | 19,980,524 |
| RHI Magnesita NV | | 139,500 | 5,947,160 |
| Wienerberger AG | | 308,400 | 10,491,902 |
| | | | 36,419,586 |
| Containers & Packaging - 0.9% | | | |
| Mayr-Melnhof Karton AG | | 47,300 | 6,256,734 |
| Packaging Corp. of America | | 86,700 | 14,381,796 |
| Silgan Holdings, Inc. | | 82,700 | 3,799,238 |
| | | | 24,437,768 |
| Metals & Mining - 0.3% | | | |
| Warrior Metropolitan Coal, Inc. | | 139,400 | 8,945,298 |
TOTAL MATERIALS | | | 194,180,310 |
| REAL ESTATE - 0.9% | | | |
| Real Estate Management & Development - 0.9% | | | |
| Jones Lang LaSalle, Inc. (a) | | 151,200 | 26,771,472 |
| UTILITIES - 1.5% | | | |
| Electric Utilities - 1.5% | | | |
| PG&E Corp. | | 2,593,600 | 43,754,032 |
| TOTAL COMMON STOCKS (Cost $2,166,784,611) | | | 2,804,237,080 |
| | | | |
| Money Market Funds - 2.7% |
| | | Shares | Value ($) |
| Fidelity Cash Central Fund 5.39% (e) | | 23,295,375 | 23,300,035 |
| Fidelity Securities Lending Cash Central Fund 5.39% (e)(f) | | 53,535,697 | 53,541,051 |
| TOTAL MONEY MARKET FUNDS (Cost $76,841,086) | | | 76,841,086 |
| | | | |
| TOTAL INVESTMENT IN SECURITIES - 102.0% (Cost $2,243,625,697) | 2,881,078,166 |
NET OTHER ASSETS (LIABILITIES) - (2.0)% | (57,873,372) |
| NET ASSETS - 100.0% | 2,823,204,794 |
| | |
Legend
| (b) | Security or a portion of the security is on loan at period end. |
| (c) | Security exempt from registration under Rule 144A of the Securities Act of 1933. These securities may be resold in transactions exempt from registration, normally to qualified institutional buyers. At the end of the period, the value of these securities amounted to $11,274,785 or 0.4% of net assets. |
| (e) | Affiliated fund that is generally available only to investment companies and other accounts managed by Fidelity Investments. The rate quoted is the annualized seven-day yield of the fund at period end. A complete unaudited listing of the fund's holdings as of its most recent quarter end is available upon request. In addition, each Fidelity Central Fund's financial statements are available on the SEC's website or upon request. |
| (f) | Investment made with cash collateral received from securities on loan. |
Affiliated Central Funds
Fiscal year to date information regarding the Fund's investments in Fidelity Central Funds, including the ownership percentage, is presented below.
| Affiliate | Value, beginning of period ($) | Purchases ($) | Sales Proceeds ($) | Dividend Income ($) | Realized Gain (loss) ($) | Change in Unrealized appreciation (depreciation) ($) | Value, end of period ($) | % ownership, end of period |
| Fidelity Cash Central Fund 5.39% | 34,456,604 | 244,496,022 | 255,652,591 | 1,108,713 | - | - | 23,300,035 | 0.0% |
| Fidelity Securities Lending Cash Central Fund 5.39% | 108,612,743 | 504,586,896 | 559,658,588 | 65,050 | - | - | 53,541,051 | 0.2% |
| Total | 143,069,347 | 749,082,918 | 815,311,179 | 1,173,763 | - | - | 76,841,086 | |
| | | | | | | | | |
Amounts in the dividend income column in the above table include any capital gain distributions from underlying funds, which are presented in the corresponding line item in the Statement of Operations, if applicable.
Amounts in the dividend income column for Fidelity Securities Lending Cash Central Fund represents the income earned on investing cash collateral, less rebates paid to borrowers and any lending agent fees associated with the loan, plus any premium payments received for lending certain types of securities.
Amounts included in the purchases and sales proceeds columns may include in-kind transactions, if applicable.
Investment Valuation
The following is a summary of the inputs used, as of January 31, 2024, involving the Fund's assets and liabilities carried at fair value. The inputs or methodology used for valuing securities may not be an indication of the risk associated with investing in those securities. For more information on valuation inputs, and their aggregation into the levels used below, please refer to the Investment Valuation section in the accompanying Notes to Financial Statements.
| Valuation Inputs at Reporting Date: |
| Description | Total ($) | Level 1 ($) | Level 2 ($) | Level 3 ($) |
Investments in Securities: | | | | |
|
| Equities: | | | | |
Communication Services | 55,241,321 | 50,095,998 | 5,145,323 | - |
Consumer Discretionary | 368,224,989 | 356,399,477 | 11,825,512 | - |
Consumer Staples | 116,102,825 | 113,479,091 | 2,623,734 | - |
Energy | 219,233,404 | 219,233,404 | - | - |
Financials | 538,174,967 | 527,947,764 | 10,227,203 | - |
Health Care | 306,453,914 | 292,557,108 | 13,896,806 | - |
Industrials | 528,060,142 | 474,347,370 | 53,712,709 | 63 |
Information Technology | 408,039,704 | 381,366,729 | 26,672,975 | - |
Materials | 194,180,310 | 181,523,850 | 12,595,702 | 60,758 |
Real Estate | 26,771,472 | 26,771,472 | - | - |
Utilities | 43,754,032 | 43,754,032 | - | - |
|
| Money Market Funds | 76,841,086 | 76,841,086 | - | - |
| Total Investments in Securities: | 2,881,078,166 | 2,744,317,381 | 136,699,964 | 60,821 |
| Statement of Assets and Liabilities |
| | | | January 31, 2024 (Unaudited) |
| | | | | |
| Assets | | | | |
| Investment in securities, at value (including securities loaned of $50,701,032) - See accompanying schedule: | | | | |
Unaffiliated issuers (cost $2,166,784,611) | $ | 2,804,237,080 | | |
Fidelity Central Funds (cost $76,841,086) | | 76,841,086 | | |
| | | | | |
| | | | | |
| Total Investment in Securities (cost $2,243,625,697) | | | $ | 2,881,078,166 |
| Cash | | | | 8,343 |
| Foreign currency held at value (cost $29,334) | | | | 29,073 |
| Receivable for investments sold | | | | 77,053 |
| Receivable for fund shares sold | | | | 2,223,686 |
| Dividends receivable | | | | 1,009,525 |
| Reclaims receivable | | | | 3,122,573 |
| Distributions receivable from Fidelity Central Funds | | | | 110,453 |
| Receivable from investment adviser for expense reductions | | | | 1,032 |
| Other receivables | | | | 473,939 |
Total assets | | | | 2,888,133,843 |
| Liabilities | | | | |
| Payable for investments purchased | $ | 4,399,298 | | |
| Payable for fund shares redeemed | | 6,755,890 | | |
| Other payables and accrued expenses | | 260,386 | | |
| Collateral on securities loaned | | 53,513,475 | | |
| Total Liabilities | | | | 64,929,049 |
| Net Assets | | | $ | 2,823,204,794 |
| Net Assets consist of: | | | | |
| Paid in capital | | | $ | 2,162,907,759 |
| Total accumulated earnings (loss) | | | | 660,297,035 |
| Net Assets | | | $ | 2,823,204,794 |
Net Asset Value, offering price and redemption price per share ($2,823,204,794 ÷ 263,669,638 shares) | | | $ | 10.71 |
| Statement of Operations |
| | | | Six months ended January 31, 2024 (Unaudited) |
| Investment Income | | | | |
| Dividends | | | $ | 25,242,085 |
| Interest | | | | 3,311 |
| Income from Fidelity Central Funds (including $65,050 from security lending) | | | | 1,173,763 |
| Total Income | | | | 26,419,159 |
| Expenses | | | | |
| Custodian fees and expenses | $ | 74,308 | | |
| Independent trustees' fees and expenses | | 7,867 | | |
| Total expenses before reductions | | 82,175 | | |
| Expense reductions | | (34,320) | | |
| Total expenses after reductions | | | | 47,855 |
| Net Investment income (loss) | | | | 26,371,304 |
| Realized and Unrealized Gain (Loss) | | | | |
| Net realized gain (loss) on: | | | | |
| Investment Securities: | | | | |
| Unaffiliated issuers | | 63,599,598 | | |
| Foreign currency transactions | | (366,942) | | |
| Total net realized gain (loss) | | | | 63,232,656 |
| Change in net unrealized appreciation (depreciation) on: | | | | |
| Investment Securities: | | | | |
| Unaffiliated issuers(net of decrease in deferred foreign taxes of $2,347) | | 61,361,190 | | |
| Assets and liabilities in foreign currencies | | 576,681 | | |
| Total change in net unrealized appreciation (depreciation) | | | | 61,937,871 |
| Net gain (loss) | | | | 125,170,527 |
| Net increase (decrease) in net assets resulting from operations | | | $ | 151,541,831 |
| Statement of Changes in Net Assets |
| |
| | Six months ended January 31, 2024 (Unaudited) | | Year ended July 31, 2023 |
| Increase (Decrease) in Net Assets | | | | |
| Operations | | | | |
| Net investment income (loss) | $ | 26,371,304 | $ | 89,543,971 |
| Net realized gain (loss) | | 63,232,656 | | 1,963,949,684 |
| Change in net unrealized appreciation (depreciation) | | 61,937,871 | | (1,711,411,416) |
| Net increase (decrease) in net assets resulting from operations | | 151,541,831 | | 342,082,239 |
| Distributions to shareholders | | (581,084,973) | | (2,290,889,691) |
| | | | | |
| Share transactions | | | | |
| Proceeds from sales of shares | | 207,415,382 | | 367,791,224 |
| Reinvestment of distributions | | 581,084,973 | | 2,290,889,691 |
| Cost of shares redeemed | | (307,502,996) | | (5,559,972,706) |
| | | | | |
Net increase (decrease) in net assets resulting from share transactions | | 480,997,359 | | (2,901,291,791) |
| Total increase (decrease) in net assets | | 51,454,217 | | (4,850,099,243) |
| | | | | |
| Net Assets | | | | |
| Beginning of period | | 2,771,750,577 | | 7,621,849,820 |
| End of period | $ | 2,823,204,794 | $ | 2,771,750,577 |
| | | | | |
| Other Information | | | | |
| Shares | | | | |
| Sold | | 19,938,640 | | 28,466,662 |
| Issued in reinvestment of distributions | | 58,411,695 | | 172,732,746 |
| Redeemed | | (29,055,126) | | (391,811,728) |
| Net increase (decrease) | | 49,295,209 | | (190,612,320) |
| | | | | |
Financial Highlights
| Fidelity® Series Intrinsic Opportunities Fund |
| |
| | Six months ended (Unaudited) January 31, 2024 | | Years ended July 31, 2023 | | 2022 | | 2021 | | 2020 | | 2019 |
Selected Per-Share Data | | | | | | | | | | | | |
| Net asset value, beginning of period | $ | 12.93 | $ | 18.82 | $ | 22.41 | $ | 15.29 | $ | 16.42 | $ | 18.79 |
| Income from Investment Operations | | | | | | | | | | | | |
Net investment income (loss) A,B | | .10 | | .31 | | .40 | | .40 | | .38 | | .44 |
| Net realized and unrealized gain (loss) | | .34 | | 1.30 | | (.31) | | 7.49 | | (.65) | | (1.37) |
| Total from investment operations | | .44 | | 1.61 | | .09 | | 7.89 | | (.27) | | (.93) |
| Distributions from net investment income | | (.26) | | (.35) | | (.51) | | (.44) | | (.45) | | (.42) |
| Distributions from net realized gain | | (2.40) | | (7.15) | | (3.17) | | (.33) | | (.40) | | (1.02) |
| Total distributions | | (2.66) | | (7.50) | | (3.68) | | (.77) | | (.86) C | | (1.44) |
| Net asset value, end of period | $ | 10.71 | $ | 12.93 | $ | 18.82 | $ | 22.41 | $ | 15.29 | $ | 16.42 |
Total Return D,E | | 5.44% | | 13.61% | | .18% | | 53.18% | | (1.89)% | | (5.13)% |
Ratios to Average Net Assets B,F,G | | | | | | | | | | | | |
| Expenses before reductions | | .01% H | | .01% | | .01% | | .01% | | .01% | | .01% |
| Expenses net of fee waivers, if any | | -% H,I | | -% I | | -% I | | -% I | | .01% | | .01% |
| Expenses net of all reductions | | -% H,I | | -% I | | -% I | | -% I | | .01% | | .01% |
| Net investment income (loss) | | 1.95% H | | 2.29% | | 1.99% | | 2.08% | | 2.46% | | 2.61% |
| Supplemental Data | | | | | | | | | | | | |
| Net assets, end of period (000 omitted) | $ | 2,823,205 | $ | 2,771,751 | $ | 7,621,850 | $ | 13,891,352 | $ | 11,787,708 | $ | 13,589,092 |
Portfolio turnover rate J | | 18% H | | 35% | | 18% | | 10% | | 19% | | 27% |
ACalculated based on average shares outstanding during the period.
BNet investment income (loss) is affected by the timing of the declaration of dividends by any underlying mutual funds or exchange-traded funds (ETFs). Net investment income (loss) of any mutual funds or ETFs is not included in the Fund's net investment income (loss) ratio.
CTotal distributions per share do not sum due to rounding.
DTotal returns for periods of less than one year are not annualized.
ETotal returns would have been lower if certain expenses had not been reduced during the applicable periods shown.
FFees and expenses of any underlying mutual funds or exchange-traded funds (ETFs) are not included in the Fund's expense ratio. The Fund indirectly bears its proportionate share of these expenses. For additional expense information related to investments in Fidelity Central Funds, please refer to the "Investments in Fidelity Central Funds" note found in the Notes to Financial Statements section of the most recent Annual or Semi-Annual report.
GExpense ratios reflect operating expenses of the class. Expenses before reductions do not reflect amounts reimbursed, waived, or reduced through arrangements with the investment adviser, brokerage services, or other offset arrangements, if applicable, and do not represent the amount paid by the class during periods when reimbursements, waivers or reductions occur.
HAnnualized.
IAmount represents less than .005%.
JAmount does not include the portfolio activity of any underlying mutual funds or exchange-traded funds (ETFs).
For the period ended January 31, 2024
1. Organization.
Fidelity Series Intrinsic Opportunities Fund (the Fund) is a fund of Fidelity Puritan Trust (the Trust) and is authorized to issue an unlimited number of shares. Shares are offered only to certain other Fidelity funds, Fidelity managed 529 plans, and Fidelity managed collective investment trusts. The Trust is registered under the Investment Company Act of 1940, as amended (the 1940 Act), as an open-end management investment company organized as a Massachusetts business trust.
2. Investments in Fidelity Central Funds.
Funds may invest in Fidelity Central Funds, which are open-end investment companies generally available only to other investment companies and accounts managed by the investment adviser and its affiliates. The Schedule of Investments lists any Fidelity Central Funds held as an investment as of period end, but does not include the underlying holdings of each Fidelity Central Fund. An investing fund indirectly bears its proportionate share of the expenses of the underlying Fidelity Central Funds.
Based on its investment objective, each Fidelity Central Fund may invest or participate in various investment vehicles or strategies that are similar to those of the investing fund. These strategies are consistent with the investment objectives of the investing fund and may involve certain economic risks which may cause a decline in value of each of the Fidelity Central Funds and thus a decline in the value of the investing fund.
| Fidelity Central Fund | Investment Manager | Investment Objective | Investment Practices | Expense RatioA |
| Fidelity Money Market Central Funds | Fidelity Management & Research Company LLC (FMR) | Each fund seeks to obtain a high level of current income consistent with the preservation of capital and liquidity. | Short-term Investments | Less than .005% |
A Expenses expressed as a percentage of average net assets and are as of each underlying Central Fund's most recent annual or semi-annual shareholder report.
A complete unaudited list of holdings for each Fidelity Central Fund is available upon request or at the Securities and Exchange Commission website at www.sec.gov. In addition, the financial statements of the Fidelity Central Funds which contain the significant accounting policies (including investment valuation policies) of those funds, and are not covered by the Report of Independent Registered Public Accounting Firm, are available on the Securities and Exchange Commission website or upon request.
3. Significant Accounting Policies.
The Fund is an investment company and applies the accounting and reporting guidance of the Financial Accounting Standards Board (FASB) Accounting Standards Codification Topic 946 Financial Services - Investment Companies. The financial statements have been prepared in conformity with accounting principles generally accepted in the United States of America (GAAP), which require management to make certain estimates and assumptions at the date of the financial statements. Actual results could differ from those estimates. Subsequent events, if any, through the date that the financial statements were issued have been evaluated in the preparation of the financial statements. The Fund's Schedule of Investments lists any underlying mutual funds or exchange-traded funds (ETFs) but does not include the underlying holdings of these funds. The following summarizes the significant accounting policies of the Fund:
Investment Valuation. Investments are valued as of 4:00 p.m. Eastern time on the last calendar day of the period. The Board of Trustees (the Board) has designated the Fund's investment adviser as the valuation designee responsible for the fair valuation function and performing fair value determinations as needed. The investment adviser has established a Fair Value Committee (the Committee) to carry out the day-to-day fair valuation responsibilities and has adopted policies and procedures to govern the fair valuation process and the activities of the Committee. In accordance with these fair valuation policies and procedures, which have been approved by the Board, the Fund attempts to obtain prices from one or more third party pricing services or brokers to value its investments. When current market prices, quotations or currency exchange rates are not readily available or reliable, investments will be fair valued in good faith by the Committee, in accordance with the policies and procedures. Factors used in determining fair value vary by investment type and may include market or investment specific events, transaction data, estimated cash flows, and market observations of comparable investments. The frequency that the fair valuation procedures are used cannot be predicted and they may be utilized to a significant extent. The Committee manages the Fund's fair valuation practices and maintains the fair valuation policies and procedures. The Fund's investment adviser reports to the Board information regarding the fair valuation process and related material matters.
The Fund categorizes the inputs to valuation techniques used to value its investments into a disclosure hierarchy consisting of three levels as shown below:
Level 1 - unadjusted quoted prices in active markets for identical investments
Level 2 - other significant observable inputs (including quoted prices for similar investments, interest rates, prepayment speeds, etc.)
Level 3 - unobservable inputs (including the Fund's own assumptions based on the best information available)
Valuation techniques used to value the Fund's investments by major category are as follows:
Equity securities, including restricted securities, for which market quotations are readily available, are valued at the last reported sale price or official closing price as reported by a third party pricing service on the primary market or exchange on which they are traded and are categorized as Level 1 in the hierarchy. In the event there were no sales during the day or closing prices are not available, securities are valued at the last quoted bid price or may be valued using the last available price and are generally categorized as Level 2 in the hierarchy. For foreign equity securities, when market or security specific events arise, comparisons to the valuation of American Depositary Receipts (ADRs), futures contracts, ETFs and certain indexes as well as quoted prices for similar securities may be used and would be categorized as Level 2 in the hierarchy. For equity securities, including restricted securities, where observable inputs are limited, assumptions about market activity and risk are used and these securities may be categorized as Level 3 in the hierarchy.
Investments in open-end mutual funds, including the Fidelity Central Funds, are valued at their closing net asset value (NAV) each business day and are categorized as Level 1 in the hierarchy.
Changes in valuation techniques may result in transfers in or out of an assigned level within the disclosure hierarchy. The aggregate value of investments by input level as of January 31, 2024 is included at the end of the Fund's Schedule of Investments.
Foreign Currency. Certain Funds may use foreign currency contracts to facilitate transactions in foreign-denominated securities. Gains and losses from these transactions may arise from changes in the value of the foreign currency or if the counterparties do not perform under the contracts' terms.
Foreign-denominated assets, including investment securities, and liabilities are translated into U.S. dollars at the exchange rates at period end. Purchases and sales of investment securities, income and dividends received, and expenses denominated in foreign currencies are translated into U.S. dollars at the exchange rate in effect on the transaction date.
The effects of exchange rate fluctuations on investments are included with the net realized and unrealized gain (loss) on investment securities. Other foreign currency transactions resulting in realized and unrealized gain (loss) are disclosed separately.
Investment Transactions and Income. For financial reporting purposes, the Fund's investment holdings and NAV include trades executed through the end of the last business day of the period. The NAV per share for processing shareholder transactions is calculated as of the close of business of the New York Stock Exchange (NYSE), normally 4:00 p.m. Eastern time and includes trades executed through the end of the prior business day. Gains and losses on securities sold are determined on the basis of identified cost and include proceeds received from litigation. Commissions paid to certain brokers with whom the investment adviser, or its affiliates, places trades on behalf of a fund include an amount in addition to trade execution, which may be rebated back to a fund. Any such rebates are included in net realized gain (loss) on investments in the Statement of Operations. Dividend income is recorded on the ex-dividend date, except for certain dividends from foreign securities where the ex-dividend date may have passed, which are recorded as soon as the Fund is informed of the ex-dividend date. Non-cash dividends included in dividend income, if any, are recorded at the fair market value of the securities received. Income and capital gain distributions from Fidelity Central Funds, if any, are recorded on the ex-dividend date. Interest income is accrued as earned and includes coupon interest and amortization of premium and accretion of discount on debt securities as applicable. Investment income is recorded net of foreign taxes withheld where recovery of such taxes is uncertain. Funds may file withholding tax reclaims in certain jurisdictions to recover a portion of amounts previously withheld. Any withholding tax reclaims income is included in the Statement of Operations in dividends. Any receivables for withholding tax reclaims are included in the Statement of Assets and Liabilities in reclaims receivable. The Fund has filed tax reclaims for previously withheld taxes on dividends earned in certain European Union (EU) countries. These additional filings are subject to various administrative proceedings by the local jurisdictions' tax authorities within the EU, as well as a number of related judicial proceedings. Income recognized for EU reclaims is included with other reclaims in the Statement of Operations in dividends. These reclaims are recorded when the amount is known and there are no significant uncertainties on collectability.
Expenses. Expenses directly attributable to a fund are charged to that fund. Expenses attributable to more than one fund are allocated among the respective funds on the basis of relative net assets or other appropriate methods. Expenses included in the accompanying financial statements reflect the expenses of that fund and do not include any expenses associated with any underlying mutual funds or exchange-traded funds. Although not included in a fund's expenses, a fund indirectly bears its proportionate share of these expenses through the net asset value of each underlying mutual fund or exchange-traded fund. Expense estimates are accrued in the period to which they relate and adjustments are made when actual amounts are known.
Income Tax Information and Distributions to Shareholders. Each year, the Fund intends to qualify as a regulated investment company under Subchapter M of the Internal Revenue Code, including distributing substantially all of its taxable income and realized gains. As a result, no provision for U.S. Federal income taxes is required. The Fund files a U.S. federal tax return, in addition to state and local tax returns as required. The Fund's federal income tax returns are subject to examination by the Internal Revenue Service (IRS) for a period of three fiscal years after they are filed. State and local tax returns may be subject to examination for an additional fiscal year depending on the jurisdiction. Foreign taxes are provided for based on the Fund's understanding of the tax rules and rates that exist in the foreign markets in which it invests. The Fund is subject to a tax imposed on capital gains by certain countries in which it invests. An estimated deferred tax liability for net unrealized appreciation on the applicable securities is included in Other payables and accrued expenses on the Statement of Assets & Liabilities.
Distributions are declared and recorded on the ex-dividend date. Income and capital gain distributions are determined in accordance with income tax regulations, which may differ from GAAP.
Capital accounts within the financial statements are adjusted for permanent book-tax differences. These adjustments have no impact on net assets or the results of operations. Capital accounts are not adjusted for temporary book-tax differences which will reverse in a subsequent period.
Book-tax differences are primarily due to futures contracts, foreign currency transactions, certain foreign taxes, passive foreign investment companies (PFIC), partnerships and losses deferred due to wash sales and excise tax regulations.
As of period end, the cost and unrealized appreciation (depreciation) in securities, and derivatives if applicable, for federal income tax purposes were as follows:
| Gross unrealized appreciation | $778,219,235 |
| Gross unrealized depreciation | (151,880,250) |
| Net unrealized appreciation (depreciation) | $626,338,985 |
| Tax cost | $2,254,739,181 |
Restricted Securities (including Private Placements). Funds may invest in securities that are subject to legal or contractual restrictions on resale. These securities generally may be resold in transactions exempt from registration or to the public if the securities are registered. Disposal of these securities may involve time-consuming negotiations and expense, and prompt sale at an acceptable price may be difficult. Information regarding restricted securities held at period end is included at the end of the Schedule of Investments, if applicable.
4. Purchases and Sales of Investments.
Purchases and sales of securities, other than short-term securities and in-kind transactions, as applicable, are noted in the table below.
| | Purchases ($) | Sales ($) |
| Fidelity Series Intrinsic Opportunities Fund | 236,404,620 | 290,062,169 |
5. Fees and Other Transactions with Affiliates.
Management Fee. Fidelity Management & Research Company LLC (the investment adviser) and its affiliates provide the Fund with investment management related services for which the Fund does not pay a management fee. Under the management contract, the investment adviser or an affiliate pays all ordinary operating expenses of the Fund, except custody fees, fees and expenses of the independent Trustees, and certain miscellaneous expenses such as proxy and shareholder meeting expenses.
Brokerage Commissions. A portion of portfolio transactions were placed with brokerage firms which are affiliates of the investment adviser. Brokerage commissions are included in net realized gain (loss) and change in net unrealized appreciation (depreciation) in the Statement of Operations. The commissions paid to these affiliated firms were as follows:
| | Amount |
| Fidelity Series Intrinsic Opportunities Fund | $5,641 |
Interfund Trades. Funds may purchase from or sell securities to other Fidelity Funds under procedures adopted by the Board. The procedures have been designed to ensure these interfund trades are executed in accordance with Rule 17a-7 of the 1940 Act. Any interfund trades are included within the respective purchases and sales amounts shown in the Purchases and Sales of Investments note. Interfund trades during the period are noted in the table below.
| | Purchases ($) | Sales ($) | Realized Gain (Loss) ($) |
| Fidelity Series Intrinsic Opportunities Fund | 17,773,964 | 30,881,466 | 6,230,533 |
Subsequent Event - Sub-Advisory Arrangements. Effective March 1, 2024, the Fund's sub-advisory agreements with FMR Investment Management (UK) Limited, Fidelity Management & Research (Hong Kong) Limited, and Fidelity Management & Research (Japan) Limited will be amended to provide that the investment adviser will pay each sub-adviser monthly fees equal to 110% of the sub-adviser's costs for providing sub-advisory services.
6. Committed Line of Credit.
Certain Funds participate with other funds managed by the investment adviser or an affiliate in a $4.25 billion credit facility (the "line of credit") to be utilized for temporary or emergency purposes to fund shareholder redemptions or for other short-term liquidity purposes. The commitment fees on the pro-rata portion of the line of credit are borne by the investment adviser. During the period, there were no borrowings on this line of credit.
7. Security Lending.
Funds lend portfolio securities from time to time in order to earn additional income. Lending agents are used, including National Financial Services (NFS), an affiliate of the investment adviser. Pursuant to a securities lending agreement, NFS will receive a fee, which is capped at 9.9% of a fund's daily lending revenue, for its services as lending agent. A fund may lend securities to certain qualified borrowers, including NFS. On the settlement date of the loan, a fund receives collateral (in the form of U.S. Treasury obligations, letters of credit and/or cash) against the loaned securities and maintains collateral in an amount not less than 100% of the market value of the loaned securities during the period of the loan. The market value of the loaned securities is determined at the close of business of a fund and any additional required collateral is delivered to a fund on the next business day. A fund or borrower may terminate the loan at any time, and if the borrower defaults on its obligation to return the securities loaned because of insolvency or other reasons, a fund may apply collateral received from the borrower against the obligation. A fund may experience delays and costs in recovering the securities loaned. Any cash collateral received is invested in the Fidelity Securities Lending Cash Central Fund. Any loaned securities are identified as such in the Schedule of Investments, and the value of loaned securities and cash collateral at period end, as applicable, are presented in the Statement of Assets and Liabilities. Security lending income represents the income earned on investing cash collateral, less rebates paid to borrowers and any lending agent fees associated with the loan, plus any premium payments received for lending certain types of securities. Security lending income is presented in the Statement of Operations as a component of income from Fidelity Central Funds. Affiliated security lending activity, if any, was as follows:
| | Total Security Lending Fees Paid to NFS | Security Lending Income From Securities Loaned to NFS | Value of Securities Loaned to NFS at Period End |
| Fidelity Series Intrinsic Opportunities Fund | $6,530 | $113 | $- |
8. Expense Reductions.
The investment adviser contractually agreed to reimburse the Fund to the extent annual operating expenses exceeded .003% of average net assets. This reimbursement will remain in place through November 30, 2026. Some expenses, for example the compensation of the independent Trustees, and certain other expenses such as interest expense, are excluded from this reimbursement. During the period this reimbursement reduced the Fund's expenses by $33,797.
Through arrangements with the Fund's custodian, credits realized as a result of certain uninvested cash balances were used to reduce the Fund's expenses by $523.
9. Other.
A fund's organizational documents provide former and current trustees and officers with a limited indemnification against liabilities arising in connection with the performance of their duties to the fund. In the normal course of business, a fund may also enter into contracts that provide general indemnifications. A fund's maximum exposure under these arrangements is unknown as this would be dependent on future claims that may be made against a fund. The risk of material loss from such claims is considered remote.
At the end of the period, mutual funds and accounts managed by the investment adviser or its affiliates were the owners of record of all of the outstanding shares of the Fund.
10. Risk and Uncertainties.
Many factors affect a fund's performance. Developments that disrupt global economies and financial markets, such as pandemics, epidemics, outbreaks of infectious diseases, war, terrorism, and environmental disasters, may significantly affect a fund's investment performance. The effects of these developments to a fund will be impacted by the types of securities in which a fund invests, the financial condition, industry, economic sector, and geographic location of an issuer, and a fund's level of investment in the securities of that issuer. Significant concentrations in security types, issuers, industries, sectors, and geographic locations may magnify the factors that affect a fund's performance.
As a shareholder, you incur two types of costs: (1) transaction costs, which may include sales charges (loads) on purchase payments or redemption proceeds, as applicable and (2) ongoing costs, which generally include management fees, distribution and/or service (12b-1) fees and other Fund expenses. This Example is intended to help you understand your ongoing costs (in dollars) of investing in a fund and to compare these costs with the ongoing costs of investing in other mutual funds.
| The Example is based on an investment of $1,000 invested at the beginning of the period and held for the entire period (August 1, 2023 to January 31, 2024). |
Actual Expenses
The first line of the accompanying table provides information about actual account values and actual expenses. You may use the information in this line, together with the amount you invested, to estimate the expenses that you paid over the period. Simply divide your account value by $1,000.00 (for example, an $8,600 account value divided by $1,000.00 = 8.6), then multiply the result by the number in the first line for a class/Fund under the heading entitled "Expenses Paid During Period" to estimate the expenses you paid on your account during this period. If any fund is a shareholder of any underlying mutual funds or exchange-traded funds (ETFs) (the Underlying Funds), such fund indirectly bears its proportional share of the expenses of the Underlying Funds in addition to the direct expenses incurred presented in the table. These fees and expenses are not included in the annualized expense ratio used to calculate the expense estimate in the table below.
Hypothetical Example for Comparison Purposes
The second line of the accompanying table provides information about hypothetical account values and hypothetical expenses based on the actual expense ratio and an assumed rate of return of 5% per year before expenses, which is not the actual return. The hypothetical account values and expenses may not be used to estimate the actual ending account balance or expenses you paid for the period. You may use this information to compare the ongoing costs of investing in the Fund and other funds. To do so, compare this 5% hypothetical example with the 5% hypothetical examples that appear in the shareholder reports of the other funds. If any fund is a shareholder of any Underlying Funds, such fund indirectly bears its proportional share of the expenses of the Underlying Funds in addition to the direct expenses as presented in the table. These fees and expenses are not included in the annualized expense ratio used to calculate the expense estimate in the table below.
Please note that the expenses shown in the table are meant to highlight your ongoing costs only and do not reflect any transaction costs. Therefore, the second line of the table is useful in comparing ongoing costs only, and will not help you determine the relative total costs of owning different funds. In addition, if these transactional costs were included, your costs would have been higher.
| | | | | Annualized Expense Ratio- A | | Beginning Account Value August 1, 2023 | | Ending Account Value January 31, 2024 | | Expenses Paid During Period- C August 1, 2023 to January 31, 2024 |
| | | | | | | | | | |
| Fidelity® Series Intrinsic Opportunities Fund | | | | -%-D | | | | | | |
| Actual | | | | | | $ 1,000 | | $ 1,054.40 | | $-E |
Hypothetical-B | | | | | | $ 1,000 | | $ 1,025.14 | | $-E |
| |
A Annualized expense ratio reflects expenses net of applicable fee waivers.
B 5% return per year before expenses
C Expenses are equal to the annualized expense ratio, multiplied by the average account value over the period, multiplied by 184/ 366 (to reflect the one-half year period). The fees and expenses of any Underlying Funds are not included in each annualized expense ratio.
D Amount represents less than .005%.
E Amount represents less than $.005.
Board Approval of Investment Advisory Contracts
At its January 2024 meeting, the Board of Trustees, including the Independent Trustees (together, the Board), approved amended and restated sub-advisory agreements (the Sub-Advisory Contracts) for the fund, including the fund's sub-advisory agreements with FMR Investment Management (UK) Limited (FMR UK), Fidelity Management & Research (Hong Kong) Limited (FMR H.K.), and Fidelity Management & Research (Japan) Limited (FMR Japan). The Sub-Advisory Contracts will be effective March 1, 2024. The Board will consider the annual renewal of the funds' Sub-Advisory Contracts in May 2024, following its review of additional materials provided by FMR.
The Board considered the Sub-Advisory Contracts, which simplified the calculation of the fees paid by FMR to the sub-advisers under the agreements. The Board noted that the agreements with FMR UK, FMR H.K., and FMR Japan were amended to provide that FMR will compensate each sub-adviser at a fee rate equal to 110% of the sub-adviser's costs incurred in providing services under the agreement. The Board considered that, under the Sub-Advisory Contracts, FMR, and not the fund, will continue to pay the sub-advisory fees to each applicable sub-adviser, and that the management fee paid by the fund under the management contract with FMR will remain unchanged.
The Board further considered that the approval of the fund's Sub-Advisory Contracts will not result in any changes in the investment process or strategies employed in the management of the fund's assets or the day-to-day management of the fund or the persons primarily responsible for such management. Further, the Board considered that the Sub-Advisory Contracts would not change the obligations and services of FMR and its affiliates on behalf of the fund, and, in particular, there would be no change in the nature and level of services provided to the fund by FMR and its affiliates.
In connection with its consideration of future renewals of the fund's advisory contracts, the Board will consider: (i) the nature, extent and quality of services provided to the funds, including shareholder and administrative services and investment performance; (ii) the competitiveness of the management fee and total expenses for the fund; (iii) the costs of the services and profitability, including the revenues earned and the expenses incurred in conducting the business of developing, marketing, distributing, managing, administering, and servicing the fund and its shareholders, to the extent applicable; and (iv) whether there have been economies of scale in respect of the Fidelity funds, whether the Fidelity funds (including the fund) have appropriately benefited from any such economies of scale, and whether there is the potential for realization of any further economies.
Based on its evaluation of all of the conclusions noted above, and after considering all factors it believed relevant, the Board concluded that the fund's management fee structure is fair and reasonable, and that the fund's Sub-Advisory Contracts should be approved.
The Securities and Exchange Commission adopted Rule 22e-4 under the Investment Company Act of 1940 (the Liquidity Rule) to promote effective liquidity risk management throughout the open-end investment company industry, thereby reducing the risk that funds will be unable to meet their redemption obligations and mitigating dilution of the interests of fund shareholders.
The Fund has adopted and implemented a liquidity risk management program (the Program) reasonably designed to assess and manage the Fund's liquidity risk and to comply with the requirements of the Liquidity Rule. The Fund's Board of Trustees (the Board) has designated the Fund's investment adviser as administrator of the Program. The Fidelity advisers have established a Liquidity Risk Management Committee (the LRM Committee) to manage the Program for each of the Fidelity Funds. The LRM Committee monitors the adequacy and effectiveness of implementation of the Program and on a periodic basis assesses each Fund's liquidity risk based on a variety of factors including (1) the Fund's investment strategy, (2) portfolio liquidity and cash flow projections during normal and reasonably foreseeable stressed conditions, (3) shareholder redemptions, (4) borrowings and other funding sources and (5) certain factors specific to ETFs including the effect of the Fund's prices and spreads, market participants, and basket compositions on the overall liquidity of the Fund's portfolio, as applicable.
In accordance with the Program, each of the Fund's portfolio investments is classified into one of four defined liquidity categories based on a determination of a reasonable expectation for how long it would take to convert the investment to cash (or sell or dispose of the investment) without significantly changing its market value.
- Highly liquid investments - cash or convertible to cash within three business days or less
- Moderately liquid investments - convertible to cash in three to seven calendar days
- Less liquid investments - can be sold or disposed of, but not settled, within seven calendar days
- Illiquid investments - cannot be sold or disposed of within seven calendar days
Liquidity classification determinations take into account a variety of factors including various market, trading and investment-specific considerations, as well as market depth, and generally utilize analysis from a third-party liquidity metrics service.
The Liquidity Rule places a 15% limit on a fund's illiquid investments and requires funds that do not primarily hold assets that are highly liquid investments to determine and maintain a minimum percentage of the fund's net assets to be invested in highly liquid investments (highly liquid investment minimum or HLIM). The Program includes provisions reasonably designed to comply with the 15% limit on illiquid investments and for determining, periodically reviewing and complying with the HLIM requirement as applicable.
At a recent meeting of the Fund's Board of Trustees, the LRM Committee provided a written report to the Board pertaining to the operation, adequacy, and effectiveness of the Program for the period December 1, 2022 through November 30, 2023. The report concluded that the Program is operating effectively and is reasonably designed to assess and manage the Fund's liquidity risk.
1.951015.111
O2T-SANN-0324
Fidelity® Value Discovery Fund
Semi-Annual Report
January 31, 2024
Contents
To view a fund's proxy voting guidelines and proxy voting record for the 12-month period ended June 30, visit http://www.fidelity.com/proxyvotingresults or visit the Securities and Exchange Commission's (SEC) web site at http://www.sec.gov.
You may also call 1-800-544-8544 if you're an individual investing directly with Fidelity, call 1-800-835-5092 if you're a plan sponsor or participant with Fidelity as your recordkeeper or call 1-877-208-0098 on institutional accounts or if you're an advisor or invest through one to request a free copy of the proxy voting guidelines.
Standard & Poor's, S&P and S&P 500 are registered service marks of The McGraw-Hill Companies, Inc. and have been licensed for use by Fidelity Distributors Corporation.
Other third-party marks appearing herein are the property of their respective owners.
All other marks appearing herein are registered or unregistered trademarks or service marks of FMR LLC or an affiliated company. © 2024 FMR LLC. All rights reserved.
This report and the financial statements contained herein are submitted for the general information of the shareholders of the Fund. This report is not authorized for distribution to prospective investors in the Fund unless preceded or accompanied by an effective prospectus.
A fund files its complete schedule of portfolio holdings with the SEC for the first and third quarters of each fiscal year on Form N-PORT. Forms N-PORT are available on the SEC's web site at http://www.sec.gov. A fund's Forms N-PORT may be reviewed and copied at the SEC's Public Reference Room in Washington, DC. Information regarding the operation of the SEC's Public Reference Room may be obtained by calling 1-800-SEC-0330.
For a complete list of a fund's portfolio holdings, view the most recent holdings listing, semiannual report, or annual report on Fidelity's web site at http://www.fidelity.com, http://www.institutional.fidelity.com, or http://www.401k.com, as applicable.
NOT FDIC INSURED •MAY LOSE VALUE •NO BANK GUARANTEE
Neither the Fund nor Fidelity Distributors Corporation is a bank.
Top Holdings (% of Fund's net assets) |
| |
| Exxon Mobil Corp. | 4.1 | |
| Berkshire Hathaway, Inc. Class B | 3.9 | |
| JPMorgan Chase & Co. | 3.5 | |
| Comcast Corp. Class A | 3.3 | |
| Chubb Ltd. | 2.9 | |
| Cigna Group | 2.7 | |
| The Travelers Companies, Inc. | 2.6 | |
| Bank of America Corp. | 2.4 | |
| Centene Corp. | 2.4 | |
| PG&E Corp. | 2.2 | |
| | 30.0 | |
| |
| Market Sectors (% of Fund's net assets) |
| |
| Financials | 23.5 | |
| Health Care | 16.8 | |
| Consumer Staples | 12.9 | |
| Utilities | 9.1 | |
| Industrials | 8.6 | |
| Energy | 8.1 | |
| Information Technology | 7.1 | |
| Communication Services | 5.2 | |
| Consumer Discretionary | 2.9 | |
| Materials | 2.1 | |
| Real Estate | 1.0 | |
| |
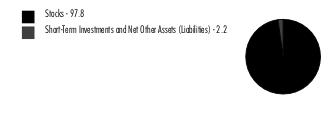
Asset Allocation (% of Fund's net assets) |
|
|
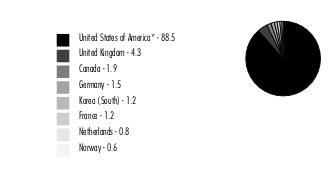
Geographic Diversification (% of Fund's net assets) |
|
* Includes Short-Term investments and Net Other Assets (Liabilities). Percentages are adjusted for the effect of derivatives, if applicable. |
| |
Showing Percentage of Net Assets
| Common Stocks - 96.1% |
| | | Shares | Value ($) |
| COMMUNICATION SERVICES - 5.2% | | | |
| Entertainment - 1.9% | | | |
| The Walt Disney Co. | | 558,500 | 53,643,925 |
| Media - 3.3% | | | |
| Comcast Corp. Class A | | 2,024,730 | 94,230,934 |
TOTAL COMMUNICATION SERVICES | | | 147,874,859 |
| CONSUMER DISCRETIONARY - 2.9% | | | |
| Diversified Consumer Services - 1.9% | | | |
| H&R Block, Inc. | | 1,160,962 | 54,379,460 |
| Specialty Retail - 1.0% | | | |
| Ross Stores, Inc. | | 198,640 | 27,865,219 |
TOTAL CONSUMER DISCRETIONARY | | | 82,244,679 |
| CONSUMER STAPLES - 12.9% | | | |
| Beverages - 3.0% | | | |
| Coca-Cola European Partners PLC | | 339,939 | 23,421,797 |
| Diageo PLC | | 197,600 | 7,136,889 |
| Keurig Dr. Pepper, Inc. | | 658,400 | 20,700,096 |
| The Coca-Cola Co. | | 559,700 | 33,296,553 |
| | | | 84,555,335 |
| Consumer Staples Distribution & Retail - 1.4% | | | |
| BJ's Wholesale Club Holdings, Inc. (a) | | 230,000 | 14,798,200 |
| U.S. Foods Holding Corp. (a) | | 560,760 | 25,800,568 |
| | | | 40,598,768 |
| Food Products - 3.1% | | | |
| Lamb Weston Holdings, Inc. | | 123,500 | 12,651,340 |
| Mondelez International, Inc. | | 726,061 | 54,650,611 |
| Tyson Foods, Inc. Class A | | 348,229 | 19,069,020 |
| | | | 86,370,971 |
| Household Products - 2.5% | | | |
| Procter & Gamble Co. | | 257,434 | 40,453,179 |
| Reckitt Benckiser Group PLC | | 195,763 | 14,153,838 |
| The Clorox Co. | | 117,668 | 17,091,277 |
| | | | 71,698,294 |
| Personal Care Products - 2.9% | | | |
| Haleon PLC | | 4,707,300 | 19,119,949 |
| Kenvue, Inc. | | 2,319,904 | 48,161,207 |
| Unilever PLC sponsored ADR | | 321,979 | 15,677,158 |
| | | | 82,958,314 |
TOTAL CONSUMER STAPLES | | | 366,181,682 |
| ENERGY - 8.1% | | | |
| Oil, Gas & Consumable Fuels - 8.1% | | | |
| Antero Resources Corp. (a) | | 514,696 | 11,498,309 |
| ConocoPhillips Co. | | 53,539 | 5,989,408 |
| Equinor ASA sponsored ADR | | 635,488 | 18,219,441 |
| Exxon Mobil Corp. | | 1,123,241 | 115,480,407 |
| Occidental Petroleum Corp. | | 336,901 | 19,395,391 |
| Ovintiv, Inc. | | 380,651 | 16,147,215 |
| Parex Resources, Inc. (b) | | 1,211,508 | 20,058,885 |
| Shell PLC ADR | | 360,800 | 22,697,928 |
| | | | 229,486,984 |
| FINANCIALS - 23.5% | | | |
| Banks - 10.2% | | | |
| Bank of America Corp. | | 2,014,490 | 68,512,805 |
| Cullen/Frost Bankers, Inc. | | 66,891 | 7,098,473 |
| JPMorgan Chase & Co. | | 574,670 | 100,199,461 |
| M&T Bank Corp. | | 130,577 | 18,032,684 |
| PNC Financial Services Group, Inc. | | 172,596 | 26,098,241 |
| U.S. Bancorp | | 372,300 | 15,465,342 |
| Wells Fargo & Co. | | 1,093,989 | 54,896,368 |
| | | | 290,303,374 |
| Capital Markets - 2.9% | | | |
| Affiliated Managers Group, Inc. | | 116,212 | 17,296,994 |
| BlackRock, Inc. Class A | | 62,183 | 48,148,919 |
| Northern Trust Corp. | | 187,724 | 14,950,339 |
| | | | 80,396,252 |
| Financial Services - 3.9% | | | |
| Berkshire Hathaway, Inc. Class B (a) | | 290,592 | 111,511,774 |
| Insurance - 6.5% | | | |
| Chubb Ltd. | | 332,246 | 81,400,270 |
| The Travelers Companies, Inc. | | 353,806 | 74,780,436 |
| Willis Towers Watson PLC | | 116,899 | 28,792,224 |
| | | | 184,972,930 |
TOTAL FINANCIALS | | | 667,184,330 |
| HEALTH CARE - 16.8% | | | |
| Health Care Providers & Services - 9.4% | | | |
| Centene Corp. (a) | | 907,090 | 68,312,948 |
| Cigna Group | | 249,491 | 75,084,316 |
| CVS Health Corp. | | 524,000 | 38,969,880 |
| Elevance Health, Inc. | | 76,477 | 37,736,811 |
| UnitedHealth Group, Inc. | | 89,620 | 45,862,139 |
| | | | 265,966,094 |
| Pharmaceuticals - 7.4% | | | |
| AstraZeneca PLC sponsored ADR | | 630,514 | 42,017,453 |
| Bristol-Myers Squibb Co. | | 963,485 | 47,085,512 |
| Johnson & Johnson | | 303,308 | 48,195,641 |
| Roche Holding AG (participation certificate) | | 120,604 | 34,337,931 |
| Sanofi SA sponsored ADR | | 797,551 | 39,797,795 |
| | | | 211,434,332 |
TOTAL HEALTH CARE | | | 477,400,426 |
| INDUSTRIALS - 8.6% | | | |
| Aerospace & Defense - 3.7% | | | |
| Airbus Group NV | | 105,604 | 16,821,227 |
| L3Harris Technologies, Inc. | | 108,326 | 22,577,305 |
| Lockheed Martin Corp. | | 56,685 | 24,341,106 |
| Northrop Grumman Corp. | | 89,264 | 39,879,585 |
| | | | 103,619,223 |
| Air Freight & Logistics - 0.5% | | | |
| DHL Group | | 302,895 | 14,573,116 |
| Electrical Equipment - 0.5% | | | |
| Eaton Corp. PLC | | 38,368 | 9,441,597 |
| Regal Rexnord Corp. | | 45,506 | 6,073,231 |
| | | | 15,514,828 |
| Industrial Conglomerates - 1.0% | | | |
| Siemens AG | | 165,177 | 29,570,628 |
| Machinery - 2.3% | | | |
| Deere & Co. | | 101,400 | 39,909,012 |
| Oshkosh Corp. | | 26,090 | 2,872,509 |
| Pentair PLC | | 294,455 | 21,545,272 |
| | | | 64,326,793 |
| Professional Services - 0.6% | | | |
| Maximus, Inc. | | 215,011 | 17,441,692 |
TOTAL INDUSTRIALS | | | 245,046,280 |
| INFORMATION TECHNOLOGY - 5.9% | | | |
| Communications Equipment - 2.1% | | | |
| Cisco Systems, Inc. | | 1,226,756 | 61,558,616 |
| IT Services - 2.4% | | | |
| Amdocs Ltd. | | 386,304 | 35,416,351 |
| Capgemini SA | | 75,636 | 16,936,492 |
| Cognizant Technology Solutions Corp. Class A | | 204,215 | 15,749,061 |
| | | | 68,101,904 |
| Software - 1.4% | | | |
| Gen Digital, Inc. | | 1,012,282 | 23,768,381 |
| Open Text Corp. (b) | | 354,518 | 15,460,530 |
| | | | 39,228,911 |
TOTAL INFORMATION TECHNOLOGY | | | 168,889,431 |
| MATERIALS - 2.1% | | | |
| Chemicals - 1.3% | | | |
| CF Industries Holdings, Inc. | | 261,200 | 19,723,212 |
| Nutrien Ltd. | | 331,100 | 16,511,957 |
| | | | 36,235,169 |
| Containers & Packaging - 0.6% | | | |
| Crown Holdings, Inc. | | 184,400 | 16,319,400 |
| Metals & Mining - 0.2% | | | |
| Newmont Corp. | | 211,030 | 7,282,645 |
TOTAL MATERIALS | | | 59,837,214 |
| REAL ESTATE - 1.0% | | | |
| Equity Real Estate Investment Trusts (REITs) - 0.6% | | | |
| Crown Castle, Inc. | | 165,900 | 17,958,675 |
| Real Estate Management & Development - 0.4% | | | |
| CBRE Group, Inc. (a) | | 111,731 | 9,643,503 |
TOTAL REAL ESTATE | | | 27,602,178 |
| UTILITIES - 9.1% | | | |
| Electric Utilities - 5.9% | | | |
| Constellation Energy Corp. | | 269,450 | 32,872,900 |
| Edison International | | 495,133 | 33,411,575 |
| NextEra Energy, Inc. | | 233,981 | 13,718,306 |
| PG&E Corp. | | 3,708,803 | 62,567,507 |
| Southern Co. | | 344,246 | 23,931,982 |
| | | | 166,502,270 |
| Independent Power and Renewable Electricity Producers - 0.5% | | | |
| The AES Corp. | | 778,431 | 12,984,229 |
| Multi-Utilities - 2.7% | | | |
| Dominion Energy, Inc. | | 562,552 | 25,719,877 |
| National Grid PLC | | 1,420,800 | 18,923,784 |
| Sempra | | 462,800 | 33,117,968 |
| | | | 77,761,629 |
TOTAL UTILITIES | | | 257,248,128 |
| TOTAL COMMON STOCKS (Cost $2,172,105,035) | | | 2,728,996,191 |
| | | | |
| Nonconvertible Preferred Stocks - 1.2% |
| | | Shares | Value ($) |
| INFORMATION TECHNOLOGY - 1.2% | | | |
| Technology Hardware, Storage & Peripherals - 1.2% | | | |
Samsung Electronics Co. Ltd. (Cost $32,439,498) | | 792,210 | 34,664,215 |
| | | | |
| Money Market Funds - 2.0% |
| | | Shares | Value ($) |
| Fidelity Cash Central Fund 5.39% (c) | | 54,254,090 | 54,264,941 |
| Fidelity Securities Lending Cash Central Fund 5.39% (c)(d) | | 2,951,705 | 2,952,000 |
| TOTAL MONEY MARKET FUNDS (Cost $57,216,941) | | | 57,216,941 |
| | | | |
| TOTAL INVESTMENT IN SECURITIES - 99.3% (Cost $2,261,761,474) | 2,820,877,347 |
NET OTHER ASSETS (LIABILITIES) - 0.7% | 20,199,737 |
| NET ASSETS - 100.0% | 2,841,077,084 |
| | |
Legend
| (b) | Security or a portion of the security is on loan at period end. |
| (c) | Affiliated fund that is generally available only to investment companies and other accounts managed by Fidelity Investments. The rate quoted is the annualized seven-day yield of the fund at period end. A complete unaudited listing of the fund's holdings as of its most recent quarter end is available upon request. In addition, each Fidelity Central Fund's financial statements are available on the SEC's website or upon request. |
| (d) | Investment made with cash collateral received from securities on loan. |
Affiliated Central Funds
Fiscal year to date information regarding the Fund's investments in Fidelity Central Funds, including the ownership percentage, is presented below.
| Affiliate | Value, beginning of period ($) | Purchases ($) | Sales Proceeds ($) | Dividend Income ($) | Realized Gain (loss) ($) | Change in Unrealized appreciation (depreciation) ($) | Value, end of period ($) | % ownership, end of period |
| Fidelity Cash Central Fund 5.39% | 43,166,966 | 292,082,227 | 280,984,252 | 1,458,964 | - | - | 54,264,941 | 0.1% |
| Fidelity Securities Lending Cash Central Fund 5.39% | 21,052,883 | 83,712,002 | 101,812,885 | 303,310 | - | - | 2,952,000 | 0.0% |
| Total | 64,219,849 | 375,794,229 | 382,797,137 | 1,762,274 | - | - | 57,216,941 | |
| | | | | | | | | |
Amounts in the dividend income column in the above table include any capital gain distributions from underlying funds, which are presented in the corresponding line item in the Statement of Operations, if applicable.
Amounts in the dividend income column for Fidelity Securities Lending Cash Central Fund represents the income earned on investing cash collateral, less rebates paid to borrowers and any lending agent fees associated with the loan, plus any premium payments received for lending certain types of securities.
Amounts included in the purchases and sales proceeds columns may include in-kind transactions, if applicable.
Investment Valuation
The following is a summary of the inputs used, as of January 31, 2024, involving the Fund's assets and liabilities carried at fair value. The inputs or methodology used for valuing securities may not be an indication of the risk associated with investing in those securities. For more information on valuation inputs, and their aggregation into the levels used below, please refer to the Investment Valuation section in the accompanying Notes to Financial Statements.
| Valuation Inputs at Reporting Date: |
| Description | Total ($) | Level 1 ($) | Level 2 ($) | Level 3 ($) |
Investments in Securities: | | | | |
|
| Equities: | | | | |
Communication Services | 147,874,859 | 147,874,859 | - | - |
Consumer Discretionary | 82,244,679 | 82,244,679 | - | - |
Consumer Staples | 366,181,682 | 325,771,006 | 40,410,676 | - |
Energy | 229,486,984 | 229,486,984 | - | - |
Financials | 667,184,330 | 667,184,330 | - | - |
Health Care | 477,400,426 | 443,062,495 | 34,337,931 | - |
Industrials | 245,046,280 | 198,654,425 | 46,391,855 | - |
Information Technology | 203,553,646 | 168,889,431 | 34,664,215 | - |
Materials | 59,837,214 | 59,837,214 | - | - |
Real Estate | 27,602,178 | 27,602,178 | - | - |
Utilities | 257,248,128 | 238,324,344 | 18,923,784 | - |
|
| Money Market Funds | 57,216,941 | 57,216,941 | - | - |
| Total Investments in Securities: | 2,820,877,347 | 2,646,148,886 | 174,728,461 | - |
| Statement of Assets and Liabilities |
| | | | January 31, 2024 (Unaudited) |
| | | | | |
| Assets | | | | |
| Investment in securities, at value (including securities loaned of $2,859,642) - See accompanying schedule: | | | | |
Unaffiliated issuers (cost $2,204,544,533) | $ | 2,763,660,406 | | |
Fidelity Central Funds (cost $57,216,941) | | 57,216,941 | | |
| | | | | |
| | | | | |
| Total Investment in Securities (cost $2,261,761,474) | | | $ | 2,820,877,347 |
| Foreign currency held at value (cost $1,281) | | | | 1,275 |
| Receivable for investments sold | | | | 11,548,621 |
| Receivable for fund shares sold | | | | 19,748,262 |
| Dividends receivable | | | | 2,053,167 |
| Reclaims receivable | | | | 1,750,465 |
| Distributions receivable from Fidelity Central Funds | | | | 159,627 |
| Prepaid expenses | | | | 2,426 |
Total assets | | | | 2,856,141,190 |
| Liabilities | | | | |
| Payable for investments purchased | $ | 9,181,421 | | |
| Payable for fund shares redeemed | | 1,395,259 | | |
| Accrued management fee | | 1,084,989 | | |
| Other affiliated payables | | 379,974 | | |
| Other payables and accrued expenses | | 70,463 | | |
| Collateral on securities loaned | | 2,952,000 | | |
| Total Liabilities | | | | 15,064,106 |
| Net Assets | | | $ | 2,841,077,084 |
| Net Assets consist of: | | | | |
| Paid in capital | | | $ | 2,255,702,901 |
| Total accumulated earnings (loss) | | | | 585,374,183 |
| Net Assets | | | $ | 2,841,077,084 |
| | | | | |
| Net Asset Value and Maximum Offering Price | | | | |
| Value Discovery : | | | | |
Net Asset Value, offering price and redemption price per share ($2,823,466,529 ÷ 80,540,184 shares) | | | $ | 35.06 |
| Class K : | | | | |
Net Asset Value, offering price and redemption price per share ($17,610,555 ÷ 501,974 shares) | | | $ | 35.08 |
| Statement of Operations |
| | | | Six months ended January 31, 2024 (Unaudited) |
| Investment Income | | | | |
| Dividends | | | $ | 31,700,244 |
| Income from Fidelity Central Funds (including $303,310 from security lending) | | | | 1,762,274 |
| Total Income | | | | 33,462,518 |
| Expenses | | | | |
| Management fee | | | | |
| Basic fee | $ | 7,235,712 | | |
| Performance adjustment | | 62,135 | | |
| Transfer agent fees | | 1,887,329 | | |
| Accounting fees | | 360,206 | | |
| Custodian fees and expenses | | 43,162 | | |
| Independent trustees' fees and expenses | | 8,127 | | |
| Registration fees | | 59,056 | | |
| Audit | | 30,483 | | |
| Legal | | 4,298 | | |
| Miscellaneous | | 5,062 | | |
| Total expenses before reductions | | 9,695,570 | | |
| Expense reductions | | (119,640) | | |
| Total expenses after reductions | | | | 9,575,930 |
| Net Investment income (loss) | | | | 23,886,588 |
| Realized and Unrealized Gain (Loss) | | | | |
| Net realized gain (loss) on: | | | | |
| Investment Securities: | | | | |
| Unaffiliated issuers | | 48,805,603 | | |
| Foreign currency transactions | | 35,134 | | |
| Total net realized gain (loss) | | | | 48,840,737 |
| Change in net unrealized appreciation (depreciation) on: | | | | |
| Investment Securities: | | | | |
| Unaffiliated issuers | | (40,013,527) | | |
| Assets and liabilities in foreign currencies | | (51,671) | | |
| Total change in net unrealized appreciation (depreciation) | | | | (40,065,198) |
| Net gain (loss) | | | | 8,775,539 |
| Net increase (decrease) in net assets resulting from operations | | | $ | 32,662,127 |
| Statement of Changes in Net Assets |
| |
| | Six months ended January 31, 2024 (Unaudited) | | Year ended July 31, 2023 |
| Increase (Decrease) in Net Assets | | | | |
| Operations | | | | |
| Net investment income (loss) | $ | 23,886,588 | $ | 39,500,806 |
| Net realized gain (loss) | | 48,840,737 | | 105,614,232 |
| Change in net unrealized appreciation (depreciation) | | (40,065,198) | | 15,435,014 |
| Net increase (decrease) in net assets resulting from operations | | 32,662,127 | | 160,550,052 |
| Distributions to shareholders | | (147,607,805) | | (133,719,223) |
| | | | | |
| Share transactions - net increase (decrease) | | 26,914,327 | | (52,772,440) |
| Total increase (decrease) in net assets | | (88,031,351) | | (25,941,611) |
| | | | | |
| Net Assets | | | | |
| Beginning of period | | 2,929,108,435 | | 2,955,050,046 |
| End of period | $ | 2,841,077,084 | $ | 2,929,108,435 |
| | | | | |
| | | | | |
Financial Highlights
| Fidelity® Value Discovery Fund |
| |
| | Six months ended (Unaudited) January 31, 2024 | | Years ended July 31, 2023 | | 2022 | | 2021 | | 2020 | | 2019 |
Selected Per-Share Data | | | | | | | | | | | | |
| Net asset value, beginning of period | $ | 36.46 | $ | 36.10 | $ | 37.95 | $ | 26.99 | $ | 28.85 | $ | 29.25 |
| Income from Investment Operations | | | | | | | | | | | | |
Net investment income (loss) A,B | | .30 | | .48 | | .45 | | .40 | | .57 C | | .54 |
| Net realized and unrealized gain (loss) | | .13 | | 1.53 | | (.48) | | 10.98 | | (1.53) | | .22 |
| Total from investment operations | | .43 | | 2.01 | | (.03) | | 11.38 | | (.96) | | .76 |
| Distributions from net investment income | | (.58) | | (.44) | | (.43) | | (.42) | | (.52) | | (.57) |
| Distributions from net realized gain | | (1.26) | | (1.21) | | (1.40) | | - | | (.38) | | (.59) |
| Total distributions | | (1.83) D | | (1.65) | | (1.82) D | | (.42) | | (.90) | | (1.16) |
| Net asset value, end of period | $ | 35.06 | $ | 36.46 | $ | 36.10 | $ | 37.95 | $ | 26.99 | $ | 28.85 |
Total Return E,F | | 1.40% | | 5.83% | | (.21)% | | 42.65% | | (3.54)% | | 2.86% |
Ratios to Average Net Assets B,G,H | | | | | | | | | | | | |
| Expenses before reductions | | .70% I | | .84% | | .80% | | .75% | | .66% | | .60% |
| Expenses net of fee waivers, if any | | .69% I | | .83% | | .80% | | .75% | | .66% | | .60% |
| Expenses net of all reductions | | .69% I | | .83% | | .80% | | .74% | | .64% | | .60% |
| Net investment income (loss) | | 1.72% I | | 1.37% | | 1.20% | | 1.21% | | 2.07% C | | 1.95% |
| Supplemental Data | | | | | | | | | | | | |
| Net assets, end of period (000 omitted) | $ | 2,823,467 | $ | 2,911,436 | $ | 2,895,400 | $ | 3,192,073 | $ | 1,788,146 | $ | 2,400,695 |
Portfolio turnover rate J | | 24% I | | 24% K | | 34% K | | 36% | | 70% K | | 48% |
ACalculated based on average shares outstanding during the period.
BNet investment income (loss) is affected by the timing of the declaration of dividends by any underlying mutual funds or exchange-traded funds (ETFs). Net investment income (loss) of any mutual funds or ETFs is not included in the Fund's net investment income (loss) ratio.
CNet investment income per share reflects one or more large, non-recurring dividend(s) which amounted to $.09 per share. Excluding such non-recurring dividend(s), the ratio of net investment income (loss) to average net assets would have been 1.74%.
DTotal distributions per share do not sum due to rounding.
ETotal returns for periods of less than one year are not annualized.
FTotal returns would have been lower if certain expenses had not been reduced during the applicable periods shown.
GFees and expenses of any underlying mutual funds or exchange-traded funds (ETFs) are not included in the Fund's expense ratio. The Fund indirectly bears its proportionate share of these expenses. For additional expense information related to investments in Fidelity Central Funds, please refer to the "Investments in Fidelity Central Funds" note found in the Notes to Financial Statements section of the most recent Annual or Semi-Annual report.
HExpense ratios reflect operating expenses of the class. Expenses before reductions do not reflect amounts reimbursed, waived, or reduced through arrangements with the investment adviser, brokerage services, or other offset arrangements, if applicable, and do not represent the amount paid by the class during periods when reimbursements, waivers or reductions occur.
IAnnualized.
JAmount does not include the portfolio activity of any underlying mutual funds or exchange-traded funds (ETFs).
KPortfolio turnover rate excludes securities received or delivered in-kind.
| Fidelity® Value Discovery Fund Class K |
| |
| | Six months ended (Unaudited) January 31, 2024 | | Years ended July 31, 2023 | | 2022 | | 2021 | | 2020 | | 2019 |
Selected Per-Share Data | | | | | | | | | | | | |
| Net asset value, beginning of period | $ | 36.49 | $ | 36.13 | $ | 37.98 | $ | 27.01 | $ | 28.86 | $ | 29.28 |
| Income from Investment Operations | | | | | | | | | | | | |
Net investment income (loss) A,B | | .31 | | .51 | | .49 | | .44 | | .60 C | | .58 |
| Net realized and unrealized gain (loss) | | .14 | | 1.54 | | (.48) | | 10.97 | | (1.52) | | .20 |
| Total from investment operations | | .45 | | 2.05 | | .01 | | 11.41 | | (.92) | | .78 |
| Distributions from net investment income | | (.60) | | (.47) | | (.46) | | (.44) | | (.55) | | (.61) |
| Distributions from net realized gain | | (1.26) | | (1.21) | | (1.40) | | - | | (.38) | | (.59) |
| Total distributions | | (1.86) | | (1.69) D | | (1.86) | | (.44) | | (.93) | | (1.20) |
| Net asset value, end of period | $ | 35.08 | $ | 36.49 | $ | 36.13 | $ | 37.98 | $ | 27.01 | $ | 28.86 |
Total Return E,F | | 1.45% | | 5.92% | | (.12)% | | 42.76% | | (3.40)% | | 2.93% |
Ratios to Average Net Assets B,G,H | | | | | | | | | | | | |
| Expenses before reductions | | .61% I | | .75% | | .70% | | .65% | | .56% | | .49% |
| Expenses net of fee waivers, if any | | .60% I | | .74% | | .70% | | .65% | | .56% | | .49% |
| Expenses net of all reductions | | .60% I | | .74% | | .70% | | .65% | | .54% | | .48% |
| Net investment income (loss) | | 1.82% I | | 1.47% | | 1.30% | | 1.30% | | 2.17% C | | 2.06% |
| Supplemental Data | | | | | | | | | | | | |
| Net assets, end of period (000 omitted) | $ | 17,611 | $ | 17,672 | $ | 59,650 | $ | 87,856 | $ | 37,275 | $ | 55,768 |
Portfolio turnover rate J | | 24% I | | 24% K | | 34% K | | 36% | | 70% K | | 48% |
ACalculated based on average shares outstanding during the period.
BNet investment income (loss) is affected by the timing of the declaration of dividends by any underlying mutual funds or exchange-traded funds (ETFs). Net investment income (loss) of any mutual funds or ETFs is not included in the Fund's net investment income (loss) ratio.
CNet investment income per share reflects one or more large, non-recurring dividend(s) which amounted to $.09 per share. Excluding such non-recurring dividend(s), the ratio of net investment income (loss) to average net assets would have been 1.84%.
DTotal distributions per share do not sum due to rounding.
ETotal returns for periods of less than one year are not annualized.
FTotal returns would have been lower if certain expenses had not been reduced during the applicable periods shown.
GFees and expenses of any underlying mutual funds or exchange-traded funds (ETFs) are not included in the Fund's expense ratio. The Fund indirectly bears its proportionate share of these expenses. For additional expense information related to investments in Fidelity Central Funds, please refer to the "Investments in Fidelity Central Funds" note found in the Notes to Financial Statements section of the most recent Annual or Semi-Annual report.
HExpense ratios reflect operating expenses of the class. Expenses before reductions do not reflect amounts reimbursed, waived, or reduced through arrangements with the investment adviser, brokerage services, or other offset arrangements, if applicable, and do not represent the amount paid by the class during periods when reimbursements, waivers or reductions occur.
IAnnualized.
JAmount does not include the portfolio activity of any underlying mutual funds or exchange-traded funds (ETFs).
KPortfolio turnover rate excludes securities received or delivered in-kind.
For the period ended January 31, 2024
1. Organization.
Fidelity Value Discovery Fund (the Fund) is a fund of Fidelity Puritan Trust (the Trust) and is authorized to issue an unlimited number of shares. The Trust is registered under the Investment Company Act of 1940, as amended (the 1940 Act), as an open-end management investment company organized as a Massachusetts business trust. The Fund offers Value Discovery and Class K shares, each of which has equal rights as to assets and voting privileges. Each class has exclusive voting rights with respect to matters that affect that class.
2. Investments in Fidelity Central Funds.
Funds may invest in Fidelity Central Funds, which are open-end investment companies generally available only to other investment companies and accounts managed by the investment adviser and its affiliates. The Schedule of Investments lists any Fidelity Central Funds held as an investment as of period end, but does not include the underlying holdings of each Fidelity Central Fund. An investing fund indirectly bears its proportionate share of the expenses of the underlying Fidelity Central Funds.
Based on its investment objective, each Fidelity Central Fund may invest or participate in various investment vehicles or strategies that are similar to those of the investing fund. These strategies are consistent with the investment objectives of the investing fund and may involve certain economic risks which may cause a decline in value of each of the Fidelity Central Funds and thus a decline in the value of the investing fund.
| Fidelity Central Fund | Investment Manager | Investment Objective | Investment Practices | Expense RatioA |
| Fidelity Money Market Central Funds | Fidelity Management & Research Company LLC (FMR) | Each fund seeks to obtain a high level of current income consistent with the preservation of capital and liquidity. | Short-term Investments | Less than .005% |
A Expenses expressed as a percentage of average net assets and are as of each underlying Central Fund's most recent annual or semi-annual shareholder report.
A complete unaudited list of holdings for each Fidelity Central Fund is available upon request or at the Securities and Exchange Commission website at www.sec.gov. In addition, the financial statements of the Fidelity Central Funds which contain the significant accounting policies (including investment valuation policies) of those funds, and are not covered by the Report of Independent Registered Public Accounting Firm, are available on the Securities and Exchange Commission website or upon request.
3. Significant Accounting Policies.
The Fund is an investment company and applies the accounting and reporting guidance of the Financial Accounting Standards Board (FASB) Accounting Standards Codification Topic 946 Financial Services - Investment Companies. The financial statements have been prepared in conformity with accounting principles generally accepted in the United States of America (GAAP), which require management to make certain estimates and assumptions at the date of the financial statements. Actual results could differ from those estimates. Subsequent events, if any, through the date that the financial statements were issued have been evaluated in the preparation of the financial statements. The Fund's Schedule of Investments lists any underlying mutual funds or exchange-traded funds (ETFs) but does not include the underlying holdings of these funds. The following summarizes the significant accounting policies of the Fund:
Investment Valuation. Investments are valued as of 4:00 p.m. Eastern time on the last calendar day of the period. The Board of Trustees (the Board) has designated the Fund's investment adviser as the valuation designee responsible for the fair valuation function and performing fair value determinations as needed. The investment adviser has established a Fair Value Committee (the Committee) to carry out the day-to-day fair valuation responsibilities and has adopted policies and procedures to govern the fair valuation process and the activities of the Committee. In accordance with these fair valuation policies and procedures, which have been approved by the Board, the Fund attempts to obtain prices from one or more third party pricing services or brokers to value its investments. When current market prices, quotations or currency exchange rates are not readily available or reliable, investments will be fair valued in good faith by the Committee, in accordance with the policies and procedures. Factors used in determining fair value vary by investment type and may include market or investment specific events, transaction data, estimated cash flows, and market observations of comparable investments. The frequency that the fair valuation procedures are used cannot be predicted and they may be utilized to a significant extent. The Committee manages the Fund's fair valuation practices and maintains the fair valuation policies and procedures. The Fund's investment adviser reports to the Board information regarding the fair valuation process and related material matters.
The Fund categorizes the inputs to valuation techniques used to value its investments into a disclosure hierarchy consisting of three levels as shown below:
Level 1 - unadjusted quoted prices in active markets for identical investments
Level 2 - other significant observable inputs (including quoted prices for similar investments, interest rates, prepayment speeds, etc.)
Level 3 - unobservable inputs (including the Fund's own assumptions based on the best information available)
Valuation techniques used to value the Fund's investments by major category are as follows:
Equity securities, including restricted securities, for which market quotations are readily available, are valued at the last reported sale price or official closing price as reported by a third party pricing service on the primary market or exchange on which they are traded and are categorized as Level 1 in the hierarchy. In the event there were no sales during the day or closing prices are not available, securities are valued at the last quoted bid price or may be valued using the last available price and are generally categorized as Level 2 in the hierarchy. For foreign equity securities, when market or security specific events arise, comparisons to the valuation of American Depositary Receipts (ADRs), futures contracts, ETFs and certain indexes as well as quoted prices for similar securities may be used and would be categorized as Level 2 in the hierarchy. For equity securities, including restricted securities, where observable inputs are limited, assumptions about market activity and risk are used and these securities may be categorized as Level 3 in the hierarchy.
Investments in open-end mutual funds, including the Fidelity Central Funds, are valued at their closing net asset value (NAV) each business day and are categorized as Level 1 in the hierarchy.
Changes in valuation techniques may result in transfers in or out of an assigned level within the disclosure hierarchy. The aggregate value of investments by input level as of January 31, 2024 is included at the end of the Fund's Schedule of Investments.
Foreign Currency. Certain Funds may use foreign currency contracts to facilitate transactions in foreign-denominated securities. Gains and losses from these transactions may arise from changes in the value of the foreign currency or if the counterparties do not perform under the contracts' terms.
Foreign-denominated assets, including investment securities, and liabilities are translated into U.S. dollars at the exchange rates at period end. Purchases and sales of investment securities, income and dividends received, and expenses denominated in foreign currencies are translated into U.S. dollars at the exchange rate in effect on the transaction date.
The effects of exchange rate fluctuations on investments are included with the net realized and unrealized gain (loss) on investment securities. Other foreign currency transactions resulting in realized and unrealized gain (loss) are disclosed separately.
Investment Transactions and Income. For financial reporting purposes, the Fund's investment holdings and NAV include trades executed through the end of the last business day of the period. The NAV per share for processing shareholder transactions is calculated as of the close of business of the New York Stock Exchange (NYSE), normally 4:00 p.m. Eastern time and includes trades executed through the end of the prior business day. Gains and losses on securities sold are determined on the basis of identified cost and include proceeds received from litigation. Commissions paid to certain brokers with whom the investment adviser, or its affiliates, places trades on behalf of a fund include an amount in addition to trade execution, which may be rebated back to a fund. Any such rebates are included in net realized gain (loss) on investments in the Statement of Operations. Dividend income is recorded on the ex-dividend date, except for certain dividends from foreign securities where the ex-dividend date may have passed, which are recorded as soon as the Fund is informed of the ex-dividend date. Non-cash dividends included in dividend income, if any, are recorded at the fair market value of the securities received. Income and capital gain distributions from Fidelity Central Funds, if any, are recorded on the ex-dividend date. Certain distributions received by the Fund represent a return of capital or capital gain. The Fund determines the components of these distributions subsequent to the ex-dividend date, based upon receipt of tax filings or other correspondence relating to the underlying investment. These distributions are recorded as a reduction of cost of investments and/or as a realized gain. Investment income is recorded net of foreign taxes withheld where recovery of such taxes is uncertain. Funds may file withholding tax reclaims in certain jurisdictions to recover a portion of amounts previously withheld. Any withholding tax reclaims income is included in the Statement of Operations in dividends. Any receivables for withholding tax reclaims are included in the Statement of Assets and Liabilities in reclaims receivable. The Fund has filed tax reclaims for previously withheld taxes on dividends earned in certain European Union (EU) countries. These additional filings are subject to various administrative proceedings by the local jurisdictions' tax authorities within the EU, as well as a number of related judicial proceedings. Income recognized for EU reclaims is included with other reclaims in the Statement of Operations in dividends. These reclaims are recorded when the amount is known and there are no significant uncertainties on collectability.
Class Allocations and Expenses. Investment income, realized and unrealized capital gains and losses, common expenses of a fund, and certain fund-level expense reductions, if any, are allocated daily on a pro-rata basis to each class based on the relative net assets of each class to the total net assets of a fund. Each class differs with respect to transfer agent and distribution and service plan fees incurred, as applicable. Certain expense reductions may also differ by class, if applicable. For the reporting period, the allocated portion of income and expenses to each class as a percent of its average net assets may vary due to the timing of recording these transactions in relation to fluctuating net assets of the classes. Expenses directly attributable to a fund are charged to that fund. Expenses attributable to more than one fund are allocated among the respective funds on the basis of relative net assets or other appropriate methods. Expenses included in the accompanying financial statements reflect the expenses of that fund and do not include any expenses associated with any underlying mutual funds or exchange-traded funds (ETFs). Although not included in a fund's expenses, a fund indirectly bears its proportionate share of these expenses through the net asset value of each underlying mutual fund or exchange-traded fund (ETF). Expense estimates are accrued in the period to which they relate and adjustments are made when actual amounts are known.
Income Tax Information and Distributions to Shareholders. Each year, the Fund intends to qualify as a regulated investment company under Subchapter M of the Internal Revenue Code, including distributing substantially all of its taxable income and realized gains. As a result, no provision for U.S. Federal income taxes is required. The Fund files a U.S. federal tax return, in addition to state and local tax returns as required. The Fund's federal income tax returns are subject to examination by the Internal Revenue Service (IRS) for a period of three fiscal years after they are filed. State and local tax returns may be subject to examination for an additional fiscal year depending on the jurisdiction. Foreign taxes are provided for based on the Fund's understanding of the tax rules and rates that exist in the foreign markets in which it invests.
Distributions are declared and recorded on the ex-dividend date. Income and capital gain distributions are declared separately for each class. Income and capital gain distributions are determined in accordance with income tax regulations, which may differ from GAAP.
Capital accounts within the financial statements are adjusted for permanent book-tax differences. These adjustments have no impact on net assets or the results of operations. Capital accounts are not adjusted for temporary book-tax differences which will reverse in a subsequent period.
Book-tax differences are primarily due to foreign currency transactions, redemptions in-kind and losses deferred due to wash sales and excise tax regulations.
As of period end, the cost and unrealized appreciation (depreciation) in securities, and derivatives if applicable, for federal income tax purposes were as follows:
| Gross unrealized appreciation | $636,487,256 |
| Gross unrealized depreciation | (80,000,562) |
| Net unrealized appreciation (depreciation) | $556,486,694 |
| Tax cost | $2,264,390,653 |
4. Purchases and Sales of Investments.
Purchases and sales of securities, other than short-term securities and in-kind transactions, as applicable, are noted in the table below.
| | Purchases ($) | Sales ($) |
| Fidelity Value Discovery Fund | 333,163,019 | 395,032,503 |
Prior Fiscal Year Unaffiliated Redemptions In-Kind. Shares that were redeemed in-kind for investments, including accrued interest and cash, if any, are shown in the table below; along with realized gain or loss on investments delivered through in-kind redemptions. The amount of the in-kind redemptions is included in share transactions in the accompanying Statement of Changes in Net Assets. There was no gain or loss for federal income tax purposes.
| | Shares | Total net realized gain or loss ($) | Total Proceeds ($) | Participating classes |
| Fidelity Value Discovery Fund | 928,278 | 8,848,380 | 30,615,682 | Class K |
5. Fees and Other Transactions with Affiliates.
Management Fee. Fidelity Management & Research Company LLC (the investment adviser) and its affiliates provide the Fund with investment management related services for which the Fund pays a monthly management fee. The management fee is the sum of an individual fund fee rate that is based on an annual rate of .30% of the Fund's average net assets and an annualized group fee rate that averaged .22% during the period. The group fee rate is based upon the monthly average net assets of a group of registered investment companies with which the investment adviser has management contracts. The group fee rate decreases as assets under management increase and increases as assets under management decrease. In addition, the management fee is subject to a performance adjustment (up to a maximum of +/- .20% of the Fund's average net assets over a 36 month performance period). The upward or downward adjustment to the management fee is based on the relative investment performance of Value Discovery as compared to its benchmark index, the Russell 3000 Value Index, over the same 36 month performance period. For the reporting period, the total annualized management fee rate, including the performance adjustment, was .53% of the Fund's average net assets. The performance adjustment included in the management fee rate may be higher or lower than the maximum performance adjustment rate due to the difference between the average net assets for the reporting and performance periods.
Transfer Agent Fees. Fidelity Investments Institutional Operations Company LLC (FIIOC), an affiliate of the investment adviser, is the transfer, dividend disbursing and shareholder servicing agent for each class of the Fund.
During November 2023, the Board approved a change in the transfer agent fees effective December 1, 2023 to a fixed annual rate of class-level average net assets as follows:
| | % of Class-Level Average Net Assets |
| Value Discovery | .1362 |
| | |
Prior to December 1, 2023, FIIOC received account fees and asset-based fees that varied according to the account size and type of account of the shareholders of the respective classes of the Fund, except for Class K. FIIOC received an asset-based fee of Class K's average net assets. FIIOC pays for typesetting, printing and mailing of shareholder reports, except proxy statements.
For the period, transfer agent fees for each class were as follows:
| | Amount | % of Class-Level Average Net AssetsA |
| Value Discovery | $1,883,822 | .14 |
| Class K | 3,507 | .04 |
| | $1,887,329 | |
A Annualized
Accounting Fees. Fidelity Service Company, Inc. (FSC), an affiliate of the investment adviser, maintains the Fund's accounting records.
During November 2023, the Board approved a change in the accounting fees effective December 1, 2023 to a fixed annual rate of average net assets as follows:
| | % of Average Net Assets |
| Fidelity Value Discovery Fund | .0259 |
Prior to December 1, 2023, the accounting fee was based on the level of average net assets for each month. For the period, the fees were equivalent to the following annualized rates:
| | % of Average Net Assets |
| Fidelity Value Discovery Fund | .03 |
Subsequent Event - Management Fee. Effective March 1, 2024, the Fund's management contract will be amended to incorporate administrative services previously covered under separate services agreements (Transfer Agent and Accounting agreements). The amended contract incorporates a basic fee rate that may vary by class (subject to a performance adjustment). The investment adviser or an affiliate will pay certain expenses of managing and operating the Fund out of each class's management fee.
Each class of the Fund will pay a management fee to the investment adviser. The management fee will be calculated and paid to the investment adviser every month.
The management fee will be determined by calculating a basic fee and then applying a performance adjustment.
When determining a class's basic fee, a mandate rate will be calculated based on the monthly average net assets of a group of funds advised by FMR within a designated asset class. A discount rate will be subtracted from the mandate rate once the Fund's monthly average net assets reach a certain level. The mandate rate and discount rate may vary by class.
The annual basic fee rate for a class of shares of the Fund will be the lesser of (1) the class's mandate rate reduced by the class's discount rate (if applicable) or (2) the amount set forth in the following table.
| | Maximum Management Fee Rate % |
| Value Discovery | .65 |
| Class K | .56 |
One-twelfth of the basic fee rate for a class will be applied to the average net assets of the class for the month, giving a dollar amount which is the basic fee for the class for that month.
The performance adjustment rate will be calculated monthly by comparing over the performance period the Fund's performance to that of the performance adjustment index listed below.
| | Performance Adjustment Index |
| Fidelity Value Discovery Fund | Russell 3000 Value Index |
For the purposes of calculating the performance adjustment for the Fund, the Fund's investment performance will be based on the performance of Value Discovery. To the extent that other classes of the Fund have higher expenses, this could result in those classes bearing a larger positive performance adjustment and smaller negative performance adjustment than would be the case if each class's own performance were considered.
The performance period is the most recent 36 month period.
The maximum annualized performance adjustment rate will be ± .20% of the Fund's average net assets over the performance period. The performance adjustment rate will be divided by twelve and multiplied by the Fund's average net assets over the performance period, and the resulting dollar amount will be proportionately added to or subtracted from a class's basic fee.
A different management fee rate may be applicable to each class of the Fund. The difference between classes is the result of separate arrangements for class-level services and/or waivers of certain expenses. It is not the result of any difference in advisory or custodial fees or other expenses related to the management of the Fund's assets, which do not vary by class.
Effective March 1, 2024, the Fund's sub-advisory agreements with FMR Investment Management (UK) Limited, Fidelity Management & Research (Hong Kong) Limited, and Fidelity Management & Research (Japan) Limited will be amended to provide that the investment adviser will pay each sub-adviser monthly fees equal to 110% of the sub-adviser's costs for providing sub-advisory services.
Brokerage Commissions. A portion of portfolio transactions were placed with brokerage firms which are affiliates of the investment adviser. Brokerage commissions are included in net realized gain (loss) and change in net unrealized appreciation (depreciation) in the Statement of Operations. The commissions paid to these affiliated firms were as follows:
| | Amount |
| Fidelity Value Discovery Fund | $5,159 |
Interfund Trades. Funds may purchase from or sell securities to other Fidelity Funds under procedures adopted by the Board. The procedures have been designed to ensure these interfund trades are executed in accordance with Rule 17a-7 of the 1940 Act. Any interfund trades are included within the respective purchases and sales amounts shown in the Purchases and Sales of Investments note. Interfund trades during the period are noted in the table below.
| | Purchases ($) | Sales ($) | Realized Gain (Loss) ($) |
| Fidelity Value Discovery Fund | 20,642,561 | 66,863,256 | (1,080,222) |
6. Committed Line of Credit.
Certain Funds participate with other funds managed by the investment adviser or an affiliate in a $4.25 billion credit facility (the "line of credit") to be utilized for temporary or emergency purposes to fund shareholder redemptions or for other short-term liquidity purposes. The participating funds have agreed to pay commitment fees on their pro-rata portion of the line of credit, which are reflected in Miscellaneous expenses on the Statement of Operations, and are listed below. During the period, there were no borrowings on this line of credit.
| | Amount |
| Fidelity Value Discovery Fund | $2,221 |
7. Security Lending.
Funds lend portfolio securities from time to time in order to earn additional income. Lending agents are used, including National Financial Services (NFS), an affiliate of the investment adviser. Pursuant to a securities lending agreement, NFS will receive a fee, which is capped at 9.9% of a fund's daily lending revenue, for its services as lending agent. A fund may lend securities to certain qualified borrowers, including NFS. On the settlement date of the loan, a fund receives collateral (in the form of U.S. Treasury obligations, letters of credit and/or cash) against the loaned securities and maintains collateral in an amount not less than 100% of the market value of the loaned securities during the period of the loan. The market value of the loaned securities is determined at the close of business of a fund and any additional required collateral is delivered to a fund on the next business day. A fund or borrower may terminate the loan at any time, and if the borrower defaults on its obligation to return the securities loaned because of insolvency or other reasons, a fund may apply collateral received from the borrower against the obligation. A fund may experience delays and costs in recovering the securities loaned. Any cash collateral received is invested in the Fidelity Securities Lending Cash Central Fund. Any loaned securities are identified as such in the Schedule of Investments, and the value of loaned securities and cash collateral at period end, as applicable, are presented in the Statement of Assets and Liabilities. Security lending income represents the income earned on investing cash collateral, less rebates paid to borrowers and any lending agent fees associated with the loan, plus any premium payments received for lending certain types of securities. Security lending income is presented in the Statement of Operations as a component of income from Fidelity Central Funds. Affiliated security lending activity, if any, was as follows:
| | Total Security Lending Fees Paid to NFS | Security Lending Income From Securities Loaned to NFS | Value of Securities Loaned to NFS at Period End |
| Fidelity Value Discovery Fund | $25,942 | $- | $- |
8. Expense Reductions.
Through arrangements with the Fund's custodian, credits realized as a result of certain uninvested cash balances were used to reduce the Fund's expenses. During the period, custodian credits reduced the Fund's expenses by $165.
In addition, during the period the investment adviser or an affiliate reimbursed and/or waived a portion of fund-level operating expenses in the amount of $119,475.
9. Distributions to Shareholders.
Distributions to shareholders of each class were as follows:
| | Six months ended January 31, 2024 | Year ended July 31, 2023 |
| Fidelity Value Discovery Fund | | |
| Distributions to shareholders | | |
| Value Discovery | $146,729,501 | $131,037,906 |
| Class K | 878,304 | 2,681,317 |
Total | $147,607,805 | $133,719,223 |
10. Share Transactions.
Share transactions for each class were as follows and may contain in-kind transactions, automatic conversions between classes or exchanges between affiliated funds:
| | Shares | Shares | Dollars | Dollars |
| | Six months ended January 31, 2024 | Year ended July 31, 2023 | Six months ended January 31, 2024 | Year ended July 31, 2023 |
| Fidelity Value Discovery Fund | | | | |
| Value Discovery | | | | |
| Shares sold | 9,845,578 | 18,888,345 | $336,037,008 | $639,957,332 |
| Reinvestment of distributions | 2,752,672 | 2,461,661 | 93,601,712 | 85,499,522 |
| Shares redeemed | (11,910,841) | (21,696,074) | (403,298,079) | (739,316,686) |
| Net increase (decrease) | 687,409 | (346,068) | $26,340,641 | $(13,859,832) |
| Class K | | | | |
| Shares sold | 51,062 | 291,506 | $1,748,415 | $10,198,809 |
| Reinvestment of distributions | 25,815 | 77,184 | 878,304 | 2,681,317 |
| Shares redeemed | (59,176) | (1,535,242) | (2,053,033) | (51,792,734) |
| Net increase (decrease) | 17,701 | (1,166,552) | $573,686 | $(38,912,608) |
11. Other.
A fund's organizational documents provide former and current trustees and officers with a limited indemnification against liabilities arising in connection with the performance of their duties to the fund. In the normal course of business, a fund may also enter into contracts that provide general indemnifications. A fund's maximum exposure under these arrangements is unknown as this would be dependent on future claims that may be made against a fund. The risk of material loss from such claims is considered remote.
12. Risk and Uncertainties.
Many factors affect a fund's performance. Developments that disrupt global economies and financial markets, such as pandemics, epidemics, outbreaks of infectious diseases, war, terrorism, and environmental disasters, may significantly affect a fund's investment performance. The effects of these developments to a fund will be impacted by the types of securities in which a fund invests, the financial condition, industry, economic sector, and geographic location of an issuer, and a fund's level of investment in the securities of that issuer. Significant concentrations in security types, issuers, industries, sectors, and geographic locations may magnify the factors that affect a fund's performance.
As a shareholder, you incur two types of costs: (1) transaction costs, which may include sales charges (loads) on purchase payments or redemption proceeds, as applicable and (2) ongoing costs, which generally include management fees, distribution and/or service (12b-1) fees and other Fund expenses. This Example is intended to help you understand your ongoing costs (in dollars) of investing in a fund and to compare these costs with the ongoing costs of investing in other mutual funds.
| The Example is based on an investment of $1,000 invested at the beginning of the period and held for the entire period (August 1, 2023 to January 31, 2024). |
Actual Expenses
The first line of the accompanying table provides information about actual account values and actual expenses. You may use the information in this line, together with the amount you invested, to estimate the expenses that you paid over the period. Simply divide your account value by $1,000.00 (for example, an $8,600 account value divided by $1,000.00 = 8.6), then multiply the result by the number in the first line for a class/Fund under the heading entitled "Expenses Paid During Period" to estimate the expenses you paid on your account during this period. If any fund is a shareholder of any underlying mutual funds or exchange-traded funds (ETFs) (the Underlying Funds), such fund indirectly bears its proportional share of the expenses of the Underlying Funds in addition to the direct expenses incurred presented in the table. These fees and expenses are not included in the annualized expense ratio used to calculate the expense estimate in the table below.
Hypothetical Example for Comparison Purposes
The second line of the accompanying table provides information about hypothetical account values and hypothetical expenses based on the actual expense ratio and an assumed rate of return of 5% per year before expenses, which is not the actual return. The hypothetical account values and expenses may not be used to estimate the actual ending account balance or expenses you paid for the period. You may use this information to compare the ongoing costs of investing in the Fund and other funds. To do so, compare this 5% hypothetical example with the 5% hypothetical examples that appear in the shareholder reports of the other funds. If any fund is a shareholder of any Underlying Funds, such fund indirectly bears its proportional share of the expenses of the Underlying Funds in addition to the direct expenses as presented in the table. These fees and expenses are not included in the annualized expense ratio used to calculate the expense estimate in the table below.
Please note that the expenses shown in the table are meant to highlight your ongoing costs only and do not reflect any transaction costs. Therefore, the second line of the table is useful in comparing ongoing costs only, and will not help you determine the relative total costs of owning different funds. In addition, if these transactional costs were included, your costs would have been higher.
| | | | | Annualized Expense Ratio- A | | Beginning Account Value August 1, 2023 | | Ending Account Value January 31, 2024 | | Expenses Paid During Period- C August 1, 2023 to January 31, 2024 |
| Fidelity® Value Discovery Fund | | | | | | | | | | |
Fidelity® Value Discovery Fund ** | | | | .69% | | | | | | |
| Actual | | | | | | $ 1,000 | | $ 1,014.00 | | $ 3.49 |
Hypothetical-B | | | | | | $ 1,000 | | $ 1,021.67 | | $ 3.51 |
Class K ** | | | | .60% | | | | | | |
| Actual | | | | | | $ 1,000 | | $ 1,014.50 | | $ 3.04 |
Hypothetical-B | | | | | | $ 1,000 | | $ 1,022.12 | | $ 3.05 |
| |
A Annualized expense ratio reflects expenses net of applicable fee waivers.
B 5% return per year before expenses
C Expenses are equal to the annualized expense ratio, multiplied by the average account value over the period, multiplied by 184/ 366 (to reflect the one-half year period). The fees and expenses of any Underlying Funds are not included in each annualized expense ratio.
** If fees and changes to the expense contract and/or expense cap, effective March 1, 2024, had been in effect during the current period, the restated annualized expense ratio and the expenses paid in the actual and hypothetical examples above would have been as shown in table below:
| | | | | Annualized Expense Ratio- A | | Expenses Paid |
| Fidelity® Value Discovery Fund | | | | | | |
| Fidelity® Value Discovery Fund | | | | .65% | | |
| Actual | | | | | | $ 3.29 |
Hypothetical- B | | | | | | $ 3.30 |
| Class K | | | | .57% | | |
| Actual | | | | | | $ 2.89 |
Hypothetical- B | | | | | | $ 2.90 |
| | | | | | | |
| A Annualized expense ratio reflects expenses net of applicable fee waivers. | | | | | | |
| B 5% return per year before expenses | | | | | | |
Board Approval of Investment Advisory Contracts
At its January 2024 meeting, the Board of Trustees, including the Independent Trustees (together, the Board), approved an amended and restated management contract with Fidelity Management & Research Company LLC (FMR) (the Management Contract), and amended and restated sub-advisory agreements (the Sub-Advisory Contracts, and together with the Management Contract, the Advisory Contracts) for the fund, including the fund's sub-advisory agreements with FMR Investment Management (UK) Limited (FMR UK), Fidelity Management & Research (Hong Kong) Limited (FMR H.K.), and Fidelity Management & Research (Japan) Limited (FMR Japan). The Advisory Contracts will be effective March 1, 2024. The Board will consider the annual renewal of the fund's Advisory Contracts in May 2024, following its review of additional materials provided by FMR.
Management Contract. The Board approved the Management Contract, which implements a new fee structure combining the management fee, transfer agent fee (TA Fee), and pricing and bookkeeping fee (P&B Fee) of the fund and each class into a single class-level fee based on tiered schedules and subject to a maximum class-level rate (the Unified Fee). In exchange for the Unified Fee, the fund will receive investment advisory, management, administrative, transfer agent, pricing and bookkeeping services under a single agreement - the Management Contract.
In its consideration of the Management Contract over several meetings, the Board received, reviewed and discussed a comprehensive set of analyses regarding the Unified Fee including (i) the legal framework, (ii) design goals for the Unified Fee, (iii) calculation methodology for the Unified Fee and illustrative examples, (iv) annual and cumulative projected impacts under various scenarios, both in the aggregate and at the fund/class level, (v) explanations of schedules, rate levers and maximum rates and (vi) shareholder benefits and projected savings.
The Board considered that the maximum Unified Fee for each class of the fund would be no higher than the sum of (i) the lowest contractual management fee rate under the fund's existing management contract, which is the individual fund fee rate, if any, plus the lowest contractual marginal group fee rate and (ii) the TA and P&B Fee rates, which are fixed fee rates since December 1, 2023 (together, the Unified Fee Cap). The Board noted that Fidelity has represented that, as a result of this Unified Fee Cap, the Unified Fee would be no greater than the fee rates previously authorized to be charged to the fund for the same services. The Board noted that certain expenses such as performance adjustments, third-party expenses, and certain other miscellaneous expenses would be outside the scope of the Unified Fee and the calculation of such fees would not change as a result of the Unified Fee. The Board considered that, under the Management Contract, a different management fee rate will be applicable to each class of the fund. The Board noted that Fidelity has represented that the difference in expenses between classes is based on differences in class-specific expenses and not due to any difference in advisory or third-party custodial fees or other expenses related to the management of the fund's assets.
The Board considered Fidelity's representations that implementation of the Unified Fee, which includes the Unified Fee Cap, would cause all funds subject to the Unified Fee, including the fund, to experience an immediate reduction on contractual fee rates for services provided under the current management contracts. The Board considered that some funds would not experience lower net total fees as a result of existing fee caps. The Board further considered that, in addition to the contractual fee savings, the Unified Fee offers funds and their shareholders greater protection from future rate increases for services previously offered under separate agreements that are now covered by the Management Contract because such rate increases would require shareholder approval.
Sub-Advisory Contracts. In connection with the Unified Fee changes, the Board considered the Sub-Advisory Contracts, which simplified the calculation of the fees paid by FMR to the sub-advisers under the agreements. The Board noted that the agreements with FMR UK, FMR H.K., and FMR Japan were amended to provide that FMR will compensate each sub-adviser at a fee rate equal to 110% of the sub-adviser's costs incurred in providing services under the agreement. The Board considered that, under the Sub-Advisory Contracts, FMR, and not the fund, will continue to pay the sub-advisory fees to each applicable sub-adviser.
The Board further considered that the approval of the fund's Advisory Contracts will not result in any changes in the investment process or strategies employed in the management of the fund's assets or the day-to-day management of the fund or the persons primarily responsible for such management. Further, the Board considered that the Management Contract would not change the obligations and services of FMR and its affiliates on behalf of the fund, and, in particular, there would be no change in the nature and level of advisory, management, administration, transfer agent, and pricing and bookkeeping services provided to the fund by FMR, its affiliates, and each applicable sub-adviser.
In connection with its consideration of future renewals of the fund's Advisory Contracts, the Board will consider: (i) the nature, extent and quality of services provided to the funds, including shareholder and administrative services and investment performance; (ii) the competitiveness of the management fee and total expenses for the fund; (iii) the costs of the services and profitability, including the revenues earned and the expenses incurred in conducting the business of developing, marketing, distributing, managing, administering, and servicing the fund and its shareholders, to the extent applicable; and (iv) whether there have been economies of scale in respect of the Fidelity funds, whether the Fidelity funds (including the fund) have appropriately benefited from any such economies of scale, and whether there is the potential for realization of any further economies.
Based on its evaluation of all of the conclusions and representations noted above, and after considering all factors it believed relevant, the Board concluded that the fund's management fee structure is fair and reasonable, and that the fund's Advisory Contracts should be approved.
The Securities and Exchange Commission adopted Rule 22e-4 under the Investment Company Act of 1940 (the Liquidity Rule) to promote effective liquidity risk management throughout the open-end investment company industry, thereby reducing the risk that funds will be unable to meet their redemption obligations and mitigating dilution of the interests of fund shareholders.
The Fund has adopted and implemented a liquidity risk management program (the Program) reasonably designed to assess and manage the Fund's liquidity risk and to comply with the requirements of the Liquidity Rule. The Fund's Board of Trustees (the Board) has designated the Fund's investment adviser as administrator of the Program. The Fidelity advisers have established a Liquidity Risk Management Committee (the LRM Committee) to manage the Program for each of the Fidelity Funds. The LRM Committee monitors the adequacy and effectiveness of implementation of the Program and on a periodic basis assesses each Fund's liquidity risk based on a variety of factors including (1) the Fund's investment strategy, (2) portfolio liquidity and cash flow projections during normal and reasonably foreseeable stressed conditions, (3) shareholder redemptions, (4) borrowings and other funding sources and (5) certain factors specific to ETFs including the effect of the Fund's prices and spreads, market participants, and basket compositions on the overall liquidity of the Fund's portfolio, as applicable.
In accordance with the Program, each of the Fund's portfolio investments is classified into one of four defined liquidity categories based on a determination of a reasonable expectation for how long it would take to convert the investment to cash (or sell or dispose of the investment) without significantly changing its market value.
- Highly liquid investments - cash or convertible to cash within three business days or less
- Moderately liquid investments - convertible to cash in three to seven calendar days
- Less liquid investments - can be sold or disposed of, but not settled, within seven calendar days
- Illiquid investments - cannot be sold or disposed of within seven calendar days
Liquidity classification determinations take into account a variety of factors including various market, trading and investment-specific considerations, as well as market depth, and generally utilize analysis from a third-party liquidity metrics service.
The Liquidity Rule places a 15% limit on a fund's illiquid investments and requires funds that do not primarily hold assets that are highly liquid investments to determine and maintain a minimum percentage of the fund's net assets to be invested in highly liquid investments (highly liquid investment minimum or HLIM). The Program includes provisions reasonably designed to comply with the 15% limit on illiquid investments and for determining, periodically reviewing and complying with the HLIM requirement as applicable.
At a recent meeting of the Fund's Board of Trustees, the LRM Committee provided a written report to the Board pertaining to the operation, adequacy, and effectiveness of the Program for the period December 1, 2022 through November 30, 2023. The report concluded that the Program is operating effectively and is reasonably designed to assess and manage the Fund's liquidity risk.
1.783113.121
FVD-SANN-0324
Fidelity® Low-Priced Stock Fund
Semi-Annual Report
January 31, 2024
Contents
To view a fund's proxy voting guidelines and proxy voting record for the 12-month period ended June 30, visit http://www.fidelity.com/proxyvotingresults or visit the Securities and Exchange Commission's (SEC) web site at http://www.sec.gov.
You may also call 1-800-544-8544 if you're an individual investing directly with Fidelity, call 1-800-835-5092 if you're a plan sponsor or participant with Fidelity as your recordkeeper or call 1-877-208-0098 on institutional accounts or if you're an advisor or invest through one to request a free copy of the proxy voting guidelines.
Standard & Poor's, S&P and S&P 500 are registered service marks of The McGraw-Hill Companies, Inc. and have been licensed for use by Fidelity Distributors Corporation.
Other third-party marks appearing herein are the property of their respective owners.
All other marks appearing herein are registered or unregistered trademarks or service marks of FMR LLC or an affiliated company. © 2024 FMR LLC. All rights reserved.
This report and the financial statements contained herein are submitted for the general information of the shareholders of the Fund. This report is not authorized for distribution to prospective investors in the Fund unless preceded or accompanied by an effective prospectus.
A fund files its complete schedule of portfolio holdings with the SEC for the first and third quarters of each fiscal year on Form N-PORT. Forms N-PORT are available on the SEC's web site at http://www.sec.gov. A fund's Forms N-PORT may be reviewed and copied at the SEC's Public Reference Room in Washington, DC. Information regarding the operation of the SEC's Public Reference Room may be obtained by calling 1-800-SEC-0330.
For a complete list of a fund's portfolio holdings, view the most recent holdings listing, semiannual report, or annual report on Fidelity's web site at http://www.fidelity.com, http://www.institutional.fidelity.com, or http://www.401k.com, as applicable.
NOT FDIC INSURED •MAY LOSE VALUE •NO BANK GUARANTEE
Neither the Fund nor Fidelity Distributors Corporation is a bank.
Top Holdings (% of Fund's net assets) |
| |
| Wells Fargo & Co. | 1.9 | |
| Elevance Health, Inc. | 1.9 | |
| Metro, Inc. | 1.6 | |
| Seagate Technology Holdings PLC | 1.5 | |
| UnitedHealth Group, Inc. | 1.5 | |
| Next PLC | 1.5 | |
| TotalEnergies SE sponsored ADR | 1.5 | |
| PG&E Corp. | 1.4 | |
| Reinsurance Group of America, Inc. | 1.1 | |
| Unum Group | 1.1 | |
| | 15.0 | |
| |
| Market Sectors (% of Fund's net assets) |
| |
| Industrials | 16.4 | |
| Financials | 15.8 | |
| Information Technology | 15.6 | |
| Consumer Discretionary | 14.6 | |
| Health Care | 11.6 | |
| Energy | 8.9 | |
| Consumer Staples | 6.6 | |
| Materials | 5.4 | |
| Utilities | 1.8 | |
| Communication Services | 1.2 | |
| Real Estate | 0.9 | |
| |
Asset Allocation (% of Fund's net assets) |
|
|
Geographic Diversification (% of Fund's net assets) |
|
* Includes Short-Term investments and Net Other Assets (Liabilities). Percentages are adjusted for the effect of derivatives, if applicable. |
| |
Showing Percentage of Net Assets
| Common Stocks - 98.8% |
| | | Shares | Value ($) (000s) |
| COMMUNICATION SERVICES - 1.2% | | | |
| Entertainment - 0.5% | | | |
| GungHo Online Entertainment, Inc. | | 492,727 | 8,284 |
| International Games Systems Co. Ltd. | | 1,720,706 | 45,532 |
| Warner Bros Discovery, Inc. (a) | | 6,280,831 | 62,934 |
| | | | 116,750 |
| Interactive Media & Services - 0.2% | | | |
| Cars.com, Inc. (a) | | 3,126,546 | 54,496 |
| JOYY, Inc. ADR | | 197,425 | 6,053 |
| New Work SE (b) | | 33,441 | 2,233 |
| | | | 62,782 |
| Media - 0.5% | | | |
| Comcast Corp. Class A | | 1,903,663 | 88,596 |
| Intage Holdings, Inc. | | 214,893 | 2,541 |
| Nexstar Media Group, Inc. Class A | | 166,290 | 29,551 |
| Pico Far East Holdings Ltd. | | 22,200,608 | 4,292 |
| Reach PLC | | 5,430,826 | 4,250 |
| RKB Mainichi Broadcasting Corp. | | 34,946 | 1,187 |
| Thryv Holdings, Inc. (a) | | 441,100 | 9,016 |
| Trenders, Inc. (b) | | 147,906 | 937 |
| | | | 140,370 |
TOTAL COMMUNICATION SERVICES | | | 319,902 |
| CONSUMER DISCRETIONARY - 14.6% | | | |
| Automobile Components - 1.5% | | | |
| Adient PLC (a) | | 892,790 | 30,989 |
| ASTI Corp. (c) | | 195,675 | 4,160 |
| Brembo SpA | | 1,080,064 | 13,353 |
| Cie Automotive SA | | 1,350,453 | 35,756 |
| DaikyoNishikawa Corp. | | 492,714 | 2,466 |
| Gentex Corp. | | 591,693 | 19,603 |
| GUD Holdings Ltd. | | 98,174 | 779 |
| Hi-Lex Corp. | | 114,989 | 1,210 |
| LCI Industries (b) | | 1,170,324 | 130,234 |
| Lear Corp. | | 666,388 | 88,563 |
| Motonic Corp. (c) | | 1,790,746 | 11,052 |
| Patrick Industries, Inc. | | 175,019 | 17,570 |
| PT Selamat Sempurna Tbk | | 50,116,600 | 6,364 |
| SNT Holdings Co. Ltd. (c) | | 885,108 | 12,775 |
| Yutaka Giken Co. Ltd. (c) | | 913,134 | 16,370 |
| | | | 391,244 |
| Automobiles - 0.6% | | | |
| General Motors Co. | | 1,481,769 | 57,493 |
| Harley-Davidson, Inc. | | 2,115,795 | 68,658 |
| Isuzu Motors Ltd. | | 1,203,224 | 16,418 |
| Kabe Husvagnar AB (B Shares) | | 243,036 | 7,555 |
| | | | 150,124 |
| Broadline Retail - 2.3% | | | |
| ASKUL Corp. | | 2,935,385 | 39,677 |
| B&M European Value Retail SA | | 8,047,241 | 52,888 |
| Belluna Co. Ltd. | | 1,692,797 | 7,284 |
| Big Lots, Inc. (b) | | 1,219,227 | 6,998 |
| Europris ASA (d) | | 2,571,176 | 19,301 |
| Gwangju Shinsegae Co. Ltd. | | 243,645 | 5,576 |
| Kohl's Corp. (b) | | 1,172,468 | 30,203 |
| Macy's, Inc. (b) | | 1,090,296 | 19,942 |
| Max Stock Ltd. | | 1,357,697 | 2,769 |
| Next PLC | | 3,661,956 | 392,983 |
| Rusta AB | | 4,319,451 | 30,391 |
| Vipshop Holdings Ltd. ADR (a) | | 986,309 | 15,672 |
| | | | 623,684 |
| Distributors - 0.4% | | | |
| Arata Corp. | | 1,180,488 | 26,202 |
| Autohellas SA | | 183,956 | 2,664 |
| Central Automotive Products Ltd. | | 301,531 | 9,952 |
| Inchcape PLC | | 5,321,786 | 46,198 |
| PALTAC Corp. | | 1,185,405 | 36,090 |
| | | | 121,106 |
| Diversified Consumer Services - 0.3% | | | |
| Aucnet, Inc. | | 162,220 | 2,326 |
| Cross-Harbour Holdings Ltd. | | 2,248,914 | 2,140 |
| Frontdoor, Inc. (a) | | 484,472 | 15,871 |
| Gakkyusha Co. Ltd. | | 40,273 | 563 |
| H&R Block, Inc. | | 1,082,110 | 50,686 |
| JP-Holdings, Inc. | | 863,225 | 2,679 |
| ME Group International PLC | | 6,532,086 | 10,513 |
| Step Co. Ltd. | | 406,955 | 5,639 |
| | | | 90,417 |
| Hotels, Restaurants & Leisure - 0.3% | | | |
| Betsson AB (B Shares) | | 3,058,688 | 33,330 |
| Brinker International, Inc. (a) | | 571,127 | 24,439 |
| Hollywood Bowl Group PLC | | 222,900 | 845 |
| Ibersol SGPS SA | | 1,180,710 | 8,524 |
| J.D. Wetherspoon PLC (a) | | 1,570,348 | 16,717 |
| | | | 83,855 |
| Household Durables - 3.3% | | | |
| Ace Bed Co. Ltd. | | 33,326 | 636 |
| Barratt Developments PLC | | 18,602,219 | 127,397 |
| Bellway PLC | | 3,702,147 | 129,492 |
| Chervon Holdings Ltd. | | 10,789,625 | 21,932 |
| Cuckoo Holdings Co. Ltd. | | 508,128 | 6,029 |
| D.R. Horton, Inc. | | 240,564 | 34,379 |
| Emak SpA | | 3,151,984 | 3,583 |
| First Juken Co. Ltd. (b)(c) | | 1,331,393 | 10,062 |
| FJ Next Co. Ltd. | | 1,182,970 | 9,976 |
| Gree Electric Appliances, Inc. of Zhuhai (A Shares) | | 8,158,037 | 40,188 |
| Helen of Troy Ltd. (a)(b)(c) | | 1,399,044 | 160,191 |
| JM AB (B Shares) | | 1,454,369 | 23,842 |
| Open House Group Co. Ltd. | | 542,027 | 16,950 |
| Pressance Corp. | | 2,496,188 | 28,234 |
| Tempur Sealy International, Inc. | | 1,527,102 | 76,187 |
| Token Corp. | | 236,687 | 15,178 |
| TopBuild Corp. (a) | | 96,481 | 35,614 |
| Vistry Group PLC | | 11,310,547 | 144,055 |
| ZAGG, Inc. rights (a)(e) | | 448,847 | 0 |
| | | | 883,925 |
| Leisure Products - 0.2% | | | |
| Brunswick Corp. | | 498,305 | 40,203 |
| Miroku Corp. | | 36,465 | 373 |
| Roland Corp. | | 276,055 | 9,172 |
| | | | 49,748 |
| Specialty Retail - 4.0% | | | |
| Academy Sports & Outdoors, Inc. | | 580,034 | 36,386 |
| Arcland Sakamoto Co. Ltd. | | 1,109,193 | 12,702 |
| AutoZone, Inc. (a) | | 94,941 | 262,239 |
| BHG Group AB (a) | | 4,347,817 | 7,115 |
| BMTC Group, Inc. (c) | | 3,239,303 | 29,635 |
| Buffalo Co. Ltd. | | 69,296 | 653 |
| Dick's Sporting Goods, Inc. | | 511,248 | 76,212 |
| Foot Locker, Inc. | | 2,173,204 | 61,197 |
| Formosa Optical Technology Co. Ltd. | | 1,002,000 | 2,802 |
| Fuji Corp. | | 495,158 | 5,950 |
| Goldlion Holdings Ltd. | | 24,979,416 | 3,352 |
| Hamee Corp. | | 616,681 | 4,541 |
| Handsman Co. Ltd. | | 336,224 | 2,284 |
| IA Group Corp. (c) | | 111,375 | 2,679 |
| JD Sports Fashion PLC | | 36,762,904 | 54,533 |
| Jumbo SA (c) | | 7,014,027 | 197,082 |
| K's Holdings Corp. | | 552,274 | 5,019 |
| Kid ASA (d) | | 51,148 | 654 |
| Ku Holdings Co. Ltd. | | 840,179 | 6,756 |
| Leon's Furniture Ltd. | | 305,554 | 4,836 |
| Maisons du Monde SA (d) | | 841,165 | 4,065 |
| Mr. Bricolage SA (a) | | 818,317 | 7,163 |
| Nafco Co. Ltd. (c) | | 1,844,830 | 27,960 |
| Papyless Co. Ltd. | | 60,663 | 380 |
| Pendragon PLC (a) | | 12,706,886 | 5,854 |
| Pets At Home Group PLC | | 1,911,847 | 6,789 |
| Ross Stores, Inc. | | 382,525 | 53,661 |
| Sally Beauty Holdings, Inc. (a)(c) | | 8,232,470 | 101,424 |
| Sportsman's Warehouse Holdings, Inc. (a)(b)(c) | | 2,815,961 | 10,841 |
| Syuppin Co. Ltd. | | 296,082 | 2,087 |
| The Hour Glass Ltd. | | 1,837,179 | 2,079 |
| Valvoline, Inc. (a) | | 9,949 | 363 |
| WH Smith PLC | | 1,761,759 | 27,038 |
| Williams-Sonoma, Inc. | | 225,034 | 43,519 |
| | | | 1,069,850 |
| Textiles, Apparel & Luxury Goods - 1.7% | | | |
| Best Pacific International Holdings Ltd. | | 34,489,826 | 4,750 |
| Crocs, Inc. (a) | | 47,811 | 4,852 |
| Deckers Outdoor Corp. (a) | | 5,595 | 4,217 |
| Embry Holdings Ltd. (a) | | 2,147,519 | 113 |
| Gildan Activewear, Inc. | | 2,980,631 | 98,434 |
| Handsome Co. Ltd. (c) | | 1,400,000 | 19,538 |
| Kontoor Brands, Inc. | | 661,339 | 38,768 |
| Levi Strauss & Co. Class A (b) | | 4,257,009 | 69,304 |
| PVH Corp. | | 852,240 | 102,490 |
| Sun Hing Vision Group Holdings Ltd. (c) | | 17,847,882 | 1,699 |
| Texwinca Holdings Ltd. | | 33,580,422 | 3,522 |
| Victory City International Holdings Ltd. (e) | | 8,385,171 | 311 |
| Wolverine World Wide, Inc. (c) | | 5,230,217 | 43,725 |
| Youngone Corp. | | 250,000 | 8,975 |
| Youngone Holdings Co. Ltd. (c) | | 752,000 | 45,581 |
| | | | 446,279 |
TOTAL CONSUMER DISCRETIONARY | | | 3,910,232 |
| CONSUMER STAPLES - 6.6% | | | |
| Beverages - 0.3% | | | |
| A.G. Barr PLC | | 1,954,840 | 14,071 |
| Britvic PLC | | 5,667,122 | 63,381 |
| Muhak Co. Ltd. | | 159,678 | 595 |
| Viva Wine Group AB | | 2,534,117 | 9,972 |
| | | | 88,019 |
| Consumer Staples Distribution & Retail - 4.7% | | | |
| Acomo NV | | 136,083 | 2,582 |
| Alimentation Couche-Tard, Inc. Class A (multi-vtg.) | | 2,141,916 | 125,509 |
| Atacadao SA | | 7,154,900 | 15,034 |
| Belc Co. Ltd. (c) | | 1,384,809 | 59,166 |
| BJ's Wholesale Club Holdings, Inc. (a) | | 1,495,834 | 96,242 |
| Corporativo Fragua S.A.B. de CV | | 267,029 | 8,378 |
| Cosmos Pharmaceutical Corp. | | 926,359 | 99,504 |
| Create SD Holdings Co. Ltd. | | 3,122,920 | 67,959 |
| Eurocash SA | | 273,287 | 1,037 |
| G-7 Holdings, Inc. | | 1,232,170 | 10,504 |
| Genky DrugStores Co. Ltd. (c) | | 985,445 | 44,836 |
| Halows Co. Ltd. (c) | | 1,454,230 | 43,119 |
| MARR SpA | | 113,187 | 1,380 |
| Metro, Inc. | | 7,946,406 | 417,224 |
| North West Co., Inc. | | 74,090 | 2,143 |
| Performance Food Group Co. (a) | | 95,605 | 6,949 |
| Sprouts Farmers Market LLC (a) | | 3,722,940 | 187,524 |
| Tsuruha Holdings, Inc. | | 147,898 | 11,704 |
| U.S. Foods Holding Corp. (a) | | 114,198 | 5,254 |
| YAKUODO Holdings Co. Ltd. | | 154,331 | 2,710 |
| Yaoko Co. Ltd. | | 714,425 | 41,221 |
| | | | 1,249,979 |
| Food Products - 1.2% | | | |
| Armanino Foods of Distinction | | 1,228,547 | 5,934 |
| Axyz Co. Ltd. | | 21,455 | 432 |
| Carr's Group PLC (c) | | 5,938,435 | 9,633 |
| Century Pacific Food, Inc. | | 18,194,356 | 10,560 |
| Delfi Ltd. | | 2,985,701 | 2,438 |
| Food Empire Holdings Ltd. | | 21,052,929 | 21,133 |
| Gruma S.A.B. de CV Series B | | 477,532 | 8,939 |
| Inghams Group Ltd. | | 5,421,782 | 15,172 |
| Ingredion, Inc. | | 271,206 | 29,174 |
| Lamb Weston Holdings, Inc. | | 589,696 | 60,408 |
| Nomad Foods Ltd. | | 582,978 | 10,488 |
| Ottogi Corp. | | 77,998 | 23,381 |
| Pacific Andes International Holdings Ltd. (a)(e) | | 106,294,500 | 0 |
| Pacific Andes Resources Development Ltd. (a)(e) | | 205,371,360 | 2 |
| Pickles Holdings Co. Ltd. | | 351,478 | 3,071 |
| Rocky Mountain Chocolate Factory, Inc. (a)(c) | | 446,776 | 1,787 |
| S Foods, Inc. | | 793,328 | 17,839 |
| Seaboard Corp. | | 15,472 | 55,746 |
| Sunjin Co. Ltd. (c) | | 1,747,572 | 8,584 |
| Sunjuice Holdings Co. Ltd. | | 240,000 | 1,765 |
| Tate & Lyle PLC | | 4,366,277 | 34,473 |
| | | | 320,959 |
| Household Products - 0.0% | | | |
| Transaction Co. Ltd. | | 393,251 | 6,575 |
| Personal Care Products - 0.3% | | | |
| Hengan International Group Co. Ltd. | | 8,721,996 | 27,008 |
| Sarantis SA (c) | | 3,752,727 | 35,608 |
| TCI Co. Ltd. | | 400,000 | 2,194 |
| | | | 64,810 |
| Tobacco - 0.1% | | | |
| KT&G Corp. | | 286,050 | 19,427 |
| Scandinavian Tobacco Group A/S (d) | | 690,109 | 12,376 |
| | | | 31,803 |
TOTAL CONSUMER STAPLES | | | 1,762,145 |
| ENERGY - 8.9% | | | |
| Energy Equipment & Services - 0.2% | | | |
| Cactus, Inc. | | 117,705 | 4,995 |
| John Wood Group PLC (a) | | 17,609,950 | 35,149 |
| PHX Energy Services Corp. | | 1,182,881 | 8,218 |
| Total Energy Services, Inc. | | 1,731,415 | 12,131 |
| Vallourec SA (a) | | 349,100 | 5,031 |
| | | | 65,524 |
| Oil, Gas & Consumable Fuels - 8.7% | | | |
| Adams Resources & Energy, Inc. | | 16,120 | 406 |
| Antero Resources Corp. (a) | | 6,752,349 | 150,847 |
| Berry Corp. (c) | | 4,139,428 | 27,776 |
| Bonterra Energy Corp. (a)(b) | | 571,713 | 2,075 |
| Cenovus Energy, Inc. (Canada) | | 10,523,165 | 170,475 |
| China Petroleum & Chemical Corp. (H Shares) | | 85,216,201 | 44,330 |
| Chord Energy Corp. | | 1,546,286 | 237,757 |
| Civitas Resources, Inc. (b) | | 2,758,044 | 178,749 |
| CNX Resources Corp. (a) | | 1,576,662 | 31,849 |
| Diamondback Energy, Inc. | | 527,252 | 81,060 |
| Energy Transfer LP | | 701,480 | 10,031 |
| Enterprise Products Partners LP | | 1,609,583 | 43,072 |
| Exxon Mobil Corp. | | 46,200 | 4,750 |
| INPEX Corp. | | 198,932 | 2,704 |
| Iwatani Corp. | | 97,250 | 4,346 |
| Mi Chang Oil Industrial Co. Ltd. (c) | | 173,900 | 9,654 |
| NACCO Industries, Inc. Class A | | 308,007 | 11,174 |
| Northern Oil & Gas, Inc. | | 1,677,856 | 56,208 |
| Oil & Natural Gas Corp. Ltd. | | 43,622,493 | 132,456 |
| Oil India Ltd. | | 13,091,000 | 67,197 |
| Ovintiv, Inc. | | 6,804,553 | 288,649 |
| Parkland Corp. | | 525,573 | 17,935 |
| Petronet LNG Ltd. | | 14,000,000 | 45,365 |
| Range Resources Corp. | | 6,427,139 | 186,644 |
| Scorpio Tankers, Inc. | | 62,453 | 4,415 |
| Shell PLC (London) | | 812,499 | 25,189 |
| Southwestern Energy Co. (a) | | 14,122,706 | 91,091 |
| TotalEnergies SE sponsored ADR (b) | | 6,006,233 | 391,486 |
| Unit Corp. | | 150,136 | 5,983 |
| Unit Corp. warrants 9/3/27 (a) | | 115,977 | 104 |
| | | | 2,323,777 |
TOTAL ENERGY | | | 2,389,301 |
| FINANCIALS - 15.8% | | | |
| Banks - 5.8% | | | |
| ACNB Corp. | | 373,984 | 14,597 |
| Associated Banc-Corp. | | 4,656,247 | 97,828 |
| Bar Harbor Bankshares | | 663,131 | 17,447 |
| Cadence Bank | | 3,631,963 | 96,683 |
| Camden National Corp. (b) | | 335,623 | 12,092 |
| Central Pacific Financial Corp. | | 128,198 | 2,470 |
| Community Trust Bancorp, Inc. | | 67,186 | 2,788 |
| East West Bancorp, Inc. | | 815,344 | 59,365 |
| First Bancorp, Puerto Rico | | 2,701,883 | 45,067 |
| First Foundation, Inc. | | 24,384 | 232 |
| FNB Corp., Pennsylvania | | 5,182,751 | 68,309 |
| Intercorp Financial Services, Inc. | | 618,224 | 14,497 |
| KeyCorp | | 1,892,839 | 27,503 |
| Nicolet Bankshares, Inc. | | 198,564 | 15,442 |
| Oak Valley Bancorp Oakdale California (b) | | 117,586 | 3,063 |
| OFG Bancorp | | 103,524 | 3,807 |
| Plumas Bancorp | | 197,136 | 6,955 |
| QCR Holdings, Inc. | | 575,567 | 33,619 |
| Southern Missouri Bancorp, Inc. | | 207,149 | 9,034 |
| Sparebank 1 Oestlandet | | 2,037,739 | 23,715 |
| Sparebank 1 Sr Bank ASA (primary capital certificate) | | 1,118,904 | 13,596 |
| Sparebanken Nord-Norge | | 2,417,789 | 23,816 |
| Synovus Financial Corp. | | 3,276,617 | 123,397 |
| The First Bancorp, Inc. | | 175,061 | 4,377 |
| U.S. Bancorp | | 1,685,170 | 70,002 |
| Union Bankshares, Inc. | | 125,480 | 3,761 |
| United Community Bank, Inc. | | 2,920,026 | 79,834 |
| Unity Bancorp, Inc. | | 108,416 | 2,970 |
| Washington Trust Bancorp, Inc. | | 660,180 | 18,360 |
| Webster Financial Corp. | | 1,301,644 | 64,405 |
| Wells Fargo & Co. | | 10,263,299 | 515,013 |
| West Bancorp., Inc. | | 625,797 | 11,771 |
| Wintrust Financial Corp. | | 721,263 | 69,948 |
| | | | 1,555,763 |
| Capital Markets - 2.3% | | | |
| ABG Sundal Collier ASA | | 5,643,536 | 3,386 |
| Antin Infrastructure Partners SA | | 390,657 | 7,202 |
| Azimut Holding SpA | | 116,659 | 3,265 |
| Banca Generali SpA | | 322,444 | 12,336 |
| Bank of New York Mellon Corp. | | 108,405 | 6,012 |
| DWS Group GmbH & Co. KGaA (d) | | 151,766 | 6,229 |
| Federated Hermes, Inc. | | 2,548,054 | 89,080 |
| Korea Ratings Corp. | | 29,923 | 1,737 |
| Lazard, Inc. Class A | | 2,611,680 | 101,803 |
| LPL Financial | | 274,113 | 65,565 |
| Rathbone Brothers PLC | | 1,756,876 | 36,915 |
| Raymond James Financial, Inc. | | 1,521,198 | 167,606 |
| SEI Investments Co. | | 1,080 | 68 |
| Stifel Financial Corp. | | 1,008,406 | 73,563 |
| T. Rowe Price Group, Inc. | | 9,950 | 1,079 |
| Van Lanschot Kempen NV (Bearer) | | 1,009,935 | 30,506 |
| Vontobel Holdings AG | | 220,720 | 14,630 |
| | | | 620,982 |
| Consumer Finance - 1.2% | | | |
| Aeon Credit Service (Asia) Co. Ltd. | | 13,939,681 | 9,590 |
| Discover Financial Services | | 2,478,885 | 261,572 |
| OneMain Holdings, Inc. | | 809,311 | 38,523 |
| | | | 309,685 |
| Financial Services - 1.6% | | | |
| ASAX Co. Ltd. | | 108,276 | 549 |
| Enact Holdings, Inc. | | 1,194,327 | 34,026 |
| Essent Group Ltd. | | 1,680,622 | 92,703 |
| Far East Horizon Ltd. | | 3,349,819 | 2,456 |
| Federal Agricultural Mortgage Corp.: | | | |
| Class A (multi-vtg.) | | 4,861 | 749 |
| Class C (non-vtg.) | | 322,052 | 59,995 |
| FleetCor Technologies, Inc. (a) | | 561,659 | 162,842 |
| Fuyo General Lease Co. Ltd. | | 128,195 | 11,464 |
| Nice Information & Telecom, Inc. | | 433,187 | 7,040 |
| Tokyo Century Corp. | | 595,629 | 6,618 |
| Zenkoku Hosho Co. Ltd. | | 1,531,757 | 57,002 |
| | | | 435,444 |
| Insurance - 4.9% | | | |
| American Financial Group, Inc. | | 742,968 | 89,453 |
| ASR Nederland NV | | 1,872,918 | 88,472 |
| Db Insurance Co. Ltd. | | 308,087 | 20,323 |
| Direct Line Insurance Group PLC (a) | | 47,143,254 | 101,207 |
| First American Financial Corp. | | 744,658 | 44,940 |
| Grupo Catalana Occidente SA | | 399,287 | 14,305 |
| Hartford Financial Services Group, Inc. | | 421,181 | 36,626 |
| Hiscox Ltd. | | 295,675 | 3,893 |
| National Western Life Group, Inc. | | 5,759 | 2,787 |
| NN Group NV | | 1,037,494 | 42,525 |
| Primerica, Inc. | | 417,542 | 97,772 |
| Qualitas Controladora S.A.B. de CV | | 818,956 | 9,049 |
| Reinsurance Group of America, Inc. | | 1,741,078 | 302,756 |
| Selective Insurance Group, Inc. | | 1,037,193 | 108,760 |
| Stewart Information Services Corp. | | 533,617 | 32,903 |
| Talanx AG | | 488,543 | 34,344 |
| The Travelers Companies, Inc. | | 23,962 | 5,065 |
| Unum Group | | 6,093,439 | 294,557 |
| | | | 1,329,737 |
TOTAL FINANCIALS | | | 4,251,611 |
| HEALTH CARE - 11.6% | | | |
| Biotechnology - 0.5% | | | |
| Amgen, Inc. | | 2,980 | 936 |
| Cell Biotech Co. Ltd. | | 404,461 | 3,472 |
| Essex Bio-Technology Ltd. | | 11,642,101 | 3,831 |
| Gilead Sciences, Inc. | | 1,226,508 | 95,987 |
| Regeneron Pharmaceuticals, Inc. (a) | | 4,270 | 4,026 |
| United Therapeutics Corp. (a) | | 124,219 | 26,680 |
| | | | 134,932 |
| Health Care Equipment & Supplies - 0.9% | | | |
| Dentsply Sirona, Inc. | | 1,291,471 | 44,879 |
| Embecta Corp. | | 1,718,760 | 29,460 |
| Fukuda Denshi Co. Ltd. | | 1,617,494 | 86,247 |
| InBody Co. Ltd. (c) | | 741,922 | 13,763 |
| Nakanishi, Inc. | | 389,971 | 6,382 |
| Prim SA (c) | | 1,340,976 | 14,999 |
| Techno Medica Co. Ltd. | | 37,055 | 495 |
| Utah Medical Products, Inc. (c) | | 213,090 | 16,879 |
| Value Added Technology Co. Ltd. | | 436,553 | 10,469 |
| Vieworks Co. Ltd. | | 394,258 | 8,059 |
| Zimmer Biomet Holdings, Inc. | | 29,789 | 3,741 |
| | | | 235,373 |
| Health Care Providers & Services - 8.4% | | | |
| Centene Corp. (a) | | 2,788,245 | 209,983 |
| Ci Medical Co. Ltd. | | 97,791 | 2,788 |
| Cigna Group | | 923,263 | 277,856 |
| CVS Health Corp. | | 747,181 | 55,568 |
| Elevance Health, Inc. | | 1,021,312 | 503,956 |
| Henry Schein, Inc. (a) | | 762,275 | 57,049 |
| Hi-Clearance, Inc. | | 1,660,459 | 7,079 |
| Humana, Inc. | | 364,244 | 137,706 |
| Laboratory Corp. of America Holdings | | 483,427 | 107,466 |
| Medica Sur SA de CV | | 1,125,987 | 2,663 |
| Quest Diagnostics, Inc. | | 402,454 | 51,687 |
| Select Medical Holdings Corp. | | 122,399 | 3,181 |
| Ship Healthcare Holdings, Inc. | | 585,228 | 8,882 |
| Sinopharm Group Co. Ltd. (H Shares) | | 42,644,736 | 112,134 |
| UnitedHealth Group, Inc. | | 801,440 | 410,129 |
| Universal Health Services, Inc. Class B | | 1,822,301 | 289,400 |
| WIN-Partners Co. Ltd. (c) | | 2,077,371 | 17,964 |
| | | | 2,255,491 |
| Health Care Technology - 0.0% | | | |
| Software Service, Inc. | | 49,250 | 4,184 |
| Life Sciences Tools & Services - 0.5% | | | |
| ICON PLC (a) | | 535,345 | 139,655 |
| Pharmaceuticals - 1.3% | | | |
| China Medical System Holdings Ltd. | | 9,854,503 | 14,082 |
| Consun Pharmaceutical Group Ltd. | | 3,941,946 | 2,687 |
| Daewon Pharmaceutical Co. Ltd. (c) | | 2,142,922 | 23,456 |
| Dai Han Pharmaceutical Co. Ltd. | | 297,037 | 6,259 |
| Daito Pharmaceutical Co. Ltd. | | 88,181 | 1,177 |
| Dawnrays Pharmaceutical Holdings Ltd. | | 64,051,715 | 9,147 |
| DongKook Pharmaceutical Co. Ltd. | | 1,420,400 | 18,992 |
| Faes Farma SA | | 3,027,612 | 9,963 |
| Genomma Lab Internacional SA de CV | | 2,390,178 | 1,961 |
| Granules India Ltd. | | 591,564 | 2,959 |
| Huons Co. Ltd. (c) | | 853,834 | 21,974 |
| Hypera SA | | 1,921,000 | 12,303 |
| Jazz Pharmaceuticals PLC (a) | | 211,736 | 25,984 |
| Korea United Pharm, Inc. | | 40,010 | 733 |
| Kwang Dong Pharmaceutical Co. Ltd. (c) | | 4,164,491 | 22,602 |
| Nippon Chemiphar Co. Ltd. | | 19,040 | 207 |
| Recordati SpA | | 618,993 | 34,317 |
| Sanofi SA | | 1,226,167 | 122,795 |
| Sanofi SA sponsored ADR | | 124,505 | 6,213 |
| Syngen Biotech Co. Ltd. | | 357,700 | 1,724 |
| Whanin Pharmaceutical Co. Ltd. (c) | | 1,016,010 | 10,938 |
| | | | 350,473 |
TOTAL HEALTH CARE | | | 3,120,108 |
| INDUSTRIALS - 16.4% | | | |
| Aerospace & Defense - 0.7% | | | |
| Cadre Holdings, Inc. | | 1,357,247 | 46,133 |
| Huntington Ingalls Industries, Inc. | | 432,901 | 112,087 |
| Leonardo DRS, Inc. (a) | | 429,646 | 8,339 |
| Rheinmetall AG | | 27,069 | 9,502 |
| V2X, Inc. (a) | | 396,696 | 15,428 |
| | | | 191,489 |
| Air Freight & Logistics - 0.4% | | | |
| AIT Corp. | | 160,109 | 2,052 |
| Compania de Distribucion Integral Logista Holdings SA | | 1,039,283 | 29,472 |
| Hamakyorex Co. Ltd. (c) | | 1,229,088 | 34,223 |
| SENKO Co. Ltd. | | 492,973 | 3,854 |
| Sinotrans Ltd. (H Shares) | | 29,562,245 | 12,333 |
| Trancom Co. Ltd. (c) | | 813,169 | 38,537 |
| | | | 120,471 |
| Building Products - 0.8% | | | |
| Builders FirstSource, Inc. (a) | | 276,847 | 48,097 |
| Hayward Holdings, Inc. (a) | | 9,336,827 | 116,897 |
| Janus International Group, Inc. (a) | | 1,551,795 | 21,958 |
| Kondotec, Inc. (c) | | 1,579,624 | 13,140 |
| Nihon Dengi Co. Ltd. | | 305,522 | 11,359 |
| Nihon Flush Co. Ltd. | | 1,119,445 | 7,135 |
| Owens Corning | | 35,525 | 5,383 |
| Sekisui Jushi Corp. | | 128,791 | 2,218 |
| | | | 226,187 |
| Commercial Services & Supplies - 1.1% | | | |
| Aeon Delight Co. Ltd. | | 199,331 | 5,106 |
| AJIS Co. Ltd. (c) | | 848,862 | 15,215 |
| BIC SA | | 39,703 | 2,750 |
| Civeo Corp. (c) | | 817,993 | 18,159 |
| CoreCivic, Inc. (a) | | 3,316,073 | 47,155 |
| CTS Co. Ltd. | | 124,091 | 587 |
| Fursys, Inc. (c) | | 900,000 | 20,649 |
| Lion Rock Group Ltd. | | 18,279,240 | 2,435 |
| Mears Group PLC | | 250,525 | 1,089 |
| Mitie Group PLC | | 40,804,695 | 53,470 |
| Pilot Corp. | | 4,928 | 138 |
| Prestige International, Inc. | | 2,174,800 | 8,930 |
| Prosegur Compania de Seguridad SA (Reg.) | | 295,557 | 560 |
| S1 Corp. | | 326,880 | 13,961 |
| Takkt AG | | 576,594 | 8,425 |
| The GEO Group, Inc. (a)(b) | | 2,045,580 | 22,747 |
| VSE Corp. (c) | | 1,148,380 | 71,326 |
| | | | 292,702 |
| Construction & Engineering - 1.0% | | | |
| Boustead Singapore Ltd. | | 5,715,504 | 3,701 |
| Bowman Consulting Group Ltd. (a) | | 488,417 | 15,341 |
| Dai-Dan Co. Ltd. | | 197,202 | 2,189 |
| Daiichi Kensetsu Corp. | | 985,505 | 12,083 |
| EMCOR Group, Inc. | | 647,887 | 147,790 |
| Fuji Furukawa Engineering & Construction Co. Ltd. | | 14,955 | 559 |
| Geumhwa PSC Co. Ltd. (c) | | 316,299 | 6,007 |
| Meisei Industrial Co. Ltd. | | 397,171 | 3,130 |
| Mirait One Corp. | | 319,902 | 4,227 |
| Nippon Rietec Co. Ltd. | | 734,276 | 6,451 |
| Primoris Services Corp. | | 882,454 | 28,944 |
| Raiznext Corp. (c) | | 3,104,099 | 33,032 |
| Shinnihon Corp. | | 917,896 | 7,553 |
| Sinopec Engineering Group Co. Ltd. (H Shares) | | 97,595 | 49 |
| United Integrated Services Co. | | 300,800 | 2,662 |
| | | | 273,718 |
| Electrical Equipment - 1.4% | | | |
| Acuity Brands, Inc. | | 706,721 | 168,313 |
| Aichi Electric Co. Ltd. | | 383,667 | 10,239 |
| AQ Group AB | | 749,618 | 39,186 |
| Chiyoda Integre Co. Ltd. | | 267,207 | 5,000 |
| GrafTech International Ltd. (c) | | 18,172,650 | 24,170 |
| Hammond Power Solutions, Inc. Class A (b) | | 281,816 | 19,490 |
| Korea Electric Terminal Co. Ltd. | | 437,401 | 22,739 |
| nVent Electric PLC | | 512,471 | 30,769 |
| Sensata Technologies, Inc. PLC | | 315,457 | 11,410 |
| TKH Group NV (bearer) (depositary receipt) | | 902,182 | 36,484 |
| Vitzrocell Co. Ltd. | | 140,000 | 1,837 |
| | | | 369,637 |
| Ground Transportation - 0.6% | | | |
| Alps Logistics Co. Ltd. (c) | | 2,265,837 | 27,406 |
| Sakai Moving Service Co. Ltd. (c) | | 2,544,799 | 48,370 |
| Stef SA | | 235,918 | 30,850 |
| Universal Logistics Holdings, Inc. (c) | | 1,354,083 | 41,327 |
| | | | 147,953 |
| Industrial Conglomerates - 0.5% | | | |
| DCC PLC (United Kingdom) | | 1,659,242 | 121,035 |
| Mytilineos SA | | 591,385 | 24,286 |
| | | | 145,321 |
| Machinery - 3.3% | | | |
| Aalberts Industries NV | | 5,181,377 | 207,070 |
| Allison Transmission Holdings, Inc. | | 72,340 | 4,379 |
| Beijer Alma AB (B Shares) | | 1,436,921 | 25,323 |
| Crane Co. | | 1,067,858 | 132,532 |
| Daiwa Industries Ltd. | | 838,434 | 8,944 |
| EnPro Industries, Inc. | | 371,125 | 55,439 |
| ESAB Corp. | | 675,298 | 58,069 |
| Estic Corp. | | 369,608 | 2,312 |
| Foremost Income Fund (a) | | 2,141,103 | 10,535 |
| Haitian International Holdings Ltd. | | 6,602,351 | 14,696 |
| Hillenbrand, Inc. | | 2,886,263 | 134,413 |
| Hosokawa Micron Corp. | | 108,451 | 3,383 |
| Hy-Lok Corp. | | 102,000 | 1,899 |
| Hyster-Yale Materials Handling, Inc. Class A | | 161,229 | 10,596 |
| ITT, Inc. | | 533,980 | 64,494 |
| JOST Werke AG (d) | | 74,418 | 3,599 |
| Luxfer Holdings PLC sponsored | | 768,742 | 6,327 |
| Miller Industries, Inc. | | 315,585 | 12,702 |
| Mincon Group PLC | | 2,053,259 | 1,442 |
| Nadex Co. Ltd. (c) | | 756,817 | 5,492 |
| Precision Tsugami China Corp. Ltd. | | 384,198 | 453 |
| Semperit AG Holding | | 198,821 | 3,116 |
| Shinwa Co. Ltd. | | 86,492 | 1,444 |
| SIMPAC, Inc. | | 1,183,000 | 3,447 |
| Stabilus Se | | 70,473 | 4,954 |
| Takamatsu Machinery Co. Ltd. | | 201,637 | 719 |
| Takeuchi Manufacturing Co. Ltd. | | 443,473 | 15,161 |
| Timken Co. | | 503,381 | 41,232 |
| TK Group Holdings Ltd. | | 7,919,243 | 1,366 |
| Tocalo Co. Ltd. | | 2,822,112 | 30,019 |
| Trinity Industrial Corp. | | 805,224 | 5,600 |
| Yamada Corp. | | 54,274 | 1,949 |
| | | | 873,106 |
| Marine Transportation - 0.0% | | | |
| SITC International Holdings Co. Ltd. (b) | | 5,731,853 | 8,697 |
| Tokyo Kisen Co. Ltd. | | 301,665 | 1,301 |
| | | | 9,998 |
| Passenger Airlines - 0.1% | | | |
| Jet2 PLC | | 1,471,179 | 24,909 |
| Professional Services - 3.2% | | | |
| Altech Corp. | | 330,934 | 6,444 |
| Artner Co. Ltd. | | 243,439 | 3,615 |
| Barrett Business Services, Inc. | | 69,103 | 7,758 |
| CACI International, Inc. Class A (a) | | 325,653 | 111,937 |
| Careerlink Co. Ltd. | | 162,438 | 2,878 |
| Concentrix Corp. | | 1,659,069 | 147,441 |
| Creek & River Co. Ltd. | | 9,892 | 134 |
| E-Credible Co. Ltd. | | 250,349 | 2,465 |
| Gakujo Co. Ltd. | | 271,466 | 3,263 |
| Genpact Ltd. | | 4,555,807 | 163,553 |
| Hito Communications Holdings, Inc. | | 178,737 | 1,463 |
| HRnetgroup Ltd. | | 4,540,956 | 2,407 |
| IFIS Japan Ltd. | | 174,902 | 719 |
| KBR, Inc. | | 2,279,400 | 118,780 |
| Maximus, Inc. | | 1,463,253 | 118,699 |
| Open Up Group, Inc. | | 97,218 | 1,506 |
| Persol Holdings Co. Ltd. | | 10,103,626 | 16,062 |
| Quick Co. Ltd. (c) | | 1,037,583 | 18,429 |
| Science Applications International Corp. | | 357,940 | 45,695 |
| SS&C Technologies Holdings, Inc. | | 4,928 | 301 |
| Synergie SA | | 131,328 | 4,556 |
| Verra Mobility Corp. (a) | | 2,763,424 | 66,073 |
| WDB Holdings Co. Ltd. | | 650,860 | 10,250 |
| Will Group, Inc. | | 1,098,571 | 9,003 |
| | | | 863,431 |
| Trading Companies & Distributors - 3.2% | | | |
| AerCap Holdings NV (a) | | 214,663 | 16,435 |
| Alconix Corp. | | 1,372,498 | 13,227 |
| Alligo AB (B Shares) | | 239,714 | 3,050 |
| Beacon Roofing Supply, Inc. (a) | | 940,772 | 77,981 |
| Bergman & Beving AB (B Shares) | | 381,852 | 6,678 |
| Bossard Holding AG | | 60,850 | 14,596 |
| Chori Co. Ltd. | | 1,091,864 | 22,034 |
| Core & Main, Inc. (a) | | 2,914,477 | 120,397 |
| Ferguson PLC | | 572,976 | 107,639 |
| Global Industrial Co. | | 1,202,837 | 51,157 |
| Goodfellow, Inc. (c) | | 675,641 | 7,086 |
| Green Cross Co. Ltd. (c) | | 486,059 | 3,385 |
| Horizon Construction Development Ltd. | | 36,616 | 12 |
| Inaba Denki Sangyo Co. Ltd. | | 354,712 | 8,475 |
| Itochu Corp. | | 3,528,548 | 160,140 |
| Kamei Corp. | | 94,712 | 1,245 |
| KS Energy Services Ltd. (a)(e) | | 12,806,409 | 124 |
| Lumax International Corp. Ltd. | | 2,201,510 | 6,338 |
| Mitani Shoji Co. Ltd. | | 2,768,996 | 37,009 |
| Momentum Group Komponenter & Tjanster AB | | 1,577,263 | 20,688 |
| Parker Corp. (c) | | 2,108,816 | 11,739 |
| Richelieu Hardware Ltd. | | 689,357 | 22,263 |
| RS GROUP PLC | | 5,845,865 | 58,201 |
| Sanyo Trading Co. Ltd. | | 130,520 | 1,163 |
| Senshu Electric Co. Ltd. (c) | | 1,272,309 | 32,347 |
| Thermador Groupe SA | | 5,496 | 510 |
| Totech Corp. (c) | | 887,399 | 33,399 |
| Yamazen Co. Ltd. | | 128,100 | 1,095 |
| Yuasa Trading Co. Ltd. | | 360,258 | 12,003 |
| | | | 850,416 |
| Transportation Infrastructure - 0.1% | | | |
| Daito Koun Co. Ltd. | | 19,570 | 104 |
| Isewan Terminal Service Co. Ltd. | | 1,070,489 | 5,749 |
| Qingdao Port International Co. Ltd. (H Shares) (d) | | 16,260,016 | 9,101 |
| | | | 14,954 |
TOTAL INDUSTRIALS | | | 4,404,292 |
| INFORMATION TECHNOLOGY - 15.6% | | | |
| Electronic Equipment, Instruments & Components - 6.8% | | | |
| Advanced Energy Industries, Inc. | | 1,157,469 | 120,585 |
| Belden, Inc. | | 1,076,898 | 79,884 |
| CDW Corp. | | 733,343 | 166,264 |
| Crane Nxt Co. | | 2,169,947 | 126,465 |
| Daido Signal Co. Ltd. | | 40,041 | 115 |
| Daiwabo Holdings Co. Ltd. | | 1,372,343 | 29,841 |
| Dexerials Corp. | | 683,552 | 19,699 |
| Flex Ltd. (a) | | 2,730,590 | 64,824 |
| FLEXium Interconnect, Inc. | | 600,000 | 1,637 |
| Hon Hai Precision Industry Co. Ltd. (Foxconn) | | 31,404,012 | 102,751 |
| IDIS Holdings Co. Ltd. (c) | | 743,796 | 6,292 |
| Insight Enterprises, Inc. (a) | | 689,069 | 127,299 |
| Jabil, Inc. | | 728,783 | 91,309 |
| Kingboard Chemical Holdings Ltd. (c) | | 67,340,089 | 119,859 |
| Makus, Inc. | | 686,027 | 6,927 |
| Maruwa Ceramic Co. Ltd. | | 66,062 | 13,218 |
| Methode Electronics, Inc. Class A (c) | | 2,118,251 | 43,975 |
| Nippo Ltd. (c) | | 630,682 | 6,454 |
| PAX Global Technology Ltd. | | 44,442,338 | 31,060 |
| Redington (India) Ltd. | | 29,256,820 | 63,280 |
| Riken Keiki Co. Ltd. | | 124,390 | 6,146 |
| SAMT Co. Ltd. | | 100,000 | 200 |
| Shibaura Electronics Co. Ltd. | | 369,426 | 13,719 |
| Simplo Technology Co. Ltd. | | 6,990,000 | 90,477 |
| TD SYNNEX Corp. | | 2,406,553 | 240,607 |
| Test Research, Inc. | | 150,000 | 333 |
| Thinking Electronic Industries Co. Ltd. | | 4,124,000 | 20,913 |
| Tomen Devices Corp. | | 99,536 | 3,631 |
| Tripod Technology Corp. | | 3,548,000 | 21,190 |
| Vontier Corp. | | 3,764,003 | 130,197 |
| VSTECS Holdings Ltd. (c) | | 109,780,125 | 59,154 |
| Yageo Corp. | | 1,266,000 | 22,272 |
| | | | 1,830,577 |
| IT Services - 2.9% | | | |
| ALTEN | | 118,324 | 18,388 |
| Amdocs Ltd. | | 2,739,925 | 251,196 |
| Argo Graphics, Inc. | | 725,205 | 21,280 |
| Asahi Intelligence Service Co. | | 38,699 | 364 |
| Avant Group Corp. | | 225,934 | 2,206 |
| CDS Co. Ltd. | | 305,200 | 3,546 |
| Cognizant Technology Solutions Corp. Class A | | 2,163,167 | 166,823 |
| CSE Global Ltd. | | 24,703,996 | 7,424 |
| Densan System Holdings Co. Ltd. | | 75,514 | 1,514 |
| Dimerco Data System Corp. | | 994,799 | 4,274 |
| DTS Corp. | | 582,584 | 14,329 |
| Econocom Group SA | | 4,771,455 | 12,169 |
| Exclusive Networks SA (a) | | 106,253 | 2,170 |
| Future Corp. | | 376,552 | 4,469 |
| Gabia, Inc. (c) | | 900,000 | 11,595 |
| Himacs Ltd. | | 27,580 | 269 |
| Indra Sistemas SA | | 8,219,189 | 146,294 |
| Information Planning Co. | | 123,515 | 3,231 |
| Know IT AB | | 370,017 | 4,992 |
| Neurones | | 70,805 | 3,470 |
| Pole To Win Holdings, Inc. (b) | | 258,081 | 875 |
| Sopra Steria Group | | 350,359 | 82,466 |
| TDC Soft, Inc. | | 517,993 | 8,011 |
| TIS, Inc. | | 455,496 | 10,131 |
| | | | 781,486 |
| Semiconductors & Semiconductor Equipment - 2.9% | | | |
| ASMPT Ltd. | | 3,398,970 | 32,801 |
| Japan Material Co. Ltd. | | 97,271 | 1,644 |
| Machvision, Inc. | | 209,000 | 1,839 |
| Melexis NV | | 97,683 | 8,456 |
| Micron Technology, Inc. | | 1,595,014 | 136,772 |
| MKS Instruments, Inc. | | 1,649,537 | 175,593 |
| Novatek Microelectronics Corp. | | 100,000 | 1,629 |
| Parade Technologies Ltd. | | 936,000 | 33,214 |
| Powertech Technology, Inc. | | 10,000,000 | 46,437 |
| Renesas Electronics Corp. (a) | | 4,200,164 | 68,915 |
| Skyworks Solutions, Inc. | | 1,049,084 | 109,587 |
| Sumco Corp. | | 1,917,884 | 29,076 |
| Systems Technology, Inc. | | 150,100 | 2,981 |
| Taiwan Semiconductor Manufacturing Co. Ltd. | | 3,701,000 | 74,104 |
| Topco Scientific Co. Ltd. | | 7,819,593 | 46,855 |
| | | | 769,903 |
| Software - 0.3% | | | |
| Cresco Ltd. | | 665,758 | 8,633 |
| Focus Systems Corp. | | 87,426 | 628 |
| Fukui Computer Holdings, Inc. | | 197,084 | 3,479 |
| Hecto Innovation Co. Ltd. | | 500,074 | 5,322 |
| Jastec Co. Ltd. | | 264,471 | 2,447 |
| Justsystems Corp. | | 98,501 | 2,058 |
| KSK Co., Ltd. (c) | | 535,128 | 11,117 |
| Linedata Services | | 8,974 | 568 |
| NetGem SA | | 439,006 | 503 |
| NSW, Inc. | | 172,475 | 3,442 |
| Open Text Corp. | | 1,050,352 | 45,805 |
| Pro-Ship, Inc. | | 593,266 | 5,721 |
| System Research Co. Ltd. | | 135,335 | 2,738 |
| | | | 92,461 |
| Technology Hardware, Storage & Peripherals - 2.7% | | | |
| Dell Technologies, Inc. | | 1,867,709 | 154,796 |
| Elecom Co. Ltd. | | 542,141 | 6,305 |
| MCJ Co. Ltd. | | 2,651,901 | 22,237 |
| Samsung Electronics Co. Ltd. | | 1,884,000 | 102,372 |
| Seagate Technology Holdings PLC | | 4,795,411 | 410,871 |
| TSC Auto ID Technology Corp. (c) | | 2,544,911 | 18,377 |
| | | | 714,958 |
TOTAL INFORMATION TECHNOLOGY | | | 4,189,385 |
| MATERIALS - 5.4% | | | |
| Chemicals - 2.9% | | | |
| Axalta Coating Systems Ltd. (a) | | 3,887,131 | 126,021 |
| C. Uyemura & Co. Ltd. | | 739,108 | 56,087 |
| Celanese Corp. Class A | | 666,188 | 97,457 |
| EcoGreen International Group Ltd. (a)(c)(e) | | 52,196,039 | 3,171 |
| Element Solutions, Inc. | | 4,111,234 | 91,393 |
| Fujikura Kasei Co., Ltd. | | 658,540 | 2,042 |
| Gujarat Narmada Valley Fertilizers Co. | | 500,197 | 4,525 |
| Gujarat State Fertilizers & Chemicals Ltd. | | 10,160,536 | 36,587 |
| Huntsman Corp. | | 3,540,878 | 86,893 |
| Jcu Corp. | | 344,967 | 8,706 |
| KPX Chemical Co. Ltd. | | 110,852 | 3,591 |
| LyondellBasell Industries NV Class A | | 1,977,870 | 186,157 |
| Miwon Commercial Co. Ltd. | | 28,100 | 3,522 |
| Muto Seiko Co. Ltd. (b) | | 197,057 | 3,012 |
| Scientex Bhd | | 100,000 | 85 |
| Soulbrain Co. Ltd. | | 81,000 | 16,333 |
| Tronox Holdings PLC | | 3,326,329 | 45,870 |
| Yip's Chemical Holdings Ltd. | | 21,632,192 | 4,070 |
| | | | 775,522 |
| Construction Materials - 0.8% | | | |
| Buzzi SpA | | 394,414 | 13,435 |
| Eagle Materials, Inc. | | 371,185 | 83,992 |
| GCC S.A.B. de CV | | 332,291 | 3,838 |
| Mitani Sekisan Co. Ltd. | | 921,376 | 31,657 |
| RHI Magnesita NV | | 198,802 | 8,475 |
| SigmaRoc PLC (a) | | 15,679,505 | 12,916 |
| Vertex Corp. | | 29,725 | 358 |
| Wienerberger AG | | 1,632,420 | 55,536 |
| | | | 210,207 |
| Containers & Packaging - 0.7% | | | |
| Chuoh Pack Industry Co. Ltd. (c) | | 403,118 | 3,952 |
| Corticeira Amorim SGPS SA | | 1,476,167 | 15,076 |
| Groupe Guillin SA | | 135,437 | 4,457 |
| Kohsoku Corp. (c) | | 1,626,337 | 25,159 |
| Mayr-Melnhof Karton AG | | 183,922 | 24,329 |
| Packaging Corp. of America | | 578,964 | 96,039 |
| Silgan Holdings, Inc. | | 181,317 | 8,330 |
| The Pack Corp. (b)(c) | | 1,266,310 | 29,149 |
| | | | 206,491 |
| Metals & Mining - 0.5% | | | |
| Boliden AB | | 147,895 | 3,936 |
| CK-SAN-ETSU Co. Ltd. | | 28,533 | 759 |
| Hill & Smith Holdings PLC | | 507,170 | 12,045 |
| PRL Global Ltd. (e) | | 354,336 | 349 |
| Tohoku Steel Co. Ltd. | | 39,882 | 472 |
| Tokyo Tekko Co. Ltd. | | 396,486 | 13,885 |
| Warrior Metropolitan Coal, Inc. | | 1,473,579 | 94,560 |
| | | | 126,006 |
| Paper & Forest Products - 0.5% | | | |
| Miquel y Costas & Miquel SA | | 436,314 | 5,309 |
| Stella-Jones, Inc. | | 1,827,798 | 108,136 |
| Sylvamo Corp. | | 603,946 | 28,041 |
| Western Forest Products, Inc. | | 3,705,889 | 1,874 |
| | | | 143,360 |
TOTAL MATERIALS | | | 1,461,586 |
| REAL ESTATE - 0.9% | | | |
| Equity Real Estate Investment Trusts (REITs) - 0.0% | | | |
| Apple Hospitality (REIT), Inc. | | 213,824 | 3,434 |
| Mapletree Industrial (REIT) | | 4,732,046 | 8,619 |
| | | | 12,053 |
| Real Estate Management & Development - 0.9% | | | |
| Branicks Group AG (b) | | 1,165,692 | 2,683 |
| Instone Real Estate Group BV (d) | | 332,585 | 2,890 |
| Jones Lang LaSalle, Inc. (a) | | 748,028 | 132,446 |
| LSL Property Services PLC | | 1,224,339 | 4,112 |
| Real Matters, Inc. (a) | | 3,487,531 | 18,132 |
| Relo Group, Inc. | | 194,030 | 1,948 |
| Robinsons Land Corp. | | 31,101,290 | 8,830 |
| Savills PLC | | 4,049,821 | 51,991 |
| Selvaag Bolig ASA | | 506,207 | 1,519 |
| Servcorp Ltd. | | 904,722 | 1,943 |
| Tejon Ranch Co. (a) | | 410,775 | 6,482 |
| | | | 232,976 |
TOTAL REAL ESTATE | | | 245,029 |
| UTILITIES - 1.8% | | | |
| Electric Utilities - 1.6% | | | |
| Kansai Electric Power Co., Inc. | | 2,666,708 | 36,380 |
| PG&E Corp. | | 22,657,989 | 382,240 |
| Power Grid Corp. of India Ltd. | | 66,666 | 208 |
| Southern Co. | | 102,281 | 7,111 |
| | | | 425,939 |
| Gas Utilities - 0.1% | | | |
| China Resource Gas Group Ltd. | | 3,942,006 | 11,179 |
| Independent Power and Renewable Electricity Producers - 0.1% | | | |
| Mega First Corp. Bhd | | 32,943,659 | 27,015 |
| Vistra Corp. | | 142,001 | 5,826 |
| | | | 32,841 |
TOTAL UTILITIES | | | 469,959 |
| TOTAL COMMON STOCKS (Cost $18,537,490) | | | 26,523,550 |
| | | | |
| Nonconvertible Bonds - 0.0% |
| | | Principal Amount (f) (000s) | Value ($) (000s) |
| ENERGY - 0.0% | | | |
| Energy Equipment & Services - 0.0% | | | |
Bristow Group, Inc. 6.25% (e)(g) (Cost $0) | | 9,933 | 0 |
| | | | |
| Money Market Funds - 1.5% |
| | | Shares | Value ($) (000s) |
| Fidelity Cash Central Fund 5.39% (h) | | 289,771,644 | 289,830 |
| Fidelity Securities Lending Cash Central Fund 5.39% (h)(i) | | 119,248,133 | 119,260 |
| TOTAL MONEY MARKET FUNDS (Cost $409,058) | | | 409,090 |
| | | | |
| TOTAL INVESTMENT IN SECURITIES - 100.3% (Cost $18,946,548) | 26,932,640 |
NET OTHER ASSETS (LIABILITIES) - (0.3)% | (74,458) |
| NET ASSETS - 100.0% | 26,858,182 |
| | |
Any values shown as $0 in the Schedule of Investments may reflect amounts less than $500.
Legend
| (b) | Security or a portion of the security is on loan at period end. |
| (d) | Security exempt from registration under Rule 144A of the Securities Act of 1933. These securities may be resold in transactions exempt from registration, normally to qualified institutional buyers. At the end of the period, the value of these securities amounted to $58,215,000 or 0.2% of net assets. |
| (f) | Amount is stated in United States dollars unless otherwise noted. |
| (g) | Non-income producing - Security is in default. |
| (h) | Affiliated fund that is generally available only to investment companies and other accounts managed by Fidelity Investments. The rate quoted is the annualized seven-day yield of the fund at period end. A complete unaudited listing of the fund's holdings as of its most recent quarter end is available upon request. In addition, each Fidelity Central Fund's financial statements are available on the SEC's website or upon request. |
| (i) | Investment made with cash collateral received from securities on loan. |
Affiliated Central Funds
Fiscal year to date information regarding the Fund's investments in Fidelity Central Funds, including the ownership percentage, is presented below.
| Affiliate (Amounts in thousands) | Value, beginning of period ($) | Purchases ($) | Sales Proceeds ($) | Dividend Income ($) | Realized Gain (loss) ($) | Change in Unrealized appreciation (depreciation) ($) | Value, end of period ($) | % ownership, end of period |
| Fidelity Cash Central Fund 5.39% | 620,316 | 3,189,027 | 3,519,513 | 16,618 | - | - | 289,830 | 0.6% |
| Fidelity Securities Lending Cash Central Fund 5.39% | 341,398 | 925,611 | 1,147,749 | 250 | - | - | 119,260 | 0.5% |
| Total | 961,714 | 4,114,638 | 4,667,262 | 16,868 | - | - | 409,090 | |
| | | | | | | | | |
Amounts in the dividend income column in the above table include any capital gain distributions from underlying funds, which are presented in the corresponding line item in the Statement of Operations, if applicable.
Amounts in the dividend income column for Fidelity Securities Lending Cash Central Fund represents the income earned on investing cash collateral, less rebates paid to borrowers and any lending agent fees associated with the loan, plus any premium payments received for lending certain types of securities.
Amounts included in the purchases and sales proceeds columns may include in-kind transactions, if applicable.
Other Affiliated Issuers
An affiliated company is a company in which the Fund has ownership of at least 5% of the voting securities. Fiscal year to date transactions with companies which are or were affiliates are presented in the table below. Certain corporate actions, such as mergers, are excluded from the amounts in this table if applicable. A dash in the Value end of period ($) column means either the issuer is no longer held at period end, or the issuer is held at period end but is no longer an affiliate.
| Affiliate (Amounts in thousands) | Value, beginning of period ($) | Purchases ($) | Sales Proceeds ($) | Dividend Income ($) | Realized Gain (loss) ($) | Change in Unrealized appreciation (depreciation) ($) | Value, end of period ($) |
| AJIS Co. Ltd. | 14,379 | - | 100 | - | 43 | 893 | 15,215 |
| ASL Marine Holdings Ltd. | 1,762 | - | 1,643 | - | (14,400) | 14,281 | - |
| ASTI Corp. | 5,785 | - | 1,745 | - | 721 | (601) | 4,160 |
| Adams Resources & Energy, Inc. | 5,248 | - | 3,967 | 53 | 2,185 | (3,061) | - |
| Aichi Electric Co. Ltd. | 12,622 | - | 2,553 | 217 | 361 | (191) | - |
| Alconix Corp. | 23,775 | - | 8,943 | 371 | 956 | (2,561) | - |
| Alps Logistics Co. Ltd. | 25,224 | - | 194 | 303 | 130 | 2,246 | 27,406 |
| BMTC Group, Inc. | 40,069 | - | 487 | 373 | 465 | (10,412) | 29,635 |
| Belc Co. Ltd. | 76,992 | - | 10,571 | 500 | 6,219 | (13,474) | 59,166 |
| Belluna Co. Ltd. | 30,642 | - | 18,820 | 363 | 1,095 | (5,633) | - |
| Berry Corp. | 34,552 | 124 | 2,337 | 1,490 | (1,426) | (3,137) | 27,776 |
| CDS Co. Ltd. | 4,836 | - | 1,005 | 70 | (183) | (102) | - |
| CSE Global Ltd. | 14,462 | - | 4,890 | 368 | (9,070) | 6,922 | - |
| Carr's Group PLC | 11,074 | 85 | 62 | 303 | 5 | (1,469) | 9,633 |
| Cell Biotech Co. Ltd. | 4,598 | - | 975 | 138 | (1,510) | 1,359 | - |
| Chase Corp. | 78,351 | - | 78,403 | - | 59,138 | (59,086) | - |
| Chori Co. Ltd. | 29,117 | - | 6,269 | 495 | 1,512 | (2,325) | - |
| Chuoh Pack Industry Co. Ltd. | 3,714 | - | 28 | 73 | 10 | 256 | 3,952 |
| Civeo Corp. | 15,279 | 944 | 131 | 332 | 16 | 2,051 | 18,159 |
| Create SD Holdings Co. Ltd. | 120,041 | - | 37,138 | 665 | 24,904 | (39,848) | - |
| Daewon Pharmaceutical Co. Ltd. | 25,677 | - | - | 484 | - | (2,221) | 23,456 |
| Daito Pharmaceutical Co. Ltd. | 16,812 | - | 13,676 | 101 | (12,181) | 10,222 | - |
| DongKook Pharmaceutical Co. Ltd. | 26,400 | - | 11,668 | 165 | 7,978 | (3,718) | - |
| EcoGreen International Group Ltd. | 10,249 | - | 72 | - | 5 | (7,011) | 3,171 |
| First Juken Co. Ltd. | 10,494 | - | 74 | 179 | 2 | (360) | 10,062 |
| First of Long Island Corp. | 17,154 | - | 15,097 | 215 | (10,510) | 8,453 | - |
| Food Empire Holdings Ltd. | 24,699 | - | 7,887 | - | 5,201 | (880) | - |
| Fresh Del Monte Produce, Inc. | 64,093 | - | 60,350 | 461 | 3,477 | (7,220) | - |
| Fujikura Kasei Co., Ltd. | 5,840 | - | 3,431 | 83 | (2,990) | 2,624 | - |
| Fursys, Inc. | 21,272 | - | - | 639 | - | (623) | 20,649 |
| Gabia, Inc. | 8,502 | - | - | 41 | - | 3,093 | 11,595 |
| Genky DrugStores Co. Ltd. | 35,102 | - | 273 | 75 | 230 | 9,777 | 44,836 |
| Geumhwa PSC Co. Ltd. | 8,467 | - | 862 | 277 | (591) | (1,007) | 6,007 |
| Goodfellow, Inc. | 7,222 | - | 52 | 211 | 38 | (122) | 7,086 |
| GrafTech International Ltd. | 94,145 | 3,844 | 2,161 | - | (3,433) | (68,225) | 24,170 |
| Green Cross Co. Ltd. | 3,542 | - | 25 | - | 1 | (133) | 3,385 |
| Halows Co. Ltd. | 38,104 | - | 318 | 180 | 249 | 5,084 | 43,119 |
| Hamakyorex Co. Ltd. | 34,161 | 2 | 253 | 411 | 126 | 187 | 34,223 |
| Handsome Co. Ltd. | 22,736 | - | - | 678 | - | (3,198) | 19,538 |
| Helen of Troy Ltd. | 139,035 | 47,829 | 1,113 | - | 1,070 | (26,630) | 160,191 |
| Hoshi Iryo-Sanki Co. Ltd. | 6,033 | - | 5,717 | 43 | 1,459 | (1,775) | - |
| Huons Co. Ltd. | 21,618 | - | - | 353 | - | 356 | 21,974 |
| Hyster-Yale Materials Handling, Inc. Class A | 9,475 | 601 | 15,727 | 123 | 4,755 | 4,280 | - |
| Hyster-Yale Materials Handling, Inc. Class B | 14,806 | - | - | 101 | - | (7,593) | - |
| IA Group Corp. | 3,243 | - | 364 | 46 | (180) | (20) | 2,679 |
| IDIS Holdings Co. Ltd. | 7,513 | - | 491 | 124 | (614) | (116) | 6,292 |
| InBody Co. Ltd. | 16,288 | - | - | 144 | - | (2,525) | 13,763 |
| JLM Couture, Inc. | 165 | - | 5 | - | (864) | 704 | - |
| Jumbo SA | 279,752 | - | 68,778 | 13,825 | 43,035 | (56,927) | 197,082 |
| KSK Co., Ltd. | 9,417 | - | 75 | - | 54 | 1,721 | 11,117 |
| Kingboard Chemical Holdings Ltd. | 187,900 | - | 1,179 | 5,715 | 890 | (67,752) | 119,859 |
| Kohsoku Corp. | 24,624 | - | 174 | 237 | 109 | 600 | 25,159 |
| Kondotec, Inc. | 13,513 | - | 94 | 192 | 74 | (353) | 13,140 |
| Kwang Dong Pharmaceutical Co. Ltd. | 20,990 | - | - | 269 | - | 1,612 | 22,602 |
| Maruzen Co. Ltd. | 21,492 | - | 21,919 | 293 | 14,160 | (13,733) | - |
| Methode Electronics, Inc. Class A | 53,335 | 11,799 | 318 | 519 | (28) | (20,813) | 43,975 |
| Mi Chang Oil Industrial Co. Ltd. | 8,969 | - | - | 281 | - | 685 | 9,654 |
| Motonic Corp. | 14,377 | - | 1,729 | 562 | (113) | (1,483) | 11,052 |
| Murakami Corp. | 16,590 | - | 17,051 | 248 | 9,636 | (9,175) | - |
| Nadex Co. Ltd. | 5,837 | - | 43 | 51 | 21 | (323) | 5,492 |
| Nafco Co. Ltd. | 24,640 | - | 179 | 325 | 10 | 3,489 | 27,960 |
| Nippo Ltd. | 4,873 | - | 44 | - | 28 | 1,597 | 6,454 |
| Parker Corp. | 11,036 | - | 84 | 141 | 59 | 728 | 11,739 |
| Prim SA | 16,340 | - | 116 | 139 | 27 | (1,252) | 14,999 |
| Quick Co. Ltd. | 17,892 | - | 127 | 227 | 45 | 619 | 18,429 |
| Raiznext Corp. | 32,006 | - | 237 | 566 | 63 | 1,200 | 33,032 |
| Rocky Mountain Chocolate Factory, Inc. | 2,665 | - | 15 | - | (1) | (862) | 1,787 |
| SJM Co. Ltd. | 4,178 | - | 3,596 | 15 | (1,073) | 491 | - |
| SNT Holdings Co. Ltd. | 10,959 | - | - | 229 | - | 1,816 | 12,775 |
| Sakai Moving Service Co. Ltd. | 48,117 | - | 348 | 232 | 261 | 340 | 48,370 |
| Sally Beauty Holdings, Inc. | 99,191 | 1,955 | 2,407 | - | (1,894) | 4,579 | 101,424 |
| Sanei Architecture Planning Co. Ltd. | 18,021 | - | 23,152 | - | 6,700 | (1,569) | - |
| Sarantis SA | 33,067 | - | 1,618 | - | 551 | 3,608 | 35,608 |
| Senshu Electric Co. Ltd. | 38,862 | - | 2,465 | 503 | 1,582 | (5,632) | 32,347 |
| Societe Pour L'Informatique Industrielle SA | 88,564 | - | 117,505 | 796 | 108,084 | (79,143) | - |
| Sportsman's Warehouse Holdings, Inc. | 2,616 | 11,058 | 95 | - | 27 | (2,765) | 10,841 |
| Step Co. Ltd. | 11,518 | - | 6,448 | 227 | 3,455 | (2,886) | - |
| Sun Hing Vision Group Holdings Ltd. | 1,732 | - | 38 | 69 | (137) | 142 | 1,699 |
| Sunjin Co. Ltd. | 14,707 | - | 2,997 | 113 | (2,953) | (173) | 8,584 |
| TSC Auto ID Technology Corp. | 20,945 | - | - | (15) | - | (2,568) | 18,377 |
| The Pack Corp. | 29,772 | - | 217 | 348 | 79 | (485) | 29,149 |
| Tohoku Steel Co. Ltd. | 7,604 | - | 6,720 | 36 | (437) | 25 | - |
| Tokyo Kisen Co. Ltd. | 2,375 | - | 1,011 | - | (184) | 120 | - |
| Tokyo Tekko Co. Ltd. | 17,974 | - | 8,662 | 221 | 2,811 | 1,761 | - |
| Tomen Devices Corp. | 14,861 | - | 11,217 | - | 2,800 | (2,813) | - |
| Totech Corp. | 33,307 | - | 224 | 329 | 186 | 130 | 33,399 |
| Trancom Co. Ltd. | 40,598 | - | 302 | 326 | 295 | (2,054) | 38,537 |
| Universal Logistics Holdings, Inc. | 39,325 | 3,976 | 1,556 | 282 | (39) | (379) | 41,327 |
| Utah Medical Products, Inc. | 21,109 | - | 132 | 128 | 120 | (4,218) | 16,879 |
| VSE Corp. | 62,187 | - | 520 | 230 | 412 | 9,247 | 71,326 |
| VSTECS Holdings Ltd. | 56,564 | - | 994 | - | 589 | 2,995 | 59,154 |
| WIN-Partners Co. Ltd. | 16,006 | - | 126 | - | 81 | 2,003 | 17,964 |
| Whanin Pharmaceutical Co. Ltd. | 16,151 | - | 5,601 | 197 | 3,255 | (2,867) | 10,938 |
| Wolverine World Wide, Inc. | 48,342 | 11,943 | 300 | 906 | (48) | (16,212) | 43,725 |
| World Holdings Co. Ltd. | 18,967 | - | 16,598 | 43 | (3,155) | 786 | - |
| Youngone Holdings Co. Ltd. | 45,318 | - | - | 742 | - | 263 | 45,581 |
| Yutaka Giken Co. Ltd. | 16,837 | - | 4,406 | 287 | (3,405) | 7,344 | 16,370 |
| Total | 2,891,391 | 94,160 | 651,294 | 41,082 | 250,431 | (451,025) | 1,919,204 |
Amounts included in the purchases and sales proceeds columns may include in-kind transactions, if applicable.
Investment Valuation
The following is a summary of the inputs used, as of January 31, 2024, involving the Fund's assets and liabilities carried at fair value. The inputs or methodology used for valuing securities may not be an indication of the risk associated with investing in those securities. For more information on valuation inputs, and their aggregation into the levels used below, please refer to the Investment Valuation section in the accompanying Notes to Financial Statements.
| Valuation Inputs at Reporting Date: |
Description (Amounts in thousands) | Total ($) | Level 1 ($) | Level 2 ($) | Level 3 ($) |
Investments in Securities: | | | | |
|
| Equities: | | | | |
Communication Services | 319,902 | 257,129 | 62,773 | - |
Consumer Discretionary | 3,910,232 | 3,378,047 | 531,874 | 311 |
Consumer Staples | 1,762,145 | 1,221,246 | 540,897 | 2 |
Energy | 2,389,301 | 2,058,060 | 331,241 | - |
Financials | 4,251,611 | 4,092,307 | 159,304 | - |
Health Care | 3,120,108 | 2,574,627 | 545,481 | - |
Industrials | 4,404,292 | 3,460,442 | 943,726 | 124 |
Information Technology | 4,189,385 | 2,922,328 | 1,267,057 | - |
Materials | 1,461,586 | 1,214,115 | 243,951 | 3,520 |
Real Estate | 245,029 | 223,689 | 21,340 | - |
Utilities | 469,959 | 395,177 | 74,782 | - |
|
| Corporate Bonds | - | - | - | - |
|
| Money Market Funds | 409,090 | 409,090 | - | - |
| Total Investments in Securities: | 26,932,640 | 22,206,257 | 4,722,426 | 3,957 |
| Statement of Assets and Liabilities |
| Amounts in thousands (except per-share amounts) | | | | January 31, 2024 (Unaudited) |
| | | | | |
| Assets | | | | |
| Investment in securities, at value (including securities loaned of $112,453) - See accompanying schedule: | | | | |
Unaffiliated issuers (cost $17,145,919) | $ | 24,604,346 | | |
Fidelity Central Funds (cost $409,058) | | 409,090 | | |
Other affiliated issuers (cost $1,391,571) | | 1,919,204 | | |
| | | | | |
| | | | | |
| Total Investment in Securities (cost $18,946,548) | | | $ | 26,932,640 |
| Cash | | | | 8 |
| Foreign currency held at value (cost $2,657) | | | | 2,657 |
| Receivable for investments sold | | | | 82,070 |
| Receivable for fund shares sold | | | | 7,122 |
| Dividends receivable | | | | 28,387 |
| Distributions receivable from Fidelity Central Funds | | | | 1,783 |
| Prepaid expenses | | | | 23 |
| Other receivables | | | | 2,230 |
Total assets | | | | 27,056,920 |
| Liabilities | | | | |
| Payable for investments purchased | $ | 24,371 | | |
| Payable for fund shares redeemed | | 14,378 | | |
| Accrued management fee | | 17,763 | | |
| Other affiliated payables | | 2,716 | | |
| Deferred taxes | | 17,996 | | |
| Other payables and accrued expenses | | 2,311 | | |
| Collateral on securities loaned | | 119,203 | | |
| Total Liabilities | | | | 198,738 |
| Net Assets | | | $ | 26,858,182 |
| Net Assets consist of: | | | | |
| Paid in capital | | | $ | 17,652,486 |
| Total accumulated earnings (loss) | | | | 9,205,696 |
| Net Assets | | | $ | 26,858,182 |
| | | | | |
| Net Asset Value and Maximum Offering Price | | | | |
| Low-Priced Stock : | | | | |
Net Asset Value, offering price and redemption price per share ($23,756,894 ÷ 544,153 shares) | | | $ | 43.66 |
| Class K : | | | | |
Net Asset Value, offering price and redemption price per share ($3,101,288 ÷ 71,156 shares) | | | $ | 43.58 |
| Statement of Operations |
| Amounts in thousands | | | | Six months ended January 31, 2024 (Unaudited) |
| Investment Income | | | | |
| Dividends (including $41,082 earned from affiliated issuers) | | | $ | 276,934 |
| Interest | | | | 19 |
| Income from Fidelity Central Funds (including $250 from security lending) | | | | 16,868 |
| Total Income | | | | 293,821 |
| Expenses | | | | |
| Management fee | | | | |
| Basic fee | $ | 75,787 | | |
| Performance adjustment | | 29,567 | | |
| Transfer agent fees | | 15,228 | | |
| Accounting fees | | 893 | | |
| Custodian fees and expenses | | 920 | | |
| Independent trustees' fees and expenses | | 78 | | |
| Registration fees | | 70 | | |
| Audit | | 228 | | |
| Legal | | 27 | | |
| Miscellaneous | | 47 | | |
| Total expenses before reductions | | 122,845 | | |
| Expense reductions | | (1,142) | | |
| Total expenses after reductions | | | | 121,703 |
| Net Investment income (loss) | | | | 172,118 |
| Realized and Unrealized Gain (Loss) | | | | |
| Net realized gain (loss) on: | | | | |
| Investment Securities: | | | | |
| Unaffiliated issuers (net of foreign taxes of $859) | | 1,349,716 | | |
| Redemptions in-kind | | 936,580 | | |
| Affiliated issuers | | 250,431 | | |
| Foreign currency transactions | | (984) | | |
| Total net realized gain (loss) | | | | 2,535,743 |
| Change in net unrealized appreciation (depreciation) on: | | | | |
| Investment Securities: | | | | |
| Unaffiliated issuers(net of increase in deferred foreign taxes of $8,824) | | (1,045,079) | | |
| Affiliated issuers | | (451,025) | | |
| Assets and liabilities in foreign currencies | | 387 | | |
| Total change in net unrealized appreciation (depreciation) | | | | (1,495,717) |
| Net gain (loss) | | | | 1,040,026 |
| Net increase (decrease) in net assets resulting from operations | | | $ | 1,212,144 |
| Statement of Changes in Net Assets |
| |
| Amount in thousands | | Six months ended January 31, 2024 (Unaudited) | | Year ended July 31, 2023 |
| Increase (Decrease) in Net Assets | | | | |
| Operations | | | | |
| Net investment income (loss) | $ | 172,118 | $ | 446,838 |
| Net realized gain (loss) | | 2,535,743 | | 5,156,289 |
| Change in net unrealized appreciation (depreciation) | | (1,495,717) | | (2,788,534) |
| Net increase (decrease) in net assets resulting from operations | | 1,212,144 | | 2,814,593 |
| Distributions to shareholders | | (4,564,405) | | (2,504,391) |
| | | | | |
| Share transactions - net increase (decrease) | | 2,084,099 | | (543,038) |
| Total increase (decrease) in net assets | | (1,268,162) | | (232,836) |
| | | | | |
| Net Assets | | | | |
| Beginning of period | | 28,126,344 | | 28,359,180 |
| End of period | $ | 26,858,182 | $ | 28,126,344 |
| | | | | |
| | | | | |
Financial Highlights
| Fidelity® Low-Priced Stock Fund |
| |
| | Six months ended (Unaudited) January 31, 2024 | | Years ended July 31, 2023 | | 2022 | | 2021 | | 2020 | | 2019 |
Selected Per-Share Data | | | | | | | | | | | | |
| Net asset value, beginning of period | $ | 49.91 | $ | 49.42 | $ | 58.05 | $ | 44.78 | $ | 49.03 | $ | 55.65 |
| Income from Investment Operations | | | | | | | | | | | | |
Net investment income (loss) A,B | | .28 | | .75 | | .74 | | .58 | | .73 | | .91 |
| Net realized and unrealized gain (loss) | | 1.53 | | 4.11 | | (2.86) | | 18.11 | | (.91) | | (1.69) |
| Total from investment operations | | 1.81 | | 4.86 | | (2.12) | | 18.69 | | (.18) | | (.78) |
| Distributions from net investment income | | (.89) | | (.55) | | (.83) | | (.86) | | (.89) | | (.84) |
| Distributions from net realized gain | | (7.17) | | (3.81) | | (5.68) | | (4.56) | | (3.19) | | (5.00) |
| Total distributions | | (8.06) | | (4.37) C | | (6.51) | | (5.42) | | (4.07) C | | (5.84) |
| Net asset value, end of period | $ | 43.66 | $ | 49.91 | $ | 49.42 | $ | 58.05 | $ | 44.78 | $ | 49.03 |
Total Return D,E | | 4.84% | | 10.78% | | (4.16)% | | 45.83% | | (.48)% | | (1.20)% |
Ratios to Average Net Assets B,F,G | | | | | | | | | | | | |
| Expenses before reductions | | .94% H | | .92% | | .82% | | .65% | | .78% | | .52% |
| Expenses net of fee waivers, if any | | .93% H | | .92% | | .82% | | .64% | | .78% | | .52% |
| Expenses net of all reductions | | .93% H | | .92% | | .82% | | .64% | | .78% | | .51% |
| Net investment income (loss) | | 1.29% H | | 1.61% | | 1.41% | | 1.12% | | 1.64% | | 1.86% |
| Supplemental Data | | | | | | | | | | | | |
| Net assets, end of period (in millions) | $ | 23,757 | $ | 24,755 | $ | 24,633 | $ | 28,251 | $ | 19,517 | $ | 24,047 |
Portfolio turnover rate I | | 22% H,J | | 39% | | 14% | | 21% | | 9% K | | 17% |
ACalculated based on average shares outstanding during the period.
BNet investment income (loss) is affected by the timing of the declaration of dividends by any underlying mutual funds or exchange-traded funds (ETFs). Net investment income (loss) of any mutual funds or ETFs is not included in the Fund's net investment income (loss) ratio.
CTotal distributions per share do not sum due to rounding.
DTotal returns for periods of less than one year are not annualized.
ETotal returns would have been lower if certain expenses had not been reduced during the applicable periods shown.
FFees and expenses of any underlying mutual funds or exchange-traded funds (ETFs) are not included in the Fund's expense ratio. The Fund indirectly bears its proportionate share of these expenses. For additional expense information related to investments in Fidelity Central Funds, please refer to the "Investments in Fidelity Central Funds" note found in the Notes to Financial Statements section of the most recent Annual or Semi-Annual report.
GExpense ratios reflect operating expenses of the class. Expenses before reductions do not reflect amounts reimbursed, waived, or reduced through arrangements with the investment adviser, brokerage services, or other offset arrangements, if applicable, and do not represent the amount paid by the class during periods when reimbursements, waivers or reductions occur.
HAnnualized.
IAmount does not include the portfolio activity of any underlying mutual funds or exchange-traded funds (ETFs).
JPortfolio turnover rate excludes securities received or delivered in-kind.
KThe portfolio turnover rate does not include the assets acquired in the merger.
| Fidelity® Low-Priced Stock Fund Class K |
| |
| | Six months ended (Unaudited) January 31, 2024 | | Years ended July 31, 2023 | | 2022 | | 2021 | | 2020 | | 2019 |
Selected Per-Share Data | | | | | | | | | | | | |
| Net asset value, beginning of period | $ | 49.86 | $ | 49.38 | $ | 58.00 | $ | 44.75 | $ | 49.01 | $ | 55.63 |
| Income from Investment Operations | | | | | | | | | | | | |
Net investment income (loss) A,B | | .30 | | .79 | | .79 | | .62 | | .77 | | .96 |
| Net realized and unrealized gain (loss) | | 1.52 | | 4.09 | | (2.85) | | 18.09 | | (.91) | | (1.69) |
| Total from investment operations | | 1.82 | | 4.88 | | (2.06) | | 18.71 | | (.14) | | (.73) |
| Distributions from net investment income | | (.93) | | (.59) | | (.88) | | (.90) | | (.93) | | (.89) |
| Distributions from net realized gain | | (7.17) | | (3.81) | | (5.68) | | (4.56) | | (3.19) | | (5.00) |
| Total distributions | | (8.10) | | (4.40) | | (6.56) | | (5.46) | | (4.12) | | (5.89) |
| Net asset value, end of period | $ | 43.58 | $ | 49.86 | $ | 49.38 | $ | 58.00 | $ | 44.75 | $ | 49.01 |
Total Return C,D | | 4.87% | | 10.86% | | (4.07)% | | 45.94% | | (.41)% | | (1.10)% |
Ratios to Average Net Assets B,E,F | | | | | | | | | | | | |
| Expenses before reductions | | .86% G | | .84% | | .74% | | .56% | | .69% | | .43% |
| Expenses net of fee waivers, if any | | .85% G | | .84% | | .74% | | .56% | | .69% | | .43% |
| Expenses net of all reductions | | .85% G | | .84% | | .74% | | .56% | | .69% | | .43% |
| Net investment income (loss) | | 1.37% G | | 1.69% | | 1.49% | | 1.20% | | 1.72% | | 1.95% |
| Supplemental Data | | | | | | | | | | | | |
| Net assets, end of period (in millions) | $ | 3,101 | $ | 3,371 | $ | 3,726 | $ | 5,426 | $ | 4,294 | $ | 5,776 |
Portfolio turnover rate H | | 22% G,I | | 39% | | 14% | | 21% | | 9% J | | 17% |
ACalculated based on average shares outstanding during the period.
BNet investment income (loss) is affected by the timing of the declaration of dividends by any underlying mutual funds or exchange-traded funds (ETFs). Net investment income (loss) of any mutual funds or ETFs is not included in the Fund's net investment income (loss) ratio.
CTotal returns for periods of less than one year are not annualized.
DTotal returns would have been lower if certain expenses had not been reduced during the applicable periods shown.
EFees and expenses of any underlying mutual funds or exchange-traded funds (ETFs) are not included in the Fund's expense ratio. The Fund indirectly bears its proportionate share of these expenses. For additional expense information related to investments in Fidelity Central Funds, please refer to the "Investments in Fidelity Central Funds" note found in the Notes to Financial Statements section of the most recent Annual or Semi-Annual report.
FExpense ratios reflect operating expenses of the class. Expenses before reductions do not reflect amounts reimbursed, waived, or reduced through arrangements with the investment adviser, brokerage services, or other offset arrangements, if applicable, and do not represent the amount paid by the class during periods when reimbursements, waivers or reductions occur.
GAnnualized.
HAmount does not include the portfolio activity of any underlying mutual funds or exchange-traded funds (ETFs).
IPortfolio turnover rate excludes securities received or delivered in-kind.
JThe portfolio turnover rate does not include the assets acquired in the merger.
For the period ended January 31, 2024
(Amounts in thousands except percentages)
1. Organization.
Fidelity Low-Priced Stock Fund (the Fund) is a fund of Fidelity Puritan Trust (the Trust) and is authorized to issue an unlimited number of shares. The Trust is registered under the Investment Company Act of 1940, as amended (the 1940 Act), as an open-end management investment company organized as a Massachusetts business trust. The Fund offers Low-Priced Stock and Class K shares, each of which has equal rights as to assets and voting privileges. Each class has exclusive voting rights with respect to matters that affect that class. The Fund's investments in emerging markets can be subject to social, economic, regulatory, and political uncertainties and can be extremely volatile.
2. Investments in Fidelity Central Funds.
Funds may invest in Fidelity Central Funds, which are open-end investment companies generally available only to other investment companies and accounts managed by the investment adviser and its affiliates. The Schedule of Investments lists any Fidelity Central Funds held as an investment as of period end, but does not include the underlying holdings of each Fidelity Central Fund. An investing fund indirectly bears its proportionate share of the expenses of the underlying Fidelity Central Funds.
Based on its investment objective, each Fidelity Central Fund may invest or participate in various investment vehicles or strategies that are similar to those of the investing fund. These strategies are consistent with the investment objectives of the investing fund and may involve certain economic risks which may cause a decline in value of each of the Fidelity Central Funds and thus a decline in the value of the investing fund.
| Fidelity Central Fund | Investment Manager | Investment Objective | Investment Practices | Expense RatioA |
| Fidelity Money Market Central Funds | Fidelity Management & Research Company LLC (FMR) | Each fund seeks to obtain a high level of current income consistent with the preservation of capital and liquidity. | Short-term Investments | Less than .005% |
A Expenses expressed as a percentage of average net assets and are as of each underlying Central Fund's most recent annual or semi-annual shareholder report.
A complete unaudited list of holdings for each Fidelity Central Fund is available upon request or at the Securities and Exchange Commission website at www.sec.gov. In addition, the financial statements of the Fidelity Central Funds which contain the significant accounting policies (including investment valuation policies) of those funds, and are not covered by the Report of Independent Registered Public Accounting Firm, are available on the Securities and Exchange Commission website or upon request.
3. Significant Accounting Policies.
The Fund is an investment company and applies the accounting and reporting guidance of the Financial Accounting Standards Board (FASB) Accounting Standards Codification Topic 946 Financial Services - Investment Companies. The financial statements have been prepared in conformity with accounting principles generally accepted in the United States of America (GAAP), which require management to make certain estimates and assumptions at the date of the financial statements. Actual results could differ from those estimates. Subsequent events, if any, through the date that the financial statements were issued have been evaluated in the preparation of the financial statements. The Fund's Schedule of Investments lists any underlying mutual funds or exchange-traded funds (ETFs) but does not include the underlying holdings of these funds. The following summarizes the significant accounting policies of the Fund:
Investment Valuation. Investments are valued as of 4:00 p.m. Eastern time on the last calendar day of the period. The Board of Trustees (the Board) has designated the Fund's investment adviser as the valuation designee responsible for the fair valuation function and performing fair value determinations as needed. The investment adviser has established a Fair Value Committee (the Committee) to carry out the day-to-day fair valuation responsibilities and has adopted policies and procedures to govern the fair valuation process and the activities of the Committee. In accordance with these fair valuation policies and procedures, which have been approved by the Board, the Fund attempts to obtain prices from one or more third party pricing services or brokers to value its investments. When current market prices, quotations or currency exchange rates are not readily available or reliable, investments will be fair valued in good faith by the Committee, in accordance with the policies and procedures. Factors used in determining fair value vary by investment type and may include market or investment specific events, transaction data, estimated cash flows, and market observations of comparable investments. The frequency that the fair valuation procedures are used cannot be predicted and they may be utilized to a significant extent. The Committee manages the Fund's fair valuation practices and maintains the fair valuation policies and procedures. The Fund's investment adviser reports to the Board information regarding the fair valuation process and related material matters.
The Fund categorizes the inputs to valuation techniques used to value its investments into a disclosure hierarchy consisting of three levels as shown below:
Level 1 - unadjusted quoted prices in active markets for identical investments
Level 2 - other significant observable inputs (including quoted prices for similar investments, interest rates, prepayment speeds, etc.)
Level 3 - unobservable inputs (including the Fund's own assumptions based on the best information available)
Valuation techniques used to value the Fund's investments by major category are as follows:
Equity securities, including restricted securities, for which market quotations are readily available, are valued at the last reported sale price or official closing price as reported by a third party pricing service on the primary market or exchange on which they are traded and are categorized as Level 1 in the hierarchy. In the event there were no sales during the day or closing prices are not available, securities are valued at the last quoted bid price or may be valued using the last available price and are generally categorized as Level 2 in the hierarchy. For foreign equity securities, when market or security specific events arise, comparisons to the valuation of American Depositary Receipts (ADRs), futures contracts, ETFs and certain indexes as well as quoted prices for similar securities may be used and would be categorized as Level 2 in the hierarchy. For equity securities, including restricted securities, where observable inputs are limited, assumptions about market activity and risk are used and these securities may be categorized as Level 3 in the hierarchy.
Debt securities, including restricted securities, are valued based on evaluated prices received from third party pricing services or from brokers who make markets in such securities. Corporate bonds are valued by pricing services who utilize matrix pricing which considers yield or price of bonds of comparable quality, coupon, maturity and type or by broker-supplied prices. When independent prices are unavailable or unreliable, debt securities may be valued utilizing pricing methodologies which consider similar factors that would be used by third party pricing services. Debt securities are generally categorized as Level 2 in the hierarchy but may be Level 3 depending on the circumstances.
Investments in open-end mutual funds, including the Fidelity Central Funds, are valued at their closing net asset value (NAV) each business day and are categorized as Level 1 in the hierarchy.
Changes in valuation techniques may result in transfers in or out of an assigned level within the disclosure hierarchy. The aggregate value of investments by input level as of January 31, 2024 is included at the end of the Fund's Schedule of Investments.
Foreign Currency. Certain Funds may use foreign currency contracts to facilitate transactions in foreign-denominated securities. Gains and losses from these transactions may arise from changes in the value of the foreign currency or if the counterparties do not perform under the contracts' terms.
Foreign-denominated assets, including investment securities, and liabilities are translated into U.S. dollars at the exchange rates at period end. Purchases and sales of investment securities, income and dividends received, and expenses denominated in foreign currencies are translated into U.S. dollars at the exchange rate in effect on the transaction date.
The effects of exchange rate fluctuations on investments are included with the net realized and unrealized gain (loss) on investment securities. Other foreign currency transactions resulting in realized and unrealized gain (loss) are disclosed separately.
Investment Transactions and Income. For financial reporting purposes, the Fund's investment holdings and NAV include trades executed through the end of the last business day of the period. The NAV per share for processing shareholder transactions is calculated as of the close of business of the New York Stock Exchange (NYSE), normally 4:00 p.m. Eastern time and includes trades executed through the end of the prior business day. Gains and losses on securities sold are determined on the basis of identified cost and include proceeds received from litigation. Commissions paid to certain brokers with whom the investment adviser, or its affiliates, places trades on behalf of a fund include an amount in addition to trade execution, which may be rebated back to a fund. Any such rebates are included in net realized gain (loss) on investments in the Statement of Operations. Dividend income is recorded on the ex-dividend date, except for certain dividends from foreign securities where the ex-dividend date may have passed, which are recorded as soon as the Fund is informed of the ex-dividend date. Non-cash dividends included in dividend income, if any, are recorded at the fair market value of the securities received. Income and capital gain distributions from Fidelity Central Funds, if any, are recorded on the ex-dividend date. Certain distributions received by the Fund represent a return of capital or capital gain. The Fund determines the components of these distributions subsequent to the ex-dividend date, based upon receipt of tax filings or other correspondence relating to the underlying investment. These distributions are recorded as a reduction of cost of investments and/or as a realized gain. Interest income is accrued as earned and includes coupon interest and amortization of premium and accretion of discount on debt securities as applicable. Investment income is recorded net of foreign taxes withheld where recovery of such taxes is uncertain. Funds may file withholding tax reclaims in certain jurisdictions to recover a portion of amounts previously withheld. Any withholding tax reclaims income is included in the Statement of Operations in dividends. Any receivables for withholding tax reclaims are included in the Statement of Assets and Liabilities in dividends receivable. The Fund has filed tax reclaims for previously withheld taxes on dividends earned in certain European Union (EU) countries. These additional filings are subject to various administrative proceedings by the local jurisdictions' tax authorities within the EU, as well as a number of related judicial proceedings. Income recognized for EU reclaims is included with other reclaims in the Statement of Operations in dividends. These reclaims are recorded when the amount is known and there are no significant uncertainties on collectability.
Class Allocations and Expenses. Investment income, realized and unrealized capital gains and losses, common expenses of a fund, and certain fund-level expense reductions, if any, are allocated daily on a pro-rata basis to each class based on the relative net assets of each class to the total net assets of a fund. Each class differs with respect to transfer agent and distribution and service plan fees incurred, as applicable. Certain expense reductions may also differ by class, if applicable. For the reporting period, the allocated portion of income and expenses to each class as a percent of its average net assets may vary due to the timing of recording these transactions in relation to fluctuating net assets of the classes. Expenses directly attributable to a fund are charged to that fund. Expenses attributable to more than one fund are allocated among the respective funds on the basis of relative net assets or other appropriate methods. Expenses included in the accompanying financial statements reflect the expenses of that fund and do not include any expenses associated with any underlying mutual funds or exchange-traded funds (ETFs). Although not included in a fund's expenses, a fund indirectly bears its proportionate share of these expenses through the net asset value of each underlying mutual fund or exchange-traded fund (ETF). Expense estimates are accrued in the period to which they relate and adjustments are made when actual amounts are known.
Deferred Trustee Compensation. Under a Deferred Compensation Plan (the Plan) for certain Funds, certain independent Trustees have elected to defer receipt of a portion of their annual compensation. Deferred amounts are invested in affiliated mutual funds, are marked-to-market and remain in a fund until distributed in accordance with the Plan. The investment of deferred amounts and the offsetting payable to the Trustees presented below are included in the accompanying Statement of Assets and Liabilities in other receivables and other payables and accrued expenses, as applicable.
| Fidelity Low-Priced Stock Fund | $1,381 |
Income Tax Information and Distributions to Shareholders. Each year, the Fund intends to qualify as a regulated investment company under Subchapter M of the Internal Revenue Code, including distributing substantially all of its taxable income and realized gains. As a result, no provision for U.S. Federal income taxes is required. The Fund files a U.S. federal tax return, in addition to state and local tax returns as required. The Fund's federal income tax returns are subject to examination by the Internal Revenue Service (IRS) for a period of three fiscal years after they are filed. State and local tax returns may be subject to examination for an additional fiscal year depending on the jurisdiction. Foreign taxes are provided for based on the Fund's understanding of the tax rules and rates that exist in the foreign markets in which it invests. The Fund is subject to a tax imposed on capital gains by certain countries in which it invests. An estimated deferred tax liability for net unrealized appreciation on the applicable securities is included in Deferred taxes on the Statement of Assets & Liabilities.
Distributions are declared and recorded on the ex-dividend date. Income and capital gain distributions are declared separately for each class. Income and capital gain distributions are determined in accordance with income tax regulations, which may differ from GAAP.
Capital accounts within the financial statements are adjusted for permanent book-tax differences. These adjustments have no impact on net assets or the results of operations. Capital accounts are not adjusted for temporary book-tax differences which will reverse in a subsequent period.
Book-tax differences are primarily due to foreign currency transactions, certain foreign taxes, passive foreign investment companies (PFIC), redemptions in kind, partnerships, deferred trustee compensation, capital loss carryforwards and losses deferred due to wash sales.
As of period end, the cost and unrealized appreciation (depreciation) in securities, and derivatives if applicable, for federal income tax purposes were as follows:
| Gross unrealized appreciation | $9,010,402 |
| Gross unrealized depreciation | (1,208,222) |
| Net unrealized appreciation (depreciation) | $7,802,180 |
| Tax cost | $19,130,460 |
Capital loss carryforwards are only available to offset future capital gains of the Fund to the extent provided by regulations and may be limited. The capital loss carryforward information presented below, including any applicable limitation, is estimated as of fiscal period end and is subject to adjustment.
| Short-term | $(42,181) |
| Long-term | (26,231) |
| Total capital loss carryforward | $(68,412) |
Due to a merger in a prior period, approximately $68,412 of the Fund's realized capital losses are subject to limitation. Due to this limitation, the Fund will only be permitted to use approximately $680 of those capital losses per year to offset capital gains. These realized capital losses were acquired from Fidelity Event Driven Opportunities Fund when it merged into the Fund on June 19, 2020.
Restricted Securities (including Private Placements). Funds may invest in securities that are subject to legal or contractual restrictions on resale. These securities generally may be resold in transactions exempt from registration or to the public if the securities are registered. Disposal of these securities may involve time-consuming negotiations and expense, and prompt sale at an acceptable price may be difficult. Information regarding restricted securities held at period end is included at the end of the Schedule of Investments, if applicable.
4. Purchases and Sales of Investments.
Purchases and sales of securities, other than short-term securities and in-kind transactions, as applicable, are noted in the table below.
| | Purchases ($) | Sales ($) |
| Fidelity Low-Priced Stock Fund | 2,826,491 | 3,752,792 |
Unaffiliated Redemptions In-Kind. Shares that were redeemed in-kind for investments, including accrued interest and cash, if any, are shown in the table below. The net realized gain or loss on investments delivered through in-kind redemptions is included in the "Net realized gain (loss) on: Redemptions in-kind" line in the accompanying Statement of Operations. The amount of the in-kind redemptions is included in share transactions in the accompanying Statement of Changes in Net Assets. There was no gain or loss for federal income tax purposes.
| | Shares | Total net realized gain or loss ($) | Total Proceeds ($) | Participating classes |
| Fidelity Low-Priced Stock Fund | 26,237 | 936,580 | 1,118,059 | Fidelity Low-Priced Stock, Class K |
Prior Fiscal Year Unaffiliated Redemptions In-Kind. Shares that were redeemed in-kind for investments, including accrued interest and cash, if any, are shown in the table below; along with realized gain or loss on investments delivered through in-kind redemptions. The amount of the in-kind redemptions is included in share transactions in the accompanying Statement of Changes in Net Assets. There was no gain or loss for federal income tax purposes.
| | Shares | Total net realized gain or loss ($) | Total Proceeds ($) | Participating classes |
| Fidelity Low-Priced Stock Fund | 23,440 | 906,841 | 1,086,158 | Fidelity Low-Priced Stock, Class K |
5. Fees and Other Transactions with Affiliates.
Management Fee. Fidelity Management & Research Company LLC (the investment adviser) and its affiliates provide the Fund with investment management related services for which the Fund pays a monthly management fee. The management fee is the sum of an individual fund fee rate that is based on an annual rate of .35% of the Fund's average net assets and an annualized group fee rate that averaged .22% during the period. The group fee rate is based upon the monthly average net assets of a group of registered investment companies with which the investment adviser has management contracts. The group fee rate decreases as assets under management increase and increases as assets under management decrease. In addition, the management fee is subject to a performance adjustment (up to a maximum of +/-.20% of the Fund's average net assets over a 36 month performance period). The upward or downward adjustment to the management fee is based on the relative investment performance of Fidelity Low-Priced Stock as compared to its benchmark index, the Russell 2000 Index, over the same 36 month performance period. For the reporting period, the total annualized management fee rate, including the performance adjustment, was .80% of the Fund's average net assets. The performance adjustment included in the management fee rate may be higher or lower than the maximum performance adjustment rate due to the difference between the average net assets for the reporting and performance periods.
Transfer Agent Fees. Fidelity Investments Institutional Operations Company LLC (FIIOC), an affiliate of the investment adviser, is the transfer, dividend disbursing and shareholder servicing agent for each class of the Fund.
During November 2023, the Board approved a change in the transfer agent fees effective December 1, 2023 to a fixed annual rate of class-level average net assets as follows:
| | % of Class-Level Average Net Assets |
| Low-Priced Stock | .1239 |
Prior to December 1, 2023, FIIOC received account fees and asset-based fees that varied according to the account size and type of account of the shareholders of the respective classes of the Fund, except for Class K. FIIOC received an asset-based fee of Class K's average net assets. FIIOC pays for typesetting, printing and mailing of shareholder reports, except proxy statements.
For the period, transfer agent fees for each class were as follows:
| | Amount | % of Class-Level Average Net AssetsA |
| Low-Priced Stock | $ 14,573 | .12 |
| Class K | 655 | .04 |
| | $15,228 | |
A Annualized
Accounting Fees. Fidelity Service Company, Inc. (FSC), an affiliate of the investment adviser, maintains the Fund's accounting records.
| | % of Average Net Assets |
| Fidelity Low-Priced Stock Fund | .0065 |
Prior to December 1, 2023, the accounting fee was based on the level of average net assets for each month. For the period, the fees were equivalent to the following annualized rates:
| | % of Average Net Assets |
| Fidelity Low-Priced Stock Fund | .01 |
Subsequent Event - Management Fee. Effective March 1, 2024, the Fund's management contract will be amended to incorporate administrative services previously covered under separate services agreements (Transfer Agent and Accounting agreements). The amended contract incorporates a basic fee rate that may vary by class (subject to a performance adjustment). The investment adviser or an affiliate will pay certain expenses of managing and operating the Fund out of each class's management fee.
Each class of the Fund will pay a management fee to the investment adviser. The management fee will be calculated and paid to the investment adviser every month.
The management fee will be determined by calculating a basic fee and then applying a performance adjustment.
When determining a class's basic fee, a mandate rate will be calculated based on the monthly average net assets of a group of funds advised by FMR within a designated asset class. A discount rate will be subtracted from the mandate rate once the Fund's monthly average net assets reach a certain level. The mandate rate and discount rate may vary by class.
The annual basic fee rate for a class of shares of the Fund will be the lesser of (1) the class's mandate rate reduced by the class's discount rate (if applicable) or (2) the amount set forth in the following table.
| | Maximum Management Fee Rate % |
| Low-Priced Stock | 0.67 |
| Class K | 0.59 |
One-twelfth of the basic fee rate for a class will be applied to the average net assets of the class for the month, giving a dollar amount which is the basic fee for the class for that month.
The performance adjustment rate will be calculated monthly by comparing over the performance period the Fund's performance to that of the performance adjustment index listed below.
| | Performance Adjustment Index |
| Fidelity Low-Priced Stock Fund | Russell 2000 Index |
For the purposes of calculating the performance adjustment for the Fund, the Fund's investment performance will be based on the performance of Low-Priced Stock. To the extent that other classes of the Fund have higher expenses, this could result in those classes bearing a larger positive performance adjustment and smaller negative performance adjustment than would be the case if each class's own performance were considered.
The performance period is the most recent 36 month period.
The maximum annualized performance adjustment rate will be ±.20% of the Fund's average net assets over the performance period. The performance adjustment rate will be divided by twelve and multiplied by the Fund's average net assets over the performance period, and the resulting dollar amount will be proportionately added to or subtracted from a class's basic fee.
A different management fee rate may be applicable to each class of the Fund. The difference between classes is the result of separate arrangements for class-level services and/or waivers of certain expenses. It is not the result of any difference in advisory or custodial fees or other expenses related to the management of the Fund's assets, which do not vary by class.
Effective March 1, 2024, the Fund's sub-advisory agreements with FMR Investment Management (UK) Limited, Fidelity Management & Research (Hong Kong) Limited, and Fidelity Management & Research (Japan) Limited will be amended to provide that the investment adviser will pay each sub-adviser monthly fees equal to 110% of the sub-adviser's costs for providing sub-advisory services.
Brokerage Commissions. A portion of portfolio transactions were placed with brokerage firms which are affiliates of the investment adviser. Brokerage commissions are included in net realized gain (loss) and change in net unrealized appreciation (depreciation) in the Statement of Operations. The commissions paid to these affiliated firms were as follows:
| | Amount |
| Fidelity Low-Priced Stock Fund | $ 36 |
Interfund Trades. Funds may purchase from or sell securities to other Fidelity Funds under procedures adopted by the Board. The procedures have been designed to ensure these interfund trades are executed in accordance with Rule 17a-7 of the 1940 Act. Any interfund trades are included within the respective purchases and sales amounts shown in the Purchases and Sales of Investments note. Interfund trades during the period are noted in the table below.
| | Purchases ($) | Sales ($) | Realized Gain (Loss) ($) |
| Fidelity Low-Priced Stock Fund | 248,385 | 99,607 | 28,277 |
6. Committed Line of Credit.
Certain Funds participate with other funds managed by the investment adviser or an affiliate in a $4.25 billion credit facility (the "line of credit") to be utilized for temporary or emergency purposes to fund shareholder redemptions or for other short-term liquidity purposes. The participating funds have agreed to pay commitment fees on their pro-rata portion of the line of credit, which are reflected in Miscellaneous expenses on the Statement of Operations, and are listed below. During the period, there were no borrowings on this line of credit.
| | Amount |
| Fidelity Low-Priced Stock Fund | $21 |
7. Security Lending.
Funds lend portfolio securities from time to time in order to earn additional income. Lending agents are used, including National Financial Services (NFS), an affiliate of the investment adviser. Pursuant to a securities lending agreement, NFS will receive a fee, which is capped at 9.9% of a fund's daily lending revenue, for its services as lending agent. A fund may lend securities to certain qualified borrowers, including NFS. On the settlement date of the loan, a fund receives collateral (in the form of U.S. Treasury obligations, letters of credit and/or cash) against the loaned securities and maintains collateral in an amount not less than 100% of the market value of the loaned securities during the period of the loan. The market value of the loaned securities is determined at the close of business of a fund and any additional required collateral is delivered to a fund on the next business day. A fund or borrower may terminate the loan at any time, and if the borrower defaults on its obligation to return the securities loaned because of insolvency or other reasons, a fund may apply collateral received from the borrower against the obligation. A fund may experience delays and costs in recovering the securities loaned. Any cash collateral received is invested in the Fidelity Securities Lending Cash Central Fund. Any loaned securities are identified as such in the Schedule of Investments, and the value of loaned securities and cash collateral at period end, as applicable, are presented in the Statement of Assets and Liabilities. Security lending income represents the income earned on investing cash collateral, less rebates paid to borrowers and any lending agent fees associated with the loan, plus any premium payments received for lending certain types of securities. Security lending income is presented in the Statement of Operations as a component of income from Fidelity Central Funds. Affiliated security lending activity, if any, was as follows:
| | Total Security Lending Fees Paid to NFS | Security Lending Income From Securities Loaned to NFS | Value of Securities Loaned to NFS at Period End |
| Fidelity Low-Priced Stock Fund | $26 | $- A | $- |
A Represents amount less than five hundred dollars.
8. Expense Reductions.
During the period the investment adviser or an affiliate reimbursed and/or waived a portion of fund-level operating expenses in the amount of $1,142.
9. Distributions to Shareholders.
Distributions to shareholders of each class were as follows:
| | Six months ended January 31, 2024 | Year ended July 31, 2023 |
| Fidelity Low-Priced Stock Fund | | |
| Distributions to shareholders | | |
| Low-Priced Stock | $ 4,020,428 | $2,185,254 |
| Class K | 543,977 | 319,137 |
Total | $4,564,405 | $2,504,391 |
10. Share Transactions.
Share transactions for each class were as follows and may contain in-kind transactions, automatic conversions between classes or exchanges between affiliated funds:
| | Shares | Shares | Dollars | Dollars |
| | Six months ended January 31, 2024 | Year ended July 31, 2023 | Six months ended January 31, 2024 | Year ended July 31, 2023 |
| Fidelity Low-Priced Stock Fund | | | | |
| Low-Priced Stock | | | | |
| Shares sold | 34,595 | 45,379 | $1,480,853 | $2,113,858 |
| Reinvestment of distributions | 88,323 | 44,186 | 3,700,353 | 2,022,615 |
| Shares redeemed | (74,727) | (92,009) | (3,228,982) | (4,306,161) |
| Net increase (decrease) | 48,191 | (2,444) | $1,952,224 | $(169,688) |
| Class K | | | | |
| Shares sold | 4,721 | 11,247 | $203,837 | $527,756 |
| Reinvestment of distributions | 13,006 | 6,981 | 543,960 | 319,132 |
| Shares redeemed | (14,181) | (26,083) | (615,922) | (1,220,239) |
| Net increase (decrease) | 3,546 | (7,855) | $131,875 | $(373,351) |
11. Other.
A fund's organizational documents provide former and current trustees and officers with a limited indemnification against liabilities arising in connection with the performance of their duties to the fund. In the normal course of business, a fund may also enter into contracts that provide general indemnifications. A fund's maximum exposure under these arrangements is unknown as this would be dependent on future claims that may be made against a fund. The risk of material loss from such claims is considered remote.
12. Risk and Uncertainties.
Many factors affect a fund's performance. Developments that disrupt global economies and financial markets, such as pandemics, epidemics, outbreaks of infectious diseases, war, terrorism, and environmental disasters, may significantly affect a fund's investment performance. The effects of these developments to a fund will be impacted by the types of securities in which a fund invests, the financial condition, industry, economic sector, and geographic location of an issuer, and a fund's level of investment in the securities of that issuer. Significant concentrations in security types, issuers, industries, sectors, and geographic locations may magnify the factors that affect a fund's performance.
As a shareholder, you incur two types of costs: (1) transaction costs, which may include sales charges (loads) on purchase payments or redemption proceeds, as applicable and (2) ongoing costs, which generally include management fees, distribution and/or service (12b-1) fees and other Fund expenses. This Example is intended to help you understand your ongoing costs (in dollars) of investing in a fund and to compare these costs with the ongoing costs of investing in other mutual funds.
| The Example is based on an investment of $1,000 invested at the beginning of the period and held for the entire period (August 1, 2023 to January 31, 2024). |
Actual Expenses
The first line of the accompanying table provides information about actual account values and actual expenses. You may use the information in this line, together with the amount you invested, to estimate the expenses that you paid over the period. Simply divide your account value by $1,000.00 (for example, an $8,600 account value divided by $1,000.00 = 8.6), then multiply the result by the number in the first line for a class/Fund under the heading entitled "Expenses Paid During Period" to estimate the expenses you paid on your account during this period. If any fund is a shareholder of any underlying mutual funds or exchange-traded funds (ETFs) (the Underlying Funds), such fund indirectly bears its proportional share of the expenses of the Underlying Funds in addition to the direct expenses incurred presented in the table. These fees and expenses are not included in the annualized expense ratio used to calculate the expense estimate in the table below.
Hypothetical Example for Comparison Purposes
The second line of the accompanying table provides information about hypothetical account values and hypothetical expenses based on the actual expense ratio and an assumed rate of return of 5% per year before expenses, which is not the actual return. The hypothetical account values and expenses may not be used to estimate the actual ending account balance or expenses you paid for the period. You may use this information to compare the ongoing costs of investing in the Fund and other funds. To do so, compare this 5% hypothetical example with the 5% hypothetical examples that appear in the shareholder reports of the other funds. If any fund is a shareholder of any Underlying Funds, such fund indirectly bears its proportional share of the expenses of the Underlying Funds in addition to the direct expenses as presented in the table. These fees and expenses are not included in the annualized expense ratio used to calculate the expense estimate in the table below.
Please note that the expenses shown in the table are meant to highlight your ongoing costs only and do not reflect any transaction costs. Therefore, the second line of the table is useful in comparing ongoing costs only, and will not help you determine the relative total costs of owning different funds. In addition, if these transactional costs were included, your costs would have been higher.
| | | | | Annualized Expense Ratio- A | | Beginning Account Value August 1, 2023 | | Ending Account Value January 31, 2024 | | Expenses Paid During Period- C August 1, 2023 to January 31, 2024 |
| Fidelity® Low-Priced Stock Fund | | | | | | | | | | |
| Fidelity® Low-Priced Stock Fund | | | | .93% | | | | | | |
| Actual | | | | | | $ 1,000 | | $ 1,048.40 | | $ 4.79 |
Hypothetical-B | | | | | | $ 1,000 | | $ 1,020.46 | | $ 4.72 |
| Class K | | | | .85% | | | | | | |
| Actual | | | | | | $ 1,000 | | $ 1,048.70 | | $ 4.38 |
Hypothetical-B | | | | | | $ 1,000 | | $ 1,020.86 | | $ 4.32 |
| |
A Annualized expense ratio reflects expenses net of applicable fee waivers.
B 5% return per year before expenses
C Expenses are equal to the annualized expense ratio, multiplied by the average account value over the period, multiplied by 184/ 366 (to reflect the one-half year period). The fees and expenses of any Underlying Funds are not included in each annualized expense ratio.
Board Approval of Investment Advisory Contracts
At its January 2024 meeting, the Board of Trustees, including the Independent Trustees (together, the Board), approved an amended and restated management contract with Fidelity Management & Research Company LLC (FMR) (the Management Contract), and amended and restated sub-advisory agreements (the Sub-Advisory Contracts, and together with the Management Contract, the Advisory Contracts) for the fund, including the fund's sub-advisory agreements with FMR Investment Management (UK) Limited (FMR UK), Fidelity Management & Research (Hong Kong) Limited (FMR H.K.), and Fidelity Management & Research (Japan) Limited (FMR Japan). The Advisory Contracts will be effective March 1, 2024. The Board will consider the annual renewal of the fund's Advisory Contracts in May 2024, following its review of additional materials provided by FMR.
Management Contract. The Board approved the Management Contract, which implements a new fee structure combining the management fee, transfer agent fee (TA Fee), and pricing and bookkeeping fee (P&B Fee) of the fund and each class into a single class-level fee based on tiered schedules and subject to a maximum class-level rate (the Unified Fee). In exchange for the Unified Fee, the fund will receive investment advisory, management, administrative, transfer agent, pricing and bookkeeping services under a single agreement - the Management Contract.
In its consideration of the Management Contract over several meetings, the Board received, reviewed and discussed a comprehensive set of analyses regarding the Unified Fee including (i) the legal framework, (ii) design goals for the Unified Fee, (iii) calculation methodology for the Unified Fee and illustrative examples, (iv) annual and cumulative projected impacts under various scenarios, both in the aggregate and at the fund/class level, (v) explanations of schedules, rate levers and maximum rates and (vi) shareholder benefits and projected savings.
The Board considered that the maximum Unified Fee for each class of the fund would be no higher than the sum of (i) the lowest contractual management fee rate under the fund's existing management contract, which is the individual fund fee rate, if any, plus the lowest contractual marginal group fee rate and (ii) the TA and P&B Fee rates, which are fixed fee rates since December 1, 2023 (together, the Unified Fee Cap). The Board noted that Fidelity has represented that, as a result of this Unified Fee Cap, the Unified Fee would be no greater than the fee rates previously authorized to be charged to the fund for the same services. The Board noted that certain expenses such as performance adjustments, third-party expenses, and certain other miscellaneous expenses would be outside the scope of the Unified Fee and the calculation of such fees would not change as a result of the Unified Fee. The Board considered that, under the Management Contract, a different management fee rate will be applicable to each class of the fund. The Board noted that Fidelity has represented that the difference in expenses between classes is based on differences in class-specific expenses and not due to any difference in advisory or third-party custodial fees or other expenses related to the management of the fund's assets.
The Board considered Fidelity's representations that implementation of the Unified Fee, which includes the Unified Fee Cap, would cause all funds subject to the Unified Fee, including the fund, to experience an immediate reduction on contractual fee rates for services provided under the current management contracts. The Board considered that some funds would not experience lower net total fees as a result of existing fee caps. The Board further considered that, in addition to the contractual fee savings, the Unified Fee offers funds and their shareholders greater protection from future rate increases for services previously offered under separate agreements that are now covered by the Management Contract because such rate increases would require shareholder approval.
Sub-Advisory Contracts. In connection with the Unified Fee changes, the Board considered the Sub-Advisory Contracts, which simplified the calculation of the fees paid by FMR to the sub-advisers under the agreements. The Board noted that the agreements with FMR UK, FMR H.K., and FMR Japan were amended to provide that FMR will compensate each sub-adviser at a fee rate equal to 110% of the sub-adviser's costs incurred in providing services under the agreement. The Board considered that, under the Sub-Advisory Contracts, FMR, and not the fund, will continue to pay the sub-advisory fees to each applicable sub-adviser.
The Board further considered that the approval of the fund's Advisory Contracts will not result in any changes in the investment process or strategies employed in the management of the fund's assets or the day-to-day management of the fund or the persons primarily responsible for such management. Further, the Board considered that the Management Contract would not change the obligations and services of FMR and its affiliates on behalf of the fund, and, in particular, there would be no change in the nature and level of advisory, management, administration, transfer agent, and pricing and bookkeeping services provided to the fund by FMR, its affiliates, and each applicable sub-adviser.
In connection with its consideration of future renewals of the fund's Advisory Contracts, the Board will consider: (i) the nature, extent and quality of services provided to the funds, including shareholder and administrative services and investment performance; (ii) the competitiveness of the management fee and total expenses for the fund; (iii) the costs of the services and profitability, including the revenues earned and the expenses incurred in conducting the business of developing, marketing, distributing, managing, administering, and servicing the fund and its shareholders, to the extent applicable; and (iv) whether there have been economies of scale in respect of the Fidelity funds, whether the Fidelity funds (including the fund) have appropriately benefited from any such economies of scale, and whether there is the potential for realization of any further economies.
Based on its evaluation of all of the conclusions and representations noted above, and after considering all factors it believed relevant, the Board concluded that the fund's management fee structure is fair and reasonable, and that the fund's Advisory Contracts should be approved.
The Securities and Exchange Commission adopted Rule 22e-4 under the Investment Company Act of 1940 (the Liquidity Rule) to promote effective liquidity risk management throughout the open-end investment company industry, thereby reducing the risk that funds will be unable to meet their redemption obligations and mitigating dilution of the interests of fund shareholders.
The Fund has adopted and implemented a liquidity risk management program (the Program) reasonably designed to assess and manage the Fund's liquidity risk and to comply with the requirements of the Liquidity Rule. The Fund's Board of Trustees (the Board) has designated the Fund's investment adviser as administrator of the Program. The Fidelity advisers have established a Liquidity Risk Management Committee (the LRM Committee) to manage the Program for each of the Fidelity Funds. The LRM Committee monitors the adequacy and effectiveness of implementation of the Program and on a periodic basis assesses each Fund's liquidity risk based on a variety of factors including (1) the Fund's investment strategy, (2) portfolio liquidity and cash flow projections during normal and reasonably foreseeable stressed conditions, (3) shareholder redemptions, (4) borrowings and other funding sources and (5) certain factors specific to ETFs including the effect of the Fund's prices and spreads, market participants, and basket compositions on the overall liquidity of the Fund's portfolio, as applicable.
In accordance with the Program, each of the Fund's portfolio investments is classified into one of four defined liquidity categories based on a determination of a reasonable expectation for how long it would take to convert the investment to cash (or sell or dispose of the investment) without significantly changing its market value.
- Highly liquid investments - cash or convertible to cash within three business days or less
- Moderately liquid investments - convertible to cash in three to seven calendar days
- Less liquid investments - can be sold or disposed of, but not settled, within seven calendar days
- Illiquid investments - cannot be sold or disposed of within seven calendar days
Liquidity classification determinations take into account a variety of factors including various market, trading and investment-specific considerations, as well as market depth, and generally utilize analysis from a third-party liquidity metrics service.
The Liquidity Rule places a 15% limit on a fund's illiquid investments and requires funds that do not primarily hold assets that are highly liquid investments to determine and maintain a minimum percentage of the fund's net assets to be invested in highly liquid investments (highly liquid investment minimum or HLIM). The Program includes provisions reasonably designed to comply with the 15% limit on illiquid investments and for determining, periodically reviewing and complying with the HLIM requirement as applicable.
At a recent meeting of the Fund's Board of Trustees, the LRM Committee provided a written report to the Board pertaining to the operation, adequacy, and effectiveness of the Program for the period December 1, 2022 through November 30, 2023. The report concluded that the Program is operating effectively and is reasonably designed to assess and manage the Fund's liquidity risk.
1.700505.127
LPS-SANN-0324
Fidelity® Low-Priced Stock K6 Fund
Semi-Annual Report
January 31, 2024
Contents
To view a fund's proxy voting guidelines and proxy voting record for the 12-month period ended June 30, visit http://www.fidelity.com/proxyvotingresults or visit the Securities and Exchange Commission's (SEC) web site at http://www.sec.gov.
You may also call 1-800-835-5092 to request a free copy of the proxy voting guidelines.
Standard & Poor's, S&P and S&P 500 are registered service marks of The McGraw-Hill Companies, Inc. and have been licensed for use by Fidelity Distributors Corporation.
Other third-party marks appearing herein are the property of their respective owners.
All other marks appearing herein are registered or unregistered trademarks or service marks of FMR LLC or an affiliated company. © 2024 FMR LLC. All rights reserved.
This report and the financial statements contained herein are submitted for the general information of the shareholders of the Fund. This report is not authorized for distribution to prospective investors in the Fund unless preceded or accompanied by an effective prospectus.
A fund files its complete schedule of portfolio holdings with the SEC for the first and third quarters of each fiscal year on Form N-PORT. Forms N-PORT are available on the SEC's web site at http://www.sec.gov. A fund's Forms N-PORT may be reviewed and copied at the SEC's Public Reference Room in Washington, DC. Information regarding the operation of the SEC's Public Reference Room may be obtained by calling 1-800-SEC-0330.
For a complete list of a fund's portfolio holdings, view the most recent holdings listing, semiannual report, or annual report on Fidelity's web site at http://www.fidelity.com, http://www.institutional.fidelity.com, or http://www.401k.com, as applicable.
NOT FDIC INSURED •MAY LOSE VALUE •NO BANK GUARANTEE
Neither the Fund nor Fidelity Distributors Corporation is a bank.
Top Holdings (% of Fund's net assets) |
| |
| Wells Fargo & Co. | 1.9 | |
| Elevance Health, Inc. | 1.9 | |
| Metro, Inc. | 1.5 | |
| Seagate Technology Holdings PLC | 1.5 | |
| UnitedHealth Group, Inc. | 1.5 | |
| TotalEnergies SE sponsored ADR | 1.5 | |
| Next PLC | 1.5 | |
| PG&E Corp. | 1.4 | |
| Reinsurance Group of America, Inc. | 1.1 | |
| Unum Group | 1.1 | |
| | 14.9 | |
| |
| Market Sectors (% of Fund's net assets) |
| |
| Industrials | 15.9 | |
| Financials | 15.8 | |
| Information Technology | 15.6 | |
| Consumer Discretionary | 14.5 | |
| Health Care | 11.4 | |
| Energy | 8.8 | |
| Consumer Staples | 6.5 | |
| Materials | 5.5 | |
| Utilities | 1.7 | |
| Communication Services | 1.2 | |
| Real Estate | 0.9 | |
| |
Asset Allocation (% of Fund's net assets) |
|
|
Geographic Diversification (% of Fund's net assets) |
|
* Includes Short-Term investments and Net Other Assets (Liabilities). Percentages are adjusted for the effect of derivatives, if applicable. |
| |
Showing Percentage of Net Assets
| Common Stocks - 97.8% |
| | | Shares | Value ($) |
| COMMUNICATION SERVICES - 1.2% | | | |
| Entertainment - 0.5% | | | |
| GungHo Online Entertainment, Inc. | | 59,993 | 1,008,625 |
| International Games Systems Co. Ltd. | | 224,400 | 5,937,890 |
| Warner Bros Discovery, Inc. (a) | | 876,695 | 8,784,484 |
| | | | 15,730,999 |
| Interactive Media & Services - 0.2% | | | |
| Cars.com, Inc. (a) | | 369,572 | 6,441,640 |
| JOYY, Inc. ADR | | 25,177 | 771,927 |
| New Work SE | | 4,354 | 290,792 |
| | | | 7,504,359 |
| Media - 0.5% | | | |
| Comcast Corp. Class A | | 258,253 | 12,019,095 |
| Intage Holdings, Inc. (b) | | 26,155 | 309,211 |
| Nexstar Media Group, Inc. Class A | | 23,191 | 4,121,273 |
| Pico Far East Holdings Ltd. | | 2,520,418 | 487,288 |
| Reach PLC | | 679,483 | 531,735 |
| RKB Mainichi Broadcasting Corp. | | 3,372 | 114,498 |
| Thryv Holdings, Inc. (a) | | 51,032 | 1,043,094 |
| Trenders, Inc. (b) | | 18,017 | 114,193 |
| | | | 18,740,387 |
TOTAL COMMUNICATION SERVICES | | | 41,975,745 |
| CONSUMER DISCRETIONARY - 14.5% | | | |
| Automobile Components - 1.5% | | | |
| Adient PLC (a) | | 113,593 | 3,942,813 |
| ASTI Corp. | | 12,154 | 258,376 |
| Brembo SpA | | 126,636 | 1,565,627 |
| Cie Automotive SA | | 199,790 | 5,289,870 |
| DaikyoNishikawa Corp. | | 59,380 | 297,151 |
| Gentex Corp. | | 70,870 | 2,347,923 |
| GUD Holdings Ltd. | | 11,420 | 90,647 |
| Hi-Lex Corp. | | 12,638 | 133,000 |
| LCI Industries | | 156,426 | 17,407,085 |
| Lear Corp. | | 91,926 | 12,216,965 |
| Motonic Corp. | | 197,504 | 1,218,903 |
| Patrick Industries, Inc. | | 21,421 | 2,150,454 |
| PT Selamat Sempurna Tbk | | 6,849,800 | 869,829 |
| SNT Holdings Co. Ltd. | | 104,262 | 1,504,880 |
| Yutaka Giken Co. Ltd. | | 90,651 | 1,625,115 |
| | | | 50,918,638 |
| Automobiles - 0.6% | | | |
| General Motors Co. | | 191,895 | 7,445,526 |
| Harley-Davidson, Inc. | | 281,171 | 9,123,999 |
| Isuzu Motors Ltd. | | 142,343 | 1,942,263 |
| Kabe Husvagnar AB (B Shares) | | 26,703 | 830,087 |
| | | | 19,341,875 |
| Broadline Retail - 2.3% | | | |
| ASKUL Corp. | | 408,379 | 5,519,919 |
| B&M European Value Retail SA | | 1,105,122 | 7,263,103 |
| Belluna Co. Ltd. | | 206,452 | 888,388 |
| Big Lots, Inc. | | 144,317 | 828,380 |
| Europris ASA (c) | | 314,600 | 2,361,613 |
| Gwangju Shinsegae Co. Ltd. | | 24,227 | 554,445 |
| Kohl's Corp. (b) | | 147,976 | 3,811,862 |
| Macy's, Inc. (b) | | 137,655 | 2,517,710 |
| Max Stock Ltd. | | 175,275 | 357,493 |
| Next PLC | | 477,626 | 51,256,417 |
| Rusta AB | | 543,682 | 3,825,284 |
| Vipshop Holdings Ltd. ADR (a) | | 119,919 | 1,905,513 |
| | | | 81,090,127 |
| Distributors - 0.4% | | | |
| Arata Corp. | | 130,054 | 2,886,711 |
| Autohellas SA | | 22,880 | 331,334 |
| Central Automotive Products Ltd. | | 32,258 | 1,064,709 |
| Inchcape PLC | | 678,400 | 5,889,194 |
| PALTAC Corp. | | 175,007 | 5,328,163 |
| | | | 15,500,111 |
| Diversified Consumer Services - 0.3% | | | |
| Aucnet, Inc. | | 23,380 | 335,211 |
| Cross-Harbour Holdings Ltd. | | 262,916 | 250,206 |
| Frontdoor, Inc. (a) | | 59,591 | 1,952,201 |
| Gakkyusha Co. Ltd. | | 8,627 | 120,702 |
| H&R Block, Inc. | | 155,362 | 7,277,156 |
| JP-Holdings, Inc. | | 111,533 | 346,189 |
| ME Group International PLC | | 850,406 | 1,368,704 |
| Step Co. Ltd. | | 34,312 | 475,444 |
| | | | 12,125,813 |
| Hotels, Restaurants & Leisure - 0.3% | | | |
| Betsson AB (B Shares) | | 457,255 | 4,982,652 |
| Brinker International, Inc. (a) | | 72,586 | 3,105,955 |
| Hollywood Bowl Group PLC | | 29,200 | 110,645 |
| Ibersol SGPS SA (b) | | 169,639 | 1,224,637 |
| J.D. Wetherspoon PLC (a) | | 189,555 | 2,017,874 |
| | | | 11,441,763 |
| Household Durables - 3.3% | | | |
| Ace Bed Co. Ltd. | | 669 | 12,770 |
| Barratt Developments PLC | | 2,564,072 | 17,560,020 |
| Bellway PLC | | 479,207 | 16,761,453 |
| Chervon Holdings Ltd. | | 1,382,768 | 2,810,804 |
| Cuckoo Holdings Co. Ltd. | | 49,130 | 582,891 |
| D.R. Horton, Inc. | | 33,025 | 4,719,603 |
| Emak SpA | | 471,381 | 535,911 |
| First Juken Co. Ltd. (b) | | 147,234 | 1,112,671 |
| FJ Next Co. Ltd. | | 144,339 | 1,217,204 |
| Gree Electric Appliances, Inc. of Zhuhai (A Shares) | | 1,094,046 | 5,389,526 |
| Helen of Troy Ltd. (a)(b) | | 180,313 | 20,645,839 |
| JM AB (B Shares) | | 176,461 | 2,892,789 |
| Open House Group Co. Ltd. | | 66,046 | 2,065,398 |
| Pressance Corp. | | 384,269 | 4,346,421 |
| Tempur Sealy International, Inc. | | 202,197 | 10,087,608 |
| Token Corp. | | 28,774 | 1,845,203 |
| TopBuild Corp. (a) | | 12,277 | 4,531,809 |
| Vistry Group PLC | | 1,485,939 | 18,925,462 |
| ZAGG, Inc. rights (a)(d) | | 384 | 0 |
| | | | 116,043,382 |
| Leisure Products - 0.2% | | | |
| Brunswick Corp. | | 67,139 | 5,416,775 |
| Miroku Corp. | | 35 | 358 |
| Roland Corp. | | 34,986 | 1,162,370 |
| | | | 6,579,503 |
| Specialty Retail - 3.9% | | | |
| Academy Sports & Outdoors, Inc. | | 79,260 | 4,971,980 |
| Arcland Sakamoto Co. Ltd. | | 136,276 | 1,560,569 |
| AutoZone, Inc. (a) | | 12,413 | 34,286,320 |
| BHG Group AB (a) | | 544,022 | 890,267 |
| BMTC Group, Inc. | | 309,815 | 2,834,411 |
| Buffalo Co. Ltd. | | 6,083 | 57,292 |
| Dick's Sporting Goods, Inc. | | 65,540 | 9,770,048 |
| Foot Locker, Inc. | | 281,934 | 7,939,261 |
| Formosa Optical Technology Co. Ltd. | | 161,000 | 450,164 |
| Fuji Corp. | | 60,494 | 726,890 |
| Goldlion Holdings Ltd. | | 3,198,624 | 429,273 |
| Hamee Corp. | | 75,058 | 552,709 |
| Handsman Co. Ltd. | | 42,185 | 286,617 |
| IA Group Corp. | | 12,231 | 294,223 |
| JD Sports Fashion PLC | | 4,815,617 | 7,143,364 |
| Jumbo SA | | 896,580 | 25,192,284 |
| K's Holdings Corp. | | 69,134 | 628,302 |
| Kid ASA (c) | | 8,033 | 102,654 |
| Ku Holdings Co. Ltd. | | 39,878 | 320,683 |
| Leon's Furniture Ltd. | | 37,348 | 591,145 |
| Maisons du Monde SA (c) | | 106,511 | 514,756 |
| Mr. Bricolage SA (a) | | 72,483 | 634,492 |
| Nafco Co. Ltd. | | 244,599 | 3,707,118 |
| Papyless Co. Ltd. | | 814 | 5,099 |
| Pendragon PLC (a) | | 1,668,726 | 768,721 |
| Pets At Home Group PLC | | 235,741 | 837,110 |
| Ross Stores, Inc. | | 49,894 | 6,999,130 |
| Sally Beauty Holdings, Inc. (a) | | 1,029,692 | 12,685,805 |
| Sportsman's Warehouse Holdings, Inc. (a) | | 344,540 | 1,326,479 |
| Syuppin Co. Ltd. | | 36,060 | 254,181 |
| The Hour Glass Ltd. | | 228,790 | 258,851 |
| Valvoline, Inc. (a) | | 1,226 | 44,737 |
| WH Smith PLC | | 215,239 | 3,303,274 |
| Williams-Sonoma, Inc. | | 28,073 | 5,429,037 |
| | | | 135,797,246 |
| Textiles, Apparel & Luxury Goods - 1.7% | | | |
| Best Pacific International Holdings Ltd. | | 4,932,354 | 679,290 |
| Crocs, Inc. (a) | | 6,275 | 636,787 |
| Deckers Outdoor Corp. (a) | | 755 | 569,066 |
| Embry Holdings Ltd. (a) | | 202,454 | 10,661 |
| Gildan Activewear, Inc. | | 410,516 | 13,557,150 |
| Handsome Co. Ltd. | | 187,090 | 2,610,934 |
| Kontoor Brands, Inc. | | 98,094 | 5,750,270 |
| Levi Strauss & Co. Class A (b) | | 558,959 | 9,099,853 |
| PVH Corp. | | 110,770 | 13,321,200 |
| Sun Hing Vision Group Holdings Ltd. | | 1,661,819 | 158,148 |
| Texwinca Holdings Ltd. | | 3,511,467 | 368,280 |
| Victory City International Holdings Ltd. (d) | | 4,590,144 | 170,267 |
| Wolverine World Wide, Inc. | | 713,523 | 5,965,052 |
| Youngone Corp. | | 27,064 | 971,612 |
| Youngone Holdings Co. Ltd. | | 103,285 | 6,260,374 |
| | | | 60,128,944 |
TOTAL CONSUMER DISCRETIONARY | | | 508,967,402 |
| CONSUMER STAPLES - 6.5% | | | |
| Beverages - 0.4% | | | |
| A.G. Barr PLC | | 238,424 | 1,716,239 |
| Britvic PLC | | 802,657 | 8,976,854 |
| Viva Wine Group AB | | 317,300 | 1,248,570 |
| | | | 11,941,663 |
| Consumer Staples Distribution & Retail - 4.6% | | | |
| Acomo NV | | 16,375 | 310,750 |
| Alimentation Couche-Tard, Inc. Class A (multi-vtg.) | | 287,771 | 16,862,360 |
| Atacadao SA | | 882,700 | 1,854,696 |
| Belc Co. Ltd. | | 152,916 | 6,533,348 |
| BJ's Wholesale Club Holdings, Inc. (a) | | 198,963 | 12,801,279 |
| Corporativo Fragua S.A.B. de CV | | 32,601 | 1,022,836 |
| Cosmos Pharmaceutical Corp. | | 119,638 | 12,850,816 |
| Create SD Holdings Co. Ltd. | | 398,107 | 8,663,340 |
| Eurocash SA | | 43,296 | 164,354 |
| G-7 Holdings, Inc. | | 149,047 | 1,270,622 |
| Genky DrugStores Co. Ltd. | | 146,828 | 6,680,350 |
| Halows Co. Ltd. | | 169,410 | 5,023,162 |
| MARR SpA | | 9,186 | 111,980 |
| MARR SpA | | 1,900 | 23,162 |
| Metro, Inc. | | 1,028,441 | 53,998,029 |
| North West Co., Inc. | | 9,056 | 261,957 |
| Performance Food Group Co. (a) | | 11,866 | 862,421 |
| Sprouts Farmers Market LLC (a) | | 498,552 | 25,112,064 |
| Tsuruha Holdings, Inc. | | 18,829 | 1,490,027 |
| U.S. Foods Holding Corp. (a) | | 14,529 | 668,479 |
| YAKUODO Holdings Co. Ltd. | | 18,796 | 330,001 |
| Yaoko Co. Ltd. | | 104,751 | 6,043,909 |
| | | | 162,939,942 |
| Food Products - 1.1% | | | |
| Armanino Foods of Distinction | | 149,886 | 723,949 |
| Axyz Co. Ltd. | | 2,391 | 48,173 |
| Carr's Group PLC (b) | | 665,986 | 1,080,325 |
| Century Pacific Food, Inc. | | 2,140,076 | 1,242,145 |
| Delfi Ltd. | | 371,472 | 303,366 |
| Food Empire Holdings Ltd. | | 2,724,956 | 2,735,324 |
| Gruma S.A.B. de CV Series B | | 59,764 | 1,118,785 |
| Inghams Group Ltd. | | 696,014 | 1,947,656 |
| Ingredion, Inc. | | 33,216 | 3,573,045 |
| Lamb Weston Holdings, Inc. | | 78,617 | 8,053,525 |
| Nomad Foods Ltd. | | 71,337 | 1,283,353 |
| Ottogi Corp. | | 8,893 | 2,665,837 |
| Pacific Andes International Holdings Ltd. (a)(d) | | 3,104,000 | 4 |
| Pacific Andes Resources Development Ltd. (a)(d) | | 1,379,862 | 10 |
| Pickles Holdings Co. Ltd. | | 42,595 | 372,223 |
| Rocky Mountain Chocolate Factory, Inc. (a) | | 67,258 | 269,032 |
| S Foods, Inc. | | 96,660 | 2,173,583 |
| Seaboard Corp. | | 1,808 | 6,514,224 |
| Sunjin Co. Ltd. | | 10,720 | 52,657 |
| Sunjuice Holdings Co. Ltd. | | 22,000 | 161,761 |
| Tate & Lyle PLC | | 557,291 | 4,399,968 |
| | | | 38,718,945 |
| Household Products - 0.0% | | | |
| Transaction Co. Ltd. | | 65,662 | 1,097,858 |
| Personal Care Products - 0.3% | | | |
| Hengan International Group Co. Ltd. | | 1,333,654 | 4,129,648 |
| Sarantis SA | | 452,776 | 4,296,186 |
| TCI Co. Ltd. | | 41,000 | 224,867 |
| | | | 8,650,701 |
| Tobacco - 0.1% | | | |
| KT&G Corp. | | 33,810 | 2,296,207 |
| Scandinavian Tobacco Group A/S (c) | | 84,171 | 1,509,515 |
| | | | 3,805,722 |
TOTAL CONSUMER STAPLES | | | 227,154,831 |
| ENERGY - 8.8% | | | |
| Energy Equipment & Services - 0.2% | | | |
| Cactus, Inc. | | 17,300 | 734,212 |
| John Wood Group PLC (a) | | 2,289,773 | 4,570,381 |
| PHX Energy Services Corp. | | 144,101 | 1,001,081 |
| Total Energy Services, Inc. | | 154,496 | 1,082,489 |
| Vallourec SA (a) | | 45,600 | 657,148 |
| | | | 8,045,311 |
| Oil, Gas & Consumable Fuels - 8.6% | | | |
| Antero Resources Corp. (a) | | 880,281 | 19,665,478 |
| Berry Corp. | | 504,268 | 3,383,638 |
| Bonterra Energy Corp. (a)(b) | | 66,046 | 239,730 |
| Cenovus Energy, Inc. (Canada) | | 1,378,106 | 22,325,225 |
| China Petroleum & Chemical Corp. (H Shares) | | 11,833,459 | 6,155,807 |
| Chord Energy Corp. | | 202,637 | 31,157,465 |
| Civitas Resources, Inc. (b) | | 359,985 | 23,330,628 |
| CNX Resources Corp. (a) | | 210,231 | 4,246,666 |
| Diamondback Energy, Inc. | | 68,939 | 10,598,682 |
| Energy Transfer LP | | 91,520 | 1,308,736 |
| Enterprise Products Partners LP | | 235,217 | 6,294,407 |
| Exxon Mobil Corp. | | 6,200 | 637,422 |
| INPEX Corp. | | 25,820 | 350,957 |
| Iwatani Corp. | | 11,801 | 527,345 |
| NACCO Industries, Inc. Class A | | 39,494 | 1,432,842 |
| Northern Oil & Gas, Inc. | | 226,421 | 7,585,104 |
| Oil & Natural Gas Corp. Ltd. | | 5,508,769 | 16,726,854 |
| Oil India Ltd. | | 1,763,400 | 9,051,704 |
| Ovintiv, Inc. | | 881,830 | 37,407,229 |
| Parkland Corp. | | 64,602 | 2,204,574 |
| Petronet LNG Ltd. | | 1,973,300 | 6,394,194 |
| Range Resources Corp. | | 835,845 | 24,272,939 |
| Scorpio Tankers, Inc. | | 8,098 | 572,529 |
| Shell PLC (London) | | 110,466 | 3,424,703 |
| Southwestern Energy Co. (a) | | 1,843,003 | 11,887,369 |
| TotalEnergies SE sponsored ADR (b) | | 788,737 | 51,409,878 |
| Unit Corp. | | 19,125 | 762,131 |
| Unit Corp. warrants 9/3/27 (a) | | 14,052 | 12,647 |
| | | | 303,366,883 |
TOTAL ENERGY | | | 311,412,194 |
| FINANCIALS - 15.8% | | | |
| Banks - 5.8% | | | |
| ACNB Corp. | | 45,519 | 1,776,607 |
| Associated Banc-Corp. | | 590,315 | 12,402,518 |
| Bar Harbor Bankshares | | 80,122 | 2,108,010 |
| Cadence Bank | | 475,887 | 12,668,112 |
| Camden National Corp. | | 40,944 | 1,475,212 |
| Central Pacific Financial Corp. | | 16,895 | 325,567 |
| Community Trust Bancorp, Inc. | | 7,474 | 310,171 |
| East West Bancorp, Inc. | | 108,710 | 7,915,175 |
| First Bancorp, Puerto Rico | | 366,523 | 6,113,604 |
| First Foundation, Inc. | | 2,823 | 26,875 |
| FNB Corp., Pennsylvania | | 680,769 | 8,972,535 |
| Intercorp Financial Services, Inc. | | 76,017 | 1,782,599 |
| KeyCorp | | 246,461 | 3,581,078 |
| Nicolet Bankshares, Inc. | | 24,747 | 1,924,574 |
| Oak Valley Bancorp Oakdale California (b) | | 15,461 | 402,759 |
| OFG Bancorp | | 11,728 | 431,239 |
| Plumas Bancorp | | 23,356 | 824,000 |
| QCR Holdings, Inc. | | 72,539 | 4,237,003 |
| Southern Missouri Bancorp, Inc. | | 35,775 | 1,560,148 |
| Sparebank 1 Oestlandet | | 254,924 | 2,966,811 |
| Sparebank 1 Sr Bank ASA (primary capital certificate) | | 138,059 | 1,677,619 |
| Sparebanken Nord-Norge | | 304,869 | 3,003,107 |
| Synovus Financial Corp. | | 426,254 | 16,052,726 |
| The First Bancorp, Inc. | | 21,925 | 548,125 |
| U.S. Bancorp | | 227,182 | 9,437,140 |
| Union Bankshares, Inc. | | 15,520 | 465,134 |
| United Community Bank, Inc. | | 381,091 | 10,419,028 |
| Unity Bancorp, Inc. | | 13,198 | 361,493 |
| Washington Trust Bancorp, Inc. | | 80,522 | 2,239,317 |
| Webster Financial Corp. | | 171,283 | 8,475,083 |
| Wells Fargo & Co. | | 1,348,682 | 67,676,866 |
| West Bancorp., Inc. | | 76,337 | 1,435,899 |
| Wintrust Financial Corp. | | 100,720 | 9,767,826 |
| | | | 203,363,960 |
| Capital Markets - 2.3% | | | |
| ABG Sundal Collier ASA | | 692,682 | 415,586 |
| Antin Infrastructure Partners SA | | 50,158 | 924,750 |
| Azimut Holding SpA | | 14,182 | 396,956 |
| Banca Generali SpA | | 42,379 | 1,621,284 |
| Bank of New York Mellon Corp. | | 13,836 | 767,345 |
| DWS Group GmbH & Co. KGaA (c) | | 18,951 | 777,844 |
| Federated Hermes, Inc. | | 340,262 | 11,895,560 |
| Korea Ratings Corp. | | 4,839 | 280,977 |
| Lazard, Inc. Class A | | 361,289 | 14,083,045 |
| LPL Financial | | 38,844 | 9,291,096 |
| Rathbone Brothers PLC | | 235,816 | 4,954,927 |
| Raymond James Financial, Inc. | | 204,467 | 22,528,174 |
| SEI Investments Co. | | 1,017 | 64,315 |
| Stifel Financial Corp. | | 130,753 | 9,538,431 |
| T. Rowe Price Group, Inc. | | 1,225 | 132,851 |
| Van Lanschot Kempen NV (Bearer) | | 113,603 | 3,431,443 |
| Vontobel Holdings AG | | 27,690 | 1,835,411 |
| | | | 82,939,995 |
| Consumer Finance - 1.2% | | | |
| Aeon Credit Service (Asia) Co. Ltd. | | 1,923,126 | 1,323,077 |
| Discover Financial Services | | 335,043 | 35,353,737 |
| OneMain Holdings, Inc. | | 106,949 | 5,090,772 |
| | | | 41,767,586 |
| Financial Services - 1.6% | | | |
| ASAX Co. Ltd. | | 1,332 | 6,757 |
| Enact Holdings, Inc. | | 155,740 | 4,437,033 |
| Essent Group Ltd. | | 217,006 | 11,970,051 |
| Far East Horizon Ltd. | | 433,170 | 317,563 |
| Federal Agricultural Mortgage Corp.: | | | |
| Class A (multi-vtg.) | | 612 | 94,352 |
| Class C (non-vtg.) | | 41,400 | 7,712,406 |
| FleetCor Technologies, Inc. (a) | | 74,526 | 21,607,323 |
| Fuyo General Lease Co. Ltd. | | 15,582 | 1,393,440 |
| Nice Information & Telecom, Inc. | | 46,280 | 752,135 |
| Tokyo Century Corp. | | 73,171 | 813,031 |
| Zenkoku Hosho Co. Ltd. | | 204,012 | 7,591,987 |
| | | | 56,696,078 |
| Insurance - 4.9% | | | |
| American Financial Group, Inc. | | 101,653 | 12,239,021 |
| ASR Nederland NV | | 253,621 | 11,980,396 |
| Db Insurance Co. Ltd. | | 37,780 | 2,492,218 |
| Direct Line Insurance Group PLC (a) | | 6,045,184 | 12,977,839 |
| First American Financial Corp. | | 87,668 | 5,290,764 |
| Grupo Catalana Occidente SA | | 49,906 | 1,787,893 |
| Hartford Financial Services Group, Inc. | | 54,352 | 4,726,450 |
| Hiscox Ltd. | | 13,627 | 179,430 |
| National Western Life Group, Inc. | | 727 | 351,868 |
| NN Group NV | | 136,808 | 5,607,518 |
| Primerica, Inc. | | 53,437 | 12,512,808 |
| Qualitas Controladora S.A.B. de CV | | 78,135 | 863,360 |
| Reinsurance Group of America, Inc. | | 226,813 | 39,440,513 |
| Selective Insurance Group, Inc. | | 140,397 | 14,722,029 |
| Stewart Information Services Corp. | | 68,747 | 4,238,940 |
| Talanx AG | | 67,129 | 4,719,137 |
| The Travelers Companies, Inc. | | 3,038 | 642,112 |
| Unum Group | | 792,366 | 38,302,972 |
| | | | 173,075,268 |
TOTAL FINANCIALS | | | 557,842,887 |
| HEALTH CARE - 11.4% | | | |
| Biotechnology - 0.5% | | | |
| Amgen, Inc. | | 413 | 129,789 |
| Cell Biotech Co. Ltd. | | 37,497 | 321,892 |
| Essex Bio-Technology Ltd. | | 1,358,024 | 446,862 |
| Gilead Sciences, Inc. | | 165,729 | 12,969,952 |
| Regeneron Pharmaceuticals, Inc. (a) | | 520 | 490,246 |
| United Therapeutics Corp. (a) | | 18,768 | 4,030,991 |
| | | | 18,389,732 |
| Health Care Equipment & Supplies - 0.9% | | | |
| Dentsply Sirona, Inc. | | 175,374 | 6,094,247 |
| Embecta Corp. | | 264,724 | 4,537,369 |
| Fukuda Denshi Co. Ltd. | | 217,428 | 11,593,561 |
| InBody Co. Ltd. | | 85,500 | 1,586,047 |
| Nakanishi, Inc. | | 47,626 | 779,440 |
| Prim SA | | 118,761 | 1,328,371 |
| Techno Medica Co. Ltd. | | 2,970 | 39,676 |
| Utah Medical Products, Inc. | | 25,866 | 2,048,846 |
| Value Added Technology Co. Ltd. | | 63,387 | 1,520,032 |
| Vieworks Co. Ltd. | | 43,800 | 895,272 |
| Zimmer Biomet Holdings, Inc. | | 3,740 | 469,744 |
| | | | 30,892,605 |
| Health Care Providers & Services - 8.4% | | | |
| Centene Corp. (a) | | 359,984 | 27,110,395 |
| Ci Medical Co. Ltd. | | 13,436 | 383,069 |
| Cigna Group | | 120,730 | 36,333,694 |
| CVS Health Corp. | | 99,739 | 7,417,589 |
| Elevance Health, Inc. | | 133,085 | 65,669,462 |
| Henry Schein, Inc. (a) | | 101,706 | 7,611,677 |
| Hi-Clearance, Inc. | | 186,882 | 796,698 |
| Humana, Inc. | | 47,490 | 17,954,069 |
| Laboratory Corp. of America Holdings | | 64,456 | 14,328,569 |
| Medica Sur SA de CV | | 140,874 | 333,124 |
| Quest Diagnostics, Inc. | | 54,633 | 7,016,516 |
| Select Medical Holdings Corp. | | 15,601 | 405,470 |
| Ship Healthcare Holdings, Inc. | | 74,838 | 1,135,806 |
| Sinopharm Group Co. Ltd. (H Shares) | | 5,198,931 | 13,670,511 |
| UnitedHealth Group, Inc. | | 104,491 | 53,472,224 |
| Universal Health Services, Inc. Class B | | 235,964 | 37,473,443 |
| WIN-Partners Co. Ltd. | | 254,473 | 2,200,580 |
| | | | 293,312,896 |
| Health Care Technology - 0.0% | | | |
| Software Service, Inc. | | 5,826 | 494,926 |
| Life Sciences Tools & Services - 0.5% | | | |
| ICON PLC (a) | | 69,805 | 18,210,030 |
| Pharmaceuticals - 1.1% | | | |
| China Medical System Holdings Ltd. | | 1,200,632 | 1,715,742 |
| Consun Pharmaceutical Group Ltd. | | 478,054 | 325,882 |
| Dai Han Pharmaceutical Co. Ltd. | | 32,100 | 676,445 |
| Daito Pharmaceutical Co. Ltd. | | 10,054 | 134,222 |
| Dawnrays Pharmaceutical Holdings Ltd. | | 7,780,641 | 1,111,125 |
| DongKook Pharmaceutical Co. Ltd. | | 158,280 | 2,116,306 |
| Faes Farma SA | | 373,054 | 1,227,621 |
| Genomma Lab Internacional SA de CV | | 268,248 | 220,066 |
| Granules India Ltd. | | 73,527 | 367,726 |
| Huons Co. Ltd. | | 78,866 | 2,029,644 |
| Hypera SA | | 232,300 | 1,487,744 |
| Jazz Pharmaceuticals PLC (a) | | 29,632 | 3,636,439 |
| Korea United Pharm, Inc. | | 4,980 | 91,284 |
| Kwang Dong Pharmaceutical Co. Ltd. | | 450,892 | 2,447,127 |
| Nippon Chemiphar Co. Ltd. | | 666 | 7,227 |
| Recordati SpA | | 75,843 | 4,204,729 |
| Sanofi SA | | 164,342 | 16,458,115 |
| Sanofi SA sponsored ADR | | 15,897 | 793,260 |
| Syngen Biotech Co. Ltd. | | 35,000 | 168,732 |
| | | | 39,219,436 |
TOTAL HEALTH CARE | | | 400,519,625 |
| INDUSTRIALS - 15.9% | | | |
| Aerospace & Defense - 0.7% | | | |
| Cadre Holdings, Inc. | | 179,694 | 6,107,799 |
| Huntington Ingalls Industries, Inc. | | 56,808 | 14,708,727 |
| Leonardo DRS, Inc. (a) | | 53,271 | 1,033,990 |
| Rheinmetall AG | | 3,280 | 1,151,317 |
| V2X, Inc. (a) | | 48,317 | 1,879,048 |
| | | | 24,880,881 |
| Air Freight & Logistics - 0.4% | | | |
| AIT Corp. | | 19,787 | 253,648 |
| Compania de Distribucion Integral Logista Holdings SA | | 157,297 | 4,460,560 |
| Hamakyorex Co. Ltd. | | 150,259 | 4,183,832 |
| SENKO Co. Ltd. | | 60,184 | 470,543 |
| Sinotrans Ltd. (H Shares) | | 3,608,783 | 1,505,489 |
| Trancom Co. Ltd. | | 72,108 | 3,417,239 |
| | | | 14,291,311 |
| Building Products - 0.8% | | | |
| Builders FirstSource, Inc. (a) | | 35,022 | 6,084,372 |
| Hayward Holdings, Inc. (a) | | 1,260,528 | 15,781,811 |
| Janus International Group, Inc. (a) | | 201,281 | 2,848,126 |
| Kondotec, Inc. | | 193,044 | 1,605,820 |
| Nihon Dengi Co. Ltd. | | 37,308 | 1,387,033 |
| Nihon Flush Co. Ltd. | | 135,605 | 864,309 |
| Owens Corning | | 4,246 | 643,396 |
| Sekisui Jushi Corp. | | 15,984 | 275,306 |
| | | | 29,490,173 |
| Commercial Services & Supplies - 1.0% | | | |
| Aeon Delight Co. Ltd. | | 23,978 | 614,197 |
| AJIS Co. Ltd. | | 85,543 | 1,533,229 |
| BIC SA | | 4,997 | 346,157 |
| Civeo Corp. | | 127,552 | 2,831,654 |
| CoreCivic, Inc. (a) | | 426,760 | 6,068,527 |
| CTS Co. Ltd. | | 23,782 | 112,460 |
| Fursys, Inc. | | 10,628 | 243,841 |
| Lion Rock Group Ltd. | | 1,796,848 | 239,383 |
| Mears Group PLC | | 29,978 | 130,310 |
| Mitie Group PLC | | 5,756,610 | 7,543,394 |
| Pilot Corp. | | 560 | 15,638 |
| Prestige International, Inc. | | 284,800 | 1,169,435 |
| Prosegur Compania de Seguridad SA (Reg.) | | 34,901 | 66,157 |
| S1 Corp. | | 38,950 | 1,663,604 |
| Takkt AG | | 78,672 | 1,149,482 |
| The GEO Group, Inc. (a) | | 252,884 | 2,812,070 |
| VSE Corp. | | 151,906 | 9,434,882 |
| | | | 35,974,420 |
| Construction & Engineering - 1.0% | | | |
| Boustead Singapore Ltd. | | 697,464 | 451,601 |
| Bowman Consulting Group Ltd. (a) | | 60,452 | 1,898,797 |
| Dai-Dan Co. Ltd. | | 23,901 | 265,282 |
| Daiichi Kensetsu Corp. | | 120,146 | 1,473,065 |
| EMCOR Group, Inc. | | 84,687 | 19,317,952 |
| Fuji Furukawa Engineering & Construction Co. Ltd. | | 1,707 | 63,760 |
| Geumhwa PSC Co. Ltd. | | 34,039 | 646,423 |
| Meisei Industrial Co. Ltd. | | 48,017 | 378,463 |
| Mirait One Corp. | | 38,728 | 511,673 |
| Nippon Rietec Co. Ltd. | | 78,608 | 690,639 |
| Primoris Services Corp. | | 113,126 | 3,710,533 |
| Raiznext Corp. | | 440,045 | 4,682,662 |
| Shinnihon Corp. | | 118,775 | 977,349 |
| Sinopec Engineering Group Co. Ltd. (H Shares) | | 9,958 | 4,995 |
| United Integrated Services Co. | | 32,200 | 284,930 |
| | | | 35,358,124 |
| Electrical Equipment - 1.4% | | | |
| Acuity Brands, Inc. | | 93,839 | 22,348,696 |
| Aichi Electric Co. Ltd. | | 37,924 | 1,012,106 |
| AQ Group AB | | 98,541 | 5,151,159 |
| Chiyoda Integre Co. Ltd. | | 40,586 | 759,412 |
| GrafTech International Ltd. | | 2,300,822 | 3,060,093 |
| Hammond Power Solutions, Inc. Class A (b) | | 36,070 | 2,494,543 |
| Korea Electric Terminal Co. Ltd. | | 59,986 | 3,118,462 |
| nVent Electric PLC | | 63,037 | 3,784,741 |
| Sensata Technologies, Inc. PLC | | 45,427 | 1,643,095 |
| TKH Group NV (bearer) (depositary receipt) | | 120,944 | 4,890,950 |
| Vitzrocell Co. Ltd. | | 12,100 | 158,734 |
| | | | 48,421,991 |
| Ground Transportation - 0.5% | | | |
| Alps Logistics Co. Ltd. | | 298,989 | 3,616,425 |
| Sakai Moving Service Co. Ltd. | | 310,472 | 5,901,293 |
| Stef SA | | 28,690 | 3,751,639 |
| Universal Logistics Holdings, Inc. | | 171,873 | 5,245,564 |
| | | | 18,514,921 |
| Industrial Conglomerates - 0.6% | | | |
| DCC PLC (United Kingdom) | | 225,722 | 16,465,469 |
| Mytilineos SA | | 72,064 | 2,959,423 |
| | | | 19,424,892 |
| Machinery - 3.0% | | | |
| Aalberts Industries NV | | 577,960 | 23,097,759 |
| Allison Transmission Holdings, Inc. | | 9,460 | 572,708 |
| Beijer Alma AB (B Shares) | | 175,357 | 3,090,377 |
| Crane Co. | | 138,921 | 17,241,485 |
| Daiwa Industries Ltd. | | 102,196 | 1,090,129 |
| EnPro Industries, Inc. | | 51,439 | 7,683,958 |
| ESAB Corp. | | 90,305 | 7,765,327 |
| Estic Corp. | | 44,920 | 280,994 |
| Haitian International Holdings Ltd. | | 805,019 | 1,791,897 |
| Hillenbrand, Inc. | | 375,925 | 17,506,827 |
| Hosokawa Micron Corp. | | 13,176 | 411,011 |
| Hy-Lok Corp. | | 11,000 | 204,848 |
| Hyster-Yale Materials Handling, Inc. Class A | | 1,350 | 88,722 |
| ITT, Inc. | | 71,474 | 8,632,630 |
| JOST Werke AG (c) | | 9,137 | 441,877 |
| Luxfer Holdings PLC sponsored | | 95,263 | 784,014 |
| Miller Industries, Inc. | | 39,496 | 1,589,714 |
| Mincon Group PLC | | 200,055 | 140,530 |
| Nadex Co. Ltd. | | 85,741 | 622,152 |
| Precision Tsugami China Corp. Ltd. | | 52,281 | 61,694 |
| Semperit AG Holding | | 24,840 | 389,247 |
| Shinwa Co. Ltd. | | 11,745 | 196,147 |
| SIMPAC, Inc. | | 127,420 | 371,253 |
| Stabilus Se | | 8,588 | 603,732 |
| Takamatsu Machinery Co. Ltd. | | 23,241 | 82,830 |
| Takeuchi Manufacturing Co. Ltd. | | 54,209 | 1,853,284 |
| Timken Co. | | 65,361 | 5,353,720 |
| TK Group Holdings Ltd. | | 901,185 | 155,472 |
| Tocalo Co. Ltd. | | 260,341 | 2,769,284 |
| Trinity Industrial Corp. | | 88,706 | 616,872 |
| Yamada Corp. | | 7,489 | 268,900 |
| | | | 105,759,394 |
| Marine Transportation - 0.0% | | | |
| SITC International Holdings Co. Ltd. | | 722,697 | 1,096,580 |
| Tokyo Kisen Co. Ltd. | | 22,940 | 98,908 |
| | | | 1,195,488 |
| Passenger Airlines - 0.1% | | | |
| Jet2 PLC | | 177,526 | 3,005,715 |
| Professional Services - 3.2% | | | |
| Altech Corp. | | 39,928 | 777,519 |
| Artner Co. Ltd. | | 27,547 | 409,021 |
| Barrett Business Services, Inc. | | 8,251 | 926,340 |
| CACI International, Inc. Class A (a) | | 43,877 | 15,081,841 |
| Careerlink Co. Ltd. | | 20,988 | 371,902 |
| Concentrix Corp. | | 226,200 | 20,102,394 |
| Creek & River Co. Ltd. | | 1,783 | 24,194 |
| E-Credible Co. Ltd. | | 27,075 | 266,601 |
| Gakujo Co. Ltd. | | 32,950 | 396,059 |
| Genpact Ltd. | | 595,884 | 21,392,236 |
| Hito Communications Holdings, Inc. | | 21,122 | 172,880 |
| HRnetgroup Ltd. | | 533,196 | 282,597 |
| IFIS Japan Ltd. | | 21,757 | 89,435 |
| KBR, Inc. | | 297,558 | 15,505,747 |
| Maximus, Inc. | | 192,043 | 15,578,528 |
| Open Up Group, Inc. | | 11,833 | 183,288 |
| Persol Holdings Co. Ltd. | | 1,301,123 | 2,068,410 |
| Quick Co. Ltd. | | 125,136 | 2,222,585 |
| Science Applications International Corp. | | 45,964 | 5,867,764 |
| SS&C Technologies Holdings, Inc. | | 660 | 40,273 |
| Synergie SA | | 14,422 | 500,306 |
| Verra Mobility Corp. (a) | | 342,242 | 8,183,006 |
| WDB Holdings Co. Ltd. | | 77,467 | 1,219,973 |
| Will Group, Inc. | | 124,506 | 1,020,365 |
| | | | 112,683,264 |
| Trading Companies & Distributors - 3.1% | | | |
| AerCap Holdings NV (a) | | 26,696 | 2,043,846 |
| Alconix Corp. | | 166,816 | 1,607,663 |
| Alligo AB (B Shares) | | 27,882 | 354,732 |
| Beacon Roofing Supply, Inc. (a) | | 124,875 | 10,350,889 |
| Bergman & Beving AB (B Shares) | | 47,685 | 833,954 |
| Bossard Holding AG | | 7,510 | 1,801,460 |
| Chori Co. Ltd. | | 133,589 | 2,695,897 |
| Core & Main, Inc. (a) | | 376,376 | 15,548,093 |
| Ferguson PLC | | 73,979 | 13,897,695 |
| Global Industrial Co. | | 162,748 | 6,921,672 |
| Goodfellow, Inc. | | 124,630 | 1,307,065 |
| Green Cross Co. Ltd. | | 56,316 | 392,174 |
| Horizon Construction Development Ltd. | | 4,141 | 1,398 |
| Inaba Denki Sangyo Co. Ltd. | | 44,294 | 1,058,352 |
| Itochu Corp. | | 459,835 | 20,869,209 |
| Kamei Corp. | | 13,588 | 178,671 |
| KS Energy Services Ltd. (a)(d) | | 882,902 | 8,556 |
| Lumax International Corp. Ltd. | | 148,200 | 426,642 |
| Mitani Shoji Co. Ltd. | | 365,695 | 4,887,721 |
| Momentum Group Komponenter & Tjanster AB | | 183,561 | 2,407,699 |
| Parker Corp. | | 192,037 | 1,069,039 |
| Richelieu Hardware Ltd. | | 83,975 | 2,712,034 |
| RS GROUP PLC | | 795,319 | 7,918,123 |
| Sanyo Trading Co. Ltd. | | 15,051 | 134,110 |
| Senshu Electric Co. Ltd. | | 180,901 | 4,599,265 |
| Thermador Groupe SA | | 709 | 65,818 |
| Totech Corp. | | 108,167 | 4,071,077 |
| Yamazen Co. Ltd. | | 15,708 | 134,331 |
| Yuasa Trading Co. Ltd. | | 43,934 | 1,463,843 |
| | | | 109,761,028 |
| Transportation Infrastructure - 0.1% | | | |
| Daito Koun Co. Ltd. | | 2,243 | 11,897 |
| Isewan Terminal Service Co. Ltd. | | 132,462 | 711,375 |
| Qingdao Port International Co. Ltd. (H Shares) (c) | | 2,285,237 | 1,279,018 |
| | | | 2,002,290 |
TOTAL INDUSTRIALS | | | 560,763,892 |
| INFORMATION TECHNOLOGY - 15.6% | | | |
| Electronic Equipment, Instruments & Components - 6.7% | | | |
| Advanced Energy Industries, Inc. | | 159,066 | 16,571,496 |
| Belden, Inc. | | 141,888 | 10,525,252 |
| CDW Corp. | | 99,685 | 22,600,583 |
| Crane Nxt Co. | | 279,226 | 16,273,291 |
| Daido Signal Co. Ltd. | | 67 | 192 |
| Daiwabo Holdings Co. Ltd. | | 176,896 | 3,846,552 |
| Dexerials Corp. | | 82,725 | 2,384,009 |
| Flex Ltd. (a) | | 321,026 | 7,621,157 |
| FLEXium Interconnect, Inc. | | 64,700 | 176,569 |
| Hon Hai Precision Industry Co. Ltd. (Foxconn) | | 4,029,900 | 13,185,447 |
| IDIS Holdings Co. Ltd. | | 82,849 | 700,873 |
| Insight Enterprises, Inc. (a) | | 88,525 | 16,354,109 |
| Jabil, Inc. | | 93,483 | 11,712,485 |
| Kingboard Chemical Holdings Ltd. | | 8,073,424 | 14,369,934 |
| Makus, Inc. | | 69,400 | 700,734 |
| Maruwa Ceramic Co. Ltd. | | 8,071 | 1,614,893 |
| Methode Electronics, Inc. Class A | | 292,541 | 6,073,151 |
| Nippo Ltd. | | 76,664 | 784,535 |
| PAX Global Technology Ltd. | | 6,742,805 | 4,712,366 |
| Redington (India) Ltd. | | 3,680,122 | 7,959,770 |
| Riken Keiki Co. Ltd. | | 15,730 | 777,167 |
| SAMT Co. Ltd. | | 8,500 | 16,994 |
| Shibaura Electronics Co. Ltd. | | 44,999 | 1,671,060 |
| Simplo Technology Co. Ltd. | | 912,000 | 11,804,742 |
| TD SYNNEX Corp. | | 313,523 | 31,346,030 |
| Test Research, Inc. | | 16,000 | 35,548 |
| Thinking Electronic Industries Co. Ltd. | | 498,900 | 2,529,911 |
| Tomen Devices Corp. | | 11,738 | 428,174 |
| Tripod Technology Corp. | | 504,000 | 3,010,105 |
| Vontier Corp. | | 507,727 | 17,562,277 |
| VSTECS Holdings Ltd. | | 11,190,584 | 6,029,956 |
| Yageo Corp. | | 152,000 | 2,674,100 |
| | | | 236,053,462 |
| IT Services - 2.9% | | | |
| ALTEN | | 14,391 | 2,236,428 |
| Amdocs Ltd. | | 357,080 | 32,737,094 |
| Argo Graphics, Inc. | | 88,617 | 2,600,315 |
| Asahi Intelligence Service Co. | | 4,103 | 38,571 |
| Avant Group Corp. | | 27,512 | 268,628 |
| CDS Co. Ltd. | | 33,007 | 383,542 |
| Cognizant Technology Solutions Corp. Class A | | 292,884 | 22,587,214 |
| CSE Global Ltd. | | 2,925,147 | 879,106 |
| Densan System Holdings Co. Ltd. | | 10,862 | 217,769 |
| Dimerco Data System Corp. | | 87,318 | 375,189 |
| DTS Corp. | | 70,241 | 1,727,609 |
| Econocom Group SA | | 563,494 | 1,437,164 |
| Exclusive Networks SA (a) | | 13,757 | 280,990 |
| Future Corp. | | 44,399 | 526,956 |
| Gabia, Inc. | | 97,100 | 1,250,970 |
| Himacs Ltd. | | 3,250 | 31,675 |
| Indra Sistemas SA | | 1,103,477 | 19,640,929 |
| Information Planning Co. | | 14,303 | 374,125 |
| Know IT AB (b) | | 45,178 | 609,513 |
| Neurones | | 8,416 | 412,466 |
| Pole To Win Holdings, Inc. (b) | | 29,390 | 99,693 |
| Sopra Steria Group | | 47,565 | 11,195,681 |
| TDC Soft, Inc. | | 65,358 | 1,010,822 |
| TIS, Inc. | | 56,956 | 1,266,806 |
| | | | 102,189,255 |
| Semiconductors & Semiconductor Equipment - 2.9% | | | |
| ASMPT Ltd. | | 496,131 | 4,787,853 |
| Japan Material Co. Ltd. | | 10,780 | 182,158 |
| Machvision, Inc. | | 22,000 | 193,588 |
| Melexis NV | | 11,908 | 1,030,805 |
| Micron Technology, Inc. | | 214,865 | 18,424,674 |
| MKS Instruments, Inc. | | 214,944 | 22,880,789 |
| Novatek Microelectronics Corp. | | 10,000 | 162,931 |
| Parade Technologies Ltd. | | 130,000 | 4,612,988 |
| Powertech Technology, Inc. | | 1,350,000 | 6,268,934 |
| Renesas Electronics Corp. (a) | | 560,387 | 9,194,598 |
| Skyworks Solutions, Inc. | | 142,274 | 14,861,942 |
| Sumco Corp. | | 242,781 | 3,680,664 |
| Systems Technology, Inc. | | 24,400 | 484,512 |
| Taiwan Semiconductor Manufacturing Co. Ltd. | | 472,000 | 9,450,695 |
| Topco Scientific Co. Ltd. | | 1,079,031 | 6,465,614 |
| | | | 102,682,745 |
| Software - 0.4% | | | |
| Cresco Ltd. | | 75,632 | 980,694 |
| Focus Systems Corp. | | 18,343 | 131,772 |
| Fukui Computer Holdings, Inc. | | 23,919 | 422,184 |
| Hecto Innovation Co. Ltd. | | 71,300 | 758,797 |
| Jastec Co. Ltd. | | 32,362 | 299,373 |
| Justsystems Corp. | | 12,051 | 251,793 |
| KSK Co., Ltd. | | 66,949 | 1,390,843 |
| Linedata Services | | 1,431 | 90,624 |
| NetGem SA | | 49,515 | 56,722 |
| NSW, Inc. | | 21,134 | 421,775 |
| Open Text Corp. | | 152,751 | 6,661,305 |
| Pro-Ship, Inc. | | 67,895 | 654,736 |
| System Research Co. Ltd. | | 15,598 | 315,538 |
| | | | 12,436,156 |
| Technology Hardware, Storage & Peripherals - 2.7% | | | |
| Dell Technologies, Inc. | | 254,382 | 21,083,180 |
| Elecom Co. Ltd. | | 66,153 | 769,362 |
| MCJ Co. Ltd. | | 322,087 | 2,700,831 |
| Samsung Electronics Co. Ltd. | | 241,740 | 13,135,535 |
| Seagate Technology Holdings PLC | | 629,608 | 53,944,813 |
| TSC Auto ID Technology Corp. | | 360,046 | 2,599,971 |
| | | | 94,233,692 |
TOTAL INFORMATION TECHNOLOGY | | | 547,595,310 |
| MATERIALS - 5.5% | | | |
| Chemicals - 2.9% | | | |
| Axalta Coating Systems Ltd. (a) | | 500,470 | 16,225,237 |
| C. Uyemura & Co. Ltd. | | 104,156 | 7,903,853 |
| Celanese Corp. Class A | | 90,233 | 13,200,186 |
| EcoGreen International Group Ltd. (a)(d) | | 5,839,887 | 354,818 |
| Element Solutions, Inc. | | 559,190 | 12,430,794 |
| Fujikura Kasei Co., Ltd. | | 42,296 | 131,165 |
| Gujarat Narmada Valley Fertilizers Co. | | 61,335 | 554,910 |
| Gujarat State Fertilizers & Chemicals Ltd. | | 1,360,187 | 4,897,857 |
| Huntsman Corp. | | 478,337 | 11,738,390 |
| Jcu Corp. | | 42,763 | 1,079,189 |
| LyondellBasell Industries NV Class A | | 264,699 | 24,913,470 |
| Miwon Commercial Co. Ltd. | | 2,800 | 350,990 |
| Muto Seiko Co. Ltd. | | 24,037 | 367,464 |
| Scientex Bhd | | 9,800 | 8,291 |
| Soulbrain Co. Ltd. | | 9,000 | 1,814,770 |
| Tronox Holdings PLC | | 392,350 | 5,410,507 |
| Yip's Chemical Holdings Ltd. | | 2,624,383 | 493,744 |
| | | | 101,875,635 |
| Construction Materials - 0.8% | | | |
| Buzzi SpA | | 48,066 | 1,637,304 |
| Eagle Materials, Inc. | | 51,514 | 11,656,588 |
| GCC S.A.B. de CV | | 39,471 | 455,838 |
| Mitani Sekisan Co. Ltd. | | 112,402 | 3,861,994 |
| RHI Magnesita NV | | 33,232 | 1,416,746 |
| SigmaRoc PLC (a) | | 2,044,495 | 1,684,143 |
| Vertex Corp. | | 3,400 | 40,921 |
| Wienerberger AG | | 223,897 | 7,617,074 |
| | | | 28,370,608 |
| Containers & Packaging - 0.8% | | | |
| Chuoh Pack Industry Co. Ltd. | | 45,402 | 445,057 |
| Corticeira Amorim SGPS SA | | 174,721 | 1,784,358 |
| Groupe Guillin SA | | 17,106 | 562,913 |
| Kohsoku Corp. | | 201,477 | 3,116,810 |
| Mayr-Melnhof Karton AG | | 26,453 | 3,499,141 |
| Packaging Corp. of America | | 79,998 | 13,270,068 |
| Silgan Holdings, Inc. | | 25,331 | 1,163,706 |
| The Pack Corp. | | 154,401 | 3,554,185 |
| | | | 27,396,238 |
| Metals & Mining - 0.5% | | | |
| Boliden AB | | 18,076 | 481,053 |
| CK-SAN-ETSU Co. Ltd. | | 4,295 | 114,321 |
| Hill & Smith Holdings PLC | | 61,760 | 1,466,751 |
| PRL Global Ltd. (d) | | 38,751 | 38,134 |
| Tohoku Steel Co. Ltd. | | 614 | 7,263 |
| Tokyo Tekko Co. Ltd. | | 51,167 | 1,791,825 |
| Warrior Metropolitan Coal, Inc. | | 193,837 | 12,438,520 |
| | | | 16,337,867 |
| Paper & Forest Products - 0.5% | | | |
| Miquel y Costas & Miquel SA | | 55,471 | 675,009 |
| Stella-Jones, Inc. | | 241,515 | 14,288,447 |
| Sylvamo Corp. | | 78,559 | 3,647,494 |
| Western Forest Products, Inc. | | 422,753 | 213,821 |
| | | | 18,824,771 |
TOTAL MATERIALS | | | 192,805,119 |
| REAL ESTATE - 0.9% | | | |
| Equity Real Estate Investment Trusts (REITs) - 0.1% | | | |
| Apple Hospitality (REIT), Inc. | | 27,576 | 442,871 |
| Mapletree Industrial (REIT) | | 592,125 | 1,078,471 |
| | | | 1,521,342 |
| Real Estate Management & Development - 0.8% | | | |
| Branicks Group AG (b) | | 144,769 | 333,242 |
| Instone Real Estate Group BV (c) | | 44,858 | 389,763 |
| Jones Lang LaSalle, Inc. (a) | | 88,386 | 15,649,625 |
| LSL Property Services PLC | | 186,173 | 625,233 |
| Real Matters, Inc. (a) | | 423,177 | 2,200,162 |
| Relo Group, Inc. | | 23,231 | 233,187 |
| Robinsons Land Corp. | | 3,704,904 | 1,051,887 |
| Savills PLC | | 528,653 | 6,786,715 |
| Selvaag Bolig ASA | | 59,863 | 179,579 |
| Servcorp Ltd. | | 102,356 | 219,824 |
| Tejon Ranch Co. (a) | | 57,380 | 905,456 |
| | | | 28,574,673 |
TOTAL REAL ESTATE | | | 30,096,015 |
| UTILITIES - 1.7% | | | |
| Electric Utilities - 1.6% | | | |
| Kansai Electric Power Co., Inc. | | 341,369 | 4,657,002 |
| PG&E Corp. | | 2,978,212 | 50,242,436 |
| Power Grid Corp. of India Ltd. | | 5,733 | 17,898 |
| Southern Co. | | 12,574 | 874,144 |
| | | | 55,791,480 |
| Gas Utilities - 0.0% | | | |
| China Resource Gas Group Ltd. | | 480,718 | 1,363,308 |
| Independent Power and Renewable Electricity Producers - 0.1% | | | |
| Mega First Corp. Bhd | | 4,501,400 | 3,691,262 |
| Vistra Corp. | | 17,459 | 716,343 |
| | | | 4,407,605 |
TOTAL UTILITIES | | | 61,562,393 |
| TOTAL COMMON STOCKS (Cost $2,840,443,845) | | | 3,440,695,413 |
| | | | |
| Nonconvertible Bonds - 0.0% |
| | | Principal Amount (e) | Value ($) |
| ENERGY - 0.0% | | | |
| Energy Equipment & Services - 0.0% | | | |
Bristow Group, Inc. 6.25% (d)(f) (Cost $0) | | 388,666 | 0 |
| | | | |
| Money Market Funds - 3.3% |
| | | Shares | Value ($) |
| Fidelity Cash Central Fund 5.39% (g) | | 74,165,204 | 74,180,037 |
| Fidelity Securities Lending Cash Central Fund 5.39% (g)(h) | | 44,210,750 | 44,215,171 |
| TOTAL MONEY MARKET FUNDS (Cost $118,395,207) | | | 118,395,208 |
| | | | |
| TOTAL INVESTMENT IN SECURITIES - 101.1% (Cost $2,958,839,052) | 3,559,090,621 |
NET OTHER ASSETS (LIABILITIES) - (1.1)% | (40,229,615) |
| NET ASSETS - 100.0% | 3,518,861,006 |
| | |
Legend
| (b) | Security or a portion of the security is on loan at period end. |
| (c) | Security exempt from registration under Rule 144A of the Securities Act of 1933. These securities may be resold in transactions exempt from registration, normally to qualified institutional buyers. At the end of the period, the value of these securities amounted to $7,377,040 or 0.2% of net assets. |
| (e) | Amount is stated in United States dollars unless otherwise noted. |
| (f) | Non-income producing - Security is in default. |
| (g) | Affiliated fund that is generally available only to investment companies and other accounts managed by Fidelity Investments. The rate quoted is the annualized seven-day yield of the fund at period end. A complete unaudited listing of the fund's holdings as of its most recent quarter end is available upon request. In addition, each Fidelity Central Fund's financial statements are available on the SEC's website or upon request. |
| (h) | Investment made with cash collateral received from securities on loan. |
Affiliated Central Funds
Fiscal year to date information regarding the Fund's investments in Fidelity Central Funds, including the ownership percentage, is presented below.
| Affiliate | Value, beginning of period ($) | Purchases ($) | Sales Proceeds ($) | Dividend Income ($) | Realized Gain (loss) ($) | Change in Unrealized appreciation (depreciation) ($) | Value, end of period ($) | % ownership, end of period |
| Fidelity Cash Central Fund 5.39% | 109,033,357 | 459,628,144 | 494,481,464 | 2,651,861 | - | - | 74,180,037 | 0.1% |
| Fidelity Securities Lending Cash Central Fund 5.39% | 33,475,452 | 285,748,454 | 275,008,735 | 53,205 | - | - | 44,215,171 | 0.2% |
| Total | 142,508,809 | 745,376,598 | 769,490,199 | 2,705,066 | - | - | 118,395,208 | |
| | | | | | | | | |
Amounts in the dividend income column in the above table include any capital gain distributions from underlying funds, which are presented in the corresponding line item in the Statement of Operations, if applicable.
Amounts in the dividend income column for Fidelity Securities Lending Cash Central Fund represents the income earned on investing cash collateral, less rebates paid to borrowers and any lending agent fees associated with the loan, plus any premium payments received for lending certain types of securities.
Amounts included in the purchases and sales proceeds columns may include in-kind transactions, if applicable.
Investment Valuation
The following is a summary of the inputs used, as of January 31, 2024, involving the Fund's assets and liabilities carried at fair value. The inputs or methodology used for valuing securities may not be an indication of the risk associated with investing in those securities. For more information on valuation inputs, and their aggregation into the levels used below, please refer to the Investment Valuation section in the accompanying Notes to Financial Statements.
| Valuation Inputs at Reporting Date: |
| Description | Total ($) | Level 1 ($) | Level 2 ($) | Level 3 ($) |
Investments in Securities: | | | | |
|
| Equities: | | | | |
Communication Services | 41,975,745 | 34,004,040 | 7,971,705 | - |
Consumer Discretionary | 508,967,402 | 441,949,998 | 66,847,137 | 170,267 |
Consumer Staples | 227,154,831 | 158,817,937 | 68,336,880 | 14 |
Energy | 311,412,194 | 268,780,630 | 42,631,564 | - |
Financials | 557,842,887 | 537,264,184 | 20,578,703 | - |
Health Care | 400,519,625 | 337,005,676 | 63,513,949 | - |
Industrials | 560,763,892 | 449,134,290 | 111,621,046 | 8,556 |
Information Technology | 547,595,310 | 386,812,164 | 160,783,146 | - |
Materials | 192,805,119 | 161,877,558 | 30,534,609 | 392,952 |
Real Estate | 30,096,015 | 27,512,646 | 2,583,369 | - |
Utilities | 61,562,393 | 51,832,923 | 9,729,470 | - |
|
| Corporate Bonds | - | - | - | - |
|
| Money Market Funds | 118,395,208 | 118,395,208 | - | - |
| Total Investments in Securities: | 3,559,090,621 | 2,973,387,254 | 585,131,578 | 571,789 |
| Statement of Assets and Liabilities |
| | | | January 31, 2024 (Unaudited) |
| | | | | |
| Assets | | | | |
| Investment in securities, at value (including securities loaned of $41,969,939) - See accompanying schedule: | | | | |
Unaffiliated issuers (cost $2,840,443,845) | $ | 3,440,695,413 | | |
Fidelity Central Funds (cost $118,395,207) | | 118,395,208 | | |
| | | | | |
| | | | | |
| Total Investment in Securities (cost $2,958,839,052) | | | $ | 3,559,090,621 |
| Cash | | | | 3,763 |
| Foreign currency held at value (cost $341,792) | | | | 341,823 |
| Receivable for investments sold | | | | 10,521,546 |
| Receivable for fund shares sold | | | | 2,321,783 |
| Dividends receivable | | | | 3,464,964 |
| Interest receivable | | | | 252 |
| Distributions receivable from Fidelity Central Funds | | | | 325,699 |
| Other receivables | | | | 42 |
Total assets | | | | 3,576,070,493 |
| Liabilities | | | | |
| Payable for investments purchased | $ | 2,399,510 | | |
| Payable for fund shares redeemed | | 6,431,305 | | |
| Accrued management fee | | 1,456,118 | | |
| Other payables and accrued expenses | | 2,708,792 | | |
| Collateral on securities loaned | | 44,213,762 | | |
| Total Liabilities | | | | 57,209,487 |
| Net Assets | | | $ | 3,518,861,006 |
| Net Assets consist of: | | | | |
| Paid in capital | | | $ | 2,865,447,074 |
| Total accumulated earnings (loss) | | | | 653,413,932 |
| Net Assets | | | $ | 3,518,861,006 |
Net Asset Value, offering price and redemption price per share ($3,518,861,006 ÷ 235,748,612 shares) | | | $ | 14.93 |
| Statement of Operations |
| | | | Six months ended January 31, 2024 (Unaudited) |
| Investment Income | | | | |
| Dividends | | | $ | 33,878,759 |
| Interest | | | | 1,108 |
| Income from Fidelity Central Funds (including $53,205 from security lending) | | | | 2,705,066 |
| Total Income | | | | 36,584,933 |
| Expenses | | | | |
| Management fee | $ | 8,216,500 | | |
| Independent trustees' fees and expenses | | 9,403 | | |
| Total expenses before reductions | | 8,225,903 | | |
| Expense reductions | | (3,434) | | |
| Total expenses after reductions | | | | 8,222,469 |
| Net Investment income (loss) | | | | 28,362,464 |
| Realized and Unrealized Gain (Loss) | | | | |
| Net realized gain (loss) on: | | | | |
| Investment Securities: | | | | |
| Unaffiliated issuers (net of foreign taxes of $161,408) | | 128,673,378 | | |
| Foreign currency transactions | | (183,875) | | |
| Total net realized gain (loss) | | | | 128,489,503 |
| Change in net unrealized appreciation (depreciation) on: | | | | |
| Investment Securities: | | | | |
| Unaffiliated issuers(net of increase in deferred foreign taxes of $1,199,789) | | 16,070,087 | | |
| Assets and liabilities in foreign currencies | | (34,849) | | |
| Total change in net unrealized appreciation (depreciation) | | | | 16,035,238 |
| Net gain (loss) | | | | 144,524,741 |
| Net increase (decrease) in net assets resulting from operations | | | $ | 172,887,205 |
| Statement of Changes in Net Assets |
| |
| | Six months ended January 31, 2024 (Unaudited) | | Year ended July 31, 2023 |
| Increase (Decrease) in Net Assets | | | | |
| Operations | | | | |
| Net investment income (loss) | $ | 28,362,464 | $ | 62,247,544 |
| Net realized gain (loss) | | 128,489,503 | | 93,234,683 |
| Change in net unrealized appreciation (depreciation) | | 16,035,238 | | 182,503,935 |
| Net increase (decrease) in net assets resulting from operations | | 172,887,205 | | 337,986,162 |
| Distributions to shareholders | | (224,506,444) | | (100,231,371) |
| | | | | |
| Share transactions | | | | |
| Proceeds from sales of shares | | 427,549,191 | | 845,051,056 |
| Reinvestment of distributions | | 224,505,035 | | 100,231,371 |
| Cost of shares redeemed | | (412,557,658) | | (707,363,698) |
| | | | | |
Net increase (decrease) in net assets resulting from share transactions | | 239,496,568 | | 237,918,729 |
| Total increase (decrease) in net assets | | 187,877,329 | | 475,673,520 |
| | | | | |
| Net Assets | | | | |
| Beginning of period | | 3,330,983,677 | | 2,855,310,157 |
| End of period | $ | 3,518,861,006 | $ | 3,330,983,677 |
| | | | | |
| Other Information | | | | |
| Shares | | | | |
| Sold | | 29,653,084 | | 60,030,634 |
| Issued in reinvestment of distributions | | 15,807,526 | | 7,285,754 |
| Redeemed | | (28,442,167) | | (49,989,301) |
| Net increase (decrease) | | 17,018,443 | | 17,327,087 |
| | | | | |
Financial Highlights
| Fidelity® Low-Priced Stock K6 Fund |
| |
| | Six months ended (Unaudited) January 31, 2024 | | Years ended July 31, 2023 | | 2022 | | 2021 | | 2020 | | 2019 |
Selected Per-Share Data | | | | | | | | | | | | |
| Net asset value, beginning of period | $ | 15.23 | $ | 14.18 | $ | 15.52 | $ | 10.82 | $ | 11.19 | $ | 11.52 |
| Income from Investment Operations | | | | | | | | | | | | |
Net investment income (loss) A,B | | .12 | | .29 | | .24 | | .17 | | .20 | | .20 |
| Net realized and unrealized gain (loss) | | .59 | | 1.25 | | (.76) | | 4.72 | | (.27) | | (.29) |
| Total from investment operations | | .71 | | 1.54 | | (.52) | | 4.89 | | (.07) | | (.09) |
| Distributions from net investment income | | (.29) | | (.22) | | (.20) | | (.19) | | (.22) | | (.17) |
| Distributions from net realized gain | | (.72) | | (.27) | | (.63) | | - | | (.08) | | (.06) |
| Total distributions | | (1.01) | | (.49) | | (.82) C | | (.19) | | (.30) | | (.24) C |
| Net asset value, end of period | $ | 14.93 | $ | 15.23 | $ | 14.18 | $ | 15.52 | $ | 10.82 | $ | 11.19 |
Total Return D,E | | 5.11% | | 11.23% | | (3.56)% | | 45.81% | | (.74)% | | (.73)% |
Ratios to Average Net Assets B,F,G | | | | | | | | | | | | |
| Expenses before reductions | | .50% H | | .50% | | .50% | | .50% | | .50% | | .50% |
| Expenses net of fee waivers, if any | | .50% H | | .50% | | .50% | | .50% | | .50% | | .50% |
| Expenses net of all reductions | | .50% H | | .50% | | .50% | | .50% | | .50% | | .50% |
| Net investment income (loss) | | 1.73% H | | 2.06% | | 1.63% | | 1.23% | | 1.86% | | 1.85% |
| Supplemental Data | | | | | | | | | | | | |
| Net assets, end of period (000 omitted) | $ | 3,518,861 | $ | 3,330,984 | $ | 2,855,310 | $ | 2,937,045 | $ | 1,861,492 | $ | 1,923,317 |
Portfolio turnover rate I,J | | 34% H | | 48% | | 25% | | 27% | | 21% | | 20% |
ACalculated based on average shares outstanding during the period.
BNet investment income (loss) is affected by the timing of the declaration of dividends by any underlying mutual funds or exchange-traded funds (ETFs). Net investment income (loss) of any mutual funds or ETFs is not included in the Fund's net investment income (loss) ratio.
CTotal distributions per share do not sum due to rounding.
DTotal returns for periods of less than one year are not annualized.
ETotal returns would have been lower if certain expenses had not been reduced during the applicable periods shown.
FFees and expenses of any underlying mutual funds or exchange-traded funds (ETFs) are not included in the Fund's expense ratio. The Fund indirectly bears its proportionate share of these expenses. For additional expense information related to investments in Fidelity Central Funds, please refer to the "Investments in Fidelity Central Funds" note found in the Notes to Financial Statements section of the most recent Annual or Semi-Annual report.
GExpense ratios reflect operating expenses of the class. Expenses before reductions do not reflect amounts reimbursed, waived, or reduced through arrangements with the investment adviser, brokerage services, or other offset arrangements, if applicable, and do not represent the amount paid by the class during periods when reimbursements, waivers or reductions occur.
HAnnualized.
IPortfolio turnover rate excludes securities received or delivered in-kind.
JAmount does not include the portfolio activity of any underlying mutual funds or exchange-traded funds (ETFs).
For the period ended January 31, 2024
1. Organization.
Fidelity Low-Priced Stock K6 Fund (the Fund) is a fund of Fidelity Puritan Trust (the Trust) and is authorized to issue an unlimited number of shares. Share transactions on the Statement of Changes in Net Assets may contain exchanges between affiliated funds. The Trust is registered under the Investment Company Act of 1940, as amended (the 1940 Act), as an open-end management investment company organized as a Massachusetts business trust. Shares generally are available only to employer-sponsored retirement plans that are recordkept by Fidelity, or to certain employer-sponsored retirement plans that are not recordkept by Fidelity.
2. Investments in Fidelity Central Funds.
Funds may invest in Fidelity Central Funds, which are open-end investment companies generally available only to other investment companies and accounts managed by the investment adviser and its affiliates. The Schedule of Investments lists any Fidelity Central Funds held as an investment as of period end, but does not include the underlying holdings of each Fidelity Central Fund. An investing fund indirectly bears its proportionate share of the expenses of the underlying Fidelity Central Funds.
Based on its investment objective, each Fidelity Central Fund may invest or participate in various investment vehicles or strategies that are similar to those of the investing fund. These strategies are consistent with the investment objectives of the investing fund and may involve certain economic risks which may cause a decline in value of each of the Fidelity Central Funds and thus a decline in the value of the investing fund.
| Fidelity Central Fund | Investment Manager | Investment Objective | Investment Practices | Expense RatioA |
| Fidelity Money Market Central Funds | Fidelity Management & Research Company LLC (FMR) | Each fund seeks to obtain a high level of current income consistent with the preservation of capital and liquidity. | Short-term Investments | Less than .005% |
A Expenses expressed as a percentage of average net assets and are as of each underlying Central Fund's most recent annual or semi-annual shareholder report.
A complete unaudited list of holdings for each Fidelity Central Fund is available upon request or at the Securities and Exchange Commission website at www.sec.gov. In addition, the financial statements of the Fidelity Central Funds which contain the significant accounting policies (including investment valuation policies) of those funds, and are not covered by the Report of Independent Registered Public Accounting Firm, are available on the Securities and Exchange Commission website or upon request.
3. Significant Accounting Policies.
The Fund is an investment company and applies the accounting and reporting guidance of the Financial Accounting Standards Board (FASB) Accounting Standards Codification Topic 946 Financial Services - Investment Companies. The financial statements have been prepared in conformity with accounting principles generally accepted in the United States of America (GAAP), which require management to make certain estimates and assumptions at the date of the financial statements. Actual results could differ from those estimates. Subsequent events, if any, through the date that the financial statements were issued have been evaluated in the preparation of the financial statements. The Fund's Schedule of Investments lists any underlying mutual funds or exchange-traded funds (ETFs) but does not include the underlying holdings of these funds. The following summarizes the significant accounting policies of the Fund:
Investment Valuation. Investments are valued as of 4:00 p.m. Eastern time on the last calendar day of the period. The Board of Trustees (the Board) has designated the Fund's investment adviser as the valuation designee responsible for the fair valuation function and performing fair value determinations as needed. The investment adviser has established a Fair Value Committee (the Committee) to carry out the day-to-day fair valuation responsibilities and has adopted policies and procedures to govern the fair valuation process and the activities of the Committee. In accordance with these fair valuation policies and procedures, which have been approved by the Board, the Fund attempts to obtain prices from one or more third party pricing services or brokers to value its investments. When current market prices, quotations or currency exchange rates are not readily available or reliable, investments will be fair valued in good faith by the Committee, in accordance with the policies and procedures. Factors used in determining fair value vary by investment type and may include market or investment specific events, transaction data, estimated cash flows, and market observations of comparable investments. The frequency that the fair valuation procedures are used cannot be predicted and they may be utilized to a significant extent. The Committee manages the Fund's fair valuation practices and maintains the fair valuation policies and procedures. The Fund's investment adviser reports to the Board information regarding the fair valuation process and related material matters.
The Fund categorizes the inputs to valuation techniques used to value its investments into a disclosure hierarchy consisting of three levels as shown below:
Level 1 - unadjusted quoted prices in active markets for identical investments
Level 2 - other significant observable inputs (including quoted prices for similar investments, interest rates, prepayment speeds, etc.)
Level 3 - unobservable inputs (including the Fund's own assumptions based on the best information available)
Valuation techniques used to value the Fund's investments by major category are as follows:
Equity securities, including restricted securities, for which market quotations are readily available, are valued at the last reported sale price or official closing price as reported by a third party pricing service on the primary market or exchange on which they are traded and are categorized as Level 1 in the hierarchy. In the event there were no sales during the day or closing prices are not available, securities are valued at the last quoted bid price or may be valued using the last available price and are generally categorized as Level 2 in the hierarchy. For foreign equity securities, when market or security specific events arise, comparisons to the valuation of American Depositary Receipts (ADRs), futures contracts, ETFs and certain indexes as well as quoted prices for similar securities may be used and would be categorized as Level 2 in the hierarchy. For equity securities, including restricted securities, where observable inputs are limited, assumptions about market activity and risk are used and these securities may be categorized as Level 3 in the hierarchy.
Debt securities, including restricted securities, are valued based on evaluated prices received from third party pricing services or from brokers who make markets in such securities. Corporate bonds are valued by pricing services who utilize matrix pricing which considers yield or price of bonds of comparable quality, coupon, maturity and type or by broker-supplied prices. When independent prices are unavailable or unreliable, debt securities may be valued utilizing pricing methodologies which consider similar factors that would be used by third party pricing services. Debt securities are generally categorized as Level 2 in the hierarchy but may be Level 3 depending on the circumstances.
Investments in open-end mutual funds, including the Fidelity Central Funds, are valued at their closing net asset value (NAV) each business day and are categorized as Level 1 in the hierarchy.
Changes in valuation techniques may result in transfers in or out of an assigned level within the disclosure hierarchy. The aggregate value of investments by input level as of January 31, 2024 is included at the end of the Fund's Schedule of Investments.
Foreign Currency. Certain Funds may use foreign currency contracts to facilitate transactions in foreign-denominated securities. Gains and losses from these transactions may arise from changes in the value of the foreign currency or if the counterparties do not perform under the contracts' terms.
Foreign-denominated assets, including investment securities, and liabilities are translated into U.S. dollars at the exchange rates at period end. Purchases and sales of investment securities, income and dividends received, and expenses denominated in foreign currencies are translated into U.S. dollars at the exchange rate in effect on the transaction date.
The effects of exchange rate fluctuations on investments are included with the net realized and unrealized gain (loss) on investment securities. Other foreign currency transactions resulting in realized and unrealized gain (loss) are disclosed separately.
Investment Transactions and Income. For financial reporting purposes, the Fund's investment holdings and NAV include trades executed through the end of the last business day of the period. The NAV per share for processing shareholder transactions is calculated as of the close of business of the New York Stock Exchange (NYSE), normally 4:00 p.m. Eastern time and includes trades executed through the end of the prior business day. Gains and losses on securities sold are determined on the basis of identified cost and include proceeds received from litigation. Commissions paid to certain brokers with whom the investment adviser, or its affiliates, places trades on behalf of a fund include an amount in addition to trade execution, which may be rebated back to a fund. Any such rebates are included in net realized gain (loss) on investments in the Statement of Operations. Dividend income is recorded on the ex-dividend date, except for certain dividends from foreign securities where the ex-dividend date may have passed, which are recorded as soon as the Fund is informed of the ex-dividend date. Non-cash dividends included in dividend income, if any, are recorded at the fair market value of the securities received. Income and capital gain distributions from Fidelity Central Funds, if any, are recorded on the ex-dividend date. Certain distributions received by the Fund represent a return of capital or capital gain. The Fund determines the components of these distributions subsequent to the ex-dividend date, based upon receipt of tax filings or other correspondence relating to the underlying investment. These distributions are recorded as a reduction of cost of investments and/or as a realized gain. Interest income is accrued as earned and includes coupon interest and amortization of premium and accretion of discount on debt securities as applicable. Investment income is recorded net of foreign taxes withheld where recovery of such taxes is uncertain. Debt obligations may be placed on non-accrual status and related interest income may be reduced by ceasing current accruals and writing off interest receivables when the collection of all or a portion of interest has become doubtful based on consistently applied procedures. A debt obligation is removed from non-accrual status when the issuer resumes interest payments or when collectability of interest is reasonably assured. Funds may file withholding tax reclaims in certain jurisdictions to recover a portion of amounts previously withheld. Any withholding tax reclaims income is included in the Statement of Operations in dividends. Any receivables for withholding tax reclaims are included in the Statement of Assets and Liabilities in dividends receivable.
Expenses. Expenses directly attributable to a fund are charged to that fund. Expenses attributable to more than one fund are allocated among the respective funds on the basis of relative net assets or other appropriate methods. Expenses included in the accompanying financial statements reflect the expenses of that fund and do not include any expenses associated with any underlying mutual funds or exchange-traded funds. Although not included in a fund's expenses, a fund indirectly bears its proportionate share of these expenses through the net asset value of each underlying mutual fund or exchange-traded fund. Expense estimates are accrued in the period to which they relate and adjustments are made when actual amounts are known.
Income Tax Information and Distributions to Shareholders. Each year, the Fund intends to qualify as a regulated investment company under Subchapter M of the Internal Revenue Code, including distributing substantially all of its taxable income and realized gains. As a result, no provision for U.S. Federal income taxes is required. The Fund files a U.S. federal tax return, in addition to state and local tax returns as required. The Fund's federal income tax returns are subject to examination by the Internal Revenue Service (IRS) for a period of three fiscal years after they are filed. State and local tax returns may be subject to examination for an additional fiscal year depending on the jurisdiction. Foreign taxes are provided for based on the Fund's understanding of the tax rules and rates that exist in the foreign markets in which it invests. The Fund is subject to a tax imposed on capital gains by certain countries in which it invests. An estimated deferred tax liability for net unrealized appreciation on the applicable securities is included in Other payables and accrued expenses on the Statement of Assets & Liabilities.
Distributions are declared and recorded on the ex-dividend date. Income and capital gain distributions are determined in accordance with income tax regulations, which may differ from GAAP.
Capital accounts within the financial statements are adjusted for permanent book-tax differences. These adjustments have no impact on net assets or the results of operations. Capital accounts are not adjusted for temporary book-tax differences which will reverse in a subsequent period.
Book-tax differences are primarily due to foreign currency transactions, certain foreign taxes, passive foreign investment companies (PFIC), partnerships and losses deferred due to wash sales and excise tax regulations.
As of period end, the cost and unrealized appreciation (depreciation) in securities, and derivatives if applicable, for federal income tax purposes were as follows:
| Gross unrealized appreciation | $754,970,890 |
| Gross unrealized depreciation | (160,011,172) |
| Net unrealized appreciation (depreciation) | $594,959,718 |
| Tax cost | $2,964,130,903 |
Restricted Securities (including Private Placements). Funds may invest in securities that are subject to legal or contractual restrictions on resale. These securities generally may be resold in transactions exempt from registration or to the public if the securities are registered. Disposal of these securities may involve time-consuming negotiations and expense, and prompt sale at an acceptable price may be difficult. Information regarding restricted securities held at period end is included at the end of the Schedule of Investments, if applicable.
4. Purchases and Sales of Investments.
Purchases and sales of securities, other than short-term securities and in-kind transactions, as applicable, are noted in the table below.
| | Purchases ($) | Sales ($) |
| Fidelity Low-Priced Stock K6 Fund | 545,037,626 | 583,390,484 |
Unaffiliated Exchanges In-Kind. Shares that were exchanged for investments, including accrued interest and cash, if any, are shown in the table below. The amount of in-kind exchanges is included in share transactions in the accompanying Statement of Changes in Net Assets.
| | Shares | Total Proceeds ($) |
| Fidelity Low-Priced Stock K6 Fund | 8,441,865 | 120,596,308 |
Prior Year Unaffiliated Exchanges In-Kind. Shares that were exchanged for investments, including accrued interest and cash, if any, are shown in the table below. The amount of in-kind exchanges is included in share transactions in the accompanying Statement of Changes in Net Assets.
| | Shares | Total Proceeds ($) |
| Fidelity Low-Priced Stock K6 Fund | 13,633,983 | 189,662,629 |
5. Fees and Other Transactions with Affiliates.
Management Fee. Fidelity Management & Research Company LLC (the investment adviser) and its affiliates provide the Fund with investment management related services for which the Fund pays a monthly management fee that is based on an annual rate of .50% of average net assets. Under the management contract, the investment adviser or an affiliate pays all other expenses of the Fund, excluding fees and expenses of the independent Trustees, and certain miscellaneous expenses such as proxy and shareholder meeting expenses.
Brokerage Commissions. A portion of portfolio transactions were placed with brokerage firms which are affiliates of the investment adviser. Brokerage commissions are included in net realized gain (loss) and change in net unrealized appreciation (depreciation) in the Statement of Operations. The commissions paid to these affiliated firms were as follows:
| | Amount |
| Fidelity Low-Priced Stock K6 Fund | $7,848 |
Interfund Trades. Funds may purchase from or sell securities to other Fidelity Funds under procedures adopted by the Board. The procedures have been designed to ensure these interfund trades are executed in accordance with Rule 17a-7 of the 1940 Act. Any interfund trades are included within the respective purchases and sales amounts shown in the Purchases and Sales of Investments note. Interfund trades during the period are noted in the table below.
| | Purchases ($) | Sales ($) | Realized Gain (Loss) ($) |
| Fidelity Low-Priced Stock K6 Fund | 44,708,962 | 23,123,147 | 5,418,392 |
Subsequent Event - Sub-Advisory Arrangements. Effective March 1, 2024, the Fund's sub-advisory agreements with FMR Investment Management (UK) Limited, Fidelity Management & Research (Hong Kong) Limited, and Fidelity Management & Research (Japan) Limited will be amended to provide that the investment adviser will pay each sub-adviser monthly fees equal to 110% of the sub-adviser's costs for providing sub-advisory services.
6. Committed Line of Credit.
Certain Funds participate with other funds managed by the investment adviser or an affiliate in a $4.25 billion credit facility (the "line of credit") to be utilized for temporary or emergency purposes to fund shareholder redemptions or for other short-term liquidity purposes. The commitment fees on the pro-rata portion of the line of credit are borne by the investment adviser. During the period, there were no borrowings on this line of credit.
7. Security Lending.
Funds lend portfolio securities from time to time in order to earn additional income. Lending agents are used, including National Financial Services (NFS), an affiliate of the investment adviser. Pursuant to a securities lending agreement, NFS will receive a fee, which is capped at 9.9% of a fund's daily lending revenue, for its services as lending agent. A fund may lend securities to certain qualified borrowers, including NFS. On the settlement date of the loan, a fund receives collateral (in the form of U.S. Treasury obligations, letters of credit and/or cash) against the loaned securities and maintains collateral in an amount not less than 100% of the market value of the loaned securities during the period of the loan. The market value of the loaned securities is determined at the close of business of a fund and any additional required collateral is delivered to a fund on the next business day. A fund or borrower may terminate the loan at any time, and if the borrower defaults on its obligation to return the securities loaned because of insolvency or other reasons, a fund may apply collateral received from the borrower against the obligation. A fund may experience delays and costs in recovering the securities loaned. Any cash collateral received is invested in the Fidelity Securities Lending Cash Central Fund. Any loaned securities are identified as such in the Schedule of Investments, and the value of loaned securities and cash collateral at period end, as applicable, are presented in the Statement of Assets and Liabilities. Security lending income represents the income earned on investing cash collateral, less rebates paid to borrowers and any lending agent fees associated with the loan, plus any premium payments received for lending certain types of securities. Security lending income is presented in the Statement of Operations as a component of income from Fidelity Central Funds. Affiliated security lending activity, if any, was as follows:
| | Total Security Lending Fees Paid to NFS | Security Lending Income From Securities Loaned to NFS | Value of Securities Loaned to NFS at Period End |
| Fidelity Low-Priced Stock K6 Fund | $5,676 | $2 | $- |
8. Expense Reductions.
Through arrangements with the Fund's custodian, credits realized as a result of certain uninvested cash balances were used to reduce the Fund's expenses by $3,434.
9. Other.
A fund's organizational documents provide former and current trustees and officers with a limited indemnification against liabilities arising in connection with the performance of their duties to the fund. In the normal course of business, a fund may also enter into contracts that provide general indemnifications. A fund's maximum exposure under these arrangements is unknown as this would be dependent on future claims that may be made against a fund. The risk of material loss from such claims is considered remote.
10. Risk and Uncertainties.
Many factors affect a fund's performance. Developments that disrupt global economies and financial markets, such as pandemics, epidemics, outbreaks of infectious diseases, war, terrorism, and environmental disasters, may significantly affect a fund's investment performance. The effects of these developments to a fund will be impacted by the types of securities in which a fund invests, the financial condition, industry, economic sector, and geographic location of an issuer, and a fund's level of investment in the securities of that issuer. Significant concentrations in security types, issuers, industries, sectors, and geographic locations may magnify the factors that affect a fund's performance.
As a shareholder, you incur two types of costs: (1) transaction costs, which may include sales charges (loads) on purchase payments or redemption proceeds, as applicable and (2) ongoing costs, which generally include management fees, distribution and/or service (12b-1) fees and other Fund expenses. This Example is intended to help you understand your ongoing costs (in dollars) of investing in a fund and to compare these costs with the ongoing costs of investing in other mutual funds.
| The Example is based on an investment of $1,000 invested at the beginning of the period and held for the entire period (August 1, 2023 to January 31, 2024). |
Actual Expenses
The first line of the accompanying table provides information about actual account values and actual expenses. You may use the information in this line, together with the amount you invested, to estimate the expenses that you paid over the period. Simply divide your account value by $1,000.00 (for example, an $8,600 account value divided by $1,000.00 = 8.6), then multiply the result by the number in the first line for a class/Fund under the heading entitled "Expenses Paid During Period" to estimate the expenses you paid on your account during this period. If any fund is a shareholder of any underlying mutual funds or exchange-traded funds (ETFs) (the Underlying Funds), such fund indirectly bears its proportional share of the expenses of the Underlying Funds in addition to the direct expenses incurred presented in the table. These fees and expenses are not included in the annualized expense ratio used to calculate the expense estimate in the table below.
Hypothetical Example for Comparison Purposes
The second line of the accompanying table provides information about hypothetical account values and hypothetical expenses based on the actual expense ratio and an assumed rate of return of 5% per year before expenses, which is not the actual return. The hypothetical account values and expenses may not be used to estimate the actual ending account balance or expenses you paid for the period. You may use this information to compare the ongoing costs of investing in the Fund and other funds. To do so, compare this 5% hypothetical example with the 5% hypothetical examples that appear in the shareholder reports of the other funds. If any fund is a shareholder of any Underlying Funds, such fund indirectly bears its proportional share of the expenses of the Underlying Funds in addition to the direct expenses as presented in the table. These fees and expenses are not included in the annualized expense ratio used to calculate the expense estimate in the table below.
Please note that the expenses shown in the table are meant to highlight your ongoing costs only and do not reflect any transaction costs. Therefore, the second line of the table is useful in comparing ongoing costs only, and will not help you determine the relative total costs of owning different funds. In addition, if these transactional costs were included, your costs would have been higher.
| | | | | Annualized Expense Ratio- A | | Beginning Account Value August 1, 2023 | | Ending Account Value January 31, 2024 | | Expenses Paid During Period- C August 1, 2023 to January 31, 2024 |
| | | | | | | | | | |
| Fidelity® Low-Priced Stock K6 Fund | | | | .50% | | | | | | |
| Actual | | | | | | $ 1,000 | | $ 1,051.10 | | $ 2.58 |
Hypothetical-B | | | | | | $ 1,000 | | $ 1,022.62 | | $ 2.54 |
| |
A Annualized expense ratio reflects expenses net of applicable fee waivers.
B 5% return per year before expenses
C Expenses are equal to the annualized expense ratio, multiplied by the average account value over the period, multiplied by 184/ 366 (to reflect the one-half year period). The fees and expenses of any Underlying Funds are not included in each annualized expense ratio.
Board Approval of Investment Advisory Contracts
At its January 2024 meeting, the Board of Trustees, including the Independent Trustees (together, the Board), approved amended and restated sub-advisory agreements (the Sub-Advisory Contracts) for the fund, including the fund's sub-advisory agreements with FMR Investment Management (UK) Limited (FMR UK), Fidelity Management & Research (Hong Kong) Limited (FMR H.K.), and Fidelity Management & Research (Japan) Limited (FMR Japan). The Sub-Advisory Contracts will be effective March 1, 2024. The Board will consider the annual renewal of the funds' Sub-Advisory Contracts in May 2024, following its review of additional materials provided by FMR.
The Board considered the Sub-Advisory Contracts, which simplified the calculation of the fees paid by FMR to the sub-advisers under the agreements. The Board noted that the agreements with FMR UK, FMR H.K., and FMR Japan were amended to provide that FMR will compensate each sub-adviser at a fee rate equal to 110% of the sub-adviser's costs incurred in providing services under the agreement. The Board considered that, under the Sub-Advisory Contracts, FMR, and not the fund, will continue to pay the sub-advisory fees to each applicable sub-adviser, and that the management fee paid by the fund under the management contract with FMR will remain unchanged.
The Board further considered that the approval of the fund's Sub-Advisory Contracts will not result in any changes in the investment process or strategies employed in the management of the fund's assets or the day-to-day management of the fund or the persons primarily responsible for such management. Further, the Board considered that the Sub-Advisory Contracts would not change the obligations and services of FMR and its affiliates on behalf of the fund, and, in particular, there would be no change in the nature and level of services provided to the fund by FMR and its affiliates.
In connection with its consideration of future renewals of the fund's advisory contracts, the Board will consider: (i) the nature, extent and quality of services provided to the funds, including shareholder and administrative services and investment performance; (ii) the competitiveness of the management fee and total expenses for the fund; (iii) the costs of the services and profitability, including the revenues earned and the expenses incurred in conducting the business of developing, marketing, distributing, managing, administering, and servicing the fund and its shareholders, to the extent applicable; and (iv) whether there have been economies of scale in respect of the Fidelity funds, whether the Fidelity funds (including the fund) have appropriately benefited from any such economies of scale, and whether there is the potential for realization of any further economies.
Based on its evaluation of all of the conclusions noted above, and after considering all factors it believed relevant, the Board concluded that the fund's management fee structure is fair and reasonable, and that the fund's Sub-Advisory Contracts should be approved.
The Securities and Exchange Commission adopted Rule 22e-4 under the Investment Company Act of 1940 (the Liquidity Rule) to promote effective liquidity risk management throughout the open-end investment company industry, thereby reducing the risk that funds will be unable to meet their redemption obligations and mitigating dilution of the interests of fund shareholders.
The Fund has adopted and implemented a liquidity risk management program (the Program) reasonably designed to assess and manage the Fund's liquidity risk and to comply with the requirements of the Liquidity Rule. The Fund's Board of Trustees (the Board) has designated the Fund's investment adviser as administrator of the Program. The Fidelity advisers have established a Liquidity Risk Management Committee (the LRM Committee) to manage the Program for each of the Fidelity Funds. The LRM Committee monitors the adequacy and effectiveness of implementation of the Program and on a periodic basis assesses each Fund's liquidity risk based on a variety of factors including (1) the Fund's investment strategy, (2) portfolio liquidity and cash flow projections during normal and reasonably foreseeable stressed conditions, (3) shareholder redemptions, (4) borrowings and other funding sources and (5) certain factors specific to ETFs including the effect of the Fund's prices and spreads, market participants, and basket compositions on the overall liquidity of the Fund's portfolio, as applicable.
In accordance with the Program, each of the Fund's portfolio investments is classified into one of four defined liquidity categories based on a determination of a reasonable expectation for how long it would take to convert the investment to cash (or sell or dispose of the investment) without significantly changing its market value.
- Highly liquid investments - cash or convertible to cash within three business days or less
- Moderately liquid investments - convertible to cash in three to seven calendar days
- Less liquid investments - can be sold or disposed of, but not settled, within seven calendar days
- Illiquid investments - cannot be sold or disposed of within seven calendar days
Liquidity classification determinations take into account a variety of factors including various market, trading and investment-specific considerations, as well as market depth, and generally utilize analysis from a third-party liquidity metrics service.
The Liquidity Rule places a 15% limit on a fund's illiquid investments and requires funds that do not primarily hold assets that are highly liquid investments to determine and maintain a minimum percentage of the fund's net assets to be invested in highly liquid investments (highly liquid investment minimum or HLIM). The Program includes provisions reasonably designed to comply with the 15% limit on illiquid investments and for determining, periodically reviewing and complying with the HLIM requirement as applicable.
At a recent meeting of the Fund's Board of Trustees, the LRM Committee provided a written report to the Board pertaining to the operation, adequacy, and effectiveness of the Program for the period December 1, 2022 through November 30, 2023. The report concluded that the Program is operating effectively and is reasonably designed to assess and manage the Fund's liquidity risk.
1.9883998.106
LPSK6-SANN-0324
Fidelity® Value Discovery K6 Fund
Semi-Annual Report
January 31, 2024
Contents
To view a fund's proxy voting guidelines and proxy voting record for the 12-month period ended June 30, visit http://www.fidelity.com/proxyvotingresults or visit the Securities and Exchange Commission's (SEC) web site at http://www.sec.gov.
You may also call 1-800-835-5092 to request a free copy of the proxy voting guidelines.
Standard & Poor's, S&P and S&P 500 are registered service marks of The McGraw-Hill Companies, Inc. and have been licensed for use by Fidelity Distributors Corporation.
Other third-party marks appearing herein are the property of their respective owners.
All other marks appearing herein are registered or unregistered trademarks or service marks of FMR LLC or an affiliated company. © 2024 FMR LLC. All rights reserved.
This report and the financial statements contained herein are submitted for the general information of the shareholders of the Fund. This report is not authorized for distribution to prospective investors in the Fund unless preceded or accompanied by an effective prospectus.
A fund files its complete schedule of portfolio holdings with the SEC for the first and third quarters of each fiscal year on Form N-PORT. Forms N-PORT are available on the SEC's web site at http://www.sec.gov. A fund's Forms N-PORT may be reviewed and copied at the SEC's Public Reference Room in Washington, DC. Information regarding the operation of the SEC's Public Reference Room may be obtained by calling 1-800-SEC-0330.
For a complete list of a fund's portfolio holdings, view the most recent holdings listing, semiannual report, or annual report on Fidelity's web site at http://www.fidelity.com, http://www.institutional.fidelity.com, or http://www.401k.com, as applicable.
NOT FDIC INSURED •MAY LOSE VALUE •NO BANK GUARANTEE
Neither the Fund nor Fidelity Distributors Corporation is a bank.
Top Holdings (% of Fund's net assets) |
| |
| Exxon Mobil Corp. | 4.1 | |
| Berkshire Hathaway, Inc. Class B | 3.8 | |
| JPMorgan Chase & Co. | 3.5 | |
| Comcast Corp. Class A | 3.4 | |
| Chubb Ltd. | 2.8 | |
| Cigna Group | 2.6 | |
| The Travelers Companies, Inc. | 2.6 | |
| Bank of America Corp. | 2.5 | |
| Centene Corp. | 2.4 | |
| Cisco Systems, Inc. | 2.2 | |
| | 29.9 | |
| |
| Market Sectors (% of Fund's net assets) |
| |
| Financials | 23.5 | |
| Health Care | 17.1 | |
| Consumer Staples | 13.1 | |
| Utilities | 9.2 | |
| Industrials | 8.7 | |
| Energy | 8.1 | |
| Information Technology | 7.1 | |
| Communication Services | 5.4 | |
| Consumer Discretionary | 3.3 | |
| Materials | 2.2 | |
| Real Estate | 1.0 | |
| |
Asset Allocation (% of Fund's net assets) |
|
|
Geographic Diversification (% of Fund's net assets) |
|
* Includes Short-Term investments and Net Other Assets (Liabilities). Percentages are adjusted for the effect of derivatives, if applicable. |
| |
Showing Percentage of Net Assets
| Common Stocks - 97.7% |
| | | Shares | Value ($) |
| COMMUNICATION SERVICES - 5.4% | | | |
| Entertainment - 2.0% | | | |
| The Walt Disney Co. | | 37,906 | 3,640,871 |
| Media - 3.4% | | | |
| Comcast Corp. Class A | | 136,314 | 6,344,054 |
TOTAL COMMUNICATION SERVICES | | | 9,984,925 |
| CONSUMER DISCRETIONARY - 3.3% | | | |
| Diversified Consumer Services - 2.3% | | | |
| H&R Block, Inc. | | 88,557 | 4,148,010 |
| Specialty Retail - 1.0% | | | |
| Ross Stores, Inc. | | 13,402 | 1,880,033 |
TOTAL CONSUMER DISCRETIONARY | | | 6,028,043 |
| CONSUMER STAPLES - 13.1% | | | |
| Beverages - 3.0% | | | |
| Coca-Cola European Partners PLC | | 22,735 | 1,566,442 |
| Diageo PLC | | 13,100 | 473,144 |
| Keurig Dr. Pepper, Inc. | | 43,696 | 1,373,802 |
| The Coca-Cola Co. | | 37,059 | 2,204,640 |
| | | | 5,618,028 |
| Consumer Staples Distribution & Retail - 1.5% | | | |
| BJ's Wholesale Club Holdings, Inc. (a) | | 15,416 | 991,865 |
| U.S. Foods Holding Corp. (a) | | 38,048 | 1,750,588 |
| | | | 2,742,453 |
| Food Products - 3.1% | | | |
| Lamb Weston Holdings, Inc. | | 8,196 | 839,598 |
| Mondelez International, Inc. | | 48,099 | 3,620,412 |
| Tyson Foods, Inc. Class A | | 22,319 | 1,222,188 |
| | | | 5,682,198 |
| Household Products - 2.5% | | | |
| Procter & Gamble Co. | | 17,485 | 2,747,593 |
| Reckitt Benckiser Group PLC | | 12,904 | 932,971 |
| The Clorox Co. | | 7,082 | 1,028,661 |
| | | | 4,709,225 |
| Personal Care Products - 3.0% | | | |
| Haleon PLC | | 307,686 | 1,249,748 |
| Kenvue, Inc. | | 154,397 | 3,205,282 |
| Unilever PLC sponsored ADR | | 21,568 | 1,050,146 |
| | | | 5,505,176 |
TOTAL CONSUMER STAPLES | | | 24,257,080 |
| ENERGY - 8.1% | | | |
| Oil, Gas & Consumable Fuels - 8.1% | | | |
| Antero Resources Corp. (a) | | 34,580 | 772,517 |
| ConocoPhillips Co. | | 2,458 | 274,976 |
| Equinor ASA sponsored ADR | | 41,518 | 1,190,321 |
| Exxon Mobil Corp. | | 74,310 | 7,639,810 |
| Occidental Petroleum Corp. | | 21,135 | 1,216,742 |
| Ovintiv, Inc. | | 24,815 | 1,052,652 |
| Parex Resources, Inc. | | 79,895 | 1,322,818 |
| Shell PLC ADR | | 24,192 | 1,521,919 |
| | | | 14,991,755 |
| FINANCIALS - 23.5% | | | |
| Banks - 10.5% | | | |
| Bank of America Corp. | | 138,758 | 4,719,160 |
| Cullen/Frost Bankers, Inc. | | 4,440 | 471,173 |
| JPMorgan Chase & Co. | | 37,365 | 6,514,961 |
| M&T Bank Corp. | | 8,359 | 1,154,378 |
| PNC Financial Services Group, Inc. | | 12,657 | 1,913,865 |
| U.S. Bancorp | | 20,978 | 871,426 |
| Wells Fargo & Co. | | 75,739 | 3,800,583 |
| | | | 19,445,546 |
| Capital Markets - 2.7% | | | |
| Affiliated Managers Group, Inc. | | 7,934 | 1,180,897 |
| BlackRock, Inc. Class A | | 3,762 | 2,912,954 |
| Northern Trust Corp. | | 12,168 | 969,060 |
| | | | 5,062,911 |
| Financial Services - 3.8% | | | |
| Berkshire Hathaway, Inc. Class B (a) | | 18,026 | 6,917,297 |
| Insurance - 6.5% | | | |
| Chubb Ltd. | | 21,283 | 5,214,335 |
| The Travelers Companies, Inc. | | 23,242 | 4,912,429 |
| Willis Towers Watson PLC | | 7,950 | 1,958,085 |
| | | | 12,084,849 |
TOTAL FINANCIALS | | | 43,510,603 |
| HEALTH CARE - 17.1% | | | |
| Health Care Providers & Services - 9.5% | | | |
| Centene Corp. (a) | | 59,348 | 4,469,498 |
| Cigna Group | | 16,397 | 4,934,677 |
| CVS Health Corp. | | 34,674 | 2,578,705 |
| Elevance Health, Inc. | | 5,122 | 2,527,400 |
| UnitedHealth Group, Inc. | | 6,211 | 3,178,417 |
| | | | 17,688,697 |
| Pharmaceuticals - 7.6% | | | |
| AstraZeneca PLC sponsored ADR | | 42,119 | 2,806,810 |
| Bristol-Myers Squibb Co. | | 64,491 | 3,151,675 |
| Johnson & Johnson | | 20,214 | 3,212,005 |
| Roche Holding AG (participation certificate) | | 7,905 | 2,250,683 |
| Sanofi SA sponsored ADR | | 52,940 | 2,641,706 |
| | | | 14,062,879 |
TOTAL HEALTH CARE | | | 31,751,576 |
| INDUSTRIALS - 8.7% | | | |
| Aerospace & Defense - 3.8% | | | |
| Airbus Group NV | | 6,770 | 1,078,365 |
| L3Harris Technologies, Inc. | | 7,602 | 1,584,409 |
| Lockheed Martin Corp. | | 4,031 | 1,730,952 |
| Northrop Grumman Corp. | | 6,118 | 2,733,278 |
| | | | 7,127,004 |
| Air Freight & Logistics - 0.5% | | | |
| DHL Group | | 19,179 | 922,755 |
| Electrical Equipment - 0.5% | | | |
| Eaton Corp. PLC | | 2,595 | 638,578 |
| Regal Rexnord Corp. | | 2,182 | 291,210 |
| | | | 929,788 |
| Industrial Conglomerates - 1.0% | | | |
| Siemens AG | | 10,567 | 1,891,745 |
| Machinery - 2.2% | | | |
| Deere & Co. | | 6,290 | 2,475,618 |
| Oshkosh Corp. | | 1,961 | 215,906 |
| Pentair PLC | | 19,417 | 1,420,742 |
| | | | 4,112,266 |
| Professional Services - 0.7% | | | |
| Maximus, Inc. | | 14,923 | 1,210,554 |
TOTAL INDUSTRIALS | | | 16,194,112 |
| INFORMATION TECHNOLOGY - 6.1% | | | |
| Communications Equipment - 2.2% | | | |
| Cisco Systems, Inc. | | 82,713 | 4,150,538 |
| IT Services - 2.5% | | | |
| Amdocs Ltd. | | 25,990 | 2,382,763 |
| Capgemini SA | | 5,333 | 1,194,171 |
| Cognizant Technology Solutions Corp. Class A | | 13,320 | 1,027,238 |
| | | | 4,604,172 |
| Software - 1.4% | | | |
| Gen Digital, Inc. | | 67,969 | 1,595,912 |
| Open Text Corp. | | 23,607 | 1,029,501 |
| | | | 2,625,413 |
TOTAL INFORMATION TECHNOLOGY | | | 11,380,123 |
| MATERIALS - 2.2% | | | |
| Chemicals - 1.3% | | | |
| CF Industries Holdings, Inc. | | 17,498 | 1,321,274 |
| Nutrien Ltd. | | 22,579 | 1,126,015 |
| | | | 2,447,289 |
| Containers & Packaging - 0.6% | | | |
| Crown Holdings, Inc. | | 12,672 | 1,121,472 |
| Metals & Mining - 0.3% | | | |
| Newmont Corp. | | 12,918 | 445,800 |
TOTAL MATERIALS | | | 4,014,561 |
| REAL ESTATE - 1.0% | | | |
| Equity Real Estate Investment Trusts (REITs) - 0.7% | | | |
| Crown Castle, Inc. | | 11,279 | 1,220,952 |
| Real Estate Management & Development - 0.3% | | | |
| CBRE Group, Inc. (a) | | 7,435 | 641,715 |
TOTAL REAL ESTATE | | | 1,862,667 |
| UTILITIES - 9.2% | | | |
| Electric Utilities - 5.9% | | | |
| Constellation Energy Corp. | | 17,478 | 2,132,316 |
| Edison International | | 32,473 | 2,191,278 |
| NextEra Energy, Inc. | | 16,330 | 957,428 |
| PG&E Corp. | | 243,533 | 4,108,402 |
| Southern Co. | | 22,475 | 1,562,462 |
| | | | 10,951,886 |
| Independent Power and Renewable Electricity Producers - 0.4% | | | |
| The AES Corp. | | 50,673 | 845,226 |
| Multi-Utilities - 2.9% | | | |
| Dominion Energy, Inc. | | 38,446 | 1,757,751 |
| National Grid PLC | | 96,028 | 1,279,007 |
| Sempra | | 32,047 | 2,293,283 |
| | | | 5,330,041 |
TOTAL UTILITIES | | | 17,127,153 |
| TOTAL COMMON STOCKS (Cost $143,631,014) | | | 181,102,598 |
| | | | |
| Nonconvertible Preferred Stocks - 1.0% |
| | | Shares | Value ($) |
| INFORMATION TECHNOLOGY - 1.0% | | | |
| Technology Hardware, Storage & Peripherals - 1.0% | | | |
Samsung Electronics Co. Ltd. (Cost $1,651,787) | | 43,335 | 1,896,181 |
| | | | |
| Money Market Funds - 1.1% |
| | | Shares | Value ($) |
Fidelity Cash Central Fund 5.39% (b) (Cost $2,106,400) | | 2,105,978 | 2,106,400 |
| | | | |
| TOTAL INVESTMENT IN SECURITIES - 99.8% (Cost $147,389,201) | 185,105,179 |
NET OTHER ASSETS (LIABILITIES) - 0.2% | 310,112 |
| NET ASSETS - 100.0% | 185,415,291 |
| | |
Legend
| (b) | Affiliated fund that is generally available only to investment companies and other accounts managed by Fidelity Investments. The rate quoted is the annualized seven-day yield of the fund at period end. A complete unaudited listing of the fund's holdings as of its most recent quarter end is available upon request. In addition, each Fidelity Central Fund's financial statements are available on the SEC's website or upon request. |
Affiliated Central Funds
Fiscal year to date information regarding the Fund's investments in Fidelity Central Funds, including the ownership percentage, is presented below.
| Affiliate | Value, beginning of period ($) | Purchases ($) | Sales Proceeds ($) | Dividend Income ($) | Realized Gain (loss) ($) | Change in Unrealized appreciation (depreciation) ($) | Value, end of period ($) | % ownership, end of period |
| Fidelity Cash Central Fund 5.39% | 1,567,728 | 23,323,168 | 22,784,496 | 90,455 | - | - | 2,106,400 | 0.0% |
| Fidelity Securities Lending Cash Central Fund 5.39% | 1,949,825 | 1,642,097 | 3,591,922 | 18,379 | - | - | - | 0.0% |
| Total | 3,517,553 | 24,965,265 | 26,376,418 | 108,834 | - | - | 2,106,400 | |
| | | | | | | | | |
Amounts in the dividend income column in the above table include any capital gain distributions from underlying funds, which are presented in the corresponding line item in the Statement of Operations, if applicable.
Amounts in the dividend income column for Fidelity Securities Lending Cash Central Fund represents the income earned on investing cash collateral, less rebates paid to borrowers and any lending agent fees associated with the loan, plus any premium payments received for lending certain types of securities.
Amounts included in the purchases and sales proceeds columns may include in-kind transactions, if applicable.
Investment Valuation
The following is a summary of the inputs used, as of January 31, 2024, involving the Fund's assets and liabilities carried at fair value. The inputs or methodology used for valuing securities may not be an indication of the risk associated with investing in those securities. For more information on valuation inputs, and their aggregation into the levels used below, please refer to the Investment Valuation section in the accompanying Notes to Financial Statements.
| Valuation Inputs at Reporting Date: |
| Description | Total ($) | Level 1 ($) | Level 2 ($) | Level 3 ($) |
Investments in Securities: | | | | |
|
| Equities: | | | | |
Communication Services | 9,984,925 | 9,984,925 | - | - |
Consumer Discretionary | 6,028,043 | 6,028,043 | - | - |
Consumer Staples | 24,257,080 | 21,601,217 | 2,655,863 | - |
Energy | 14,991,755 | 14,991,755 | - | - |
Financials | 43,510,603 | 43,510,603 | - | - |
Health Care | 31,751,576 | 29,500,893 | 2,250,683 | - |
Industrials | 16,194,112 | 13,224,002 | 2,970,110 | - |
Information Technology | 13,276,304 | 11,380,123 | 1,896,181 | - |
Materials | 4,014,561 | 4,014,561 | - | - |
Real Estate | 1,862,667 | 1,862,667 | - | - |
Utilities | 17,127,153 | 15,848,146 | 1,279,007 | - |
|
| Money Market Funds | 2,106,400 | 2,106,400 | - | - |
| Total Investments in Securities: | 185,105,179 | 174,053,335 | 11,051,844 | - |
| Statement of Assets and Liabilities |
| | | | January 31, 2024 (Unaudited) |
| | | | | |
| Assets | | | | |
| Investment in securities, at value - See accompanying schedule: | | | | |
Unaffiliated issuers (cost $145,282,801) | $ | 182,998,779 | | |
Fidelity Central Funds (cost $2,106,400) | | 2,106,400 | | |
| | | | | |
| | | | | |
| Total Investment in Securities (cost $147,389,201) | | | $ | 185,105,179 |
| Foreign currency held at value (cost $49) | | | | 49 |
| Receivable for investments sold | | | | 735,364 |
| Receivable for fund shares sold | | | | 47,111 |
| Dividends receivable | | | | 203,133 |
| Distributions receivable from Fidelity Central Funds | | | | 8,817 |
Total assets | | | | 186,099,653 |
| Liabilities | | | | |
| Payable for investments purchased | $ | 574,934 | | |
| Payable for fund shares redeemed | | 40,130 | | |
| Accrued management fee | | 69,298 | | |
| Total Liabilities | | | | 684,362 |
| Net Assets | | | $ | 185,415,291 |
| Net Assets consist of: | | | | |
| Paid in capital | | | $ | 145,877,221 |
| Total accumulated earnings (loss) | | | | 39,538,070 |
| Net Assets | | | $ | 185,415,291 |
Net Asset Value, offering price and redemption price per share ($185,415,291 ÷ 15,444,311 shares) | | | $ | 12.01 |
| Statement of Operations |
| | | | Six months ended January 31, 2024 (Unaudited) |
| Investment Income | | | | |
| Dividends | | | $ | 2,080,096 |
| Income from Fidelity Central Funds (including $18,379 from security lending) | | | | 108,834 |
| Total Income | | | | 2,188,930 |
| Expenses | | | | |
| Management fee | $ | 413,673 | | |
| Independent trustees' fees and expenses | | 545 | | |
| Total expenses before reductions | | 414,218 | | |
| Expense reductions | | (546) | | |
| Total expenses after reductions | | | | 413,672 |
| Net Investment income (loss) | | | | 1,775,258 |
| Realized and Unrealized Gain (Loss) | | | | |
| Net realized gain (loss) on: | | | | |
| Investment Securities: | | | | |
| Unaffiliated issuers | | 2,459,123 | | |
| Foreign currency transactions | | 1,606 | | |
| Total net realized gain (loss) | | | | 2,460,729 |
| Change in net unrealized appreciation (depreciation) on: | | | | |
| Investment Securities: | | | | |
| Unaffiliated issuers | | (1,898,761) | | |
| Assets and liabilities in foreign currencies | | (3,545) | | |
| Total change in net unrealized appreciation (depreciation) | | | | (1,902,306) |
| Net gain (loss) | | | | 558,423 |
| Net increase (decrease) in net assets resulting from operations | | | $ | 2,333,681 |
| Statement of Changes in Net Assets |
| |
| | Six months ended January 31, 2024 (Unaudited) | | Year ended July 31, 2023 |
| Increase (Decrease) in Net Assets | | | | |
| Operations | | | | |
| Net investment income (loss) | $ | 1,775,258 | $ | 3,106,287 |
| Net realized gain (loss) | | 2,460,729 | | 4,336,755 |
| Change in net unrealized appreciation (depreciation) | | (1,902,306) | | 8,108,400 |
| Net increase (decrease) in net assets resulting from operations | | 2,333,681 | | 15,551,442 |
| Distributions to shareholders | | (8,769,141) | | (13,940,304) |
| | | | | |
| Share transactions | | | | |
| Proceeds from sales of shares | | 19,415,918 | | 115,401,725 |
| Reinvestment of distributions | | 8,769,141 | | 13,940,304 |
| Cost of shares redeemed | | (30,622,864) | | (74,114,191) |
| | | | | |
Net increase (decrease) in net assets resulting from share transactions | | (2,437,805) | | 55,227,838 |
| Total increase (decrease) in net assets | | (8,873,265) | | 56,838,976 |
| | | | | |
| Net Assets | | | | |
| Beginning of period | | 194,288,556 | | 137,449,580 |
| End of period | $ | 185,415,291 | $ | 194,288,556 |
| | | | | |
| Other Information | | | | |
| Shares | | | | |
| Sold | | 1,651,161 | | 10,110,184 |
| Issued in reinvestment of distributions | | 755,476 | | 1,185,215 |
| Redeemed | | (2,632,452) | | (6,205,102) |
| Net increase (decrease) | | (225,815) | | 5,090,297 |
| | | | | |
Financial Highlights
| Fidelity® Value Discovery K6 Fund |
| |
| | Six months ended (Unaudited) January 31, 2024 | | Years ended July 31, 2023 | | 2022 | | 2021 | | 2020 | | 2019 |
Selected Per-Share Data | | | | | | | | | | | | |
| Net asset value, beginning of period | $ | 12.40 | $ | 12.99 | $ | 14.22 | $ | 10.15 | $ | 10.94 | $ | 10.98 |
| Income from Investment Operations | | | | | | | | | | | | |
Net investment income (loss) A,B | | .11 | | .21 | | .21 | | .19 | | .23 C | | .22 |
| Net realized and unrealized gain (loss) | | .07 | | .51 | | (.12) | | 4.09 | | (.62) | | .09 |
| Total from investment operations | | .18 | | .72 | | .09 | | 4.28 | | (.39) | | .31 |
| Distributions from net investment income | | (.22) | | (.17) | | (.20) | | (.21) | | (.23) | | (.27) |
| Distributions from net realized gain | | (.35) | | (1.14) | | (1.12) | | - | | (.17) | | (.08) |
| Total distributions | | (.57) | | (1.31) | | (1.32) | | (.21) | | (.40) | | (.35) |
| Net asset value, end of period | $ | 12.01 | $ | 12.40 | $ | 12.99 | $ | 14.22 | $ | 10.15 | $ | 10.94 |
Total Return D,E | | 1.62% | | 6.14% | | .60% | | 42.84% | | (3.80)% | | 2.98% |
Ratios to Average Net Assets B,F,G | | | | | | | | | | | | |
| Expenses before reductions | | .45% H | | .45% | | .45% | | .45% | | .45% | | .45% |
| Expenses net of fee waivers, if any | | .45% H | | .45% | | .45% | | .45% | | .45% | | .45% |
| Expenses net of all reductions | | .45% H | | .45% | | .45% | | .45% | | .44% | | .45% |
| Net investment income (loss) | | 1.93% H | | 1.76% | | 1.52% | | 1.51% | | 2.27% C | | 2.13% |
| Supplemental Data | | | | | | | | | | | | |
| Net assets, end of period (000 omitted) | $ | 185,415 | $ | 194,289 | $ | 137,450 | $ | 180,575 | $ | 164,392 | $ | 191,701 |
Portfolio turnover rate I | | 29% H | | 43% J | | 37% J | | 55% | | 82% | | 45% |
ACalculated based on average shares outstanding during the period.
BNet investment income (loss) is affected by the timing of the declaration of dividends by any underlying mutual funds or exchange-traded funds (ETFs). Net investment income (loss) of any mutual funds or ETFs is not included in the Fund's net investment income (loss) ratio.
CNet investment income per share reflects one or more large, non-recurring dividend(s) which amounted to $.03 per share. Excluding such non-recurring dividend(s), the ratio of net investment income (loss) to average net assets would have been 1.93%.
DTotal returns for periods of less than one year are not annualized.
ETotal returns would have been lower if certain expenses had not been reduced during the applicable periods shown.
FFees and expenses of any underlying mutual funds or exchange-traded funds (ETFs) are not included in the Fund's expense ratio. The Fund indirectly bears its proportionate share of these expenses. For additional expense information related to investments in Fidelity Central Funds, please refer to the "Investments in Fidelity Central Funds" note found in the Notes to Financial Statements section of the most recent Annual or Semi-Annual report.
GExpense ratios reflect operating expenses of the class. Expenses before reductions do not reflect amounts reimbursed, waived, or reduced through arrangements with the investment adviser, brokerage services, or other offset arrangements, if applicable, and do not represent the amount paid by the class during periods when reimbursements, waivers or reductions occur.
HAnnualized.
IAmount does not include the portfolio activity of any underlying mutual funds or exchange-traded funds (ETFs).
JPortfolio turnover rate excludes securities received or delivered in-kind.
For the period ended January 31, 2024
1. Organization.
Fidelity Value Discovery K6 Fund (the Fund) is a fund of Fidelity Puritan Trust (the Trust) and is authorized to issue an unlimited number of shares. Share transactions on the Statement of Changes in Net Assets may contain exchanges between affiliated funds. The Trust is registered under the Investment Company Act of 1940, as amended (the 1940 Act), as an open-end management investment company organized as a Massachusetts business trust. Shares generally are available only to employer-sponsored retirement plans that are recordkept by Fidelity, or to certain employer-sponsored retirement plans that are not recordkept by Fidelity.
2. Investments in Fidelity Central Funds.
Funds may invest in Fidelity Central Funds, which are open-end investment companies generally available only to other investment companies and accounts managed by the investment adviser and its affiliates. The Schedule of Investments lists any Fidelity Central Funds held as an investment as of period end, but does not include the underlying holdings of each Fidelity Central Fund. An investing fund indirectly bears its proportionate share of the expenses of the underlying Fidelity Central Funds.
Based on its investment objective, each Fidelity Central Fund may invest or participate in various investment vehicles or strategies that are similar to those of the investing fund. These strategies are consistent with the investment objectives of the investing fund and may involve certain economic risks which may cause a decline in value of each of the Fidelity Central Funds and thus a decline in the value of the investing fund.
| Fidelity Central Fund | Investment Manager | Investment Objective | Investment Practices | Expense RatioA |
| Fidelity Money Market Central Funds | Fidelity Management & Research Company LLC (FMR) | Each fund seeks to obtain a high level of current income consistent with the preservation of capital and liquidity. | Short-term Investments | Less than .005% |
A Expenses expressed as a percentage of average net assets and are as of each underlying Central Fund's most recent annual or semi-annual shareholder report.
A complete unaudited list of holdings for each Fidelity Central Fund is available upon request or at the Securities and Exchange Commission website at www.sec.gov. In addition, the financial statements of the Fidelity Central Funds which contain the significant accounting policies (including investment valuation policies) of those funds, and are not covered by the Report of Independent Registered Public Accounting Firm, are available on the Securities and Exchange Commission website or upon request.
3. Significant Accounting Policies.
The Fund is an investment company and applies the accounting and reporting guidance of the Financial Accounting Standards Board (FASB) Accounting Standards Codification Topic 946 Financial Services - Investment Companies. The financial statements have been prepared in conformity with accounting principles generally accepted in the United States of America (GAAP), which require management to make certain estimates and assumptions at the date of the financial statements. Actual results could differ from those estimates. Subsequent events, if any, through the date that the financial statements were issued have been evaluated in the preparation of the financial statements. The Fund's Schedule of Investments lists any underlying mutual funds or exchange-traded funds (ETFs) but does not include the underlying holdings of these funds. The following summarizes the significant accounting policies of the Fund:
Investment Valuation. Investments are valued as of 4:00 p.m. Eastern time on the last calendar day of the period. The Board of Trustees (the Board) has designated the Fund's investment adviser as the valuation designee responsible for the fair valuation function and performing fair value determinations as needed. The investment adviser has established a Fair Value Committee (the Committee) to carry out the day-to-day fair valuation responsibilities and has adopted policies and procedures to govern the fair valuation process and the activities of the Committee. In accordance with these fair valuation policies and procedures, which have been approved by the Board, the Fund attempts to obtain prices from one or more third party pricing services or brokers to value its investments. When current market prices, quotations or currency exchange rates are not readily available or reliable, investments will be fair valued in good faith by the Committee, in accordance with the policies and procedures. Factors used in determining fair value vary by investment type and may include market or investment specific events, transaction data, estimated cash flows, and market observations of comparable investments. The frequency that the fair valuation procedures are used cannot be predicted and they may be utilized to a significant extent. The Committee manages the Fund's fair valuation practices and maintains the fair valuation policies and procedures. The Fund's investment adviser reports to the Board information regarding the fair valuation process and related material matters.
The Fund categorizes the inputs to valuation techniques used to value its investments into a disclosure hierarchy consisting of three levels as shown below:
Level 1 - unadjusted quoted prices in active markets for identical investments
Level 2 - other significant observable inputs (including quoted prices for similar investments, interest rates, prepayment speeds, etc.)
Level 3 - unobservable inputs (including the Fund's own assumptions based on the best information available)
Valuation techniques used to value the Fund's investments by major category are as follows:
Equity securities, including restricted securities, for which market quotations are readily available, are valued at the last reported sale price or official closing price as reported by a third party pricing service on the primary market or exchange on which they are traded and are categorized as Level 1 in the hierarchy. In the event there were no sales during the day or closing prices are not available, securities are valued at the last quoted bid price or may be valued using the last available price and are generally categorized as Level 2 in the hierarchy. For foreign equity securities, when market or security specific events arise, comparisons to the valuation of American Depositary Receipts (ADRs), futures contracts, ETFs and certain indexes as well as quoted prices for similar securities may be used and would be categorized as Level 2 in the hierarchy. For equity securities, including restricted securities, where observable inputs are limited, assumptions about market activity and risk are used and these securities may be categorized as Level 3 in the hierarchy.
Investments in open-end mutual funds ,including the Fidelity Central Funds, are valued at their closing net asset value (NAV) each business day and are categorized as Level 1 in the hierarchy
Changes in valuation techniques may result in transfers in or out of an assigned level within the disclosure hierarchy. The aggregate value of investments by input level as of January 31, 2024, is included at the end of the Fund's Schedule of Investments.
Foreign Currency. Certain Funds may use foreign currency contracts to facilitate transactions in foreign-denominated securities. Gains and losses from these transactions may arise from changes in the value of the foreign currency or if the counterparties do not perform under the contracts' terms.
Foreign-denominated assets, including investment securities, and liabilities are translated into U.S. dollars at the exchange rates at period end. Purchases and sales of investment securities, income and dividends received, and expenses denominated in foreign currencies are translated into U.S. dollars at the exchange rate in effect on the transaction date.
The effects of exchange rate fluctuations on investments are included with the net realized and unrealized gain (loss) on investment securities. Other foreign currency transactions resulting in realized and unrealized gain (loss) are disclosed separately.
Investment Transactions and Income. For financial reporting purposes, the Fund's investment holdings and NAV include trades executed through the end of the last business day of the period. The NAV per share for processing shareholder transactions is calculated as of the close of business of the New York Stock Exchange (NYSE), normally 4:00 p.m. Eastern time and includes trades executed through the end of the prior business day. Gains and losses on securities sold are determined on the basis of identified cost and include proceeds received from litigation. Commissions paid to certain brokers with whom the investment adviser, or its affiliates, places trades on behalf of a fund include an amount in addition to trade execution, which may be rebated back to a fund. Any such rebates are included in net realized gain (loss) on investments in the Statement of Operations. Dividend income is recorded on the ex-dividend date, except for certain dividends from foreign securities where the ex-dividend date may have passed, which are recorded as soon as the Fund is informed of the ex-dividend date. Non-cash dividends included in dividend income, if any, are recorded at the fair market value of the securities received. Income and capital gain distributions from Fidelity Central Funds, if any, are recorded on the ex-dividend date. Certain distributions received by the Fund represent a return of capital or capital gain. The Fund determines the components of these distributions subsequent to the ex-dividend date, based upon receipt of tax filings or other correspondence relating to the underlying investment. These distributions are recorded as a reduction of cost of investments and/or as a realized gain. Investment income is recorded net of foreign taxes withheld where recovery of such taxes is uncertain. Funds may file withholding tax reclaims in certain jurisdictions to recover a portion of amounts previously withheld. Any withholding tax reclaims income is included in the Statement of Operations in dividends. Any receivables for withholding tax reclaims are included in the Statement of Assets and Liabilities in dividends receivable.
Expenses. Expenses directly attributable to a fund are charged to that fund. Expenses attributable to more than one fund are allocated among the respective funds on the basis of relative net assets or other appropriate methods. Expenses included in the accompanying financial statements reflect the expenses of that fund and do not include any expenses associated with any underlying mutual funds or exchange-traded funds. Although not included in a fund's expenses, a fund indirectly bears its proportionate share of these expenses through the net asset value of each underlying mutual fund or exchange-traded fund. Expense estimates are accrued in the period to which they relate and adjustments are made when actual amounts are known.
Income Tax Information and Distributions to Shareholders. Each year, the Fund intends to qualify as a regulated investment company under Subchapter M of the Internal Revenue Code, including distributing substantially all of its taxable income and realized gains. As a result, no provision for U.S. Federal income taxes is required. The Fund files a U.S. federal tax return, in addition to state and local tax returns as required. The Fund's federal income tax returns are subject to examination by the Internal Revenue Service (IRS) for a period of three fiscal years after they are filed. State and local tax returns may be subject to examination for an additional fiscal year depending on the jurisdiction. Foreign taxes are provided for based on the Fund's understanding of the tax rules and rates that exist in the foreign markets in which it invests.
Distributions are declared and recorded on the ex-dividend date. Income and capital gain distributions are determined in accordance with income tax regulations, which may differ from GAAP.
Capital accounts within the financial statements are adjusted for permanent book-tax differences. These adjustments have no impact on net assets or the results of operations. Capital accounts are not adjusted for temporary book-tax differences which will reverse in a subsequent period.
Book-tax differences are primarily due to foreign currency transactions and losses deferred due to wash sales.
As of period end, the cost and unrealized appreciation (depreciation) in securities, and derivatives if applicable, for federal income tax purposes were as follows:
| Gross unrealized appreciation | $41,487,819 |
| Gross unrealized depreciation | (4,009,692) |
| Net unrealized appreciation (depreciation) | $37,478,127 |
| Tax cost | $147,627,052 |
4. Purchases and Sales of Investments.
Purchases and sales of securities, other than short-term securities and in-kind transactions, as applicable, are noted in the table below.
| | Purchases ($) | Sales ($) |
| Fidelity Value Discovery K6 Fund | 26,037,535 | 32,256,017 |
Prior Year Unaffiliated Exchanges In-Kind. Shares that were exchanged for investments, including accrued interest and cash, if any, are shown in the table below. The amount of in-kind exchanges is included in share transactions in the accompanying Statement of Changes in Net Assets.
| | Shares | Total Proceeds ($) |
| Fidelity Value Discovery K6 Fund | 2,730,382 | 30,615,682 |
5. Fees and Other Transactions with Affiliates.
Management Fee. Fidelity Management & Research Company LLC (the investment adviser) and its affiliates provide the Fund with investment management related services for which the Fund pays a monthly management fee that is based on an annual rate of .45% of average net assets. Under the management contract, the investment adviser or an affiliate pays all other expenses of the Fund, excluding fees and expenses of the independent Trustees, and certain miscellaneous expenses such as proxy and shareholder meeting expenses.
Brokerage Commissions. A portion of portfolio transactions were placed with brokerage firms which are affiliates of the investment adviser. Brokerage commissions are included in net realized gain (loss) and change in net unrealized appreciation (depreciation) in the Statement of Operations. The commissions paid to these affiliated firms were as follows:
| | Amount |
| Fidelity Value Discovery K6 Fund | $ 491 |
Interfund Trades. Funds may purchase from or sell securities to other Fidelity Funds under procedures adopted by the Board. The procedures have been designed to ensure these interfund trades are executed in accordance with Rule 17a-7 of the 1940 Act. Any interfund trades are included within the respective purchases and sales amounts shown in the Purchases and Sales of Investments note. Interfund trades during the period are noted in the table below.
| | Purchases ($) | Sales ($) | Realized Gain (Loss) ($) |
| Fidelity Value Discovery K6 Fund | 1,408,442 | 3,077,078 | (79,639) |
Subsequent Event - Sub-Advisory Arrangements. Effective March 1, 2024, the Fund's sub-advisory agreements with FMR Investment Management (UK) Limited, Fidelity Management & Research (Hong Kong) Limited, and Fidelity Management & Research (Japan) Limited will be amended to provide that the investment adviser will pay each sub-adviser monthly fees equal to 110% of the sub-adviser's costs for providing sub-advisory services.
6. Committed Line of Credit.
Certain Funds participate with other funds managed by the investment adviser or an affiliate in a $4.25 billion credit facility (the "line of credit") to be utilized for temporary or emergency purposes to fund shareholder redemptions or for other short-term liquidity purposes. The commitment fees on the pro-rata portion of the line of credit are borne by the investment adviser. During the period, there were no borrowings on this line of credit.
7. Security Lending.
Funds lend portfolio securities from time to time in order to earn additional income. Lending agents are used, including National Financial Services (NFS), an affiliate of the investment adviser. Pursuant to a securities lending agreement, NFS will receive a fee, which is capped at 9.9% of a fund's daily lending revenue, for its services as lending agent. A fund may lend securities to certain qualified borrowers, including NFS. On the settlement date of the loan, a fund receives collateral (in the form of U.S. Treasury obligations, letters of credit and/or cash) against the loaned securities and maintains collateral in an amount not less than 100% of the market value of the loaned securities during the period of the loan. The market value of the loaned securities is determined at the close of business of a fund and any additional required collateral is delivered to a fund on the next business day. A fund or borrower may terminate the loan at any time, and if the borrower defaults on its obligation to return the securities loaned because of insolvency or other reasons, a fund may apply collateral received from the borrower against the obligation. A fund may experience delays and costs in recovering the securities loaned. Any cash collateral received is invested in the Fidelity Securities Lending Cash Central Fund. Any loaned securities are identified as such in the Schedule of Investments, and the value of loaned securities and cash collateral at period end, as applicable, are presented in the Statement of Assets and Liabilities. Security lending income represents the income earned on investing cash collateral, less rebates paid to borrowers and any lending agent fees associated with the loan, plus any premium payments received for lending certain types of securities. Security lending income is presented in the Statement of Operations as a component of income from Fidelity Central Funds. Affiliated security lending activity, if any, was as follows:
| | Total Security Lending Fees Paid to NFS | Security Lending Income From Securities Loaned to NFS | Value of Securities Loaned to NFS at Period End |
| Fidelity Value Discovery K6 Fund | $1,600 | $- | $- |
8. Expense Reductions.
Through arrangements with the Fund's custodian, credits realized as a result of certain uninvested cash balances were used to reduce the Fund's expenses by $546.
9. Other.
A fund's organizational documents provide former and current trustees and officers with a limited indemnification against liabilities arising in connection with the performance of their duties to the fund. In the normal course of business, a fund may also enter into contracts that provide general indemnifications. A fund's maximum exposure under these arrangements is unknown as this would be dependent on future claims that may be made against a fund. The risk of material loss from such claims is considered remote.
10. Risk and Uncertainties.
Many factors affect a fund's performance. Developments that disrupt global economies and financial markets, such as pandemics, epidemics, outbreaks of infectious diseases, war, terrorism, and environmental disasters, may significantly affect a fund's investment performance. The effects of these developments to a fund will be impacted by the types of securities in which a fund invests, the financial condition, industry, economic sector, and geographic location of an issuer, and a fund's level of investment in the securities of that issuer. Significant concentrations in security types, issuers, industries, sectors, and geographic locations may magnify the factors that affect a fund's performance.
As a shareholder, you incur two types of costs: (1) transaction costs, which may include sales charges (loads) on purchase payments or redemption proceeds, as applicable and (2) ongoing costs, which generally include management fees, distribution and/or service (12b-1) fees and other Fund expenses. This Example is intended to help you understand your ongoing costs (in dollars) of investing in a fund and to compare these costs with the ongoing costs of investing in other mutual funds.
| The Example is based on an investment of $1,000 invested at the beginning of the period and held for the entire period (August 1, 2023 to January 31, 2024). |
Actual Expenses
The first line of the accompanying table provides information about actual account values and actual expenses. You may use the information in this line, together with the amount you invested, to estimate the expenses that you paid over the period. Simply divide your account value by $1,000.00 (for example, an $8,600 account value divided by $1,000.00 = 8.6), then multiply the result by the number in the first line for a class/Fund under the heading entitled "Expenses Paid During Period" to estimate the expenses you paid on your account during this period. If any fund is a shareholder of any underlying mutual funds or exchange-traded funds (ETFs) (the Underlying Funds), such fund indirectly bears its proportional share of the expenses of the Underlying Funds in addition to the direct expenses incurred presented in the table. These fees and expenses are not included in the annualized expense ratio used to calculate the expense estimate in the table below.
Hypothetical Example for Comparison Purposes
The second line of the accompanying table provides information about hypothetical account values and hypothetical expenses based on the actual expense ratio and an assumed rate of return of 5% per year before expenses, which is not the actual return. The hypothetical account values and expenses may not be used to estimate the actual ending account balance or expenses you paid for the period. You may use this information to compare the ongoing costs of investing in the Fund and other funds. To do so, compare this 5% hypothetical example with the 5% hypothetical examples that appear in the shareholder reports of the other funds. If any fund is a shareholder of any Underlying Funds, such fund indirectly bears its proportional share of the expenses of the Underlying Funds in addition to the direct expenses as presented in the table. These fees and expenses are not included in the annualized expense ratio used to calculate the expense estimate in the table below.
Please note that the expenses shown in the table are meant to highlight your ongoing costs only and do not reflect any transaction costs. Therefore, the second line of the table is useful in comparing ongoing costs only, and will not help you determine the relative total costs of owning different funds. In addition, if these transactional costs were included, your costs would have been higher.
| | | | | Annualized Expense Ratio- A | | Beginning Account Value August 1, 2023 | | Ending Account Value January 31, 2024 | | Expenses Paid During Period- C August 1, 2023 to January 31, 2024 |
| | | | | | | | | | |
| Fidelity® Value Discovery K6 Fund | | | | .45% | | | | | | |
| Actual | | | | | | $ 1,000 | | $ 1,016.20 | | $ 2.28 |
Hypothetical-B | | | | | | $ 1,000 | | $ 1,022.87 | | $ 2.29 |
| |
A Annualized expense ratio reflects expenses net of applicable fee waivers.
B 5% return per year before expenses
C Expenses are equal to the annualized expense ratio, multiplied by the average account value over the period, multiplied by 184/ 366 (to reflect the one-half year period). The fees and expenses of any Underlying Funds are not included in each annualized expense ratio.
Board Approval of Investment Advisory Contracts
At its January 2024 meeting, the Board of Trustees, including the Independent Trustees (together, the Board), approved amended and restated sub-advisory agreements (the Sub-Advisory Contracts) for the fund, including the fund's sub-advisory agreements with FMR Investment Management (UK) Limited (FMR UK), Fidelity Management & Research (Hong Kong) Limited (FMR H.K.), and Fidelity Management & Research (Japan) Limited (FMR Japan). The Sub-Advisory Contracts will be effective March 1, 2024. The Board will consider the annual renewal of the funds' Sub-Advisory Contracts in May 2024, following its review of additional materials provided by FMR.
The Board considered the Sub-Advisory Contracts, which simplified the calculation of the fees paid by FMR to the sub-advisers under the agreements. The Board noted that the agreements with FMR UK, FMR H.K., and FMR Japan were amended to provide that FMR will compensate each sub-adviser at a fee rate equal to 110% of the sub-adviser's costs incurred in providing services under the agreement. The Board considered that, under the Sub-Advisory Contracts, FMR, and not the fund, will continue to pay the sub-advisory fees to each applicable sub-adviser, and that the management fee paid by the fund under the management contract with FMR will remain unchanged.
The Board further considered that the approval of the fund's Sub-Advisory Contracts will not result in any changes in the investment process or strategies employed in the management of the fund's assets or the day-to-day management of the fund or the persons primarily responsible for such management. Further, the Board considered that the Sub-Advisory Contracts would not change the obligations and services of FMR and its affiliates on behalf of the fund, and, in particular, there would be no change in the nature and level of services provided to the fund by FMR and its affiliates.
In connection with its consideration of future renewals of the fund's advisory contracts, the Board will consider: (i) the nature, extent and quality of services provided to the funds, including shareholder and administrative services and investment performance; (ii) the competitiveness of the management fee and total expenses for the fund; (iii) the costs of the services and profitability, including the revenues earned and the expenses incurred in conducting the business of developing, marketing, distributing, managing, administering, and servicing the fund and its shareholders, to the extent applicable; and (iv) whether there have been economies of scale in respect of the Fidelity funds, whether the Fidelity funds (including the fund) have appropriately benefited from any such economies of scale, and whether there is the potential for realization of any further economies.
Based on its evaluation of all of the conclusions noted above, and after considering all factors it believed relevant, the Board concluded that the fund's management fee structure is fair and reasonable, and that the fund's Sub-Advisory Contracts should be approved.
The Securities and Exchange Commission adopted Rule 22e-4 under the Investment Company Act of 1940 (the Liquidity Rule) to promote effective liquidity risk management throughout the open-end investment company industry, thereby reducing the risk that funds will be unable to meet their redemption obligations and mitigating dilution of the interests of fund shareholders.
The Fund has adopted and implemented a liquidity risk management program (the Program) reasonably designed to assess and manage the Fund's liquidity risk and to comply with the requirements of the Liquidity Rule. The Fund's Board of Trustees (the Board) has designated the Fund's investment adviser as administrator of the Program. The Fidelity advisers have established a Liquidity Risk Management Committee (the LRM Committee) to manage the Program for each of the Fidelity Funds. The LRM Committee monitors the adequacy and effectiveness of implementation of the Program and on a periodic basis assesses each Fund's liquidity risk based on a variety of factors including (1) the Fund's investment strategy, (2) portfolio liquidity and cash flow projections during normal and reasonably foreseeable stressed conditions, (3) shareholder redemptions, (4) borrowings and other funding sources and (5) certain factors specific to ETFs including the effect of the Fund's prices and spreads, market participants, and basket compositions on the overall liquidity of the Fund's portfolio, as applicable.
In accordance with the Program, each of the Fund's portfolio investments is classified into one of four defined liquidity categories based on a determination of a reasonable expectation for how long it would take to convert the investment to cash (or sell or dispose of the investment) without significantly changing its market value.
- Highly liquid investments - cash or convertible to cash within three business days or less
- Moderately liquid investments - convertible to cash in three to seven calendar days
- Less liquid investments - can be sold or disposed of, but not settled, within seven calendar days
- Illiquid investments - cannot be sold or disposed of within seven calendar days
Liquidity classification determinations take into account a variety of factors including various market, trading and investment-specific considerations, as well as market depth, and generally utilize analysis from a third-party liquidity metrics service.
The Liquidity Rule places a 15% limit on a fund's illiquid investments and requires funds that do not primarily hold assets that are highly liquid investments to determine and maintain a minimum percentage of the fund's net assets to be invested in highly liquid investments (highly liquid investment minimum or HLIM). The Program includes provisions reasonably designed to comply with the 15% limit on illiquid investments and for determining, periodically reviewing and complying with the HLIM requirement as applicable.
At a recent meeting of the Fund's Board of Trustees, the LRM Committee provided a written report to the Board pertaining to the operation, adequacy, and effectiveness of the Program for the period December 1, 2022 through November 30, 2023. The report concluded that the Program is operating effectively and is reasonably designed to assess and manage the Fund's liquidity risk.
1.9884002.106
FVDK6-SANN-0324
Item 2.
Code of Ethics
Not applicable.
Item 3.
Audit Committee Financial Expert
Not applicable.
Item 4.
Principal Accountant Fees and Services
Not applicable.
Item 5.
Audit Committee of Listed Registrants
Not applicable.
Item 6.
Investments
(a)
Not applicable.
(b)
Not applicable
Item 7.
Disclosure of Proxy Voting Policies and Procedures for Closed-End Management Investment Companies
Not applicable.
Item 8.
Portfolio Managers of Closed-End Management Investment Companies
Not applicable.
Item 9.
Purchase of Equity Securities by Closed-End Management Investment Company and Affiliated Purchasers
Not applicable.
Item 10.
Submission of Matters to a Vote of Security Holders
There were no material changes to the procedures by which shareholders may recommend nominees to the Fidelity Puritan Trust’s Board of Trustees.
Item 11.
Controls and Procedures
(a)(i) The President and Treasurer and the Chief Financial Officer have concluded that the Fidelity Puritan Trust’s (the “Trust”) disclosure controls and procedures (as defined in Rule 30a-3(c) under the Investment Company Act) provide reasonable assurances that
material information relating to the Trust is made known to them by the appropriate persons, based on their evaluation of these controls and procedures as of a date within 90 days of the filing date of this report.
(a)(ii) There was no change in the Trust’s internal control over financial reporting (as defined in Rule 30a-3(d) under the Investment Company Act) that occurred during the period covered by this report that has materially affected, or is reasonably likely to materially affect, the Trust’s internal control over financial reporting.
Item 12.
Disclosure of Securities Lending Activities for Closed-End Management
Investment Companies
Not applicable.
Item 18.
Recovery of Erroneously Awarded Compensation
(a)
Not applicable.
(b)
Not applicable.
Item 19.
Exhibits
SIGNATURES
Pursuant to the requirements of the Securities Exchange Act of 1934 and the Investment Company Act of 1940, the registrant has duly caused this report to be signed on its behalf by the undersigned, thereunto duly authorized.
Fidelity Puritan Trust
| |
By: | /s/Stacie M. Smith |
| Stacie M. Smith |
| President and Treasurer |
|
|
Date: | March 21, 2024 |
Pursuant to the requirements of the Securities Exchange Act of 1934 and the Investment Company Act of 1940, this report has been signed below by the following persons on behalf of the registrant and in the capacities and on the dates indicated.
| |
By: | /s/Stacie M. Smith |
| Stacie M. Smith |
| President and Treasurer |
|
|
Date: | March 21, 2024 |
| |
By: | /s/John J. Burke III |
| John J. Burke III |
| Chief Financial Officer |
|
|
Date: | March 21, 2024 |