Exhibit 99.2
| O-I Earnings Call 4th Quarter & Full Year 2007 January 31, 2008 |
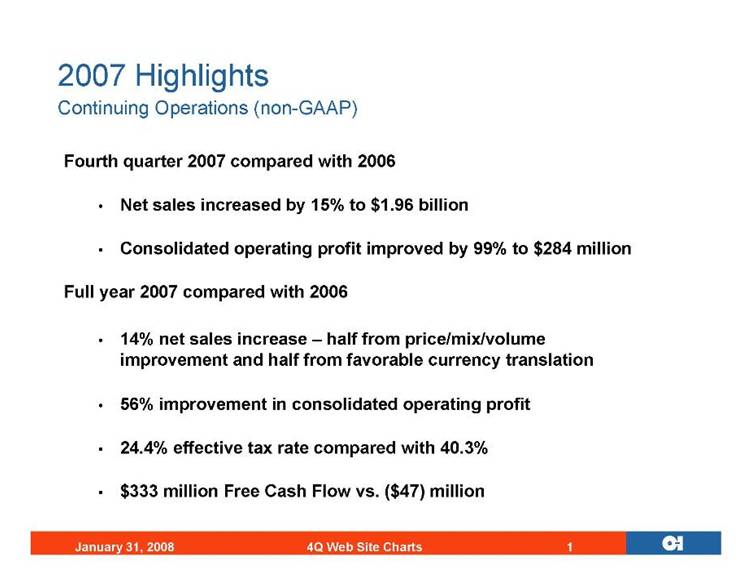
| 2007 Highlights Continuing Operations (non-GAAP) Fourth quarter 2007 compared with 2006 • Net sales increased by 15% to $1.96 billion • Consolidated operating profit improved by 99% to $284 million Full year 2007 compared with 2006 • 14% net sales increase – half from price/mix/volume improvement and half from favorable currency translation • 56% improvement in consolidated operating profit • 24.4% effective tax rate compared with 40.3% • $333 million Free Cash Flow vs. ($47) million
|
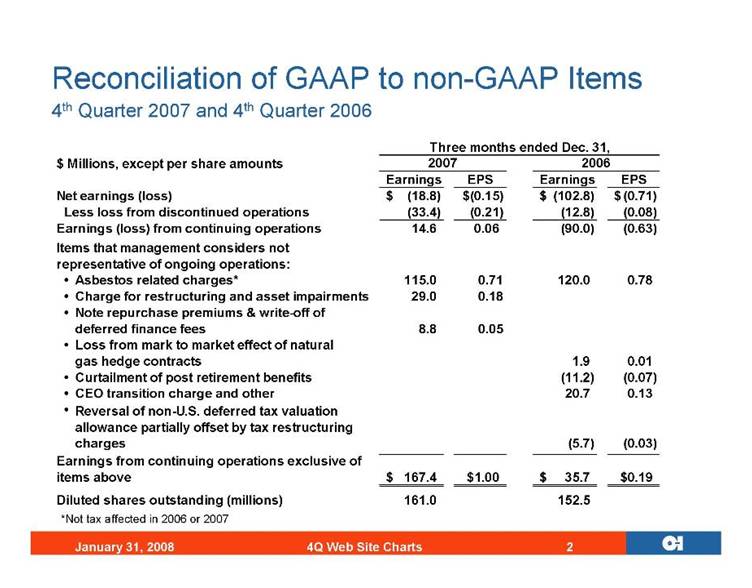
| Reconciliation of GAAP to non-GAAP Items 4th Quarter 2007 and 4th Quarter 2006 Three months ended Dec. 31, $ Millions, except per share amounts Earnings EPS Earnings EPS Net earnings (loss) (18.8) $ (0.15) $ (102.8) $ (0.71) $ Less loss from discontinued operations (33.4) (0.21) (12.8) (0.08) Earnings (loss) from continuing operations 14.6 0.06 (90.0) (0.63) • Asbestos related charges* 115.0 0.71 120.0 0.78 • Charge for restructuring and asset impairments 29.0 0.18 • Note repurchase premiums & write-off of deferred finance fees 8.8 0.05 • Loss from mark to market effect of natural gas hedge contracts 1.9 0.01 • Curtailment of post retirement benefits (11.2) (0.07) • CEO transition charge and other 20.7 0.13 • Reversal of non-U.S. deferred tax valuation allowance partially offset by tax restructuring charges (5.7) (0.03) 167.4 $ $1.00 35.7 $ $0.19 161.0 152.5 2006 Items that management considers not representative of ongoing operations: Earnings from continuing operations exclusive of items above Diluted shares outstanding (millions) 2007 *Not tax affected in 2006 or 2007
|
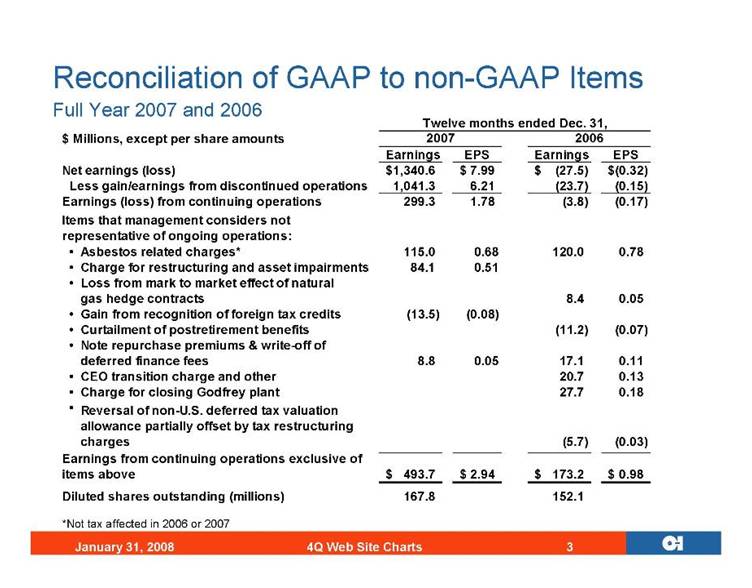
| Reconciliation of GAAP to non-GAAP Items Full Year 2007 and 2006 Twelve months ended Dec. 31, $ Millions, except per share amounts Earnings EPS Earnings EPS Net earnings (loss) 1,340.6 $ 7.99 $ (27.5) $ (0.32) $ Less gain/earnings from discontinued operations 1,041.3 6.21 (23.7) (0.15) Earnings (loss) from continuing operations 299.3 1.78 (3.8) (0.17) • Asbestos related charges* 115.0 0.68 120.0 0.78 • Charge for restructuring and asset impairments 84.1 0.51 • Loss from mark to market effect of natural gas hedge contracts 8.4 0.05 • Gain from recognition of foreign tax credits (13.5) (0.08) • Curtailment of postretirement benefits (11.2) (0.07) • Note repurchase premiums & write-off of deferred finance fees 8.8 0.05 17.1 0.11 • CEO transition charge and other 20.7 0.13 • Charge for closing Godfrey plant 27.7 0.18 • Reversal of non-U.S. deferred tax valuation allowance partially offset by tax restructuring charges (5.7) (0.03) 493.7 $ 2.94 $ 173.2 $ 0.98 $ 167.8 152.1 2006 Items that management considers not representative of ongoing operations: Earnings from continuing operations exclusive of items above Diluted shares outstanding (millions) 2007 *Not tax affected in 2006 or 2007
|
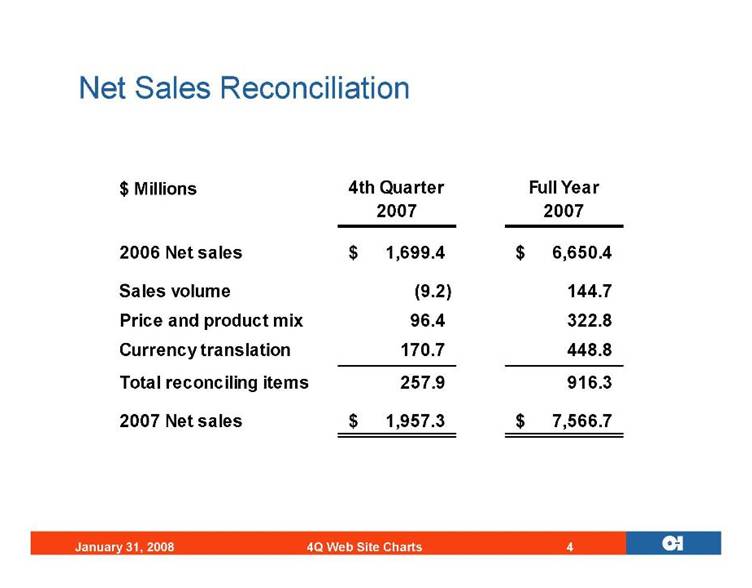
| Net Sales Reconciliation $ Millions 4th Quarter 2007 Full Year 2007 2006 Net sales 1,699.4 $ 6,650.4 $ Sales volume (9.2) 144.7 Price and product mix 96.4 322.8 Currency translation 170.7 448.8 Total reconciling items 257.9 916.3 2007 Net sales 1,957.3 $ 7,566.7 $
|
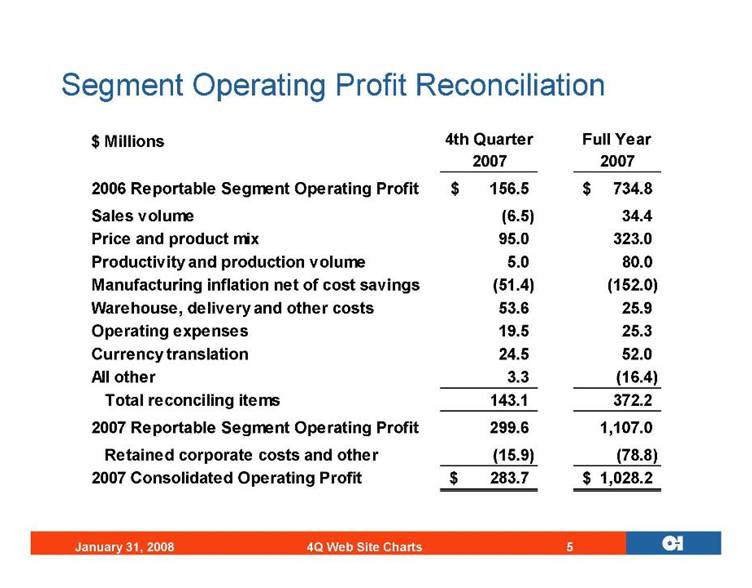
| Segment Operating Profit Reconciliation $ Millions 4th Quarter 2007 Full Year 2007 2006 Reportable Segment Operating Profit 156.5 $ 734.8 $ Sales volume (6.5) 34.4 Price and product mix 95.0 323.0 Productivity and production volume 5.0 80.0 Manufacturing inflation net of cost savings (51.4) (152.0) Warehouse, delivery and other costs 53.6 25.9 Operating expenses 19.5 25.3 Currency translation 24.5 52.0 All other 3.3 (16.4) Total reconciling items 143.1 372.2 2007 Reportable Segment Operating Profit 299.6 1,107.0 Retained corporate costs and other (15.9) (78.8) 2007 Consolidated Operating Profit 283.7 $ 1,028.2 $
|
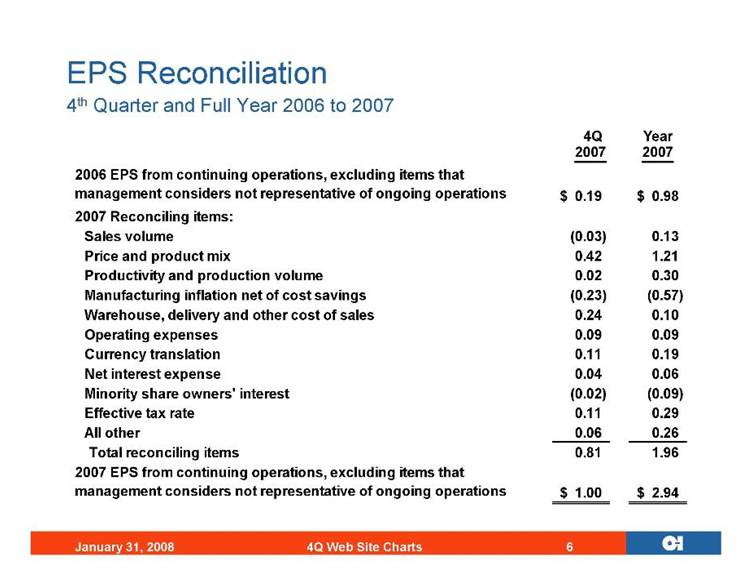
| EPS Reconciliation 4th Quarter and Full Year 2006 to 2007 4Q Year 2007 2007 0.19 $ 0.98 $ 2007 Reconciling items: Sales volume (0.03) 0.13 Price and product mix 0.42 1.21 Productivity and production volume 0.02 0.30 Manufacturing inflation net of cost savings (0.23) (0.57) Warehouse, delivery and other cost of sales 0.24 0.10 Operating expenses 0.09 0.09 Currency translation 0.11 0.19 Net interest expense 0.04 0.06 Minority share owners' interest (0.02) (0.09) Effective tax rate 0.11 0.29 All other 0.06 0.26 Total reconciling items 0.81 1.96 1.00 $ 2.94 $ 2006 EPS from continuing operations, excluding items that management considers not representative of ongoing operations 2007 EPS from continuing operations, excluding items that management considers not representative of ongoing operations
|
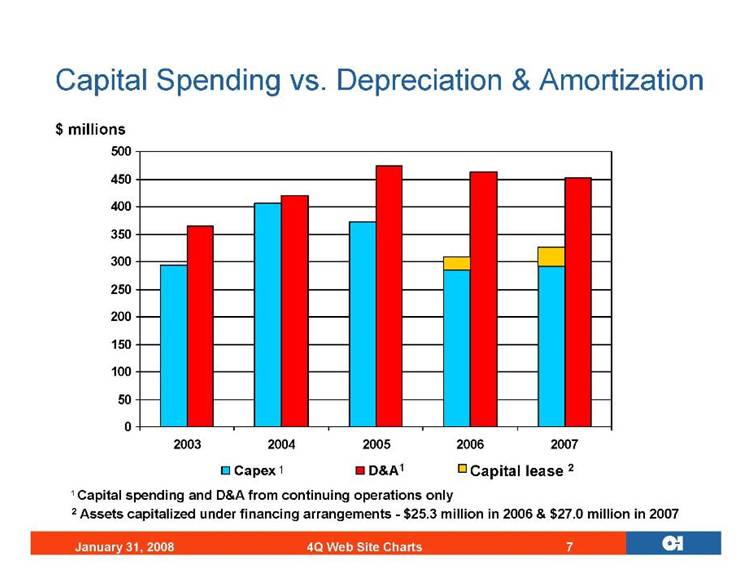
| $ millions 2 Assets capitalized under financing arrangements - $25.3 million in 2006 & $27.0 million in 2007 1 Capital spending and D&A from continuing operations only 0 50 100 150 200 250 300 350 400 450 500 2003 2004 2005 2006 2007 Capex 1 D&A 1 Capital lease 2 Capital Spending vs. Depreciation & Amortization
|
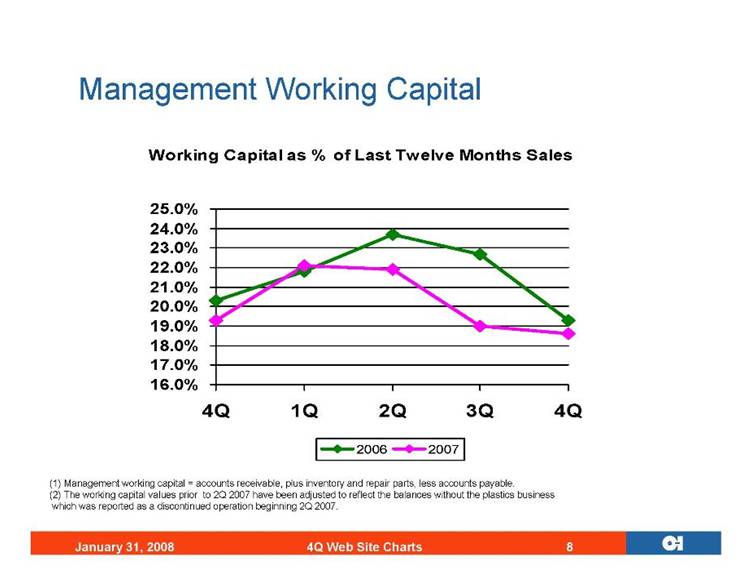
| Management Working Capital 16.0% 17.0% 18.0% 19.0% 20.0% 21.0% 22.0% 23.0% 24.0% 25.0% 4Q 1Q 2Q 3Q 4Q 2006 2007 Working Capital as % of Last Twelve Months Sales (1) Management working capital = accounts receivable, plus inventory and repair parts, less accounts payable. (2) The working capital values prior to 2Q 2007 have been adjusted to reflect the balances without the plastics business which was reported as a discontinued operation beginning 2Q 2007.
|
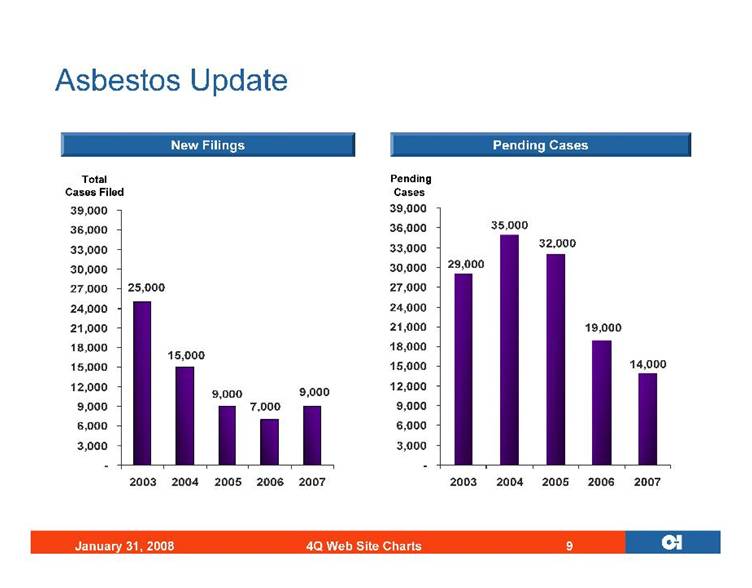
| Asbestos Update 9,000 7,000 9,000 25,000 15,000 - 3,000 6,000 9,000 12,000 15,000 18,000 21,000 24,000 27,000 30,000 33,000 36,000 39,000 2003 2004 2005 2006 2007 Total Cases Filed New Filings Pending Cases Pending Cases 14,000 19,000 32,000 29,000 35,000 - 3,000 6,000 9,000 12,000 15,000 18,000 21,000 24,000 27,000 30,000 33,000 36,000 39,000 2003 2004 2005 2006 2007
|
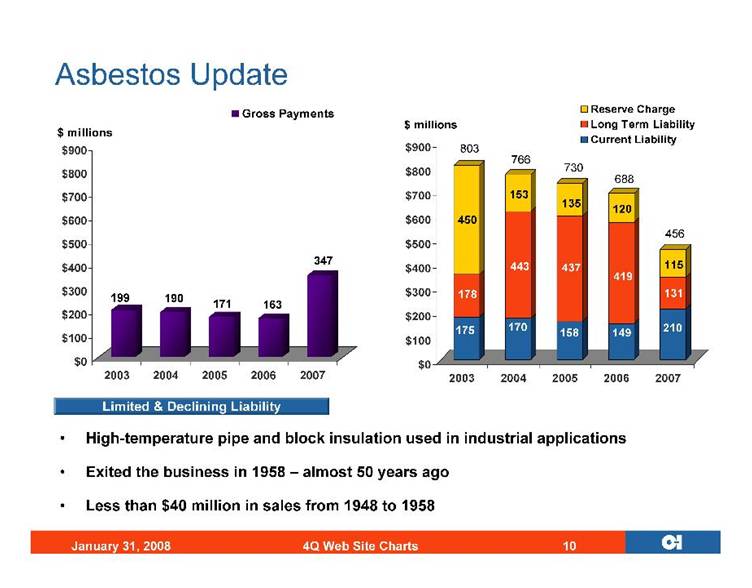
| Asbestos Update 199 190 171 163 347 $0 $100 $200 $300 $400 $500 $600 $700 $800 $900 2003 2004 2005 2006 2007 $ millions Gross Payments Limited & Declining Liability • High-temperature pipe and block insulation used in industrial applications • Exited the business in 1958 – almost 50 years ago • Less than $40 million in sales from 1948 to 1958 175 178 450 170 443 153 158 437 135 149 419 120 210 131 115 $0 $100 $200 $300 $400 $500 $600 $700 $800 $900 2003 2004 2005 2006 2007 $ millions Reserve Charge Long Term Liability Current Liability 803
|
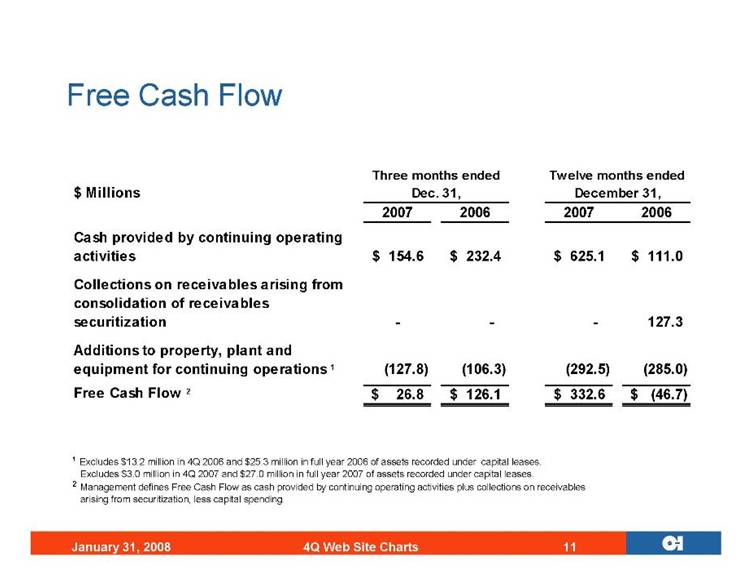
| Free Cash Flow 1 Excludes $13.2 million in 4Q 2006 and $25.3 million in full year 2006 of assets recorded under capital leases. Excludes $3.0 million in 4Q 2007 and $27.0 million in full year 2007 of assets recorded under capital leases. 2 Management defines Free Cash Flow as cash provided by continuing operating activities plus collections on receivables arising from securitization, less capital spending. $ Millions 2007 2006 2007 2006 Cash provided by continuing operating activities 154.6 $ 232.4 $ 625.1 $ 111.0 $ Collections on receivables arising from consolidation of receivables securitization - - - 127.3 Additions to property, plant and equipment for continuing operations 1 (127.8) (106.3) (292.5) (285.0) Free Cash Flow 2 26.8 $ 126.1 $ 332.6 $ (46.7) $ Twelve months ended December 31, Three months ended Dec. 31,
|
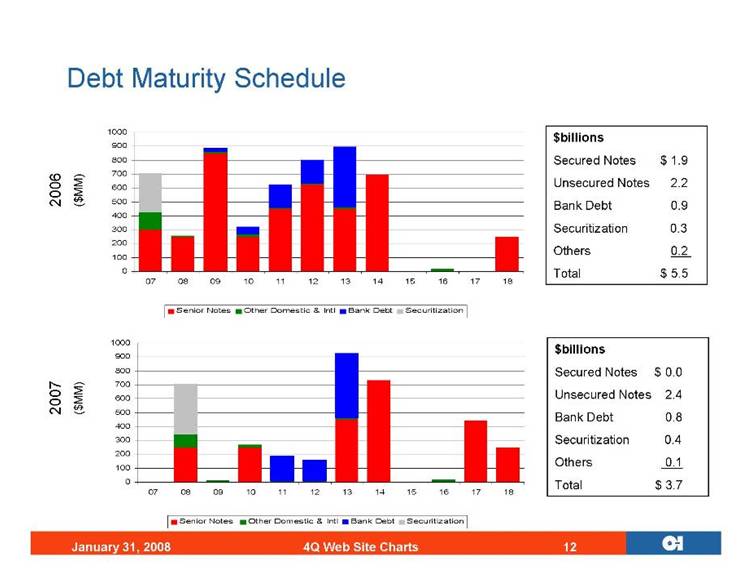
| Debt Maturity Schedule $billions Secured Notes $ 0.0 Unsecured Notes 2.4 Bank Debt 0.8 Securitization 0.4 Others 0.1 Total $ 3.7 $billions Secured Notes $ 1.9 Unsecured Notes 2.2 Bank Debt 0.9 Securitization 0.3 Others 0.2 Total $ 5.5 2006 ($MM) 2007 ($MM) 0 100 200 300 400 500 600 700 800 900 1000 07 08 09 10 11 12 13 14 15 16 17 18 Senior Notes Other Domestic & Intl Bank Debt Securitization 0 100 200 300 400 500 600 700 800 900 1000 07 08 09 10 11 12 13 14 15 16 17 18 Senior Notes Other Domestic & Intl Bank Debt Securitization
|
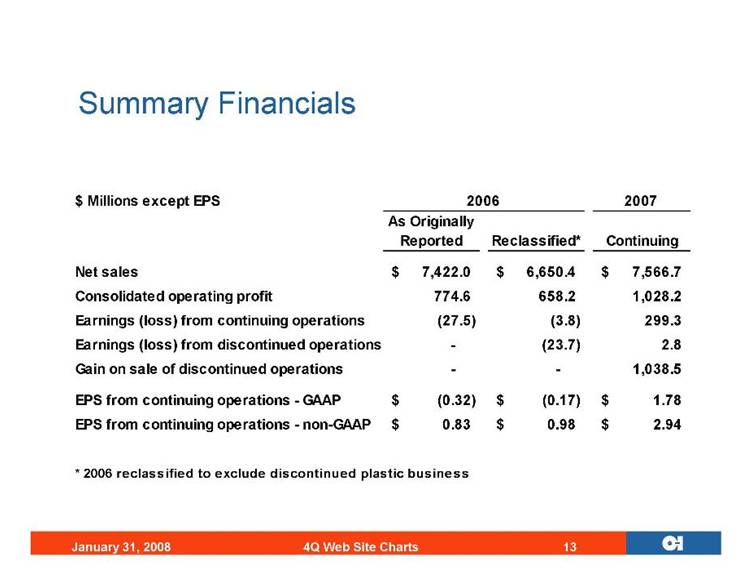
| Summary Financials $ Millions except EPS 2007 As Originally Reported Reclassified* Continuing Net sales 7,422.0 $ 6,650.4 $ 7,566.7 $ Consolidated operating profit 774.6 658.2 1,028.2 Earnings (loss) from continuing operations (27.5) (3.8) 299.3 Earnings (loss) from discontinued operations - (23.7) 2.8 Gain on sale of discontinued operations - - 1,038.5 EPS from continuing operations - GAAP (0.32) $ (0.17) $ 1.78 $ EPS from continuing operations - non-GAAP 0.83 $ 0.98 $ 2.94 $ * 2006 reclassified to exclude discontinued plastic business 2006
|
