First Quarter 2008 Highlights
• | Highest 1Q EPS since the 1991 IPO |
| |
• | 1Q cash from operating activities positive for 1st time since 1Q 2002 |
| |
• | Successful conversion of 9M preferred shares to common shares |
| |
• | Credit rating agency upgrades |
| |
| • | S&P to BB from BB- |
| | |
| • | Moody’s to Ba3 from B2 |
| |
• | Announced expansion of Lurin, Peru plant |
| |
• | Announced 4th regional engineering center to be located in Peru |
1
Reconciliation of GAAP to non-GAAP Items
1tst Quarter 2008 and 1st Quarter 2007
| | 1Q 08 | | 1Q 07 | |
$ Millions, except per share amounts | | Earnings | | EPS | | Earnings | | EPS | |
Net earnings | | $ | 178.1 | | $ | 1.04 | | $ | 53.2 | | $ | 0.30 | |
Add loss from discontinued operations | | | | | | 2.1 | | 0.01 | |
Less gain on sale of discontinued operations | | (4.1 | ) | (0.02 | ) | | | | |
Earnings from continuing operations | | 174.0 | | 1.02 | | 55.3 | | 0.31 | |
| | | | | | | | | |
Excluding Note 1 item (a): | | | | | | | | | |
Charge for restructuring and asset impairment | | 9.7 | | 0.06 | | | | | |
Earnings from continuing operations exclusive of Note 1 items | | $ | 183.7 | | $ | 1.08 | | $ | 55.3 | | $ | 0.31 | |
Diluted shares outstanding (millions) | | 170.5 | | | | 157.0 | | | |
(a) Management considers Note 1 items not representative of ongoing operations
2
EPS Reconciliation
1st Quarter 2007 vs. 1st Quarter 2008
2007 EPS from continuing operations excluding items that management considers not representative of ongoing operations | | $ | 0.31 | |
| | | |
Sales volume | | (0.05 | ) |
Price and product mix | | 0.48 | |
Manufacturing and delivery | | (0.23 | ) |
Operating expenses | | 0.00 | |
Currency translation | | 0.14 | |
Retained corporate costs & other | | 0.12 | |
Net interest expense | | 0.09 | |
Minority share owners’ interest | | (0.03 | ) |
Effective tax rate | | 0.19 | |
Share count dilution | | (0.06 | ) |
All other | | 0.12 | |
Total reconciling items | | 0.77 | |
| | | |
2008 EPS from continuing operations excluding items that management considers not representative of ongoing operations | | $ | 1.08 | |
3
Net Sales Reconciliation
$ Millions | | 1Q 08 | | 1Q 07 | |
Prior segment sales | | $ | 1,668 | | $ | 1,460 | |
| | | | | |
Sales volume | | (49 | ) | 67 | |
Price and product mix | | 119 | | 62 | |
Currency translation | | 187 | | 79 | |
Total reconciling items | | 257 | | 208 | |
| | | | | |
Current segment sales | | 1,925 | | 1,668 | |
Other sales | | 36 | | 16 | |
| | $ | 1,961 | | $ | 1,684 | |
4
Segment Operating Profit Reconciliation
$ Millions | | 1Q 08 | | 1Q 07 | |
| | | | | |
Prior Segment Operating Profit | | $ | 210 | | $ | 164 | |
| | | | | |
Sales volume | | (12 | ) | 20 | |
Price and product mix | | 119 | | 62 | |
Manufacturing and delivery | | (55 | ) | (31 | ) |
Operating expenses | | (0 | ) | (5 | ) |
Currency translation | | 35 | | 8 | |
All other | | 25 | | (8 | ) |
Total reconciling items | | 112 | | 46 | |
| | | | | |
Current Segment Operating Profit | | 322 | | 210 | |
Retained corporate costs & other | | 2 | | (27 | ) |
| | $ | 324 | | $ | 183 | |
5
Free Cash Flow
$ Millions | | 1Q 08 | | 1Q 07 | |
| | | | | |
Net earnings | | $ | 178.1 | | $ | 53.2 | |
Loss from discontinued operations | | | | 2.1 | |
Gain on sale of discontinued operations | | (4.1 | ) | | |
Earnings from continuing operating activities | | 174.0 | | 55.3 | |
| | | | | |
Non-cash charges: | | | | | |
Depreciation and amortization | | 123.1 | | 107.4 | |
Restructuring and asset impairment | | 12.9 | | — | |
All other non-cash charges | | (11.1 | ) | 24.2 | |
Asbestos-related payments | | (40.2 | ) | (41.0 | ) |
Change in components of working capital | | (216.8 | ) | (172.5 | ) |
Change in non-current assets and liabilities | | (21.2 | ) | (13.6 | ) |
Cash provided by (utilized in) continuing operating activities | | 20.7 | | (40.2 | ) |
Additions to property, plant and equipment for continuing operations | | (45.4 | ) | (32.6 | ) |
Free Cash Flow (a) | | $ | (24.7 | ) | $ | (72.8 | ) |
(a) Management defines Free Cash Flow as cash provided by continuing operating activities less capital spending for continuing operating activities
6
Reportable Segment Results
| | 2008 | | 2007 (a) | |
$ Millions | | 1Q | | 1Q | | 2Q | | 3Q | | 4Q | | Total | |
| | | | | | | | | | | | | |
Sales | | | | | | | | | | | | | |
Europe | | $ | 888.9 | | $ | 728.4 | | $ | 901.6 | | $ | 825.2 | | $ | 843.5 | | $ | 3,298.7 | |
North America | | 530.9 | | 523.4 | | 613.9 | | 596.2 | | 537.8 | | 2,271.3 | |
South America | | 254.2 | | 203.2 | | 231.1 | | 253.0 | | 283.4 | | 970.7 | |
Asia Pacific | | 250.0 | | 212.5 | | 210.5 | | 239.4 | | 271.9 | | 934.3 | |
Reportable segment totals | | 1,924.0 | | 1,667.5 | | 1,957.1 | | 1,913.8 | | 1,936.6 | | 7,475.0 | |
| | | | | | | | | | | | | |
Other sales | | 36.5 | | 16.5 | | 39.9 | | 14.6 | | 20.7 | | 91.7 | |
Total | | $ | 1,960.5 | | $ | 1,684.0 | | $ | 1,997.0 | | $ | 1,928.4 | | $ | 1,957.3 | | $ | 7,566.7 | |
| | | | | | | | | | | | | |
Segment Operating Profit | | | | | | | | | | | | | |
Europe | | $ | 147.6 | | $ | 74.8 | | $ | 122.5 | | $ | 106.5 | | $ | 129.2 | | $ | 433.0 | |
North America | | 55.5 | | 62.5 | | 85.0 | | 84.1 | | 33.5 | | 265.1 | |
South America | | 73.6 | | 48.0 | | 58.4 | | 66.1 | | 82.4 | | 254.9 | |
Asia Pacific | | 45.4 | | 24.7 | | 32.2 | | 42.6 | | 54.5 | | 154.0 | |
Reportable segment totals | | 322.1 | | 210.0 | | 298.1 | | 299.3 | | 299.6 | | 1,107.0 | |
| | | | | | | | | | | | | |
Retained corporate costs and other | | 1.5 | | (27.0 | ) | (14.5 | ) | (21.4 | ) | (15.9 | ) | (78.8 | ) |
Total | | $ | 323.6 | | $ | 183.0 | | $ | 283.6 | | $ | 277.9 | | $ | 283.7 | | $ | 1,028.2 | |
(a) Amounts by segment from Note 21 to the 2007 financial statements (pgs. 92-93 of Form 10K) are presented in this table on a quarterly basis for historical reference.
7
Two Major Currencies v USD
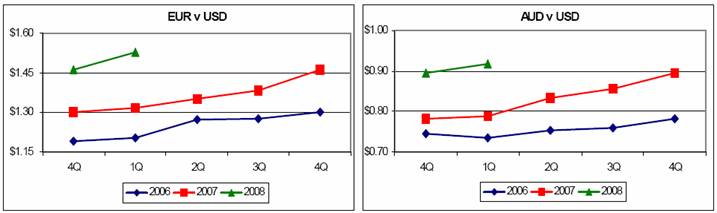
FX Translation Impact on Segment Profit
compared to prior year
$ Millions | | | | | | | | | | | |
| | | | | | | | | | | |
2007 | | 2008 | |
1Q | | 2Q | | 3Q | | 4Q | | Year | | 1Q | |
$ | 8.0 | | $ | 10.9 | | $ | 8.3 | | $ | 24.8 | | $ | 52.0 | | $ | 35.0 | |
| | | | | | | | | | | | | | | | | |
source: O-I Website Earnings Charts - 2007
8