Exhibit 99.2

ACCELERATING O - I’S TRANSFORMATION 2021 INVESTOR DAY | SEPTEMBER 28, 2021

WELCOME & INTRODUCTIONS ANDRES LOPEZ CEO JOHN HAUDRICH SVP & CFO ARNAUD AUJOUANNET SVP & CHIEF SALES AND MARKETING OFFICER VITALIANO TORNO PRESIDENT, BUSINESS OPERATIONS LUDOVIC VALETTE VP, TECHNOLOGY & ENGINEERING RANDY BURNS VP, CHIEF SUSTAINABILITY & CORPORATE AFFAIRS OFFICER MARIE - LAURE SUSSET DIRECTOR, INTEGRATED MARKETING COMMUNICATIONS CHRIS MANUEL VP, INVESTOR RELATIONS ASAD HAMID VP, GLOBAL MARKETING & INNOVATION 2

3 AGENDA TIME (EDT) TOPIC 8:30 AM INVESTOR PRESENTATION 9:45 AM BREAK 9:55 AM Q&A 10:55 AM BREAK 11:00 AM FOCUS SESSIONS • ADVANCING ESG • ADVANCING GLASS ADVOCACY • ENABLING GROWTH AND NEW PRODUCT DEVELOPMENT 12:00PM ADJOURN

4 SAFE HARBOR COMMENTS FORWARD - LOOKING STATEMENTS This presentation contains “forward - looking” statements related to O - I Glass, Inc . (the “company”) within the meaning of Section 21 E of the Securities Exchange Act of 1934 , as amended (the “Exchange Act”) and Section 27 A of the Securities Act of 1933 . Forward - looking statements reflect the company’s current expectations and projections about future events at the time, and thus involve uncertainty and risk . The words “believe,” “expect,” “anticipate,” “will,” “could,” “would,” “should,” “may,” “plan,” “estimate,” “intend,” “predict,” “potential,” “continue,” and the negatives of these words and other similar expressions generally identify forward - looking statements . It is possible that the company’s future financial performance may differ from expectations due to a variety of factors including, but not limited to the following : ( 1 ) the risk that the proposed plan of reorganization of Paddock Enterprises, LLC (“Paddock”) may not be approved by the bankruptcy court or that other conditions necessary to implement the agreement in principle may not be satisfied, ( 2 ) the actions and decisions of participants in the bankruptcy proceeding, and the actions and decisions of third parties, including regulators, that may have an interest in the bankruptcy proceedings, ( 3 ) the terms and conditions of any reorganization plan that may ultimately be approved by the bankruptcy court, ( 4 ) delays in the confirmation or consummation of a plan of reorganization due to factors beyond the company’s and Paddock’s control, ( 5 ) risks with respect to the receipt of the consents necessary to effect the reorganization, ( 6 ) risks inherent in, and potentially adverse developments related to, the bankruptcy proceeding, that could adversely affect the company and the company’s liquidity or results of operations, ( 7 ) the impact of the COVID - 19 pandemic and the various governmental, industry and consumer actions related thereto, ( 8 ) the company’s ability to obtain the benefits it anticipates from the corporate modernization, ( 9 ) the company’s ability to manage its cost structure, including its success in implementing restructuring or other plans aimed at improving the company’s operating efficiency and working capital management, achieving cost savings, and remaining well - positioned to address Paddock’s legacy liabilities, ( 10 ) the company’s ability to acquire or divest businesses, acquire and expand plants, integrate operations of acquired businesses and achieve expected benefits from acquisitions, divestitures or expansions, ( 11 ) the company’s ability to achieve its strategic plan, ( 12 ) the company’s ability to improve its glass melting technology, known as the MAGMA program, ( 13 ) foreign currency fluctuations relative to the U . S . dollar, ( 14 ) changes in capital availability or cost, including interest rate fluctuations and the ability of the company to refinance debt on favorable terms, ( 15 ) the general political, economic and competitive conditions in markets and countries where the company has operations, including uncertainties related to Brexit, economic and social conditions, disruptions in the supply chain, competitive pricing pressures, inflation or deflation, changes in tax rates and laws, natural disasters, and weather, ( 16 ) the company’s ability to generate sufficient future cash flows to ensure the company’s goodwill is not impaired, ( 17 ) consumer preferences for alternative forms of packaging, ( 18 ) cost and availability of raw materials, labor, energy and transportation, ( 19 ) consolidation among competitors and customers, ( 20 ) unanticipated expenditures with respect to data privacy, environmental, safety and health laws, ( 21 ) unanticipated operational disruptions, including higher capital spending, ( 22 ) the company’s ability to further develop its sales, marketing and product development capabilities, ( 23 ) the failure of the company’s joint venture partners to meet their obligations or commit additional capital to the joint venture, ( 24 ) the ability of the company and the third parties on which it relies for information technology system support to prevent and detect security breaches related to cybersecurity and data privacy, ( 25 ) changes in U . S . trade policies, and the other risk factors discussed in the company’s Annual Report on Form 10 - K for the year ended December 31 , 2020 , and any subsequently filed Annual Report on Form 10 - K, Quarterly Reports on Form 10 - Q or the company’s other filings with the Securities and Exchange Commission . It is not possible to foresee or identify all such factors . Any forward - looking statements in this document are based on certain assumptions and analyses made by the company in light of its experience and perception of historical trends, current conditions, expected future developments, and other factors it believes are appropriate in the circumstances . Forward - looking statements are not a guarantee of future performance and actual results, or developments may differ materially from expectations . While the company continually reviews trends and uncertainties affecting the company’s results or operations and financial condition, the company does not assume any obligation to update or supplement any particular forward - looking statements contained in this document .
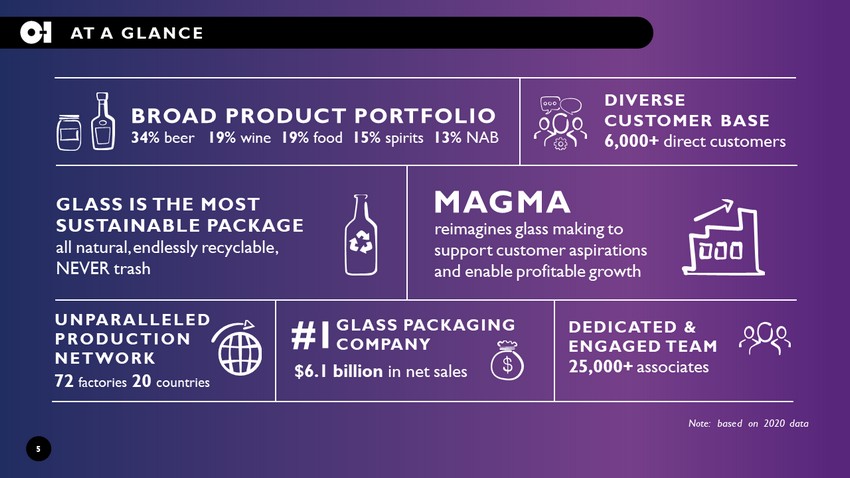
5 AT A GLANCE #1 72 factories 20 countries BROAD PRODUCT PORTFOLIO 34% beer 19% wine 19% food 15% spirits 13% NAB GLASS IS THE MOST SUSTAINABLE PACKAGE all natural, endlessly recyclable, NEVER trash Note: based on 2020 data MAGMA reimagines glass making to support customer aspirations and enable profitable growth DIVERSE CUSTOMER BASE 6,000+ direct customers DEDICATED & ENGAGED TEAM 25,000+ associates UNPARALLELED PRODUCTION NETWORK GLASS PACKAGING COMPANY $6.1 billion in net sales

6 O - I SERVES THE BRANDS YOU TRUST & LOVE All trademarks, logos, service marks and company names are property of their respective owners.
EXECUTIVE SUMMARY ENHANCE VALUE TRANSFORMATION FAVORABLE MARKET MAGMA
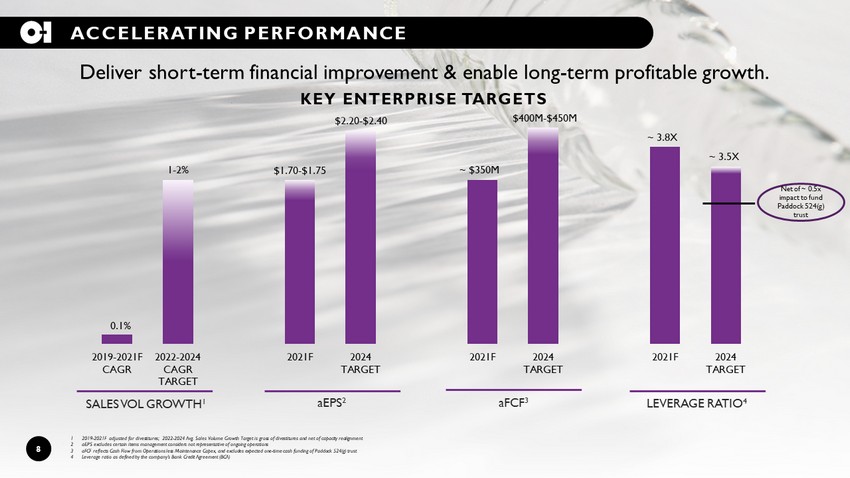
8 ACCELERATING PERFORMANCE 2019-2021F CAGR 2022-2024 CAGR TARGET 2021F 2024 TARGET 2021F 2024 TARGET 2021F 2024 TARGET Deliver short - term financial improvement & enable long - term profitable growth. $1.65 - $1.75 $400M - $450M ~ 3.8X $2.20 - $2.40 ~ $350M ~ 3.5X aEPS 2 aFCF 3 LEVERAGE RATIO 4 SALES VOL GROWTH 1 0.1% 1 - 2% 1 2019 - 2021F adjusted for divestitures; 2022 - 2024 Avg. Sales Volume Growth Target is gross of divestitures and net of capacity realignment 2 aEPS excludes certain items management considers not representative of ongoing operations 3 aFCF reflects Cash Flow from Operations less Maintenance Capex , and excludes expected one - time cash funding of Paddock 524(g) trust 4 Leverage ratio as defined by the company’s Bank Credit Agreement (BCA) KEY ENTERPRISE TARGETS Net of ~ 0.5x impact to fund Paddock 524(g) trust

9 O - I HAS AN ATTRACTIVE VALUE PROPOSITION TRANSFORMATION IMPROVES MARGINS, EARNINGS & ROIC RESOLUTION OF LEGACY LIABILITIES REDUCES RISK & IMPROVES CASH FLOW CONVERSION MAGMA WILL UNLOCK SIGNIFICANT GROWTH MARKET, INNOVATON & ESG LEADER IN THE ATTRACTIVE GLASS SEGMENT OPPORTUNITY FOR HIGHER VALUATION THROUGH SOLID EXECUTION AND PROFITABLE GROWTH

FAVORABLE MARKET SUMMARY ENHANCE VALUE TRANSFORMATION FAVORABLE MARKET MAGMA

POST WAR PROSPERITY 1950s – 1960s Strong glass presence Refillable glass systems Fragmented industry Glass market growth CONVENIENCE 1970s – 1990s Plastic revolution PET bottled water Throw away packaging Food/NAB conversion to plastics Headwind to glass growth BRIC/EM 2000 – 2008 Growth of packaged food & beverages Returnable glass bottle systems Wine/Spirits exports Glass market growth AUSTERITY 2008 – 2016 Accelerated US Beer conversion to aluminum continued thru 2020 Select mainstream NAB conversion to plastics Strong glass performance in premium segments Stable glass market overall ACCELERATED WELLNESS 2017+ Wellness and earth - friendly Luxury and value At home living Digital and e - Commerce Glass market growth MARKET EVOLUTION FAVORABLE TO GLASS 11
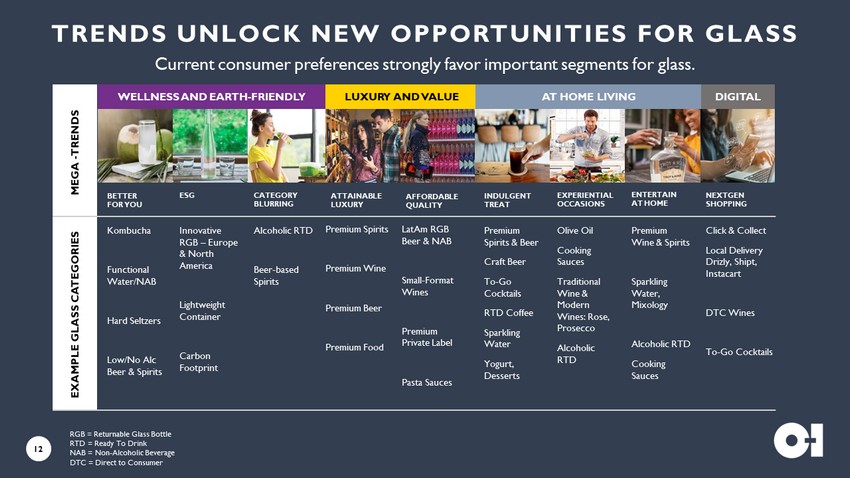
TRENDS UNLOCK NEW OPPORTUNITIES FOR GLASS Current consumer preferences strongly favor important segments for glass. LatAm RGB Beer & NAB Small - Format Wines Premium Private Label Pasta Sauces Premium Spirits Premium Wine Premium Beer Premium Food Premium Spirits & Beer Craft Beer To - Go Cocktails RTD Coffee Sparkling Water Yogurt, Desserts Olive Oil Cooking Sauces Traditional Wine & Modern Wines: Rose, Prosecco Alcoholic RTD Premium Wine & Spirits Sparkling Water, Mixology Alcoholic RTD Cooking Sauces Kombucha Functional Water/NAB Hard Seltzers Low/No Alc Beer & Spirits Alcoholic RTD Beer - based Spirits Innovative RGB – Europe & North America Lightweight Container Carbon Footprint Click & Collect Local Delivery Drizly, Shipt, Instacart DTC Wines To - Go Cocktails BETTER FOR YOU ESG CATEGORY BLURRING ATTAINABLE LUXURY AFFORDABLE QUALITY INDULGENT TREAT EXPERIENTIAL OCCASIONS ENTERTAIN AT HOME NEXTGEN SHOPPING MEGA - TRENDS EXAMPLE GLASS CATEGORIES LUXURY AND VALUE AT HOME LIVING WELLNESS AND EARTH - FRIENDLY DIGITAL 12 RGB = Returnable Glass Bottle RTD = Ready To Drink NAB = Non - Alcoholic Beverage DTC = Direct to Consumer
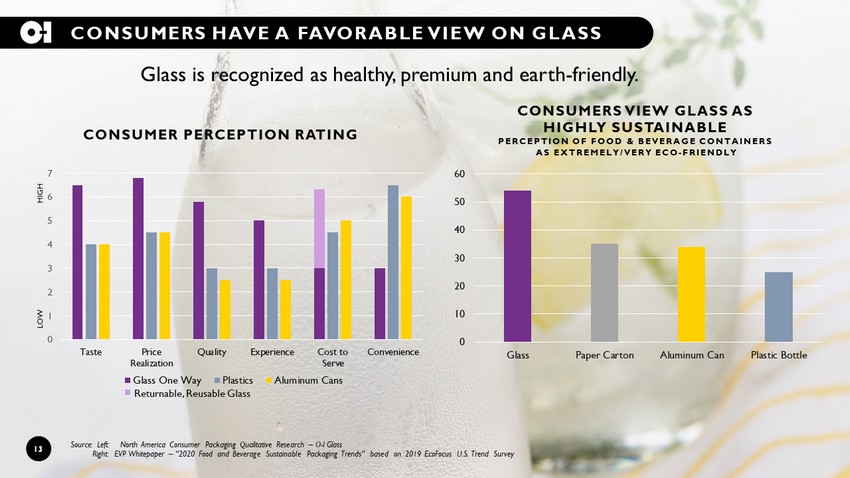
13 CONSUMERS HAVE A FAVORABLE VIEW ON GLASS 0 10 20 30 40 50 60 Glass Paper Carton Aluminum Can Plastic Bottle CONSUMERS VIEW GLASS AS HIGHLY SUSTAINABLE PERCEPTION OF FOOD & BEVERAGE CONTAINERS AS EXTREMELY/VERY ECO - FRIENDLY Source: Left: North America Consumer Packaging Qualitative Research – O - I Glass Right: EVP Whitepaper – “2020 Food and Beverage Sustainable Packaging Trends” based on 2019 EcoFocus U.S. Trend Survey Glass is recognized as healthy, premium and earth - friendly . 0 1 2 3 4 5 6 7 Taste Price Realization Quality Experience Cost to Serve Convenience LOW HIGH Glass One Way Plastics Aluminum Cans CONSUMER PERCEPTION RATING Returnable, Reusable Glass

14 TRENDS ECHO GLASS IS MORE RELEVANT THAN EVER WELLNESS POSITIVE Glass is all natural and inert – it will not contaminate the product content and is the only package “generally recognized as safe” by the U.S. Food and Drug Administration PREMIUM & DIFFERENTIATED The appearance of a glass container alone can identify and define a brand, transform the ordinary into the extraordinary and build a consumer connection unlike any other substrate EARTH - FRIENDLY Glass is all natural, reusable, 100% infinitely recyclable. Glass is NEVER TRASH and is safe for the Earth and our oceans
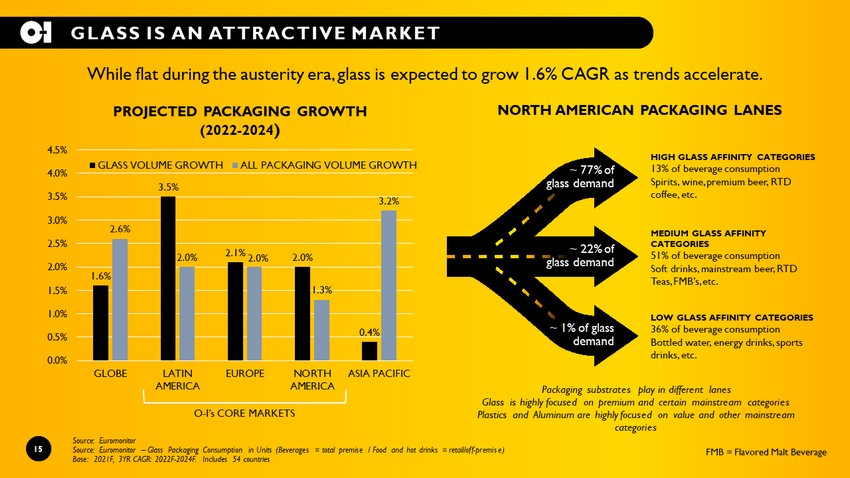
15 GLASS IS AN ATTRACTIVE MARKET 1.6% 3.5% 2.1% 2.0% 0.4% 2.6% 2.0% 2.0% 1.3% 3.2% 0.0% 0.5% 1.0% 1.5% 2.0% 2.5% 3.0% 3.5% 4.0% 4.5% GLOBE LATIN AMERICA EUROPE NORTH AMERICA ASIA PACIFIC PROJECTED PACKAGING GROWTH (2022 - 2024 ) GLASS VOLUME GROWTH ALL PACKAGING VOLUME GROWTH Source: Euromonitor Source: Euromonitor – Glass Packaging Consumption in Units (Beverages = total premise / Food and hot drinks = retail/off - premise ) Base: 2021F, 3YR CAGR: 2022F - 2024F. Includes 54 countries NORTH AMERICAN PACKAGING LANES While flat during the austerity era, glass is expected to grow 1.6% CAGR as trends accelerate. HIGH GLASS AFFINITY CATEGORIES 13% of beverage consumption Spirits, wine, premium beer, RTD coffee, etc. MEDIUM GLASS AFFINITY CATEGORIES 51% of beverage consumption Soft drinks, mainstream beer, RTD Teas, FMB’s, etc. LOW GLASS AFFINITY CATEGORIES 36% of beverage consumption Bottled water, energy drinks, sports drinks, etc. Packaging substrates play in different lanes Glass is highly focused on premium and certain mainstream categories Plastics and Aluminum are highly focused on value and other mainstream categories O - I’s CORE MARKETS FMB = Flavored Malt Beverage 15 ~ 77% of glass demand ~ 22% of glass demand ~ 1% of glass demand

The combination of market trends & O - I actions will enable growth. O - I IS ADDRESSING THE ISSUES THAT LIMITED PAST GROWTH HISTORIC LIMITATIONS HOW THIS WILL CHANGE COST OVER BRANDING ADVANCED COMMERCIAL APPROACH EFFECTIVE AND EFFICIENT OPERATIONS MAGMA ENABLES OPERATIONAL FLEXIBILITY MAGMA SUPPORTS GROWTH INVESTMENTS IMPROVE FINANCIAL FLEXIBILITY MARKET O - I ACCELERATED WELLNESS MANUFACTURING MINDSET HIGH FIXED COSTS LIMITED FLEXIBILITY CAPACITY CONSTRAINTS FINANCIAL CONSTRAINTS 16

17 O - I’S COMMERCIAL PIPELINE & PRINCIPLES IMPROVE / PROTECT GROW SELECTIVELY PARTICIPATE INCREASE RIGHT TO WIN SEGMENT ATTRACTIVENESS LOW HIGH O - I has a clear set of principles to evaluate pipeline opportunities. LOW ALIGNMENT TO O - I’S CURRENT STRENGTHS EXPAND LEADING FRANCHISE POSITION in high growth & value markets EXPAND IN SELECT CATEGORIES with high glass affinity, good growth & high value EXPAND in attractive categories where glass/O - I is under - represented SUPPORT market in attractive sub - categories MIX MANAGEMENT TO OPTIMIZE MARGIN MIX MANAGEMENT TO OPTIMIZE MARGIN HIGH NEGOTIATE QUALIFY IDENTIFY 1.7MT COMMERCIAL PIPELINE EXIT / DIVEST 2019 2022+ 17

18 18 O - I operations only YES! TO PROFITABLE GROWTH ANDEAN Premium Beer, NAB, Food BRAZIL Premium Beer, NAB, Spirits UK Spirits A B A MEXICO Premium Beer, NAB, Food, Spirits B CONTINENTAL EUROPE Wine Food, Fragmented Categories C O - I’S COMMERCIAL PRIORITIES O - I HAS PRIORITIZED UP TO 1 MILLION TONS OF EXPANSION OPPORTUNITIES TARGET EXPANSION OPPORTUNITIES EXPAND LEADING FRANCHISE POSITION in high growth & value markets EXPAND IN SELECT CATEGORIES with high glass affinity, good growth & high value SELECTIVELY SUPPORT markets in attractive sub - categories A B C NORTH AMERICA Spirits, Premium Beer Food, Fragmented Categories A B C

TRANSFORMING O - I ENHANCE VALUE TRANSFORMATION FAVORABLE MARKET MAGMA
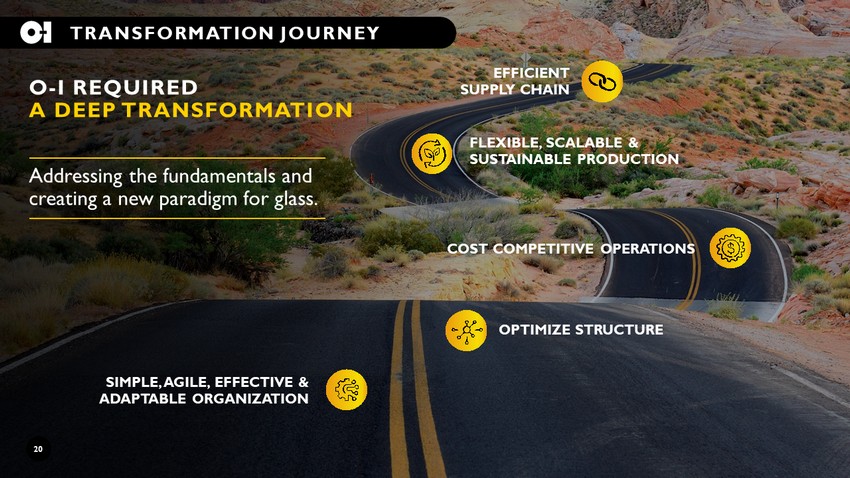
O - I REQUIRED A DEEP TRANSFORMATION COST COMPETITIVE OPERATIONS OPTIMIZE STRUCTURE EFFICIENT SUPPLY CHAIN FLEXIBLE, SCALABLE & SUSTAINABLE PRODUCTION SIMPLE, AGILE, EFFECTIVE & ADAPTABLE ORGANIZATION TRANSFORMATION JOURNEY Addressing the fundamentals and creating a new paradigm for glass. 20

21 SUBSTANTIAL PROGRESS 1. SIMPLE, AGILE, EFFECTIVE & ADAPTABLE ORGANIZATION INTEGRATED BUSINESS PLANNING ALIGNED WITH STRATEGY STREAMLINED ORGANIZATION REBUILT CRITICAL CAPABILITIES – COMMERCIAL, R&D, ESG STRONG COMMERCIAL PIPELINE – 1.7 MT 2. OPTIMIZE STRUCTURE PORTFOLIO OPTIMIZATION – 80% COMPLETE ON $1.15B PLAN PADDOCK AGREEMENT IN PRINCIPLE – $610M 524(g) TRUST INCREASED FCF CONVERSION – 50% HIGHER THAN PAST AVG. REDUCED NET DEBT – $1.5B SINCE PORTFOLIO OPTIMIZATION 3. COST COMPETITIVE OPERATIONS MARGIN EXPANSION INITIATIVES – $240M 2017 - 2021F DEVELOPING MAGMA TO REDUCE COST / CAPITAL INTENSITY 4. FLEXIBLE, SCALABLE & SUSTAINABLE PRODUCTION MAGMA TO REDEFINE GLASS PRODUCTION 5. EFFICIENT SUPPLY CHAIN MAGMA TO INCREASE LOCALITY ULTRA TO SIGNIFICANTLY REDUCE PRODUCT WEIGHT TRANSFORMATION OBJECTIVES PROGRESS Significant transformation with continued progress in the future MAGMA will accelerate O - I’s transformation KEY

22 PROFITABLE ORGANIC GROWTH HIGHER EARNINGS & CASH FLOW IMPROVED MARGINS & RETURNS SUSTAINABLE BUSINESS BENEFITS OF O - I’S TRANSFORMATION YES! TO AN AGILE & RESILIENT COMPANY

MAGMA ENHANCE VALUE TRANSFORMATION FAVORABLE MARKET MAGMA

MAGMA REINVENTS GLASS MAKING AND ENHANCES O - I’S CAPABILITIES EXPAND RIGHT TO WIN WITH RAPID COLOR, SHAPE & SIZE CHANGES AGILE THROUGH ECONOMIC CYCLES & SEASONALITY SUPPLY CHAIN EFFICIENT WITH CO/NEAR LOCATION LOWER CAPITAL INTENSITY WITH EXTENDED ASSET LIFE GROW WITH THE MARKET WITH SCALABLE CAPACITY SUSTAINABLE PRODUCTION WITH LOWER EMISSIONS CONVENIENT PACKAGE WITH LOWER WEIGHT CONTAINER COST EFFICIENT WITH MORE VARIABLE COST STRUCTURE ENTER NEW MARKETS WITH SCALABILITY & LOWER CAPITAL 24

25 MAGMA HERITAGE MAGMA COMPARED TO HERITAGE TECHNOLOGY Illustrative representations of typical Heritage production lines & MAGMA Gen 3 production line ENABLES SINGLE - LINE NIMBLE SUPPLY CHAIN REQUIRES MULTI - LINE MASS PRODUCTION REQUIRES DEDICATED GLASS FACTORY FITS WITHIN INDUSTRIAL WAREHOUSE ~ ଵ ଷ Τ height ~ ଵ ଶ Τ length

26 CLICK TO EDIT MASTER TITLE STYLE 26 GEN 3 2025+ GEN 2 2023+ GEN 1 2022+ • DIGITALIZE • PREDICTIVE PROCESS • ULTRA LIGHT WEIGHT • RENEWABLE FUELS • MODULAR BATCH • MODULAR FORMING • MODULAR INSPECTION • MODULAR COLD END • MODULAR MELTER MAGMA DEVELOPMENT PROGRESSING VERY WELL DEVELOPMENT INVENT SIMPLIFY DIGITAL MINIATURE MODULAR SUSTAINABLE 1 2 3 4 5 6 RETROFIT HERITAGE BASE EXPANSION RETROFIT HERITAGE BASE EXPANSION DESIGN PRINCIPLES MAGMA is being developed across three generations with specific design principles.
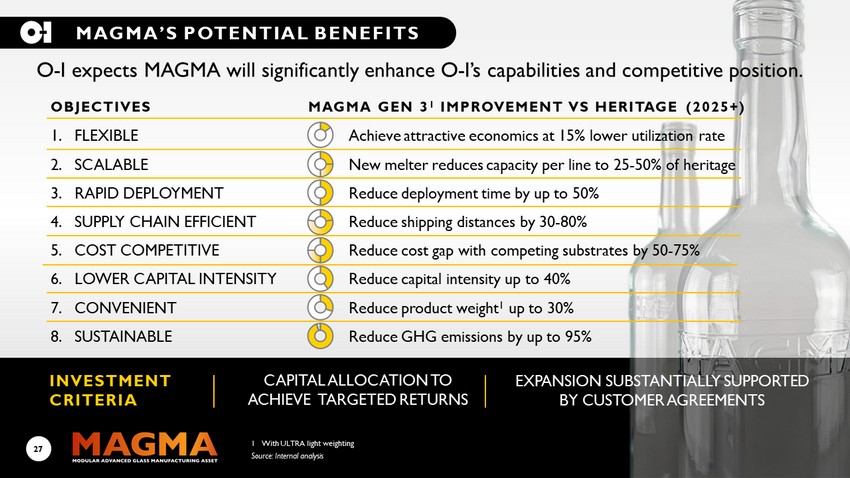
1. FLEXIBLE Achieve attractive economics at 15% lower utilization rate 2. SCALABLE New melter reduces capacity per line to 25 - 50% of heritage 3. RAPID DEPLOYMENT Reduce deployment time by up to 50% 4. SUPPLY CHAIN EFFICIENT Reduce shipping distances by 30 - 80% 5. COST COMPETITIVE Reduce cost gap with competing substrates by 50 - 75% 6. LOWER CAPITAL INTENSITY Reduce capital intensity up to 40% 7. CONVENIENT Reduce product weight 1 up to 30% 8. SUSTAINABLE Reduce GHG emissions by up to 95% OBJECTIVES MAGMA GEN 3 1 IMPROVEMENT VS HERITAGE (2025+) INVESTMENT CRITERIA CAPITAL ALLOCATION TO ACHIEVE TARGETED RETURNS EXPANSION SUBSTANTIALY SUPPORTED BY CUSTOMER AGREEMENTS O - I expects MAGMA will significantly enhance O - I’s capabilities and competitive position. 1 With ULTRA light weighting MAGMA’S POTENTIAL BENEFITS 27 Source: Internal analysis

28 MAGMA IN ACTION Illustrative pictures of the MAGMA system in Holzminden , Germany

29 MAGMA TO IMPROVE SUSTAINABILITY SUSTAINABILITY OF GLASS CONTAINERS SUSTAINABILITY OF GLASS CONTAINER MANUFACTURING Current favorable attribute Improve by breakthrough systems (MAGMA / ULTRA) Improve by heritage technology or other initiatives 100% RECYCLABLE REUSABLE & CIRCULAR ALL NATURAL & INERT NEVER WASTE EARTH & OCEAN FRIENDLY LIGHT WEIGHT INCREASE EFFICIENCY INCREASE CULLET USAGE LIGHT WEIGHT NEAR / CO LOCATE MINIMAL EMISSIONS RENEWABLE FUELS IMPROVING SUSTAINABILITY OF PRODUCT AND PROCESS POTENTIAL CARBON IMPACT OF MAGMA VS. HERITAGE Illustrative representation of carbon impact per bottle (g CO2 /unit) ( i ) oxygen - fuel furnace, ~ 35% recycled content; ( ii ) ~ 55% recycled content; ( iii ) with co - location and ~ 95% recycled content; ( iv ) with renewable energy Heritage (i) MAGMA Gen 3 w/ ULTRA (ii) MAGMA Gen 3 w/ advancement (iii) MAGMA Gen 3 ultimate (iv) Carbon impact (CO2 /bottle) Source: Internal analysis supported by third - party analysis
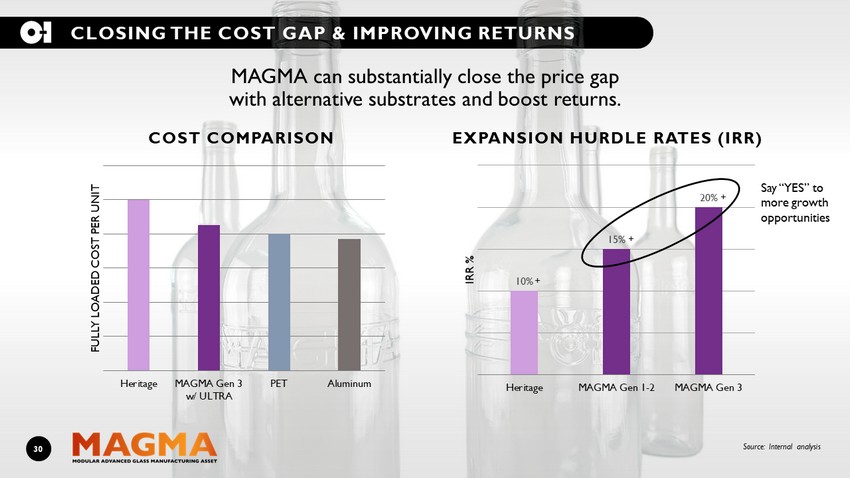
30 10% 15% 20% Heritage MAGMA Gen 1-2 MAGMA Gen 3 IRR % + + + MAGMA can substantially close the price gap with alternative substrates and boost returns. COST COMPARISON EXPANSION HURDLE RATES (IRR) Heritage MAGMA Gen 3 w/ ULTRA PET Aluminum FULLY LOADED COST PER UNIT Source: Internal analysis CLOSING THE COST GAP & IMPROVING RETURNS Say “YES” to more growth opportunities

31 IMPROVING O - I’S RIGHT TO WIN HOW WE WILL WIN • Faster speed to market • Faster capital deployment for growth • Shorter product development cycle & launch • Logistics improvement • Shorter production runs EXPANSION OF O - I’S “RIGHT TO WIN” O - I FOOTPRINT DIFFERENTIATED MARKET MAJOR BRANDS FIXED LOCAL CUSTOMER ATTRIBUTES EXAMPLES • Still/sparkling wine • Whiskey • Premium+ spirits • Spirit based RTD • RTD tea • Spices/table sauces MAGMA expands O - I’s right to win in its addressable market. O - I’s CORE STRENGTHS
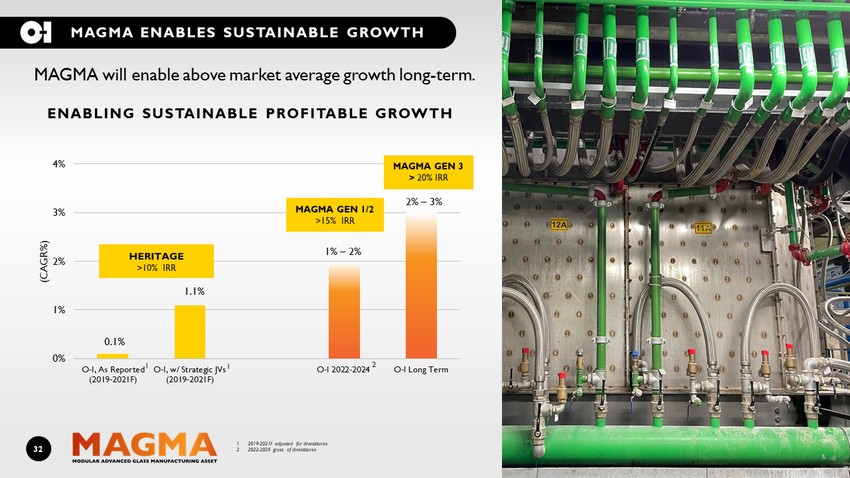
32 MAGMA ENABLES SUSTAINABLE GROWTH 0% 1% 2% 3% 4% O-I, As Reported (2019-2021F) O-I, w/ Strategic JVs (2019-2021F) O-I 2022-2024 O-I Long Term (CAGR%) MAGMA will enable above market average growth long - term. 0.1% 1.1 % 1% – 2% 2% – 3% MAGMA GEN 1/2 >15% IRR MAGMA GEN 3 > 20% IRR HERITAGE >10% IRR ENABLING SUSTAINABLE PROFITABLE GROWTH 1 2019 - 2021F adjusted for divestitures 2 2022 - 2024 gross of divestitures 1 1 2

YES! TO A NEW PARADIGM FOR GLASS MAGMA IS A UNIQUE COMPETITIVE EDGE: MAGMA IS AN O - I INNOVATION – >100 PATENTS/APPLICATIONS WORLDWIDE MAGMA UNIQUELY ALIGNS O - I TO EVOLVING MARKET REQUIREMENTS MAGMA IS MORE COST EFFICIENT WITH LOWER CAPITAL INTENSITY SO O - I CAN SAY ‘YES’ TO PROFITABLE GROWTH MAGMA CAN UNIQUELY ENHANCE O - I’S SUPPLY CHAIN MAGMA MAKES O - I GLASS MORE SUSTAINABLE VS COMPETITION 33
ENHANCE VALUE ENHANCE VALUE TRANSFORMATION FAVORABLE MARKET MAGMA

35 BUILDING THE PATH TO YES! YES! TO PROFITABLE GROWTH Mega trends favor glass 1.6% CAGR market growth 1.7 mt O - I commercial pipeline Focused on 1 mt opportunities YES! TO AN AGILE & RESILIENT COMPANY Simple, agile, effective, adaptable Cost competitive operations Optimized structure Financially flexible YES! TO A NEW PARADIGM FOR GLASS Flexible Scalable Rapid deployment Supply chain efficient Sustainable Cost/capital competitive YES! TO ENHANCE VALUE Profitable growth Higher earnings, cash flow Improved sustainability Satisfied customers Engaged employees Leader in innovation ENHANCE STAKEHOLDER VALUE ENHANCE VALUE TRANSFORMATION FAVORABLE MARKET MAGMA
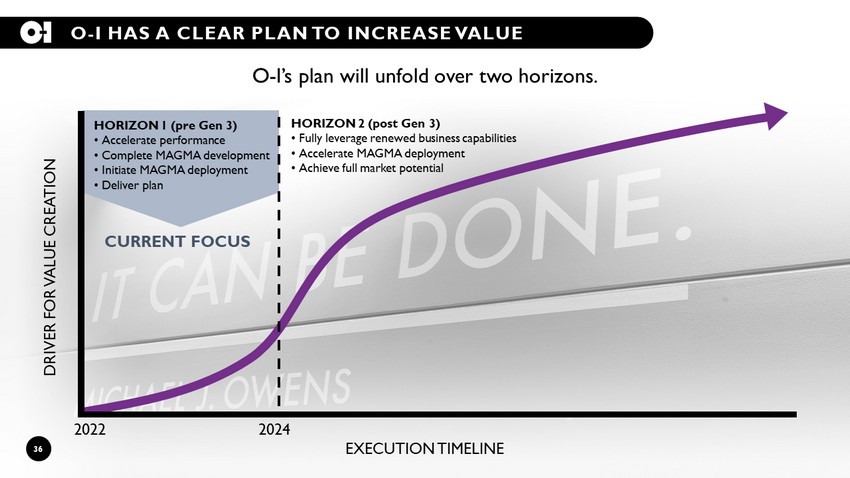
36 O - I HAS A CLEAR PLAN TO INCREASE VALUE HORIZON 2 (post Gen 3) • Fully leverage renewed business capabilities • Accelerate MAGMA deployment • Achieve full market potential CURRENT FOCUS HORIZON 1 (pre Gen 3) • Accelerate performance • Complete MAGMA development • Initiate MAGMA deployment • Deliver plan O - I’s plan will unfold over two horizons. DRIVER FOR VALUE CREATION EXECUTION TIMELINE 2022 2024
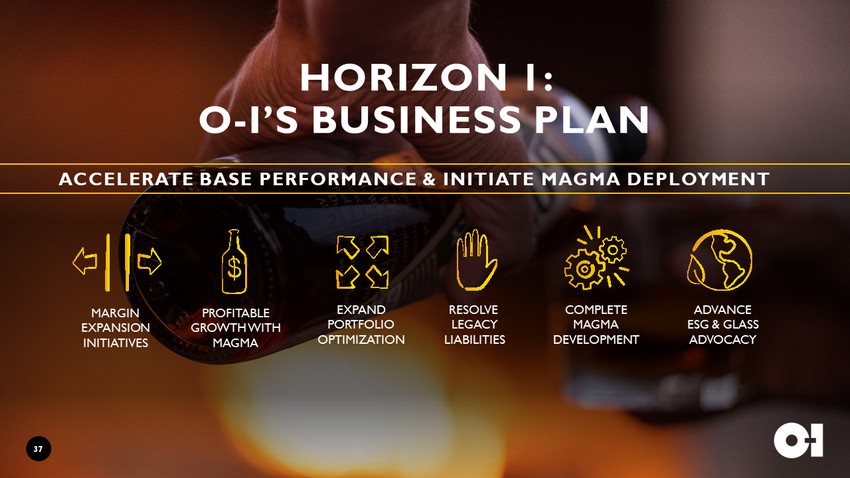
HORIZON 1: O - I’S BUSINESS PLAN MARGIN EXPANSION INITIATIVES PROFITABLE GROWTH WITH MAGMA RESOLVE LEGACY LIABILITIES EXPAND PORTFOLIO OPTIMIZATION ADVANCE ESG & GLASS ADVOCACY COMPLETE MAGMA DEVELOPMENT ACCELERATE BASE PERFORMANCE & INITIATE MAGMA DEPLOYMENT 37

38 38 O - I operations only 1% – 2% CAGR PROFITABLE VOLUME GROWTH 1 2022 - 2024 EXPANDING IN PREMIUM MARKETS ACROSS PREMIUM CATEGORIES WITH PREMIUM TECHNOLOGY Investing up to $680M to expand 700KT 2 (5% – 6%) capacity • $100M on previously announced Heritage brownfield in Andean • $580M in 4 markets with up to 11 MAGMA lines • Deployment 2022 - 2024 20% average IRR US Spirits (up to 3 MAGMA lines) BRAZIL Beer, NAB, Spirits (up to 3 MAGMA Lines) UK Spirits (up to 2 MAGMA Lines) CAN Premium Beer (1 Line Extension) MAGMA Greenfield Expansion Heritage Brownfield Expansion Line Extension COLOMBIA Beer, NAB (1 Heritage furnace) PERU Beer, NAB (up to 3 MAGMA Lines) 1 Gross of divestitures and net of capacity realignment 2 Approximately 600 - 650KT net expansion considering capacity realignment

39 EXPAND PORTFOLIO OPTIMIZATION Expand portfolio optimization to $1.5B to fund MAGMA expansion and improve ROIC. 1,500 810 690 $0 $200 $400 $600 $800 $1,000 $1,200 $1,400 $1,600 $1,800 Proceeds from Divestiture Investment in Expansion Available for Debt Reduction ($M) PORTFOLIO OPTIMIZATION PROGRAM (2019 - 2024) > 15% IRR ~ 0.7x lower Leverage Ratio Expected status by FYE21 or early 2022 REINVEST IN PROFITABLE GROWTH IMPROVE CAPITAL STRUCTURE OPTIMIZE BUSINESS PORTFOLIO REALIGN THE BUSINESS O - I HAS DEPRIORITIZED INORGANIC GROWTH GIVEN GROWING COMMERCIAL PIPELINE AND MAGMA’S UNIQUE CAPABILITIES

40 CAPITAL REDEPLOYMENT 1,450 $0 $200 $400 $600 $800 $1,000 $1,200 $1,400 $1,600 $1,800 $2,000 ($M) NET CAPITAL INVESTMENT (2022 - 2024) Maintenance Other Strategic Growth (Heritage) Growth (MAGMA) Net Capital Investment Stable net capital investment as portfolio optimization helps fund MAGMA growth investment. 500 EST. GROSS CAPEX 2022 - 2024 EST. PROCEEDS FROM PORTFOLIO REALIGNMENT EST. NET INVESTMENT 2022 - 2024 Expect > 25% of furnace rebuilds will be replaced with ~ 13 MAGMA Gen 1 lines 1 Run rate basis Average annual net investment of ~ $480M for 2022 - 2024 compares to the historic average of ~ $425M for 2017 - 2021F. Note: elevated cost inflation is expected to impact CapEx. Incremental portfolio optimization realignment substantially funds MAGMA expansion 1,950

41 RESOLVE LEGACY LIABILITIES 0% 10% 20% 30% 40% 50% 60% 70% 80% 90% 100% 2011 2012 2013 2014 2015 2016 2017 2018 2019 2020 2021F 2022F 2023F 2024F USE OF PRE - LIABILITY FCF 1 524(g) Trust Interest Asbestos Payments Pension Contributions Free Cash Flow Resolve legacy liabilities to shrink $1B of risk and boost FCF conversion. LEGACY ASBESTOS AND PENSION LIABILITY COSTS REPRESENTED 43% OF 2011 – 2021F PRE - LIABILITY FREE CASH FLOW O - I plans to resolve legacy liabilities that have absorbed nearly half of O - I’s pre - liability free cash flow in the past decade • Fund the Paddock 524(g) trust on the effective date of a confirmed plan of reorganization ($610M) (currently expected in 2022) • Eliminate underfunded position in key pension plans by end of 2024 Clear majority of O - I cash flow becomes available to create value 1 Pre - liability free cash flow relates to cash provided by operating activities less cash payments for property, plant and equipme nt plus pension contributions plus asbestos - related payments plus the one - time payment to the Paddock 524(g) trust plus interest payments related to the funding of the 524(g) trust. (excludes one time 524(g) funding)

42 ACCELERATING PERFORMANCE 2019-2021F CAGR 2022-2024 CAGR TARGET 2021F 2024 TARGET 2021F 2024 TARGET 2021F 2024 TARGET $1.65 - $1.75 $400M - $450M ~ 3.8X $2.20 - $2.40 ~ $350M ~ 3.5X aEPS 2 aFCF 3 LEVERAGE RATIO 4 1 2019 - 2021F adjusted for divestitures; 2022 - 2024 Avg. Sales Volume Growth Target is gross of divestitures and net of capacity realignment 2 aEPS excludes certain items management considers not representative of ongoing operations 3 aFCF represents Cash Flow from Operations less Maintenance Capex and excludes expected one - time cash funding of Paddock 524(g) trust. 4 Leverage ratio as defined by the company’s Bank Credit Agreement (BCA) SALES VOL GROWTH 1 0.1% 1 - 2% Net of ~ $0.25 - $0.30 impact from divestitures and interest on the funding of Paddock 524(g) trust Net of $610M (~ 0.5x) funding of Paddock 524(g) trust Gross of divestitures and net of impact of expected plant closure aFCF deducts maintenance CapEx but not strategic CapEx which will be mostly funded by divestiture proceeds recorded in cash flow from investing Deliver short - term financial improvement & enable long - term profitable growth. 2021 reported FCF is expected to be ~ $260M (~ $660M Cash from Operations less ~ $400M CapEx which includes ~ $310M maintenance CapEx ) KEY ENTERPRISE TARGETS
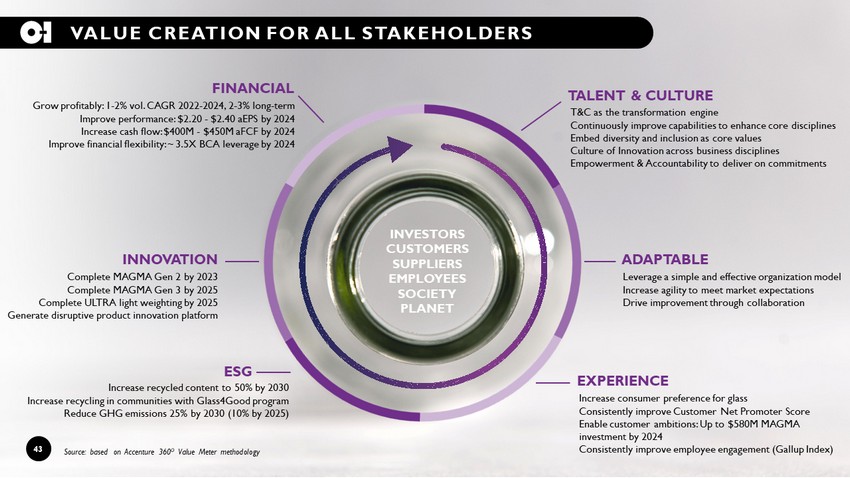
43 VALUE CREATION FOR ALL STAKEHOLDERS TALENT & CULTURE ADAPTABLE EXPERIENCE ESG INNOVATION FINANCIAL Source: based on Accenture 360 O Value Meter methodology INVESTORS CUSTOMERS SUPPLIERS EMPLOYEES SOCIETY PLANET Grow profitably: 1 - 2% vol. CAGR 2022 - 2024, 2 - 3% long - term Improve performance: $2.20 - $2.40 aEPS by 2024 Increase cash flow: $400M - $450M aFCF by 2024 Improve financial flexibility: ~ 3.5X BCA leverage by 2024 Increase recycled content to 50% by 2030 Increase recycling in communities with Glass4Good program Reduce GHG emissions 25% by 2030 (10% by 2025) Increase consumer preference for glass Consistently improve Customer Net Promoter Score Enable customer ambitions: Up to $580M MAGMA investment by 2024 Consistently improve employee engagement (Gallup Index) Leverage a simple and effective organization model Increase agility to meet market expectations Drive improvement through collaboration Complete MAGMA Gen 2 by 2023 Complete MAGMA Gen 3 by 2025 Complete ULTRA light weighting by 2025 Generate disruptive product innovation platform T&C as the transformation engine Continuously improve capabilities to enhance core disciplines Embed diversity and inclusion as core values Culture of Innovation across business disciplines Empowerment & Accountability to deliver on commitments 43

44 CONCLUSION: O - I IS AN ATTRACTIVE INVESTMENT TRANSFORMATION IMPROVES MARGINS, EARNINGS & ROIC RESOLUTION OF LEGACY LIABILITIES REDUCES RISK & IMPROVES CASH FLOW CONVERSION MAGMA WILL UNLOCK SIGNIFICANT GROWTH OPPORTUNITY FOR HIGHER VALUATION THROUGH SOLID EXECUTION AND PROFITABLE GROWTH MARKET, INNOVATION & ESG LEADER IN THE ATTRACTIVE GLASS SEGMENT

ACCELERATING O - I’S TRANSFORMATION 2021 INVESTOR DAY | SEPTEMBER 28, 2021

QUESTION & ANSWER SESSION

47 REVIEW OF FOCUS SESSIONS ADVANCING ESG Innovation - driven plan to advance sustainability and ESG Glass already has more of what we need tomorrow Social engagement with GLASS 4 GOOD TM ADVANCING GLASS ADVOCACY Trends & consumers favor glass Rebalancing the dialogue on glass Raising awareness on glass attributes fuels growth ENABLING GROWTH THROUGH NEW PRODUCT DEVELOPMENT Glass is uniquely positioned as a brand builder Outside - in new product development approach Case study: US beer & hard seltzers

ACCELERATING O - I’S TRANSFORMATION 2021 INVESTOR DAY | SEPTEMBER 28, 2021

FOCUS SESSION INTRODUCTIONS JOHN HAUDRICH SVP & CFO ARNAUD AUJOUANNET SVP & CHIEF SALES AND MARKETING OFFICER RANDY BURNS VP, CHIEF SUSTAINABILITY & CORPORATE AFFAIRS OFFICER MARIE - LAURE SUSSET DIRECTOR, INTEGRATED MARKETING COMMUNICATIONS CHRIS MANUEL VP, INVESTOR RELATIONS ASAD HAMID VP, GLOBAL MARKETING & INNOVATION 49

ADVANCING ESG FOCUS SESSION #1 “We will achieve balance, together, by transforming what we do.”

51

52 SUSTAINABILITY GOALS Increase recycled content to 50% average by 2030. O - I is taking a tailored approach to increase recycled content rates across its enterprise network as rates vary significantly by geography. Approved SBTi target to reduce GHG emissions 25% by 2030 (interim target of 10% by 2025). As part of our journey toward zero injuries, we are committed to a 50% improvement of our Total Recordable Incident Rate (TRIR) by 2030. Reduce the amount of natural resources used and reduce the generation of waste by reuse and recycling as we drive towards a Zero Waste organization. Renewable energy is a pillar in our strategy to lower carbon emissions. Our goal is to reach 40% renewable energy use by 2030 and to reduce total energy consumption by 9%. We see tremendous opportunity to positively impact the planet and communities where we operate. We will collaborate with customers, NGOs, suppliers and local leaders to make glass recycling available in 100% of our locations. Achieve sustainability balance, together, by aligning our supply chain with our 2030 sustainability vision and goals. We are committed to reducing our global water usage 25% by 2030, prioritizing operations in higher risk areas. Reinvent and re - imagine glassmaking – where the circularity of glass meets the potential of our MAGMA melting systems, low - carbon alternative fuels, and light - weighted glass packaging. Create a diverse and inclusive environment where people feel welcomed to create a better future for themselves, each other, and O - I. We are focused on increasing all aspects of diversity across our team.

INNOVATING EVERY PART OF OUR PROCESS FOR SUSTAINABILITY 53 50% RECYCLED GLASS USED ON AVERAGE IN 30% OF OUR FURNACES IN 2020 SCOPE 1 & 2 EMISSIONS TSC TOTAL ENERGY - RELATED PROJECTS 129 PROJECTS IN 2017 261 PROJECTS IN 2018 480 PROJECTS IN 2019 387 PROJECTS IN 2020 G.O.A.T. PROGRESS 13 FURNACES ALREADY OUTFITTED 36 FURNACES EARMARKED FOR DEPLOYMENT BETWEEN 2022 & 2030

GLASS: SUSTAINABILITY ATTRIBUTES OTHERS MAY NEVER HAVE A CIRCULAR ECONOMY SUCCESS A Glass Bottle for SICILY, from SICILY MADE FROM Very high rate of recycled glass (90%), collected UNIQUELY IN SICILY Locally sourced raw materials PRODUCED IN SICILY at O - I Marsala, the only plant rooted in Sicily EMBRACED BY SICILIAN wine makers Simple, inert ingredients No contact issues with contents No harm: us, earth, oceans 80% become new containers 100% infinitely recyclable Known recycled content Local sourcing, production, recycling 54

55 CLICK TO EDIT MASTER TITLE STYLE 55 SOCIAL ENGAGEMENT WITH ENVIRONMENTAL IMPACT MAKE GLASS RECYCLING AVAILABLE IN 100% OF OUR LOCATIONS We see tremendous opportunity to positively impact the planet and communities where we operate. We will collaborate with customers, NGOs, suppliers and local leaders.

ADVANCING ESG FOCUS SESSION #1 “We will achieve balance, together, by transforming what we do.” Q&A

ADVANCING GLASS ADVOCACY FOCUS SESSION #2
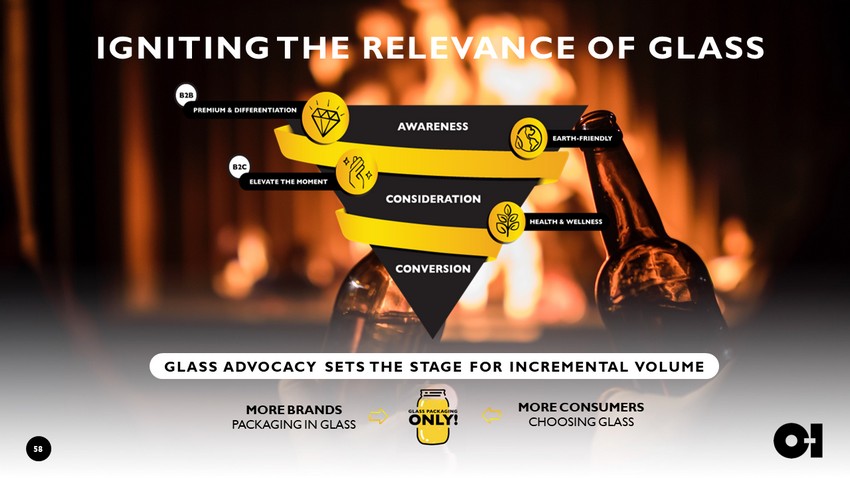
IGNITING THE RELEVANCE OF GLASS MORE BRANDS PACKAGING IN GLASS MORE CONSUMERS CHOOSING GLASS 58 GLASS ADVOCACY SETS THE STAGE FOR INCREMENTAL VOLUME
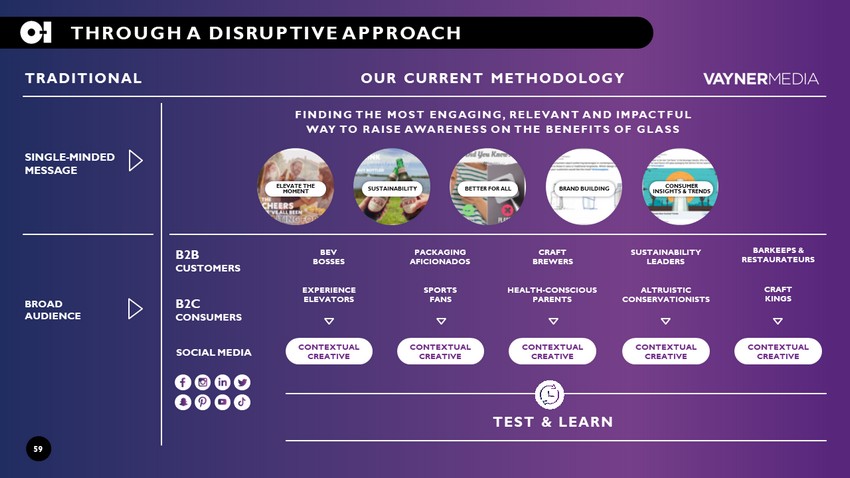
59 THROUGH A DISRUPTIVE APPROACH FINDING THE MOST ENGAGING, RELEVANT AND IMPACTFUL WAY TO RAISE AWARENESS ON THE BENEFITS OF GLASS BEV BOSSES PACKAGING AFICIONADOS CRAFT BREWERS SUSTAINABILITY LEADERS BARKEEPS & RESTAURATEURS TEST & LEARN SINGLE - MINDED MESSAGE BROAD AUDIENCE B2B CUSTOMERS B2C CONSUMERS SPORTS FANS EXPERIENCE ELEVATORS CRAFT KINGS HEALTH - CONSCIOUS PARENTS ALTRUISTIC CONSERVATIONISTS SOCIAL MEDIA TRADITIONAL OUR CURRENT METHODOLOGY CONTEXTUAL CREATIVE CONTEXTUAL CREATIVE CONTEXTUAL CREATIVE CONTEXTUAL CREATIVE CONTEXTUAL CREATIVE ELEVATE THE MOMENT SUSTAINABILITY BETTER FOR ALL BRAND BUILDING CONSUMER INSIGHTS & TRENDS

TO DRIVE IMPACT INCREASED RELEVANCE. IMPROVED ENGAGEMENT. HIGHER IMPACT. IN TWELVE MONTHS 1.1B IMPRESSIONS 93M AMERICANS REACHED 6 PT LIFT IN PURCHASE INTENT 6 X HIGHER THAN PLATFORM BENCHMARKS # TEAM GLASS ON AVERAGE 8.5x 2.4 PT DIRECTIONAL LIFT ON IN - STORE SALES 60

ADVANCING GLASS ADVOCACY FOCUS SESSION #2 Q&A
ENABLING GROWTH & NEW PRODUCT DEVELOPMENT FOCUS SESSION #3

ENGINEERING EMOTIONS BRAND BUILDING AT THE CORE OF OUR INNOVATION PHILOSOPHY BRAND BUILDING AT THE CORE OF OUR INNOVATION PHILOSOPHY ENGINEERING EMOTIONS BRAND STORY AND PERSONALITY UNIQUE GLASS ATTRIBUTES INSIGHTS AND EXPERTISE JOINT VALUE CREATION BRAND EXPANSION AND GROWTH 63
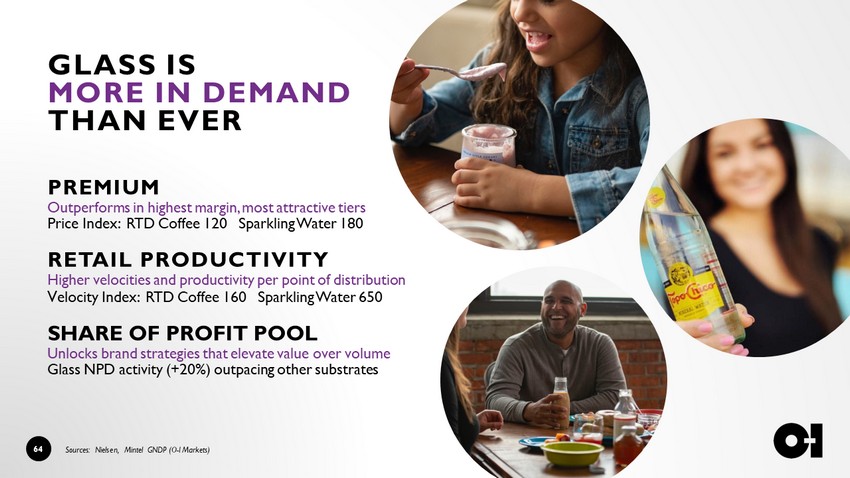
64 GLASS IS MORE IN DEMAND THAN EVER PREMIUM Outperforms in highest margin, most attractive tiers Price Index: RTD Coffee 120 Sparkling Water 180 RETAIL PRODUCTIVITY Higher velocities and productivity per point of distribution V elocity Index: RTD Coffee 160 Sparkling Water 650 SHARE OF PROFIT POOL Unlocks brand strategies that elevate value over volume Glass NPD activity (+20%) outpacing other substrates Sources: Nielsen, Mintel GNDP (O - I Markets)

65 US BEER & HARD SELTZER GLASS STILL PREFERRED, BUT NEEDS HAVE EVOLVED • Younger consumers and new liquids • Experimentation and novelty are king THEMES DRIVING CRAFT BEER & HARD SELTZERS • Creation • Connection • Defiance • Adventure • Playfulness GLASS MUST ADAPT • Undifferentiated traditional beer designs, unsuitable for today’s new and exciting liquids Consumers looking for novel experiences cannot find them in traditional beer bottles.

66 CATALYST H O R I Z O N H O R I Z O N INTRODUCING THE CATALYST COLLECTION 66

67 DISRUPTING THE NARRATIVE Consumer perception of beer in glass radically changes with the new catalyst collection. 0 10 20 30 40 50 60 70 80 90 Impression of Beer in Glass Premium New and Exciting Modern and Relevant Consumer Perception Traditional Beer Bottle Catalyst Snifter Drinktainer Source: Eurofins Food Integrity & Innovation Research FIND YOUR FIT Which design from The Catalyst Collection is right for your brand?
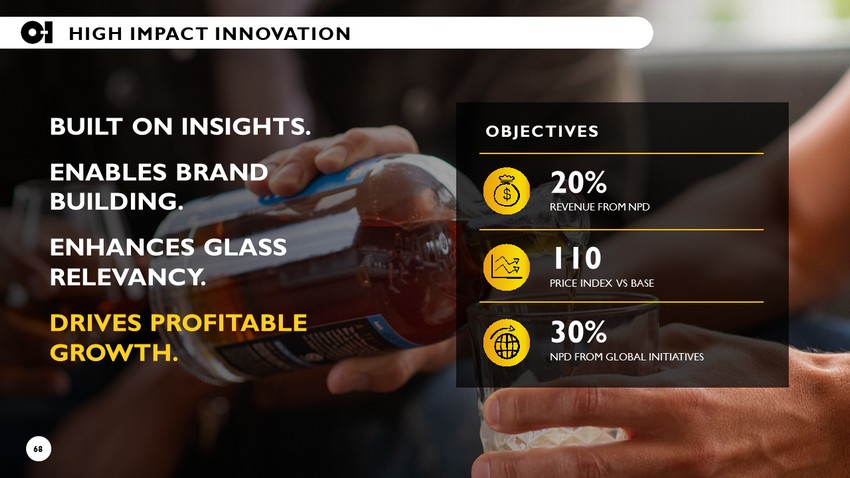
68 68 HIGH IMPACT INNOVATION BUILT ON INSIGHTS. ENABLES BRAND BUILDING. ENHANCES GLASS RELEVANCY. DRIVES PROFITABLE GROWTH. 20% REVENUE FROM NPD 110 PRICE INDEX VS BASE 30% NPD FROM GLOBAL INITIATIVES OBJECTIVES 68

ENABLING GROWTH & NEW PRODUCT DEVELOPMENT FOCUS SESSION #3 Q&A

ENGINEERING EMOTIONS

FINANCIAL APPENDIX
72 NON - GAAP FINANCIAL MEASURES The company uses certain non - GAAP financial measures, which are measures of its historical or future financial performance that are not calculated and presented in accordance with GAAP, within the meaning of applicable SEC rules. Management believes that its presentation and use of certain non - GAAP financi al measures, including adjusted earnings, adjusted earnings per share, free cash flow, adjusted free cash flow, pre - liability free cash flow, adjusted EBITDA, adjusted EBITDA to f ree cash flow conversion, net debt, credit agreement EBITDA and leverage ratio provide relevant and useful supplemental financial information that is widely used by analysts and investo rs, as well as by management in assessing both consolidated and business unit performance. These non - GAAP measures are reconciled to the most directly comparable GAAP measures and should be c onsidered supplemental in nature and should not be considered in isolation or be construed as being more important than comparable GAAP measures. Adjusted earnings relates to net earnings from continuing operations attributable to the company, exclusive of items manageme nt considers not representative of ongoing operations because such items are not reflective of the company’s principal business activity, which is glass container production. Adjust ed earnings are divided by weighted average shares outstanding (diluted) to derive adjusted earnings per share. Management uses adjusted earnings and adjusted earnings per share to evaluat e i ts period - over - period operating performance because it believes these provide useful supplemental measures of the results of operations of its principal business activity by exclud ing items that are not reflective of such operations. Adjusted earnings and adjusted earnings per share may be useful to investors in evaluating the underlying operating performance of the co mpany’s business as these measures eliminate items that are not reflective of its principal business activity. Leverage ratio is defined as net debt divided by credit agreement EBITDA (as defined in the Company's bank credit agreement). N et debt is defined as total debt less cash. Management uses net debt to analyze the liquidity of the company. Further, free cash flow relates to cash provided by operating activities less cash payments for property, plant and equipment . M anagement has historically used free cash flow to evaluate its period - over - period cash generation performance because it believes this has provided a useful supplemental measure related to it s principal business activity. Adjusted free cash flow relates to cash provided by operating activities less cash payments for property, plant and equipment that are related to mai nte nance activities and excludes the expected one - time cash payment of the Paddock 524(g) trust. Pre - liability free cash flow relates to cash provided by operating activities less cash pay ments for property, plant and equipment plus pension contributions plus asbestos - related payments plus the one - time payment to fund the Paddock 524(g) trust plus interest payments r elated to the funding of the 524(g) trust. Management uses free cash flow, adjusted free cash flow and pre - liability free cash flow to evaluate its period - over - period cash generation performance because it believes this provides a useful supplemental measure related to its principal business activity. Free cash flow, adjusted free cash flow and pre - liability free cash flow may be useful to investors to assist in understanding the comparability of cash flows generated by the Company’s principal business activity. Since a significant portion of the Company’ s non - maintenance - related (or strategic) capital spending is planned to be funded by proceeds from divested assets, adjusted free cash flow may help investors to evaluate the long - term cash generation ability of the Company’s principal business activity as non - maintenance related capital spending declines. Since the Company expects pension contributions and asbestos - rel ated payments to decline in future years, pre - liability free cash flow may also help investors to evaluate the long - term cash generation ability of the Company's principal business activity . It should not be inferred that the entire free cash flow, adjusted free cash flow or pre - liability free cash flow amounts are available for discretionary expenditures since the Company h as mandatory debt service requirements and other non - discretionary expenditures that are not deducted from the measure. Adjusted EBITDA relates to net earnings from continuing op era tions attributable to the company, less interest, taxes, depreciation and amortization as well as items management considers not representative of ongoing operations because such ite ms are not reflective of the company’s principal business activity. Free cash flow to adjusted EBITDA conversion may be useful to investors to assist in understanding the comparabilit y o f cash flows generated by the company’s principal business activity. Management uses non - GAAP information principally for internal reporting, forecasting, budgeting and calculating compen sation payments. The Company routinely posts important information on its website at o - i.com/investors .
73 RECONCILIATION FOR ADJUSTED EARNINGS & aEPS The Company is unable to present a quantitative reconciliation of its forward - looking non - GAAP measures, adjusted earnings and adjusted earnings per share, for the year ending December 31, 2021 and all periods after, to its most directly comparable GAAP financial measure, earnings from operations attributable to the Company, because management cannot reliably predict all of the necessary components of the GAAP financial measures without unreasonable efforts. Earnings from operations attributable to the Company includes several significant items, such as restructuring charges, asset impairment charges, charges for the write - off of finance fees, and the income tax effect on such items. The decisions and events that typically lead to the recognition of these and other similar items are complex and inherently unpredictable, and the amount recognized for each item can vary significantly. Accordingly, the Company is unable to provide a reconciliation of adjusted earnings and adjusted earnings per share to earnings from operations attributable to the Company or address the probable significance of the unavailable information, which could be material to the Company's future financial results.

74 RECONCILIATION FOR FCF & PRE - LIABILITY FCF The Company is unable to present a quantitative reconciliation of its forward - looking non - GAAP measures, free cash flow and pre - liability free cash flow, for all periods after December 31, 2021 to its most directly comparable U.S. GAAP financial measure, cash provided by operating activities, without unreasonable effort. This is due to potentially high variability, complexity and low visibility, in the relevant future periods, of components of cash provided by operating activities and cash spent on property, plant and equipment, as well as items that would be excluded from cash provided by operating activities. The variability of these excluded items and other components of cash provided by operating activities may have a significant, and potentially unpredictable, impact on the Company's future financial results. 2011 2012 2013 2014 2015 2016 2017 2018 2019 2020 2021F Cash from continuing operating activities 505$ 580$ 700$ 698$ 612$ 758$ 724$ 793$ 408$ 457$ 660$ Cash payments for property, plant and equipment 285 290 361 369 402 454 441 536 426 311 400 Free Cash Flow (non-GAAP) 220$ 290$ 339$ 329$ 210$ 304$ 283$ 257$ (18)$ 146$ 260$ Pension contributions 59 219 96 28 17 38 31 34 33 103 75 Asbestos-related payments 170 165 158 148 138 125 110 105 151 Pre-Liability Free Cash Flow (non-GAAP) 449$ 674$ 593$ 505$ 365$ 467$ 424$ 396$ 166$ 249$ 335$ Year ended December 31,

75 RECONCILIATION TO FCF AND ADJUSTED FCF The Company is unable to present a quantitative reconciliation of its forward - looking non - GAAP measures, free cash flow and adjusted free cash flow, for all periods after December 31, 2021 to its most directly comparable U.S. GAAP financial measure, Cash provided by operating activities, without unreasonable effort. This is due to potentially high variability, complexity and low visibility, in the relevant future periods, of components of cash provided by operating activities and cash spent on property, plant and equipment, as well as items that would be excluded from cash provided by operating activities. The variability of these excluded items and other components of cash provided by operating activities may have a significant, and potentially unpredictable, impact on the Company's future financial results. Unaudited Forecasted Year Ended December 31, 2021 Cash provided by operating activities 660$ Cash payments for maintenance-related property, plant and equipment 310 Adjusted Free Cash Flow (non-GAAP) 350$ Cash payments for strategic-related property, plant and equipment 90 Free Cash Flow (non-GAAP) 260$

76 RECONCILIATION FOR LEVERAGE RATIO & NET DEBT For the year ending December 31, 2021 and all periods after, the Company is unable to present a quantitative reconciliation of its forward - looking non - GAAP measure, net debt divided by Credit Agreement EBITDA, to its most directly comparable U.S. GAAP financial measure, Net Earnings, because management cannot reliably predict all of the necessary components of this U.S. GAAP financial measure without unreasonable efforts. Net Earnings includes several significant items, such as restructuring, asset impairment and other charges, charges for the write - off of finance fees, and the income tax effect on such items. The decisions and events that typically lead to the recognition of these and other similar non - GAAP adjustments are inherently unpredictable as to if and when they may occur. The inability to provide a reconciliation is due to that unpredictability and the related difficulties in assessing the potential financial impact of the non - GAAP adjustments. For the same reasons, the Company is unable to address the probable significance of the unavailable information, which could be material to the Company’s future financial results.

77 OTHER KEY ASSUMPTIONS: 2022 - 2024 Corporate Retained & Other ~ $40 million/quarter Effective Tax Rate ~ 30% - 32% Average Interest Rate ~ 4.5% - 5.0% APPROXIMATE ANNUAL IMPACT ON FX RATES AT KEY POINTS EPS FROM 10% FX CHANGE Aug 31, Aug YTD Aug YTD AVG 2021 2021 2020 2020 EUR 0.13 EUR 1.18 1.20 1.13 1.15 MXN 0.04 MXN 20.10 20.21 21.87 21.56 BRL 0.04 BRL 5.18 5.32 5.08 5.21 COP 0.02 COP 3,806 3,716 3,726 3,715 APPROXIMATE ANNUAL IMPACT ON FX RATES AT KEY POINTS EPS FROM 10% FX CHANGE Aug 31, Aug YTD Aug YTD AVG 2021 2021 2020 2020 EUR 0.13 EUR 1.18 1.20 1.13 1.15 MXN 0.04 MXN 20.10 20.21 21.87 21.56 BRL 0.04 BRL 5.18 5.32 5.08 5.21 COP 0.02 COP 3,806 3,716 3,726 3,715 Corporate Retained & Other ~ $40 million/quarter Effective Tax Rate ~ 30% - 32% Average Interest Rate ~ 4.5% - 5.0% APPROXIMATE ANNUAL IMPACT ON FX RATES AT KEY POINTS EPS FROM 10% FX CHANGE Aug 31, Aug YTD Aug YTD AVG 2021 2021 2020 2020 EUR 0.13 EUR 1.18 1.20 1.13 1.15 MXN 0.04 MXN 20.10 20.21 21.87 21.56 BRL 0.04 BRL 5.18 5.32 5.08 5.21 COP 0.02 COP 3,806 3,716 3,726 3,715 APPROXIMATE ANNUAL IMPACT ON FX RATES AT KEY POINTS EPS FROM 10% FX CHANGE Aug 31, Aug YTD Aug YTD AVG 2021 2021 2020 2020 EUR 0.13 EUR 1.18 1.20 1.13 1.15 MXN 0.04 MXN 20.10 20.21 21.87 21.56 BRL 0.04 BRL 5.18 5.32 5.08 5.21 COP 0.02 COP 3,806 3,716 3,726 3,715