Exhibit 99.2

SEPTEMBER 2022 3Q22 CAPITAL MARKETS PRESENTATION
SAFE HARBOR COMMENTS FORWARD - LOOKING STATEMENTS This presentation contains “forward - looking” statements related to O - I Glass, Inc. (“O - I” or the “company”) within the meaning o f Section 21E of the Securities Exchange Act of 1934, as amended, and Section 27A of the Securities Act of 1933, as amended. Forward - looking statements reflect the company’s current exp ectations and projections about future events at the time, and thus involve uncertainty and risk. The words “believe,” “expect,” “anticipate,” “will,” “could,” “would,” “should,” “may, ” “ plan,” “estimate,” “intend,” “predict,” “potential,” “continue,” and the negatives of these words and other similar expressions generally identify forward - looking statements. It is possible that the company’s future financial performance may differ from expectations due to a variety of factors inclu din g, but not limited to the following: (1) the impact of the COVID - 19 pandemic and the various governmental, industry and consumer actions related thereto, (2) the company’s ability to obtain the be nefits it anticipates from the Corporate Modernization, (3) the company’s ability to manage its cost structure, including its success in implementing restructuring or other plans aimed at i mpr oving the company’s operating efficiency and working capital management, and achieving cost savings, (4) the company’s ability to acquire or divest businesses, acquire and expand plants, in tegrate operations of acquired businesses and achieve expected benefits from acquisitions, divestitures or expansions, (5) the company’s ability to achieve its strategic plan, (6) the comp any ’s ability to improve its glass melting technology, known as the MAGMA program, and implement it within the timeframe expected, (7) foreign currency fluctuations relative to the U.S. dollar, (8 ) changes in capital availability or cost, including interest rate fluctuations and the ability of the company to refinance debt on favorable terms, (9) the general political, economic and com pet itive conditions in markets and countries where the company has operations, including uncertainties related to economic and social conditions, disruptions in the supply chain, competitive p ric ing pressures, inflation or deflation, changes in tax rates and laws, war, civil disturbance or acts of terrorism, natural disasters, and weather, (10) the company’s ability to generate sufficien t f uture cash flows to ensure the company’s goodwill is not impaired, (11) consumer preferences for alternative forms of packaging, (12) cost and availability of raw materials, labor, energy and tra nsportation (including impacts related to the current conflict between Russia and Ukraine and disruptions in supply of raw materials caused by transportation delays ), (13) consolidation among competitors and customers, (14) unanticipated expenditures with respect to data privacy, environmental, safety and health laws, (15) unanticipated operational disruptions, including hi ghe r capital spending, (16) the company’s ability to further develop its sales, marketing and product development capabilities, (17) the failure of the company’s joint venture partners to meet their ob ligations or commit additional capital to the joint venture, (18) the ability of the company and the third parties on which it relies for information technology system support to prevent and dete ct security breaches related to cybersecurity and data privacy, (19) changes in U.S. trade policies, (20) risks related to recycling and recycled content laws and regulations, (21) risks related to climate - change and air emissions, including related laws or regulations and the other risk factors discussed in the company's filings with the Securities and Exchange Commission. It is not possible to foresee or identify all such factors. Any forward - looking statements in this document are based on certai n assumptions and analyses made by the company in light of its experience and perception of historical trends, current conditions, expected future developments, and other factors it believ es are appropriate in the circumstances. Forward - looking statements are not a guarantee of future performance and actual results or developments may differ materially from expectatio ns. While the company continually reviews trends and uncertainties affecting the company’s results or operations and financial condition, the company does not assume any obligati on to update or supplement any particular forward - looking statements contained in this document.
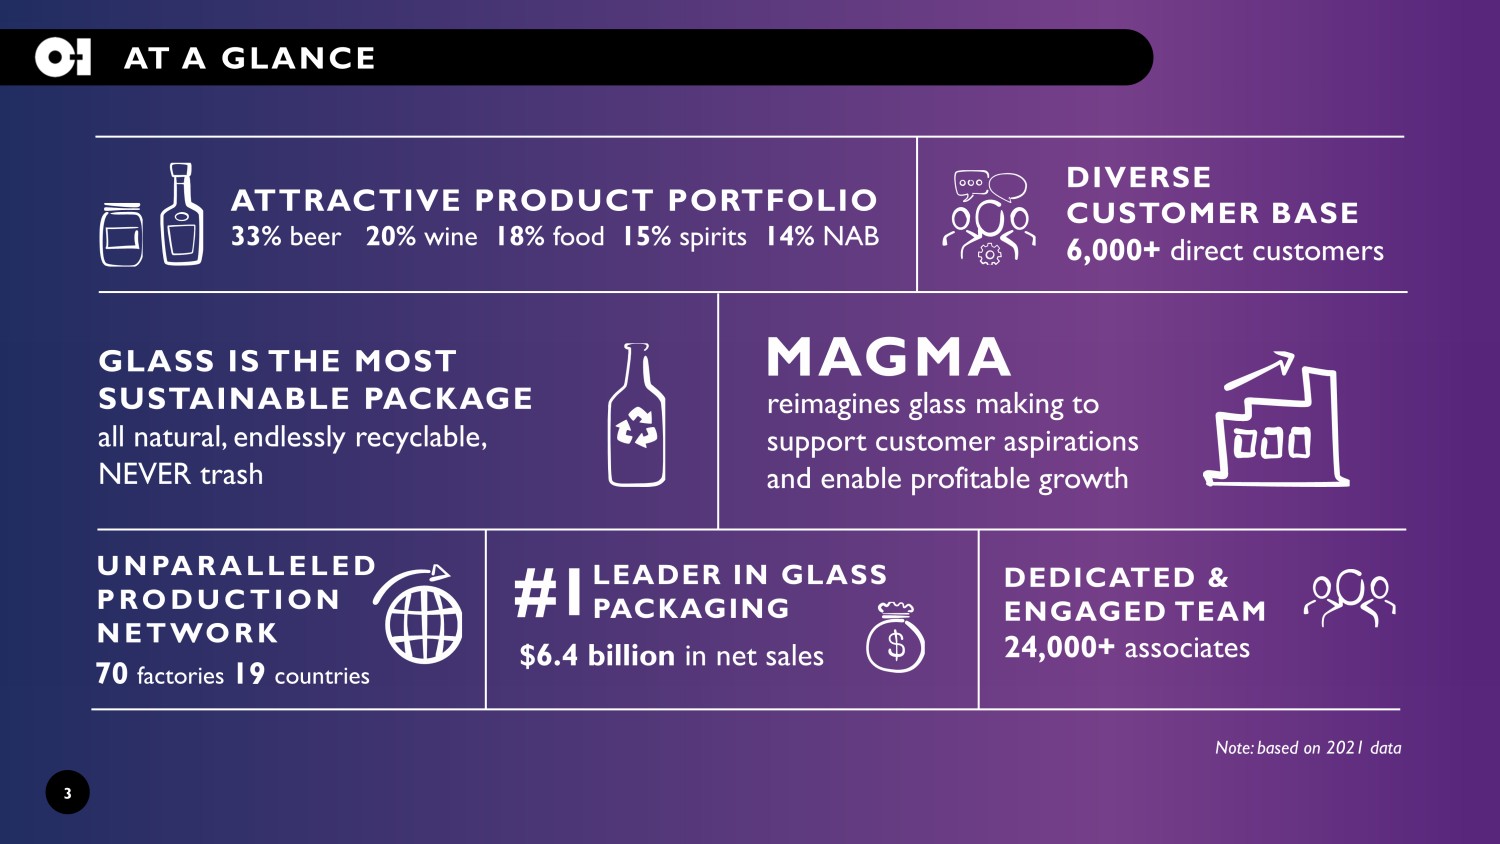
3 AT A GLANCE #1 70 factories 19 countries ATTRACTIVE PRODUCT PORTFOLIO 33 % beer 20% wine 18 % food 15 % spirits 14 % NAB GLASS IS THE MOST SUSTAINABLE PACKAGE all natural, endlessly recyclable, NEVER trash Note: based on 2021 data MAGMA reimagines glass making to support customer aspirations and enable profitable growth DIVERSE CUSTOMER BASE 6,000+ direct customers DEDICATED & ENGAGED TEAM 24,000+ associates UNPARALLELED PRODUCTION NETWORK LEADER IN GLASS PACKAGING $6.4 billion in net sales
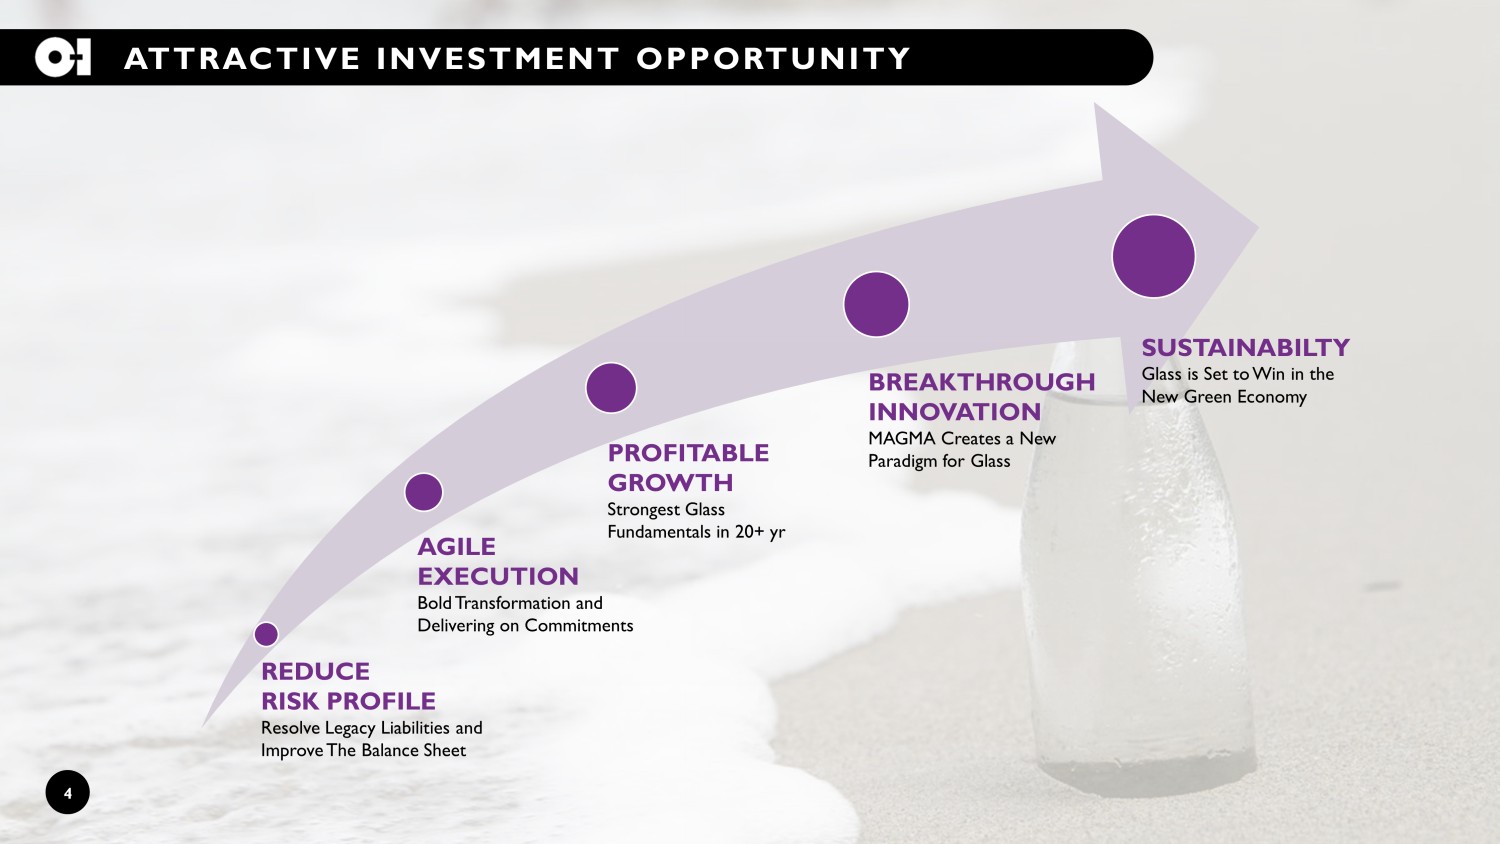
4 ATTRACTIVE INVESTMENT OPPORTUNITY REDUCE RISK PROFILE Resolve Legacy Liabilities and Improve The Balance Sheet PROFITABLE GROWTH Strongest Glass Fundamentals in 20+ yr AGILE EXECUTION Bold Transformation and Delivering on Commitments BREAKTHROUGH INNOVATION MAGMA Creates a New Paradigm for Glass SUSTAINABILTY Glass is Set to Win in the New Green Economy
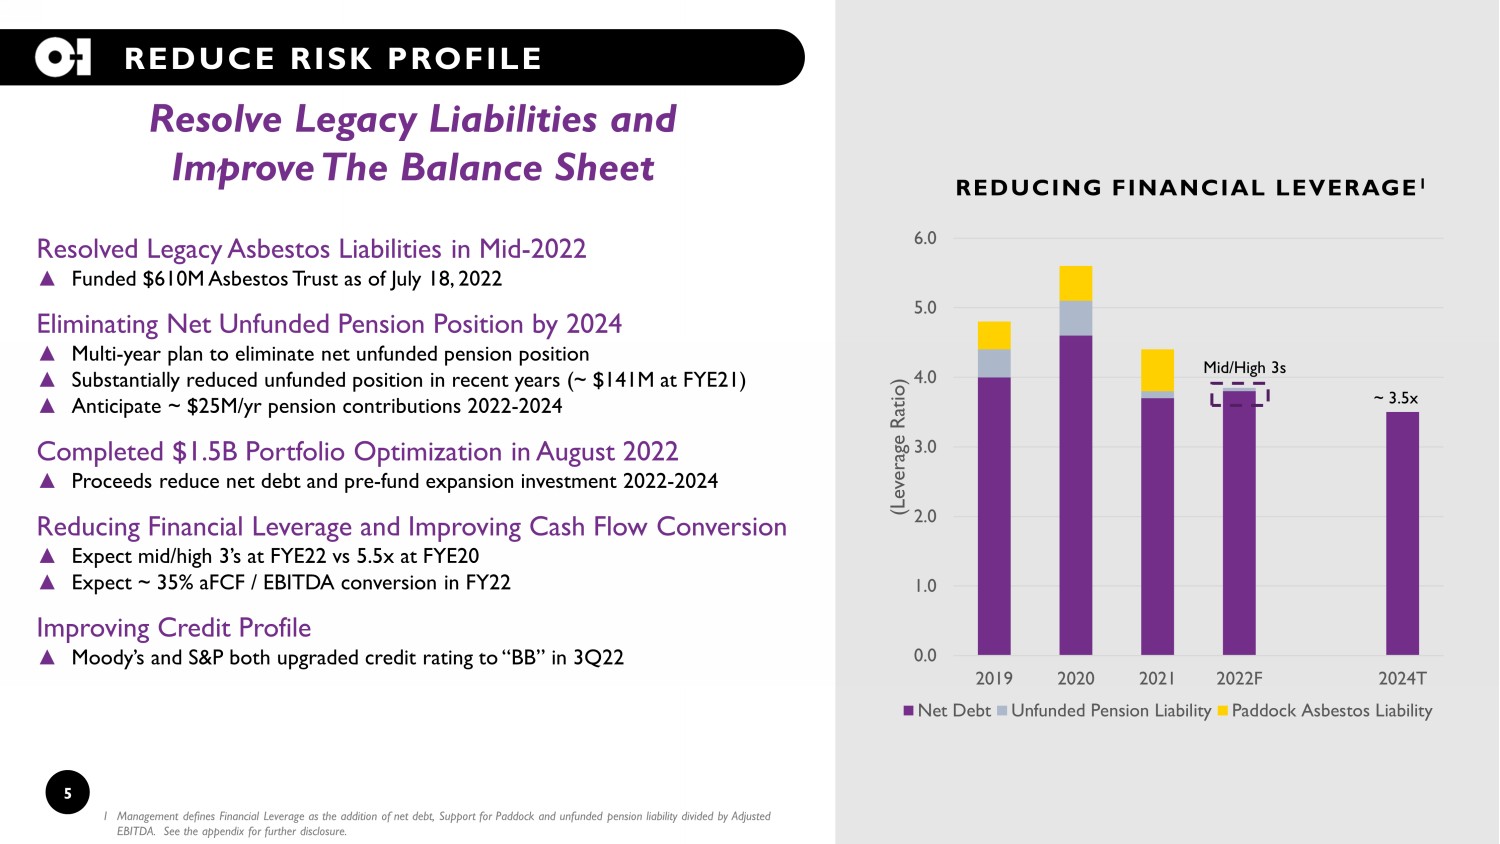
5 REDUCE RISK PROFILE 1 Management defines Financial Leverage as the addition of net debt, Support for Paddock and unfunded pension liability divided by Adjusted EBITDA. See the appendix for further disclosure. 0.0 1.0 2.0 3.0 4.0 5.0 6.0 2019 2020 2021 2022F 2024T (Leverage Ratio) Net Debt Unfunded Pension Liability Paddock Asbestos Liability REDUCING FINANCIAL LEVERAGE 1 Resolve Legacy Liabilities and Improve The Balance Sheet Mid/High 3s ~ 3.5x Resolved Legacy Asbestos Liabilities in Mid - 2022 ▲ Funded $610M Asbestos Trust as of July 18, 2022 Eliminating Net Unfunded Pension Position by 2024 ▲ Multi - year plan to eliminate net unfunded pension position ▲ Substantially reduced unfunded position in recent years (~ $141M at FYE21 ) ▲ Anticipate ~ $25M/ yr pension contributions 2022 - 2024 Completed $1.5B Portfolio Optimization in August 2022 ▲ Proceeds reduce net debt and pre - fund expansion investment 2022 - 2024 Reducing Financial Leverage and Improving Cash Flow Conversion ▲ Expect mid/high 3’s at FYE22 vs 5.5x at FYE20 ▲ Expect ~ 35% aFCF / EBITDA conversion in FY22 Improving Credit Profile ▲ Moody’s and S&P both upgraded credit rating to “BB” in 3Q22
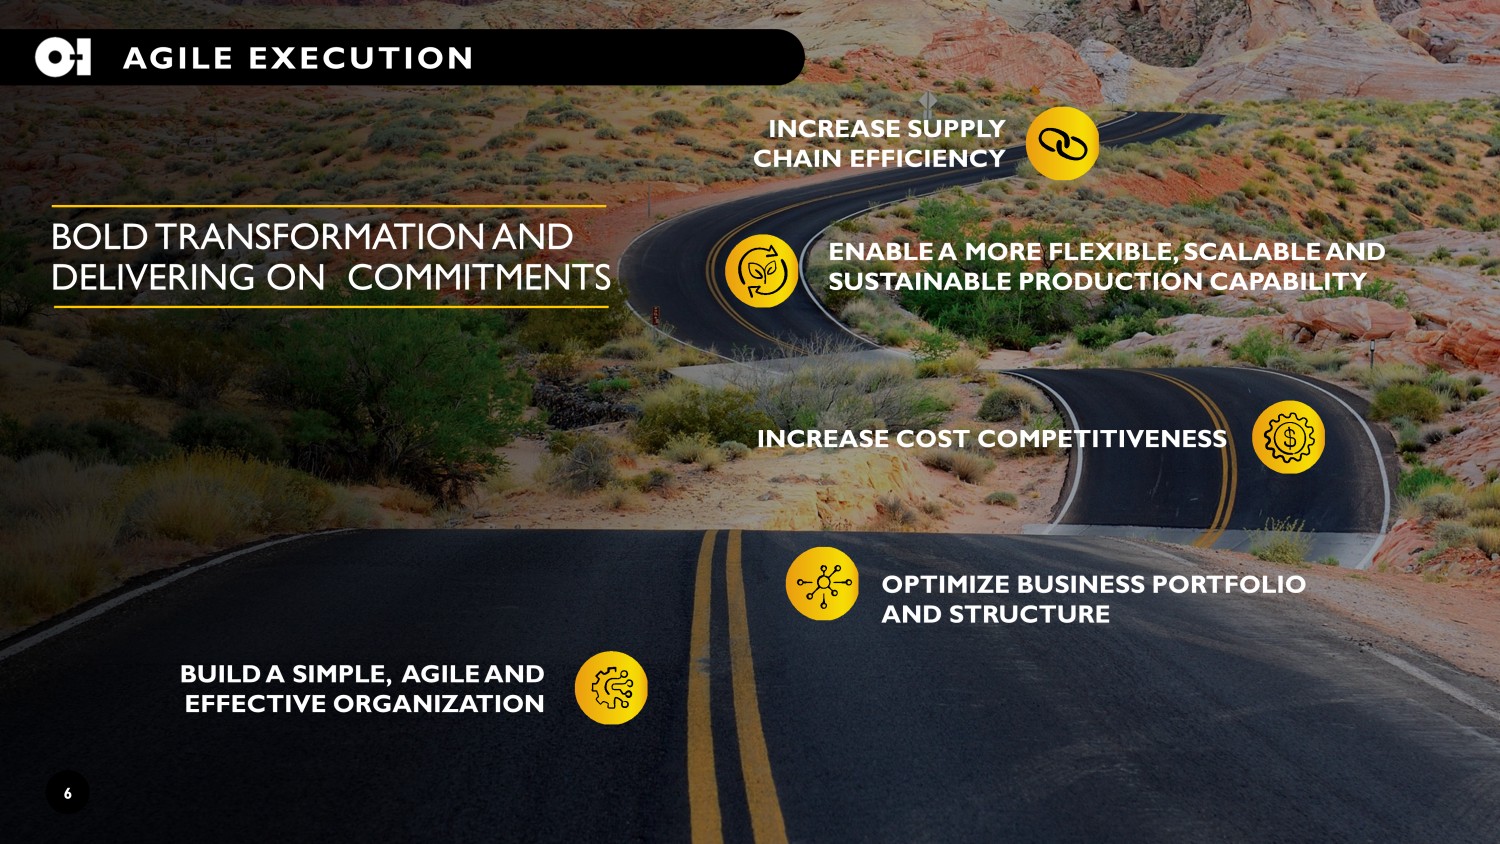
INCREASE COST COMPETITIVENESS OPTIMIZE BUSINESS PORTFOLIO AND STRUCTURE INCREASE SUPPLY CHAIN EFFICIENCY ENABLE A MORE FLEXIBLE, SCALABLE AND SUSTAINABLE PRODUCTION CAPABILITY BUILD A SIMPLE, AGILE AND EFFECTIVE ORGANIZATION AGILE EXECUTION BOLD TRANSFORMATION AND DELIVERING ON COMMITMENTS 6
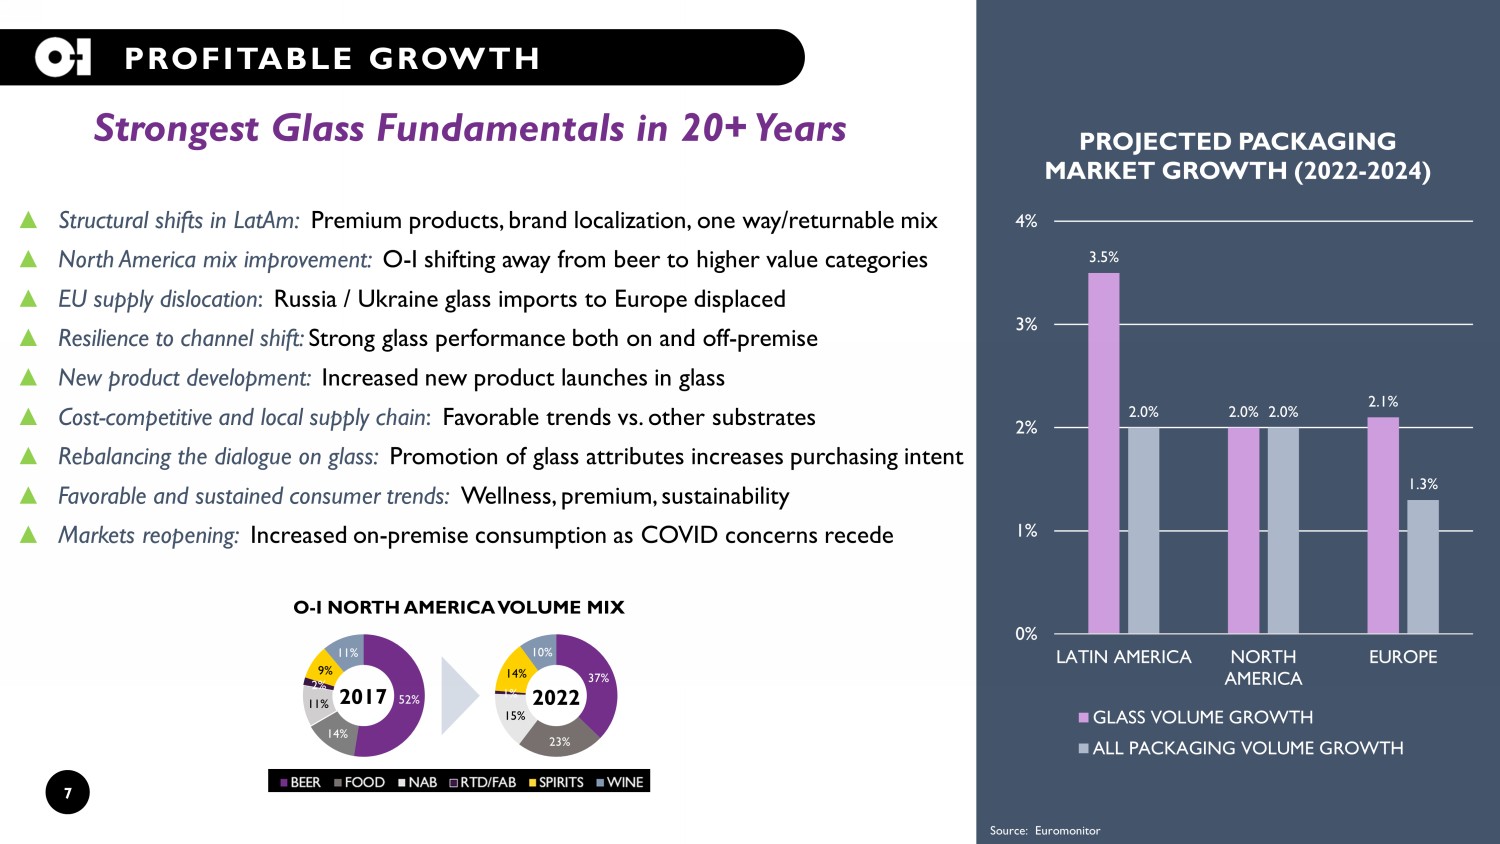
7 PROFITABLE GROWTH Strongest Glass Fundamentals in 20+ Years ▲ Structural shifts in LatAm : Premium products, brand localization, one way/returnable mix ▲ North America mix improvement: O - I shifting away from beer to higher value categories ▲ EU supply dislocation : Russia / Ukraine glass imports to Europe displaced ▲ Resilience to channel shift: Strong glass performance both on and off - premise ▲ New product development: Increased new product launches in glass ▲ Cost - competitive and local supply chain : Favorable trends vs. other substrates ▲ Rebalancing the dialogue on glass: Promotion of glass attributes increases purchasing intent ▲ Favorable and sustained consumer trends: Wellness, premium, sustainability ▲ Markets reopening: Increased on - premise consumption as COVID concerns recede 37% 23% 15% 1% 14% 10% 52% 14% 11% 2% 9% 11% 2017 2022 O - I NORTH AMERICA VOLUME MIX 3.5% 2.0% 2.1% 2.0% 2.0% 1.3% 0% 1% 2% 3% 4% LATIN AMERICA NORTH AMERICA EUROPE PROJECTED PACKAGING MARKET GROWTH (2022 - 2024) GLASS VOLUME GROWTH ALL PACKAGING VOLUME GROWTH Source: Euromonitor
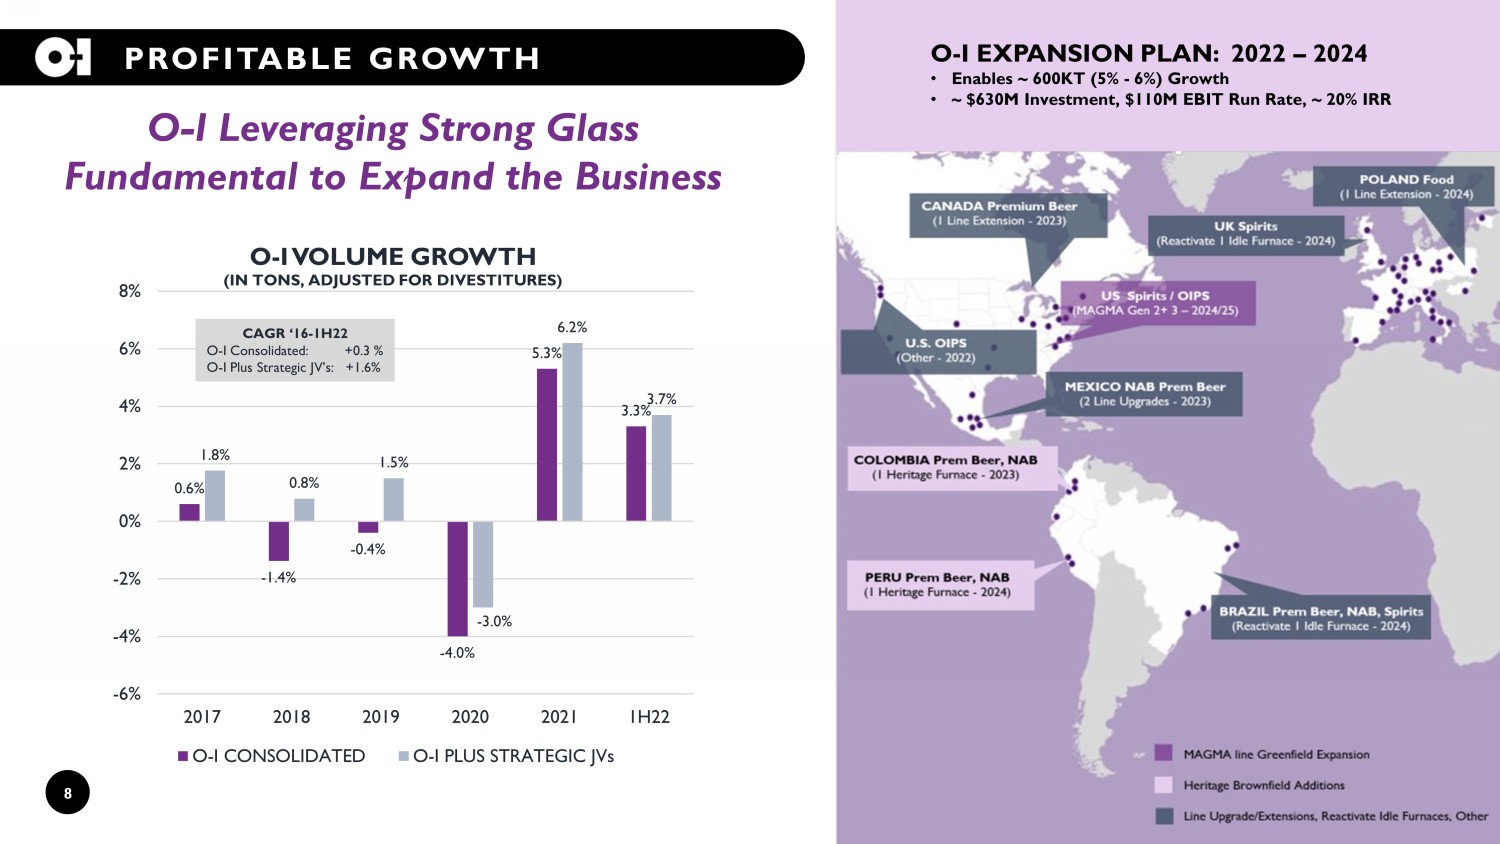
8 O - I EXPANSION PLAN: 2022 – 2024 • Enables ~ 600KT (5% - 6%) Growth • ~ $630M Investment, $110M EBIT Run Rate, ~ 20% IRR PROFITABLE GROWTH O - I Leveraging Strong Glass Fundamental to Expand the Business 0.6% - 1.4% - 0.4% - 4.0% 5.3% 3.3% 1.8% 0.8% 1.5% - 3.0% 6.2% 3.7% -6% -4% -2% 0% 2% 4% 6% 8% 2017 2018 2019 2020 2021 1H22 O - I VOLUME GROWTH (IN TONS, ADJUSTED FOR DIVESTITURES) O-I CONSOLIDATED O-I PLUS STRATEGIC JVs CAGR ‘16 - 1H22 O - I Consolidated: +0.3 % O - I Plus Strategic JV’s: +1.6%
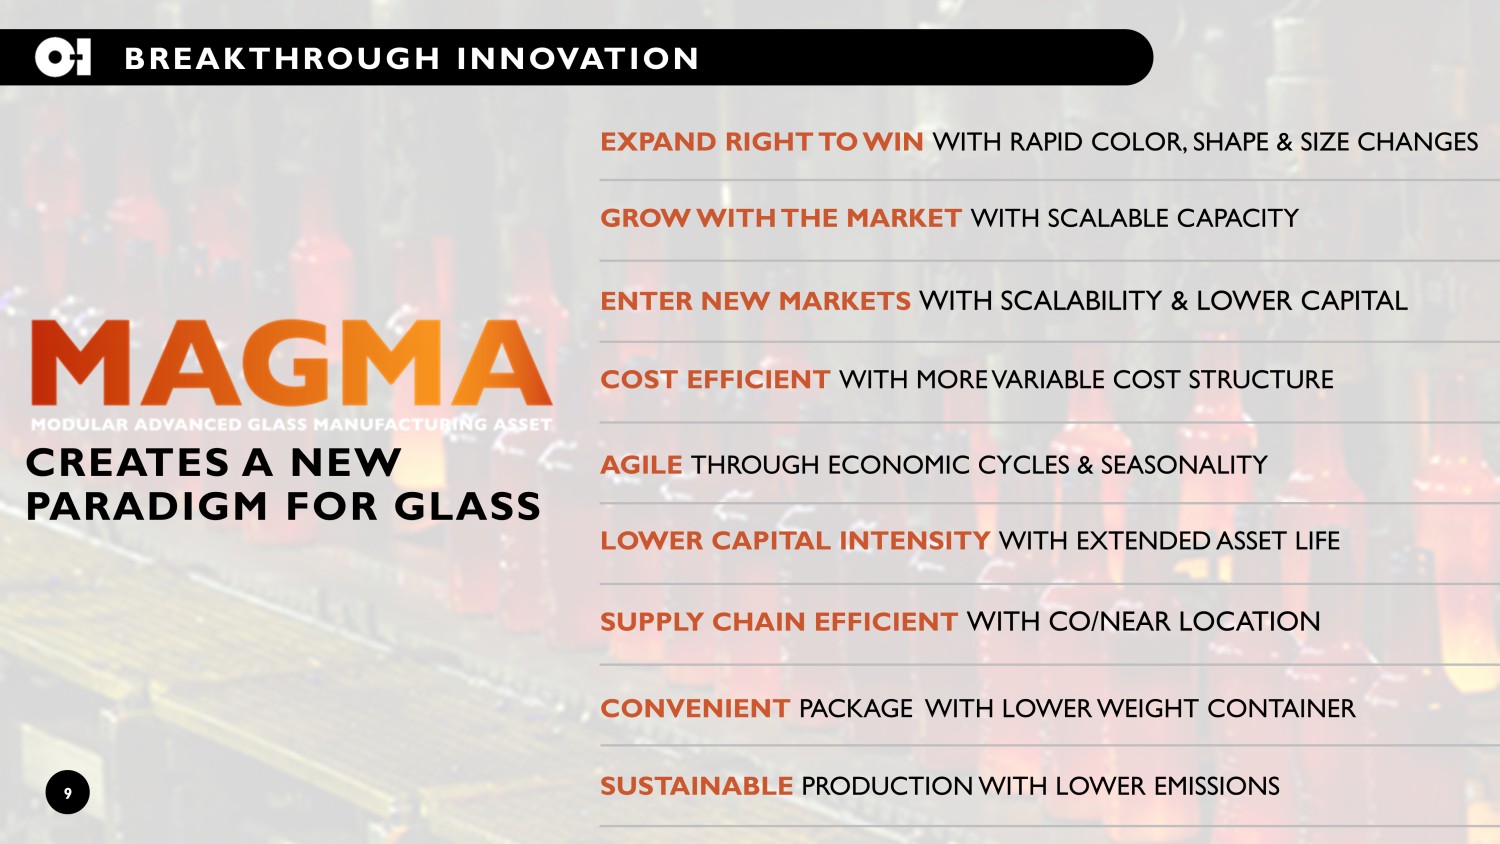
9 BREAKTHROUGH INNOVATION CREATES A NEW PARADIGM FOR GLASS EXPAND RIGHT TO WIN WITH RAPID COLOR, SHAPE & SIZE CHANGES AGILE THROUGH ECONOMIC CYCLES & SEASONALITY SUPPLY CHAIN EFFICIENT WITH CO/NEAR LOCATION LOWER CAPITAL INTENSITY WITH EXTENDED ASSET LIFE GROW WITH THE MARKET WITH SCALABLE CAPACITY SUSTAINABLE PRODUCTION WITH LOWER EMISSIONS CONVENIENT PACKAGE WITH LOWER WEIGHT CONTAINER COST EFFICIENT WITH MORE VARIABLE COST STRUCTURE ENTER NEW MARKETS WITH SCALABILITY & LOWER CAPITAL

10 SUSTAINABILTY B RATING ▲ Elevated Goals ▲ Doubled ESG Initiatives ▲ Global CO2 reduced by 13% from base year ▲ Global Renewable Electricity >30% ▲ #52 on Forbes America's 500 Best Large Employers PROGRESS AND RECOGNITION GLASS IS HIGHLY SUSTAINABLE ▲ 100% recyclable ▲ Reusable and circular ▲ All natural and inert ▲ Never waste – earth and ocean friendly ▲ Local supply chain MAJOR LEVERS FOR IMPROVEMENT ▲ Increase cullet usage ▲ Light weight containers ▲ Near/co - location to reduce logistics ▲ Renewable fuels ▲ Reduce emissions POTENTIAL CARBON IMPACT OF MAGMA VS. HERITAGE Illustrative representation of carbon impact per bottle (g CO2 /unit) ( i ) oxygen - fuel furnace, ~ 35% recycled content; ( ii ) ~ 55% recycled content; ( iii ) with co - location and ~ 95% recycled content; ( iv ) with renewable energy Heritage (i) MAGMA Gen 3 w/ ULTRA (ii) MAGMA Gen 3 w/ advancement (iii) MAGMA Gen 3 ultimate (iv) Carbon impact (CO2 /bottle) Glass is Set to Win in the New Green Economy
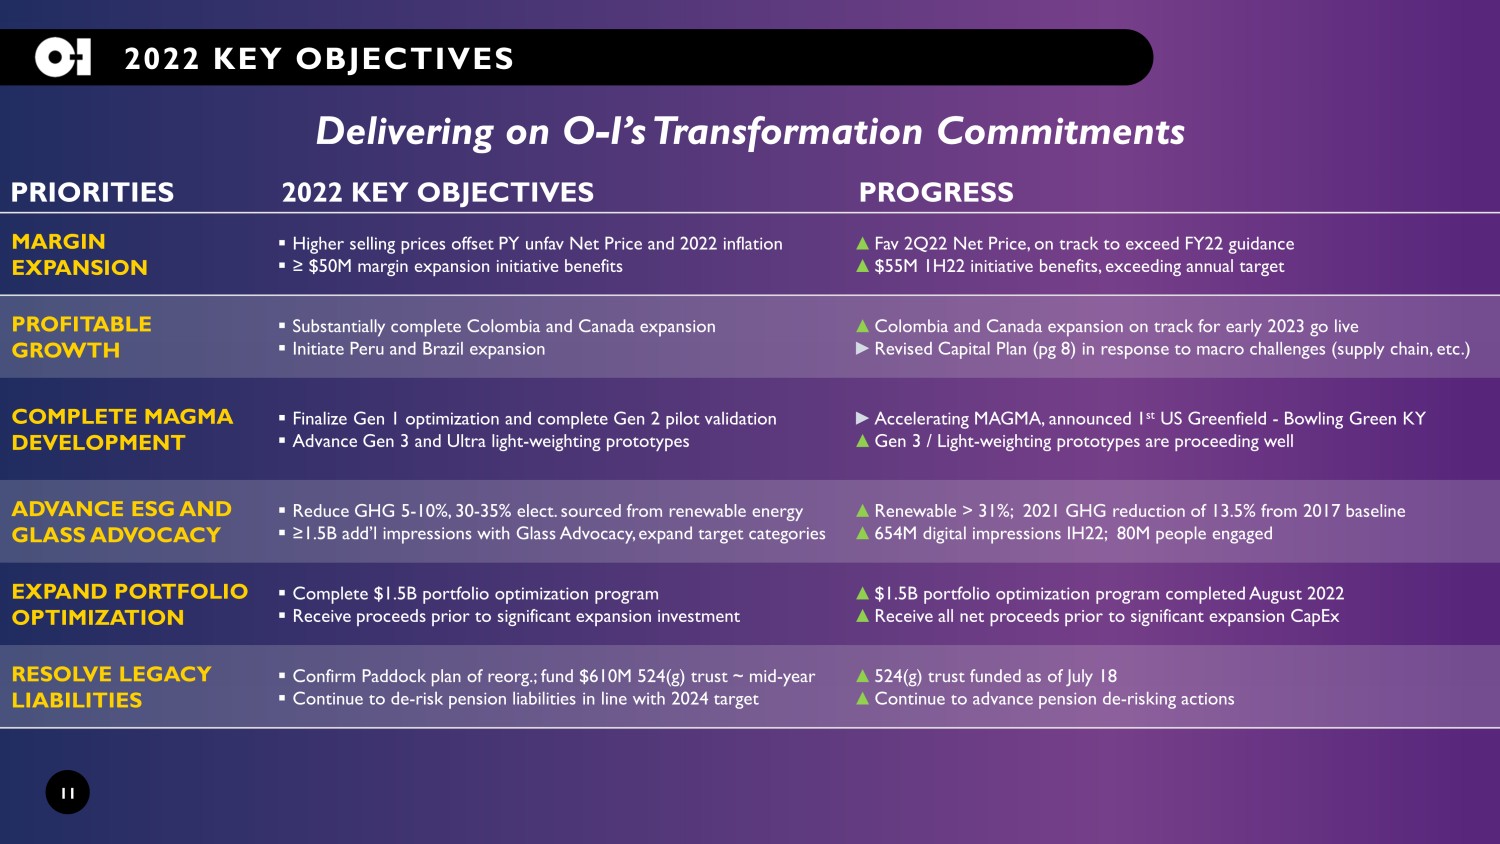
11 2022 KEY OBJECTIVES 2022 KEY OBJECTIVES PROGRESS Delivering on O - I’s Transformation Commitments MARGIN EXPANSION ▪ Higher selling prices offset PY unfav Net Price and 2022 inflation ▪ ≥ $50M margin expansion initiative benefits ▲ Fav 2Q22 Net Price, on track to exceed FY22 guidance ▲ $55M 1H22 initiative benefits, exceeding annual target PROFITABLE GROWTH ▪ Substantially complete Colombia and Canada expansion ▪ Initiate Peru and Brazil expansion ▲ Colombia and Canada expansion on track for early 2023 go live ► Revised Capital Plan (pg 8) in response to macro challenges (supply chain, etc.) COMPLETE MAGMA DEVELOPMENT ▪ Finalize Gen 1 optimization and complete Gen 2 pilot validation ▪ Advance Gen 3 and Ultra light - weighting prototypes ► Accelerating MAGMA, announced 1 st US Greenfield - Bowling Green KY ▲ Gen 3 / Light - weighting prototypes are proceeding well ADVANCE ESG AND GLASS ADVOCACY ▪ Reduce GHG 5 - 10%, 30 - 35% elect. sourced from renewable energy ▪ ≥1.5B add’l impressions with Glass Advocacy, expand target categories ▲ Renewable > 31%; 2021 GHG reduction of 13.5% from 2017 baseline ▲ 654M digital impressions IH22; 80M people engaged EXPAND PORTFOLIO OPTIMIZATION ▪ Complete $1.5B portfolio optimization program ▪ Receive proceeds prior to significant expansion investment ▲ $1.5B portfolio optimization program completed August 2022 ▲ Receive all net proceeds prior to significant expansion CapEx RESOLVE LEGACY LIABILITIES ▪ Confirm Paddock plan of reorg.; fund $610M 524(g) trust ~ mid - year ▪ Continue to de - risk pension liabilities in line with 2024 target ▲ 524(g) trust funded as of July 18 ▲ Continue to advance pension de - risking actions PRIORITIES
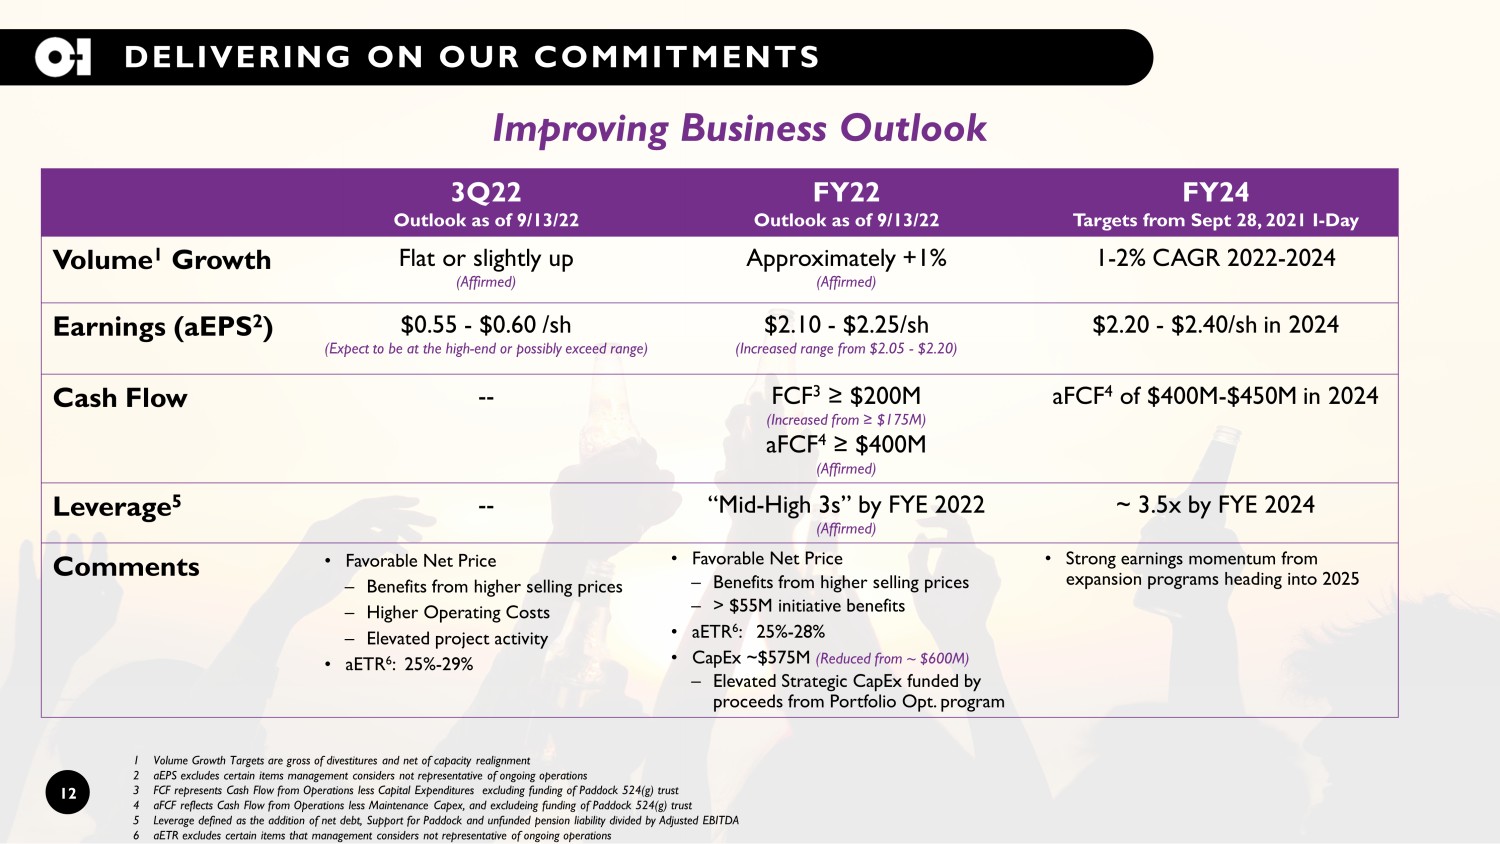
1 Volume Growth Targets are gross of divestitures and net of capacity realignment 2 aEPS excludes certain items management considers not representative of ongoing operations 3 FCF represents Cash Flow from Operations less Capital Expenditures excluding funding of Paddock 524(g) trust 4 aFCF reflects Cash Flow from Operations less Maintenance Capex, and excludeing funding of Paddock 524(g) trust 5 Leverage defined as the addition of net debt, Support for Paddock and unfunded pension liability divided by Adjusted EBITDA 6 aETR excludes certain items that management considers not representative of ongoing operations DELIVERING ON OUR COMMITMENTS 12 3Q22 Outlook as of 9/13/22 FY22 Outlook as of 9/13/22 FY24 Targets from Sept 28, 2021 I - Day Volume 1 Growth Flat or slightly up (Affirmed) Approximately +1% (Affirmed) 1 - 2% CAGR 2022 - 2024 Earnings (aEPS 2 ) $0.55 - $0.60 /sh (Expect to be at the high - end or possibly exceed range) $2.10 - $2.25/sh (Increased range from $2.05 - $2.20) $2.20 - $2.40/ sh in 2024 Cash Flow -- FCF 3 ≥ $200M (Increased from ≥ $175M) aFCF 4 ≥ $400M (Affirmed) aFCF 4 of $400M - $450M in 2024 Leverage 5 -- “Mid - High 3s” by FYE 20 22 (Affirmed) ~ 3.5x by FYE 2024 Comments • Favorable Net Price – Benefits from higher selling prices – Higher Operating Costs – Elevated project activity • aETR 6 : 25% - 29% • Favorable Net Price – Benefits from higher selling prices – > $55M initiative benefits • aETR 6 : 25% - 28% • CapEx ~$575M (Reduced from ~ $600M) – Elevated Strategic CapEx funded by proceeds from Portfolio Opt. program • Strong earnings momentum from expansion programs heading into 2025 Improving Business Outlook
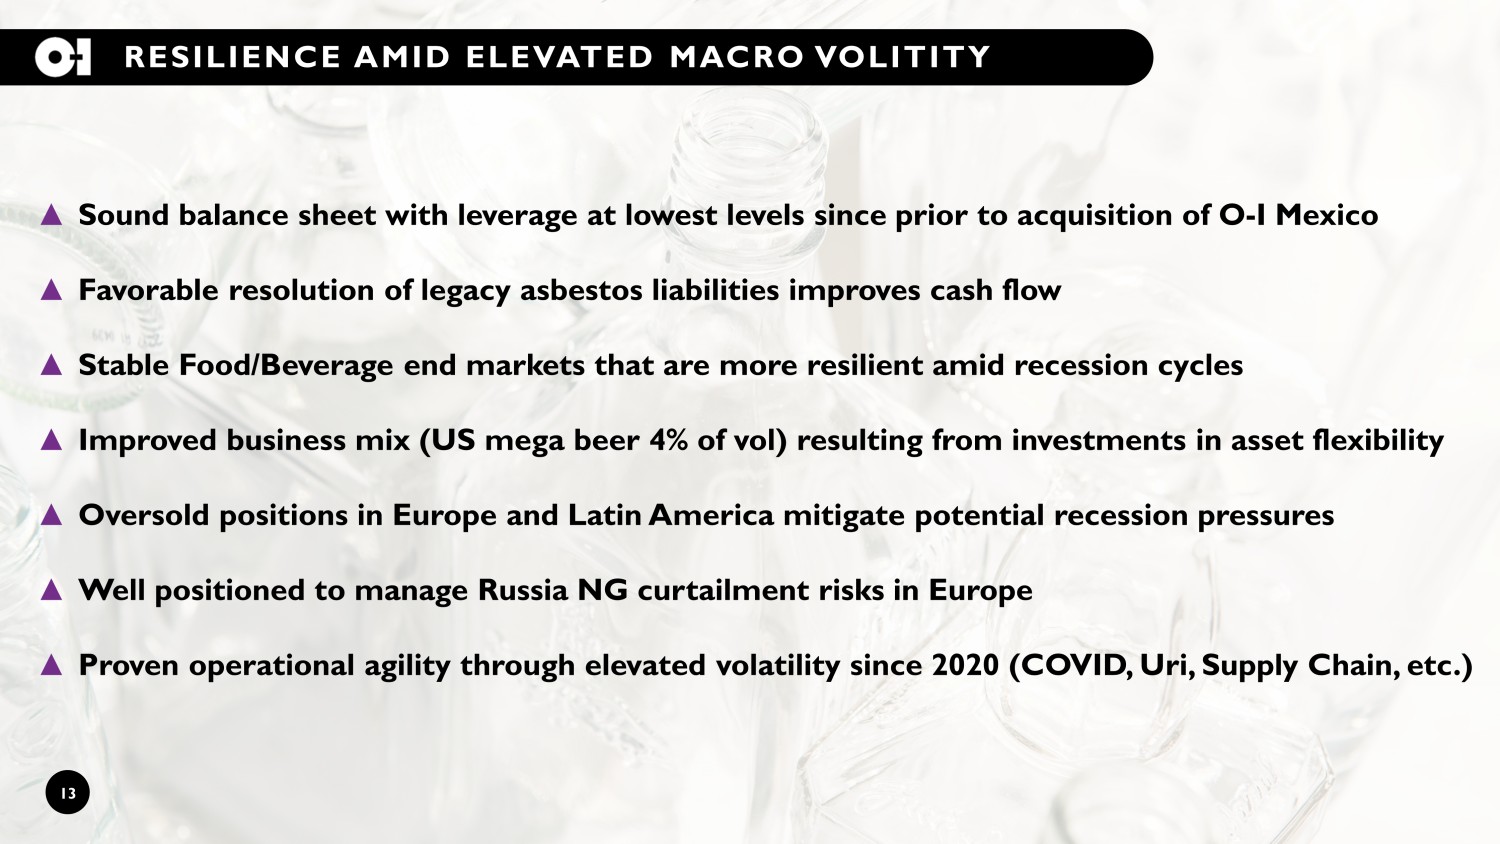
RESILIENCE AMID ELEVATED MACRO VOLITITY ▲ Sound balance sheet with leverage at lowest levels since prior to acquisition of O - I Mexico ▲ Favorable resolution of legacy asbestos liabilities improves cash flow ▲ Stable Food/Beverage end markets that are more resilient amid recession cycles ▲ Improved business mix (US mega beer 4% of vol) resulting from investments in asset flexibility ▲ Oversold positions in Europe and Latin America mitigate potential recession pressures ▲ Well positioned to manage Russia NG curtailment risks in Europe ▲ Proven operational agility through elevated volatility since 2020 (COVID, Uri, Supply Chain, etc.) 13
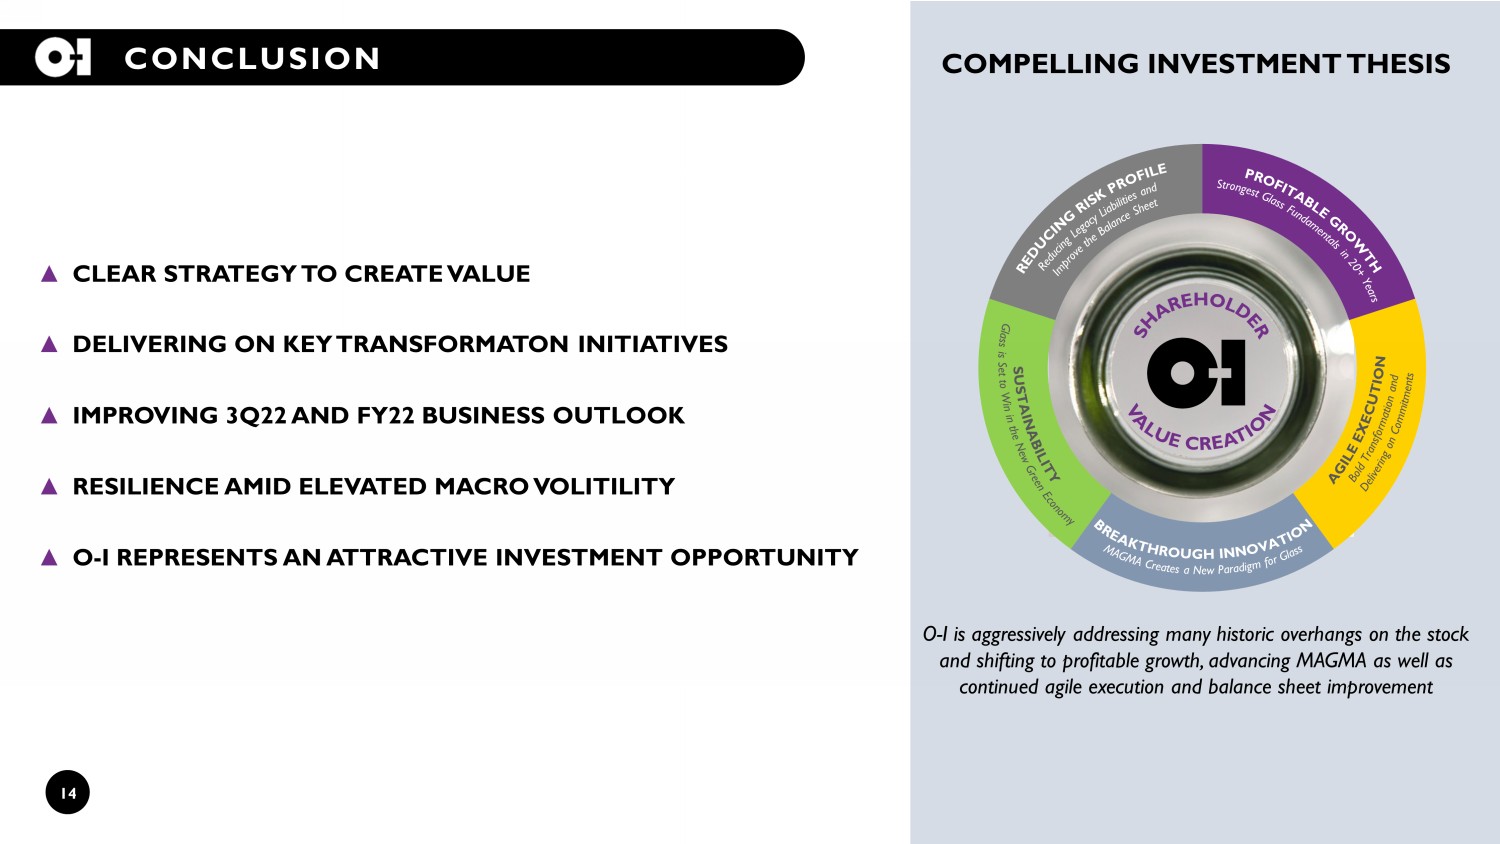
14 CONCLUSION ▲ CLEAR STRATEGY TO CREATE VALUE ▲ DELIVERING ON KEY TRANSFORMATON INITIATIVES ▲ IMPROVING 3Q22 AND FY22 BUSINESS OUTLOOK ▲ RESILIENCE AMID ELEVATED MACRO VOLITILITY ▲ O - I REPRESENTS AN ATTRACTIVE INVESTMENT OPPORTUNITY COMPELLING INVESTMENT THESIS O - I is aggressively addressing many historic overhangs on the stock and shifting to profitable growth, advancing MAGMA as well as continued agile execution and balance sheet improvement
APPENDIX
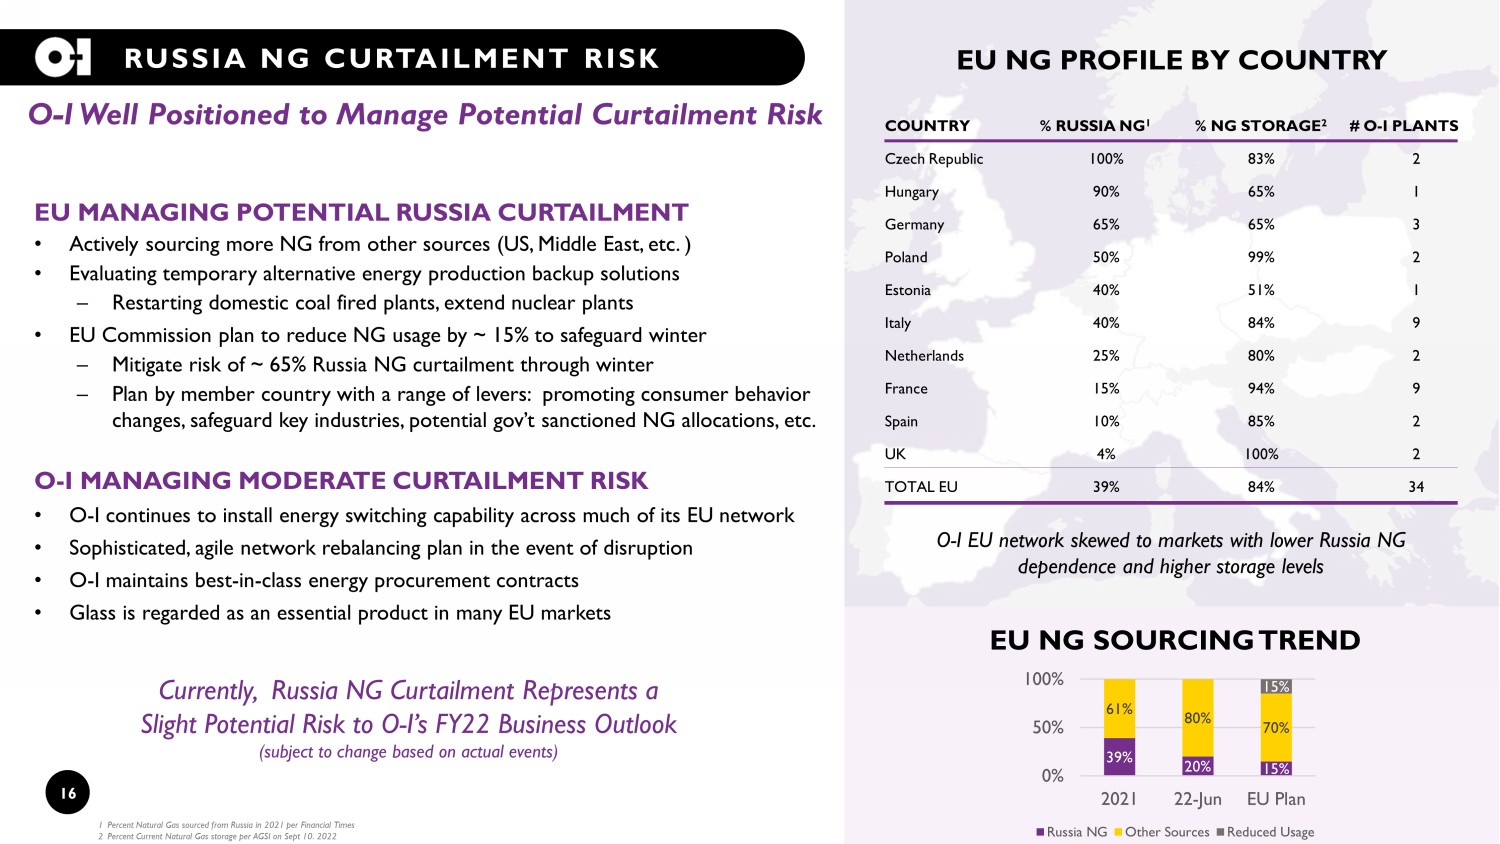
16 RUSSIA NG CURTAILMENT RISK EU MANAGING POTENTIAL RUSSIA CURTAILMENT • Actively sourcing more NG from other sources (US, Middle East, etc. ) • Evaluating temporary alternative energy production backup solutions – Restarting domestic coal fired plants, extend nuclear plants • EU Commission plan to reduce NG usage by ~ 15% to safeguard winter – Mitigate risk of ~ 65% Russia NG curtailment through winter – Plan by member country with a range of levers: promoting consumer behavior changes, safeguard key industries, potential gov’t sanctioned NG allocations, etc. O - I MANAGING MODERATE CURTAILMENT RISK • O - I continues to install energy switching capability across much of its EU network • Sophisticated, agile network rebalancing plan in the event of disruption • O - I maintains best - in - class energy procurement contracts • Glass is regarded as an essential product in many EU markets O - I Well Positioned to Manage Potential Curtailment Risk 39% 20% 15% 61% 80% 70% 15% 0% 50% 100% 2021 22-Jun EU Plan Russia NG Other Sources Reduced Usage Currently, Russia NG Curtailment Represents a Slight Potential Risk to O - I’s FY22 Business Outlook (subject to change based on actual events) COUNTRY % RUSSIA NG 1 % NG STORAGE 2 # O - I PLANTS Czech Republic 100% 83% 2 Hungary 90% 65% 1 Germany 65% 65% 3 Poland 50% 99% 2 Estonia 40% 51% 1 Italy 40% 84% 9 Netherlands 25% 80% 2 France 15% 94% 9 Spain 10% 85% 2 UK 4% 100% 2 TOTAL EU 39% 84% 34 1 Percent Natural Gas sourced from Russia in 2021 per Financial Times 2 Percent Current Natural Gas storage per AGSI on Sept 10. 2022 EU NG PROFILE BY COUNTRY EU NG SOURCING TREND O - I EU network skewed to markets with lower Russia NG dependence and higher storage levels
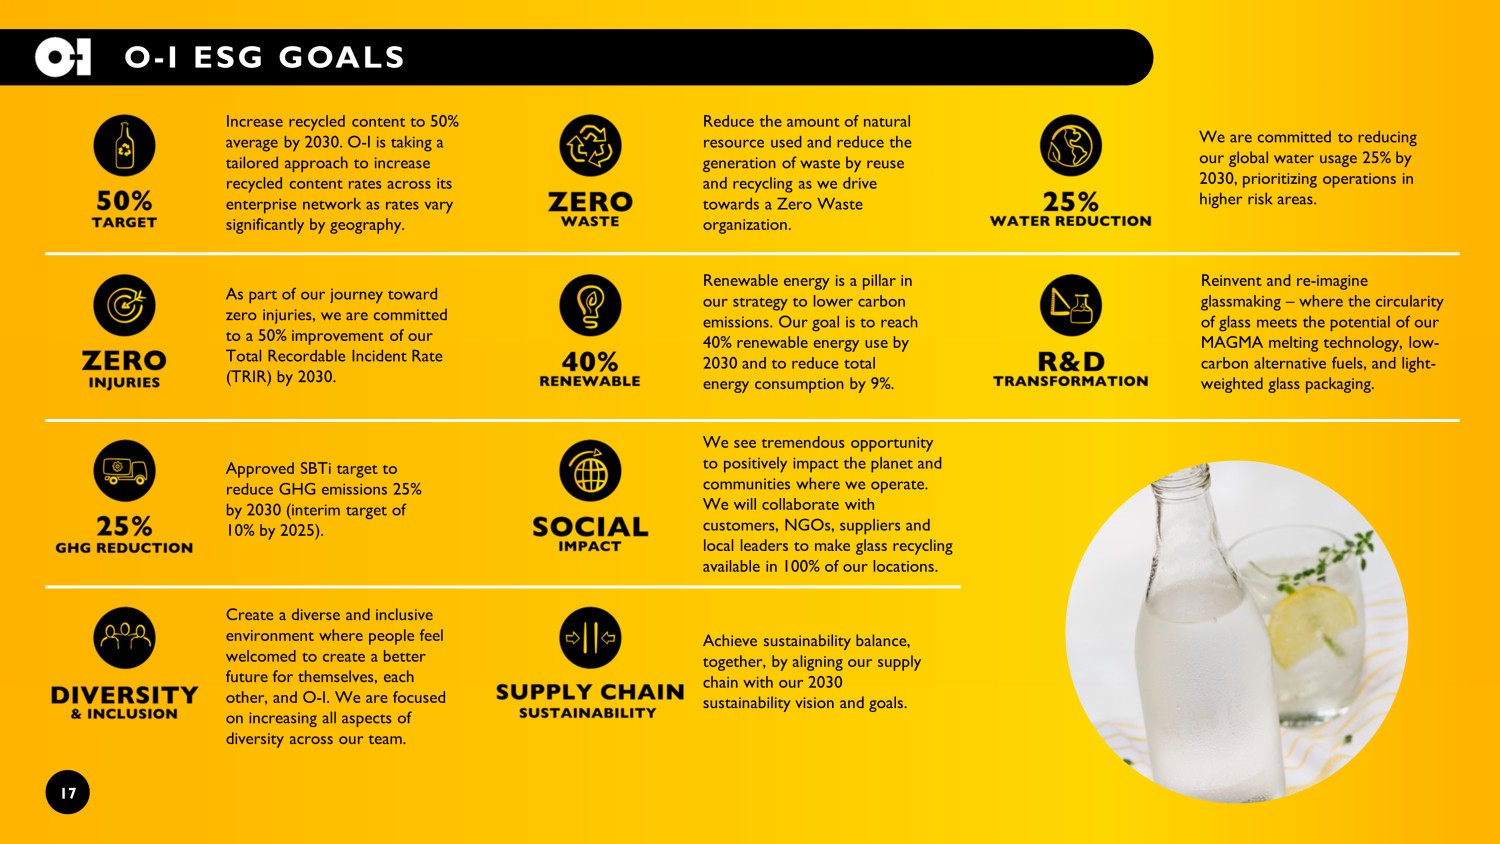
17 O - I ESG GOALS Increase recycled content to 50% average by 2030. O - I is taking a tailored approach to increase recycled content rates across its enterprise network as rates vary significantly by geography. Approved SBTi target to reduce GHG emissions 25% by 2030 (interim target of 10% by 2025). As part of our journey toward zero injuries, we are committed to a 50% improvement of our Total Recordable Incident Rate (TRIR) by 2030. Reduce the amount of natural resource used and reduce the generation of waste by reuse and recycling as we drive towards a Zero Waste organization. Renewable energy is a pillar in our strategy to lower carbon emissions. Our goal is to reach 40% renewable energy use by 2030 and to reduce total energy consumption by 9%. We see tremendous opportunity to positively impact the planet and communities where we operate. We will collaborate with customers, NGOs, suppliers and local leaders to make glass recycling available in 100% of our locations. Achieve sustainability balance, together, by aligning our supply chain with our 2030 sustainability vision and goals. We are committed to reducing our global water usage 25% by 2030, prioritizing operations in higher risk areas. Reinvent and re - imagine glassmaking – where the circularity of glass meets the potential of our MAGMA melting technology, low - carbon alternative fuels, and light - weighted glass packaging. Create a diverse and inclusive environment where people feel welcomed to create a better future for themselves, each other, and O - I. We are focused on increasing all aspects of diversity across our team.
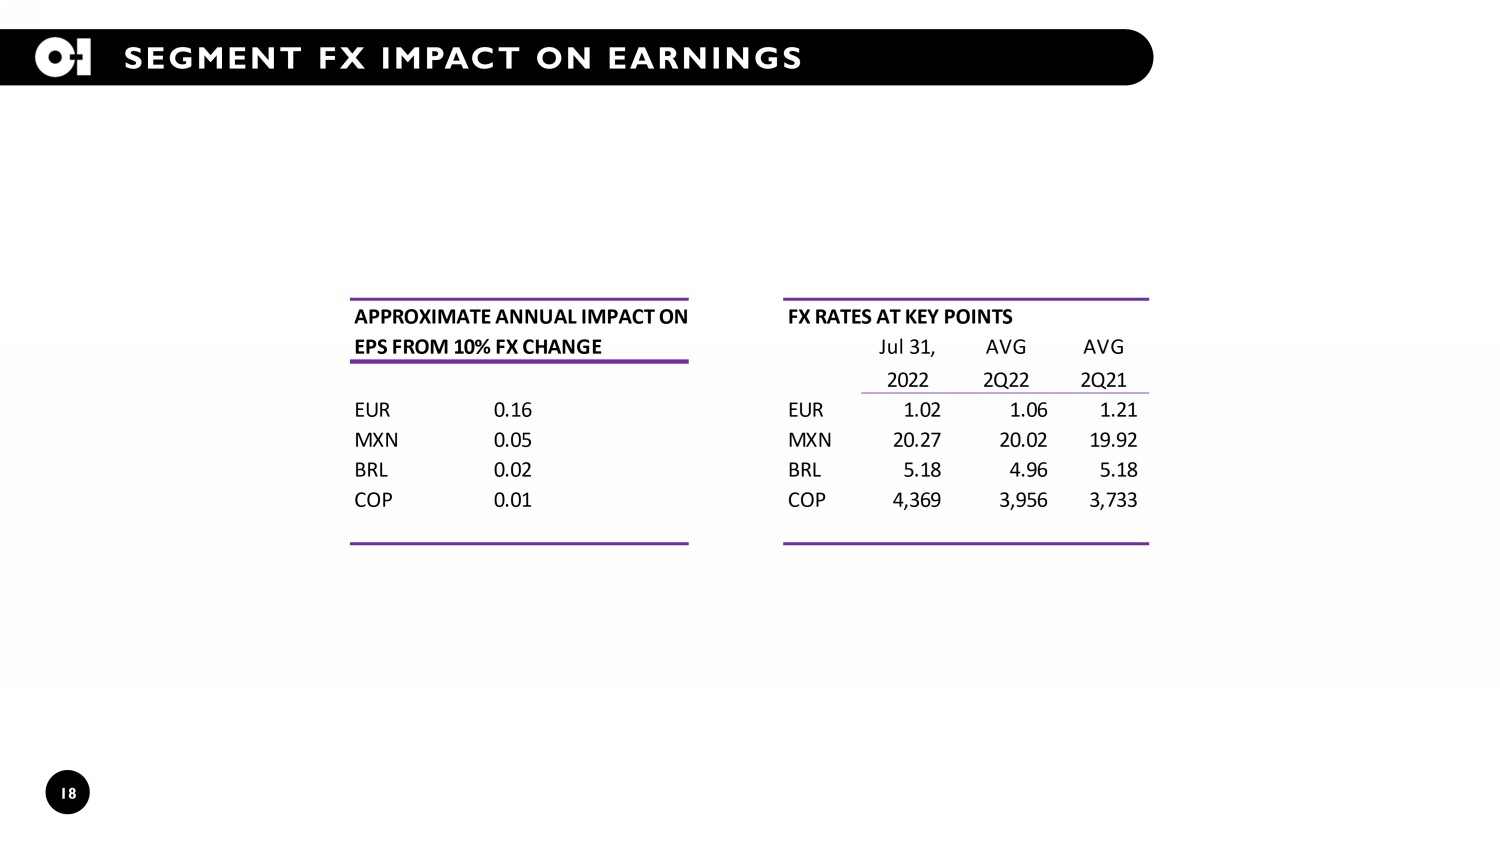
18 SEGMENT FX IMPACT ON EARNINGS APPROXIMATE ANNUAL IMPACT ON FX RATES AT KEY POINTS EPS FROM 10% FX CHANGE Jul 31, AVG AVG 2022 2Q22 2Q21 EUR 0.16 EUR 1.02 1.06 1.21 MXN 0.05 MXN 20.27 20.02 19.92 BRL 0.02 BRL 5.18 4.96 5.18 COP 0.01 COP 4,369 3,956 3,733

19 NON - GAAP FINANCIAL MEASURES The company uses certain non - GAAP financial measures, which are measures of its historical or future financial performance that are not calculated and presented in accordance with GAAP, within the meaning of applicable SEC rules. Management believes that its pres entation and use of certain non - GAAP financial measures, including adjusted earnings, adjusted earnings per share, free cash flow, adjusted f ree cash flow, adjusted effective tax rate, total financial leverage, EBITDA and Adjusted EBITDA provide relevant and useful supplemental financial information that is widely used by analysts and investors, as well as by management in assessing both consolidated and business unit perf orm ance. These non - GAAP measures are reconciled to the most directly comparable GAAP measures and should be considered supplemental in nature an d s hould not be considered in isolation or be construed as being more important than comparable GAAP measures. Adjusted earnings relates to net earnings attributable to the company, exclusive of items management considers not representativ e of ongoing operations and other adjustments because such items are not reflective of the company’s principal business activity, which is gl ass container production. Adjusted earnings are divided by weighted average shares outstanding (diluted) to derive adjusted earnings per shar e. Adjusted effective tax rate relates to earnings before income taxes, exclusive of items management considers not representative of ong oin g operations and other adjustments, divided by the provision for income taxes, excluding tax items management considers not representative of ong oing operations and other adjustments. EBITDA refers to net earnings (loss), excluding gains or losses from discontinued operation s, interest expense, net, provision for income taxes, depreciation and amortization of intangibles. Adjusted EBITDA refers to EBITDA, exclusive of i tems management considers not representative of ongoing operations and other adjustments. Total financial leverage refers to the sum of total debt less cash, plus unfunded pension liability, plus the asbestos liability or Paddock liability divided by Adjusted EBITDA. Manage ment uses adjusted earnings, adjusted earnings per share, segment operating profit, EBITDA, Adjusted EBITDA, adjusted effective tax rate and total financial leverage to evaluate its period - over - period operating performance because it believes these provide useful supplemental measures of the r esults of operations of its principal business activity by excluding items that are not reflective of such operations. Adjusted earnings, adjusted earnings per share and segment operating profit may be useful to investors in evaluating the underlying operating performance of the compa ny’ s business as these measures eliminate items that are not reflective of its principal business activity. Further, free cash flow relates to cash provided by operating activities less cash payments for property, plant and equipment . Adjusted free cash flow relates to cash provided by operating activities less cash payments for property, plant and equipment pertaining to base ma intenance activity. Management has historically used free cash flow and adjusted free cash flow to evaluate its period - over - period cash g eneration performance because it believes these have provided useful supplemental measures related to its principal business activity. It should not be inferred that the entire free cash flow or adjusted free cash flow amount is available for discretionary expenditures, since the company has mandatory debt service requirements and other non - discretionary expenditures that are not deducted from these measures. Managem ent uses non - GAAP information principally for internal reporting, forecasting, budgeting and calculating compensation payments. The company routinely posts important information on its website – www.o - i.com/investors .
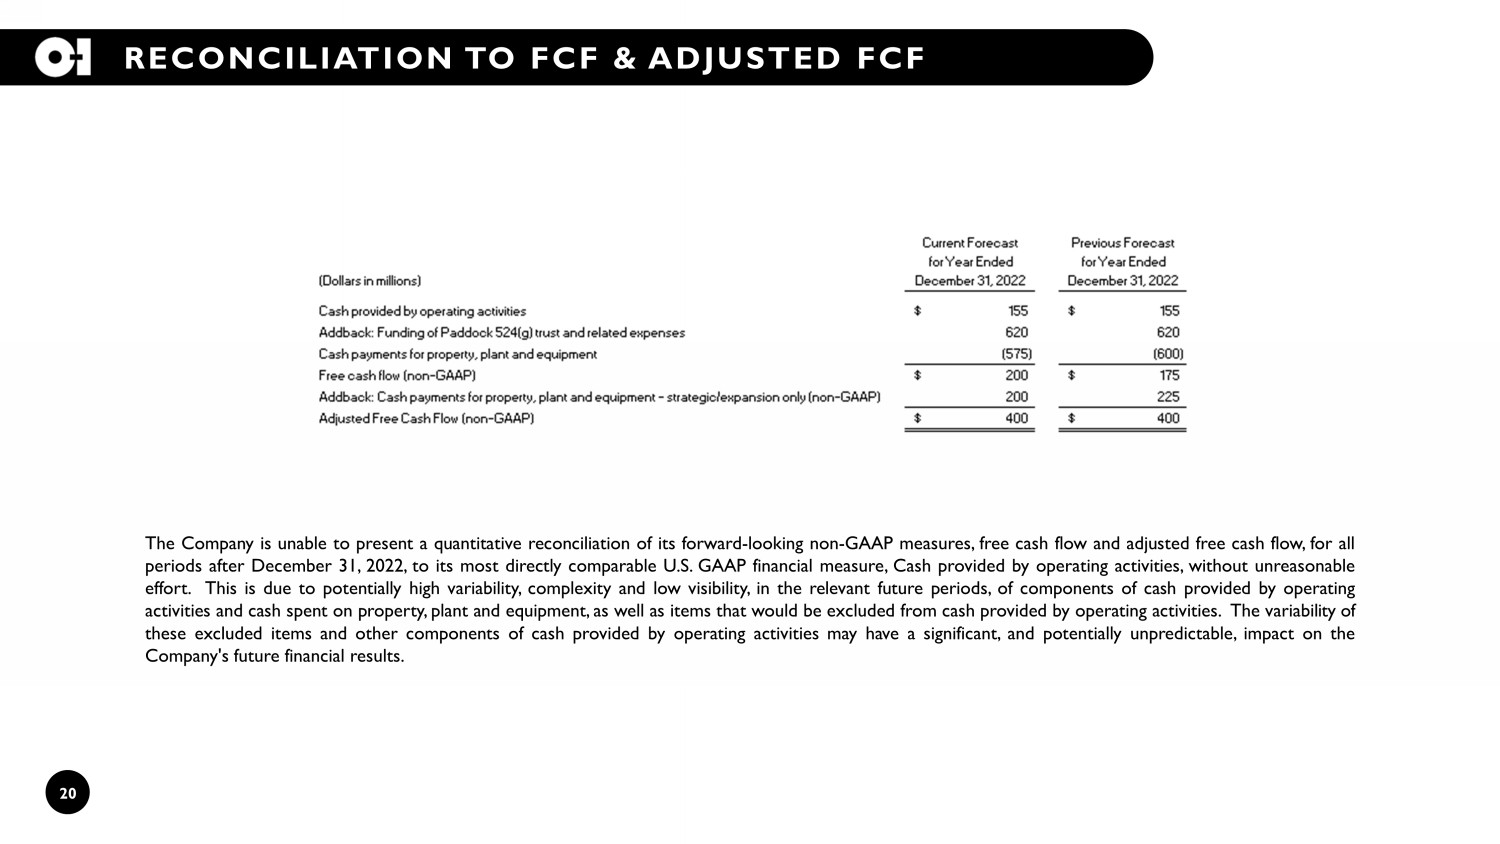
20 RECONCILIATION TO FCF & ADJUSTED FCF The Company is unable to present a quantitative reconciliation of its forward - looking non - GAAP measures, free cash flow and adjusted free cash flow, for all periods after December 31 , 2022 , to its most directly comparable U . S . GAAP financial measure, Cash provided by operating activities, without unreasonable effort . This is due to potentially high variability, complexity and low visibility, in the relevant future periods, of components of cash provided by operating activities and cash spent on property, plant and equipment, as well as items that would be excluded from cash provided by operating activities . The variability of these excluded items and other components of cash provided by operating activities may have a significant, and potentially unpredictable, impact on the Company's future financial results .

21 RECONCILIATION TO FINANCIAL LEVERAGE For all periods after the year ending December 31, 2021, the Company is unable to present a quantitative reconciliation of it s f orward - looking non - GAAP measure, Net Debt divided by Adjusted EBITDA and Financial Leverage, to its most directly comparable U.S. GAAP financial measure, Earnings (loss) from continuing operations, bec ause management cannot reliably predict all of the necessary components of this U.S. GAAP financial measure without unreasonable efforts. Earnings (loss) from continuing operations includes several significa nt items, such as restructuring, asset impairment and other charges, charges for the write - off of finance fees, and the income tax effect on such items. The decisions and events that typically lead to the rec ognition of these and other similar non - GAAP adjustments are inherently unpredictable as to if and when they may occur. The inability to provide a reconciliation is due to that unpredictability and t he related difficulties in assessing the potential financial impact of the non - GAAP adjustments. For the same reasons, the Company is unable to address the probable significance of the unavailable information, w hich could be material to the Company’s future financial results. $ millions 2019 2020 2021 Earnings (loss) from continuing operations (379)$ 264$ 165$ Interest expense (net) 311 265 216$ Interest income 9 5 7$ Provision for income taxes 118 89 167$ Depreciation 390 369 356$ Amortization of intangibles 109 99 93$ EBITDA 558$ 1,091$ 1,004$ Adjustments to EBITDA: Charge for asbestos-related costs 35 - - Restructuring, asset impairment, pension settlement and other charges 140 168 109 Charge for goodwill impairment 595 - - Gain on sale of ANZ Business - (275) - Gain on Sale of Equity Investment (107) - - Gain on sale of miscellaneous assets - - (84) Charge related to Paddock support agreement liability - - 154 Charge for deconsolidation of Paddock - 14 - Brazil indirect tax credit - - (71) Strategic transactions and Corporate Modernization costs 31 8 - Adjusted EBITDA 1,252$ 1,006$ 1,112$ Total debt 5,559$ 5,142$ 4,825$ Less cash 551$ 563$ 725$ Net debt 5,008$ 4,579$ 4,100$ Net debt divided by Adjusted EBITDA 4.0 4.6 3.7 Unfunded Pension Liability 493$ 464$ 141$ Unfunded Pension Liability divided by Adjusted EBITDA 0.4 0.5 0.1 Asbestos / Paddock Liability 486$ 471$ 625$ Asbestos / Paddock Liability divided by Adjusted EBITDA 0.4 0.5 0.6 Financial Leverage ((Net Debt + Unfunded Pension Liability + Asbestos/Paddock Liability)/Adjusted EBITDA) 4.8 5.5 4.4
22 ADDITIONAL RECONCILIATIONS The Company is unable to present a quantitative reconciliation of its forward - looking non - GAAP measures, adjusted earnings and adjusted earnings per share, for the quarter ending September 30 , 2022 , year ending December 31 , 2022 , and all periods after, to its most directly comparable GAAP financial measure, earnings from operations attributable to the Company, because management cannot reliably predict all of the necessary components of the GAAP financial measures without unreasonable efforts . Earnings from operations attributable to the Company includes several significant items, such as restructuring charges, asset impairment charges, charges for the write - off of finance fees, and the income tax effect on such items . The decisions and events that typically lead to the recognition of these and other similar items are complex and inherently unpredictable, and the amount recognized for each item can vary significantly . Accordingly, the Company is unable to provide a reconciliation of adjusted earnings and adjusted earnings per share to earnings from operations attributable to the Company or address the probable significance of the unavailable information, which could be material to the Company's future financial results . The Company is unable to present a quantitative reconciliation of its forward - looking non - GAAP measure, adjusted effective tax rate, for the quarter ending September 30 , 2022 , and all periods after to its most directly comparable GAAP financial measure, provision for income taxes divided by earnings (loss) from continuing operations before income taxes, because management cannot reliably predict all of the necessary components of these GAAP financial measures without unreasonable efforts . Earnings (loss) from continuing operations before income taxes includes several significant items, such as restructuring charges, asset impairment charges, charges for the write - off of finance fees, and the provision for income taxes would include the income tax effect on such items . The decisions and events that typically lead to the recognition of these and other similar items are complex and inherently unpredictable, and the amount recognized for each item can vary significantly . Accordingly, the Company is unable to provide a of adjusted effective tax rate to earnings (loss) from continuing operations before income taxes divided by provision for income taxes or address the probable significance of the unavailable information, which could be material to the Company's future financial results . RECONCILIATION TO ADJUSTED EARNINGS AND ADJUSTED EARNINGS PER SHARE RECONCILIATION TO ADJUSTED EFFECTIVE TAX RATE RECONCILIATION TO ADJUSTED FREE CASH FLOW RATIO