UNITED STATES
SECURITIES AND EXCHANGE COMMISSION
Washington, D.C. 20549
__________________________________
FORM 8-K
CURRENT REPORT
Pursuant to Section 13 OR 15(d) of the Securities Exchange Act of 1934
Date of Report (date of earliest event reported): November 29, 2006
REHABCARE GROUP, INC.
(Exact name of Company as specified in its charter)
| Delaware | 0-19294 | 51-0265872 | |
| (State or other jurisdiction | (Commission | (I.R.S. Employer | |
| of incorporation) | File Number) | Identification No.) |
| | | | | | | | | | | |
| 7733 Forsyth Boulevard | |
| Suite 2300 | |
| St. Louis, Missouri | 63105 | |
(Address of principal executive offices) | (Zip Code) |
| | | | | | | | |
(314) 863-7422
(Company's telephone number, including area code)
Not applicable
(Former name or former address if changed since last report)
Check the appropriate box below if the Form 8-K filing is intended to simultaneously satisfy the filing obligation of the Company under any of the following provisions:
o Written communications pursuant to Rule 425 under the Securities Act (17 CFR 230.425)
o Soliciting material pursuant to Rule 14a-12 under the Exchange Act (17 CFR 240.14a-12)
o Pre-commencement communications pursuant to Rule 14d-2(b) under the Exchange Act (17 CFR 240.14d-2(b))
o Pre-commencement communications pursuant to Rule 13e-4(c) under the Exchange Act (17 CFR 240.13e-4(c))
Item 7.01 | Regulation FD Disclosure |
Beginning on November 29, 2006, RehabCare executives will make presentations at investor conferences to analysts and in other forums using the slides as included in this Form 8-K as Exhibit 99. Presentations will be made using these slides, or modifications thereof, in connection with other presentations in the foreseeable future.
Information contained in this presentation is an overview and intended to be considered in the context of RehabCare's SEC filings and all other publicly disclosed information. We undertake no duty or obligation to update or revise this information. However, we may update the presentation periodically in a Form 8-K filing.
Forward-looking statements have been provided pursuant to the safe harbor provisions of the Private Securities Litigation Reform Act of 1995. Forward-looking statements involve known and unknown risks and uncertainties that may cause our actual results in future periods to differ materially from forecasted results. These risks and uncertainties may include but are not limited to, our ability to consummate acquisitions and other partnering relationships at reasonable valuations; our ability to integrate acquisitions and other partnering relationships within the expected timeframes and to achieve the revenue, cost savings and earnings levels from such acquisitions and relationships at or above the levels projected; our ability to comply with the terms of our borrowing agreements; changes in governmental reimbursement rates and other regulations or policies affecting reimbursement for the services provided by us to clients and/or patients; the operational, administrative and financial effect of our compliance with other governmental regulations and applicable licensing and certification requirements; our ability to attract new client relationships or to retain and grow existing client relationships through expansion of our service offerings and the development of alternative product offerings; the future financial results of any unconsolidated affiliates; the adequacy and effectiveness of our operating and administrative systems; our ability to attract and the additional costs of attracting and retaining administrative, operational and professional employees; shortages of qualified therapists and other healthcare personnel; significant increases in health, workers compensation and professional and general liability costs; litigation risks of our past and future business, including our ability to predict the ultimate costs and liabilities or the disruption of our operations; competitive and regulatory effects on pricing and margins; our ability to effectively respond to fluctuations in our census levels and number of patient visits; the proper functioning of our information systems; natural disasters and other unexpected events which could severely damage or interrupt our systems and operations; and general and economic conditions, including efforts by governmental reimbursement programs, insurers, healthcare providers and others to contain healthcare costs.
Item 9.01 | Financial Statements and Exhibits. |
| (d) | Exhibits - See exhibit index |
SIGNATURE
Pursuant to the requirements of the Securities Exchange Act of 1934, the company has duly caused this report to be signed on its behalf by the undersigned hereunto duly authorized.
Dated: November 29, 2006
By: /s/ Jay W. Shreiner
Name: Jay W. Shreiner
Title: Senior Vice President and
Chief Financial Officer
EXHIBIT INDEX
99 | Investor Relations Presentation in use beginning November 29, 2006. |
Exhibit 99

Investor Presentation
Third Quarter, 2006
0
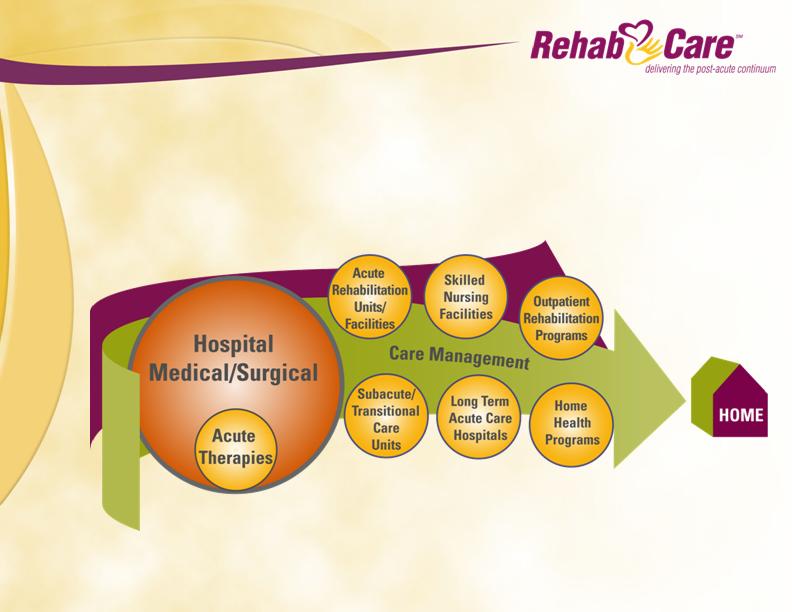
RehabCare aspires to be an integrated post acute rehabilitation services
company delivering rehabilitation care within strategic markets in the most
cost effective and appropriate care setting consistent with patients’ clinical
needs. We currently manage rehabilitation programs in host hospitals,
health systems and skilled nursing facilities and we own inpatient
rehabilitation facilities and long-term acute care hospitals.
Our Strategic Vision
1

Why We Believe In This Vision
Transforms disparate sites of rehabilitation into an
integrated delivery network enabling more:
Efficient deployment of therapists
Effective retention and recruitment of therapists
Focused allocation of corporate resources to strategic markets
Aligns with Medicare’s directional goals
Facilitates development of a common patient assessment tool to
channel patients to different clinical venues based on needs
Positions the Company for episodic post acute single payment
system
Leverages cost management and patient management across all
major rehabilitation settings
Diversifies operating portfolio across clinical settings,
customers and markets
Aligns with other healthcare services that are managed and
delivered on a local market basis
2

What We Do
Skilled Nursing Facility-Based Rehabilitation Programs
1,253 programs – 8 million patient visits annually
Hospital-Based Rehabilitation Programs – 173 Total Units
Acute Rehabilitation Units
117 programs –46,000 discharges annually
Subacute/Transitional Care Units
18 units –137,000 patient days annually
Outpatient Rehabilitation Programs
38 units –1.1 million visits annually
Freestanding Hospitals (8 solely and 1 jointly owned)
6 Inpatient Rehabilitation Hospitals
256 Beds – 2700 discharges annually
3 Long-Term Acute Care Hospitals
186 Beds – 1600 discharges annually
Other Healthcare Services
Phase 2 – consulting services for acute care hospitals
Polaris Group - consulting services for long-term care facilities
VTA Management Services – therapist staffing for SNFs and schools in
New York
3
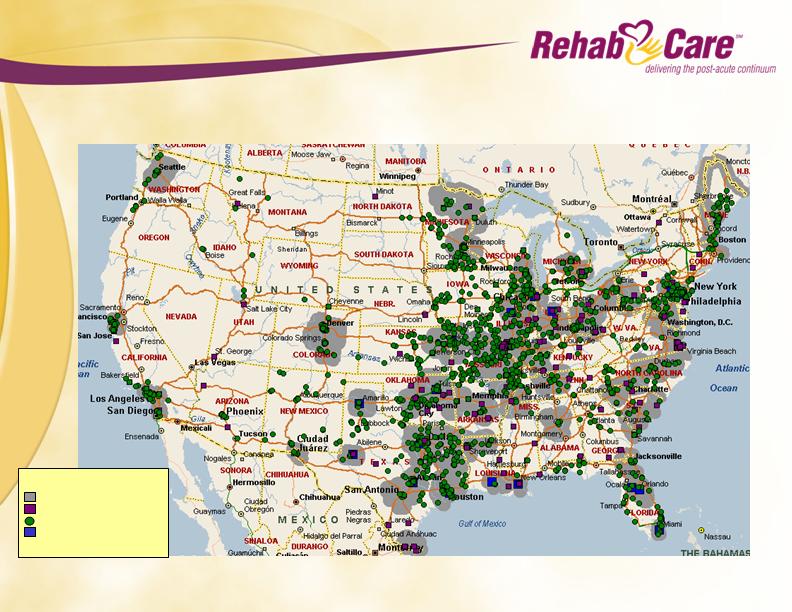
Where We Are
Continuum Markets
Hospital-Based
Skilled-Nursing Based
Freestanding Hospitals
More than 1,400 locations treating 24,000 patients each day
4
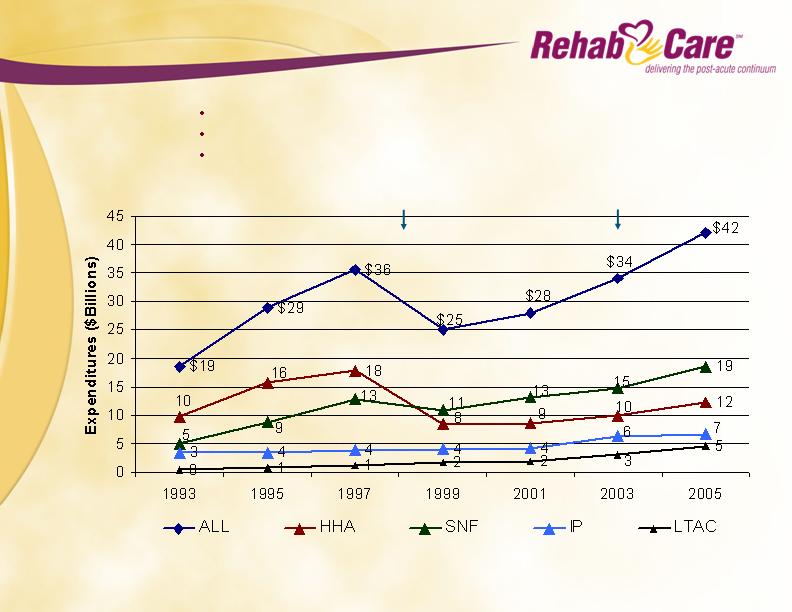
Medicare Reimbursement for
Post-Acute Services
Medicare reimbursement for post-acute services:
Totaled $42 billion in 2005, an increase of 68% since 1999
Projected $97 billion by 2014
Represents 13% of Medicare’s total spending
CMS contains costs by its PPS adjustments and regulations
HH & SNF PPS
IRF PPS
5

Hospital-Based
Rehabilitation Programs
(HRS Division)
$44.3M
SNF-Based
Rehabilitation Programs
(Contract Therapy Division)
$107.7M
Total Revenue $183.2 million
3Q/06
Other Healthcare
Services
$9.8M
5%
24%
59%
Freestanding
Hospitals
(IRFs and LTACHs)
$21.4M
12%
Our Revenue Trends
Hospital-Based
Rehabilitation Programs
(HRS Division)
$48.4M
SNF-Based
Rehabilitation Programs
(Contract Therapy Division)
$42.9M
Total Revenue $93.3 million
3Q/04
Other Healthcare
Services
$2.0M
2%
46%
52%
6
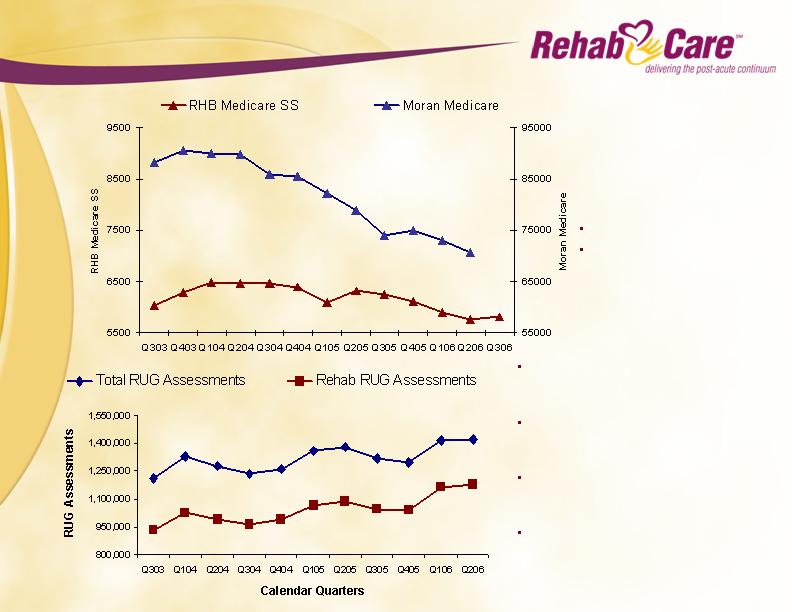
Our Revenues Follow Patient Care
Trends
In the time period studied by
Moran Report, September
2006:
Moran facilities declined 20%
RehabCare facilities
decreased 4%
Since Q3/03, RUG assessments
nationally increased 17% (208,000 days
per quarter)
Rehab RUG assessments in that period
increased 26% (243,000 days per
quarter)
During the same period, the number of
skilled facilities nationally remained
relatively stable
The number of rehabilitation
assessments outpaced the overall
increase in total assessments
7

Skilled Nursing Facility-Based
Rehabilitation
Largest Medicare post acute reimbursement setting
Growing care setting, in part due to 75% Rule
Lower operating margins require scale for better economies and
improve profitability
Acquisition of Symphony
Adds critical mass for selective markets; entry into other
markets
Adds significant therapist resources and client relationships
Provides $10-14 million projected annualized cost savings and
productivity improvements over 18 months
Continuum of Care Differentiation – Best Suited For Patients Who:
Have immediately preceding three-day hospital stay
Are unable to tolerate three hours of physical therapy daily
Have chronic complications and comorbidities
Average length of stay of about 30 days
8

Hospital-Based Rehabilitation
Provides 3-5 year contractual relationships with host hospitals
and health systems with existing market share and flow of
patients
Remains highest margin business with cash flows to fund other
businesses
Expect 3-5% historical growth to return after full implementation
of 75% Rule
Continuum of Care Differentiation – Best Suited For Patients Who:
Meet acute severity of illness, intensity of service and medical
stability criteria
Cannot be managed in less acute care settings
Qualify under one of 35 Case Mix Groups
Tolerate three hours of therapy daily for inpatient; ambulatory for
outpatient
Average length of stay of about 12 days
9

Freestanding Hospitals
Provides anchor operations in continuum markets
Continues strategy of working with host hospitals and health
systems with existing market share and flow of patients
Establishes ownership position and reduces risk of contract loss
Provides a vehicle for expansion of bed capacity
Enhances control over quality and competency in clinical and
medical matters
Continuum of Care Differentiation – Best Suited For Patients Who:
IRFs
Same differentiation as hospital-based rehabilitation; same
average length of stay
LTACHs
Complication and comorbidities requiring special treatment
such as ventilators or significant wound care
Average length of stay > 25 days
10

Freestanding Hospitals
Joint Venture Strategy
Definitive Agreement – Previously Announced
Austin -
Phase 1 - 20-bed IRF – open mid-2007
Phase 2 - replace 20-bed IRF with 36-bed IRF and
40-bed LTACH
North Kansas City – 35-bed LTACH – open early 2008
Other Development Projects
Chesterfield - 35-bed IRF – open late 2008 – certificate of
need filed Nov 2006
5 joint venture projects in various stages of development
Anticipate opening 2 to 3 facilities in 2007
11
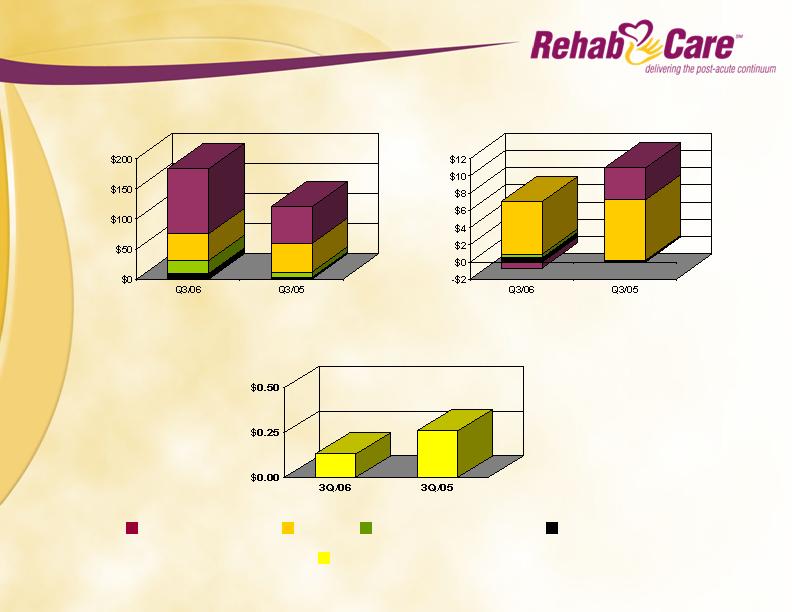
3Q/06 Versus 3Q/05
$183.2
$120.0
Revenues (in millions)
Operating Earnings (in millions)
$6.3
$10.9
Consolidated Earnings Per Share
$0.13
$0.26*
Contract Therapy
HRS
Freestanding Hospitals
Other Healthcare Services
Consolidated
*Includes after tax losses on RehabCare’s equity investment in InteliStaf of $2.0 million.
12

Sources
Strong cash flows from operations - $22.4 million TTM
$121 million outstanding debt under $175 million
revolving credit facility (expandable to $225 million)
$8.3 million in subordinated debt related to acquisitions
at 9/30/06
Project $10–15 million debt paydown during Q4/06
Uses
Acquisitions of businesses - $135.9 million TTM
Investment in information technology – approaching $7.0
million TTM
Sources and Uses Of Capital
13

Improve margins in all businesses
Integration of Symphony and synergy realization
Roll out handheld technology and train new personnel
Grow freestanding hospital business
Joint ventures and acquisitions
Labor resources
Attract and deploy therapists
Expand staffing coordination
Grow campus recruiting
More fully develop continuum market strategy
Better manage scarce resources
Focus business development efforts
Client retention
Develop closer partnerships using technology and clinical resources
Impact of regulation
75% Rule, Part B Therapy Caps, Physician Fee Schedule, Fiscal
Intermediary activism
Current Key Initiatives
14

Medicare Reimbursement Initiatives
Impacting Rehabilitation Services
75% Rule
Limits the type and number of
rehabilitation patients that can be
cared for in an acute hospital
setting
Part B Therapy Caps
Limits the amount of therapy
services which can be provided to
Part B patients in skilled nursing
facilities
Physician Fee Schedule
Establishes amounts physicians
(including therapists) can be
reimbursed for Part B services.
Controlled annually by CMS,
MedPAC and Congress
Current operating at 64% compliance
in the 60% compliance requirement
Goes to 65% in 7/07 and 75% in 7/08
Recovered from therapy caps
initiated Jan 1, 2006
Caps return Jan 1, 2007 without
Congressional action
Published changes, including 5%
rate reduction, will be implemented
Jan 1, 2007 without Congressional
action
Part B revenues represent about 35%
of our skilled nursing revenues
15

Executing On Our Strategy – Key
Accomplishments
Strong revenue growth
Created a 9 facility IRF and LTACH hospital division through
acquisitions and de novo site developments
Acquired Symphony Health Services with 470 SNFs and
approximately $207 million in annual revenues
Profiled 87 markets where we have significant presence in
terms of clients, resources or a care continuum
47% of our units are located in these markets
Developed 15 practice guidelines to improve our
consistency of care in cases such as spinal cord injury and
cognitive and communication disorders
Developed a campus recruiting strategy to attract therapy
graduates to units in our markets
Formed the Allied Health Research Institute to support
allied health research, education and training
16
Safe Harbor
Forward-looking statements have been provided pursuant to the safe harbor provisions of the Private
Securities Litigation Reform Act of 1995. Forward-looking statements involve known and unknown
risks and uncertainties that may cause our actual results in future periods to differ materially from
forecasted results. These risks and uncertainties may include but are not limited to, our ability to
consummate acquisitions and other partnering relationships at reasonable valuations; our ability to
integrate acquisitions and other partnering relationships within the expected timeframes and to
achieve the revenue, cost savings and earnings levels from such acquisitions and relationships at or
above the levels projected; our ability to comply with the terms of our borrowing agreements; changes
in governmental reimbursement rates and other regulations or policies affecting reimbursement for
the services provided by us to clients and/or patients; the operational, administrative and financial
effect of our compliance with other governmental regulations and applicable licensing and
certification requirements; our ability to attract new client relationships or to retain and grow existing
client relationships through expansion of our service offerings and the development of alternative
product offerings; the future financial results of any unconsolidated affiliates; the adequacy and
effectiveness of our operating and administrative systems; our ability to attract and the additional
costs of attracting and retaining administrative, operational and professional employees; shortages of
qualified therapists and other healthcare personnel; significant increases in health, workers
compensation and professional and general liability costs; litigation risks of our past and future
business, including our ability to predict the ultimate costs and liabilities or the disruption of our
operations; competitive and regulatory effects on pricing and margins; our ability to effectively
respond to fluctuations in our census levels and number of patient visits; the proper functioning of
our information systems; natural disasters and other unexpected events which could severely damage
or interrupt our systems and operations; and general and economic conditions, including efforts by
governmental reimbursement programs, insurers, healthcare providers and others to contain
healthcare costs.
17
Investor Presentation
Third Quarter, 2006
18