Exhibit 99
Investor Presentation
Third Quarter 2008

1
$721 million consolidated
revenues(1)
revenues(1)
Hospital Rehabilitation Services Division
$161 million revenue - 22% of revenue (1)
• 156 hospital-based programs
• 31 states
• 44,500 inpatient and skilled nursing unit discharges/year (1)
• 950,000 annual outpatient visits (1)
$106 million revenue - 15% of revenue (1)
Hospital Division
• 5 LTACHs, 5 rehabilitation hospitals
• 1 rehabilitation hospital minority owned (2)
• 7 states (3)
• 483 beds (3)
• 6,500 annual patient discharges (1) (3)
Other Healthcare Services Division
$38 million revenue - 5% of revenue (1)
• Phase 2 Consulting - - consulting and care management for hospitals and health systems
• Polaris Group - consulting for long-term care facilities
• VTA Management Services - therapy and nurse staffing for New York
(1) For twelve months ended 9/30/08
(2) Not included in consolidated
revenues
revenues
(3) These statistics include the
minority-owned rehab hospital
minority-owned rehab hospital
$416 million revenue - 58% of revenue (1)
Contract Therapy Division
• 1,075 skilled nursing facility programs
• 40 states
• 7.5 million annual patient visits (1)
Service Lines

2
The Contract Therapy division manages skilled nursing facility (SNF) rehab programs that are
designed to provide therapy intervention to both short-stay patients and long-term residents with a
wide range of conditions, including neurological, orthopedic and other conditions common to the
geriatric patient.
designed to provide therapy intervention to both short-stay patients and long-term residents with a
wide range of conditions, including neurological, orthopedic and other conditions common to the
geriatric patient.
Competitive Landscape
Company
• Self-Operation
• RehabCare
• Aegis Therapies
• Genesis
• Kindred - Peoplefirst
• Sundance
• Select Medical
• EnduraCare
• Skilled Healthcare
Owned
>12,000
0
N/A
~200
228
108
0
0
75
Source: Information available from public filings or from company websites
Managed
0
1,075
N/A
~500
345
317
~400
~300
114
Total
>12,000
1,075
>1,000
~700
573
425
~400
~300
189
Contract Therapy (CT)
Market Overview
Market Overview
Market Size
• 17,000 Medicare certified skilled nursing facilities

3
Part B Therapy Caps & Physician Fee Schedule (PFS)
On July 15, 2008, Congress overrode a Presidential veto to pass the
Medicare Improvements for Patients and Providers Act of 2008. This law:
Medicare Improvements for Patients and Providers Act of 2008. This law:
• Reinstates the therapy cap exceptions process for Part B patients
through December 31, 2009, which had expired June 30, 2008
through December 31, 2009, which had expired June 30, 2008
• Continues 0.5% physician increase for 2008 and provides an additional
1.1% increase for physicians in 2009, in lieu of a scheduled 10.6%
reduction
1.1% increase for physicians in 2009, in lieu of a scheduled 10.6%
reduction
We are pressing our trade groups toward finalizing an alternative to the therapy
cap exception process.
cap exception process.
2009 Final Rule
On July 31, 2008, CMS issued its final rule for SNFs, which went into effect
October 1. The final rule delays implementation of a recalibration of RUG
(Resource Utilization Group) categories and includes a market basket increase of
3.4% for FY09.
October 1. The final rule delays implementation of a recalibration of RUG
(Resource Utilization Group) categories and includes a market basket increase of
3.4% for FY09.
Contract Therapy
Legislative/Regulatory Environment
Legislative/Regulatory Environment
4
Contract Therapy
Performance
Performance
Dollars in millions | Q3 08 | Q2 08 | Q1 08 | Q4 07 |
Operating Revenues | $105.6 | $106.3 | $104.3 | $99.4 |
Operating Earnings | $6.6 | $5.6 | $3.8 | $4.0 |
Number of Locations End of Period | 1,075 | 1,053 | 1,038 | 1,064 |
Outlook
• Raising operating earnings margin target to a range of 5.5% to 6.5% for the
fourth quarter
fourth quarter
• Modest net increase in locations for the remainder of 2008
• Overall strong operating performance
• Operating earnings margin improved from 3.2% in Q3 07 to 6.2% in Q3
08, which exceeded guidance range of 4.5% to 5.5%
08, which exceeded guidance range of 4.5% to 5.5%
• Same store revenue increased $10.0 million or 11.8% in Q3 08 compared
to year ago period
to year ago period
• Net gain in operating units for two consecutive quarters

5
Acute care hospital-based inpatient rehabilitation facilities (IRFs) in RehabCare’s Hospital
Rehabilitation Services (HRS) division are for patients who require early, intensive therapies (at
least 3 hours/day 5 days/week) for recovery from stroke, brain injury, neurological disorders,
amputation and other disabling injuries and illnesses. Outpatient therapy programs provide
proactive, exercise-oriented therapy with hands-on treatment for individuals of all ages.
Competitive Landscape (Acute care hospital-based IRFs)
• Self-Operation
• RehabCare (110)
• Horizon Health (Physical Rehab Services) (>20)
• HealthSouth (11)
• Milestone(1)
• TherEx (formerly National Rehab Partners)(1)
(1) Private company or a subsidiary of a public company; number of locations is not available
Source: Information available from public filings or from company websites
Hospital Rehabilitation Services (HRS)
Market Overview
Market Overview
Market Size
• 5,000 acute care hospitals (approximately 1,000 hospital-based IRFs)
6
Hospital Rehab Services
Performance
Performance
Dollars in millions | Q3 08 | Q2 08 | Q1 08 | Q4 07 |
Operating Revenues | $41.6 | $40.2 | $40.2 | $38.8 |
Operating Earnings | $6.2 | $5.3 | $4.6 | $6.0 |
Number of Locations End of Period | 156 | 154 | 153 | 154 |
IRF Discharges | 10,569 | 10,309 | 10,276 | 10,190 |
Outlook
• Raised operating earnings margin target to range of 13% to 16% for the fourth quarter
• Modest increase in IRF units
• 3% - 5% growth in same store discharges YOY in the fourth quarter
• Operating earnings margin reached 15.0% in Q3 08, which was the upper end of
guidance range of 12% - 15%
guidance range of 12% - 15%
• Unit and revenue growth are returning to HRS following legislatively enacted freeze
of CMS 13 Rule at 60% in December 2007
of CMS 13 Rule at 60% in December 2007
• Same store IRF discharges increase by 3.7% in Q3 08 compared to year ago
same period
same period
• Unit count in Q3 08 increased for the second consecutive quarter
• Five signed but unopened IRF contracts with three scheduled to open in Q4 08
7
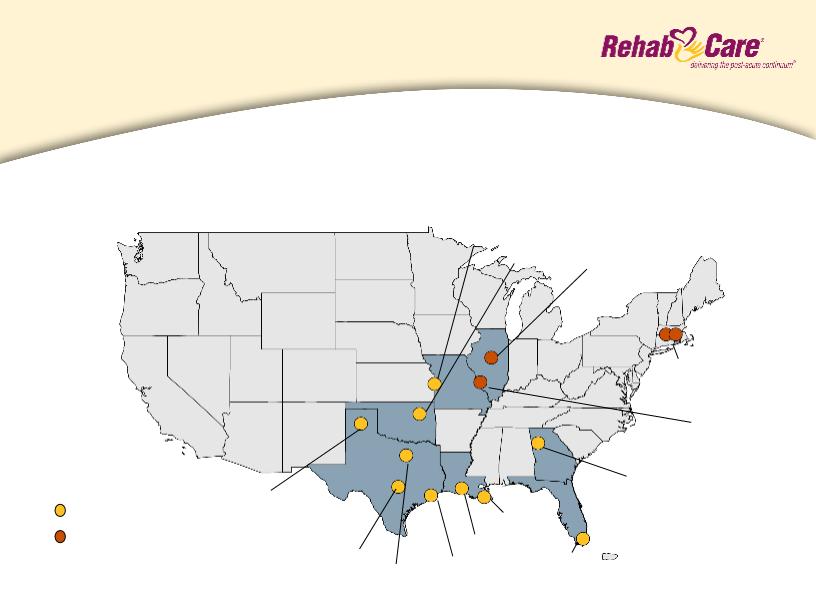
Inpatient rehabilitation facilities (IRFs) are equipped to treat patients with a wide range of
debilitating injuries and illnesses, offering inpatient and outpatient services in a home-like
environment. Long-term acute care hospitals (LTACHs) are specialty care hospitals designed
for extended stay patients with complex and chronic conditions.
debilitating injuries and illnesses, offering inpatient and outpatient services in a home-like
environment. Long-term acute care hospitals (LTACHs) are specialty care hospitals designed
for extended stay patients with complex and chronic conditions.
Hospital Division
Description and Locations
Description and Locations
Arlington, TX
Providence, RI
St. Louis, MO
N. Kansas City, MO
Tulsa, OK
Miami, FL
Houston, TX
New Orleans, LA
Amarillo, TX
Austin, TX
Rome, GA
Lafayette, LA
Peoria, IL
Current locations
Future locations
8
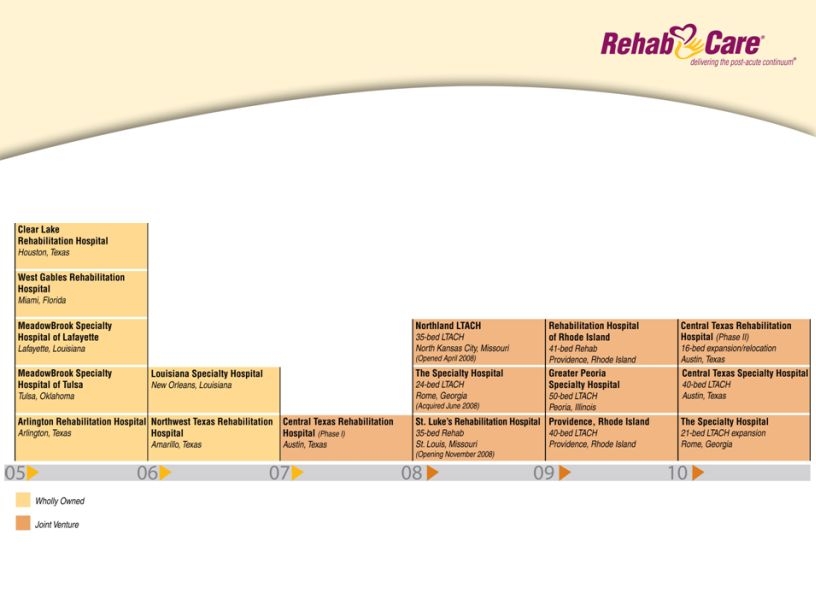
Hospital Division
Development Timeline
Development Timeline
• 10 existing hospitals, 4 in development including 1 awaiting
State Attorney General approval, 2 expansions
State Attorney General approval, 2 expansions
• Two development projects (Kokomo, IN and Reading, PA
LTACHs) canceled in third quarter
LTACHs) canceled in third quarter

9
Market Size:
• 240+ IRFs
Competitive Landscape
• Select Medical (88)
• Kindred (83)
• Regency Hospital (23)
• Triumph Healthcare (20)
• LifeCare (20)
• Vibra Healthcare (12)
• Cornerstone Healthcare (9)
• Ernest Health (8)
• HealthSouth (6)
• RehabCare (5)
Market Size:
• 460+ LTACHs
Freestanding IRFs
LTACHs
(1)Includes minority-owned hospital
Source: Information available from public filings or from company websites
Hospital Division
Market Overview
Market Overview
Competitive Landscape
• HealthSouth (93)
• RehabCare (6)(1)
• Ernest Health (6)
• Select Medical (4)
• Vibra Healthcare (4)
• Centerre (4)

10
Hospital Division
Performance
Dollars in millions | Q3 08 | Q2 08 | Q1 08 | Q4 07 |
Operating Revenues | $27.5 | $27.2 | $27.5 | $23.8 |
Operating Earnings (loss) | $(5.5) | $(3.5) | $(0.1) | $(0.7) |
Number of IRFs End of Period | 5 | 5 | 5 | 5 |
IRF Patient Discharges | 994 | 1,045 | 1,076 | 962 |
60% Compliance Level (Avg) | 59.4% | 58.5% | 59.7% | 63.6% |
Number of LTACHs End of Period | 5 | 5 | 3 | 3 |
LTACH Patient Discharges | 498 | 422 | 416 | 407 |
Outlook
• Expect operating loss of $3.7 to $4.7 million, which includes start-up and ramp-
up losses associated with Northland LTAC and St. Luke’s Rehabilitation
Hospitals, in the fourth quarter
up losses associated with Northland LTAC and St. Luke’s Rehabilitation
Hospitals, in the fourth quarter
• Operating losses have been the result of:
• Uneven operating performance among mature hospitals
• Start-up/ramp-up losses from new hospitals (aggregate $5.0 million over the past 4
quarters)
quarters)
• Higher SG&A related to infrastructure investments to support growing portfolio of hospitals

11
(dollars in millions except per share) | 3Q 08 | 2Q 08 | 1Q 08 | 4Q 07 |
Operating Revenues | $182.6 | $183.9 | $182.4 | $171.8 |
Operating Earnings | $7.0 | $7.7(1) | $8.6 | $9.1 |
Net Earnings | $4.0 | $4.5(1) | $4.5 | $5.1 |
Diluted Earnings Per Share | $0.22 | $0.25(1) | $0.25 | $0.29 |
(1) Includes a favorable pretax net settlement on a non-compete agreement of $0.6 million, or $0.4
million after tax and $0.02 per diluted share.
million after tax and $0.02 per diluted share.
• Improved operating earnings performance in CT and HRS
divisions has been masked by operating losses in the Hospital
division
divisions has been masked by operating losses in the Hospital
division
Consolidated Financial Summary

12
(Dollars in thousands)
Cash and Cash Equivalents
Total Assets
Total Debt
Stockholders’ Equity
Percent of Debt to Total Capital
6/30/08
9/30/08
$ 14,345
426,704
71,000
$255,903
22%
$ 12,405
415,953
52,000
$261,371
17%
• Cash flow from operations totaled $32.0 million for nine months
ended September 30, 2008. Debt was reduced by $19.0 million
in the third quarter
ended September 30, 2008. Debt was reduced by $19.0 million
in the third quarter
Consolidated Balance Sheet

13
• Continue to implement action plan for turning around Hospital
division, which includes strengthening field management,
centralizing business functions, trimming overhead, ramping
up market development efforts and reevaluating the
development pipeline
division, which includes strengthening field management,
centralizing business functions, trimming overhead, ramping
up market development efforts and reevaluating the
development pipeline
• Maintain targeted margins in operating divisions
• Grow operating revenues sequentially through
− same store growth
− net increases in units for all divisions
• Address therapist supply issue through academic
partnerships, campus relations/recruiting and innovative
initiatives like the Allied Health Research Institute
partnerships, campus relations/recruiting and innovative
initiatives like the Allied Health Research Institute
Primary Objectives
14
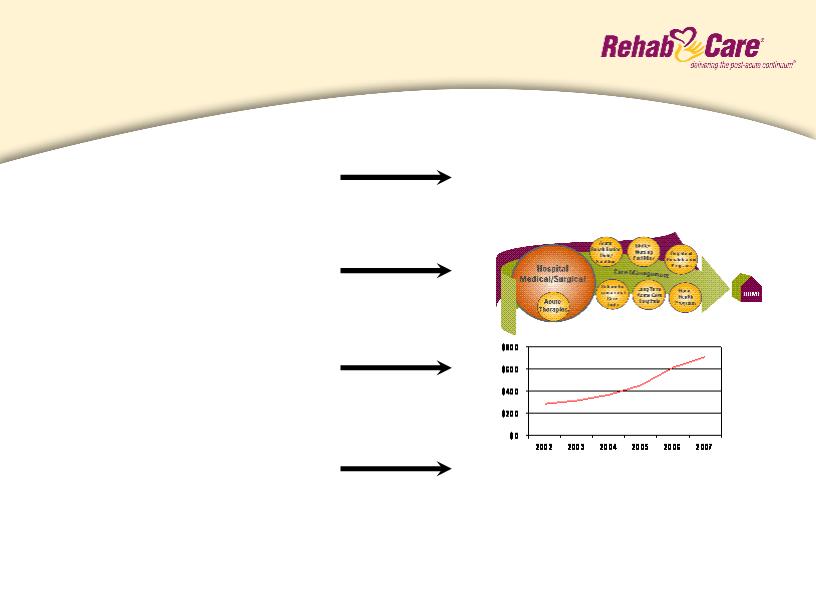
Investment Considerations
Why RehabCare?
Why RehabCare?
Increasing market demand
Unique continuum of care model
Demonstrated ability to grow revenue
organically and through acquisitions
organically and through acquisitions
Proven ability to adapt to market
and regulatory changes
Expenditures for post-acute services:
ü Grew $20.4 billion from 2000-2007
ü Projected increase of 150% by 2016
ü Represents 15% of Medicare fee-for-
service spending
service spending
ü PPS
ü 75% rule
ü Part B therapy caps
ü LTACH 25% rule
One of the longest tenured post-acute providers (established in 1982)
Revenues1
1 excludes StarMed

15
Forward-looking statements have been provided pursuant to the safe harbor provisions of the
Private Securities Litigation Reform Act of 1995. Such statements are based on the Company’s
current expectations and could be affected by numerous factors, risks and uncertainties discussed in
the Company’s filings with the Securities and Exchange Commission, including the Company’s most
recent annual report on Form 10-K, subsequent quarterly reports on Form 10-Q and current reports
on Form 8-K. Do not rely on forward looking statements as the Company cannot predict or control
many of the factors that ultimately may affect the Company’s ability to achieve the results estimated.
The Company makes no promise to update any forward looking statements whether as a result of
changes in underlying factors, new information, future events or otherwise.
Safe Harbor