
Investor Presentation
Fourth Quarter 2008
Exhibit 99
1
n $427 mm revenue - 57% of revenue
n 1,068 skilled nursing facility (SNF)
programs
n 39 states
n 7.6 million annual patient visits
Contract Therapy Division (CT)
Hospital Rehabilitation Services Division (HRS)
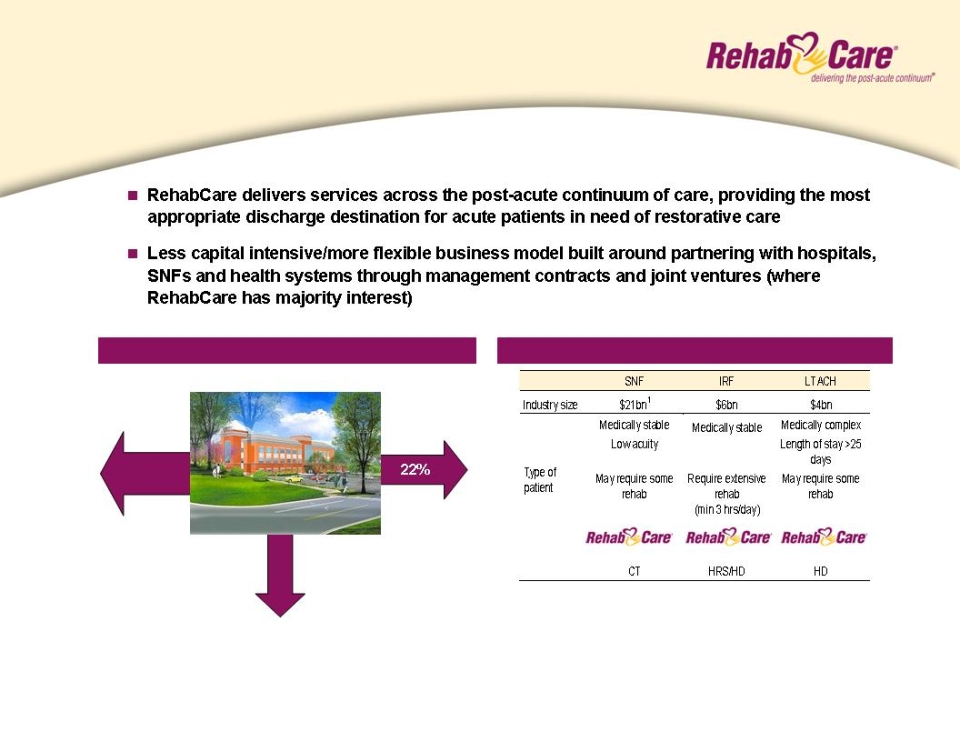
n $166 mm revenue - 22% of revenue
n 157 hospital-based programs
n 32 states
n 45,600 inpatient rehabilitation facility (IRF)
and skilled nursing unit discharges/year
and skilled nursing unit discharges/year
n 983,000 annual outpatient visits
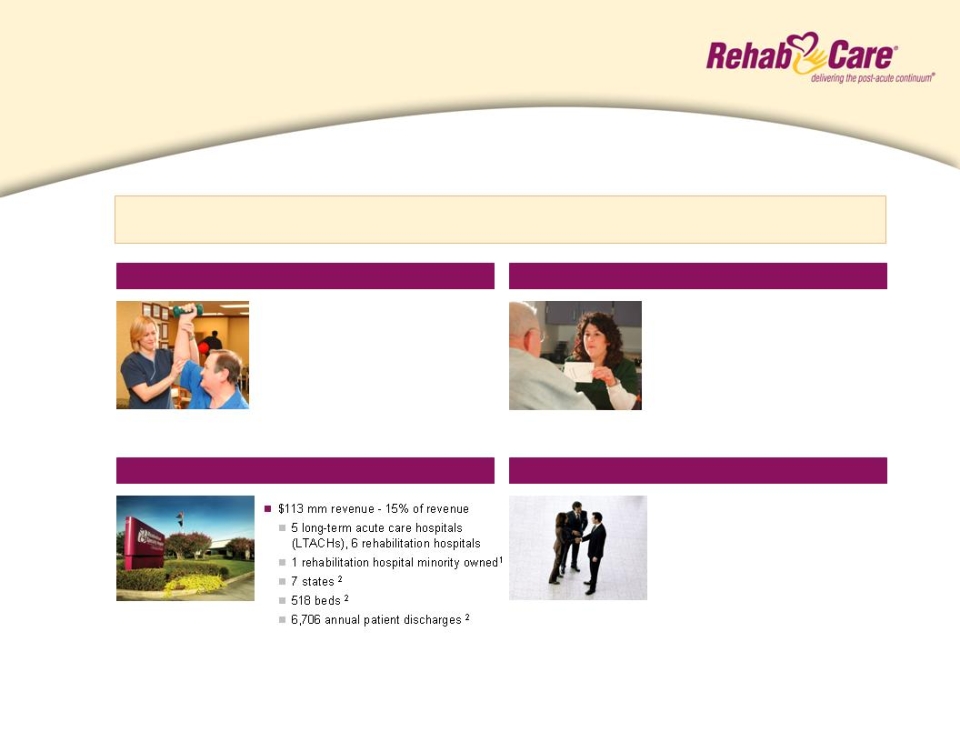
Hospital Division (HD)
Other Healthcare Services Division
n $40 mm revenue - 6% of revenue
n Phase 2 Consulting - consulting and
care management for hospitals and
health systems
care management for hospitals and
health systems
n Polaris Group - consulting for long-term
care facilities
care facilities
n VTA Management Services - therapy
and nurse staffing for New York
and nurse staffing for New York
$743 mm consolidated revenues in 2008
Note: All statistics for the twelve months ended 12/31/08, divisional revenues include inter business unit revenues of $2mm
1 Not included in consolidated revenues
2 These statistics include the minority-owned rehab hospital
RehabCare at a glance
Operating divisions
Operating divisions
2
SNF/IRF/LTACH
No post
acute care
acute care
Hospice/Home Health
Source: MedPAC, equity research estimates
1 Of the $21bn SNF market size, $6bn is the market potential for Contract Therapy
Patient Discharge Destination
Overview of post-acute settings
65%
13%
Acute care hospital
RehabCare at a glance
The back door to acute care providers
The back door to acute care providers
3
n Manages rehab programs for SNFs
n Each Medicare certified SNF is required to provide physical, speech and occupational therapy, but many lack the
management know-how and/or scale to effectively manage a program
n RehabCare provides a compelling value proposition to our SNF partners
n Access to advanced technology platform that provides for more efficient utilization of therapists and management
resources, improved patient outcomes and increased SNF reimbursement
n Broader array of services
n Better access to scarce therapist labor pool
n Market size¹
n 15,800 Medicare certified skilled nursing facilities
Source: Information available from public filings or from company websites
¹ Source: MedPAC and Congressional Budget Office
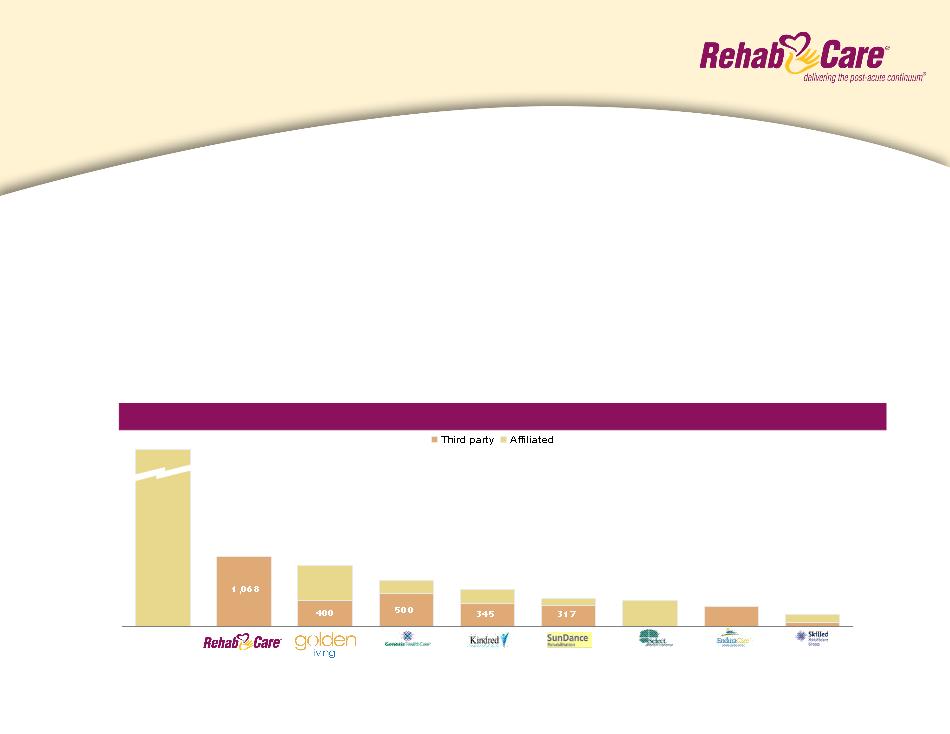
Competitive Landscape — # of facilities served
Self-
operated
11,000+
1,068
935
700
573
425
400
300
189
Contract Therapy
Division overview
Division overview
4
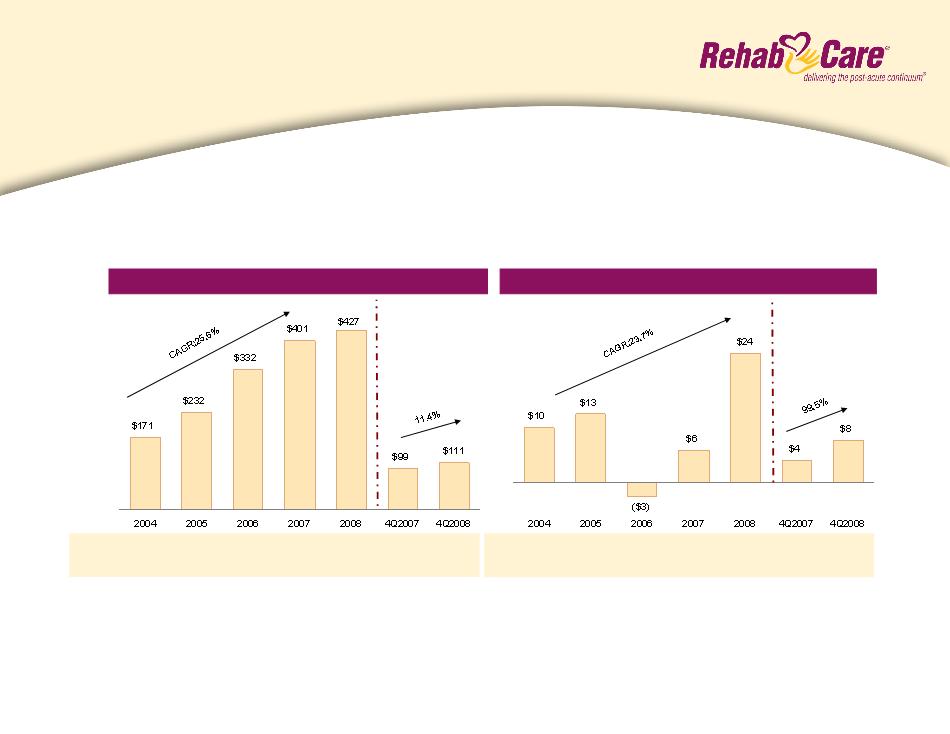
n Strong track record of profitable growth
n Operating earnings decline due to Symphony acquisition in 2006
n Margin recovery with completion of Symphony integration in 2007
Note: Includes Symphony acquisition as of July 1, 2006
¹Same store analysis does not include Symphony
n 5.5% to 6.5% operating earnings margin, driven by 4% to 6% year-over-year same store revenue growth and
assuming no market basket increase for FY 2010
n Stable to modest unit growth
2009 Outlook:
YOY growth: 30.9% 35.5% 42.8% 20.9% 6.5% (3.9%) 11.4%
Same store: 9.9% 8.4% 1.0%¹ 7.1%¹ 12.4% 9.1% 13.8%
Revenue ($mm)
% Margin: 6.0% 5.5% (0.8%) 1.5% 5.6% 4.0% 7.1%
Operating Earnings ($mm)
Contract Therapy
Performance
Performance
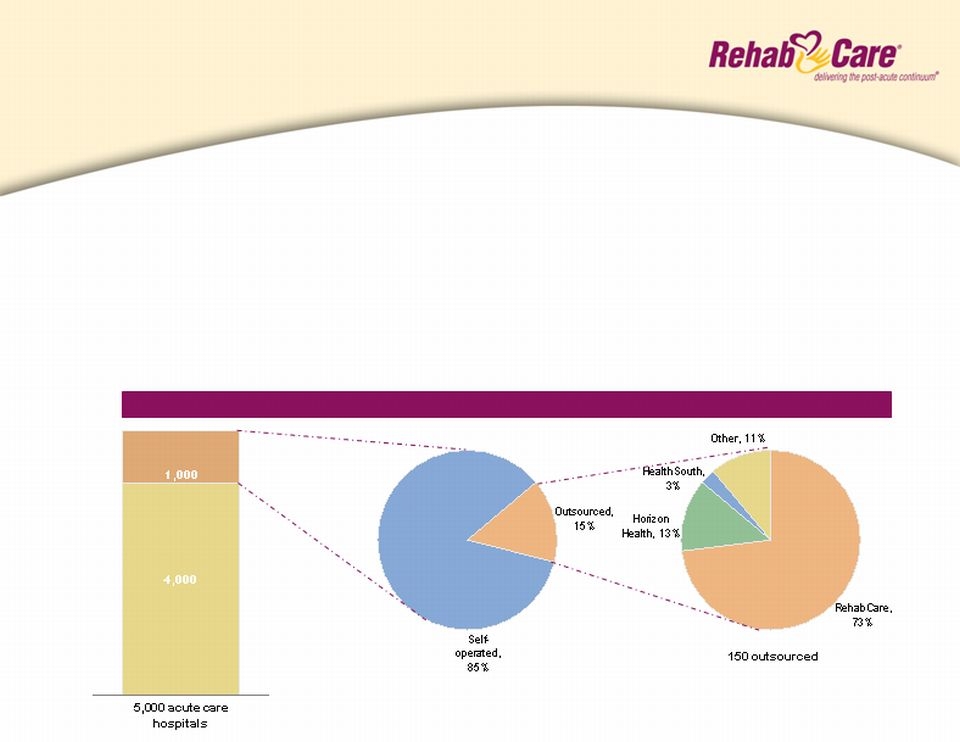
1,000 IRF's
5
n Manages hospital-based IRFs and outpatient therapy programs on a contract basis, providing our
partners with:
n Improved clinical outcomes
n Ability to attract ~30% admissions from external sources
n Broader clinical programming (brain, stroke, spinal dysfunction)
n Better access to scarce therapist labor pool
n Better compliance (60% rule, RAC, 3-hour rule)
— Enhanced denial management
Source: Information available from public filings or from company websites
Competitive Landscape
Hospital Rehabilitation Services
Division overview
Division overview
6
n RehabCare offers acute care providers opportunity to
expand post-acute services and deliver a more
coordinated continuum of care for their patient
population
expand post-acute services and deliver a more
coordinated continuum of care for their patient
population
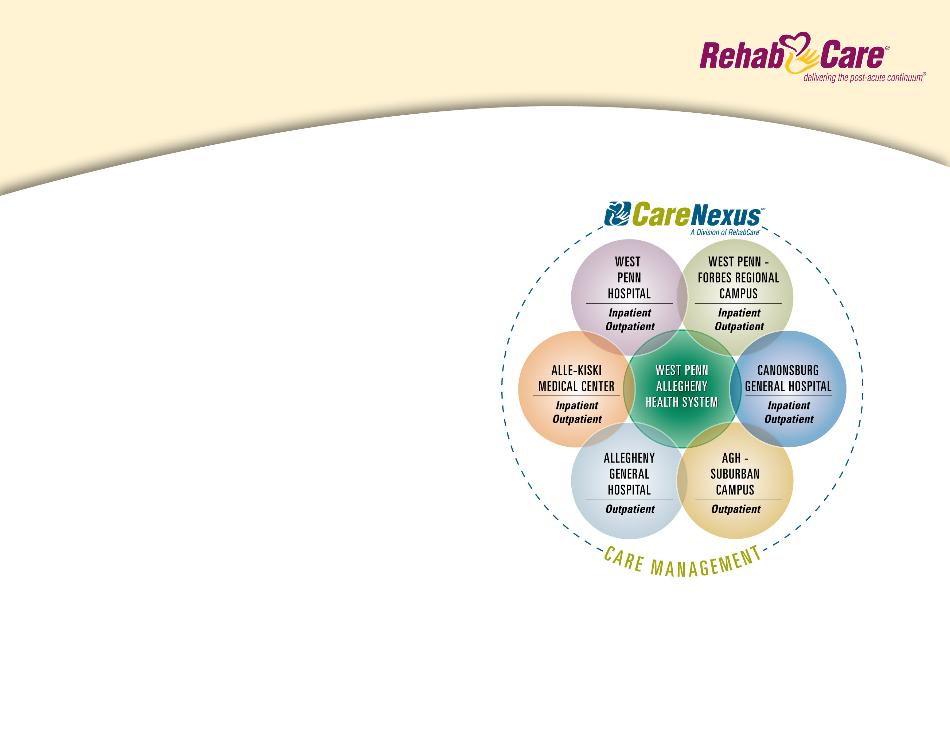
n Collaborative agreement with West Penn Allegheny
Health System (WPAHS) in October 2008 is an
example of this model
Health System (WPAHS) in October 2008 is an
example of this model
n Benefits for WPAHS:
n Enhanced clinical services for ever-growing post-acute
population
population
n Improved market share / decreased outmigration
n Improved patient outcomes / creation of “centers of excellence”
n Seamless integration of post-acute services and patient care
coordination through CareNexus
coordination through CareNexus
WPAHS agreement
A continuum of care model
A continuum of care model
7
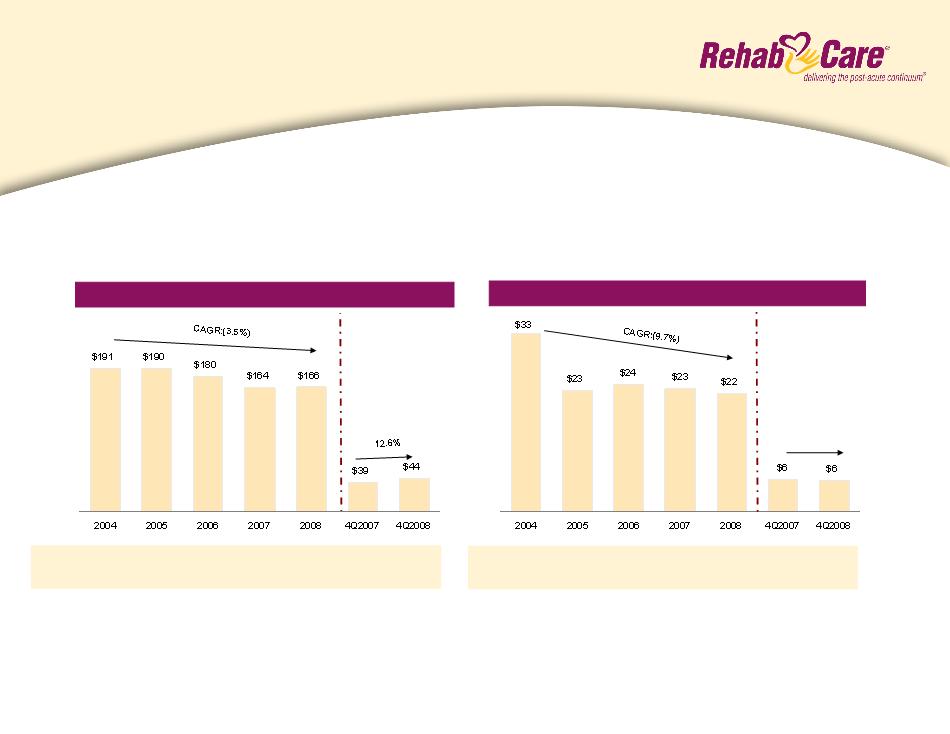
n Revenue and operating earnings declined due to implementation of the 75% Rule in 2004
n Clear runway to growth given freeze of 75% Rule at 60% starting January 2008
n Revenue and operating earnings rebounded during the second half of 2008 with further growth expected in 2009
YOY growth: 2.6% (0.5%) (5.3%) (8.7%) 0.9% (11.5%) 12.6%
IRFs: 113 120 115 107 113 107 113
Revenue ($mm)
¹includes $1.2 mm pretax charge from a bad debt write-down related to an outpatient
transaction
transaction
(2.9%)
Operating Earnings ($mm)
% Margin: 17.3% 11.9% 13.2% 14.0% 13.3% 15.5% 13.3%
¹
n 14% to 16% operating earnings margin, 3% to 5% year-over-year growth in same store IRF discharges and a modest
net increase in units
net increase in units
2009 Outlook:
Hospital Rehabilitation Services
Performance
Performance

8
n Market Size:
n 240+ IRFs
Freestanding IRFs
LTACHs
Competitive Landscape
n Market Size:
n 460+ LTACHs
Source: Information available from public filings or from company websites
¹ Includes St. Luke’s Rehabilitation Hospital (opened in November 2008) and minority-owned hospital
Centerre
Hospital Division
Market overview
Market overview
9
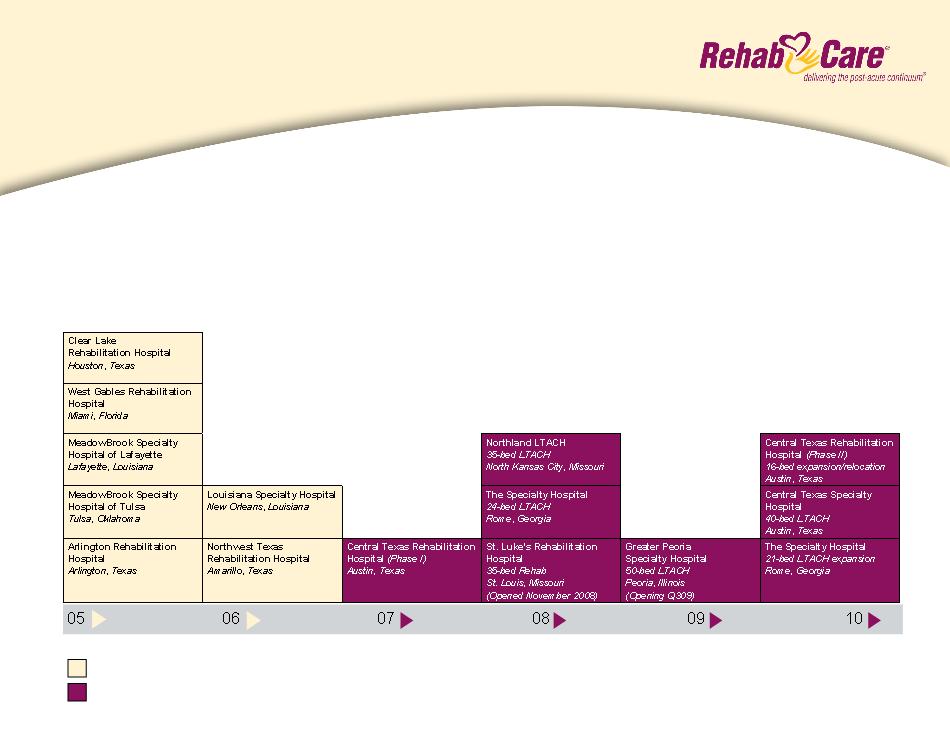
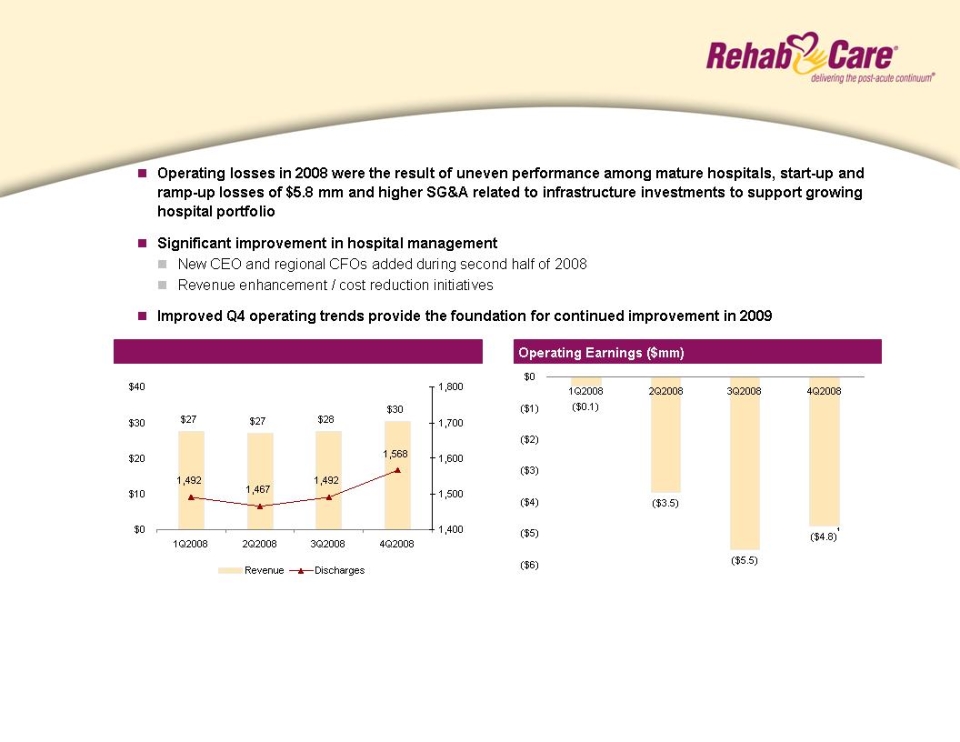
n 11 existing hospitals (St. Luke’s Rehabilitation Hospital opened November 2008), 2 in development,
2 expansions; one scheduled opening in 2009
n Strategy of partnering with real estate investors/joint venture partners to build hospitals in a capital-
efficient, high ROI fashion
efficient, high ROI fashion
Wholly Owned
Joint Venture
Growing portfolio of post-acute hospitals
10
Revenue ($mm) and discharges
1Includes a $1.5 mm pretax charge related to the cancellation of a planned
acquisition and development project
acquisition and development project
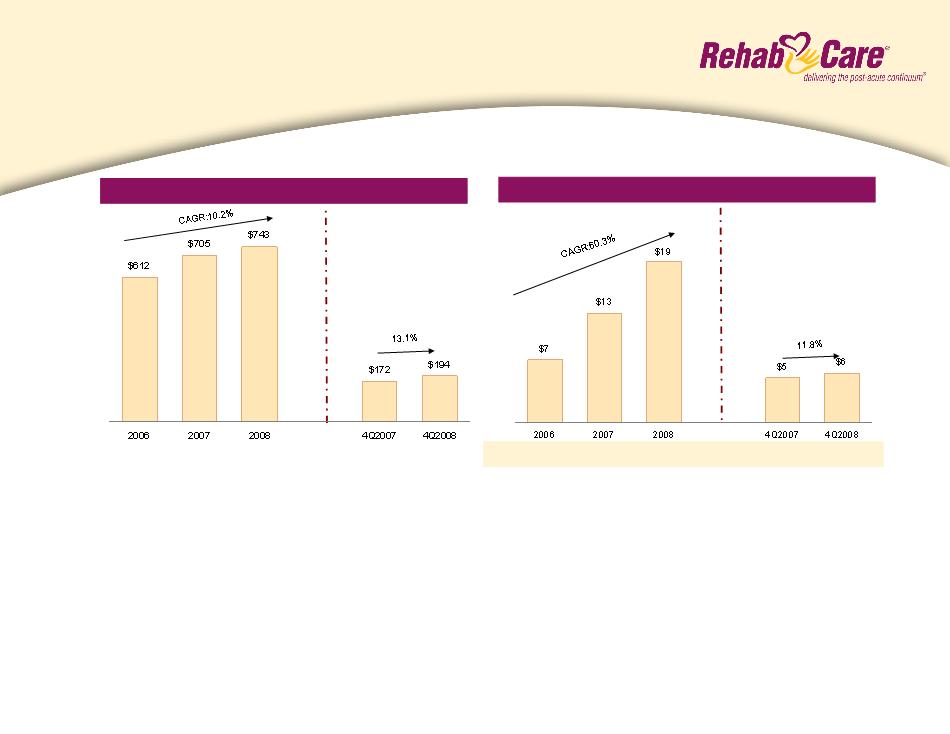
n Sequential quarterly improvement in operating earnings performance with total year operating losses reduced by
$3 - - $4 mm compared to FY 2008
n $140-$150 mm in revenue, driven by strong growth in mature and de novo hospitals and assuming no market basket
increase for LTACHs or IRFs
increase for LTACHs or IRFs
2009 Outlook:
¹
Hospital Division
Performance
Performance
11
Net Earnings ($mm)
Revenue ($mm)
EPS: $0.42 $0.731 $1.052 $0.29 $0.322
n Strong consolidated revenue and net earnings growth for the full year
n Quarterly operating earnings will be impacted less by hospital start-up / ramp-up losses than in 2008
n Consistent with prior years, first quarter 2009 operating results will be impacted by the resumption of normalized
run rate costs, such as self insurance and employee benefit programs, along with fewer calendar days
n Effective tax rate of approximately 39% after consideration of minority interests and equity income
2009 Outlook:
¹includes a $0.17 per diluted share impairment charge on an intangible asset
²includes $0.09 per diluted share in charges related to a bad debt write-down of an
outpatient transaction and cancellation of a planned acquisition and development project
outpatient transaction and cancellation of a planned acquisition and development project
Consolidated financial summary

12
Cash and Cash Equivalents
Total Assets
Total Debt
Stockholders’ Equity
Percent of Debt to Total Capital
Percent of Net Debt to Total Capital
($mm)
$ 10.3
408.6
74.5
$ 244.0
23%
20%
$ 27.4
438.4
57.0
$267.8
18%
9%
12/31/07
12/31/08
n Cash flow from operations totaled $48.7 mm in FY 2008
n Days sales outstanding improved from 72 days at FYE 2007 to 66 days at FYE 2008
n Debt was reduced during FY 2008 by $17.5 mm with cash position increasing by $17.1 mm to
provide greater liquidity during credit crisis (net debt fell from $64mm at FYE 2007 to $30 mm at
FYE 2008)
provide greater liquidity during credit crisis (net debt fell from $64mm at FYE 2007 to $30 mm at
FYE 2008)
Consolidated balance sheet

13
LTACHs
IRFs
SNFs
n The Extension Act contained LTACH
-specific provisions through
December 31, 2010, including
stoppage of both the 25% rule and a
short-stay outlier payment provision.
It also instituted a moratorium on
development of new LTACHs.
-specific provisions through
December 31, 2010, including
stoppage of both the 25% rule and a
short-stay outlier payment provision.
It also instituted a moratorium on
development of new LTACHs.
n For FY2009, CMS implemented a
2.7% increase in rates
2.7% increase in rates
n MedPAC has recommended a net
1.6% rate increase in FY2010
1.6% rate increase in FY2010
n Prior legislation requires CMS to
report by June 2009 the results of an
LTACH study relating to such areas
as patient access and admission
criteria
report by June 2009 the results of an
LTACH study relating to such areas
as patient access and admission
criteria
n The SCHIP Extension Act of 2007,
which provided a permanent freeze
of the 75% Rule at 60%, effective
January 1, 2008, also eliminated a
market basket update through
FY2009
which provided a permanent freeze
of the 75% Rule at 60%, effective
January 1, 2008, also eliminated a
market basket update through
FY2009
n MedPAC has recommended that
payment rates not be increased in
FY2010
payment rates not be increased in
FY2010
n Prior legislation requires CMS to
report by June 2009 the results of an
IRF study relating to such areas as
patient access and admission criteria
report by June 2009 the results of an
IRF study relating to such areas as
patient access and admission criteria
n On July 15, 2008 Congress passed
MIPPA (Medicare Improvements for
Patients and Providers Act) that
extended the Part B therapy cap
exceptions process and provided a
1.1% increase in the physician fee
schedule through December 31,
2009
MIPPA (Medicare Improvements for
Patients and Providers Act) that
extended the Part B therapy cap
exceptions process and provided a
1.1% increase in the physician fee
schedule through December 31,
2009
n CMS issued a 3.4% industry rate
increase for FY2009, which became
effective on October 1, 2008
increase for FY2009, which became
effective on October 1, 2008
n MedPAC has recommended that
payment rates not be increased in
FY2010
payment rates not be increased in
FY2010
Current reimbursement environment

14
Summary
n On February 26, 2009, President Obama released his proposal to save nearly $18B over the
next 10 years, which included creating a site neutral, post-acute bundled payment
mechanism beginning in 2013
next 10 years, which included creating a site neutral, post-acute bundled payment
mechanism beginning in 2013
n Proposal creates a post-acute 30-day add-on to the acute DRG payment, likely controlled by
the acute care hospital, and institutes readmission penalties on acute care hospitals, which
should result in $8.4B in savings
the acute care hospital, and institutes readmission penalties on acute care hospitals, which
should result in $8.4B in savings
n Details of the proposal are pending and Congressional action is required to enact
n Combination of incentives and penalties will likely produce better patient outcomes
n Eliminates the need for arbitrary regulations such as the 60% Rule for IRFs, 25-day length-of
-stay requirement for LTACHs and the 3-day hospital admission requirement for SNFs
-stay requirement for LTACHs and the 3-day hospital admission requirement for SNFs
n Prompts acute care hospitals to have a post-acute care strategy, which may require a post-
acute partner
acute partner
n Creates opportunity for RehabCare, given our relationships and JV partnerships with acute
care providers, SNF footprint and the breadth of our capabilities across the post-acute
continuum
care providers, SNF footprint and the breadth of our capabilities across the post-acute
continuum
Potential Impact
Obama healthcare budget proposal
Impact on post-acute care
Impact on post-acute care
15
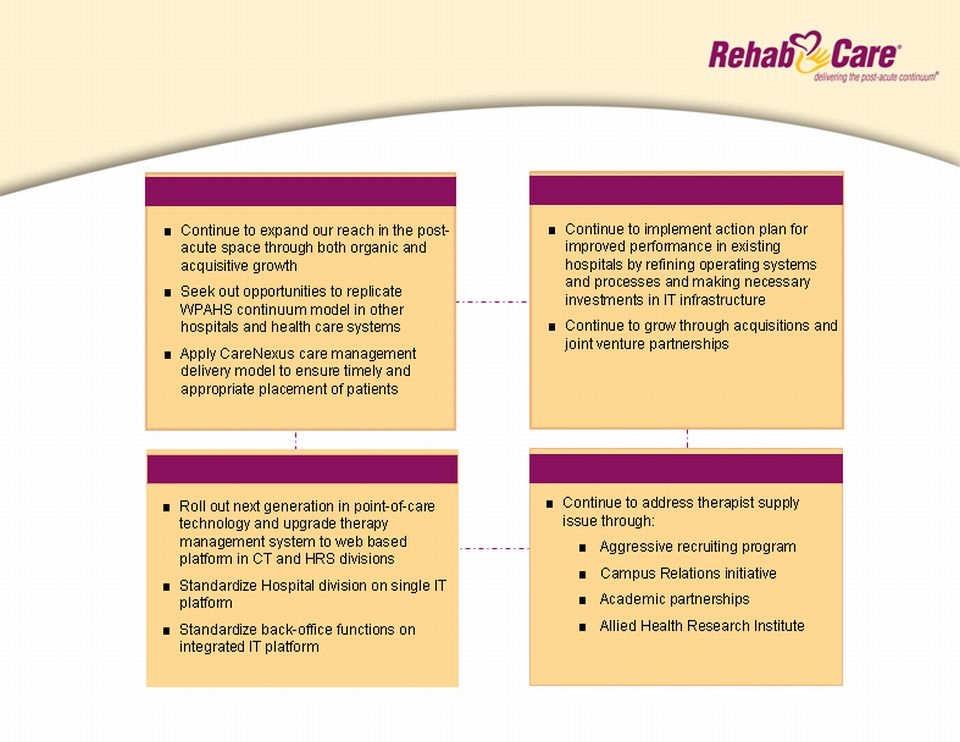
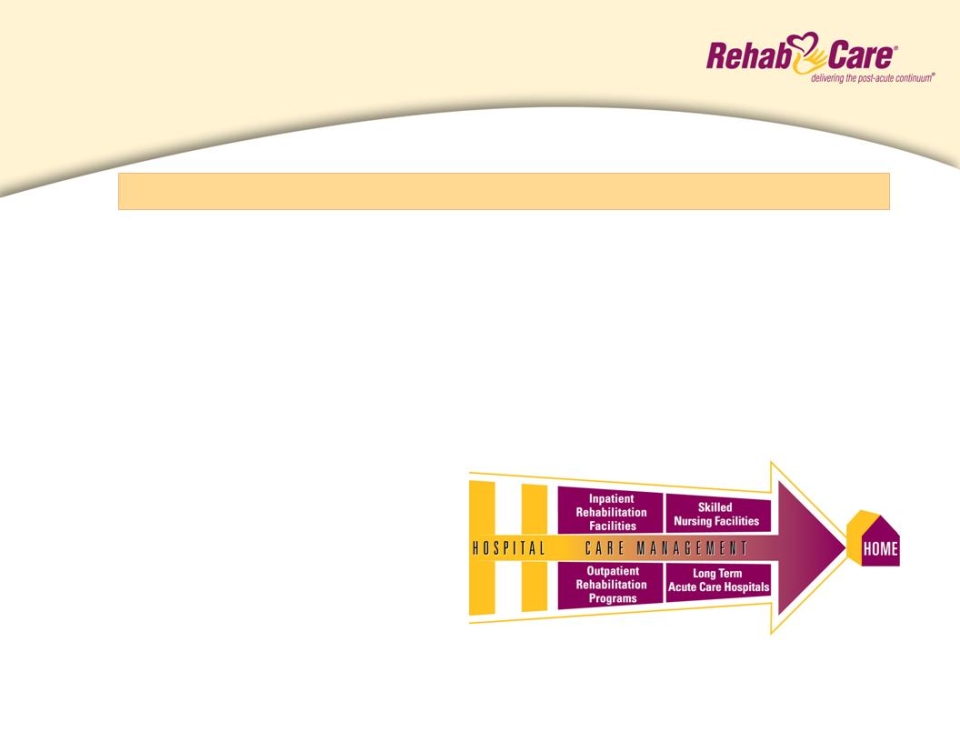
The Post-Acute Continuum
Hospital Division
IT Roadmap
Therapist Solutions
Long-term strategic plan
16
Why RehabCare?
One of the longest tenured post-acute providers (established in 1982)
n Increasing market demand
n Expenditures for post-acute services:
n Grew $20.4 billion from 2000-2007
n Projected to increase 150% by 2016
n Represents 15% of Medicare fee-for-service spending
n First wave of baby boomers enter Medicare in 2011
n Post-acute continuum capabilities
n Offers flexible solutions to clients and partners
n Gives us the ability to withstand market
pressures in any one segment
pressures in any one segment
n Positions us to capitalize on proposed bundled
or episodic payment system
or episodic payment system
17
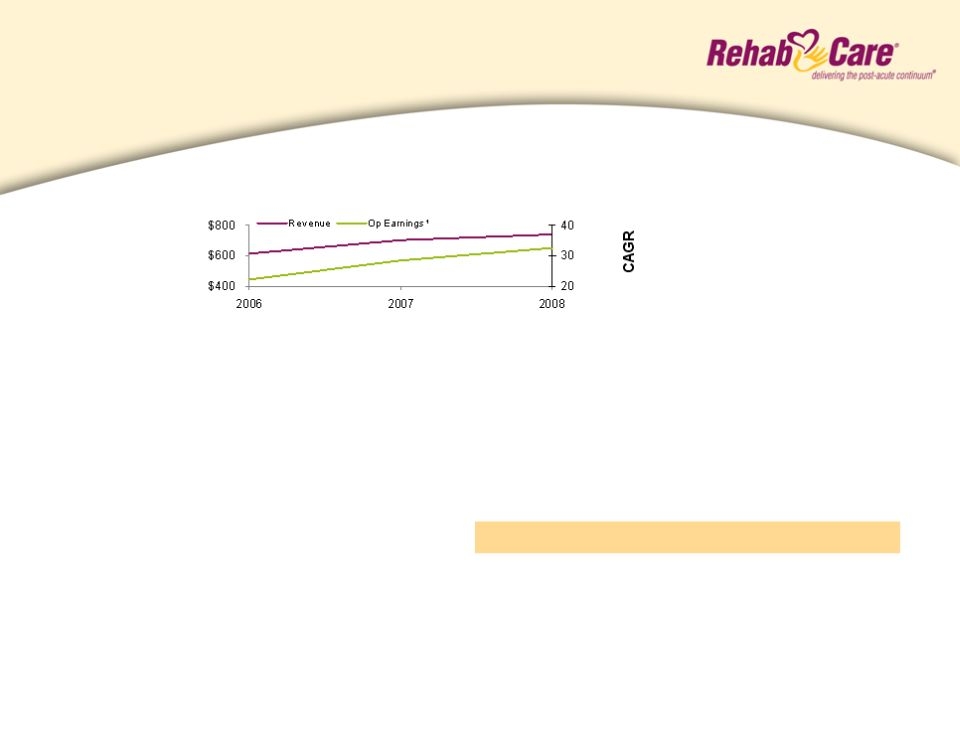
Why RehabCare?
ü PPS
ü 75% Rule
2 Total debt less cash
ü Part B Therapy Caps
ü LTACH 25% rule
2006 | 2007 | 2008 | |
DSO | 78 | 72 | 66 |
CFFO | $19 | $52 | $49 |
Net Debt2 | $111 | $64 | $30 |
2006-08
10.2%
21.3%
¹
n Enhances competitive advantage in economic
downturns
downturns
n Greater flexibility with potential partners
searching for capital resources
searching for capital resources
n Allows continued evaluation of growth
opportunities
opportunities
Note: Includes Symphony acquisition as of July 1, 2006
¹ Includes $2.7mm in charges related to a bad debt write-down of an outpatient transaction and
cancellation of a planned acquisition and development project in FY2008
cancellation of a planned acquisition and development project in FY2008
■ Demonstrated ability to grow revenue and earnings organically and through acquisitions
■ Proven ability to adapt to market regulatory changes
■ Strong cash flows

18
Forward-looking statements have been provided pursuant to the safe harbor provisions of the Private Securities
Litigation Reform Act of 1995. Such statements are based on the Company’s current expectations and could be
affected by numerous factors, risks and uncertainties discussed in the Company’s filings with the Securities and
Exchange Commission, including the Company’s most recent annual report on Form 10-K, subsequent quarterly
reports on Form 10-Q and current reports on Form 8-K. Do not rely on forward looking statements as the
Company cannot predict or control many of the factors that ultimately may affect the Company’s ability to
achieve the results estimated. The Company makes no promise to update any forward looking statements
whether as a result of changes in underlying factors, new information, future events or otherwise.
Safe Harbor