5
1
n Rolling out iTouch/iPhone
technology across divisions
n Assures accuracy of
coding and patient care
time
n Automates/speeds patient
screening process
1Preserving Patient
Access to Therapy
Tool (PPATT)
n Provides clinical pathways
for common diagnoses of
the long-term care patient
n Addresses patient goal
setting, coding guidelines
and care management of
services
1
n Converting to web-based
platform
n Tracks and trends functional
outcomes by patient type
n Assesses patient gains from
evaluation to discharge
n Allows therapists to plan the
amount of care provided at
point of service
1
Dashboard Report
n Provides site-level, real-
time reporting on key
performance indicators
n Measures against
established benchmarks
and provides program
rankings (i.e. performance
vs. peers)
n DevelopU: Online learning
management system that
offers clinical in-services
and course content for
RehabCare clinicians and
host facilities
1Professional
Development
1Specialty
Programming
n Moving Forward: Patient
education series for
common diagnoses
n Specialty program offerings
in areas such as wellness,
spinal dysfunction and falls
prevention
n Creating Stroke Centers of
Excellence
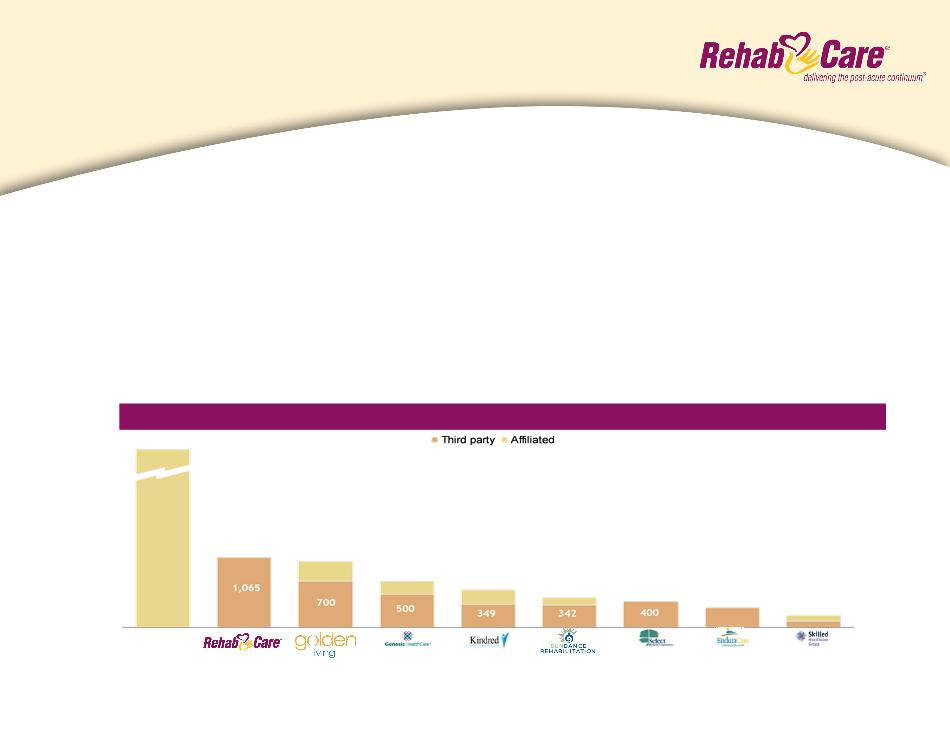
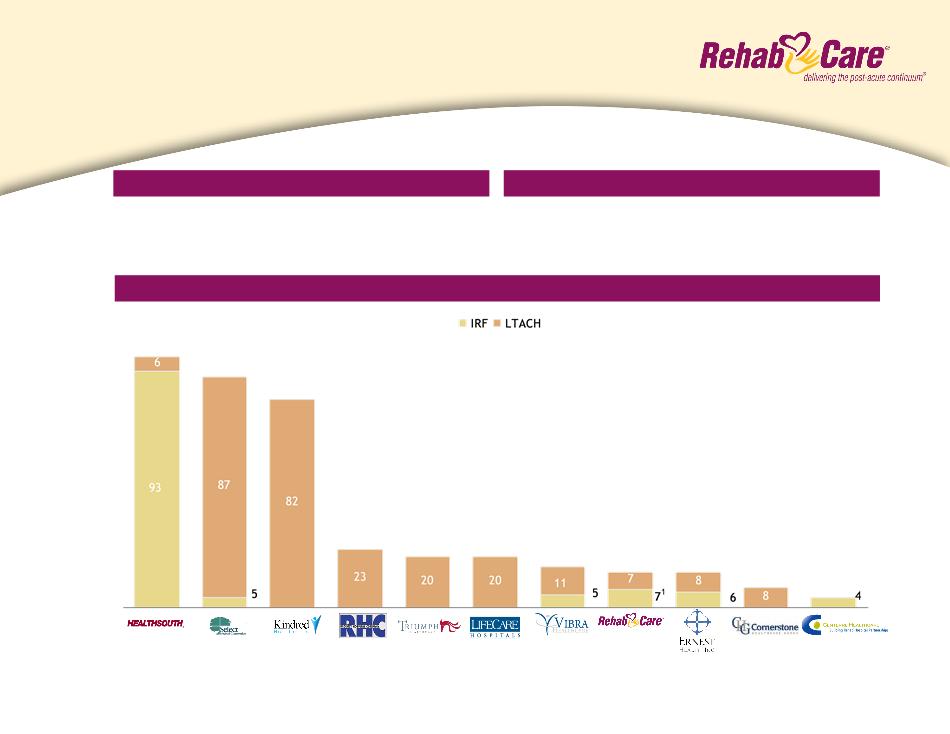
RehabCare at a glance
Ensuring clinical quality