 1 Investor Presentation Kindred Healthcare, Inc. (NYSE: KND) March 16, 2011 Filed pursuant to Rule 425 under the Securities Act of 1933 and deemed filed pursuant to Rule 14a-12 under the Securities Exchange Act of 1934 Filing Person: Kindred Healthcare, Inc. Commission File No.: 001-14057 Subject Company: RehabCare Group, Inc. Commission File No.: 001-14655 |
 Forward-Looking Statements Additional Information About this Transaction In connection with the pending transaction with RehabCare Group, Inc. (“RehabCare”), Kindred Healthcare, Inc. (“Kindred”) will file with the Securities and Exchange Commission (the “SEC”) a Registration Statement on Form S-4 that will include a joint proxy statement of Kindred and RehabCare that also constitutes a prospectus of Kindred. Kindred and RehabCare will mail the definitive proxy statement/prospectus to their respective stockholders. WE URGE INVESTORS AND SECURITY HOLDERS TO READ THE JOINT PROXY STATEMENT/PROSPECTUS REGARDING THE PENDING TRANSACTION WHEN IT BECOMES AVAILABLE BECAUSE IT WILL CONTAIN IMPORTANT INFORMATION. You may obtain a free copy of the joint proxy statement/prospectus (when available) and other related documents filed by Kindred and RehabCare with the SEC at the SEC’s website at . The joint proxy statement/prospectus (when available) and the other documents filed by Kindred and RehabCare with the SEC may also be obtained for free by accessing Kindred’swebsite at www.kindredhealthcare.com and clicking on the “Investors” link and then clicking on the link for “SEC Filings” or by accessing RehabCare’s website at www.rehabcare.com and clicking on the “Investor Information” link and then clicking on the link for “SEC Filings”. Participants in this Transaction Kindred, RehabCare and their respective directors, executive officers and certain other members of management and employees may be soliciting proxies from their respective stockholders in favor of the pending transaction. Information regarding the persons who may, under the rules of the SEC, be considered participants in the solicitation of stockholders in connection with the pending transaction will be set forth in the joint proxy statement/prospectus when it is filed with the SEC. You can find information about Kindred’s executive officers and directors in Kindred’s definitive proxy statement filed with the SEC on April 1, 2010. You can find information about RehabCare’s executive officers and directors in its definitive proxy statement filed with the SEC on March 23, 2010. You can obtain free copies of these documents from Kindred or RehabCare, respectively, using the contact information above. Forward-Looking Statements Information set forth in this presentation contains forward-looking statements, which involve a number of risks and uncertainties. Kindred and RehabCare caution readers that any forward-looking information is not a guarantee of future performance and that actual results could differ materially from those contained in the forward-looking information. Such forward-looking statements include, but are not limited to, statements about the benefits of the business combination transaction involving Kindred and RehabCare, including future financial and operating results, the combined company’s plans, objectives, expectations and intentions and other statements that are not historical facts. The following factors, among others, could cause actual results to differ from those set forth in the forward-looking statements: (a) the receipt of all required licensure and regulatory approvals and the satisfaction of the closing conditions to the acquisition of RehabCare by Kindred, including approval of the pending transaction by the shareholders of the respective companies, and Kindred’s ability to complete the required financing as contemplated by the financing commitment; (b) Kindred’s ability to integrate the operations of the acquired hospitals and rehabilitation services operations and realize the anticipated revenues, economies of scale, cost synergies and productivity gains in connection with the RehabCare acquisition and any other acquisitions that may be undertaken during 2011, as and when planned, including the potential for unanticipated issues, expenses and liabilities associated with those acquisitions and the risk that RehabCare fails to meet its expected financial and operating targets; (c) the potential for diversion of management time and resources in seeking to complete the RehabCare acquisition and integrate its operations; (d) the potential failure to retain key employees of RehabCare; (e) the impact of Kindred’s significantly increased levels of indebtedness as a result of the RehabCare acquisition on Kindred’s funding costs, operating flexibility and ability to fund ongoing operations with additional borrowings, particularly in light of ongoing volatility in the credit and capital markets; (f) the potential for dilution to Kindred stockholders as a result of the RehabCare acquisition; and (g) the ability of the Company to operate pursuant to the terms of its debt obligations, including Kindred’s obligations under financings undertaken to complete the RehabCare acquisition, and the ability of Kindred to operate pursuant to its master lease agreements with Ventas, Inc. (NYSE:VTR). Additional factors that may affect future results are contained in Kindred’s and RehabCare’s filings with the SEC, which are available at the SEC’s web site at . Many of these factors are beyond the control of Kindred or RehabCare. Kindred and RehabCare disclaim any obligation to update and revise statements contained in these materials based on new information or otherwise. 2 www.sec.gov www.sec.gov |
 3 696 (3) sites of service, 315 facilities in 40 states 56,800 (3) dedicated employees, making Kindred a top-200 private employer in the U.S. (4) 33,800 (3) patients and residents per day $4.4 billion (2) consolidated revenues Largest Diversified Post-Acute Provider in the United States (1) (1) Ranking based on revenues. (2) Revenues for the year ended December 31, 2010. (3) As of December 31, 2010. (4) Ranking provided by TMP, Inc. |
 4 4 $2.0 billion revenues (1) HOSPITAL Long-term Acute Care Hospitals • Largest operator in U.S. (2) • 89 hospitals with 6,887 licensed beds (3) $2.2 billion revenues (1) • Third largest nursing center operator in U.S. (2) • 226 nursing centers with 27,442 licensed beds (3) • 7 assisted living facilities with 463 licensed beds (3) NURSING CENTER Nursing and Rehabilitation Centers $505 million revenues (1) • Second largest contract therapy company in U.S. (2) • 381 external locations served through 5,900 therapists and 10,600 total employees (3) REHABILITATION Peoplefirst Rehabilitation Services (1) Revenues for the year ended December 31, 2010 (divisional revenues before intercompany eliminations). (2) Ranking based on revenues. (3) As of December 31, 2010. Kindred’s Market Leading Businesses |
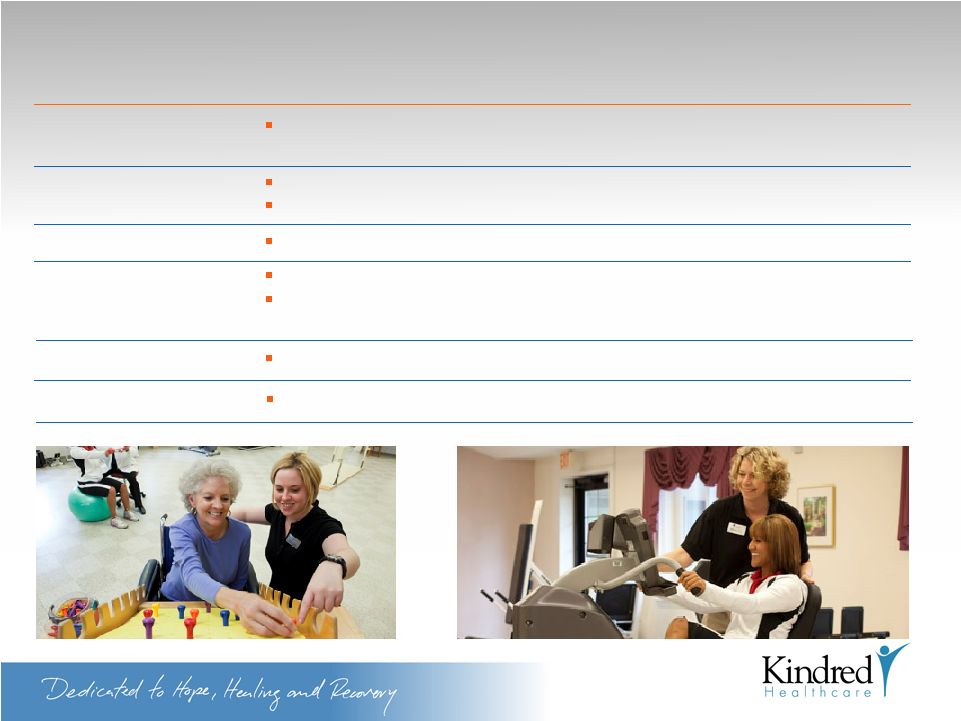
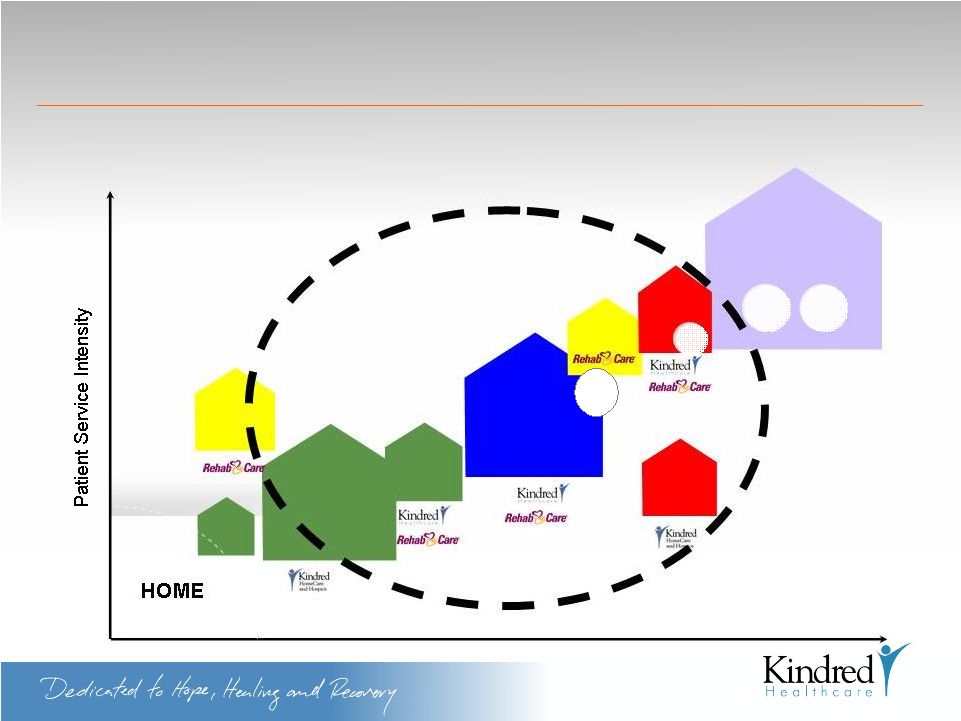
 5 Provide superior clinical outcomes and quality care with an approach which is patient-centered, disciplined and transparent Lower cost by reducing lengths of stay in acute care hospitals and transition patients home at the highest possible level of function Reduce rehospitalization through our integrated and interdisciplinary care management teams and protocols Kindred’s Value Proposition and Our “Continue The Care” Campaign |
 6 |
 7 Investment Rationale Each year, nearly 9 million people – 23,000 a day – are discharged from short-term acute care hospitals that require some form of post-acute care As the largest diversified post-acute provider, Kindred is uniquely positioned to grow and succeed in what will be an increasingly integrated healthcare delivery system Kindred has a track record of providing quality, cost-effective care, operational excellence and consistent levels of free cash flows Our platform and infrastructure, together with our successful organic development and opportunistic M&A strategy, offer the potential for creating significant value for shareholders |
 8 Kindred Update |
 9 Kindred Update Kindred Healthcare, Inc. (“Kindred”) and RehabCare Group, Inc. (“RehabCare”) have announced a transaction whereby Kindred will acquire RehabCare for ~$35/share Both Companies reported strong Q4 and 2010 clinical and financial results and share a high degree of confidence and visibility in their business plans and estimates for 2011 The combined Company will have an industry leading position in attractive post-acute business segments and growing local markets Kindred will be well positioned for future growth in a changing healthcare landscape with the expansion of the combined service offerings The transaction substantially enhances Kindred’s growth and margin profile The proposed transaction is highly accretive to Kindred’s earnings and cash flows and generates strong operating cash flows providing the ability to quickly delever and finance future growth |
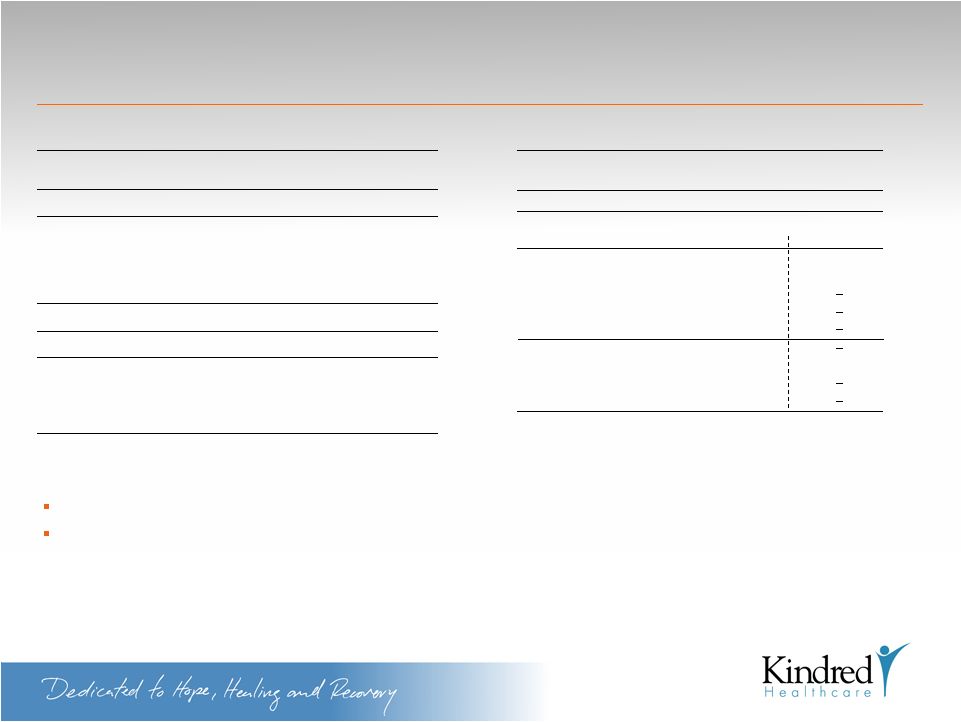
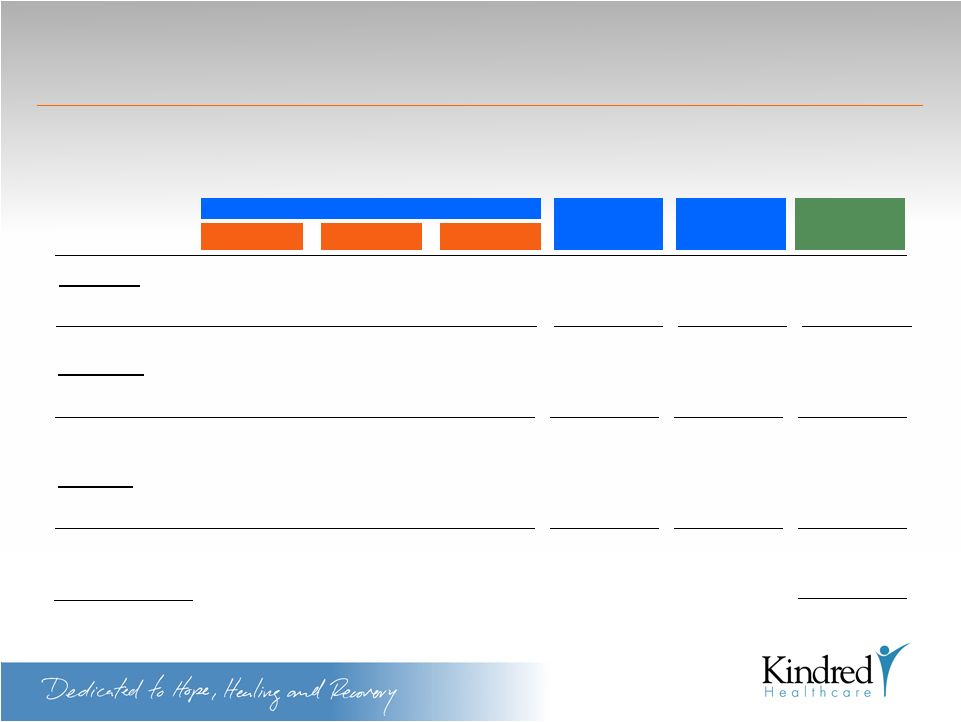
 10 Both Kindred and RehabCare beat 4Q and 2010 analyst estimates Summary of Q4 and 2010 Results Kindred RehabCare 1) I/B/E/S consensus as of 2/7/2011. 2) Reflects income from continuing operations. 3) Actual revenues exclude Miami IRF. 4) Includes discontinued operations. ($MM, except EPS Data) ($MM, except EPS Data) Q4 2010 2010 Consensus (1) Actual % Surprise Consensus (1) Actual % Surprise Revenues 1,121.0 1,135.5 1.3% 4,345.0 4,359.7 0.3% EBITDA 61.0 66.8 9.5% 211.0 217.3 3.0% EBIT 30.0 35.4 18.0% 90.0 95.7 6.3% Net Income (2) 16.0 19.8 23.8% 52.0 56.1 7.9% EPS (2) $0.41 $0.50 22.0% $1.33 $1.42 6.8% Q4 2010 2010 Consensus (1) Actual % Surprise Consensus (1) Actual % Surprise Revenues (3) 343.0 339.3 -1.1% 1,347.2 1,329.4 -1.3% EBITDA 41.5 44.1 6.3% 163.5 164.1 0.4% EBIT 34.1 36.1 5.9% 133.4 133.6 0.1% Net Income (4) 14.9 17.1 14.8% 60.6 62.5 3.1% EPS (4) $0.60 $0.69 15.0% $2.45 $2.53 3.3% |
 11 Transaction Overview |
 12 ~$35 / share total ($26 / share in cash; ~$9 / share in Kindred stock) (1) $1.3 billion total consideration, including assumption of net debt Transaction Overview Consideration Accretion Synergies Kindred and RehabCare have announced a transaction whereby Kindred will acquire RehabCare for ~$35/share Transaction Substantially accretive to Kindred’s earnings and operating cash flows $40 million in identified annual cost and operating synergies Full run-rate achieved within two years ($25MM achieved first year) – Excluding one time costs Committed financing from J.P. Morgan, Morgan Stanley and Citi Financing Expected Close On or about June 30, 2011 1) Based on a fixed exchange ratio. |
 13 Transaction Overview J.P. Morgan, Morgan Stanley and Citi have committed $1.85Bn in debt financing Key Capital Considerations Ability to delever quickly (Pro forma adjusted leverage flat to current Kindred standalone) Maintain strong balance sheet, liquidity and financial flexibility (approximately $250MM undrawn revolver capacity at close) Sources and Uses (1) ($MM) Sources % of Total $600MM ABL Revolving Credit Facility $350 19% Term Loan B 700 38% Senior Unsecured Notes 550 30% Equity Consideration (3) 228 13% Total Sources 1,828 100% Uses % of Total Purchase RehabCare Equity (~$35/share) 885 48% Retire RehabCare Debt 399 22% Retire Kindred Debt 367 20% Other 177 10% Total Uses 1,828 100% Pro-Forma Capitalization (1) ($MM) 2011E (2) New Borrowings 1,600 Total Debt 1,600 Revenue EBITDA (4) Rent Expense EBITDAR (4) Total Debt / EBITDA Adjusted Debt (5) / EBITDAR 6,200 6,200 470 487 422 422 892 909 3.4x 3.3x 4.6x 4.5x 5,846 445 414 859 3.6x 4.8x 1,600 1,600 2010PF (2) 1) Sources and Uses is as of 12/31/10. Pro-Forma Capitalization is based on borrowings expected at closing. Figures may not add due to rounding. 2) 2010PF figures reflect full year run rate of 2010 Kindred acquisitions ($157MM in revenue, $44MM in EBITDAR, $7MM in rent and $37MM of EBITDA benefit) and RehabCare. RehabCare 2010 results do not include the results of discontinued operations (inpatient rehabilitation facility in Miami). 2011 figures display low and high end of guidance which reflects the combined business as if the transaction closed on 1/1/11. 3) Based on a fixed exchange ratio. 4) 2010PF and 2011E includes $25MM of run rate synergies. 5) Calculated with 6.0x cap rate. |
 14 Agency Ratings Corporate Family Term Loan B Moody’s Investors Service (1) B1 Ba3 Standard and Poor’s (2) B+ B+ (1) Release dated March 14, 2011 (2) Release dated March 11, 2011 |
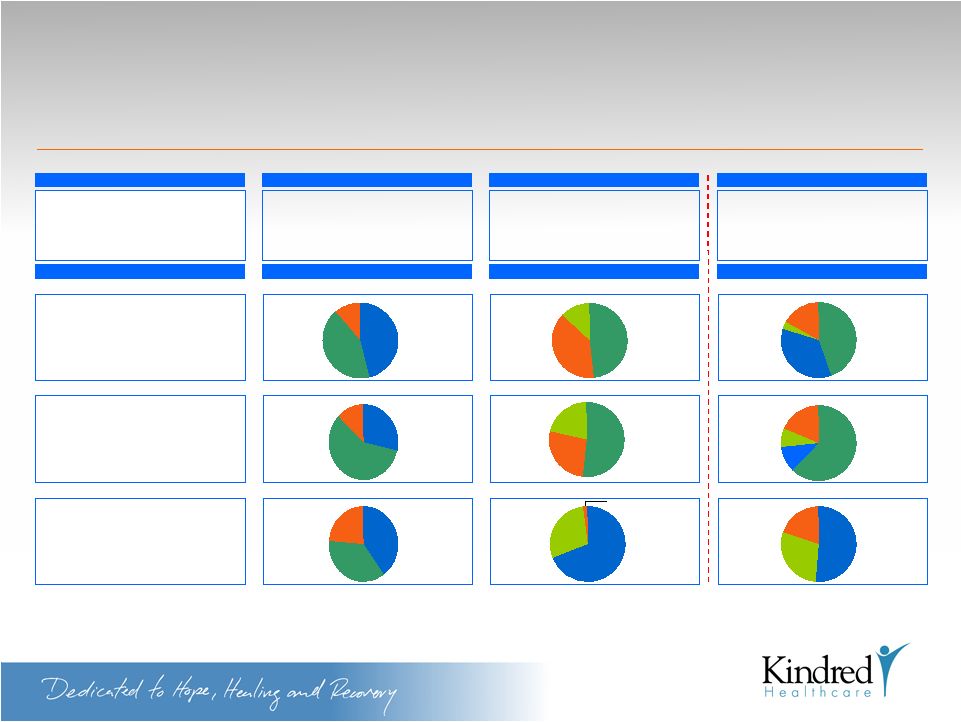 15 Kindred and RehabCare will be the Premier Rehabilitation and Post-Acute Provider in the United States Metrics Kindred Kindred + RehabCare Focus SNF, LTAC and Contract Rehab SNF, LTAC and Contract Rehab Scale (1) • States • Facilities • Beds • 2010 Revenue (Pro Forma) • 2010 EBITDA (Pro Forma) 40 322 34,792 $4,517MM (2) $254MM (2) RehabCare Contract Rehab and LTAC 42 34 1,788 $1,349MM $166MM 46 356 36,580 $5,866MM (2) $445MM (2)(3) Payor Mix (’09) Business Mix: EBITDA (’10) (2) 29% 13% 58% Contract Rehab SNF LTAC 40% 24% 36% Medicaid Medicare Commercial LTAC SRS 52% 27% 21% LTAC SRS HRS 69% 29% Medicaid 2% Medicare Commercial 45% 35% 3% 17% LTAC SNF HRS Contract Rehab 11% 8% 62% 19% LTAC SNF HRS Contract Rehab 51% 20% 29% Commercial Medicaid Medicare Business Mix: Revenue (’10) (2)(4) 39% 48% 13% HRS 47% 42% 11% Contract Rehab SNF LTAC (1) RehabCare states include LTAC and IRF locations. Beds include LTACs and freestanding IRFs. Kindred facilities include owned, leased or managed LTACHs, SNFs and ALFs. RehabCare facilities include owned and leased LTACHs. (2) Includes the full year benefit of all of the acquisitions Kindred has closed in 2010 ($157MM Revenue and $37MM EBITDA benefit). RehabCare 2010 results includes the results of discontinued operations (inpatient rehabilitation facility in Miami). Figures may not add due to rounding. (3) Includes $25MM of run rate synergies. (4) Revenue excludes the effect of Kindred intercompany eliminations. EBITDA includes intercompany eliminations in Kindred segment EBITDA. |
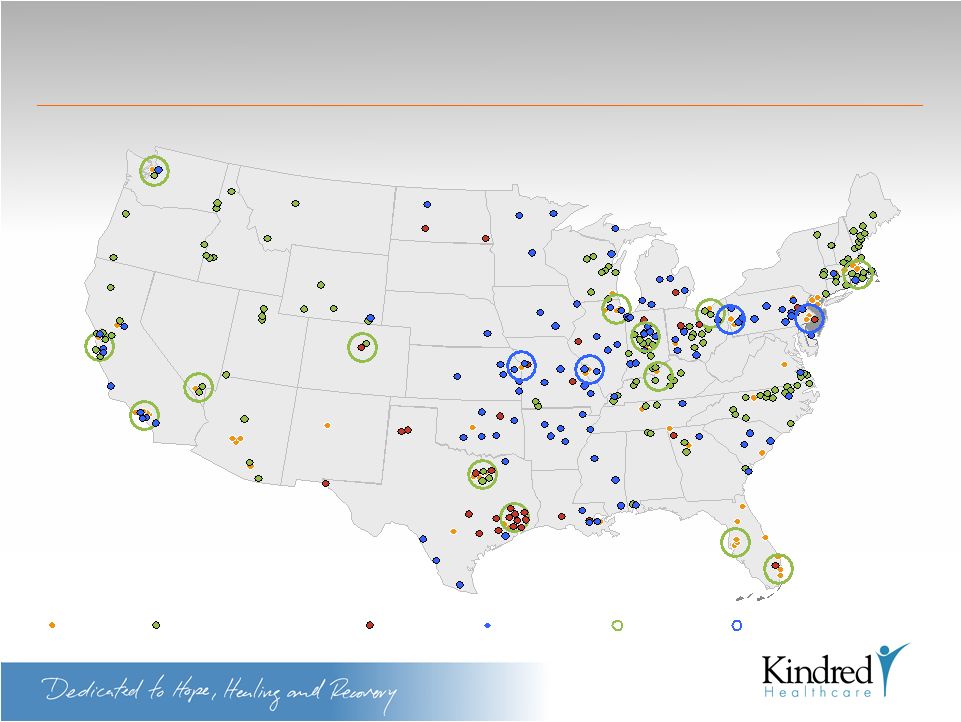 16 Kindred and RehabCare Combined Presence Kindred Hospitals Kindred Nursing and Rehabilitation Centers RehabCare Hospitals Acute Rehabilitation Units Existing Cluster Market Potential New Cluster Market Transaction enhances Kindred’s Cluster Market Strategy |
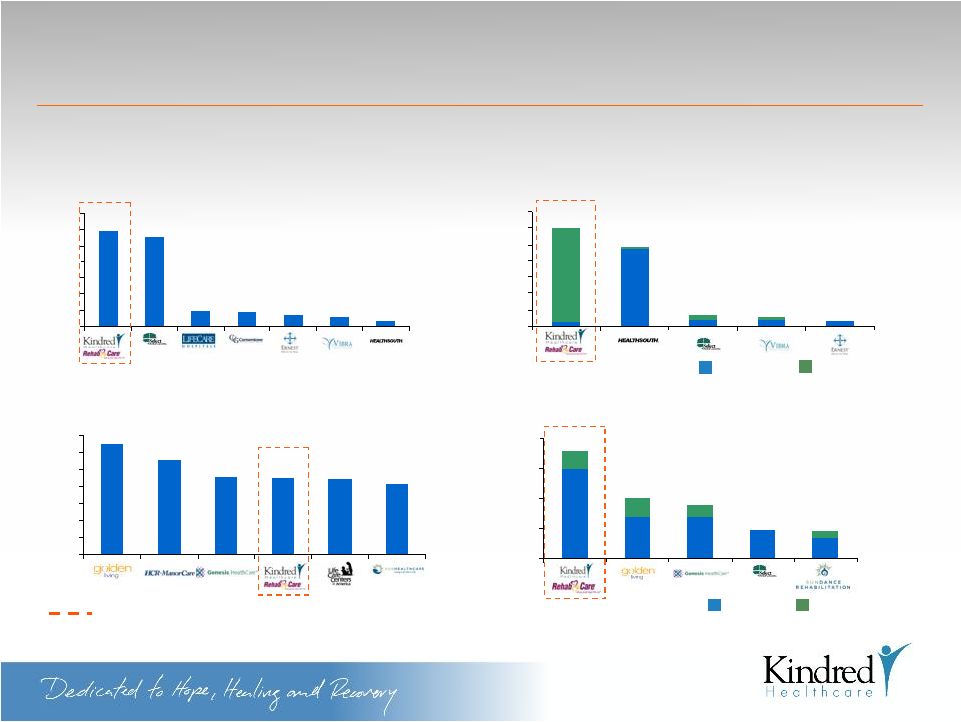 17 Leading Position in Attractive Growing Businesses (1) Includes 1,112 facilities from RehabCare and 696 facilities from Kindred. Multiple earnings streams, multiple avenues for growth PF Kindred 116 3 5 94 8 8 7 5 2 0 20 40 60 80 100 120 140 13 10 97 121 Freestanding Hospital Based 207 324 277 227 226 223 0 50 100 150 200 250 300 350 Number of Facilities 315 300 200 108 1,808 1,000 900 471 450 342 471 700 700 1,493 0 500 1,000 1,500 2,000 Third Party Affiliated (1) 12 6 15 18 19 111 118 0 20 40 60 80 100 120 140 Number of Facilities #1 Operator of Hospital Based and Freestanding IRFs #4 Operator of Skilled Nursing and Rehab Centers #1 Contract Rehab Manager #1 Operator of Long-Term Acute Care Hospitals |
 18 Strategic Rationale |
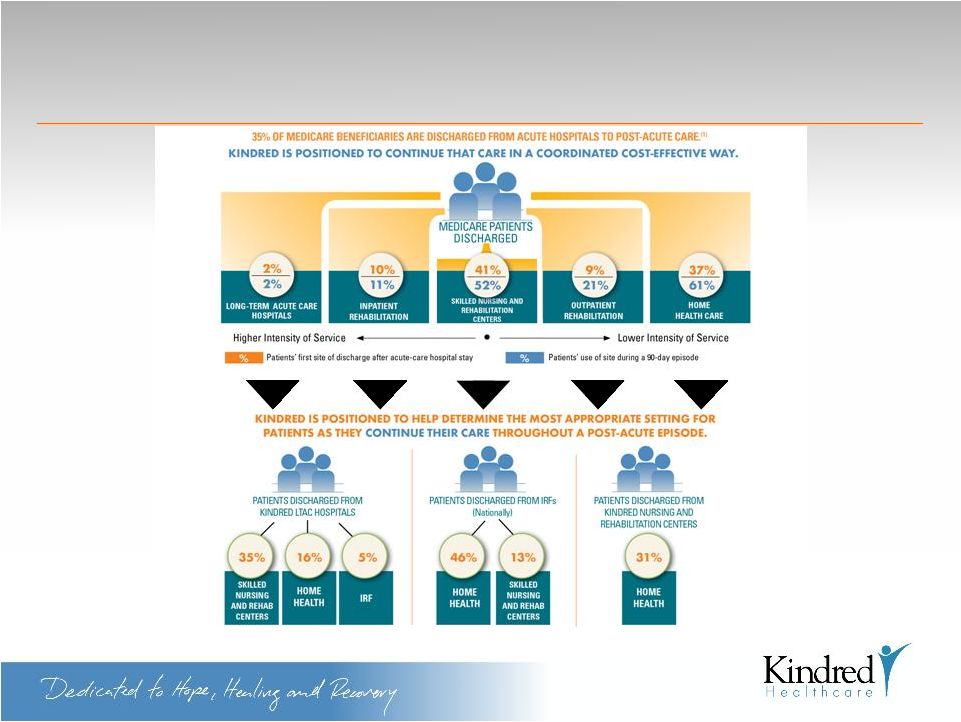 19 Rapidly Changing Post-Acute Market Multiple Patient Discharge Destinations SOURCE: RTI, 2009: Examining Post-Acute Care Relationships in an Integrated Hospital System |
 20 Positioned to Take Advantage of Changing Healthcare Landscape “Continue The Care” Uniquely Positioned For Bundled Or Episodic Payment Environment SKILLED NURSING FACILITIES HOSPICE HOME HEALTH CARE OUTPATIENT REHAB ASSISTED LIVING ACUTE CARE HOSPITALS TRANS TRANS CARE CARE ICU ICU IN-PATIENT REHAB LTACs FREESTANDING/ HIH Patient Illness Severity SAU SAU TCC & TCU ADULT DAY CARE |
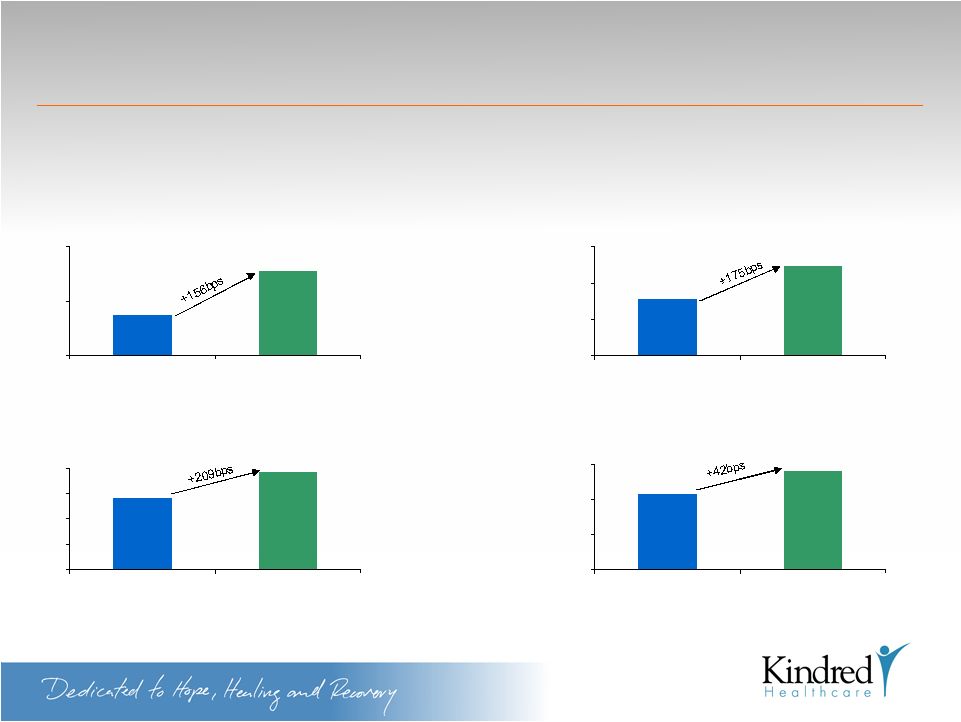 21 Transaction Enhances Financial Profile (1) Standalone Kindred growth analysis compares 2011 guidance issued on 12/15/10 relative to 2010 standalone performance pro forma full year run rate for all of Kindred’s 2010 acquisitions; Pro forma Kindred growth analysis compares pro forma 2011 guidance relative to 2010 pro forma results, in each case assuming the RehabCare acquisition occurred on the first day of each respective year and includes first year run rate synergies in both 2010 and 2011 figures. 2011 margin figures per guidance midpoint and compares standalone 2011 guidance issued on 12/15/10 relative to pro forma 2011 guidance. 2011 pro forma guidance reflects the combined business as if the transaction closed on 1/1/11 and includes first year run rate synergies. EBITDAR Growth (1) 2010 – 2011 3.5 5.1 2.0 4.0 6.0 Standalone Kindred Pro Forma Kindred (%) EBITDA Growth (1) 2010 – 2011 6.1 7.9 3.0 5.0 7.0 9.0 Standalone Kindred Pro Forma Kindred (%) EBITDA Margin (1) 2011 5.6 7.7 0.0 2.0 4.0 6.0 8.0 Standalone Kindred Pro Forma Kindred (%) Net Income Margin (1) 2011 1.3 1.7 0.0 0.6 1.2 1.8 Standalone Kindred Pro Forma Kindred (%) Enhances Kindred’s growth and operating margin profiles |
 22 Transaction Reduces Rent and Fixed Charge Burden Declining Rent Burden Enhanced Margin Profile RehabCare operates a less capital-intensive business model, driving higher pro forma returns on assets (1) Midpoint of guidance issued 12/15/10. (2) Midpoint of pro forma guidance which reflects combined business as if the transaction closed 1/1/11. 2011 Operating Leverage ($MM) Kindred (1) Pro Forma (2) Revenue $4,800 $6,200 EBITDAR 640 899 % Margin 13.3% 14.5% Rent 370 423 % Margin 7.7% 6.8% EBITDA 270 476 % Margin 5.6% 7.7% D&A 140 185 % Margin 2.9% 3.0% EBIT 130 291 % Margin 2.7% 4.7% |
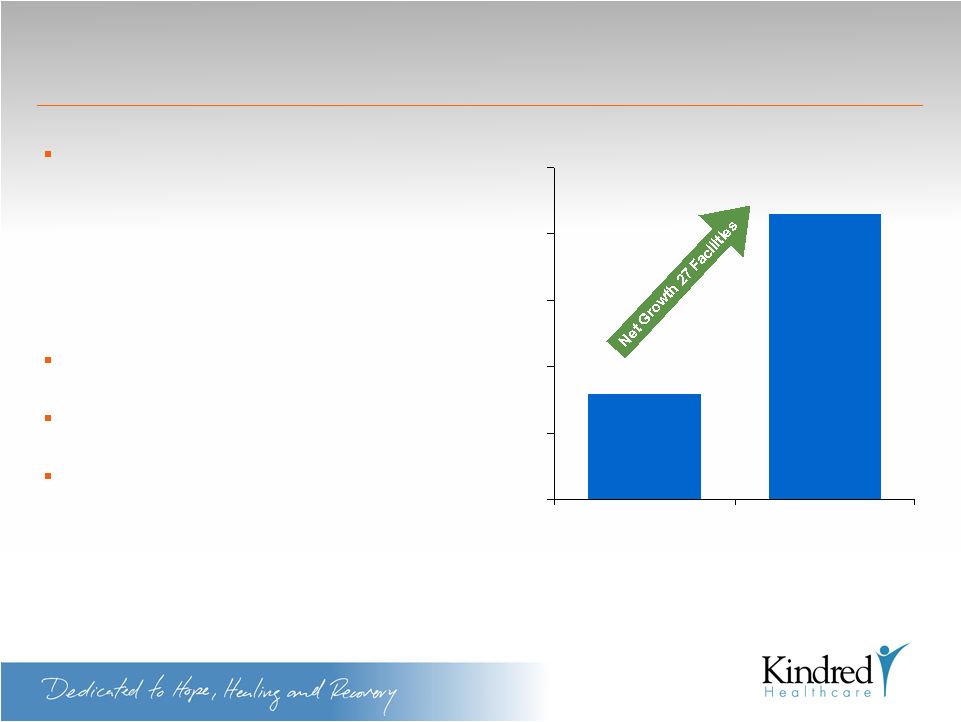 23 Growing Portfolio of Owned Real Estate 16 Facilities 43 Facilities 0 10 20 30 40 50 2006 Current Kindred Kindred has been focused on adding high quality real estate to balance sheet – Acquisitions – Development of state-of-the-art LTACHs and TCCs – Exercise of in-the-money purchase options Own 16 hospitals; 25 nursing centers and 2 assisted living facilities Combined company has total PP&E book value of approximately $1billion Kindred expects pro forma stabilized EBITDA (1) of approximately $100 million from owned real estate (1) Only includes Kindred facilities |
 24 Transaction Provides Significant EPS and Cash Flow Accretion Low End of Guidance Pro-Forma Impact Mid Point High End of Guidance 2011 EPS Impact $ % $0.50 $0.52 $0.55 34% 34% 34% 2011 EPS Guidance Prev (1) New (2) $1.45 $1.53 $1.60 $1.95 $2.05 $2.15 (1) Previous guidance shown is Kindred standalone guidance issued on 12/15/10. (2) 2011 guidance reflects the combined business as if the transaction closed on 1/1/11. |
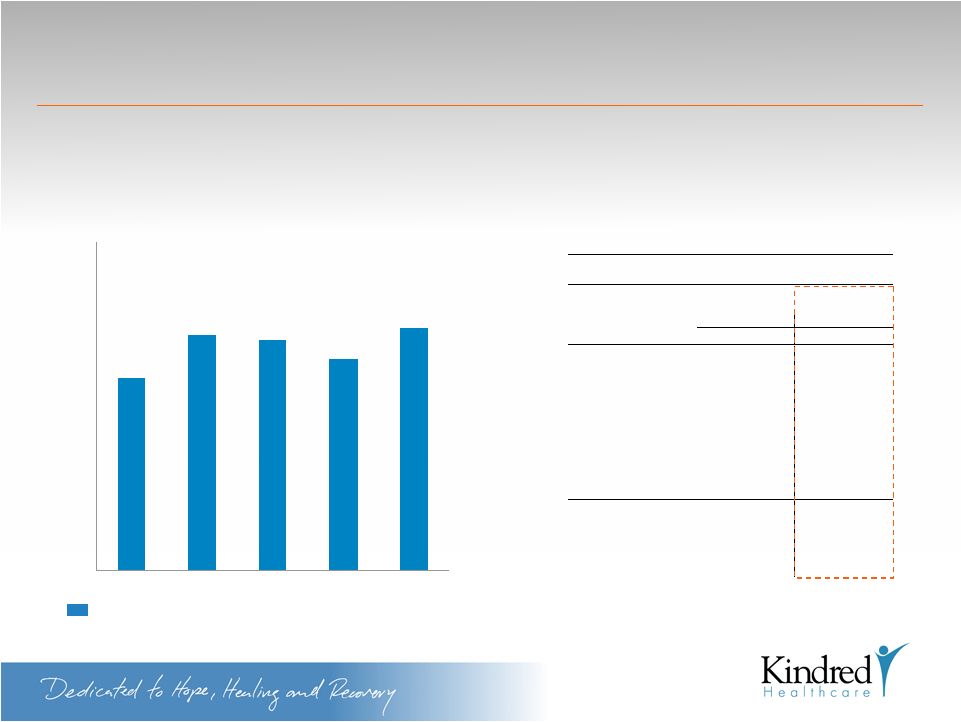 25 2011 Kindred Guidance Stand Alone (2) Pro Forma (3) ($MM) Low High Low High Revenue 4,800 4,800 6,200 6,200 EBITDA 265 275 470 487 (-) Interest 26 26 118 118 (-) Taxes 40 44 66 73 Cash Flow 199 205 286 296 Cash Flow Margin 4.1% 4.3% 4.6% 4.8% Strong Free Cash Flows and Ability to Delever 3.5 4.3 4.2 3.9 4.4 0.0 2.0 4.0 6.0 2006 2007 2008 2009 2010 Stand Alone Kindred (x) Historical Adjusted Debt / EBITDAR (1) (1) Calculated with 6.0x cap rate. (2) Per guidance midpoint, issued 12/15/2010. (3) 2011 guidance reflects the combined business as if the transaction closed on 1/1/2011. Cash Flow Profile Kindred has operated comfortably with a levered balance sheet Routine CapEx declines as a % of revenue, improving free cash flow profile |
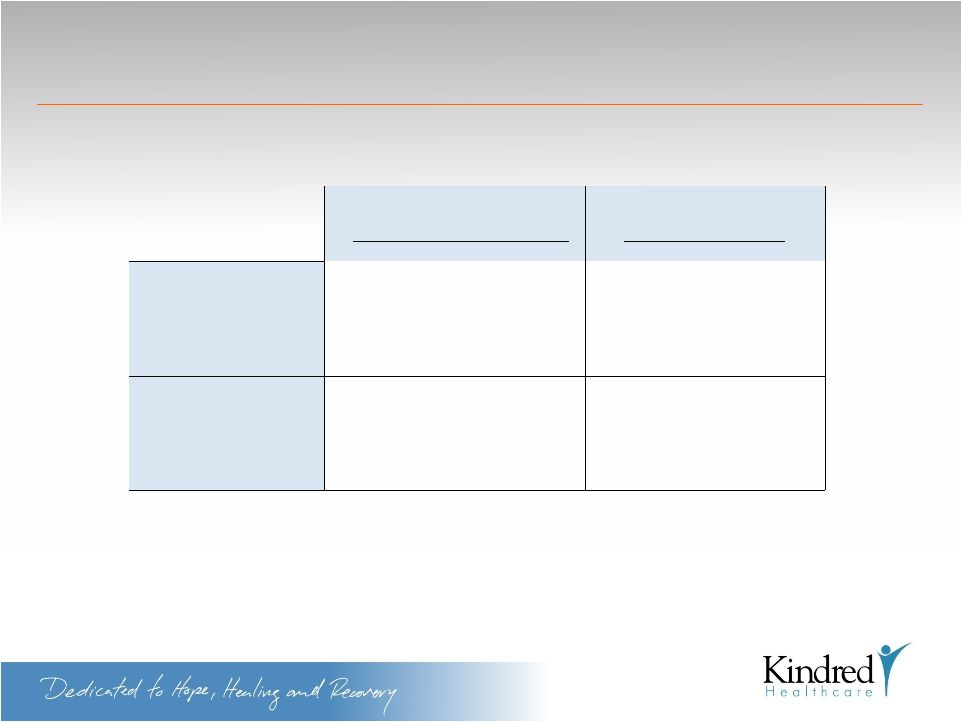
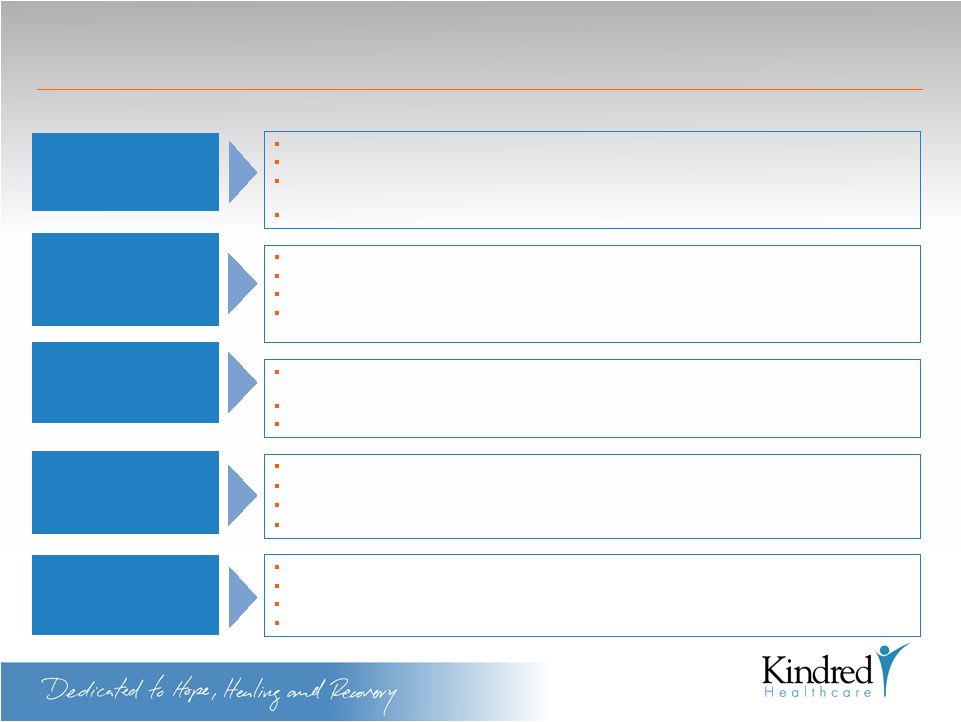 26 26 Strategic and Financial Rationale Unparalleled combined service offering No. 1 IRFs, LTACs and SNF Rehab management contracts; No. 4 standalone SNFs Expands relationships with acute care networks through RehabCare’s IRFs and JV relationships Long-term growth prospects supported by strong demographic trends Leading position in attractive growing markets Well Diversified Product Offering Experienced Management Team Well positioned to take advantage of the changing healthcare landscape Strong service offering in post-acute continuum strengthens cluster strategy Increases facility diversification, potentially creating future cluster locations Solidifies Kindred's leadership in improving patient care while decreasing healthcare spending Average industry tenor of the management team of 16 years in the industry and 10 years at Kindred Successfully grown revenue and EBITDA by 88% and 235% respectively since 2000 Recognized as the leading post-acute management team in the market Pro Forma Kindred will be the post-acute leader with an enhanced financial profile Focus on adding high quality real estate to the balance sheet Acquisitions, development of state-of-the-art LTACHs and Transitional Care Centers (TCCs) Book value of PP&E is approximately $1 billion Significant cash flow generated by assets that are unencumbered by leases Strong Asset Base Strong FCF & Ability to Delever Strong free cash flow and ability to delever Company is expected to delever on an adjusted basis to current levels by the end of 2011 Proven ability to successfully operate and grow free cash flow in a highly regulated environment Superior cash management through lean working capital |
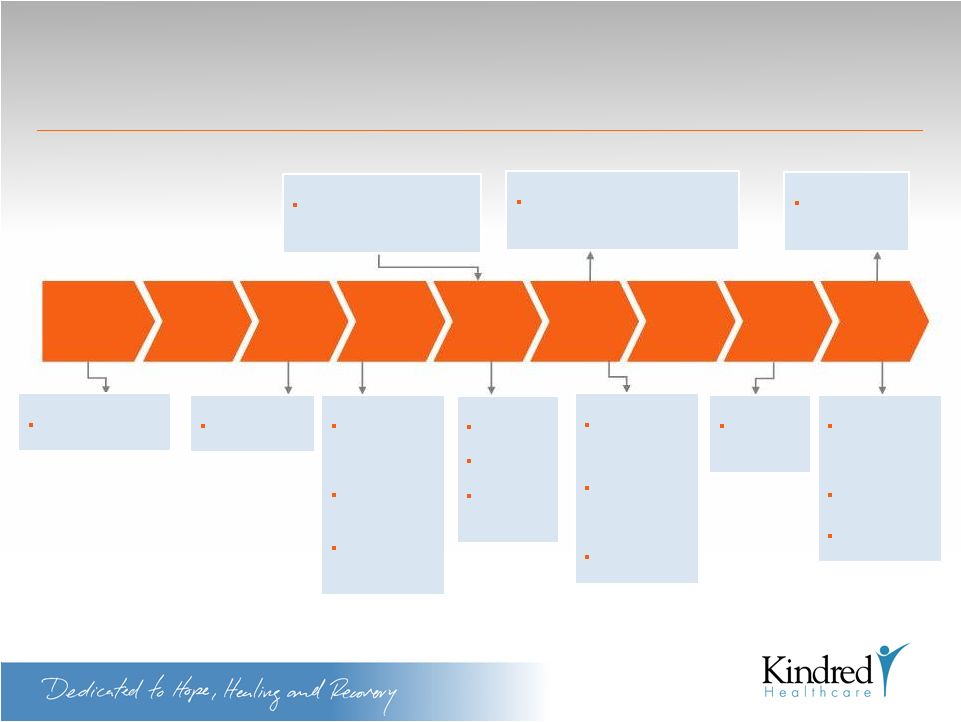 Kindred Has a History of Successfully Integrating Acquisitions 2002 2003 2005 2006 2007 2008 2009 2010 February 2006: Commonwealth Communities Holdings (6 Hospitals, 11 NCs and 4 ALFs) November 2010: Five LTACHs from Vista Healthcare 2004 July 2007: (Spin-off) Kindred and AmerisourceBergen combine their institutional pharmacy businesses to form Pharmerica Corp. 27 April 2002: Specialty Healthcare Services (6 hospitals) March 2005: Pharmacy Partners (2 pharmacies) April 2005: Skilled Care (2 pharmacies) November 2005: RXPERTS, Inc. (1 Pharmacy) August 2007: The Greens Post- Acute Rehabilitation Center Fountains On the Greens (Assisted Living Facility) October 2007: Professional Therapy Solutions April 2010: Stratford Commons (NC and ALF) September 2010: 3 Texas NCs November 2010: Signature Health Services November 2004: First Stop of Iowa (1 pharmacy) August 2006: EconoMed (1 Pharmacy) ValueScript (1 Pharmacy) PharmaStat (1 Pharmacy) July 2009: Acclaim Hospice |
 28 Track record for operational success based on commitment to quality, service excellence and a disciplined approach to the business Experienced management team, robust technology platform, processes and systems, and a demonstrated ability to adapt to change Growing businesses through disciplined organic development and acquisition strategies Strong cash flows with financial flexibility to finance acquisitions and development activities Well positioned to succeed in changing post-acute landscape Investment Considerations |
 29 Investor Presentation Kindred Healthcare, Inc. (NYSE: KND) March 16, 2011 |
 30 Appendix |
 31 Kindred Q4 ’10 Highlights • Fourth quarter consolidated revenues grew 6% to $1.1 billion • Diluted EPS of $0.50 grew 19% from Q4 ‘09 • Full year operating cash flows exceed $200 million for second consecutive year • Routine and development capital expenditures were fully funded through internal resources in both years • Hospitals report growth from last year’s Q4 • Recent acquisitions drove hospital revenues up 5% to $508 million • Operating income grew 3% to $96 million • Nursing and rehabilitation centers successfully transitioned to new Medicare payment system in Q4 • Revenue growth of 4% driven by increased acuity and clinical services and 4% growth in admissions • Division reports solid 13% growth in operating income • Peoplefirst Rehabilitation adds to customer base and adjusts to new Medicare rules in fourth quarter • Revenue growth of 21% primarily driven by new customers |
 32 RehabCare Q4 ’10 Highlights Excluding transaction related expenses in Q4 ’09, diluted EPS increased 86% year over year to $0.69 Hospital division improved EBITDA margin to 15.2% in the fourth quarter from 12.9% in the third quarter Impacted by regulatory changes, Skilled Nursing Rehabilitation Services division reported 5.8% operating earnings margin in the quarter, consistent with expectations Hospital Rehabilitation Services division delivered near record operating earnings margin of 20.6% Cash flow from operations of $104 million in 2010 allowed the Company to pay down debt by $66 million and lower debt to EBITDA ratio to 2.4 |
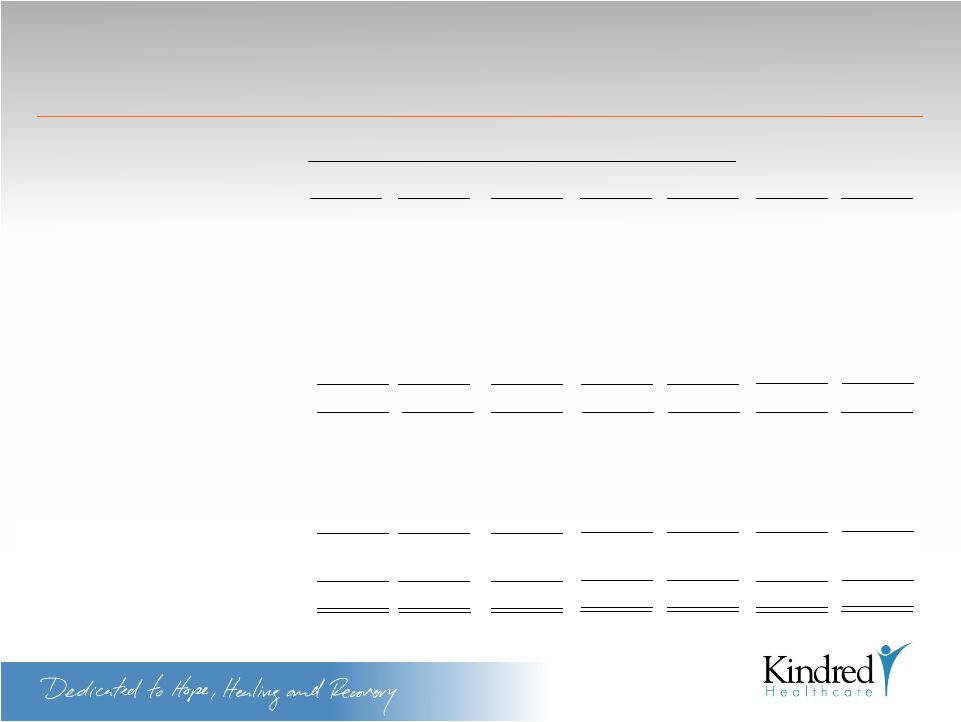
 Business Segment Buildup (1) Segment figures do not sum to totals due to eliminations / corporate expenses. RehabCare figures do not include discontinued operations (Miami IRF). Includes the full year benefit of all of the acquisitions Kindred has closed in 2010 ($157MM Revenue and $37MM EBITDA benefit) RehabCare acquisition significantly enhances scale in both the Skilled Nursing and Hospital Rehab businesses and adds to Kindred’s LTAC business Hospitals Rehabilitation Services Nursing Centers Total (1) Nursing Center Based Hospital Based Total 2010 Pro forma $MM Revenue (1) Kindred Healthcare 435 84 519 2,093 2,212 4,517 RehabCare 516 180 696 653 0 1,349 Total 951 264 1,215 2,746 2,212 5,866 EBITDAR (1) Kindred Healthcare 24 16 40 336 242 618 RehabCare 45 35 80 136 0 216 Total 69 51 120 472 242 834 % Margin 7.3% 19.3% 9.9% 17.2% 10.9% 14.2% EBITDA (1) Kindred Healthcare 18 16 34 176 44 254 RehabCare 45 35 80 86 0 166 Total 63 51 114 262 44 420 % Margin 6.6% 19.3% 9.4% 9.5% 2.0% 7.2% (+) Synergies 25 Pro Forma EBITDA 445 33 |
 34 Reconciliation of Non-GAAP Measures Year ended December 31, Operating income (loss): 2006 2007 2008 2009 Hospital division Nursing center division Rehabilitation division Pharmacy division Corporate: Overhead Insurance subsidiary Operating income Rent Depreciation and amortization Interest, net Income before income taxes Income taxes Income from cont. ops. $364 305 51 - (135) (6) (141) 579 (348) (126) (3) 102 39 $63 $ Millions 2010 Fourth Quarter 2009 $93 77 11 - (33) (2) (35) 146 (88) (32) - 26 9 $17 $96 87 9 - (33) (1) (34) 158 (90) (32) (3) 33 13 $20 Fourth Quarter 2010 $383 239 30 49 (157) (7) (164) 537 (289) (115) 1 134 53 $81 $365 295 34 18 (168) (7) (175) 537 (338) (118) (1) 80 37 $43 $346 322 38 - (133) (7) (140) 566 (339) (120) (8) 99 39 $60 $357 303 52 - (134) (3) (137) 575 (357) (122) (6) 90 34 $56 |
 35 Investor Presentation Kindred Healthcare, Inc. (NYSE: KND) March 16, 2011 |