 1 Investor Presentation Kindred Healthcare, Inc. (NYSE: KND) May 12, 2011 Filed pursuant to Rule 425 under the Securities Act of 1933 and deemed filed pursuant to Rule 14a-12 under the Securities Exchange Act of 1934 Filing Person: Kindred Healthcare, Inc. Commission File No.: 001-14057 Subject Company: RehabCare Group, Inc. Commission File No.: 001-14655 |
 2 Forward-Looking Statements Additional Information About this Transaction In connection with the pending transaction with RehabCare Group, Inc. (“RehabCare”), Kindred Healthcare, Inc. (“Kindred”) has filed with the Securities and Exchange Commission (the “SEC”) a Registration Statement on Form S-4 (commission file number 333-173050) that includes a joint proxy statement of Kindred and RehabCare that also constitutes a prospectus of Kindred. The registration statement was declared effective by the SEC on April 26, 2011. Kindred and RehabCare mailed the definitive joint proxy statement/prospectus to their respective stockholders on or about April 28, 2011. WE URGE INVESTORS AND SECURITY HOLDERS TO READ THE JOINT PROXY STATEMENT/PROSPECTUS REGARDING THE PENDING TRANSACTION BECAUSE IT CONTAINS IMPORTANT INFORMATION. You may obtain a free proxy statement/prospectus and the other documents filed by Kindred and RehabCare with the SEC may also be obtained for free by accessing Kindred’s website at www.kindredhealthcare.com and clicking on the “Investors” link and then clicking on the link for “SEC Filings” or by accessing RehabCare’s website at www.rehabcare.com and clicking on the “Investor Information” link and then clicking on the link for “SEC Filings”. Participants in this Transaction Kindred, RehabCare and their respective directors, executive officers and certain other members of management and employees may be soliciting proxies from their respective stockholders in favor of the pending transaction. You can find information about Kindred’s executive officers and directors in the joint proxy statement/prospectus. You can find information about RehabCare’s executive officers and directors in its amended Form 10-K filed with the SEC on April 28, 2011. You can obtain a free copy of these documents from Kindred or RehabCare, respectively, using the contact information above. Forward-Looking Statements Information set forth in this presentation contains forward-looking statements, which involve a number of risks and uncertainties. Kindred and RehabCare caution readers that any forward-looking information is not a guarantee of future performance and that actual results could differ materially from those contained in the forward-looking information. Such forward-looking statements include, but are not limited to, statements about the benefits of the business combination transaction involving Kindred and RehabCare, including future financial and operating results, the combined company’s plans, objectives, expectations and intentions and other statements that are not historical facts. The following factors, among others, could cause actual results to differ from those set forth in the forward-looking statements: (a) the receipt of all required licensure and regulatory approvals and the satisfaction of the closing conditions to the acquisition of RehabCare by Kindred, including approval of the pending transaction by the stockholders of the respective companies, and Kindred’s ability to complete the required financing as contemplated by the financing commitment; (b) Kindred’s ability to integrate the operations of the acquired hospitals and rehabilitation services operations and realize the anticipated revenues, economies of scale, cost synergies and productivity gains in connection with the RehabCare acquisition and any other acquisitions that may be undertaken during 2011, as and when planned, including the potential for unanticipated issues, expenses and liabilities associated with those acquisitions and the risk that RehabCare fails to meet its expected financial and operating targets; (c) the potential for diversion of management time and resources in seeking to complete the RehabCare acquisition and integrate its operations; (d) the potential failure to retain key employees of RehabCare; (e) the impact of Kindred’s significantly increased levels of indebtedness as a result of the RehabCare acquisition on Kindred’s funding costs, operating flexibility and ability to fund ongoing operations with additional borrowings, particularly in light of ongoing volatility in the credit and capital markets; (f) the potential for dilution to Kindred stockholders as a result of the RehabCare acquisition; and (g) the ability of Kindred to operate pursuant to the terms of its debt obligations, including Kindred’s obligations under financings undertaken to complete the RehabCare acquisition, and the ability of Kindred to operate pursuant to its master lease agreements with Ventas, Inc. (NYSE:VTR). Additional factors that may affect future results are contained in Kindred’s and RehabCare’s filings with the SEC, obligation to update and revise statements contained in these materials based on new information or otherwise. which are available at the SEC’s web site at Many of these factors are beyond the control of Kindred or RehabCare. Kindred and RehabCare disclaim any copy of the joint proxy statement/prospectus and other related documents filed by Kindred and RehabCare with the SEC at the SEC’s website at The joint www.sec.gov. www.sec.gov. |
 3 Kindred Overview |
 4 706 (3) sites of service, 313 facilities in 40 states 56,700 (3) dedicated employees, making Kindred a top-200 private employer in the U.S. (4) 34,400 (3) patients and residents per day $4.5 billion (2) consolidated revenues Largest Diversified Post-Acute Provider in the United States (1) (1) Ranking based on revenues. (2) Revenues for the twelve months ended March 31, 2011. (3) As of March 31, 2011. (4) Ranking provided by TMP, Inc. |
 5 5 $2.0 billion revenues HOSPITAL Long-term Acute Care Hospitals •Largest operator in U.S. •89 hospitals with 6,889 licensed beds $2.2 billion revenues •Third largest nursing center operator in U.S. •224 nursing centers with 27,252 licensed beds •6 assisted living facilities with 413 licensed beds NURSING CENTER Nursing and Rehabilitation Centers $530 million revenues •Second largest contract therapy company in U.S. •393 external locations served through 5,970 therapists and 10,500 total employees REHABILITATION Peoplefirst Rehabilitation Services (1) Revenues for the twelve months ended March 31, 2011 (divisional revenues before intercompany eliminations). (2) Ranking based on revenues. (3) As of March 31, 2011. Kindred’s Market Leading Businesses (2) (2) (2) (3) (3) (3) (3) (1) (1) (1) |
 6 Provide superior clinical outcomes and quality care with an approach which is patient-centered, disciplined and transparent Lower cost by reducing lengths of stay in acute care hospitals and transition patients home at the highest possible level of function Reduce rehospitalization through our integrated and interdisciplinary care management teams and protocols Kindred’s Value Proposition and Our “Continue The Care” Campaign |
 7 |
 8 Investment Rationale Each year, nearly 9 million people – 23,000 a day – are discharged from short-term acute care hospitals that require some form of post-acute care As the largest diversified post-acute provider, Kindred is uniquely positioned to grow and succeed in what will be an increasingly integrated healthcare delivery system Kindred has a track record of providing quality, cost-effective care, operational excellence and consistent levels of free cash flows Our platform and infrastructure, together with our successful organic development and opportunistic M&A strategy, offer the potential for creating significant value for shareholders |
 9 RehabCare Transaction Overview |
 10 RehabCare Group Acquisition Transaction Update Transaction has received all material Federal government approvals – Joint proxy statement was made effective April 26 th Commitments have been obtained for $1.35 billion of senior secured financing – $550.0 million unsecured notes offering remaining Kindred and RehabCare shareholder meetings to approve the merger have been scheduled for late May Integration and synergy plans progressing well - high degree of enthusiasm at both companies for the combination of our respective businesses Both companies' strong performances in Q1 provides substantial momentum as we approach the closing |
 11 ~$35 / share total ($26 / share in cash; ~$9 / share in Kindred stock) (1) $1.3 billion total consideration, including assumption of net debt Transaction Overview Consideration Accretion Synergies Kindred and RehabCare have announced a transaction whereby Kindred will acquire RehabCare for ~$35/share Transaction Substantially accretive to Kindred’s earnings and operating cash flows $40 million in identified annual cost and operating synergies Full run-rate achieved within two years ($25MM achieved first year) – Excluding one time costs Committed financing from J.P. Morgan, Morgan Stanley and Citi Financing Expected Close By June 30, 2011 1) Based on a fixed exchange ratio. |
 12 Transaction Overview J.P. Morgan, Morgan Stanley and Citi have committed $1.9Bn in debt financing Key Capital Considerations Maintain strong balance sheet, liquidity and financial flexibility (approximately $350MM undrawn revolver capacity at close) Sources and Uses (1) ($MM) Sources % of Total $600MM ABL Revolving Credit Facility $264 15% Term Loan B 700 39% Less original issue discount on Term Loan B (7) (1%) Senior Unsecured Notes 550 31% Equity Consideration (3) 288 16% Total Sources 1,795 100% Uses % of Total Purchase RehabCare Equity (~$35/share) 951 53% Retire RehabCare Debt 369 21% Retire Kindred Debt 350 19% Other 125 7% Total Uses 1,795 100% Pro-Forma Capitalization (1) ($MM) 2011E (2) New Borrowings 1,600 Total Debt 1,600 Revenue EBITDA (4) Rent Expense EBITDAR (4) Total Debt / EBITDA Adjusted Debt (5) / EBITDAR 1) Sources and Uses is as of 3/31/11. Pro-Forma Capitalization is based on borrowings expected at closing. Figures may not add due to rounding. 2) 2010PF figures reflect full year run rate of 2010 Kindred acquisitions ($157MM in revenue, $44MM in EBITDAR, $7MM in rent and $37MM of EBITDA benefit) and RehabCare. RehabCare 2010 results do not include the results of discontinued operations (inpatient rehabilitation facility in Miami). 2011 figures display low and high end of guidance which reflects the combined business as if the transaction closed on 1/1/11. 3) Based on a fixed exchange ratio. 4) 2010PF and 2011E includes $25MM of run rate synergies. 5) Calculated with 6.0x cap rate. 6,200 6,200 470 487 422 422 892 909 3.4x 3.3x 4.6x 4.5x 5,846 445 414 859 3.6x 4.8x 1,600 1,600 2010PF (2) |
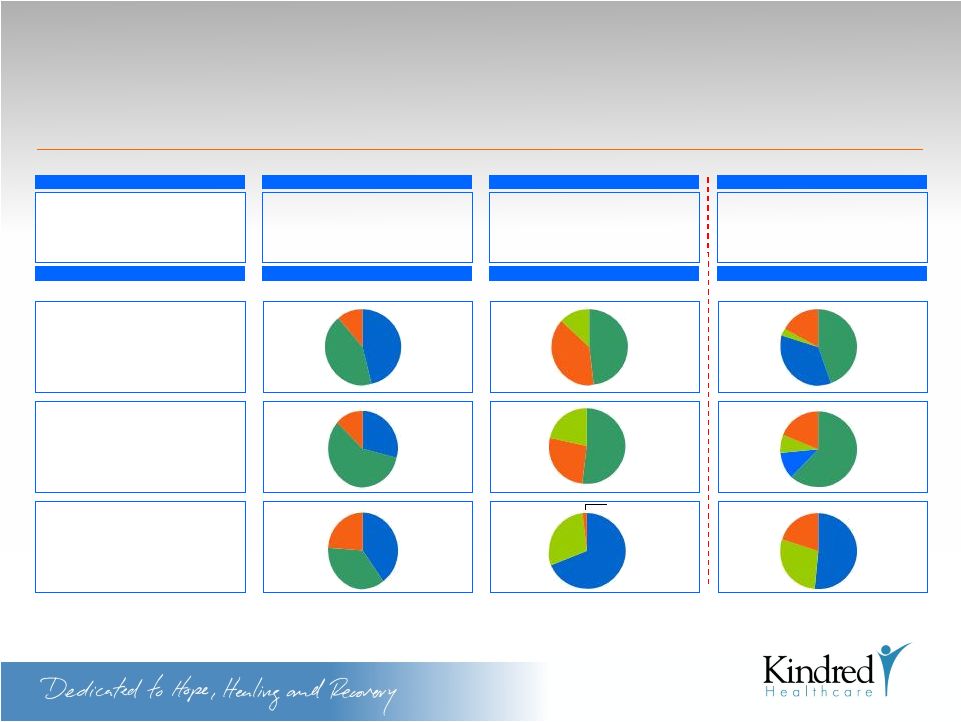 13 Kindred and RehabCare will be the Premier Rehabilitation and Post-Acute Provider in the United States (1) RehabCare states include LTAC and IRF locations. Beds include LTACs and freestanding IRFs. Kindred facilities include owned, leased or managed LTACHs, SNFs and ALFs. RehabCare facilities include owned and leased LTACHs. (2) Includes the full year benefit of all of the acquisitions Kindred has closed in 2010 ($157MM Revenue and $37MM EBITDA benefit). RehabCare 2010 results includes the results of discontinued operations (inpatient rehabilitation facility in Miami). Figures may not add due to rounding. (3) Includes $25MM of run rate synergies. (4) Revenue excludes the effect of Kindred intercompany eliminations. EBITDA includes intercompany eliminations in Kindred segment EBITDA. Metrics Kindred Kindred + RehabCare Focus SNF, LTAC and Contract Rehab SNF, LTAC and Contract Rehab Scale (1) • States • Facilities • Beds • 2010 Revenue (Pro Forma) • 2010 EBITDA (Pro Forma) 40 322 34,792 $4,517MM (2) $254MM (2) RehabCare Contract Rehab and LTAC 42 34 1,788 $1,349MM $166MM 46 356 36,580 $5,866MM (2) $445MM (2)(3) Payor Mix (’09) Business Mix: EBITDA (’10) (2) Contract Rehab SNF LTAC Medicaid Medicare Commercial LTAC SRS LTAC SRS HRS Medicaid 2% Medicare LTAC SNF HRS LTAC SNF HRS Commercial Medicaid Medicare Business Mix: Revenue (’10) (2)(4) SNF LTAC HRS Contract Rehab Contract Rehab Contract Rehab Commercial 47% 42% 11% 39% 48% 13% 45% 35% 3% 17% 29% 13% 58% 52% 27% 21% 11% 8% 62% 19% 40% 24% 36% 69% 29% 51% 20% 29% |
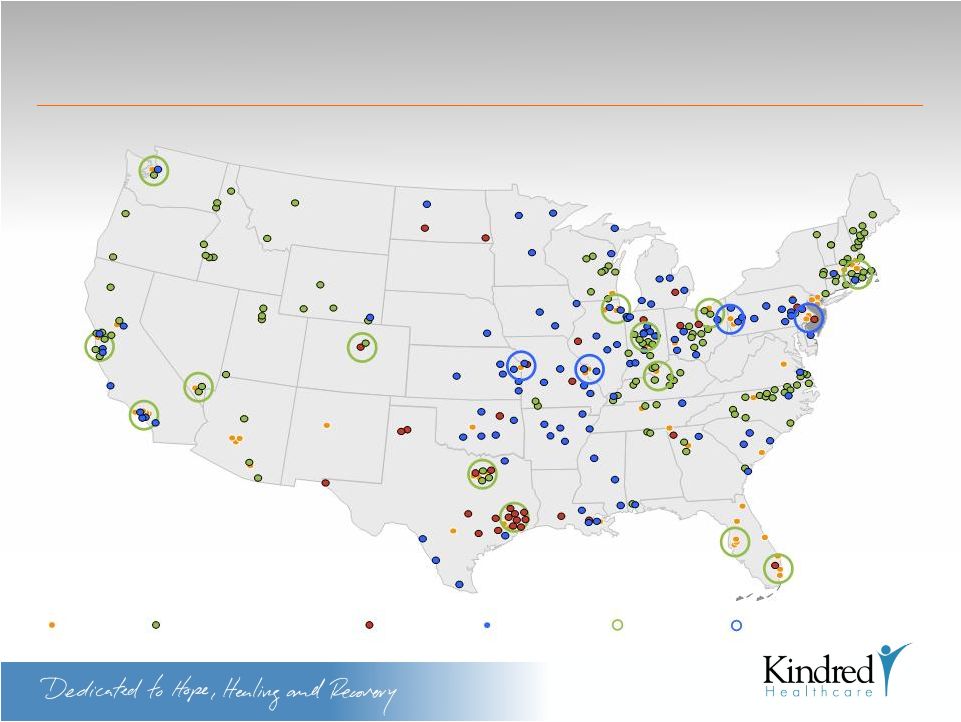 14 Kindred and RehabCare Combined Presence Kindred Hospitals Kindred Nursing and Rehabilitation Centers RehabCare Hospitals Acute Rehabilitation Units Existing Cluster Market Potential New Cluster Market Transaction enhances Kindred’s Cluster Market Strategy |
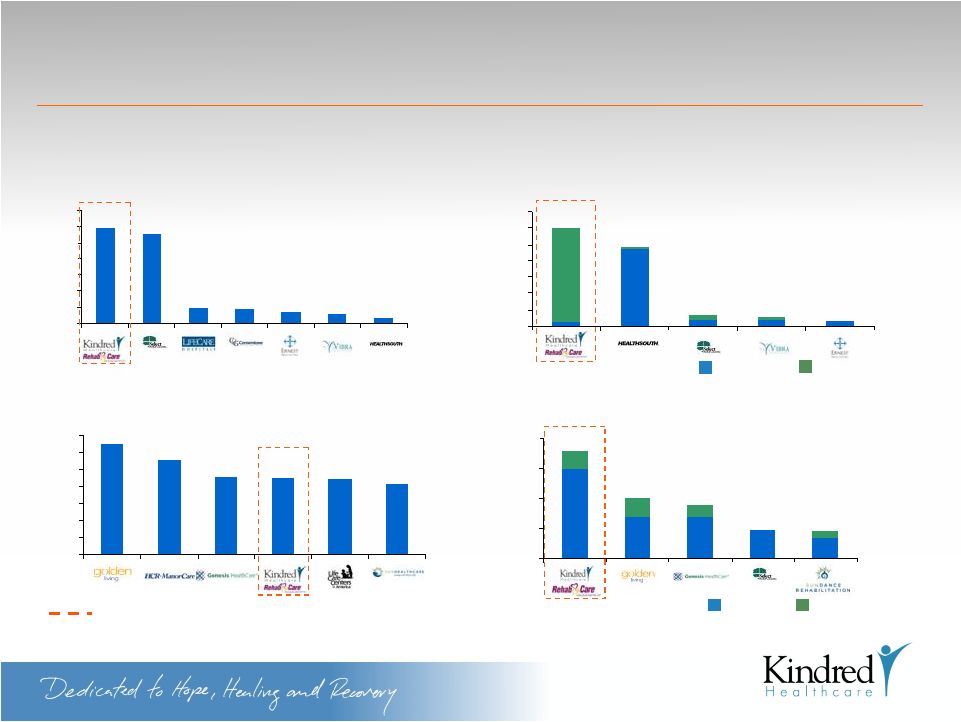 15 Leading Position in Attractive Growing Businesses (1) Includes 1,112 facilities from RehabCare and 696 facilities from Kindred. Multiple earnings streams, multiple avenues for growth PF Kindred 116 3 5 94 8 8 7 5 2 0 20 40 60 80 100 120 140 13 10 97 121 Freestanding Hospital Based 207 324 277 227 226 223 0 50 100 150 200 250 300 350 Number of Facilities 315 300 200 108 1,808 1,000 900 471 450 342 471 700 700 1,493 0 500 1,000 1,500 2,000 Third Party Affiliated (1) 12 6 15 18 19 111 118 0 20 40 60 80 100 120 140 Number of Facilities #1 Operator of Hospital Based and Freestanding IRFs #4 Operator of Skilled Nursing and Rehab Centers #1 Contract Rehab Manager #1 Operator of Long-Term Acute Care Hospitals |
 16 Strategic Rationale |
 17 17 Strategic and Financial Rationale Unparalleled combined service offering No. 1 IRFs, LTACs and SNF Rehab management contracts; No. 4 standalone SNFs Expands relationships with acute care networks through RehabCare’s IRFs and JV relationships Long-term growth prospects supported by strong demographic trends Leading position in attractive growing markets Well Diversified Product Offering Experienced Management Team Well positioned to take advantage of the changing healthcare landscape Strong service offering in post-acute continuum strengthens cluster strategy Increases facility diversification, potentially creating future cluster locations Solidifies Kindred's leadership in improving patient care while decreasing healthcare spending Average industry tenor of the management team of 16 years and 10 years at Kindred Successfully grown revenue and EBITDA by 88% and 235% respectively since 2000 Recognized as the leading post-acute management team in the market Pro Forma Kindred will be the post-acute leader with an enhanced financial profile Focus on adding high quality real estate to the balance sheet Acquisitions, development of state-of-the-art LTACHs and Transitional Care Centers (TCCs) Book value of PP&E is approximately $1 billion Significant cash flow generated by assets that are unencumbered by leases Strong Asset Base Strong FCF Strong free cash flow and ability to delever Proven ability to successfully operate and grow free cash flow in a highly regulated environment Superior cash management through lean working capital |
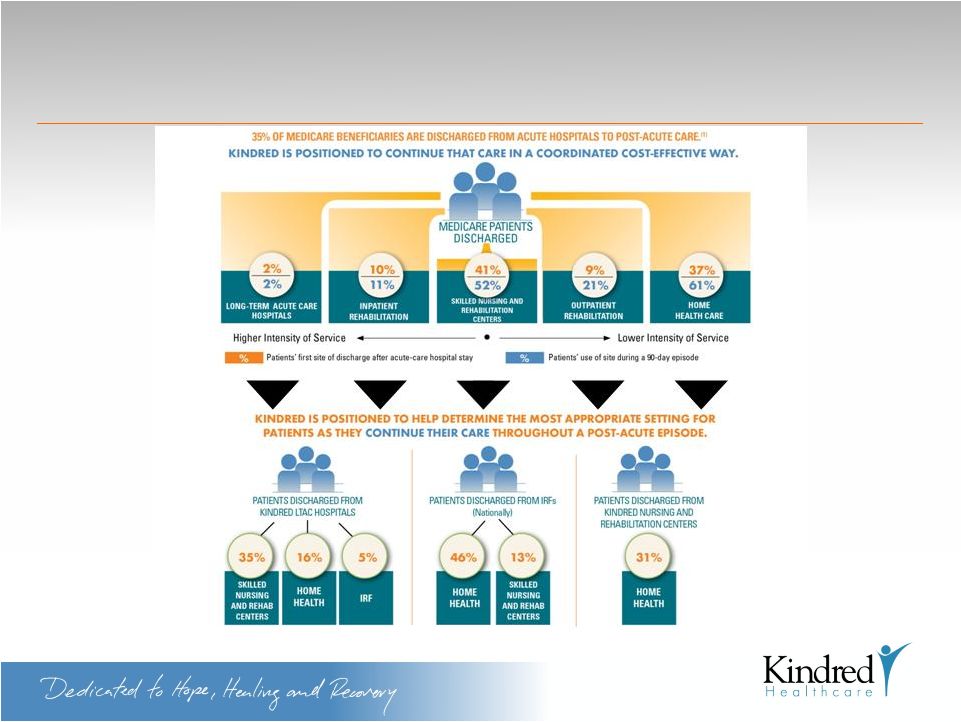 18 Rapidly Changing Post-Acute Market Multiple Patient Discharge Destinations SOURCE: RTI, 2009: Examining Post-Acute Care Relationships in an Integrated Hospital System |
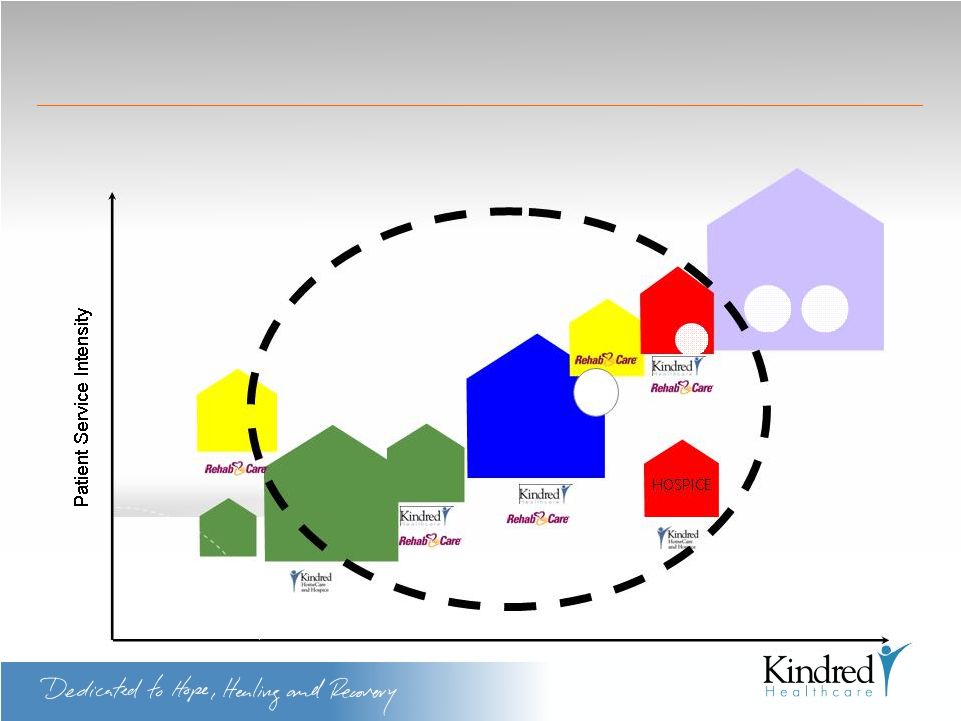 19 Positioned to Take Advantage of Changing Healthcare Landscape Uniquely Positioned For Bundled Or Episodic Payment Environment HOME SKILLED NURSING FACILITIES HOSPICE HOME HEALTH CARE OUTPATIENT REHAB ASSISTED LIVING ACUTE CARE HOSPITALS TRANS TRANS CARE CARE ICU ICU IN-PATIENT REHAB LTACs FREESTANDING/ HIH Patient Illness Severity SAU SAU ADULT DAY CARE TCC & TCU “Continue The Care” |
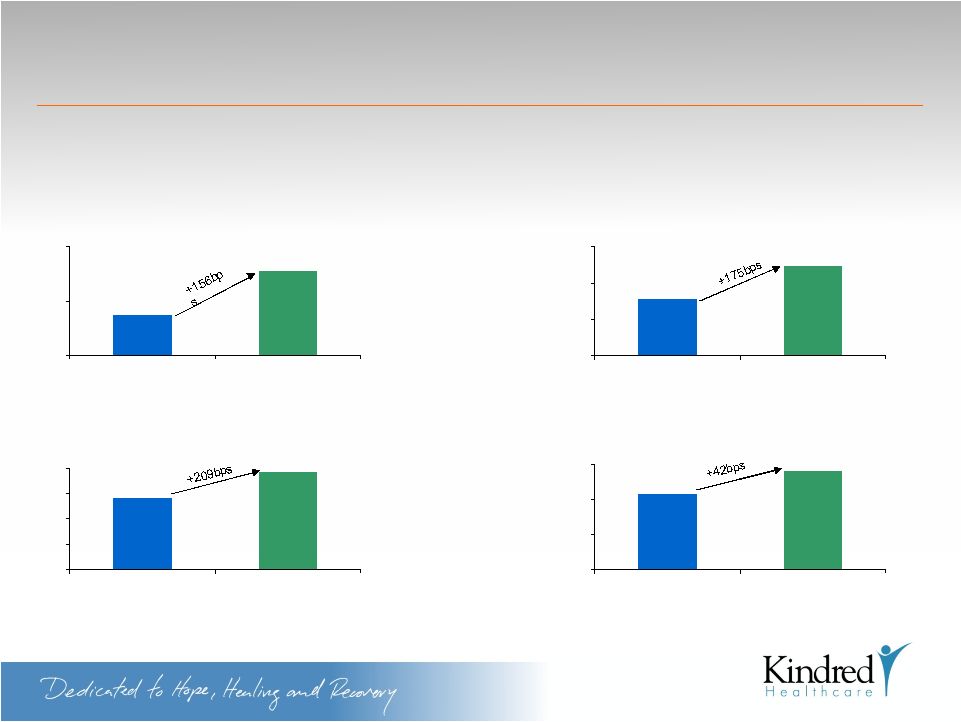 20 Transaction Enhances Financial Profile (1) Standalone Kindred growth analysis compares 2011 guidance issued on 12/15/10 relative to 2010 standalone performance pro forma full year run rate for all of Kindred’s 2010 acquisitions; Pro forma Kindred growth analysis compares pro forma 2011 guidance relative to 2010 pro forma results, in each case assuming the RehabCare acquisition occurred on the first day of each respective year and includes first year run rate synergies in both 2010 and 2011 figures. 2011 margin figures per guidance midpoint and compares standalone 2011 guidance issued on 12/15/10 relative to pro forma 2011 guidance. 2011 pro forma guidance reflects the combined business as if the transaction closed on 1/1/11 and includes first year run rate synergies. EBITDAR Growth (1) 2010 – 2011 3.5 5.1 2.0 4.0 6.0 Standalone Kindred Pro Forma Kindred (%) EBITDA Growth (1) 2010 – 2011 6.1 7.9 3.0 5.0 7.0 9.0 Standalone Kindred Pro Forma Kindred (%) EBITDA Margin (1) 2011 5.6 7.7 0.0 2.0 4.0 6.0 8.0 Standalone Kindred Pro Forma Kindred (%) Net Income Margin (1) 2011 1.3 1.7 0.0 0.6 1.2 1.8 Standalone Kindred Pro Forma Kindred (%) Enhances Kindred’s growth and operating margin profiles |
 21 Transaction Reduces Rent and Fixed Charge Burden Declining Rent Burden Enhanced Margin Profile RehabCare operates a less capital-intensive business model, driving higher pro forma returns on assets (1) Midpoint of guidance issued 12/15/10. (2) Midpoint of pro forma guidance which reflects combined business as if the transaction closed 1/1/11. 2011 Operating Leverage ($MM) Kindred (1) Pro Forma (2) Revenue $4,800 $6,200 EBITDAR 640 899 % Margin 13.3% 14.5% Rent 370 423 % Margin 7.7% 6.8% EBITDA 270 476 % Margin 5.6% 7.7% D&A 140 185 % Margin 2.9% 3.0% EBIT 130 291 % Margin 2.7% 4.7% |
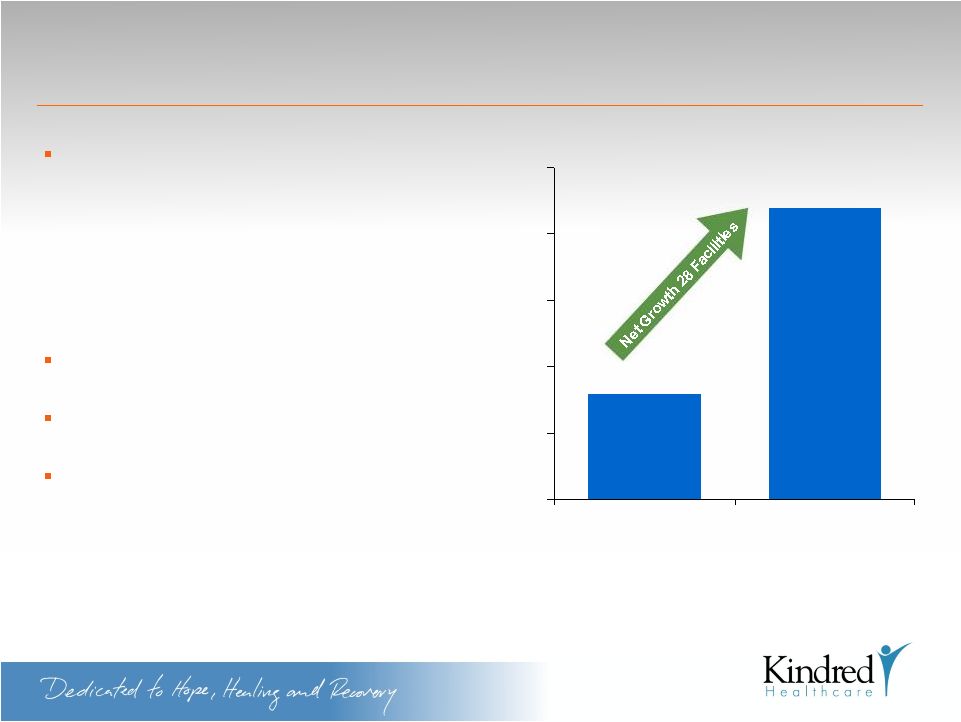 22 Growing Portfolio of Owned Real Estate 16 Facilities 44 Facilities 0 10 20 30 40 50 2006 Current Kindred Kindred has been focused on adding high quality real estate to balance sheet – Acquisitions – Development of state-of-the-art LTACHs and TCCs – Exercise of in-the-money purchase options Own 17 hospitals; 25 nursing centers and 2 assisted living facilities Combined company has total PP&E book value of approximately $1billion Kindred expects pro forma stabilized EBITDA (1) of approximately $111 million from owned real estate (1) Only includes Kindred facilities |
 23 Transaction Provides Significant EPS and Cash Flow Accretion Low End of Guidance Pro-Forma Impact Mid Point High End of Guidance 2011 EPS Pro-Forma Impact $ % $0.50 $0.52 $0.55 34% 34% 34% 2011 EPS Prev (1) Pro-Forma (2) $1.45 $1.53 $1.60 $1.95 $2.05 $2.15 (1) Previous guidance shown is Kindred standalone guidance issued on 12/15/10. (2) 2011 guidance reflects the combined business as if the transaction closed on 1/1/11. |
 24 Strong Free Cash Flows 3.5 4.3 4.2 3.9 4.4 0.0 2.0 4.0 6.0 2006 2007 2008 2009 2010 Stand Alone Kindred (x) Historical Adjusted Debt / EBITDAR (1) (1) Calculated with 6.0x cap rate. (2) Per guidance midpoint, issued 12/15/2010. (3) 2011 guidance reflects the combined business as if the transaction closed on 1/1/2011. Cash Flow Profile Kindred has operated comfortably with a levered balance sheet Routine CapEx declines as a % of revenue, improving free cash flow profile 2011 Kindred Guidance Stand Alone (2) Pro Forma (3) ($MM) Low High Low High Revenue 4,800 4,800 6,200 6,200 EBITDA 265 275 470 487 (-) Interest 26 26 118 118 (-) Taxes 40 44 66 73 Cash Flow 199 205 286 296 Cash Flow Margin 4.1% 4.3% 4.6% 4.8% |
 25 Kindred Has a History of Successfully Integrating Acquisitions April 2002: Specialty Healthcare Services (6 hospitals) March 2005: Pharmacy Partners (2 pharmacies) April 2005: Skilled Care (2 pharmacies) November 2005: RXPERTS, Inc. (1 Pharmacy) August 2007: The Greens Post- Acute Rehabilitation Center Fountains On the Greens (Assisted Living Facility) October 2007: Professional Therapy Solutions 2002 2003 2005 2006 2007 2008 2009 2010 February 2006: Commonwealth Communities Holdings (6 Hospitals, 11 NCs and 4 ALFs) November 2010: Five LTACHs from Vista Healthcare April 2010: Stratford Commons (NC and ALF) September 2010: 3 Texas NCs November 2010: Signature Health Services 2004 July 2007: (Spin-off) Kindred and AmerisourceBergen combine their institutional pharmacy businesses to form Pharmerica Corp. November 2004: First Stop of Iowa (1 pharmacy) August 2006: EconoMed (1 Pharmacy) ValueScript (1 Pharmacy) PharmaStat (1 Pharmacy) July 2009: Acclaim Hospice |
 26 Reimbursement Update |
 27 Kindred Medicare Reimbursement Update On April 19, CMS proposed FY 2012 LTAC PPS rates that CMS projected would increase payment rates to LTACs by 1.9%. The increase would take effect October 1, 2011. Kindred estimates that the impact of these proposed changes would result in an approximate 0.5% increase in payments to the Company's hospitals CMS issued a proposed rule on April 28 regarding Medicare payments for skilled nursing centers for FY 2012. The rule proposed two options for updating payment rates: Option one would address potential overpayments related to the transition to the new RUGs IV system by reducing payments by a projected 11.3% Under option two, nursing centers would receive a 1.5% rate increase, effective October 1, 2011, while CMS continues to collect more data regarding the implementation of the RUGs IV system CMS further proposed to define group therapy as therapy sessions with four patients who are performing similar therapy activities |
 28 Kindred Medicare Reimbursement Update (cont.) The proposed skilled nursing rule offers two alternatives for a potential parity adjustment, one of which recognizes that three months of data may be insufficient to arrive at an accurate calculation Kindred strongly supports an approach that ensures adequate data before arriving at definitive conclusions on appropriate rates Kindred has experienced a 4.2% decline in Medicare average length of stay from 2008-2010 and a 2.4% decline in the first quarter of 2011 compared to the same period last year |
 29 % Change in Key Measures, 2008 - 2010 11% 9% 7% -4% -5% 0% 5% 10% 15% 2008 2010 Medicare Rate PPD Operating Cost PPD Medicare Case Mix Index Medicare Length of Stay (days) Kindred SNF cost and case mix severity increases have kept pace with Medicare rate increases. Significant declines in Length of Stay restrain both margin expansion and Medicare spending under the PPS system. Nursing and Rehabilitation Centers |
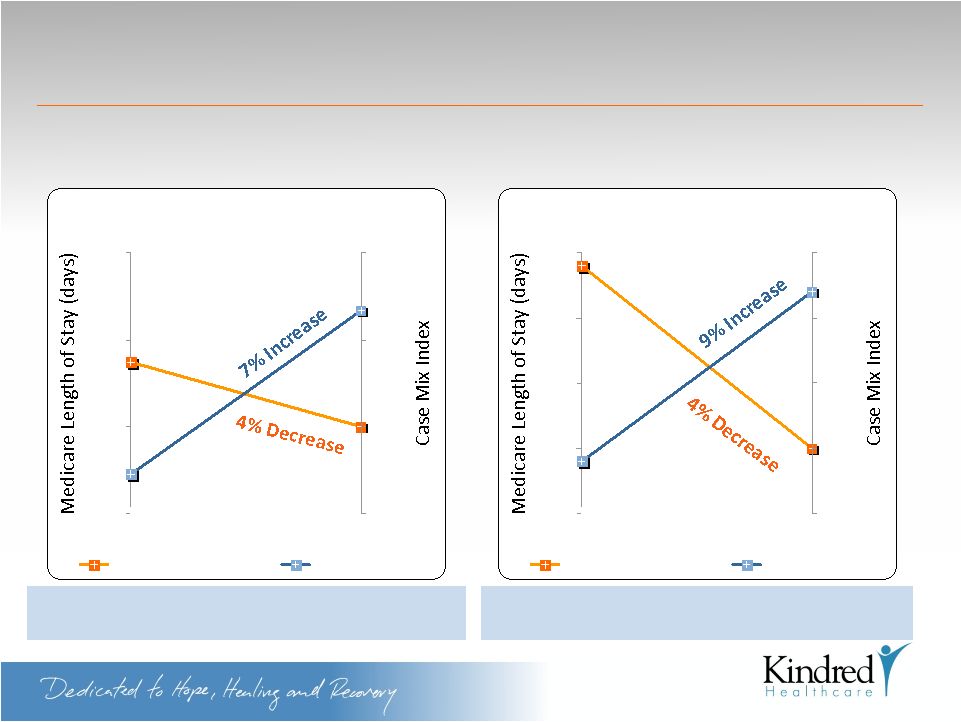 30 9% increase in Medicare CMI from 2.83 to 3.09 4% Decrease in Medicare LOS from 33.9 to 32.5 days 32.0 34.0 36.0 38.0 2008 2010 2.65 2.75 2.85 2.95 Length of Stay (days) Case Mix Index 32.0 32.5 33.0 33.5 34.0 Sep-10 Dec-10 2.75 2.85 2.95 3.05 3.15 Length of Stay (days) Case Mix Index 7% increase in Medicare CMI from 2.70 to 2.88 4% Decrease in Medicare LOS from 35.5 to 34.0 days Kindred SNF Medicare Case Mix Severity has increased significantly and Length of Stay has declined. (2008 – 2010 & 4th Quarter 2010) Nursing and Rehabilitation Centers (cont.) |
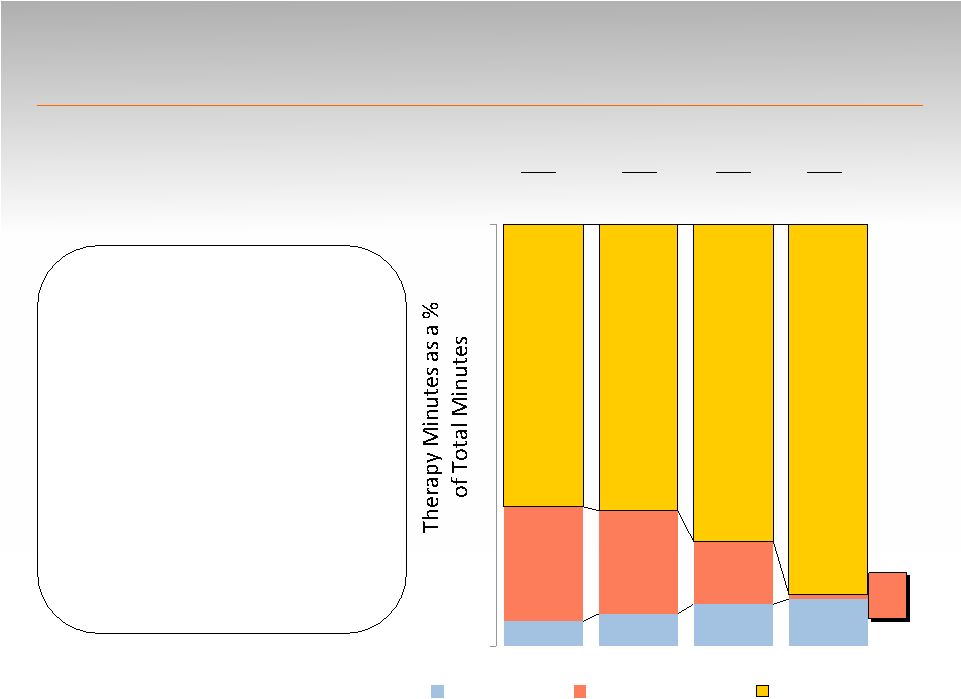 6% 8% 10% 11% 27% 24% 15% 1% 67% 68% 75% 88% 0% 100% Total Group % Total Concurrent % Total Individual % 2010 Medicare Part A Therapy Minutes / RUG Day Q1 Q2 Q3 Q4 69 70 71 71 Kindred maintained the same level and intensity of Rehab Services for patients pre and post RUG IV, primarily through providing more individual therapy (at a higher cost) and increasing therapist time spent with patients (versus “administrative” time). Nursing and Rehabilitation Centers (cont.) |
 32 Financial Update |
 33 Kindred Financial Update Q1 2011 Company reported strong results of $0.55 per diluted share Reported results included charges of $0.10 per diluted share, primarily related to pending RehabCare transaction Excluding certain charges in both periods, diluted earnings per share rose 48% from Q1 of 2010 Consolidated revenues grew 9% to $1.2 billion Each operating division reported revenue growth as compared to Q1 of 2010 First quarter operating income for the hospital division grew 14% to $108 million Strong admissions and higher Medicare and managed care volumes drove nursing center growth in operating income of 24% to $87 million |
 34 Kindred Financial Update Q1 2011 (cont.) Peoplefirst Rehabilitation revenues grew by 21% to $145 million Division reported $15 million in operating income Operating cash flows grew to $46 million for the quarter, up $60 million from last year's first quarter Accounts receivables days outstanding declined to 49.8 days at March 2011, down from 54.4 days at March 2010 Long-term debt declined by $15 million during the quarter |
 35 RehabCare Group Financial Update Q1 2011 RehabCare net earnings per diluted share increased 20.3% year over year to $0.71 $0.12 per diluted share of transaction related expenses were included in the Q1 2011 results Hospital division EBITDA margin improved to 17.6% from 12.9% a year ago Skilled Nursing Rehabilitation Services division operating earnings margin in line with expectations Hospital Rehabilitation Services division delivered operating earnings margin of 18.7% Cash flow from operations allows RehabCare to pay down debt by $18 million in the quarter |
 36 Investment Considerations |
 37 Track record for operational success based on commitment to quality, service excellence and a disciplined approach to the business Experienced management team, robust technology platform, processes and systems, and a demonstrated ability to adapt to change Growing businesses through disciplined organic development and acquisition strategies Strong cash flows with financial flexibility to finance acquisitions and development activities Well positioned to succeed in changing post-acute landscape Investment Considerations |
 38 Investor Presentation Kindred Healthcare, Inc. (NYSE: KND) May 12, 2011 |
 39 Appendix |
 40 Agency Ratings Corporate Family Term Loan B Moody’s Investors Service (1) B1 Ba3 Standard and Poor’s (2) B+ B+ (1) Release dated March 14, 2011 (2) Release dated March 11, 2011 |
 41 Reconciliation of Non-GAAP Measures Year ended December 31, Operating income (loss): 2006 2007 2008 2009 Hospital division Nursing center division Rehabilitation division Pharmacy division Corporate: Overhead Insurance subsidiary Transaction costs Operating income Rent Depreciation and amortization Interest, net Income before income taxes Income taxes Income from cont. ops. $ Millions 2010 First Quarter 2010 First Quarter 2011 $383 239 30 49 (157) (7) (164) - 537 (289) (115) 1 134 53 $81 $365 295 34 18 (168) (7) (175) - 537 (338) (118) (1) 80 37 $43 $346 322 38 - (133) (7) (140) - 566 (339) (120) (8) 99 39 $60 $364 305 51 - (135) (6) (141) - 579 (348) (126) (3) 102 39 $63 $360 304 53 - (134) (3) (137) (5) 575 (357) (122) (6) 90 34 $56 $96 70 15 - (34) - (34) (1) 146 (89) (31) - 26 11 $15 $108 87 15 - (38) (1) (39) (4) 167 (91) (33) (5) 38 16 $22 |
 42 Investor Presentation Kindred Healthcare, Inc. (NYSE: KND) May 12, 2011 |