UNITED STATES
SECURITIES AND EXCHANGE COMMISSION
Washington, D.C. 20549
FORM N-CSR
Certified Shareholder Report of
Registered Management Investment Companies
Investment Company Act File Number: 811-05104
Capital World Bond Fund
(Exact Name of Registrant as Specified in Charter)
333 South Hope Street, 55th Floor
Los Angeles, California 90071
(Address of Principal Executive Offices)
Registrant's telephone number, including area code: (949) 975-5000
Date of fiscal year end: December 31
Date of reporting period: December 31, 2022
Brian C. Janssen
Capital World Bond Fund
6455 Irvine Center Drive
Irvine, California 92618
(Name and Address of Agent for Service)
ITEM 1 – Reports to Stockholders
Capital World Bond Fund® Annual report
for the year ended
December 31, 2022 |  |

Find diverse total
return opportunities
in global bonds
Capital World Bond Fund seeks to provide you, over the long term, with a high level of total return consistent with prudent investment management. Total return comprises the income generated by the fund and the changes in the market value of the fund’s investments.
This fund is one of more than 40 offered by Capital Group, home of American Funds, one of the nation’s largest mutual fund families. For over 90 years, Capital Group has invested with a long-term focus based on thorough research and attention to risk.
Fund results shown in this report, unless otherwise indicated, are for Class F-2 shares. Class A share results are shown at net asset value unless otherwise indicated. If a sales charge (maximum 3.75%) had been deducted, the results would have been lower. Results are for past periods and are not predictive of results for future periods. Current and future results may be lower or higher than those shown. Prices and returns will vary, so investors may lose money. Investing for short periods makes losses more likely. For current information and month-end results, visit capitalgroup.com.
Refer to page 4 for Class F-2 share results and Class A share results with relevant sales charges deducted. For other share class results, visit capitalgroup.com and americanfundsretirement.com.
Investment results assume all distributions are reinvested and reflect applicable fees and expenses. When applicable, results reflect fee waivers and/or expense reimbursements, without which they would have been lower. Visit capitalgroup.com for more information.
The fund’s 30-day yield as of December 31, 2022, was 3.39% for Class F-2 shares and 2.90% for Class A shares calculated in accordance with the U.S. Securities and Exchange Commission formula. The fund’s distribution rate as of that date was 2.36% for Class F-2 shares and 1.91% for Class A shares. The Class A share results for both reflect the 3.75% maximum sales charge. The SEC yield reflects the rate at which the fund is earning income on its current portfolio of securities, while the distribution rate reflects the fund’s past dividends paid to shareholders. Accordingly, the fund’s SEC yield and distribution rate may differ.
The return of principal for bond funds and for funds with significant underlying bond holdings is not guaranteed. Fund shares are subject to the same interest rate, inflation and credit risks associated with the underlying bond holdings. High-yield and lower rated bonds are subject to greater fluctuations in value and risk of loss of income and principal than investment-grade and higher rated bonds. Bond ratings, which typically range from AAA/Aaa (highest) to D (lowest), are assigned by credit rating agencies such as Standard & Poor’s, Moody’s and/or Fitch as an indication of an issuer’s creditworthiness. Investing in bonds issued outside the U.S. may be subject to additional risks. They include currency fluctuations, political and social instability, differing securities regulations and accounting standards, higher transaction costs, possible changes in taxation, illiquidity and price volatility. These risks may be heightened in connection with investments in developing countries. Refer to the fund prospectus and the Risk Factors section of this report for more information on these and other risks associated with investing in the fund.
Investments are not FDIC-insured, nor are they deposits of or guaranteed by a bank or any other entity, so they may lose value.
Contents
| 1 | Letter to investors |
| | |
| 4 | The value of a long-term perspective |
| | |
| 5 | Investment portfolio |
| | |
| 39 | Financial statements |
| | |
| 74 | Board of trustees and other officers |
Fellow investors:
Global investment-grade bonds came under meaningful pressure in 2022 alongside rising interest rates, slowing economic growth, and elevated inflation. In foreign exchange markets, a strong dollar grew for much of the year, particularly as the U.S. Federal Reserve (Fed) and European Central Bank (ECB), among others, aggressively raised interest rates in an attempt to bring inflation back to a target of roughly 2%, down from 7% to 10% in many economies.
Against this eventful backdrop, Capital World Bond Fund Class F-2 shares recorded a return of –17.20% for the 12-month period ending December 31, 2022. This result lagged the Bloomberg Global Aggregate Index, a measure of global investment-grade (rated BBB/Baa and above) fixed income markets, which declined by 16.25%. Longer term results, however, represent stronger returns and reflect Capital Group’s long-term perspective. Refer to the table below for longer term results.
Sector/industry allocation decisions were the main positive contributors to relative results. Currency exposure was also additive, although this was largely offset by the impact from select currency hedging strategies. Country and market allocation decisions detracted from comparative results, driven by duration management. Curve positioning was modestly additive.
The portfolio’s average below-benchmark allocation to the Chinese renminbi was the most significant positive contributor to relative currency returns during the year followed closely by its average below-benchmark weight to the euro over the period. Conversely, the portfolio’s average above-benchmark allocation to both the Polish zloty and the Hungarian forint were equally meaningful detractors to relative returns.
The fund’s interest rate strategies utilized interest rate swaps and futures to more efficiently execute the portfolio’s
Results at a glance
For periods ended December 31, 2022, with all distributions reinvested
| | | Cumulative
total returns | | Average annual total returns |
| | | 1 year | | 5 years | | 10 years | | Lifetime (since Class A
inception on 8/4/87) |
| | | | | | | | | |
| Capital World Bond Fund (Class F-2 shares)1 | | | –17.20 | % | | | –1.51 | % | | | –0.25 | % | | | 5.25 | % |
| Capital World Bond Fund (Class A shares) | | | –17.51 | | | | –1.84 | | | | –0.57 | | | | 4.96 | |
| Bloomberg Global Aggregate Index2 | | | –16.25 | | | | –1.66 | | | | –0.44 | | | | 4.94 | |
| Lipper Global Income Funds Average3 | | | –13.50 | | | | –0.79 | | | | 0.31 | | | | 5.12 | |
Past results are not predictive of results in future periods.
| 1 | Class F-2 shares were first offered on August 1, 2008. Class F-2 share results prior to the date of first sale are hypothetical based on the results of the original share class of the fund without a sales charge, adjusted for typical estimated expenses. Visit capitalgroup.com for more information on specific expense adjustments and the actual dates of first sale. |
| 2 | Bloomberg source: Bloomberg Index Services Ltd. The Bloomberg Global Aggregate Index began on December 31, 1989. For the period of August 4, 1987, to December 31, 1989, the FTSE World Government Bond Index was used. Bloomberg Global Aggregate Index represents the global investment-grade fixed income markets. The index is unmanaged and, therefore, has no expenses. Investors cannot invest directly in an index. FTSE data: © 2023 FTSE Index LLC. All rights reserved. |
| 3 | Source: Refinitiv Lipper. Lipper averages reflect the current composition of all eligible mutual funds (all share classes) within a given category. Lipper categories are dynamic and averages may have few funds, especially over longer periods. For the number of funds included in the Lipper category for each fund’s lifetime, please refer to the Quarterly Statistical Update, available on our website. |
positioning based on how managers expected yields to move. These had mixed impacts on results, but ultimately helped to express managers’ convictions more efficiently.
The fund’s 12-month return fell short of the Lipper Global Income Funds Average, a peer group measure, which fell by 13.50% over the period. As a Lipper category, global income includes a broad spectrum of funds, such as those with substantial investments in U.S. high-yield (rated BB/Ba and below) bonds, for example, which benefited from their stronger results relative to global sovereign and currency returns over the period.
United States
U.S. fixed income markets fell across the board in 2022. A combination of persistently high inflation, aggressive rate hikes, supply constraints and Russia’s invasion of Ukraine weighed on markets, resulting in an annual return of –13.01% for the Bloomberg U.S. Aggregate Index.1 The Fed hiked its benchmark interest rate by 425 basis points (bps) over seven monetary policy meetings to counter the highest inflation since the 1980s. Its target rate range of 4.25%–4.50% following its December meeting was the highest since 2007.
Within corporate markets, investment-grade bonds fared worse than their high-yield counterparts, which were protected to a degree by their shorter duration in the rising rate environment. The Bloomberg U.S. Corporate Investment Grade Index2 returned –15.76% while the Bloomberg U.S. Corporate High Yield 2% Issuer Cap Index3 returned –11.18%. Investment-grade and high-yield spreads widened by 38 bps and 186 bps, respectively, but remained well below 2020’s COVID-19 peaks. Despite a challenging macro environment for corporates, 2022 had a record level of upgrades to investment-grade status compared to downgrades. Issuance fell across both markets, with high-yield volume dipping to levels not seen since 2008.
Exposure to the U.S. bond market at year-end was higher than that of its benchmark. The fund’s exposure to the U.S. dollar varied above and below that of the benchmark but on average was a slightly below-benchmark weight over the 12-month period. The fund maintained its below-benchmark weight to mortgage-backed securities (MBS), a position that was among the top contributors to relative performance as the Fed continued its program to reduce its balance sheet, which weighed on Federal National Mortgage Association (FNMA), Federal Home Loan Mortgage Corporation (FHLMC) and Government National Mortgage Association (GNMA) securities. With slight out-of-index exposure to high-yield corporates and a below-benchmark allocation to investment-grade, corporate positioning was mixed for returns for the year.
Europe
Returns for European bond markets were negative in 2022 as central banks raised rates in response to skyrocketing inflation, fueled in part by high energy prices due to the Russia-Ukraine war. An end-of-year bond market rally helped offset some losses, but concerns remained that central banks will be forced to lift rates further amid labor shortages and persistent inflation. Overall, the Bloomberg Euro Global Aggregate Index4 was down 22.27% in 2022.
Lower inflation in the U.S., U.K. and European Union allowed central banks to end their runs of 0.75 percentage point increases. The ECB and the Bank of England lifted their benchmark interest rates by half of a percentage point, in line with rate-setters in the U.S. The ECB’s decision brought interest rates to 2% and represented a slowdown in the pace of tightening from the 75 basis points increases in two prior meetings. The ECB also plans to begin shrinking its balance sheet by €15 billion per month on average from March 2023 until the end of the second-quarter of 2023. ECB President Christine Lagarde noted that rate increases will continue, and investors have priced in a peak deposit rate of 3.3% from 2.75% prior to the meeting. The 10-year German bund yield, a proxy for borrowing costs across the eurozone, rose 275 bps during the year to settle at 2.57%. The yield on the U.K’s 10-year bond jumped 270 bps to end the year at 3.67%.
European bond issuance slowed in 2022, with investment grade down €26 billion to €461 billion, while high-yield bond issuance slid 69% to €52.8 billion. The amount of corporate bonds issued in the U.K. also fell. However, many companies borrowed heavily when interest rates were low and currently do not have imminent maturities. Yields on longer dated government bonds in the U.S. and Germany have dipped below shorter dated notes. A so-called yield curve inversion that indicates an economic downturn is on the horizon for both regions. The euro and British pound sterling declined 5.85% and 10.71%, respectively, against the U.S. dollar as central banks lifted rates.
As of December 31, 2022, European currency exposure accounted for 27.8% of the fund’s portfolio before currency hedging, of which 24.6% was bond exposure. Portfolio managers trimmed exposure to holdings in Romania and Serbia which saw spreads tightening in the second half of the year. The managers remained cautious on corporates and emerging markets credits. The managers gradually increased duration in the euro area through the year.
Other developed markets
The Bank of Japan (BOJ) intervened in the foreign exchange market in September for the first time in more than 20 years in an effort to stop the yen’s decline against the dollar. The currency slid to a 32-year low in October. It rebounded when the BOJ surprised markets in December by raising the cap on the benchmark 10-year government bond yield to 0.5% from 0.25%. Some market participants viewed this as a pivot away from ultra-loose monetary policy, which BOJ Governor Haruhiko Kuroda denied. Core inflation, which excludes volatile fresh food prices, reached a 41-year high in November.
The economy recovered its pre-pandemic size in the second quarter as gross domestic product (GDP) grew an annualized 3.5%. A rise in private consumption as COVID-19 restrictions eased in March helped drive growth. Yet weakness among Japan’s trade partners still weighed on the economy. In October, the BOJ trimmed its median forecast for fiscal 2022 GDP growth to 2.0% from 2.4%.
Australian fixed income markets fell as labor shortages and climbing inflation weighed on the economy. Inflation hit the highest levels since 1990, accelerating to an annualized 7.3% in the third quarter. Ahead of the country’s May general election, the government introduced relief measures to ease the pain of inflation, including a reduction in its gasoline tax. The Reserve Bank of Australia raised its key interest rate for most of the year, reaching a 10-year high of 3.1% in the fourth quarter. Anthony Albanese was elected as the country’s new prime minister in May, breaking nine years of conservative leadership. The Australian dollar fell 7% against the U.S. dollar.
Managers continue to favor the Japanese yen given attractive valuations and supportive policies from the Bank of Japan and have recently pared back the below-benchmark duration exposure to the bond market there. Exposure has been modest to Asian currencies through the year — which was helpful until October. Since then, those currencies had strong results into year-end, weighing on relative results, as market expectations for the Chinese economy improved.
Developing markets
Emerging markets bonds experienced a challenging 2022, with rising interest rates and inflation, the war in Europe, China’s zero-COVID policy, and global supply constraints. As such, both hard and local currency markets declined, with local markets hindered further by emerging market currency weakness. The JPMorgan EMBI Global Diversified5 (hard currency) returned –17.78% and the JPMorgan GBI EM Global Diversified6 (local currency) returned –11.69% in U.S. dollar terms.
The majority of hard currency markets posted negative returns. While underlying assets of local markets held up better, weakening currencies deteriorated their position in U.S. dollar terms. European issuers fared worst in both hard and local markets, having been hit particularly hard by Russia’s invasion of Ukraine earlier in the year. Fundamentals have been also weakening for the region, owing to inflationary pressures and the political outlook.
The portfolio reduced the overall exposure to emerging markets. Within emerging markets, managers have a slight preference for hard currency emerging markets debt. The portfolio is slightly below-benchmark to local currency emerging markets debt, mainly expressed through a below-benchmark weight to Chinese government bonds. While the rollback of zero-COVID is viewed as a positive, managers remain concerned about growth prospects as the government pivots to a “common prosperity” focus. Continued weakness in the renminbi is also a concern if policy rates remain low relative to the United States and much of the eurozone.
Looking ahead
The portfolio remains cautiously positioned, as a combination of rising interest rates, rising recession risks, and ongoing geopolitical instability will likely contribute to more persistent near-term volatility.
Declining energy prices, specifically natural gas prices, should continue to put downward pressure on global inflation, especially in countries more heavily dependent on Russian natural gas. This may reduce the drag on global growth and could reduce the pressure on central banks to continue to aggressively hike interest rates to ease inflationary pressures.
Global recessionary risks remain despite inflation softening. Sticky inflation above central bank targets may lead to continued hiking of policy rates and a policy-driven recession. Alternatively, a lack of upside growth catalysts may give way to a “stagflation” scenario where we see no, or slow, growth paired with sticky inflation. This scenario could delay or prevent central banks from easing.
Though credit spreads have widened to reflect greater market uncertainty, the portfolio remains somewhat defensively positioned with below-benchmark exposure to investment-grade corporates and a modest off-benchmark position in high-yield corporates.
Thank you for your continued commitment to our risk-disciplined and long-term approach to global bond investing.
We look forward to reporting to you again in 12 months.
Cordially,

Thomas H. Høgh
President
February 9, 2023
For current information about the fund, visit capitalgroup.com.
Past results are not predictive of results in future periods.
| 1 | Bloomberg U.S. Aggregate Index represents the U.S. investment-grade fixed-rate bond market. |
| 2 | Bloomberg U.S. Corporate Investment Grade Index represents the universe of investment grade, publicly issued U.S. corporate and specified foreign debentures and secured notes that meet the specified maturity, liquidity, and quality requirements. |
| 3 | Bloomberg U.S. Corporate High Yield 2% Issuer Capped Index covers the universe of fixed-rate, non-investment-grade debt. The index limits the maximum exposure of any one issuer to 2%. |
| 4 | Bloomberg Euro Global Aggregate Index is a flagship measure of global investment-grade debt from a multitude of local currency markets. This multi-currency benchmark includes treasury, government-related, corporate and securitized fixed-rate bonds from both developed and emerging markets issuers. |
| 5 | The J.P. Morgan Emerging Market Bond Index (EMBI) Global Diversified is a uniquely weighted emerging market debt benchmark that tracks total returns for U.S. dollar-denominated bonds issued by emerging market sovereign and quasi-sovereign entities. |
| 6 | JP Morgan Government Bond Index – Emerging Markets Global Diversified covers the universe of regularly traded, liquid fixed-rate, domestic currency emerging market government bonds to which international investors can gain exposure. |
The value of a long-term perspective
How a hypothetical $10,000 investment has grown over the fund’s lifetime.
Fund results shown are for Class F-2 shares and Class A shares. Class A share results reflect deduction of the maximum sales charge of 3.75% on the $10,000 investment.1 Thus, the net amount invested was $9,625.2 Investing for short periods makes losses more likely.
Class F-2 shares were first offered on August 1, 2008. Class F-2 share results prior to the date of first sale are hypothetical based on the results of the original share class of the fund without a sales charge, adjusted for typical estimated expenses. Visit capitalgroup.com for more information on specific expense adjustments and the actual dates of first sale.

| 1 | As outlined in the prospectus, the sales charge is reduced for accounts (and aggregated investments) of $100,000 or more and is eliminated for purchases of $1 million or more. There is no sales charge on dividends or capital gain distributions that are reinvested in additional shares. |
| 2 | The maximum initial sales charge was 4.75% prior to January 10, 2000. |
| 3 | With dividends and capital gains reinvested or interest compounded. Results of the FTSE World Government Bond Index are represented by the black line. FTSE World Government Bond Index is a comprehensive measure of the total return results of the government bond markets of more than 20 countries meeting certain market capitalization requirements. FTSE data: © 2023 FTSE Index LLC. All rights reserved. |
| 4 | Bloomberg source: Bloomberg Index Services Ltd. Bloomberg Global Aggregate Index did not exist until December 31, 1989. For the period of August 4, 1987, through December 31, 1989, the FTSE World Government Bond Index results were used. |
| 5 | For the period of August 4, 1987, commencement of operations, through December 31, 1987. |
The market indexes are unmanaged and, therefore, have no expenses. Investors cannot invest directly in an index.
Past results are not predictive of results for future periods. The results shown are before taxes on fund distributions and sale of fund shares.
Average annual total returns based on a $1,000 investment (for periods ended December 31, 2022)
| | | 1 year | | 5 years | | 10 years |
| | | | | | | |
| Class F-2 shares | | | –17.20 | % | | | –1.51 | % | | | –0.25 | % |
| Class A shares* | | | –20.62 | | | | –2.59 | | | | –0.95 | |
| * | Assumes payment of the maximum 3.75% sales charge. |
The total annual fund operating expense ratios are 0.60% for Class F-2 shares and 0.97% for Class A shares as of the prospectus dated March 1, 2023 (unaudited). Expense ratios are restated to reflect current fees.
Investment results assume all distributions are reinvested and reflect applicable fees and expenses. When applicable, results reflect fee waivers and/or expense reimbursements, without which they would have been lower. Visit capitalgroup.com for more information.
| Investment portfolio December 31, 2022 | |
| | |
| Portfolio by type of security | Percent of net assets |
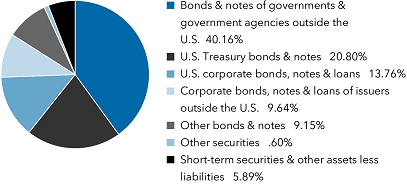
| Bonds & notes of governments & government agencies outside the U.S. | | | Percent of
net assets |
| Eurozone*: | | | | | | | | |
| Germany | | | 2.79 | % | | | | |
| Spain | | | 2.11 | | | | | |
| France | | | 2.10 | | | | | |
| Italy | | | 1.97 | | | | | |
| Greece | | | .92 | | | | | |
| Austria | | | .67 | | | | | |
| Ireland | | | .28 | | | | | |
| Finland | | | .24 | | | | | |
| Belgium | | | .16 | | | | | |
| Portugal | | | .11 | | | | | |
| Lithuania | | | .03 | | | | | |
| Estonia | | | .01 | | | | | |
| Luxembourg | | | — | † | | | 11.39 | % |
| Japan | | | | | | | 6.26 | |
| China | | | | | | | 3.81 | |
| United Kingdom | | | | | | | 3.16 | |
| Canada | | | | | | | 3.09 | |
| Australia | | | | | | | 1.87 | |
| Mexico | | | | | | | 1.47 | |
| Other | | | | | | | 9.11 | |
| | | | | | | | 40.16 | % |
| * | Countries using the euro as a common currency: Austria, Belgium, Cyprus, Estonia, Finland, France, Germany, Greece, Ireland, Italy, Latvia, Lithuania, Luxembourg, Malta, the Netherlands, Portugal, Slovakia, Slovenia and Spain. |
| † | Amount less than .01% |
| Bonds, notes & other debt instruments 93.51% | | Principal amount
(000) | | | Value
(000) | |
| Euros 18.28% | | | | | | | | |
| AbbVie, Inc. 1.25% 11/18/2031 | | EUR | 3,520 | | | $ | 3,138 | |
| AIA Group, Ltd. 0.88% 9/9/2033 (5-year EUR Annual Swap + 1.10% on 9/9/2028)1 | | | 23,220 | | | | 19,344 | |
| Allianz SE 4.75% perpetual bonds (3-month EUR-EURIBOR + 3.60% on 10/24/2023)1 | | | 13,900 | | | | 14,797 | |
| Altria Group, Inc. 2.20% 6/15/2027 | | | 8,550 | | | | 8,241 | |
| American Medical Systems Europe BV 1.375% 3/8/2028 | | | 940 | | | | 890 | |
| American Tower Corp. 0.45% 1/15/2027 | | | 2,095 | | | | 1,926 | |
| American Tower Corp. 0.875% 5/21/2029 | | | 1,420 | | | | 1,214 | |
| Anheuser-Busch InBev NV 1.125% 7/1/2027 | | | 3,275 | | | | 3,179 | |
| Anheuser-Busch InBev NV 2.875% 4/2/2032 | | | 805 | | | | 800 | |
| AT&T, Inc. 1.60% 5/19/2028 | | | 2,290 | | | | 2,180 | |
| AT&T, Inc. 2.05% 5/19/2032 | | | 6,250 | | | | 5,629 | |
| Austria (Republic of) 0% 2/20/2031 | | | 45,322 | | | | 37,997 | |
| Austria (Republic of) 0.90% 2/20/2032 | | | 29,485 | | | | 26,105 | |
| Austria (Republic of) 0.70% 4/20/2071 | | | 290 | | | | 139 | |
| Bonds, notes & other debt instruments (continued) | | Principal amount
(000) | | | Value
(000) | |
| Euros (continued) | | | | | | | | |
| AXA SA 4.25% 3/10/2043 (3-month EUR-EURIBOR + 3.60% on 3/10/2033)1 | | EUR | 3,000 | | | $ | 2,937 | |
| Banco de Sabadell, SA 2.625% 3/24/2026 (5-year EUR Mid-Swap + 2.20% on 3/24/2025)1 | | | 3,600 | | | | 3,626 | |
| Bank of America Corp. 0.58% 8/8/2029 (3-month EUR-EURIBOR + 0.73% on 8/8/2028)1,2 | | | 3,140 | | | | 2,732 | |
| Bayer Capital Corp. BV 1.50% 6/26/2026 | | | 1,600 | | | | 1,592 | |
| Belgium (Kingdom of), Series 72, 2.60% 6/22/2024 | | | 4,510 | | | | 4,818 | |
| Belgium (Kingdom of), Series 89, 0.10% 6/22/2030 | | | 2,510 | | | | 2,182 | |
| Belgium (Kingdom of), Series 94, 0.35% 6/22/2032 | | | 7,560 | | | | 6,270 | |
| Belgium (Kingdom of), Series 88, 1.70% 6/22/2050 | | | 765 | | | | 580 | |
| Belgium (Kingdom of), Series 95, 1.40% 6/22/2053 | | | 1,890 | | | | 1,286 | |
| BMW Finance NV 1.50% 2/6/2029 | | | 1,000 | | | | 951 | |
| British American Tobacco International Finance PLC 2.75% 3/25/2025 | | | 8,000 | | | | 8,389 | |
| British American Tobacco PLC 3.00% subordinated perpetual bonds (5-year EUR Mid-Swap + 3.372% on 12/27/2026)1 | | | 4,000 | | | | 3,346 | |
| Buzzi Unicem SpA 2.125% 4/28/2023 | | | 2,000 | | | | 2,136 | |
| Caisse d’Amortissement de la Dette Sociale 0.60% 11/25/2029 | | | 2,700 | | | | 2,428 | |
| CaixaBank, SA 1.375% 6/19/2026 | | | 9,800 | | | | 9,518 | |
| CaixaBank, SA 2.25% 4/17/2030 (5-year EUR Annual (vs. 6-month EUR-EURIBOR) + 1.68% on 4/17/2025)1 | | | 16,200 | | | | 15,829 | |
| Celanese US Holdings, LLC 4.777% 7/19/2026 | | | 3,020 | | | | 3,084 | |
| Celanese US Holdings, LLC 0.625% 9/10/2028 | | | 1,500 | | | | 1,172 | |
| Chubb, Ltd. 1.55% 3/15/2028 | | | 1,040 | | | | 985 | |
| Comcast Corp. 0% 9/14/2026 | | | 7,770 | | | | 7,273 | |
| Comcast Corp. 0.25% 5/20/2027 | | | 6,700 | | | | 6,186 | |
| Comcast Corp. 0.25% 9/14/2029 | | | 8,195 | | | | 6,983 | |
| Comcast Corp. 1.25% 2/20/2040 | | | 1,300 | | | | 943 | |
| Crédit Agricole SA 0.50% 6/24/2024 | | | 900 | | | | 925 | |
| Credit Suisse Group AG 0.65% 1/14/2028 (1-year EUR Mid-Swap + 0.77% on 1/12/2027)1 | | | 3,340 | | | | 2,680 | |
| Daimler Truck International Finance BV 1.625% 4/6/2027 | | | 5,000 | | | | 4,855 | |
| Deutsche Bank AG 4.00% 6/24/2032 (3-month EUR-EURIBOR + 3.30% on 6/24/2027)1 | | | 4,400 | | | | 4,179 | |
| DH Europe Finance II SARL 0.45% 3/18/2028 | | | 1,957 | | | | 1,790 | |
| Dow Chemical Co. 1.875% 3/15/2040 | | | 1,000 | | | | 712 | |
| E.ON SE 1.625% 3/29/2031 | | | 5,260 | | | | 4,744 | |
| EDP - Energias de Portugal, SA, junior subordinated, 1.875% 8/2/2081 (5-year EUR-ICE Swap EURIBOR + 2.38% on 8/2/2026)1 | | | 4,000 | | | | 3,682 | |
| Egypt (Arab Republic of) 4.75% 4/16/2026 | | | 680 | | | | 607 | |
| Egypt (Arab Republic of) 5.625% 4/16/2030 | | | 504 | | | | 376 | |
| Enel Finance International SA 1.00% 9/16/2024 | | | 4,000 | | | | 4,126 | |
| Equinix, Inc. 0.25% 3/15/2027 | | | 2,820 | | | | 2,615 | |
| Equinix, Inc. 1.00% 3/15/2033 | | | 5,000 | | | | 3,905 | |
| Equinor ASA 1.375% 5/22/2032 | | | 1,041 | | | | 925 | |
| Estonia (Republic of) 4.00% 10/12/2032 | | | 1,010 | | | | 1,110 | |
| European Financial Stability Facility 0.40% 2/17/2025 | | | 26,000 | | | | 26,368 | |
| European Investment Bank 0% 6/17/2027 | | | 7,240 | | | | 6,799 | |
| European Investment Bank 0% 9/28/2028 | | | 5,220 | | | | 4,715 | |
| European Investment Bank 0% 1/14/2031 | | | 2,020 | | | | 1,696 | |
| European Investment Bank 0.25% 1/20/2032 | | | 39,400 | | | | 32,850 | |
| European Investment Bank 1.50% 6/15/2032 | | | 6,160 | | | | 5,740 | |
| European Union 0% 11/4/2025 | | | 350 | | | | 346 | |
| European Union 0% 3/4/2026 | | | 3,590 | | | | 3,508 | |
| European Union 0% 7/6/2026 | | | 12,700 | | | | 12,266 | |
| European Union 0.25% 10/22/2026 | | | 4,945 | | | | 4,788 | |
| European Union 0% 6/2/2028 | | | 19,680 | | | | 17,949 | |
| European Union 0% 10/4/2028 | | | 800 | | | | 722 | |
| European Union 0% 7/4/2031 | | | 4,680 | | | | 3,878 | |
| European Union 0% 7/4/2035 | | | 1,355 | | | | 978 | |
| European Union 0.20% 6/4/2036 | | | 11,650 | | | | 8,391 | |
| Finland (Republic of) 0.125% 9/15/2031 | | | 3,000 | | | | 2,516 | |
| Finland (Republic of) 1.50% 9/15/2032 | | | 21,710 | | | | 20,261 | |
| French Republic O.A.T. 0% 2/25/2024 | | | 6,360 | | | | 6,595 | |
| French Republic O.A.T. 0.50% 5/25/2025 | | | 4,860 | | | | 4,932 | |
| French Republic O.A.T. 0% 2/25/2027 | | | 5,110 | | | | 4,887 | |
| French Republic O.A.T. 1.00% 5/25/2027 | | | 620 | | | | 615 | |
| French Republic O.A.T. 0.75% 2/25/2028 | | | 28,150 | | | | 27,190 | |
| French Republic O.A.T. 0% 11/25/2030 | | | 75,900 | | | | 64,882 | |
| French Republic O.A.T. 0% 11/25/2031 | | | 9,730 | | | | 8,048 | |
| Bonds, notes & other debt instruments (continued) | | Principal amount
(000) | | | Value
(000) | |
| Euros (continued) | | | | | | | | |
| French Republic O.A.T. 2.00% 11/25/2032 | | EUR | 26,675 | | | $ | 26,059 | |
| French Republic O.A.T. 1.25% 5/25/2034 | | | 8,560 | | | | 7,498 | |
| French Republic O.A.T. 0.50% 5/25/2040 | | | 24,900 | | | | 16,923 | |
| French Republic O.A.T. 0.50% 6/25/2044 | | | 1,370 | | | | 856 | |
| French Republic O.A.T. 2.00% 5/25/2048 | | | 1,340 | | | | 1,123 | |
| French Republic O.A.T. 0.75% 5/25/2052 | | | 47,480 | | | | 27,352 | |
| French Republic O.A.T. 1.75% 5/25/2066 | | | 320 | | | | 235 | |
| General Electric Co. 4.125% 9/19/20352 | | | 1,000 | | | | 1,064 | |
| Germany (Federal Republic of) 0% 10/18/2024 | | | 2,190 | | | | 2,241 | |
| Germany (Federal Republic of) 0% 4/11/2025 | | | 12,485 | | | | 12,627 | |
| Germany (Federal Republic of) 0% 10/9/2026 | | | 1,500 | | | | 1,462 | |
| Germany (Federal Republic of) 0.25% 2/15/2027 | | | 10,285 | | | | 10,069 | |
| Germany (Federal Republic of) 0% 4/16/2027 | | | 5 | | | | 5 | |
| Germany (Federal Republic of) 0% 8/15/2030 | | | 70,340 | | | | 62,690 | |
| Germany (Federal Republic of) 0% 8/15/2030 | | | 3,026 | | | | 2,698 | |
| Germany (Federal Republic of) 1.70% 8/15/2032 | | | 89,325 | | | | 89,167 | |
| Germany (Federal Republic of) 1.00% 5/15/2038 | | | 38,000 | | | | 32,558 | |
| Germany (Federal Republic of) 2.50% 7/4/2044 | | | 2,990 | | | | 3,202 | |
| Germany (Federal Republic of) 1.25% 8/15/2048 | | | 2,170 | | | | 1,809 | |
| Germany (Federal Republic of) 0% 8/15/2050 | | | 26,940 | | | | 15,102 | |
| Germany (Federal Republic of) 0% 8/15/2050 | | | 260 | | | | 146 | |
| Germany (Federal Republic of) 0% 8/15/2052 | | | 17,530 | | | | 9,399 | |
| Goldman Sachs Group, Inc. 1.00% 3/18/20332 | | | 22,674 | | | | 17,527 | |
| Greece (Hellenic Republic of) 3.375% 2/15/2025 | | | 45,810 | | | | 49,040 | |
| Greece (Hellenic Republic of) 2.00% 4/22/2027 | | | 13,760 | | | | 13,809 | |
| Greece (Hellenic Republic of) 1.75% 6/18/2032 | | | 29,790 | | | | 25,183 | |
| Groupe BPCE SA 0.875% 1/31/2024 | | | 700 | | | | 730 | |
| Groupe BPCE SA 1.00% 4/1/2025 | | | 10,900 | | | | 10,995 | |
| Holding d’Infrastructures de Transport SAS 1.475% 1/18/2031 | | | 1,100 | | | | 921 | |
| Honeywell International, Inc. 0.75% 3/10/2032 | | | 2,530 | | | | 2,095 | |
| Iberdrola, SA 1.875% junior subordinated perpetual bonds (5-year EUR Annual (vs. 6-month EURIBOR) + 1.592% on 5/22/2023)1 | | | 1,600 | | | | 1,703 | |
| Ireland (Republic of) 0.90% 5/15/2028 | | | 30 | | | | 29 | |
| Ireland (Republic of) 0.20% 10/18/2030 | | | 10,410 | | | | 9,057 | |
| Ireland (Republic of) 0% 10/18/2031 | | | 21,790 | | | | 18,051 | |
| Israel (State of) 2.875% 1/29/2024 | | | 7,700 | | | | 8,209 | |
| Israel (State of) 1.50% 1/18/2027 | | | 4,275 | | | | 4,255 | |
| Israel (State of) 1.50% 1/16/2029 | | | 3,875 | | | | 3,732 | |
| Italy (Republic of) 0% 1/30/2024 | | | 5,800 | | | | 6,011 | |
| Italy (Republic of) 0.85% 1/15/2027 | | | 12,395 | | | | 11,879 | |
| Italy (Republic of) 0.25% 3/15/2028 | | | 15,780 | | | | 13,964 | |
| Italy (Republic of) 2.80% 12/1/2028 | | | 28,044 | | | | 28,150 | |
| Italy (Republic of) 1.35% 4/1/2030 | | | 690 | | | | 607 | |
| Italy (Republic of) 1.65% 12/1/2030 | | | 10,580 | | | | 9,310 | |
| Italy (Republic of) 0.95% 12/1/2031 | | | 2,400 | | | | 1,918 | |
| Italy (Republic of) 2.50% 12/1/2032 | | | 64,010 | | | | 57,371 | |
| Italy (Republic of) 1.45% 3/1/2036 | | | 17,730 | | | | 13,070 | |
| Italy (Republic of) 1.80% 3/1/2041 | | | 2,840 | | | | 1,974 | |
| Italy (Republic of) 2.15% 9/1/2052 | | | 2,770 | | | | 1,800 | |
| Italy Buoni Poliennali Del Tesoro 0.90% 4/1/2031 | | | 50,620 | | | | 41,390 | |
| KfW 0.125% 6/30/2025 | | | 4,585 | | | | 4,586 | |
| KfW 0% 12/15/2027 | | | 11,710 | | | | 10,830 | |
| Lithuania (Republic of) 4.125% 4/25/2028 | | | 2,450 | | | | 2,694 | |
| Lloyds Banking Group PLC 1.75% 9/7/2028 (5-year EUR-EURIBOR + 1.30% on 9/7/2023)1 | | | 12,400 | | | | 12,770 | |
| Luxembourg (Grand Duchy of) 0% 9/14/2032 | | | 271 | | | | 218 | |
| Marsh & McLennan Companies, Inc. 1.349% 9/21/2026 | | | 390 | | | | 379 | |
| Marsh & McLennan Companies, Inc. 1.979% 3/21/2030 | | | 1,000 | | | | 919 | |
| Mastercard, Inc. 1.00% 2/22/2029 | | | 1,425 | | | | 1,325 | |
| Medtronic Global Holdings SCA 1.125% 3/7/2027 | | | 4,820 | | | | 4,691 | |
| Medtronic Global Holdings SCA 1.00% 7/2/2031 | | | 7,720 | | | | 6,633 | |
| Medtronic Global Holdings SCA 1.375% 10/15/2040 | | | 1,095 | | | | 765 | |
| Morgan Stanley 2.103% 5/8/2026 (3-month EUR-EURIBOR + 0.904% on 5/8/2025)1 | | | 4,740 | | | | 4,839 | |
| Morgan Stanley 2.95% 5/7/2032 (3-month EUR-EURIBOR + 1.245% on 5/7/2031)1 | | | 12,730 | | | | 12,111 | |
| Morocco (Kingdom of) 1.50% 11/27/2031 | | | 8,895 | | | | 7,053 | |
| Netflix, Inc. 3.625% 5/15/2027 | | | 3,800 | | | | 3,923 | |
| Netflix, Inc. 3.875% 11/15/20292 | | | 3,800 | | | | 3,813 | |
| Orange SA 2.00% 1/15/2029 | | | 400 | | | | 393 | |
| Philip Morris International, Inc. 0.80% 8/1/2031 | | | 5,800 | | | | 4,481 | |
| Bonds, notes & other debt instruments (continued) | | Principal amount
(000) | | | Value
(000) | |
| Euros (continued) | | | | | | | | |
| Philippines (Republic of) 0.70% 2/3/2029 | | EUR | 3,480 | | | $ | 3,089 | |
| Portuguese Republic 1.95% 6/15/2029 | | | 60 | | | | 60 | |
| Portuguese Republic 0.475% 10/18/2030 | | | 9,770 | | | | 8,467 | |
| Portuguese Republic 1.65% 7/16/2032 | | | 960 | | | | 876 | |
| Portuguese Republic 1.15% 4/11/2042 | | | 830 | | | | 569 | |
| Portuguese Republic 1.00% 4/12/2052 | | | 310 | | | | 166 | |
| Public Storage 0.50% 9/9/2030 | | | 2,490 | | | | 2,014 | |
| Quebec (Province of) 0.25% 5/5/2031 | | | 5,980 | | | | 4,963 | |
| Quebec (Province of) 0.50% 1/25/2032 | | | 9,030 | | | | 7,486 | |
| Raytheon Technologies Corp. 2.15% 5/18/2030 | | | 1,600 | | | | 1,486 | |
| Romania 5.00% 9/27/2026 | | | 1,270 | | | | 1,371 | |
| Romania 3.624% 5/26/2030 | | | 20,870 | | | | 18,340 | |
| Romania 1.75% 7/13/2030 | | | 14,675 | | | | 10,965 | |
| Russian Federation 2.875% 12/4/20253 | | | 15,300 | | | | 6,879 | |
| Russian Federation 2.875% 12/4/20253 | | | 5,100 | | | | 2,293 | |
| Santander Issuances, SA Unipersonal 3.25% 4/4/2026 | | | 7,200 | | | | 7,481 | |
| Serbia (Republic of) 3.125% 5/15/2027 | | | 5,688 | | | | 5,260 | |
| Serbia (Republic of) 3.125% 5/15/2027 | | | 611 | | | | 565 | |
| Serbia (Republic of) 1.50% 6/26/2029 | | | 4,353 | | | | 3,354 | |
| Serbia (Republic of) 2.05% 9/23/2036 | | | 11,570 | | | | 7,015 | |
| Spain (Kingdom of) 0% 5/31/2024 | | | 2,800 | | | | 2,881 | |
| Spain (Kingdom of) 2.75% 10/31/2024 | | | 17,030 | | | | 18,184 | |
| Spain (Kingdom of) 0% 1/31/2027 | | | 14,425 | | | | 13,639 | |
| Spain (Kingdom of) 0.80% 7/30/2027 | | | 83,500 | | | | 80,741 | |
| Spain (Kingdom of) 1.40% 7/30/2028 | | | 2,075 | | | | 2,025 | |
| Spain (Kingdom of) 1.45% 4/30/2029 | | | 10,215 | | | | 9,861 | |
| Spain (Kingdom of) 0.50% 4/30/2030 | | | 2,560 | | | | 2,251 | |
| Spain (Kingdom of) 1.25% 10/31/2030 | | | 2,762 | | | | 2,540 | |
| Spain (Kingdom of) 0.10% 4/30/2031 | | | 515 | | | | 422 | |
| Spain (Kingdom of) 0.50% 10/31/2031 | | | 31,534 | | | | 26,293 | |
| Spain (Kingdom of) 0.70% 4/30/2032 | | | 41,085 | | | | 34,281 | |
| Spain (Kingdom of) 1.85% 7/30/2035 | | | 260 | | | | 227 | |
| Spain (Kingdom of) 1.00% 7/30/2042 | | | 690 | | | | 453 | |
| Spain (Kingdom of) 3.45% 7/30/2043 | | | 580 | | | | 577 | |
| Spain (Kingdom of) 2.70% 10/31/2048 | | | 4,700 | | | | 4,115 | |
| Spain (Kingdom of) 1.00% 10/31/2050 | | | 1,000 | | | | 560 | |
| Spain (Kingdom of) 1.90% 10/31/2052 | | | 2,340 | | | | 1,611 | |
| Spain (Kingdom of) 1.45% 10/31/2071 | | | 200 | | | | 101 | |
| State Grid Overseas Investment, Ltd. 1.375% 5/2/2025 | | | 2,050 | | | | 2,053 | |
| State Grid Overseas Investment, Ltd. 2.125% 5/2/2030 | | | 800 | | | | 708 | |
| Stellantis NV 4.50% 7/7/2028 | | | 1,500 | | | | 1,611 | |
| Stellantis NV 0.75% 1/18/2029 | | | 3,000 | | | | 2,573 | |
| Stellantis NV 1.25% 6/20/2033 | | | 17,865 | | | | 13,475 | |
| Stryker Corp. 0.25% 12/3/2024 | | | 2,580 | | | | 2,599 | |
| Stryker Corp. 0.75% 3/1/2029 | | | 5,230 | | | | 4,679 | |
| Stryker Corp. 1.00% 12/3/2031 | | | 2,410 | | | | 2,013 | |
| Sweden (Kingdom of) 0.125% 4/24/2023 | | | 3,000 | | | | 3,190 | |
| Takeda Pharmaceutical Company, Ltd. 0.75% 7/9/2027 | | | 3,230 | | | | 3,041 | |
| Thermo Fisher Scientific (Finance I) BV 0.80% 10/18/2030 | | | 913 | | | | 794 | |
| Thermo Fisher Scientific (Finance I) BV 1.625% 10/18/2041 | | | 530 | | | | 382 | |
| TOTAL SA 1.75% junior subordinated perpetual bonds (5-year EUR-EURIBOR + 1.765% on 4/4/2024)1 | | | 16,030 | | | | 16,234 | |
| Tunisia (Republic of) 6.75% 10/31/2023 | | | 20,073 | | | | 18,119 | |
| Tunisia (Republic of) 6.75% 10/31/2023 | | | 4,406 | | | �� | 3,977 | |
| Tunisia (Republic of) 5.625% 2/17/2024 | | | 15,773 | | | | 13,307 | |
| Tunisia (Republic of) 6.375% 7/15/2026 | | | 9,500 | | | | 6,447 | |
| Ukraine 6.75% 6/20/2028 | | | 13,243 | | | | 2,629 | |
| Ukraine 4.375% 1/27/2032 | | | 15,050 | | | | 2,651 | |
| Ukraine 4.375% 1/27/2032 | | | 1,800 | | | | 317 | |
| UniCredit SpA 4.875% 2/20/2029 (5-year EUR-ICE Swap EURIBOR + 4.739% on 2/20/2024)1 | | | 7,750 | | | | 8,229 | |
| Veolia Environnement 1.59% 1/10/2028 | | | 1,900 | | | | 1,839 | |
| Verizon Communications, Inc. 0.375% 3/22/2029 | | | 12,350 | | | | 10,684 | |
| Verizon Communications, Inc. 1.25% 4/8/2030 | | | 6,000 | | | | 5,287 | |
| Verizon Communications, Inc. 4.25% 10/31/2030 | | | 470 | | | | 510 | |
| Verizon Communications, Inc. 0.75% 3/22/2032 | | | 6,025 | | | | 4,827 | |
| Verizon Communications, Inc. 4.75% 10/31/2034 | | | 540 | | | | 598 | |
| Visa, Inc. 1.50% 6/15/2026 | | | 3,090 | | | | 3,109 | |
| Visa, Inc. 2.00% 6/15/2029 | | | 2,430 | | | | 2,386 | |
| Bonds, notes & other debt instruments (continued) | | Principal amount
(000) | | | Value
(000) | |
| Euros (continued) | | | | | | | | |
| Volkswagen Financial Services AG 1.375% 10/16/2023 | | EUR | 5,480 | | | $ | 5,782 | |
| Volkswagen International Finance NV 4.375% junior subordinated perpetual bonds (9-year EUR Mid-Swap + 3.36% on 3/28/2031)1 | | | 12,600 | | | | 11,051 | |
| Wellcome Trust, Ltd. 1.125% 1/21/2027 | | | 3,000 | | | | 2,955 | |
| Zurich Finance Ireland DAC, junior subordinated, 1.875% 9/17/2050 (3-month EUR-LIBOR + 2.95% on 9/17/2050)1 | | | 2,000 | | | | 1,693 | |
| | | | | | | | 1,741,674 | |
| | | | | | | | | |
| Japanese yen 7.12% | | | | | | | | |
| Banco Santander, SA 0.568% 1/11/2023 | | JPY | 600,000 | | | | 4,571 | |
| Banque Federative du Credit Mutuel 0.443% 10/12/2023 | | | 100,000 | | | | 761 | |
| Groupe BPCE SA 0.645% 7/12/2023 | | | 1,500,000 | | | | 11,425 | |
| Hungary (Republic of) 0.52% 9/15/2023 | | | 200,000 | | | | 1,522 | |
| Indonesia (Republic of) 0.92% 5/31/2023 | | | 100,000 | | | | 763 | |
| Indonesia (Republic of) 1.13% 7/7/2023 | | | 1,100,000 | | | | 8,403 | |
| Japan, Series 17, 0.10% 9/10/20234 | | | 1,515,100 | | | | 11,729 | |
| Japan, Series 18, 0.10% 3/10/20244 | | | 2,664,180 | | | | 20,757 | |
| Japan, Series 341, 0.30% 12/20/2025 | | | 1,567,450 | | | | 12,026 | |
| Japan, Series 21, 0.10% 3/10/20264 | | | 1,582,620 | | | | 12,523 | |
| Japan, Series 346, 0.10% 3/20/2027 | | | 2,907,900 | | | | 22,074 | |
| Japan, Series 347, 0.10% 6/20/2027 | | | 1,000,000 | | | | 7,580 | |
| Japan, Series 23, 0.10% 3/10/20284 | | | 7,439,197 | | | | 58,866 | |
| Japan, Series 24, 0.10% 3/10/20294 | | | 646,845 | | | | 5,123 | |
| Japan, Series 26, 0.005% 3/10/20314 | | | 2,491,332 | | | | 19,733 | |
| Japan, Series 362, 0.10% 3/20/2031 | | | 4,272,600 | | | | 31,497 | |
| Japan, Series 363, 0.10% 6/20/2031 | | | 850,000 | | | | 6,260 | |
| Japan, Series 367, 0.20% 6/20/2032 | | | 9,112,050 | | | | 67,985 | |
| Japan, Series 152, 1.20% 3/20/2035 | | | 10,223,300 | | | | 81,562 | |
| Japan, Series 161, 0.60% 6/20/2037 | | | 2,535,250 | | | | 18,329 | |
| Japan, Series 162, 0.60% 9/20/2037 | | | 10,420,000 | | | | 75,020 | |
| Japan, Series 173, 0.40% 6/20/2040 | | | 462,750 | | | | 3,082 | |
| Japan, Series 176, 0.50% 3/20/2041 | | | 741,900 | | | | 4,970 | |
| Japan, Series 53, 0.60% 12/20/2046 | | | 971,800 | | | | 6,158 | |
| Japan, Series 37, 0.60% 6/20/2050 | | | 5,218,850 | | | | 31,434 | |
| Japan, Series 70, 0.70% 3/20/2051 | | | 2,521,150 | | | | 15,470 | |
| Japan, Series 73, 0.70% 12/20/2051 | | | 7,338,050 | | | | 44,794 | |
| Japan, Series 74, 1.00% 3/20/2052 | | | 3,853,400 | | | | 25,449 | |
| Japan, Series 76, 1.40% 9/20/2052 | | | 1,910,000 | | | | 13,928 | |
| Lloyds Banking Group PLC 0.65% 5/30/2023 | | | 400,000 | | | | 3,046 | |
| Philippines (Republic of) 0.001% 4/12/2024 | | | 5,700,000 | | | | 42,926 | |
| Société Générale 0.804% 10/12/2023 | | | 100,000 | | | | 757 | |
| Tunisia (Republic of) 3.28% 8/9/2027 | | | 700,000 | | | | 2,766 | |
| United Mexican States 0.60% 4/20/2023 | | | 700,000 | | | | 5,337 | |
| | | | | | | | 678,626 | |
| | | | | | | | | |
| Chinese yuan renminbi 3.81% | | | | | | | | |
| China (People’s Republic of), Series INBK, 2.36% 7/2/2023 | | CNY | 7,690 | | | | 1,107 | |
| China (People’s Republic of), Series INBK, 2.26% 2/24/2025 | | | 7,680 | | | | 1,100 | |
| China (People’s Republic of), Series INBK, 1.99% 4/9/2025 | | | 20,000 | | | | 2,849 | |
| China (People’s Republic of), Series INBK, 2.69% 8/12/2026 | | | 121,000 | | | | 17,438 | |
| China (People’s Republic of), Series INBK, 2.85% 6/4/2027 | | | 7,320 | | | | 1,061 | |
| China (People’s Republic of), Series 1915, 3.13% 11/21/2029 | | | 75,090 | | | | 11,035 | |
| China (People’s Republic of), Series INBK, 3.02% 5/27/2031 | | | 18,000 | | | | 2,621 | |
| China (People’s Republic of), Series INBK, 2.75% 2/17/2032 | | | 180,720 | | | | 25,675 | |
| China (People’s Republic of), Series 1910, 3.86% 7/22/2049 | | | 570,100 | | | | 90,784 | |
| China (People’s Republic of), Series INBK, 3.39% 3/16/2050 | | | 121,120 | | | | 17,797 | |
| China (People’s Republic of), Series INBK, 3.81% 9/14/2050 | | | 309,790 | | | | 48,955 | |
| China (People’s Republic of), Series INBK, 3.72% 4/12/2051 | | | 12,000 | | | | 1,874 | |
| China (People’s Republic of), Series INBK, 3.53% 10/18/2051 | | | 237,360 | | | | 35,864 | |
| China (People’s Republic of), Series INBK, 3.32% 4/15/2052 | | | 3,790 | | | | 557 | |
| China Development Bank Corp., Series 2008, 2.89% 6/22/2025 | | | 258,050 | | | | 37,453 | |
| China Development Bank Corp., Series 1904, 3.68% 2/26/2026 | | | 95,130 | | | | 14,102 | |
| China Development Bank Corp., Series 1909, 3.50% 8/13/2026 | | | 48,800 | | | | 7,216 | |
| China Development Bank Corp., Series 2004, 3.43% 1/14/2027 | | | 57,380 | | | | 8,436 | |
| China Development Bank Corp., Series 1805, 4.88% 2/9/2028 | | | 232,310 | | | | 36,621 | |
| | | | | | | | 362,545 | |
| Bonds, notes & other debt instruments (continued) | | Principal amount
(000) | | | Value
(000) | |
| British pounds 3.75% | | | | | | | | |
| Abertis Infraestructuras, SA 3.375% 11/27/2026 | | GBP | 4,500 | | | $ | 4,932 | |
| Asian Development Bank 1.125% 6/10/2025 | | | 9,320 | | | | 10,470 | |
| Comcast Corp. 1.50% 2/20/2029 | | | 600 | | | | 597 | |
| Comcast Corp. 1.875% 2/20/2036 | | | 400 | | | | 343 | |
| Fiserv, Inc. 2.25% 7/1/2025 | | | 150 | | | | 169 | |
| HSBC Holdings PLC 3.00% 5/29/2030 (1-year EUR Annual (vs. 6-month GBP-LIBOR) + 1.77% on 5/29/2029)1 | | | 8,000 | | | | 8,018 | |
| KfW 1.125% 7/4/2025 | | | 6,625 | | | | 7,423 | |
| Lloyds Banking Group PLC 7.625% 4/22/2025 | | | 450 | | | | 574 | |
| Nestlé Finance International, Ltd. 2.25% 11/30/2023 | | | 400 | | | | 477 | |
| Quebec (Province of) 2.25% 9/15/2026 | | | 18,480 | | | | 20,588 | |
| United Kingdom 0.125% 1/31/2023 | | | 3,700 | | | | 4,464 | |
| United Kingdom 0.625% 6/7/2025 | | | 2,100 | | | | 2,370 | |
| United Kingdom 0.125% 1/30/2026 | | | 9,370 | | | | 10,217 | |
| United Kingdom 1.25% 7/22/2027 | | | 52,590 | | | | 57,312 | |
| United Kingdom 4.25% 12/7/2027 | | | 9,590 | | | | 11,904 | |
| United Kingdom 0.875% 10/22/2029 | | | 660 | | | | 668 | |
| United Kingdom 0.375% 10/22/2030 | | | 26,030 | | | | 24,599 | |
| United Kingdom 0.25% 7/31/2031 | | | 32,480 | | | | 29,432 | |
| United Kingdom 1.00% 1/31/2032 | | | 70,490 | | | | 67,493 | |
| United Kingdom 4.25% 6/7/2032 | | | 25,890 | | | | 32,762 | |
| United Kingdom 0.625% 7/31/2035 | | | 1,708 | | | | 1,391 | |
| United Kingdom 1.75% 9/7/2037 | | | 8,230 | | | | 7,489 | |
| United Kingdom 3.25% 1/22/2044 | | | 10,110 | | | | 10,839 | |
| United Kingdom 3.50% 1/22/2045 | | | 4,905 | | | | 5,460 | |
| United Kingdom 0.875% 1/31/2046 | | | 1,830 | | | | 1,173 | |
| United Kingdom 0.625% 10/22/2050 | | | 1,190 | | | | 642 | |
| United Kingdom 1.25% 7/31/2051 | | | 45,224 | | | | 29,567 | |
| United Kingdom 1.50% 7/31/2053 | | | 200 | | | | 139 | |
| United Kingdom 1.625% 10/22/2054 | | | 590 | | | | 422 | |
| United Kingdom 0.50% 10/22/2061 | | | 3,470 | | | | 1,498 | |
| United Kingdom 1.125% 10/22/2073 | | | 1,900 | | | | 1,006 | |
| Vodafone Group PLC 5.625% 12/4/2025 | | | 540 | | | | 669 | |
| Volkswagen Financial Services NV 0.875% 2/20/2025 | | | 1,000 | | | | 1,093 | |
| Volkswagen Group of America Finance, LLC 3.375% 11/16/2026 | | | 700 | | | | 774 | |
| | | | | | | | 356,974 | |
| | | | | | | | | |
| Canadian dollars 2.75% | | | | | | | | |
| AT&T, Inc. 5.10% 11/25/2048 | | | CAD400 | | | | 263 | |
| Canada 0.75% 10/1/2024 | | | 115,050 | | | | 80,295 | |
| Canada 2.25% 6/1/2025 | | | 92,350 | | | | 65,836 | |
| Canada 3.50% 3/1/2028 | | | 129,139 | | | | 95,876 | |
| Canada 4.00% 6/1/2041 | | | 1,725 | | | | 1,385 | |
| Canada 3.50% 12/1/2045 | | | 2,970 | | | | 2,253 | |
| Canada 2.75% 12/1/2048 | | | 22,100 | | | | 14,759 | |
| Toronto-Dominion Bank 7.283% 10/31/2082 (5-year Canada Government Bond + 4.10% on 10/31/2027)1 | | | 1,256 | | | | 899 | |
| Verizon Communications, Inc. 3.625% 5/16/2050 | | | 1,280 | | | | 682 | |
| | | | | | | | 262,248 | |
| | | | | | | | | |
| Danish kroner 1.92% | | | | | | | | |
| Nordea Kredit 0.50% 10/1/20405 | | DKK | 100,773 | | | | 11,271 | |
| Nykredit Realkredit AS, Series 01E, 2.00% 7/1/20375 | | | 16,147 | | | | 2,072 | |
| Nykredit Realkredit AS, Series 01E, 0.50% 10/1/20405 | | | 471,201 | | | | 52,666 | |
| Nykredit Realkredit AS, Series 01E, 1.50% 10/1/20405 | | | 97,564 | | | | 12,007 | |
| Nykredit Realkredit AS, Series 01E, 0.50% 10/1/20435 | | | 735,283 | | | | 80,151 | |
| Nykredit Realkredit AS, Series 01E, 2.50% 10/1/20475 | | | 7,323 | | | | 940 | |
| Nykredit Realkredit AS, Series CCE, 1.00% 10/1/20505 | | | 52,966 | | | | 5,623 | |
| Nykredit Realkredit AS, Series 01E, 1.00% 10/1/20535 | | | 149,287 | | | | 15,662 | |
| Realkredit Danmark AS 1.00% 10/1/20535 | | | 20,052 | | | | 2,106 | |
| | | | | | | | 182,498 | |
| | | | | | | | | |
| Australian dollars 1.87% | | | | | | | | |
| Australia (Commonwealth of), Series 139, 3.25% 4/21/2025 | | AUD | 29,250 | | | | 19,825 | |
| Australia (Commonwealth of), Series 152, 2.75% 11/21/2028 | | | 21,890 | | | | 14,103 | |
| Australia (Commonwealth of), Series 166, 3.00% 11/21/2033 | | | 98,900 | | | | 61,008 | |
| Australia (Commonwealth of), Series 167, 3.75% 5/21/2034 | | | 126,305 | | | | 83,276 | |
| | | | | | | | 178,212 | |
| 10 | Capital World Bond Fund |
| Bonds, notes & other debt instruments (continued) | | Principal amount
(000) | | | Value
(000) | |
| Mexican pesos 1.57% | | | | | | | | |
| América Móvil, SAB de CV, 8.46% 12/18/2036 | | MXN | 15,000 | | | $ | 665 | |
| Petróleos Mexicanos 7.19% 9/12/2024 | | | 340,342 | | | | 16,199 | |
| United Mexican States, Series M20, 10.00% 12/5/2024 | | | 22,960 | | | | 1,182 | |
| United Mexican States 4.50% 12/4/20254 | | | 560,208 | | | | 28,599 | |
| United Mexican States, Series M, 5.75% 3/5/2026 | | | 384,550 | | | | 17,875 | |
| United Mexican States, Series M, 7.50% 6/3/2027 | | | 35,144 | | | | 1,702 | |
| United Mexican States, Series M20, 8.50% 5/31/2029 | | | 136,880 | | | | 6,837 | |
| United Mexican States, Series M, 7.75% 5/29/2031 | | | 561,882 | | | | 26,705 | |
| United Mexican States, Series M, 7.75% 11/13/2042 | | | 46,806 | | | | 2,098 | |
| United Mexican States, Series M, 8.00% 11/7/2047 | | | 101,421 | | | | 4,645 | |
| United Mexican States, Series M, 8.00% 7/31/2053 | | | 934,110 | | | | 42,751 | |
| | | | | | | | 149,258 | |
| | | | | | | | | |
| Colombian pesos 0.65% | | | | | | | | |
| Colombia (Republic of), Series B, 5.75% 11/3/2027 | | COP | 52,550,400 | | | | 8,222 | |
| Colombia (Republic of), Series B, 7.00% 3/26/2031 | | | 243,557,400 | | | | 35,584 | |
| Colombia (Republic of), Series B, 7.00% 6/30/2032 | | | 643,700 | | | | 91 | |
| Colombia (Republic of), Series B, 7.25% 10/18/2034 | | | 20,545,400 | | | | 2,801 | |
| Colombia (Republic of), Series B, 9.25% 5/28/2042 | | | 10,708,000 | | | | 1,601 | |
| Colombia (Republic of), Series B, 7.25% 10/26/2050 | | | 112,220,200 | | | | 13,173 | |
| | | | | | | | 61,472 | |
| | | | | | | | | |
| Indonesian rupiah 0.48% | | | | | | | | |
| Indonesia (Republic of), Series 63, 5.625% 5/15/2023 | | IDR | 191,100,000 | | | | 12,300 | |
| Indonesia (Republic of), Series 81, 6.50% 6/15/2025 | | | 108,958,000 | | | | 7,069 | |
| Indonesia (Republic of), Series 59, 7.00% 5/15/2027 | | | 18,459,000 | | | | 1,217 | |
| Indonesia (Republic of), Series 95, 6.375% 8/15/2028 | | | 23,973,000 | | | | 1,526 | |
| Indonesia (Republic of), Series 78, 8.25% 5/15/2029 | | | 175,983,000 | | | | 12,184 | |
| Indonesia (Republic of), Series 91, 6.375% 4/15/2032 | | | 18,204,000 | | | | 1,127 | |
| Indonesia (Republic of), Series 68, 8.375% 3/15/2034 | | | 143,268,000 | | | | 10,089 | |
| | | | | | | | 45,512 | |
| | | | | | | | | |
| South Korean won 0.37% | | | | | | | | |
| South Korea (Republic of), Series 2712, 2.375% 12/10/2027 | | KRW | 28,587,150 | | | | 21,175 | |
| South Korea (Republic of), Series 3106, 2.00% 6/10/2031 | | | 21,008,450 | | | | 14,486 | |
| | | | | | | | 35,661 | |
| | | | | | | | | |
| Chilean pesos 0.36% | | | | | | | | |
| Chile (Republic of) 4.00% 3/1/2023 | | CLP | 19,310,000 | | | | 22,509 | |
| Chile (Republic of) 4.70% 9/1/2030 | | | 9,460,000 | | | | 10,762 | |
| Chile (Republic of) 5.00% 3/1/2035 | | | 610,000 | | | | 713 | |
| | | | | | | | 33,984 | |
| | | | | | | | | |
| Brazilian reais 0.25% | | | | | | | | |
| Brazil (Federative Republic of) 10.00% 1/1/2025 | | BRL | 30,868 | | | | 5,593 | |
| Brazil (Federative Republic of) 0% 7/1/2025 | | | 59,423 | | | | 8,375 | |
| Brazil (Federative Republic of) 6.00% 8/15/20264 | | | 10,960 | | | | 2,100 | |
| Brazil (Federative Republic of) 10.00% 1/1/2027 | | | 6,665 | | | | 1,161 | |
| Brazil (Federative Republic of) 10.00% 1/1/2029 | | | 33,000 | | | | 5,603 | |
| Brazil (Federative Republic of) 10.00% 1/1/2031 | | | 3,600 | | | | 596 | |
| | | | | | | | 23,428 | |
| | | | | | | | | |
| South African rand 0.23% | | | | | | | | |
| South Africa (Republic of), Series R-2030, 8.00% 1/31/2030 | | ZAR | 135,770 | | | | 7,126 | |
| South Africa (Republic of), Series R-213, 7.00% 2/28/2031 | | | 34,971 | | | | 1,662 | |
| South Africa (Republic of), Series R-2032, 8.25% 3/31/2032 | | | 59,094 | | | | 2,967 | |
| South Africa (Republic of), Series R-2037, 8.50% 1/31/2037 | | | 27,171 | | | | 1,269 | |
| South Africa (Republic of), Series R-2040, 9.00% 1/31/2040 | | | 47,946 | | | | 2,284 | |
| South Africa (Republic of), Series R-214, 6.50% 2/28/2041 | | | 15,200 | | | | 560 | |
| South Africa (Republic of), Series R-2048, 8.75% 2/28/2048 | | | 124,891 | | | | 5,747 | |
| | | | | | | | 21,615 | |
| | | | | | | | | |
| Russian rubles 0.22% | | | | | | | | |
| Russian Federation 7.00% 1/25/20233,6 | | RUB | 85,315 | | | | 393 | |
| Russian Federation 8.15% 2/3/20273,6 | | | 188,225 | | | | 868 | |
| Russian Federation 2.50% 2/2/20283,4 | | | 34 | | | | — | 7 |
| Russian Federation 7.65% 4/10/20303 | | | 3,700,170 | | | | 16,055 | |
| Capital World Bond Fund | 11 |
| Bonds, notes & other debt instruments (continued) | | Principal amount
(000) | | | Value
(000) | |
| Russian rubles (continued) | | | | | | | | |
| Russian Federation 6.90% 7/23/20313 | | RUB | 668,992 | | | $ | 2,903 | |
| Russian Federation 7.70% 3/23/20333 | | | 102,563 | | | | 445 | |
| Russian Federation 6.10% 7/18/20353 | | | 95,606 | | | | 415 | |
| | | | | | | | 21,079 | |
| | | | | | | | | |
| Dominican pesos 0.15% | | | | | | | | |
| Dominican Republic 8.90% 2/15/2023 | | DOP | 833,350 | | | | 14,787 | |
| | | | | | | | | |
| | | | | | | | | |
| Malaysian ringgits 0.15% | | | | | | | | |
| Malaysia (Federation of), Series 0313, 3.48% 3/15/2023 | | MYR | 7,510 | | | | 1,704 | |
| Malaysia (Federation of), Series 0116, 3.80% 8/17/2023 | | | 10,770 | | | | 2,448 | |
| Malaysia (Federation of), Series 0120, 3.422% 9/30/2027 | | | 7,064 | | | | 1,574 | |
| Malaysia (Federation of), Series 0415, 4.254% 5/31/2035 | | | 6,900 | | | | 1,574 | |
| Malaysia (Federation of), Series 0317, 4.762% 4/7/2037 | | | 8,830 | | | | 2,108 | |
| Malaysia (Federation of), Series 0219, 4.467% 9/15/2039 | | | 8,000 | | | | 1,829 | |
| Malaysia (Federation of), Series 0519, 3.757% 5/22/2040 | | | 10,030 | | | | 2,105 | |
| Malaysia (Federation of), Series 0221, 4.417% 9/30/2041 | | | 1,281 | | | | 290 | |
| Malaysia (Federation of), Series 0120, 4.065% 6/15/2050 | | | 2,081 | | | | 432 | |
| | | | | | | | 14,064 | |
| | | | | | | | | |
| Polish zloty 0.13% | | | | | | | | |
| Poland (Republic of), Series 0727, 2.50% 7/25/2027 | | PLN | 39,070 | | | | 7,434 | |
| Poland (Republic of), Series 1029, 2.75% 10/25/2029 | | | 26,990 | | | | 4,843 | |
| | | | | | | | 12,277 | |
| | | | | | | | | |
| Ukrainian hryvnia 0.11% | | | | | | | | |
| Ukraine 15.97% 4/19/20236 | | UAH | 306,105 | | | | 6,219 | |
| Ukraine 10.00% 8/23/2023 | | | 17,650 | | | | 286 | |
| Ukraine 16.00% 9/27/20236 | | | 34,420 | | | | 559 | |
| Ukraine 15.84% 2/26/2025 | | | 201,785 | | | | 3,385 | |
| Ukraine 15.84% 2/26/20253 | | | 9,100 | | | | 153 | |
| | | | | | | | 10,602 | |
| | | | | | | | | |
| Thai baht 0.10% | | | | | | | | |
| Thailand (Kingdom of) 3.625% 6/16/2023 | | THB | 40,957 | | | | 1,196 | |
| Thailand (Kingdom of) 2.125% 12/17/2026 | | | 111,000 | | | | 3,251 | |
| Thailand (Kingdom of) 1.00% 6/17/2027 | | | 44,686 | | | | 1,240 | |
| Thailand (Kingdom of) 3.65% 6/20/2031 | | | 108,200 | | | | 3,410 | |
| Thailand (Kingdom of) 3.30% 6/17/2038 | | | 10,430 | | | | 306 | |
| Thailand (Kingdom of) 2.00% 6/17/2042 | | | 12,988 | | | | 303 | |
| | | | | | | | 9,706 | |
| | | | | | | | | |
| Indian rupees 0.10% | | | | | | | | |
| HDFC Bank, Ltd. 7.95% 9/21/2026 | | INR | 200,000 | | | | 2,445 | |
| India (Republic of) 5.15% 11/9/2025 | | | 624,800 | | | | 7,173 | |
| | | | | | | | 9,618 | |
| | | | | | | | | |
| Czech korunas 0.07% | | | | | | | | |
| Czech Republic 0.45% 10/25/2023 | | CZK | 39,840 | | | | 1,680 | |
| Czech Republic 2.40% 9/17/2025 | | | 128,310 | | | | 5,274 | |
| | | | | | | | 6,954 | |
| | | | | | | | | |
| Israeli shekels 0.05% | | | | | | | | |
| Israel (State of) 0.15% 7/31/2023 | | ILS | 4,755 | | | | 1,326 | |
| Israel (State of) 3.75% 3/31/2024 | | | 6,465 | | | | 1,840 | |
| Israel (State of) 0.50% 4/30/2025 | | | 7,001 | | | | 1,849 | |
| | | | | | | | 5,015 | |
| | | | | | | | | |
| Hungarian forints 0.04% | | | | | | | | |
| Hungary (Republic of), Series C, 1.50% 8/23/2023 | | HUF | 1,046,820 | | | | 2,624 | |
| Hungary (Republic of), Series A, 6.75% 10/22/2028 | | | 426,050 | | | | 994 | |
| | | | | | | | 3,618 | |
| 12 | Capital World Bond Fund |
| Bonds, notes & other debt instruments (continued) | | Principal amount
(000) | | | Value
(000) | |
| Peruvian nuevos soles 0.03% | | | | | | | | |
| Peru (Republic of) 5.94% 2/12/2029 | | PEN | 7,717 | | | $ | 1,864 | |
| Peru (Republic of) 5.40% 8/12/2034 | | | 4,409 | | | | 930 | |
| Peru (Republic of) 6.90% 8/12/2037 | | | 907 | | | | 214 | |
| Peru (Republic of) 6.85% 2/12/2042 | | | 929 | | | | 216 | |
| | | | | | | | 3,224 | |
| | | | | | | | | |
| Romanian leu 0.03% | | | | | | | | |
| Romania 4.75% 2/24/2025 | | RON | 11,740 | | | | 2,436 | |
| | | | | | | | | |
| | | | | | | | | |
| Norwegian kroner 0.02% | | | | | | | | |
| Norway (Kingdom of) 2.125% 5/18/2032 | | NOK | 18,660 | | | | 1,747 | |
| | | | | | | | | |
| | | | | | | | | |
| New Zealand dollars 0.01% | | | | | | | | |
| New Zealand 2.00% 5/15/2032 | | NZD | 1,350 | | | | 697 | |
| | | | | | | | | |
| | | | | | | | | |
| U.S. dollars 48.89% | | | | | | | | |
| 1375209 BC, Ltd. 9.00% 1/30/20288 | | USD | 335 | | | | 328 | |
| 7-Eleven, Inc. 1.30% 2/10/20288 | | | 361 | | | | 300 | |
| 7-Eleven, Inc. 1.80% 2/10/20318 | | | 6,811 | | | | 5,217 | |
| AbbVie, Inc. 3.20% 11/21/2029 | | | 1,004 | | | | 907 | |
| Abu Dhabi (Emirate of) 0.75% 9/2/20238 | | | 18,355 | | | | 17,811 | |
| Abu Dhabi (Emirate of) 3.875% 4/16/2050 | | | 5,500 | | | | 4,680 | |
| Abu Dhabi National Energy Company PJSC (TAQA) 3.625% 1/12/20238 | | | 580 | | | | 579 | |
| Adobe, Inc. 2.15% 2/1/2027 | | | 6,134 | | | | 5,592 | |
| Advisor Group Holdings, LLC 6.25% 3/1/20288 | | | 1,830 | | | | 1,685 | |
| Aeropuerto International de Tocume SA 5.125% 8/11/20618 | | | 4,875 | | | | 4,007 | |
| Aethon United BR, LP / Aethon United Finance Corp. 8.25% 2/15/20268 | | | 675 | | | | 670 | |
| AG Merger Sub II, Inc. 10.75% 8/1/20278 | | | 1,278 | | | | 1,296 | |
| AG TTMT Escrow Issuer, LLC 8.625% 9/30/20278 | | | 602 | | | | 608 | |
| AIB Group PLC 7.583% 10/14/2026 (USD-SOFR + 3.456% on 10/14/2025)1,8 | | | 7,600 | | | | 7,746 | |
| Alabama Power Co. 3.00% 3/15/2052 | | | 7,280 | | | | 4,840 | |
| Albertsons Companies, Inc. 4.625% 1/15/20278 | | | 500 | | | | 466 | |
| Albertsons Companies, Inc. 3.50% 3/15/20298 | | | 2,185 | | | | 1,838 | |
| Alibaba Group Holding, Ltd. 2.125% 2/9/2031 | | | 507 | | | | 405 | |
| Allegheny Technologies, Inc. 4.875% 10/1/2029 | | | 262 | | | | 232 | |
| Allegheny Technologies, Inc. 5.125% 10/1/2031 | | | 323 | | | | 286 | |
| Alliant Holdings Intermediate, LLC 6.75% 10/15/20278 | | | 1,240 | | | | 1,117 | |
| Alliant Holdings Intermediate, LLC 5.875% 11/1/20298 | | | 565 | | | | 465 | |
| Allied Universal Holdco, LLC 9.75% 7/15/20278 | | | 590 | | | | 515 | |
| Allied Universal Holdco, LLC 6.00% 6/1/20298 | | | 320 | | | | 233 | |
| Allstate Corp. 0.75% 12/15/2025 | | | 440 | | | | 391 | |
| Almonde, Inc., Term Loan, (3-month USD-LIBOR + 7.25%) 10.621% 6/13/20259,10 | | | 650 | | | | 489 | |
| Altera Infrastructure, LP 8.50% 7/15/20233,6,8 | | | 30 | | | | 6 | |
| Altice France Holding SA 10.50% 5/15/20278 | | | 665 | | | | 509 | |
| Altice France SA 5.125% 7/15/20298 | | | 390 | | | | 293 | |
| Amazon.com, Inc. 4.60% 12/1/2025 | | | 4,539 | | | | 4,533 | |
| Amazon.com, Inc. 3.30% 4/13/2027 | | | 1,404 | | | | 1,335 | |
| Amazon.com, Inc. 3.45% 4/13/2029 | | | 1,045 | | | | 978 | |
| Amazon.com, Inc. 4.70% 12/1/2032 | | | 798 | | | | 792 | |
| Amazon.com, Inc. 3.875% 8/22/2037 | | | 375 | | | | 334 | |
| American Express Co. 5.85% 11/5/2027 | | | 1,425 | | | | 1,486 | |
| American Express Co. 4.05% 5/3/2029 | | | 3,590 | | | | 3,426 | |
| American Honda Finance Corp. 3.55% 1/12/2024 | | | 1,000 | | | | 987 | |
| American Honda Finance Corp. 1.30% 9/9/2026 | | | 1,000 | | | | 884 | |
| American International Group, Inc. 4.80% 7/10/2045 | | | 500 | | | | 451 | |
| American International Group, Inc. 4.375% 6/30/2050 | | | 1,773 | | | | 1,509 | |
| American Tower Corp. 1.60% 4/15/2026 | | | 1,562 | | | | 1,391 | |
| American Tower Corp. 1.45% 9/15/2026 | | | 300 | | | | 262 | |
| American Tower Corp. 2.70% 4/15/2031 | | | 572 | | | | 467 | |
| AmerisourceBergen Corp. 2.70% 3/15/2031 | | | 3,838 | | | | 3,195 | |
| Amgen, Inc. 1.90% 2/21/2025 | | | 3,077 | | | | 2,889 | |
| Amgen, Inc. 2.20% 2/21/2027 | | | 2,359 | | | | 2,120 | |
| Amgen, Inc. 3.00% 2/22/2029 | | | 75 | | | | 67 | |
| Amgen, Inc. 4.05% 8/18/2029 | | | 2,275 | | | | 2,131 | |
| Amgen, Inc. 2.00% 1/15/2032 | | | 397 | | | | 311 | |
| Capital World Bond Fund | 13 |
| Bonds, notes & other debt instruments (continued) | | Principal amount
(000) | | | Value
(000) | |
| U.S. dollars (continued) | | | | | | | | |
| Amgen, Inc. 4.20% 3/1/2033 | | USD | 2,525 | | | $ | 2,344 | |
| Amgen, Inc. 4.875% 3/1/2053 | | | 1,409 | | | | 1,257 | |
| AmWINS Group, Inc. 4.875% 6/30/20298 | | | 1,455 | | | | 1,236 | |
| Anglo American Capital PLC 2.25% 3/17/20288 | | | 1,698 | | | | 1,431 | |
| Anglo American Capital PLC 5.625% 4/1/20308 | | | 3,850 | | | | 3,831 | |
| Anglo American Capital PLC 2.875% 3/17/20318 | | | 1,100 | | | | 901 | |
| Angola (Republic of) 9.50% 11/12/2025 | | | 10,050 | | | | 10,367 | |
| Angola (Republic of) 8.25% 5/9/2028 | | | 600 | | | | 549 | |
| Angola (Republic of) 8.00% 11/26/2029 | | | 4,368 | | | | 3,845 | |
| Anheuser-Busch InBev NV 4.75% 1/23/2029 | | | 12,403 | | | | 12,270 | |
| Anheuser-Busch InBev NV 5.55% 1/23/2049 | | | 1,767 | | | | 1,757 | |
| Anheuser-Busch InBev NV 4.50% 6/1/2050 | | | 3,400 | | | | 2,992 | |
| Anthem, Inc. 4.10% 5/15/2032 | | | 1,478 | | | | 1,379 | |
| Anthem, Inc. 4.55% 5/15/2052 | | | 657 | | | | 574 | |
| Anywhere Real Estate Group, LLC 5.75% 1/15/20298 | | | 825 | | | | 625 | |
| Anywhere Real Estate Group, LLC 5.25% 4/15/20308 | | | 380 | | | | 278 | |
| Aon Corp. 2.60% 12/2/2031 | | | 1,750 | | | | 1,433 | |
| Aon Corp. 5.00% 9/12/2032 | | | 2,000 | | | | 1,984 | |
| Aon Corp. 3.90% 2/28/2052 | | | 500 | | | | 388 | |
| Apple, Inc. 3.35% 8/8/2032 | | | 3,000 | | | | 2,732 | |
| Apple, Inc. 2.375% 2/8/2041 | | | 1,625 | | | | 1,155 | |
| Apple, Inc. 2.70% 8/5/2051 | | | 1,450 | | | | 963 | |
| Ardagh Group SA 6.50% Cash 6/30/20278,11 | | | 577 | | | | 403 | |
| Ardagh Metal Packaging Finance USA, LLC 6.00% 6/15/20278 | | | 215 | | | | 211 | |
| Aretec Escrow Issuer, Inc. 7.50% 4/1/20298 | | | 745 | | | | 616 | |
| Argentine Republic 0.50% 7/9/2030 (0.75% on 7/9/2023)1 | | | 25,846 | | | | 7,035 | |
| Argentine Republic 1.50% 7/9/2035 (3.625% on 7/9/2023)1 | | | 12,463 | | | | 3,192 | |
| Asbury Automotive Group, Inc. 5.00% 2/15/20328 | | | 350 | | | | 288 | |
| Ascensus, Inc., Term Loan, (3-month USD-LIBOR + 6.50%) 10.25% 8/2/20299,10 | | | 515 | | | | 453 | |
| Ascent Resources Utica Holdings, LLC 7.00% 11/1/20268 | | | 1,025 | | | | 996 | |
| Ascent Resources Utica Holdings, LLC 8.25% 12/31/20288 | | | 592 | | | | 581 | |
| Ascent Resources Utica Holdings, LLC 5.875% 6/30/20298 | | | 220 | | | | 196 | |
| Ashtead Capital, Inc. 5.50% 8/11/20328 | | | 400 | | | | 384 | |
| Asian Development Bank 4.125% 9/27/2024 | | | 1,025 | | | | 1,015 | |
| Asian Development Bank 3.875% 9/28/2032 | | | 237 | | | | 233 | |
| AssuredPartners, Inc. 7.00% 8/15/20258 | | | 470 | | | | 455 | |
| AssuredPartners, Inc. 8.00% 5/15/20278 | | | 486 | | | | 466 | |
| AssuredPartners, Inc. 5.625% 1/15/20298 | | | 1,420 | | | | 1,171 | |
| AstraZeneca Finance, LLC 1.75% 5/28/2028 | | | 4,864 | | | | 4,184 | |
| AstraZeneca Finance, LLC 2.25% 5/28/2031 | | | 7,178 | | | | 5,989 | |
| AstraZeneca PLC 4.00% 1/17/2029 | | | 1,000 | | | | 962 | |
| AstraZeneca PLC 1.375% 8/6/2030 | | | 360 | | | | 285 | |
| AT&T, Inc. 2.30% 6/1/2027 | | | 1,625 | | | | 1,448 | |
| AT&T, Inc. 1.65% 2/1/2028 | | | 4,206 | | | | 3,559 | |
| AT&T, Inc. 2.75% 6/1/2031 | | | 10,851 | | | | 9,020 | |
| AT&T, Inc. 2.25% 2/1/2032 | | | 5,900 | | | | 4,640 | |
| AT&T, Inc. 2.55% 12/1/2033 | | | 800 | | | | 617 | |
| AT&T, Inc. 3.50% 9/15/2053 | | | 1,347 | | | | 915 | |
| Atlantic Aviation FBO, Inc., Term Loan, (3-month USD-LIBOR + 5.75%) 10.134% 9/21/20299,10 | | | 1,800 | | | | 1,747 | |
| Australia & New Zealand Banking Group, Ltd. 5.088% 12/8/2025 | | | 2,059 | | | | 2,070 | |
| Australia & New Zealand Banking Group, Ltd. 6.742% 12/8/20328 | | | 2,942 | | | | 2,980 | |
| Avantor Funding, Inc. 4.625% 7/15/20288 | | | 1,050 | | | | 956 | |
| Avantor Funding, Inc. 3.875% 11/1/20298 | | | 630 | | | | 530 | |
| Axiata SPV2 Bhd. 2.163% 8/19/2030 | | | 451 | | | | 365 | |
| B&G Foods, Inc. 5.25% 4/1/2025 | | | 410 | | | | 360 | |
| B&G Foods, Inc. 5.25% 9/15/2027 | | | 1,180 | | | | 907 | |
| Bahrain (Kingdom of) 6.125% 8/1/2023 | | | 1,000 | | | | 1,001 | |
| Baker Hughes Co. 4.486% 5/1/2030 | | | 2,288 | | | | 2,186 | |
| Ball Corp. 6.875% 3/15/2028 | | | 665 | | | | 684 | |
| Banco Santander, SA 5.147% 8/18/2025 | | | 7,000 | | | | 6,930 | |
| Bangkok Bank PCL 4.05% 3/19/2024 | | | 1,210 | | | | 1,193 | |
| Bangkok Bank PCL 4.45% 9/19/2028 | | | 470 | | | | 449 | |
| Bangkok Bank PCL 9.025% 3/15/2029 | | | 980 | | | | 1,087 | |
| Bangkok Bank PCL 3.733% 9/25/2034 (5-year UST Yield Curve Rate T Note Constant Maturity + 1.90% on 9/25/2029)1 | | | 9,080 | | | | 7,607 | |
| Bangkok Bank PCL 3.733% 9/25/2034 (5-year UST Yield Curve Rate T Note Constant Maturity + 1.90% on 9/25/2029)1,8 | | | 290 | | | | 243 | |
| Bank of America Corp. 1.319% 6/19/2026 (USD-SOFR + 1.15% on 6/19/2025)1 | | | 15,500 | | | | 13,971 | |
| 14 | Capital World Bond Fund |
| Bonds, notes & other debt instruments (continued) | | Principal amount
(000) | | | Value
(000) | |
| U.S. dollars (continued) | | | | | | | | |
| Bank of America Corp. 1.734% 7/22/2027 (USD-SOFR + 0.96% on 7/22/2026)1 | | USD | 13,616 | | | $ | 11,946 | |
| Bank of America Corp. 2.496% 2/13/2031 (3-month USD-LIBOR + 0.99% on 2/13/2030)1 | | | 8,240 | | | | 6,715 | |
| Bank of America Corp. 1.898% 7/23/2031 (USD-SOFR + 1.53% on 7/23/2030)1 | | | 6,083 | | | | 4,682 | |
| Bank of America Corp. 5.015% 7/22/2033 (USD-SOFR + 2.16% on 7/22/2032)1 | | | 2,712 | | | | 2,583 | |
| Bank of Ireland Group PLC 6.253% 9/16/2026 (1-year UST Yield Curve Rate T Note Constant Maturity + 2.65% on 9/16/2025)1,8 | | | 350 | | | | 347 | |
| Barclays Bank PLC 5.304% 8/9/2026 (1-year UST Yield Curve Rate T Note Constant Maturity + 2.30% on 8/9/2025)1 | | | 14,450 | | | | 14,356 | |
| Barclays Bank PLC 5.501% 8/9/2028 (1-year UST Yield Curve Rate T Note Constant Maturity + 2.65% on 8/5/2027)1 | | | 8,500 | | | | 8,246 | |
| Bath & Body Works, Inc. 6.625% 10/1/20308 | | | 565 | | | | 531 | |
| Bath & Body Works, Inc. 6.875% 11/1/2035 | | | 753 | | | | 671 | |
| Bausch Health Americas, Inc. 9.25% 4/1/20268 | | | 1,642 | | | | 1,152 | |
| Bausch Health Companies, Inc. 9.00% 12/15/20258 | | | 175 | | | | 138 | |
| Bausch Health Companies, Inc. 5.75% 8/15/20278 | | | 525 | | | | 358 | |
| Bausch Health Companies, Inc. 7.25% 5/30/20298 | | | 700 | | | | 339 | |
| Bausch Health Companies, Inc. 14.00% 10/15/20308 | | | 1,000 | | | | 599 | |
| Bausch Health Companies, Inc. 5.25% 2/15/20318 | | | 1,125 | | | | 547 | |
| Baxter International, Inc. 2.539% 2/1/2032 | | | 4,989 | | | | 3,976 | |
| Bayer US Finance II, LLC 3.875% 12/15/20238 | | | 5,690 | | | | 5,610 | |
| Bayer US Finance II, LLC 4.25% 12/15/20258 | | | 557 | | | | 540 | |
| Bayerische Motoren Werke AG 3.80% 4/6/20238 | | | 2,028 | | | | 2,023 | |
| Bayerische Motoren Werke AG 3.15% 4/18/20248 | | | 2,555 | | | | 2,493 | |
| Bayerische Motoren Werke AG 3.90% 4/9/20258 | | | 5,000 | | | | 4,896 | |
| Bayerische Motoren Werke AG 4.15% 4/9/20308 | | | 5,000 | | | | 4,759 | |
| Bayerische Motoren Werke AG 2.55% 4/1/20318 | | | 737 | | | | 610 | |
| Becton, Dickinson and Company 2.823% 5/20/2030 | | | 1,950 | | | | 1,678 | |
| Becton, Dickinson and Company 4.298% 8/22/2032 | | | 2,200 | | | | 2,066 | |
| Berkshire Hathaway Energy Company 2.85% 5/15/2051 | | | 2,062 | | | | 1,360 | |
| Berkshire Hathaway Finance Corp. 4.25% 1/15/2049 | | | 1,225 | | | | 1,097 | |
| Berkshire Hathaway, Inc. 2.30% 3/15/2027 | | | 1,340 | | | | 1,239 | |
| Berkshire Hathaway, Inc. 2.875% 3/15/2032 | | | 532 | | | | 462 | |
| Berkshire Hathaway, Inc. 3.85% 3/15/2052 | | | 770 | | | | 618 | |
| BIP-V Chinook Holdco, LLC 5.50% 6/15/20318 | | | 815 | | | | 713 | |
| Blackstone Holdings Finance Co., LLC 5.90% 11/3/20278 | | | 2,435 | | | | 2,457 | |
| Blackstone Holdings Finance Co., LLC 6.20% 4/22/20338 | | | 695 | | | | 703 | |
| Blue Racer Midstream, LLC 7.625% 12/15/20258 | | | 890 | | | | 884 | |
| Bluestar Finance Holdings, Ltd. 3.10% junior subordinated perpetual bonds (3-year UST Yield Curve Rate T Note Constant Maturity + 5.634% on 7/12/2024)1 | | | 526 | | | | 504 | |
| BMC Software, Inc. 9.125% 3/1/20268 | | | 1,000 | | | | 945 | |
| BMW Finance NV 2.40% 8/14/20248 | | | 3,000 | | | | 2,876 | |
| BNP Paribas SA 2.159% 9/15/2029 (USD-SOFR + 1.218% on 9/15/2028)1,8 | | | 1,200 | | | | 980 | |
| BNP Paribas SA 2.871% 4/19/2032 (USD-SOFR + 1.387% on 4/19/2031)1,8 | | | 10,500 | | | | 8,235 | |
| Boeing Company 4.875% 5/1/2025 | | | 2,337 | | | | 2,321 | |
| Boeing Company 2.75% 2/1/2026 | | | 8,976 | | | | 8,328 | |
| Boeing Company 2.196% 2/4/2026 | | | 250 | | | | 227 | |
| Boeing Company 2.70% 2/1/2027 | | | 2,020 | | | | 1,826 | |
| Boeing Company 5.04% 5/1/2027 | | | 1,099 | | | | 1,089 | |
| Boeing Company 5.15% 5/1/2030 | | | 2,977 | | | | 2,912 | |
| Boeing Company 3.625% 2/1/2031 | | | 2,932 | | | | 2,576 | |
| Boeing Company 5.705% 5/1/2040 | | | 1,250 | | | | 1,197 | |
| Boeing Company 5.805% 5/1/2050 | | | 1,713 | | | | 1,597 | |
| Bombardier, Inc. 7.125% 6/15/20268 | | | 370 | | | | 360 | |
| Bombardier, Inc. 7.875% 4/15/20278 | | | 828 | | | | 805 | |
| Bombardier, Inc. 6.00% 2/15/20288 | | | 510 | | | | 472 | |
| Bombardier, Inc. 7.45% 5/1/20348 | | | 1,340 | | | | 1,347 | |
| Booz Allen Hamilton, Inc. 3.875% 9/1/20288 | | | 330 | | | | 293 | |
| Booz Allen Hamilton, Inc. 4.00% 7/1/20298 | | | 890 | | | | 785 | |
| Boston Scientific Corp. 3.45% 3/1/2024 | | | 1,217 | | | | 1,195 | |
| Boston Scientific Corp. 2.65% 6/1/2030 | | | 1,151 | | | | 986 | |
| Boston Scientific Corp. 4.70% 3/1/2049 | | | 119 | | | | 107 | |
| Boyd Gaming Corp. 4.75% 12/1/2027 | | | 805 | | | | 751 | |
| Boyd Gaming Corp. 4.75% 6/15/20318 | | | 260 | | | | 227 | |
| Boyne USA, Inc. 4.75% 5/15/20298 | | | 1,025 | | | | 908 | |
| BP Capital Markets America, Inc. 2.721% 1/12/2032 | | | 3,280 | | | | 2,743 | |
| Braskem Netherlands Finance BV 4.50% 1/31/20308 | | | 4,050 | | | | 3,454 | |
| Bristol-Myers Squibb Company 1.45% 11/13/2030 | | | 649 | | | | 515 | |
| British American Tobacco PLC 3.215% 9/6/2026 | | | 2 | | | | 2 | |
| Capital World Bond Fund | 15 |
| Bonds, notes & other debt instruments (continued) | | Principal amount
(000) | | | Value
(000) | |
| U.S. dollars (continued) | | | | | | | | |
| British American Tobacco PLC 4.70% 4/2/2027 | | USD | 775 | | | $ | 744 | |
| British American Tobacco PLC 3.557% 8/15/2027 | | | 3,450 | | | | 3,157 | |
| British American Tobacco PLC 3.462% 9/6/2029 | | | 5,900 | | | | 5,084 | |
| Broadcom Corp. 3.875% 1/15/2027 | | | 1,667 | | | | 1,579 | |
| Broadcom, Inc. 4.00% 4/15/20298 | | | 5,613 | | | | 5,111 | |
| Broadcom, Inc. 4.75% 4/15/2029 | | | 1,950 | | | | 1,862 | |
| Broadcom, Inc. 3.419% 4/15/20338 | | | 5,750 | | | | 4,626 | |
| Broadcom, Inc. 3.469% 4/15/20348 | | | 983 | | | | 787 | |
| BroadStreet Partners, Inc. 5.875% 4/15/20298 | | | 1,000 | | | | 852 | |
| BWX Technologies, Inc. 4.125% 4/15/20298 | | | 685 | | | | 601 | |
| Caesars Entertainment, Inc. 6.25% 7/1/20258 | | | 250 | | | | 243 | |
| Caesars Entertainment, Inc. 8.125% 7/1/20278 | | | 350 | | | | 345 | |
| Caesars Entertainment, Inc. 4.625% 10/15/20298 | | | 445 | | | | 363 | |
| Caesars Resort Collection, LLC 5.75% 7/1/20258 | | | 1,040 | | | | 1,020 | |
| California Resources Corp. 7.125% 2/1/20268 | | | 820 | | | | 789 | |
| Callon Petroleum Co. 7.50% 6/15/20308 | | | 225 | | | | 206 | |
| Canadian Natural Resources, Ltd. 3.85% 6/1/2027 | | | 5,473 | | | | 5,163 | |
| Canadian Natural Resources, Ltd. 2.95% 7/15/2030 | | | 10,338 | | | | 8,736 | |
| Canadian Pacific Railway, Ltd. 1.75% 12/2/2026 | | | 1,408 | | | | 1,257 | |
| Canadian Pacific Railway, Ltd. 2.45% 12/2/2031 | | | 1,307 | | | | 1,086 | |
| Canadian Pacific Railway, Ltd. 3.00% 12/2/2041 | | | 5,202 | | | | 3,944 | |
| Canadian Pacific Railway, Ltd. 3.10% 12/2/2051 | | | 16,770 | | | | 11,352 | |
| CAN-PACK SA 3.875% 11/15/20298 | | | 255 | | | | 201 | |
| Capital One Financial Corp. 4.927% 5/10/2028 (USD-SOFR + 2.057% on 5/10/2027)1 | | | 525 | | | | 509 | |
| Carnival Corp. 6.00% 5/1/20298 | | | 725 | | | | 484 | |
| Carrier Global Corp. 2.493% 2/15/2027 | | | 167 | | | | 151 | |
| Carrier Global Corp. 2.722% 2/15/2030 | | | 103 | | | | 87 | |
| Carrier Global Corp. 3.377% 4/5/2040 | | | 989 | | | | 754 | |
| Catalent Pharma Solutions, Inc. 5.00% 7/15/20278 | | | 470 | | | | 438 | |
| Catalent Pharma Solutions, Inc. 3.50% 4/1/20308 | | | 115 | | | | 91 | |
| CCO Holdings, LLC 4.75% 3/1/20308 | | | 495 | | | | 428 | |
| CCO Holdings, LLC 4.50% 8/15/20308 | | | 488 | | | | 404 | |
| CCO Holdings, LLC 4.25% 2/1/20318 | | | 795 | | | | 640 | |
| CCO Holdings, LLC 4.50% 5/1/2032 | | | 10 | | | | 8 | |
| CCO Holdings, LLC 4.50% 6/1/20338 | | | 850 | | | | 654 | |
| CCO Holdings, LLC 4.25% 1/15/20348 | | | 475 | | | | 352 | |
| CCO Holdings, LLC and CCO Holdings Capital Corp. 5.125% 5/1/20278 | | | 800 | | | | 747 | |
| CCO Holdings, LLC and CCO Holdings Capital Corp. 2.80% 4/1/2031 | | | 3,800 | | | | 2,967 | |
| CDI Escrow Issuer, Inc. 5.75% 4/1/20308 | | | 905 | | | | 813 | |
| CDK Global, Inc. 7.25% 6/15/20298 | | | 525 | | | | 514 | |
| Cedar Fair, LP 5.50% 5/1/20258 | | | 770 | | | | 763 | |
| Celanese US Holdings, LLC 6.379% 7/15/2032 | | | 879 | | | | 838 | |
| Centene Corp. 4.625% 12/15/2029 | | | 1,885 | | | | 1,727 | |
| Centene Corp. 2.50% 3/1/2031 | | | 615 | | | | 482 | |
| Centerfield Media Parent, Inc. 6.625% 8/1/20268 | | | 420 | | | | 269 | |
| CenterPoint Energy, Inc. 3.60% 3/1/2052 | | | 1,295 | | | | 1,002 | |
| Central Garden & Pet Co. 4.125% 10/15/2030 | | | 725 | | | | 597 | |
| Central Garden & Pet Co. 4.125% 4/30/20318 | | | 185 | | | | 153 | |
| Charles River Laboratories International, Inc. 4.25% 5/1/20288 | | | 430 | | | | 397 | |
| Charles River Laboratories International, Inc. 4.00% 3/15/20318 | | | 500 | | | | 433 | |
| Charles Schwab Corp. 1.65% 3/11/2031 | | | 625 | | | | 488 | |
| Charter Communications Operating, LLC 2.30% 2/1/2032 | | | 2,900 | | | | 2,143 | |
| Charter Communications Operating, LLC 3.70% 4/1/2051 | | | 1,500 | | | | 918 | |
| Cheniere Energy Partners, LP 4.50% 10/1/2029 | | | 810 | | | | 730 | |
| Cheniere Energy Partners, LP 4.00% 3/1/2031 | | | 425 | | | | 362 | |
| Cheniere Energy Partners, LP 3.25% 1/31/2032 | | | 509 | | | | 405 | |
| Chesapeake Energy Corp. 5.875% 2/1/20298 | | | 580 | | | | 550 | |
| Chesapeake Energy Corp. 6.75% 4/15/20298 | | | 230 | | | | 224 | |
| Chevron Corp. 1.995% 5/11/2027 | | | 1,048 | | | | 943 | |
| Chevron Corp. 2.236% 5/11/2030 | | | 4,252 | | | | 3,654 | |
| Chevron USA, Inc. 1.018% 8/12/2027 | | | 3,856 | | | | 3,313 | |
| Chile (Republic of) 2.75% 1/31/2027 | | | 200 | | | | 184 | |
| Chile (Republic of) 4.34% 3/7/2042 | | | 715 | | | | 607 | |
| Chile (Republic of) 4.00% 1/31/2052 | | | 335 | | | | 260 | |
| Chubb INA Holdings, Inc. 2.85% 12/15/2051 | | | 324 | | | | 216 | |
| Ciena Corp. 4.00% 1/31/20308 | | | 500 | | | | 441 | |
| Cigna Corp. 4.125% 11/15/2025 | | | 2,615 | | | | 2,558 | |
| Cigna Corp. 2.375% 3/15/2031 | | | 245 | | | | 201 | |
| Citigroup, Inc. 0.981% 5/1/2025 (USD-SOFR + 0.669% on 5/1/2024)1 | | | 8,832 | | | | 8,275 | |
| 16 | Capital World Bond Fund |
| Bonds, notes & other debt instruments (continued) | | Principal amount
(000) | | | Value
(000) | |
| U.S. dollars (continued) | | | | | | | | |
| Citigroup, Inc. 3.106% 4/8/2026 (USD-SOFR + 2.842% on 3/8/2026)1 | | USD | 18,865 | | | $ | 17,873 | |
| Citigroup, Inc. 1.462% 6/9/2027 (USD-SOFR + 0.67% on 6/9/2026)1 | | | 26,100 | | | | 22,670 | |
| Citigroup, Inc. 2.976% 11/5/2030 (USD-SOFR + 1.422% on 11/5/2029)1 | | | 2,520 | | | | 2,124 | |
| CK Hutchison International (20), Ltd. 3.375% 5/8/2050 | | | 250 | | | | 174 | |
| Clarivate Science Holdings Corp. 4.875% 7/1/20298 | | | 625 | | | | 532 | |
| Cleveland-Cliffs, Inc. 5.875% 6/1/2027 | | | 175 | | | | 167 | |
| Cleveland-Cliffs, Inc. 4.625% 3/1/20298 | | | 143 | | | | 127 | |
| Cleveland-Cliffs, Inc. 4.875% 3/1/20318 | | | 818 | | | | 723 | |
| CMB International Leasing Management, Ltd. 3.625% 7/3/2029 | | �� | 960 | | | | 803 | |
| CNX Resources Corp. 7.25% 3/14/20278 | | | 1,035 | | | | 1,029 | |
| Coca-Cola Company 1.375% 3/15/2031 | | | 1,487 | | | | 1,163 | |
| Coca-Cola Company 2.50% 3/15/2051 | | | 710 | | | | 463 | |
| Coinbase Global, Inc. 3.375% 10/1/20288 | | | 75 | | | | 40 | |
| Colombia (Republic of) 8.00% 4/20/2033 | | | 290 | | | | 291 | |
| Colombia (Republic of) 5.00% 6/15/2045 | | | 1,676 | | | | 1,146 | |
| Colombia (Republic of) 5.20% 5/15/2049 | | | 664 | | | | 455 | |
| Comcast Corp. 3.95% 10/15/2025 | | | 4,395 | | | | 4,309 | |
| Comcast Corp. 2.65% 2/1/2030 | | | 1,260 | | | | 1,093 | |
| Comcast Corp. 1.95% 1/15/2031 | | | 642 | | | | 520 | |
| Comcast Corp. 1.50% 2/15/2031 | | | 5,500 | | | | 4,296 | |
| Comcast Corp. 2.80% 1/15/2051 | | | 200 | | | | 127 | |
| Commonwealth Bank of Australia 2.688% 3/11/20318 | | | 17,875 | | | | 13,813 | |
| CommScope Finance, LLC 8.25% 3/1/20278 | | | 50 | | | | 39 | |
| Compass Diversified Holdings 5.25% 4/15/20298 | | | 1,865 | | | | 1,598 | |
| Compass Diversified Holdings 5.00% 1/15/20328 | | | 475 | | | | 378 | |
| Comstock Resources, Inc. 6.75% 3/1/20298 | | | 1,415 | | | | 1,280 | |
| Comstock Resources, Inc. 5.875% 1/15/20308 | | | 340 | | | | 293 | |
| Conagra Brands, Inc. 5.40% 11/1/2048 | | | 2,583 | | | | 2,400 | |
| ConocoPhillips 3.80% 3/15/2052 | | | 2,275 | | | | 1,800 | |
| Constellation Brands, Inc. 4.35% 5/9/2027 | | | 1,305 | | | | 1,273 | |
| Constellation Brands, Inc. 2.875% 5/1/2030 | | | 839 | | | | 716 | |
| Constellation Brands, Inc. 2.25% 8/1/2031 | | | 1,859 | | | | 1,481 | |
| Constellation Brands, Inc. 4.75% 5/9/2032 | | | 813 | | | | 785 | |
| Constellation Oil Services Holding SA 4.00% PIK 12/31/202611 | | | 2,729 | | | | 1,615 | |
| Consumers Energy Co. 3.25% 8/15/2046 | | | 1,162 | | | | 842 | |
| Consumers Energy Co. 3.10% 8/15/2050 | | | 185 | | | | 129 | |
| Consumers Energy Co. 2.65% 8/15/2052 | | | 301 | | | | 191 | |
| Continental Resources, Inc. 5.75% 1/15/20318 | | | 260 | | | | 243 | |
| Continental Resources, Inc. 2.875% 4/1/20328 | | | 2,487 | | | | 1,846 | |
| Corebridge Financial, Inc. 3.50% 4/4/20258 | | | 157 | | | | 151 | |
| Corebridge Financial, Inc. 3.65% 4/5/20278 | | | 548 | | | | 512 | |
| Corebridge Financial, Inc. 3.85% 4/5/20298 | | | 746 | | | | 681 | |
| Corebridge Financial, Inc. 3.90% 4/5/20328 | | | 5,980 | | | | 5,239 | |
| Corebridge Financial, Inc. 4.35% 4/5/20428 | | | 162 | | | | 134 | |
| Corebridge Financial, Inc. 4.40% 4/5/20528 | | | 390 | | | | 311 | |
| CoreLogic, Inc. 4.50% 5/1/20288 | | | 1,615 | | | | 1,241 | |
| CoreLogic, Inc., Term Loan, (3-month USD-LIBOR + 6.50%) 10.938% 6/4/20299,10 | | | 300 | | | | 218 | |
| Corporate Office Properties, LP 2.25% 3/15/2026 | | | 1,048 | | | | 920 | |
| Corporate Office Properties, LP 2.00% 1/15/2029 | | | 511 | | | | 393 | |
| Corporate Office Properties, LP 2.90% 12/1/2033 | | | 1,075 | | | | 766 | |
| Costa Rica (Republic of) 6.125% 2/19/20318 | | | 2,480 | | | | 2,418 | |
| Covanta Holding Corp. 4.875% 12/1/20298 | | | 145 | | | | 119 | |
| Crédit Agricole SA 1.247% 1/26/2027 (USD-SOFR + 0.892% on 1/26/2026)1,8 | | | 4,588 | | | | 4,017 | |
| Credit Suisse Group AG 3.869% 1/12/2029 (3-month USD-LIBOR + 1.41% on 1/12/2028)1,8 | | | 3,799 | | | | 3,051 | |
| Crestwood Midstream Partners, LP 6.00% 2/1/20298 | | | 500 | | | | 459 | |
| Crestwood Midstream Partners, LP 8.00% 4/1/20298 | | | 400 | | | | 399 | |
| CRH America, Inc. 5.125% 5/18/20458 | | | 3,000 | | | | 2,661 | |
| Crown Castle International Corp. 2.50% 7/15/2031 | | | 1,074 | | | | 868 | |
| CSN Resources SA 7.625% 4/17/2026 | | | 15,856 | | | | 15,848 | |
| CSX Corp. 4.25% 3/15/2029 | | | 3,355 | | | | 3,234 | |
| CSX Corp. 4.10% 11/15/2032 | | | 1,825 | | | | 1,717 | |
| CSX Corp. 2.50% 5/15/2051 | | | 289 | | | | 177 | |
| Cushman & Wakefield U.S. Borrower, LLC 6.75% 5/15/20288 | | | 700 | | | | 669 | |
| CVR Partners, LP 6.125% 6/15/20288 | | | 380 | | | | 341 | |
| CVS Health Corp. 3.25% 8/15/2029 | | | 1,798 | | | | 1,612 | |
| Daimler Trucks Finance North America, LLC 3.50% 4/7/20258 | | | 1,600 | | | | 1,536 | |
| Daimler Trucks Finance North America, LLC 3.65% 4/7/20278 | | | 6,550 | | | | 6,131 | |
| Daimler Trucks Finance North America, LLC 2.375% 12/14/20288 | | | 1,100 | | | | 926 | |
| Capital World Bond Fund | 17 |
| Bonds, notes & other debt instruments (continued) | | Principal amount
(000) | | | Value
(000) | |
| U.S. dollars (continued) | | | | | | | | |
| Daimler Trucks Finance North America, LLC 2.50% 12/14/20318 | | USD | 2,625 | | | $ | 2,042 | |
| DaimlerChrysler North America Holding Corp. 0.75% 3/1/20248 | | | 667 | | | | 634 | |
| Darling Ingredients, Inc. 5.25% 4/15/20278 | | | 175 | | | | 169 | |
| Darling Ingredients, Inc. 6.00% 6/15/20308 | | | 1,540 | | | | 1,507 | |
| DaVita, Inc. 4.625% 6/1/20308 | | | 430 | | | | 347 | |
| Deutsche Bank AG 2.311% 11/16/2027 (USD-SOFR + 1.219% on 11/16/2026)1 | | | 10,009 | | | | 8,499 | |
| Development Bank of Mongolia, LLC 7.25% 10/23/2023 | | | 16,205 | | | | 14,547 | |
| Diamond Sports Group, LLC 6.625% 8/15/20278 | | | 1,240 | | | | 14 | |
| Dianjian International Finance, Ltd. 4.60% perpetual bonds (5-year UST Yield Curve Rate T Note Constant Maturity + 6.933% on 3/13/2023)1 | | | 405 | | | | 404 | |
| Diebold Nixdorf, Inc. 9.375% 7/15/20258 | | | 469 | | | | 335 | |
| Digital Currency Group, Inc., Term Loan, (3-month USD-LIBOR + 7.00%) 8.00% 11/30/20266,9,10 | | | 205 | | | | 178 | |
| Digital Currency Group, Inc., Term Loan, 8.75% 11/30/20266,9 | | | 273 | | | | 219 | |
| DIRECTV Financing, LLC 5.875% 8/15/20278 | | | 705 | | | | 632 | |
| DIRECTV Financing, LLC, Term Loan, (3-month USD-LIBOR + 5.00%) 9.384% 8/2/20279,10 | | | 737 | | | | 718 | |
| Discover Financial Services 3.45% 7/27/2026 | | | 750 | | | | 692 | |
| Discover Financial Services 6.70% 11/29/2032 | | | 200 | | | | 204 | |
| Discovery Communications, Inc. 3.625% 5/15/2030 | | | 2,669 | | | | 2,205 | |
| DISH Network Corp. 11.75% 11/15/20278 | | | 2,010 | | | | 2,073 | |
| DNB Bank ASA 5.896% 10/9/2026 (USD-SOFR + 1.95% on 10/9/2025)1,8 | | | 1,000 | | | | 1,001 | |
| Dominican Republic 5.50% 2/22/20298 | | | 2,850 | | | | 2,633 | |
| Dominican Republic 5.875% 1/30/2060 | | | 3,720 | | | | 2,742 | |
| Dow Chemical Co. 3.60% 11/15/2050 | | | 1,000 | | | | 719 | |
| DTE Electric Co. 2.625% 3/1/2031 | | | 1,033 | | | | 881 | |
| DTE Energy Company 3.00% 3/1/2032 | | | 1,000 | | | | 865 | |
| Duke Energy Corp. 3.50% 6/15/2051 | | | 1,589 | | | | 1,110 | |
| Duke Energy Progress, LLC 2.00% 8/15/2031 | | | 10,500 | | | | 8,323 | |
| Dun & Bradstreet Corp. 5.00% 12/15/20298 | | | 1,152 | | | | 987 | |
| Eaton Corp. 4.15% 3/15/2033 | | | 379 | | | | 354 | |
| Eaton Corp. 4.70% 8/23/2052 | | | 291 | | | | 265 | |
| Edison International 4.125% 3/15/2028 | | | 4,030 | | | | 3,746 | |
| Edison International 6.95% 11/15/2029 | | | 925 | | | | 968 | |
| Edison International 5.00% junior subordinated perpetual bonds (5-year UST Yield Curve Rate T Note Constant Maturity + 3.901% on 3/15/2049)1 | | | 475 | | | | 398 | |
| EDP Finance BV 6.30% 10/11/20278 | | | 2,730 | | | | 2,813 | |
| Egypt (Arab Republic of) 7.053% 1/15/2032 | | | 560 | | | | 411 | |
| Egypt (Arab Republic of) 8.75% 9/30/2051 | | | 1,892 | | | | 1,277 | |
| Electricité de France SA 3.625% 10/13/20258 | | | 760 | | | | 733 | |
| Electricité de France SA 4.50% 9/21/20288 | | | 1,722 | | | | 1,633 | |
| Electricité de France SA 4.875% 9/21/20388 | | | 7,267 | | | | 5,936 | |
| Electricité de France SA 4.875% 1/22/20448 | | | 325 | | | | 263 | |
| Electricité de France SA 5.00% 9/21/20488 | | | 768 | | | | 624 | |
| Eli Lilly and Company 3.375% 3/15/2029 | | | 583 | | | | 547 | |
| Empresas Publicas de Medellin ESP 4.25% 7/18/20298 | | | 3,595 | | | | 2,860 | |
| Endo DAC 6.00% 6/30/20283,8 | | | 625 | | | | 34 | |
| Endo Luxembourg Finance Co. I SARL / Endo U.S., Inc. 6.125% 4/1/20298 | | | 805 | | | | 612 | |
| Enel Finance International SA 3.50% 4/6/20288 | | | 5,800 | | | | 5,084 | |
| Enel Finance International SA 7.50% 10/14/20328 | | | 1,800 | | | | 1,908 | |
| Energean PLC 6.50% 4/30/20278 | | | 450 | | | | 419 | |
| Energy Transfer Partners, LP 6.50% junior subordinated perpetual bonds (5-year UST Yield Curve Rate T Note Constant Maturity + 5.694% on 11/15/2049)1 | | | 254 | | | | 219 | |
| ENN Clean Energy International Investment, Ltd. 3.375% 5/12/20268 | | | 1,300 | | | | 1,134 | |
| ENN Energy Holdings, Ltd. 2.625% 9/17/20308 | | | 12,035 | | | | 9,769 | |
| Entegris Escrow Corp. 4.75% 4/15/20298 | | | 195 | | | | 178 | |
| EQM Midstream Partners, LP 6.50% 7/1/20278 | | | 1,200 | | | | 1,149 | |
| EQM Midstream Partners, LP 7.50% 6/1/20308 | | | 306 | | | | 295 | |
| EQM Midstream Partners, LP 6.50% 7/15/2048 | | | 300 | | | | 225 | |
| EQT Corp. 5.70% 4/1/2028 | | | 701 | | | | 698 | |
| EQT Corp. 7.25% 2/1/20301 | | | 212 | | | | 220 | |
| Equinix, Inc. 2.15% 7/15/2030 | | | 8,862 | | | | 7,070 | |
| Equinix, Inc. 3.00% 7/15/2050 | | | 2,889 | | | | 1,826 | |
| Ethiopia (Federal Democratic Republic of) 6.625% 12/11/2024 | | | 7,295 | | | | 4,583 | |
| Export-Import Bank of Korea 4.50% 9/15/2032 | | | 800 | | | | 783 | |
| Exxon Mobil Corp. 2.44% 8/16/2029 | | | 3,447 | | | | 3,019 | |
| Exxon Mobil Corp. 2.61% 10/15/2030 | | | 4,110 | | | | 3,600 | |
| Fair Isaac Corp. 4.00% 6/15/20288 | | | 755 | | | | 687 | |
| Fannie Mae, Series 2001-4, Class GA, 9.00% 4/17/20255,10 | | | — | 7 | | | — | 7 |
| 18 | Capital World Bond Fund |
| Bonds, notes & other debt instruments (continued) | | Principal amount
(000) | | | Value
(000) | |
| U.S. dollars (continued) | | | | | | | | |
| Fannie Mae Pool #FM9416 3.50% 7/1/20455 | | USD | 9,348 | | | $ | 8,655 | |
| Fannie Mae Pool #FM3280 3.50% 5/1/20495 | | | 15,162 | | | | 14,047 | |
| Fannie Mae Pool #FM3217 3.50% 5/1/20505 | | | 12,024 | | | | 11,046 | |
| Fannie Mae Pool #CA7599 2.50% 11/1/20505 | | | 5,500 | | | | 4,744 | |
| Fannie Mae Pool #MA4238 2.50% 1/1/20515 | | | 179 | | | | 152 | |
| Fannie Mae Pool #CB1135 2.50% 7/1/20515 | | | 10,738 | | | | 9,107 | |
| Fannie Mae Pool #FM9764 2.50% 11/1/20515 | | | 1,000 | | | | 848 | |
| Fannie Mae Pool #BU3037 2.50% 11/1/20515 | | | 359 | | | | 304 | |
| Fannie Mae Pool #BU0616 2.50% 11/1/20515 | | | 190 | | | | 161 | |
| Fannie Mae Pool #CB2467 2.50% 12/1/20515 | | | 448 | | | | 380 | |
| Fannie Mae Pool #FM9882 2.50% 12/1/20515 | | | 372 | | | | 316 | |
| Fannie Mae Pool #FM9806 2.50% 12/1/20515 | | | 164 | | | | 139 | |
| Fannie Mae Pool #BU8176 2.50% 1/1/20525 | | | 472 | | | | 401 | |
| Fannie Mae Pool #CB2558 2.50% 1/1/20525 | | | 266 | | | | 226 | |
| Fannie Mae Pool #CB3666 2.50% 2/1/20525 | | | 3,739 | | | | 3,171 | |
| Fannie Mae Pool #FS0547 2.50% 2/1/20525 | | | 236 | | | | 200 | |
| Fannie Mae Pool #BV3214 2.50% 2/1/20525 | | | 199 | | | | 170 | |
| Fannie Mae Pool #BV1102 2.50% 2/1/20525 | | | 177 | | | | 151 | |
| Fannie Mae Pool #BU9196 2.50% 2/1/20525 | | | 178 | | | | 151 | |
| Fannie Mae Pool #BU8884 2.50% 3/1/20525 | | | 2,237 | | | | 1,897 | |
| Fannie Mae Pool #CB3063 2.50% 3/1/20525 | | | 1,000 | | | | 849 | |
| Fannie Mae Pool #CB3164 2.50% 3/1/20525 | | | 1,000 | | | | 848 | |
| Fannie Mae Pool #CB3744 2.50% 3/1/20525 | | | 1,000 | | | | 848 | |
| Fannie Mae Pool #BV4139 2.50% 3/1/20525 | | | 296 | | | | 253 | |
| Fannie Mae Pool #BV3793 2.50% 3/1/20525 | | | 241 | | | | 205 | |
| Fannie Mae Pool #BV6631 2.50% 3/1/20525 | | | 220 | | | | 187 | |
| Fannie Mae Pool #BV8086 2.50% 3/1/20525 | | | 209 | | | | 178 | |
| Fannie Mae Pool #CB5013 2.50% 3/1/20525 | | | 139 | | | | 118 | |
| Fannie Mae Pool #MA4578 2.50% 4/1/20525 | | | 12,899 | | | | 10,942 | |
| Fannie Mae Pool #BU6901 2.50% 4/1/20525 | | | 448 | | | | 380 | |
| Fannie Mae Pool #BT8108 2.50% 4/1/20525 | | | 432 | | | | 367 | |
| Fannie Mae Pool #BU8802 2.50% 4/1/20525 | | | 299 | | | | 254 | |
| Fannie Mae Pool #BV4656 2.50% 4/1/20525 | | | 281 | | | | 239 | |
| Fannie Mae Pool #BV7773 2.50% 4/1/20525 | | | 30 | | | | 25 | |
| Fannie Mae Pool #CB3665 2.50% 5/1/20525 | | | 423 | | | | 359 | |
| Fannie Mae Pool #BW0462 2.50% 5/1/20525 | | | 228 | | | | 193 | |
| Fannie Mae Pool #MA4623 2.50% 6/1/20525 | | | 161 | | | | 137 | |
| Fannie Mae Pool #BV7830 2.50% 7/1/20525 | | | 376 | | | | 319 | |
| Fannie Mae Pool #MA4656 4.50% 7/1/20525 | | | 6,628 | | | | 6,386 | |
| Fannie Mae Pool #FS2535 2.50% 8/1/20525 | | | 1,000 | | | | 849 | |
| Fannie Mae Pool #BW7604 4.50% 8/1/20525 | | | 500 | | | | 482 | |
| Fannie Mae Pool #BW9408 5.00% 8/1/20525 | | | 47 | | | | 46 | |
| Fannie Mae Pool #BW1149 2.50% 9/1/20525 | | | 219 | | | | 186 | |
| Fannie Mae Pool #MA4732 4.00% 9/1/20525 | | | 2,000 | | | | 1,878 | |
| Fannie Mae Pool #MA4733 4.50% 9/1/20525 | | | 16,694 | | | | 16,085 | |
| Fannie Mae Pool #BW1201 5.00% 9/1/20525 | | | 4,630 | | | | 4,570 | |
| Fannie Mae Pool #BW8088 5.00% 9/1/20525 | | | 1,366 | | | | 1,348 | |
| Fannie Mae Pool #MA4784 4.50% 10/1/20525 | | | 19,476 | | | | 18,765 | |
| Fannie Mae Pool #BW1215 4.50% 10/1/20525 | | | 4,992 | | | | 4,809 | |
| Fannie Mae Pool #BX0097 4.50% 10/1/20525 | | | 1,628 | | | | 1,568 | |
| Fannie Mae Pool #BW8981 4.50% 10/1/20525 | | | 407 | | | | 392 | |
| Fannie Mae Pool #BW9458 4.50% 10/1/20525 | | | 369 | | | | 356 | |
| Fannie Mae Pool #BV0961 4.50% 10/1/20525 | | | 263 | | | | 253 | |
| Fannie Mae Pool #BX0902 5.00% 10/1/20525 | | | 2,784 | | | | 2,748 | |
| Fannie Mae Pool #BW7368 5.00% 10/1/20525 | | | 1,865 | | | | 1,842 | |
| Fannie Mae Pool #CB5380 5.00% 10/1/20525 | | | 1,000 | | | | 987 | |
| Fannie Mae Pool #BW7235 5.00% 10/1/20525 | | | 504 | | | | 497 | |
| Fannie Mae Pool #MA4887 2.50% 11/1/20525 | | | 117 | | | | 100 | |
| Fannie Mae Pool #MA4804 4.00% 11/1/20525 | | | 2,724 | | | | 2,557 | |
| Fannie Mae Pool #BX1516 4.50% 11/1/20525 | | | 999 | | | | 962 | |
| Fannie Mae Pool #BX2558 4.50% 11/1/20525 | | | 999 | | | | 962 | |
| Fannie Mae Pool #BX1766 5.00% 11/1/20525 | | | 2,100 | | | | 2,073 | |
| Fannie Mae Pool #MA4839 4.00% 12/1/20525 | | | 3,000 | | | | 2,817 | |
| Fannie Mae Pool #MA4840 4.50% 12/1/20525 | | | 6,000 | | | | 5,781 | |
| Fannie Mae Pool #MA4841 5.00% 12/1/20525 | | | 3,020 | | | | 2,981 | |
| Fannie Mae Pool #BX1072 5.00% 12/1/20525 | | | 3,000 | | | | 2,961 | |
| Fannie Mae Pool #BX1822 5.00% 12/1/20525 | | | 1,000 | | | | 987 | |
| Fannie Mae Pool #MA4868 5.00% 1/1/20535 | | | 4,339 | | | | 4,283 | |
| Fannie Mae Pool #MA4869 5.50% 1/1/20535 | | | 100 | | | | 100 | |
| Capital World Bond Fund | 19 |
| Bonds, notes & other debt instruments (continued) | | Principal amount
(000) | | | Value
(000) | |
| U.S. dollars (continued) | | | | | | | | |
| Fertitta Entertainment, Inc. 4.625% 1/15/20298 | | USD | 170 | | | $ | 144 | |
| Fertitta Entertainment, Inc. 6.75% 1/15/20308 | | | 175 | | | | 141 | |
| FibraSOMA 4.375% 7/22/2031 | | | 14,650 | | | | 10,975 | |
| First Quantum Minerals, Ltd. 6.875% 3/1/20268 | | | 587 | | | | 557 | |
| First Quantum Minerals, Ltd. 6.875% 10/15/20278 | | | 2,555 | | | | 2,402 | |
| First Student Bidco, Inc. 4.00% 7/31/20298 | | | 545 | | | | 452 | |
| FirstEnergy Corp. 3.50% 4/1/20288 | | | 1,425 | | | | 1,301 | |
| FirstEnergy Transmission, LLC 4.35% 1/15/20258 | | | 5,996 | | | | 5,847 | |
| FirstEnergy Transmission, LLC 2.866% 9/15/20288 | | | 3,862 | | | | 3,377 | |
| Five Corners Funding Trust II 2.85% 5/15/20308 | | | 3,500 | | | | 2,942 | |
| Florida Power & Light Company 2.85% 4/1/2025 | | | 1,600 | | | | 1,533 | |
| Florida Power & Light Company 2.875% 12/4/2051 | | | 9,093 | | | | 6,142 | |
| Ford Motor Credit Company, LLC 4.542% 8/1/2026 | | | 685 | | | | 632 | |
| Ford Motor Credit Company, LLC 4.125% 8/17/2027 | | | 1,240 | | | | 1,113 | |
| Ford Motor Credit Company, LLC 2.90% 2/16/2028 | | | 250 | | | | 207 | |
| Ford Motor Credit Company, LLC 4.00% 11/13/2030 | | | 1,020 | | | | 839 | |
| Freddie Mac, Series K153, Class A2, Multi Family, 3.82% 1/25/20335 | | | 27,575 | | | | 25,960 | |
| Freddie Mac Pool #SI2002 4.00% 3/1/20485 | | | 136 | | | | 130 | |
| Freddie Mac Pool #QC4006 2.50% 6/1/20515 | | | 201 | | | | 171 | |
| Freddie Mac Pool #RA5559 2.50% 7/1/20515 | | | 1,436 | | | | 1,218 | |
| Freddie Mac Pool #SD0926 2.50% 7/1/20515 | | | 1,146 | | | | 976 | |
| Freddie Mac Pool #SD0726 2.50% 10/1/20515 | | | 14,672 | | | | 12,598 | |
| Freddie Mac Pool #RA7081 2.50% 12/1/20515 | | | 1,675 | | | | 1,420 | |
| Freddie Mac Pool #QD3414 2.50% 12/1/20515 | | | 1,000 | | | | 849 | |
| Freddie Mac Pool #QD3399 2.50% 12/1/20515 | | | 454 | | | | 385 | |
| Freddie Mac Pool #QD3561 2.50% 12/1/20515 | | | 305 | | | | 259 | |
| Freddie Mac Pool #SD0871 2.50% 1/1/20525 | | | 21,666 | | | | 18,408 | |
| Freddie Mac Pool #QD6127 2.50% 1/1/20525 | | | 296 | | | | 252 | |
| Freddie Mac Pool #QD6751 2.50% 2/1/20525 | | | 186 | | | | 158 | |
| Freddie Mac Pool #RA8028 2.50% 2/1/20525 | | | 181 | | | | 154 | |
| Freddie Mac Pool #QD9879 2.50% 3/1/20525 | | | 2,385 | | | | 2,023 | |
| Freddie Mac Pool #SD8200 2.50% 3/1/20525 | | | 1,781 | | | | 1,510 | |
| Freddie Mac Pool #QD8867 2.50% 3/1/20525 | | | 1,000 | | | | 850 | |
| Freddie Mac Pool #RA7021 2.50% 3/1/20525 | | | 1,000 | | | | 849 | |
| Freddie Mac Pool #QD8942 2.50% 3/1/20525 | | | 1,000 | | | | 848 | |
| Freddie Mac Pool #QD8206 2.50% 3/1/20525 | | | 478 | | | | 406 | |
| Freddie Mac Pool #QD8230 2.50% 3/1/20525 | | | 199 | | | | 169 | |
| Freddie Mac Pool #SD8205 2.50% 4/1/20525 | | | 55,200 | | | | 46,823 | |
| Freddie Mac Pool #QD9911 2.50% 4/1/20525 | | | 1,928 | | | | 1,636 | |
| Freddie Mac Pool #QE0799 2.50% 4/1/20525 | | | 1,000 | | | | 849 | |
| Freddie Mac Pool #QE0327 2.50% 4/1/20525 | | | 1,000 | | | | 849 | |
| Freddie Mac Pool #QE0322 2.50% 4/1/20525 | | | 1,000 | | | | 849 | |
| Freddie Mac Pool #QD9578 2.50% 4/1/20525 | | | 1,000 | | | | 849 | |
| Freddie Mac Pool #QE1005 2.50% 4/1/20525 | | | 1,000 | | | | 848 | |
| Freddie Mac Pool #QE2314 2.50% 4/1/20525 | | | 1,000 | | | | 848 | |
| Freddie Mac Pool #QE2310 2.50% 4/1/20525 | | | 289 | | | | 245 | |
| Freddie Mac Pool #QD9323 2.50% 4/1/20525 | | | 254 | | | | 216 | |
| Freddie Mac Pool #QE0323 2.50% 4/1/20525 | | | 253 | | | | 215 | |
| Freddie Mac Pool #QE2101 2.50% 4/1/20525 | | | 164 | | | | 139 | |
| Freddie Mac Pool #QE2352 2.50% 5/1/20525 | | | 253 | | | | 214 | |
| Freddie Mac Pool #QE1859 2.50% 5/1/20525 | | | 208 | | | | 176 | |
| Freddie Mac Pool #SD1099 2.50% 5/1/20525 | | | 153 | | | | 130 | |
| Freddie Mac Pool #SD8219 2.50% 6/1/20525 | | | 21,170 | | | | 17,951 | |
| Freddie Mac Pool #SD8224 2.50% 7/1/20525 | | | 22,008 | | | | 18,669 | |
| Freddie Mac Pool #RA7747 2.50% 8/1/20525 | | | 4,108 | | | | 3,484 | |
| Freddie Mac Pool #QE8026 2.50% 8/1/20525 | | | 499 | | | | 423 | |
| Freddie Mac Pool #QE7412 4.00% 8/1/20525 | | | 244 | | | | 229 | |
| Freddie Mac Pool #QE8253 4.50% 8/1/20525 | | | 7,253 | | | | 6,989 | |
| Freddie Mac Pool #SD8238 4.50% 8/1/20525 | | | 1,164 | | | | 1,122 | |
| Freddie Mac Pool #QF0923 2.50% 9/1/20525 | | | 451 | | | | 382 | |
| Freddie Mac Pool #SD8244 4.00% 9/1/20525 | | | 14,000 | | | | 13,146 | |
| Freddie Mac Pool #QF0311 5.00% 9/1/20525 | | | 3,000 | | | | 2,961 | |
| Freddie Mac Pool #QF1489 4.00% 10/1/20525 | | | 3,000 | | | | 2,817 | |
| Freddie Mac Pool #SD8256 4.00% 10/1/20525 | | | 1,400 | | | | 1,314 | |
| Freddie Mac Pool #SD8257 4.50% 10/1/20525 | | | 81,792 | | | | 78,806 | |
| Freddie Mac Pool #QF2136 4.50% 10/1/20525 | | | 1,829 | | | | 1,763 | |
| Freddie Mac Pool #QF1431 4.50% 10/1/20525 | | | 1,693 | | | | 1,631 | |
| Freddie Mac Pool #QF1765 4.50% 10/1/20525 | | | 1,583 | | | | 1,525 | |
| Freddie Mac Pool #QF0983 4.50% 10/1/20525 | | | 794 | | | | 765 | |
| 20 | Capital World Bond Fund |
| Bonds, notes & other debt instruments (continued) | | Principal amount
(000) | | | Value
(000) | |
| U.S. dollars (continued) | | | | | | | | |
| Freddie Mac Pool #SD8283 2.50% 11/1/20525 | | USD | 500 | | | $ | 424 | |
| Freddie Mac Pool #QF2445 4.50% 11/1/20525 | | | 2,734 | | | | 2,634 | |
| Freddie Mac Pool #SD8266 4.50% 11/1/20525 | | | 14 | | | | 14 | |
| Freddie Mac Pool #SD8275 4.50% 12/1/20525 | | | 690 | | | | 665 | |
| Freddie Mac Pool #QF4754 5.00% 12/1/20525 | | | 4,979 | | | | 4,915 | |
| Freddie Mac Pool #SD8276 5.00% 12/1/20525 | | | 4,000 | | | | 3,948 | |
| Freddie Mac Pool #SD8303 2.50% 1/1/20535 | | | 1,000 | | | | 848 | |
| Freddie Mac Pool #SD8288 5.00% 1/1/20535 | | | 16,035 | | | | 15,829 | |
| Fresnillo PLC 4.25% 10/2/20508 | | | 2,560 | | | | 2,020 | |
| Frontier Communications Corp. 5.875% 10/15/20278 | | | 815 | | | | 759 | |
| Frontier Communications Corp. 5.00% 5/1/20288 | | | 432 | | | | 378 | |
| Frontier Communications Corp. 6.75% 5/1/20298 | | | 450 | | | | 373 | |
| Frontier Communications Holdings, LLC 5.875% 11/1/2029 | | | 875 | | | | 678 | |
| FS Energy and Power Fund 7.50% 8/15/20238 | | | 839 | | | | 842 | |
| FXI Holdings, Inc. 12.25% 11/15/20268 | | | 1,740 | | | | 1,443 | |
| Gabonese Republic 7.00% 11/24/20318 | | | 790 | | | | 650 | |
| Gartner, Inc. 3.625% 6/15/20298 | | | 357 | | | | 314 | |
| Gartner, Inc. 3.75% 10/1/20308 | | | 343 | | | | 296 | |
| GC Treasury Center Co., Ltd. 4.40% 3/30/20328 | | | 600 | | | | 533 | |
| GE Healthcare Holding, LLC 5.65% 11/15/20278 | | | 1,150 | | | | 1,165 | |
| GE Healthcare Holding, LLC 5.905% 11/22/20328 | | | 1,250 | | | | 1,299 | |
| GE Healthcare Holding, LLC 6.377% 11/22/20528 | | | 225 | | | | 240 | |
| General Dynamics Corp. 3.625% 4/1/2030 | | | 1,518 | | | | 1,414 | |
| General Motors Financial Co. 1.50% 6/10/2026 | | | 573 | | | | 498 | |
| General Motors Financial Co. 2.40% 4/10/2028 | | | 6,870 | | | | 5,790 | |
| Genesis Energy, LP 8.00% 1/15/2027 | | | 1,142 | | | | 1,080 | |
| Georgia (Republic of) 2.75% 4/22/20268 | | | 2,535 | | | | 2,303 | |
| Ghana (Republic of) 0% 4/7/2025 | | | 300 | | | | 100 | |
| Ghana (Republic of) 8.125% 1/18/2026 | | | 390 | | | | 160 | |
| Ghana (Republic of) 6.375% 2/11/2027 | | | 1,020 | | | | 395 | |
| Gilead Sciences, Inc. 2.80% 10/1/2050 | | | 692 | | | | 446 | |
| Glencore Funding, LLC 1.625% 4/27/20268 | | | 12,481 | | | | 11,011 | |
| Glencore Funding, LLC 2.625% 9/23/20318 | | | 1,100 | | | | 879 | |
| GoDaddy Operating Co. 5.25% 12/1/20278 | | | 275 | | | | 261 | |
| GoDaddy Operating Co. 3.50% 3/1/20298 | | | 675 | | | | 566 | |
| Goldman Sachs Group, Inc. 3.20% 2/23/2023 | | | 2,979 | | | | 2,972 | |
| Goldman Sachs Group, Inc. 2.615% 4/22/2032 (USD-SOFR + 1.281% on 4/22/2031)1 | | | 3,279 | | | | 2,623 | |
| Goldman Sachs Group, Inc. 2.383% 7/21/2032 (USD-SOFR + 1.248% on 7/21/2031)1 | | | 3,378 | | | | 2,629 | |
| Goldman Sachs Group, Inc. 3.102% 2/24/2033 (USD-SOFR + 1.41% on 2/24/2032)1 | | | 633 | | | | 516 | |
| Goldman Sachs Group, Inc. 2.908% 7/21/2042 (USD-SOFR + 1.40% on 7/21/2041)1 | | | 587 | | | | 401 | |
| Government National Mortgage Assn. 3.50% 1/1/20535,12 | | | 61,900 | | | | 56,882 | |
| Government National Mortgage Assn. 5.00% 1/1/20535,12 | | | 37,820 | | | | 37,481 | |
| Gray Television, Inc. 7.00% 5/15/20278 | | | 290 | | | | 258 | |
| Grifols Escrow Issuer SA 4.75% 10/15/20288 | | | 200 | | | | 173 | |
| Group 1 Automotive, Inc. 4.00% 8/15/20288 | | | 565 | | | | 479 | |
| Groupe BPCE SA 5.70% 10/22/20238 | | | 850 | | | | 844 | |
| Groupe BPCE SA 2.045% 10/19/2027 (USD-SOFR + 1.087% on 10/19/2026)1,8 | | | 7,500 | | | | 6,474 | |
| Grupo Energia Bogota SA ESP 4.875% 5/15/20308 | | | 2,300 | | | | 2,068 | |
| Hanesbrands, Inc. 4.625% 5/15/20248 | | | 750 | | | | 728 | |
| Hanesbrands, Inc. 4.875% 5/15/20268 | | | 830 | | | | 743 | |
| Harbour Energy PLC 5.50% 10/15/20268 | | | 480 | | | | 431 | |
| Harsco Corp. 5.75% 7/31/20278 | | | 625 | | | | 494 | |
| Harvest Midstream I, LP 7.50% 9/1/20288 | | | 587 | | | | 562 | |
| HealthEquity, Inc. 4.50% 10/1/20298 | | | 370 | | | | 324 | |
| Hess Midstream Operations, LP 5.50% 10/15/20308 | | | 190 | | | | 174 | |
| Hightower Holding, LLC 6.75% 4/15/20298 | | | 830 | | | | 698 | |
| Hilcorp Energy I, LP 5.75% 2/1/20298 | | | 410 | | | | 366 | |
| Hilcorp Energy I, LP 6.00% 4/15/20308 | | | 660 | | | | 588 | |
| Hilcorp Energy I, LP 6.00% 2/1/20318 | | | 1,000 | | | | 866 | |
| Hilcorp Energy I, LP 6.25% 4/15/20328 | | | 70 | | | | 61 | |
| Hilton Worldwide Holdings, Inc. 4.875% 1/15/2030 | | | 190 | | | | 173 | |
| Hilton Worldwide Holdings, Inc. 4.00% 5/1/20318 | | | 1,160 | | | | 973 | |
| Home Depot, Inc. 2.95% 6/15/2029 | | | 2,346 | | | | 2,127 | |
| Home Depot, Inc. 4.50% 12/6/2048 | | | 675 | | | | 616 | |
| Home Depot, Inc. 2.375% 3/15/2051 | | | 839 | | | | 504 | |
| Honduras (Republic of) 6.25% 1/19/2027 | | | 19,787 | | | | 17,508 | |
| Honduras (Republic of) 5.625% 6/24/2030 | | | 7,784 | | | | 6,279 | |
| Honduras (Republic of) 5.625% 6/24/20308 | | | 2,623 | | | | 2,116 | |
| Honeywell International, Inc. 2.30% 8/15/2024 | | | 700 | | | | 673 | |
| Capital World Bond Fund | 21 |
| Bonds, notes & other debt instruments (continued) | | Principal amount
(000) | | | Value
(000) | |
| U.S. dollars (continued) | | | | | | | | |
| Honeywell International, Inc. 4.95% 2/15/2028 | | USD | 500 | | | $ | 507 | |
| Honeywell International, Inc. 5.00% 2/15/2033 | | | 750 | | | | 766 | |
| Howard Hughes Corp. 5.375% 8/1/20288 | | | 1,022 | | | | 922 | |
| Howard Hughes Corp. 4.125% 2/1/20298 | | | 215 | | | | 180 | |
| Howard Hughes Corp. 4.375% 2/1/20318 | | | 165 | | | | 134 | |
| Howard Midstream Energy Partners, LLC 6.75% 1/15/20278 | | | 250 | | | | 240 | |
| HSBC Holdings PLC 1.589% 5/24/2027 (3-month USD-LIBOR + 1.29% on 5/24/2026)1 | | | 1,371 | | | | 1,184 | |
| HSBC Holdings PLC 4.95% 3/31/2030 | | | 2,300 | | | | 2,199 | |
| HSBC Holdings PLC 3.973% 5/22/2030 (3-month USD-LIBOR + 1.61% on 5/22/2029)1 | | | 3,229 | | | | 2,833 | |
| HSBC Holdings PLC 2.871% 11/22/2032 (USD-SOFR + 1.41% on 11/22/2031)1 | | | 1,229 | | | | 942 | |
| HSBC Holdings PLC 5.402% 8/11/2033 (USD-SOFR + 2.87% on 8/11/2032)1 | | | 2,500 | | | | 2,322 | |
| HSBC Holdings PLC 8.113% 11/3/2033 (USD-SOFR + 4.25% on 11/3/2032)1 | | | 4,000 | | | | 4,244 | |
| Huarong Finance 2017 Co., Ltd. (3-month USD-LIBOR + 1.325%) 5.068% 7/3/202310 | | | 1,272 | | | | 1,261 | |
| Huarong Finance 2017 Co., Ltd. 4.75% 4/27/2027 | | | 5,137 | | | | 4,488 | |
| Huarong Finance 2019 Co., Ltd. (3-month USD-LIBOR + 1.125%) 5.824% 2/24/202310 | | | 24,776 | | | | 24,698 | |
| Huarong Finance 2019 Co., Ltd. 3.75% 5/29/2024 | | | 750 | | | | 713 | |
| Huarong Finance 2019 Co., Ltd. (3-month USD-LIBOR + 1.25%) 6.007% 2/24/202510 | | | 1,334 | | | | 1,257 | |
| Huarong Finance 2019 Co., Ltd. 4.50% 5/29/2029 | | | 4,332 | | | | 3,600 | |
| Huarong Finance 2019 Co., Ltd. 3.875% 11/13/2029 | | | 1,520 | | | | 1,203 | |
| Huarong Finance 2019 Co., Ltd. 3.375% 2/24/2030 | | | 1,496 | | | | 1,142 | |
| Huarong Finance II Co., Ltd. 5.50% 1/16/2025 | | | 3,287 | | | | 3,119 | |
| Huarong Finance II Co., Ltd. 5.00% 11/19/2025 | | | 3,769 | | | | 3,484 | |
| Huarong Finance II Co., Ltd. 4.625% 6/3/2026 | | | 2,469 | | | | 2,182 | |
| Huarong Finance II Co., Ltd. 4.875% 11/22/2026 | | | 3,058 | | | | 2,738 | |
| HUB International, Ltd. 7.00% 5/1/20268 | | | 2,025 | | | | 1,987 | |
| Humana, Inc. 3.70% 3/23/2029 | | | 582 | | | | 534 | |
| Hyundai Capital America 0.875% 6/14/20248 | | | 8,710 | | | | 8,129 | |
| Hyundai Capital America 1.80% 10/15/20258 | | | 666 | | | | 600 | |
| Hyundai Capital America 1.50% 6/15/20268 | | | 6,775 | | | | 5,878 | |
| Hyundai Capital America 2.00% 6/15/20288 | | | 4,375 | | | | 3,571 | |
| iHeartCommunications, Inc. 5.25% 8/15/20278 | | | 500 | | | | 424 | |
| Iliad Holding SAS 6.50% 10/15/20268 | | | 375 | | | | 348 | |
| Imperial Tobacco Finance PLC 6.125% 7/27/20278 | | | 1,285 | | | | 1,281 | |
| Indonesia (Republic of) 4.65% 9/20/2032 | | | 1,350 | | | | 1,324 | |
| Ingles Markets, Inc. 4.00% 6/15/20318 | | | 545 | | | | 459 | |
| Intercontinental Exchange, Inc. 4.00% 9/15/2027 | | | 15,260 | | | | 14,759 | |
| Intercontinental Exchange, Inc. 4.35% 6/15/2029 | | | 3,950 | | | | 3,824 | |
| Intercontinental Exchange, Inc. 4.60% 3/15/2033 | | | 1,395 | | | | 1,337 | |
| Intercontinental Exchange, Inc. 2.65% 9/15/2040 | | | 300 | | | | 209 | |
| Intercontinental Exchange, Inc. 3.00% 6/15/2050 | | | 475 | | | | 322 | |
| Intercontinental Exchange, Inc. 4.95% 6/15/2052 | | | 1,282 | | | | 1,194 | |
| International Flavors & Fragrances, Inc. 1.23% 10/1/20258 | | | 2,000 | | | | 1,769 | |
| International Flavors & Fragrances, Inc. 1.832% 10/15/20278 | | | 853 | | | | 717 | |
| International Flavors & Fragrances, Inc. 2.30% 11/1/20308 | | | 1,740 | | | | 1,384 | |
| International Flavors & Fragrances, Inc. 3.268% 11/15/20408 | | | 1,000 | | | | 717 | |
| International Flavors & Fragrances, Inc. 3.468% 12/1/20508 | | | 2,000 | | | | 1,362 | |
| International Game Technology PLC 4.125% 4/15/20268 | | | 700 | | | | 654 | |
| International Game Technology PLC 5.25% 1/15/20298 | | | 620 | | | | 579 | |
| Interstate Power and Light Co. 2.30% 6/1/2030 | | | 4,150 | | | | 3,401 | |
| Intesa Sanpaolo SpA 3.25% 9/23/20248 | | | 7,125 | | | | 6,762 | |
| Intesa Sanpaolo SpA 7.00% 11/21/20258 | | | 1,375 | | | | 1,404 | |
| Intesa Sanpaolo SpA 8.248% 11/21/2033 (1-year UST Yield Curve Rate T Note Constant Maturity + 4.40% on 11/21/2032)1,8 | | | 1,250 | | | | 1,272 | |
| Invitation Homes Operating Partnership, LP 2.30% 11/15/2028 | | | 754 | | | | 625 | |
| Invitation Homes Operating Partnership, LP 2.00% 8/15/2031 | | | 1,220 | | | | 904 | |
| Invitation Homes Operating Partnership, LP 2.70% 1/15/2034 | | | 814 | | | | 596 | |
| Iqvia, Inc. 5.00% 5/15/20278 | | | 630 | | | | 602 | |
| Iraq (Republic of) 6.752% 3/9/20238 | | | 2,200 | | | | 2,177 | |
| Iron Mountain Information Management Services, Inc. 5.00% 7/15/20328 | | | 310 | | | | 258 | |
| Iron Mountain, Inc. 5.25% 7/15/20308 | | | 1,187 | | | | 1,034 | |
| Israel (State of) 2.875% 3/16/2026 | | | 726 | | | | 693 | |
| Israel (State of) 2.50% 1/15/2030 | | | 16,570 | | | | 14,862 | |
| ITC Holdings Corp. 3.35% 11/15/2027 | | | 889 | | | | 820 | |
| Jacobs Entertainment, Inc. 6.75% 2/15/20298 | | | 495 | | | | 447 | |
| Johnson & Johnson 0.95% 9/1/2027 | | | 1,082 | | | | 933 | |
| Johnson & Johnson 1.30% 9/1/2030 | | | 3,265 | | | | 2,640 | |
| Johnson & Johnson 2.10% 9/1/2040 | | | 1,000 | | | | 692 | |
| Johnson & Johnson 2.25% 9/1/2050 | | | 2,426 | | | | 1,513 | |
| 22 | Capital World Bond Fund |
| Bonds, notes & other debt instruments (continued) | | Principal amount
(000) | | | Value
(000) | |
| U.S. dollars (continued) | | | | | | | | |
| JPMorgan Chase & Co. 1.578% 4/22/2027 (USD-SOFR + 0.885% on 4/22/2026)1 | | USD | 6,109 | | | $ | 5,375 | |
| JPMorgan Chase & Co. 4.323% 4/26/2028 (USD-SOFR + 1.56% on 4/26/2027)1 | | | 6,499 | | | | 6,217 | |
| JPMorgan Chase & Co. 4.493% 3/24/2031 (USD-SOFR + 3.79% on 3/24/2030)1 | | | 15,010 | | | | 14,054 | |
| JPMorgan Chase & Co. 4.912% 7/25/2033 (USD-SOFR + 2.08% on 7/25/2032)1 | | | 1,330 | | | | 1,270 | |
| JPMorgan Chase & Co. 3.328% 4/22/2052 (USD-SOFR + 1.58% on 4/22/2051)1 | | | 4,498 | | | | 3,060 | |
| Kasikornbank PCL HK 3.343% 10/2/2031 (5-year UST Yield Curve Rate T Note Constant Maturity + 1.70% on 10/2/2026)1 | | | 3,740 | | | | 3,296 | |
| Keb Hana Bank 3.25% 3/30/20278 | | | 11,290 | | | | 10,532 | |
| Kennedy-Wilson Holdings, Inc. 4.75% 3/1/2029 | | | 695 | | | | 552 | |
| Kennedy-Wilson Holdings, Inc. 4.75% 2/1/2030 | | | 1,575 | | | | 1,203 | |
| Kimberly-Clark Corp. 3.10% 3/26/2030 | | | 668 | | | | 603 | |
| Kinder Morgan, Inc. 3.60% 2/15/2051 | | | 6,560 | | | | 4,547 | |
| Kinetik Holdings, LP 5.875% 6/15/20308 | | | 375 | | | | 352 | |
| Korea Development Bank 4.25% 9/8/2032 | | | 690 | | | | 654 | |
| Korea Electric Power Corp. 4.00% 6/14/20278 | | | 700 | | | | 666 | |
| Korea National Oil Corp. 2.625% 4/18/2032 | | | 500 | | | | 405 | |
| Kronos Acquisition Holdings, Inc. 5.00% 12/31/20268 | | | 490 | | | | 424 | |
| Kronos Acquisition Holdings, Inc. 7.00% 12/31/20278 | | | 1,450 | | | | 1,194 | |
| LABL Escrow Issuer, LLC 10.50% 7/15/20278 | | | 400 | | | | 373 | |
| Lamar Media Corp. 3.75% 2/15/2028 | | | 840 | | | | 753 | |
| Lamar Media Corp. 3.625% 1/15/2031 | | | 1,000 | | | | 828 | |
| Lamb Weston Holdings, Inc. 4.125% 1/31/20308 | | | 1,160 | | | | 1,026 | |
| Lamb Weston Holdings, Inc. 4.375% 1/31/20328 | | | 400 | | | | 350 | |
| Las Vegas Sands Corp. 3.20% 8/8/2024 | | | 97 | | | | 92 | |
| LCM Investments Holdings II, LLC 4.875% 5/1/20298 | | | 1,071 | | | | 859 | |
| Leader Goal International, Ltd. 4.25% perpetual bonds (5-year UST Yield Curve Rate T Note Constant Maturity + 6.919% on 1/19/2023)1 | | | 350 | | | | 350 | |
| Level 3 Financing, Inc. 3.75% 7/15/20298 | | | 1,325 | | | | 955 | |
| Levi Strauss & Co. 3.50% 3/1/20318 | | | 730 | | | | 580 | |
| Ligado Networks, LLC 15.50% PIK 11/1/20238,11 | | | 356 | | | | 116 | |
| Linde, Inc. 4.70% 12/5/2025 | | | 2,000 | | | | 2,004 | |
| Lithia Motors, Inc. 4.625% 12/15/20278 | | | 750 | | | | 678 | |
| Lithia Motors, Inc. 3.875% 6/1/20298 | | | 60 | | | | 49 | |
| Live Nation Entertainment, Inc. 4.75% 10/15/20278 | | | 820 | | | | 731 | |
| Lloyds Banking Group PLC 3.75% 1/11/2027 | | | 2,827 | | | | 2,634 | |
| Lockheed Martin Corp. 5.10% 11/15/2027 | | | 985 | | | | 1,008 | |
| Lockheed Martin Corp. 5.25% 1/15/2033 | | | 2,021 | | | | 2,090 | |
| Lockheed Martin Corp. 5.70% 11/15/2054 | | | 1,154 | | | | 1,217 | |
| Lowe’s Companies, Inc. 3.00% 10/15/2050 | | | 628 | | | | 402 | |
| LPL Holdings, Inc. 4.625% 11/15/20278 | | | 2,595 | | | | 2,428 | |
| LPL Holdings, Inc. 4.00% 3/15/20298 | | | 1,150 | | | | 1,002 | |
| LSB Industries, Inc. 6.25% 10/15/20288 | | | 840 | | | | 770 | |
| LSC Communications, Inc. 8.75% 10/15/20233,6,8 | | | 2,502 | | | | 8 | |
| LYB International Finance III, LLC 3.625% 4/1/2051 | | | 1,409 | | | | 949 | |
| Mallinckrodt PLC 10.00% 4/15/20258 | | | 290 | | | | 250 | |
| Marsh & McLennan Companies, Inc. 3.875% 3/15/2024 | | | 370 | | | | 365 | |
| Marsh & McLennan Companies, Inc. 4.375% 3/15/2029 | | | 160 | | | | 155 | |
| Marsh & McLennan Companies, Inc. 2.25% 11/15/2030 | | | 351 | | | | 288 | |
| Marsh & McLennan Companies, Inc. 2.375% 12/15/2031 | | | 711 | | | | 576 | |
| Marsh & McLennan Companies, Inc. 2.90% 12/15/2051 | | | 600 | | | | 387 | |
| Masco Corp. 1.50% 2/15/2028 | | | 533 | | | | 442 | |
| Masco Corp. 2.00% 2/15/2031 | | | 400 | | | | 309 | |
| Mastercard, Inc. 1.90% 3/15/2031 | | | 1,653 | | | | 1,347 | |
| Mastercard, Inc. 2.00% 11/18/2031 | | | 4,527 | | | | 3,646 | |
| Mastercard, Inc. 2.95% 3/15/2051 | | | 772 | | | | 550 | |
| Match Group, Inc. 5.625% 2/15/20298 | | | 825 | | | | 769 | |
| Mattel, Inc. 3.75% 4/1/20298 | | | 275 | | | | 242 | |
| McDonald’s Corp. 4.60% 9/9/2032 | | | 1,415 | | | | 1,388 | |
| McDonald’s Corp. 5.15% 9/9/2052 | | | 520 | | | | 502 | |
| Meituan Dianping 3.05% 10/28/20308 | | | 565 | | | | 436 | |
| Melco International Development, Ltd. 4.875% 6/6/20258 | | | 400 | | | | 368 | |
| Mercedes-Benz Finance North America, LLC 5.50% 11/27/20248 | | | 333 | | | | 335 | |
| Mercedes-Benz Finance North America, LLC 5.375% 11/26/20258 | | | 150 | | | | 151 | |
| Merck & Co., Inc. 1.45% 6/24/2030 | | | 4,500 | | | | 3,601 | |
| Methanex Corp. 5.125% 10/15/2027 | | | 500 | | | | 465 | |
| Methanex Corp. 5.25% 12/15/2029 | | | 1,095 | | | | 973 | |
| MetLife, Inc. 5.00% 7/15/2052 | | | 230 | | | | 220 | |
| Metropolitan Life Global Funding I 1.95% 1/13/20238 | | | 1,000 | | | | 999 | |
| Metropolitan Life Global Funding I 0.95% 7/2/20258 | | | 666 | | | | 604 | |
| Capital World Bond Fund | 23 |
| Bonds, notes & other debt instruments (continued) | | Principal amount
(000) | | | Value
(000) | |
| U.S. dollars (continued) | | | | | | | | |
| Metropolitan Life Global Funding I 3.45% 12/18/20268 | | USD | 2,310 | | | $ | 2,162 | |
| Metropolitan Life Global Funding I 1.875% 1/11/20278 | | | 1,500 | | | | 1,329 | |
| Metropolitan Life Global Funding I 3.00% 9/19/20278 | | | 1,150 | | | | 1,047 | |
| Metropolitan Life Global Funding I 4.30% 8/25/20298 | | | 1,000 | | | | 952 | |
| Metropolitan Life Global Funding I 1.55% 1/7/20318 | | | 571 | | | | 444 | |
| Mexico City Airport Trust 4.25% 10/31/2026 | | | 1,278 | | | | 1,221 | |
| Mexico City Airport Trust 3.875% 4/30/2028 | | | 1,672 | | | | 1,532 | |
| Mexico City Airport Trust 5.50% 10/31/2046 | | | 2,675 | | | | 2,064 | |
| Mexico City Airport Trust 5.50% 7/31/20478 | | | 287 | | | | 222 | |
| MGM Resorts International 5.50% 4/15/2027 | | | 560 | | | | 522 | |
| Microsoft Corp. 2.40% 8/8/2026 | | | 3,000 | | | | 2,801 | |
| Microsoft Corp. 3.30% 2/6/2027 | | | 4,725 | | | | 4,561 | |
| Midas OpCo Holdings, LLC 5.625% 8/15/20298 | | | 510 | | | | 422 | |
| Mileage Plus Holdings, LLC 6.50% 6/20/20278 | | | 832 | | | | 830 | |
| Mineral Resources, Ltd. 8.00% 11/1/20278 | | | 1,000 | | | | 1,024 | |
| Mineral Resources, Ltd. 8.50% 5/1/20308 | | | 385 | | | | 391 | |
| MISC Capital Two (Labuan), Ltd. 3.75% 4/6/20278 | | | 10,569 | | | | 9,591 | |
| Mohegan Gaming & Entertainment 8.00% 2/1/20268 | | | 310 | | | | 290 | |
| Molina Healthcare, Inc. 4.375% 6/15/20288 | | | 625 | | | | 571 | |
| Molina Healthcare, Inc. 3.875% 11/15/20308 | | | 460 | | | | 391 | |
| MoneyGram International, Inc. 5.375% 8/1/20268 | | | 215 | | | | 218 | |
| Mongolia (State of) 8.75% 3/9/2024 | | | 500 | | | | 485 | |
| Mongolia (State of) 5.125% 4/7/2026 | | | 700 | | | | 606 | |
| Mongolia (State of) 3.50% 7/7/2027 | | | 200 | | | | 162 | |
| Morgan Stanley 0.985% 12/10/2026 (USD-SOFR + 0.72% on 12/10/2025)1 | | | 14,750 | | | | 12,939 | |
| Morgan Stanley 1.593% 5/4/2027 (USD-SOFR + 0.879% on 5/4/2026)1 | | | 10,772 | | | | 9,462 | |
| Morgan Stanley 4.889% 7/20/2033 (USD-SOFR + 2.077% on 7/20/2032)1 | | | 580 | | | | 547 | |
| Morgan Stanley 5.297% 4/20/2037 (USD-SOFR + 2.62% on 4/20/2032)1 | | | 1,540 | | | | 1,412 | |
| Movida Europe SA 5.25% 2/8/20318 | | | 4,770 | | | | 3,583 | |
| Mozambique (Republic of) 5.00% 9/15/2031 (9.00% on 9/15/2023)1 | | | 1,650 | | | | 1,271 | |
| Mozart Debt Merger Sub, Inc. 5.25% 10/1/20298 | | | 1,110 | | | | 884 | |
| MSCI, Inc. 3.875% 2/15/20318 | | | 855 | | | | 712 | |
| MSCI, Inc. 3.625% 11/1/20318 | | | 2,115 | | | | 1,752 | |
| Muenchener Rueckversicherungs-Gesellschaft AG 5.875% 5/23/2042 (5-year UST Yield Curve Rate T Note Constant Maturity + 3.982% on 5/23/2032)1,8 | | | 3,000 | | | | 3,003 | |
| Murphy Oil Corp. 5.625% 5/1/2027 | | | 75 | | | | 73 | |
| Nabors Industries, Inc. 7.375% 5/15/20278 | | | 700 | | | | 679 | |
| National Financial Partners Corp. 6.875% 8/15/20288 | | | 748 | | | | 618 | |
| National Grid PLC 3.15% 8/1/20278 | | | 1,105 | | | | 995 | |
| Navient Corp. 5.00% 3/15/2027 | | | 380 | | | | 333 | |
| Navient Corp. 4.875% 3/15/2028 | | | 1,050 | | | | 865 | |
| NBM US Holdings, Inc. 7.00% 5/14/20262 | | | 9,816 | | | | 9,763 | |
| NCL Corp., Ltd. 5.875% 2/15/20278 | | | 575 | | | | 499 | |
| NCR Corp. 5.25% 10/1/20308 | | | 172 | | | | 142 | |
| Neiman Marcus Group, LLC 7.125% 4/1/20268 | | | 540 | | | | 507 | |
| Nestlé Holdings, Inc. 0.625% 1/15/20268 | | | 6,692 | | | | 5,944 | |
| Nestlé Holdings, Inc. 1.15% 1/14/20278 | | | 2,650 | | | | 2,311 | |
| Nestlé Holdings, Inc. 1.00% 9/15/20278 | | | 4,275 | | | | 3,629 | |
| Nestle Skin Health SA, Term Loan B3, (3-month USD-LIBOR + 3.75%) 8.48% 10/1/20269,10 | | | 995 | | | | 955 | |
| Netflix, Inc. 4.875% 4/15/2028 | | | 1,957 | | | | 1,894 | |
| Netflix, Inc. 5.875% 11/15/2028 | | | 2,750 | | | | 2,794 | |
| Netflix, Inc. 5.375% 11/15/20298 | | | 1,918 | | | | 1,864 | |
| Netflix, Inc. 4.875% 6/15/20308 | | | 1,309 | | | | 1,223 | |
| New Fortress Energy, Inc. 6.75% 9/15/20258 | | | 970 | | | | 920 | |
| New Fortress Energy, Inc. 6.50% 9/30/20268 | | | 1,745 | | | | 1,624 | |
| New York Life Global Funding 0.95% 6/24/20258 | | | 842 | | | | 763 | |
| New York Life Global Funding 0.85% 1/15/20268 | | | 750 | | | | 667 | |
| New York Life Global Funding 1.20% 8/7/20308 | | | 11,702 | | | | 8,994 | |
| New York State Electric & Gas Corp. 3.25% 12/1/20268 | | | 3,000 | | | | 2,824 | |
| Newcrest Finance Pty, Ltd. 3.25% 5/13/20308 | | | 2,143 | | | | 1,793 | |
| News Corp. 5.125% 2/15/20328 | | | 515 | | | | 469 | |
| Nexstar Broadcasting, Inc. 4.75% 11/1/20288 | | | 1,527 | | | | 1,323 | |
| Nexstar Escrow Corp. 5.625% 7/15/20278 | | | 515 | | | | 473 | |
| NextEra Energy Capital Holdings, Inc. 1.90% 6/15/2028 | | | 6,375 | | | | 5,454 | |
| NGL Energy Operating, LLC 7.50% 2/1/20268 | | | 1,955 | | | | 1,744 | |
| NGL Energy Partners, LP 7.50% 11/1/2023 | | | 222 | | | | 217 | |
| Niagara Mohawk Power Corp. 4.278% 10/1/20348 | | | 3,000 | | | | 2,605 | |
| Nigeria (Republic of) 8.375% 3/24/20298 | | | 1,025 | | | | 853 | |
| 24 | Capital World Bond Fund |
| Bonds, notes & other debt instruments (continued) | | Principal amount
(000) | | | Value
(000) | |
| U.S. dollars (continued) | | | | | | | | |
| NIKE, Inc. 3.375% 3/27/2050 | | USD | 1,680 | | | $ | 1,323 | |
| Nordea Bank AB 3.60% 6/6/20258 | | | 4,575 | | | | 4,419 | |
| Norfolk Southern Corp. 3.05% 5/15/2050 | | | 816 | | | | 550 | |
| Norfolk Southern Corp. 4.55% 6/1/2053 | | | 474 | | | | 415 | |
| Northern Oil and Gas, Inc. 8.125% 3/1/20288 | | | 2,125 | | | | 2,043 | |
| Northern States Power Co. 2.60% 6/1/2051 | | | 937 | | | | 598 | |
| Northern States Power Co. 4.50% 6/1/2052 | | | 262 | | | | 239 | |
| Northern Trust Corp. 6.125% 11/2/2032 | | | 1,620 | | | | 1,713 | |
| NortonLifeLock, Inc. 7.125% 9/30/20308 | | | 1,000 | | | | 984 | |
| Nova Chemicals Corp. 4.25% 5/15/20298 | | | 430 | | | | 352 | |
| Novartis Capital Corp. 2.20% 8/14/2030 | | | 4,000 | | | | 3,412 | |
| Novelis Corp. 4.75% 1/30/20308 | | | 290 | | | | 258 | |
| Novelis Corp. 3.875% 8/15/20318 | | | 230 | | | | 188 | |
| NuStar Logistics, LP 5.625% 4/28/2027 | | | 630 | | | | 590 | |
| Nutrien, Ltd. 5.95% 11/7/2025 | | | 277 | | | | 283 | |
| Oasis Petroleum, Inc. 6.375% 6/1/20268 | | | 680 | | | | 663 | |
| Occidental Petroleum Corp. 6.375% 9/1/2028 | | | 1,565 | | | | 1,582 | |
| Occidental Petroleum Corp. 8.875% 7/15/2030 | | | 150 | | | | 170 | |
| Occidental Petroleum Corp. 6.625% 9/1/2030 | | | 765 | | | | 792 | |
| Occidental Petroleum Corp. 6.125% 1/1/2031 | | | 495 | | | | 501 | |
| Occidental Petroleum Corp. 6.45% 9/15/2036 | | | 115 | | | | 118 | |
| Occidental Petroleum Corp. 6.60% 3/15/2046 | | | 85 | | | | 88 | |
| State of Ohio, Turnpike and Infrastructure Commission, Turnpike Rev. Ref. Bonds (Infrastructure Projects), Series 2020-A, 3.216% 2/15/2048 | | | 7,560 | | | | 5,405 | |
| Oleoducto Central SA 4.00% 7/14/20278 | | | 15,275 | | | | 13,502 | |
| Oleoducto Central SA 4.00% 7/14/2027 | | | 3,352 | | | | 2,963 | |
| Oman (Sultanate of) 6.25% 1/25/20318 | | | 3,400 | | | | 3,432 | |
| Oncor Electric Delivery Company, LLC 2.75% 5/15/2030 | | | 400 | | | | 349 | |
| Oncor Electric Delivery Company, LLC 4.55% 9/15/20328 | | | 1,875 | | | | 1,842 | |
| Oncor Electric Delivery Company, LLC 2.70% 11/15/2051 | | | 3,223 | | | | 2,120 | |
| Open Text Corp., Term Loan B, (3-month USD-LIBOR + 3.50%) 3.50% 11/16/20299,10 | | | 1,000 | | | | 977 | |
| Option Care Health, Inc. 4.375% 10/31/20298 | | | 150 | | | | 131 | |
| Oracle Corp. 3.25% 11/15/2027 | | | 4 | | | | 4 | |
| Oracle Corp. 3.60% 4/1/2050 | | | 2,475 | | | | 1,677 | |
| Oracle Corp. 3.95% 3/25/2051 | | | 1,846 | | | | 1,323 | |
| Organon Finance 1, LLC 4.125% 4/30/20288 | | | 250 | | | | 222 | |
| Oxford Finance, LLC 6.375% 2/1/20278 | | | 225 | | | | 210 | |
| Pacific Gas and Electric Co. 2.10% 8/1/2027 | | | 1,800 | | | | 1,540 | |
| Pacific Gas and Electric Co. 3.00% 6/15/2028 | | | 15,640 | | | | 13,551 | |
| Pacific Gas and Electric Co. 4.65% 8/1/2028 | | | 11,414 | | | | 10,516 | |
| Pacific Gas and Electric Co. 4.55% 7/1/2030 | | | 3,834 | | | | 3,484 | |
| Pacific Gas and Electric Co. 2.50% 2/1/2031 | | | 6,692 | | | | 5,208 | |
| Pacific Gas and Electric Co. 3.25% 6/1/2031 | | | 9,826 | | | | 8,011 | |
| Pacific Gas and Electric Co. 3.30% 8/1/2040 | | | 19,545 | | | | 13,300 | |
| Pacific Gas and Electric Co. 3.75% 8/15/2042 | | | 2,549 | | | | 1,719 | |
| Panama (Republic of) 3.75% 4/17/20268 | | | 411 | | | | 388 | |
| Panama (Republic of) 4.50% 4/1/2056 | | | 1,139 | | | | 835 | |
| Panama (Republic of) 3.87% 7/23/2060 | | | 1,160 | | | | 752 | |
| Panama (Republic of) 4.50% 1/19/2063 | | | 470 | | | | 333 | |
| Panther BF Aggregator 2, LP 8.50% 5/15/20278 | | | 350 | | | | 343 | |
| Park Intermediate Holdings, LLC 4.875% 5/15/20298 | | | 320 | | | | 271 | |
| Parker-Hannifin Corp. 3.25% 6/14/2029 | | | 70 | | | | 63 | |
| Party City Holdings, Inc. 8.75% 2/15/20268 | | | 556 | | | | 161 | |
| Patterson-UTI Energy, Inc. 5.15% 11/15/2029 | | | 45 | | | | 40 | |
| PayPal Holdings, Inc. 2.30% 6/1/2030 | | | 3,095 | | | | 2,550 | |
| PayPal Holdings, Inc. 3.25% 6/1/2050 | | | 196 | | | | 134 | |
| PepsiCo, Inc. 1.95% 10/21/2031 | | | 1,162 | | | | 942 | |
| PepsiCo, Inc. 3.625% 3/19/2050 | | | 264 | | | | 217 | |
| PepsiCo, Inc. 2.75% 10/21/2051 | | | 586 | | | | 408 | |
| Performance Food Group, Inc. 5.50% 10/15/20278 | | | 395 | | | | 373 | |
| Performance Food Group, Inc. 4.25% 8/1/20298 | | | 340 | | | | 295 | |
| Petrobras Global Finance Co. 6.75% 6/3/2050 | | | 176 | | | | 154 | |
| Petrobras Global Finance Co. 5.50% 6/10/2051 | | | 124 | | | | 95 | |
| Petróleos Mexicanos 3.50% 1/30/2023 | | | 1,200 | | | | 1,197 | |
| Petróleos Mexicanos 4.625% 9/21/2023 | | | 271 | | | | 267 | |
| Petróleos Mexicanos 4.25% 1/15/2025 | | | 160 | | | | 151 | |
| Petróleos Mexicanos 6.875% 10/16/2025 | | | 4,006 | | | | 3,928 | |
| Petróleos Mexicanos 6.875% 8/4/2026 | | | 9,000 | | | | 8,520 | |
| Petróleos Mexicanos 6.50% 3/13/2027 | | | 10,486 | | | | 9,587 | |
| Capital World Bond Fund | 25 |
| Bonds, notes & other debt instruments (continued) | | Principal amount
(000) | | | Value
(000) | |
| U.S. dollars (continued) | | | | | | | | |
| Petróleos Mexicanos 6.50% 1/23/2029 | | USD | 380 | | | $ | 326 | |
| Petróleos Mexicanos 8.75% 6/2/2029 | | | 3,450 | | | | 3,240 | |
| Petróleos Mexicanos 5.95% 1/28/2031 | | | 1,554 | | | | 1,180 | |
| Petróleos Mexicanos 6.75% 9/21/2047 | | | 1,594 | | | | 1,021 | |
| Petróleos Mexicanos 6.95% 1/28/2060 | | | 776 | | | | 492 | |
| PETRONAS Capital, Ltd. 3.50% 4/21/20308 | | | 665 | | | | 608 | |
| PETRONAS Capital, Ltd. 4.55% 4/21/20508 | | | 2,540 | | | | 2,278 | |
| PetSmart, Inc. 4.75% 2/15/20288 | | | 750 | | | | 680 | |
| PetSmart, Inc. 7.75% 2/15/20298 | | | 750 | | | | 706 | |
| PG&E Corp. 5.00% 7/1/2028 | | | 1,895 | | | | 1,733 | |
| PG&E Corp. 5.25% 7/1/2030 | | | 320 | | | | 292 | |
| PGT Innovations, Inc. 4.375% 10/1/20298 | | | 400 | | | | 335 | |
| Philip Morris International, Inc. 5.125% 11/17/2027 | | | 2,143 | | | | 2,162 | |
| Philip Morris International, Inc. 5.625% 11/17/2029 | | | 2,577 | | | | 2,620 | |
| Philip Morris International, Inc. 2.10% 5/1/2030 | | | 3,783 | | | | 3,068 | |
| Philip Morris International, Inc. 1.75% 11/1/2030 | | | 503 | | | | 395 | |
| Philip Morris International, Inc. 5.75% 11/17/2032 | | | 9,986 | | | | 10,211 | |
| Philippines (Republic of) 6.375% 1/15/2032 | | | 2,190 | | | | 2,436 | |
| Philippines (Republic of) 6.375% 10/23/2034 | | | 2,320 | | | | 2,576 | |
| Picard Midco, Inc. 6.50% 3/31/20298 | | | 1,500 | | | | 1,266 | |
| Pilgrim’s Pride Corp. 5.875% 9/30/20278 | | | 300 | | | | 292 | |
| Plains All American Pipeline, LP 3.80% 9/15/2030 | | | 1,797 | | | | 1,566 | |
| PLDT, Inc. 2.50% 1/23/2031 | | | 580 | | | | 455 | |
| PLDT, Inc. 3.45% 6/23/2050 | | | 400 | | | | 278 | |
| PM General Purchaser, LLC 9.50% 10/1/20288 | | | 335 | | | | 256 | |
| PNC Financial Services Group, Inc. 6.037% 10/28/2033 (USD-SOFR + 2.14% on 10/28/2032)1 | | | 5,155 | | | | 5,383 | |
| Poland (Republic of) 5.75% 11/16/2032 | | | 885 | | | | 945 | |
| Post Holdings, Inc. 5.625% 1/15/20288 | | | 1,330 | | | | 1,254 | |
| Post Holdings, Inc. 5.50% 12/15/20298 | | | 490 | | | | 444 | |
| Post Holdings, Inc. 4.625% 4/15/20308 | | | 535 | | | | 463 | |
| Power Financial Corp., Ltd. 4.50% 6/18/2029 | | | 640 | | | | 592 | |
| Power Financial Corp., Ltd. 3.35% 5/16/2031 | | | 6,950 | | | | 5,775 | |
| Praxair, Inc. 2.00% 8/10/2050 | | | 412 | | | | 230 | |
| Procter & Gamble Company 0.55% 10/29/2025 | | | 1,792 | | | | 1,609 | |
| Procter & Gamble Company 1.00% 4/23/2026 | | | 338 | | | | 303 | |
| Procter & Gamble Company 1.20% 10/29/2030 | | | 1,685 | | | | 1,326 | |
| Prudential Financial, Inc. 3.905% 12/7/2047 | | | 250 | | | | 200 | |
| PT Indofood CBP Sukses Makmur Tbk 3.398% 6/9/2031 | | | 580 | | | | 483 | |
| PT Indonesia Asahan Aluminium Tbk 6.53% 11/15/20288 | | | 1,030 | | | | 1,044 | |
| PT Indonesia Asahan Aluminium Tbk 5.45% 5/15/20308 | | | 6,360 | | | | 6,069 | |
| PT Indonesia Asahan Aluminium Tbk 5.80% 5/15/2050 | | | 200 | | | | 168 | |
| PTT Exploration and Production PCL 2.587% 6/10/20278 | | | 1,460 | | | | 1,298 | |
| Public Service Company of Colorado 1.875% 6/15/2031 | | | 2,332 | | | | 1,862 | |
| Public Service Electric and Gas Co. 2.05% 8/1/2050 | | | 2,700 | | | | 1,518 | |
| Qatar (State of) 4.00% 3/14/20298 | | | 1,661 | | | | 1,635 | |
| Qatar (State of) 4.00% 3/14/2029 | | | 675 | | | | 665 | |
| Qatar (State of) 4.40% 4/16/20508 | | | 2,145 | | | | 1,969 | |
| Qatar Petroleum 2.25% 7/12/20318 | | | 932 | | | | 774 | |
| Qatar Petroleum 3.125% 7/12/20418 | | | 16,587 | | | | 12,808 | |
| Qatar Petroleum 3.30% 7/12/20518 | | | 4,710 | | | | 3,489 | |
| Radiology Partners, Inc. 9.25% 2/1/20288 | | | 1,414 | | | | 796 | |
| Radiology Partners, Inc., Term Loan, (3-month USD-LIBOR + 4.25%) 8.639% 7/9/20259,10 | | | 70 | | | | 59 | |
| Range Resources Corp. 8.25% 1/15/2029 | | | 635 | | | | 655 | |
| Range Resources Corp. 4.75% 2/15/20308 | | | 1,195 | | | | 1,055 | |
| Raptor Acquisition Corp. 4.875% 11/1/20268 | | | 650 | | | | 578 | |
| Raytheon Technologies Corp. 1.90% 9/1/2031 | | | 1,430 | | | | 1,126 | |
| Raytheon Technologies Corp. 2.375% 3/15/2032 | | | 500 | | | | 406 | |
| Raytheon Technologies Corp. 2.82% 9/1/2051 | | | 750 | | | | 489 | |
| Raytheon Technologies Corp. 3.03% 3/15/2052 | | | 500 | | | | 341 | |
| Regeneron Pharmaceuticals, Inc. 1.75% 9/15/2030 | | | 7,373 | | | | 5,711 | |
| Rio Tinto Finance (USA), Ltd. 2.75% 11/2/2051 | | | 1,217 | | | | 811 | |
| RLJ Lodging Trust, LP 4.00% 9/15/20298 | | | 180 | | | | 146 | |
| Roche Holdings, Inc. 1.93% 12/13/20288 | | | 3,000 | | | | 2,570 | |
| Roche Holdings, Inc. 2.076% 12/13/20318 | | | 6,500 | | | | 5,306 | |
| Royal Bank of Canada 6.00% 11/1/2027 | | | 2,155 | | | | 2,250 | |
| Royal Bank of Scotland PLC 4.445% 5/8/2030 (3-month USD-LIBOR + 1.871% on 5/5/2029)1 | | | 8,625 | | | | 7,828 | |
| 26 | Capital World Bond Fund |
| Bonds, notes & other debt instruments (continued) | | Principal amount
(000) | | | Value
(000) | |
| U.S. dollars (continued) | | | | | | | | |
| Royal Caribbean Cruises, Ltd. 11.50% 6/1/20258 | | USD | 298 | | | $ | 320 | |
| Royal Caribbean Cruises, Ltd. 5.375% 7/15/20278 | | | 300 | | | | 243 | |
| Royal Caribbean Cruises, Ltd. 8.25% 1/15/20298 | | | 230 | | | | 231 | |
| Royal Caribbean Cruises, Ltd. 9.25% 1/15/20298 | | | 1,139 | | | | 1,172 | |
| RP Escrow Issuer, LLC 5.25% 12/15/20258 | | | 1,025 | | | | 784 | |
| Russian Federation 4.25% 6/23/20273 | | | 8,800 | | | | 3,784 | |
| Russian Federation 4.375% 3/21/20293 | | | 19,400 | | | | 7,954 | |
| Russian Federation 5.10% 3/28/20353 | | | 1,800 | | | | 738 | |
| Russian Federation 5.25% 6/23/20473 | | | 1,000 | | | | 410 | |
| Ryan Specialty Group, LLC 4.375% 2/1/20308 | | | 305 | | | | 264 | |
| SA Global Sukuk, Ltd. 0.946% 6/17/20248 | | | 955 | | | | 899 | |
| Sabre GLBL, Inc. 11.25% 12/15/20278 | | | 490 | | | | 505 | |
| salesforce.com, inc. 1.95% 7/15/2031 | | | 875 | | | | 700 | |
| salesforce.com, inc. 2.70% 7/15/2041 | | | 375 | | | | 269 | |
| salesforce.com, inc. 2.90% 7/15/2051 | | | 600 | | | | 396 | |
| Sally Holdings, LLC 5.625% 12/1/2025 | | | 227 | | | | 219 | |
| Sands China, Ltd. 2.80% 3/8/20271 | | | 600 | | | | 515 | |
| Sands China, Ltd. 5.90% 8/8/2028 | | | 275 | | | | 258 | |
| Santander Holdings USA, Inc. 3.244% 10/5/2026 | | | 14,395 | | | | 13,379 | |
| Saskatchewan (Province of) 3.25% 6/8/2027 | | | 1,073 | | | | 1,023 | |
| Saudi Arabia (Kingdom of) 3.25% 10/26/2026 | | | 1,700 | | | | 1,626 | |
| Saudi Arabia (Kingdom of) 5.50% 10/25/20328 | | | 1,175 | | | | 1,244 | |
| Scientific Games Corp. 8.625% 7/1/20258 | | | 330 | | | | 337 | |
| Scientific Games Corp. 7.00% 5/15/20288 | | | 310 | | | | 296 | |
| Scientific Games Holdings, LP 6.625% 3/1/20308 | | | 671 | | | | 568 | |
| SCIH Salt Holdings, Inc. 4.875% 5/1/20288 | | | 280 | | | | 241 | |
| SCIH Salt Holdings, Inc. 6.625% 5/1/20298 | | | 560 | | | | 452 | |
| Scotts Miracle-Gro Co. 4.50% 10/15/2029 | | | 720 | | | | 585 | |
| Scotts Miracle-Gro Co. 4.375% 2/1/2032 | | | 345 | | | | 261 | |
| Sealed Air Corp. 5.00% 4/15/20298 | | | 300 | | | | 282 | |
| Senegal (Republic of) 6.75% 3/13/2048 | | | 1,100 | | | | 781 | |
| ServiceNow, Inc. 1.40% 9/1/2030 | | | 10,473 | | | | 8,036 | |
| Shell International Finance BV 3.50% 11/13/2023 | | | 6,611 | | | | 6,535 | |
| Shell International Finance BV 2.375% 11/7/2029 | | | 3,980 | | | | 3,449 | |
| Shell International Finance BV 2.75% 4/6/2030 | | | 3,800 | | | | 3,343 | |
| Sherwin-Williams Company 3.45% 6/1/2027 | | | 892 | | | | 838 | |
| Sherwin-Williams Company 2.95% 8/15/2029 | | | 500 | | | | 439 | |
| Sherwin-Williams Company 2.30% 5/15/2030 | | | 849 | | | | 700 | |
| Sherwin-Williams Company 2.20% 3/15/2032 | | | 750 | | | | 595 | |
| Sherwin-Williams Company 4.50% 6/1/2047 | | | 500 | | | | 422 | |
| Sherwin-Williams Company 3.30% 5/15/2050 | | | 750 | | | | 516 | |
| Sherwin-Williams Company 2.90% 3/15/2052 | | | 250 | | | | 157 | |
| Siam Commercial Bank Public Co., Ltd. 3.90% 2/11/2024 | | | 1,210 | | | | 1,194 | |
| Silgan Holdings, Inc. 4.125% 2/1/2028 | | | 660 | | | | 612 | |
| Simmons Foods, Inc. 4.625% 3/1/20298 | | | 882 | | | | 719 | |
| Singapore Airlines, Ltd. 3.375% 1/19/2029 | | | 18,520 | | | | 16,739 | |
| Sinopec Group Overseas Development (2018), Ltd. 2.30% 1/8/20318 | | | 500 | | | | 421 | |
| Sirius XM Radio, Inc. 4.00% 7/15/20288 | | | 1,350 | | | | 1,178 | |
| Sirius XM Radio, Inc. 3.875% 9/1/20318 | | | 1,480 | | | | 1,158 | |
| Six Flags Theme Parks, Inc. 7.00% 7/1/20258 | | | 730 | | | | 736 | |
| SK hynix, Inc. 1.50% 1/19/20268 | | | 752 | | | | 652 | |
| SK hynix, Inc. 2.375% 1/19/20318 | | | 694 | | | | 510 | |
| SkyMiles IP, Ltd. 4.75% 10/20/20288 | | | 150 | | | | 141 | |
| SM Energy Co. 5.625% 6/1/2025 | | | 350 | | | | 337 | |
| SM Energy Co. 6.50% 7/15/2028 | | | 135 | | | | 130 | |
| Sonic Automotive, Inc. 4.625% 11/15/20298 | | | 350 | | | | 281 | |
| Sonic Automotive, Inc. 4.875% 11/15/20318 | | | 360 | | | | 284 | |
| South32 Treasury, Ltd. 4.35% 4/14/20328 | | | 945 | | | | 811 | |
| Southern California Edison Co. 4.70% 6/1/2027 | | | 228 | | | | 224 | |
| Southern California Edison Co. 5.85% 11/1/2027 | | | 1,000 | | | | 1,031 | |
| Southern California Edison Co. 2.85% 8/1/2029 | | | 1,100 | | | | 958 | |
| Southern California Edison Co. 5.95% 11/1/2032 | | | 750 | | | | 795 | |
| Southern California Edison Co. 2.95% 2/1/2051 | | | 3,069 | | | | 1,980 | |
| Southern California Edison Co. 3.65% 6/1/2051 | | | 3,310 | | | | 2,423 | |
| Southwestern Electric Power Co. 3.25% 11/1/2051 | | | 1,630 | | | | 1,079 | |
| Southwestern Energy Co. 5.95% 1/23/20251 | | | 350 | | | | 344 | |
| Southwestern Energy Co. 8.375% 9/15/2028 | | | 202 | | | | 209 | |
| Southwestern Energy Co. 5.375% 3/15/2030 | | | 870 | | | | 795 | |
| Southwestern Energy Co. 4.75% 2/1/2032 | | | 600 | | | | 514 | |
| Capital World Bond Fund | 27 |
| Bonds, notes & other debt instruments (continued) | | Principal amount
(000) | | | Value
(000) | |
| U.S. dollars (continued) | | | | | | | | |
| Spirit AeroSystems, Inc. 4.60% 6/15/2028 | | USD | 105 | | | $ | 85 | |
| Spirit AeroSystems, Inc. 9.375% 11/30/20298 | | | 1,636 | | | | 1,724 | |
| Sprint Corp. 6.875% 11/15/2028 | | | 697 | | | | 725 | |
| Sri Lanka (Democratic Socialist Republic of) 5.75% 4/18/20233 | | | 10,896 | | | | 3,459 | |
| Sri Lanka (Democratic Socialist Republic of) 5.75% 4/18/20233,8 | | | 214 | | | | 68 | |
| Sri Lanka (Democratic Socialist Republic of) 6.85% 11/3/20253 | | | 2,775 | | | | 895 | |
| State Grid Overseas Investment, Ltd. 3.50% 5/4/20278 | | | 500 | | | | 478 | |
| State Street Corp. 5.82% 11/4/2028 (USD-SOFR + 1.715% on 11/4/2027)1 | | | 679 | | | | 702 | |
| Statoil ASA 3.25% 11/10/2024 | | | 1,050 | | | | 1,024 | |
| STE TransCore Holdings, Inc. 3.75% 5/5/20322 | | | 300 | | | | 272 | |
| Stellantis Finance US, Inc. 1.711% 1/29/20278 | | | 4,000 | | | | 3,438 | |
| Stellantis Finance US, Inc. 5.625% 1/12/20288 | | | 16,400 | | | | 16,268 | |
| Stellantis Finance US, Inc. 2.691% 9/15/20318 | | | 3,775 | | | | 2,889 | |
| Stellantis Finance US, Inc. 6.375% 9/12/20328 | | | 6,000 | | | | 5,941 | |
| Stericycle, Inc. 3.875% 1/15/20298 | | | 295 | | | | 258 | |
| Studio City Finance, Ltd. 6.00% 7/15/20258 | | | 635 | | | | 552 | |
| Summit Digitel Infrastructure Private, Ltd. 2.875% 8/12/20318 | | | 1,035 | | | | 796 | |
| Sun Communities Operating, LP 2.30% 11/1/2028 | | | 788 | | | | 658 | |
| Sun Communities Operating, LP 2.70% 7/15/2031 | | | 1,832 | | | | 1,450 | |
| Sun Communities Operating, LP 4.20% 4/15/2032 | | | 2,334 | | | | 2,062 | |
| Sunoco, LP 4.50% 5/15/2029 | | | 1,550 | | | | 1,358 | |
| Sunoco, LP 4.50% 4/30/2030 | | | 160 | | | | 139 | |
| Surgery Center Holdings 10.00% 4/15/20278 | | | 325 | | | | 331 | |
| SVB Financial Group 4.70% junior subordinated perpetual bonds (5-year UST Yield Curve Rate T Note Constant Maturity + 3.064% on 11/15/2031)1 | | | 3,070 | | | | 1,949 | |
| Swiss Re Finance (Luxembourg) SA 5.00% 4/2/2049 (5-year UST Yield Curve Rate T Note Constant Maturity + 3.582% on 4/2/2029)1,8 | | | 5,600 | | | | 5,182 | |
| Talen Energy Corp. 7.25% 5/15/20278 | | | 675 | | | | 702 | |
| Talen Energy Corp., Term Loan, (3-month USD CME Term SOFR + 4.75%) 9.008% 11/13/20239,10 | | | 545 | | | | 550 | |
| Tencent Holdings, Ltd. 1.81% 1/26/2026 | | | 600 | | | | 541 | |
| Tencent Holdings, Ltd. 3.975% 4/11/2029 | | | 250 | | | | 231 | |
| Tencent Holdings, Ltd. 2.39% 6/3/20308 | | | 300 | | | | 245 | |
| Tencent Holdings, Ltd. 3.68% 4/22/2041 | | | 2,035 | | | | 1,499 | |
| Tencent Holdings, Ltd. 3.24% 6/3/20508 | | | 9,220 | | | | 5,846 | |
| Tencent Holdings, Ltd. 3.24% 6/3/2050 | | | 1,482 | | | | 940 | |
| Tencent Holdings, Ltd. 3.84% 4/22/2051 | | | 3,782 | | | | 2,687 | |
| Tenet Healthcare Corp. 4.875% 1/1/20268 | | | 651 | | | | 617 | |
| Tenet Healthcare Corp. 4.625% 6/15/20288 | | | 350 | | | | 314 | |
| Tenet Healthcare Corp. 6.125% 10/1/20288 | | | 175 | | | | 157 | |
| Teva Pharmaceutical Finance Co. BV 3.15% 10/1/2026 | | | 20,505 | | | | 17,973 | |
| Teva Pharmaceutical Finance Co. BV 4.75% 5/9/2027 | | | 685 | | | | 620 | |
| Teva Pharmaceutical Finance Co. BV 6.75% 3/1/2028 | | | 500 | | | | 489 | |
| Teva Pharmaceutical Finance Co. BV 5.125% 5/9/2029 | | | 1,790 | | | | 1,596 | |
| Teva Pharmaceutical Finance Co. BV 4.10% 10/1/2046 | | | 655 | | | | 402 | |
| State of Texas, Grand Parkway Transportation Corp., Grand Parkway System Toll Rev. Ref. Bonds, Series 2020-B, 3.236% 10/1/2052 | | | 10,005 | | | | 7,117 | |
| Thermo Fisher Scientific, Inc. 4.80% 11/21/2027 | | | 6,320 | | | | 6,352 | |
| Thermo Fisher Scientific, Inc. 4.95% 11/21/2032 | | | 328 | | | | 334 | |
| Tibco Software, Inc., Term Loan A, (3-month USD CME Term SOFR + 4.50%) 9.18% 9/29/20289,10 | | | 1,535 | | | | 1,366 | |
| T-Mobile US, Inc. 1.50% 2/15/2026 | | | 9,025 | | | | 8,091 | |
| T-Mobile US, Inc. 2.05% 2/15/2028 | | | 1,275 | | | | 1,097 | |
| T-Mobile US, Inc. 3.875% 4/15/2030 | | | 1,064 | | | | 966 | |
| T-Mobile US, Inc. 2.55% 2/15/2031 | | | 7,889 | | | | 6,464 | |
| T-Mobile US, Inc. 3.00% 2/15/2041 | | | 1,376 | | | | 976 | |
| T-Mobile US, Inc. 3.40% 10/15/2052 | | | 650 | | | | 440 | |
| TNB Global Ventures Capital Bhd. 3.244% 10/19/2026 | | | 700 | | | | 650 | |
| Total Capital International 2.829% 1/10/2030 | | | 2,670 | | | | 2,363 | |
| Toyota Motor Credit Corp. 1.90% 4/6/2028 | | | 1,067 | | | | 930 | |
| Toyota Motor Credit Corp. 3.375% 4/1/2030 | | | 2,412 | | | | 2,193 | |
| TransCanada PipeLines, Ltd. 4.10% 4/15/2030 | | | 2,619 | | | | 2,405 | |
| TransDigm, Inc. 6.25% 3/15/20268 | | | 500 | | | | 494 | |
| TransDigm, Inc. 5.50% 11/15/2027 | | | 505 | | | | 475 | |
| TransDigm, Inc. 4.875% 5/1/2029 | | | 500 | | | | 437 | |
| Transocean Guardian, Ltd. 5.875% 1/15/20248 | | | 68 | | | | 67 | |
| Transocean Poseidon, Ltd. 6.875% 2/1/20278 | | | 182 | | | | 177 | |
| Transocean, Inc. 6.80% 3/15/2038 | | | 525 | | | | 332 | |
| 28 | Capital World Bond Fund |
| Bonds, notes & other debt instruments (continued) | | Principal amount
(000) | | | Value
(000) | |
| U.S. dollars (continued) | | | | | | | | |
| Travelers Companies, Inc. 4.10% 3/4/2049 | | USD | 400 | | | $ | 328 | |
| Treehouse Park Improvement Association No.1 - Anleihen 9.75% 12/1/20336,8 | | | 800 | | | | 708 | |
| Triumph Group, Inc. 6.25% 9/15/20248 | | | 328 | | | | 311 | |
| Turkey (Republic of) 6.00% 1/14/2041 | | | 2,500 | | | | 1,821 | |
| U.S. Treasury 6.25% 8/15/2023 | | | 2,499 | | | | 2,522 | |
| U.S. Treasury 0.125% 8/31/2023 | | | 5,500 | | | | 5,337 | |
| U.S. Treasury 0.50% 11/30/2023 | | | 3,000 | | | | 2,886 | |
| U.S. Treasury 0.125% 12/15/2023 | | | 28,180 | | | | 26,997 | |
| U.S. Treasury 2.25% 4/30/202413 | | | 54,760 | | | | 53,030 | |
| U.S. Treasury 0.375% 8/15/2024 | | | 3,000 | | | | 2,804 | |
| U.S. Treasury 1.50% 10/31/2024 | | | 6,000 | | | | 5,687 | |
| U.S. Treasury 1.75% 3/15/2025 | | | 550 | | | | 520 | |
| U.S. Treasury 2.875% 4/30/2025 | | | 72 | | | | 70 | |
| U.S. Treasury 0.25% 6/30/2025 | | | 2,895 | | | | 2,623 | |
| U.S. Treasury 3.00% 7/15/2025 | | | 66,924 | | | | 64,833 | |
| U.S. Treasury 3.125% 8/15/2025 | | | 2,500 | | | | 2,427 | |
| U.S. Treasury 0.25% 8/31/2025 | | | 54,975 | | | | 49,463 | |
| U.S. Treasury 0.25% 10/31/2025 | | | 136,626 | | | | 122,237 | |
| U.S. Treasury 4.50% 11/15/2025 | | | 3,380 | | | | 3,401 | |
| U.S. Treasury 2.875% 11/30/2025 | | | 27,270 | | | | 26,251 | |
| U.S. Treasury 4.00% 12/15/2025 | | | 8,422 | | | | 8,369 | |
| U.S. Treasury 0.375% 1/31/2026 | | | 109,860 | | | | 97,781 | |
| U.S. Treasury 0.50% 2/28/2026 | | | 83,605 | | | | 74,535 | |
| U.S. Treasury 0.75% 3/31/2026 | | | 83,100 | | | | 74,517 | |
| U.S. Treasury 2.25% 3/31/2026 | | | 25 | | | | 24 | |
| U.S. Treasury 0.875% 6/30/2026 | | | 44,247 | | | | 39,568 | |
| U.S. Treasury 0.625% 7/31/2026 | | | 32,230 | | | | 28,478 | |
| U.S. Treasury 0.75% 8/31/2026 | | | 500 | | | | 443 | |
| U.S. Treasury 0.875% 9/30/2026 | | | 50,975 | | | | 45,280 | |
| U.S. Treasury 1.125% 10/31/2026 | | | 95,220 | | | | 85,166 | |
| U.S. Treasury 1.625% 11/30/2026 | | | 4,255 | | | | 3,880 | |
| U.S. Treasury 2.25% 2/15/2027 | | | 10,500 | | | | 9,773 | |
| U.S. Treasury 2.50% 3/31/2027 | | | 21,705 | | | | 20,378 | |
| U.S. Treasury 2.75% 4/30/2027 | | | 3,280 | | | | 3,110 | |
| U.S. Treasury 2.625% 5/31/2027 | | | 7,002 | | | | 6,601 | |
| U.S. Treasury 2.75% 7/31/2027 | | | 7,400 | | | | 7,003 | |
| U.S. Treasury 0.50% 8/31/2027 | | | 4,200 | | | | 3,574 | |
| U.S. Treasury 3.125% 8/31/2027 | | | 153,500 | | | | 147,690 | |
| U.S. Treasury 4.125% 9/30/2027 | | | 112,425 | | | | 112,857 | |
| U.S. Treasury 4.125% 10/31/2027 | | | 120,996 | | | | 121,458 | |
| U.S. Treasury 2.25% 11/15/2027 | | | 90,150 | | | | 83,093 | |
| U.S. Treasury 3.875% 11/30/2027 | | | 13,578 | | | | 13,504 | |
| U.S. Treasury 2.75% 2/15/2028 | | | 13,845 | | | | 13,020 | |
| U.S. Treasury 1.125% 2/29/2028 | | | 2,967 | | | | 2,570 | |
| U.S. Treasury 2.875% 5/15/2028 | | | 27,630 | | | | 26,089 | |
| U.S. Treasury 1.125% 8/31/2028 | | | 10,000 | | | | 8,542 | |
| U.S. Treasury 2.875% 4/30/2029 | | | 5,407 | | | | 5,066 | |
| U.S. Treasury 1.625% 8/15/202913 | | | 59,970 | | | | 52,031 | |
| U.S. Treasury 3.875% 12/31/2029 | | | 2,000 | | | | 1,986 | |
| U.S. Treasury 1.50% 2/15/2030 | | | 240 | | | | 205 | |
| U.S. Treasury 0.625% 5/15/203013 | | | 35,267 | | | | 27,921 | |
| U.S. Treasury 0.625% 8/15/2030 | | | 20 | | | | 16 | |
| U.S. Treasury 1.625% 5/15/2031 | | | 12,235 | | | | 10,299 | |
| U.S. Treasury 1.25% 8/15/2031 | | | 3,000 | | | | 2,436 | |
| U.S. Treasury 1.875% 2/15/203213 | | | 109,350 | | | | 92,743 | |
| U.S. Treasury 2.875% 5/15/2032 | | | 60,145 | | | | 55,456 | |
| U.S. Treasury 2.75% 8/15/2032 | | | 27,125 | | | | 24,697 | |
| U.S. Treasury 4.125% 11/15/2032 | | | 13,975 | | | | 14,254 | |
| U.S. Treasury 4.50% 5/15/2038 | | | 1,000 | | | | 1,065 | |
| U.S. Treasury 4.50% 8/15/2039 | | | 2,270 | | | | 2,411 | |
| U.S. Treasury 4.375% 11/15/2039 | | | 1,500 | | | | 1,568 | |
| U.S. Treasury 1.125% 8/15/2040 | | | 3,750 | | | | 2,338 | |
| U.S. Treasury 1.875% 2/15/2041 | | | 33,996 | | | | 24,081 | |
| U.S. Treasury 2.25% 5/15/204113 | | | 35,385 | | | | 26,636 | |
| U.S. Treasury 1.75% 8/15/2041 | | | 3,460 | | | | 2,374 | |
| U.S. Treasury 3.125% 11/15/2041 | | | 100 | | | | 87 | |
| U.S. Treasury 3.25% 5/15/2042 | | | 1,636 | | | | 1,437 | |
| U.S. Treasury 2.75% 8/15/2042 | | | 100 | | | | 81 | |
| U.S. Treasury 2.75% 11/15/2042 | | | 2,300 | | | | 1,849 | |
| Capital World Bond Fund | 29 |
| Bonds, notes & other debt instruments (continued) | | Principal amount
(000) | | | Value
(000) | |
| U.S. dollars (continued) | | | | | | | | |
| U.S. Treasury 4.00% 11/15/2042 | | USD | 287 | | | $ | 281 | |
| U.S. Treasury 3.375% 5/15/2044 | | | 2,700 | | | | 2,386 | |
| U.S. Treasury 3.125% 8/15/2044 | | | 940 | | | | 796 | |
| U.S. Treasury 2.50% 2/15/2045 | | | 1,900 | | | | 1,437 | |
| U.S. Treasury 3.00% 5/15/2045 | | | 1,125 | | | | 930 | |
| U.S. Treasury 2.875% 8/15/2045 | | | 1,250 | | | | 1,010 | |
| U.S. Treasury 3.00% 11/15/2045 | | | 1,425 | | | | 1,177 | |
| U.S. Treasury 3.00% 2/15/2048 | | | 8,165 | | | | 6,728 | |
| U.S. Treasury 3.125% 5/15/2048 | | | 800 | | | | 676 | |
| U.S. Treasury 3.00% 2/15/2049 | | | 520 | | | | 431 | |
| U.S. Treasury 2.375% 11/15/2049 | | | 100 | | | | 73 | |
| U.S. Treasury 2.00% 2/15/2050 | | | 18,540 | | | | 12,317 | |
| U.S. Treasury 1.25% 5/15/205013 | | | 12,110 | | | | 6,551 | |
| U.S. Treasury 1.375% 8/15/2050 | | | 1,310 | | | | 733 | |
| U.S. Treasury 1.625% 11/15/2050 | | | 5,855 | | | | 3,507 | |
| U.S. Treasury 2.375% 5/15/2051 | | | 860 | | | | 620 | |
| U.S. Treasury 2.00% 8/15/2051 | | | 38,216 | | | | 25,155 | |
| U.S. Treasury 1.875% 11/15/205113 | | | 110,940 | | | | 70,649 | |
| U.S. Treasury 2.25% 2/15/2052 | | | 51,400 | | | | 35,933 | |
| U.S. Treasury 2.875% 5/15/2052 | | | 11,061 | | | | 8,908 | |
| U.S. Treasury 3.00% 8/15/2052 | | | 24,329 | | | | 20,173 | |
| U.S. Treasury 4.00% 11/15/2052 | | | 1,645 | | | | 1,654 | |
| U.S. Treasury Inflation-Protected Security 0.50% 4/15/20244 | | | 106 | | | | 103 | |
| U.S. Treasury Inflation-Protected Security 0.125% 4/15/20274 | | | 1,653 | | | | 1,541 | |
| U.S. Treasury Inflation-Protected Security 1.625% 10/15/20274 | | | 7,254 | | | | 7,245 | |
| U.S. Treasury Inflation-Protected Security 0.125% 2/15/20514 | | | 16,807 | | | | 10,842 | |
| Uber Technologies, Inc. 8.00% 11/1/20268 | | | 890 | | | | 895 | |
| UBS Group AG 4.49% 8/5/2025 (1-year UST Yield Curve Rate T Note Constant Maturity + 1.60% on 8/5/2024)1,8 | | | 14,100 | | | | 13,867 | |
| UKG, Inc., Term Loan, (3-month USD-LIBOR + 5.25%) 8.998% 5/3/20279,10 | | | 675 | | | | 624 | |
| Ukraine 7.75% 9/1/20243 | | | 44,660 | | | | 11,107 | |
| Ukraine 8.994% 2/1/20263 | | | 4,127 | | | | 924 | |
| Ukraine 7.75% 9/1/20263 | | | 12,460 | | | | 2,680 | |
| Ukraine 7.75% 9/1/20293 | | | 2,300 | | | | 497 | |
| Ukraine 6.876% 5/21/20313 | | | 9,540 | | | | 1,837 | |
| Ukraine 7.375% 9/25/20343,8 | | | 560 | | | | 107 | |
| Ukraine 0% 5/31/204110 | | | 1,000 | | | | 290 | |
| UniCredit SpA 5.459% 6/30/2035 (5-year USD-ICE Swap + 4.75% on 6/30/2030)1,8 | | | 16,050 | | | | 13,071 | |
| Uniform Mortgage-Backed Security 2.50% 1/1/20535,12 | | | 57,700 | | | | 48,871 | |
| Uniform Mortgage-Backed Security 4.50% 1/1/20535,12 | | | 1,360 | | | | 1,309 | |
| Uniform Mortgage-Backed Security 5.00% 1/1/20535,12 | | | 4,279 | | | | 4,217 | |
| Uniform Mortgage-Backed Security 5.50% 1/1/20535,12 | | | 24,640 | | | | 24,708 | |
| Uniform Mortgage-Backed Security 5.00% 2/1/20535,12 | | | 31,021 | | | | 30,568 | |
| Union Pacific Corp. 2.80% 2/14/2032 | | | 4,000 | | | | 3,464 | |
| Union Pacific Corp. 4.30% 3/1/2049 | | | 1,550 | | | | 1,331 | |
| Union Pacific Corp. 3.839% 3/20/2060 | | | 302 | | | | 235 | |
| Union Pacific Corp. 3.799% 4/6/2071 | | | 302 | | | | 224 | |
| Unisys Corp. 6.875% 11/1/20278 | | | 150 | | | | 115 | |
| United Mexican States 4.875% 5/19/2033 | | | 210 | | | | 193 | |
| United Mexican States 5.00% 4/27/2051 | | | 1,020 | | | | 831 | |
| United Mexican States 4.40% 2/12/2052 | | | 860 | | | | 635 | |
| United Mexican States 3.75% 4/19/2071 | | | 1,290 | | | | 806 | |
| United Natural Foods, Inc. 6.75% 10/15/20288 | | | 1,500 | | | | 1,444 | |
| United Rentals, Inc. 4.875% 1/15/2028 | | | 475 | | | | 451 | |
| United Rentals, Inc. 6.00% 12/15/20298 | | | 2,000 | | | | 1,991 | |
| United Technologies Corp. 3.65% 8/16/2023 | | | 185 | | | | 183 | |
| United Technologies Corp. 3.125% 5/4/2027 | | | 250 | | | | 233 | |
| United Technologies Corp. 4.125% 11/16/2028 | | | 4,100 | | | | 3,933 | |
| UnitedHealth Group, Inc. 3.75% 7/15/2025 | | | 1,658 | | | | 1,622 | |
| UnitedHealth Group, Inc. 3.70% 5/15/2027 | | | 1,423 | | | | 1,379 | |
| UnitedHealth Group, Inc. 4.20% 5/15/2032 | | | 1,365 | | | | 1,300 | |
| UnitedHealth Group, Inc. 4.25% 6/15/2048 | | | 757 | | | | 658 | |
| UnitedHealth Group, Inc. 3.25% 5/15/2051 | | | 731 | | | | 527 | |
| UnitedHealth Group, Inc. 4.75% 5/15/2052 | | | 230 | | | | 214 | |
| Universal Entertainment Corp. 8.50% 12/11/20248 | | | 500 | | | | 467 | |
| Univision Communications, Inc. 4.50% 5/1/20298 | | | 1,240 | | | | 1,039 | |
| Univision Communications, Inc. 7.375% 6/30/20308 | | | 1,347 | | | | 1,289 | |
| US Foods, Inc. 4.625% 6/1/20308 | | | 585 | | | | 516 | |
| Vail Resorts, Inc. 6.25% 5/15/20258 | | | 760 | | | | 761 | |
| 30 | Capital World Bond Fund |
| Bonds, notes & other debt instruments (continued) | | Principal amount
(000) | | | Value
(000) | |
| U.S. dollars (continued) | | | | | | | | |
| Vale Overseas, Ltd. 3.75% 7/8/2030 | | USD | 5 | | | $ | 4 | |
| Valeant Pharmaceuticals International, Inc. 5.50% 11/1/20258 | | | 820 | | | | 698 | |
| Valvoline, Inc. 3.625% 6/15/20318 | | | 733 | | | | 602 | |
| Venator Finance SARL 9.50% 7/1/20258 | | | 465 | | | | 337 | |
| Venator Finance SARL 5.75% 7/15/20258 | | | 654 | | | | 224 | |
| Venezuela (Bolivarian Republic of) 9.00% 5/7/20233 | | | 1,289 | | | | 113 | |
| Venezuela (Bolivarian Republic of) 8.25% 10/13/20243 | | | 279 | | | | 24 | |
| Venezuela (Bolivarian Republic of) 7.65% 4/21/20253 | | | 120 | | | | 11 | |
| Venezuela (Bolivarian Republic of) 11.75% 10/21/20263 | | | 60 | | | | 6 | |
| Venezuela (Bolivarian Republic of) 9.25% 9/15/20273 | | | 159 | | | | 15 | |
| Venezuela (Bolivarian Republic of) 9.25% 5/7/20283 | | | 2,498 | | | | 225 | |
| Venezuela (Bolivarian Republic of) 7.00% 12/1/20183 | | | 60 | | | | 5 | |
| Venezuela (Bolivarian Republic of) 7.75% 10/13/20193 | | | 1,074 | | | | 86 | |
| Venezuela (Bolivarian Republic of) 6.00% 12/9/20203 | | | 883 | | | | 62 | |
| Venezuela (Bolivarian Republic of) 11.95% 8/5/20313 | | | 99 | | | | 9 | |
| Venezuela (Bolivarian Republic of) 12.75% 8/23/20223 | | | 80 | | | | 7 | |
| Venezuela (Bolivarian Republic of) 7.00% 3/31/20383 | | | 99 | | | | 9 | |
| Venture Global Calcasieu Pass, LLC 3.875% 8/15/20298 | | | 310 | | | | 272 | |
| Venture Global Calcasieu Pass, LLC 4.125% 8/15/20318 | | | 1,490 | | | | 1,272 | |
| Venture Global Calcasieu Pass, LLC 3.875% 11/1/20338 | | | 475 | | | | 389 | |
| Verizon Communications, Inc. 4.329% 9/21/2028 | | | 3,315 | | | | 3,194 | |
| Verizon Communications, Inc. 3.15% 3/22/2030 | | | 3,500 | | | | 3,095 | |
| Verizon Communications, Inc. 1.68% 10/30/2030 | | | 2,500 | | | | 1,954 | |
| Verizon Communications, Inc. 1.75% 1/20/2031 | | | 5,473 | | | | 4,259 | |
| Verizon Communications, Inc. 2.55% 3/21/2031 | | | 16,935 | | | | 13,968 | |
| Verizon Communications, Inc. 3.40% 3/22/2041 | | | 1,800 | | | | 1,361 | |
| Verizon Communications, Inc. 3.85% 11/1/2042 | | | 443 | | | | 353 | |
| Verizon Communications, Inc. 2.875% 11/20/2050 | | | 1,325 | | | | 836 | |
| Verizon Communications, Inc. 3.55% 3/22/2051 | | | 1,594 | | | | 1,143 | |
| Vertical U.S. Newco, Inc. 5.25% 7/15/20278 | | | 300 | | | | 267 | |
| VICI Properties, LP 4.375% 5/15/2025 | | | 996 | | | | 969 | |
| VICI Properties, LP 4.625% 6/15/20258 | | | 751 | | | | 721 | |
| VICI Properties, LP 4.75% 2/15/2028 | | | 2,645 | | | | 2,514 | |
| VICI Properties, LP 4.625% 12/1/20298 | | | 492 | | | | 449 | |
| VICI Properties, LP 4.95% 2/15/2030 | | | 1,767 | | | | 1,684 | |
| VICI Properties, LP 4.125% 8/15/20308 | | | 520 | | | | 456 | |
| VICI Properties, LP 5.125% 5/15/2032 | | | 905 | | | | 840 | |
| VICI Properties, LP 5.625% 5/15/2052 | | | 275 | | | | 244 | |
| VICI Properties, LP / VICI Note Co., Inc. 4.50% 1/15/20288 | | | 1,642 | | | | 1,516 | |
| Vigorous Champion International, Ltd. 4.25% 5/28/2029 | | | 1,000 | | | | 899 | |
| Virginia Electric and Power Co. 2.40% 3/30/2032 | | | 3,281 | | | | 2,660 | |
| Visa, Inc. 2.00% 8/15/2050 | | | 500 | | | | 296 | |
| Vistra Corp. 8.00% junior subordinated perpetual bonds (5-year UST Yield Curve Rate T Note Constant Maturity + 6.93% on 10/15/2026)1,8 | | | 350 | | | | 335 | |
| Vistra Corp. 7.00% junior subordinated perpetual bonds (5-year UST Yield Curve Rate T Note Constant Maturity + 5.74% on 12/15/2026)1,8 | | | 700 | | | | 638 | |
| Volkswagen Group of America Finance, LLC 3.125% 5/12/20238 | | | 8,492 | | | | 8,425 | |
| Volkswagen Group of America Finance, LLC 4.25% 11/13/20238 | | | 11,700 | | | | 11,590 | |
| VZ Secured Financing BV 5.00% 1/15/20328 | | | 200 | | | | 163 | |
| W. R. Grace Holdings, LLC 5.625% 8/15/20298 | | | 270 | | | | 219 | |
| Walt Disney Company 2.65% 1/13/2031 | | | 7,360 | | | | 6,301 | |
| Warner Music Group 3.75% 12/1/20298 | | | 922 | | | | 794 | |
| Warner Music Group 3.875% 7/15/20308 | | | 885 | | | | 764 | |
| Warner Music Group 3.00% 2/15/20318 | | | 605 | | | | 484 | |
| WarnerMedia Holdings, Inc. 4.279% 3/15/20328 | | | 5,585 | | | | 4,615 | |
| WarnerMedia Holdings, Inc. 5.05% 3/15/20428 | | | 11,988 | | | | 9,214 | |
| Warrior Met Coal, Inc. 7.875% 12/1/20288 | | | 300 | | | | 296 | |
| WASH Multifamily Acquisition, Inc. 5.75% 4/15/20268 | | | 1,572 | | | | 1,483 | |
| Weatherford International, Ltd. 11.00% 12/1/20248 | | | 57 | | | | 58 | |
| Weatherford International, Ltd. 6.50% 9/15/20288 | | | 650 | | | | 638 | |
| Weatherford International, Ltd. 8.625% 4/30/20308 | | | 520 | | | | 500 | |
| Wells Fargo & Company 3.526% 3/24/2028 (USD-SOFR + 1.51% on 3/24/2027)1 | | | 13,194 | | | | 12,241 | |
| Wells Fargo & Company 4.611% 4/25/2053 (USD-SOFR + 2.13% on 4/25/2052)1 | | | 8,572 | | | | 7,303 | |
| WESCO Distribution, Inc. 7.125% 6/15/20258 | | | 320 | | | | 325 | |
| WESCO Distribution, Inc. 7.25% 6/15/20288 | | | 647 | | | | 657 | |
| Western Global Airlines, LLC 10.375% 8/15/20258 | | | 735 | | | | 553 | |
| Western Midstream Operating, LP 4.75% 8/15/2028 | | | 160 | | | | 146 | |
| Western Midstream Operating, LP 5.50% 2/1/20501 | | | 300 | | | | 248 | |
| Westlake Chemical Corp. 5.00% 8/15/2046 | | | 260 | | | | 217 | |
| Capital World Bond Fund | 31 |
| Bonds, notes & other debt instruments (continued) | | Principal amount
(000) | | | Value
(000) | |
| U.S. dollars (continued) | | | | | | | | |
| Westpac Banking Corp. 2.894% 2/4/2030 (5-year UST Yield Curve Rate T Note Constant Maturity + 1.35% on 2/4/2025)1 | | USD | 8,440 | | | $ | 7,744 | |
| Westpac Banking Corp. 4.11% 7/24/2034 (5-year UST Yield Curve Rate T Note Constant Maturity + 2.00% on 7/24/2029)1 | | | 2,279 | | | | 1,958 | |
| Westpac Banking Corp. 2.668% 11/15/2035 (5-year UST Yield Curve Rate T Note Constant Maturity + 1.75% on 11/15/2030)1 | | | 3,425 | | | | 2,553 | |
| Westpac Banking Corp. 2.963% 11/16/2040 | | | 400 | | | | 266 | |
| WeWork Companies, LLC 5.00% 7/10/20258 | | | 650 | | | | 216 | |
| Williams Companies, Inc. 3.50% 11/15/2030 | | | 2,565 | | | | 2,249 | |
| Williams Companies, Inc. 2.60% 3/15/2031 | | | 860 | | | | 698 | |
| Willis North America, Inc. 4.65% 6/15/2027 | | | 375 | | | | 363 | |
| Wyndham Destinations, Inc. 6.625% 7/31/20268 | | | 500 | | | | 490 | |
| Wyndham Worldwide Corp. 4.375% 8/15/20288 | | | 830 | | | | 746 | |
| Wynn Resorts Finance, LLC 7.75% 4/15/20258 | | | 1,130 | | | | 1,126 | |
| Xcel Energy, Inc. 3.35% 12/1/2026 | | | 3,850 | | | | 3,621 | |
| Xcel Energy, Inc. 1.75% 3/15/2027 | | | 630 | | | | 553 | |
| Xcel Energy, Inc. 2.35% 11/15/2031 | | | 2,440 | | | | 1,956 | |
| Xcel Energy, Inc. 4.60% 6/1/2032 | | | 769 | | | | 737 | |
| Xcel Energy, Inc. 3.50% 12/1/2049 | | | 1,532 | | | | 1,125 | |
| Xiaomi Best Time International, Ltd. 2.875% 7/14/20318 | | | 780 | | | | 566 | |
| Yahoo Holdings, Inc., Term Loan B, (1-month USD-LIBOR + 5.50%) 9.884% 9/1/20279,10 | | | 250 | | | | 226 | |
| Ziggo Bond Co. BV 5.125% 2/28/20308 | | | 325 | | | | 263 | |
| Ziggo Bond Finance BV 4.875% 1/15/20308 | | | 530 | | | | 444 | |
| Zoetis, Inc. 5.60% 11/16/2032 | | | 1,625 | | | | 1,690 | |
| | | | | | | | 4,657,235 | |
| | | | | | | | | |
| Total bonds, notes & other debt instruments (cost: $10,292,707,000) | | | | | | | 8,906,766 | |
| | | | | | | | | |
| Investment funds 0.57% | | | Shares | | | | | |
| U.S. dollars 0.57% | | | | | | | | |
| Capital Group Central Corporate Bond Fund14 | | | 6,632,603 | | | | 54,056 | |
| | | | | | | | | |
| Total investment funds (cost: $53,330,000) | | | | | | | 54,056 | |
| | | | | | | | | |
| Convertible bonds & notes 0.01% | | | Principal amount
(000) | | | | | |
| U.S. dollars 0.01% | | | | | | | | |
| Airbnb, Inc., convertible notes, 0% 3/15/2026 | | USD | 543 | | | | 448 | |
| DISH DBS Corp., convertible notes, 3.375% 8/15/2026 | | | 390 | | | | 245 | |
| Ford Motor Co., convertible notes, 0% 3/15/2026 | | | 186 | | | | 176 | |
| Penn National Gaming, Inc., convertible notes, 2.75% 5/15/2026 | | | 87 | | | | 129 | |
| | | | | | | | | |
| Total convertible bonds & notes (cost: $1,407,000) | | | | | | | 998 | |
| | | | | | | | | |
| Convertible stocks 0.00% | | | Shares | | | | | |
| U.S. dollars 0.00% | | | | | | | | |
| 2020 Cash Mandatory Exchangeable Trust, convertible preferred shares, 5.25% 6/1/20238 | | | 300 | | | | 344 | |
| | | | | | | | | |
| Total convertible stocks (cost: $307,000) | | | | | | | 344 | |
| | | | | | | | | |
| Preferred securities 0.00% | | | | | | | | |
| U.S. dollars 0.00% | | | | | | | | |
| ACR III LSC Holdings, LLC, Series B, preferred shares6,8,15 | | | 277 | | | | 116 | |
| | | | | | | | | |
| Total preferred securities (cost: $287,000) | | | | | | | 116 | |
| | | | | | | | | |
| Common stocks 0.02% | | | | | | | | |
| U.S. dollars 0.02% | | | | | | | | |
| Chesapeake Energy Corp. | | | 9,204 | | | | 869 | |
| Constellation Oil Services Holding SA, Class B-16,15 | | | 3,023,297 | | | | 332 | |
| Bighorn Permian Resources, LLC6 | | | 2,668 | | | | — | 7 |
| | | | | | | | | |
| Total common stocks (cost: $405,000) | | | | | | | 1,201 | |
| 32 | Capital World Bond Fund |
| Short-term securities 7.01% | | | | | Shares | | | Value
(000) | |
| Money market investments 6.81% | | | | | | | | | | | | |
| Capital Group Central Cash Fund 4.31%14,16 | | | | | | | 6,486,438 | | | $ | 648,579 | |
| | | | | | | | | | | | | |
| | | Weighted
average yield
at acquisition | | | Principal amount
(000) | | | | | |
| U.S. Treasury bills 0.20% | | | | | | | | | | | | |
| U.S. Treasury 11/2/2023 | | | 4.530 | % | | USD | 20,000 | | | | 19,253 | |
| | | | | | | | | | | | | |
| Total short-term securities (cost: $667,800,000) | | | | | | | | | | | 667,832 | |
| Total investment securities 101.12% (cost: $11,016,243,000) | | | | | | | | | | | 9,631,313 | |
| Other assets less liabilities (1.12)% | | | | | | | | | | | (106,261 | ) |
| | | | | | | | | | | | | |
| Net assets 100.00% | | | | | | | | | | $ | 9,525,052 | |
Futures contracts
| | | | | | | | | | | | | Value and | |
| | | | | | | | | | | | | unrealized | |
| | | | | | | | | | | | | (depreciation) | |
| | | | | | | | | Notional | | | appreciation | |
| | | | | Number of | | | | amount | | | at 12/31/2022 | |
| Contracts | | Type | | contracts | | Expiration | | (000) | | | (000) | |
| 3 Month SONIA Futures | | Long | | 90 | | March 2025 | | | USD | 26,083 | | | | $ | (113 | ) |
| 3 Month SOFR Futures | | Short | | 100 | | March 2025 | | | | (24,165 | ) | | | | 85 | |
| 2 Year Euro-Schatz Futures | | Long | | 254 | | March 2023 | | | | 28,663 | | | | | (368 | ) |
| 2 Year U.S. Treasury Note Futures | | Long | | 702 | | March 2023 | | | | 143,965 | | | | | 140 | |
| 5 Year Euro-Bobl Futures | | Long | | 2,549 | | March 2023 | | | | 315,833 | | | | | (10,658 | ) |
| 5 Year U.S. Treasury Note Futures | | Long | | 6,861 | | March 2023 | | | | 740,506 | | | | | (1,097 | ) |
| 10 Year Euro-Bund Futures | | Long | | 723 | | March 2023 | | | | 102,879 | | | | | (6,649 | ) |
| 10 Year Italy Government Bond Futures | | Short | | 261 | | March 2023 | | | | (30,431 | ) | | | | 2,411 | |
| 10 Year Japanese Government Bond Futures | | Long | | 122 | | March 2023 | | | | 135,219 | | | | | (549 | ) |
| 10 Year Canadian Government Bond Futures | | Long | | 8 | | March 2023 | | | | 724 | | | | | (17 | ) |
| 10 Year Ultra U.S. Treasury Note Futures | | Short | | 337 | | March 2023 | | | | (39,861 | ) | | | | 507 | |
| 10 Year U.S. Treasury Note Futures | | Short | | 1,631 | | March 2023 | | | | (183,156 | ) | | | | 1,390 | |
| 10 Year UK Gilt Futures | | Long | | 46 | | March 2023 | | | | 5,556 | | | | | (364 | ) |
| 20 Year U.S. Treasury Bond Futures | | Long | | 825 | | March 2023 | | | | 103,408 | | | | | (1,710 | ) |
| 30 Year Euro-Buxl Futures | | Long | | 84 | | March 2023 | | | | 12,160 | | | | | (2,256 | ) |
| 30 Year Ultra U.S. Treasury Bond Futures | | Short | | 657 | | March 2023 | | | | (88,243 | ) | | | | 1,144 | |
| | | | | | | | | | | | | | | $ | (18,104 | ) |
Forward currency contracts
| | | | | | | | | | | | | Unrealized | |
| | | | | | | | | | | | | appreciation | |
| Contract amount | | | | | | (depreciation) | |
| Currency purchased | | Currency sold | | | | Settlement | | at 12/31/2022 | |
| (000) | | (000) | | Counterparty | | date | | (000) | |
| HUF | | 771,999 | | USD | | 1,968 | | JPMorgan Chase | | 1/3/2023 | | | $ | 98 | |
| PLN | | 20,494 | | USD | | 4,584 | | JPMorgan Chase | | 1/3/2023 | | | | 92 | |
| ZAR | | 21,114 | | USD | | 1,244 | | Morgan Stanley | | 1/3/2023 | | | | (2 | ) |
| USD | | 2,454 | | MXN | | 47,922 | | JPMorgan Chase | | 1/3/2023 | | | | (3 | ) |
| USD | | 2,055 | | HUF | | 771,999 | | Bank of New York Mellon | | 1/3/2023 | | | | (11 | ) |
| USD | | 4,663 | | PLN | | 20,494 | | UBS AG | | 1/3/2023 | | | | (14 | ) |
| MXN | | 47,922 | | USD | | 2,478 | | Goldman Sachs | | 1/3/2023 | | | | (20 | ) |
| USD | | 1,203 | | ZAR | | 21,114 | | JPMorgan Chase | | 1/3/2023 | | | | (39 | ) |
| EUR | | 65,600 | | USD | | 68,705 | | Bank of America | | 1/5/2023 | | | | 1,547 | |
| EUR | | 25,790 | | USD | | 27,176 | | JPMorgan Chase | | 1/5/2023 | | | | 442 | |
| PLN | | 6,830 | | USD | | 1,365 | | JPMorgan Chase | | 1/5/2023 | | | | 193 | |
| USD | | 4,274 | | EUR | | 4,160 | | HSBC Bank | | 1/5/2023 | | | | (181 | ) |
| USD | | 1,341 | | PLN | | 6,830 | | Morgan Stanley | | 1/5/2023 | | | | (217 | ) |
| USD | | 22,082 | | AUD | | 33,310 | | Citibank | | 1/5/2023 | | | | (603 | ) |
| Capital World Bond Fund | 33 |
Forward currency contracts (continued)
| | | | | | | | | | | | | Unrealized | |
| | | | | | | | | | | | | appreciation | |
| Contract amount | | | | | | (depreciation) | |
| Currency purchased | | Currency sold | | | | Settlement | | at 12/31/2022 | |
| (000) | | (000) | | Counterparty | | date | | (000) | |
| USD | | 70,762 | | EUR | | 66,990 | | BNP Paribas | | 1/5/2023 | | | $ | (978 | ) |
| CLP | | 575,000 | | USD | | 650 | | JPMorgan Chase | | 1/6/2023 | | | | 27 | |
| COP | | 3,010,639 | | USD | | 630 | | JPMorgan Chase | | 1/6/2023 | | | | (10 | ) |
| USD | | 280 | | CLP | | 263,686 | | Barclays Bank PLC | | 1/6/2023 | | | | (30 | ) |
| KRW | | 64,925,274 | | USD | | 49,259 | | Citibank | | 1/9/2023 | | | | 2,309 | |
| KRW | | 5,687,310 | | USD | | 4,370 | | Bank of America | | 1/9/2023 | | | | 148 | |
| USD | | 11,561 | | IDR | | 178,895,000 | | Citibank | | 1/9/2023 | | | | 65 | |
| CLP | | 993,536 | | USD | | 1,112 | | Citibank | | 1/9/2023 | | | | 59 | |
| PEN | | 8,970 | | USD | | 2,341 | | JPMorgan Chase | | 1/9/2023 | | | | 19 | |
| USD | | 1,217 | | BRL | | 6,437 | | Citibank | | 1/9/2023 | | | | — | 7 |
| IDR | | 6,732,225 | | USD | | 435 | | Citibank | | 1/9/2023 | | | | (2 | ) |
| USD | | 476 | | PEN | | 1,824 | | JPMorgan Chase | | 1/9/2023 | | | | (4 | ) |
| USD | | 628 | | ZAR | | 11,016 | | Bank of New York Mellon | | 1/9/2023 | | | | (19 | ) |
| MXN | | 1,561,461 | | USD | | 78,570 | | Goldman Sachs | | 1/10/2023 | | | | 1,393 | |
| DKK | | 354,220 | | USD | | 50,175 | | UBS AG | | 1/10/2023 | | | | 861 | |
| USD | | 42,609 | | GBP | | 34,761 | | Goldman Sachs | | 1/10/2023 | | | | 572 | |
| CAD | | 35,917 | | USD | | 26,326 | | HSBC Bank | | 1/10/2023 | | | | 202 | |
| USD | | 3,949 | | ILS | | 13,476 | | BNP Paribas | | 1/10/2023 | | | | 114 | |
| ZAR | | 22,543 | | USD | | 1,297 | | JPMorgan Chase | | 1/10/2023 | | | | 28 | |
| THB | | 34,092 | | USD | | 978 | | JPMorgan Chase | | 1/10/2023 | | | | 11 | |
| USD | | 2,778 | | INR | | 229,240 | | Standard Chartered Bank | | 1/10/2023 | | | | 8 | |
| MYR | | 5,630 | | USD | | 1,280 | | Standard Chartered Bank | | 1/10/2023 | | | | 7 | |
| USD | | 141 | | ILS | | 480 | | BNP Paribas | | 1/10/2023 | | | | 4 | |
| USD | | 450 | | GBP | | 370 | | JPMorgan Chase | | 1/10/2023 | | | | 3 | |
| EUR | | 32,678 | | DKK | | 243,030 | | Standard Chartered Bank | | 1/10/2023 | | | | (8 | ) |
| USD | | 972 | | THB | | 34,092 | | Morgan Stanley | | 1/10/2023 | | | | (17 | ) |
| GBP | | 7,900 | | USD | | 9,684 | | Goldman Sachs | | 1/10/2023 | | | | (130 | ) |
| USD | | 11,241 | | PLN | | 50,650 | | UBS AG | | 1/10/2023 | | | | (310 | ) |
| USD | | 44,143 | | AUD | | 65,552 | | HSBC Bank | | 1/10/2023 | | | | (509 | ) |
| USD | | 15,208 | | HUF | | 6,044,230 | | UBS AG | | 1/10/2023 | | | | (938 | ) |
| CNH | | 1,637,595 | | USD | | 235,759 | | Citibank | | 1/11/2023 | | | | 1,108 | |
| USD | | 58,941 | | GBP | | 48,050 | | JPMorgan Chase | | 1/11/2023 | | | | 832 | |
| EUR | | 50,576 | | USD | | 53,483 | | Morgan Stanley | | 1/11/2023 | | | | 702 | |
| EUR | | 27,650 | | USD | | 29,045 | | Bank of America | | 1/11/2023 | | | | 579 | |
| CZK | | 98,330 | | USD | | 4,267 | | Bank of America | | 1/11/2023 | | | | 81 | |
| THB | | 231,700 | | USD | | 6,681 | | Citibank | | 1/11/2023 | | | | 42 | |
| USD | | 2,034 | | SEK | | 21,030 | | HSBC Bank | | 1/11/2023 | | | | 17 | |
| THB | | 56,922 | | USD | | 1,641 | | Citibank | | 1/11/2023 | | | | 10 | |
| USD | | 1,242 | | MXN | | 24,080 | | JPMorgan Chase | | 1/11/2023 | | | | 9 | |
| USD | | 1,622 | | THB | | 56,922 | | Morgan Stanley | | 1/11/2023 | | | | (29 | ) |
| USD | | 6,825 | | EUR | | 6,454 | | Morgan Stanley | | 1/11/2023 | | | | (90 | ) |
| CAD | | 16,970 | | USD | | 12,649 | | Bank of America | | 1/11/2023 | | | | (115 | ) |
| SEK | | 135,520 | | USD | | 13,131 | | Bank of America | | 1/11/2023 | | | | (135 | ) |
| GBP | | 44,320 | | USD | | 54,149 | | HSBC Bank | | 1/11/2023 | | | | (551 | ) |
| EUR | | 186,067 | | USD | | 196,006 | | Goldman Sachs | | 1/12/2023 | | | | 3,355 | |
| CHF | | 12,670 | | USD | | 13,572 | | Morgan Stanley | | 1/12/2023 | | | | 150 | |
| AUD | | 11,870 | | USD | | 7,993 | | Barclays Bank PLC | | 1/12/2023 | | | | 94 | |
| CAD | | 4,741 | | USD | | 3,475 | | HSBC Bank | | 1/12/2023 | | | | 27 | |
| ZAR | | 17,433 | | USD | | 1,013 | | Bank of America | | 1/12/2023 | | | | 12 | |
| NZD | | 6,620 | | USD | | 4,219 | | Morgan Stanley | | 1/12/2023 | | | | (15 | ) |
| GBP | | 2,567 | | USD | | 3,131 | | Goldman Sachs | | 1/12/2023 | | | | (26 | ) |
| SEK | | 135,600 | | USD | | 13,127 | | Bank of America | | 1/12/2023 | | | | (122 | ) |
| USD | | 52,756 | | CNH | | 366,230 | | Morgan Stanley | | 1/12/2023 | | | | (221 | ) |
| USD | | 37,138 | | CAD | | 50,666 | | HSBC Bank | | 1/12/2023 | | | | (285 | ) |
| USD | | 51,789 | | EUR | | 49,163 | | Goldman Sachs | | 1/12/2023 | | | | (887 | ) |
| EUR | | 102,702 | | USD | | 108,522 | | JPMorgan Chase | | 1/13/2023 | | | | 1,526 | |
| JPY | | 5,703,060 | | USD | | 42,341 | | Bank of America | | 1/13/2023 | | | | 1,199 | |
| HUF | | 7,005,140 | | USD | | 17,708 | | Goldman Sachs | | 1/13/2023 | | | | 987 | |
| JPY | | 3,789,020 | | USD | | 28,049 | | Bank of America | | 1/13/2023 | | | | 878 | |
| CHF | | 5,200 | | USD | | 5,563 | | UBS AG | | 1/13/2023 | | | | 70 | |
| EUR | | 3,954 | | USD | | 4,177 | | BNP Paribas | | 1/13/2023 | | | | 60 | |
| USD | | 4,035 | | GBP | | 3,299 | | Morgan Stanley | | 1/13/2023 | | | | 45 | |
| 34 | Capital World Bond Fund |
Forward currency contracts (continued)
| | | | | | | | | | | | | Unrealized | |
| | | | | | | | | | | | | appreciation | |
| Contract amount | | | | | | (depreciation) | |
| Currency purchased | | Currency sold | | | | Settlement | | at 12/31/2022 | |
| (000) | | (000) | | Counterparty | | date | | (000) | |
| ZAR | | 26,151 | | USD | | 1,504 | | Morgan Stanley | | 1/13/2023 | | | $ | 33 | |
| MXN | | 19,247 | | USD | | 969 | | UBS AG | | 1/13/2023 | | | | 16 | |
| USD | | 1,367 | | COP | | 6,570,976 | | Citibank | | 1/13/2023 | | | | 15 | |
| MYR | | 3,967 | | USD | | 898 | | JPMorgan Chase | | 1/13/2023 | | | | 9 | |
| DKK | | 301,540 | | EUR | | 40,550 | | BNP Paribas | | 1/13/2023 | | | | 6 | |
| USD | | 920 | | CAD | | 1,242 | | Standard Chartered Bank | | 1/13/2023 | | | | 3 | |
| IDR | | 21,315,907 | | USD | | 1,368 | | JPMorgan Chase | | 1/13/2023 | | | | 3 | |
| USD | | 49 | | GBP | | 40 | | Bank of New York Mellon | | 1/13/2023 | | | | — | 7 |
| USD | | 1,173 | | CNH | | 8,140 | | JPMorgan Chase | | 1/13/2023 | | | | (5 | ) |
| EUR | | 102,292 | | DKK | | 760,670 | | BNP Paribas | | 1/13/2023 | | | | (14 | ) |
| USD | | 853 | | EUR | | 810 | | JPMorgan Chase | | 1/13/2023 | | | | (15 | ) |
| USD | | 5,128 | | EUR | | 4,831 | | Standard Chartered Bank | | 1/13/2023 | | | | (49 | ) |
| CAD | | 25,143 | | USD | | 18,626 | | Standard Chartered Bank | | 1/13/2023 | | | | (55 | ) |
| GBP | | 45,962 | | USD | | 56,214 | | Morgan Stanley | | 1/13/2023 | | | | (627 | ) |
| USD | | 86,637 | | EUR | | 81,991 | | JPMorgan Chase | | 1/13/2023 | | | | (1,218 | ) |
| USD | | 81,596 | | MXN | | 1,621,830 | | JPMorgan Chase | | 1/13/2023 | | | | (1,407 | ) |
| PLN | | 87,740 | | USD | | 19,625 | | BNP Paribas | | 1/17/2023 | | | | 370 | |
| ZAR | | 1,417 | | USD | | 81 | | Morgan Stanley | | 1/17/2023 | | | | 3 | |
| JPY | | 30,308,260 | | USD | | 223,427 | | JPMorgan Chase | | 1/19/2023 | | | | 8,153 | |
| JPY | | 1,947,030 | | USD | | 14,325 | | Citibank | | 1/19/2023 | | | | 552 | |
| JPY | | 1,206,570 | | EUR | | 8,432 | | Citibank | | 1/19/2023 | | | | 180 | |
| EUR | | 29,359 | | DKK | | 218,340 | | Bank of America | | 1/19/2023 | | | | (9 | ) |
| USD | | 11,558 | | CAD | | 15,730 | | Bank of America | | 1/19/2023 | | | | (61 | ) |
| JPY | | 23,482,795 | | USD | | 172,795 | | Citibank | | 1/20/2023 | | | | 6,658 | |
| JPY | | 13,865,140 | | USD | | 102,224 | | Standard Chartered Bank | | 1/20/2023 | | | | 3,732 | |
| USD | | 40,349 | | HUF | | 14,455,020 | | Bank of America | | 1/20/2023 | | | | 1,854 | |
| EUR | | 48,637 | | USD | | 51,239 | | JPMorgan Chase | | 1/20/2023 | | | | 904 | |
| JPY | | 3,590,896 | | AUD | | 39,300 | | HSBC Bank | | 1/20/2023 | | | | 659 | |
| EUR | | 194 | | USD | | 207 | | Bank of New York Mellon | | 1/20/2023 | | | | 1 | |
| CZK | | 984,840 | | USD | | 44,251 | | Goldman Sachs | | 1/20/2023 | | | | (730 | ) |
| USD | | 68,019 | | MXN | | 1,349,369 | | BNP Paribas | | 1/20/2023 | | | | (938 | ) |
| USD | | 60,756 | | DKK | | 428,570 | | Bank of America | | 1/20/2023 | | | | (1,044 | ) |
| USD | | 87,092 | | EUR | | 82,671 | | JPMorgan Chase | | 1/20/2023 | | | | (1,537 | ) |
| USD | | 41,479 | | CZK | | 986,410 | | Morgan Stanley | | 1/20/2023 | | | | (2,111 | ) |
| HUF | | 14,349,550 | | USD | | 43,821 | | Bank of America | | 1/20/2023 | | | | (5,607 | ) |
| USD | | 23,837 | | COP | | 114,649,611 | | Morgan Stanley | | 1/23/2023 | | | | 300 | |
| USD | | 920 | | BRL | | 4,954 | | Morgan Stanley | | 1/23/2023 | | | | (14 | ) |
| USD | | 1,490 | | BRL | | 7,996 | | Citibank | | 1/23/2023 | | | | (17 | ) |
| USD | | 92,758 | | EUR | | 87,554 | | Bank of America | | 1/23/2023 | | | | (1,129 | ) |
| JPY | | 6,558,900 | | USD | | 45,461 | | Standard Chartered Bank | | 1/27/2023 | | | | 4,710 | |
| JPY | | 7,782,750 | | USD | | 57,466 | | BNP Paribas | | 1/27/2023 | | | | 2,068 | |
| JPY | | 2,769,400 | | USD | | 19,134 | | UBS AG | | 1/27/2023 | | | | 2,050 | |
| JPY | | 3,737,200 | | USD | | 27,733 | | Goldman Sachs | | 1/27/2023 | | | | 854 | |
| USD | | 2,467 | | MXN | | 47,922 | | Goldman Sachs | | 1/27/2023 | | | | 22 | |
| PLN | | 20,494 | | USD | | 4,654 | | UBS AG | | 1/27/2023 | | | | 12 | |
| HUF | | 771,999 | | USD | | 2,040 | | Bank of New York Mellon | | 1/27/2023 | | | | 11 | |
| USD | | 1,241 | | ZAR | | 21,114 | | Morgan Stanley | | 1/27/2023 | | | | 2 | |
| USD | | 11,656 | | PLN | | 55,760 | | JPMorgan Chase | | 2/2/2023 | | | | (1,033 | ) |
| PLN | | 191,770 | | USD | | 46,242 | | BNP Paribas | | 2/2/2023 | | | | (2,603 | ) |
| KRW | | 18,500,000 | | USD | | 13,996 | | Standard Chartered Bank | | 2/28/2023 | | | | 713 | |
| EUR | | 90,700 | | USD | | 95,396 | | Bank of America | | 3/6/2023 | | | | 2,137 | |
| CNH | | 439,380 | | USD | | 62,719 | | Standard Chartered Bank | | 3/6/2023 | | | | 1,099 | |
| JPY | | 2,455,060 | | USD | | 18,222 | | BNP Paribas | | 3/6/2023 | | | | 652 | |
| KRW | | 16,582,610 | | USD | | 12,736 | | HSBC Bank | | 3/6/2023 | | | | 451 | |
| JPY | | 1,200,000 | | USD | | 8,941 | | JPMorgan Chase | | 3/15/2023 | | | | 296 | |
| EUR | | 5,500 | | USD | | 5,848 | | Bank of America | | 3/15/2023 | | | | 70 | |
| USD | | 865 | | NZD | | 1,350 | | UBS AG | | 3/15/2023 | | | | 8 | |
| USD | | 6,129 | | AUD | | 9,000 | | UBS AG | | 3/15/2023 | | | | (17 | ) |
| SEK | | 20,537 | | USD | | 2,000 | | JPMorgan Chase | | 3/15/2023 | | | | (23 | ) |
| USD | | 2,000 | | NOK | | 19,879 | | JPMorgan Chase | | 3/15/2023 | | | | (36 | ) |
| THB | | 91,013 | | USD | | 2,634 | | Morgan Stanley | | 6/9/2023 | | | | 44 | |
| PLN | | 30,130 | | USD | | 6,070 | | JPMorgan Chase | | 8/31/2023 | | | | 660 | |
| Capital World Bond Fund | 35 |
Forward currency contracts (continued)
| | | | | | | | | | | | | Unrealized | |
| | | | | | | | | | | | | appreciation | |
| Contract amount | | | | | | (depreciation) | |
| Currency purchased | | Currency sold | | | | Settlement | | at 12/31/2022 | |
| (000) | | (000) | | Counterparty | | date | | (000) | |
| USD | | 697 | | PLN | | 3,650 | | Morgan Stanley | | 8/31/2023 | | | $ | (119 | ) |
| USD | | 1,897 | | PLN | | 9,900 | | JPMorgan Chase | | 8/31/2023 | | | | (315 | ) |
| | | | | | | | | | | | | | $ | 32,041 | |
Swap contracts
Interest rate swaps
Centrally cleared interest rate swaps
| | | | | | | | | | | | | | | | | Upfront | | | Unrealized | |
| Receive | | Pay | | | | | | | | | | premium | | | (depreciation) | |
| | | | | | | | | | | Notional | | Value at | | | paid | | | appreciation | |
| | | Payment | | | | Payment | | Expiration | | amount | | 12/31/2022 | | | (received) | | | at 12/31/2022 | |
| Rate | | frequency | | Rate | | frequency | | date | | (000) | | (000) | | | (000) | | | (000) | |
| 0.11108502% | | Annual | | SONIA | | Annual | | 4/9/2023 | | GBP | 20,140 | | $ | (248 | ) | | $ | 5 | | | | $ | (253 | ) |
| 1.3467% | | Semi-annual | | 3-month NZD-BBR-FRA | | Quarterly | | 8/18/2023 | | NZD | 25,000 | | | (381 | ) | | | — | | | | | (381 | ) |
| 1.2475% | | Semi-annual | | 3-month NZD-BBR-FRA | | Quarterly | | 8/20/2023 | | | 32,742 | | | (519 | ) | | | — | | | | | (519 | ) |
| 1.234974% | | Semi-annual | | 3-month NZD-BBR-FRA | | Quarterly | | 8/20/2023 | | | 279,022 | | | (4,436 | ) | | | — | | | | | (4,436 | ) |
| 1.2375% | | Semi-annual | | 3-month NZD-BBR-FRA | | Quarterly | | 8/26/2023 | | | 108,068 | | | (1,792 | ) | | | — | | | | | (1,792 | ) |
| 1.264% | | Semi-annual | | 3-month NZD-BBR-FRA | | Quarterly | | 8/27/2023 | | | 270,134 | | | (4,444 | ) | | | — | | | | | (4,444 | ) |
| 1.26% | | Semi-annual | | 3-month NZD-BBR-FRA | | Quarterly | | 8/30/2023 | | | 44,558 | | | (740 | ) | | | — | | | | | (740 | ) |
| 1.28% | | Semi-annual | | 3-month NZD-BBR-FRA | | Quarterly | | 8/31/2023 | | | 44,558 | | | (740 | ) | | | — | | | | | (740 | ) |
| 1.30% | | Semi-annual | | 3-month NZD-BBR-FRA | | Quarterly | | 9/3/2023 | | | 48,917 | | | (824 | ) | | | — | | | | | (824 | ) |
| 1.4975% | | Semi-annual | | 3-month NZD-BBR-FRA | | Quarterly | | 9/21/2023 | | | 90,549 | | | (1,574 | ) | | | — | | | | | (1,574 | ) |
| 1.445% | | Semi-annual | | 3-month NZD-BBR-FRA | | Quarterly | | 9/28/2023 | | | 90,448 | | | (1,645 | ) | | | — | | | | | (1,645 | ) |
| 1.4475% | | Semi-annual | | 3-month NZD-BBR-FRA | | Quarterly | | 9/29/2023 | | | 89,953 | | | (1,643 | ) | | | — | | | | | (1,643 | ) |
| 1.4475% | | Semi-annual | | 3-month NZD-BBR-FRA | | Quarterly | | 9/30/2023 | | | 90,327 | | | (1,649 | ) | | | — | | | | | (1,649 | ) |
| 1.5125% | | Semi-annual | | 3-month NZD-BBR-FRA | | Quarterly | | 10/14/2023 | | | 79,737 | | | (1,516 | ) | | | — | | | | | (1,516 | ) |
| 1.53% | | Semi-annual | | 3-month NZD-BBR-FRA | | Quarterly | | 10/14/2023 | | | 90,950 | | | (1,721 | ) | | | — | | | | | (1,721 | ) |
| 1.5625% | | Semi-annual | | 3-month NZD-BBR-FRA | | Quarterly | | 10/15/2023 | | | 90,850 | | | (1,701 | ) | | | — | | | | | (1,701 | ) |
| 1.59% | | Semi-annual | | 3-month NZD-BBR-FRA | | Quarterly | | 10/18/2023 | | | 90,850 | | | (1,700 | ) | | | — | | | | | (1,700 | ) |
| 1.62% | | Semi-annual | | 3-month NZD-BBR-FRA | | Quarterly | | 10/19/2023 | | | 100,996 | | | (1,884 | ) | | | — | | | | | (1,884 | ) |
| 2.26% | | Semi-annual | | 3-month NZD-BBR-FRA | | Quarterly | | 11/2/2023 | | | 3,733 | | | (61 | ) | | | — | | | | | (61 | ) |
| 2.215% | | Semi-annual | | 3-month NZD-BBR-FRA | | Quarterly | | 11/3/2023 | | | 7,460 | | | (123 | ) | | | — | | | | | (123 | ) |
| 2.2525% | | Semi-annual | | 3-month NZD-BBR-FRA | | Quarterly | | 11/8/2023 | | | 129,491 | | | (2,143 | ) | | | — | | | | | (2,143 | ) |
| 2.24% | | Semi-annual | | 3-month NZD-BBR-FRA | | Quarterly | | 11/8/2023 | | | 129,491 | | | (2,152 | ) | | | — | | | | | (2,152 | ) |
| 2.20% | | Semi-annual | | 3-month NZD-BBR-FRA | | Quarterly | | 11/9/2023 | | | 10,894 | | | (184 | ) | | | — | | | | | (184 | ) |
| 2.495% | | Annual | | SONIA | | Annual | | 5/5/2024 | | GBP | 161,740 | | | (4,110 | ) | | | — | | | | | (4,110 | ) |
| 2.42% | | Annual | | SONIA | | Annual | | 5/5/2024 | | | 362,400 | | | (9,520 | ) | | | — | | | | | (9,520 | ) |
| 2.363% | | Annual | | SONIA | | Annual | | 5/11/2024 | | | 315,760 | | | (8,504 | ) | | | — | | | | | (8,504 | ) |
| SONIA | | Annual | | 5.6325% | | Annual | | 9/25/2024 | | | 284,200 | | | (3,236 | ) | | | — | | | | | (3,236 | ) |
| 4.5645% | | Annual | | U.S. EFFR | | Annual | | 10/19/2024 | | USD | 5,200 | | | (2 | ) | | | — | | | | | (2 | ) |
| 4.533% | | Annual | | U.S. EFFR | | Annual | | 10/20/2024 | | | 6,500 | | | (5 | ) | | | — | | | | | (5 | ) |
| 4.56% | | Annual | | U.S. EFFR | | Annual | | 10/27/2024 | | | 6,500 | | | (1 | ) | | | — | | | | | (1 | ) |
| 4.5245% | | Annual | | U.S. EFFR | | Annual | | 10/27/2024 | | | 7,800 | | | (6 | ) | | | — | | | | | (6 | ) |
| 4.67% | | 28-day | | 28-day MXN-TIIE | | 28-day | | 12/16/2025 | | MXN | 24,000 | | | (144 | ) | | | — | | | | | (144 | ) |
| 5.75% | | 28-day | | 28-day MXN-TIIE | | 28-day | | 4/2/2026 | | | 22,300 | | | (107 | ) | | | — | | | | | (107 | ) |
| 6.5375% | | 28-day | | 28-day MXN-TIIE | | 28-day | | 6/17/2026 | | | 108,000 | | | (405 | ) | | | — | | | | | (405 | ) |
| 6.55% | | 28-day | | 28-day MXN-TIIE | | 28-day | | 6/18/2026 | | | 105,200 | | | (393 | ) | | | — | | | | | (393 | ) |
| 6.64% | | 28-day | | 28-day MXN-TIIE | | 28-day | | 6/25/2026 | | | 279,500 | | | (1,007 | ) | | | — | | | | | (1,007 | ) |
| 6.6175% | | 28-day | | 28-day MXN-TIIE | | 28-day | | 6/25/2026 | | | 740,700 | | | (2,694 | ) | | | — | | | | | (2,694 | ) |
| 6.633% | | 28-day | | 28-day MXN-TIIE | | 28-day | | 6/25/2026 | | | 770,600 | | | (2,785 | ) | | | — | | | | | (2,785 | ) |
| 7.28% | | 28-day | | 28-day MXN-TIIE | | 28-day | | 9/30/2026 | | | 11,600 | | | (31 | ) | | | — | | | | | (31 | ) |
| 7.24% | | 28-day | | 28-day MXN-TIIE | | 28-day | | 10/2/2026 | | | 11,700 | | | (32 | ) | | | — | | | | | (32 | ) |
| 0.8738% | | Annual | | SONIA | | Annual | | 10/8/2026 | | GBP | 4,000 | | | (555 | ) | | | — | | | | | (555 | ) |
| 7.59% | | 28-day | | 28-day MXN-TIIE | | 28-day | | 10/29/2026 | | MXN | 218,800 | | | (486 | ) | | | — | | | | | (486 | ) |
| 7.62% | | 28-day | | 28-day MXN-TIIE | | 28-day | | 10/29/2026 | | | 328,248 | | | (712 | ) | | | — | | | | | (712 | ) |
| 7.66% | | 28-day | | 28-day MXN-TIIE | | 28-day | | 10/29/2026 | | | 535,800 | | | (1,127 | ) | | | — | | | | | (1,127 | ) |
| 7.52% | | 28-day | | 28-day MXN-TIIE | | 28-day | | 10/30/2026 | | | 676,683 | | | (1,580 | ) | | | — | | | | | (1,580 | ) |
| SONIA | | Annual | | 1.2822% | | Annual | | 1/28/2027 | | GBP | 1,150 | | | 149 | | | | — | | | | | 149 | |
| 36 | Capital World Bond Fund |
Swap contracts (continued)
Interest rate swaps (continued)
Centrally cleared interest rate swaps (continued)
| Receive | | Pay | | | | Notional | | | Value at | | | Upfront
premium
paid | | | Unrealized
(depreciation)
appreciation | |
| Rate | | Payment
frequency | | Rate | | Payment
frequency | | Expiration
date | | amount
(000) | | | 12/31/2022
(000) | | | (received)
(000) | | | at 12/31/2022
(000) | |
| 7.805% | | 28-day | | 28-day MXN-TIIE | | 28-day | | 2/23/2027 | | MXN | 187,375 | | | | $ | (357 | ) | | | $ | — | | | | $ | (357 | ) |
| 7.795% | | 28-day | | 28-day MXN-TIIE | | 28-day | | 2/24/2027 | | | 829,520 | | | | (1,597 | ) | | | — | 7 | | | (1,597 | ) |
| 3.0825% | | At maturity | | Eurozone HICP Ex. Tobacco | | At maturity | | 8/15/2027 | | EUR | 1,000 | | | | (6 | ) | | | — | | | | (6 | ) |
| SONIA | | Annual | | 5.1013% | | Annual | | 10/7/2027 | | GBP | 2,000 | | | | (100 | ) | | | — | | | | (100 | ) |
| 0.57520783% | | Annual | | SONIA | | Annual | | 4/9/2028 | | | 10,370 | | | | (2,031 | ) | | | (16 | ) | | | (2,015 | ) |
| 2.2679% | | Annual | | SONIA | | Annual | | 7/14/2032 | | | 590 | | | | (84 | ) | | | — | | | | (84 | ) |
| 0.9221376% | | Annual | | SONIA | | Annual | | 4/9/2041 | | | 5,500 | | | | (2,340 | ) | | | (43 | ) | | | (2,297 | ) |
| 2.23% | | Annual | | SONIA | | Annual | | 7/14/2042 | | | 320 | | | | (73 | ) | | | — | | | | (73 | ) |
| 1.0469% | | Annual | | SONIA | | Annual | | 3/2/2052 | | | 70 | | | | | (37 | ) | | | | — | | | | | (37 | ) |
| | | | | | | | | | | | | | | | $ | (77,738 | ) | | | $ | (54 | ) | | | $ | (77,684 | ) |
| Bilateral interest rate swaps |
| Receive | | Pay | | | | | | Notional | | | Value at | | | Upfront
premium | | | Unrealized
depreciation | |
| Rate | | Payment
frequency | | Rate | | Payment
frequency | | Counterparty | | Expiration
date | | amount
(000) | | | 12/31/2022
(000) | | | paid
(000) | | | at 12/31/2022
(000) | |
| 11.46% | | At maturity | | BZDIOVER | | At maturity | | BNP Paribas | | 1/2/2026 | | | BRL9,234 | | | | | $ | (60 | ) | | | $ | — | | | | $ | (60 | ) |
| 11.97% | | At maturity | | BZDIOVER | | At maturity | | Barclays Bank PLC | | 1/2/2026 | | | 14,700 | | | | | | (61 | ) | | | | — | | | | | (61 | ) |
| 11.15% | | At maturity | | BZDIOVER | | At maturity | | Barclays Bank PLC | | 1/2/2026 | | | 9,330 | | | | | | (76 | ) | | | | — | | | | | (76 | ) |
| | | | | | | | | | | | | | | | | | | $ | (197 | ) | | | $ | — | | | | $ | (197 | ) |
Credit default swaps
Centrally cleared credit default swaps on credit indices — buy protection
| | | | | | | | | | | | | | | Upfront | | | Unrealized | |
| | | | | | | | | Notional | | | Value at | | | premium | | | depreciation | |
| Reference | | Financing | | Payment | | Expiration | | amount | | | 12/31/2022 | | | paid | | | at 12/31/2022 | |
| index | | rate paid | | frequency | | date | | (000) | | | (000) | | | (000) | | | (000) | |
| CDX.EM.38 | | 1.00% | | Quarterly | | 12/20/2027 | | USD | 140,890 | | | | | $ | 8,243 | | | | $ | 8,826 | | | | $ | (583 | ) |
| | | | | | | | | | | | | | | | | | | | | | | |
| Centrally cleared credit default swaps on credit indices — sell protection |
| | | | | | | | | | | | | | | | | | | | | | | |
| | | | | | | | | | | | | | | Upfront | | | Unrealized | |
| | | | | | | | | Notional | | | Value at | | | premium | | | depreciation | |
| Financing | | Payment | | Reference | | Expiration | | amount
| 17 | | 12/31/2022 | 18 | | paid | | | at 12/31/2022 | |
| rate received | | frequency | | index | | date | | (000) | | | (000) | | | (000) | | | (000) | |
| 5.00% | | Quarterly | | CDX.NA.HY.39 | | 12/20/2027 | | USD | 100,617 | | | | | $ | 619 | | | | $ | 840 | | | | $ | (221 | ) |
| 1.00% | | Quarterly | | CDX.NA.IG.39 | | 12/20/2027 | | | 235,324 | | | | | | 1,882 | | | | | 2,183 | | | | | (301 | ) |
| | | | | | | | | | | | | | | $ | 2,501 | | | | $ | 3,023 | | | | $ | (522 | ) |
Investments in affiliates14
| | | | | | | | | | | | | | | Net | | | | | | | |
| | | Value of | | | | | | | | | Net | | | unrealized | | | Value of | | | | |
| | | affiliates at | | | | | | | | | realized | | | appreciation | | | affiliates at | | | Dividend | |
| | | 1/1/2022 | | | Additions | | | Reductions | | | loss | | | (depreciation) | | | 12/31/2022 | | | income | |
| | | (000) | | | (000) | | | (000) | | | (000) | | | (000) | | | (000) | | | (000) | |
| Investment funds 0.57% | | | | | | | | | | | | | | | | | | | | | | | | | | | | |
| Capital Group Central Corporate Bond Fund | | $ | — | | | $ | 53,331 | | | $ | — | | | $ | — | | | $ | 725 | | | $ | 54,056 | | | $ | 252 | |
| Short-term securities 6.81% | | | | | | | | | | | | | | | | | | | | | | | | | | | | |
| Money market investments 6.81% | | | | | | | | | | | | | | | | | | | | | | | | | | | | |
| Capital Group Central Cash Fund 4.31%16 | | | 1,132,236 | | | | 6,645,845 | | | | 7,129,139 | | | | (258 | ) | | | (105 | ) | | | 648,579 | | | | 18,882 | |
| Total 7.38% | | | | | | | | | | | | | | $ | (258 | ) | | $ | 620 | | | $ | 702,635 | | | $ | 19,134 | |
| Capital World Bond Fund | 37 |
Restricted securities2
| | | Acquisition
date(s) | | Cost
(000) | | | Value
(000) | | | Percent
of net
assets | |
| Goldman Sachs Group, Inc. 1.00% 3/18/2033 | | 5/18/2021-5/19/2021 | | $ | 27,138 | | | $ | 17,527 | | | | .19 | % |
| NBM US Holdings, Inc. 7.00% 5/14/2026 | | 8/6/2021 | | | 10,052 | | | | 9,763 | | | | .10 | |
| Netflix, Inc. 3.875% 11/15/2029 | | 10/27/2021-10/29/2021 | | | 5,262 | | | | 3,813 | | | | .04 | |
| Bank of America Corp. 0.58% 8/8/2029 (3-month EUR-EURIBOR + 0.73% on 8/8/2028)1 | | 2/4/2021 | | | 3,818 | | | | 2,732 | | | | .03 | |
| General Electric Co. 4.125% 9/19/2035 | | 2/3/2022 | | | 1,432 | | | | 1,064 | | | | .01 | |
| STE TransCore Holdings, Inc. 3.75% 5/5/2032 | | 12/21/2022 | | | 276 | | | | 272 | | | | .00 | |
| Total | | | | $ | 47,978 | | | $ | 35,171 | | | | .37 | % |
| 1 | Step bond; coupon rate may change at a later date. |
| 2 | Restricted security, other than Rule 144A securities or commercial paper issued pursuant to Section 4(a)(2) of the Securities Act of 1933. The total value of all such restricted securities was $35,171,000, which represented .37% of the net assets of the fund. |
| 3 | Scheduled interest and/or principal payment was not received. |
| 4 | Index-linked bond whose principal amount moves with a government price index. |
| 5 | Principal payments may be made periodically. Therefore, the effective maturity date may be earlier than the stated maturity date. |
| 6 | Value determined using significant unobservable inputs. |
| 7 | Amount less than one thousand. |
| 8 | Acquired in a transaction exempt from registration under Rule 144A or, for commercial paper, Section 4(a)(2) of the Securities Act of 1933. May be resold in the U.S. in transactions exempt from registration, normally to qualified institutional buyers. The total value of all such securities was $678,283,000, which represented 7.12% of the net assets of the fund. |
| 9 | Loan participations and assignments; may be subject to legal or contractual restrictions on resale. The total value of all such loans was $8,779,000, which represented .09% of the net assets of the fund. |
| 10 | Coupon rate may change periodically. Reference rate and spread are as of the most recent information available. Some coupon rates are determined by the issuer or agent based on current market conditions; therefore, the reference rate and spread are not available. |
| 11 | Payment in kind; the issuer has the option of paying additional securities in lieu of cash. Payment methods and rates are as of the most recent payment when available. |
| 12 | Purchased on a TBA basis. |
| 13 | All or a portion of this security was pledged as collateral. The total value of pledged collateral was $66,279,000, which represented .70% of the net assets of the fund. |
| 14 | Part of the same “group of investment companies” as the fund as defined under the Investment Company Act of 1940, as amended. |
| 15 | Security did not produce income during the last 12 months. |
| 16 | Rate represents the seven-day yield at 12/31/2022. |
| 17 | The maximum potential amount the fund may pay as a protection seller should a credit event occur. |
| 18 | The prices and resulting values for credit default swap indices serve as an indicator of the current status of the payment/performance risk. As the value of a sell protection credit default swap increases or decreases, when compared to the notional amount of the swap, the payment/performance risk may decrease or increase, respectively. |
Key to abbreviations
Assn. = Association
AUD = Australian dollars
BBR = Bank Base Rate
BRL = Brazilian reais
BZDIOVER = Overnight Brazilian Interbank Deposit Rate
CAD = Canadian dollars
CHF = Swiss francs
CLP = Chilean pesos
CME = CME Group
CNH = Chinese yuan renminbi
CNY = Chinese yuan
COP = Colombian pesos
CZK = Czech korunas
DAC = Designated Activity Company
DKK = Danish kroner
DOP = Dominican pesos
EFFR = Effective Federal Funds Rate
EUR = Euros
EURIBOR = Euro Interbank Offered Rate
FRA = Forward Rate Agreement
GBP = British pounds
HICP = Harmonised Index of Consumer Prices
HUF = Hungarian forints
ICE = Intercontinental Exchange, Inc.
IDR = Indonesian rupiah
ILS = Israeli shekels
INR = Indian rupees
JPY = Japanese yen
KRW = South Korean won
LIBOR = London Interbank Offered Rate
MXN = Mexican pesos
MYR = Malaysian ringgits
NOK = Norwegian kroner
NZD = New Zealand dollars
PEN = Peruvian nuevos soles
PIK = Payment In Kind
PLN = Polish zloty
Ref. = Refunding
Rev. = Revenue
RON = Romanian leu
RUB = Russian rubles
SEK = Swedish kronor
SOFR = Secured Overnight Financing Rate
SONIA = Sterling Overnight Interbank Average Rate
TBA = To be announced
THB = Thai baht
TIIE = Equilibrium Interbank Interest Rate
UAH = Ukrainian hryvnia
USD = U.S. dollars
ZAR = South African rand
Refer to the notes to financial statements.
| 38 | Capital World Bond Fund |
Financial statements
Statement of assets and liabilities
at December 31, 2022 | |
| | (dollars in thousands) |
| Assets: | | | | |
| Investment securities, at value: | | | | | | | | |
| Unaffiliated issuers (cost: $10,314,343) | | $ | 8,928,678 | | | | | |
| Affiliated issuers (cost: $701,900) | | | 702,635 | | | $ | 9,631,313 | |
| Cash | | | | | | | 1,781 | |
| Cash denominated in currencies other than U.S. dollars (cost: $7,537) | | | | | | | 7,588 | |
| Unrealized appreciation on open forward currency contracts | | | | | | | 59,295 | |
| Unrealized appreciation on unfunded commitments | | | | | | | 93 | |
| Receivables for: | | | | | | | | |
| Sales of investments | | | 33,031 | | | | | |
| Sales of fund’s shares | | | 10,770 | | | | | |
| Dividends and interest | | | 76,213 | | | | | |
| Variation margin on futures contracts | | | 2,039 | | | | | |
| Variation margin on centrally cleared swap contracts | | | 1,066 | | | | | |
| Other | | | 2,671 | | | | 125,790 | |
| | | | | | | | 9,825,860 | |
| | | | | | | | | |
| Liabilities: | | | | | | | | |
| Unrealized depreciation on open forward currency contracts | | | | | | | 27,254 | |
| Bilateral interest rate swaps, at value | | | | | | | 197 | |
| Unrealized depreciation on unfunded commitments | | | | | | | 7 | |
| Payables for: | | | | | | | | |
| Purchases of investments | | | 244,398 | | | | | |
| Repurchases of fund’s shares | | | 17,807 | | | | | |
| Investment advisory services | | | 3,546 | | | | | |
| Services provided by related parties | | | 1,633 | | | | | |
| Trustees’ deferred compensation | | | 228 | | | | | |
| Variation margin on futures contracts | | | 3,641 | | | | | |
| Variation margin on centrally cleared swap contracts | | | 1,564 | | | | | |
| Other | | | 533 | | | | 273,350 | |
| Net assets at December 31, 2022 | | | | | | $ | 9,525,052 | |
| | | | | | | | | |
| Net assets consist of: | | | | | | | | |
| Capital paid in on shares of beneficial interest | | | | | | $ | 12,487,153 | |
| Total accumulated loss | | | | | | | (2,962,101 | ) |
| Net assets at December 31, 2022 | | | | | | $ | 9,525,052 | |
Refer to the notes to financial statements.
| Capital World Bond Fund | 39 |
Financial statements (continued)
| Statement of assets and liabilities | |
| at December 31, 2022 (continued) | |
| | (dollars and shares in thousands, except per-share amounts) |
Shares of beneficial interest issued and outstanding (no stated par value) –
unlimited shares authorized (591,385 total shares outstanding)
| | | Net assets | | | Shares
outstanding | | | Net asset value
per share | |
| Class A | | $ | 3,862,102 | | | | 239,656 | | | $ | 16.12 | |
| Class C | | | 52,108 | | | | 3,292 | | | | 15.83 | |
| Class T | | | 8 | | | | — | * | | | 16.09 | |
| Class F-1 | | | 96,070 | | | | 5,976 | | | | 16.08 | |
| Class F-2 | | | 822,629 | | | | 51,142 | | | | 16.09 | |
| Class F-3 | | | 1,362,989 | | | | 84,662 | | | | 16.10 | |
| Class 529-A | | | 215,897 | | | | 13,354 | | | | 16.17 | |
| Class 529-C | | | 6,736 | | | | 421 | | | | 15.98 | |
| Class 529-E | | | 8,567 | | | | 534 | | | | 16.05 | |
| Class 529-T | | | 10 | | | | 1 | | | | 16.10 | |
| Class 529-F-1 | | | 8 | | | | 1 | | | | 16.03 | |
| Class 529-F-2 | | | 32,887 | | | | 2,041 | | | | 16.11 | |
| Class 529-F-3 | | | 8 | | | | 1 | | | | 16.10 | |
| Class R-1 | | | 5,559 | | | | 349 | | | | 15.94 | |
| Class R-2 | | | 70,339 | | | | 4,418 | | | | 15.92 | |
| Class R-2E | | | 5,138 | | | | 320 | | | | 16.07 | |
| Class R-3 | | | 93,146 | | | | 5,789 | | | | 16.09 | |
| Class R-4 | | | 68,539 | | | | 4,257 | | | | 16.10 | |
| Class R-5E | | | 23,284 | | | | 1,447 | | | | 16.09 | |
| Class R-5 | | | 31,241 | | | | 1,937 | | | | 16.12 | |
| Class R-6 | | | 2,767,787 | | | | 171,787 | | | | 16.11 | |
| * | Amount less than one thousand. |
Refer to the notes to financial statements.
| 40 | Capital World Bond Fund |
Financial statements (continued)
| Statement of operations | |
| for the year ended December 31, 2022 | (dollars in thousands) |
| Investment income: | | | | |
| Income: | | | | |
| Interest from unaffiliated issuers (net of non-U.S. taxes of $1,589) | | $ | 315,792 | | | | | |
| Dividends (includes $19,134 from affiliates) | | | 19,594 | | | $ | 335,386 | |
| Fees and expenses*: | | | | | | | | |
| Investment advisory services | | | 52,303 | | | | | |
| Distribution services | | | 14,081 | | | | | |
| Transfer agent services | | | 12,640 | | | | | |
| Administrative services | | | 3,645 | | | | | |
| 529 plan services | | | 173 | | | | | |
| Reports to shareholders | | | 571 | | | | | |
| Registration statement and prospectus | | | 634 | | | | | |
| Trustees’ compensation | | | 23 | | | | | |
| Auditing and legal | | | 202 | | | | | |
| Custodian | | | 952 | | | | | |
| Other | | | 36 | | | | 85,260 | |
| Net investment income | | | | | | | 250,126 | |
| | | | | | | | | |
| Net realized loss and unrealized depreciation: | | | | | | | | |
| Net realized (loss) gain on: | | | | | | | | |
| Investments (net of non-U.S. taxes of $2,757): | | | | | | | | |
| Unaffiliated issuers | | | (1,349,949 | ) | | | | |
| Affiliated issuers | | | (258 | ) | | | | |
| Futures contracts | | | 3,505 | | | | | |
| Forward currency contracts | | | (208,439 | ) | | | | |
| Swap contracts | | | (2,182 | ) | | | | |
| Currency transactions | | | (21,092 | ) | | | (1,578,415 | ) |
| Net unrealized (depreciation) appreciation on: | | | | | | | | |
| Investments (net of non-U.S. taxes of $40): | | | | | | | | |
| Unaffiliated issuers | | | (1,342,392 | ) | | | | |
| Affiliated issuers | | | 620 | | | | | |
| Futures contracts | | | (15,689 | ) | | | | |
| Forward currency contracts | | | 45,372 | | | | | |
| Swap contracts | | | (52,915 | ) | | | | |
| Currency translations | | | 3,142 | | | | (1,361,862 | ) |
| Net realized loss and unrealized depreciation | | | | | | | (2,940,277 | ) |
| | | | | | | | | |
| Net decrease in net assets resulting from operations | | | | | | $ | (2,690,151 | ) |
| * | Additional information related to class-specific fees and expenses is included in the notes to financial statements. |
Refer to the notes to financial statements.
| Capital World Bond Fund | 41 |
Financial statements (continued)
| Statements of changes in net assets | |
| | (dollars in thousands) |
| | | Year ended December 31, |
| | | 2022 | | 2021 | |
| Operations: | | | | |
| Net investment income | | $ | 250,126 | | | $ | 268,444 | |
| Net realized (loss) gain | | | (1,578,415 | ) | | | 77,438 | |
| Net unrealized depreciation | | | (1,361,862 | ) | | | (1,120,730 | ) |
| Net decrease in net assets resulting from operations | | | (2,690,151 | ) | | | (774,848 | ) |
| | | | | | | | | |
| Distributions paid and return of capital paid to shareholders: | | | | | | | | |
| Distributions | | | (124,687 | ) | | | (434,469 | ) |
| Return of capital | | | (125,989 | ) | | | — | |
| Total distributions paid and return of capital paid to shareholders | | | (250,676 | ) | | | (434,469 | ) |
| | | | | | | | | |
| Net capital share transactions | | | (3,457,460 | ) | | | 2,308,912 | |
| | | | | | | | | |
| Total (decrease) increase in net assets | | | (6,398,287 | ) | | | 1,099,595 | |
| | | | | | | | | |
| Net assets: | | | | | | | | |
| Beginning of year | | | 15,923,339 | | | | 14,823,744 | |
| End of year | | $ | 9,525,052 | | | $ | 15,923,339 | |
Refer to the notes to financial statements.
| 42 | Capital World Bond Fund |
Notes to financial statements
1. Organization
Capital World Bond Fund (the “fund”) is registered under the Investment Company Act of 1940, as amended (the “1940 Act”), as an open-end, diversified management investment company. The fund seeks to provide, over the long term, a high level of total return consistent with prudent investment management. Total return comprises the income generated by the fund and the changes in the market value of the fund’s investments.
The fund has 21 share classes consisting of six retail share classes (Classes A, C, T, F-1, F-2 and F-3), seven 529 college savings plan share classes (Classes 529-A, 529-C, 529-E, 529-T, 529-F-1, 529-F-2 and 529-F-3) and eight retirement plan share classes (Classes R-1, R-2, R-2E, R-3, R-4, R-5E, R-5 and R-6). The 529 college savings plan share classes can be used to save for college education. The retirement plan share classes are generally offered only through eligible employer-sponsored retirement plans. The fund’s share classes are described further in the following table:
| Share class | | Initial sales charge | | Contingent deferred sales
charge upon redemption | | Conversion feature |
| Classes A and 529-A | | Up to 3.75% for Class A; up to 3.50% for Class 529-A | | None (except 1.00% for certain redemptions within 18 months of purchase without an initial sales charge) | | None |
| Classes C and 529-C | | None | | 1.00% for redemptions within one year of purchase | | Class C converts to Class A after eight years and Class 529-C converts to Class 529-A after five years |
| Class 529-E | | None | | None | | None |
| Classes T and 529-T* | | Up to 2.50% | | None | | None |
| Classes F-1, F-2, F-3, 529-F-1, 529-F-2 and 529-F-3 | | None | | None | | None |
| Classes R-1, R-2, R-2E, R-3, R-4, R-5E, R-5 and R-6 | | None | | None | | None |
| * | Class T and 529-T shares are not available for purchase. |
Holders of all share classes have equal pro rata rights to the assets, dividends and liquidation proceeds of the fund. Each share class has identical voting rights, except for the exclusive right to vote on matters affecting only its class. Share classes have different fees and expenses (“class-specific fees and expenses”), primarily due to different arrangements for distribution, transfer agent and administrative services. Differences in class-specific fees and expenses will result in differences in net investment income and, therefore, the payment of different per-share dividends by each share class.
2. Significant accounting policies
The fund is an investment company that applies the accounting and reporting guidance issued in Topic 946 by the U.S. Financial Accounting Standards Board. The fund’s financial statements have been prepared to comply with U.S. generally accepted accounting principles (“U.S. GAAP”). These principles require the fund’s investment adviser to make estimates and assumptions that affect reported amounts and disclosures. Actual results could differ from those estimates. Subsequent events, if any, have been evaluated through the date of issuance in the preparation of the financial statements. The fund follows the significant accounting policies described in this section, as well as the valuation policies described in the next section on valuation.
Security transactions and related investment income — Security transactions are recorded by the fund as of the date the trades are executed with brokers. Realized gains and losses from security transactions are determined based on the specific identified cost of the securities. In the event a security is purchased with a delayed payment date, the fund will segregate liquid assets sufficient to meet its payment obligations. Dividend income is recognized on the ex-dividend date and interest income is recognized on an accrual basis. Market discounts, premiums and original issue discounts on fixed-income securities are amortized daily over the expected life of the security.
Class allocations — Income, fees and expenses (other than class-specific fees and expenses), realized gains and losses and unrealized appreciation and depreciation are allocated daily among the various share classes based on their relative net assets. Class-specific fees and expenses, such as distribution, transfer agent and administrative services, are charged directly to the respective share class.
Distributions paid to shareholders — Income dividends and capital gain distributions are recorded on the ex-dividend date. The fund may deem a portion of the income dividends and/or capital gain distributions as a return of capital for tax purposes.
| Capital World Bond Fund | 43 |
Currency translation — Assets and liabilities, including investment securities, denominated in currencies other than U.S. dollars are translated into U.S. dollars at the exchange rates supplied by one or more pricing vendors on the valuation date. Purchases and sales of investment securities and income and expenses are translated into U.S. dollars at the exchange rates on the dates of such transactions. The effects of changes in exchange rates on investment securities are included with the net realized gain or loss and net unrealized appreciation or depreciation on investments in the fund’s statement of operations. The realized gain or loss and unrealized appreciation or depreciation resulting from all other transactions denominated in currencies other than U.S. dollars are disclosed separately.
3. Valuation
Capital Research and Management Company (“CRMC”), the fund’s investment adviser, values the fund’s investments at fair value as defined by U.S. GAAP. The net asset value per share is calculated once daily as of the close of regular trading on the New York Stock Exchange, normally 4 p.m. New York time, each day the New York Stock Exchange is open.
Methods and inputs — The fund’s investment adviser uses the following methods and inputs to establish the fair value of the fund’s assets and liabilities. Use of particular methods and inputs may vary over time based on availability and relevance as market and economic conditions evolve.
Equity securities, including depositary receipts, are generally valued at the official closing price of, or the last reported sale price on, the exchange or market on which such securities are traded, as of the close of business on the day the securities are being valued or, lacking any sales, at the last available bid price. Prices for each security are taken from the principal exchange or market on which the security trades.
Fixed-income securities, including short-term securities, are generally valued at evaluated prices obtained from third-party pricing vendors. Vendors value such securities based on one or more of the inputs described in the following table. The table provides examples of inputs that are commonly relevant for valuing particular classes of fixed-income securities in which the fund is authorized to invest. However, these classifications are not exclusive, and any of the inputs may be used to value any other class of fixed-income security.
| Fixed-income class | | Examples of standard inputs |
| All | | Benchmark yields, transactions, bids, offers, quotations from dealers and trading systems, new issues, spreads and other relationships observed in the markets among comparable securities; and proprietary pricing models such as yield measures calculated using factors such as cash flows, financial or collateral performance and other reference data (collectively referred to as “standard inputs”) |
| Corporate bonds, notes & loans; convertible securities | | Standard inputs and underlying equity of the issuer |
| Bonds & notes of governments & government agencies | | Standard inputs and interest rate volatilities |
| Mortgage-backed; asset-backed obligations | | Standard inputs and cash flows, prepayment information, default rates, delinquency and loss assumptions, collateral characteristics, credit enhancements and specific deal information |
| Municipal securities | | Standard inputs and, for certain distressed securities, cash flows or liquidation values using a net present value calculation based on inputs that include, but are not limited to, financial statements and debt contracts |
Securities with both fixed-income and equity characteristics, or equity securities traded principally among fixed-income dealers, are generally valued in the manner described for either equity or fixed-income securities, depending on which method is deemed most appropriate by the fund’s investment adviser. The Capital Group Central Corporate Bond Fund (“CCBF”), a fund within the Capital Group Central Fund Series II, and Capital Group Central Cash Fund (“CCF”), a fund within the Capital Group Central Fund Series (collectively the “Central Funds”), are each valued based upon a floating net asset value, which fluctuates with changes in the value of each fund’s portfolio securities. The underlying securities are valued based on the policies and procedures in the Central Funds’ statements of additional information. Exchange-traded futures are generally valued at the official settlement price of the exchange or market on which such instruments are traded, as of the close of business on the day the futures are being valued. Forward currency contracts are valued based on the spot and forward exchange rates obtained from a third-party pricing vendor. Swaps are generally valued using evaluated prices obtained from third-party pricing vendors who calculate these values based on market inputs that may include the yields of the indices referenced in the instrument and the relevant curve, dealer quotes, default probabilities and recovery rates, other reference data, and terms of the contract.
| 44 | Capital World Bond Fund |
Securities and other assets for which representative market quotations are not readily available or are considered unreliable by the fund’s investment adviser are fair valued as determined in good faith under fair valuation guidelines adopted by the fund’s investment adviser and approved by the board of trustees as further described. The investment adviser follows fair valuation guidelines, consistent with U.S. Securities and Exchange Commission rules and guidance, to consider relevant principles and factors when making fair value determinations. The investment adviser considers relevant indications of value that are reasonably and timely available to it in determining the fair value to be assigned to a particular security, such as the type and cost of the security, contractual or legal restrictions on resale of the security, relevant financial or business developments of the issuer, actively traded similar or related securities, dealer or broker quotes, conversion or exchange rights on the security, related corporate actions, significant events occurring after the close of trading in the security, and changes in overall market conditions. In addition, the closing prices of equity securities that trade in markets outside U.S. time zones may be adjusted to reflect significant events that occur after the close of local trading but before the net asset value of each share class of the fund is determined. Fair valuations of investments that are not actively trading involve judgment and may differ materially from valuations that would have been used had greater market activity occurred.
Processes and structure — The fund’s board of trustees has designated the fund’s investment adviser to make fair value determinations, subject to board oversight. The investment adviser has established a Joint Fair Valuation Committee (the “Fair Valuation Committee”) to administer, implement and oversee the fair valuation process, and to make fair value decisions. The Fair Valuation Committee regularly reviews its own fair value decisions, as well as decisions made under its standing instructions to the investment adviser’s valuation team. The Fair Valuation Committee reviews changes in fair value measurements from period to period and may, as deemed appropriate, update the fair valuation guidelines to better reflect the results of back testing and address new or evolving issues. The Fair Valuation Committee reports any changes to the fair valuation guidelines to the board of trustees. The fund’s board and audit committee also regularly review reports that describe fair value determinations and methods.
The fund’s investment adviser has also established a Fixed-Income Pricing Review Group to administer and oversee the fixed-income valuation process, including the use of fixed-income pricing vendors. This group regularly reviews pricing vendor information and market data. Pricing decisions, processes and controls over security valuation are also subject to additional internal reviews facilitated by the investment adviser’s global risk management group.
Classifications — The fund’s investment adviser classifies the fund’s assets and liabilities into three levels based on the inputs used to value the assets or liabilities. Level 1 values are based on quoted prices in active markets for identical securities. Level 2 values are based on significant observable market inputs, such as quoted prices for similar securities and quoted prices in inactive markets. Certain securities trading outside the U.S. may transfer between Level 1 and Level 2 due to valuation adjustments resulting from significant market movements following the close of local trading. Level 3 values are based on significant unobservable inputs that reflect the investment adviser’s determination of assumptions that market participants might reasonably use in valuing the securities. The valuation levels are not necessarily an indication of the risk or liquidity associated with the underlying investment. For example, U.S. government securities are reflected as Level 2 because the inputs used to determine fair value may not always be quoted prices in an active market. The tables on the following page present the fund’s valuation levels as of December 31, 2022 (dollars in thousands):
| Capital World Bond Fund | 45 |
| | | Investment securities | |
| | | Level 1 | | | Level 2 | | | Level 3 | | | Total | |
| Assets: | | | | | | | | | | | | |
| Bonds, notes & other debt instruments: | | | | | | | | | | | | | | | | |
| Euros | | $ | — | | | $ | 1,741,674 | | | $ | — | | | $ | 1,741,674 | |
| Japanese yen | | | — | | | | 678,626 | | | | — | | | | 678,626 | |
| Chinese yuan renminbi | | | — | | | | 362,545 | | | | — | | | | 362,545 | |
| British pounds | | | — | | | | 356,974 | | | | — | | | | 356,974 | |
| Canadian dollars | | | — | | | | 262,248 | | | | — | | | | 262,248 | |
| Danish kroner | | | — | | | | 182,498 | | | | — | | | | 182,498 | |
| Australian dollars | | | — | | | | 178,212 | | | | — | | | | 178,212 | |
| Mexican pesos | | | — | | | | 149,258 | | | | — | | | | 149,258 | |
| Colombian pesos | | | — | | | | 61,472 | | | | — | | | | 61,472 | |
| Indonesian rupiah | | | — | | | | 45,512 | | | | — | | | | 45,512 | |
| South Korean won | | | — | | | | 35,661 | | | | — | | | | 35,661 | |
| Chilean pesos | | | — | | | | 33,984 | | | | — | | | | 33,984 | |
| Brazilian reais | | | — | | | | 23,428 | | | | — | | | | 23,428 | |
| South African rand | | | — | | | | 21,615 | | | | — | | | | 21,615 | |
| Russian rubles | | | — | | | | 19,818 | | | | 1,261 | | | | 21,079 | |
| Dominican pesos | | | — | | | | 14,787 | | | | — | | | | 14,787 | |
| Malaysian ringgits | | | — | | | | 14,064 | | | | — | | | | 14,064 | |
| Polish zloty | | | — | | | | 12,277 | | | | — | | | | 12,277 | |
| Ukrainian hryvnia | | | — | | | | 3,824 | | | | 6,778 | | | | 10,602 | |
| Thai baht | | | — | | | | 9,706 | | | | — | | | | 9,706 | |
| Indian rupees | | | — | | | | 9,618 | | | | — | | | | 9,618 | |
| Czech korunas | | | — | | | | 6,954 | | | | — | | | | 6,954 | |
| Israeli shekels | | | — | | | | 5,015 | | | | — | | | | 5,015 | |
| Hungarian forints | | | — | | | | 3,618 | | | | — | | | | 3,618 | |
| Peruvian nuevos soles | | | — | | | | 3,224 | | | | — | | | | 3,224 | |
| Romanian leu | | | — | | | | 2,436 | | | | — | | | | 2,436 | |
| Norwegian kroner | | | — | | | | 1,747 | | | | — | | | | 1,747 | |
| New Zealand dollars | | | — | | | | 697 | | | | — | | | | 697 | |
| U.S. dollars | | | — | | | | 4,656,116 | | | | 1,119 | | | | 4,657,235 | |
| Investment funds | | | 54,056 | | | | — | | | | — | | | | 54,056 | |
| Convertible bonds & notes | | | — | | | | 998 | | | | — | | | | 998 | |
| Convertible stocks | | | — | | | | 344 | | | | — | | | | 344 | |
| Preferred securities | | | — | | | | — | | | | 116 | | | | 116 | |
| Common stocks | | | 869 | | | | — | | | | 332 | | | | 1,201 | |
| Short-term securities | | | 648,579 | | | | 19,253 | | | | — | | | | 667,832 | |
| Total | | $ | 703,504 | | | $ | 8,918,203 | | | $ | 9,606 | | | $ | 9,631,313 | |
| | | Other investments* | |
| | | Level 1 | | | Level 2 | | | Level 3 | | | Total | |
| Assets: | | | | | | | | | | | | | | | | |
| Unrealized appreciation on futures contracts | | $ | 5,677 | | | $ | — | | | $ | — | | | $ | 5,677 | |
| Unrealized appreciation on open forward currency contracts | | | — | | | | 59,295 | | | | — | | | | 59,295 | |
| Unrealized appreciation on centrally cleared interest rate swaps | | | — | | | | 149 | | | | — | | | | 149 | |
| Liabilities: | | | | | | | | | | | | | | | | |
| Unrealized depreciation on futures contracts | | | (23,781 | ) | | | — | | | | — | | | | (23,781 | ) |
| Unrealized depreciation on open forward currency contracts | | | — | | | | (27,254 | ) | | | — | | | | (27,254 | ) |
| Unrealized depreciation on centrally cleared interest rate swaps | | | — | | | | (77,833 | ) | | | — | | | | (77,833 | ) |
| Unrealized depreciation on bilateral interest rate swaps | | | — | | | | (197 | ) | | | — | | | | (197 | ) |
| Unrealized depreciation on centrally cleared credit default swaps | | | — | | | | (1,105 | ) | | | — | | | | (1,105 | ) |
| Total | | $ | (18,104 | ) | | $ | (46,945 | ) | | $ | — | | | $ | (65,049 | ) |
| * | Futures contracts, forward currency contracts, interest rate swaps and credit default swaps are not included in the fund’s investment portfolio. |
| 46 | Capital World Bond Fund |
4. Risk factors
Investing in the fund may involve certain risks including, but not limited to, those described below.
Market conditions — The prices of, and the income generated by, the securities held by the fund may decline — sometimes rapidly or unpredictably — due to various factors, including events or conditions affecting the general economy or particular industries or companies; overall market changes; local, regional or global political, social or economic instability; governmental, governmental agency or central bank responses to economic conditions; and currency exchange rate, interest rate and commodity price fluctuations.
Economies and financial markets throughout the world are highly interconnected. Economic, financial or political events, trading and tariff arrangements, wars, terrorism, cybersecurity events, natural disasters, public health emergencies (such as the spread of infectious disease) and other circumstances in one country or region, including actions taken by governmental or quasi-governmental authorities in response to any of the foregoing, could have impacts on global economies or markets. As a result, whether or not the fund invests in securities of issuers located in or with significant exposure to the countries affected, the value and liquidity of the fund’s investments may be negatively affected by developments in other countries and regions.
Issuer risks — The prices of, and the income generated by, securities held by the fund may decline in response to various factors directly related to the issuers of such securities, including reduced demand for an issuer’s goods or services, poor management performance, major litigation, investigations or other controversies related to the issuer, changes in the issuer’s financial condition or credit rating, changes in government regulations affecting the issuer or its competitive environment and strategic initiatives such as mergers, acquisitions or dispositions and the market response to any such initiatives.
Investing in debt instruments — The prices of, and the income generated by, bonds and other debt securities held by the fund may be affected by factors such as the interest rates, maturities and credit quality of these securities.
Rising interest rates will generally cause the prices of bonds and other debt securities to fall. Also, when interest rates rise, issuers are less likely to refinance existing debt securities, causing the average life of such securities to extend. A general rise in interest rates may cause investors to sell debt securities on a large scale, which could also adversely affect the price and liquidity of debt securities and could also result in increased redemptions from the fund. Falling interest rates may cause an issuer to redeem, call or refinance a debt security before its stated maturity, which may result in the fund failing to recoup the full amount of its initial investment and having to reinvest the proceeds in lower yielding securities. Longer maturity debt securities generally have greater sensitivity to changes in interest rates and may be subject to greater price fluctuations than shorter maturity debt securities.
Bonds and other debt securities are also subject to credit risk, which is the possibility that the credit strength of an issuer or guarantor will weaken or be perceived to be weaker, and/or an issuer of a debt security will fail to make timely payments of principal or interest and the security will go into default. Changes in actual or perceived creditworthiness may occur quickly. A downgrade or default affecting any of the fund’s securities could cause the value of the fund’s shares to decrease. Lower quality debt securities generally have higher rates of interest and may be subject to greater price fluctuations than higher quality debt securities. Credit risk is gauged, in part, by the credit ratings of the debt securities in which the fund invests. However, ratings are only the opinions of the rating agencies issuing them and are not guarantees as to credit quality or an evaluation of market risk. The fund’s investment adviser relies on its own credit analysts to research issuers and issues in assessing credit and default risks.
Liquidity risk — Certain fund holdings may be or may become difficult or impossible to sell, particularly during times of market turmoil. Liquidity may be impacted by the lack of an active market for a holding, legal or contractual restrictions on resale, or the reduced number and capacity of market participants to make a market in such holding. Market prices for less liquid or illiquid holdings may be volatile or difficult to determine, and reduced liquidity may have an adverse impact on the market price of such holdings. Additionally, the sale of less liquid or illiquid holdings may involve substantial delays (including delays in settlement) and additional costs and the fund may be unable to sell such holdings when necessary to meet its liquidity needs, or to try to limit losses, or may be forced to sell at a loss.
Investing in lower rated debt instruments — Lower rated bonds and other lower rated debt securities generally have higher rates of interest and involve greater risk of default or price declines due to changes in the issuer’s creditworthiness than those of higher quality debt securities. The market prices of these securities may fluctuate more than the prices of higher quality debt securities and may decline significantly in periods of general economic difficulty. These risks may be increased with respect to investments in junk bonds.
Currency — The prices of, and the income generated by, many debt securities held by the fund may also be affected by changes in relative currency values. If the U.S. dollar appreciates against foreign currencies, the value in U.S. dollars of the fund’s securities denominated in such currencies would generally fall and vice versa.
| Capital World Bond Fund | 47 |
Investing in derivatives — The use of derivatives involves a variety of risks, which may be different from, or greater than, the risks associated with investing in traditional securities, such as stocks and bonds. Changes in the value of a derivative may not correlate perfectly with, and may be more sensitive to market events than, the underlying asset, rate or index, and a derivative instrument may cause the fund to lose significantly more than its initial investment. Derivatives may be difficult to value, difficult for the fund to buy or sell at an opportune time or price and difficult, or even impossible, to terminate or otherwise offset. The fund’s use of derivatives may result in losses to the fund, and investing in derivatives may reduce the fund’s returns and increase the fund’s price volatility. The fund’s counterparty to a derivative transaction (including, if applicable, the fund’s clearing broker, the derivatives exchange or the clearinghouse) may be unable or unwilling to honor its financial obligations in respect of the transaction. In certain cases, the fund may be hindered or delayed in exercising remedies against or closing out derivative instruments with a counterparty, which may result in additional losses. Derivatives are also subject to operational risk (such as documentation issues, settlement issues and systems failures) and legal risk (such as insufficient documentation, insufficient capacity or authority of a counterparty, and issues with the legality or enforceability of a contract).
Investing in inflation-linked bonds — The values of inflation-linked bonds generally fluctuate in response to changes in real interest rates —i.e., rates of interest after factoring in inflation. A rise in real interest rates may cause the prices of inflation-linked securities to fall, while a decline in real interest rates may cause the prices to increase. Inflation-linked bonds may experience greater losses than other debt securities with similar durations when real interest rates rise faster than nominal interest rates. There can be no assurance that the value of an inflation-linked security will be directly correlated to changes in interest rates; for example, if interest rates rise for reasons other than inflation, the increase may not be reflected in the security’s inflation measure.
Investing in inflation-linked bonds may also reduce the fund’s distributable income during periods of deflation. If prices for goods and services decline throughout the economy, the principal and income on inflation-linked securities may decline and result in losses to the fund.
Investing outside the U.S. — Securities of issuers domiciled outside the U.S., or with significant operations or revenues outside the U.S., may lose value because of adverse political, social, economic or market developments (including social instability, regional conflicts, terrorism and war) in the countries or regions in which the issuers operate or generate revenue. These securities may also lose value due to changes in foreign currency exchange rates against the U.S. dollar and/or currencies of other countries. Issuers of these securities may be more susceptible to actions of foreign governments, such as nationalization, currency blockage or the imposition of price controls, sanctions, or punitive taxes, each of which could adversely impact the value of these securities. Securities markets in certain countries may be more volatile and/or less liquid than those in the U.S. Investments outside the U.S. may also be subject to different regulatory, legal, accounting, auditing, financial reporting and recordkeeping requirements, and may be more difficult to value, than those in the U.S. In addition, the value of investments outside the U.S. may be reduced by foreign taxes, including foreign withholding taxes on interest and dividends. Further, there may be increased risks of delayed settlement of securities purchased or sold by the fund, which could impact the liquidity of the fund’s portfolio. The risks of investing outside the U.S. may be heightened in connection with investments in emerging markets.
Investing in emerging markets — Investing in emerging markets may involve risks in addition to and greater than those generally associated with investing in the securities markets of developed countries. For instance, emerging market countries tend to have less developed political, economic and legal systems than those in developed countries. Accordingly, the governments of these countries may be less stable and more likely to intervene in the market economy, for example, by imposing capital controls, nationalizing a company or industry, placing restrictions on foreign ownership and on withdrawing sale proceeds of securities from the country, and/or imposing punitive taxes that could adversely affect the prices of securities. Information regarding issuers in emerging markets may be limited, incomplete or inaccurate, and such issuers may not be subject to regulatory, accounting, auditing, and financial reporting and recordkeeping standards comparable to those to which issuers in more developed markets are subject. The fund’s rights with respect to its investments in emerging markets, if any, will generally be governed by local law, which may make it difficult or impossible for the fund to pursue legal remedies or to obtain and enforce judgments in local courts. In addition, the economies of these countries may be dependent on relatively few industries, may have limited access to capital and may be more susceptible to changes in local and global trade conditions and downturns in the world economy. Securities markets in these countries can also be relatively small and have substantially lower trading volumes. As a result, securities issued in these countries may be more volatile and less liquid, and may be more difficult to value, than securities issued in countries with more developed economies and/or markets. Less certainty with respect to security valuations may lead to additional challenges and risks in calculating the fund’s net asset value. Additionally, emerging markets are more likely to experience problems with the clearing and settling of trades and the holding of securities by banks, agents and depositories that are less established than those in developed countries.
| 48 | Capital World Bond Fund |
Management — The investment adviser to the fund actively manages the fund’s investments. Consequently, the fund is subject to the risk that the methods and analyses, including models, tools and data, employed by the investment adviser in this process may be flawed or incorrect and may not produce the desired results. This could cause the fund to lose value or its investment results to lag relevant benchmarks or other funds with similar objectives.
5. Certain investment techniques
Index-linked bonds — The fund has invested in index-linked bonds, which are fixed-income securities whose principal value is periodically adjusted to a government price index. Over the life of an index-linked bond, interest is paid on the adjusted principal value. Increases or decreases in the principal value of index-linked bonds are recorded as interest income in the fund’s statement of operations.
Mortgage dollar rolls — The fund has entered into mortgage dollar roll transactions in which the fund sells a mortgage-backed security to a counterparty and simultaneously enters into an agreement with the same counterparty to buy back a similar security on a specific future date at a predetermined price. Mortgage dollar rolls are accounted for as purchase and sale transactions. Portfolio turnover rates excluding and including mortgage dollar rolls are presented at the end of the fund’s financial highlights table.
Loan transactions — The fund has entered into loan transactions in which the fund acquires a loan either through an agent, by assignment from another holder, or as a participation interest in another holder’s portion of a loan. The loan is often administered by a financial institution that acts as agent for the holders of the loan, and the fund may be required to receive approval from the agent and/or borrower prior to the sale of the investment. The loan’s interest rate and maturity date may change based on the terms of the loan, including potential early payments of principal.
Unfunded commitments — The fund has participated in transactions that involve unfunded commitments, which may obligate the fund to purchase new or additional bonds if certain contingencies are met. As of December 31, 2022, the fund’s maximum exposure of unfunded bond commitments was $524,000, which would represent less than .01% of the net assets of the fund should such commitments become due. Unrealized appreciation of $93,000 is disclosed as unrealized appreciation on unfunded commitments and unrealized depreciation of $7,000 is disclosed as unrealized depreciation on unfunded commitments in the fund’s statement of assets and liabilities. Both are included in net unrealized depreciation on investments in unaffiliated issuers in the fund’s statement of operations.
Futures contracts — The fund has entered into futures contracts, which provide for the future sale by one party and purchase by another party of a specified amount of a specific financial instrument for a specified price, date, time and place designated at the time the contract is made. Futures contracts are used to strategically manage the fund’s interest rate sensitivity by increasing or decreasing the duration of the fund or a portion of the fund’s portfolio.
Upon entering into futures contracts, and to maintain the fund’s open positions in futures contracts, the fund is required to deposit with a futures broker, known as a futures commission merchant (“FCM”), in a segregated account in the name of the FCM an amount of cash, U.S. government securities or other liquid securities, known as initial margin. The margin required for a particular futures contract is set by the exchange on which the contract is traded to serve as collateral, and may be significantly modified from time to time by the exchange during the term of the contract.
On a daily basis, the fund pays or receives variation margin based on the increase or decrease in the value of the futures contracts and records variation margin on futures contracts in the statement of assets and liabilities. Futures contracts may involve a risk of loss in excess of the variation margin shown on the fund’s statement of assets and liabilities. The fund records realized gains or losses at the time the futures contract is closed or expires. Net realized gains or losses and net unrealized appreciation or depreciation from futures contracts are recorded in the fund’s statement of operations. The average month-end notional amount of futures contracts while held was $2,285,535,000.
Forward currency contracts — The fund has entered into forward currency contracts, which represent agreements to exchange currencies on specific future dates at predetermined rates. The fund’s investment adviser uses forward currency contracts to manage the fund’s exposure to changes in exchange rates. Upon entering into these contracts, risks may arise from the potential inability of counterparties to meet the terms of their contracts and from possible movements in exchange rates.
On a daily basis, the fund’s investment adviser values forward currency contracts and records unrealized appreciation or depreciation for open forward currency contracts in the fund’s statement of assets and liabilities. Realized gains or losses are recorded at the time the forward currency contract is closed or offset by another contract with the same broker for the same settlement date and currency.
| Capital World Bond Fund | 49 |
Closed forward currency contracts that have not reached their settlement date are included in the respective receivables or payables for closed forward currency contracts in the fund’s statement of assets and liabilities. Net realized gains or losses from closed forward currency contracts and net unrealized appreciation or depreciation from open forward currency contracts are recorded in the fund’s statement of operations. The average month-end notional amount of open forward currency contracts while held was $4,533,943,000.
Swap contracts — The fund has entered into swap agreements, which are two-party contracts entered into primarily by institutional investors for a specified time period. In a typical swap transaction, two parties agree to exchange the returns earned or realized from one or more underlying assets or rates of return. Swap agreements can be traded on a swap execution facility (SEF) and cleared through a central clearinghouse (cleared), traded over-the-counter (OTC) and cleared, or traded bilaterally and not cleared. Because clearing interposes a central clearinghouse as the ultimate counterparty to each participant’s swap, and margin is required to be exchanged under the rules of the clearinghouse, central clearing is intended to decrease (but not eliminate) counterparty risk relative to uncleared bilateral swaps. To the extent the fund enters into bilaterally negotiated swap transactions, the fund will enter into swap agreements only with counterparties that meet certain credit standards and subject to agreed collateralized procedures. The term of a swap can be days, months or years and certain swaps may be less liquid than others.
Upon entering into a centrally cleared swap contract, the fund is required to deposit cash, U.S. government securities or other liquid securities, which is known as initial margin. Generally, the initial margin required for a particular swap is set and held as collateral by the clearinghouse on which the contract is cleared. The amount of initial margin required may be significantly modified from time to time by the clearinghouse during the term of the contract.
On a daily basis, interest accruals related to the exchange of future payments are recorded as a receivable and payable in the fund’s statement of assets and liabilities for centrally cleared swaps and as unrealized appreciation or depreciation in the fund’s statement of assets and liabilities for bilateral swaps. For centrally cleared swaps, the fund also pays or receives a variation margin based on the increase or decrease in the value of the swaps, including accrued interest as applicable, and records variation margin in the statement of assets and liabilities. The fund records realized gains and losses on both the net accrued interest and any gain or loss recognized at the time the swap is closed or expires. Net realized gains or losses, as well as any net unrealized appreciation or depreciation, from swaps are recorded in the fund’s statement of operations.
Swap agreements can take different forms. The fund has entered into the following types of swap agreements:
Interest rate swaps — The fund has entered into interest rate swaps, which seek to manage the interest rate sensitivity of the fund by increasing or decreasing the duration of the fund or a portion of the fund’s portfolio. An interest rate swap is an agreement between two parties to exchange or swap payments based on changes in an interest rate or rates. Typically, one interest rate is fixed and the other is variable based on a designated short-term interest rate such as the Secured Overnight Financing Rate (SOFR), prime rate or other benchmark, or on an inflation index such as the U.S. Consumer Price Index (which is a measure that examines the weighted average of prices of a basket of consumer goods and services and measures changes in the purchasing power of the U.S. dollar and the rate of inflation). In other types of interest rate swaps, known as basis swaps, the parties agree to swap variable interest rates based on different designated short-term interest rates. Interest rate swaps generally do not involve the delivery of securities or other principal amounts. Rather, cash payments are exchanged by the parties based on the application of the designated interest rates to a notional amount, which is the predetermined dollar principal of the trade upon which payment obligations are computed. Accordingly, the fund’s current obligation or right under the swap agreement is generally equal to the net amount to be paid or received under the swap agreement based on the relative value of the position held by each party. The average month-end notional amount of interest rate swaps while held was $3,027,739,000.
Credit default swap indices — The fund has entered into centrally cleared credit default swap indices, including CDX and iTraxx indices (collectively referred to as “CDSIs”), in order to assume exposure to a diversified portfolio of credits or to hedge against existing credit risks. A CDSI is based on a portfolio of credit default swaps with similar characteristics, such as credit default swaps on high-yield bonds. In a typical CDSI transaction, one party (the protection buyer) is obligated to pay the other party (the protection seller) a stream of periodic payments over the term of the contract. If a credit event, such as a default or restructuring, occurs with respect to any of the underlying reference obligations, the protection seller must pay the protection buyer the loss on those credits.
| 50 | Capital World Bond Fund |
The fund may enter into a CDSI transaction as either protection buyer or protection seller. If the fund is a protection buyer, it would pay the counterparty a periodic stream of payments over the term of the contract and would not recover any of those payments if no credit events were to occur with respect to any of the underlying reference obligations. However, if a credit event did occur, the fund, as a protection buyer, would have the right to deliver the referenced debt obligations or a specified amount of cash, depending on the terms of the applicable agreement, and to receive the par value of such debt obligations from the counterparty protection seller. As a protection seller, the fund would receive fixed payments throughout the term of the contract if no credit events were to occur with respect to any of the underlying reference obligations. If a credit event were to occur, however, the value of any deliverable obligation received by the fund, coupled with the periodic payments previously received by the fund, may be less than the full notional value that the fund, as a protection seller, pays to the counterparty protection buyer, effectively resulting in a loss of value to the fund. Furthermore, as a protection seller, the fund would effectively add leverage to its portfolio because it would have investment exposure to the notional amount of the swap transaction. The average month-end notional amount of credit default swaps while held was $796,265,000.
The following tables identify the location and fair value amounts on the fund’s statement of assets and liabilities and the effect on the fund’s statement of operations resulting from the fund’s use of futures contracts, forward currency contracts, interest rate swaps and credit default swaps as of, or for the year ended, December 31, 2022 (dollars in thousands):
| | | | | Assets | | | Liabilities | |
| Contracts | | Risk type | | Location on statement of
assets and liabilities | | Value | | | Location on statement of
assets and liabilities | | Value | |
| Futures | | Interest | | Unrealized appreciation* | | $ | 5,677 | | | Unrealized depreciation* | | $ | 23,781 | |
| Forward currency | | Currency | | Unrealized appreciation on open forward currency contracts | | | 59,295 | | | Unrealized depreciation on open forward currency contracts | | | 27,254 | |
| Swap (centrally cleared) | | Interest | | Unrealized appreciation* | | | 149 | | | Unrealized depreciation* | | | 77,833 | |
| Swap (bilateral) | | Interest | | Bilateral interest rate swaps, at value | | | — | | | Bilateral interest rate swaps, at value | | | 197 | |
| Swap (centrally cleared) | | Credit | | Unrealized appreciation* | | | — | | | Unrealized depreciation* | | | 1,105 | |
| | | | | | | $ | 65,121 | | | | | $ | 130,170 | |
| | | | | | | | | | | | | | | |
| | | | | Net realized gain (loss) | | | Net unrealized (depreciation) appreciation | |
| Contracts | | Risk type | | Location on statement of operations | | Value | | | Location on statement of operations | | Value | |
| Futures | | Interest | | Net realized gain on futures contracts | | $ | 3,505 | | | Net unrealized depreciation on futures contracts | | $ | (15,689 | ) |
| Forward currency | | Currency | | Net realized loss on forward currency contracts | | | (208,439 | ) | | Net unrealized appreciation on forward currency contracts | | | 45,372 | |
| Swap | | Interest | | Net realized loss on swap contracts | | | (7,197 | ) | | Net unrealized depreciation on swap contracts | | | (52,558 | ) |
| Swap | | Credit | | Net realized gain on swap contracts | | | 5,015 | | | Net unrealized depreciation on swap contracts | | | (357 | ) |
| | | | | | | $ | (207,116 | ) | | | | $ | (23,232 | ) |
| * | Includes cumulative appreciation/depreciation on futures contracts, centrally cleared interest rate swaps and centrally cleared credit default swaps as reported in the applicable tables following the fund’s investment portfolio. Only current day’s variation margin is reported within the fund’s statement of assets and liabilities. |
Collateral — The fund receives or pledges highly liquid assets, such as cash or U.S. government securities, as collateral due to its use of futures contracts, forward currency contracts, interest rate swaps, credit default swaps and future delivery contracts. For futures contracts, centrally cleared interest rate swaps and centrally cleared credit default swaps, the fund pledges collateral for initial and variation margin by contract. For forward currency contracts and bilateral interest rate swaps, the fund either receives or pledges collateral based on the net gain or loss on unsettled contracts by counterparty. For future delivery contracts, the fund either receives or pledges collateral based on the net gain or loss on unsettled contracts by certain counterparties. The purpose of the collateral is to cover potential losses that could occur in the event that either party cannot meet its contractual obligation. Non-cash collateral pledged by the fund, if any, is disclosed in the fund’s investment portfolio, and cash collateral pledged by the fund, if any, is held in a segregated account with the fund’s custodian, which is reflected as pledged cash collateral in the fund’s statement of assets and liabilities.
| Capital World Bond Fund | 51 |
Rights of offset — The fund has entered into enforceable master netting agreements with certain counterparties for forward currency contracts and bilateral interest rate swaps, where on any date amounts payable by each party to the other (in the same currency with respect to the same transaction) may be closed or offset by each party’s payment obligation. If an early termination date occurs under these agreements following an event of default or termination event, all obligations of each party to its counterparty are settled net through a single payment in a single currency (“close-out netting”). For financial reporting purposes, the fund does not offset financial assets and financial liabilities that are subject to these master netting arrangements in the statement of assets and liabilities.
The following table presents the fund’s forward currency contracts and bilateral interest rate swaps by counterparty that are subject to master netting agreements but that are not offset in the fund’s statement of assets and liabilities. The net amount column shows the impact of offsetting on the fund’s statement of assets and liabilities as of December 31, 2022, if close-out netting was exercised (dollars in thousands):
| | | Gross amounts
recognized in the | | | Gross amounts not offset in the
statement of assets and liabilities and
subject to a master netting agreement | | | | |
| Counterparty | | statement of assets
and liabilities | | | Available
to offset | | | Non-cash
collateral* | | | Cash
collateral* | | | Net
amount | |
| Assets: | | | | | | | | | | | | | | | |
| Bank of America | | $ | 8,505 | | | $ | (8,222 | ) | | $ | — | | | $ | — | | | $ | 283 | |
| Bank of New York Mellon | | | 12 | | | | (12 | ) | | | — | | | | — | | | | — | |
| Barclays Bank PLC | | | 94 | | | | (94 | ) | | | — | | | | — | | | | — | |
| BNP Paribas | | | 3,274 | | | | (3,274 | ) | | | — | | | | — | | | | — | |
| Citibank | | | 10,998 | | | | (622 | ) | | | (2,093 | ) | | | (2,800 | ) | | | 5,483 | |
| Goldman Sachs | | | 7,183 | | | | (1,793 | ) | | | — | | | | (4,618 | ) | | | 772 | |
| HSBC Bank | | | 1,356 | | | | (1,356 | ) | | | — | | | | — | | | | — | |
| JPMorgan Chase | | | 13,305 | | | | (5,645 | ) | | | — | | | | (3,170 | ) | | | 4,490 | |
| Morgan Stanley | | | 1,279 | | | | (1,279 | ) | | | — | | | | — | | | | — | |
| Standard Chartered Bank | | | 10,272 | | | | (112 | ) | | | — | | | | (6,970 | ) | | | 3,190 | |
| UBS AG | | | 3,017 | | | | (1,279 | ) | | | — | | | | (1,738 | ) | | | — | |
| Total | | $ | 59,295 | | | $ | (23,688 | ) | | $ | (2,093 | ) | | $ | (19,296 | ) | | $ | 14,218 | |
| Liabilities: | | | | | | | | | | | | | | | | | | | | |
| Bank of America | | $ | 8,222 | | | $ | (8,222 | ) | | $ | — | | | $ | — | | | $ | — | |
| Bank of New York Mellon | | | 30 | | | | (12 | ) | | | — | | | | — | | | | 18 | |
| Barclays Bank PLC | | | 167 | | | | (94 | ) | | | (73 | ) | | | — | | | | — | |
| BNP Paribas | | | 4,593 | | | | (3,274 | ) | | | (1,319 | ) | | | — | | | | — | |
| Citibank | | | 622 | | | | (622 | ) | | | — | | | | — | | | | — | |
| Goldman Sachs | | | 1,793 | | | | (1,793 | ) | | | — | | | | — | | | | — | |
| HSBC Bank | | | 1,526 | | | | (1,356 | ) | | | (170 | ) | | | — | | | | — | |
| JPMorgan Chase | | | 5,645 | | | | (5,645 | ) | | | — | | | | — | | | | — | |
| Morgan Stanley | | | 3,462 | | | | (1,279 | ) | | | (1,927 | ) | | | — | | | | 256 | |
| Standard Chartered Bank | | | 112 | | | | (112 | ) | | | — | | | | — | | | | — | |
| UBS AG | | | 1,279 | | | | (1,279 | ) | | | — | | | | — | | | | — | |
| Total | | $ | 27,451 | | | $ | (23,688 | ) | | $ | (3,489 | ) | | $ | — | | | $ | 274 | |
| * | Collateral is shown on a settlement basis. |
6. Taxation and distributions
Federal income taxation — The fund complies with the requirements under Subchapter M of the Internal Revenue Code applicable to regulated investment companies and intends to distribute substantially all of its net taxable income and net capital gains each year. The fund is not subject to income taxes to the extent such distributions are made. Therefore, no federal income tax provision is required.
As of and during the year ended December 31, 2022, the fund did not have a liability for any unrecognized tax benefits. The fund recognizes interest and penalties, if any, related to unrecognized tax benefits as income tax expense in the statement of operations. During the year, the fund did not incur any significant interest or penalties.
The fund’s tax returns are generally not subject to examination by federal, state and, if applicable, non-U.S. tax authorities after the expiration of each jurisdiction’s statute of limitations, which is typically three years after the date of filing but can be extended in certain jurisdictions.
| 52 | Capital World Bond Fund |
Non-U.S. taxation — Dividend and interest income are recorded net of non-U.S. taxes paid. The fund may file withholding tax reclaims in certain jurisdictions to recover a portion of amounts previously withheld. These reclaims are recorded when the amount is known and there are no significant uncertainties on collectability. Gains realized by the fund on the sale of securities in certain countries, if any, may be subject to non-U.S. taxes. If applicable, the fund records an estimated deferred tax liability based on unrealized gains to provide for potential non-U.S. taxes payable upon the sale of these securities.
Distributions — Distributions determined on a tax basis may differ from net investment income and net realized gains for financial reporting purposes. These differences are due primarily to different treatment for items such as currency gains and losses; short-term capital gains and losses; capital losses related to sales of certain securities within 30 days of purchase; deferred expenses; cost of investments sold; net capital losses; non-U.S. taxes on capital gains; amortization of premiums and discounts and income on certain investments. The fiscal year in which amounts are distributed may differ from the year in which the net investment income and net realized gains are recorded by the fund for financial reporting purposes.
During the year ended December 31, 2022, the fund reclassified $8,000 from total accumulated loss to capital paid in on shares of beneficial interest to align financial reporting with tax reporting.
As of December 31, 2022, the tax basis components of distributable earnings, unrealized appreciation (depreciation) and cost of investments were as follows (dollars in thousands):
| Distributions in excess of ordinary income | | $ | 125,989 | |
| Late year ordinary loss deferral1 | | | (130,971 | ) |
| Capital loss carryforward2 | | | (1,330,263 | ) |
| Gross unrealized appreciation on investments | | | 107,676 | |
| Gross unrealized depreciation on investments | | | (1,583,604 | ) |
| Net unrealized depreciation on investments | | | (1,475,928 | ) |
| Cost of investments | | | 11,030,397 | |
| 1 | This deferral is considered incurred in the subsequent year. |
| 2 | The capital loss carryforward will be used to offset any capital gains realized by the fund in future years. The fund will not make distributions from capital gains while a capital loss carryforward remains. |
For the year ended December 31, 2022, the fund’s distributions exceeded total taxable income and net realized gains or losses resulting in a return of capital for tax purposes. Distributions paid were characterized for tax purposes as follows (dollars in thousands):
| | | Year ended December 31, 2022 | | | Year ended December 31, 2021 | |
| Share class | | Ordinary
income | | | Return of
capital | | | Total
distributions
paid | | | Ordinary
income | | | Long-term
capital gains | | | Total
distributions
paid | |
| Class A | | $ | 39,667 | | | $ | 42,742 | | | $ | 82,409 | | | $ | 112,101 | | | $ | 34,715 | | | $ | 146,816 | |
| Class C | | | 336 | | | | 368 | | | | 704 | | | | 1,173 | | | | 608 | | | | 1,781 | |
| Class T | | | — | 3 | | | — | 3 | | | — | 3 | | | — | 3 | | | — | 3 | | | — | 3 |
| Class F-1 | | | 979 | | | | 1,060 | | | | 2,039 | | | | 2,983 | | | | 968 | | | | 3,951 | |
| Class F-2 | | | 10,765 | | | | 11,284 | | | | 22,049 | | | | 29,166 | | | | 7,543 | | | | 36,709 | |
| Class F-3 | | | 12,525 | | | | 14,033 | | | | 26,558 | | | | 30,276 | | | | 7,371 | | | | 37,647 | |
| Class 529-A | | | 2,106 | | | | 2,292 | | | | 4,398 | | | | 5,951 | | | | 1,895 | | | | 7,846 | |
| Class 529-C | | | 43 | | | | 45 | | | | 88 | | | | 160 | | | | 93 | | | | 253 | |
| Class 529-E | | | 78 | | | | 85 | | | | 163 | | | | 223 | | | | 78 | | | | 301 | |
| Class 529-T | | | — | 3 | | | — | 3 | | | — | 3 | | | — | 3 | | | — | 3 | | | — | 3 |
| Class 529-F-1 | | | — | 3 | | | — | 3 | | | — | 3 | | | — | 3 | | | — | 3 | | | — | 3 |
| Class 529-F-2 | | | 375 | | | | 413 | | | | 788 | | | | 955 | | | | 258 | | | | 1,213 | |
| Class 529-F-3 | | | — | 3 | | | — | 3 | | | — | 3 | | | — | 3 | | | — | 3 | | | — | 3 |
| Class R-1 | | | 35 | | | | 40 | | | | 75 | | | | 87 | | | | 42 | | | | 129 | |
| Class R-2 | | | 443 | | | | 511 | | | | 954 | | | | 1,280 | | | | 603 | | | | 1,883 | |
| Class R-2E | | | 41 | | | | 46 | | | | 87 | | | | 113 | | | | 42 | | | | 155 | |
| Class R-3 | | | 806 | | | | 904 | | | | 1,710 | | | | 2,330 | | | | 818 | | | | 3,148 | |
| Class R-4 | | | 707 | | | | 774 | | | | 1,481 | | | | 1,911 | | | | 558 | | | | 2,469 | |
| Class R-5E | | | 238 | | | | 271 | | | | 509 | | | | 564 | | | | 149 | | | | 713 | |
| Class R-5 | | | 336 | | | | 395 | | | | 731 | | | | 1,289 | | | | 332 | | | | 1,621 | |
| Class R-6 | | | 55,207 | | | | 50,726 | | | | 105,933 | | | | 151,548 | | | | 36,286 | | | | 187,834 | |
| Total | | $ | 124,687 | | | $ | 125,989 | | | $ | 250,676 | | | $ | 342,110 | | | $ | 92,359 | | | $ | 434,469 | |
| 3 | Amount less than one thousand. |
| Capital World Bond Fund | 53 |
7. Fees and transactions with related parties
CRMC, the fund’s investment adviser, is the parent company of American Funds Distributors®, Inc. (“AFD”), the principal underwriter of the fund’s shares, and American Funds Service Company® (“AFS”), the fund’s transfer agent. CRMC, AFD and AFS are considered related parties to the fund.
Investment advisory services — The fund has an investment advisory and service agreement with CRMC that provides for monthly fees accrued daily. At the beginning of the year, these fees were based on a series of decreasing annual rates beginning with 0.570% on the first $1 billion of daily net assets and decreasing to 0.360% on such assets in excess of $15 billion. On March 9, 2022, the fund’s board of trustees approved an amended investment advisory and service agreement effective May 1, 2022, replacing the prior series of rates and breakpoints with a new series of decreasing annual rates beginning with 0.431% on the first $15 billion of daily net assets and decreasing to 0.360% on such assets in excess of $15 billion. For the year ended December 31, 2022, the investment advisory services fees were $52,303,000, which were equivalent to an annualized rate of 0.431% of average daily net assets.
Class-specific fees and expenses — Expenses that are specific to individual share classes are accrued directly to the respective share class. The principal class-specific fees and expenses are further described below:
Distribution services — The fund has plans of distribution for all share classes, except Class F-2, F-3, 529-F-2, 529-F-3, R-5E, R-5 and R-6 shares. Under the plans, the board of trustees approves certain categories of expenses that are used to finance activities primarily intended to sell fund shares and service existing accounts. The plans provide for payments, based on an annualized percentage of average daily net assets, ranging from 0.30% to 1.00% as noted in this section. In some cases, the board of trustees has limited the amounts that may be paid to less than the maximum allowed by the plans. All share classes with a plan may use up to 0.25% of average daily net assets to pay service fees, or to compensate AFD for paying service fees, to firms that have entered into agreements with AFD to provide certain shareholder services. The remaining amounts available to be paid under each plan are paid to dealers to compensate them for their sales activities.
| | Share class | | Currently approved limits | | Plan limits |
| | Class A | | | 0.30 | % | | | 0.30 | % |
| | Class 529-A | | | 0.30 | | | | 0.50 | |
| | Classes C, 529-C and R-1 | | | 1.00 | | | | 1.00 | |
| | Class R-2 | | | 0.75 | | | | 1.00 | |
| | Class R-2E | | | 0.60 | | | | 0.85 | |
| | Classes 529-E and R-3 | | | 0.50 | | | | 0.75 | |
| | Classes T, F-1, 529-T, 529-F-1 and R-4 | | | 0.25 | | | | 0.50 | |
For Class A and 529-A shares, distribution-related expenses include the reimbursement of dealer and wholesaler commissions paid by AFD for certain shares sold without a sales charge. These share classes reimburse AFD for amounts billed within the prior 15 months but only to the extent that the overall annual expense limits are not exceeded. As of December 31, 2022, there were no unreimbursed expenses subject to reimbursement for Class A or 529-A shares.
Transfer agent services — The fund has a shareholder services agreement with AFS under which the fund compensates AFS for providing transfer agent services to each of the fund’s share classes. These services include recordkeeping, shareholder communications and transaction processing. In addition, the fund reimburses AFS for amounts paid to third parties for performing transfer agent services on behalf of fund shareholders.
Administrative services — The fund has an administrative services agreement with CRMC under which the fund compensates CRMC for providing administrative services to all share classes. Administrative services are provided by CRMC and its affiliates to help assist third parties providing non-distribution services to fund shareholders. These services include providing in-depth information on the fund and market developments that impact fund investments. Administrative services also include, but are not limited to, coordinating, monitoring and overseeing third parties that provide services to fund shareholders. The agreement provides the fund the ability to charge an administrative services fee at the annual rate of 0.05% of the average daily net assets attributable to each share class of the fund. Currently the fund pays CRMC an administrative services fee at the annual rate of 0.03% of the average daily net assets attributable to each share class of the fund for CRMC’s provision of administrative services.
| 54 | Capital World Bond Fund |
529 plan services — Each 529 share class is subject to service fees to compensate the Virginia College Savings Plan (“Virginia529”) for its oversight and administration of the CollegeAmerica 529 college savings plan. The fees are based on the combined net assets invested in Class 529 and ABLE shares of the American Funds. Class ABLE shares are offered on other American Funds by Virginia529 through ABLEAmerica®, a tax-advantaged savings program for individuals with disabilities. Virginia529 is not considered a related party to the fund.
The quarterly fees are based on a series of decreasing annual rates beginning with 0.09% on the first $20 billion of the combined net assets invested in the American Funds and decreasing to 0.03% on such assets in excess of $75 billion. The fees for any given calendar quarter are accrued and calculated on the basis of the average net assets of Class 529 and ABLE shares of the American Funds for the last month of the prior calendar quarter. For the year ended December 31, 2022, the 529 plan services fees were $173,000, which were equivalent to 0.058% of the average daily net assets of each 529 share class.
For the year ended December 31, 2022, class-specific expenses under the agreements were as follows (dollars in thousands):
| | Share class | | Distribution
services | | | Transfer agent
services | | | Administrative
services | | | 529 plan
services | |
| | Class A | | | $11,093 | | | | $9,825 | | | | $1,348 | | | | Not applicable | |
| | Class C | | | 639 | | | | 140 | | | | 19 | | | | Not applicable | |
| | Class T | | | — | | | | — | * | | | — | * | | | Not applicable | |
| | Class F-1 | | | 273 | | | | 276 | | | | 34 | | | | Not applicable | |
| | Class F-2 | | | Not applicable | | | | 1,210 | | | | 305 | | | | Not applicable | |
| | Class F-3 | | | Not applicable | | | | 8 | | | | 330 | | | | Not applicable | |
| | Class 529-A | | | 566 | | | | 495 | | | | 73 | | | | $141 | |
| | Class 529-C | | | 88 | | | | 18 | | | | 3 | | | | 5 | |
| | Class 529-E | | | 49 | | | | 8 | | | | 3 | | | | 6 | |
| | Class 529-T | | | — | | | | — | * | | | — | * | | | — | * |
| | Class 529-F-1 | | | — | | | | — | * | | | — | * | | | — | * |
| | Class 529-F-2 | | | Not applicable | | | | 28 | | | | 11 | | | | 21 | |
| | Class 529-F-3 | | | Not applicable | | | | — | * | | | — | * | | | — | * |
| | Class R-1 | | | 58 | | | | 6 | | | | 2 | | | | Not applicable | |
| | Class R-2 | | | 576 | | | | 282 | | | | 23 | | | | Not applicable | |
| | Class R-2E | | | 35 | | | | 13 | | | | 2 | | | | Not applicable | |
| | Class R-3 | | | 516 | | | | 164 | | | | 31 | | | | Not applicable | |
| | Class R-4 | | | 188 | | | | 79 | | | | 22 | | | | Not applicable | |
| | Class R-5E | | | Not applicable | | | | 36 | | | | 7 | | | | Not applicable | |
| | Class R-5 | | | Not applicable | | | | 20 | | | | 10 | | | | Not applicable | |
| | Class R-6 | | | Not applicable | | | | 32 | | | | 1,422 | | | | Not applicable | |
| | Total class-specific expenses | | | $14,081 | | | | $12,640 | | | | $3,645 | | | | $173 | |
| | * | Amount less than one thousand. |
Trustees deferred compensation — Trustees who are unaffiliated with CRMC may elect to defer the cash payment of part or all of their compensation. These deferred amounts, which remain as liabilities of the fund, are treated as if invested in shares of the fund or other American Funds. These amounts represent general, unsecured liabilities of the fund and vary according to the total returns of the selected funds. Trustees’ compensation of $23,000 in the fund’s statement of operations reflects $49,000 in current fees (either paid in cash or deferred) and a net decrease of $26,000 in the value of the deferred amounts.
Affiliated officers and trustees — Officers and certain trustees of the fund are or may be considered to be affiliated with CRMC, AFD and AFS. No affiliated officers or trustees received any compensation directly from the fund.
Investments in CCBF and CCF — The fund holds shares of CCBF, a corporate bond fund, and CCF, an institutional prime money market fund, which are both managed by CRMC. CCBF seeks to provide maximum total return consistent with capital preservation and prudent risk management by investing primarily in corporate debt instruments. CCBF is used as an investment vehicle for the fund’s corporate bond investments. CCF invests in high-quality, short-term money market instruments. CCF is used as the primary investment vehicle for the fund’s short-term instruments. Both CCBF and CCF shares are only available for purchase by CRMC, its affiliates, and other funds managed by CRMC or its affiliates, and are not available to the public. CRMC does not receive an investment advisory services fee from either CCBF or CCF.
| Capital World Bond Fund | 55 |
Security transactions with related funds — The fund purchased investment securities from, and sold investment securities to, other funds managed by CRMC (or funds managed by certain affiliates of CRMC) under procedures adopted by the fund’s board of trustees. The funds involved in such transactions are considered related by virtue of having a common investment adviser (or affiliated investment advisers), common trustees and/or common officers. Each transaction was executed at the current market price of the security and no brokerage commissions or fees were paid in accordance with Rule 17a-7 of the 1940 Act. During the year ended December 31, 2022, the fund engaged in such purchase and sale transactions with related funds in the amounts of $21,617,000 and $330,388,000, respectively, which generated $39,066,000 of net realized losses from such sales.
Interfund lending — Pursuant to an exemptive order issued by the SEC, the fund, along with other CRMC-managed funds (or funds managed by certain affiliates of CRMC), may participate in an interfund lending program. The program provides an alternate credit facility that permits the funds to lend or borrow cash for temporary purposes directly to or from one another, subject to the conditions of the exemptive order. The fund did not lend or borrow cash through the interfund lending program at any time during the year ended December 31, 2022.
8. Indemnifications
The fund’s organizational documents provide board members and officers with indemnification against certain liabilities or expenses in connection with the performance of their duties to the fund. In the normal course of business, the fund may also enter into contracts that provide general indemnifications. The fund’s maximum exposure under these arrangements is unknown since it is dependent on future claims that may be made against the fund. The risk of material loss from such claims is considered remote. Insurance policies are also available to the fund’s board members and officers.
9. Capital share transactions
Capital share transactions in the fund were as follows (dollars and shares in thousands):
| | | Sales* | | | Reinvestments of
distributions | | | Repurchases* | | | Net (decrease)
increase | |
| Share class | | Amount | | | Shares | | | Amount | | | Shares | | | Amount | | | Shares | | | Amount | | | Shares | |
| | | | | | | | |
| Year ended December 31, 2022 | | | | | | | |
| | | | | | | | |
| Class A | | $ | 225,620 | | | | 12,928 | | | $ | 81,576 | | | | 4,885 | | | $ | (997,297 | ) | | | (58,641 | ) | | $ | (690,101 | ) | | | (40,828 | ) |
| Class C | | | 7,030 | | | | 407 | | | | 702 | | | | 43 | | | | (27,532 | ) | | | (1,617 | ) | | | (19,800 | ) | | | (1,167 | ) |
| Class T | | | — | | | | — | | | | — | | | | — | | | | — | | | | — | | | | — | | | | — | |
| Class F-1 | | | 4,614 | | | | 269 | | | | 1,990 | | | | 120 | | | | (26,085 | ) | | | (1,531 | ) | | | (19,481 | ) | | | (1,142 | ) |
| Class F-2 | | | 227,798 | | | | 13,156 | | | | 21,755 | | | | 1,303 | | | | (461,710 | ) | | | (27,388 | ) | | | (212,157 | ) | | | (12,929 | ) |
| Class F-3 | | | 744,424 | | | | 46,269 | | | | 26,236 | | | | 1,576 | | | | (497,316 | ) | | | (28,882 | ) | | | 273,344 | | | | 18,963 | |
| Class 529-A | | | 18,780 | | | | 1,085 | | | | 4,396 | | | | 262 | | | | (48,885 | ) | | | (2,838 | ) | | | (25,709 | ) | | | (1,491 | ) |
| Class 529-C | | | 1,314 | | | | 76 | | | | 88 | | | | 5 | | | | (4,603 | ) | | | (270 | ) | | | (3,201 | ) | | | (189 | ) |
| Class 529-E | | | 591 | | | | 34 | | | | 163 | | | | 10 | | | | (1,831 | ) | | | (108 | ) | | | (1,077 | ) | | | (64 | ) |
| Class 529-T | | | — | | | | — | | | | — | † | | | — | † | | | — | | | | — | | | | — | † | | | — | † |
| Class 529-F-1 | | | — | | | | — | | | | — | † | | | — | † | | | — | | | | — | | | | — | † | | | — | † |
| Class 529-F-2 | | | 6,002 | | | | 349 | | | | 789 | | | | 48 | | | | (8,364 | ) | | | (490 | ) | | | (1,573 | ) | | | (93 | ) |
| Class 529-F-3 | | | — | | | | — | | | | — | † | | | 1 | | | | — | | | | — | | | | — | † | | | 1 | |
| Class R-1 | | | 1,167 | | | | 67 | | | | 74 | | | | 4 | | | | (826 | ) | | | (49 | ) | | | 415 | | | | 22 | |
| Class R-2 | | | 13,344 | | | | 781 | | | | 953 | | | | 58 | | | | (20,538 | ) | | | (1,193 | ) | | | (6,241 | ) | | | (354 | ) |
| Class R-2E | | | 1,203 | | | | 69 | | | | 88 | | | | 5 | | | | (2,080 | ) | | | (120 | ) | | | (789 | ) | | | (46 | ) |
| Class R-3 | | | 20,060 | | | | 1,158 | | | | 1,708 | | | | 102 | | | | (32,815 | ) | | | (1,883 | ) | | | (11,047 | ) | | | (623 | ) |
| Class R-4 | | | 19,417 | | | | 1,115 | | | | 1,481 | | | | 89 | | | | (27,185 | ) | | | (1,559 | ) | | | (6,287 | ) | | | (355 | ) |
| Class R-5E | | | 7,315 | | | | 432 | | | | 508 | | | | 31 | | | | (4,923 | ) | | | (292 | ) | | | 2,900 | | | | 171 | |
| Class R-5 | | | 8,764 | | | | 510 | | | | 730 | | | | 44 | | | | (25,559 | ) | | | (1,350 | ) | | | (16,065 | ) | | | (796 | ) |
| Class R-6 | | | 762,946 | | | | 42,524 | | | | 105,934 | | | | 6,273 | | | | (3,589,471 | ) | | | (216,303 | ) | | | (2,720,591 | ) | | | (167,506 | ) |
| Total net increase (decrease) | | $ | 2,070,389 | | | | 121,229 | | | $ | 249,171 | | | | 14,859 | | | $ | (5,777,020 | ) | | | (344,514 | ) | | $ | (3,457,460 | ) | | | (208,426 | ) |
Refer to the end of the table for footnotes.
| 56 | Capital World Bond Fund |
| | | Sales* | | | Reinvestments of
distributions | | | Repurchases* | | | Net increase
(decrease) | |
| Share class | | Amount | | | Shares | | | Amount | | | Shares | | | Amount | | | Shares | | | Amount | | | Shares | |
| | | | | | | | | | | | | | | | | | | | | | | | | |
| Year ended December 31, 2021 | | | | | | | | | | | | | | | | | |
| | | | | | | | | | | | | | | | | | |
| Class A | | $ | 683,215 | | | | 32,923 | | | $ | 145,411 | | | | 7,137 | | | $ | (784,033 | ) | | | (37,996 | ) | | $ | 44,593 | | | | 2,064 | |
| Class C | | | 13,841 | | | | 681 | | | | 1,775 | | | | 89 | | | | (38,008 | ) | | | (1,869 | ) | | | (22,392 | ) | | | (1,099 | ) |
| Class T | | | — | | | | — | | | | — | | | | — | | | | — | | | | — | | | | — | | | | — | |
| Class F-1 | | | 10,241 | | | | 495 | | | | 3,862 | | | | 190 | | | | (46,934 | ) | | | (2,267 | ) | | | (32,831 | ) | | | (1,582 | ) |
| Class F-2 | | | 454,055 | | | | 21,946 | | | | 36,211 | | | | 1,781 | | | | (299,343 | ) | | | (14,576 | ) | | | 190,923 | | | | 9,151 | |
| Class F-3 | | | 425,194 | | | | 20,563 | | | | 36,996 | | | | 1,818 | | | | (223,580 | ) | | | (10,819 | ) | | | 238,610 | | | | 11,562 | |
| Class 529-A | | | 36,640 | | | | 1,761 | | | | 7,843 | | | | 384 | | | | (58,554 | ) | | | (2,820 | ) | | | (14,071 | ) | | | (675 | ) |
| Class 529-C | | | 2,886 | | | | 141 | | | | 253 | | | | 12 | | | | (8,095 | ) | | | (395 | ) | | | (4,956 | ) | | | (242 | ) |
| Class 529-E | | | 1,211 | | | | 59 | | | | 301 | | | | 15 | | | | (2,643 | ) | | | (128 | ) | | | (1,131 | ) | | | (54 | ) |
| Class 529-T | | | — | | | | — | | | | — | † | | | — | † | | | — | | | | — | | | | — | † | | | — | † |
| Class 529-F-1 | | | — | | | | — | | | | — | † | | | — | † | | | — | | | | — | | | | — | † | | | — | † |
| Class 529-F-2 | | | 9,273 | | | | 448 | | | | 1,212 | | | | 59 | | | | (7,847 | ) | | | (380 | ) | | | 2,638 | | | | 127 | |
| Class 529-F-3 | | | — | | | | — | | | | — | † | | | — | † | | | — | | | | — | | | | — | † | | | — | † |
| Class R-1 | | | 1,728 | | | | 84 | | | | 129 | | | | 6 | | | | (2,419 | ) | | | (118 | ) | | | (562 | ) | | | (28 | ) |
| Class R-2 | | | 19,248 | | | | 941 | | | | 1,882 | | | | 94 | | | | (26,574 | ) | | | (1,299 | ) | | | (5,444 | ) | | | (264 | ) |
| Class R-2E | | | 2,363 | | | | 115 | | | | 155 | | | | 7 | | | | (2,330 | ) | | | (112 | ) | | | 188 | | | | 10 | |
| Class R-3 | | | 30,480 | | | | 1,470 | | | | 3,146 | | | | 155 | | | | (41,684 | ) | | | (2,015 | ) | | | (8,058 | ) | | | (390 | ) |
| Class R-4 | | | 27,877 | | | | 1,348 | | | | 2,468 | | | | 121 | | | | (27,221 | ) | | | (1,316 | ) | | | 3,124 | | | | 153 | |
| Class R-5E | | | 7,537 | | | | 364 | | | | 713 | | | | 35 | | | | (5,669 | ) | | | (273 | ) | | | 2,581 | | | | 126 | |
| Class R-5 | | | 13,118 | | | | 630 | | | | 1,621 | | | | 80 | | | | (11,608 | ) | | | (559 | ) | | | 3,131 | | | | 151 | |
| Class R-6 | | | 1,947,355 | | | | 94,091 | | | | 187,833 | | | | 9,225 | | | | (222,619 | ) | | | (10,751 | ) | | | 1,912,569 | | | | 92,565 | |
| Total net increase (decrease) | | $ | 3,686,262 | | | | 178,060 | | | $ | 431,811 | | | | 21,208 | | | $ | (1,809,161 | ) | | | (87,693 | ) | | $ | 2,308,912 | | | | 111,575 | |
| * | Includes exchanges between share classes of the fund. |
| † | Amount less than one thousand. |
10. Investment transactions
The fund engaged in purchases and sales of investment securities, excluding short-term securities and U.S. government obligations, if any, of $14,362,988,000 and $17,339,240,000, respectively, during the year ended December 31, 2022.
| Capital World Bond Fund | 57 |
Financial highlights
| | | | | | (Loss) income from
investment operations1 | | | Dividends, distributions and return of capital | | | | | | | | | | | | | | | | | | | |
| Year ended | | Net asset
value,
beginning
of year | | | Net
investment
income | | | Net (losses)
gains on
securities
(both
realized and
unrealized) | | | Total from
investment
operations | | | Dividends
(from net
investment
income) | | | Distributions
(from capital
gains) | | | Return of
capital | | | Total
dividends,
distributions
and return
of capital | | | Net assets
value, end
of year | | | Total return2,3 | | | Net assets,
end of year
(in millions) | | | Ratio of
expenses to
average net
assets before
reimburse-
ments4 | | | Ratio of
expenses to
average net
assets after
reimburse-
ments3,4 | | | Ratio of
net income
to average
net assets3 | |
| Class A: | | | | | | | | | | | | | | | | | | | | | | | | | | | | | | | | | | | | | | | | | | | | | | | | | | | | | | | | |
| 12/31/2022 | | $ | 19.92 | | | $ | .31 | | | $ | (3.79 | ) | | $ | (3.48 | ) | | $ | (.15 | ) | | $ | — | | | $ | (.17 | ) | | $ | (.32 | ) | | $ | 16.12 | | | | (17.51 | )% | | $ | 3,862 | | | | .95 | % | | | .95 | % | | | 1.83 | % |
| 12/31/2021 | | | 21.55 | | | | .31 | | | | (1.42 | ) | | | (1.11 | ) | | | (.40 | ) | | | (.12 | ) | | | — | | | | (.52 | ) | | | 19.92 | | | | (5.17 | ) | | | 5,586 | | | | .92 | | | | .92 | | | | 1.50 | |
| 12/31/2020 | | | 20.26 | | | | .34 | | | | 1.64 | | | | 1.98 | | | | (.40 | ) | | | (.29 | ) | | | — | | | | (.69 | ) | | | 21.55 | | | | 9.90 | | | | 5,999 | | | | .93 | | | | .93 | | | | 1.62 | |
| 12/31/2019 | | | 19.25 | | | | .44 | | | | 1.03 | | | | 1.47 | | | | (.39 | ) | | | (.07 | ) | | | — | | | | (.46 | ) | | | 20.26 | | | | 7.66 | | | | 5,669 | | | | .94 | | | | .94 | | | | 2.22 | |
| 12/31/2018 | | | 19.97 | | | | .44 | | | | (.74 | ) | | | (.30 | ) | | | (.42 | ) | | | — | | | | — | | | | (.42 | ) | | | 19.25 | | | | (1.53 | ) | | | 5,499 | | | | .94 | | | | .94 | | | | 2.25 | |
| Class C: | | | | | | | | | | | | | | | | | | | | | | | | | | | | | | | | | | | | | | | | | | | | | | | | | | | | | | | | |
| 12/31/2022 | | | 19.57 | | | | .18 | | | | (3.73 | ) | | | (3.55 | ) | | | (.09 | ) | | | — | | | | (.10 | ) | | | (.19 | ) | | | 15.83 | | | | (18.16 | ) | | | 52 | | | | 1.69 | | | | 1.69 | | | | 1.08 | |
| 12/31/2021 | | | 21.17 | | | | .16 | | | | (1.39 | ) | | | (1.23 | ) | | | (.25 | ) | | | (.12 | ) | | | — | | | | (.37 | ) | | | 19.57 | | | | (5.82 | ) | | | 87 | | | | 1.65 | | | | 1.65 | | | | .77 | |
| 12/31/2020 | | | 19.91 | | | | .18 | | | | 1.61 | | | | 1.79 | | | | (.24 | ) | | | (.29 | ) | | | — | | | | (.53 | ) | | | 21.17 | | | | 9.09 | | | | 118 | | | | 1.67 | | | | 1.67 | | | | .90 | |
| 12/31/2019 | | | 18.92 | | | | .29 | | | | 1.01 | | | | 1.30 | | | | (.24 | ) | | | (.07 | ) | | | — | | | | (.31 | ) | | | 19.91 | | | | 6.87 | | | | 178 | | | | 1.69 | | | | 1.69 | | | | 1.47 | |
| 12/31/2018 | | | 19.63 | | | | .28 | | | | (.73 | ) | | | (.45 | ) | | | (.26 | ) | | | — | | | | — | | | | (.26 | ) | | | 18.92 | | | | (2.30 | ) | | | 210 | | | | 1.72 | | | | 1.72 | | | | 1.46 | |
| Class T: | | | | | | | | | | | | | | | | | | | | | | | | | | | | | | | | | | | | | | | | | | | | | | | | | | | | | | | | |
| 12/31/2022 | | | 19.90 | | | | .35 | | | | (3.80 | ) | | | (3.45 | ) | | | (.17 | ) | | | — | | | | (.19 | ) | | | (.36 | ) | | | 16.09 | | | | (17.35 | )5 | | | — | 6 | | | .68 | 5 | | | .68 | 5 | | | 2.06 | 5 |
| 12/31/2021 | | | 21.54 | | | | .35 | | | | (1.42 | ) | | | (1.07 | ) | | | (.45 | ) | | | (.12 | ) | | | — | | | | (.57 | ) | | | 19.90 | | | | (4.98 | )5 | | | — | 6 | | | .68 | 5 | | | .68 | 5 | | | 1.71 | 5 |
| 12/31/2020 | | | 20.26 | | | | .38 | | | | 1.64 | | | | 2.02 | | | | (.45 | ) | | | (.29 | ) | | | — | | | | (.74 | ) | | | 21.54 | | | | 10.13 | 5 | | | — | 6 | | | .68 | 5 | | | .68 | 5 | | | 1.83 | 5 |
| 12/31/2019 | | | 19.25 | | | | .49 | | | | 1.03 | | | | 1.52 | | | | (.44 | ) | | | (.07 | ) | | | — | | | | (.51 | ) | | | 20.26 | | | | 7.93 | 5 | | | — | 6 | | | .69 | 5 | | | .69 | 5 | | | 2.44 | 5 |
| 12/31/2018 | | | 19.97 | | | | .49 | | | | (.75 | ) | | | (.26 | ) | | | (.46 | ) | | | — | | | | — | | | | (.46 | ) | | | 19.25 | | | | (1.32 | )5 | | | — | 6 | | | .72 | 5 | | | .72 | 5 | | | 2.48 | 5 |
| Class F-1: | | | | | | | | | | | | | | | | | | | | | | | | | | | | | | | | | | | | | | | | | | | | | | | | | | | | | | | | |
| 12/31/2022 | | | 19.87 | | | | .31 | | | | (3.78 | ) | | | (3.47 | ) | | | (.15 | ) | | | — | | | | (.17 | ) | | | (.32 | ) | | | 16.08 | | | | (17.53 | ) | | | 96 | | | | .97 | | | | .97 | | | | 1.80 | |
| 12/31/2021 | | | 21.50 | | | | .30 | | | | (1.42 | ) | | | (1.12 | ) | | | (.39 | ) | | | (.12 | ) | | | — | | | | (.51 | ) | | | 19.87 | | | | (5.20 | ) | | | 141 | | | | .94 | | | | .94 | | | | 1.48 | |
| 12/31/2020 | | | 20.21 | | | | .33 | | | | 1.65 | | | | 1.98 | | | | (.40 | ) | | | (.29 | ) | | | — | | | | (.69 | ) | | | 21.50 | | | | 9.93 | | | | 187 | | | | .93 | | | | .93 | | | | 1.62 | |
| 12/31/2019 | | | 19.20 | | | | .45 | | | | 1.02 | | | | 1.47 | | | | (.39 | ) | | | (.07 | ) | | | — | | | | (.46 | ) | | | 20.21 | | | | 7.68 | | | | 209 | | | | .93 | | | | .93 | | | | 2.24 | |
| 12/31/2018 | | | 19.92 | | | | .44 | | | | (.74 | ) | | | (.30 | ) | | | (.42 | ) | | | — | | | | — | | | | (.42 | ) | | | 19.20 | | | | (1.53 | ) | | | 238 | | | | .93 | | | | .93 | | | | 2.25 | |
| Class F-2: | | | | | | | | | | | | | | | | | | | | | | | | | | | | | | | | | | | | | | | | | | | | | | | | | | | | | | | | |
| 12/31/2022 | | | 19.88 | | | | .37 | | | | (3.78 | ) | | | (3.41 | ) | | | (.18 | ) | | | — | | | | (.20 | ) | | | (.38 | ) | | | 16.09 | | | | (17.20 | ) | | | 823 | | | | .60 | | | | .60 | | | | 2.17 | |
| 12/31/2021 | | | 21.51 | | | | .38 | | | | (1.42 | ) | | | (1.04 | ) | | | (.47 | ) | | | (.12 | ) | | | — | | | | (.59 | ) | | | 19.88 | | | | (4.85 | ) | | | 1,274 | | | | .59 | | | | .59 | | | | 1.84 | |
| 12/31/2020 | | | 20.23 | | | | .40 | | | | 1.64 | | | | 2.04 | | | | (.47 | ) | | | (.29 | ) | | | — | | | | (.76 | ) | | | 21.51 | | | | 10.25 | | | | 1,182 | | | | .60 | | | | .60 | | | | 1.95 | |
| 12/31/2019 | | | 19.22 | | | | .51 | | | | 1.02 | | | | 1.53 | | | | (.45 | ) | | | (.07 | ) | | | — | | | | (.52 | ) | | | 20.23 | | | | 8.00 | | | | 932 | | | | .63 | | | | .63 | | | | 2.57 | |
| 12/31/2018 | | | 19.94 | | | | .51 | | | | (.75 | ) | | | (.24 | ) | | | (.48 | ) | | | — | | | | — | | | | (.48 | ) | | | 19.22 | | | | (1.19 | ) | | | 1,217 | | | | .60 | | | | .60 | | | | 2.59 | |
| Class F-3: | | | | | | | | | | | | | | | | | | | | | | | | | | | | | | | | | | | | | | | | | | | | | | | | | | | | | | | | |
| 12/31/2022 | | | 19.90 | | | | .40 | | | | (3.80 | ) | | | (3.40 | ) | | | (.19 | ) | | | — | | | | (.21 | ) | | | (.40 | ) | | | 16.10 | | | | (17.13 | ) | | | 1,363 | | | | .48 | | | | .48 | | | | 2.31 | |
| 12/31/2021 | | | 21.53 | | | | .40 | | | | (1.42 | ) | | | (1.02 | ) | | | (.49 | ) | | | (.12 | ) | | | — | | | | (.61 | ) | | | 19.90 | | | | (4.74 | ) | | | 1,307 | | | | .48 | | | | .48 | | | | 1.95 | |
| 12/31/2020 | | | 20.24 | | | | .42 | | | | 1.65 | | | | 2.07 | | | | (.49 | ) | | | (.29 | ) | | | — | | | | (.78 | ) | | | 21.53 | | | | 10.39 | | | | 1,166 | | | | .50 | | | | .50 | | | | 2.07 | |
| 12/31/2019 | | | 19.23 | | | | .53 | | | | 1.03 | | | | 1.56 | | | | (.48 | ) | | | (.07 | ) | | | — | | | | (.55 | ) | | | 20.24 | | | | 8.12 | | | | 2,246 | | | | .52 | | | | .52 | | | | 2.64 | |
| 12/31/2018 | | | 19.95 | | | | .52 | | | | (.75 | ) | | | (.23 | ) | | | (.49 | ) | | | — | | | | — | | | | (.49 | ) | | | 19.23 | | | | (1.13 | ) | | | 2,037 | | | | .54 | | | | .54 | | | | 2.65 | |
| Class 529-A: | | | | | | | | | | | | | | | | | | | | | | | | | | | | | | | | | | | | | | | | | | | | | | | | | | | | | | | | |
| 12/31/2022 | | | 19.98 | | | | .31 | | | | (3.80 | ) | | | (3.49 | ) | | | (.15 | ) | | | — | | | | (.17 | ) | | | (.32 | ) | | | 16.17 | | | | (17.53 | ) | | | 216 | | | | .98 | | | | .98 | | | | 1.80 | |
| 12/31/2021 | | | 21.61 | | | | .31 | | | | (1.42 | ) | | | (1.11 | ) | | | (.40 | ) | | | (.12 | ) | | | — | | | | (.52 | ) | | | 19.98 | | | | (5.18 | ) | | | 297 | | | | .94 | | | | .94 | | | | 1.48 | |
| 12/31/2020 | | | 20.32 | | | | .33 | | | | 1.64 | | | | 1.97 | | | | (.39 | ) | | | (.29 | ) | | | — | | | | (.68 | ) | | | 21.61 | | | | 9.84 | | | | 335 | | | | .96 | | | | .96 | | | | 1.59 | |
| 12/31/2019 | | | 19.30 | | | | .44 | | | | 1.03 | | | | 1.47 | | | | (.38 | ) | | | (.07 | ) | | | — | | | | (.45 | ) | | | 20.32 | | | | 7.64 | | | | 299 | | | | .99 | | | | .99 | | | | 2.17 | |
| 12/31/2018 | | | 20.02 | | | | .43 | | | | (.75 | ) | | | (.32 | ) | | | (.40 | ) | | | — | | | | — | | | | (.40 | ) | | | 19.30 | | | | (1.59 | ) | | | 292 | | | | 1.01 | | | | 1.01 | | | | 2.18 | |
Refer to the end of the table for footnotes.
| 58 | Capital World Bond Fund |
Financial highlights (continued)
| | | | | | (Loss) income from
investment operations1 | | | Dividends, distributions and return of capital | | | | | | | | | | | | | | | | | | | |
| Year ended | | Net asset
value,
beginning
of year | | | Net
investment
income | | | Net (losses)
gains on
securities
(both
realized and
unrealized) | | | Total from
investment
operations | | | Dividends
(from net
investment
income) | | | Distributions
(from capital
gains) | | | Return of
capital | | | Total
dividends,
distributions
and return
of capital | | | Net assets
value, end
of year | | | Total return2,3 | | | Net assets,
end of year
(in millions) | | | Ratio of
expenses to
average net
assets before
reimburse-
ments4 | | | Ratio of
expenses to
average net
assets after
reimburse-
ments3,4 | | | Ratio of
net income
to average
net assets3 | |
| Class 529-C: | | | | | | | | | | | | | | | | | | | | | | | | | | | | | | | | | | | | | | | | | | | | | | | | | | | | | | | | |
| 12/31/2022 | | $ | 19.75 | | | $ | .17 | | | $ | (3.76 | ) | | $ | (3.59 | ) | | $ | (.08 | ) | | $ | — | | | $ | (.10 | ) | | $ | (.18 | ) | | $ | 15.98 | | | | (18.21 | )% | | $ | 7 | | | | 1.74 | % | | | 1.74 | % | | | 1.02 | % |
| 12/31/2021 | | | 21.36 | | | | .15 | | | | (1.40 | ) | | | (1.25 | ) | | | (.24 | ) | | | (.12 | ) | | | — | | | | (.36 | ) | | | 19.75 | | | | (5.88 | ) | | | 12 | | | | 1.69 | | | | 1.69 | | | | .73 | |
| 12/31/2020 | | | 20.07 | | | | .17 | | | | 1.63 | | | | 1.80 | | | | (.22 | ) | | | (.29 | ) | | | — | | | | (.51 | ) | | | 21.36 | | | | 9.04 | | | | 18 | | | | 1.71 | | | | 1.71 | | | | .86 | |
| 12/31/2019 | | | 19.07 | | | | .28 | | | | 1.02 | | | | 1.30 | | | | (.23 | ) | | | (.07 | ) | | | — | | | | (.30 | ) | | | 20.07 | | | | 6.81 | | | | 55 | | | | 1.73 | | | | 1.73 | | | | 1.44 | |
| 12/31/2018 | | | 19.78 | | | | .28 | | | | (.74 | ) | | | (.46 | ) | | | (.25 | ) | | | — | | | | — | | | | (.25 | ) | | | 19.07 | | | | (2.32 | ) | | | 67 | | | | 1.76 | | | | 1.76 | | | | 1.43 | |
| Class 529-E: | | | | | | | | | | | | | | | | | | | | | | | | | | | | | | | | | | | | | | | | | | | | | | | | | | | | | | | | |
| 12/31/2022 | | | 19.84 | | | | .28 | | | | (3.78 | ) | | | (3.50 | ) | | | (.14 | ) | | | — | | | | (.15 | ) | | | (.29 | ) | | | 16.05 | | | | (17.68 | ) | | | 9 | | | | 1.12 | | | | 1.12 | | | | 1.65 | |
| 12/31/2021 | | | 21.47 | | | | .27 | | | | (1.42 | ) | | | (1.15 | ) | | | (.36 | ) | | | (.12 | ) | | | — | | | | (.48 | ) | | | 19.84 | | | | (5.36 | ) | | | 12 | | | | 1.10 | | | | 1.10 | | | | 1.32 | |
| 12/31/2020 | | | 20.18 | | | | .30 | | | | 1.65 | | | | 1.95 | | | | (.37 | ) | | | (.29 | ) | | | — | | | | (.66 | ) | | | 21.47 | | | | 9.76 | | | | 14 | | | | 1.10 | | | | 1.10 | | | | 1.45 | |
| 12/31/2019 | | | 19.18 | | | | .40 | | | | 1.02 | | | | 1.42 | | | | (.35 | ) | | | (.07 | ) | | | — | | | | (.42 | ) | | | 20.18 | | | | 7.42 | | | | 14 | | | | 1.14 | | | | 1.14 | | | | 2.02 | |
| 12/31/2018 | | | 19.90 | | | | .39 | | | | (.74 | ) | | | (.35 | ) | | | (.37 | ) | | | — | | | | — | | | | (.37 | ) | | | 19.18 | | | | (1.76 | ) | | | 15 | | | | 1.17 | | | | 1.17 | | | | 2.02 | |
| Class 529-T: | | | | | | | | | | | | | | | | | | | | | | | | | | | | | | | | | | | | | | | | | | | | | | | | | | | | | | | | |
| 12/31/2022 | | | 19.90 | | | | .35 | | | | (3.79 | ) | | | (3.44 | ) | | | (.17 | ) | | | — | | | | (.19 | ) | | | (.36 | ) | | | 16.10 | | | | (17.34 | )5 | | | — | 6 | | | .74 | 5 | | | .74 | 5 | | | 2.02 | 5 |
| 12/31/2021 | | | 21.54 | | | | .34 | | | | (1.42 | ) | | | (1.08 | ) | | | (.44 | ) | | | (.12 | ) | | | — | | | | (.56 | ) | | | 19.90 | | | | (5.02 | )5 | | | — | 6 | | | .72 | 5 | | | .72 | 5 | | | 1.67 | 5 |
| 12/31/2020 | | | 20.26 | | | | .37 | | | | 1.64 | | | | 2.01 | | | | (.44 | ) | | | (.29 | ) | | | — | | | | (.73 | ) | | | 21.54 | | | | 10.07 | 5 | | | — | 6 | | | .73 | 5 | | | .73 | 5 | | | 1.80 | 5 |
| 12/31/2019 | | | 19.25 | | | | .48 | | | | 1.03 | | | | 1.51 | | | | (.43 | ) | | | (.07 | ) | | | — | | | | (.50 | ) | | | 20.26 | | | | 7.87 | 5 | | | — | 6 | | | .76 | 5 | | | .76 | 5 | | | 2.40 | 5 |
| 12/31/2018 | | | 19.97 | | | | .48 | | | | (.75 | ) | | | (.27 | ) | | | (.45 | ) | | | — | | | | — | | | | (.45 | ) | | | 19.25 | | | | (1.36 | )5 | | | — | 6 | | | .76 | 5 | | | .76 | 5 | | | 2.43 | 5 |
| Class 529-F-1: | | | | | | | | | | | | | | | | | | | | | | | | | | | | | | | | | | | | | | | | | | | | | | | | | | | | | | | | |
| 12/31/2022 | | | 19.82 | | | | .34 | | | | (3.77 | ) | | | (3.43 | ) | | | (.17 | ) | | | — | | | | (.19 | ) | | | (.36 | ) | | | 16.03 | | | | (17.39 | )5 | | | — | 6 | | | .77 | 5 | | | .77 | 5 | | | 1.97 | 5 |
| 12/31/2021 | | | 21.46 | | | | .34 | | | | (1.42 | ) | | | (1.08 | ) | | | (.44 | ) | | | (.12 | ) | | | — | | | | (.56 | ) | | | 19.82 | | | | (5.06 | )5 | | | — | 6 | | | .75 | 5 | | | .75 | 5 | | | 1.64 | 5 |
| 12/31/2020 | | | 20.19 | | | | .38 | | | | 1.63 | | | | 2.01 | | | | (.45 | ) | | | (.29 | ) | | | — | | | | (.74 | ) | | | 21.46 | | | | 10.08 | 5 | | | — | 6 | | | .73 | 5 | | | .73 | 5 | | | 1.86 | 5 |
| 12/31/2019 | | | 19.18 | | | | .48 | | | | 1.03 | | | | 1.51 | | | | (.43 | ) | | | (.07 | ) | | | — | | | | (.50 | ) | | | 20.19 | | | | 7.90 | | | | 40 | | | | .75 | | | | .75 | | | | 2.41 | |
| 12/31/2018 | | | 19.90 | | | | .47 | | | | (.74 | ) | | | (.27 | ) | | | (.45 | ) | | | — | | | | — | | | | (.45 | ) | | | 19.18 | | | | (1.36 | ) | | | 38 | | | | .77 | | | | .77 | | | | 2.42 | |
| Class 529-F-2: | | | | | | | | | | | | | | | | | | | | | | | | | | | | | | | | | | | | | | | | | | | | | | | | | | | | | | | | |
| 12/31/2022 | | | 19.91 | | | | .37 | | | | (3.79 | ) | | | (3.42 | ) | | | (.18 | ) | | | — | | | | (.20 | ) | | | (.38 | ) | | | 16.11 | | | | (17.28 | ) | | | 33 | | | | .62 | | | | .62 | | | | 2.16 | |
| 12/31/2021 | | | 21.55 | | | | .37 | | | | (1.43 | ) | | | (1.06 | ) | | | (.46 | ) | | | (.12 | ) | | | — | | | | (.58 | ) | | | 19.91 | | | | (4.89 | ) | | | 43 | | | | .64 | | | | .64 | | | | 1.78 | |
| 12/31/20207,8 | | | 21.00 | | | | .06 | | | | .87 | | | | .93 | | | | (.11 | ) | | | (.27 | ) | | | — | | | | (.38 | ) | | | 21.55 | | | | 4.47 | 9 | | | 43 | | | | .11 | 9 | | | .11 | 9 | | | .28 | 9 |
| Class 529-F-3: | | | | | | | | | | | | | | | | | | | | | | | | | | | | | | | | | | | | | | | | | | | | | | | | | | | | | | | | |
| 12/31/2022 | | | 19.90 | | | | .38 | | | | (3.78 | ) | | | (3.40 | ) | | | (.19 | ) | | | — | | | | (.21 | ) | | | (.40 | ) | | | 16.10 | | | | (17.17 | ) | | | — | 6 | | | .53 | | | | .53 | | | | 2.22 | |
| 12/31/2021 | | | 21.54 | | | | .38 | | | | (1.42 | ) | | | (1.04 | ) | | | (.48 | ) | | | (.12 | ) | | | — | | | | (.60 | ) | | | 19.90 | | | | (4.85 | ) | | | — | 6 | | | .57 | | | | .55 | | | | 1.84 | |
| 12/31/20207,8 | | | 21.00 | | | | .06 | | | | .87 | | | | .93 | | | | (.12 | ) | | | (.27 | ) | | | — | | | | (.39 | ) | | | 21.54 | | | | 4.46 | 9 | | | — | 6 | | | .13 | 9 | | | .09 | 9 | | | .30 | 9 |
| Class R-1: | | | | | | | | | | | | | | | | | | | | | | | | | | | | | | | | | | | | | | | | | | | | | | | | | | | | | | | | |
| 12/31/2022 | | | 19.70 | | | | .20 | | | | (3.74 | ) | | | (3.54 | ) | | | (.10 | ) | | | — | | | | (.12 | ) | | | (.22 | ) | | | 15.94 | | | | (18.02 | ) | | | 6 | | | | 1.58 | | | | 1.58 | | | | 1.21 | |
| 12/31/2021 | | | 21.32 | | | | .17 | | | | (1.41 | ) | | | (1.24 | ) | | | (.26 | ) | | | (.12 | ) | | | — | | | | (.38 | ) | | | 19.70 | | | | (5.81 | ) | | | 6 | | | | 1.58 | | | | 1.58 | | | | .84 | |
| 12/31/2020 | | | 20.05 | | | | .19 | | | | 1.63 | | | | 1.82 | | | | (.26 | ) | | | (.29 | ) | | | — | | | | (.55 | ) | | | 21.32 | | | | 9.14 | | | | 8 | | | | 1.65 | | | | 1.65 | | | | .91 | |
| 12/31/2019 | | | 19.05 | | | | .30 | | | | 1.02 | | | | 1.32 | | | | (.25 | ) | | | (.07 | ) | | | — | | | | (.32 | ) | | | 20.05 | | | | 6.92 | | | | 7 | | | | 1.65 | | | | 1.65 | | | | 1.50 | |
| 12/31/2018 | | | 19.77 | | | | .29 | | | | (.74 | ) | | | (.45 | ) | | | (.27 | ) | | | — | | | | — | | | | (.27 | ) | | | 19.05 | | | | (2.26 | ) | | | 8 | | | | 1.67 | | | | 1.67 | | | | 1.52 | |
Refer to the end of the table for footnotes.
| Capital World Bond Fund | 59 |
Financial highlights (continued)
| | | | | | (Loss) income from
investment operations1 | | | Dividends, distributions and return of capital | | | | | | | | | | | | | | | | | | | |
| Year ended | | Net asset
value,
beginning
of year | | | Net
investment
income | | | Net (losses)
gains on
securities
(both
realized and
unrealized) | | | Total from
investment
operations | | | Dividends
(from net
investment
income) | | | Distributions
(from capital
gains) | | | Return of
capital | | | Total
dividends,
distributions
and return
of capital | | | Net assets
value, end
of year | | | Total return2,3 | | | Net assets,
end of year
(in millions) | | | Ratio of
expenses to
average net
assets before
reimburse-
ments4 | | | Ratio of
expenses to
average net
assets after
reimburse-
ments3,4 | | | Ratio of
net income
to average
net assets3 | |
| Class R-2: | | | | | | | | | | | | | | | | | | | | | | | | | | | | | | | | | | | | | | | | | | | | | | | | | | | | | | | | |
| 12/31/2022 | | $ | 19.68 | | | $ | .20 | | | $ | (3.75 | ) | | $ | (3.55 | ) | | $ | (.10 | ) | | $ | — | | | $ | (.11 | ) | | $ | (.21 | ) | | $ | 15.92 | | | | (18.06 | )% | | $ | 70 | | | | 1.60 | % | | | 1.60 | % | | | 1.18 | % |
| 12/31/2021 | | | 21.30 | | | | .17 | | | | (1.40 | ) | | | (1.23 | ) | | | (.27 | ) | | | (.12 | ) | | | — | | | | (.39 | ) | | | 19.68 | | | | (5.81 | ) | | | 94 | | | | 1.58 | | | | 1.58 | | | | .84 | |
| 12/31/2020 | | | 20.03 | | | | .20 | | | | 1.63 | | | | 1.83 | | | | (.27 | ) | | | (.29 | ) | | | — | | | | (.56 | ) | | | 21.30 | | | | 9.20 | | | | 107 | | | | 1.59 | | | | 1.59 | | | | .96 | |
| 12/31/2019 | | | 19.04 | | | | .30 | | | | 1.02 | | | | 1.32 | | | | (.26 | ) | | | (.07 | ) | | | — | | | | (.33 | ) | | | 20.03 | | | | 6.93 | | | | 109 | | | | 1.62 | | | | 1.62 | | | | 1.54 | |
| 12/31/2018 | | | 19.75 | | | | .30 | | | | (.73 | ) | | | (.43 | ) | | | (.28 | ) | | | — | | | | — | | | | (.28 | ) | | | 19.04 | | | | (2.18 | ) | | | 113 | | | | 1.64 | | | | 1.64 | | | | 1.55 | |
| Class R-2E: | | | | | | | | | | | | | | | | | | | | | | | | | | | | | | | | | | | | | | | | | | | | | | | | | | | | | | | | |
| 12/31/2022 | | | 19.86 | | | | .25 | | | | (3.78 | ) | | | (3.53 | ) | | | (.12 | ) | | | — | | | | (.14 | ) | | | (.26 | ) | | | 16.07 | | | | (17.81 | ) | | | 5 | | | | 1.30 | | | | 1.30 | | | | 1.48 | |
| 12/31/2021 | | | 21.49 | | | | .23 | | | | (1.41 | ) | | | (1.18 | ) | | | (.33 | ) | | | (.12 | ) | | | — | | | | (.45 | ) | | | 19.86 | | | | (5.52 | ) | | | 7 | | | | 1.29 | | | | 1.29 | | | | 1.13 | |
| 12/31/2020 | | | 20.21 | | | | .26 | | | | 1.63 | | | | 1.89 | | | | (.32 | ) | | | (.29 | ) | | | — | | | | (.61 | ) | | | 21.49 | | | | 9.47 | | | | 8 | | | | 1.32 | | | | 1.32 | | | | 1.24 | |
| 12/31/2019 | | | 19.20 | | | | .36 | | | | 1.04 | | | | 1.40 | | | | (.32 | ) | | | (.07 | ) | | | — | | | | (.39 | ) | | | 20.21 | | | | 7.30 | | | | 7 | | | | 1.33 | | | | 1.33 | | | | 1.82 | |
| 12/31/2018 | | | 19.93 | | | | .36 | | | | (.76 | ) | | | (.40 | ) | | | (.33 | ) | | | — | | | | — | | | | (.33 | ) | | | 19.20 | | | | (1.99 | ) | | | 5 | | | | 1.36 | | | | 1.36 | | | | 1.84 | |
| Class R-3: | | | | | | | | | | | | | | | | | | | | | | | | | | | | | | | | | | | | | | | | | | | | | | | | | | | | | | | | |
| 12/31/2022 | | | 19.88 | | | | .28 | | | | (3.79 | ) | | | (3.51 | ) | | | (.13 | ) | | | — | | | | (.15 | ) | | | (.28 | ) | | | 16.09 | | | | (17.66 | ) | | | 93 | | | | 1.14 | | | | 1.14 | | | | 1.64 | |
| 12/31/2021 | | | 21.51 | | | | .27 | | | | (1.42 | ) | | | (1.15 | ) | | | (.36 | ) | | | (.12 | ) | | | — | | | | (.48 | ) | | | 19.88 | | | | (5.38 | ) | | | 128 | | | | 1.13 | | | | 1.13 | | | | 1.29 | |
| 12/31/2020 | | | 20.23 | | | | .29 | | | | 1.64 | | | | 1.93 | | | | (.36 | ) | | | (.29 | ) | | | — | | | | (.65 | ) | | | 21.51 | | | | 9.64 | | | | 146 | | | | 1.15 | | | | 1.15 | | | | 1.41 | |
| 12/31/2019 | | | 19.22 | | | | .40 | | | | 1.03 | | | | 1.43 | | | | (.35 | ) | | | (.07 | ) | | | — | | | | (.42 | ) | | | 20.23 | | | | 7.44 | | | | 138 | | | | 1.17 | | | | 1.17 | | | | 1.99 | |
| 12/31/2018 | | | 19.94 | | | | .39 | | | | (.74 | ) | | | (.35 | ) | | | (.37 | ) | | | — | | | | — | | | | (.37 | ) | | | 19.22 | | | | (1.78 | ) | | | 132 | | | | 1.19 | | | | 1.19 | | | | 2.00 | |
| Class R-4: | | | | | | | | | | | | | | | | | | | | | | | | | | | | | | | | | | | | | | | | | | | | | | | | | | | | | | | | |
| 12/31/2022 | | | 19.90 | | | | .33 | | | | (3.79 | ) | | | (3.46 | ) | | | (.16 | ) | | | — | | | | (.18 | ) | | | (.34 | ) | | | 16.10 | | | | (17.43 | ) | | | 68 | | | | .84 | | | | .84 | | | | 1.94 | |
| 12/31/2021 | | | 21.53 | | | | .33 | | | | (1.42 | ) | | | (1.09 | ) | | | (.42 | ) | | | (.12 | ) | | | — | | | | (.54 | ) | | | 19.90 | | | | (5.08 | ) | | | 92 | | | | .83 | | | | .83 | | | | 1.59 | |
| 12/31/2020 | | | 20.25 | | | | .35 | | | | 1.64 | | | | 1.99 | | | | (.42 | ) | | | (.29 | ) | | | — | | | | (.71 | ) | | | 21.53 | | | | 9.97 | | | | 96 | | | | .84 | | | | .84 | | | | 1.71 | |
| 12/31/2019 | | | 19.23 | | | | .46 | | | | 1.04 | | | | 1.50 | | | | (.41 | ) | | | (.07 | ) | | | — | | | | (.48 | ) | | | 20.25 | | | | 7.81 | | | | 89 | | | | .86 | | | | .86 | | | | 2.30 | |
| 12/31/2018 | | | 19.95 | | | | .45 | | | | (.74 | ) | | | (.29 | ) | | | (.43 | ) | | | — | | | | — | | | | (.43 | ) | | | 19.23 | | | | (1.48 | ) | | | 91 | | | | .88 | | | | .88 | | | | 2.30 | |
| Class R-5E: | | | | | | | | | | | | | | | | | | | | | | | | | | | | | | | | | | | | | | | | | | | | | | | | | | | | | | | | |
| 12/31/2022 | | | 19.88 | | | | .37 | | | | (3.78 | ) | | | (3.41 | ) | | | (.18 | ) | | | — | | | | (.20 | ) | | | (.38 | ) | | | 16.09 | | | | (17.23 | ) | | | 23 | | | | .64 | | | | .64 | | | | 2.15 | |
| 12/31/2021 | | | 21.51 | | | | .37 | | | | (1.42 | ) | | | (1.05 | ) | | | (.46 | ) | | | (.12 | ) | | | — | | | | (.58 | ) | | | 19.88 | | | | (4.90 | ) | | | 25 | | | | .63 | | | | .63 | | | | 1.79 | |
| 12/31/2020 | | | 20.23 | | | | .39 | | | | 1.64 | | | | 2.03 | | | | (.46 | ) | | | (.29 | ) | | | — | | | | (.75 | ) | | | 21.51 | | | | 10.21 | | | | 25 | | | | .63 | | | | .63 | | | | 1.89 | |
| 12/31/2019 | | | 19.22 | | | | .50 | | | | 1.03 | | | | 1.53 | | | | (.45 | ) | | | (.07 | ) | | | — | | | | (.52 | ) | | | 20.23 | | | | 7.98 | | | | 8 | | | | .66 | | | | .66 | | | | 2.48 | |
| 12/31/2018 | | | 19.94 | | | | .50 | | | | (.75 | ) | | | (.25 | ) | | | (.47 | ) | | | — | | | | — | | | | (.47 | ) | | | 19.22 | | | | (1.24 | ) | | | 3 | | | | .67 | | | | .67 | | | | 2.58 | |
| Class R-5: | | | | | | | | | | | | | | | | | | | | | | | | | | | | | | | | | | | | | | | | | | | | | | | | | | | | | | | | |
| 12/31/2022 | | | 19.93 | | | | .38 | | | | (3.80 | ) | | | (3.42 | ) | | | (.18 | ) | | | — | | | | (.21 | ) | | | (.39 | ) | | | 16.12 | | | | (17.21 | ) | | | 31 | | | | .54 | | | | .54 | | | | 2.23 | |
| 12/31/2021 | | | 21.56 | | | | .39 | | | | (1.42 | ) | | | (1.03 | ) | | | (.48 | ) | | | (.12 | ) | | | — | | | | (.60 | ) | | | 19.93 | | | | (4.79 | ) | | | 55 | | | | .53 | | | | .53 | | | | 1.89 | |
| 12/31/2020 | | | 20.27 | | | | .42 | | | | 1.64 | | | | 2.06 | | | | (.48 | ) | | | (.29 | ) | | | — | | | | (.77 | ) | | | 21.56 | | | | 10.33 | | | | 56 | | | | .54 | | | | .54 | | | | 2.01 | |
| 12/31/2019 | | | 19.26 | | | | .52 | | | | 1.03 | | | | 1.55 | | | | (.47 | ) | | | (.07 | ) | | | — | | | | (.54 | ) | | | 20.27 | | | | 8.06 | | | | 52 | | | | .56 | | | | .56 | | | | 2.61 | |
| 12/31/2018 | | | 19.98 | | | | .51 | | | | (.74 | ) | | | (.23 | ) | | | (.49 | ) | | | — | | | | — | | | | (.49 | ) | | | 19.26 | | | | (1.17 | ) | | | 76 | | | | .58 | | | | .58 | | | | 2.61 | |
| Class R-6: | | | | | | | | | | | | | | | | | | | | | | | | | | | | | | | | | | | | | | | | | | | | | | | | | | | | | | | | |
| 12/31/2022 | | | 19.92 | | | | .39 | | | | (3.80 | ) | | | (3.41 | ) | | | (.19 | ) | | | — | | | | (.21 | ) | | | (.40 | ) | | | 16.11 | | | | (17.17 | ) | | | 2,768 | | | | .48 | | | | .48 | | | | 2.26 | |
| 12/31/2021 | | | 21.55 | | | | .40 | | | | (1.42 | ) | | | (1.02 | ) | | | (.49 | ) | | | (.12 | ) | | | — | | | | (.61 | ) | | | 19.92 | | | | (4.74 | ) | | | 6,757 | | | | .48 | | | | .48 | | | | 1.95 | |
| 12/31/2020 | | | 20.26 | | | | .43 | | | | 1.64 | | | | 2.07 | | | | (.49 | ) | | | (.29 | ) | | | — | | | | (.78 | ) | | | 21.55 | | | | 10.40 | | | | 5,316 | | | | .48 | | | | .48 | | | | 2.07 | |
| 12/31/2019 | | | 19.25 | | | | .53 | | | | 1.03 | | | | 1.56 | | | | (.48 | ) | | | (.07 | ) | | | — | | | | (.55 | ) | | | 20.26 | | | | 8.14 | | | | 4,294 | | | | .50 | | | | .50 | | | | 2.65 | |
| 12/31/2018 | | | 19.97 | | | | .52 | | | | (.74 | ) | | | (.22 | ) | | | (.50 | ) | | | — | | | | — | | | | (.50 | ) | | | 19.25 | | | | (1.11 | ) | | | 3,124 | | | | .52 | | | | .52 | | | | 2.67 | |
Refer to the end of the table for footnotes.
| 60 | Capital World Bond Fund |
Financial highlights (continued)
| | | Year ended December 31, |
| Portfolio turnover rate for all share classes10,11 | | 2022 | | 2021 | | 2020 | | 2019 | | 2018 |
| Excluding mortgage dollar roll transactions | | | 73 | % | | | 65 | % | | | 100 | % | | | 120 | % | | | 99 | % |
| Including mortgage dollar roll transactions | | | 150 | % | | | 89 | % | | | 143 | % | | | 163 | % | | | 128 | % |
| 1 | Based on average shares outstanding. |
| 2 | Total returns exclude any applicable sales charges, including contingent deferred sales charges. |
| 3 | This column reflects the impact, if any, of certain reimbursements from CRMC. During some of the years shown, CRMC reimbursed a portion of transfer agent services fees for Class 529-F-3 shares. |
| 4 | Ratios do not include expenses of any Central Funds. The fund indirectly bears its proportionate share of the expenses of any Central Funds. |
| 5 | All or a significant portion of assets in this class consisted of seed capital invested by CRMC and/or its affiliates. Fees for distribution services are not charged or accrued on these seed capital assets. If such fees were paid by the fund on seed capital assets, fund expenses would have been higher and net income and total return would have been lower. |
| 6 | Amount less than $1 million. |
| 7 | Based on operations for a period that is less than a full year. |
| 8 | Class 529-F-2 and 529-F-3 shares began investment operations on October 30, 2020. |
| 9 | Not annualized. |
| 10 | Rates do not include the fund’s portfolio activity with respect to any Central Funds. |
| 11 | Refer to Note 5 for more information on mortgage dollar rolls. |
Refer to the notes to financial statements.
| Capital World Bond Fund | 61 |
Report of Independent Registered Public Accounting Firm
To the Shareholders and Board of Trustees of Capital World Bond Fund:
Opinion on the Financial Statements and Financial Highlights
We have audited the accompanying statement of assets and liabilities of Capital World Bond Fund (the “Fund”), including the investment portfolio, as of December 31, 2022, the related statement of operations for the year then ended, the statements of changes in net assets for each of the two years in the period then ended, the financial highlights for each of the five years in the period then ended, and the related notes. In our opinion, the financial statements and financial highlights present fairly, in all material respects, the financial position of the Fund as of December 31, 2022, and the results of its operations for the year then ended, the changes in its net assets for each of the two years in the period then ended, and the financial highlights for each of the five years in the period then ended in conformity with accounting principles generally accepted in the United States of America.
Basis for Opinion
These financial statements and financial highlights are the responsibility of the Fund’s management. Our responsibility is to express an opinion on the Fund’s financial statements and financial highlights based on our audits. We are a public accounting firm registered with the Public Company Accounting Oversight Board (United States) (PCAOB) and are required to be independent with respect to the Fund in accordance with the U.S. federal securities laws and the applicable rules and regulations of the Securities and Exchange Commission and the PCAOB.
We conducted our audits in accordance with the standards of the PCAOB. Those standards require that we plan and perform the audit to obtain reasonable assurance about whether the financial statements and financial highlights are free of material misstatement, whether due to error or fraud. The Fund is not required to have, nor were we engaged to perform, an audit of its internal control over financial reporting. As part of our audits we are required to obtain an understanding of internal control over financial reporting but not for the purpose of expressing an opinion on the effectiveness of the Fund’s internal control over financial reporting. Accordingly, we express no such opinion.
Our audits included performing procedures to assess the risks of material misstatement of the financial statements and financial highlights, whether due to error or fraud, and performing procedures that respond to those risks. Such procedures included examining, on a test basis, evidence regarding the amounts and disclosures in the financial statements and financial highlights. Our audits also included evaluating the accounting principles used and significant estimates made by management, as well as evaluating the overall presentation of the financial statements and financial highlights. Our procedures included confirmation of securities owned as of December 31, 2022, by correspondence with the custodian and brokers; when replies were not received from brokers, we performed other auditing procedures. We believe that our audits provide a reasonable basis for our opinion.
Deloitte & Touche LLP
Costa Mesa, California
February 9, 2023
We have served as the auditor of one or more American Funds investment companies since 1956.
| 62 | Capital World Bond Fund |
As a fund shareholder, you incur two types of costs: (1) transaction costs, such as initial sales charges on purchase payments and contingent deferred sales charges on redemptions (loads), and (2) ongoing costs, including management fees, distribution and service (12b-1) fees, and other expenses. This example is intended to help you understand your ongoing costs (in dollars) of investing in the fund so you can compare these costs with the ongoing costs of investing in other mutual funds. The example is based on an investment of $1,000 invested at the beginning of the period and held for the entire six-month period (July 1, 2022, through December 31, 2022).
Actual expenses:
The first line of each share class in the table on the following page provides information about actual account values and actual expenses. You may use the information in this line, together with the amount you invested, to estimate the expenses that you paid over the period. Simply divide your account value by $1,000 (for example, an $8,600 account value divided by $1,000 = 8.6), then multiply the result by the number in the first line under the heading titled “Expenses paid during period” to estimate the expenses you paid on your account during this period.
Hypothetical example for comparison purposes:
The second line of each share class in the table on the following page provides information about hypothetical account values and hypothetical expenses based on the actual expense ratio for the share class and an assumed rate of return of 5.00% per year before expenses, which is not the actual return of the share class. The hypothetical account values and expenses may not be used to estimate the actual ending account balance or expenses you paid for the period. You may use this information to compare the ongoing costs of investing in the fund and other funds. To do so, compare this 5.00% hypothetical example with the 5.00% hypothetical examples that appear in the shareholder reports of the other funds.
Notes:
Retirement plan participants may be subject to certain fees charged by the plan sponsor, and Class F-1, F-2, F-3, 529-F-1, 529-F-2 and 529-F-3 shareholders may be subject to fees charged by financial intermediaries, typically ranging from 0.75% to 1.50% of assets annually depending on services offered. You can estimate the impact of these fees by adding the amount of the fees to the total estimated expenses you paid on your account during the period as calculated above. In addition, your ending account value would be lower by the amount of these fees.
Note that the expenses shown in the table on the following page are meant to highlight your ongoing costs only and do not reflect any transactional costs, such as sales charges (loads). Therefore, the second line of each share class in the table is useful in comparing ongoing costs only and will not help you determine the relative total costs of owning different funds. In addition, if these transactional costs were included, your costs would have been higher.
| Capital World Bond Fund | 63 |
Expense example (continued)
| | | Beginning
account value
7/1/2022 | | | Ending
account value
12/31/2022 | | | Expenses paid
during period* | | | Annualized
expense ratio | |
| Class A – actual return | | $ | 1,000.00 | | | $ | 980.79 | | | $ | 4.84 | | | | .97 | % |
| Class A – assumed 5% return | | | 1,000.00 | | | | 1,020.32 | | | | 4.94 | | | | .97 | |
| Class C – actual return | | | 1,000.00 | | | | 976.74 | | | | 8.47 | | | | 1.70 | |
| Class C – assumed 5% return | | | 1,000.00 | | | | 1,016.64 | | | | 8.64 | | | | 1.70 | |
| Class T – actual return | | | 1,000.00 | | | | 981.52 | | | | 3.50 | | | | .70 | |
| Class T – assumed 5% return | | | 1,000.00 | | | | 1,021.68 | | | | 3.57 | | | | .70 | |
| Class F-1 – actual return | | | 1,000.00 | | | | 980.67 | | | | 4.89 | | | | .98 | |
| Class F-1 – assumed 5% return | | | 1,000.00 | | | | 1,020.27 | | | | 4.99 | | | | .98 | |
| Class F-2 – actual return | | | 1,000.00 | | | | 982.52 | | | | 3.05 | | | | .61 | |
| Class F-2 – assumed 5% return | | | 1,000.00 | | | | 1,022.13 | | | | 3.11 | | | | .61 | |
| Class F-3 – actual return | | | 1,000.00 | | | | 983.19 | | | | 2.45 | | | | .49 | |
| Class F-3 – assumed 5% return | | | 1,000.00 | | | | 1,022.74 | | | | 2.50 | | | | .49 | |
| Class 529-A – actual return | | | 1,000.00 | | | | 980.66 | | | | 4.99 | | | | 1.00 | |
| Class 529-A – assumed 5% return | | | 1,000.00 | | | | 1,020.16 | | | | 5.09 | | | | 1.00 | |
| Class 529-C – actual return | | | 1,000.00 | | | | 976.36 | | | | 8.77 | | | | 1.76 | |
| Class 529-C – assumed 5% return | | | 1,000.00 | | | | 1,016.33 | | | | 8.94 | | | | 1.76 | |
| Class 529-E – actual return | | | 1,000.00 | | | | 979.88 | | | | 5.64 | | | | 1.13 | |
| Class 529-E – assumed 5% return | | | 1,000.00 | | | | 1,019.51 | | | | 5.75 | | | | 1.13 | |
| Class 529-T – actual return | | | 1,000.00 | | | | 981.84 | | | | 3.80 | | | | .76 | |
| Class 529-T – assumed 5% return | | | 1,000.00 | | | | 1,021.37 | | | | 3.87 | | | | .76 | |
| Class 529-F-1 – actual return | | | 1,000.00 | | | | 981.02 | | | | 3.94 | | | | .79 | |
| Class 529-F-1 – assumed 5% return | | | 1,000.00 | | | | 1,021.22 | | | | 4.02 | | | | .79 | |
| Class 529-F-2 – actual return | | | 1,000.00 | | | | 982.48 | | | | 3.15 | | | | .63 | |
| Class 529-F-2 – assumed 5% return | | | 1,000.00 | | | | 1,022.03 | | | | 3.21 | | | | .63 | |
| Class 529-F-3 – actual return | | | 1,000.00 | | | | 982.95 | | | | 2.65 | | | | .53 | |
| Class 529-F-3 – assumed 5% return | | | 1,000.00 | | | | 1,022.53 | | | | 2.70 | | | | .53 | |
| Class R-1 – actual return | | | 1,000.00 | | | | 977.58 | | | | 7.88 | | | | 1.58 | |
| Class R-1 – assumed 5% return | | | 1,000.00 | | | | 1,017.24 | | | | 8.03 | | | | 1.58 | |
| Class R-2 – actual return | | | 1,000.00 | | | | 977.50 | | | | 7.93 | | | | 1.59 | |
| Class R-2 – assumed 5% return | | | 1,000.00 | | | | 1,017.19 | | | | 8.08 | | | | 1.59 | |
| Class R-2E – actual return | | | 1,000.00 | | | | 979.13 | | | | 6.49 | | | | 1.30 | |
| Class R-2E – assumed 5% return | | | 1,000.00 | | | | 1,018.65 | | | | 6.61 | | | | 1.30 | |
| Class R-3 – actual return | | | 1,000.00 | | | | 979.91 | | | | 5.69 | | | | 1.14 | |
| Class R-3 – assumed 5% return | | | 1,000.00 | | | | 1,019.46 | | | | 5.80 | | | | 1.14 | |
| Class R-4 – actual return | | | 1,000.00 | | | | 981.41 | | | | 4.20 | | | | .84 | |
| Class R-4 – assumed 5% return | | | 1,000.00 | | | | 1,020.97 | | | | 4.28 | | | | .84 | |
| Class R-5E – actual return | | | 1,000.00 | | | | 982.42 | | | | 3.20 | | | | .64 | |
| Class R-5E – assumed 5% return | | | 1,000.00 | | | | 1,021.98 | | | | 3.26 | | | | .64 | |
| Class R-5 – actual return | | | 1,000.00 | | | | 982.32 | | | | 2.70 | | | | .54 | |
| Class R-5 – assumed 5% return | | | 1,000.00 | | | | 1,022.48 | | | | 2.75 | | | | .54 | |
| Class R-6 – actual return | | | 1,000.00 | | | | 983.14 | | | | 2.40 | | | | .48 | |
| Class R-6 – assumed 5% return | | | 1,000.00 | | | | 1,022.79 | | | | 2.45 | | | | .48 | |
| * | The “expenses paid during period” are equal to the “annualized expense ratio,” multiplied by the average account value over the period, multiplied by the number of days in the period, and divided by 365 (to reflect the one-half year period). |
| 64 | Capital World Bond Fund |
We are required to advise you of the federal tax status of certain distributions received by shareholders during the fiscal year. The fund hereby designates the following amounts for the fund’s fiscal year ended December 31, 2022:
| Qualified dividend income | $1,827,000 |
| Section 163(j) interest dividends | $124,314,000 |
| Corporate dividends received deduction | $369,000 |
| U.S. government income that may be exempt from state taxation | $15,902,000 |
Individual shareholders should refer to their Form 1099 or other tax information, which was mailed in January 2023, to determine the calendar year amounts to be included on their 2022 tax returns. Shareholders should consult their tax advisors.
| Capital World Bond Fund | 65 |
| Liquidity Risk Management Program | unaudited |
The fund has adopted a liquidity risk management program (the “program”). The fund’s board has designated Capital Research and Management Company (“CRMC”) as the administrator of the program. Personnel of CRMC or its affiliates conduct the day-to-day operation of the program pursuant to policies and procedures administered by the Capital Group Liquidity Risk Management Committee.
Under the program, CRMC manages the fund’s liquidity risk, which is the risk that the fund could not meet shareholder redemption requests without significant dilution of remaining shareholders’ interests in the fund. This risk is managed by monitoring the degree of liquidity of the fund’s investments, limiting the amount of the fund’s illiquid investments, and utilizing various risk management tools and facilities available to the fund for meeting shareholder redemptions, among other means. CRMC’s process of determining the degree of liquidity of the fund’s investments is supported by one or more third-party liquidity assessment vendors.
The fund’s board reviewed a report prepared by CRMC regarding the operation and effectiveness of the program for the period October 1, 2021, through September 30, 2022. No significant liquidity events impacting the fund were noted in the report. In addition, CRMC provided its assessment that the program had been effective in managing the fund’s liquidity risk.
| 66 | Capital World Bond Fund |
This page was intentionally left blank.
| Capital World Bond Fund | 67 |
This page was intentionally left blank.
| 68 | Capital World Bond Fund |
This page was intentionally left blank.
| Capital World Bond Fund | 69 |
This page was intentionally left blank.
| 70 | Capital World Bond Fund |
This page was intentionally left blank.
| Capital World Bond Fund | 71 |
This page was intentionally left blank.
| 72 | Capital World Bond Fund |
This page was intentionally left blank.
| Capital World Bond Fund | 73 |
Board of trustees and other officers
Independent trustees1
| Name and year of birth | | Year first
elected
a trustee
of the fund2 | | Principal occupation(s) during past five years | | Number of
portfolios in fund
complex overseen
by trustee | | Other directorships3
held by trustee during the
past five years |
| Francisco G. Cigarroa, MD, 1957 | | 2021 | | Professor of Surgery, University of Texas Health San Antonio; Trustee, Ford Foundation; Clayton Research Scholar, Clayton Foundation for Biomedical Research | | 86 | | None |
| James G. Ellis, 1947 | | 2006 | | Former Dean and Professor of Marketing, Marshall School of Business, University of Southern California | | 96 | | Advanced Merger Partners; EVe Mobility Acquisition Corp (acquisitions of companies in the electric vehicle market); J. G. Boswell (agricultural production); Mercury General Corporation |
| Nariman Farvardin, 1956 | | 2018 | | President, Stevens Institute of Technology | | 91 | | None |
| Jennifer C. Feikin, 1968 | | 2022 | | Business Advisor; previously held positions at Google, AOL, 20th Century Fox and McKinsey & Company; Trustee, The Nature Conservancy of Utah; former Trustee, The Nature Conservancy of California; former Director, First Descents | | 97 | | Hertz Global Holdings, Inc. |
| Leslie Stone Heisz, 1961 | | 2022 | | Former Managing Director, Lazard (retired, 2010); Director, Kaiser Permanente (California public benefit corporation); former Lecturer, UCLA Anderson School of Management | | 97 | | Edwards Lifesciences; Public Storage |
| Mary Davis Holt, 1950 | | 2015-2016
2017 | | Principal, Mary Davis Holt Enterprises, LLC (leadership development consulting); former Partner, Flynn Heath Holt Leadership, LLC (leadership consulting); former COO, Time Life Inc. (1993 – 2003) | | 87 | | None |
| Merit E. Janow, 1958 | | 2010 | | Dean Emerita and Professor of Practice, International Economic Law & International Affairs, Columbia University, School of International and Public Affairs | | 93 | | Aptiv (autonomous and green vehicle technology); Mastercard Incorporated |
Margaret Spellings, 1957
Chair of the Board
(Independent and
Non-Executive) | | 2010 | | President and CEO, Texas 2036; former President, Margaret Spellings & Company (public policy and strategic consulting); former President, The University of North Carolina; former President, George W. Bush Presidential Center | | 91 | | None |
| Alexandra Trower, 1964 | | 2019 | | Former Executive Vice President, Global Communications and Corporate Officer, The Estée Lauder Companies | | 86 | | None |
| Paul S. Williams, 1959 | | 2020 | | Former Partner/Managing Director, Major, Lindsey & Africa (executive recruiting firm) | | 86 | | Air Transport Services Group, Inc. (aircraft leasing and air cargo transportation); Compass Minerals, Inc. (producer of salt and specialty fertilizers); Public Storage, Inc |
| 74 | Capital World Bond Fund |
Interested trustees4,5
Name, year of birth and
position with fund | | Year first
elected a
trustee
or officer
of the fund2 | | Principal occupation(s) during past five years
and positions held with affiliated entities or the
principal underwriter of the fund | | Number of
portfolios in fund
complex overseen
by trustee | | Other directorships3
held by trustee during the
past five years |
| Michael C. Gitlin, 1970 | | 2015 | | Partner – Capital Fixed Income Investors, Capital Research and Management Company; Vice Chairman and Director, Capital Research and Management Company; Director, The Capital Group Companies, Inc.6 | | 86 | | None |
| Karl J. Zeile, 1966 | | 2019 | | Partner – Capital Fixed Income Investors, Capital Research and Management Company | | 21 | | None |
The fund’s statement of additional information includes further details about fund trustees and is available without charge upon request by calling American Funds Service Company at (800) 421-4225 or by visiting the American Funds website at capitalgroup.com. The address for all trustees and officers of the fund is 333 South Hope Street, Los Angeles, CA 90071, Attention: Secretary.
| Other officers5 | | | | |
| | | | | |
Name, year of birth and
position with fund | | Year first
elected
an officer
of the fund2 | | Principal occupation(s) during past five years and positions held with affiliated entities
or the principal underwriter of the fund |
Thomas H. Høgh, 1963
President | | 2001 | | Partner — Capital Fixed Income Investors, Capital Research Company6 |
Kristine M. Nishiyama, 1970
Principal Executive Officer | | 2003 | | Senior Vice President and Senior Counsel — Fund Business Management Group, Capital Research and Management Company; Chair, Senior Vice President, General Counsel and Director, Capital Bank and Trust Company6 |
Michael W. Stockton, 1967
Executive Vice President | | 2021 | | Senior Vice President – Fund Business Management Group, Capital Research and Management Company |
Philip Chitty, 1969
Senior Vice President | | 2021 | | Partner – Capital Fixed Income Investors, Capital Research Company6 |
Andrew A. Cormack, 1982
Senior Vice President | | 2019 | | Partner – Capital Fixed Income Investors, Capital Research Company6 |
Steven I. Koszalka, 1964
Secretary | | 2010 | | Vice President — Fund Business Management Group, Capital Research and Management Company |
Brian C. Janssen, 1972
Treasurer | | 2012 | | Senior Vice President – Investment Operations, Capital Research and Management Company |
Jane Y. Chung, 1974
Assistant Secretary | | 2014 | | Associate – Fund Business Management Group, Capital Research and Management Company |
Sandra Chuon, 1972
Assistant Treasurer | | 2019 | | Vice President – Investment Operations, Capital Research and Management Company |
Becky L. Park, 1979
Assistant Treasurer | | 2021 | | Vice President – Investment Operations, Capital Research and Management Company |
| 1 | The term independent trustee refers to a trustee who is not an “interested person” of the fund within the meaning of the Investment Company Act of 1940. |
| 2 | Trustees and officers of the fund serve until their resignation, removal or retirement. |
| 3 | This includes all directorships/trusteeships (other than those in the American Funds or other funds managed by Capital Research and Management Company or its affiliates) that are held by each trustee as a trustee or director of a public company or a registered investment company. |
| 4 | The term interested trustee refers to a trustee who is an “interested person” within the meaning of the Investment Company Act of 1940, on the basis of their affiliation with the fund’s investment adviser, Capital Research and Management Company, or affiliated entities (including the fund’s principal underwriter). |
| 5 | All of the trustees and/or officers listed are officers and/or directors/trustees of one or more of the other funds for which Capital Research and Management Company serves as investment adviser. |
| 6 | Company affiliated with Capital Research and Management Company. |
| Capital World Bond Fund | 75 |
Office of the fund
333 South Hope Street
Los Angeles, CA 90071-1406
Investment adviser
Capital Research and Management Company
333 South Hope Street
Los Angeles, CA 90071-1406
Transfer agent for shareholder accounts
American Funds Service Company
(Write to the address nearest you.)
P.O. Box 6007
Indianapolis, IN 46206-6007
P.O. Box 2280
Norfolk, VA 23501-2280
Custodian of assets
JPMorgan Chase Bank
270 Park Avenue
New York, NY 10017-2070
Counsel
Morgan, Lewis & Bockius LLP
One Federal Street
Boston, MA 02110-1726
Independent registered public accounting firm
Deloitte & Touche LLP
695 Town Center Drive
Suite 1000
Costa Mesa, CA 92626-7188
Principal underwriter
American Funds Distributors, Inc.
333 South Hope Street
Los Angeles, CA 90071-1406
| 76 | Capital World Bond Fund |
Investors should carefully consider investment objectives, risks, charges and expenses. This and other important information is contained in the fund prospectus and summary prospectus, which can be obtained from your financial professional and should be read carefully before investing. You may also call American Funds Service Company (AFS) at (800) 421-4225 or visit the Capital Group website at capitalgroup.com.
“American Funds Proxy Voting Procedures and Principles” — which describes how we vote proxies relating to portfolio securities — is available on our website or upon request by calling AFS. The fund files its proxy voting record with the U.S. Securities and Exchange Commission (SEC) for the 12 months ended June 30 by August 31. The proxy voting record is available free of charge on the SEC website at sec.gov and on our website.
Capital World Bond Fund files a complete list of its portfolio holdings with the SEC for the first and third quarters of each fiscal year on Form NPORT-P. The list of portfolio holdings is available free of charge on the SEC website and on our website.
This report is for the information of shareholders of Capital World Bond Fund, but it also may be used as sales literature when preceded or accompanied by the current prospectus or summary prospectus, which gives details about charges, expenses, investment objectives and operating policies of the fund. If used as sales material after March 31, 2023, this report must be accompanied by an American Funds statistical update for the most recently completed calendar quarter.
BLOOMBERG® is a trademark and service mark of Bloomberg Finance L.P. and its affiliates (collectively “Bloomberg”). Bloomberg or Bloomberg’s licensors own all proprietary rights in the Bloomberg Indices. Neither Bloomberg nor Bloomberg’s licensors approves or endorses this material, or guarantees the accuracy or completeness of any information herein, or makes any warranty, express or implied, as to the results to be obtained therefrom and, to the maximum extent allowed by law, neither shall have any liability or responsibility for injury or damages arising in connection therewith.
London Stock Exchange Group plc and its group undertakings (collectively, the “LSE Group”). © LSE Group 2023. FTSE Russell is a trading name of certain of the LSE Group companies. FTSE indexes are trademarks of the relevant LSE Group companies and are used by any other LSE Group company under license. All rights in the FTSE Russell indexes or data vest in the relevant LSE Group company which owns the index or the data. Neither LSE Group nor its licensors accept any liability for any errors or omissions in the indexes or data and no party may rely on any indexes or data contained in this communication. No further distribution of data from the LSE Group is permitted without the relevant LSE Group company’s express written consent. The LSE Group does not promote, sponsor or endorse the content of this communication.
This report, and any product, index or fund referred to herein, is not sponsored, endorsed or promoted in any way by J.P. Morgan or any of its affiliates who provide no warranties whatsoever, express or implied, and shall have no liability to any prospective investor, in connection with this report. J.P. Morgan disclaimer: https://www.jpmm.com/ research/disclosures.
American Funds Distributors, Inc., member FINRA.
The Capital Advantage®
Since 1931, Capital Group, home of American Funds, has helped investors pursue long-term investment success. Our consistent approach — in combination with The Capital SystemTM — has resulted in superior outcomes.
| | Aligned with investor success
We base our decisions on a long-term perspective, which we believe aligns our goals with the interests of our clients. Our portfolio managers average 27 years of investment industry experience, including 21 years at our company, reflecting a career commitment to our long-term approach.1 |
| | | |
| | The Capital System
The Capital System combines individual accountability with teamwork. Funds using The Capital System are divided into portions that are managed independently by investment professionals with diverse backgrounds, ages and investment approaches. An extensive global research effort is the backbone of our system. |
| | | |
| | American Funds’ superior outcomes
Equity funds have beaten their Lipper peer indexes in 90% of 10-year periods and 99% of 20-year periods.2 Fixed income funds have helped investors achieve diversification through attention to correlation between bonds and equities.3 Fund management fees have been among the lowest in the industry.4 |
| | | |
| | 1 | Investment industry experience as of December 31, 2021. |
| | 2 | Based on Class F-2 share results for rolling calendar-year periods starting the first full calendar year after each fund’s inception through December 31, 2021. Periods covered are the shorter of the fund’s lifetime or since the comparable Lipper index inception date (except Capital Income Builder and SMALLCAP World Fund, for which the Lipper average was used). Expenses differ for each share class, so results will vary. |
| | 3 | Based on Class F-2 share results as of December 31, 2021. Thirteen of the 17 fixed income American Funds that have been in existence for the three-year period showed a three-year correlation below 0.3. S&P 500 Index was used as an equity market proxy. Correlation based on monthly total returns. Correlation is a statistical measure of how two securities move in relation to each other. A correlation ranges from –1 to 1. A positive correlation close to 1 implies that as one security moves, either up or down, the other security will move in “lockstep,�� in the same direction. A negative correlation close to –1 indicates that the securities have moved in the opposite direction. |
| | 4 | On average, our management fees were in the lowest quintile 63% of the time, based on the 20-year period ended December 31, 2021, versus comparable Lipper categories, excluding funds of funds. |
Class F-2 shares were first offered on August 1, 2008. Class F-2 share results prior to the date of first sale are hypothetical based on the results of the original share class of the fund without a sales charge, adjusted for typical estimated expenses. Results for certain funds with an inception date after August 1, 2008, also include hypothetical returns because those funds’ Class F-2 shares sold after the funds’ date of first offering. Visit capitalgroup.com for more information on specific expense adjustments and the actual dates of first sale.
All Capital Group trademarks mentioned are owned by The Capital Group Companies, Inc., an affiliated company or fund. All other company and product names mentioned are the property of their respective companies.

ITEM 2 – Code of Ethics
The Registrant has adopted a Code of Ethics that applies to its Principal Executive Officer and Principal Financial Officer. The Registrant undertakes to provide to any person without charge, upon request, a copy of the Code of Ethics. Such request can be made by calling 800/421-4225 or to the Secretary of the Registrant, 333 South Hope Street, 55th Floor, Los Angeles, California 90071.
ITEM 3 – Audit Committee Financial Expert
The Registrant’s board has determined that Paul S. Williams, a member of the Registrant’s audit committee, is an “audit committee financial expert” and "independent," as such terms are defined in this Item. This designation will not increase the designee’s duties, obligations or liability as compared to his or her duties, obligations and liability as a member of the audit committee and of the board, nor will it reduce the responsibility of the other audit committee members. There may be other individuals who, through education or experience, would qualify as "audit committee financial experts" if the board had designated them as such. Most importantly, the board believes each member of the audit committee contributes significantly to the effective oversight of the Registrant’s financial statements and condition.
ITEM 4 – Principal Accountant Fees and Services
| a) Audit Fees: | | |
| Audit | 2021 | 168,000 |
| | 2022 | 172,000 |
| | | |
| b) Audit-Related Fees: | | |
| | 2021 | 2,000 |
| | 2022 | 3,000 |
| | | |
| c) Tax Fees: | | |
| | 2021 | 12,000 |
| | 2022 | 11,000 |
| | The tax fees consist of professional services relating to the preparation of the Registrant’s tax returns. | |
| | | |
| d) All Other Fees: | | |
| | 2021 | None |
| | 2022 | None |
| | | |
| | Adviser and affiliates (includes only fees for non-audit services billed to the adviser and affiliates for engagements that relate directly to the operations and financial reporting of the Registrant and were subject to the pre-approval policies described below): | |
| a) Audit Fees: | | |
| | Not Applicable | |
| | | |
| b) Audit-Related Fees: | | |
| | 2021 | 1,427,000 |
| | 2022 | 2,394,000 |
| | The audit-related fees consist of assurance and related services relating to the examination of the Registrant’s transfer agent, principal underwriter and investment adviser conducted in accordance with Statement on Standards for Attestation Engagements Number 18 issued by the American Institute of Certified Public Accountants. | |
| | | |
| c) Tax Fees: | | |
| | 2021 | 1,000 |
| | 2022 | 394,000 |
| | The tax fees consist of consulting services relating to the Registrant’s investments. | |
| | | |
| | | |
| d) All Other Fees: | | |
| | 2021 | 2,000 |
| | 2022 | None |
| | The other fees consist of subscription services related to an accounting research tool. | |
| | | |
| | | |
| | All audit and permissible non-audit services that the Registrant’s audit committee considers compatible with maintaining the independent registered public accounting firm’s independence are required to be pre-approved by the committee. The pre-approval requirement will extend to all non-audit services provided to the Registrant, the investment adviser, and any entity controlling, controlled by, or under common control with the investment adviser that provides ongoing services to the Registrant, if the engagement relates directly to the operations and financial reporting of the Registrant. The committee will not delegate its responsibility to pre-approve these services to the investment adviser. The committee may delegate to one or more committee members the authority to review and pre-approve audit and permissible non-audit services. Actions taken under any such delegation will be reported to the full committee at its next meeting. The pre-approval requirement is waived with respect to non-audit services if certain conditions are met. The pre-approval requirement was not waived for any of the non-audit services listed above provided to the Registrant, adviser and affiliates. | |
| | | |
| | Aggregate non-audit fees paid to the Registrant’s auditors, including fees for all services billed to the Registrant, adviser and affiliates that provide ongoing services to the Registrant, were $1,443,000 for fiscal year 2021 and $2,802,000 for fiscal year 2022. The non-audit services represented by these amounts were brought to the attention of the committee and considered to be compatible with maintaining the auditors’ independence. | |
ITEM 5 – Audit Committee of Listed Registrants
Not applicable to this Registrant, insofar as the Registrant is not a listed issuer as defined in Rule 10A-3 under the Securities Exchange Act of 1934.
ITEM 6 – Schedule of Investments
Not applicable, insofar as the schedule is included as part of the report to shareholders filed under Item 1 of this Form.
ITEM 7 – Disclosure of Proxy Voting Policies and Procedures for Closed-End Management Investment Companies
Not applicable to this Registrant, insofar as the Registrant is not a closed-end management investment company.
ITEM 8 – Portfolio Managers of Closed-End Management Investment Companies
Not applicable to this Registrant, insofar as the Registrant is not a closed-end management investment company.
ITEM 9 – Purchases of Equity Securities by Closed-End Management Investment Company and Affiliated Purchasers
Not applicable to this Registrant, insofar as the Registrant is not a closed-end management investment company.
ITEM 10 – Submission of Matters to a Vote of Security Holders
There have been no material changes to the procedures by which shareholders may recommend nominees to the Registrant’s board of trustees since the Registrant last submitted a proxy statement to its shareholders. The procedures are as follows. The Registrant has a nominating and governance committee comprised solely of persons who are not considered ‘‘interested persons’’ of the Registrant within the meaning of the Investment Company Act of 1940, as amended. The committee periodically reviews such issues as the board’s composition, responsibilities, committees, compensation and other relevant issues, and recommends any appropriate changes to the full board of trustees. While the committee normally is able to identify from its own resources an ample number of qualified candidates, it will consider shareholder suggestions of persons to be considered as nominees to fill future vacancies on the board. Such suggestions must be sent in writing to the nominating and governance committee of the Registrant, c/o the Registrant’s Secretary, and must be accompanied by complete biographical and occupational data on the prospective nominee, along with a written consent of the prospective nominee for consideration of his or her name by the nominating and governance committee.
ITEM 11 – Controls and Procedures
| (a) | The Registrant’s Principal Executive Officer and Principal Financial Officer have concluded, based on their evaluation of the Registrant’s disclosure controls and procedures (as such term is defined in Rule 30a-3 under the Investment Company Act of 1940), that such controls and procedures are adequate and reasonably designed to achieve the purposes described in paragraph (c) of such rule. |
| | |
| (b) | There were no changes in the Registrant’s internal controls over financial reporting (as defined in Rule 30a-3(d) under the Investment Company Act of 1940) that occurred during the Registrant’s semi-annual period covered by this report that has materially affected, or is reasonably likely to materially affect, the Registrant’s internal control over financial reporting. |
ITEM 12 – Exhibits
| (a)(1) | The Code of Ethics that is the subject of the disclosure required by Item 2 is attached as an exhibit hereto. |
| | |
| (a)(2) | The certifications required by Rule 30a-2 of the Investment Company Act of 1940 and Sections 302 and 906 of the Sarbanes-Oxley Act of 2002 are attached as exhibits hereto. |
SIGNATURES
Pursuant to the requirements of the Securities Exchange Act of 1934 and the Investment Company Act of 1940, the Registrant has duly caused this report to be signed on its behalf by the undersigned, thereunto duly authorized.
| | CAPITAL WORLD BOND FUND |
| | |
| | By __/s/ Kristine M. Nishiyama________________ |
| | Kristine M. Nishiyama, Principal Executive Officer |
| | |
| | Date: February 28, 2023 |
Pursuant to the requirements of the Securities Exchange Act of 1934 and the Investment Company Act of 1940, this report has been signed below by the following persons on behalf of the Registrant and in the capacities and on the dates indicated.
| By _ /s/ Kristine M. Nishiyama_____________ |
Kristine M. Nishiyama, Principal Executive Officer |
| |
| Date: February 28, 2023 |
| By ___/s/ Brian C. Janssen__________________ |
Brian C. Janssen, Treasurer and Principal Financial Officer |
| |
| Date: February 28, 2023 |