UNITED STATES
SECURITIES AND EXCHANGE COMMISSION
Washington, D.C. 20549
|
FORM N-CSR
CERTIFIED SHAREHOLDER REPORT OF REGISTERED
MANAGEMENT INVESTMENT COMPANIES
|
Investment Company Act file number: (811- 00058 )
Exact name of registrant as specified in charter: The George Putnam Fund of Boston
Address of principal executive offices: One Post Office Square, Boston, Massachusetts 02109
| Name and address of agent for service: | Beth S. Mazor, Vice President |
| | One Post Office Square |
| | Boston, Massachusetts 02109 |
| |
| Copy to: | John W. Gerstmayr, Esq. |
| | Ropes & Gray LLP |
| | One International Place |
| | Boston, Massachusetts 02110 |
| |
| Registrant’s telephone number, including area code: | (617) 292-1000 |
Date of fiscal year end: July 31, 2006
Date of reporting period: August 1, 2005—January 31, 2006
Item 1. Report to Stockholders:
The following is a copy of the report transmitted to stockholders pursuant to Rule 30e-1 under the Investment Company Act of 1940:

What makes Putnam different?
|

In 1830, Massachusetts Supreme Judicial Court Justice Samuel Putnam established The Prudent Man Rule, a legal foundation for responsible money management.
THE PRUDENT MAN RULE
All that can be required of a trustee to invest is that he shall conduct himself faithfully and exercise a sound discretion. He is to observe how men of prudence, discretion, and intelligence manage their own affairs, not in regard to speculation, but in regard to the permanent disposition of their funds, considering the probable income, as well as the probable safety of the capital to be invested.

A time-honored tradition
in money management
Since 1937, our values have been rooted
in a profound sense of responsibility for the
money entrusted to us.
A prudent approach to investing
We use a research-driven team approach to seek
consistent, dependable, superior investment
results over time, although there is no guarantee
a fund will meet its objectives.
Funds for every investment goal
We offer a broad range of mutual funds and other
financial products so investors and their financial
representatives can build diversified portfolios.
A commitment to doing
what’s right for investors
We have below-average expenses and stringent
investor protections, and provide a wealth of
information about the Putnam funds.
Industry-leading service
We help investors, along with their financial
representatives, make informed investment
decisions with confidence.
|
The George
Putnam Fund
of Boston
|
1| 31| 06
Semiannual Report
|
| Message from the Trustees | 2 |
| About the fund | 4 |
| Report from the fund managers | 7 |
| Performance | 13 |
| Expenses | 16 |
| Portfolio turnover | 18 |
| Risk | 19 |
| Your fund’s management | 20 |
| Terms and definitions | 23 |
| Trustee approval of management contract | 25 |
| Other information for shareholders | 30 |
| Financial statements | 31 |
| Brokerage commissions | 100 |
Cover photograph: Postage stamps, private collection © White-Packert Photography
Message from the Trustees
|
Dear Fellow Shareholder
The performance of U.S. financial markets in the early weeks of 2006 suggests that investors remain generally optimistic this year. Stocks have advanced briskly while bonds have remained subdued. We consider these results typical of an expanding economy capable of generating both profits and inflation. As is often the case, the fundamental data painted a more conflicted picture than the market’s movements. In the final months of 2005, the economic growth rate slipped to a low level of 1.1%, according to initial estimates. Nevertheless, labor market conditions have strengthened, and energy prices, though elevated, did not spike in the winter months, thanks in part to mild winter weather in many regions of the country. Inflationary pressures remain contained, to borrow the terminology of the U.S. Federal Reserve Board (the Fed). At its January 31 meeting, marking the end of former Chairman Alan Greenspan’s 18 years of service, the Fed again raised interest rates, but hinted that the end of this tightening cycle might not be far away. Whatever the course the economy and monetary policy take in coming months, in our view it is fortunate that the Fed’s new Chairman, Ben Bernanke, like his predecessor, regards the Fed’s role in pursuing both price stability and economic growth as essential to encouraging investment.
Although there is no guarantee a fund will achieve its objectives, we believe that the professional research, diversification, and active management that mutual funds provide continue to make them an intelligent choice for investors. We want you to know that Putnam Investments, under the leadership of Chief Executive Officer Ed Haldeman, continues to focus on delivering consistent, dependable, superior investment performance over time.
2
In the following pages, members of your fund’s management team discuss the fund’s performance and strategies, and their outlook for the months ahead. We thank you for your support of the Putnam funds.

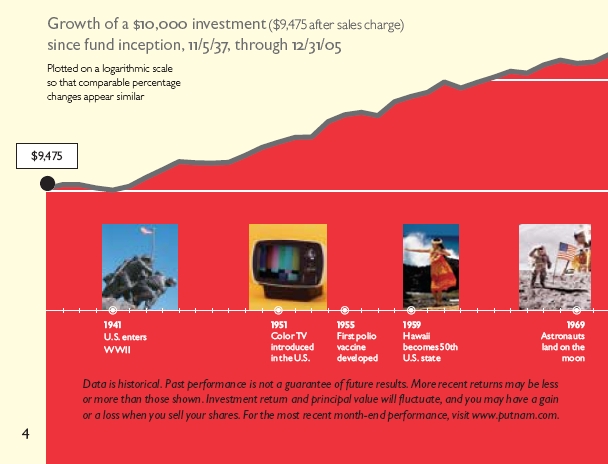
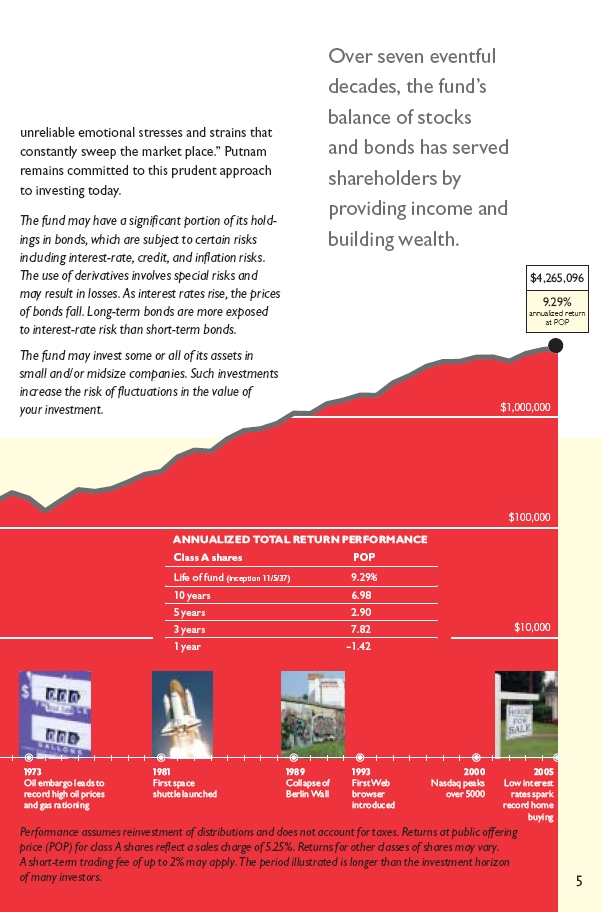
The George Putnam Fund of Boston: providing the
benefits of balanced investing for nearly 70 years
|
Your fund launched in 1937 when George Putnam, a Boston investment manager, decided to start a fund with an innovative approach — a balance of stocks to seek capital appreciation and bonds to help provide current income. The original portfolio featured industrial stocks, such as U.S. Smelting, Refining, & Mining Co., and railroad bonds.
This balanced approach made sense then, and we believe it continues to make sense now. In the late 1930s, the stock market experienced dramatic swings as businesses struggled to recover from the Great Depression and as the shadow of war began to spread across Europe and Asia. Today, global political and economic uncertainties also challenge investors.
Although the fund has experienced volatility at times, its balanced approach has kept it on course. When stocks were weak, the fund’s bonds helped results. Similarly, stocks have often provided leadership when bonds were hurt by rising interest rates or inflation.
In a letter to shareholders dated July 12, 1938, George Putnam articulated the balanced strategy: “Successful investing calls not so much for some clairvoyant ability to read the future as for the courage to stick to tested, common sense policies in the face of the
The George Putnam Fund of Boston seeks to provide a balanced investment composed of a well-diversified portfolio of stocks and bonds that produce both capital growth and current income. The fund targets attractively priced stocks of large, established, dividend-paying companies that the management team believes are poised to experience positive change and improved financial performance. The bond portion is a diversified mix of mainly investment-grade securities. The fund may be appropriate for investors seeking current income and long-term growth from a balanced investment.
| Highlights |
| * For the six months ended January 31, 2006, The George Putnam Fund of Boston’s class A |
| shares returned 2.75% without sales charges. |
* The fund’s equity benchmark changed after the end of the reporting period. The new bench- |
| mark, the S&P 500/Citigroup Value Index, returned 6.92% for the period, while the former |
| benchmark, the S&P 500/Barra Value Index, returned 6.47%. The fund’s bond benchmark, |
| the Lehman Aggregate Bond Index, returned 0.84% over the same period. |
* The fund’s custom benchmark, intended to provide a suitable performance target for a balanced |
| fund, is made up of 60% S&P 500/Citigroup Value Index and 40% Lehman Aggregate Bond |
| Index. It returned 4.52% for the period. Using the former equity benchmark, the S&P 500/Barra |
| Value Index, this custom benchmark returned 4.26%. |
* The average return for the fund’s Lipper category, Balanced Funds, was 4.47%. |
* Additional fund performance, comparative performance, and Lipper data can be found in the |
| performance section beginning on page 13. |
Performance
Total return for class A shares for periods ended 1/31/06
| Since the fund’s inception (11/5/37), average annual return is 9.39% at NAV and 9.31% at POP. | |
|
| | Average annual return | Cumulative return |
| | NAV | POP | NAV | POP |
|
| 10 years | 7.53% | 6.95% | 106.69% | 95.79% |
|
| 5 years | 4.17 | 3.05 | 22.68 | 16.23 |
|
| 3 years | 10.94 | 8.96 | 36.56 | 29.37 |
|
| 1 year | 6.61 | 1.03 | 6.61 | 1.03 |
|
| 6 months | — | — | 2.75 | –2.65 |
|
Data is historical. Past performance does not guarantee future results. More recent returns may be less or more than those shown. Investment return and principal value will fluctuate, and you may have a gain or a loss when you sell your shares. Performance assumes reinvestment of distributions and does not account for taxes. Returns at NAV do not reflect a sales charge of 5.25% . For the most recent month-end performance, visit www.putnam.com. A short-term trading fee of up to 2% may apply.
6
Report from the fund managers
|
The period in review
Given an environment that was generally favorable for equities but less so for bonds, your fund generated modest returns for the first six months of its 2006 fiscal year. The fund’s positioning within sectors and individual security selections were generally positive, with a few exceptions that detracted from the fund’s performance relative to its benchmarks and the average for its Lipper category. For example, we deliberately emphasized larger-capitalization stocks, which, in our opinion, offered more compelling valuations. However, smaller-cap stocks continued to outperform larger caps, and in January 2006 they led larger caps by a particularly wide margin. Nevertheless, for a number of reasons, we believe that the fund’s larger-cap bias will prove rewarding in the coming months. The fund benefited from effective weightings and stock selection within the energy, utilities, and capital goods sectors. Meanwhile, certain technology, health-care, and conglomerates stocks detracted from returns. The fund’s bond portfolio outperformed its benchmark and helped stabilize fund returns in the midst of a volatile market.
U.S. financial markets experienced a fair amount of volatility in the first six months of the fund’s fiscal year. The economy weathered a number of stress factors, including an ongoing war, major hurricane damage, sustained high energy prices, and rising interest rates. The Federal Reserve Board (the Fed) raised the federal funds rate (the interest banks charge each other for overnight loans needed to maintain reserve levels) five times during the period, continuing its efforts to slow economic growth and curb inflation. Consequently, the federal funds rate increased from 3.25% to 4.50% . The yield curve, a graphical representation of interest rates across all bond maturities, flattened as short-term borrowing rates increased more than long-term rates. Despite this, U.S. gross domestic product (GDP) grew at a healthy rate of
7
3.6% in 2005. Inflation remained low. Stock market returns, while positive, were generally modest, with most major stock market indexes posting single-digit returns. Stocks outperformed bonds by a wide margin. Within equities, value stocks outpaced growth stocks rather significantly. Small-capitalization stocks outpaced larger-cap stocks — a trend that has continued for several years. Lower-yielding stocks outpaced those offering higher yields.
The market’s strongest-performing sectors were energy, transportation, and basic materials. The weakest sectors included consumer cyclicals, conglomerates, and communications services.
Because the Fed raised the federal funds rate consistently during the year while the central banks of most other nations did not, U.S. interest rates became more attractive in a global context. This helped explain the surprising strength of the U.S. dollar versus other currencies.
Strategy overview
After many months of interest-rate increases, we believe that the Fed is nearing the end of its restrictive monetary policy. In our view, bond market futures suggest a high probability of another rate increase in March 2006, but perhaps no further increases after that. Historically, bond prices have risen at the end of a tightening cycle. Accordingly, we adjusted the portfolio’s allocation during the period from 60% stocks, 35% bonds,
| Market sector performance | |
| These indexes provide an overview of performance in different market sectors for the | |
| six months ended 1/31/06. | |
|
| |
| Equities | |
| S&P 500/Citigroup Value Index (large-company value stocks) | 6.92% |
|
| Russell 2000 Growth Index (small-company growth stocks) | 10.71% |
|
| Russell 2000 Value Index (small-company value stocks) | 6.31% |
|
| Russell 1000 Index (large-company stocks) | 5.04% |
|
| Bonds | |
| Lehman Aggregate Bond Index (broad bond market) | 0.84% |
|
| JP Morgan Global High Yield Index (global high-yield corporate bonds) | 1.83% |
|
| Lehman Government Bond Index (U.S. Treasury and agency securities) | 0.77% |
|
8
and 5% cash to approximately 60% stocks and 40% bonds. The portfolio remained positioned to benefit from an increase in corporate capital spending, because we believe that businesses have sufficient cash flow to invest in upgrades and improvements. In addition, weaker-than-expected holiday sales suggest that consumers had begun to rein in their spending.
Relative to the fund’s equity benchmark, the portfolio had greater weightings in the technology, energy, health-care, and consumer staples sectors. It had underweight positions in communications services, financials, and utilities. With regard to other sectors, the portfolio is neutrally weighted, comparable to the benchmark.
With regard to the bond benchmark, the fund’s portfolio was overweighted in collateralized mortgage obligations, asset-backed securities, and mortgage-backed securities. It had underweight positions in investment-grade corporate bonds and mortgage pass-through securities. The
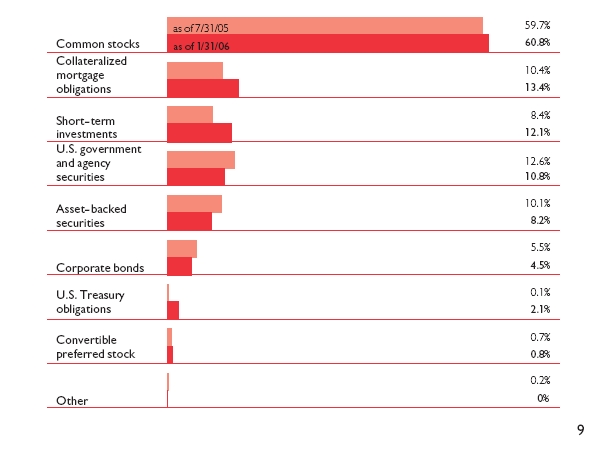
Portfolio composition comparison
This chart shows how the fund’s weightings have changed over the last six months.
Weightings are shown as a percentage of net assets. Holdings will vary over time.
fund’s bond portfolio also had a shorter duration (i.e., a lower level of sensitivity to changes in interest rates) than its benchmark. Combined, these strategies helped the bond portfolio outperform its benchmark, the Lehman Aggregate Bond Index, during the period.
Your fund’s holdings
As might be expected in a well-diversi-fied fund with numerous holdings, some holdings were standout performers for the period, while others disappointed. In a period of consistently high energy prices and strong demand, it should be no surprise that Marathon Oil and Amerada Hess were among the best-performing stocks in the portfolio. Both are diversified energy companies that explore for, extract, refine, transport, and market petroleum products. Both significantly increased their revenues and earnings during the period. In addition to these favorable statistics, we believe both companies have demonstrated fundamental improvements in production growth, and their management teams are focused on providing shareholders with higher returns. The portfolio is overweighted in both names relative to the benchmark, although we took some profits on the Amerada Hess position during the period.
In the utilities sector, fund holding Exelon was a strong performer. Exelon produces electricity and distributes it in Illinois and Pennsylvania. The company operates nuclear power plants, which are the most cost-efficient method of
Top equity holdings
This table shows the fund's top equity holdings, and the percentage of the fund's net assets that each comprised, as of 1/31/06. The fund's holdings will change over time.
| Holding (percent of fund's net assets) | Industry |
| Bank of America Corp. (2.7%) | Banking |
|
| Citigroup, Inc. (2.6%) | Financial |
|
| Exxon Mobil Corp. (2.5%) | Oil and gas |
|
| Chevron Corp. (1.9%) | Oil and gas |
|
| Pfizer, Inc. (1.8%) | Pharmaceuticals |
|
| U.S. Bancorp (1.5%) | Banking |
|
| Freddie Mac (1.3%) | Financial |
|
| Hewlett-Packard Co. (1.3%) | Computers |
|
| ACE, Ltd. (Bermuda) (1.2%) | Insurance |
|
| Tyco International, Ltd. (Bermuda) (1.1%) | Conglomerates |
|
10
generating electricity. Thus, the company has the advantage of lower production costs to improve its cash flow and bottom line. We have held this stock for a few years, in anticipation of the time when its fixed, below-market pricing structure, set when the industry was deregulated three years ago, would expire and the company could begin to charge market rates. Recent legislation opened the doors for market rates and the rising stock price reflected this positive news. In the financial sector, fund holding Ace Limited, a property and casualty insurer, benefited from higher pricing, which it was able to secure because of the severity of the damage in hurricane-struck regions in 2005. In the wake of the hurricanes, the need for transporting both coal and building materials jumped sharply higher. The Norfolk Southern Railway Company addressed that urgent need and, consequently, its parent company, Norfolk Southern, was able to raise prices. The company’s stock appreciated as a result and contributed to the fund’s returns.
A handful of stocks disappointed during the period. Tyco International had been performing well in recent years following a very successful turnaround. The market viewed Tyco’s decision to split the conglomerate into three distinct units as a positive. These units will consist of health care; electronics; and fire- and security-engineered products and services. However, Tyco’s stock price fell following news of a product recall in the health-care segment and slimmer-than-expected margins in the fire and safety segment. We believe these are short-term difficul-ties and that the stock price will recover, so we continue to hold the position. Intel, which manufactures semiconductors and is known for its Pentium processor, faced stiff competition from Advanced Micro Devices, which gained market share. This hurt Intel during the period. Masco manufactures plumbing, cabinetry, and paints for home use. As the market for new housing softened, so did Masco’s stock price. Yet Masco’s product line is more focused on rebuilding and renovation projects, and we believe it remains an attractive holding for the long term. Cendant owns an array of travel-related businesses, including car rental agencies, hotel chains, and travel agencies. In addition, it operates real estate brokerages and tax-preparation services. All of these businesses are closely aligned with the consumer spending cycle. As consumer spending began to slow, this stock underperformed. We continue to hold the position and believe the stock may recover in time.
Please note that the holdings discussed in this report may not have been held by the fund for the entire period. Portfolio composition is subject to review in accordance with the fund’s investment strategy and may vary in the future.
11
The outlook for your fund
|
The following commentary reflects anticipated developments that could affect your fund over the next six months, as well as your management team’s plans for responding to them.
For some time, the fund has been positioned to benefit from an increase in corporate capital spending, and from an anticipated softening in consumer spending. We believe the Fed may be near the end of its tightening cycle. Yet, we anticipate that interest rates will rise further in 2006. We believe that energy prices will remain high, driven by increasing worldwide demand, especially from China and other emerging markets. Consumers are feeling the pinch of higher fuel costs, both at the gasoline pump and in their heating bills. In addition, anecdotal evidence suggests that the housing market is slowing. Thus far in the economic recovery, inflation has not been a major issue, but we continue to monitor the economy for signs of increasing inflationary pressure. We believe these trends support our expectation of a less robust consumer sector.
The major rebuilding effort following last year’s devastating hurricanes boosted demand for building supplies, transport, and labor, and has spurred businesses in many sectors. In addition, in the highly competitive retail market, some suppliers are finding that manufacturing in the United States can be more profitable than outsourcing to foreign countries, as it enables them to respond more quickly to current trends. These and other factors have given businesses more pricing power that should enhance their profitability. Also, after years of solid earnings and higher profits, corporate coffers are well padded. Many companies are paying higher dividends or are repurchasing shares to enhance shareholder value. Mergers and acquisitions are on the rise, and these are signs that businesses are increasingly willing to spend capital. We anticipate greater capital expenditures on technology, in particular. Your fund is well positioned to take advantage of an increase in corporate capital spending.
The views expressed in this report are exclusively those of Putnam Management. They are not meant as investment advice.
The fund may invest a portion of its assets in small and/or midsize companies. Such investments increase the risk of fluctuations in the value of your investment. The use of derivatives involves special risks and may result in losses.
This fund may have a significant portion of its holdings in bonds. Mutual funds that invest in bonds are subject to certain risks, including interest-rate risk, credit risk, and inflation risk. As interest rates rise, the prices of bonds fall. Long-term bonds are more exposed to interest-rate risk than short-term bonds. Unlike bonds, bond funds have ongoing fees and expenses.
12
This section shows your fund’s performance during the first half of its fiscal year, which ended January 31, 2006. In accordance with regulatory requirements for mutual funds, we also include performance for the most recent calendar quarter-end. Performance should always be considered in light of a fund’s investment strategy. Data represents past performance. Past performance does not guarantee future results. More recent returns may be less or more than those shown. Investment return and principal value will fluctuate, and you may have a gain or a loss when you sell your shares. For the most recent month-end performance, please visit www.putnam.com or call Putnam at 1-800-225-1581. Class Y shares are generally only available to corporate and institutional clients. See the Terms and Definitions section in this report for definitions of the share classes offered by your fund.
| Fund performance | | | | | | | | |
| Total return for periods ended 1/31/06 | | | | | | | |
|
| |
| | Class A | | Class B | | Class C | | Class M | | Class R | Class Y |
| (inception dates) | (11/5/37) | | (4/27/92) | | (7/26/99) | | (12/1/94) | | (1/21/03) | (3/31/94) |
| | NAV | POP | NAV | CDSC | NAV | CDSC | NAV | POP | NAV | NAV |
|
| Annual average | | | | | | | | | | |
| (life of fund) | 9.39% | 9.31% | 8.36% | 8.36% | 8.57% | 8.57% | 8.63% | 8.58% | 9.12% | 9.44% |
|
| 10 years | 106.69 | 95.79 | 91.78 | 91.78 | 91.65 | 91.65 | 96.82 | 90.41 | 101.76 | 111.98 |
| Annual average | 7.53 | 6.95 | 6.73 | 6.73 | 6.72 | 6.72 | 7.01 | 6.65 | 7.27 | 7.80 |
|
| 5 years | 22.68 | 16.23 | 18.21 | 16.21 | 18.15 | 18.15 | 19.75 | 15.84 | 21.27 | 24.31 |
| Annual average | 4.17 | 3.05 | 3.40 | 3.05 | 3.39 | 3.39 | 3.67 | 2.98 | 3.93 | 4.45 |
|
| 3 years | 36.56 | 29.37 | 33.54 | 30.54 | 33.52 | 33.52 | 34.60 | 30.27 | 35.63 | 37.57 |
| Annual average | 10.94 | 8.96 | 10.12 | 9.29 | 10.12 | 10.12 | 10.41 | 9.21 | 10.69 | 11.22 |
|
| 1 year | 6.61 | 1.03 | 5.85 | 0.85 | 5.86 | 4.86 | 6.15 | 2.67 | 6.40 | 6.92 |
|
| 6 months | 2.75 | –2.65 | 2.31 | –2.63 | 2.33 | 1.34 | 2.52 | –0.80 | 2.63 | 2.82 |
|
Performance assumes reinvestment of distributions and does not account for taxes. Returns at public offering price (POP) for class A and M shares reflect a sales charge of 5.25% and 3.25%, respectively. Class B share returns reflect the applicable contingent deferred sales charge (CDSC), which is 5% in the first year, declining to 1% in the sixth year, and is eliminated thereafter. Class C shares reflect a 1% CDSC the first year that is eliminated thereafter. Class R and Y shares have no initial sales charge or CDSC. Performance for class B, C, M, R, and Y shares before their inception is derived from the historical performance of class A shares, adjusted for the applicable sales charge (or CDSC) and, except for class Y shares, the higher operating expenses for such shares.
A 2% short-term trading fee may be applied to shares exchanged or sold within 5 days of purchase.
13
| Comparative index returns | | | | |
| |
| For periods ended 1/31/06 | | | | |
|
| |
| | | Lehman | George | Lipper |
| | S&P 500/ | S&P 500/ | Aggregate | Putnam | Balanced |
| | Citigroup | Barra Value | Bond | Blended | Funds category |
| | Value Index* | Index* | Index | Index | average§ |
|
| Annual average | | | | | | |
| (life of fund) | —† | —† | —† | —‡ | —† | —† |
|
| 10 years | 146.29% | 147.30% | 80.70% | 125.29% | 127.09% | 102.29% |
| Annual average | 9.43 | 9.48 | 6.10 | 8.46 | 8.55 | 7.13 |
|
| 5 years | 27.47 | 12.39 | 30.89 | 31.39 | 22.27 | 14.56 |
| Annual average | 4.97 | 2.36 | 5.53 | 5.61 | 4.10 | 2.65 |
|
| 3 years | 72.57 | 72.34 | 11.17 | 45.68 | 45.63 | 39.91 |
| Annual average | 19.95 | 19.89 | 3.59 | 13.36 | 13.35 | 11.80 |
|
| 1 year | 14.10 | 12.66 | 1.80 | 9.17 | 8.34 | 8.60 |
|
| 6 months | 6.92 | 6.47 | 0.84 | 4.52 | 4.26 | 4.47 |
|
Index and Lipper results should be compared to fund performance at net asset value.
* Putnam Management has recently undertaken a review of the fund’s benchmarks. The S&P 500/Citigroup Value Index re-
placed the S&P 500/Barra Value Index as the fund’s equity benchmark because, in Putnam Management’s opinion, the
securities tracked by this index more accurately reflect the types of equity securities that generally will be held by the fund. |
† The indexes and Lipper category were not in existence at the time of the fund’s inception. The S&P 500/Citigroup Value
Index commenced 6/30/95. The S&P 500/Barra Value Index commenced 12/31/74. The Lehman Aggregate Bond Index
commenced 12/31/75. The George Putnam Blended Index, with the S&P 500/Barra Value Index as its equity component,
commenced 12/31/86. The Lipper average commenced 12/31/59.
|
‡ The George Putnam Blended Index has been revised to reflect the fund's new benchmark, the S&P 500/Citigroup Value
Index, as its equity component. Commencement date for the revised Blended Index is 6/30/95.
|
§ Over the 6-month and 1-, 3-, 5-, and 10-year periods ended 1/31/06, there were 698, 660, 482, 387, and 182 funds, respectively,
in this Lipper category.
|
14
| Fund price and distribution information | | | |
| For the six-month period ended 1/31/06 | | | | | |
|
| |
| Distributions* | Class A | | Class B | Class C | Class M | | Class R | Class Y |
|
| Number | 2 | | 2 | 2 | 2 | | 2 | 2 |
|
| Income | $0.301 | $0.229 | $0.233 | $0.255 | $0.279 | $0.325 |
|
| Capital gains | | | | | | | | |
|
| Long-term | $0.358 | $0.358 | $0.358 | $0.358 | $0.358 | $0.358 |
|
| Short-term | $0.023 | $0.023 | $0.023 | $0.023 | $0.023 | $0.023 |
|
| Total | $0.682 | $0.610 | $0.614 | $0.636 | $0.660 | $0.706 |
|
| Share value: | NAV | POP | NAV | NAV | NAV | POP | NAV | NAV |
|
| 7/31/05 | $18.40 | $19.42 | $18.22 | $18.30 | $18.22 | $18.83 | $18.36 | $18.46 |
|
| 1/31/06 | 18.21 | 19.22 | 18.02 | 18.10 | 18.03 | 18.64 | 18.17 | 18.26 |
|
| Current yield | | | | | | | | |
| (end of period) | | | | | | | | |
|
| Current | | | | | | | | |
| dividend rate1 | 2.20% | 2.08% | 1.42% | 1.48% | 1.71% | 1.65% | 1.96% | 2.45% |
|
| Current 30-day | | | | | | | | |
| SEC yield2 | 2.32 | 2.20 | 1.57 | 1.57 | 1.82 | 1.76 | 2.08 | 2.57 |
|
* Dividend sources are estimated and may vary based on final tax calculations after the fund’s fiscal year-end.
1 Most recent distribution, excluding capital gains, annualized and divided by NAV or POP at end of period.
2 Based only on investment income, calculated using SEC guidelines.
Fund performance for most recent calendar quarter
Total return for periods ended 12/31/05
|
| | Class A | | Class B | | Class C | | Class M | | Class R | Class Y |
| (inception dates) | (11/5/37) | | (4/27/92) | | (7/26/99) | | (12/1/94) | | (1/21/03) | (3/31/94) |
| | NAV | POP | NAV | CDSC | NAV | CDSC | NAV | POP | NAV | NAV |
|
| Annual average | | | | | | | | | | |
| (life of fund) | 9.38% | 9.29% | 8.35% | 8.35% | 8.56% | 8.56% | 8.62% | 8.57% | 9.11% | 9.43% |
|
| 10 years | 107.33 | 96.44 | 92.45 | 92.45 | 92.27 | 92.27 | 97.42 | 90.97 | 102.32 | 112.64 |
| Annual average | 7.56 | 6.98 | 6.77 | 6.77 | 6.76 | 6.76 | 7.04 | 6.68 | 7.30 | 7.84 |
|
| 5 years | 21.78 | 15.39 | 17.32 | 15.32 | 17.27 | 17.27 | 18.86 | 15.01 | 20.30 | 23.33 |
| Annual average | 4.02 | 2.90 | 3.25 | 2.89 | 3.24 | 3.24 | 3.52 | 2.84 | 3.77 | 4.28 |
|
| 3 years | 32.30 | 25.35 | 29.38 | 26.38 | 29.40 | 29.40 | 30.43 | 26.21 | 31.40 | 33.38 |
| Annual average | 9.78 | 7.82 | 8.97 | 8.12 | 8.97 | 8.97 | 9.26 | 8.07 | 9.53 | 10.08 |
|
| 1 year | 4.04 | –1.42 | 3.27 | –1.69 | 3.24 | 2.24 | 3.56 | 0.20 | 3.77 | 4.29 |
|
| 6 months | 2.73 | –2.64 | 2.35 | –2.60 | 2.31 | 1.32 | 2.50 | –0.82 | 2.56 | 2.86 |
|
15
As a mutual fund investor, you pay ongoing expenses, such as management fees, distribution fees (12b-1 fees), and other expenses. Using the information below, you can estimate how these expenses affect your investment and compare them with the expenses of other funds. You may also pay one-time transaction expenses, including sales charges (loads) and redemption fees, which are not shown in this section and would have resulted in higher total expenses. For more information, see your fund’s prospectus or talk to your financial advisor.
Review your fund’s expenses
The table below shows the expenses you would have paid on a $1,000 investment in The George Putnam Fund of Boston from August 1, 2005, to January 31, 2006. It also shows how much a $1,000 investment would be worth at the close of the period, assuming actual returns and expenses.
| | Class A | Class B | Class C | Class M | Class R | Class Y |
|
| Expenses paid per $1,000* | $ 4.85 | $ 8.67 | $ 8.67 | $ 7.40 | $ 6.13 | $ 3.58 |
|
| Ending value (after expenses) | $1,027.50 | $1,023.10 | $1,023.30 | $1,025.20 | $1,026.30 | $1,028.20 |
|
* Expenses for each share class are calculated using the fund’s annualized expense ratio for each class, which represents the ongoing expenses as a percentage of net assets for the six months ended 1/31/06. The expense ratio may differ for each share class (see the table at the bottom of the next page). Expenses are calculated by multiplying the expense ratio by the average account value for the period; then multiplying the result by the number of days in the period; and then dividing that result by the number of days in the year.
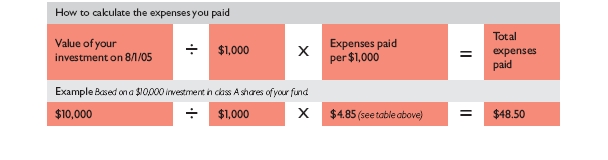
Estimate the expenses you paid
To estimate the ongoing expenses you paid for the six months ended January 31, 2006, use the calculation method below. To find the value of your investment on August 1, 2005, go to www.putnam.com and log on to your account. Click on the “Transaction History” tab in your Daily Statement and enter 08/01/2005 in both the “from” and “to” fields. Alternatively, call Putnam at 1-800-225-1581.
16
Compare expenses using the SEC’s method
The Securities and Exchange Commission (SEC) has established guidelines to help investors assess fund expenses. Per these guidelines, the table below shows your fund’s expenses based on a $1,000 investment, assuming a hypothetical 5% annualized return. You can use this information to compare the ongoing expenses (but not transaction expenses or total costs) of investing in the fund with those of other funds. All mutual fund shareholder reports will provide this information to help you make this comparison. Please note that you cannot use this information to estimate your actual ending account balance and expenses paid during the period.
| | Class A | Class B | Class C | Class M | Class R | Class Y |
|
| Expenses paid per $1,000* | $ 4.84 | $ 8.64 | $ 8.64 | $ 7.37 | $ 6.11 | $ 3.57 |
|
| Ending value (after expenses) | $1,020.42 | $1,016.64 | $1,016.64 | $1,017.90 | $1,019.16 | $1,021.68 |
|
* Expenses for each share class are calculated using the fund’s annualized expense ratio for each class, which represents the ongoing expenses as a percentage of net assets for the six months ended 1/31/06. The expense ratio may differ for each share class (see the table at the bottom of this page). Expenses are calculated by multiplying the expense ratio by the average account value for the period; then multiplying the result by the number of days in the period; and then dividing that result by the number of days in the year.
Compare expenses using industry averages
You can also compare your fund’s expenses with the average of its peer group, as defined by Lipper, an independent fund-rating agency that ranks funds relative to others that Lipper considers to have similar investment styles or objectives. The expense ratio for each share class shown below indicates how much of your fund’s net assets have been used to pay ongoing expenses during the period.
| | Class A | Class B | Class C | Class M | Class R | Class Y |
| Your fund's annualized | | | | | | |
| expense ratio | 0.95% | 1.70% | 1.70% | 1.45% | 1.20% | 0.70% |
|
| Average annualized expense ratio | | | | | | |
| for Lipper peer group* | 1.27% | 2.02% | 2.02% | 1.77% | 1.52% | 1.02% |
|
* Simple average of the expenses of all front-end load funds in the fund’s Lipper peer group, calculated in accordance with Lipper’s standard method for comparing fund expenses (excluding 12b-1 fees and without giving effect to any expense offset and brokerage service arrangements that may reduce fund expenses). This average reflects each fund’s expenses for its most recent fiscal year available to Lipper as of 12/31/05. To facilitate comparison, Putnam has adjusted this average to reflect the 12b-1 fees carried by each class of shares other than class Y shares, which do not incur 12b-1 fees. The peer group may include funds that are significantly smaller or larger than the fund, which may limit the comparability of the fund’s expenses to the simple average, which typically is higher than the asset-weighted average.
17
Your fund’s
portfolio turnover
|
Putnam funds are actively managed by teams of experts who buy and sell securities based on intensive analysis of companies, industries, economies, and markets. Portfolio turnover is a measure of how often a fund’s managers buy and sell securities for your fund. A portfolio turnover of 100%, for example, means that the managers sold and replaced securities valued at 100% of a fund’s assets within a one-year period. Funds with high turnover may be more likely to generate capital gains and dividends that must be distributed to shareholders as taxable income. High turnover may also cause a fund to pay more brokerage commissions and other transaction costs, which may detract from performance.
Funds that invest in bonds or other fixed-income instruments may have higher turnover than funds that invest only in stocks. Short-term bond funds tend to have higher turnover than longer-term bond funds, because shorter-term bonds will mature or be sold more frequently than longer-term bonds. You can use the table below to compare your fund’s turnover with the average turnover for funds in its Lipper category.
| Turnover comparisons | | | | | |
| Percentage of holdings that change every year | | | |
|
| |
| | 2005 | 2004 | 2003 | 2002 | 2001 |
| The George Putnam | | | | | |
| Fund of Boston | 169%* | 166% | 121%†‡ | 132%† | 333% |
|
| Lipper Balanced Funds | | | | | |
| category average | 61% | 69% | 75% | 77% | 78% |
|
Turnover data for the fund is calculated based on the fund’s fiscal-year period, which ends on July 31. Turnover data for the fund’s Lipper category is calculated based on the average of the turnover of each fund in the category for its fiscal year ended during the indicated year. Fiscal years vary across funds in the Lipper category, which may limit the comparability of the fund’s portfolio turnover rate to the Lipper average. Comparative data for 2005 is based on information available as of 12/31/05.
* Portfolio turnover excludes dollar roll transactions.
|
† Portfolio turnover excludes certain Treasury note transactions executed in connection with a short-term trading strategy.
‡ Portfolio turnover excludes the impact of assets received from the acquisition of Putnam Balanced Fund and Putnam Balanced Retirement Fund.
18
This risk comparison is designed to help you understand how your fund compares with other funds. The comparison utilizes a risk measure developed by Morningstar, an independent fund-rating agency. This risk measure is referred to as the fund’s Overall Morningstar Risk.
Your fund’s Overall Morningstar® Risk
|
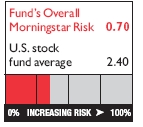
Your fund’s Overall Morningstar Risk is shown alongside that of the average fund in its broad asset class, as determined by Morningstar. The risk bar broadens the comparison by translating the fund’s Overall Morningstar Risk into a percentile, which is based on the fund’s ranking among all funds rated by Morningstar as of December 31, 2005. A higher Overall Morningstar Risk generally indicates that a fund’s monthly returns have varied more widely.
Morningstar determines a fund’s Overall Morningstar Risk by assessing variations in the fund’s monthly returns - with an emphasis on downside variations - over 3-, 5-, and 10-year periods, if available. Those measures are weighted and averaged to produce the fund’s Overall Morningstar Risk. The information shown is provided for the fund’s class A shares only; information for other classes may vary. Overall Morningstar Risk is based on historical data and does not indicate future results. Morningstar does not purport to measure the risk associated with a current investment in a fund, either on an absolute basis or on a relative basis. Low Overall Morningstar Risk does not mean that you cannot lose money on an investment in a fund. Copyright 2006 Morningstar, Inc. All Rights Reserved. The information contained herein (1) is proprietary to Morningstar and/or its content providers; (2) may not be copied or distributed; and (3) is not warranted to be accurate, complete, or timely. Neither Morningstar nor its content providers are responsible for any damages or losses arising from any use of this information.
19
Your fund is managed by the members of the Putnam Large-Cap Value, Core Fixed-Income, and Global Asset Allocation teams. Jeanne Mockard is the Portfolio Leader of the fund. Geoffrey Kelley, Jeffrey Knight, and Raman Srivastava are Portfolio Members. The Portfolio Leader and Portfolio Members coordinate the teams’ management of the fund.
For a complete listing of the members of the Putnam Large-Cap Value, Core Fixed-Income, and Global Asset Allocation teams, including those who are not Portfolio Leaders or Portfolio Members of your fund, visit Putnam’s Individual Investor Web site at www.putnam.com.
Fund ownership by the Portfolio Leader and Portfolio Members
The table below shows how much the fund’s current Portfolio Leader and Portfolio Members have invested in the fund (in dollar ranges). Information shown is as of January 31, 2006, and January 31, 2005.
| | | | $1 – | $10,001 – | $50,001 – | $100,001 – | $500,001 – | $1,000,001 |
| | Year | $0 | $10,000 | $50,000 | $100,000 | $500,000 | $1,000,000 | and over |
|
| Jeanne Mockard | 2006 | | | | * | | | |
|
|
| Portfolio Leader | 2005 | | | * | | | | |
|
| Geoffrey Kelley | N/A | | | | | | | |
|
|
| Portfolio Member | N/A | | | | | | | |
|
| Jeffrey Knight | 2006 | * | | | | | | |
|
|
| Portfolio Member | 2005 | * | | | | | | |
|
| Raman Srivastava | 2006 | | | | * | | | |
|
|
| Portfolio Member | 2005 | | | * | | | | |
|
N/A indicates the individual became a Portfolio Leader or Portfolio Member after the reporting date.
20
Fund manager compensation
|
The total 2005 fund manager compensation that is attributable to your fund is approximately $2,300,000. This amount includes a portion of 2005 compensation paid by Putnam Management to the fund managers assigned to the fund as of January 31, 2006, for their portfolio management responsibilities, calculated based on the fund assets they manage taken as a percentage of the total assets they manage. The compensation amount also includes a portion of the 2005 compensation paid to the Chief Investment Officers of the teams and the Group Chief Investment Officers of the fund’s broader investment categories for their oversight responsibilities, calculated based on the fund assets they oversee taken as a percentage of the total assets they oversee. This amount does not include compensation of other personnel involved in research, trading, administration, systems, compliance, or fund operations; nor does it include non-compensation costs. These percentages are determined as of the fund’s fiscal period-end. For personnel who joined Putnam Management during or after 2005, the calculation reflects annualized 2005 compensation or an estimate of 2006 compensation, as applicable.
Other Putnam funds managed by the Portfolio Leader and Portfolio Members
Jeanne Mockard is also a Portfolio Member of Putnam Equity Income Fund.
Jeffrey Knight is also a Portfolio Leader of the three Putnam Asset Allocation Funds, Putnam Income Strategies Fund, and the ten Putnam RetirementReady Funds.
Raman Srivastava is also a Portfolio Member of Putnam Income Fund.
Jeanne Mockard, Geoffrey Kelley, Jeffrey Knight, and Raman Srivastava may also manage other accounts and variable trust funds advised by Putnam Management or an affiliate.
Changes in your fund’s Portfolio Leader and Portfolio Members
During the year ended January 31, 2006, Michael Abata joined your fund’s management team as a Portfolio Member. However, shortly after the fiscal period-end, he, as well as Portfolio Member Kevin Cronin, left the team in order to focus on their other responsibilities at Putnam. At the same time, Geoffrey Kelley joined the team as a Portfolio Member.
Geoffrey Kelley joined Putnam in 1994. Currently, he is a Portfolio Manager, and in the past five years, his previous position at Putnam was Quantitative Portfolio Specialist.
21
Fund ownership by Putnam’s Executive Board
The table below shows how much the members of Putnam’s Executive Board have invested in the fund (in dollar ranges). Information shown is as of January 31, 2006, and January 31, 2005.
| | | | | $1 – | $10,001 – | $50,001– | $100,001 |
| | Year | | $0 | $10,000 | $50,000 | $100,000 | and over |
|
| Philippe Bibi | 2006 | | * | | | | |
|
|
| Chief Technology Officer | 2005 | | * | | | | |
|
| Joshua Brooks | 2006 | | | | * | | |
|
|
| Deputy Head of Investments | N/A | | | | | | |
|
| William Connolly | 2006 | | * | | | | |
|
|
| Head of Retail Management | N/A | | | | | | |
|
| Kevin Cronin | 2006 | | | | | * | |
|
|
| Head of Investments | 2005 | | | | | * | |
|
| Charles Haldeman, Jr. | 2006 | | | | * | | |
|
|
| President and CEO | 2005 | | | | * | | |
|
| Amrit Kanwal | 2006 | | * | | | | |
|
|
| Chief Financial Officer | 2005 | | * | | | | |
|
| Steven Krichmar | 2006 | | * | | | | |
|
|
| Chief of Operations | 2005 | | * | | | | |
|
| Francis McNamara, III | 2006 | | | * | | | |
|
|
| General Counsel | 2005 | | | * | | | |
|
| Richard Robie, III | 2006 | | * | | | | |
|
|
| Chief Administrative Officer | 2005 | | * | | | | |
|
| Edward Shadek | 2006 | | * | | | | |
|
|
| Deputy Head of Investments | N/A | | | | | | |
|
| Sandra Whiston | 2006 | | * | | | | |
|
|
| Head of Institutional Management | N/A | | | | | | |
|
N/A indicates the individual was not a member of Putnam’s Executive Board as of 1/31/05.
22
Total return shows how the value of the fund’s shares changed over time, assuming you held the shares through the entire period and reinvested all distributions in the fund.
Net asset value (NAV) is the price, or value, of one share of a mutual fund, without a sales charge. NAVs fluctuate with market conditions. NAV is calculated by dividing the net assets of each class of shares by the number of outstanding shares in the class.
Public offering price (POP) is the price of a mutual fund share plus the maximum sales charge levied at the time of purchase. POP performance figures shown here assume the 5.25% maximum sales charge for class A shares and 3.25% for class M shares.
Contingent deferred sales charge (CDSC) is a charge applied at the time of the redemption of class B or C shares and assumes redemption at the end of the period. Your fund’s class B CDSC declines from a 5% maximum during the first year to 1% during the sixth year. After the sixth year, the CDSC no longer applies. The CDSC for class C shares is 1% for one year after purchase.
Class A shares are generally subject to an initial sales charge and no sales charge on redemption (except on certain redemptions of shares bought without an initial sales charge).
Class B shares may be subject to a sales charge upon redemption.
Class C shares are not subject to an initial sales charge and are subject to a contingent deferred sales charge only if the shares are redeemed during the first year.
Class M shares have a lower initial sales charge and a higher 12b-1 fee than class A shares and no sales charge on redemption (except on certain redemptions of shares bought without an initial sales charge).
Class R shares are not subject to an initial sales charge or CDSC and are available only to certain defined contribution plans.
Class Y shares are not subject to an initial sales charge or CDSC, and carry no 12b-1 fee. They are only available to eligible purchasers, including eligible defined contribution plans or corporate IRAs.
23
George Putnam Blended Index is an unmanaged index administered by Putnam Management, 60% of which is the S&P 500/Citigroup Value Index and 40% of which is the Lehman Aggregate Bond Index. (The S&P 500/Citigroup Value Index has replaced the fund's former equity benchmark, the S&P 500/Barra Value Index.)
JP Morgan Global High Yield Index is an unmanaged index of global high-yield fixed-income securities.
Lehman Aggregate Bond Index is an unmanaged index of U.S. investment-grade fixed-income securities.
Lehman Government Bond Index is an unmanaged index of U.S. Treasury and agency securities.
Russell 1000 Index is an unmanaged index of the 1,000 largest companies in the Russell 3000 Index.
Russell 2000 Growth Index is an unmanaged index of those companies in the small-cap Russell 2000 Index chosen for their growth orientation.
Russell 2000 Value Index is an unmanaged index of those companies in the small-cap Russell 2000 Index chosen for their value orientation.
S&P 500/Citigroup Value Index is a market-capitalization weighted index. All stocks in the underlying parent index are allocated into value or growth. Stocks that do not have pure value or pure growth characteristics have their market caps distributed between the value and growth indices.
S&P 500/Barra Value Index is an unmanaged capitalization-weighted index of large-cap stocks chosen for their value orientation.
Indexes assume reinvestment of all distributions and do not account for fees. Securities and performance of a fund and an index will differ. You cannot invest directly in an index.
Lipper is a third-party industry-ranking entity that ranks mutual funds. Lipper rankings are based on total return at net asset value and do not reflect sales charges. Funds are ranked among other funds with similar current investment styles or objectives as determined by Lipper. Lipper may change a fund’s category assignment at its discretion. Lipper category averages reflect performance trends for funds within a category.
24
Trustee approval of
management contract
|
The Board of Trustees of the Putnam funds oversees the management of each fund and, as required by law, determines annually whether to approve the continuance of your fund’s management contract with Putnam Management. In this regard, the Board of Trustees, with the assistance of its Contract Committee consisting solely of Trustees who are not “interested persons” (as such term is defined in the Investment Company Act of 1940, as amended) of the Putnam funds (the “Independent Trustees”), requests and evaluates all information it deems reasonably necessary under the circumstances. Over the course of several months beginning in March and ending in June 2005, the Contract Committee met five times to consider the information provided by Putnam Management and other information developed with the assistance of the Board’s independent counsel and independent staff. The Contract Committee reviewed and discussed key aspects of this information with all of the Independent Trustees. Upon completion of this review, the Contract Committee recommended and the Independent Trustees approved the continuance of your fund’s management contract, effective July 1, 2005.
This approval was based on the following conclusions:
* That the fee schedule currently in effect for your fund represents reasonable compensation in light of the nature and quality of the services being provided to the fund, the fees paid by competitive funds and the costs incurred by Putnam Management in providing such services, and
* That such fee schedule represents an appropriate sharing between fund shareholders and Putnam Management of such economies of scale as may exist in the management of the fund at current asset levels.
These conclusions were based on a comprehensive consideration of all information provided to the Trustees and were not the result of any single factor. Some of the factors that figured particularly in the Trustees’ deliberations and how the Trustees considered these factors are described below, although individual Trustees may have evaluated the information presented differently, giving different weights to various factors. It is also important to recognize that the fee arrangements for your fund and the other Putnam funds are the result of many years of review and discussion between the Independent Trustees and Putnam Management, that certain aspects of such arrangements may receive greater scrutiny in some years than others, and that the Trustees’ conclusions may be based, in part, on their consideration of these same arrangements in prior years.
25
Model fee schedules and categories; total expenses
The Trustees’ review of the management fees and total expenses of the Putnam funds focused on three major themes:
* Consistency. The Trustees, working in cooperation with Putnam Management, have developed and implemented a series of model fee schedules for the Putnam funds designed to ensure that each fund’s management fee is consistent with the fees for similar funds in the Putnam family of funds and compares favorably with fees paid by competitive funds sponsored by other investment advisors. Under this approach, each Putnam fund is assigned to one of several fee categories based on a combination of factors, including competitive fees and perceived difficulty of management, and a common fee schedule is implemented for all funds in a given fee category. The Trustees reviewed the model fee schedule then in effect for your fund, including fee levels and breakpoints, and the assignment of the fund to a particular fee category under this structure. (“Breakpoints” refer to reductions in fee rates that apply to additional assets once specified asset levels are reached.) The Trustees concluded that no changes should be made in the fund’s current fee schedule at this time.
* Competitiveness. The Trustees also reviewed comparative fee and expense information for competitive funds, which indicated that, in a custom peer group of competitive funds selected by Lipper Inc., your fund ranked in the 21st percentile in management fees and in the 17th percentile in total expenses (less any applicable 12b-1 fees) as of December 31, 2004 (the first percentile being the least expensive funds and the 100th percentile being the most expensive funds). (Because the fund’s custom peer group is smaller than the fund’s broad Lipper Inc. peer group, this expense comparison may differ from the Lipper peer expense information found elsewhere in this report.) The Trustees noted that expense ratios for a number of Putnam funds, which show the percentage of fund assets used to pay for management and administrative services, distribution (12b-1) fees and other expenses, had been increasing recently as a result of declining net assets and the natural operation of fee breakpoints. They noted that such expense ratio increases were currently being controlled by expense limitations implemented in January 2004 and which Putnam Management, in consultation with the Contract Committee, has committed to maintain at least through 2006. The Trustees expressed their intention to monitor this information closely to ensure that fees and expenses of the Putnam funds continue to meet evolving competitive standards.
* Economies of scale. The Trustees concluded that the fee schedule currently in effect for your fund represents an appropriate sharing of economies of scale at current asset levels. Your fund currently has the benefit of breakpoints in its management fee that provide shareholders with significant economies of scale, which means that the effective management fee rate of a fund (as a percentage of fund assets) declines as a fund grows in size and crosses specified
26
asset thresholds. The Trustees examined the existing breakpoint structure of the Putnam funds’ management fees in light of competitive industry practices. The Trustees considered various possible modifications to the Putnam funds’ current breakpoint structure, but ultimately concluded that the current breakpoint structure continues to serve the interests of fund shareholders. Accordingly, the Trustees continue to believe that the fee schedules currently in effect for the funds represent an appropriate sharing of economies of scale at current asset levels. The Trustees noted that significant redemptions in many Putnam funds, together with significant changes in the cost structure of Putnam Management, have altered the economics of Putnam Management’s business in significant ways. In view of these changes, the Trustees intend to consider whether a greater sharing of the economies of scale by fund shareholders would be appropriate if and when aggregate assets in the Putnam funds begin to experience meaningful growth.
In connection with their review of the management fees and total expenses of the Putnam funds, the Trustees also reviewed the costs of the services to be provided and profits to be realized by Putnam Management and its affiliates from the relationship with the funds. This information included trends in revenues, expenses and profitability of Putnam Management and its affiliates relating to the investment management and distribution services provided to the funds. In this regard, the Trustees also reviewed an analysis of Putnam Management’s revenues, expenses and profitability with respect to the funds’ management contracts, allocated on a fund-by-fund basis.
The quality of the investment process provided by Putnam Management represented a major factor in the Trustees’ evaluation of the quality of services provided by Putnam Management under your fund’s management contract. The Trustees were assisted in their review of the funds’ investment process and performance by the work of the Investment Oversight Committees of the Trustees, which meet on a regular monthly basis with the funds’ portfolio teams throughout the year. The Trustees concluded that Putnam Management generally provides a high-quality investment process — as measured by the experience and skills of the individuals assigned to the management of fund portfolios, the resources made available to such personnel, and in general the ability of Putnam Management to attract and retain high-quality personnel — but also recognize that this does not guarantee favorable investment results for every fund in every time period. The Trustees considered the investment performance of each fund over multiple time periods and considered information comparing the fund’s performance with various benchmarks and with the performance of competitive funds. The Trustees noted the satisfactory investment performance of many Putnam funds. They also noted the disappointing investment performance of certain funds in recent years and continued to discuss with senior management of Putnam Management the factors contributing to such underperformance and actions being taken to
27
improve performance. The Trustees recognized that, in recent years, Putnam Management has made significant changes in its investment personnel and processes and in the fund product line to address areas of underperformance. The Trustees indicated their intention to continue to monitor performance trends to assess the effectiveness of these changes and to evaluate whether additional remedial changes are warranted.
In the case of your fund, the Trustees considered that your fund’s class A share cumulative total return performance at net asset value was in the following percentiles of its Lipper Inc. peer group (Lipper Balanced Funds) for the one-, three- and five-year periods ended December 31, 2004 (the first percentile being the best-performing funds and the 100th percentile being the worst-performing funds):
| One-year period | Three-year period | Five-year period |
|
| 46th | 34th | 15th |
(Because of the passage of time, these performance results may differ from the performance results for more recent periods shown elsewhere in this report. Over the one-, three-, and five-year periods ended December 31, 2004, there were 576, 446, and 368 funds, respectively, in your fund’s Lipper peer group.* Past performance is no guarantee of future performance.)
As a general matter, the Trustees believe that cooperative efforts between the Trustees and Putnam Management represent the most effective way to address investment performance problems. The Trustees believe that investors in the Putnam funds have, in effect, placed their trust in the Putnam organization, under the oversight of the funds’ Trustees, to make appropriate decisions regarding the management of the funds. Based on the responsiveness of Putnam Management in the recent past to Trustee concerns about investment performance, the Trustees believe that it is preferable to seek change within Putnam Management to address performance shortcomings. In the Trustees’ view, the alternative of terminating a management contract and engaging a new investment advisor for an underperforming fund would entail significant disruptions and would not provide any greater assurance of improved investment performance.
Brokerage and soft-dollar allocations; other benefits
The Trustees considered various potential benefits that Putnam Management may receive in connection with the services it provides under the management contract with your fund. These include principally benefits related to brokerage and soft-dollar allocations, whereby a portion of the commissions paid by a fund for brokerage is earmarked to pay for research services that may be utilized by a fund’s investment advisor, subject to the obligation to seek best execution.
* The percentile rankings for your fund’s class A share annualized total return performance in the Lipper Balanced Funds category for the one-, five-, and ten-year periods ended December 31, 2005, were 66th, 25th, and 39th, respectively. Over the one-, five-, and ten-year periods ended December 31, 2005, the fund ranked 426th out of 650 funds, 92nd out of 382 funds, and 68th out of 177 funds, respectively. Note that this more recent information was not available when the Trustees approved the continuance of your fund’s management contract.
28
The Trustees believe that soft-dollar credits and other potential benefits associated with the allocation of fund brokerage, which pertains mainly to funds investing in equity securities, represent assets of the funds that should be used for the benefit of fund shareholders. This area has been marked by significant change in recent years. In July 2003, acting upon the Contract Committee’s recommendation, the Trustees directed that allocations of brokerage to reward firms that sell fund shares be discontinued no later than December 31, 2003. In addition, commencing in 2004, the allocation of brokerage commissions by Putnam Management to acquire research services from third-party service providers has been significantly reduced, and continues at a modest level only to acquire research that is customarily not available for cash. The Trustees will continue to monitor the allocation of the funds’ brokerage to ensure that the principle of “best price and execution” remains paramount in the portfolio trading process.
The Trustees’ annual review of your fund’s management contract also included the review of its distributor’s contract and distribution plan with Putnam Retail Management Limited Partnership and the custodian agreement and investor servicing agreement with Putnam Fiduciary Trust Company, all of which provide benefits to affiliates of Putnam Management.
Comparison of retail and institutional fee schedules
The information examined by the Trustees as part of their annual contract review has included for many years information regarding fees charged by Putnam Management and its affiliates to institutional clients such as defined benefit pension plans, college endowments, etc. This information included comparison of such fees with fees charged to the funds, as well as a detailed assessment of the differences in the services provided to these two types of clients. The Trustees observed, in this regard, that the differences in fee rates between institutional clients and the mutual funds are by no means uniform when examined by individual asset sectors, suggesting that differences in the pricing of investment management services to these types of clients reflect to a substantial degree historical competitive forces operating in separate market places. The Trustees considered the fact that fee rates across all asset sectors are higher on average for mutual funds than for institutional clients, as well as the differences between the services that Putnam Management provides to the Putnam funds and those that it provides to institutional clients of the firm, but have not relied on such comparisons to any significant extent in concluding that the management fees paid by your fund are reasonable.
29
Other information
for shareholders
|
Important notice regarding delivery of shareholder documents
In accordance with SEC regulations, Putnam sends a single copy of annual and semiannual shareholder reports, prospectuses, and proxy statements to Putnam shareholders who share the same address. If you prefer to receive your own copy of these documents, please call Putnam at 1-800-225-1581, and Putnam will begin sending individual copies within 30 days.
Putnam is committed to managing our mutual funds in the best interests of our shareholders. The Putnam funds’ proxy voting guidelines and procedures, as well as information regarding how your fund voted proxies relating to portfolio securities during the 12-month period ended June 30, 2005, are available on the Putnam Individual Investor Web site, www.putnam.com/individual, and on the SEC’s Web site, www.sec.gov. If you have questions about finding forms on the SEC’s Web site, you may call the SEC at 1-800-SEC-0330. You may also obtain the Putnam funds’ proxy voting guidelines and procedures at no charge by calling Putnam’s Shareholder Services at 1-800-225-1581.
The fund will file a complete schedule of its portfolio holdings with the SEC for the first and third quarters of each fiscal year on Form N-Q. Shareholders may obtain the fund’s Forms N-Q on the SEC’s Web site at www.sec.gov. In addition, the fund’s Forms N-Q may be reviewed and copied at the SEC’s public reference room in Washington, D.C. You may call the SEC at 1-800-SEC-0330 for information about the SEC’s Web site or the operation of the public reference room.
30
A guide to financial statements
|
These sections of the report, as well as the accompanying Notes, constitute the fund’s financial statements.
The fund’s portfolio lists all the fund’s investments and their values as of the last day of the reporting period. Holdings are organized by asset type and industry sector, country, or state to show areas of concentration and diversification.
Statement of assets and liabilities shows how the fund’s net assets and share price are determined. All investment and noninvestment assets are added together. Any unpaid expenses and other liabilities are subtracted from this total. The result is divided by the number of shares to determine the net asset value per share, which is calculated separately for each class of shares. (For funds with preferred shares, the amount subtracted from total assets includes the liquidation preference of preferred shares.)
Statement of operations shows the fund’s net investment gain or loss. This is done by first adding up all the fund’s earnings — from dividends and interest income — and subtracting its operating expenses to determine net investment income (or loss). Then, any net gain or loss the fund realized on the sales of its holdings — as well as any unrealized gains or losses over the period — is added to or subtracted from the net investment result to determine the fund’s net gain or loss for the fiscal period.
Statement of changes in net assets shows how the fund’s net assets were affected by the fund’s net investment gain or loss, by distributions to shareholders, and by changes in the number of the fund’s shares. It lists distributions and their sources (net investment income or realized capital gains) over the current reporting period and the most recent fiscal year-end. The distributions listed here may not match the sources listed in the Statement of operations because the distributions are determined on a tax basis and may be paid in a different period from the one in which they were earned. Dividend sources are estimated at the time of declaration. Actual results may vary. Any non-taxable return of capital cannot be determined until final tax calculations are completed after the end of the fund’s fiscal year.
Financial highlights provide an overview of the fund’s investment results, per-share distributions, expense ratios, net investment income ratios, and portfolio turnover in one summary table, reflecting the five most recent reporting periods. In a semiannual report, the highlight table also includes the current reporting period. For open-end funds, a separate table is provided for each share class.
31
| The fund’s portfolio 1/31/06 (Unaudited) | | | |
|
| |
| |
| |
| COMMON STOCKS (60.8%)* | | | |
|
| | Shares | | Value |
| |
| Banking (4.7%) | | | |
| Bank of America Corp. | 2,936,345 | $ | 129,874,539 |
| U.S. Bancorp | 2,401,660 | | 71,833,651 |
| Wachovia Corp. | 468,500 | | 25,687,855 |
| | | | 227,396,045 |
|
| |
| Basic Materials (1.3%) | | | |
| Alcoa, Inc. | 435,700 | | 13,724,550 |
| Crown Holdings, Inc. † | 385,800 | | 7,218,318 |
| Dow Chemical Co. (The) | 116,900 | | 4,944,870 |
| Huntsman Corp. † (S) | 158,000 | | 3,415,960 |
| PPG Industries, Inc. | 280,700 | | 16,701,650 |
| Rohm & Haas Co. | 181,200 | | 9,223,080 |
| United States Steel Corp. (S) | 132,700 | | 7,928,825 |
| | | | 63,157,253 |
|
| |
| Capital Goods (2.8%) | | | |
| Autoliv, Inc. (Sweden) | 139,100 | | 6,814,509 |
| Boeing Co. (The) | 188,500 | | 12,876,435 |
| Ingersoll-Rand Co., Ltd. Class A (Bermuda) | 461,600 | | 18,127,032 |
| Lockheed Martin Corp. | 784,100 | | 53,044,365 |
| Owens-Illinois, Inc. † | 120,900 | | 2,658,591 |
| Parker-Hannifin Corp. | 402,200 | | 30,474,694 |
| Waste Management, Inc. | 487,200 | | 15,385,776 |
| | | | 139,381,402 |
|
| |
| Communication Services (1.8%) | | | |
| Sprint Nextel Corp. | 1,996,000 | | 45,688,440 |
| Verizon Communications, Inc. | 1,276,800 | | 40,423,488 |
| | | | 86,111,928 |
|
| |
| Conglomerates (2.0%) | | | |
| General Electric Co. | 439,100 | | 14,380,525 |
| Honeywell International, Inc. | 425,600 | | 16,351,552 |
| Textron, Inc. | 107,400 | | 9,071,004 |
| Tyco International, Ltd. (Bermuda) | 2,138,450 | | 55,706,623 |
| | | | 95,509,704 |
|
| |
| Consumer Cyclicals (5.8%) | | | |
| Brunswick Corp. | 479,600 | | 18,028,164 |
| Cendant Corp. | 1,599,500 | | 26,775,630 |
| Foot Locker, Inc. | 159,400 | | 3,621,568 |
| Lennar Corp. (S) | 286,600 | | 17,929,696 |
| Masco Corp. | 1,549,100 | | 45,930,815 |
| Michaels Stores, Inc. | 253,500 | | 8,525,205 |
| NVR, Inc. † | 11,046 | | 8,773,286 |
| Office Depot, Inc. † | 763,400 | | 25,306,710 |
32
| COMMON STOCKS (60.8%)* continued | | | |
|
| | Shares | | Value |
| |
| Consumer Cyclicals continued | | | |
| R. R. Donnelley & Sons Co. | 525,700 | $ | 17,137,820 |
| Royal Caribbean Cruises, Ltd. | 349,500 | | 14,294,550 |
| Sears Holdings Corp. † (S) | 48,500 | | 5,889,840 |
| Sherwin Williams Co. | 578,600 | | 30,607,940 |
| TJX Cos., Inc. (The) | 371,200 | | 9,476,736 |
| Vulcan Materials Co. | 156,100 | | 11,220,468 |
| Walt Disney Co. (The) | 813,400 | | 20,587,154 |
| Whirlpool Corp. (S) | 259,100 | | 20,904,188 |
| | | | 285,009,770 |
|
| |
| Consumer Finance (1.3%) | | | |
| Capital One Financial Corp. | 484,400 | | 40,350,520 |
| Countrywide Financial Corp. | 639,100 | | 21,371,504 |
| | | | 61,722,024 |
|
| |
| Consumer Staples (4.9%) | | | |
| Altria Group, Inc. | 728,900 | | 52,728,626 |
| Coca-Cola Co. (The) | 432,500 | | 17,896,850 |
| Coca-Cola Enterprises, Inc. | 584,300 | | 11,534,082 |
| Comcast Corp. Class A † (S) | 1,110,000 | | 30,880,200 |
| Estee Lauder Cos., Inc. (The) Class A (S) | 298,700 | | 10,893,589 |
| General Mills, Inc. | 432,200 | | 21,009,242 |
| Loews Corp. - Carolina Group | 283,600 | | 13,079,632 |
| McDonald’s Corp. | 859,600 | | 30,094,596 |
| Procter & Gamble Co. (The) | 233,700 | | 13,842,051 |
| Rite Aid Corp. † (S) | 3,776,100 | | 13,556,199 |
| Supervalu, Inc. (S) | 780,100 | | 24,908,593 |
| | | | 240,423,660 |
|
| |
| Energy (7.9%) | | | |
| Amerada Hess Corp. (S) | 213,900 | | 33,111,720 |
| Chevron Corp. | 1,536,900 | | 91,261,122 |
| Devon Energy Corp. | 114,300 | | 7,796,403 |
| EOG Resources, Inc. | 19,700 | | 1,665,438 |
| Exxon Mobil Corp. | 1,967,400 | | 123,454,350 |
| Marathon Oil Corp. | 576,000 | | 44,277,120 |
| Occidental Petroleum Corp. (S) | 379,300 | | 37,061,403 |
| Pride International, Inc. † | 441,100 | | 15,575,241 |
| Sunoco, Inc. | 132,600 | | 12,623,520 |
| Valero Energy Corp. | 198,500 | | 12,392,355 |
| Weatherford International, Ltd. † | 177,000 | | 7,926,060 |
| | | | 387,144,732 |
|
| |
| Financial (5.4%) | | | |
| Citigroup, Inc. # | 2,766,400 | | 128,858,912 |
| Fannie Mae | 316,300 | | 18,326,422 |
| Freddie Mac | 943,140 | | 64,001,480 |
| Lehman Brothers Holdings, Inc. | 75,300 | | 10,575,885 |
| MetLife, Inc. (S) | 271,800 | | 13,633,488 |
33
| COMMON STOCKS (60.8%)* continued | | | |
|
| | Shares | | Value |
| |
| Financial continued | | | |
| PMI Group, Inc. (The) (S) | 467,700 | $ | 20,218,671 |
| Washington Mutual, Inc. (S) | 144,100 | | 6,098,312 |
| | | | 261,713,170 |
|
| |
| Health Care (7.9%) | | | |
| Abbott Laboratories | 139,200 | | 6,006,480 |
| AmerisourceBergen Corp. | 374,600 | | 16,347,544 |
| Amgen, Inc. † | 105,900 | | 7,719,051 |
| Barr Pharmaceuticals, Inc. † | 83,400 | | 5,469,372 |
| Baxter International, Inc. | 352,000 | | 12,971,200 |
| Becton, Dickinson and Co. | 408,200 | | 26,451,360 |
| Boston Scientific Corp. † (S) | 728,700 | | 15,936,669 |
| Cardinal Health, Inc. | 478,100 | | 34,442,324 |
| CIGNA Corp. | 267,300 | | 32,503,680 |
| HCA, Inc. | 255,300 | | 12,530,124 |
| Johnson & Johnson | 914,800 | | 52,637,592 |
| Lincare Holdings, Inc. † | 41,800 | | 1,766,468 |
| PerkinElmer, Inc. | 275,900 | | 6,273,966 |
| Pfizer, Inc. | 3,336,100 | | 85,671,048 |
| Watson Pharmaceuticals, Inc. † (S) | 344,000 | | 11,382,960 |
| WellPoint, Inc. † | 238,100 | | 18,286,080 |
| Wyeth | 886,800 | | 41,014,500 |
| | | | 387,410,418 |
|
| |
| Insurance (4.3%) | | | |
| ACE, Ltd. (Bermuda) | 1,056,600 | | 57,848,850 |
| American International Group, Inc. | 452,950 | | 29,650,107 |
| Axis Capital Holdings, Ltd. (Bermuda) | 401,674 | | 12,010,053 |
| Chubb Corp. (The) | 362,800 | | 34,230,180 |
| Endurance Specialty Holdings, Ltd. (Bermuda) | 209,300 | | 6,892,249 |
| Everest Re Group, Ltd. (Barbados) | 404,200 | | 39,065,930 |
| Hartford Financial Services Group, Inc.(The) (S) | 154,800 | | 12,729,204 |
| Prudential Financial, Inc. | 202,200 | | 15,233,748 |
| St. Paul Travelers Cos., Inc. (The) | 65,800 | | 2,986,004 |
| | | | 210,646,325 |
|
| |
| Investment Banking/Brokerage (1.0%) | | | |
| Bear Stearns Cos., Inc. (The) | 88,500 | | 11,191,710 |
| Goldman Sachs Group, Inc. (The) (S) | 58,200 | | 8,220,750 |
| Morgan Stanley | 451,600 | | 27,750,820 |
| | | | 47,163,280 |
|
| |
| Technology (6.8%) | | | |
| Accenture, Ltd. Class A (Bermuda) | 473,500 | | 14,929,455 |
| Arrow Electronics, Inc. † | 187,500 | | 6,442,500 |
| Avnet, Inc. † | 279,200 | | 6,826,440 |
| Cisco Systems, Inc. † | 1,440,230 | | 26,745,071 |
| Dell, Inc. † | 637,000 | | 18,670,470 |
| EMC Corp. † | 744,200 | | 9,972,280 |
34
| COMMON STOCKS (60.8%)* continued | | | |
|
| | Shares | | Value |
| |
| Technology continued | | | |
| Hewlett-Packard Co. | 2,017,900 | $ | 62,918,686 |
| IBM Corp. | 137,900 | | 11,211,270 |
| Intel Corp. | 2,429,400 | | 51,673,338 |
| McAfee, Inc. † | 395,400 | | 9,169,326 |
| Micron Technology, Inc. † | 196,100 | | 2,878,748 |
| Microsoft Corp. | 1,788,800 | | 50,354,720 |
| Motorola, Inc. | 523,400 | | 11,886,414 |
| Oracle Corp. † | 2,493,500 | | 31,343,295 |
| Symantec Corp. † | 507,300 | | 9,324,174 |
| Xerox Corp. † (S) | 708,500 | | 10,138,635 |
| | | | 334,484,822 |
|
| |
| Transportation (0.6%) | | | |
| Norfolk Southern Corp. | 370,200 | | 18,450,768 |
| YRC Worldwide, Inc. † | 235,800 | | 11,752,272 |
| | | | 30,203,040 |
|
| |
| Utilities & Power (2.3%) | | | |
| Dominion Resources, Inc. (S) | 177,550 | | 13,410,352 |
| DPL, Inc. (S) | 208,000 | | 5,333,120 |
| Entergy Corp. | 231,300 | | 16,077,663 |
| Exelon Corp. | 519,200 | | 29,812,464 |
| PG&E Corp. (S) | 752,550 | | 28,077,641 |
| Public Service Enterprise Group, Inc. | 108,500 | | 7,553,770 |
| Wisconsin Energy Corp. | 271,800 | | 11,282,418 |
| | | | 111,547,428 |
|
| |
| Total common stocks (cost $2,363,753,280) | | $ | 2,969,025,001 |
|
| |
| |
| COLLATERALIZED MORTGAGE OBLIGATIONS (13.4%)* | | | |
|
| | Principal amount | | Value |
| |
| Amresco Commercial Mortgage Funding I 144A | | | |
| Ser. 97-C1, Class H, 7s, 2029 | $ 664,000 | $ | 669,546 |
| Asset Securitization Corp. Ser. 96-MD6, | | | |
| Class A7, 8.292s, 2029 | 1,858,000 | | 1,966,845 |
| Banc of America Commercial Mortgage, Inc. | | | |
| Ser. 01-1, Class G, 7.324s, 2036 | 950,000 | | 1,020,635 |
| Banc of America Commercial Mortgage, Inc. 144A | | | |
| Ser. 01-PB1, Class K, 6.15s, 2035 | 715,000 | | 722,206 |
| Ser. 05-1, Class XW, Interest Only (IO), 0.105s, 2042 | 279,077,498 | | 1,449,389 |
| Ser. 05-4, Class XC, IO, 0.039s, 2045 | 83,504,317 | | 613,882 |
| Banc of America Large Loan | | | |
| FRB Ser. 04-BBA4, Class H, 5.42s, 2018 | 142,000 | | 142,465 |
| FRB Ser. 04-BBA4, Class G, 5.17s, 2018 | 227,000 | | 227,900 |
| Banc of America Large Loan 144A | | | |
| FRB Ser. 02-FL2A, Class L1, 7.419s, 2014 | 427,000 | | 426,681 |
| FRB Ser. 02-FL2A, Class K1, 6.919s, 2014 | 148,000 | | 147,972 |
| FRB Ser. 05-BOCA, Class M, 6.57s, 2016 | 956,000 | | 958,834 |
35
| COLLATERALIZED MORTGAGE OBLIGATIONS (13.4%)* continued | | | |
|
| | Principal amount | | Value |
| |
| Banc of America Large Loan 144A | | | |
| FRB Ser. 05-MIB1, Class K, 6.47s, 2022 | $ 823,000 | $ | 800,153 |
| FRB Ser. 05-ESHA, Class K, 6.27s, 2020 | 1,660,000 | | 1,660,840 |
| FRB Ser. 05-BOCA, Class L, 6.17s, 2016 | 456,000 | | 456,966 |
| FRB Ser. 05-BOCA, Class K, 5.82s, 2016 | 470,000 | | 470,998 |
| FRB Ser. 05-BOCA, Class J, 5.57s, 2016 | 200,000 | | 200,340 |
| FRB Ser. 05-MIB1, Class J, 5.52s, 2022 | 1,400,000 | | 1,397,971 |
| FRB Ser. 05-BOCA, Class H, 5.42s, 2016 | 200,000 | | 200,374 |
| FRB Ser. 05-ESHA, Class G, 5.35s, 2020 | 1,024,000 | | 1,023,497 |
| Ser. 03-BBA2, Class X1A, IO, 0.488s, 2015 | 33,919,156 | | 86,358 |
| Banc of America Structured Security Trust 144A | | | |
| Ser. 02-X1, Class A3, 5.436s, 2033 | 1,930,000 | | 1,932,724 |
| Bayview Commercial Asset Trust 144A | | | |
| FRB Ser. 05-1A, Class A1, 4.83s, 2035 | 1,995,371 | | 1,992,977 |
| Ser. 05-3A, IO, 0.775s, 2035 | 22,040,417 | | 1,812,551 |
| Ser. 05-1A, IO, 0.775s, 2035 | 8,337,390 | | 629,538 |
| Ser. 04-3, IO, 0.775s, 2035 | 6,822,635 | | 513,830 |
| Ser. 04-2, IO, 0.72s, 2034 | 10,538,326 | | 785,023 |
| Bear Stearns Commercial Mortgage Securities, Inc. | | | |
| Ser. 05-PWR9, Class X1, IO, 0.045s, 2042 | 41,760,148 | | 411,087 |
| Bear Stearns Commercial Mortgage | | | |
| Securities, Inc. 144A | | | |
| FRB Ser. 05-LXR1, Class J, 6.12s, 2018 | 1,795,000 | | 1,795,000 |
| FRB Ser. 05-LXR1, Class H, 5.67s, 2018 | 997,000 | | 997,000 |
| FRB Ser. 05-LXR1, Class G, 5.42s, 2018 | 997,000 | | 997,000 |
| Ser. 05-LXR1, Class X1, IO, 0.792s, 2018 | 96,649,000 | | 897,483 |
| Ser. 05-PW10, Class X1, IO, 0.032s, 2040 | 64,674,000 | | 295,560 |
| Bear Stearns Commercial Mortgage Securitization Corp. | | | |
| Ser. 00-WF2, Class F, 8.199s, 2032 | 456,000 | | 518,709 |
| Chase Commercial Mortgage Securities Corp. | | | |
| Ser. 00-3, Class A2, 7.319s, 2032 | 553,000 | | 596,835 |
| Chase Commercial Mortgage Securities Corp. 144A | | | |
| Ser. 98-1, Class F, 6.56s, 2030 | 4,600,000 | | 4,775,688 |
| Ser. 98-1, Class G, 6.56s, 2030 | 1,171,000 | | 1,222,587 |
| Ser. 98-1, Class H, 6.34s, 2030 | 1,761,000 | | 1,500,595 |
| Citigroup Commercial Mortgage Trust 144A | | | |
| Ser. 05-C3, Class XC, IO, 0.056s, 2043 | 119,005,512 | | 1,250,488 |
| Commercial Mortgage Acceptance Corp. | | | |
| Ser. 97-ML1, Class A3, 6.57s, 2030 | 4,937,500 | | 4,999,609 |
| Commercial Mortgage Acceptance Corp. 144A | | | |
| Ser. 98-C1, Class F, 6.23s, 2031 | 2,013,000 | | 2,074,914 |
| Commercial Mortgage Pass-Through | | | |
| Certificates 144A | | | |
| FRB Ser. 01-J2A, Class A2F, 4.97s, 2034 | 1,590,000 | | 1,608,824 |
| Ser. 05-LP5, Class XC, IO, 0.041s, 2043 | 73,937,924 | | 780,045 |
| Ser. 05-C6, Class XC, IO, 0.04s, 2044 | 67,592,769 | | 459,631 |
| Criimi Mae Commercial Mortgage Trust 144A | | | |
| Ser. 98-C1, Class B, 7s, 2033 | 3,385,000 | | 3,539,695 |
36
| COLLATERALIZED MORTGAGE OBLIGATIONS (13.4%)* continued | | | |
|
| | Principal amount | | Value |
| |
| Crown Castle Towers, LLC 144A Ser. 05-1A, | | | |
| Class D, 5.612s, 2035 | $ 2,903,000 | $ | 2,824,642 |
| CS First Boston Mortgage Securities Corp. | | | |
| Ser. 97-C2, Class F, 7.46s, 2035 | 1,239,000 | | 1,307,399 |
| CS First Boston Mortgage Securities Corp. 144A | | | |
| FRB Ser. 03-TF2A, Class L, 8.47s, 2014 | 1,124,000 | | 1,103,920 |
| FRB Ser. 05-TFLA, Class J, 5.42s, 2020 | 518,000 | | 517,997 |
| FRB Ser. 04-TF2A, Class J, 5.42s, 2016 | 313,000 | | 312,998 |
| FRB Ser. 05-TF2A, Class J, 5.37s, 2020 | 1,237,000 | | 1,236,994 |
| FRB Ser. 05-TFLA, Class H, 5.22s, 2020 | 319,000 | | 318,998 |
| FRB Ser. 04-TF2A, Class H, 5.17s, 2019 | 627,000 | | 626,997 |
| Ser. 01-CK1, Class AY, IO, 0.785s, 2035 | 67,907,000 | | 2,156,948 |
| Ser. 03-C3, Class AX, IO, 0.345s, 2038 | 29,480,967 | | 1,243,041 |
| Ser. 05-C2, Class AX, IO, 0.065s, 2037 | 77,028,589 | | 1,159,280 |
| DLJ Commercial Mortgage Corp. | | | |
| Ser. 00-CF1, Class A1B, 7.62s, 2033 | 2,212,000 | | 2,402,846 |
| Ser. 99-CG2, Class B3, 6.1s, 2032 | 1,752,000 | | 1,768,257 |
| Ser. 99-CG2, Class B4, 6.1s, 2032 | 2,785,000 | | 2,802,961 |
| Ser. 98-CF2, Class B3, 6.04s, 2031 | 814,188 | | 822,126 |
| DLJ Mortgage Acceptance Corp. 144A Ser. 97-CF1, | | | |
| Class A3, 7.76s, 2030 | 1,000,000 | | 1,021,577 |
| Fannie Mae | | | |
| IFB Ser. 05-37, Class SU, 11.08s, 2035 | 3,488,076 | | 3,888,064 |
| IFB Ser. 04-10, Class QC, 10.48s, 2031 | 2,172,474 | | 2,325,905 |
| Ser. 92-15, Class L, IO, 10.38s, 2022 | 314 | | 3,304 |
| Ser. 04-T3, Class PT1, 9.805s, 2044 | 854,226 | | 919,404 |
| Ser. 03-W6, Class PT1, 9.627s, 2042 | 361,117 | | 387,018 |
| Ser. 02-T12, Class A4, 9 1/2s, 2042 | 306,675 | | 326,550 |
| Ser. 02-T4, Class A4, 9 1/2s, 2041 | 1,784,728 | | 1,897,364 |
| Ser. 02-T6, Class A3, 9 1/2s, 2041 | 625,204 | | 662,929 |
| IFB Ser. 05-106, Class US, 7.957s, 2035 | 4,499,989 | | 4,717,723 |
| IFB Ser. 05-99, Class SA,7.957s, 2035 | 2,184,947 | | 2,242,771 |
| IFB Ser. 05-74, Class CP, 8.14s, 2035 | 1,859,721 | | 1,944,398 |
| IFB Ser. 05-76, Class SA, 8.14s, 2034 | 2,630,013 | | 2,706,816 |
| IFB Ser. 05-57, Class CD, 8.138s, 2035 | 1,649,492 | | 1,713,333 |
| Ser. 00-42, Class B2, 8s, 2030 | 107,143 | | 115,254 |
| Ser. 00-17, Class PA, 8s, 2030 | 510,456 | | 548,566 |
| Ser. 00-18, Class PA, 8s, 2030 | 469,248 | | 504,114 |
| Ser. 00-19, Class PA, 8s, 2030 | 485,237 | | 521,304 |
| Ser. 00-20, Class PA, 8s, 2030 | 262,046 | | 281,737 |
| Ser. 00-21, Class PA, 8s, 2030 | 815,586 | | 876,877 |
| Ser. 00-22, Class PA, 8s, 2030 | 608,076 | | 653,330 |
| Ser. 97-37, Class PB, 8s, 2027 | 1,420,203 | | 1,530,343 |
| Ser. 97-13, Class TA, 8s, 2027 | 208,764 | | 225,050 |
| Ser. 97-21, Class PA, 8s, 2027 | 829,221 | | 892,964 |
| Ser. 97-22, Class PA, 8s, 2027 | 1,605,916 | | 1,729,989 |
| Ser. 97-16, Class PE, 8s, 2027 | 546,576 | | 588,675 |
| Ser. 97-25, Class PB, 8s, 2027 | 527,920 | | 568,351 |
| Ser. 95-12, Class PD, 8s, 2025 | 328,680 | | 353,607 |
| Ser. 95-5, Class A, 8s, 2025 | 397,055 | | 427,956 |
37
| COLLATERALIZED MORTGAGE OBLIGATIONS (13.4%)* continued | | | | |
|
| | Principal amount | | Value |
| |
| Fannie Mae | | | | |
| Ser. 95-5, Class TA, 8s, 2025 | $ | 104,215 | $ | 112,599 |
| Ser. 95-6, Class A, 8s, 2025 | | 253,681 | | 273,453 |
| Ser. 95-7, Class A, 8s, 2025 | | 350,628 | | 378,079 |
| Ser. 94-106, Class PA, 8s, 2024 | | 522,436 | | 563,485 |
| Ser. 94-95, Class A, 8s, 2024 | | 772,399 | | 833,624 |
| IFB Ser. 05-45, Class DA, 7.81s, 2035 | | 3,471,132 | | 3,588,527 |
| IFB Ser. 05-74, Class DM, 7.773s, 2035 | | 4,220,444 | | 4,339,032 |
| IFB Ser. 05-45, Class DC, 7.7s, 2035 | | 2,707,445 | | 2,787,644 |
| IFB Ser. 05-114, Class PS, 7.682s, 2035 | | 1,028,147 | | 1,023,151 |
| IFB Ser. 05-74, Class SK, 7.673s, 2035 | | 3,427,759 | | 3,538,252 |
| IFB Ser. 05-74, Class CS, 7.563s, 2035 | | 2,120,902 | | 2,180,181 |
| Ser. 02-26, Class A2, 7 1/2s, 2048 | | 2,816,511 | | 2,950,648 |
| Ser. 05-W3, Class 1A, 7 1/2s, 2045 | | 3,726,430 | | 3,928,281 |
| Ser. 05-W1, Class 1A4, 7 1/2s, 2044 | | 3,646,045 | | 3,833,496 |
| Ser. 04-W12, Class 1A4, 7 1/2s, 2044 | | 866,688 | | 911,358 |
| Ser. 04-W14, Class 2A, 7 1/2s, 2044 | | 407,876 | | 428,678 |
| Ser. 04-W8, Class 3A, 7 1/2s, 2044 | | 4,114,622 | | 4,329,568 |
| Ser. 04-W11, Class 1A4, 7 1/2s, 2044 | | 2,351,646 | | 2,473,257 |
| Ser. 04-W2, Class 5A, 7 1/2s, 2044 | | 5,702,458 | | 5,999,135 |
| Ser. 04-T3, Class 1A4, 7 1/2s, 2044 | | 89,939 | | 94,558 |
| Ser. 04-W9, Class 2A3, 7 1/2s, 2044 | | 2,954,344 | | 3,104,082 |
| Ser. 04-T2, Class 1A4, 7 1/2s, 2043 | | 1,273,911 | | 1,339,221 |
| Ser. 03-W1, Class 2A, 7 1/2s, 2042 | | 664,061 | | 694,401 |
| Ser. 03-W4, Class 4A, 7 1/2s, 2042 | | 400,738 | | 419,268 |
| Ser. 02-T18, Class A4, 7 1/2s, 2042 | | 314,136 | | 329,480 |
| Ser. 03-W3, Class 1A3, 7 1/2s, 2042 | | 1,537,905 | | 1,613,094 |
| Ser. 02-T16, Class A3, 7 1/2s, 2042 | | 2,946,712 | | 3,089,965 |
| Ser. 02-T19, Class A3, 7 1/2s, 2042 | | 1,762,897 | | 1,848,758 |
| Ser. 03-W2, Class 1A3, 7 1/2s, 2042 | | 3,381,717 | | 3,548,266 |
| Ser. 02-W6, Class 2A, 7 1/2s, 2042 | | 2,894,787 | | 3,030,827 |
| Ser. 02-T12, Class A3, 7 1/2s, 2042 | | 507,387 | | 530,991 |
| Ser. 02-W4, Class A5, 7 1/2s, 2042 | | 6,395,124 | | 6,698,969 |
| Ser. 02-W1, Class 2A, 7 1/2s, 2042 | | 3,178,223 | | 3,314,082 |
| Ser. 02-14, Class A2, 7 1/2s, 2042 | | 1,017,182 | | 1,064,905 |
| Ser. 01-T10, Class A2, 7 1/2s, 2041 | | 3,019,093 | | 3,155,045 |
| Ser. 02-T4, Class A3, 7 1/2s, 2041 | | 567,006 | | 592,694 |
| Ser. 02-T6, Class A2, 7 1/2s, 2041 | | 7,429,278 | | 7,755,680 |
| Ser. 01-T12, Class A2, 7 1/2s, 2041 | | 2,824,443 | | 2,951,817 |
| Ser. 01-T8, Class A1, 7 1/2s, 2041 | | 2,622,850 | | 2,736,695 |
| Ser. 01-T7, Class A1, 7 1/2s, 2041 | | 7,443,303 | | 7,760,478 |
| Ser. 01-T3, Class A1, 7 1/2s, 2040 | | 442,467 | | 461,535 |
| Ser. 01-T1, Class A1, 7 1/2s, 2040 | | 969,105 | | 1,012,809 |
| Ser. 99-T2, Class A1, 7 1/2s, 2039 | | 280,691 | | 294,667 |
| Ser. 03-W10, Class 1A1, 7 1/2s, 2032 | | 1,251,731 | | 1,310,086 |
| Ser. 02-T1, Class A3, 7 1/2s, 2031 | | 777,908 | | 813,774 |
| Ser. 00-T6, Class A1, 7 1/2s, 2030 | | 2,438,328 | | 2,542,230 |
| Ser. 01-T5, Class A3, 7 1/2s, 2030 | | 53,945 | | 56,280 |
| Ser. 02-W7, Class A5, 7 1/2s, 2029 | | 1,795,342 | | 1,881,911 |
| Ser. 01-T4, Class A1, 7 1/2s, 2028 | | 5,672,118 | | 5,973,301 |
38
| COLLATERALIZED MORTGAGE OBLIGATIONS (13.4%)* continued | | | | |
|
| | Principal amount | | Value |
| |
| Fannie Mae | | | | |
| Ser. 02-W3, Class A5, 7 1/2s, 2028 | $ | 1,694,491 | $ | 1,773,993 |
| IFB Ser. 04-79, Class SA, 7.37s, 2032 | | 4,644,552 | | 4,609,229 |
| IFB Ser. 05-114, Class SP, 7.123s, 2036 | | 1,229,300 | | 1,207,787 |
| IFB Ser. 05-57, Class DC, 7.053s, 2034 | | 3,003,596 | | 3,082,752 |
| Ser. 02-26, Class A1, 7s, 2048 | | 1,730,892 | | 1,790,415 |
| Ser. 04-T3, Class 1A3, 7s, 2044 | | 822,001 | | 853,668 |
| Ser. 03-W3, Class 1A2, 7s, 2042 | | 840,907 | | 871,461 |
| Ser. 02-T16, Class A2, 7s, 2042 | | 1,749,105 | | 1,812,175 |
| Ser. 02-14, Class A1, 7s, 2042 | | 166,615 | | 172,238 |
| Ser. 02-T4, Class A2, 7s, 2041 | | 1,055,487 | | 1,091,165 |
| Ser. 01-W3, Class A, 7s, 2041 | | 657,926 | | 679,288 |
| Ser. 04-W1, Class 2A2, 7s, 2033 | | 8,784,992 | | 9,120,557 |
| IFB Ser. 05-45, Class PC, 6.66s, 2034 | | 1,636,635 | | 1,660,869 |
| IFB Ser. 02-97, Class TW, IO, 6 1/2s, 2031 | | 1,437,653 | | 238,527 |
| IFB Ser. 05-95, Class CP, 6.43s, 2035 | | 357,612 | | 368,204 |
| IFB Ser. 05-95, Class OP, 6.363s, 2035 | | 1,046,000 | | 1,005,204 |
| IFB Ser. 04-46, Class QB, 5.88s, 2034 | | 1,091,507 | | 1,011,862 |
| Ser. 03-31, Class IM, IO, 5.8s, 2032 | | 4,697,564 | | 631,963 |
| IFB Ser. 05-73, Class SA, 5.772s, 2035 | | 1,858,688 | | 1,799,733 |
| IFB Ser. 05-83, Class QP, 5.616s, 2034 | | 690,994 | | 658,382 |
| IFB Ser. 05-93, Class AS, 5.55s, 2034 | | 935,090 | | 869,780 |
| Ser. 350, Class 2, IO, 5 1/2s, 2034 | | 14,908,072 | | 3,293,263 |
| Ser. 329, Class 2, IO, 5 1/2s, 2033 | | 16,382,619 | | 3,635,300 |
| Ser. 03-45, Class PI, IO, 5 1/2s, 2029 | | 2,944,162 | | 296,256 |
| Ser. 03-8, Class IP, IO, 5 1/2s, 2028 | | 2,601,759 | | 169,184 |
| Ser. 05-29, Class SX, IO, 5s, 2036 | | 3,107,000 | | 3,194,384 |
| Ser. 06-08, Class HP, 5s, 2036 | | 2,795,000 | | 2,871,825 |
| Ser. 06-8, Class WK, 5s, 2036 | | 2,319,000 | | 2,383,498 |
| Ser. 03-24, Class UI, IO, 5s, 2031 | | 2,694,061 | | 412,923 |
| IFB Ser. 05-56, Class TP, 4.56s, 2033 | | 793,588 | | 731,341 |
| IFB Ser. 02-89, Class S, IO, 3.67s, 2033 | | 4,275,882 | | 391,510 |
| IFB Ser. 97-44, Class SN, IO, 3.54s, 2023 | | 1,537,653 | | 142,387 |
| IFB Ser. 02-36, Class QH, IO, 3.52s, 2029 | | 1,077,651 | | 20,751 |
| IFB Ser. 03-66, Class SA, IO, 3.12s, 2033 | | 4,564,909 | | 333,832 |
| IFB Ser. 03-48, Class S, IO, 3.02s, 2033 | | 2,033,101 | | 149,616 |
| IFB Ser. 02-92, Class SB, IO, 2.82s, 2030 | | 1,557,444 | | 103,456 |
| IFB Ser. 05-113, Class DI, IO, 2.7s, 2036 | | 36,918,644 | | 2,380,171 |
| IFB Ser. 05-52, Class DC, IO, 2.67s, 2035 | | 3,166,851 | | 248,400 |
| IFB Ser. 04-24, Class CS, IO, 2.62s, 2034 | | 5,594,993 | | 465,958 |
| IFB Ser. 03-122, Class SA, IO, 2.57s, 2028 | | 7,936,794 | | 447,754 |
| IFB Ser. 03-122, Class SJ, IO, 2.57s, 2028 | | 8,428,139 | | 482,848 |
| IFB Ser. 04-64, Class SW, IO, 2.52s, 2034 | | 12,783,982 | | 751,059 |
| IFB Ser. 04-65, Class ST, IO, 2.52s, 2034 | | 6,408,980 | | 376,528 |
| IFB Ser. 04-51, Class S0, IO, 2.52s, 2034 | | 1,133,863 | | 62,717 |
| IFB Ser. 04-60, Class SW, IO, 2.52s, 2034 | | 10,520,121 | | 797,215 |
| IFB Ser. 05-65, Class KI, IO, 2.47s, 2035 | | 23,863,710 | | 1,444,737 |
| IFB Ser. 05-42, Class PQ, IO, 2.27s, 2035 | | 2,085,863 | | 139,701 |
| IFB Ser. 05-42, Class SA, IO, 2.27s, 2035 | | 8,947,649 | | 530,514 |
| Ser. 03-W12, Class 2, IO, 2.231s, 2043 | | 11,877,849 | | 590,470 |
39
| COLLATERALIZED MORTGAGE OBLIGATIONS (13.4%)* continued | | | | |
|
| | Principal amount | | Value |
| |
| Fannie Mae | | | | |
| IFB Ser. 05-73, Class SI, IO, 2.22s, 2035 | $ | 2,142,719 | $ | 125,885 |
| IFB Ser. 05-17, Class ES, IO, 2.22s, 2035 | | 4,265,214 | | 319,186 |
| IFB Ser. 05-17, Class SY, IO, 2.22s, 2035 | | 1,979,194 | | 145,538 |
| IFB Ser. 05-62, Class FS, IO, 2.22s, 2034 | | 5,400,869 | | 328,392 |
| IFB Ser. 05-82, Class SW, IO, 2.2s, 2035 | | 8,503,563 | | 410,563 |
| IFB Ser. 05-82, Class SY, IO, 2.2s, 2035 | | 10,820,517 | | 522,428 |
| IFB Ser. 05-45, Class EW, IO, 2.19s, 2035 | | 18,645,197 | | 994,014 |
| IFB Ser. 05-45, Class SR, IO, 2.19s, 2035 | | 14,783,390 | | 780,393 |
| IFB Ser. 05-105, Class S, IO, 2.17s, 2035 | | 3,232,598 | | 158,599 |
| IFB Ser. 05-95, Class CI, IO, 2.17s, 2035 | | 4,712,481 | | 344,210 |
| IFB Ser. 05-84, Class SG, IO, 2.17s, 2035 | | 8,370,621 | | 568,460 |
| IFB Ser. 05-87, Class SG, IO, 2.17s, 2035 | | 10,737,810 | | 563,735 |
| IFB Ser. 05-89, Class S, IO, 2.17s, 2035 | | 15,579,197 | | 744,880 |
| IFB Ser. 05-69, Class AS, IO, 2.17s, 2035 | | 2,236,427 | | 122,654 |
| IFB Ser. 05-54, Class SA, IO, 2.17s, 2035 | | 10,368,099 | | 515,165 |
| IFB Ser. 05-23, Class SG, IO, 2.17s, 2035 | | 6,662,353 | | 467,406 |
| IFB Ser. 05-29, Class SX, IO, 2.17s, 2035 | | 8,125,578 | | 510,658 |
| IFB Ser. 05-57, Class CI, IO, 2.17s, 2035 | | 6,000,496 | | 376,261 |
| IFB Ser. 05-104, Class NI, IO, 2.17s, 2035 | | 3,921,810 | | 295,455 |
| IFB Ser. 05-17, Class SA, IO, 2.17s, 2035 | | 6,107,910 | | 413,471 |
| IFB Ser. 05-17, Class SE, IO, 2.17s, 2035 | | 6,510,224 | | 431,693 |
| IFB Ser. 05-57, Class DI, IO, 2.17s, 2035 | | 14,164,622 | | 880,387 |
| IFB Ser. 04-92, Class S, IO, 2.17s, 2034 | | 6,740,487 | | 394,925 |
| IFB Ser. 05-104, Class SI, IO, 2.17s, 2033 | | 10,347,773 | | 683,331 |
| IFB Ser. 05-83, Class QI, IO, 2.16s, 2035 | | 1,161,677 | | 86,769 |
| IFB Ser. 05-92, Class SC, IO, 2.15s, 2035 | | 11,176,342 | | 686,339 |
| IFB Ser. 05-73, Class SD, IO, 2.15s, 2035 | | 5,327,733 | | 335,481 |
| IFB Ser. 05-83, Class SL, IO, 2.14s, 2035 | | 22,437,645 | | 1,221,465 |
| IFB Ser. 05-95, Class OI, IO, 2.06s, 2035 | | 647,256 | | 48,451 |
| IFB Ser. 04-38, Class SI, IO, 2.04s, 2033 | | 10,197,762 | | 430,346 |
| IFB Ser. 04-72, Class SB, IO, 1.97s, 2034 | | 4,778,636 | | 207,572 |
| IFB Ser. 03-112, Class SA, IO, 1.97s, 2028 | | 4,319,579 | | 157,333 |
| Ser. 03-W10, Class 1, IO, 1.965s, 2043 | | 36,822,944 | | 1,676,502 |
| Ser. 03-W10, Class 3, IO, 1.932s, 2043 | | 9,378,221 | | 442,505 |
| Ser. 03-W8, Class 12, IO, 1.638s, 2042 | | 37,557,019 | | 1,425,661 |
| IFB Ser. 05-67, Class BS, IO, 1.62s, 2035 | | 5,769,807 | | 255,134 |
| IFB Ser. 05-74, Class SE, IO, 1.57s, 2035 | | 19,826,091 | | 706,767 |
| IFB Ser. 05-82, Class SI, IO, 1.57s, 2035 | | 18,483,326 | | 632,476 |
| IFB Ser. 05-87, Class SE, IO, 1.52s, 2035 | | 43,008,820 | | 1,579,230 |
| IFB Ser. 05-58, Class IK, IO, 1.47s, 2035 | | 4,424,786 | | 192,202 |
| IFB Ser. 04-54, Class SW, IO, 1.47s, 2033 | | 2,605,641 | | 79,900 |
| Ser. 03-W3, Class 2IO2, IO, 1.456s, 2042 | | 1,329,888 | | 4,479 |
| Ser. 03-W6, Class 11, IO, 1.286s, 2035 | | 7,856,767 | | 4,714 |
| Ser. 03-W17, Class 12, IO, 1.153s, 2033 | | 11,298,550 | | 334,754 |
| Ser. 03-T2, Class 2, IO, 0.872s, 2042 | | 55,242,467 | | 1,015,959 |
| Ser. 03-W6, Class 51, IO, 0.682s, 2042 | | 15,672,340 | | 172,396 |
| Ser. 03-W3, Class 2IO1, IO, 0.682s, 2042 | | 4,775,914 | | 76,033 |
| Ser. 01-T12, Class IO, 0.569s, 2041 | | 33,917,413 | | 399,760 |
| Ser. 03-W2, Class 1, IO, 0.471s, 2042 | | 30,470,525 | | 293,115 |
40
| COLLATERALIZED MORTGAGE OBLIGATIONS (13.4%)* continued | | | |
|
| | Principal amount | | Value |
| |
| Fannie Mae | | | |
| Ser. 02-T4, IO, 0.455s, 2041 | $ 11,978,719 | $ | 108,612 |
| Ser. 03-W3, Class 1, IO, 0.437s, 2042 | 39,141,962 | | 371,733 |
| Ser. 02-T1, Class IO, IO, 0.424s, 2031 | 29,550,348 | | 268,894 |
| Ser. 03-W6, Class 3, IO, 0.365s, 2042 | 21,626,767 | | 101,646 |
| Ser. 03-W6, Class 23, IO, 0.351s, 2042 | 23,278,266 | | 104,752 |
| Ser. 01-79, Class BI, IO, 0.338s, 2045 | 6,147,775 | | 43,360 |
| Ser. 03-W4, Class 3A, IO, 0.297s, 2042 | 20,613,667 | | 180,812 |
| Ser. 03-W8, Class 11, IO, 0.03s, 2042 | 13,004,985 | | 1,621 |
| Ser. 03-W6, Class 21, IO, 0.004s, 2042 | 8,589,489 | | 9 |
| Ser. 05-113, Class DO, Principal Only (PO), zero %, 2036 | 5,674,098 | | 4,594,069 |
| Ser. 363, Class 1, PO, zero %, 2035 | 1,169,209 | | 870,177 |
| Ser. 361, Class 1, PO, zero %, 2035 | 10,563,013 | | 8,416,592 |
| Ser. 05-65, Class KO, PO, zero %, 2035 | 854,684 | | 705,657 |
| Ser. 353, Class 1, PO, zero %, 2034 | 21,669,902 | | 15,877,564 |
| Ser. 04-38, Class A0, PO, zero %, 2034 | 5,153,938 | | 3,778,481 |
| Ser. 342, Class 1, PO, zero %, 2033 | 2,342,016 | | 1,856,253 |
| Ser. 02-82, Class TO, PO, zero %, 2032 | 1,402,745 | | 1,092,607 |
| Ser. 04-61, Class C0, PO, zero %, 2031 | 3,065,000 | | 2,386,869 |
| Ser. 05-38, PO, zero %, 2031 | 431,000 | | 320,018 |
| FRB Ser. 05-65, Class ER, zero %, 2035 | 3,349,822 | | 3,528,421 |
| FRB Ser. 05-57, Class UL, zero %, 2035 | 3,571,007 | | 3,726,053 |
| FRB Ser. 05-36, Class QA, zero %, 2035 | 667,198 | | 693,310 |
| FRB Ser. 05-65, Class CU, zero %, 2034 | 483,389 | | 639,316 |
| FRB Ser. 05-81, Class DF, zero %, 2033 | 515,637 | | 531,023 |
| Federal Home Loan Mortgage Corp. Structured | | | |
| Pass-Through Securities | | | |
| Ser. T-42, Class A6, 9 1/2s, 2042 | 327,850 | | 348,988 |
| Ser. T-60, Class 1A3, 7 1/2s, 2044 | 6,214,439 | | 6,531,785 |
| Ser. T-59, Class 1A3, 7 1/2s, 2043 | 4,480,007 | | 4,718,054 |
| Ser. T-58, Class 4A, 7 1/2s, 2043 | 833,331 | | 872,860 |
| Ser. T-57, Class 1A3, 7 1/2s, 2043 | 4,708,798 | | 4,950,388 |
| Ser. T-51, Class 2A, 7 1/2s, 2042 | 928,491 | | 970,111 |
| Ser. T-42, Class A5, 7 1/2s, 2042 | 1,374,864 | | 1,438,917 |
| Ser. T-41, Class 3A, 7 1/2s, 2032 | 3,990,707 | | 4,170,265 |
| Ser. T-60, Class 1A2, 7s, 2044 | 6,030,786 | | 6,258,776 |
| Ser. T-41, Class 2A, 7s, 2032 | 160,763 | | 166,005 |
| Ser. T-56, Class A, IO, 0.66s, 2043 | 14,164,606 | | 156,152 |
| Ser. T-56, Class 3, IO, 0.352s, 2043 | 17,394,613 | | 177,165 |
| Ser. T-56, Class 1, IO, 0.279s, 2043 | 21,116,605 | | 145,886 |
| Ser. T-56, Class 2, IO, 0.04s, 2043 | 19,684,274 | | 51,926 |
| FFCA Secured Lending Corp. 144A Ser. 00-1, | | | |
| Class A2, 7.77s, 2027 | 10,756,269 | | 11,731,483 |
| First Union National Bank-Bank of America | | | |
| Commercial Mortgage 144A Ser. 01-C1, Class 3, | | | |
| IO, 1.696s, 2033 | 32,417,066 | | 2,231,335 |
| First Union-Lehman Brothers Commercial | | | |
| Mortgage Trust II | | | |
| Ser. 97-C2, Class F, 7 1/2s, 2029 | 2,726,000 | | 3,072,410 |
| Ser. 97-C1, Class A3, 7.38s, 2029 | 2,673,193 | | 2,710,442 |
41
| | COLLATERALIZED MORTGAGE OBLIGATIONS (13.4%)* continued | | | |
|
|
| | | Principal amount | | Value |
| |
| | First Union-Lehman Brothers-Bank of America 144A | | | |
| | Ser. 98-C2, Class G, 7s, 2035 | $ 3,410,000 | $ | 3,717,585 |
| | Freddie Mac | | | |
| | IFB Ser. 2963, Class SV, 10.72s, 2034 | 904,000 | | 996,943 |
| | IFB Ser. 2763, Class SC, 10.72s, 2032 | 4,543,036 | | 4,882,533 |
| | IFB Ser. 2990, Class LB, 9.048s, 2034 | 3,228,903 | | 3,028,130 |
| | IFB Ser. 3081, Class DC, 9.045s, 2035 | 1,708,763 | | 1,754,472 |
| | IFB Ser. 3102, Class SD, 8.177s, 2036 | 1,273,000 | | 1,308,475 |
| | IFB Ser. 2990, Class SL, 8.103s, 2034 | 2,723,441 | | 2,792,219 |
| | IFB Ser. 2976, Class LC, 8.03s, 2035 | 1,291,556 | | 1,316,702 |
| | IFB Ser. 2976, Class KL, 7.993s, 2035 | 3,044,751 | | 3,106,655 |
| | IFB Ser. 2990, Class DP, 7.883s, 2034 | 2,687,876 | | 2,711,960 |
| | IFB Ser. 2979, Class AS, 7.883s, 2034 | 779,077 | | 779,077 |
| | IFB Ser. 3051, Class PS, 7.773s, 2035 | 946,342 | | 956,545 |
| | IFB Ser. 3072, Class SA, 7.737s, 2035 | 670,123 | | 656,093 |
| | Ser. 2229, Class PD, 7 1/2s, 2030 | 573,161 | | 607,193 |
| | Ser. 2224, Class PD, 7 1/2s, 2030 | 570,145 | | 603,998 |
| | Ser. 2217, Class PD, 7 1/2s, 2030 | 590,174 | | 625,215 |
| | Ser. 2187, Class PH, 7 1/2s, 2029 | 1,338,198 | | 1,417,653 |
| | Ser. 1989, Class C, 7 1/2s, 2027 | 200,841 | | 212,766 |
| | Ser. 1990, Class D, 7 1/2s, 2027 | 544,307 | | 576,625 |
| | Ser. 1969, Class PF, 7 1/2s, 2027 | 463,709 | | 491,241 |
| | Ser. 1975, Class E, 7 1/2s, 2027 | 126,271 | | 133,768 |
| | Ser. 1943, Class M, 7 1/2s, 2027 | 300,791 | | 318,651 |
| | Ser. 1932, Class E, 7 1/2s, 2027 | 412,246 | | 436,723 |
| | Ser. 1938, Class E, 7 1/2s, 2027 | 165,391 | | 175,211 |
| | Ser. 1941, Class E, 7 1/2s, 2027 | 137,234 | | 145,382 |
| | Ser. 1924, Class H, 7 1/2s, 2027 | 450,309 | | 477,046 |
| | Ser. 1928, Class D, 7 1/2s, 2027 | 178,340 | | 188,929 |
| | Ser. 1915, Class C, 7 1/2s, 2026 | 396,867 | | 420,431 |
| | Ser. 1923, Class D, 7 1/2s, 2026 | 483,278 | | 511,973 |
| | Ser. 1904, Class D, 7 1/2s, 2026 | 519,864 | | 550,731 |
| | Ser. 1905, Class H, 7 1/2s, 2026 | 464,890 | | 492,493 |
| | Ser. 1890, Class H, 7 1/2s, 2026 | 437,103 | | 463,056 |
| | Ser. 1895, Class C, 7 1/2s, 2026 | 218,154 | | 231,107 |
| | IFB Ser. 3072, Class SM, 7.407s, 2035 | 1,064,933 | | 1,029,158 |
| | IFB Ser. 3072, Class SB, 7.26s, 2035 | 1,005,273 | | 966,004 |
| | IFB Ser. 3065, Class DC, 6.45s, 2035 | 2,619,229 | | 2,495,690 |
| | IFB Ser. 3050, Class SA, 5.7s, 2034 | 1,824,445 | | 1,696,494 |
| | Ser. 2581, Class IH, IO, 5 1/2s, 2031 | 2,111,245 | | 564,587 |
| | Ser. 2600, Class CI, IO, 5 1/2s, 2029 | 666,122 | | 154,484 |
| | Ser. 2664, Class UD, IO, 5 1/2s, 2028 | 1,061,555 | | 203,558 |
| | IFB Ser. 2990, Class WP, 5.495s, 2035 | 2,131,634 | | 2,061,525 |
| | Ser. 3114, Class TS, IO, 5s, 2036 | 20,092,655 | | 941,843 |
| | IFB Ser. 2927, Class SI, IO, 4.03s, 2035 | 5,135,437 | | 609,925 |
| | Ser. 2437, Class SB, IO, 3.53s, 2032 | 3,432,669 | | 318,595 |
| | IFB Ser. 2538, Class SH, IO, 3.08s, 2032 | 819,297 | | 56,345 |
| | IFB Ser. 2828, Class GI, IO, 3.03s, 2034 | 5,596,810 | | 576,311 |
| | Ser. 2469, Class SH, IO, 3s, 2032 | 3,090,980 | | 244,381 |
| | IFB Ser. 2802, Class SM, IO, 2.88s, 2032 | 1,753,861 | | 118,575 |
| | IFB Ser. 2869, Class SH, IO, 2.83s, 2034 | 2,955,981 | | 195,526 |
| 42 | | | | |
| COLLATERALIZED MORTGAGE OBLIGATIONS (13.4%)* continued | | | |
|
| | Principal amount | | Value |
| |
| Freddie Mac | | | |
| IFB Ser. 2869, Class JS, IO, 2.78s, 2034 | $ 14,093,602 | $ | 966,714 |
| IFB Ser. 2882, Class SL, IO, 2.73s, 2034 | 2,947,189 | | 231,760 |
| IFB Ser. 2682, Class TQ, IO, 2.58s, 2033 | 2,429,804 | | 140,473 |
| IFB Ser. 2815, Class PT, IO, 2.58s, 2032 | 5,437,469 | | 396,276 |
| IFB Ser. 2828, Class TI, IO, 2.58s, 2030 | 2,616,276 | | 183,139 |
| IFB Ser. 3033, Class SF, IO, 2.33s, 2035 | 3,943,244 | | 199,627 |
| IFB Ser. 3028, Class ES, IO, 2.28s, 2035 | 13,083,134 | | 1,032,719 |
| IFB Ser. 2922, Class SE, IO, 2.28s, 2035 | 8,124,848 | | 413,859 |
| IFB Ser. 3045, Class DI, IO, 2.26s, 2035 | 27,558,731 | | 1,357,288 |
| IFB Ser. 2981, Class AS, IO, 2 1/4s, 2035 | 7,210,820 | | 349,274 |
| IFB Ser. 2981, Class BS, IO, 2 1/4s, 2035 | 3,823,853 | | 188,803 |
| IFB Ser. 3054, Class CS, IO, 2.23s, 2035 | 2,930,047 | | 161,153 |
| IFB Ser. 3066, Class SI, IO, 2.23s, 2035 | 8,429,000 | | 657,511 |
| IFB Ser. 2924, Class SA, IO, 2.23s, 2035 | 11,602,539 | | 558,372 |
| IFB Ser. 2927, Class ES, IO, 2.23s, 2035 | 4,158,075 | | 234,460 |
| IFB Ser. 2950, Class SM, IO, 2.23s, 2016 | 5,700,503 | | 360,735 |
| IFB Ser. 3031, Class BI, IO, 2.22s, 2035 | 2,503,910 | | 205,696 |
| IFB Ser. 3067, Class SI, IO, 2.18s, 2035 | 9,723,853 | | 762,398 |
| IFB Ser. 2986, Class WS, IO, 2.18s, 2035 | 3,279,891 | | 114,058 |
| IFB Ser. 2962, Class BS, IO, 2.18s, 2035 | 16,689,385 | | 938,609 |
| IFB Ser. 2990, Class LI, IO, 2.16s, 2034 | 4,872,751 | | 316,015 |
| IFB Ser. 3065, Class DI, IO, 2.15s, 2035 | 1,901,043 | | 150,470 |
| IFB Ser. 2988, Class AS, IO, 1.73s, 2035 | 1,622,924 | | 63,000 |
| IFB Ser. 3016, Class SP, IO, 1.64s, 2035 | 2,540,635 | | 98,450 |
| IFB Ser. 3016, Class SQ, IO, 1.64s, 2035 | 5,792,413 | | 223,529 |
| IFB Ser. 2937, Class SY, IO, 1.63s, 2035 | 2,652,982 | | 90,865 |
| IFB Ser. 2957, Class SW, IO, 1.53s, 2035 | 14,705,270 | | 494,005 |
| IFB Ser. 2815, Class S, IO, 1.53s, 2032 | 6,096,733 | | 205,801 |
| Ser. 3045, Class DO, PO, zero %, 2035 | 2,173,873 | | 1,711,454 |
| Ser. 231, PO, zero %, 2035 | 66,159,838 | | 49,888,192 |
| Ser. 228, PO, zero %, 2035 | 28,391,690 | | 22,397,013 |
| Ser. 227, PO, zero %, 2034 | 28,306,389 | | 20,657,985 |
| FRB Ser. 3022, Class TC, zero %, 2035 | 569,712 | | 634,160 |
| FRB Ser. 3003, Class XF, zero %, 2035 | 3,069,763 | | 3,155,624 |
| FRB Ser. 2986, Class XT, zero %, 2035 | 329,584 | | 350,955 |
| FRB Ser. 2958, Class FL, zero %, 2035 | 1,505,720 | | 1,454,349 |
| FRB Ser. 3046, Class WF, zero %, 2035 | 829,413 | | 812,638 |
| FRB Ser. 3054, Class XF, zero %, 2034 | 336,670 | | 341,457 |
| GE Capital Commercial Mortgage Corp. 144A | | | |
| Ser. 05-C2, Class XC, IO, 0.05s, 2043 | 88,771,983 | | 754,047 |
| Ser. 05-C3, Class XC, IO, 0.038s, 2045 | 232,914,000 | | 1,236,773 |
| General Growth Properties-Mall Properties Trust | | | |
| 144A FRB Ser. 01-C1A, Class D3, 6.72s, 2014 | 1,574,422 | | 1,575,898 |
| GMAC Commercial Mortgage Securities, Inc. | | | |
| Ser. 99-C3, Class F, 7.806s, 2036 | 592,000 | | 622,115 |
| Ser. 04-C2, Class A4, 5.301s, 2038 | 1,483,000 | | 1,481,383 |
| Ser. 03-C2, Class A2, 5.28s, 2040 | 6,249,000 | | 6,322,776 |
| Ser. 97-C1, Class X, IO, 1.579s, 2029 | 16,042,540 | | 572,719 |
| Ser. 05-C1, Class X1, IO, 0.097s, 2043 | 99,281,000 | | 1,806,914 |
43
| COLLATERALIZED MORTGAGE OBLIGATIONS (13.4%)* continued | | | |
|
| | Principal amount | | Value |
| |
| GMAC Commercial Mortgage Securities, Inc. 144A | | | |
| Ser. 99-C3, Class G, 6.974s, 2036 | $ 1,614,303 | $ | 1,564,860 |
| Ser. 06-C1, Class XC, IO, 0.039s, 2045 | 128,777,000 | | 875,684 |
| Government National Mortgage Association | | | |
| IFB Ser. 05-7, Class JM, 6.864s, 2034 | 3,495,123 | | 3,509,045 |
| IFB Ser. 05-66, Class SP, 5.933s, 2035 | 1,543,522 | | 1,443,173 |
| Ser. 05-13, Class PI, IO, 5 1/2s, 2033 | 4,001,458 | | 651,137 |
| IFB Ser. 04-86, Class SW, IO, 2.26s, 2034 | 6,778,130 | | 371,848 |
| IFB Ser. 05-65, Class SI, IO, 1.86s, 2035 | 6,727,573 | | 301,281 |
| IFB Ser. 05-68, Class SI, IO, 1.81s, 2035 | 21,654,724 | | 1,096,678 |
| IFB Ser. 05-51, Class SJ, IO, 1.71s, 2035 | 6,513,879 | | 305,371 |
| IFB Ser. 05-68, Class S, IO, 1.71s, 2035 | 12,920,497 | | 596,146 |
| IFB Ser. 05-28, Class SA, IO, 1.71s, 2035 | 16,820,114 | | 597,585 |
| Ser. 98-2, Class EA, PO, zero %, 2028 | 161,856 | | 129,030 |
| Greenwich Capital Commercial Funding Corp. | | | |
| Ser. 05-GG5, Class XC, IO, 0.038s, 2037 | 185,307,804 | | 815,549 |
| GS Mortgage Securities Corp. II 144A | | | |
| FRB Ser. 03-FL6A, Class L, 7.72s, 2015 | 565,000 | | 565,706 |
| Ser. 98-C1, Class F, 6s, 2030 | 1,286,000 | | 1,291,455 |
| Ser. 05-GG4, Class XC, IO, 0.105s, 2039 | 108,557,740 | | 2,135,388 |
| Ser. 04-C1, Class X1, IO, 0.086s, 2028 | 36,576,015 | | 311,468 |
| JPMorgan Chase Commercial Mortgage | | | |
| Securities Corp. 144A | | | |
| Ser. 04-FL1A, Class X1A, IO, 0.954s, 2019 | 6,825,235 | | 22,547 |
| Ser. 02-CIB5, Class X1, IO, 0.385s, 2037 | 22,733,189 | | 1,004,345 |
| Ser. 05-CB12, Class X1, IO, 0.053s, 2037 | 56,365,585 | | 612,095 |
| Ser. 05-LDP2, Class X1, IO, 0.048s, 2042 | 170,163,282 | | 2,678,743 |
| Ser. 05-LDP4, Class X1, IO, 0.041s, 2042 | 111,954,681 | | 1,045,202 |
| Ser. 05-LDP3, Class X1, IO, 0.036s, 2042 | 82,910,822 | | 628,309 |
| Ser. 05-LDP1, Class X1, IO, 0.034s, 2046 | 38,020,688 | | 357,929 |
| Ser. 05-LDP5, Class X1, IO, 0.033s, 2044 | 347,976,000 | | 1,658,325 |
| JP Morgan Commercial Mortgage Finance Corp. | | | |
| Ser. 97-C5, Class F, 7.561s, 2029 | 911,000 | | 1,000,490 |
| LB Commercial Conduit Mortgage Trust 144A | | | |
| Ser. 99-C1, Class F, 6.41s, 2031 | 715,303 | | 730,196 |
| Ser. 99-C1, Class G, 6.41s, 2031 | 765,731 | | 721,030 |
| Ser. 98-C4, Class G, 5.6s, 2035 | 634,000 | | 613,200 |
| Ser. 98-C4, Class H, 5.6s, 2035 | 1,074,000 | | 1,003,812 |
| LB-UBS Commercial Mortgage Trust 144A | | | |
| Ser. 05-C3, Class XCL, IO, 0.139s, 2040 | 68,863,779 | | 1,487,474 |
| Ser. 05-C2, Class XCL, IO, 0.1s, 2040 | 135,296,522 | | 1,481,685 |
| Ser. 05-C5, Class XCL, IO, 0.084s, 2020 | 70,449,384 | | 1,025,414 |
| Ser. 05-C7, Class XCL, IO, 0.074s, 2040 | 84,280,739 | | 806,651 |
| Ser. 06-C1, Class XCL, IO, 0.062s, 2041 | 67,262,000 | | 766,787 |
| Lehman Brothers Floating Rate Commercial | | | |
| Mortgage Trust 144A | | | |
| FRB Ser. 03-LLFA, Class L, 8.22s, 2014 | 1,704,000 | | 1,702,353 |
| FRB Ser. 04-LLFA, Class H, 5.42s, 2017 | 733,000 | | 735,785 |
| FRB Ser. 05-LLFA, 5.27s, 2018 | 423,000 | | 423,000 |
44
| COLLATERALIZED MORTGAGE OBLIGATIONS (13.4%)* continued | | | | |
|
| | Principal amount | | Value |
| |
| Merrill Lynch Mortgage Investors, Inc. | | | | |
| Ser. 98-C3, Class E, 7.138s, 2030 | $ | 644,000 | $ | 696,967 |
| Ser. 96-C2, Class A3, 6.96s, 2028 | | 34,798 | | 34,838 |
| Merrill Lynch Mortgage Trust Ser. 05-MCP1, | | | | |
| Class XC, IO, 0.048s, 2043 | | 72,100,455 | | 957,584 |
| Merrill Lynch Mortgage Trust 144A Ser. 05-LC1, | | | | |
| Class X, IO, 0.108s, 2044 | | 37,997,000 | | 390,229 |
| Mezz Cap Commercial Mortgage Trust 144A | | | | |
| Ser. 04-C1, Class X, IO, 8.052s, 2037 | | 3,205,803 | | 1,249,262 |
| Ser. 04-C2, Class X, IO, 6.406s, 2040 | | 2,522,174 | | 902,465 |
| Ser. 05-C3, Class X, IO, 5.538s, 2044 | | 2,890,000 | | 986,213 |
| Morgan Stanley Capital 144A | | | | |
| Ser. 05-RR6, Class X, IO, 1.683s, 2043 | | 10,669,000 | | 777,258 |
| Ser. 05-HQ6, Class X1, IO, 0.047s, 2042 | | 77,217,676 | | 781,211 |
| Morgan Stanley Capital I 144A | | | | |
| Ser. 98-HF1, Class F, 7.18s, 2030 | | 482,000 | | 498,055 |
| Ser. 04-RR, Class F5, 6s, 2039 | | 1,000,000 | | 855,910 |
| Ser. 04-RR, Class F6, 6s, 2039 | | 1,700,000 | | 1,399,871 |
| Ser. 05-HQ5, Class X1, IO, 0.038s, 2042 | | 52,641,903 | | 435,928 |
| Morgan Stanley Dean Witter Capital I | | | | |
| Ser. 00-LIF2, Class A1, 6.96s, 2033 | | 575,840 | | 589,290 |
| Mortgage Capital Funding, Inc. FRB Ser. 98-MC2, | | | | |
| Class E, 7.098s, 2030 | | 1,020,000 | | 1,060,623 |
| Permanent Financing PLC FRB Ser. 8, Class 2C, | | | | |
| 4.88s, 2042 (United Kingdom) | | 2,054,000 | | 2,053,530 |
| PNC Mortgage Acceptance Corp. 144A | | | | |
| Ser. 99-CM1, Class B3, 7.1s, 2032 | | 3,870,000 | | 4,030,240 |
| Ser. 00-C1, Class J, 6 5/8s, 2010 | | 456,000 | | 431,303 |
| Ser. 00-C2, Class J, 6.22s, 2033 | | 998,000 | | 1,003,747 |
| Pure Mortgages 144A | | | | |
| FRB Ser. 04-1A, Class F, 7.9s, 2034 (Ireland) | | 2,645,000 | | 2,649,959 |
| Ser. 04-1A, Class E, 5.65s, 2034 (Ireland) | | 1,041,000 | | 1,042,952 |
| QFA Royalties, LLC 144A Ser. 05-1, 7.3s, 2025 | | 1,841,070 | | 1,821,963 |
| Salomon Brothers Mortgage Securities VII 144A | | | | |
| Ser. 03-CDCA, Class X3CD, IO, 1.43s, 2015 | | 3,824,595 | | 37,810 |
| SBA CMBS Trust 144A Ser. 05-1A, Class D, 6.219s, 2035 | | 600,000 | | 602,029 |
| STRIPS 144A | | | | |
| Ser. 03-1A, Class L, 5s, 2018 (Cayman Islands) | | 757,000 | | 651,641 |
| Ser. 03-1A, Class M, 5s, 2018 (Cayman Islands) | | 513,000 | | 424,908 |
| Ser. 04-1A, Class L, 5s, 2018 (Cayman Islands) | | 337,000 | | 290,096 |
| Wachovia Bank Commercial Mortgage Trust | | | | |
| Ser. 05-C17, Class A4, 5.083s, 2042 | | 7,065,000 | | 6,973,296 |
| Wachovia Bank Commercial Mortgage Trust 144A | | | | |
| FRB Ser. 05-WL5A, Class L, 7.77s, 2018 | | 771,000 | | 766,775 |
| Ser. 03-C3, Class IOI, IO, 0.271s, 2035 | | 18,123,386 | | 581,728 |
| Washington Mutual Asset Securities Corp. 144A | | | | |
| Ser. 05-C1A, Class G, 5.72s, 2036 | | 222,000 | | 215,592 |
| Washington Mutual Multi-Fam., Mtge. 144A | | | | |
| Ser. 01-1, Class B5, 7.21s, 2031 | | 1,305,000 | | 1,377,311 |
|
| Total collateralized mortgage obligations (cost $672,252,455) | | | $ | 657,154,371 |
45
| U.S. GOVERNMENT AND AGENCY MORTGAGE OBLIGATIONS (10.8%)* | | |
|
| | Principal amount | | Value |
| |
| U.S. Government Guaranteed Mortgage Obligations (—%) | | | |
| Government National Mortgage Association | | | |
| Pass-Through Certificates 7s, with due dates from | | | |
| August 15, 2029 to October 15, 2031 | $ 348,103 | $ | 367,608 |
|
| |
| U.S. Government Agency Mortgage Obligations (10.8%) | | | |
| Federal Home Loan Mortgage Corporation | | | |
| Pass-Through Certificates | | | |
| 8 3/4s, with due dates from May 1, 2009 to June 1, 2009 | 202,667 | | 209,538 |
| 6s, with due dates from October 1, 2031 to March 1, 2035 | 64,548 | | 65,292 |
| 5 1/2s, June 1, 2035 | 2,847,120 | | 2,822,616 |
| 5 1/2s, July 1, 2016 | 532,707 | | 536,786 |
| Federal National Mortgage Association | | | |
| Pass-Through Certificates | | | |
| 11s, with due dates from October 1, 2015 to March 1, 2016 | 11,204 | | 12,370 |
| 9s, with due dates from January 1, 2027 to July 1, 2032 | 292,247 | | 318,555 |
| 8 3/4s, July 1, 2009 | 4,861 | | 5,045 |
| 8s, with due dates from August 1, 2026 to July 1, 2033 | 1,301,254 | | 1,376,495 |
| 7 1/2s, with due dates from October 1, 2025 to July 1, 2033 | 973,826 | | 1,020,568 |
| 7s, with due dates from February 1, 2033 to January 1, 2036 | 7,885,805 | | 8,203,943 |
| 7s, with due dates from November 1, 2007 to February 1, 2017 | 1,489,981 | | 1,522,768 |
| 6 1/2s, with due dates from February 1, 2033 | | | |
| to December 1, 2034 | 7,275,325 | | 7,465,162 |
| 6 1/2s, with due dates from July 1, 2010 to May 1, 2011 | 315,090 | | 323,571 |
| 6s, May 1, 2035 | 219,253 | | 221,711 |
| 6s, with due dates from December 1, 2013 to May 1, 2017 | 223,950 | | 228,862 |
| 6s, TBA, February 1, 2036 | 49,600,000 | | 50,068,874 |
| 5 1/2s, with due dates from February 1, 2035 | | | |
| to January 1, 2036 | 74,887,145 | | 74,109,320 |
| 5 1/2s, with due dates from January 1, 2009 | | | |
| to April 1, 2020 | 902,852 | | 909,760 |
| 5 1/2s, TBA, February 1, 2036 | 113,400,000 | | 112,141,963 |
| 5 1/2s, TBA, February 1, 2021 | 67,700,000 | | 68,091,387 |
| 5s, with due dates from July 1, 2035 to August 1, 2035 | 117,419 | | 113,613 |
| 5s, with due dates from December 1, 2018 to June 1, 2020 | 2,403,119 | | 2,378,053 |
| 5s, TBA, February 1, 2036 | 191,400,000 | | 184,910,353 |
| 4 1/2s, April 1, 2020 | 1,969 | | 1,911 |
| 4 1/2s, TBA, February 1, 2021 | 1,700,000 | | 1,649,531 |
| 4s, with due dates from May 1, 2019 to October 1, 2020 | 9,720,322 | | 9,256,524 |
| | | | 527,964,571 |
|
| |
| Total U.S. government and agency mortgage obligations (cost $529,997,876) | $ | 528,332,179 |
46
| U.S. TREASURY OBLIGATIONS (2.1%)* | | | |
|
| | Principal amount | | Value |
| |
| U.S. Treasury Notes | | | |
| 4 1/4s, November 15, 2013 | $ 1,450,000 | $ | 1,421,680 |
| 3 7/8s, May 15, 2010 | 100,000,000 | | 97,546,880 |
| 3 1/4s, August 15, 2008 | 3,005,000 | | 2,916,024 |
|
| Total U.S. treasury obligations (cost $101,885,827) | | $ | 101,884,584 |
|
| |
| |
| ASSET-BACKED SECURITIES (8.2%)* | | | |
|
| | Principal amount | | Value |
| |
| Aames Mortgage Investment Trust FRN Ser. 04-1, | | | |
| Class 2A1, 4.87s, 2034 | $ 1,389,095 | $ | 1,390,656 |
| ABSC NIMS Trust 144A Ser. 05-HE2, Class A1, | | | |
| 4 1/2s, 2035 (Cayman Islands) | 1,525,732 | | 1,495,637 |
| Advanta Business Card Master Trust FRN | | | |
| Ser. 04-C1, Class C, 5.54s, 2013 | 210,000 | | 212,791 |
| Advanta Mortgage Loan Trust Ser. 00-1, Class A4, 8.61s, 2028 | 381,701 | | 382,477 |
| Aegis Asset Backed Securities Trust 144A | | | |
| Ser. 04-2N, Class N1, 4 1/2s, 2034 | 94,875 | | 94,579 |
| Ser. 04-5N, Class Note, 5s, 2034 | 228,670 | | 227,669 |
| Ser. 04-6N, Class Note, 4 3/4s, 2035 | 344,007 | | 342,072 |
| AFC Home Equity Loan Trust Ser. 99-2, Class 1A, | | | |
| 4.94s, 2029 | 3,599,819 | | 3,616,044 |
| American Express Credit Account Master Trust | | | |
| 144A Ser. 04-C, Class C, 4.97s, 2012 | 7,865,460 | | 7,866,687 |
| American Home Mortgage Investment Trust | | | |
| FRB Ser. 04-3, Class 2A, 3.59s, 2034 | 2,081,373 | | 2,043,612 |
| FRB Ser. 04-3, Class 3A, 3.71s, 2034 | 1,837,391 | | 1,807,254 |
| Americredit Automobile Receivables Trust 144A | | | |
| Ser. 05-1, Class E, 5.82s, 2012 | 1,520,000 | | 1,516,185 |
| Ameriquest Finance NIM Trust 144A | | | |
| Ser. 04-IAN, Class 1A, 5.437s, 2034 | | | |
| (Cayman Islands) | 56,551 | | 56,551 |
| Ser. 04-RN9, Class N1, 4.8s, 2034 | | | |
| (Cayman Islands) | 292,657 | | 292,657 |
| Ameriquest Mortgage Securities, Inc. | | | |
| Ser. 03-6, Class S, IO, 5s, 2033 | 3,379,094 | | 1,014 |
| Ser. 03-8, Class S, IO, 5s, 2006 | 2,442,646 | | 10,406 |
| Arcap REIT, Inc. 144A | | | |
| Ser. 03-1A, Class E, 7.11s, 2038 | 1,283,000 | | 1,312,669 |
| Ser. 04-1A, Class E, 6.42s, 2039 | 1,112,000 | | 1,108,360 |
| Argent NIM Trust 144A Ser. 04-WN9, Class A, | | | |
| 5.19s, 2034 (Cayman Islands) | 96,149 | | 96,104 |
| Asset Backed Funding Corp. NIM Trust 144A | | | |
| Ser. 04-0PT5, Class N1, 4.45s, 2034 | | | |
| (Cayman Islands) | 96,356 | | 96,109 |
| Ser. 04-FF1, Class N1, 5s, 2034 (Cayman Islands) | 174,535 | | 174,285 |
47
| ASSET-BACKED SECURITIES (8.2%)* continued | | | |
|
| | Principal amount | | Value |
| |
| Asset Backed Securities Corp. Home Equity Loan Trust | | | |
| Ser. 03-HE5, Class A, IO, 4s, 2033 | $ 4,811,919 | $ | 34 |
| FRB Ser. 04-HE9, Class A2, 4.9s, 2034 | 624,409 | | 625,097 |
| FRB Ser. 05-HE1, Class A3, 4.82s, 2035 | 868,530 | | 869,347 |
| FRB Ser. 04-HE1, Class A3, 4.87s, 2034 | 36,946 | | 36,956 |
| Aviation Capital Group Trust 144A FRB | | | |
| Ser. 03-2A, Class G1, 5.19s, 2033 | 966,152 | | 967,585 |
| Banc of America Funding Corp. 144A Ser. 04-NIM1, | | | |
| Class Note, 6s, 2034 | 31,857 | | 31,857 |
| Banc of America Mortgage Securities | | | |
| Ser. 04-D, Class 2A, IO, 0.576s, 2034 | 15,730,916 | | 54,075 |
| Ser. 05-E, Class 2, IO, 0.306s, 2035 | 34,569,000 | | 243,065 |
| Bank One Issuance Trust FRB Ser. 03-C4, | | | |
| Class C4, 5 1/2s, 2011 | 210,000 | | 213,962 |
| Bay View Auto Trust Ser. 05-LJ2, Class D, 5.27s, 2014 | 420,000 | | 415,189 |
| Bayview Financial Acquisition Trust | | | |
| Ser. 03-E, Class A, IO, 4s, 2006 | 2,907,535 | | 16,416 |
| Ser. 04-B, Class A1, 5.06s, 2039 | 4,211,489 | | 4,211,481 |
| Ser. 04-D, Class A, IO, 3.938s, 2007 | 15,690,481 | | 549,684 |
| Ser. 05-B, Class A, IO, 2.481s, 2039 | 13,011,549 | | 462,209 |
| FRB Ser. 04-D, Class A, 4.95s, 2044 | 3,019,740 | | 3,022,594 |
| FRB Ser. 03-F, Class A, 5.06s, 2043 | 2,372,000 | | 2,377,861 |
| FRB Ser. 03-G, Class A1, 5.16s, 2039 | 4,813,000 | | 4,819,556 |
| Bayview Financial Acquisition Trust 144A FRN | | | |
| Ser. 04-B, Class M2, 6.46s, 2039 | 200,000 | | 202,793 |
| Bayview Financial Asset Trust 144A | | | |
| Ser. 03-X, Class A, IO, 0.61s, 2006 | 19,249,950 | | 276,718 |
| FRB Ser. 03-SSRA, Class A, 5.23s, 2038 | 1,124,627 | | 1,131,262 |
| FRB Ser. 03-SSRA, Class M, 5.88s, 2038 | 1,333,399 | | 1,347,933 |
| FRB Ser. 04-SSRA, Class A1, 5.13s, 2039 | 1,458,515 | | 1,464,787 |
| Bear Stearns Adjustable Rate Mortgage Trust | | | |
| Ser. 04-1, Class 11A1, 3.627s, 2034 | 4,777,987 | | 4,723,645 |
| Bear Stearns Alternate Trust | | | |
| Ser. 04-11, Class 2A2, 4.955s, 2034 | 3,223,625 | | 3,212,751 |
| Ser. 04-12, Class 2A2, 5.02s, 2035 | 2,200,766 | | 2,192,893 |
| Ser. 04-9, Class 1A1, 4.976s, 2034 | 828,673 | | 826,242 |
| Ser. 05-2, Class 2A2A, 4.833s, 2035 | 1,370,731 | | 1,363,361 |
| Ser. 05-5, Class 21A1, 4.688s, 2035 | 4,593,327 | | 4,551,480 |
| Bear Stearns Asset Backed Securities NIM Trust 144A | | | |
| Ser. 04-FR1, Class A1, 5s, 2034 (Cayman Islands) | 210,019 | | 209,625 |
| Ser. 04-HE10, Class A1, 4 1/4s, 2034 | | | |
| (Cayman Islands) | 196,731 | | 195,501 |
| Ser. 04-HE10, Class A2, 5s, 2034 | | | |
| (Cayman Islands) | 245,000 | | 243,009 |
| Ser. 04-HE5N, Class A1, 5s, 2034 | | | |
| (Cayman Islands) | 5,342 | | 5,337 |
| Ser. 04-HE6, Class A1, 5 1/4s, 2034 | | | |
| (Cayman Islands) | 136,678 | | 136,507 |
| Ser. 04-HE7N, Class A1, 5 1/4s, 2034 | 158,587 | | 158,388 |
| Ser. 04-HE8N, Class A1, 5s, 2034 | 77,144 | | 76,975 |
48
| ASSET-BACKED SECURITIES (8.2%)* continued | | | |
|
| | Principal amount | | Value |
| |
| Bear Stearns Asset Backed Securities, Inc. | | | |
| Ser. 03-AC4, Class A, IO, 5s, 2006 | $ 6,744,600 | $ | 790 |
| FRB Ser. 05-3, Class A1, 4.98s, 2035 | 1,495,287 | | 1,494,353 |
| FRB Ser. 03-1, Class A1, 5.03s, 2042 | 581,577 | | 581,574 |
| FRB Ser. 03-3, Class A2, 5.12s, 2043 | 2,229,000 | | 2,234,224 |
| Capital Auto Receivables Asset Trust 144A | | | |
| Ser. 05-1, Class D, 6 1/2s, 2011 | 1,442,000 | | 1,407,753 |
| Capital One Multi-Asset Execution Trust FRB | | | |
| Ser. 02-C1, Class C1, 7.22s, 2010 | 570,000 | | 591,197 |
| CARMAX Auto Owner Trust Ser. 04-2, Class D, | | | |
| 3.67s, 2011 | 361,768 | | 353,885 |
| CARSSX Finance, Ltd. 144A | | | |
| FRB Ser. 04-AA, Class B3, 7.82s, 2011 | | | |
| (Cayman Islands) | 150,843 | | 153,700 |
| FRB Ser. 04-AA, Class B4, 9.97s, 2011 | | | |
| (Cayman Islands) | 694,723 | | 733,106 |
| CDO Repackaging Trust Series 144A FRN Ser. 03-2, | | | |
| Class A, 8.617s, 2008 | 3,105,000 | | 3,330,113 |
| Centex Home Equity Ser. 04-C, Class A, IO, | | | |
| 3 1/2s, 2006 | 7,830,000 | | 82,691 |
| Chase Credit Card Master Trust FRB Ser. 03-3, | | | |
| Class C, 5.55s, 2010 | 1,730,000 | | 1,760,241 |
| Chase Funding Net Interest Margin 144A | | | |
| Ser. 04-OPT1, Class Note, 4.458s, 2034 | 376,548 | | 374,666 |
| CHEC NIM Ltd., 144A | | | |
| Ser. 04-2, Class N1, 4.45s, 2034 (Cayman Islands) | 106,696 | | 106,449 |
| Ser. 04-2, Class N2, 8s, 2034 (Cayman Islands) | 421,000 | | 415,738 |
| Ser. 04-2, Class N3, 8s, 2034 (Cayman Islands) | 169,000 | | 146,254 |
| Citibank Credit Card Issuance Trust FRN | | | |
| Ser. 01-C1, Class C1, 5.68s, 2010 | 1,060,000 | | 1,076,645 |
| Conseco Finance Securitizations Corp. | | | |
| Ser. 00-4, Class A6, 8.31s, 2032 | 8,597,000 | | 7,270,483 |
| Ser. 00-5, Class A4, 7.47s, 2032 | 1,432,531 | | 1,439,025 |
| Ser. 00-5, Class A6, 7.96s, 2032 | 3,727,000 | | 3,161,379 |
| Ser. 01-1, Class A4, 6.21s, 2032 | 3,471,336 | | 3,487,634 |
| Ser. 01-1, Class A5, 6.99s, 2032 | 2,692,000 | | 2,485,395 |
| Ser. 01-3, Class A4, 6.91s, 2033 | 8,065,000 | | 7,748,255 |
| Ser. 01-4, Class A4, 7.36s, 2033 | 6,025,000 | | 5,949,308 |
| Ser. 01-4, Class B1, 9.4s, 2033 | 838,805 | | 113,239 |
| Ser. 02-1, Class A, 6.681s, 2033 | 9,126,424 | | 9,286,083 |
| Ser. 02-1, Class M2, 9.546s, 2033 | 4,582,000 | | 2,291,000 |
| Ser. 02-2, Class A, IO, 8 1/2s, 2033 | 7,637,732 | | 1,822,874 |
| Consumer Credit Reference IDX Securities 144A | | | |
| FRB Ser. 02-1A, Class A, 6.501s, 2007 | 3,061,000 | | 3,097,426 |
| Countrywide Alternative Loan Trust | | | |
| Ser. 04-15, Class 1A1, 4.934s, 2034 | 808,920 | | 805,507 |
| Ser. 05-24, Class 1AX, IO, 1.223s, 2035 | 26,081,320 | | 684,635 |
| Ser. 05-24, Class IIAX, IO, 1.039s, 2035 | 22,452,138 | | 841,955 |
49
| ASSET-BACKED SECURITIES (8.2%)* continued | | | |
|
| | Principal amount | | Value |
| |
| Countrywide Asset Backed Certificates 144A | | | |
| Ser. 04-11N, Class N, 5 1/4s, 2036 | $ 132,771 | $ | 131,672 |
| Ser. 04-14N, 5s, 2036 | 337,104 | | 331,823 |
| Ser. 04-6N, Class N1, 6 1/4s, 2035 | 943,422 | | 934,626 |
| Ser. 04-BC1N, Class Note, 5 1/2s, 2035 | 172,801 | | 170,796 |
| Countrywide Home Loans | | | |
| Ser. 05-2, Class 2X, IO, 1.196s, 2035 | 25,584,707 | | 603,640 |
| Ser. 05-9, Class 1X, IO, 1.27s, 2035 | 24,996,885 | | 578,053 |
| Countrywide Home Loans 144A Ser. 05-R2, | | | |
| Class 2A3, 8s, 2035 | 1,688,156 | | 1,787,335 |
| Countrywide Partnership Trust 144A Ser. 04-EC1N, | | | |
| Class N, 5s, 2035 | 94,369 | | 93,384 |
| Crest, Ltd. 144A Ser. 03-2A, Class D2, 6.723s, | | | |
| 2038 (Cayman Islands) | 1,617,000 | | 1,628,497 |
| CS First Boston Mortgage Securities Corp. 144A | | | |
| Ser. 04-FR1N, Class A, 5s, 2034 | 786,468 | | 778,603 |
| Fieldstone Mortgage Investment Corp. FRB | | | |
| Ser. 05-1, Class M3, 5.07s, 2035 | 700,000 | | 700,000 |
| Finance America NIM Trust 144A Ser. 04-1, | | | |
| Class A, 5 1/4s, 2034 | 192,388 | | 148,796 |
| First Chicago Lennar Trust 144A Ser. 97-CHL1, | | | |
| Class D, 7.674s, 2039 | 4,880,001 | | 4,898,839 |
| First Consumers Master Trust FRB Ser. 01-A, | | | |
| Class A, 4.78s, 2008 | 166,430 | | 165,598 |
| First Franklin Mortgage Loan NIM Trust 144A | | | |
| Ser. 04-FF10, Class N1, 4.45s, 2034 | | | |
| (Cayman Islands) | 150,397 | | 149,972 |
| Ser. 04-FF7A, Class A, 5s, 2034 (Cayman Islands) | 177,192 | | 176,631 |
| First Horizon Mortgage Pass-Through Trust | | | |
| Ser. 05-AR2, Class 1A1, 4.83s, 2035 | 2,984,820 | | 2,958,900 |
| First Plus Home Loan Trust Ser. 97-3, Class B1, | | | |
| 7.79s, 2023 | 683,981 | | 684,408 |
| Ford Credit Auto Owner Trust Ser. 04-A, Class C, | | | |
| 4.19s, 2009 | 650,000 | | 639,844 |
| Fort Point CDO, Ltd. FRB Ser. 03-2A, Class A2, | | | |
| 5.47s, 2038 (Cayman Islands) | 616,000 | | 622,591 |
| Foxe Basin, Ltd. 144A FRB Ser. 03-1A, Class A1, | | | |
| 4.991s, 2015 (Cayman Islands) | 2,000,000 | | 2,004,800 |
| Fremont NIM Trust 144A | | | |
| Ser. 04-3, Class A, 4 1/2s, 2034 | 412,838 | | 409,385 |
| Ser. 04-3, Class B, 7 1/2s, 2034 | 229,083 | | 223,330 |
| Ser. 04-D, Class N1, 4 1/2s, 2034 | | | |
| (Cayman Islands) | 308,957 | | 306,998 |
| Ser. 04-D, Class N2, 7 1/2s, 2034 | | | |
| (Cayman Islands) | 66,793 | | 66,340 |
| G-Force CDO, Ltd. 144A Ser. 03-1A, Class E, | | | |
| 6.58s, 2038 (Cayman Islands) | 939,000 | | 943,695 |
| G-Star, Ltd. 144A FRB Ser. 02-2A, Class BFL, | | | |
| 6.53s, 2037 (Cayman Islands) | 308,000 | | 320,801 |
50
| ASSET-BACKED SECURITIES (8.2%)* continued | | | |
|
| | Principal amount | | Value |
| |
| GE Capital Credit Card Master Note Trust FRB | | | |
| Ser. 04-2, Class C, 4.95s, 2010 | $ 1,903,750 | $ | 1,906,439 |
| GE Corporate Aircraft Financing, LLC 144A | | | |
| Ser. 04-1A, Class B, 5.38s, 2018 | 263,304 | | 263,146 |
| FRB Ser. 05-1A, Class C, 5.83s, 2019 | 1,680,000 | | 1,680,000 |
| Gears Auto Owner Trust Ser. 05-AA, Class E1, | | | |
| 8.22s, 2012 | 1,962,000 | | 1,956,224 |
| GEBL 144A | | | |
| Ser. 04-2, Class C, 5.32s, 2032 | 282,919 | | 282,918 |
| Ser. 04-2, Class D, 7.22s, 2032 | 755,064 | | 740,270 |
| GMAC Mortgage Corp. Loan Trust Ser. 04-HE5, | | | |
| Class A, IO, 6s, 2007 | 7,540,350 | | 424,145 |
| Goldentree Loan Opportunities II, Ltd. 144A FRN | | | |
| Ser. 2A, Class 4, 7.93s, 2015 (Cayman Islands) | 470,000 | | 473,760 |
| Granite Mortgages PLC | | | |
| FRB Ser. 02-1, Class 1C, 5.901s, 2042 | | | |
| (United Kingdom) | 1,300,000 | | 1,309,807 |
| FRB Ser. 02-2, Class 1C, 5.851s, 2043 | | | |
| (United Kingdom) | 650,000 | | 657,158 |
| FRB Ser. 01-1, Class 1C, 6.001s, 2041 | | | |
| (United Kingdom) | 2,376,001 | | 2,403,845 |
| FRB Ser. 04-1, Class 1C, 5.4s, 2044 | | | |
| (United Kingdom) | 1,619,000 | | 1,622,036 |
| Green Tree Financial Corp. | | | |
| Ser. 95-8, Class B1, 7.3s, 2026 | 362,579 | | 286,365 |
| Ser. 97-4, Class A7, 7.36s, 2029 | 754,726 | | 784,274 |
| Ser. 97-7, Class A8, 6.86s, 2029 | 570,491 | | 584,097 |
| Ser. 99-3, Class A5, 6.16s, 2031 | 177,518 | | 178,627 |
| Ser. 99-3, Class A6, 6 1/2s, 2031 | 1,137,000 | | 1,139,963 |
| Ser. 99-5, Class A5, 7.86s, 2030 | 16,750,000 | | 14,756,970 |
| Greenpoint Manufactured Housing Ser. 00-3, | | | |
| Class IA, 8.45s, 2031 | 3,999,335 | | 3,768,857 |
| Greenpoint Mortgage Funding Trust Ser. 05-AR1, | | | |
| Class X1, IO, 1.769s, 2045 | 17,070,994 | | 482,790 |
| GS Auto Loan Trust 144A Ser. 04-1, Class D, 5s, 2011 | 1,632,979 | | 1,619,572 |
| GSAMP Trust 144A | | | |
| Ser. 04-NIM1, Class N1, 5 1/2s, 2034 | 655,521 | | 655,390 |
| Ser. 04-NIM1, Class N2, zero %, 2034 | 1,553,000 | | 1,143,785 |
| Ser. 04-NIM2, Class N, 4 7/8s, 2034 | 1,120,382 | | 1,115,564 |
| Ser. 04-SE2N, Class Note, 5 1/2s, 2034 | 745 | | 744 |
| Ser. 05-NC1, Class N, 5s, 2035 | 475,735 | | 474,688 |
| GSMPS Mortgage Loan Trust | | | |
| Ser. 05-RP3, Class 1A2, 7 1/2s, 2035 | 1,180,462 | | 1,238,701 |
| Ser. 05-RP3, Class 1A3, 8s, 2035 | 1,252,277 | | 1,328,098 |
| Ser. 05-RP3, Class 1A4, 8 1/2s, 2035 | 441,998 | | 473,335 |
| GSMPS Mortgage Loan Trust 144A | | | |
| Ser. 05-RP1, Class 1A3, 8s, 2035 | 192,951 | | 204,596 |
| Ser. 05-RP2, Class 1A2, 7 1/2s, 2035 | 1,843,382 | | 1,931,211 |
| Ser. 05-RP2, Class 1A3, 8s, 2035 | 1,550,883 | | 1,645,180 |
51
| ASSET-BACKED SECURITIES (8.2%)* continued | | | |
|
| | Principal amount | | Value |
| |
| Guggenheim Structured Real Estate Funding, Ltd. 144A | | | |
| FRB Ser. 05-1A, Class D, 6.06s, 2030 | | | |
| (Cayman Islands) | $ 2,225,000 | $ | 2,218,548 |
| FRB Ser. 05-2A, Class D, 6.08s, 2030 | | | |
| (Cayman Islands) | 1,141,000 | | 1,141,342 |
| HASCO NIM Trust 144A Ser. 05-OP1A, Class A, | | | |
| 6 1/4s, 2035 | 1,216,536 | | 1,175,123 |
| High Income Trust Securities 144A FRB | | | |
| Ser. 03-1A, Class A, 4.81s, 2036 | | | |
| (Cayman Islands) | 2,410,716 | | 2,362,502 |
| Holmes Financing PLC | | | |
| FRB Ser. 4, Class 3C, 5.9s, 2040 | | | |
| (United Kingdom) | 870,000 | | 872,948 |
| FRB Ser. 8, Class 2C, 5.32s, 2040 | | | |
| (United Kingdom) | 746,000 | | 747,119 |
| Home Equity Asset Trust 144A | | | |
| Ser. 04-3N, Class A, 5s, 2034 | 55,528 | | 55,113 |
| Ser. 04-4N, Class A, 5s, 2034 | 122,348 | | 120,818 |
| Hyundai Auto Receivables Trust Ser. 04-A, | | | |
| Class D, 4.1s, 2011 | 429,000 | | 418,388 |
| Lehman Manufactured Housing Ser. 98-1, Class 1, | | | |
| IO, 0.809s, 2028 | 24,066,637 | | 475,161 |
| LNR CDO, Ltd. 144A | | | |
| FRB Ser. 02-1A, Class FFL, 7.269s, 2037 | | | |
| (Cayman Islands) | 5,220,000 | | 5,260,194 |
| FRB Ser. 03-1A, Class EFL, 7.51s, 2036 | | | |
| (Cayman Islands) | 2,585,000 | | 2,777,272 |
| Long Beach Asset Holdings Corp. NIM Trust 144A | | | |
| Ser. 04-5, Class Note, 5s, 2034 | 235,966 | | 235,386 |
| Ser. 05-1, Class N1, 4.115s, 2035 | 1,026,133 | | 1,024,286 |
| Long Beach Mortgage Loan Trust | | | |
| Ser. 04-3, Class S1, IO, 4 1/2s, 2006 | 15,806,811 | | 508,979 |
| Ser. 04-3, Class S2, IO, 4 1/2s, 2006 | 7,903,408 | | 254,095 |
| Madison Avenue Manufactured Housing Contract | | | |
| Ser. 02-A IO, 0.3s, 2032 | 176,752,785 | | 1,877,998 |
| FRB Ser. 02-A, Class B1, 7.78s, 2032 | 4,059,503 | | 2,029,752 |
| Marriott Vacation Club Owner Trust 144A | | | |
| Ser. 04-2A, Class C, 4.741s, 2026 | 137,556 | | 133,040 |
| Ser. 04-2A, Class D, 5.389s, 2026 | 149,518 | | 145,070 |
| Ser. 05-2, Class D, 6.205s, 2027 | 178,971 | | 178,580 |
| FRB Ser. 02-1A, Class A1, 5.19s, 2024 | 1,597,624 | | 1,605,612 |
| Master Reperforming Loan Trust 144A Ser. 05-2, | | | |
| Class 1A3, 7 1/2s, 2035 | 1,065,409 | | 1,115,017 |
| MASTR Adjustable Rate Mortgages Trust | | | |
| Ser. 04-03, Class 4AX, IO, 1.417s, 2034 | 3,386,884 | | 76,205 |
| Ser. 04-7, Class 2A1, 4.694s, 2034 | 955,743 | | 951,382 |
| Ser. 05-2, Class 7AX, IO, 0.168s, 2035 | 9,475,645 | | 28,131 |
52
| ASSET-BACKED SECURITIES (8.2%)* continued | | | | |
|
| | Principal amount | | Value |
| |
| MASTR Asset Backed Securities NIM Trust 144A | | | | |
| Ser. 04-CI5, Class N1, 4.946s, 2034 | | | | |
| (Cayman Islands) | $ | 30,325 | $ | 30,288 |
| Ser. 04-CI5, Class N2, 9s, 2034 (Cayman Islands) | | 317,309 | | 317,436 |
| Ser. 04-HE1A, Class Note, 5.191s, 2034 | | | | |
| (Cayman Islands) | | 118,182 | | 118,064 |
| MASTR Reperforming Loan Trust 144A Ser. 05-1, | | | | |
| Class 1A4, 7 1/2s, 2034 | | 2,512,015 | | 2,625,841 |
| MBNA Credit Card Master Note Trust FRB | | | | |
| Ser. 03-C5, Class C5, 5.65s, 2010 | | 1,730,000 | | 1,766,388 |
| Merit Securities Corp. 144A FRB Ser. 11PA, | | | | |
| Class 3A1, 5.18s, 2027 | | 6,152,992 | | 5,906,872 |
| Merrill Lynch Mortgage Investors, Inc. | | | | |
| Ser. 03-WM3N, Class N1, 8s, 2034 | | 9,495 | | 9,463 |
| Merrill Lynch Mortgage Investors, Inc. 144A | | | | |
| Ser. 04-FM1N, Class N1, 5s, 2035 | | | | |
| (Cayman Islands) | | 44,804 | | 44,818 |
| Ser. 04-HE1N, Class N1, 5s, 2006 | | 77,765 | | 77,498 |
| Ser. 04-HE2N, Class N1, 5s, 2035 | | | | |
| (Cayman Islands) | | 288,939 | | 287,765 |
| Ser. 04-OP1N, Class N1, 4 3/4s, 2035 | | | | |
| (Cayman Islands) | | 96,955 | | 96,622 |
| Ser. 04-WM1N, Class N1, 4 1/2s, 2034 | | 3,095 | | 3,098 |
| Ser. 04-WM2N, Class N1, 4 1/2s, 2034 | | 38,006 | | 37,863 |
| Ser. 04-WM3N, Class N1, 4 1/2s, 2035 | | 88,600 | | 88,295 |
| Ser. 05-WM1N, Class N1, 5s, 2035 | | 682,606 | | 682,820 |
| Metris Master Trust FRN Ser. 04-2, Class C, | | | | |
| 5.84s, 2010 | | 1,050,000 | | 1,056,287 |
| Metris Master Trust 144A | | | | |
| FRB Ser. 01-2, Class C, 6.39s, 2009 | | 1,670,000 | | 1,672,181 |
| FRB Ser. 04-2, Class D, 7.74s, 2010 | | 668,000 | | 674,680 |
| Mid-State Trust | | | | |
| Ser. 10, Class B, 7.54s, 2036 | | 821,519 | | 716,950 |
| Ser. 11, Class B, 8.221s, 2038 | | 429,528 | | 426,096 |
| MMCA Automobile Trust Ser. 02-1, Class B, 5.37s, 2010 | | 2,884,648 | | 2,873,686 |
| Morgan Stanley ABS Capital I FRB Ser. 04-WMC3, | | | | |
| Class A2PT, 4.82s, 2035 | | 1,528,202 | | 1,528,542 |
| Morgan Stanley Auto Loan Trust Ser. 04-HB2, | | | | |
| Class D, 3.82s, 2012 | | 51,887 | | 51,787 |
| Morgan Stanley Auto Loan Trust 144A | | | | |
| Ser. 04-HB1, Class D, 5 1/2s, 2011 | | 900,934 | | 895,676 |
| Ser. 04-HB2, Class E, 5s, 2012 | | 513,000 | | 501,557 |
| Morgan Stanley Dean Witter Capital I | | | | |
| FRB Ser. 01-NC3, Class B1, 6.98s, 2031 | | 248,180 | | 248,180 |
| FRB Ser. 01-NC4, Class B1, 7.03s, 2032 | | 274,184 | | 274,328 |
| Morgan Stanley Mortgage Loan Trust | | | | |
| Ser. 05-3AR, Class 2A2, 5.27s, 2035 | | 4,044,197 | | 4,034,875 |
| Ser. 05-5AR, Class 2A1, 5.433s, 2035 | | 7,367,988 | | 7,359,640 |
| Navigator CDO, Ltd. 144A FRB Ser. 03-1A, | | | | |
| Class A1, 4.83s, 2015 (Cayman Islands) | | 1,168,000 | | 1,170,453 |
53
| ASSET-BACKED SECURITIES (8.2%)* continued | | | |
|
| | Principal amount | | Value |
| |
| Navistar Financial Corp. Owner Trust | | | |
| Ser. 04-B, Class C, 3.93s, 2012 | $ 340,702 | $ | 331,737 |
| Ser. 05-A, Class C, 4.84s, 2014 | 873,000 | | 861,586 |
| New Century Home Equity Loan Trust Ser. 03-5, | | | |
| Class AI7, 5.15s, 2033 | 1,734,000 | | 1,677,519 |
| Newcastle CDO, Ltd. 144A FRB Ser. 3A, Class 4FL, | | | |
| 7.719s, 2038 (Cayman Islands) | 624,000 | | 634,140 |
| Nomura Asset Acceptance Corp. Ser. 04-R3, | | | |
| Class PT, 9.068s, 2035 | 636,252 | | 678,404 |
| Nomura Asset Acceptance Corp. 144A Ser. 04-R2, | | | |
| Class PT, 8.989s, 2034 | 631,997 | | 675,150 |
| Novastar NIM Trust 144A Ser. 04-N2, Class Note, | | | |
| 4.458s, 2034 | 33,920 | | 33,665 |
| Oakwood Mortgage Investors, Inc. Ser. 02-C, | | | |
| Class A1, 5.41s, 2032 | 5,049,026 | | 4,360,339 |
| Oakwood Mortgage Investors, Inc. 144A Ser. 01-B, | | | |
| Class A4, 7.21s, 2030 | 751,196 | | 680,297 |
| Ocean Star PLC 144A | | | |
| FRB Ser. 04, Class D, 6.632s, 2018 (Ireland) | 623,000 | | 640,911 |
| FRB Ser. 05-A, Class D, 5.796s, 2012 (Ireland) | 696,000 | | 695,930 |
| Option One Mortgage Securities Corp. NIM Trust | | | |
| 144A Ser. 04-2A, Class N1, 4.213s, 2034 | | | |
| (Cayman Islands) | 194,760 | | 194,759 |
| Origen Manufactured Housing Ser. 04-B, Class A2, | | | |
| 3.79s, 2017 | 431,000 | | 419,821 |
| Park Place Securities NIM Trust 144A | | | |
| Ser. 04-MCWN1, Class A, 4.458s, 2034 | 59,695 | | 59,769 |
| Ser. 04-WHQ2, Class A, 4s, 2035 | 333,297 | | 329,965 |
| Park Place Securities, Inc. FRB Ser. 04-WHQ2, | | | |
| Class A3A, 4.88s, 2035 | 1,354,498 | | 1,355,714 |
| People’s Choice Net Interest Margin Note 144A | | | |
| Ser. 04-2, Class A, 5s, 2034 | 518,521 | | 513,670 |
| Ser. 04-2, Class B, 5s, 2034 | 313,000 | | 301,464 |
| Permanent Financing PLC | | | |
| FRB Ser. 1, Class 3C, 5.68s, 2042 | | | |
| (United Kingdom) | 870,000 | | 870,427 |
| FRB Ser. 3, Class 3C, 5.63s, 2042 | | | |
| (United Kingdom) | 1,300,000 | | 1,319,209 |
| Pillar Funding PLC 144A | | | |
| FRB Ser. 04-1A, Class C1, 5.491s, 2011 | | | |
| (United Kingdom) | 657,000 | | 664,098 |
| FRB Ser. 04-2A, Class C, 5.371s, 2011 | | | |
| (United Kingdom) | 912,000 | | 917,199 |
| Providian Gateway Master Trust 144A | | | |
| Ser. 04-DA, Class D, 4.4s, 2011 | 944,000 | | 918,925 |
| Ser. 04-FA, Class E, 5s, 2011 | 500,000 | | 500,000 |
| FRB Ser. 04-AA, Class D, 6.32s, 2011 | 1,204,000 | | 1,221,073 |
| FRB Ser. 04-BA, Class D, 5.87s, 2010 | 1,900,000 | | 1,908,962 |
| FRB Ser. 04-EA, Class D, 5.4s, 2011 | 701,000 | | 706,888 |
54
| ASSET-BACKED SECURITIES (8.2%)* continued | | | |
|
| | Principal amount | | Value |
| |
| Renaissance Home Equity Loan Trust Ser. 03-4, | | | |
| Class S, IO, 3s, 2006 | $ 753,211 | $ | 75 |
| Renaissance NIM Trust 144A | | | |
| Ser. 04-A, Class Note, 4.45s, 2034 | 11,039 | | 11,026 |
| Ser. 05-1, Class N, 4.7s, 2035 | 387,949 | | 387,949 |
| Residential Accredit Loans, Inc. | | | |
| Ser. 04-QA5, Class A2, 4.984s, 2034 | 691,232 | | 688,890 |
| Ser. 04-QA6, Class NB1, 4.974s, 2034 | 3,802,192 | | 3,786,661 |
| Residential Asset Mortgage Products, Inc. | | | |
| Ser. 04-RZ2, Class A, IO, 3 1/2s, 2006 | 2,933,333 | | 30,064 |
| Residential Asset Securities Corp. 144A | | | |
| Ser. 04-N10B, Class A1, 5s, 2034 | 560,750 | | 558,647 |
| Ser. 04-NT, Class Note, 5s, 2034 | 445,038 | | 427,237 |
| Ser. 04-NT12, Class Note, 4.7s, 2035 | 214,529 | | 213,612 |
| Residential Funding Mortgage Securities II | | | |
| Ser. 03-HS3, Class AI, IO, 5s, 2006 | 2,035,814 | | 29,662 |
| Saco I Trust FRB Ser. 05-10, Class 1A1, 4.79s, 2033 | 2,397,658 | | 2,397,658 |
| SAIL Net Interest Margin Notes 144A | | | |
| Ser. 03-3, Class A, 7 3/4s, 2033 | | | |
| (Cayman Islands) | 24,040 | | 20,939 |
| Ser. 03-4, Class A, 7 1/2s, 2033 | | | |
| (Cayman Islands) | 1,739 | | 1,608 |
| Ser. 03-5, Class A, 7.35s, 2033 (Cayman Islands) | 11,937 | | 10,010 |
| Ser. 03-6A, Class A, 7s, 2033 (Cayman Islands) | 13,602 | | 10,057 |
| Ser. 03-7A, Class A, 7s, 2033 (Cayman Islands) | 22,668 | | 19,080 |
| Ser. 03-8A, Class A, 7s, 2033 (Cayman Islands) | 52,532 | | 16,530 |
| Ser. 03-9A, Class A, 7s, 2033 (Cayman Islands) | 90,849 | | 24,944 |
| Ser. 03-BC2A, Class A, 7 3/4s, 2033 | | | |
| (Cayman Islands) | 133,867 | | 56,692 |
| Ser. 04-10A, Class A, 5s, 2034 (Cayman Islands) | 821,311 | | 815,809 |
| Ser. 04-11A, Class A2, 4 3/4s, 2035 | | | |
| (Cayman Islands) | 1,162,431 | | 1,152,036 |
| Ser. 04-4A, Class A, 5s, 2034 (Cayman Islands) | 258,191 | | 257,740 |
| Ser. 04-4A, Class B, 7 1/2s, 2034 | | | |
| (Cayman Islands) | 350,000 | | 300,488 |
| Ser. 04-5A, Class A, 4 1/2s, 2034 | | | |
| (Cayman Islands) | 28,863 | | 28,807 |
| Ser. 04-7A, Class A, 4 3/4s, 2034 | | | |
| (Cayman Islands) | 134,750 | | 134,360 |
| Ser. 04-8A, Class A, 5s, 2034 (Cayman Islands) | 198,148 | | 197,564 |
| Ser. 04-AA, Class A, 4 1/2s, 2034 | | | |
| (Cayman Islands) | 640,696 | | 636,051 |
| Ser. 04-BN2A, Class A, 5s, 2034 (Cayman Islands) | 154,375 | | 153,410 |
| Ser. 04-BNCA, Class A, 5s, 2034 (Cayman Islands) | 38,922 | | 38,820 |
| Ser. 05-1A, Class A, 4 1/4s, 2035 | 1,139,068 | | 1,127,012 |
| Ser. 05-2A, Class A, 4 3/4s, 2035 | | | |
| (Cayman Islands) | 1,334,646 | | 1,322,969 |
| Sasco Net Interest Margin Trust 144A | | | |
| Ser. 05-NC1A, Class A, 4 3/4s, 2035 | 1,374,254 | | 1,364,335 |
| Ser. 05-WF1A, Class A, 4 3/4s, 2035 | 1,136,751 | | 1,126,250 |
55
| ASSET-BACKED SECURITIES (8.2%)* continued | | | | |
|
| | Principal amount | | Value |
| |
| Sharps SP I, LLC Net Interest Margin Trust 144A | | | | |
| Ser. 03-HE1N, Class N, 6.9s, 2033 | $ | 16,550 | $ | 16,550 |
| Ser. 04-4N, Class Note, 6.65s, 2034 | | 63,918 | | 63,918 |
| Ser. 04-HE1N, Class Note, 4.94s, 2034 | | 145,147 | | 145,147 |
| Ser. 04-HE2N, Class NA, 5.43s, 2034 | | 80,864 | | 79,651 |
| Ser. 04-HE4N, Class NA, 3 3/4s, 2034 | | 946,697 | | 937,230 |
| Ser. 04-HS1N, Class Note, 5.92s, 2034 | | 54,755 | | 54,755 |
| Ser. 04-RM2N, Class NA, 4s, 2035 | | 494,991 | | 490,041 |
| South Coast Funding 144A FRB Ser. 3A, Class A2, | | | | |
| 5.51s, 2038 (Cayman Islands) | | 470,000 | | 472,350 |
| Structured Adjustable Rate Mortgage Loan Trust | | | | |
| Ser. 04-10, Class 1A1, 4.916s, 2034 | | 1,492,962 | | 1,491,167 |
| Ser. 04-12, Class 1A2, 4.972s, 2034 | | 2,094,371 | | 2,092,726 |
| Ser. 04-14, Class 1A, 5.086s, 2034 | | 4,375,246 | | 4,363,611 |
| Ser. 04-16, Class 1A2, 4.999s, 2034 | | 7,701,811 | | 7,685,460 |
| Ser. 04-18, Class 1A1, 5.017s, 2034 | | 1,857,774 | | 1,853,284 |
| Ser. 04-20, Class 1A2, 5.066s, 2035 | | 5,109,292 | | 5,096,330 |
| Ser. 04-6, Class 1A, 4.371s, 2034 | | 6,500,698 | | 6,465,660 |
| Ser. 04-8, Class 1A3, 4.691s, 2034 | | 62,530 | | 62,338 |
| Ser. 05-1, Class 1A1, 5.14s, 2035 | | 8,100,167 | | 8,082,721 |
| Ser. 05-9, Class AX, IO, 0.937s, 2035 | | 49,640,332 | | 1,479,282 |
| Structured Adjustable Rate Mortgage Loan Trust | | | | |
| 144A Ser. 04-NP2, Class A, 4.88s, 2034 | | 1,554,566 | | 1,554,721 |
| Structured Asset Investment Loan Trust | | | | |
| Ser. 03-BC1A, Class A, 7 3/4s, 2033 | | | | |
| (Cayman Islands) | | 2,975 | | 2,975 |
| Structured Asset Receivables Trust 144A FRB | | | | |
| Ser. 05-1, 5.114s, 2015 | | 5,318,553 | | 5,242,099 |
| Structured Asset Securities Corp. | | | | |
| Ser. 03-26A, Class 2A, 4.504s, 2033 | | 1,619,187 | | 1,622,502 |
| Ser. 03-40A, Class 1A, 4.893s, 2034 | | 1,048,961 | | 1,053,123 |
| Ser. 04-8, Class 1A1, 4.691s, 2034 | | 1,205,120 | | 1,201,429 |
| IFB Ser. 05-10, Class 3A3, 7.343s, 2034 | | 3,214,971 | | 2,984,608 |
| IFB Ser. 05-6, Class 5A8, 4.84s, 2035 | | 4,467,680 | | 3,766,721 |
| Structured Asset Securities Corp. 144A | | | | |
| Ser. 98-RF3, Class A, IO, 6.1s, 2028 | | 4,502,155 | | 551,514 |
| FRB Ser. 03-NP2, Class A2, 5.08s, 2032 | | 368,090 | | 368,090 |
| FRB Ser. 03-NP3, Class A1, 5.03s, 2033 | | 61,709 | | 61,715 |
| Terwin Mortgage Trust FRB Ser. 04-5HE, | | | | |
| Class A1B, 4.95s, 2035 | | 1,902,491 | | 1,905,575 |
| TIAA Real Estate CDO, Ltd. Ser. 03-1A, Class E, | | | | |
| 8s, 2038 (Cayman Islands) | | 1,698,000 | | 1,646,221 |
| Wells Fargo Home Equity Trust 144A | | | | |
| Ser. 04-1N, Class A, 5s, 2034 | | 164,338 | | 164,066 |
| Ser. 04-2, Class N1, 4.45s, 2034 | | | | |
| (Cayman Islands) | | 394,617 | | 389,888 |
| Ser. 04-2, Class N2, 8s, 2034 (Cayman Islands) | | 862,000 | | 844,775 |
56
| ASSET-BACKED SECURITIES (8.2%)* continued | | | |
|
| | Principal amount | | Value |
| |
| Wells Fargo Mortgage Backed Securities Trust | | | |
| Ser. 05-AR10, Class 2A18, IO, 0.61s, 2035 | $ 44,983,000 | $ | 667,719 |
| Ser. 05-AR12, Class 2A5, 4.321s, 2035 | 21,411,000 | | 20,758,112 |
| Ser. 05-AR9, Class 1A2, 4.352s, 2035 | 2,606,470 | | 2,545,377 |
| WFS Financial Owner Trust | | | |
| Ser. 04-1, Class D, 3.17s, 2011 | 271,377 | | 267,360 |
| Ser. 04-3, Class D, 4.07s, 2012 | 637,953 | | 628,792 |
| Ser. 04-4, Class D, 3.58s, 2012 | 277,451 | | 272,900 |
| Ser. 05-1, Class D, 4 1/4s, 2012 | 677,739 | | 666,719 |
| Whinstone Capital Management, Ltd. 144A FRB | | | |
| Ser. 1A, Class B3, 5.523s, 2044 (United Kingdom) | 1,687,000 | | 1,686,736 |
| Whole Auto Loan Trust Ser. 03-1, Class C, 3.13s, 2010 | 195,689 | | 194,330 |
| Whole Auto Loan Trust 144A | | | |
| Ser. 03-1, Class D, 6s, 2010 | 364,835 | | 364,539 |
| Ser. 04-1, Class D, 5.6s, 2011 | 937,732 | | 930,606 |
|
| Total asset-backed securities (cost $410,521,686) | | $ | 398,159,638 |
|
| |
| |
| CORPORATE BONDS AND NOTES (4.5%)* | | | |
|
| | Principal amount | | Value |
| |
| Basic Materials (0.2%) | | | |
| Dow Chemical Co. (The) Pass Through Trust 144A | | | |
| company guaranty 4.027s, 2009 | $ 1,510,000 | $ | 1,445,111 |
| Georgia-Pacific Corp. notes 8 1/8s, 2011 | 635,000 | | 646,113 |
| ICI Wilmington, Inc. company guaranty 5 5/8s, 2013 | 1,235,000 | | 1,219,156 |
| Lubrizol Corp. (The) sr. notes 5 1/2s, 2014 | 470,000 | | 467,725 |
| Newmont Mining Corp. notes 5 7/8s, 2035 | 675,000 | | 657,353 |
| Potash Corp. of Saskatchewan notes 7 3/4s, 2011 | | | |
| (Canada) | 510,000 | | 566,410 |
| Teck Cominco Ltd. notes 6 1/8s, 2035 (Canada) | 650,000 | | 634,234 |
| Teck Cominco Ltd. notes 5 3/8s, 2015 (Canada) | 120,000 | | 117,655 |
| Weyerhaeuser Co. debs. 7.95s, 2025 | 975,000 | | 1,102,902 |
| Weyerhaeuser Co. debs. 7 3/8s, 2032 | 880,000 | | 971,195 |
| Weyerhaeuser Co. notes 6 3/4s, 2012 | 380,000 | | 401,248 |
| | | | 8,229,102 |
|
| |
| Capital Goods (0.1%) | | | |
| Bunge Ltd. Finance Corp. notes 5.35s, 2014 | 925,000 | | 904,527 |
| L-3 Communications Corp. sr. sub. notes Class B, | | | |
| 6 3/8s, 2015 | 595,000 | | 592,025 |
| Lockheed Martin Corp. bonds 8 1/2s, 2029 | 1,145,000 | | 1,535,882 |
| Raytheon Co. debs. 6 3/4s, 2018 | 185,000 | | 204,795 |
| Sealed Air Corp. 144A notes 5 5/8s, 2013 | 800,000 | | 790,174 |
| | | | 4,027,403 |
|
| |
| Communication Services (0.5%) | | | |
| Ameritech Capital Funding company guaranty 6 1/4s, 2009 | 200,000 | | 204,739 |
| AT&T Corp. sr. notes 9 3/4s, 2031 | 670,000 | | 828,400 |
| AT&T Wireless Services, Inc. sr. notes 8 3/4s, 2031 | 2,010,000 | | 2,633,938 |
57
| CORPORATE BONDS AND NOTES (4.5%)* continued | | | |
|
| | Principal amount | | Value |
| |
| Communication Services continued | | | |
| Citizens Communications Co. sr. notes 6 1/4s, 2013 | $ 685,000 | $ | 664,450 |
| Deutsche Telekom International Finance BV | | | |
| company guaranty 8 1/4s, 2030 (Germany) | 560,000 | | 698,636 |
| Deutsche Telekom International Finance BV | | | |
| notes 5 1/4s, 2013 (Germany) | 1,540,000 | | 1,517,662 |
| France Telecom notes 8 1/2s, 2031 (France) | 180,000 | | 235,224 |
| France Telecom notes 7 3/4s, 2011 (France) | 1,430,000 | | 1,586,516 |
| SBC Communications, Inc. notes 5 7/8s, 2012 | 440,000 | | 449,690 |
| Southwestern Bell Telephone debs. 7s, 2027 | 1,075,000 | | 1,095,156 |
| Sprint Capital Corp. company guaranty 7 5/8s, 2011 | 1,045,000 | | 1,149,667 |
| Sprint Capital Corp. company guaranty 6.9s, 2019 | 1,315,000 | | 1,442,289 |
| Sprint Capital Corp. company guaranty 6 7/8s, 2028 | 3,040,000 | | 3,293,703 |
| Telecom Italia Capital SA company | | | |
| guaranty 6 3/8s, 2033 (Luxembourg) | 290,000 | | 286,579 |
| Telecom Italia Capital SA company | | | |
| guaranty 5 1/4s, 2013 (Luxembourg) | 1,335,000 | | 1,296,802 |
| Telecom Italia Capital SA company guaranty 4s, | | | |
| 2010 (Luxembourg) | 1,270,000 | | 1,208,697 |
| Telecom Italia Capital SA notes 5 1/4s, 2015 | | | |
| (Luxembourg) | 965,000 | | 940,875 |
| Telefonica Europe BV company guaranty 8 1/4s, | | | |
| 2030 (Netherlands) | 595,000 | | 723,975 |
| Verizon Global Funding Corp. notes 7 3/4s, 2030 | 235,000 | | 272,992 |
| Verizon New England, Inc. sr. notes 6 1/2s, 2011 | 2,285,000 | | 2,348,013 |
| Verizon New Jersey, Inc. debs. 8s, 2022 | 770,000 | | 869,506 |
| Verizon Virginia Inc. debs. Ser. A, 4 5/8s, 2013 | 1,585,000 | | 1,475,017 |
| | | | 25,222,526 |
|
| |
| Conglomerates (—%) | | | |
| Tyco International Group SA company | | | |
| guaranty 6 3/4s, 2011 (Luxembourg) | 1,185,000 | | 1,257,246 |
|
| |
| Consumer Cyclicals (0.5%) | | | |
| Cendant Corp. notes 6 1/4s, 2010 | 1,785,000 | | 1,843,528 |
| D.R. Horton, Inc. company guaranty 8s, 2009 | 545,000 | | 579,614 |
| D.R. Horton, Inc. sr. notes 5 7/8s, 2013 | 840,000 | | 815,730 |
| DaimlerChrysler NA Holding Corp. company | | | |
| guaranty 7.2s, 2009 | 3,720,000 | | 3,919,764 |
| DaimlerChrysler NA Holding Corp. company | | | |
| guaranty 6 1/2s, 2013 | 1,130,000 | | 1,172,262 |
| Ford Motor Credit Corp. FRN 7.68s, 2007 | 950,000 | | 930,977 |
| Ford Motor Credit Corp. notes 7 3/4s, 2007 | 190,000 | | 185,755 |
| Ford Motor Credit Corp. notes 7 3/8s, 2009 | 4,870,000 | | 4,556,348 |
| General Motors Acceptance Corp. FRN 5.55s, 2007 | 1,870,000 | | 1,802,418 |
| General Motors Acceptance Corp. FRN Ser. MTN, | | | |
| 5 1/2s, 2007 | 1,170,000 | | 1,142,142 |
| General Motors Acceptance Corp. FRN Ser. MTN, | | | |
| 5.243s, 2006 | 846,000 | | 842,685 |
| General Motors Acceptance Corp. FRN Ser. MTN, | | | |
| 5.22s, 2007 | 1,815,000 | | 1,759,399 |
58
| CORPORATE BONDS AND NOTES (4.5%)* continued | | | |
|
| | Principal amount | | Value |
| |
| Consumer Cyclicals continued | | | |
| GTECH Holdings Corp. notes 4 3/4s, 2010 | $ 640,000 | $ | 618,765 |
| Harrah’s Operating Co., Inc. company | | | |
| guaranty 5 3/4s, 2017 | 770,000 | | 744,554 |
| Hilton Hotels Corp. notes 8 1/4s, 2011 | 1,355,000 | | 1,481,881 |
| JC Penney Co., Inc. debs. 7 1/8s, 2023 | 805,000 | | 909,163 |
| Johnson Controls, Inc. sr. notes 5 1/2s, 2016 | 840,000 | | 830,487 |
| May Department Stores Co. (The) notes 5 3/4s, 2014 | 360,000 | | 364,792 |
| Park Place Entertainment Corp. sr. notes 7s, 2013 | 1,020,000 | | 1,084,312 |
| | | | 25,584,576 |
|
| |
| Consumer Staples (0.5%) | | | |
| Chancellor Media Corp. company guaranty 8s, 2008 | 1,355,000 | | 1,438,007 |
| Comcast Corp. company guaranty 4.95s, 2016 | 165,000 | | 153,336 |
| Cox Communications, Inc. notes 7 3/4s, 2010 | 730,000 | | 786,644 |
| Cox Communications, Inc. notes 6 3/4s, 2011 | 745,000 | | 774,395 |
| Cox Enterprises, Inc. 144A notes 7 7/8s, 2010 | 1,045,000 | | 1,127,249 |
| CVS Corp. 144A pass-through certificates 6.117s, 2013 | 1,652,641 | | 1,707,476 |
| Delhaize America, Inc. company guaranty 8 1/8s, 2011 | 1,585,000 | | 1,722,370 |
| Diageo PLC company guaranty 8s, 2022 | 760,000 | | 946,677 |
| Fortune Brands, Inc. notes 5 3/8s, 2016 | 1,170,000 | | 1,149,200 |
| Jones Intercable, Inc. sr. notes 7 5/8s, 2008 | 3,585,000 | | 3,758,034 |
| Kroger Co. company guaranty 6 3/4s, 2012 | 275,000 | | 288,177 |
| Miller Brewing Co. 144A notes 5 1/2s, 2013 | 760,000 | | 767,016 |
| News America Holdings, Inc. debs. 7 3/4s, 2045 | 1,065,000 | | 1,199,223 |
| News America, Inc. 144A notes 6.4s, 2035 | 1,645,000 | | 1,638,094 |
| TCI Communications, Inc. debs. 8 3/4s, 2015 | 1,115,000 | | 1,335,398 |
| TCI Communications, Inc. debs. 7 7/8s, 2013 | 1,240,000 | | 1,386,618 |
| Time Warner Entertainment Co., LP debs. 8 3/8s, 2023 | 795,000 | | 920,769 |
| Time Warner, Inc. debs. 9.15s, 2023 | 340,000 | | 417,189 |
| Time Warner, Inc. debs. 9 1/8s, 2013 | 3,950,000 | | 4,655,446 |
| | | | 26,171,318 |
|
| |
| Energy (0.1%) | | | |
| Amerada Hess Corp. bonds 7 7/8s, 2029 | 1,160,000 | | 1,409,265 |
| Buckeye Partners LP notes 5.3s, 2014 | 570,000 | | 560,993 |
| Enbridge Energy Partners LP sr. notes 5.35s, 2014 | 555,000 | | 542,377 |
| Forest Oil Corp. sr. notes 8s, 2011 | 610,000 | | 667,950 |
| Motiva Enterprises, LLC 144A sr. notes 5.2s, 2012 | 1,070,000 | | 1,071,174 |
| Premcor Refining Group, Inc. sr. notes 7 1/2s, 2015 | 325,000 | | 346,150 |
| Sunoco, Inc. notes 4 7/8s, 2014 | 590,000 | | 570,662 |
| Valero Energy Corp. sr. unsecd. notes 7 1/2s, 2032 | 745,000 | | 896,079 |
| | | | 6,064,650 |
|
| |
| Financial (1.7%) | | | |
| Allfirst Financial Inc. sub. notes 7.2s, 2007 | 1,055,000 | | 1,084,755 |
| Archstone-Smith Operating Trust notes 5 1/4s, | | | |
| 2010 (R) (S) | 550,000 | | 548,067 |
| AXA Financial, Inc. sr. notes 7 3/4s, 2010 | 1,250,000 | | 1,376,825 |
| Bank of New York Co., Inc. (The) | | | |
| sr. sub. notes FRN 3.4s, 2013 | 405,000 | | 391,303 |
59
| CORPORATE BONDS AND NOTES (4.5%)* continued | | | |
|
| | Principal amount | | Value |
| |
| Financial continued | | | |
| Bank One Corp. sub. notes 5 1/4s, 2013 | $ 100,000 | $ | 99,538 |
| Barclays Bank PLC FRB 6.278s, 2049 | | | |
| (United Kingdom) | 1,110,000 | | 1,117,770 |
| Block Financial Corp. notes 5 1/8s, 2014 | 760,000 | | 707,501 |
| Bosphorus Financial Services, Ltd. 144A sec. FRN | | | |
| 6.14s, 2012 (Cayman Islands) | 2,378,000 | | 2,390,232 |
| Capital One Bank notes 6 1/2s, 2013 | 655,000 | | 692,204 |
| CIT Group, Inc. sr. notes 7 3/4s, 2012 (S) | 1,015,000 | | 1,141,985 |
| CIT Group, Inc. sr. notes 5s, 2015 | 780,000 | | 755,277 |
| CIT Group, Inc. sr. notes 5s, 2014 | 2,575,000 | | 2,500,886 |
| Citigroup, Inc. sub. notes 5s, 2014 | 2,377,000 | | 2,322,491 |
| Colonial Properties Trust notes 6 1/4s, 2014 (R) | 660,000 | | 676,031 |
| Countrywide Capital III company guaranty Ser. B, | | | |
| 8.05s, 2027 | 1,035,000 | | 1,230,246 |
| Deutsche Bank Capital Funding Trust VII 144A FRB | | | |
| 5.628s, 2049 | 1,145,000 | | 1,136,426 |
| Developers Diversified Realty Corp. unsecd. | | | |
| notes 5 3/8s, 2012 (R) | 385,000 | | 379,177 |
| Equity One, Inc. company guaranty 3 7/8s, 2009 (R) | 840,000 | | 798,092 |
| ERP Operating LP notes 6.584s, 2015 | 600,000 | | 645,532 |
| Executive Risk Capital Trust company | | | |
| guaranty Ser. B, 8.675s, 2027 | 1,545,000 | | 1,653,164 |
| Fleet Capital Trust V bank guaranty FRN 5.497s, 2028 | 935,000 | | 932,388 |
| Franchise Finance Corp. of America | | | |
| sr. notes 8 3/4s, 2010 (R) | 1,850,000 | | 2,137,512 |
| Fund American Cos. Inc. notes 5 7/8s, 2013 | 1,370,000 | | 1,371,935 |
| Greenpoint Capital Trust I company | | | |
| guaranty 9.1s, 2027 | 600,000 | | 651,674 |
| Heritage Property Investment Trust company | | | |
| guaranty 5 1/8s, 2014 (R) | 795,000 | | 760,390 |
| Hospitality Properties Trust notes 6 3/4s, 2013 (R) | 780,000 | | 825,870 |
| HRPT Properties Trust bonds 5 3/4s, 2014 (R) | 530,000 | | 529,679 |
| HRPT Properties Trust notes 6 1/4s, 2016 (R) | 525,000 | | 540,176 |
| HSBC Finance Capital Trust IX FRN 5.911s, 2035 | 3,300,000 | | 3,307,475 |
| ILFC E-Capital Trust I 144A FRB 5.9s, 2065 | 295,000 | | 295,547 |
| ILFC E-Capital Trust II 144A FRB 6 1/4s, 2065 | 1,710,000 | | 1,723,766 |
| International Lease Finance Corp. notes 4 3/4s, 2012 | 2,630,000 | | 2,548,147 |
| iStar Financial, Inc. sr. notes 8 3/4s, 2008 (R) | 200,000 | | 215,673 |
| iStar Financial, Inc. sr. notes 6s, 2010 (R) | 1,180,000 | | 1,202,151 |
| JPMorgan Chase Capital XV notes 5 7/8s, 2035 | 3,380,000 | | 3,314,621 |
| Lehman Brothers E-Capital Trust I 144A FRN | | | |
| 5.15s, 2065 | 2,420,000 | | 2,426,512 |
| Lehman Brothers Holdings, Inc. notes 6 5/8s, 2012 | 65,000 | | 69,645 |
| Liberty Mutual Insurance 144A notes 7.697s, 2097 | 2,095,000 | | 2,211,453 |
| Loews Corp. notes 5 1/4s, 2016 | 510,000 | | 497,474 |
| MetLife, Inc. notes 5.7s, 2035 | 725,000 | | 716,683 |
| MetLife, Inc. notes 5s, 2015 | 1,210,000 | | 1,182,521 |
| Nationwide Financial Services, Inc. | | | |
| notes 5 5/8s, 2015 | 465,000 | | 469,731 |
60
| CORPORATE BONDS AND NOTES (4.5%)* continued | | | |
|
| | Principal amount | | Value |
| |
| Financial continued | | | |
| Nationwide Mutual Insurance Co. 144A | | | |
| notes 8 1/4s, 2031 | $ 375,000 | $ | 462,597 |
| NB Capital Trust IV company guaranty 8 1/4s, 2027 | 5,540,000 | | 5,912,897 |
| Nuveen Investments, Inc. sr. notes 5 1/2s, 2015 | 505,000 | | 494,642 |
| Nuveen Investments, Inc. sr. notes 5s, 2010 | 505,000 | | 494,844 |
| OneAmerica Financial Partners, Inc. 144A | | | |
| bonds 7s, 2033 | 710,000 | | 785,650 |
| PNC Bank NA notes 4 7/8s, 2017 | 1,030,000 | | 981,106 |
| Prudential Holdings LLC 144A bonds 8.695s, 2023 | 1,260,000 | | 1,579,649 |
| Prudential Insurance Co. 144A notes 8.3s, 2025 | 870,000 | | 1,108,638 |
| Rouse Co. (The) notes 7.2s, 2012 (R) | 1,065,000 | | 1,108,021 |
| Royal Bank of Scotland Group PLC bonds Ser. 1, | | | |
| 9.118s, 2049 (United Kingdom) | 1,900,000 | | 2,163,984 |
| Royal Bank of Scotland Group PLC FRB 7.648s, | | | |
| 2049 (United Kingdom) | 400,000 | | 474,719 |
| Safeco Capital Trust I company guaranty 8.072s, 2037 | 1,365,000 | | 1,453,662 |
| Simon Property Group LP 144A | | | |
| unsub. notes 5 3/4s, 2015 (R) | 740,000 | | 746,263 |
| Sovereign Bancorp, Inc. 144A sr. notes 4.8s, 2010 | 730,000 | | 712,586 |
| Sun Life Canada Capital Trust 144A company | | | |
| guaranty 8.526s, 2049 | 2,115,000 | | 2,272,538 |
| Transamerica Capital III company | | | |
| guaranty 7 5/8s, 2037 | 1,095,000 | | 1,270,116 |
| UBS AG/Jersey Branch FRN 7 1/2s, 2008 (Jersey) | 3,020,000 | | 3,118,150 |
| UBS Preferred Funding Trust I company | | | |
| guaranty 8.622s, 2049 | 1,345,000 | | 1,527,601 |
| Washington Mutual, Inc. sub. notes 8 1/4s, 2010 | 1,580,000 | | 1,748,012 |
| Westpac Capital Trust III 144A sub. notes FRN | | | |
| 5.819s, 2049 (Australia) | 1,010,000 | | 1,022,282 |
| Zurich Capital Trust I 144A company | | | |
| guaranty 8.376s, 2037 | 1,110,000 | | 1,196,728 |
| | | | 80,213,210 |
|
| |
| Health Care (0.1%) | | | |
| Bayer Corp. 144A FRB 6.2s, 2008 | 845,000 | | 861,089 |
| Hospira, Inc. notes 5.9s, 2014 | 430,000 | | 440,220 |
| WellPoint, Inc. notes 5s, 2014 | 515,000 | | 500,603 |
| WellPoint, Inc. unsecd. notes 5 1/4s, 2016 | 590,000 | | 582,335 |
| Wyeth notes 5 1/2s, 2014 | 2,475,000 | | 2,492,486 |
| | | | 4,876,733 |
|
| |
| Technology (0.1%) | | | |
| Avnet, Inc. notes 6s, 2015 | 765,000 | | 744,349 |
| Computer Associates International, Inc. 144A | | | |
| sr. notes 6 1/8s, 2014 (S) | 980,000 | | 959,995 |
| | | | 1,704,344 |
61
| CORPORATE BONDS AND NOTES (4.5%)* continued | | | |
|
| | Principal amount | | Value |
| |
| Transportation (0.1%) | | | |
| Continental Airlines, Inc. pass-through | | | |
| certificates Ser. 98-3, 6.32s, 2008 | $ 4,215,000 | $ | 4,233,591 |
| CSX Corp. notes 6 3/4s, 2011 | 955,000 | | 1,017,831 |
| Union Pacific Corp. 144A pass-through | | | |
| certificates 5.214s, 2014 | 590,000 | | 584,855 |
| | | | 5,836,277 |
|
| |
| Utilities & Power (0.6%) | | | |
| AEP Texas North Co. sr. notes Ser. B, 5 1/2s, 2013 | 905,000 | | 910,274 |
| Appalachian Power Co. sr. notes 5.8s, 2035 | 510,000 | | 491,388 |
| Atmos Energy Corp. notes 4.95s, 2014 | 860,000 | | 823,615 |
| Beaver Valley II Funding debs. 9s, 2017 | 935,000 | | 1,080,505 |
| CenterPoint Energy Resources Corp. notes 7 3/4s, 2011 | 1,060,000 | | 1,170,247 |
| Cleveland Electric Illuminating Co. (The) 144A | | | |
| sr. notes Ser. D, 7.88s, 2017 | 550,000 | | 655,272 |
| Consolidated Natural Gas Co. sr. notes 5s, 2014 | 530,000 | | 510,941 |
| Consumers Energy Co. 1st mtge. 5.65s, 2020 | 420,000 | | 412,766 |
| Consumers Energy Co. 1st mtge. 5s, 2012 | 1,210,000 | | 1,176,004 |
| Consumers Energy Co. 1st mtge. Ser. B, 5 3/8s, 2013 | 960,000 | | 948,432 |
| Dayton Power & Light Co. (The) 1st mtge. 5 1/8s, 2013 | 975,000 | | 963,755 |
| Duke Energy Field Services, LLC 144A | | | |
| notes 5 3/8s, 2015 | 260,000 | | 255,092 |
| Entergy Gulf States, Inc. 1st mtge. 5 1/4s, 2015 | 375,000 | | 354,375 |
| Entergy Gulf States, Inc. 1st mtge. 3.6s, 2008 | 565,000 | | 543,115 |
| FirstEnergy Corp. notes Ser. B, 6.45s, 2011 | 55,000 | | 57,819 |
| Indianapolis Power & Light 144A 1st mtge. 6.3s, 2013 | 515,000 | | 537,256 |
| Ipalco Enterprises, Inc. sec. notes 8 3/8s, 2008 | 440,000 | | 463,100 |
| Kansas Gas & Electric bonds 5.647s, 2021 | 320,000 | | 314,810 |
| Kinder Morgan, Inc. sr. notes 6 1/2s, 2012 | 780,000 | | 821,242 |
| MidAmerican Energy Holdings Co. | | | |
| sr. notes 5 7/8s, 2012 | 1,320,000 | | 1,348,732 |
| Monongahela Power Co. 1st mtge. 5s, 2006 | 2,185,000 | | 2,182,352 |
| National Fuel Gas Co. notes 5 1/4s, 2013 | 545,000 | | 539,248 |
| Nevada Power Co. 2nd mtge. 9s, 2013 | 463,000 | | 512,512 |
| Nevada Power Co. general ref. mtge. Ser. L, | | | |
| 5 7/8s, 2015 | 425,000 | | 422,535 |
| NiSource Finance Corp. company guaranty 5.45s, 2020 | 1,315,000 | | 1,258,583 |
| NiSource Finance Corp. company guaranty 5 1/4s, 2017 | 140,000 | | 134,807 |
| Oncor Electric Delivery Co. sec. notes 7 1/4s, 2033 | 820,000 | | 946,828 |
| Oncor Electric Delivery Co. sec. notes 6 3/8s, 2012 | 1,365,000 | | 1,426,600 |
| PacifiCorp Sinking Fund 1st mtge. 5.45s, 2013 | 1,020,000 | | 1,032,671 |
| Power Receivable Finance, LLC 144A | | | |
| sr. notes 6.29s, 2012 (S) | 1,209,584 | | 1,226,143 |
| PP&L Capital Funding, Inc. company | | | |
| guaranty Ser. D, 8 3/8s, 2007 | 605,000 | | 629,274 |
| Public Service Co. of Colorado sr. notes Ser. A, | | | |
| 6 7/8s, 2009 | 375,000 | | 395,353 |
62
| CORPORATE BONDS AND NOTES (4.5%)* continued | | | |
|
| | | Principal amount | | Value |
| |
| Utilities & Power continued | | | | |
| Public Service Co. of New Mexico sr. notes 4.4s, 2008 | $ 570,000 | $ | 558,441 |
| Public Service Electric & Gas Co. 1st mtge. | | | | |
| 6 3/8s, 2008 | | 915,000 | | 937,836 |
| Southern California Edison Co. 1st mtge. 5s, 2014 | 230,000 | | 226,017 |
| Southern California Edison Co. notes 6.65s, 2029 | | 1,205,000 | | 1,317,243 |
| Tampa Electric Co. notes 6 7/8s, 2012 | | 660,000 | | 715,906 |
| Westar Energy, Inc. 1st mtge. 5.1s, 2020 | | 800,000 | | 750,972 |
| York Power Funding 144A notes 12s, 2007 | | | | |
| (Cayman Islands) (In default) (F) † | | 157,726 | | 13,154 |
| | | | | 29,065,215 |
|
| |
| Total corporate bonds and notes (cost $218,351,199) | | $ | 218,252,600 |
|
| |
| |
| CONVERTIBLE PREFERRED STOCKS (0.8%)* | | | | |
|
| | | Shares | | Value |
| |
| General Motors Corp. Ser. A, $1.13 cv. pfd. | | 75,722 | $ | 1,751,071 |
| Hartford Financial Services Group, Inc. (The) | | | | |
| $3.50 cv. pfd. | | 46,274 | | 3,389,571 |
| Hartford Financial Services Group, Inc. (The) | | | | |
| $3.00 cv. pfd. | | 71,174 | | 5,151,218 |
| Huntsman Corp. $2.50 cv. pfd. (S) | | 110,100 | | 5,078,363 |
| Xerox Corp. $6.25 cv. pfd. | | 157,000 | | 18,761,500 |
| XL Capital, Ltd. $1.625 cv. pfd. (Bermuda) | | 247,500 | | 5,499,450 |
|
| Total convertible preferred stocks (cost $33,934,324) | | $ | 39,631,173 |
|
| |
| |
| MUNICIPAL BONDS AND NOTES (—%)* | | | | |
|
| | Rating ** | Principal amount | | Value |
| |
| NJ State Tpk. Auth. Rev. Bonds, Ser. B, AMBAC | | | | |
| 4.252s, 1/1/16 | Aaa | $ 1,065,000 | $ | 1,004,444 |
| 4.252s, 1/1/16 Prerefunded | Aaa | 55,000 | | 51,429 |
|
| Total municipal bonds and notes (cost $1,084,008) | | $ | 1,055,873 |
|
| |
| |
| PREFERRED STOCKS (—%)* | | | | |
|
| | | Shares | | Value |
| |
| Paxson Communications Corp. 14.25% cum. pfd. ‡‡ | 1 | $ | 8,600 |
| UBS Capital III $1.938 cum. pfd. | | 31,000 | | 780,890 |
|
| Total preferred stocks (cost $788,350) | | | $ | 789,490 |
|
| |
| |
| UNITS (—%)* (cost $745,798) | | | | |
|
| | | Units | | Value |
| |
| Cendant Corp. 4.89s, 2006 | | 10,100 | $ | 503,022 |
63
| SHORT-TERM INVESTMENTS (12.1%)* | | | | |
|
| | Principal amount/shares | | Value |
| |
| Atlantic Asset Sec. Corp. for an effective yield | | | | |
| of 4.41%, February 9, 2006 | $ | 23,863,000 | $ | 23,839,667 |
| Barton Capital Corp., LLC for an effective yield | | | | |
| off 4.48%, February 7, 2006 | | 22,222,000 | | 22,205,445 |
| Barton Capital Corp., LLC for an effective yield | | | | |
| off 4.39%, February 13, 2006 | | 29,018,000 | | 28,975,634 |
| CBA (Delaware) Finance for an effective yield | | | | |
| of 4.39%, February 9, 2006 | | 50,000,000 | | 49,951,333 |
| Ranger Funding Co., LLC for an effective yield | | | | |
| of 4.41%, February 10, 2006 | | 15,273,000 | | 15,256,200 |
| Westpac Banking Corp. for an effective yield | | | | |
| of 4.48%, February 7, 2006 | | 28,000,000 | | 27,979,140 |
| Interest in $437,000,000 joint repurchase | | | | |
| agreement dated January 31, 2006 with Bank | | | | |
| of America Securities, LLC due February 1, 2006 | | | | |
| with respect to various U.S. Government | | | | |
| obligations — maturity value of $49,635,135 for | | | | |
| an effective yield of 4.45% (collateralized by | | | | |
| Fannie Mae and Freddie Mac with yields ranging | | | | |
| from 3.50% to 12.00% and due dates ranging from | | | | |
| July 1, 2006 to February 1, 2036, valued at | | | | |
| $510,002,396) | | 49,629,000 | | 49,629,000 |
| Short-term investments held as collateral for | | | | |
| loaned securities with yields ranging from 4.33% | | | | |
| to 4.65% and due dates ranging from | | | | |
| February 1, 2006 to March 24, 2006 (d) | | 212,851,472 | | 212,749,540 |
| Putnam Prime Money Market Fund (e) | | 163,058,124 | | 163,058,124 |
|
| |
| Total short-term investments (cost $593,644,083) | | | $ | 593,644,083 |
|
| TOTAL INVESTMENTS | |
| Total investments (cost $4,926,958,886) | | $ 5,508,432,014 | | |
* Percentages indicated are based on net assets of $4,886,843,608.
** The Moody’s or Standard & Poor’s ratings indicated are believed to be the most recent ratings available at January 31, 2006 for the securities listed. Ratings are generally ascribed to securities at the time of issuance. While the agencies may from time to time revise such ratings, they undertake no obligation to do so, and the ratings do not necessarily represent what the agencies would ascribe to these securities at January 31, 2006. Securities rated by Putnam are indicated by “/P”. Security ratings are defined in the Statement of Additional Information.
† Non-income-producing security.
(S) Securities on loan, in part or in entirety, at January 31, 2006.
‡‡ Income may be received in cash or additional securities at the discretion of the issuer.
# A portion of this security was pledged and segregated with the custodian to cover margin requirements for futures contracts at January 31, 2006.
(R) Real Estate Investment Trust.
(d) See Note 1 to the financial statements.
64
(e) See Note 5 to the financial statements regarding investments in Putnam Prime Money Market Fund.
(F) Security is valued at fair value following procedures approved by the Trustees.
At January 31, 2006, liquid assets totaling $720,067,811 have been designated as collateral for open forward commitments, swap contracts and futures contracts.
144A after the name of a security represents those exempt from registration under Rule 144A of the Securities Act of 1933. These securities may be resold in transactions exempt from registration, normally to qualified institutional buyers.
TBA after the name of a security represents to be announced securities (Note 1).
The rates shown on Floating Rate Bonds (FRB) and Floating Rate Notes (FRN) are the current interest rates at January 31, 2006.
AMBAC represents AMBAC Indemnity Corporation.
Inverse Floating Rate Bonds (IFB) are securities that pay interest rates that vary inversely to changes in the market interest rates. As interest rates rise, inverse floaters produce less current income. The interest rates shown are the current interest rates at January 31, 2006.
| FUTURES CONTRACTS OUTSTANDING at 1/31/06 (Unaudited) | | |
|
| | | | | Unrealized |
| | Number of | | Expiration | appreciation/ |
| | contracts | Value | date | (depreciation) |
|
| |
| Euro 90 day (Long) | 2,535 | $602,537,813 | Jun-06 | $ (689,564) |
| Euro 90 day (Long) | 3 | 713,813 | Mar-06 | (5,223) |
| Euro 90 day (Short) | 2,535 | 603,076,500 | Mar-07 | 699,004 |
| U.S. Treasury Bond 10 yr (Long) | 1,252 | 141,280,375 | Mar-06 | (562,990) |
| U.S. Treasury Note 2 yr (Long) | 608 | 124,545,000 | Mar-06 | (248,956) |
| U.S. Treasury Note 5 yr (Short) | 3,067 | 324,287,328 | Mar-06 | 1,530,883 |
| U.S. Treasury Note 10 yr (Long) | 1,457 | 157,993,438 | Mar-06 | (647,006) |
|
| Total | | | | $ 76,148 |
|
| |
| |
| WRITTEN OPTIONS OUTSTANDING at 1/31/06 (premiums received $5,942,027) (Unaudited) | |
|
| | | Contract | Expiration date/ |
| | | amount | strike price | Value |
|
| Option on an interest rate swap with JPMorgan Chase Bank, | | | |
| N.A. for the obligation to pay a fixed rate of 4.55% versus | | | |
| the three month LIBOR maturing on July 5, 2017. | $76,820,000 | Jul 07/4.55 | $4,224,585 |
| Option on an interest rate swap with JPMorgan Chase Bank, | | | |
| N.A. for the right to receive a fixed rate of 4.55% | | | |
| versus the three month LIBOR maturing on July 5, 2017. | 76,820,000 | Jul 07/4.55 | 1,166,166 |
|
| Total | | | | $5,390,751 |
TBA SALE COMMITMENTS OUTSTANDING at 1/31/06 (proceeds receivable $102,932,875) (Unaudited)
| | Principal | Settlement | |
| Agency | amount | date | Value |
|
| |
| FNMA, 6s, February 1, 2036 | $49,600,000 | 2/13/06 | $ 50,068,874 |
| FNMA, 5 1/2s, February 1, 2036 | 44,000,000 | 2/13/06 | 43,511,873 |
| FNMA, 5s, February 1, 2036 | 700,000 | 2/13/06 | 676,266 |
| FNMA, 4s, February 1, 2021 | 8,700,000 | 2/16/06 | 8,271,796 |
|
| Total | | | $102,528,809 |
65
| INTEREST RATE SWAP CONTRACTS OUTSTANDING at 1/31/06 (Unaudited) | | |
|
| | | | Unrealized |
| | Notional | Termination | appreciation/ |
| | amount | date | (depreciation) |
|
| Agreement with JPMorgan Chase Bank, N.A. dated | | | |
| January 12, 2006 to pay semi-annually the notional | | | |
| amount multiplied by 4.946% and receive quarterly the | | | |
| notional amount multiplied by the three month LIBOR. | $183,000,000 | 1/17/16 | $ 1,239,500 |
| Agreement with Bank of America, N.A. dated May 18, | | | |
| 2005 to pay semi-annually the notional amount multiplied | | | |
| by 3.95% and receive quarterly the notional amount | | | |
| multiplied by the three month USD-LIBOR. | 248,000,000 | 5/21/07 | 3,303,222 |
| Agreement with Bank of America, N.A. dated December 20, | | | |
| 2004 to pay semi-annually the notional amount multiplied by | | | |
| 3.965% and receive quarterly the notional amount multiplied | | | |
| by the three month USD-LIBOR. | 102,075,000 | 12/22/09 | 3,565,583 |
| Agreement with Bank of America, N.A. dated March 31, | | | |
| 2005 to pay semi-annually the notional amount multiplied | | | |
| by 4.6375% and receive quarterly the notional amount | | | |
| multiplied by the three month USD-LIBOR. | 84,900,000 | 4/6/10 | (5,406) |
| Agreement with Bank of America, N.A. dated January 12, | | | |
| 2005 to receive semi-annually the notional amount multi- | | | |
| plied by 4.106% and pay quarterly the notional amount | | | |
| multiplied by the three month USD-LIBOR. | 87,100,000 | 1/14/10 | (2,618,216) |
| Agreement with Bank of America, N.A. dated January 26, | | | |
| 2004 to receive semi-annually the notional amount multi- | | | |
| plied by 5.2125% and pay quarterly the notional amount | | | |
| multiplied by the three month USD-LIBOR. | 82,772,000 | 1/28/24 | 804,205 |
| Agreement with Bank of America, N.A. dated October 19, | | | |
| 2005 to pay semi-annually the notional amount multiplied | | | |
| by 4.943% and receive quarterly the notional amount | | | |
| multiplied by the three month USD-LIBOR. | 53,000,000 | 10/21/15 | (317,847) |
| Agreement with Bank of America, N.A. dated June 15, | | | |
| 2005 to pay semi-annually the notional amount multiplied | | | |
| by 4.555% and receive quarterly the notional amount | | | |
| multiplied by the three month USD-LIBOR. | 20,610,000 | 6/17/15 | 718,918 |
| Agreement with Bank of America, N.A. dated June 21, | | | |
| 2005 to pay semi-annually the notional amount multiplied | | | |
| by 4.466% and receive quarterly the notional amount | | | |
| multiplied by the three month USD-LIBOR. | 7,440,000 | 6/23/15 | 309,802 |
| Agreement with Bank of America, N.A. dated June 22, | | | |
| 2005 to pay semi-annually the notional amount multiplied | | | |
| by 4.39% and receive quarterly the notional amount | | | |
| multiplied by the three month USD-LIBOR. | 3,720,000 | 6/24/15 | 176,289 |
| Agreement with Bank of America, N.A. dated June 21, | | | |
| 2005 to pay semi-annually the notional amount multiplied | | | |
| by 4.45% and receive quarterly the notional amount | | | |
| multiplied by the three month USD-LIBOR. | 3,070,000 | 6/23/15 | 131,540 |
66
INTEREST RATE SWAP CONTRACTS OUTSTANDING at 1/31/06 (Unaudited) continued
| | | | | Unrealized |
| | | Notional | Termination | appreciation/ |
| | | amount | date | (depreciation) |
|
| Agreement with Bank of America, N.A. dated August 30, | | | | |
| 2005 to pay semi-annually the notional amount multiplied | | | | |
| by 4.53125% and receive quarterly the notional amount | | | | |
| multiplied by the three month USD-LIBOR-BBA. | $ | 700,000 | 9/1/15 | $ (18,354) |
| Agreement with Credit Suisse First Boston International | | | | |
| dated July 7, 2004 to receive semi-annually the notional | | | | |
| amount multiplied by 2.931% and pay quarterly the | | | | |
| notional amount multiplied by the three month | | | | |
| USD-LIBOR. | | 25,631,800 | 7/9/06 | (234,422) |
| Agreement with Credit Suisse First Boston International | | | | |
| dated November 15, 2004 to pay semi-annually the | | | | |
| notional amount multiplied by 3.947% and receive quar- | | | | |
| terly the notional amount multiplied by the three month | | | | |
| USD-LIBOR. | | 6,600,000 | 11/17/09 | 229,878 |
| Agreement with JPMorgan Chase Bank, N.A. dated March 3, | | | | |
| 2005 to receive semi-annually the notional amount multi- | | | | |
| plied by 4.798% and pay quarterly the notional amount | | | | |
| multiplied by the three month USD-LIBOR. | | 126,500,000 | 3/7/15 | (461,753) |
| Agreement with JPMorgan Chase Bank, N.A. dated June 27, | | | | |
| 2005 to receive semi-annually the notional amount | | | | |
| multiplied by 4.296% and pay quarterly the notional | | | | |
| amount multiplied by the three month USD-LIBOR. | | 63,370,000 | 6/29/15 | (3,441,676) |
| Agreement with JPMorgan Chase Bank, N.A. dated | | | | |
| October 19, 2005 to pay semi-annually the notional | | | | |
| amount multiplied by 4.916% and receive quarterly the | | | | |
| notional amount multiplied by the three month LIBOR. | | 47,810,000 | 10/21/15 | (204,234) |
| Agreement with JPMorgan Chase Bank, N.A. dated June 14, | | | | |
| 2005 to pay semi-annually the notional amount multiplied | | | | |
| by 4.538% and receive quarterly the notional amount | | | | |
| multiplied by the three month USD-LIBOR. | | 17,930,000 | 6/16/15 | 648,189 |
| Agreement with JPMorgan Chase Bank, N.A. dated July 29, | | | | |
| 2005 to pay semi-annually the notional amount multiplied | | | | |
| by 4.6757% and receive quarterly the notional amount | | | | |
| multiplied by the three month USD-LIBOR. | | 10,430,000 | 8/2/15 | (145,422) |
| Agreement with JPMorgan Chase Bank, N.A. dated June 22, | | | | |
| 2005 to receive semi-annually the notional amount multi- | | | | |
| plied by 4.387% and pay quarterly the notional amount | | | | |
| multiplied by the three month USD-LIBOR. | | 4,470,000 | 6/24/15 | 218,460 |
| Agreement with Lehman Brothers Special Financing, Inc. | | | | |
| dated July 13, 2005 to pay semi-annually the notional | | | | |
| amount multiplied by 4.38% and receive quarterly the | | | | |
| notional amount multiplied by the three month | | | | |
| USD-LIBOR-BBA. | | 63,000,000 | 7/15/10 | 1,430,310 |
67
INTEREST RATE SWAP CONTRACTS OUTSTANDING at 1/31/06 (Unaudited) continued
| | | | Unrealized |
| | Notional | Termination | appreciation/ |
| | amount | date | (depreciation) |
|
| Agreement with Lehman Brothers Special Financing, Inc. | | | |
| dated June 14, 2005 to pay semi-annually the notional | | | |
| amount multiplied by 4.0525% and receive quarterly the | | | |
| notional amount multiplied by the three month | | | |
| USD-LIBOR-BBA. | $30,200,000 | 6/16/07 | $ (375,022) |
| Agreement with Lehman Brothers Special Financing, Inc. | | | |
| dated December 11, 2003 to pay semi-annually the | | | |
| notional amount multiplied by 4.710% and receive quar- | | | |
| terly the notional amount multiplied by the three month | | | |
| USD-LIBOR-BBA. | 10,708,000 | 12/15/13 | 200,668 |
| Agreement with Lehman Brothers Special Financing, Inc. | | | |
| dated December 12, 2003 to pay semi-annually the | | | |
| notional amount multiplied by 4.579% and receive quar- | | | |
| terly the notional amount multiplied by the three month | | | |
| USD-LIBOR-BBA. | 10,192,000 | 12/16/13 | 278,749 |
| Agreement with Lehman Brothers Special Financing, Inc. | | | |
| dated January 21, 2004 to pay semi-annually the notional | | | |
| amount multiplied by 4.408% and receive quarterly the | | | |
| notional amount multiplied by the three month | | | |
| USD-LIBOR-BBA. | 9,307,000 | 1/23/14 | 362,543 |
| Agreement with Lehman Brothers Special Financing, Inc. | | | |
| dated January 21, 2004 to pay semi-annually the notional | | | |
| amount multiplied by 4.419% and receive quarterly the | | | |
| notional amount multiplied by the three month | | | |
| USD-LIBOR-BBA. | 9,307,000 | 1/23/14 | 361,963 |
| Agreement with Lehman Brothers Special Financing, Inc. | | | |
| dated June 14, 2005 to pay semi-annually the notional | | | |
| amount multiplied by 4.5475% and receive quarterly the | | | |
| notional amount multiplied by the three month | | | |
| USD-LIBOR-BBA. | 8,300,000 | 6/16/15 | (294,062) |
| Agreement with Lehman Brothers Special Financing, Inc. | | | |
| dated December 9, 2003 to receive semi-annually the | | | |
| notional amount multiplied by 4.641% and pay quarterly | | | |
| the notional amount multiplied by the three month | | | |
| USD-LIBOR-BBA. | 3,658,000 | 12/15/13 | (84,901) |
| Agreement with Lehman Brothers Special Financing, Inc. | | | |
| dated December 15, 2005 to pay semi-annually the | | | |
| notional amount multiplied by 5.0265% and receive quar- | | | |
| terly the notional amount multiplied by the three month | | | |
| USD-LIBOR-BBA. | 87,235,000 | 12/19/15 | (4,193) |
|
| |
| Total | | | $5,774,311 |
68
| TOTAL RETURN SWAP CONTRACTS OUTSTANDING at 1/31/06 (Unaudited) | | |
|
| | | | Unrealized |
| | Notional | Termination | appreciation/ |
| | amount | date | (depreciation) |
|
| Agreement with Deutsche Bank AG dated September 8, | | | |
| 2005 to receive at maturity the notional amount multiplied | | | |
| by the nominal spread appreciation of the Lehman | | | |
| Brothers AAA 8.5+ Commercial Mortgage Backed | | | |
| Securities Index adjusted by a modified duration factor and | | | |
| an accrual of 25 basis points plus the beginning of the | | | |
| period nominal spread of the Lehman Brothers AAA 8.5+ | | | |
| Commercial Mortgage Backed Securities Index and pay at | | | |
| maturity the notional amount multiplied by the nominal | | | |
| spread depreciation of the Lehman Brothers AAA 8.5+ | | | |
| Commercial Mortgage Backed Securities Index adjusted by | | | |
| a modified duration factor. | $ 13,837,000 | 3/1/06 | $ 20,105 |
| Agreement with Goldman Sachs dated December 23, | | | |
| 2005 to receive/(pay) a premium based on the difference | | | |
| between the market price of Ford Credit Auto Owner | | | |
| Trust Series 2005-B Class D and par on day of execution | | | |
| and receive monthly the notional amount multiplied by 678 | | | |
| basis points and pay monthly the one month USD-LIBOR. | | | |
| At maturity/termination the fund receives the coupon and | | | |
| price appreciation of Ford Credit Auto Owner Trust Series | | | |
| 2005-B Class D and pays the one month USD LIBOR and | | | |
| the price depreciation of Ford Credit Auto Owner Trust | | | |
| Series 2005-B Class D. | 3,843,000 | 9/15/11 | 18,808 |
| Agreement with Goldman Sachs Capital Markets, L.P. | | | |
| dated September 8, 2005 to receive at maturity the | | | |
| notional amount multiplied by the nominal spread appreci- | | | |
| ation of the Lehman Brothers AAA 8.5+ Commercial | | | |
| Mortgage Backed Securities Index adjusted by a modified | | | |
| duration factor and an accrual of 30 basis points plus the | | | |
| beginning of the period nominal spread of the Lehman | | | |
| Brothers AAA 8.5+ Commercial Mortgage Backed | | | |
| Securities Index and pay at maturity the notional amount | | | |
| multiplied by the nominal spread depreciation of the | | | |
| Lehman Brothers AAA 8.5+ Commercial Mortgage Backed | | | |
| Securities Index adjusted by a modified duration factor. | 59,488,000 | 4/1/06 | 62,105 |
| Agreement with Lehman Brothers Finance, S.A. dated | | | |
| August 31, 2005 to receive/(pay) semi-annually the | | | |
| notional amount multiplied by the return of the Lehman | | | |
| Brothers US ABS Floating Rate Index HEL Aggregate | | | |
| Component and pay semi-annually the notional amount | | | |
| multiplied by the six month USD-LIBOR-BBA adjusted by | | | |
| a specified spread. | 147,000,000 | 3/1/06 | (123,809) |
|
| |
| Total | | | $ (22,791) |
69
| CREDIT DEFAULT CONTRACTS OUTSTANDING at 1/31/06 (Unaudited) | | |
|
| | | Unrealized |
| | Notional | appreciation/ |
| | amount | (depreciation) |
|
| Agreement with Morgan Stanley Capital Services, Inc. on September 7, | | |
| 2005, maturing on June 20, 2015, to receive quarterly 70.5 basis points | | |
| per annum times the notional amount. Upon a credit default event of a | | |
| reference entity within the DJ IG CDX Series 4 Index 10-15% tranche, | | |
| the fund makes a payment of the proportional notional amount times | | |
| the difference between the par value and the then-market value of the | | |
| reference entity within the DJ IG CDX Series 4 Index 10-15% tranche. | $3,363,000 | $ 46,400 |
| Agreement with Morgan Stanley Capital Services, Inc. on September 7, | | |
| 2005, maturing on June 20, 2015, to receive/(pay) a premium based on | | |
| the difference between the original spread on issue and the market | | |
| spread on day of execution and pay quarterly 65 basis points per annum | | |
| times the notional amount. Upon a credit default event of a reference | | |
| entity within the DJ IG CDX Series 4 Index, the fund receives a payment | | |
| of the proportional notional amount times the difference between the | | |
| par value and the then-market value of the reference entity within the | | |
| DJ IG CDX Series 4 Index. | 3,363,000 | (8,598) |
| Agreement with Morgan Stanley Capital Services, Inc. on November 16, | | |
| 2005, maturing on December 20, 2012, to receive quarterly 305 basis | | |
| points per annum times the notional amount. Upon a credit default event | | |
| of a reference entity within the DJ IG CDX Series 5 Index 3-7% tranche, | | |
| the fund makes a payment of the proportional notional amount times | | |
| the difference between the par value and the then-market value of the | | |
| reference entity within the DJ IG CDX Series 5 Index 3-7% tranche. | 2,396,000 | 108,746 |
| Agreement with Morgan Stanley Capital Services, Inc. on November 30, | | |
| 2005, maturing on December 20, 2012, to receive quarterly 30 basis | | |
| points per annum times the notional amount. Upon a credit default event | | |
| of a reference entity within the DJ IG CDX Series 5 Index 10-15% tranche, | | |
| the fund makes a payment of the proportional notional amount times the | | |
| difference between the par value and the then-market value of the | | |
| reference entity within the DJ IG CDX Series 5 Index 10-15% tranche. | 6,832,000 | 11,420 |
| Agreement with Morgan Stanley Capital Services, Inc. on November 30, | | |
| 2005, maturing on December 20, 2012, to receive/(pay) a premium | | |
| based on the difference between the original spread on issue and the | | |
| market spread on day of execution and pay quarterly 55 basis points per | | |
| annum times the notional amount. Upon a credit default event of a refer- | | |
| ence entity within the DJ IG CDX Series 5 Index, the fund receives a | | |
| payment of the proportional notional amount times the difference | | |
| between the par value and the then-market value of the reference entity | | |
| within the DJ IG CDX Series 5 Index. | 3,416,000 | (11,054) |
| Agreement with Morgan Stanley Capital Services, Inc. on December 8, | | |
| 2005, maturing on December 20, 2012, to receive/(pay) a premium | | |
| based on the difference between the original spread on issue and the | | |
| market spread on day of execution and pay quarterly 55 basis points per | | |
| annum times the notional amount. Upon a credit default event of a refer- | | |
| ence entity within the DJ IG CDX Series 5 Index, the fund receives a | | |
| payment of the proportional notional amount times the difference | | |
| between the par value and the then-market value of the reference entity | | |
| within the DJ IG CDX Series 5 Index. | 3,414,500 | (11,055) |
70
| CREDIT DEFAULT CONTRACTS OUTSTANDING at 1/31/06 (Unaudited) continued | |
|
| | | Unrealized |
| | Notional | appreciation/ |
| | amount | (depreciation) |
|
| Agreement with Morgan Stanley Capital Services, Inc. on December 8, | | |
| 2005, maturing on December 20, 2012, to receive quarterly 29 basis | | |
| points per annum times the notional amount. Upon a credit default event | | |
| of a reference entity within the DJ IG CDX Series 5 Index 10-15% tranche, | | |
| the fund makes a payment of the proportional notional amount times the | | |
| difference between the par value and the then-market value of the | | |
| reference entity within the DJ IG CDX Series 5 Index 10-15% tranche. | $6,829,000 | $ 18,209 |
| Agreement with Morgan Stanley Capital Services, Inc. on December 19, | | |
| 2005, maturing on June 20, 2010, to pays quarterly 110.5 basis points | | |
| per annum times the notional amount. Upon a credit default event of a | | |
| reference entity within the DJ IG CDX Series 4 Index 3-7% tranche, the | | |
| fund receives a payment of the proportional notional amount times the | | |
| difference between the par value and the then-market value of the | | |
| reference entity within the DJ IG CDX Series 4 Index 3-7% tranche. | 1,567,000 | 1,126 |
| Agreement with Morgan Stanley Capital Services, Inc. on September 13, | | |
| 2005, maturing on June 20, 2012, to receive quarterly 275 basis points | | |
| per annum times the notional amount. Upon a credit default event of a | | |
| reference entity within the DJ IG CDX Series 4 Index 3-7% tranche, the | | |
| fund makes a payment of the proportional notional amount times the | | |
| difference between the par value and the then-market value of the | | |
| reference entity within the DJ IG CDX Series 4 Index 3-7% tranche. | 2,517,000 | 6,568 |
| Agreement with Morgan Stanley Capital Services, Inc. on September 19, | | |
| 2005, maturing on June 20, 2012, to receive/(pay) a premium based on | | |
| the difference between the original spread on issue and the market | | |
| spread on day of execution and pay quarterly 55 basis points per annum | | |
| times the notional amount. Upon a credit default event of a reference | | |
| entity within the DJ IG CDX Series 4 Index, the fund receives a payment | | |
| of the proportional notional amount times the difference between the | | |
| par value and the then-market value of the reference entity within the | | |
| DJ IG CDX Series 4 Index. | 6,767,000 | (5,987) |
| Agreement with Morgan Stanley Capital Services, Inc. on September 19, | | |
| 2005, maturing on June 20, 2012, to receive quarterly 48 basis points per | | |
| annum times the notional amount. Upon a credit default event of a refer- | | |
| ence entity within the DJ IG CDX Series 4 Index 7-10% tranche, the fund | | |
| makes a payment of the proportional notional amount times the differ- | | |
| ence between the par value and the then-market value of the reference | | |
| entity within the DJ IG CDX Series 4 Index 7-10% tranche. | 6,767,000 | 21,042 |
| Agreement with Goldman Sachs Capital Markets, L.P. on November 17, | | |
| 2005, maturing on December 20, 2010, to receive/(pay) a premium | | |
| based on the difference between the original spread on issue and the | | |
| market spread on day of execution and pay quarterly 85 basis points per | | |
| annum times the notional amount. Upon a credit default event of a refer- | | |
| ence entity within the CDX IG HVOL Series 5 Index, the fund receives a | | |
| payment of the proportional notional amount times the difference | | |
| between the par value and the then-market value of the reference entity | | |
| within the CDX IG HVOL Series 5 Index. | 2,396,000 | (16,463) |
71
| CREDIT DEFAULT CONTRACTS OUTSTANDING at 1/31/06 (Unaudited) continued | |
|
| | | Unrealized |
| | Notional | appreciation/ |
| | amount | (depreciation) |
|
| Agreement with Goldman Sachs Capital Markets, L.P. on November 18, | | |
| 2005, maturing on December 20, 2010, to receive/(pay) a premium | | |
| based on the difference between the original spread on issue and the | | |
| market spread on day of execution and pay quarterly 45 basis points per | | |
| annum times the notional amount. Upon a credit default event of a refer- | | |
| ence entity within the CDX IG Series 5 Index, the fund receives a | | |
| payment of the proportional notional amount times the difference | | |
| between the par value and the then-market value of the reference entity | | |
| within the CDX IG Series 5 Index. | $26,770,000 | $(90,615) |
| Agreement with Goldman Sachs Capital Markets, L.P. on December 2, | | |
| 2005, maturing on December 20, 2012, to receive/(pay) a premium | | |
| based on the difference between the original spread on issue and the | | |
| market spread on day of execution and pay quarterly 55 basis points per | | |
| annum times the notional amount. Upon a credit default event of a refer- | | |
| ence entity within the CDX IG Series 5 Index, the fund receives a | | |
| payment of the proportional notional amount times the difference | | |
| between the par value and the then-market value of the reference entity | | |
| within the CDX IG Series 5 Index. | 1,708,000 | (5,521) |
| Agreement with Goldman Sachs Capital Markets, L.P. on December 2, | | |
| 2005, maturing on December 20, 2012, to receive quarterly 31.25 basis | | |
| points per annum times the notional amount. Upon a credit default event | | |
| of a reference entity within the CDX IG Series 5 Index, 10-15% tranche, | | |
| the fund receives a payment of the proportional notional amount times | | |
| the difference between the par value and the then-market value of the | | |
| reference entity within the CDX IG Series 5 Index,10-15% tranche. | 3,416,000 | 13,305 |
| Agreement with Goldman Sachs Capital Markets, L.P. on December 2, | | |
| 2005, maturing on December 20, 2010, to pay quarterly 113 basis points | | |
| per annum times the notional amount. Upon a credit default event of a | | |
| reference entity within the CDX IG Series 5 Index, 3-7% tranche, the | | |
| fund receives a payment of the proportional notional amount times the | | |
| difference between the par value and the then-market value of the | | |
| reference entity within the CDX IG Series 5 Index, 3-7% tranche. | 1,198,000 | 5,253 |
| Agreement with Goldman Sachs Capital Markets, L.P. on December 2, | | |
| 2005, maturing on December 20, 2010, to receive/(pay) a premium | | |
| based on the difference between the original spread on issue and the | | |
| market spread on day of execution and pay quarterly 85 basis points per | | |
| annum times the notional amount. Upon a credit default event of a refer- | | |
| ence entity within the CDX IG HVOL Series 5 Index, the fund receives a | | |
| payment of the proportional notional amount times the difference | | |
| between the par value and the then-market value of the reference entity | | |
| within the CDX IG HVOL Series 5 Index. | 2,396,000 | (11,366) |
72
| CREDIT DEFAULT CONTRACTS OUTSTANDING at 1/31/06 (Unaudited) continued | |
|
| | | Unrealized |
| | Notional | appreciation/ |
| | amount | (depreciation) |
|
| Agreement with Goldman Sachs Capital Markets, L.P. on January 13, | | |
| 2006, maturing on December 20, 2010, to pay quarterly 115 basis points | | |
| per annum times the notional amount. Upon a credit default event of a | | |
| reference entity within the CDX IG Series 5 Index, 3-7% tranche, the | | |
| fund receives a payment of the proportional notional amount times the | | |
| difference between the par value and the then-market value of the | | |
| reference entity within the CDX IG Series 5 Index, 3-7% tranche. | $1,030,000 | $ (5,411) |
| Agreement with Morgan Stanley Capital Services, Inc. on October 14, | | |
| 2005, maturing on December 20, 2010, to receive quarterly 127 basis | | |
| points per annum times the notional amount. Upon a credit default event | | |
| of a reference entity within the DJ HY CDX Series 5 Index 25-35% tranche, | | |
| the fund makes a payment of the proportional notional amount times the | | |
| difference between the par value and the then-market value of the | | |
| reference entity within the DJ HY CDX Series 5 Index 25-35% tranche. | 3,826,000 | 61,428 |
| Agreement with Morgan Stanley Capital Services, Inc. on October 14, | | |
| 2005, maturing on December 20, 2010, to receive/(pay) a premium | | |
| based on the difference between the original spread on issue and the | | |
| market spread on day of execution and pays quarterly 395 basis points | | |
| per annum times the notional amount. Upon a credit default event of a | | |
| reference entity within the CDX HY Series 5 Index, the fund receives a | | |
| payment of the proportional notional amount times the difference | | |
| between the par value and the then-market value of the reference entity | | |
| within the CDX HY Series 5 Index. | 1,874,740 | (78,835) |
| Agreement with Morgan Stanley Capital Services, Inc. on January 6, 2006, | | |
| maturing on December 20, 2012, to receive quarterly 28.5 basis points | | |
| per annum times the notional amount. Upon a credit default event of a | | |
| reference entity within the DJ IG CDX Series 5 Index 10-15% tranche, the | | |
| fund makes a payment of the proportional notional amount times the | | |
| difference between the par value and the then-market value of the | | |
| reference entity within the DJ IG CDX Series 5 Index 10-15% tranche. | 3,007,000 | 6,410 |
| Agreement with Morgan Stanley Capital Services, Inc. on January 6, 2006 | | |
| maturing on December 20, 2012, to receive/(pay) a premium based on | | |
| the difference between the original spread on issue and the market | | |
| spread on day of execution and pays quarterly 55 basis points per annum | | |
| times the notional amount. Upon a credit default event of a reference | | |
| entity within the CDX IG Series 5 Index, the fund receives a payment of | | |
| the proportional notional amount times the difference between the par | | |
| value and the then-market value of the reference entity within the | | |
| CDX IG Series 5 Index. | 1,503,500 | (1,165) |
| Agreement with Morgan Stanley Capital Services, Inc. on January 13, | | |
| 2006, maturing on December 20, 2010, to pay quarterly 115 basis points | | |
| per annum times the notional amount. Upon a credit default event of a | | |
| reference entity within the DJ IG CDX Series 5 Index 3-7% tranche, the | | |
| fund receives a payment of the proportional notional amount times the | | |
| difference between the par value and the then-market value of the | | |
| reference entity within the DJ IG CDX Series 5 Index 3-7% tranche. | 1,030,000 | 3,381 |
73
| CREDIT DEFAULT CONTRACTS OUTSTANDING at 1/31/06 (Unaudited) continued | |
|
| | | Unrealized |
| | Notional | appreciation/ |
| | amount | (depreciation) |
|
| Agreement with Morgan Stanley Capital Services, Inc. on January 13, | | |
| 2006 maturing on December 20, 2010, to receive/(pay) a premium | | |
| based on the difference between the original spread on issue and the | | |
| market spread on day of execution and pay quarterly 85 basis points per | | |
| annum times the notional amount. Upon a credit default event of a refer- | | |
| ence entity within the CDX IG HVOL Series 5 Index, the fund receives a | | |
| payment of the proportional notional amount times the difference | | |
| between the par value and the then-market value of the reference entity | | |
| within the CDX IG HVOLSeries 5 Index. | $1,030,000 | $(3,674) |
| Agreement with Morgan Stanley Capital Services, Inc. on January 13, | | |
| 2006, maturing on December 20, 2012, to receive quarterly 248 basis | | |
| points per annum times the notional amount. Upon a credit default event | | |
| of a reference entity within the DJ IG CDX Series 5 Index 3-7% tranche, | | |
| the fund makes a payment of the proportional notional amount times the | | |
| difference between the par value and the then-market value of the | | |
| reference entity within the DJ IG CDX Series 5 Index 3-7% tranche. | 1,030,000 | 7,106 |
| Agreement with Merrill Lynch International on December 15, 2005, | | |
| maturing on December 20, 2010, to receive/(pay) a premium based on | | |
| the difference between the original spread on issue and the market | | |
| spread on day of execution and pays quarterly 45 basis points per annum | | |
| times the notional amount. Upon a credit default event of a reference | | |
| entity within the DJ IG CDX 5 Index, the fund receives a payment of the | | |
| proportional notional amount times the difference between the par value | | |
| and the then-market value of the reference entity within the | | |
| DJ IG CDX 5 Index. | 6,010,000 | (9,087) |
| Agreement with Merrill Lynch International & Co. C.V. on January 13, | | |
| 2006, maturing on December 20, 2012, to receive quarterly 246 basis | | |
| points per annum times the notional amount. Upon a credit default event | | |
| of a reference entity within the DJ IG CDX Series 5 Index 3-7% tranche, | | |
| the fund makes a payment of the proportional notional amount times the | | |
| difference between the par value and the then-market value of the | | |
| reference entity within the DJ IG CDX Series 5 Index 3-7% tranche. | 1,030,000 | 4,888 |
| Agreement with JPMorgan Securities Inc. on December 12, 2005, | | |
| maturing on June 20, 2012, to receive/(pay) a premium based on the | | |
| difference between the original spread on issue and the market spread on | | |
| day of execution and pays quarterly 55 basis points per annum times the | | |
| notional amount. Upon a credit default event of a reference entity within | | |
| the DJ IG CDX 4 Index, the fund receives a payment of the proportional | | |
| notional amount times the difference between the par value and the | | |
| then-market value of the reference entity within the DJ IG CDX 4 Index. | 3,437,500 | (8,665) |
| Agreement with JPMorgan Securities Inc. on December 12, 2005, | | |
| maturing on June 20, 2012, to receive quarterly 30.5 basis points per | | |
| annum times the notional amount. Upon a credit default event of a refer- | | |
| ence entity within the DJ IG CDX 4 Index, 10-15% tranche, the fund | | |
| makes a payment of the proportional notional amount times the differ- | | |
| ence between the par value and the then-market value of the reference | | |
| entity within the DJ IG CDX 4 Index10-15% tranche. | 6,875,000 | 7,549 |
74
| CREDIT DEFAULT CONTRACTS OUTSTANDING at 1/31/06 (Unaudited) continued | |
|
| | | Unrealized |
| | Notional | appreciation/ |
| | amount | (depreciation) |
|
| Agreement with Lehman Brothers Special Financing, Inc. on November 29, | | |
| 2005, maturing on December 20, 2010, to receive/(pay) a premium based | | |
| on the difference between the original spread on issue and the market | | |
| spread on day of execution and pay quarterly 45 basis points per annum | | |
| times the notional amount. Upon a credit default event of a reference | | |
| entity within the CDX IG Series 5 Index, the fund receives a payment of the | | |
| proportional notional amount times the difference between the par value | | |
| and the then-market value of the reference entity within the CDX IG | | |
| Series 5 Index. | $13,240,000 | $(35,615) |
| Agreement with Lehman Brothers Special Financing, Inc. on December 1, | | |
| 2005, maturing on June 20, 2010, to pay quarterly 124.5 basis points per | | |
| annum times the notional amount. Upon a credit default event of any | | |
| reference entity within the DJ IG CDX Series 4 Index, 3-7% tranche,the | | |
| fund receives a payment of the proportional notional amount times the | | |
| difference between the par value and the then-market value of the | | |
| reference entity within the DJ IG CDX Series 4 Index, 3-7% tranche. | 1,258,500 | (11,376) |
| Agreement with Lehman Brothers Special Financing, Inc. on December 8, | | |
| 2005, maturing on December 20, 2010, to receive/(pay) a premium | | |
| based on the difference between the original spread on issue and the | | |
| market spread on day of execution and to pay quarterly 45 basis points | | |
| per annum times the notional amount. Upon a credit default event of any | | |
| reference entity within the DJ IG CDX Series 4 Index,the fund receives a | | |
| payment of the proportional notional amount times the difference | | |
| between the par value and the then-market value of the reference entity | | |
| within the DJ IG CDX Series 4 Index. | 6,520,000 | (14,388) |
| Agreement with Lehman Brothers Special Financing, Inc. on December 19, | | |
| 2005, maturing on June 20, 2010, to receive/(pay) a premium based on the | | |
| difference between the original spread on issue and the market spread on | | |
| day of execution and to pay quarterly 90 basis points per annum times the | | |
| notional amount. Upon a credit default event of any reference entity within | | |
| the DJ IG CDX HVOL Series 4 Index,the fund receives a payment of the | | |
| proportional notional amount times the difference between the par value | | |
| and the then-market value of the reference entity within the DJ IG CDX | | |
| HVOL Series 4 Index. | 1,567,000 | (5,539) |
| Agreement with Lehman Brothers Special Financing, Inc. on December 19, | | |
| 2005, maturing on June 20, 2012, to receive quarterly 309 basis points per | | |
| annum times the notional amount. Upon a credit default event of any | | |
| reference entity within the DJ IG CDX Series 4 Index, 3-7% tranche,the | | |
| fund makes a payment of the proportional notional amount times the | | |
| difference between the par value and the then-market value of the | | |
| reference entity within the DJ IG CDX Series 4 Index, 3-7% tranche. | 1,567,000 | 22,739 |
75
| CREDIT DEFAULT CONTRACTS OUTSTANDING at 1/31/06 (Unaudited) continued | |
|
| | | Unrealized |
| | Notional | appreciation/ |
| | amount | (depreciation) |
|
| Agreement with Lehman Brothers Special Financing, Inc. on January 13, | | |
| 2006, maturing on December 20, 2010, to receive/(pay) a premium | | |
| based on the difference between the original spread on issue and the | | |
| market spread on day of execution and pay quarterly 85 basis points per | | |
| annum times the notional amount. Upon a credit default event of any | | |
| reference entity within the DJ IG CDX HVOL Series 5 Index,the fund | | |
| receives a payment of the proportional notional amount times the differ- | | |
| ence between the par value and the then-market value of the reference | | |
| entity within the DJ IG CDX HVOL Series 5 Index. | $1,030,000 | $ (3,401) |
| Agreement with Bank of America, N.A. on September 13, 2005, | | |
| maturing on June 20, 2010, to receive/(pay) a premium based on the | | |
| difference between the original spread on issue and the market spread on | | |
| day of execution and pay quarterly 90 basis points per annum times the | | |
| notional amount. Upon a credit default event of a reference entity within | | |
| the DJ CDX IG HVOL Series 4 Index, the fund receives a payment of the | | |
| proportional notional amount times the difference between the par value | | |
| and the then-market value of the reference entity within the DJ CDX IG | | |
| HVOL Series 4 Index. | 5,034,000 | 3,850 |
| Agreement with Bank of America, N.A. on July 26, 2005, maturing on | | |
| September 20, 2012, to receive quarterly 64 basis points times the | | |
| notional amount. Upon a credit default event of Waste Management, | | |
| 7.375%, 8/1/2010, the fund makes a payment of the proportional notional | | |
| amount times the difference between the par value and the then-market | | |
| value of Waste Management, 7.375%, 8/1/2010. | 1,140,000 | 1,430 |
| Agreement with Lehman Brothers Special Financing, Inc. on September 19, | | |
| 2005, maturing on June 20, 2015, to receive/(pay) a premium based on the | | |
| difference between the original spread on issue and the market spread on | | |
| day of execution and pay quarterly 65 basis points per annum times the | | |
| notional amount. Upon a credit default event of a reference entity within | | |
| the DJ IG CDX 4 Index, the fund receives a payment of the proportional | | |
| notional amount times the difference between the par value and the | | |
| then-market value of the reference entity within the DJ IG CDX 4 Index. | 3,384,000 | (3,719) |
| Agreement with Lehman Brothers Special Financing, Inc. on September 19, | | |
| 2005, maturing on June 20, 2015, to receive quarterly 59 basis points per | | |
| annum times the notional amount. Upon a credit default event of a refer- | | |
| ence entity within the DJ IG CDX 4 Index,10-15% tranche, the fund makes | | |
| a payment of the proportional notional amount times the difference | | |
| between the par value and the then-market value of the reference | | |
| entity within the DJ IG CDX 4 Index,10-15% tranche. | 3,384,000 | (7) |
76
| CREDIT DEFAULT CONTRACTS OUTSTANDING at 1/31/06 (Unaudited) continued | |
|
| | | Unrealized |
| | Notional | appreciation/ |
| | amount | (depreciation) |
|
| Agreement with Lehman Brothers Special Financing, Inc. on September 21, | | |
| 2005, maturing on December 20, 2015, to receive/(pay) a premium based | | |
| on the difference between the original spread on issue and the market | | |
| spread on day of execution and pay quarterly 70 basis points per annum | | |
| times the notional amount. Upon a credit default event of a reference | | |
| entity within the DJ IG CDX 5 Index, the fund receives a payment of the | | |
| proportional notional amount times the difference between the par | | |
| value and the then-market value of the reference entity within the | | |
| DJ IG CDX 5 Index. | $ 3,383,000 | $ (12,404) |
| Agreement with Lehman Brothers Special Financing, Inc. on September 21, | | |
| 2005, maturing on December 20, 2015, to receive quarterly 57.5 basis | | |
| points per annum times the notional amount. Upon a credit default event | | |
| of a reference entity within the DJ IG CDX 5 Index 10-15% tranche, the | | |
| fund makes a payment of the proportional notional amount times the | | |
| difference between the par value and the then-market value of the | | |
| reference entity within the DJ IG CDX 5 Index 10-15% tranche. | 3,383,000 | 6,971 |
| Agreement with Lehman Brothers Special Financing, Inc. on October 5, | | |
| 2005, maturing on December 20, 2010, to receive/(pay) a premium | | |
| based on the difference between the original spread on issue and the | | |
| market spread on day of execution and receive quarterly 45 basis points | | |
| per annum times the notional amount. Upon a credit default event of a | | |
| reference entity within the DJ CDX IG Series 5 Index, the fund makes a | | |
| payment of the proportional notional amount times the difference | | |
| between the par value and the then-market value of the reference entity | | |
| within the DJ CDX IG Series 5 Index. | 12,095,000 | (14,397) |
| Agreement with Deutsche Bank AG on July 22, 2005, maturing on | | |
| September 20, 2010, to receive quarterly 41 basis points times the | | |
| notional amount. Upon a credit default event of France Telecomm, 7.25%, | | |
| 1/28/2013, the fund makes a payment of the proportional notional | | |
| amount times the difference between the par value and the then-market | | |
| value of France Telecomm, 7.25%, 1/28/2013. | 1,905,000 | 2,038 |
| Agreement with Goldman Sachs Capital Markets, L.P. on August 4, 2005, | | |
| maturing on September 20, 2010, to receive quarterly 49 basis points | | |
| times the notional amount. Upon a credit default event of Goodrich | | |
| Corp. 7 5/8s, 12/15/12, the fund makes a payment of the proportional | | |
| notional amount times the difference between the par value | | |
| and the then-market value of Goodrich Corp. 7 5/8s, 12/15/12. | 930,000 | 544 |
| Agreement with Goldman Sachs International on September 2, 2004, | | |
| terminating on the date on which the notional amount is reduced to zero | | |
| or the date on which the assets securing the reference obligation are | | |
| liquidated, the fund receives a payment of the outstanding notional | | |
| amount times 2.55625% and the fund pays in the event of a credit default | | |
| in one of the underlying securities in the basket of BB CMBS securities. | 8,582,000 | 33,231 |
77
| CREDIT DEFAULT CONTRACTS OUTSTANDING at 1/31/06 (Unaudited) continued | |
|
| | | Unrealized |
| | Notional | appreciation/ |
| | amount | (depreciation) |
|
| Agreement with Citigroup Financial Products, Inc. on August 19, 2005, | | |
| maturing on June 20, 2012, to receive/(pay) a premium based on the | | |
| difference between the original spread on issue and the market spread on | | |
| day of execution and pay quarterly 55 basis points per annum times the | | |
| notional amount. Upon a credit default event of a reference entity within | | |
| the DJ IG CDX Series 4 Index, the fund receives a payment of the | | |
| proportional notional amount times the difference between the par value | | |
| and the then-market value of the reference entity within the DJ IG CDX | | |
| Series 4 Index. | $6,695,000 | $(13,036) |
| Agreement with Citigroup Financial Products, Inc. on August 19, 2005, | | |
| maturing on June 20, 2012, to receive quarterly 62 basis points per | | |
| annum times the notional amount. Upon a credit default event of a refer- | | |
| ence entity within the DJ IG CDX Series 4 Index,7-10% tranche, the fund | | |
| makes a payment of the proportional notional amount times the differ- | | |
| ence between the par value and the then-market value of the reference | | |
| entity within the DJ IG CDX Series 4 Index, 7-10% tranche. | 6,695,000 | 61,196 |
|
| |
| Total | | $ 73,452 |
The accompanying notes are an integral part of these financial statements.
78
| Statement of assets and liabilities 1/31/06 (Unaudited) | |
|
| |
| ASSETS | |
| Investment in securities, at value, including $206,262,187 of securities on loan (Note 1): | |
| Unaffiliated issuers (identified cost $4,763,900,762) | $5,345,373,890 |
| Affiliated issuers (identified cost $163,058,124) (Note 5) | 163,058,124 |
|
| Cash | 6,482,299 |
|
| Dividends, interest and other receivables | 13,452,526 |
|
| Receivable for shares of the fund sold | 2,518,536 |
|
| Receivable for securities sold | 49,299,537 |
|
| Receivable for sales of delayed delivery securities (Note 1) | 103,128,408 |
|
| Unrealized appreciation on swap contracts (Note 1) | 14,535,667 |
|
| Receivable for closed swap contracts (Note 1) | 130,058 |
|
| Receivable for variation margin (Note 1) | 364,714 |
|
| Premiums paid on swap contracts (Note 1) | 340,645 |
|
| Total assets | 5,698,684,404 |
|
| |
| LIABILITIES | |
| Payable for securities purchased | 35,004,013 |
|
| Payable for purchases of delayed delivery securities (Note 1) | 419,091,906 |
|
| Payable for shares of the fund repurchased | 19,200,341 |
|
| Payable for compensation of Manager (Notes 2 and 5) | 6,092,729 |
|
| Payable for investor servicing and custodian fees (Note 2) | 665,278 |
|
| Payable for Trustee compensation and expenses (Note 2) | 390,508 |
|
| Payable for administrative services (Note 2) | 5,641 |
|
| Payable for distribution fees (Note 2) | 1,582,722 |
|
| Written options outstanding, at value (premiums received $5,942,027) (Note 1) | 5,390,751 |
|
| Unrealized depreciation on swap contracts (Note 1) | 8,710,695 |
|
| TBA sales commitments, at value (proceeds receivable $102,932,875) (Note 1) | 102,528,809 |
|
| Collateral on securities loaned, at value (Note 1) | 212,749,540 |
|
| Other accrued expenses | 427,863 |
|
| Total liabilities | 811,840,796 |
|
| Net assets | $4,886,843,608 |
| |
| (Continued on next page) | |
79
| Statement of assets and liabilities (Continued) | |
|
| |
| REPRESENTED BY | |
| Paid-in capital (Unlimited shares authorized) (Notes 1 and 4) | $4,296,833,595 |
|
| Undistributed net investment income (Note 1) | 3,228,396 |
|
| Accumulated net realized loss on investments | |
| and foreign currency transactions (Note 1) | (1,520,077) |
|
| Net unrealized appreciation of investments | |
| and assets and liabilities on in foreign currencies | 588,301,694 |
|
| Total — Representing net assets applicable to capital shares outstanding | $4,886,843,608 |
|
| |
| COMPUTATION OF NET ASSET VALUE AND OFFERING PRICE | |
| Net asset value and redemption price per class A share | |
| ($3,288,356,714 divided by 180,534,566 shares) | $18.21 |
|
| Offering price per class A share | |
| (100/94.75 of $18.21)* | $19.22 |
|
| Net asset value and offering price per class B share | |
| ($786,165,059 divided by 43,617,056 shares)** | $18.02 |
|
| Net asset value and offering price per class C share | |
| ($75,514,943 divided by 4,171,816 shares)** | $18.10 |
|
| Net asset value and redemption price per class M share | |
| ($205,331,599 divided by 11,388,557 shares) | $18.03 |
|
| Offering price per class M share | |
| (100/96.75 of $18.03)* | $18.64 |
|
| Net asset value, offering price and redemption price per class R share | |
| ($922,527 divided by 50,769 shares) | $18.17 |
|
| Net asset value, offering price and redemption price per class Y share | |
| ($530,552,766 divided by 29,047,791 shares) | $18.26 |
* On single retail sales of less than $50,000. On sales of $50,000 or more and on group sales, the offering price is reduced.
** Redemption price per share is equal to net asset value less any applicable contingent deferred sales charge.
The accompanying notes are an integral part of these financial statements.
80
| Statement of operations Six months ended 1/31/06 (Unaudited) | |
|
| |
| INVESTMENT INCOME | |
| Interest (including interest income of $3,496,496 | |
| from investments in affiliated issuers) (Note 5) | $ 52,833,359 |
|
| Dividends | 31,424,088 |
|
| Securities lending | 71,468 |
|
| Total investment income | 84,328,915 |
|
| |
| EXPENSES | |
| Compensation of Manager (Note 2) | 12,476,321 |
|
| Investor servicing fees (Note 2) | 4,716,566 |
|
| Custodian fees (Note 2) | 247,706 |
|
| Trustee compensation and expenses (Note 2) | 67,254 |
|
| Administrative services (Note 2) | 31,427 |
|
| Distribution fees — Class A (Note 2) | 4,220,111 |
|
| Distribution fees — Class B (Note 2) | 4,259,682 |
|
| Distribution fees — Class C (Note 2) | 380,516 |
|
| Distribution fees — Class M (Note 2) | 796,677 |
|
| Distribution fees — Class R (Note 2) | 2,039 |
|
| Other | 505,331 |
|
| Non-recurring costs (Notes 2 and 6) | 45,470 |
|
| Costs assumed by Manager (Notes 2 and 6) | (45,470) |
|
| Fees waived and reimbursed by Manager (Note 5) | (120,569) |
|
| Total expenses | 27,583,061 |
|
| Expense reduction (Note 2) | (842,352) |
|
| Net expenses | 26,740,709 |
|
| Net investment income | 57,588,206 |
|
| Net realized gain on investments (Notes 1 and 3) | 174,047,812 |
|
| Net realized gain on swap contracts (Note 1) | 2,885,698 |
|
| Net realized loss on futures contracts (Note 1) | (4,504,577) |
|
| Net realized gain on foreign currency transactions (Note 1) | 9,998 |
|
| Net unrealized appreciation of assets and liabilities | |
| in foreign currencies during the period | 12,669 |
|
| Net unrealized depreciation of investments, futures contracts, swap contracts, | |
| written options, and TBA sale commitments during the period | (99,452,370) |
|
| Net gain on investments | 72,999,230 |
|
| Net increase in net assets resulting from operations | $130,587,436 |
| |
| |
| The accompanying notes are an integral part of these financial statements. | |
81
| Statement of changes in net assets | |
|
| |
| DECREASE IN NET ASSETS | | |
|
| | Six months ended | Year ended |
| | 1/31/06* | 7/31/05 |
|
| Operations: | | |
| Net investment income | $ 57,588,206 | $ 100,672,170 |
|
| Net realized gain on investments | | |
| and foreign currency transactions | 172,438,931 | 388,377,420 |
|
| Net unrealized appreciation (depreciation) of investments | | |
| and assets and liabilities in foreign currencies | (99,439,701) | 73,207,522 |
|
| Net increase in net assets resulting from operations | 130,587,436 | 562,257,112 |
|
| Distributions to shareholders: (Note 1) | | |
|
| From net investment income | | |
|
| Class A | (55,171,726) | (63,734,158) |
|
| Class B | (10,638,291) | (11,829,280) |
|
| Class C | (966,846) | (879,740) |
|
| Class M | (2,961,141) | (3,086,878) |
|
| Class R | (11,763) | (7,354) |
|
| Class Y | (11,471,525) | (16,948,666) |
|
| From net realized short-term gain on investments | | |
|
| Class A | (4,167,381) | — |
|
| Class B | (1,042,091) | — |
|
| Class C | (95,268) | — |
|
| Class M | (264,982) | — |
|
| Class R | (993) | — |
|
| Class Y | (806,000) | — |
|
| From net realized long-term gain on investments | | |
|
| Class A | (64,866,185) | — |
|
| Class B | (16,220,380) | — |
|
| Class C | (1,482,867) | — |
|
| Class M | (4,124,504) | — |
|
| Class R | (15,451) | — |
|
| Class Y | (12,545,570) | — |
|
| Redemption fees (Note 1) | 3,160 | 18,029 |
|
| Decrease from capital share transactions (Note 4) | (387,347,140) | (694,050,829) |
|
| Total decrease in net assets | $(443,609,508) | $(228,261,764) |
| |
| (Continued on next page) | | |
82
| Statement of changes in net assets (Continued) | |
|
| |
| NET ASSETS | | |
| Beginning of period | $5,330,453,116 | $5,558,714,880 |
|
| End of period (including undistributed net investment | | |
| income of $3,228,396 and $26,861,482, respectively) | $4,886,843,608 | $5,330,453,116 |
| * Unaudited | | |
The accompanying notes are an integral part of these financial statements.
83
Financial highlights (For a common share outstanding throughout the period)
| CLASS A | | | | | | | |
|
| PER-SHARE OPERATING PERFORMANCE | | | | | |
|
| | | Six months ended** | | | Year ended | | |
| | | 1/31/06 | 7/31/05 | 7/31/04 | 7/31/03 | 7/31/02 | 7/31/01 |
|
| Net asset value, | | | | | | | |
| beginning of period | | $18.40 | $16.91 | $15.72 | $15.02 | $17.24 | $15.77 |
|
| Investment operations: | | | | | | | |
| Net investment income (a) | .22(d) | .35(d,e) | .32(d) | .37 | .45 | .52 |
|
| Net realized and unrealized | | | | | | |
| gain (loss) on investments | .27 | 1.47 | 1.20 | .81 | (2.17) | 1.49 |
|
| Total from | | | | | | | |
| investment operations | .49 | 1.82 | 1.52 | 1.18 | (1.72) | 2.01 |
|
| Less distributions: | | | | | | | |
| From net investment income | (.30) | (.33) | (.33) | (.48) | (.48) | (.53) |
|
| From net realized gain | | | | | | |
| on investments | | (.38) | — | — | — | (.02) | (.01) |
|
| Total distributions | | (.68) | (.33) | (.33) | (.48) | (.50) | (.54) |
|
| Redemption fees | | —(f ) | —(f ) | —(f ) | — | — | — |
|
| Net asset value, | | | | | | | |
| end of period | | $18.21 | $18.40 | $16.91 | $15.72 | $15.02 | $17.24 |
|
| Total return at | | | | | | | |
| net asset value (%)(b) | | 2.75* | 10.89 | 9.77 | 8.06 | (10.20) | 12.86 |
|
| |
| RATIOS AND SUPPLEMENTAL DATA | | | | | |
| Net assets, end of period | | | | | | |
| (in thousands) | | $3,288,357 | $3,458,405 | $3,322,532 | $3,784,601 | $2,990,984 | $3,176,287 |
|
| Ratio of expenses to | | | | | | | |
| average net assets (%)(c) | .48*(d) | .98(d) | 1.00(d) | .99 | .96 | .92 |
|
| Ratio of net investment income | | | | | |
| to average net assets (%) | 1.18*(d) | 1.97(d,e) | 1.90(d) | 2.50 | 2.75 | 3.11 |
|
| Portfolio turnover (%) | | 52.47*(g) | 169.29(g) | 165.66 | 121.38(h,i) | 131.89(h) | 333.46 |
* Not annualized.
** Unaudited.
(a) Per share net investment income has been determined on the basis of the weighted average number of shares outstanding during the period.
(b) Total return assumes dividend reinvestment and does not reflect the effect of sales charges.
(c) Includes amounts paid through brokerage service and expense offset arrangements (Note 2).
(d) Reflects waivers of certain fund expenses in connection with investments in Putnam Prime Money Market Fund during the period. As a result of such waivers, the expenses of the fund for the periods ended January 31, 2006, July 31, 2005 and July 31, 2004 reflect a reduction of less than 0.01%, 0.01% and less than 0.01%, respectively, of the average net assets of class A shares (Note 5).
(e) Reflects a non-recurring accrual related to Putnam Management’s settlement with the SEC regarding brokerage allocation practices, which amounted to less than $0.01 per share and 0.02% of average net assets for class A shares (Note 6).
(f) Amount represents less than $0.01 per share.
(g) Portfolio turnover excludes dollar roll transactions.
(h) Portfolio turnover excludes certain treasury note transactions executed in connection with a short-term trading strategy.
(i) Portfolio turnover excludes the impact of assets received from the acquisition of Putnam Balanced Fund and Putnam Balanced Retirement Fund.
84 The accompanying notes are an integral part of these financial statements.
Financial highlights (For a common share outstanding throughout the period)
| CLASS B | | | | | | |
|
| PER-SHARE OPERATING PERFORMANCE | | | | |
|
| | Six months ended** | | | Year ended | | |
| | 1/31/06 | 7/31/05 | 7/31/04 | 7/31/03 | 7/31/02 | 7/31/01 |
|
| Net asset value, | | | | | | |
| beginning of period | $18.22 | $16.73 | $15.56 | $14.87 | $17.07 | $15.62 |
|
| Investment operations: | | | | | | |
| Net investment income (a) | .15(d) | .21(d,e) | .19(d) | .26 | .33 | .39 |
|
| Net realized and unrealized | | | | | | |
| gain (loss) on investments | .26 | 1.48 | 1.19 | .80 | (2.15) | 1.48 |
|
| Total from | | | | | | |
| investment operations | .41 | 1.69 | 1.38 | 1.06 | (1.82) | 1.87 |
|
| Less distributions: | | | | | | |
| From net investment income | (.23) | (.20) | (.21) | (.37) | (.36) | (.41) |
|
| From net realized gain | | | | | | |
| on investments | (.38) | — | — | — | (.02) | (.01) |
|
| Total distributions | (.61) | (.20) | (.21) | (.37) | (.38) | (.42) |
|
| Redemption fees | —(f ) | —(f ) | —(f ) | — | — | — |
|
| Net asset value, | | | | | | |
| end of period | $18.02 | $18.22 | $16.73 | $15.56 | $14.87 | $17.07 |
|
| Total return at | | | | | | |
| net asset value (%)(b) | 2.31* | 10.17 | 8.88 | 7.25 | (10.86) | 12.02 |
|
| |
| RATIOS AND SUPPLEMENTAL DATA | | | | | |
|
| Net assets, end of period | | | | | | |
| (in thousands) | $786,165 | $917,951 | $1,095,665 | $1,308,605 | $1,068,667 | $1,199,676 |
|
| Ratio of expenses to | | | | | | |
| average net assets (%)(c) | .85*(d) | 1.73(d) | 1.75(d) | 1.74 | 1.71 | 1.67 |
|
| Ratio of net investment income | | | | | |
| to average net assets (%) | .81*(d) | 1.22(d,e) | 1.16(d) | 1.75 | 2.00 | 2.36 |
|
| Portfolio turnover (%) | 52.47*(g) | 169.29(g) | 165.66 | 121.38(h,i) | 131.89(h) | 333.46 |
* Not annualized.
** Unaudited.
(a) Per share net investment income has been determined on the basis of the weighted average number of shares outstanding during the period.
(b) Total return assumes dividend reinvestment and does not reflect the effect of sales charges.
(c) Includes amounts paid through brokerage service and expense offset arrangements (Note 2).
(d) Reflects waivers of certain fund expenses in connection with investments in Putnam Prime Money Market Fund during the period. As a result of such waivers, the expenses of the fund for the periods ended January 31, 2006, July 31, 2005 and July 31, 2004 reflect a reduction of less than 0.01%, 0.01% and less than 0.01%, respectively, of the average net assets of class B shares (Note 5).
(e) Reflects a non-recurring accrual related to Putnam Management’s settlement with the SEC regarding brokerage allocation practices, which amounted to less than $0.01 per share and 0.02% of average net assets for class B shares (Note 6).
(f) Amount represents less than $0.01 per share.
(g) Portfolio turnover excludes dollar roll transactions.
(h) Portfolio turnover excludes certain treasury note transactions executed in connection with a short-term trading strategy.
(i) Portfolio turnover excludes the impact of assets received from the acquisition of Putnam Balanced Fund and Putnam Balanced Retirement Fund.
The accompanying notes are an integral part of these financial statements.
85
Financial highlights (For a common share outstanding throughout the period)
| CLASS C | | | | | | |
|
| PER-SHARE OPERATING PERFORMANCE | | | | |
|
| | Six months ended** | | | Year ended | | |
| | 1/31/06 | 7/31/05 | 7/31/04 | 7/31/03 | 7/31/02 | 7/31/01 |
|
| Net asset value, | | | | | | |
| beginning of period | $18.30 | $16.81 | $15.63 | $14.94 | $17.16 | $15.71 |
|
| Investment operations: | | | | | | |
| Net investment income (a) | .15(d) | .21(d,e) | .19(d) | .26 | .33 | .39 |
|
| Net realized and unrealized | | | | | | |
| gain (loss) on investments | .26 | 1.48 | 1.20 | .80 | (2.16) | 1.49 |
|
| Total from | | | | | | |
| investment operations | .41 | 1.69 | 1.39 | 1.06 | (1.83) | 1.88 |
|
| Less distributions: | | | | | | |
| From net investment income | (.23) | (.20) | (.21) | (.37) | (.37) | (.42) |
|
| From net realized gain | | | | | | |
| on investments | (.38) | — | — | — | (.02) | (.01) |
|
| Total distributions | (.61) | (.20) | (.21) | (.37) | (.39) | (.43) |
|
| Redemption fees | —(f ) | —(f ) | —(f ) | — | — | — |
|
| Net asset value, | | | | | | |
| end of period | $18.10 | $18.30 | $16.81 | $15.63 | $14.94 | $17.16 |
|
| Total return at | | | | | | |
| net asset value (%)(b) | 2.33* | 10.14 | 8.92 | 7.25 | (10.88) | 12.02 |
|
| |
| RATIOS AND SUPPLEMENTAL DATA | | | | | |
| Net assets, end of period | | | | | | |
| (in thousands) | $75,515 | $77,024 | $75,185 | $91,282 | $53,186 | $37,453 |
|
| Ratio of expenses to | | | | | | |
| average net assets (%)(c) | .85*(d) | 1.73(d) | 1.75(d) | 1.74 | 1.71 | 1.67 |
|
| Ratio of net investment income | | | | | |
| to average net assets (%) | .80*(d) | 1.22(d,e) | 1.16(d) | 1.73 | 1.99 | 2.32 |
|
| Portfolio turnover (%) | 52.47*(g) | 169.29(g) | 165.66 | 121.38(h,i) | 131.89(h) | 333.46 |
* Not annualized.
** Unaudited.
(a) Per share net investment income has been determined on the basis of the weighted average number of shares outstanding during the period.
(b) Total return assumes dividend reinvestment and does not reflect the effect of sales charges.
(c) Includes amounts paid through brokerage service and expense offset arrangements (Note 2).
(d) Reflects waivers of certain fund expenses in connection with investments in Putnam Prime Money Market Fund during the period. As a result of such waivers, the expenses of the fund for the periods ended January 31, 2006, July 31, 2005 and July 31, 2004 reflect a reduction of less than 0.01%, 0.01% and less than 0.01%, respectively, of the average net assets of class C shares (Note 5).
(e) Reflects a non-recurring accrual related to Putnam Management’s settlement with the SEC regarding brokerage allocation practices, which amounted to less than $0.01 per share and 0.02% of average net assets for class C shares (Note 6).
(f) Amount represents less than $0.01 per share.
(g) Portfolio turnover excludes dollar roll transactions.
(h) Portfolio turnover excludes certain treasury note transactions executed in connection with a short-term trading strategy.
(i) Portfolio turnover excludes the impact of assets received from the acquisition of Putnam Balanced Fund and Putnam Balanced Retirement Fund.
The accompanying notes are an integral part of these financial statements.
86
Financial highlights (For a common share outstanding throughout the period)
| CLASS M | | | | | | |
|
| PER-SHARE OPERATING PERFORMANCE | | | | |
|
| | Six months ended** | | | Year ended | | |
| | 1/31/06 | 7/31/05 | 7/31/04 | 7/31/03 | 7/31/02 | 7/31/01 |
|
| Net asset value, | | | | | | |
| beginning of period | $18.22 | $16.74 | $15.57 | $14.87 | $17.08 | $15.63 |
|
| Investment operations: | | | | | | |
| Net investment income (a) | .17(d) | .26(d,e) | .23(d) | .30 | .37 | .43 |
|
| Net realized and unrealized | | | | | | |
| gain (loss) on investments | .28 | 1.47 | 1.19 | .80 | (2.16) | 1.48 |
|
| Total from | | | | | | |
| investment operations | .45 | 1.73 | 1.42 | 1.10 | (1.79) | 1.91 |
|
| Less distributions: | | | | | | |
| From net investment income (.26) | (.25) | (.25) | (.40) | (.40) | (.45) |
|
| From net realized gain | | | | | | |
| on investments | (.38) | — | — | — | (.02) | (.01) |
|
| Total distributions | (.64) | (.25) | (.25) | (.40) | (.42) | (.46) |
|
| Redemption fees | —(f ) | —(f ) | —(f ) | — | — | — |
|
| Net asset value, | | | | | | |
| end of period | $18.03 | $18.22 | $16.74 | $15.57 | $14.87 | $17.08 |
|
| Total return at | | | | | | |
| net asset value (%)(b) | 2.52* | 10.39 | 9.18 | 7.58 | (10.69) | 12.31 |
|
| |
| RATIOS AND SUPPLEMENTAL DATA | | | | | |
| Net assets, end of period | | | | | | |
| (in thousands) | $205,332 | $215,816 | $217,046 | $239,662 | $222,176 | $252,802 |
|
| Ratio of expenses to | | | | | | |
| average net assets (%)(c) | .73*(d) | 1.48(d) | 1.50(d) | 1.49 | 1.46 | 1.42 |
|
| Ratio of net investment income | | | | | |
| to average net assets (%) | .93*(d) | 1.47(d,e) | 1.40(d) | 2.02 | 2.25 | 2.60 |
|
| Portfolio turnover (%) | 52.47*(g) | 169.29(g) | 165.66 | 121.38(h,i) | 131.89(h) | 333.46 |
* Not annualized.
** Unaudited.
(a) Per share net investment income has been determined on the basis of the weighted average number of shares outstanding during the period.
(b) Total return assumes dividend reinvestment and does not reflect the effect of sales charges.
(c) Includes amounts paid through brokerage service and expense offset arrangements (Note 2).
(d) Reflects waivers of certain fund expenses in connection with investments in Putnam Prime Money Market Fund during the period. As a result of such waivers, the expenses of the fund for the periods ended January 31, 2006, July 31, 2005 and July 31, 2004 reflect a reduction of less than 0.01%, 0.01% and less than 0.01%, respectively, of the average net assets of class M shares (Note 5).
(e) Reflects a non-recurring accrual related to Putnam Management’s settlement with the SEC regarding brokerage allocation practices, which amounted to less than $0.01 per share and 0.02% of average net assets for class M shares (Note 6).
(f) Amount represents less than $0.01 per share.
(g) Portfolio turnover excludes dollar roll transactions.
(h) Portfolio turnover excludes certain treasury note transactions executed in connection with a short-term trading strategy.
(i) Portfolio turnover excludes the impact of assets received from the acquisition of Putnam Balanced Fund and Putnam Balanced Retirement Fund.
The accompanying notes are an integral part of these financial statements.
Financial highlights (For a common share outstanding throughout the period)
| CLASS R | | | | |
|
| PER-SHARE OPERATING PERFORMANCE | | | | |
|
| | | | | Period |
| | Six months ended** | Year ended | 1/21/03†- |
| | 1/31/06 | 7/31/05 | 7/31/04 | 7/31/03 |
|
| Net asset value, | | | | |
| beginning of period | $18.36 | $16.89 | $15.70 | $15.05 |
|
| Investment operations: | | | | |
| Net investment income (a) | .19(d) | .30(d,e) | .21(d) | .17 |
|
| Net realized and unrealized | | | | |
| gain on investments | .28 | 1.48 | 1.29 | .65 |
|
| Total from investment operations | .47 | 1.78 | 1.50 | .82 |
|
| Less distributions: | | | | |
|
| From net investment income | (.28) | (.31) | (.31) | (.17) |
|
| From net realized gain on investments | (.38) | — | — | — |
|
| Total distributions | (.66) | (.31) | (.31) | (.17) |
|
| Redemption fees | —(f ) | —(f ) | —(f ) | — |
|
| Net asset value, end of period | $18.17 | $18.36 | $16.89 | $15.70 |
|
| Total return at | | | | |
| net asset value (%)(b) | 2.63* | 10.63 | 9.60 | 5.52* |
|
| |
| RATIOS AND SUPPLEMENTAL DATA | | | | |
| Net assets, end of period | | | | |
| (in thousands) | $923 | $726 | $127 | $1 |
|
| Ratio of expenses to | | | | |
| average net assets (%)(c) | .60*(d) | 1.23(d) | 1.25(d) | .65* |
|
| Ratio of net investment income | | | | |
| to average net assets (%) | 1.03*(d) | 1.67(d,e) | 1.33(d) | 1.18* |
|
| Portfolio turnover (%) | 52.47*(g) | 169.29(g) | 165.66 | 121.38(h,i) |
† Commencement of operations.
|
* Not annualized.** Unaudited.
(a) Per share net investment income has been determined on the basis of the weighted average number of shares outstanding during the period.
(b) Total return assumes dividend reinvestment and does not reflect the effect of sales charges.
(c) Includes amounts paid through brokerage service and expense offset arrangements (Note 2).
(d) Reflects waivers of certain fund expenses in connection with investments in Putnam Prime Money Market Fund during the period. As a result of such waivers, the expenses of the fund for the periods ended January 31, 2006, July 31, 2005 and July 31, 2004 reflect a reduction of less than 0.01%, 0.01% and less than 0.01%, respectively, of the average net assets of class R shares (Note 5).
(e) Reflects a non-recurring accrual related to Putnam Management’s settlement with the SEC regarding brokerage allocation practices, which amounted to less than $0.01 per share and 0.02% of average net assets for class R shares (Note 6).
(f) Amount represents less than $0.01 per share.
(g) Portfolio turnover excludes dollar roll transactions.
(h) Portfolio turnover excludes certain treasury note transactions executed in connection with a short-term trading strategy.
(i) Portfolio turnover excludes the impact of assets received from the acquisition of Putnam Balanced Fund and Putnam Balanced Retirement Fund.
88 The accompanying notes are an integral part of these financial statements.
Financial highlights (For a common share outstanding throughout the period)
| CLASS Y | | | | | | |
|
| PER-SHARE OPERATING PERFORMANCE | | | | |
|
| | Six months ended** | | | Year ended | | |
| | 1/31/06 | 7/31/05 | 7/31/04 | 7/31/03 | 7/31/02 | 7/31/01 |
|
| Net asset value, | | | | | | |
| beginning of period | $18.46 | $16.95 | $15.76 | $15.05 | $17.28 | $15.80 |
|
| Investment operations: | | | | | | |
| Net investment income (a) | .24(d) | .40(d,e) | .36(d) | .41 | .49 | .56 |
|
| Net realized and unrealized | | | | | | |
| gain (loss) on investments | .27 | 1.49 | 1.21 | .82 | (2.17) | 1.50 |
|
| Total from | | | | | | |
| investment operations | .51 | 1.89 | 1.57 | 1.23 | (1.68) | 2.06 |
|
| Less distributions: | | | | | | |
| From net investment income (.33) | (.38) | (.38) | (.52) | (.53) | (.57) |
|
| From net realized gain | | | | | | |
| on investments | (.38) | — | — | — | (.02) | (.01) |
|
| Total distributions | (.71) | (.38) | (.38) | (.52) | (.55) | (.58) |
|
| Redemption fees | —(f ) | —(f ) | —(f ) | — | — | — |
|
| Net asset value, | | | | | | |
| end of period | $18.26 | $18.46 | $16.95 | $15.76 | $15.05 | $17.28 |
|
| Total return at | | | | | | |
| net asset value (%)(b) | 2.82* | 11.26 | 10.03 | 8.38 | (10.01) | 13.18 |
|
| |
| RATIOS AND SUPPLEMENTAL DATA | | | | | |
| Net assets, end of period | | | | | | |
| (in thousands) | $530,553 | $660,532 | $848,161 | $880,435 | $731,900 | $768,075 |
|
| Ratio of expenses to | | | | | | |
| average net assets (%)(c) | .35*(d) | .73(d) | .75(d) | .74 | .71 | .67 |
|
| Ratio of net investment income | | | | | |
| to average net assets (%) | 1.33*(d) | 2.23(d,e) | 2.16(d) | 2.76 | 3.00 | 3.35 |
|
| Portfolio turnover (%) | 52.47*(g) | 169.29(g) | 165.66 | 121.38(h,i) | 131.89(h) | 333.46 |
* Not annualized.
** Unaudited.
(a) Per share net investment income has been determined on the basis of the weighted average number of shares outstanding during the period.
(b) Total return assumes dividend reinvestment and does not reflect the effect of sales charges.
(c) Includes amounts paid through brokerage service and expense offset arrangements (Note 2).
(d) Reflects waivers of certain fund expenses in connection with investments in Putnam Prime Money Market Fund during the period. As a result of such waivers, the expenses of the fund for the periods ended January 31, 2006, July 31, 2005 and July 31, 2004 reflect a reduction of less than 0.01%, 0.01% and less than 0.01%, respectively, of the average net assets of class Y shares (Note 5).
(e) Reflects a non-recurring accrual related to Putnam Management’s settlement with the SEC regarding brokerage allocation practices, which amounted to less than $0.01 per share and 0.02% of average net assets for class Y shares (Note 6).
(f) Amount represents less than $0.01 per share.
(g) Portfolio turnover excludes dollar roll transactions.
(h) Portfolio turnover excludes certain treasury note transactions executed in connection with a short-term trading strategy.
(i) Portfolio turnover excludes the impact of assets received from the acquisition of Putnam Balanced Fund and Putnam Balanced Retirement Fund.
The accompanying notes are an integral part of these financial statements.
Notes to financial statements 1/31/06 (Unaudited)
Note 1: Significant accounting policies
The George Putnam Fund of Boston (the “fund”), a Massachusetts business trust, is registered under the Investment Company Act of 1940, as amended, as a diversified, open-end management investment company. The fund seeks to provide a balanced investment comprised of a well-diversi-fied portfolio of stocks and bonds, that will produce both capital growth and current income.
The fund offers class A, class B, class C, class M, class R and class Y shares. Class A and class M shares are sold with a maximum front-end sales charge of 5.25% and 3.25%, respectively, and generally do not pay a contingent deferred sales charge. Class B shares, which convert to class A shares after approximately eight years, do not pay a front-end sales charge and are subject to a contingent deferred sales charge, if those shares are redeemed within six years of purchase. Class C shares have a one-year 1.00% contingent deferred sales charge and do not convert to class A shares. Class R shares, which are offered to qualified employee-benefit plans are sold without a front-end sales charge or a contingent deferred sales charge. The expenses for class A, class B, class C, class M and class R shares may differ based on the distribution fee of each class, which is identified in Note 2. Class Y shares, which are sold at net asset value, are generally subject to the same expenses as class A, class B, class C, class M and class R shares, but do not bear a distribution fee. Class Y shares are sold to certain eligible purchasers including certain defined contribution plans (including corporate IRAs), bank trust departments, trust companies and certain college savings plans.
A 2.00% redemption fee may apply to any shares that are redeemed (either by selling or exchanging into another fund) within 5 days of purchase. The redemption fee is accounted for as an addition to paid-in-capital.
Investment income, realized and unrealized gains and losses and expenses of the fund are borne pro-rata based on the relative net assets of each class to the total net assets of the fund, except that each class bears expenses unique to that class (including the distribution fees applicable to such classes). Each class votes as a class only with respect to its own distribution plan or other matters on which a class vote is required by law or determined by the Trustees. Shares of each class would receive their pro-rata share of the net assets of the fund, if the fund were liquidated. In addition, the Trustees declare separate dividends on each class of shares.
In the normal course of business, the fund enters into contracts that may include agreements to indemnify another party under given circumstances. The fund’s maximum exposure under these arrangements is unknown as this would involve future claims that may be, but have not yet been, made against the fund. However, the fund expects the risk of material loss to be remote.
The following is a summary of significant accounting policies consistently followed by the fund in the preparation of its financial statements. The preparation of financial statements is in conformity with accounting principles generally accepted in the United States of America and requires management to make estimates and assumptions that affect the reported amounts of assets and liabilities in the financial statements and the reported amounts of increases and decreases in net assets from operations during the reporting period. Actual results could differ from those estimates.
A) Security valuation Investments for which market quotations are readily available are valued at the last reported sales price on their principal exchange, or official closing price for certain markets. If no sales are reported — as in the case of some securities traded over-the-counter — a security is valued at its last reported bid price. Market quotations are not considered to be readily available for certain debt obligations; such investments are valued on the basis of valuations furnished by an independent pricing service approved by the Trustees or dealers selected by Putnam Investment Management, LLC (“Putnam Management”), the fund’s manager, an indirect wholly-owned subsidiary of Putnam, LLC. Such services or dealers determine valuations for normal institutional-size trading units of such
90
securities using methods based on market transactions for comparable securities and various relationships, generally recognized by institutional traders, between securities. Many securities markets and exchanges outside the U.S. close prior to the close of the New York Stock Exchange and therefore the closing prices for securities in such markets or on such exchanges may not fully reflect events that occur after such close but before the close of the New York Stock Exchange. Accordingly, on certain days, the fund will fair value foreign equity securities taking into account multiple factors, including movements in the U.S. securities markets. The number of days on which fair value prices will be used will depend on market activity and it is possible that fair value prices will be used by the fund to a significant extent. Securities quoted in foreign currencies, if any, are translated into U.S. dollars at the current exchange rate. Other investments, including certain restricted securities, are valued at fair value following procedures approved by the Trustees. Such valuations and procedures are reviewed periodically by the Trustees.
B) Joint trading account Pursuant to an exemptive order from the Securities and Exchange Commission, the fund may transfer uninvested cash balances, including cash collateral received under security lending arrangements, into a joint trading account along with the cash of other registered investment companies and certain other accounts managed by Putnam Management. These balances may be invested in issues of high-grade short-term investments having maturities of up to 397 days for collateral received under security lending arrangements and up to 90 days for other cash investments.
C) Repurchase agreements The fund, or any joint trading account, through its custodian, receives delivery of the underlying securities, the market value of which at the time of purchase is required to be in an amount at least equal to the resale price, including accrued interest. Collateral for certain tri-party repurchase agreements is held at the counterparty’s custodian in a segregated account for the benefit of the fund and the counterparty. Putnam Management is responsible for determining that the value of these underlying securities is at all times at least equal to the resale price, including accrued interest.
D) Security transactions and related investment income Security transactions are recorded on the trade date (the date the order to buy or sell is executed). Gains or losses on securities sold are determined on the identified cost basis.
Interest income is recorded on the accrual basis. Dividend income, net of applicable withholding taxes, is recognized on the ex-dividend date except that certain dividends from foreign securities, if any, are recognized as soon as the fund is informed of the ex-dividend date. Non-cash dividends, if any, are recorded at the fair market value of the securities received. All premiums/discounts are amortized/accreted on a yield-to-maturity basis.
Securities purchased or sold on forward commitment or delayed delivery basis may be settled a month or more after the trade date; interest income is accrued based on the terms of the securities. Losses may arise due to changes in the market value of the underlying securities or if the counterparty does not perform under the contract.
E) Stripped mortgage-backed securities The fund may invest in stripped mortgage-backed securities which represent a participation in mortgage loans and may be structured in classes with rights to receive different portions of the interest and principal. Interest-only securities receive all of the interest and principal-only securities receive all of the principal. If the interest-only securities experience greater than anticipated prepayments of principal, the fund may fail to recoup fully its initial investment in these securities. Conversely, principal-only securities increase in value if prepayments are greater than anticipated and decline if prepayments are slower than anticipated. The market value of these securities is highly sensitive to changes in interest rates.
F) Foreign currency translation The accounting records of the fund are maintained in U.S. dollars. The market value of foreign securities, currency holdings, and other assets and liabilities are recorded in the books and records of the fund
91
after translation to U.S. dollars based on the exchange rates on that day. The cost of each security is determined using historical exchange rates. Income and withholding taxes are translated at prevailing exchange rates when earned or incurred. The fund does not isolate that portion of realized or unrealized gains or losses resulting from changes in the foreign exchange rate on investments from fluctuations arising from changes in the market prices of the securities. Such gains and losses are included with the net realized and unrealized gain or loss on investments. Net realized gains and losses on foreign currency transactions represent net realized exchange gains or losses on closed forward currency contracts, disposition of foreign currencies, currency gains and losses realized between the trade and settlement dates on securities transactions and the difference between the amount of investment income and foreign withholding taxes recorded on the fund’s books and the U.S. dollar equivalent amounts actually received or paid. Net unrealized appreciation and depreciation of assets and liabilities in foreign currencies arise from changes in the value of open forward currency contracts and assets and liabilities other than investments at the period end, resulting from changes in the exchange rate. Investments in foreign securities involve certain risks, including those related to economic instability, unfavorable political developments, and currency fluctuations, not present with domestic investments.
G) Forward currency contracts The fund may buy and sell forward currency contracts, which are agreements between two parties to buy and sell currencies at a set price on a future date. These contracts are used to protect against a decline in value relative to the U.S. dollar of the currencies in which its portfolio securities are denominated or quoted (or an increase in the value of a currency in which securities a fund intends to buy are denominated, when a fund holds cash reserves and short term investments), or for other investment purposes. The U.S. dollar value of forward currency contracts is determined using current forward currency exchange rates supplied by a quotation service. The market value of the contract will fluctuate with changes in currency exchange rates. The contract is marked to market daily and the change in market value is recorded as an unrealized gain or loss. When the contract is closed, the fund records a realized gain or loss equal to the difference between the value of the contract at the time it was opened and the value at the time it was closed. The fund could be exposed to risk if the value of the currency changes unfavorably, if the counterparties to the contracts are unable to meet the terms of their contracts or if the fund is unable to enter into a closing position. Risks may exceed amounts recognized on the statement of assets and liabilities. Forward currency contracts outstanding at period end, if any, are listed after the fund’s portfolio.
H) Futures and options contracts The fund may use futures and options contracts to hedge against changes in the values of securities the fund owns or expects to purchase, or for other investment purposes. The fund may also write options on swaps or securities it owns or in which it may invest to increase its current returns.
The potential risk to the fund is that the change in value of futures and options contracts may not correspond to the change in value of the hedged instruments. In addition, losses may arise from changes in the value of the underlying instruments, if there is an illiquid secondary market for the contracts, or if the counterparty to the contract is unable to perform. Risks may exceed amounts recognized on the statement of assets and liabilities. When the contract is closed, the fund records a realized gain or loss equal to the difference between the value of the contract at the time it was opened and the value at the time it was closed. Realized gains and losses on purchased options are included in realized gains and losses on investment securities. If a written call option is exercised, the premium originally received is recorded as an addition to sales proceeds. If a written put option is exercised, the premium originally received is recorded as a reduction to the cost of investments.
Futures contracts are valued at the quoted daily settlement prices established by the exchange on
92
which they trade. The fund and the broker agree to exchange an amount of cash equal to the daily fluctuation in the value of the futures contract. Such receipts or payments are known as “variation margin.” Exchange traded options are valued at the last sale price, or if no sales are reported, the last bid price for purchased options and the last ask price for written options. Options traded over-the-counter are valued using prices supplied by dealers. Futures and written option contracts outstanding at period end, if any, are listed after the fund’s portfolio.
I) Total return swap contracts The fund may enter into total return swap contracts, which are arrangements to exchange a market linked return for a periodic payment, both based on a notional principal amount. To the extent that the total return of the security, index or other financial measure underlying the transaction exceeds or falls short of the offsetting interest rate obligation, the fund will receive a payment from or make a payment to the counterparty. Total return swap contracts are marked to market daily based upon quotations from market makers and the change, if any, is recorded as unrealized gain or loss. Payments received or made are recorded as realized gains or loss. The fund could be exposed to credit or market risk due to unfavorable changes in the fluctuation of interest rates or in the price of the underlying security or index, the possibility that there is no liquid market for these agreements or that the counterparty may default on its obligation to perform. Risk of loss may exceed amounts recognized on the statement of assets and liabilities. Total return swap contracts outstanding at period end, if any, are listed after the fund’s portfolio.
J) Interest rate swap contracts The fund may enter into interest rate swap contracts, which are arrangements between two parties to exchange cash flows based on a notional principal amount, to manage the fund’s exposure to interest rates. Interest rate swap contracts are marked to market daily based upon quotations from an independent pricing service or market makers and the change, if any, is recorded as unrealized gain or loss. Payments received or made are recorded as realized gains or loss. The fund could be exposed to credit or market risk due to unfavorable changes in the fluctuation of interest rates or if the counterparty defaults on its obligation to perform. Risk of loss may exceed amounts recognized on the statement of assets and liabilities. Interest rate swap contracts outstanding at period end, if any, are listed after the fund’s portfolio.
K) Credit default contracts The fund may enter into credit default contracts where one party, the protection buyer, makes an upfront or periodic payment to a counter party, the protection seller, in exchange for the right to receive a contingent payment. The maximum amount of the payment may equal the notional amount, at par, of the underlying index or security as a result of a related credit event. An upfront payment received by the fund, as the protection seller, is recorded as a liability on the fund’s books. An upfront payment made by the fund, as the protection buyer, is recorded as an asset on the fund’s books. Periodic payments received or paid by the fund are recorded as realized gains or losses. The credit default contracts are marked to market daily based upon quotations from an independent pricing service or market makers and the change, if any, is recorded as unrealized gain or loss. Payments received or made as a result of a credit event or termination of the contract are recognized, net of a proportional amount of the upfront payment, as realized gains or losses. In addition to bearing the risk that the credit event will occur, the fund could be exposed to market risk due to unfavorable changes in interest rates or in the price of the underlying security or index, the possibility that the fund may be unable to close out its position at the same time or at the same price as if it had purchased comparable publicly traded securities or that the counterparty may default on its obligation to perform. Risks of loss may exceed amounts recognized on the statement of assets and liabilities. Credit default contracts outstanding at period end, if any, are listed after the fund’s portfolio.
L) TBA purchase commitments The fund may enter into “TBA” (to be announced) commitments to purchase securities for a fixed unit price at a
93
future date beyond customary settlement time. Although the unit price has been established, the principal value has not been finalized. However, the amount of the commitments will not significantly differ from the principal amount. The fund holds, and maintains until settlement date, cash or high-grade debt obligations in an amount sufficient to meet the purchase price, or the fund may enter into offsetting contracts for the forward sale of other securities it owns. Income on the securities will not be earned until settlement date. TBA purchase commitments may be considered securities themselves, and involve a risk of loss if the value of the security to be purchased declines prior to the settlement date, which risk is in addition to the risk of decline in the value of the fund’s other assets. Unsettled TBA purchase commitments are valued at fair value of the underlying securities, according to the procedures described under “Security valuation” above. The contract is “marked-to-market” daily and the change in market value is recorded by the fund as an unrealized gain or loss.
Although the fund will generally enter into TBA purchase commitments with the intention of acquiring securities for its portfolio or for delivery pursuant to options contracts it has entered into, the fund may dispose of a commitment prior to settlement if Putnam Management deems it appropriate to do so.
M) TBA sale commitments The fund may enter into TBA sale commitments to hedge its portfolio positions or to sell mortgage-backed securities it owns under delayed delivery arrangements. Proceeds of TBA sale commitments are not received until the contractual settlement date. During the time a TBA sale commitment is outstanding, equivalent deliverable securities or an offsetting TBA purchase commitment deliverable on or before the sale commitment date, are held as “cover” for the transaction.
Unsettled TBA sale commitments are valued at fair value of the underlying securities, generally according to the procedures described under “Security valuation” above. The contract is “marked-to-market” daily and the change in market value is recorded by the fund as an unrealized gain or loss. If the TBA sale commitment is closed through the acquisition of an offsetting purchase commitment, the fund realizes a gain or loss. If the fund delivers securities under the commitment, the fund realizes a gain or a loss from the sale of the securities based upon the unit price established at the date the commitment was entered into. TBA sale commitments outstanding at period end, if any, are listed after the fund’s portfolio.
N) Dollar rolls To enhance returns, the fund may enter into dollar rolls (principally using TBAs) in which the fund sells securities for delivery in the current month and simultaneously contracts to purchase similar securities on a specified future date. During the period between the sale and subsequent purchase, the fund will not be entitled to receive income and principal payments on the securities sold. The fund will, however, retain the difference between the initial sales price and the forward price for the future purchase. The fund will also be able to earn interest on the cash proceeds that are received from the initial sale. The fund may be exposed to market or credit risk if the price of the security changes unfavorably or the counterparty fails to perform under the terms of the agreement.
O) Security lending The fund may lend securities, through its agents, to qualified borrowers in order to earn additional income. The loans are collateralized by cash and/or securities in an amount at least equal to the market value of the securities loaned. The market value of securities loaned is determined daily and any additional required collateral is allocated to the fund on the next business day. The risk of borrower default will be borne by the fund’s agents; the fund will bear the risk of loss with respect to the investment of the cash collateral. Income from securities lending is included in investment income on the statement of operations. At January 31, 2006, the value of securities loaned amounted to $206,262,187. The fund received cash collateral of $212,749,540 which is pooled with collateral of other Putnam funds into 22 issues of high grade short-term investments.
P) Federal taxes It is the policy of the fund to distribute all of its taxable income within the
94
prescribed time and otherwise comply with the provisions of the Internal Revenue Code of 1986 (the “Code”) applicable to regulated investment companies. It is also the intention of the fund to distribute an amount sufficient to avoid imposition of any excise tax under Section 4982 of the Code, as amended. Therefore, no provision has been made for federal taxes on income, capital gains or unrealized appreciation on securities held nor for excise tax on income and capital gains.
At July 31, 2005, the fund had a capital loss carryover of $35,701,820 available to the extent allowed by the Code to offset future net capital gain, if any. The amount of the carryover and the expiration dates are:
| Loss Carryover | Expiration |
| $29,751,500 | July 31, 2010 |
|
| 5,950,320 | July 31, 2011 |
|
The aggregate identified cost on a tax basis is $4,982,667,191, resulting in gross unrealized appreciation and depreciation of $630,016,031 and $104,251,208, respectively, or net unrealized appreciation of $525,764,823.
Q) Distributions to shareholders Distributions to shareholders from net investment income are recorded by the fund on the ex-dividend date. Distributions from capital gains, if any, are recorded on the ex-dividend date and paid at least annually. The amount and character of income and gains to be distributed are determined in accordance with income tax regulations, which may differ from generally accepted accounting principles. Dividend sources are estimated at the time of declaration. Actual results may vary. Any non-taxable return of capital cannot be determined until final tax calculations are completed after the end of the fund’s fiscal year. Reclassifications are made to the fund’s capital accounts to reflect income and gains available for distribution (or available capital loss carryovers) under income tax regulations.
Note 2: Management fee, administrative services and other transactions
Putnam Management is paid for management and investment advisory services quarterly based on the average net assets of the fund. Such fee is based on the following annual rates: 0.65% of the first $500 million of average net assets, 0.55% of the next $500 million, 0.50% of the next $500 million, 0.45% of the next $5 billion, 0.425% of the next $5 billion, 0.405% of the next $5 billion, 0.39% of the next $5 billion and 0.38% thereafter.
Putnam Management has agreed to waive fees and reimburse expenses of the fund through July 31, 2006 to the extent necessary to ensure that the fund’s expenses do not exceed the simple average of the expenses of all front-end load funds viewed by Lipper Inc. as having the same investment classi-fication or objective as the fund. The expense reimbursement is based on a comparison of the fund’s expenses with the average annualized operating expenses of the funds in its Lipper peer group for each calendar quarter during the fund’s last fiscal year, excluding 12b-1 fees and without giving effect to any expense offset and brokerage service arrangements that may reduce fund expenses. For the period ended January 31, 2006, Putnam Management did not waive any of its management fee from the fund.
For the period ended January 31, 2006, Putnam Management has assumed $45,470 of legal, shareholder servicing and communication, audit and Trustee fees incurred by the fund in connection with certain legal and regulatory matters (including those described in Note 6).
The fund reimburses Putnam Management an allocated amount for the compensation and related expenses of certain officers of the fund and their staff who provide administrative services to the fund. The aggregate amount of all such reimbursements is determined annually by the Trustees.
Custodial functions for the fund’s assets are provided by Putnam Fiduciary Trust Company (“PFTC”), a subsidiary of Putnam, LLC. PFTC
95
receives fees for custody services based on the fund’s asset level, the number of its security holdings and transaction volumes. Putnam Investor Services, a division of PFTC, provides investor servicing agent functions to the fund. Putnam Investor Services receives fees for investor servicing based on the number of shareholder accounts in the fund and the level of defined contribution plan assets in the fund. During the period ended January 31, 2006, the fund incurred $4,964,272 for these services.
The fund has entered into an arrangement with PFTC whereby credits realized as a result of uninvested cash balances are used to reduce a portion of the fund’s expenses. The fund also reduced expenses through brokerage service arrangements. For the six months ended January 31, 2006, the fund’s expenses were reduced by $842,352 under these arrangements.
Each independent Trustee of the fund receives an annual Trustee fee, of which $1,156, as a quarterly retainer, has been allocated to the fund, and an additional fee for each Trustees meeting attended. Trustees receive additional fees for attendance at certain committee meetings, industry seminars and for certain compliance-related matters. Trustees also are reimbursed for expenses they incur relating to their services as Trustees. George Putnam, III, who is not an independent Trustee, also receives the foregoing fees for his services as Trustee.
The fund has adopted a Trustee Fee Deferral Plan (the “Deferral Plan”) which allows the Trustees to defer the receipt of all or a portion of Trustees fees payable on or after July 1, 1995. The deferred fees remain invested in certain Putnam funds until distribution in accordance with the Deferral Plan.
The fund has adopted an unfunded noncontributory defined benefit pension plan (the “Pension Plan”) covering all Trustees of the fund who have served as a Trustee for at least five years and were first elected prior to 2004. Benefits under the Pension Plan are equal to 50% of the Trustee’s average total retainer and meeting fees for the three years ended December 31, 2005. Pension expense for the fund is included in Trustee compensation and expenses in the statement of operations. Accrued pension liability is included in Payable for Trustee compensation and expenses in the statement of assets and liabilities. The Trustees have terminated the Pension Plan with respect to any Trustee first elected after 2003.
The fund has adopted distribution plans (the “Plans”) with respect to its class A, class B, class C, class M and class R shares pursuant to Rule 12b-1 under the Investment Company Act of 1940. The purpose of the Plans is to compensate Putnam Retail Management, a wholly-owned subsidiary of Putnam, LLC and Putnam Retail Management GP, Inc., for services provided and expenses incurred in distributing shares of the fund. The Plans provide for payments by the fund to Putnam Retail Management at an annual rate of up to 0.35%, 1.00%, 1.00% , 1.00% and 1.00% of the average net assets attributable to class A, class B, class C, class M and class R shares, respectively. The Trustees have approved payment by the fund at an annual rate of 0.25%, 1.00%, 1.00%, 0.75% and 0.50% of the average net assets attributable to class A, class B, class C, class M and class R shares, respectively.
For the six months ended January 31, 2006, Putnam Retail Management, acting as underwriter, received net commissions of $103,202 and $1,527 from the sale of class A and class M shares, respectively, and received $372,249 and $2,858 in contingent deferred sales charges from redemptions of class B and class C shares, respectively.
A deferred sales charge of up to 1.00% and 0.65% is assessed on certain redemptions of class A and class M shares, respectively. For the six months ended January 31, 2006, Putnam Retail Management, acting as underwriter, received $683 and no monies on class A and class M redemptions, respectively.
Note 3: Purchases and sales of securities
During the six months ended January 31, 2006, cost of purchases and proceeds from sales of investment securities other than U.S. government securities and short-term investments aggregated $2,505,199, 820 and $3,103,053,053, respectively.
96
Purchases and sales of U.S. government securities aggregated $97,234,375 and no monies, respectively.
Written option transactions during the period ended January 31, 2006 are summarized as follows:
| | Contract | Premiums |
| | Amounts | Received |
|
| Written options | | |
| outstanding at | | |
| beginning of period | 153,640,000 | $5,942,027 |
|
| Options opened | — | — |
| Options exercised | — | — |
| Options expired | — | — |
| Options closed | — | — |
|
| Written options | | |
| outstanding at | | |
| end of period | 153,640,000 | $5,942,027 |
Note 4: Capital shares
At January 31, 2006 there was an unlimited number of shares of beneficial interest authorized. Transactions in capital shares were as follows:
| CLASS A | Shares | Amount |
| Six months ended 1/31/06: | |
| Shares sold | 13,861,710 | $ 251,318,631 |
|
| Shares issued | | |
| in connection | | |
| with reinvestment | | |
| of distributions | 6,467,357 | 115,960,258 |
|
| | 20,329,067 | 367,278,889 |
|
| Shares repurchased (27,705,781) | (502,013,464) |
|
| Net decrease | (7,376,714) | $(134,734,575) |
| |
| Year ended 7/31/05: | | |
| Shares sold | 32,384,442 | $ 574,245,635 |
|
| Shares issued | | |
| in connection | | |
| with reinvestment | | |
| of distributions | 3,333,997 | 58,742,671 |
|
| | 35,718,439 | 632,988,306 |
|
| Shares | | |
| repurchased | (44,333,728) | (784,605,393) |
|
| Net decrease | (8,615,289) | $ (151,617,087) |
| CLASS B | Shares | Amount |
| Six months ended 1/31/06: | |
| Shares sold | 1,507,559 | $ 27,100,039 |
|
| Shares issued | | |
| in connection | | |
| with reinvestment | | |
| of distributions | 1,471,677 | 26,129,849 |
|
| | 2,979,236 | 53,229,888 |
|
| Shares | | |
| repurchased | (9,754,792) | (175,223,362) |
|
| Net decrease | (6,775,556) | $(121,993,474) |
| |
| Year ended 7/31/05: | | |
| Shares sold | 5,236,764 | $ 91,543,092 |
|
| Shares issued | | |
| in connection | | |
| with reinvestment | | |
| of distributions | 630,414 | 10,998,211 |
|
| | 5,867,178 | 102,541,303 |
|
| Shares | | |
| repurchased | (20,958,534) | (367,671,388) |
|
| Net decrease | (15,091,356) | $(265,130,085) |
| CLASS C | Shares | | Amount |
| Six months ended 1/31/06: | | |
| Shares sold | 345,070 | $ | 6,203,493 |
|
| Shares issued | | | |
| in connection | | | |
| with reinvestment | | | |
| of distributions | 127,038 | | 2,264,243 |
|
| | 472,108 | | 8,467,736 |
|
| Shares | | | |
| repurchased | (510,375) | | (9,210,674) |
|
| Net decrease | (38,267) | $ | (742,938) |
| |
| Year ended 7/31/05: | | | |
| Shares sold | 800,334 | $ | 14,156,023 |
|
| Shares issued | | | |
| in connection | | | |
| with reinvestment | | | |
| of distributions | 44,540 | | 781,476 |
|
| | 844,874 | | 14,937,499 |
|
| Shares | | | |
| repurchased | (1,108,465) | | (19,549,142) |
|
| Net decrease | (263,591) | | $ (4,611,643) |
97
| CLASS M | Shares | Amount |
| Six months ended 1/31/06: | |
| Shares sold | 683,413 | $ 12,274,854 |
|
| Shares issued | | |
| in connection | | |
| with reinvestment | | |
| of distributions | 409,352 | 7,266,275 |
|
| | 1,092,765 | 19,541,129 |
|
| Shares | | |
| repurchased | (1,546,447) | (27,767,151) |
|
| Net decrease | (453,682) | $ (8,226,022) |
| |
| Year ended 7/31/05: | | |
| Shares sold | 2,152,981 | $ 37,764,959 |
|
| Shares issued | | |
| in connection | | |
| with reinvestment | | |
| of distributions | 174,045 | 3,038,978 |
|
| | 2,327,026 | 40,803,937 |
|
| Shares | | |
| repurchased | (3,448,793) | (60,632,306) |
|
| Net decrease | (1,121,767) | $(19,828,369) |
|
| |
| CLASS R | Shares | Amount |
| Six months ended 1/31/06: | |
| Shares sold | 19,374 | $ 351,488 |
|
| Shares issued | | |
| in connection | | |
| with reinvestment | | |
| of distributions | 1,577 | 28,207 |
|
| | 20,951 | 379,695 |
|
| Shares | | |
| repurchased | (9,691) | (175,191) |
|
| Net increase | 11,260 | $ 204,504 |
| |
| Year ended 7/31/05: | | |
| Shares sold | 34,944 | $ 617,759 |
|
| Shares issued | | |
| in connection | | |
| with reinvestment | | |
| of distributions | 414 | 7,354 |
|
| | 35,358 | 625,113 |
|
| Shares | | |
| repurchased | (3,357) | (59,966) |
|
| Net increase | 32,001 | $ 565,147 |
| CLASS Y | Shares | Amount |
| Six months ended 1/31/06: | |
| Shares sold | 3,995,701 | $ 72,256,691 |
|
| Shares issued | | |
| in connection | | |
| with reinvestment | | |
| of distributions | 1,380,984 | 24,823,095 |
|
| | 5,376,685 | 97,079,786 |
|
| Shares | | |
| repurchased | (12,119,706) | (218,934,421) |
|
| Net decrease | (6,743,021) | $(121,854,635) |
| |
| Year ended 7/31/05: | | |
| Shares sold | 8,972,215 | $ 159,374,817 |
|
| Shares issued | | |
| in connection | | |
| with reinvestment | | |
| of distributions | 961,528 | 16,948,666 |
|
| | 9,933,743 | 176,323,483 |
|
| Shares | | |
| repurchased | (24,182,974) | (429,752,275) |
|
| Net decrease | (14,249,231) | $(253,428,792) |
Note 5: Investment in Putnam Prime Money Market Fund
Pursuant to an exemptive order from the Securities and Exchange Commission, the fund invests in Putnam Prime Money Market Fund, an open-end management investment company managed by Putnam Management. Management fees paid by the fund are reduced by an amount equal to the management and administrative services fees paid by Putnam Prime Money Market Fund with respect to assets invested by the fund in Putnam Prime Money Market Fund. For the period ended January 31, 2006, management fees paid were reduced by $120,569 relating to the fund’s investment in Putnam Prime Money Market Fund. Income distributions earned by the fund are recorded as income in the statement of operations and totaled $3,496,496 for the period ended January 31, 2006. During the period ended January 31, 2006, cost of purchases and cost of sales of investments in Putnam Prime Money Market Fund aggregated $757,004,359 and $779,543,230, respectively.
98
Note 6: Regulatory matters and litigation
Putnam Management has entered into agreements with the Securities and Exchange Commission and the Massachusetts Securities Division settling charges connected with excessive short-term trading by Putnam employees and, in the case of the charges brought by the Massachusetts Securities Division, by participants in some Putnam-administered 401(k) plans. Pursuant to these settlement agreements, Putnam Management will pay a total of $193.5 million in penalties and restitution, with $153.5 million being paid to certain open-end funds and their shareholders. The amount will be allocated to shareholders and funds pursuant to a plan developed by an independent consultant, and will be paid following approval of the plan by the SEC and the Massachusetts Securities Division.
The Securities and Exchange Commission’s and Massachusetts Securities Division’s allegations and related matters also serve as the general basis for numerous lawsuits, including purported class action lawsuits filed against Putnam Management and certain related parties, including certain Putnam funds. Putnam Management will bear any costs incurred by Putnam funds in connection with these lawsuits. Putnam Management believes that the likelihood that the pending private lawsuits and purported class action lawsuits will have a material adverse financial impact on the fund is remote, and the pending actions are not likely to materially affect its ability to provide investment management services to its clients, including the Putnam funds.
Pursuant to a settlement with the Securities and Exchange Commission relating to Putnam Management’s brokerage allocation practices, on October 13, 2005 the fund received $919,245 in proceeds paid by Putnam Management. The fund had accrued a receivable for this amount in the prior fiscal year.
Putnam Investments has recorded a charge of $30 million for the estimated cost, excluding interest, that it believes will be necessary to address issues relating to the calculation of certain amounts paid by the Putnam mutual funds in previous years. The previous payments were cost reimbursements by the Putnam funds to Putnam for transfer agent services relating to defined contribution operations. In March 2006, the fund recorded a receivable of $2,471,315 from Putnam Investments in connection with this matter. Review of the matter is ongoing and the amount received by the fund may be adjusted in the future. Such adjustment is not expected to be material.
Putnam Management and Putnam Retail Management are named as defendants in a civil suit in which the plaintiffs allege that the management and distribution fees paid by certain Putnam funds were excessive and seek recovery under the Investment Company Act of 1940. Putnam Management and Putnam Retail Management have contested the plaintiffs’ claims and the matter is currently pending in the U.S. District Court for the District of Massachusetts. Based on currently available information, Putnam Management believes that this action is without merit and that it is unlikely to have a material effect on Putnam Management’s and Putnam Retail Management’s ability to provide services to their clients, including the fund.
99
Brokerage commissions
(Unaudited)
|
Brokerage commissions are paid to firms that execute trades on behalf of your fund. When choosing these firms, Putnam is required by law to seek the best execution of the trades, taking all relevant factors into consideration, including expected quality of execution and commission rate. Listed below are the largest relationships based upon brokerage commissions for your fund and the other funds in Putnam’s Large-Cap Value group for the year ended January 31, 2006. The other Putnam mutual funds in this group are Putnam Classic Equity Fund, Putnam Convertible Income-Growth Trust, Putnam Equity Income Fund, The Putnam Fund for Growth and Income, Putnam New Value Fund, Putnam VT Equity Income Fund, Putnam VT The George Putnam Fund of Boston, Putnam VT Growth and Income Fund, and Putnam VT New Value Fund.
The top five firms that received brokerage commissions for trades executed for the Large-Cap Value group are (in descending order) Goldman Sachs, Citigroup Global Markets, Deutsche Bank Securities, Merrill Lynch, and Morgan Stanley Dean Witter. Commissions paid to these firms together represented approximately 45% of the total brokerage commissions paid for the year ended January 31, 2006.
Commissions paid to the next 10 firms together represented approximately 40% of the total brokerage commissions paid during the period. These firms are (in alphabetical order) Bank of America, Bear Stearns & Company, Credit Suisse First Boston, Investment Technology, Lazard Freres & Co., Lehman Brothers, RBC Capital Markets, Sanford Bernstein, UBS Warburg, and Wachovia Securities.
Commission amounts do not include “mark-ups” paid on bond or derivative trades made directly with a dealer. Additional information about brokerage commissions is available on the Securities and Exchange Commission (SEC) Web site at www.sec.gov. Putnam funds disclose commissions by firm to the SEC in semiannual filings on Form N-SAR.
100
Founded over 65 years ago, Putnam Investments was built around the concept that a balance between risk and reward is the hallmark of a well-rounded financial program. We manage over 100 mutual funds in growth, value, blend, fixed income, and international.
Investment Manager
Putnam Investment
Management, LLC
One Post Office Square
Boston, MA 02109
Marketing Services
Putnam Retail Management
One Post Office Square
Boston, MA 02109
Custodian
Putnam Fiduciary
Trust Company
Legal Counsel
Ropes & Gray LLP
Trustees
John A. Hill, Chairman
Jameson Adkins Baxter,
Vice Chairman
Charles B. Curtis
Myra R. Drucker
Charles E. Haldeman, Jr.
Paul L. Joskow
Elizabeth T. Kennan
John H. Mullin, III
Robert E. Patterson
George Putnam, III
W. Thomas Stephens
Richard B. Worley |
Officers
George Putnam, III
President
Charles E. Porter
Executive Vice President,
Associate Treasurer and
Principal Executive Officer
Jonathan S. Horwitz
Senior Vice President
and Treasurer
Steven D. Krichmar
Vice President and
Principal Financial Officer
Michael T. Healy
Assistant Treasurer and
Principal Accounting Officer
Daniel T. Gallagher
Senior Vice President,
Staff Counsel and
Compliance Liaison
Beth S. Mazor
Vice President
James P. Pappas
Vice President
Richard S. Robie, III
Vice President |
Francis J. McNamara, III
Vice President and
Chief Legal Officer
Charles A. Ruys de Perez
Vice President and
Chief Compliance Officer
Mark C. Trenchard
Vice President and
BSA Compliance Officer
Judith Cohen
Vice President, Clerk and
Assistant Treasurer
Wanda M. McManus
Vice President, Senior Associate
Treasurer and Assistant Clerk
Nancy E. Florek
Vice President, Assistant Clerk,
Assistant Treasurer and
Proxy Manager
|
This report is for the information of shareholders of The George Putnam Fund of Boston. It may also be used as sales literature when preceded or accompanied by the current prospectus, the most recent copy of Putnam’s Quarterly Performance Summary, and Putnam’s Quarterly Ranking Summary. For more recent performance, please visit www.putnam.com. Investors should carefully consider the investment objective, risks, charges, and expenses of a fund, which are described in its prospectus. For this and other information or to request a prospectus, call 1-800-225-1581 toll free. Please read the prospectus carefully before investing. The fund’s Statement of Additional Information contains additional information about the fund’s Trustees and is available without charge upon request by calling 1-800-225-1581.

Item 2. Code of Ethics:
Not applicable
Item 3. Audit Committee Financial Expert:
Not applicable
Item 4. Principal Accountant Fees and Services:
Not applicable
Item 5. Audit Committee of Listed Registrants
Not applicable
Item 6. Schedule of Investments:
The registrant’s schedule of investments in unaffiliated issuers is included in the report to shareholders in Item 1 above.
Item 7. Disclosure of Proxy Voting Policies and Procedures For Closed-End Management
Investment Companies:
|
Not applicable
Item 8. Portfolio Managers of Closed-End Investment Companies
Not Applicable
Item 9. Purchases of Equity Securities by Closed-End Management Investment Companies and
Affiliated Purchasers:
|
Not applicable
Item 10. Submission of Matters to a Vote of Security Holders:
Not applicable
Item 11. Controls and Procedures:
(a) The registrant's principal executive officer and principal financial officer have concluded, based on their evaluation of the effectiveness of the design and operation of the registrant's disclosure controls and procedures as of a date within 90 days of the filing date of this report, that the design and operation of such procedures are generally effective to provide reasonable assurance that information required to be disclosed by the registrant in this report is recorded, processed, summarized and reported within the time periods specified in the Commission's rules and forms.
(b) Changes in internal control over financial reporting: Not applicable
Item 12. Exhibits:
(a)(1) Not applicable
(a)(2) Separate certifications for the principal executive officer and principal financial officer of the registrant as required by Rule 30a-2(a) under the Investment Company Act of 1940, as amended, are filed herewith.
(b) The certifications required by Rule 30a-2(b) under the Investment Company Act of 1940, as amended, are filed herewith.
SIGNATURES
Pursuant to the requirements of the Securities Exchange Act of 1934 and the Investment Company Act of 1940, the registrant has duly caused this report to be signed on its behalf by the undersigned, thereunto duly authorized.
The George Putnam Fund of Boston
By (Signature and Title):
/s/Michael T. Healy
Michael T. Healy
Principal Accounting Officer
|
Date: March 29, 2006
Pursuant to the requirements of the Securities Exchange Act of 1934 and the Investment Company Act of 1940, this report has been signed below by the following persons on behalf of the registrant and in the capacities and on the dates indicated.
By (Signature and Title):
/s/Charles E. Porter
Charles E. Porter
Principal Executive Officer
|
Date: March 29, 2006
By (Signature and Title):
/s/Steven D. Krichmar
Steven D. Krichmar
Principal Financial Officer
|
Date: March 29, 2006