UNITED STATES
SECURITIES AND EXCHANGE COMMISSION
Washington, D.C. 20549
|
FORM N-CSR
CERTIFIED SHAREHOLDER REPORT OF REGISTERED
MANAGEMENT INVESTMENT COMPANIES
|
Investment Company Act file number: (811- 00781 )
Exact name of registrant as specified in charter: The Putnam Fund for Growth and Income
Address of principal executive offices: One Post Office Square, Boston, Massachusetts 02109
| Name and address of agent for service: | Beth S. Mazor, Vice President |
| | One Post Office Square |
| | Boston, Massachusetts 02109 |
| |
| Copy to: | John W. Gerstmayr, Esq. |
| | Ropes & Gray LLP |
| | One International Place |
| | Boston, Massachusetts 02110 |
| |
| Registrant’s telephone number, including area code: | (617) 292-1000 |
Date of fiscal year end: October 31, 2006
Date of reporting period: November 1, 2005— April 30, 2006
Item 1. Report to Stockholders:
The following is a copy of the report transmitted to stockholders pursuant to Rule 30e-1 under the Investment Company Act of 1940:
What makes Putnam different?

In 1830, Massachusetts Supreme Judicial Court Justice Samuel Putnam established The Prudent Man Rule, a legal foundation for responsible money management.
THE PRUDENT MAN RULE
All that can be required of a trustee to invest is that he shall conduct himself faithfully and exercise a sound discretion. He is to observe how men of prudence, discretion, and intelligence manage their own affairs, not in regard to speculation, but in regard to the permanent disposition of their funds, considering the probable income, as well as the probable safety of the capital to be invested.

A time-honored tradition in money management
Since 1937, our values have been rooted in a profound sense of responsibility for the money entrusted to us.
A prudent approach to investing
We use a research-driven team approach to seek consistent, dependable, superior investment results over time, although there is no guarantee a fund will meet its objectives.
Funds for every investment goal
We offer a broad range of mutual funds and other financial products so investors and their financial representatives can build diversified portfolios.
A commitment to doing what’s right for investors
We have below-average expenses and stringent investor protections, and provide a wealth of information about the Putnam funds.
Industry-leading service
We help investors, along with their financial representatives, make informed investment decisions with confidence.
The Putnam
Fund for Growth
and Income
|
4| 30| 06
Semiannual Report
|
| Message from the Trustees | 2 |
| About the fund | 4 |
| Report from the fund managers | 7 |
| Performance | 12 |
| Expenses | 15 |
| Portfolio turnover | 17 |
| Brokerage commissions | 18 |
| Risk | 19 |
| Your fund’s management | 20 |
| Terms and definitions | 23 |
| Trustee approval of management contract | 25 |
| Other information for shareholders | 30 |
| Financial statements | 31 |
Cover photograph: © White-Packert Photography
Message from the Trustees
|
Dear Fellow Shareholder
In recent months, we have witnessed the continuing vibrancy of the current economic expansion, now in its fifth year. U.S. businesses have seized opportunities available both at home and abroad to generate some of the most impressive profit margins in history, by some measures. During your fund’s reporting period, common stocks have traded at higher levels to reflect improving corporate profits. However, the gains have not come without concerns in some quarters of the market about the risks facing the economy. These risks include high energy prices, inflation, and a potential pullback in consumer spending, as well as the potential adverse effects of the Federal Reserve’s (the Fed’s) series of interest-rate increases. Concerns about inflation, in particular, have been reflected in falling bond prices and rising bond yields, and worries about consumer spending have clouded the outlook for stocks.
You can be assured that the investment professionals managing your fund are closely monitoring the factors that are influencing the performance of the securities in which your fund invests. Moreover, Putnam Investments’ management team, under the leadership of Chief Executive Officer Ed Haldeman, continues to focus on investment performance and remains committed to putting the interests of shareholders first.
2
In the following pages, members of your fund’s management team discuss the fund’s performance and strategies for the fiscal period ended April 30, 2006, and provide their outlook for the months ahead. As always, we thank you for your support of the Putnam funds.
The Putnam Fund for Growth and Income:
pursuing capital growth for nearly 50 years
|
In November 1957 — almost 20 years to the day after Putnam Investments was founded with the launch of The George Putnam Fund of Boston — Putnam launched its second mutual fund: The Putnam Fund for Growth and Income.
Putnam’s founders carefully debated the merits of adding a fund whose primary focus would be stock investments. They believed that the balanced approach of The George Putnam Fund of Boston, which owned a mix of stocks and bonds, was still the most prudent choice for most individuals. However, the advent of state tax-exempt bonds was making it more advantageous for some investors to balance their own portfolios. Furthermore, many financial advisors who worked with Putnam had been urging the firm to launch a common stock fund to meet this growing need.
The fund was launched in a favorable environment for stock investors. Confidence in stocks, which had been severely shaken by the 1929 crash and the Great Depression that followed, had finally been renewed in the early 1950s. Fueled by the optimism of new technologies and the race to space, the 1960s were generally good years for investors. Then came the stagflation-plagued 1970s when the stock market moved sideways for most of the decade.
Growth of a $10,000 investment
since fund inception, 11/6/57, through 3/31/06
Plotted on a logarithmic scale
so that comparable percentage
changes appear similar
|
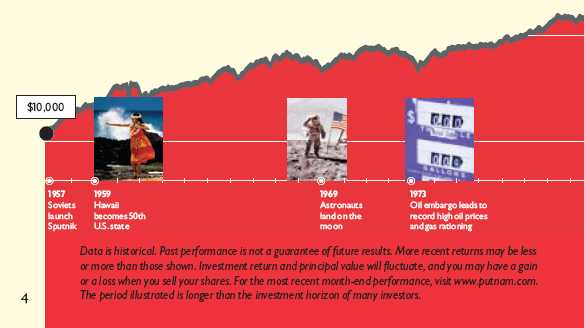
In 1957, the year The Putnam Fund for Growth and Income was introduced, the Dow Jones Industrial Average closed at just over 435. At the close of the fund’s current fiscal period, the Dow stood at 11109.
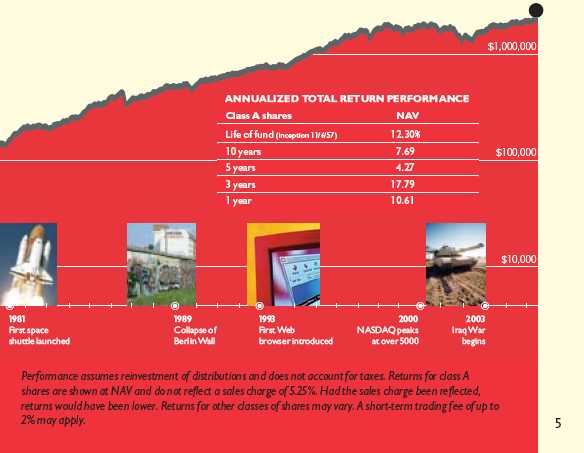
The fund benefited from the rallies that dominated the 1980s and 1990s. There were bumps in the road, such as the recession of the early 1990s, and, more recently, the bear market of 2000–2002.
True to its roots, The Putnam Fund for Growth and Income continues to focus on long-term capital growth opportunities among leading large-cap companies with equal attention to managing downside risk. We believe these strategies, which have proven successful for long-term investors in the fund, will continue to serve the fund well as it approaches its 50th year.

The Putnam Fund for Growth and Income seeks capital growth and current income by investing primarily in undervalued stocks of large, established, dividend-paying companies. The fund may be appropriate for investors who wish to diversify a portfolio that emphasizes growth investments.
| Highlights |
* | For the six months ended April 30, 2006, The Putnam Fund for Growth and Income’s class A |
| shares returned 10.18% without sales charges. |
* | Over the same period, the fund’s benchmark, the S&P 500/Citigroup Value Index,* |
| returned 13.57%. |
* | The average return for the fund’s Lipper category, Large-Cap Value Funds, was 11.05%. |
* | During the period, the fund’s quarterly dividend was reduced to $0.055 per share. See page 11 |
| for details. |
* | Additional fund performance, comparative performance, and Lipper data can be found in the |
| performance section beginning on page 12. |
| |
* | Standard & Poor’s has replaced the S&P 500/Barra Value Index with the S&P 500/Citigroup Value Index. Index performance |
| reflects the new index criteria. The S&P 500/Citigroup Value Index is an unmanaged capitalization-weighted index of large-cap |
| stocks chosen for their value orientation. It is not possible to invest in an index. |
| Performance | | | | |
| Total return for class A shares for periods ended 4/30/06 | | |
| |
| Since the fund’s inception (11/6/57), average annual return is 12.32% at NAV and 12.19% at POP. | |
|
| | Average annual return | Cumulative return |
| | NAV | POP | NAV | POP |
|
| 10 years | 7.76% | 7.18% | 111.19% | 100.09% |
|
| 5 years | 3.60 | 2.48 | 19.34 | 13.05 |
|
| 3 years | 15.29 | 13.24 | 53.26 | 45.22 |
|
| 1 year | 15.61 | 9.56 | 15.61 | 9.56 |
|
| 6 months | — | — | 10.18 | 4.38 |
|
Data is historical. Past performance does not guarantee future results. More recent returns may be less or more than those shown. Investment return and principal value will fluctuate, and you may have a gain or a loss when you sell your shares. Performance assumes reinvestment of distributions and does not account for taxes. Returns at NAV do not reflect a sales charge of 5.25% . For the most recent month-end performance, visit www.putnam.com. A short-term trading fee of up to 2% may apply.
6
Report from the fund managers
|
The period in review
The first half of your fund’s 2006 fiscal year was generally positive for equities, despite the challenges of rising interest rates, higher energy and commodities costs, and a somewhat slower pace of economic growth. Your fund generated what we consider a respectable return for the period; however, it lagged its benchmark, the S&P 500/Citigroup Value Index, and also the average of its Lipper peer group, Large-Cap Value Funds. We attribute this underperformance to the fund’s positions in financial, health-care, and technology stocks. Relative to the benchmark, the fund had greater exposure to the health-care sector, which was not particularly strong. Also, our valuation discipline and perception of risk led us away from certain industries within the financial and technology sectors that continued to have stronger results than we had expected. Finally, although our energy holdings contributed positively to returns, other fund holdings were hurt by rising energy and commodities costs and declined in value.
Market overview
The U.S. economy continued to strengthen, and corporate earnings largely exceeded expectations in the fourth calendar quarter of 2005 and the first quarter of 2006. Consumer spending remained robust, as did business investment in plants and equipment, and U.S. exports to foreign countries. Despite higher energy costs, companies gained pricing power, which enabled them to pass higher costs on to consumers. Broadly speaking, profit margins grew, but the spread of inflation outside the energy sector was a growing concern.
The Fed continued to raise short-term interest rates, and gave no solid indication of plans to alter its restrictive monetary policy in the near future. Many businesses had taken earlier advantage of lower, long-term interest rates to refinance debt, and so the negative effect of rising short-term rates was mitigated to some extent.
In the capital markets, all major indexes had positive returns for the period. Stocks outperformed bonds. International stocks outperformed domestic issues, as they have for the past
few years. In the United States, small-and mid-capitalization stocks had stronger returns than large-cap stocks, although large caps dominated in December 2005. Growth and value styles had mixed results. Among small- and mid-cap stocks, growth was the better-performing style. Among large caps, however, value continued to dominate. Market volatility intensified and offered increasing opportunities to find mispriced, undervalued stocks.
Your fund’s performance relative to other funds in its Lipper peer group may have been affected by the market’s bias in favor of smaller-cap stocks during the period. We believe the fund’s average market capitalization is larger than that of many of its peers.
Strategy overview
Your fund’s strategy generally remains unchanged despite shifts in the market environment. We invest in a well-diversified portfolio of large-capitalization domestic stocks that we believe are mispriced. We look for a combination of low valuations and attractive cash flow characteristics, as determined by our quantitative and fundamental research. In addition, we seek stocks that appear to offer the potential for long-term capital appreciation. We carefully scrutinize how companies are employing their free cash flow and consider that returning profits to shareholders in the form of dividends or share repurchases is a positive signal that management is committed to improving shareholder value.
| Market sector performance | |
These indexes provide an overview of performance in different market sectors for the | |
| six months ended 4/30/06. | |
|
Equities | |
|
| S&P 500/Citigroup Value Index (large-company value stocks) | 13.57% |
|
| Russell 1000 Growth Index (large-company growth stocks) | 7.06% |
|
| S&P 500 Index (broad stock market) | 9.64% |
|
| MSCI World Index (global stocks) | 16.01% |
|
| Bonds | |
|
| Lehman Aggregate Bond Index (broad bond market) | 0.56% |
|
| Lehman Intermediate Treasury Bond Index (intermediate-maturity U.S. Treasury bonds) | 0.64% |
|
| Lehman Municipal Bond Index (tax-exempt bonds) | 1.56% |
|
8
We will make slight adjustments to the portfolio’s sector weightings from time to time in an effort to enhance absolute and relative returns. However, our emphasis is more on stock selection than on sector weightings. We continued to reduce the number of holdings in the portfolio over the past six months. This was part of our strategy to increase our focus on holdings that we believe offer the greatest potential returns. With fewer holdings, each one can have a more meaningful effect on overall returns.
Your fund’s holdings
Office Depot, the second-largest office supplies retailer in the United States, continued to be a top performer during the period. When we established the position, the company was not as profitable as we thought it could be, and the stock was out of favor. Under the leadership of a new CEO, the company has experienced increased earnings and profits and a significant rise in share price. We have been selling shares to lock in gains, and we anticipate closing out the position within the next few months.
Another strong-performing holding was Lockheed Martin. Its three main business segments are aerospace, defense, and communications technology. The company is the largest contractor in the defense industry, and the majority of its annual revenues come from the U.S. Department of Defense. U.S. military spending has been
Comparison of top industry weightings
This chart shows how the fund’s top weightings have changed over the last six months. Weightings are shown as a percentage of net assets. Holdings will vary over time.

9
very strong in recent years and has supported Lockheed Martin’s rising stock price. We continue to hold the position, and we believe that further appreciation is possible.
Shares of Bank of America appreciated during the period. This company provides a full complement of commercial and retail banking services, including mortgage loans, credit cards, online banking, investment banking, and securities underwriting. Bank of America has grown through a large number of acquisitions, including the more recent acquisitions of Fleet Bank and MBNA. Integrating all these businesses took its toll on financial performance, but stability and efficiency appear to have improved in recent months, leading to better results.
Stocks that detracted from the fund’s returns included Tyson Foods, which processes beef, pork, and poultry products. Tyson sells its products to supermarkets, restaurants, and other food service channels. An overabundance of cattle has caused the price of beef to fall, while concern over bird flu has caused a reduction in sales of chicken products. We believe this is a cyclical trend that is likely to be temporary. Although Tyson’s stock price slipped, we are taking advantage of the price decline to purchase more shares.
Tyco International, a conglomerate with many businesses in the health-care, electronics, and fire and security industries, declined slightly. The company has been in the midst of a turnaround for several years and despite some very positive quarters, missed an earnings target and exhibited sluggish internal growth. The company is considering
Top holdings
This table shows the fund’s top holdings, and the percentage of the fund’s net assets that each
comprised, as of 4/30/06. The fund’s holdings will change over time.
|
| Holding (percent of fund’s net assets) | Industry |
|
| Bank of America Corp. (4.2%) | Banking |
|
| Exxon Mobil Corp. (3.7%) | Oil and gas |
|
| Citigroup, Inc. (3.7%) | Financial |
|
| Pfizer, Inc. (3.1%) | Pharmaceuticals |
|
| American International Group, Inc. (2.8%) | Insurance |
|
| Johnson & Johnson (2.3%) | Pharmaceuticals |
|
| U.S. Bancorp (2.1%) | Banking |
|
| Tyco International, Ltd (Bermuda) (2.0%) | Conglomerates |
|
| Intel Corp. (2.0%) | Electronics |
|
| Hewlett-Packard Co. (1.9%) | Computers |
|
10
spinning off some of its health-care and electronics units, which could enhance their value. We are maintaining the fund’s position and believe Tyco’s long-term prospects remain very favorable. Shares of specialty retailer The Home Depot declined in value amidst fears that rising interest rates would dampen new homebuilding and renovations and lower demand for the store’s products. We believe the market has ignored significant operational improvements at the company that will enhance its financial performance, and we view this as a buying opportunity.
Please note that the holdings discussed in this report may not have been held by the fund for the entire period. Portfolio composition is subject to review in accordance with the fund’s investment strategy and may vary in the future.
Of special interest
Fund’s dividend reduced
In February 2006, the dividend on class A shares of the fund was reduced from $0.070 per share to $0.055 per share. Dividends on other share classes were also reduced. The Trustees voted for the reduction because some companies in which the fund invests are now paying annual, rather than quarterly dividends, while others are choosing to reinvest their earnings.
The outlook for your fund
The following commentary reflects anticipated developments that could affect your fund over the next six months, as well as your management team’s plans for responding to them.
Six months ago, we stated that we believed the Fed may be nearing the end of its tightening policy. Although the Fed has not yet paused in raising short-term interest rates, we still believe the end of this cycle may be approaching. When interest rates stabilize, this should be a positive development for stocks, which generally struggle in a rising-rate environment. Assuming inflation remains tame and economic growth settles to a level of about 3.5%, we believe the environment will be favorable for moderate corporate earnings growth going forward.
Among larger companies, stock valuations, in our view, remain very attractive. During the past year, earnings, dividends, and cash flows have increased more than stock prices. Many of the stocks your fund invests in now offer dividend yields greater than what is available in the money market, have price-to-earnings ratios lower than the market average, and have better-than-average long-term prospects. Furthermore, an uptick in volatility has created more opportunities to take advantage of mispriced stocks. We will continue to search for stocks we believe can deliver attractive returns over the long term. As we focus on our best ideas, we anticipate reducing the number of holdings in the portfolio a bit further, so each security can make a more meaningful contribution to returns. Altogether, our outlook for the fund for the remainder of 2006 is cautiously optimistic, and we continue to believe the fund can serve as the core equity component of a well-diversified portfolio. As always, we remain committed to helping you pursue your investment goals.
The views expressed in this report are exclusively those of Putnam Management. They are not meant as investment advice.
11
Your fund’s performance
This section shows your fund’s performance for periods ended April 30, 2006, the end of the first half of its current fiscal year. In accordance with regulatory requirements for mutual funds, we also include performance for the most recent calendar quarter-end. Performance should always be considered in light of a fund’s investment strategy. Data represents past performance. Past performance does not guarantee future results. More recent returns may be less or more than those shown. Investment return and principal value will fluctuate, and you may have a gain or a loss when you sell your shares. For the most recent month-end performance, please visit www.putnam.com or call Putnam at 1-800-225-1581. Class Y shares are generally only available to corporate and institutional clients. See the Terms and Definitions section in this report for definitions of the share classes offered by your fund.
Fund performance
Total return for periods ended 4/30/06
|
| | Class A | | Class B | | Class C | | Class M | | Class R | Class Y |
| (inception dates) | (11/6/57) | | (4/27/92) | | (7/26/99) | | (5/1/95) | | (1/21/03) | (6/15/94) |
| | NAV | POP | NAV | CDSC | NAV | CDSC | NAV | POP | NAV | NAV |
|
| Annual average | | | | | | | | | | |
| (life of fund) | 12.32% | 12.19% | 11.28% | 11.28% | 11.48% | 11.48% | 11.57% | 11.49% | 12.03% | 12.39% |
|
| 10 years | 111.19 | 100.09 | 95.88 | 95.88 | 96.00 | 96.00 | 100.88 | 94.33 | 105.90 | 116.47 |
| Annual average | 7.76 | 7.18 | 6.95 | 6.95 | 6.96 | 6.96 | 7.22 | 6.87 | 7.49 | 8.03 |
|
| 5 years | 19.34 | 13.05 | 14.89 | 12.89 | 14.88 | 14.88 | 16.38 | 12.59 | 17.85 | 20.86 |
| Annual average | 3.60 | 2.48 | 2.81 | 2.45 | 2.81 | 2.81 | 3.08 | 2.40 | 3.34 | 3.86 |
|
| 3 years | 53.26 | 45.22 | 49.74 | 46.74 | 49.85 | 49.85 | 51.03 | 46.14 | 52.01 | 54.35 |
| Annual average | 15.29 | 13.24 | 14.41 | 13.64 | 14.43 | 14.43 | 14.73 | 13.48 | 14.98 | 15.57 |
|
| 1 year | 15.61 | 9.56 | 14.65 | 9.65 | 14.68 | 13.68 | 15.01 | 11.29 | 15.25 | 15.87 |
|
| 6 months | 10.18 | 4.38 | 9.75 | 4.75 | 9.76 | 8.76 | 9.92 | 6.33 | 10.04 | 10.30 |
|
Performance assumes reinvestment of distributions and does not account for taxes. Returns at public offering price (POP) for class A and M shares reflect a sales charge of 5.25% and 3.25%, respectively. Class B share returns reflect the applicable contingent deferred sales charge (CDSC), which is 5% in the first year, declining to 1% in the sixth year, and is eliminated thereafter. Class C shares reflect a 1% CDSC the first year that is eliminated thereafter. Class R and Y shares have no initial sales charge or CDSC. Performance for class B, C, M, R, and Y shares before their inception is derived from the historical performance of class A shares, adjusted for the applicable sales charge (or CDSC) and, except for class Y shares, the higher operating expenses for such shares.
A 2% short-term trading fee may be applied to shares exchanged or sold within 5 days of purchase.
12
Comparative index returns
For periods ended 4/30/06
|
| | | Lipper Large-Cap |
| | S&P 500/Citigroup | Value Funds |
| | Value Index* | category average† |
|
| Annual average | | |
| (life of fund) | —‡ | —‡ |
|
| 10 years | 151.55% | 133.22% |
| Annual average | 9.66 | 8.70 |
|
| 5 years | 38.95 | 24.90 |
| Annual average | 6.80 | 4.47 |
|
| 3 years | 72.37 | 58.66 |
| Annual average | 19.90 | 16.59 |
|
| 1 year | 21.57 | 16.53 |
|
| 6 months | 13.57 | 11.05 |
|
Index and Lipper results should be compared to fund performance at net asset value.
* Standard & Poor’s has replaced the S&P 500/Barra Value Index with the S&P 500/Citigroup Value Index. Index performance reflects the new index criteria. The S&P 500/Citigroup Value Index is an unmanaged capitalization-weighted index of large-cap stocks chosen for their value orientation. It is not possible to invest in an index.
† Over the 6-month and 1-, 3-, 5-, and 10-year periods ended 4/30/06, there were 508, 496, 411, 287, and 123 funds, respectively, in this Lipper category.
‡ The fund’s benchmark and Lipper category were not in existence at the time of the fund’s inception. The S&P 500/Citigroup Value Index commenced 6/30/95. The fund’s Lipper category commenced 12/31/59.
13
Fund price and distribution information
For the six-month period ended 4/30/06
|
| Distributions* | Class A | | Class B | | Class C | | Class M | | Class R | | Class Y |
|
| Number | 2 | | 2 | | 2 | | 2 | | 2 | | 2 |
|
| Income | $0.125 | $0.047 | | $0.050 | | $0.074 | $0.103 | | $0.150 |
|
| Capital gains | | | | | | | | | | | |
|
| Long-term | 0.404 | 0.404 | | 0.404 | | 0.404 | 0.404 | | 0.404 |
|
| Short-term | — | | — | | — | | — | | — | | — |
|
| Total | $0.529 | $0.451 | | $0.454 | | $0.478 | $0.507 | | $0.554 |
|
| Share value: | NAV | POP | NAV | | NAV | | NAV | POP | NAV | | NAV |
| 10/31/05 | $19.42 | $20.50 | $19.13 | | $19.34 | | $19.29 | $19.94 | $19.36 | | $19.46 |
|
| 4/30/06 | 20.84 | 21.99 | 20.52 | | 20.75 | | 20.70 | 21.40 | 20.77 | | 20.88 |
|
| Current yield | | | | | | | | | | | |
| (end of period) | | | | | | | | | | | |
| Current | | | | | | | | | | | |
| dividend rate1 | 1.06% | 1.00% | 0.27% | | 0.31% | | 0.54% | 0.52% | 0.85% | | 1.30% |
|
| Current 30-day | | | | | | | | | | | |
| SEC yield2 | 1.13 | 1.07 | 0.39 | | 0.40 | | 0.64 | 0.62 | 0.89 | | 1.38 |
|
* Dividend sources are estimated and may vary based on final tax calculations after the fund’s fiscal year-end.
1 Most recent distribution, excluding capital gains, annualized and divided by NAV or POP at end of period.
2 Based only on investment income, calculated using SEC guidelines.
Fund performance for most recent calendar quarter
Total return for periods ended 3/31/06
|
| | | Class A | | Class B | | Class C | | Class M | | Class R | Class Y |
| (inception dates) | | (11/6/57) | | (4/27/92) | | (7/26/99) | | (5/1/95) | | (1/21/03) | (6/15/94) |
| | | NAV | POP | NAV | CDSC | NAV | CDSC | NAV | POP | NAV | NAV |
|
| Annual average | | | | | | | | | | | |
| (life of fund) | | 12.30% | 12.17% | 11.26% | 11.26% | 11.45% | 11.45% | 11.54% | 11.47% | 12.01% | 12.37% |
|
| 10 years | | 109.81 | 98.86 | 94.63 | 94.63 | 94.84 | 94.84 | 99.54 | 93.06 | 104.59 | 115.19 |
| Annual average | | 7.69 | 7.12 | 6.89 | 6.89 | 6.90 | 6.90 | 7.15 | 6.80 | 7.42 | 7.96 |
|
| 5 years | | 23.28 | 16.81 | 18.72 | 16.72 | 18.74 | 18.74 | 20.24 | 16.30 | 21.76 | 24.84 |
| Annual average | | 4.27 | 3.16 | 3.49 | 3.14 | 3.50 | 3.50 | 3.76 | 3.07 | 4.02 | 4.54 |
|
| 3 years | | 63.44 | 54.82 | 59.83 | 56.83 | 59.88 | 59.88 | 60.97 | 55.78 | 62.17 | 64.70 |
| Annual average | | 17.79 | 15.68 | 16.92 | 16.18 | 16.93 | 16.93 | 17.20 | 15.92 | 17.49 | 18.09 |
|
| 1 year | | 10.61 | 4.80 | 9.78 | 4.78 | 9.75 | 8.75 | 10.05 | 6.47 | 10.30 | 10.86 |
|
| 6 months | | 5.94 | 0.37 | 5.56 | 0.56 | 5.57 | 4.57 | 5.66 | 2.23 | 5.79 | 6.06 |
|
14
Your fund’s expenses
As a mutual fund investor, you pay ongoing expenses, such as management fees, distribution fees (12b-1 fees), and other expenses. In the most recent six-month period, your fund limited these expenses; had it not done so, expenses would have been higher. Using the information below, you can estimate how these expenses affect your investment and compare them with the expenses of other funds. You may also pay one-time transaction expenses, including sales charges (loads) and redemption fees, which are not shown in this section and would have resulted in higher total expenses. For more information, see your fund’s prospectus or talk to your financial advisor.
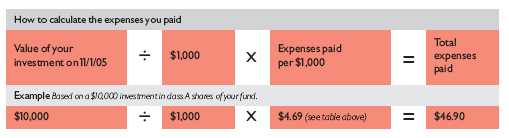
Review your fund’s expenses
The table below shows the expenses you would have paid on a $1,000 investment in The Putnam Fund for Growth and Income from November 1, 2005, to April 30, 2006. It also shows how much a $1,000 investment would be worth at the close of the period, assuming actual returns and expenses.
| | Class A | Class B | Class C | Class M | Class R | Class Y |
|
| Expenses paid per $1,000* | $ 4.69 | $ 8.58 | $ 8.58 | $ 7.29 | $ 5.99 | $ 3.39 |
|
| Ending value (after expenses) | $1,101.80 | $1,097.50 | $1,097.60 | $1,099.20 | $1,100.40 | $1,103.00 |
|
* Expenses for each share class are calculated using the fund’s annualized expense ratio for each class, which represents the ongoing expenses as a percentage of net assets for the six months ended 4/30/06. The expense ratio may differ for each share class (see the table at the bottom of the next page). Expenses are calculated by multiplying the expense ratio by the average account value for the period; then multiplying the result by the number of days in the period; and then dividing that result by the number of days in the year. Does not reflect the effect of a non-recurring reimbursement by Putnam. If this amount had been reflected in the table above, expenses for each share class would have been lower.
Estimate the expenses you paid
To estimate the ongoing expenses you paid for the six months ended April 30, 2006, use the calculation method below. To find the value of your investment on November 1, 2005, go to www.putnam.com and log on to your account. Click on the “Transaction History” tab in your Daily Statement and enter 11/01/2005 in both the “from” and “to” fields. Alternatively, call Putnam at 1-800-225-1581.
15
Compare expenses using the SEC’s method
The Securities and Exchange Commission (SEC) has established guidelines to help investors assess fund expenses. Per these guidelines, the table below shows your fund’s expenses based on a $1,000 investment, assuming a hypothetical 5% annualized return. You can use this information to compare the ongoing expenses (but not transaction expenses or total costs) of investing in the fund with those of other funds. All mutual fund shareholder reports will provide this information to help you make this comparison. Please note that you cannot use this information to estimate your actual ending account balance and expenses paid during the period.
| | Class A | Class B | Class C | Class M | Class R | Class Y |
|
| Expenses paid per $1,000* | $ 4.51 | $ 8.25 | $ 8.25 | $ 7.00 | $ 5.76 | $ 3.26 |
|
| Ending value (after expenses) | $1,020.33 | $1,016.61 | $1,016.61 | $1,017.85 | $1,019.09 | $1,021.57 |
|
* Expenses for each share class are calculated using the fund’s annualized expense ratio for each class, which represents the ongoing expenses as a percentage of net assets for the six months ended 4/30/06. The expense ratio may differ for each share class (see the table at the bottom of this page). Expenses are calculated by multiplying the expense ratio by the average account value for the period; then multiplying the result by the number of days in the period; and then dividing that result by the number of days in the year. Does not reflect the effect of a non-recurring reimbursement by Putnam. If this amount had been reflected in the table above, expenses for each share class would have been lower.
Compare expenses using industry averages
You can also compare your fund’s expenses with the average of its peer group, as defined by Lipper, an independent fund-rating agency that ranks funds relative to others that Lipper considers to have similar investment styles or objectives. The expense ratio for each share class shown below indicates how much of your fund’s net assets have been used to pay ongoing expenses during the period.
| | Class A | Class B | Class C | Class M | Class R | Class Y |
|
| Your fund’s annualized | | | | | | |
| expense ratio* | 0.90% | 1.65% | 1.65% | 1.40% | 1.15% | 0.65% |
|
| Average annualized expense | | | | | | |
| ratio for Lipper peer group† | 1.22% | 1.97% | 1.97% | 1.72% | 1.47% | 0.97% |
|
* Does not reflect the effect of a non-recurring reimbursement by Putnam. If this amount had been reflected in the table above, the expense ratio for each share class would have been lower.
† Simple average of the expenses of all front-end load funds in the fund’s Lipper peer group, calculated in accordance with Lipper’s standard method for comparing fund expenses (excluding 12b-1 fees and without giving effect to any expense offset and brokerage service arrangements that may reduce fund expenses). This average reflects each fund’s expenses for its most recent fiscal year available to Lipper as of 3/31/06. To facilitate comparison, Putnam has adjusted this average to reflect the 12b-1 fees carried by each class of shares other than class Y shares, which do not incur 12b-1 fees. The peer group may include funds that are significantly smaller or larger than the fund, which may limit the comparability of the fund’s expenses to the simple average, which typically is higher than the asset-weighted average.
16
Your fund’s
portfolio turnover
|
Putnam funds are actively managed by teams of experts who buy and sell securities based on intensive analysis of companies, industries, economies, and markets. Portfolio turnover is a measure of how often a fund’s managers buy and sell securities for your fund. A portfolio turnover of 100%, for example, means that the managers sold and replaced securities valued at 100% of a fund’s assets within a one-year period. Funds with high turnover may be more likely to generate capital gains and dividends that must be distributed to shareholders as taxable income. High turnover may also cause a fund to pay more brokerage commissions and other transaction costs, which may detract from performance.
Funds that invest in bonds or other fixed-income instruments may have higher turnover than funds that invest only in stocks. Short-term bond funds tend to have higher turnover than longer-term bond funds, because shorter-term bonds will mature or be sold more frequently than longer-term bonds. You can use the table below to compare your fund’s turnover with the average turnover for funds in its Lipper category.
| Turnover comparisons | | | | | |
Percentage of holdings that change every year
| | | |
|
| |
| | 2005 | 2004 | 2003 | 2002 | 2001 |
|
| The Putnam Fund for | | | | | |
| Growth and Income | 53% | 29% | 33% | 30% | 37% |
|
| Lipper Large-Cap Value Funds | | | | | |
| category average | 57% | 63% | 70% | 68% | 76% |
|
Turnover data for the fund is calculated based on the fund’s fiscal-year period, which ends on October 31. Turnover data for the fund’s Lipper category is calculated based on the average of the turnover of each fund in the category for its fiscal year ended during the indicated year. Fiscal years vary across funds in the Lipper category, which may limit the comparability of the fund’s portfolio turnover rate to the Lipper average. Comparative data for 2005 is based on information available as of 12/31/05.
17
Brokerage commissions are paid to firms that execute trades on behalf of your fund. When choosing these firms, Putnam is required by law to seek the best execution of the trades, taking all relevant factors into consideration, including expected quality of execution and commission rate. Listed below are the largest relationships based upon brokerage commissions for your fund and the other funds in Putnam’s Large-Cap Value group for the year ended April 30, 2006. The other Putnam mutual funds in this group are The George Putnam Fund of Boston, Putnam Classic Equity Fund, Putnam Convertible Income-Growth Trust, Putnam Equity Income Fund, Putnam New Value Fund, Putnam VT Equity Income Fund, Putnam VT The George Putnam Fund of Boston, Putnam VT Growth and Income Fund, and Putnam VT New Value Fund.
The top five firms that received brokerage commissions for trades executed for the Large-Cap Value group are (in descending order) Goldman Sachs, Citigroup Global Markets, Deutsche Bank Securities, UBS Warburg, and Morgan Stanley Dean Witter. Commissions paid to these firms together represented approximately 43% of the total brokerage commissions paid for the year ended April 30, 2006.
Commissions paid to the next 10 firms together represented approximately 39% of the total brokerage commissions paid during the period. These firms are (in alphabetical order) Bank of America, Bear Stearns & Company, Credit Suisse First Boston, JP Morgan Clearing, Lazard Freres & Co., Lehman Brothers, Merrill Lynch, RBC Capital Markets, Sanford Bernstein, and Wachovia Securities.
Commission amounts do not include “mark-ups” paid on bond or derivative trades made directly with a dealer. Additional information about brokerage commissions is available on the Securities and Exchange Commission (SEC) Web site at www.sec.gov. Putnam funds disclose commissions by firm to the SEC in semiannual filings on Form N-SAR.
18
Your fund’s risk
This risk comparison is designed to help you understand how your fund compares with other funds. The comparison utilizes a risk measure developed by Morningstar, an independent fund-rating agency. This risk measure is referred to as the fund’s Overall Morningstar Risk.
Your fund’s Overall Morningstar® Risk
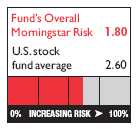
Your fund’s Overall Morningstar Risk is shown alongside that of the average fund in its broad asset class, as determined by Morningstar. The risk bar broadens the comparison by translating the fund’s Overall Morningstar Risk into a percentile, which is based on the fund’s ranking among all funds rated by Morningstar as of March 31, 2006. A higher Overall Morningstar Risk generally indicates that a fund’s monthly returns have varied more widely.
Morningstar determines a fund’s Overall Morningstar Risk by assessing variations in the fund’s monthly returns — with an emphasis on downside variations — over 3-, 5-, and 10-year periods, if available. Those measures are weighted and averaged to produce the fund’s Overall Morningstar Risk. The information shown is provided for the fund’s class A shares only; information for other classes may vary. Overall Morningstar Risk is based on historical data and does not indicate future results. Morningstar does not purport to measure the risk associated with a current investment in a fund, either on an absolute basis or on a relative basis. Low Overall Morningstar Risk does not mean that you cannot lose money on an investment in a fund. Copyright 2006 Morningstar, Inc. All Rights Reserved. The information contained herein (1) is proprietary to Morningstar and/or its content providers; (2) may not be copied or distributed; and (3) is not warranted to be accurate, complete, or timely. Neither Morningstar nor its content providers are responsible for any damages or losses arising from any use of this information.
19
Your fund is managed by the members of the Putnam Large-Cap Value Team. Joshua Brooks and Eric Harthun are Portfolio Leaders, and David King is a Portfolio Member of the fund. The Portfolio Leaders and Portfolio Member coordinate the team’s management of the fund.
For a complete listing of the members of the Putnam Large-Cap Value Team, including those who are not Portfolio Leaders or Portfolio Members of your fund, visit Putnam’s Individual Investor Web site at www.putnam.com.
Fund ownership by the Portfolio Leaders and Portfolio Member
The table below shows how much the fund’s current Portfolio Leaders and Portfolio Member have invested in the fund (in dollar ranges). Information shown is as of April 30, 2006, and April 30, 2005.
| | | | $1 – | $10,001 – | $50,001 – | $100,001 – | $500,001 – | $1,000,001 |
| | Year | $0 | $10,000 | $50,000 | $100,000 | $500,000 | $1,000,000 | and over |
|
| Joshua Brooks | 2006 | | | | | * | | |
|
|
| Portfolio Leader | 2005 | | | | * | | | |
|
| Eric Harthun | N/A | | | | | | | |
|
|
| Portfolio Leader | N/A | | | | | | | |
|
| David King | 2006 | | | | | * | | |
|
|
| Portfolio Member | 2005 | | | | | * | | |
|
N/A indicates the individual became a Portfolio Leader or Portfolio Member after the reporting date.
20
Fund manager compensation
The total 2005 fund manager compensation that is attributable to your fund is approximately $5,000,000. This amount includes a portion of 2005 compensation paid by Putnam Management to the fund managers listed in this section for their portfolio management responsibilities, calculated based on the fund assets they manage taken as a percentage of the total assets they manage. The compensation amount also includes a portion of the 2005 compensation paid to the Group Chief Investment Officer of the fund’s broader investment category for his oversight responsibilities, calculated based on the fund assets he oversees taken as a percentage of the total assets he oversees. This amount does not include compensation of other personnel involved in research, trading, administration, systems, compliance, or fund operations; nor does it include non-compensation costs. These percentages are determined as of the fund’s fiscal period-end. For personnel who joined Putnam Management during or after 2005, the calculation reflects annualized 2005 compensation or an estimate of 2006 compensation, as applicable.
Other Putnam funds managed by the Portfolio Leaders and Portfolio Member
Joshua Brooks is also a Portfolio Leader of Putnam Research Fund.
David King is also a Portfolio Leader of Putnam Convertible Income-Growth Trust, Putnam High Income Securities Fund, and Putnam New Value Fund.
Joshua Brooks, Eric Harthun, and David King may also manage other accounts and variable trust funds advised by Putnam Management or an affiliate.
Changes in your fund’s Portfolio Leader and Portfolio Members
During the year ended April 30, 2006, Joshua Brooks joined the fund’s management team as a Portfolio Member. Following the end of the period, Joshua Brooks became a Portfolio Leader of the fund, together with Portfolio Leader Eric Harthun, who moved into this role from another management position within Putnam. These changes followed the post-period-end departure of Portfolio Leader Hugh Mullin and Portfolio Member Christopher Miller from your fund’s management team.
21
Fund ownership by Putnam’s Executive Board
The table below shows how much the members of Putnam’s Executive Board have invested in the fund (in dollar ranges). Information shown is as of April 30, 2006, and April 30, 2005.
| | | | $1 – | $10,001 – | $50,001– | $100,001 |
| | Year | $0 | $10,000 | $50,000 | $100,000 | and over |
|
| Philippe Bibi | 2006 | * | | | | |
|
|
| Chief Technology Officer | 2005 | * | | | | |
|
| Joshua Brooks | 2006 | | | | | * |
|
|
| Deputy Head of Investments | 2005 | | | | * | |
|
| William Connolly | 2006 | | | * | | |
|
|
| Head of Retail Management | N/A | | | | | |
|
| Kevin Cronin | 2006 | * | | | | |
|
|
| Head of Investments | 2005 | * | | | | |
|
| Charles Haldeman, Jr. | 2006 | | | * | | |
|
|
| President and CEO | 2005 | | | * | | |
|
| Amrit Kanwal | 2006 | * | | | | |
|
|
| Chief Financial Officer | 2005 | * | | | | |
|
| Steven Krichmar | 2006 | * | | | | |
|
|
| Chief of Operations | 2005 | * | | | | |
|
| Francis McNamara, III | 2006 | | * | | | |
|
|
| General Counsel | 2005 | | * | | | |
|
| Richard Robie, III | 2006 | * | | | | |
|
|
| Chief Administrative Officer | 2005 | * | | | | |
|
| Edward Shadek | 2006 | * | | | | |
|
|
| Deputy Head of Investments | 2005 | * | | | | |
|
| Sandra Whiston | 2006 | * | | | | |
|
|
| Head of Institutional Management | N/A | | | | | |
|
N/A indicates the individual was not a member of Putnam’s Executive Board as of 4/30/05.
22
Total return shows how the value of the fund’s shares changed over time, assuming you held the shares through the entire period and reinvested all distributions in the fund.
Net asset value (NAV) is the price, or value, of one share of a mutual fund, without a sales charge. NAVs fluctuate with market conditions. NAV is calculated by dividing the net assets of each class of shares by the number of outstanding shares in the class.
Public offering price (POP) is the price of a mutual fund share plus the maximum sales charge levied at the time of purchase. POP performance figures shown here assume the 5.25% maximum sales charge for class A shares and 3.25% for class M shares.
Contingent deferred sales charge (CDSC) is a charge applied at the time of the redemption of class B or C shares and assumes redemption at the end of the period. Your fund’s class B CDSC declines from a 5% maximum during the first year to 1% during the sixth year. After the sixth year, the CDSC no longer applies. The CDSC for class C shares is 1% for one year after purchase.
Class A shares are generally subject to an initial sales charge and no sales charge on redemption (except on certain redemptions of shares bought without an initial sales charge).
Class B shares may be subject to a sales charge upon redemption.
Class C shares are not subject to an initial sales charge and are subject to a contingent deferred sales charge only if the shares are redeemed during the first year.
Class M shares have a lower initial sales charge and a higher 12b-1 fee than class A shares and no sales charge on redemption (except on certain redemptions of shares bought without an initial sales charge).
Class R shares are not subject to an initial sales charge or CDSC and are available only to certain defined contribution plans.
Class Y shares are not subject to an initial sales charge or CDSC, and carry no 12b-1 fee. They are only available to eligible purchasers, including eligible defined contribution plans or corporate IRAs.
23
Lehman Aggregate Bond Index is an unmanaged index of U.S. investment-grade fixed-income securities.
Lehman Intermediate Treasury Bond Index is an unmanaged index of U.S. Treasury securities with maturities between 1 and 10 years.
Lehman Municipal Bond Index is an unmanaged index of long-term fixed-rate investment-grade tax-exempt bonds.
Morgan Stanley Capital International (MSCI) World Index is an unmanaged index of equity securities from developed countries.
Russell 1000 Growth Index is an unmanaged index of those companies in the large-cap Russell 1000 Index chosen for their growth orientation.
S&P 500/Citigroup Value Index is an unmanaged capitalization-weighted index of large-cap stocks chosen for their value orientation.
S&P 500 Index is an unmanaged index of common stock performance.
Indexes assume reinvestment of all distributions and do not account for fees. Securities and performance of a fund and an index will differ. You cannot invest directly in an index.
Lipper is a third-party industry-ranking entity that ranks mutual funds. Its rankings do not reflect sales charges. Lipper rankings are based on total return at net asset value relative to other funds that have similar current investment styles or objectives as determined by Lipper. Lipper may change a fund’s category assignment at its discretion. Lipper category averages reflect performance trends for funds within a category.
24
Trustee approval of
management contract
|
General conclusions
The Board of Trustees of the Putnam funds oversees the management of each fund and, as required by law, determines annually whether to approve the continuance of your fund’s management contract with Putnam Management. In this regard, the Board of Trustees, with the assistance of its Contract Committee consisting solely of Trustees who are not “interested persons” (as such term is defined in the Investment Company Act of 1940, as amended) of the Putnam funds (the “Independent Trustees”), requests and evaluates all information it deems reasonably necessary under the circumstances. Over the course of several months beginning in March and ending in June 2005, the Contract Committee met five times to consider the information provided by Putnam Management and other information developed with the assistance of the Board’s independent counsel and independent staff. The Contract Committee reviewed and discussed key aspects of this information with all of the Independent Trustees. Upon completion of this review, the Contract Committee recommended and the Independent Trustees approved the continuance of your fund’s management contract, effective July 1, 2005.
This approval was based on the following conclusions:
| * | That the fee schedule currently in effect for your fund represents reasonable compensation in |
| light of the nature and quality of the services being provided to the fund, the fees paid by |
| competitive funds and the costs incurred by Putnam Management in providing such services, and |
* | That such fee schedule represents an appropriate sharing between fund shareholders and |
| Putnam Management of such economies of scale as may exist in the management of the fund |
| at current asset levels. |
These conclusions were based on a comprehensive consideration of all information provided to the Trustees and were not the result of any single factor. Some of the factors that figured particularly in the Trustees’ deliberations and how the Trustees considered these factors are described below, although individual Trustees may have evaluated the information presented differently, giving different weights to various factors. It is also important to recognize that the fee arrangements for your fund and the other Putnam funds are the result of many years of review and discussion between the Independent Trustees and Putnam Management, that certain aspects of such arrangements may receive greater scrutiny in some years than others, and that the Trustees’ conclusions may be based, in part, on their consideration of these same arrangements in prior years.
25
Model fee schedules and categories; total expenses
The Trustees’ review of the management fees and total expenses of the Putnam funds focused on three major themes:
* Consistency. The Trustees, working in cooperation with Putnam Management, have developed and implemented a series of model fee schedules for the Putnam funds designed to ensure that each fund’s management fee is consistent with the fees for similar funds in the Putnam family of funds and compares favorably with fees paid by competitive funds sponsored by other investment advisors. Under this approach, each Putnam fund is assigned to one of several fee categories based on a combination of factors, including competitive fees and perceived difficulty of management, and a common fee schedule is implemented for all funds in a given fee category. The Trustees reviewed the model fee schedule then in effect for your fund, including fee levels and breakpoints, and the assignment of the fund to a particular fee category under this structure. (“Breakpoints” refer to reductions in fee rates that apply to additional assets once specified asset levels are reached.) The Trustees concluded that no changes should be made in the fund’s current fee schedule at this time.
* Competitiveness. The Trustees also reviewed comparative fee and expense information for competitive funds, which indicated that, in a custom peer group of competitive funds selected by Lipper Inc., your fund ranked in the 8th percentile in management fees and in the 8th percentile in total expenses (less any applicable 12b-1 fees) as of December 31, 2004 (the first percentile being the least expensive funds and the 100th percentile being the most expensive funds). (Because the fund’s custom peer group is smaller than the fund’s broad Lipper Inc. peer group, this expense comparison may differ from the Lipper peer expense information found elsewhere in this report.) The Trustees noted that expense ratios for a number of Putnam funds, which show the percentage of fund assets used to pay for management and administrative services, distribution (12b-1) fees and other expenses, had been increasing recently as a result of declining net assets and the natural operation of fee breakpoints. They noted that such expense ratio increases were currently being controlled by expense limitations implemented in January 2004 and which Putnam Management, in consultation with the Contract Committee, has committed to maintain at least through 2006. The Trustees expressed their intention to monitor this information closely to ensure that fees and expenses of the Putnam funds continue to meet evolving competitive standards.
* Economies of scale. The Trustees concluded that the fee schedule currently in effect for your fund represents an appropriate sharing of economies of scale at current asset levels. Your fund currently has the benefit of breakpoints in its management fee that provide shareholders with significant economies of scale, which means that the effective management fee rate of a fund (as a percentage of fund assets) declines as a fund grows in size and crosses specified asset thresholds. The Trustees examined the existing breakpoint structure of the Putnam funds’ management fees in light of competitive industry practices. The Trustees considered
26
various possible modifications to the Putnam funds’ current breakpoint structure, but ultimately concluded that the current breakpoint structure continues to serve the interests of fund shareholders. Accordingly, the Trustees continue to believe that the fee schedules currently in effect for the funds represent an appropriate sharing of economies of scale at current asset levels. The Trustees noted that significant redemptions in many Putnam funds, together with significant changes in the cost structure of Putnam Management, have altered the economics of Putnam Management’s business in significant ways. In view of these changes, the Trustees intend to consider whether a greater sharing of the economies of scale by fund shareholders would be appropriate if and when aggregate assets in the Putnam funds begin to experience meaningful growth.
In connection with their review of the management fees and total expenses of the Putnam funds, the Trustees also reviewed the costs of the services to be provided and profits to be realized by Putnam Management and its affiliates from the relationship with the funds. This information included trends in revenues, expenses and profitability of Putnam Management and its affiliates relating to the investment management and distribution services provided to the funds. In this regard, the Trustees also reviewed an analysis of Putnam Management’s revenues, expenses and profitability with respect to the funds’ management contracts, allocated on a fund-by-fund basis.
The quality of the investment process provided by Putnam Management represented a major factor in the Trustees’ evaluation of the quality of services provided by Putnam Management under your fund’s management contract. The Trustees were assisted in their review of the funds’ investment process and performance by the work of the Investment Oversight Committees of the Trustees, which meet on a regular monthly basis with the funds’ portfolio teams throughout the year. The Trustees concluded that Putnam Management generally provides a high quality investment process — as measured by the experience and skills of the individuals assigned to the management of fund portfolios, the resources made available to such personnel, and in general the ability of Putnam Management to attract and retain high-quality personnel — but also recognize that this does not guarantee favorable investment results for every fund in every time period. The Trustees considered the investment performance of each fund over multiple time periods and considered information comparing the fund’s performance with various benchmarks and with the performance of competitive funds. The Trustees noted the satisfactory investment performance of many Putnam funds. They also noted the disappointing investment performance of certain funds in recent years and continued to discuss with senior management of Putnam Management the factors contributing to such underperformance and actions being taken to improve performance. The Trustees recognized that, in recent years, Putnam Management has made significant changes in its investment personnel and processes and in the fund product line to address areas of underperformance. The Trustees indicated their intention to continue to
27
monitor performance trends to assess the effectiveness of these changes and to evaluate whether additional remedial changes are warranted.
In the case of your fund, the Trustees considered that your fund’s class A share cumulative total return performance at net asset value was in the following percentiles of its Lipper Inc. peer group (Lipper Large-Cap Value Funds) for the one-, three- and five-year periods ended December 31, 2004 (the first percentile being the best-performing funds and the 100th percentile being the worst-performing funds):
| One-year period | Three-year period | Five-year period |
|
| 63rd | 54th | 55th |
(Because of the passage of time, these performance results may differ from the performance results for more recent periods shown elsewhere in this report. Over the one-, three-, and five-year periods ended December 31, 2004, there were 419, 319, and 220 funds, respectively, in your fund’s Lipper peer group.* Past performance is no guarantee of future performance.)
As a general matter, the Trustees believe that cooperative efforts between the Trustees and Putnam Management represent the most effective way to address investment performance problems. The Trustees believe that investors in the Putnam funds have, in effect, placed their trust in the Putnam organization, under the oversight of the funds’ Trustees, to make appropriate decisions regarding the management of the funds. Based on the responsiveness of Putnam Management in the recent past to Trustee concerns about investment performance, the Trustees believe that it is preferable to seek change within Putnam Management to address performance shortcomings. In the Trustees’ view, the alternative of terminating a management contract and engaging a new investment advisor for an underperforming fund would entail significant disruptions and would not provide any greater assurance of improved investment performance.
Brokerage and soft-dollar allocations; other benefits
The Trustees considered various potential benefits that Putnam Management may receive in connection with the services it provides under the management contract with your fund. These include principally benefits related to brokerage and soft-dollar allocations, whereby a portion of the commissions paid by a fund for brokerage is earmarked to pay for research services that may be utilized by a fund’s investment advisor, subject to the obligation to seek best execution. The Trustees believe that soft-dollar credits and other potential benefits associated with the allocation of fund brokerage, which pertains mainly to funds investing in equity securities, represent assets of the funds that should be used for the benefit of fund shareholders. This area has been
* The percentile rankings for your fund’s class A share annualized total return performance in the Lipper Large-Cap Value Funds category for the one-, five-, and ten-year periods ended March 31, 2006, were 55%, 66%, and 67%, respectively. Over the one-, five-, and ten-year periods ended March 31, 2006, the fund ranked 271st out of 495, 184th out of 281, and 82nd out of 122 funds, respectively. Note that this more recent information was not available when the Trustees approved the continuance of your fund’s management contract.
28
marked by significant change in recent years. In July 2003, acting upon the Contract Committee’s recommendation, the Trustees directed that allocations of brokerage to reward firms that sell fund shares be discontinued no later than December 31, 2003. In addition, commencing in 2004, the allocation of brokerage commissions by Putnam Management to acquire research services from third-party service providers has been significantly reduced, and continues at a modest level only to acquire research that is customarily not available for cash. The Trustees will continue to monitor the allocation of the funds’ brokerage to ensure that the principle of “best price and execution” remains paramount in the portfolio trading process.
The Trustees’ annual review of your fund’s management contract also included the review of its distributor’s contract and distribution plan with Putnam Retail Management Limited Partnership and the custodian agreement and investor servicing agreement with Putnam Fiduciary Trust Company, all of which provide benefits to affiliates of Putnam Management.
Comparison of retail and institutional fee schedules
The information examined by the Trustees as part of their annual contract review has included for many years information regarding fees charged by Putnam Management and its affiliates to institutional clients such as defined benefit pension plans, college endowments, etc. This information included comparison of such fees with fees charged to the funds, as well as a detailed assessment of the differences in the services provided to these two types of clients. The Trustees observed, in this regard, that the differences in fee rates between institutional clients and the mutual funds are by no means uniform when examined by individual asset sectors, suggesting that differences in the pricing of investment management services to these types of clients reflect to a substantial degree historical competitive forces operating in separate market places. The Trustees considered the fact that fee rates across all asset sectors are higher on average for mutual funds than for institutional clients, as well as the differences between the services that Putnam Management provides to the Putnam funds and those that it provides to institutional clients of the firm, but have not relied on such comparisons to any significant extent in concluding that the management fees paid by your fund are reasonable.
29
Other information
for shareholders
|
Important notice regarding delivery of shareholder documents
In accordance with SEC regulations, Putnam sends a single copy of annual and semiannual shareholder reports, prospectuses, and proxy statements to Putnam shareholders who share the same address, unless a shareholder requests otherwise. If you prefer to receive your own copy of these documents, please call Putnam at 1-800-225-1581, and Putnam will begin sending individual copies within 30 days.
Proxy voting
Putnam is committed to managing our mutual funds in the best interests of our shareholders. The Putnam funds’ proxy voting guidelines and procedures, as well as information regarding how your fund voted proxies relating to portfolio securities during the 12-month period ended June 30, 2005, are available on the Putnam Individual Investor Web site, www.putnam.com/individual, and on the SEC’s Web site, www.sec.gov. If you have questions about finding forms on the SEC’s Web site, you may call the SEC at 1-800-SEC-0330. You may also obtain the Putnam funds’ proxy voting guidelines and procedures at no charge by calling Putnam’s Shareholder Services at 1-800-225-1581.
Fund portfolio holdings
The fund will file a complete schedule of its portfolio holdings with the SEC for the first and third quarters of each fiscal year on Form N-Q. Shareholders may obtain the fund’s Forms N-Q on the SEC’s Web site at www.sec.gov. In addition, the fund’s Forms N-Q may be reviewed and copied at the SEC’s Public Reference Room in Washington, D.C. You may call the SEC at 1-800-SEC-0330 for information about the SEC’s Web site or the operation of the Public Reference Room.
30
A guide to financial statements
|
These sections of the report, as well as the accompanying Notes, constitute the fund’s financial statements.
The fund’s portfolio lists all the fund’s investments and their values as of the last day of the reporting period. Holdings are organized by asset type and industry sector, country, or state to show areas of concentration and diversification.
Statement of assets and liabilities shows how the fund’s net assets and share price are determined. All investment and noninvestment assets are added together. Any unpaid expenses and other liabilities are subtracted from this total. The result is divided by the number of shares to determine the net asset value per share, which is calculated separately for each class of shares. (For funds with preferred shares, the amount subtracted from total assets includes the liquidation preference of preferred shares.)
Statement of operations shows the fund’s net investment gain or loss. This is done by first adding up all the fund’s earnings — from dividends and interest income — and subtracting its operating expenses to determine net investment income (or loss). Then, any net gain or loss the fund realized on the sales of its holdings — as well as any unrealized gains or losses over the period — is added to or subtracted from the net investment result to determine the fund’s net gain or loss for the fiscal period.
Statement of changes in net assets shows how the fund’s net assets were affected by the fund’s net investment gain or loss, by distributions to shareholders, and by changes in the number of the fund’s shares. It lists distributions and their sources (net investment income or realized capital gains) over the current reporting period and the most recent fiscal year-end. The distributions listed here may not match the sources listed in the Statement of operations because the distributions are determined on a tax basis and may be paid in a different period from the one in which they were earned. Dividend sources are estimated at the time of declaration. Actual results may vary. Any non-taxable return of capital cannot be determined until final tax calculations are completed after the end of the fund’s fiscal year.
Financial highlights provide an overview of the fund’s investment results, per-share distributions, expense ratios, net investment income ratios, and portfolio turnover in one summary table, reflecting the five most recent reporting periods. In a semiannual report, the highlight table also includes the current reporting period.
31
| The fund’s portfolio 4/30/06 (Unaudited) | | | |
|
| COMMON STOCKS (99.7%)* | | | |
|
| | Shares | | Value |
|
| Aerospace and Defense (2.3%) | | | |
| Boeing Co. (The) | 137,800 | $ | 11,499,410 |
| Lockheed Martin Corp. | 3,270,900 | | 248,261,310 |
| United Technologies Corp. (S) | 1,609,600 | | 101,098,976 |
| | | | 360,859,696 |
|
| |
| Airlines (0.6%) | | | |
| Southwest Airlines Co. | 5,776,828 | | 93,700,150 |
|
| |
| Automotive (0.7%) | | | |
| Ford Motor Co. (S) | 8,060,000 | | 56,017,000 |
| General Motors Corp. (S) | 2,174,000 | | 49,741,120 |
| | | | 105,758,120 |
|
| |
| Banking (10.0%) | | | |
| Bank of America Corp. | 13,006,200 | | 649,269,504 |
| Commerce Bancorp, Inc. | 556,800 | | 22,461,312 |
| PNC Financial Services Group (S) | 333,400 | | 23,828,098 |
| U.S. Bancorp (S) | 10,334,000 | | 324,900,960 |
| Washington Mutual, Inc. | 5,751,200 | | 259,149,072 |
| Wells Fargo & Co. | 4,052,900 | | 278,393,701 |
| | | | 1,558,002,647 |
|
| |
| Beverage (0.9%) | | | |
| Coca-Cola Enterprises, Inc. (S) | 4,071,000 | | 79,506,630 |
| Pepsi Bottling Group, Inc. (The) (S) | 2,089,200 | | 67,063,320 |
| | | | 146,569,950 |
|
| |
| Broadcasting (—%) | | | |
| CBS Corp. Class B | 18,100 | | 461,007 |
|
| |
| Building Materials (1.5%) | | | |
| Masco Corp. | 4,277,200 | | 136,442,680 |
| Sherwin-Williams Co. (The) | 1,921,400 | | 97,876,116 |
| Vulcan Materials Co. | 16,700 | | 1,418,832 |
| | | | 235,737,628 |
|
| |
| Cable Television (0.4%) | | | |
| Comcast Corp. Class A † (S) | 1,772,700 | | 54,865,065 |
|
| |
| Chemicals (1.7%) | | | |
| E.I. du Pont de Nemours & Co. | 2,666,900 | | 117,610,290 |
| Huntsman Corp. † | 2,445,500 | | 48,054,075 |
| Rohm & Haas Co. | 1,961,457 | | 99,249,724 |
| | | | 264,914,089 |
32
| COMMON STOCKS (99.7%)* continued | | | |
|
| | Shares | | Value |
|
| Commercial and Consumer Services (0.6%) | | | |
| Cendant Corp. | 5,537,600 | $ | 96,520,368 |
|
| |
| Communications Equipment (0.4%) | | | |
| Cisco Systems, Inc. † | 2,953,400 | | 61,873,730 |
|
| |
| Computers (3.7%) | | | |
| Dell, Inc. † (S) | 3,695,900 | | 96,832,580 |
| Hewlett-Packard Co. (S) | 9,225,100 | | 299,538,997 |
| IBM Corp. (S) | 2,275,000 | | 187,323,500 |
| | | | 583,695,077 |
|
| |
| Conglomerates (4.5%) | | | |
| 3M Co. | 2,800,000 | | 239,204,000 |
| Textron, Inc. (S) | 1,523,005 | | 136,994,300 |
| Tyco International, Ltd. (Bermuda) | 12,119,300 | | 319,343,555 |
| | | | 695,541,855 |
|
| |
| Consumer Finance (3.0%) | | | |
| Capital One Financial Corp. | 2,859,400 | | 247,738,416 |
| Countrywide Financial Corp. | 5,351,700 | | 217,600,122 |
| | | | 465,338,538 |
|
| |
| Consumer Goods (0.6%) | | | |
| Avon Products, Inc. (S) | 2,968,190 | | 96,792,676 |
| Newell Rubbermaid, Inc. (S) | 74,200 | | 2,034,564 |
| | | | 98,827,240 |
|
| |
| Consumer Services (0.1%) | | | |
| Ceridian Corp. † (S) | 17,500 | | 424,025 |
| Service Corporation International | 1,285,600 | | 10,349,080 |
| | | | 10,773,105 |
|
| |
| Containers (0.1%) | | | |
| Owens-Illinois, Inc. † | 673,040 | | 12,303,171 |
|
| |
| Electric Utilities (4.0%) | | | |
| Constellation Energy Group, Inc. | 320,000 | | 17,574,400 |
| Entergy Corp. | 1,605,505 | | 112,289,020 |
| Exelon Corp. | 3,624,274 | | 195,710,796 |
| Great Plains Energy, Inc. (S) | 312,439 | | 8,826,402 |
| PG&E Corp. (S) | 5,478,600 | | 218,267,424 |
| Sierra Pacific Resources † | 1,943,300 | | 27,439,396 |
| Wisconsin Energy Corp. | 1,006,700 | | 39,311,635 |
| | | | 619,419,073 |
|
| |
| Electronics (2.2%) | | | |
| Intel Corp. | 15,257,200 | | 304,838,856 |
| Micron Technology, Inc. † | 2,236,700 | | 37,956,799 |
| | | | 342,795,655 |
33
| COMMON STOCKS (99.7%)* continued | | | |
|
| | Shares | | Value |
|
| Energy (1.4%) | | | |
| BJ Services Co. | 1,920,000 | $ | 73,056,000 |
| Pride International, Inc. † (S) | 2,115,000 | | 73,792,350 |
| Rowan Cos., Inc. (S) | 695,000 | | 30,809,350 |
| Weatherford International, Ltd. † | 905,200 | | 47,912,236 |
| | | | 225,569,936 |
|
| |
| Financial (6.3%) | | | |
| Allied Capital Corp. (S) | 31,858 | | 989,509 |
| Citigroup, Inc. | 11,427,200 | | 570,788,640 |
| Fannie Mae | 2,586,500 | | 130,876,900 |
| Freddie Mac (S) | 2,567,600 | | 156,777,656 |
| MGIC Investment Corp. (S) | 482,000 | | 34,077,400 |
| PMI Group, Inc. (The) (S) | 1,038,000 | | 47,903,700 |
| Radian Group, Inc. (S) | 660,100 | | 41,401,472 |
| | | | 982,815,277 |
|
| |
| Food (0.7%) | | | |
| General Mills, Inc. (S) | 61,570 | | 3,037,864 |
| Tyson Foods, Inc. Class A (S) | 7,168,288 | | 104,657,005 |
| | | | 107,694,869 |
|
| |
| Forest Products and Packaging (0.4%) | | | |
| Weyerhaeuser Co. | 979,600 | | 69,032,412 |
|
| |
| Health Care Services (3.0%) | | | |
| AmerisourceBergen Corp. (S) | 932,986 | | 40,258,346 |
| Cardinal Health, Inc. (S) | 1,867,600 | | 125,782,860 |
| CIGNA Corp. | 676,700 | | 72,406,900 |
| HCA, Inc. | 1,512,600 | | 66,388,014 |
| Humana, Inc. † (S) | 713,700 | | 32,244,966 |
| WellPoint, Inc. † | 1,822,800 | | 129,418,800 |
| | | | 466,499,886 |
|
| |
| Homebuilding (0.5%) | | | |
| Lennar Corp. (S) | 1,462,340 | | 80,326,336 |
|
| |
| Household Furniture and Appliances (0.5%) | | | |
| Whirlpool Corp. | 937,800 | | 84,167,550 |
|
| |
| Insurance (10.6%) | | | |
| ACE, Ltd. (Bermuda) | 3,971,500 | | 220,577,110 |
| American International Group, Inc. | 6,772,400 | | 441,899,100 |
| Berkshire Hathaway, Inc. Class B † | 80,559 | | 237,810,168 |
| Chubb Corp. (The) | 5,173,227 | | 266,628,120 |
| Everest Re Group, Ltd. (Barbados) (S) | 1,228,650 | | 111,807,150 |
| Genworth Financial, Inc. Class A | 4,542,220 | | 150,801,704 |
| Hartford Financial Services Group, Inc. (The) | 1,230,500 | | 113,119,865 |
| Prudential Financial, Inc. | 1,456,300 | | 113,780,719 |
| | | | 1,656,423,936 |
34
| COMMON STOCKS (99.7%)* continued | | | |
|
| | Shares | | Value |
|
| Investment Banking/Brokerage (1.8%) | | | |
| Bear Stearns Cos., Inc. (The) | 630,000 | $ | 89,781,300 |
| Goldman Sachs Group, Inc. (The) | 60,600 | | 9,713,574 |
| Morgan Stanley | 2,943,200 | | 189,247,760 |
| | | | 288,742,634 |
|
| |
| Leisure (0.8%) | | | |
| Brunswick Corp. | 3,346,100 | | 131,234,042 |
|
| |
| Lodging/Tourism (0.7%) | | | |
| Royal Caribbean Cruises, Ltd. | 2,613,200 | | 109,205,628 |
|
| |
| Machinery (1.9%) | | | |
| Deere (John) & Co. | 1,710,000 | | 150,103,800 |
| Parker-Hannifin Corp. | 1,833,500 | | 148,605,175 |
| | | | 298,708,975 |
|
| |
| Manufacturing (0.7%) | | | |
| Ingersoll-Rand Co., Ltd. Class A (Bermuda) (S) | 2,459,200 | | 107,590,000 |
|
| |
| Media (0.8%) | | | |
| Walt Disney Co. (The) | 4,707,600 | | 131,624,496 |
|
| |
| Medical Technology (1.8%) | | | |
| Baxter International, Inc. | 2,402,700 | | 90,581,790 |
| Becton, Dickinson and Co. | 1,600,700 | | 100,908,128 |
| Boston Scientific Corp. † | 3,105,600 | | 72,174,144 |
| PerkinElmer, Inc. | 522,300 | | 11,198,112 |
| | | | 274,862,174 |
|
| |
| Metals (1.4%) | | | |
| Alcoa, Inc. (S) | 945,200 | | 31,928,856 |
| Freeport-McMoRan Copper & Gold, Inc. Class B (S) | 1,160,200 | | 74,925,716 |
| Phelps Dodge Corp. | 570,000 | | 49,128,300 |
| United States Steel Corp. (S) | 847,800 | | 58,074,300 |
| | | | 214,057,172 |
|
| |
| Natural Gas Utilities (0.1%) | | | |
| Southern Union Co. | 660,598 | | 17,122,700 |
|
| |
| Oil & Gas (8.9%) | | | |
| Amerada Hess Corp. | 941,900 | | 134,946,013 |
| Apache Corp. (S) | 1,432,400 | | 101,757,696 |
| Chevron Corp. (S) | 787,300 | | 48,041,046 |
| Devon Energy Corp. | 1,820,800 | | 109,448,288 |
| Exxon Mobil Corp. | 9,216,580 | | 581,381,866 |
| Hugoton Royalty Trust | 70,626 | | 1,952,809 |
| Marathon Oil Corp. | 2,057,734 | | 163,301,770 |
| Newfield Exploration Co. † | 2,219,743 | | 99,000,538 |
| Occidental Petroleum Corp. | 318,500 | | 32,722,690 |
35
| COMMON STOCKS (99.7%)* continued | | | |
|
| | Shares | | Value |
|
| Oil & Gas continued | | | |
| Sunoco, Inc. | 655,000 | $ | 53,081,200 |
| Valero Energy Corp. | 284,600 | | 18,425,004 |
| XTO Energy, Inc. (S) | 1,185,000 | | 50,184,750 |
| | | | 1,394,243,670 |
|
| |
| Pharmaceuticals (6.0%) | | | |
| Barr Pharmaceuticals, Inc. † | 562,700 | | 34,071,485 |
| Johnson & Johnson | 6,067,400 | | 355,610,314 |
| Mylan Laboratories, Inc. | 1,668,900 | | 36,448,776 |
| Pfizer, Inc. | 19,064,200 | | 482,896,186 |
| Watson Pharmaceuticals, Inc. † | 1,206,300 | | 34,307,172 |
| | | | 943,333,933 |
|
| |
| Photography/Imaging (0.6%) | | | |
| Xerox Corp. † | 6,169,424 | | 86,618,713 |
|
| |
| Publishing (0.5%) | | | |
| R. R. Donnelley & Sons Co. (S) | 2,370,900 | | 79,875,621 |
|
| |
| Railroads (0.1%) | | | |
| Norfolk Southern Corp. | 424,100 | | 22,901,400 |
|
| |
| Regional Bells (0.8%) | | | |
| Verizon Communications, Inc. (S) | 3,890,500 | | 128,503,215 |
|
| |
| Restaurants (1.8%) | | | |
| McDonald’s Corp. | 5,176,000 | | 178,934,320 |
| Yum! Brands, Inc. | 1,885,000 | | 97,416,800 |
| | | | 276,351,120 |
|
| |
| Retail (4.9%) | | | |
| Foot Locker, Inc. | 460,400 | | 10,672,072 |
| Gap, Inc. (The) (S) | 4,299,000 | | 77,768,910 |
| Home Depot, Inc. (The) (S) | 5,715,400 | | 228,215,922 |
| Kroger Co. | 120,400 | | 2,439,304 |
| Office Depot, Inc. † (S) | 1,674,200 | | 67,939,036 |
| Rite Aid Corp. † | 4,977,984 | | 22,400,928 |
| Ross Stores, Inc. (S) | 1,907,500 | | 58,445,800 |
| Staples, Inc. | 2,785,000 | | 73,551,850 |
| Supervalu, Inc. | 3,211,800 | | 93,174,318 |
| Wal-Mart Stores, Inc. | 2,862,400 | | 128,893,872 |
| | | | 763,502,012 |
|
| |
| Software (1.5%) | | | |
| McAfee, Inc. † | 2,267,900 | | 59,169,511 |
| Oracle Corp. † | 7,191,000 | | 104,916,690 |
| Symantec Corp. † | 3,859,600 | | 63,220,248 |
| | | | 227,306,449 |
36
| COMMON STOCKS (99.7%)* continued | | | | |
|
| | | Shares | | Value |
|
| Technology Services (0.4%) | | | | |
| VeriSign, Inc. † | | 2,720,000 | $ | 63,974,400 |
|
| Telecommunications (2.1%) | | | | |
| Sprint Nextel Corp. | | 8,859,800 | | 219,723,040 |
| Vodafone Group PLC (United Kingdom) | | 45,465,000 | | 107,003,378 |
| | | | | 326,726,418 |
|
| Tobacco (0.5%) | | | | |
| Altria Group, Inc. | | 920,400 | | 67,336,464 |
| Loews Corp. - Carolina Group | | 65,800 | | 3,371,592 |
| | | | | 70,708,056 |
|
| Toys (0.1%) | | | | |
| Hasbro, Inc. | | 29,400 | | 579,474 |
| Mattel, Inc. | | 992,900 | | 16,065,122 |
| | | | | 16,644,596 |
|
| Waste Management (0.8%) | | | | |
| Waste Management, Inc. | | 3,232,800 | | 121,100,688 |
|
| Total common stocks (cost $12,502,768,615) | | | $ | 15,575,424,478 |
|
| |
| CONVERTIBLE PREFERRED STOCKS (0.1%)* (cost $12,583,981) | | |
|
| | | Shares | | Value |
|
| General Motors Corp. Ser. A, $1.13 cv. pfd. (S) | | 595,000 | $ | 14,131,250 |
|
| |
| SHORT-TERM INVESTMENTS (2.6%)* | | | | |
|
| | | Principal amount/shares | | Value |
|
| Short-term investments held as collateral for loaned | | | | |
| securities with yields ranging from 4.70% to 5.01% and | | | | |
| due dates ranging from May 1, 2006 to June 2, 2006 (d) | $ | 253,887,799 | $ | 253,589,425 |
| | | | |
| Putnam Prime Money Market Fund (e) | | 150,064,430 | | 150,064,430 |
|
| Total short-term investments (cost $403,653,855) | | | $ | 403,653,855 |
|
| |
| TOTAL INVESTMENTS | | | | |
|
| Total investments (cost $12,919,006,451) | | | $ | 15,993,209,583 |
|
* Percentages indicated are based on net assets of $15,624,638,093.
† Non-income-producing security.
(S) Securities on loan, in part or in entirety, at April 30, 2006.
(d) See Note 1 to the financial statements.
(e) See Note 5 to the financial statements regarding investments in Putnam Prime Money Market Fund.
The accompanying notes are an integral part of these financial statements.
37
| Statement of assets and liabilities 4/30/06 (Unaudited) | |
|
| |
| ASSETS | |
|
| Investment in securities, at value, including $245,981,065 of securities on loan (Note 1): | |
| Unaffiliated issuers (identified cost $12,768,942,021) | $15,843,145,153 |
| Affiliated issuers (identified cost $150,064,430) (Note 5) | 150,064,430 |
|
| Dividends, interest and other receivables | 17,144,653 |
|
| Receivable for shares of the fund sold | 3,157,927 |
|
| Receivable for securities sold | 178,162,653 |
|
| Receivable for variation margin (Note 1) | 53,971 |
|
| Total assets | 16,191,728,787 |
|
| |
| LIABILITIES | |
|
| Payable for securities purchased | 208,925,359 |
|
| Payable for shares of the fund repurchased | 78,658,142 |
|
| Payable for compensation of Manager (Notes 2 and 5) | 16,776,275 |
|
| Payable for investor servicing and custodian fees (Note 2) | 2,078,686 |
|
| Payable for Trustee compensation and expenses (Note 2) | 1,396,813 |
|
| Payable for administrative services (Note 2) | 27,618 |
|
| Payable for distribution fees (Note 2) | 4,321,927 |
|
| Collateral on securities loaned, at value (Note 1) | 253,589,425 |
|
| Other accrued expenses | 1,316,449 |
|
| Total liabilities | 567,090,694 |
|
| Net assets | $15,624,638,093 |
|
| |
| REPRESENTED BY | |
|
| Paid-in capital (Unlimited shares authorized) (Notes 1 and 4) | $11,589,271,388 |
|
| Undistributed net investment income (Note 1) | 20,505,937 |
|
| Accumulated net realized gain on investments (Note 1) | 940,657,636 |
|
| Net unrealized appreciation of investments | 3,074,203,132 |
|
| Total — Representing net assets applicable to capital shares outstanding | $15,624,638,093 |
| |
| (Continued on next page) | |
38
Statement of assets and liabilities (Continued)
| COMPUTATION OF NET ASSET VALUE AND OFFERING PRICE | |
|
| Net asset value and redemption price per class A share | |
| ($12,074,703,332 divided by 579,532,316 shares) | $20.84 |
|
| Offering price per class A share | |
| (100/94.75 of $20.84)* | $21.99 |
|
| Net asset value and offering price per class B share | |
| ($2,019,424,656 divided by 98,391,925 shares)** | $20.52 |
|
| Net asset value and offering price per class C share | |
| ($99,093,613 divided by 4,775,652 shares)** | $20.75 |
|
| Net asset value and redemption price per class M share | |
| ($118,024,754 divided by 5,702,980 shares) | $20.70 |
|
| Offering price per class M share | |
| (100/96.75 of $20.70)* | $21.40 |
|
| Net asset value, offering price and redemption price per class R share | |
| ($1,055,173 divided by 50,796 shares) | $20.77 |
|
| Net asset value, offering price and redemption price per class Y share | |
| ($1,312,336,565 divided by 62,849,922 shares) | $20.88 |
* On single retail sales of less than $50,000. On sales of $50,000 or more and on group sales, the offering price is reduced.
** Redemption price per share is equal to net asset value less any applicable contingent deferred sales charge.
The accompanying notes are an integral part of these financial statements.
39
Statement of operations Six months ended 4/30/06 (Unaudited)
| INVESTMENT INCOME | |
|
| Dividends (net of foreign tax of $8,952) | $ 174,930,805 |
|
| Interest (including interest income of $3,176,849 | |
| from investments in affiliated issuers) (Note 5) | 4,146,616 |
|
| Securities lending | 600,098 |
|
| Total investment income | 179,677,519 |
|
| |
| EXPENSES | |
|
| Compensation of Manager (Note 2) | 34,433,968 |
|
| Investor servicing fees (Note 2) | 13,880,642 |
|
| Custodian fees (Note 2) | 276,871 |
|
| Trustee compensation and expenses (Note 2) | 300,049 |
|
| Administrative services (Note 2) | 135,280 |
|
| Distribution fees — Class A (Note 2) | 14,777,130 |
|
| Distribution fees — Class B (Note 2) | 11,326,407 |
|
| Distribution fees — Class C (Note 2) | 493,939 |
|
| Distribution fees — Class M (Note 2) | 451,192 |
|
| Distribution fees — Class R (Note 2) | 2,175 |
|
| Other | 1,565,830 |
|
| Non-recurring costs (Notes 2 and 6) | 105,558 |
|
| Costs assumed by Manager (Notes 2 and 6) | (105,558) |
|
| Fees waived and reimbursed by Manager or affiliate (Notes 5 and 6) | (4,825,612) |
|
| Total expenses | 72,817,871 |
|
| Expense reduction (Note 2) | (1,561,691) |
|
| Net expenses | 71,256,180 |
|
| Net investment income | 108,421,339 |
|
| Net realized gain on investments (Notes 1 and 3) | 1,107,319,330 |
|
| Net realized loss on futures contracts (Note 1) | (2,082,268) |
|
| Net realized gain on written options (Notes 1 and 3) | 360,177 |
|
| Net unrealized appreciation of investments | |
| and written options during the period | 301,052,278 |
|
| Net gain on investments | 1,406,649,517 |
|
| Net increase in net assets resulting from operations | $1,515,070,856 |
The accompanying notes are an integral part of these financial statements.
40
| Statement of changes in net assets | |
|
| |
| INCREASE (DECREASE) IN NET ASSETS | | |
|
| | Six months ended | Year ended |
| | 4/30/06* | 10/31/05 |
|
| Operations: | | |
| Net investment income | $ 108,421,339 | $ 197,445,507 |
|
| Net realized gain on investments | | |
| and foreign currency transactions | 1,105,597,239 | 1,364,551,878 |
|
| Net unrealized appreciation (depreciation) of investments | 301,052,278 | (52,404,731) |
|
| Net increase in net assets resulting from operations | 1,515,070,856 | 1,509,592,654 |
|
| Distributions to shareholders: (Note 1) | | |
|
| From net investment income | | |
|
| Class A | (73,540,001) | (154,712,608) |
|
| Class B | (5,560,532) | (16,356,062) |
|
| Class C | (248,515) | (544,388) |
|
| Class M | (452,286) | (1,083,003) |
|
| Class R | (4,270) | (4,690) |
|
| Class Y | (9,579,330) | (25,339,143) |
|
| From net realized long-term gain on investments | | |
|
| Class A | (238,273,088) | (15,806,964) |
|
| Class B | (49,283,159) | (3,561,864) |
|
| Class C | (2,020,008) | (134,581) |
|
| Class M | (2,533,988) | (175,480) |
|
| Class R | (15,442) | (900) |
|
| Class Y | (25,624,824) | (1,833,997) |
|
| Redemption fees (Note 1) | 14,334 | 34,351 |
|
| Decrease from capital share transactions (Note 4) | (1,072,443,045) | (3,219,558,786) |
|
| Total increase (decrease) in net assets | 35,506,702 | (1,929,485,461) |
|
| |
| NET ASSETS | | |
|
| Beginning of period | 15,589,131,391 | 17,518,616,852 |
|
| End of period (including undistributed net investment | | |
| income of $20,505,937 and $1,469,532, respectively) | $15,624,638,093 | $15,589,131,391 |
* Unaudited The accompanying notes are an integral part of these financial statements.
41
| Financial highlights | (For a common share outstanding throughout the period) | | | | | | | | | | |
|
| |
| INVESTMENT OPERATIONS: | | | | | LESS DISTRIBUTIONS: | | | | | | | RATIOS AND SUPPLEMENTAL DATA: | |
| | | | Net | | | | | | | | | Total | | | | Ratio of net | |
| | Net asset | | realized and | Total | | From | From | | | | Net asset | return | | Net | Ratio of | investment | |
| | value, | Net | unrealized | from | | net | net realized | | | | value, | at net | | assets, | expenses to | income (loss) | Portfolio |
| | beginning | investment | gain (loss) on | investment | | investment | gain on | Total | | Redemption | end | asset | | end of period | average net | to average | turnover |
| Period ended | of period | income (loss)(a) | investments | operations | | income | investments | distributions | | fees | of period | value (%)(b) | | (in thousands) | assets (%)(c) | net assets (%) | (%) |
| |
| CLASS A | | | | | | | | | | | | | | | | | |
| April 30, 2006** | $19.42 | .15(d,g) | 1.80 | 1.95 | | (.13) | (.40) | (.53) | | —(e) | $20.84 | 10.18*(g) | | $12,074,703 | .41*(d,g) | .73*(d,g) | 32.28* |
| October 31, 2005 | 18.07 | .24(d,f ) | 1.38 | 1.62 | | (.24) | (.03) | (.27) | | —(e) | 19.42 | 8.96(f) | | 11,616,127 | .89(d) | 1.26(d,f ) | 52.80 |
| October 31, 2004 | 16.57 | .22(d) | 1.53 | 1.75 | | (.25) | — | (.25) | | —(e) | 18.07 | 10.63 | | 12,154,652 | .92(d) | 1.25(d) | 29.44 |
| October 31, 2003 | 13.95 | .23 | 2.59 | 2.82 | | (.20) | — | (.20) | | — | 16.57 | 20.40 | | 14,580,763 | .90 | 1.53 | 32.71 |
| October 31, 2002 | 16.86 | .22 | (2.60) | (2.38) | | (.21) | (.32) | (.53) | | — | 13.95 | (14.71) | | 14,095,214 | .86 | 1.33 | 29.94 |
| October 31, 2001 | 19.81 | .21 | (2.55) | (2.34) | | (.25) | (.36) | (.61) | | — | 16.86 | (12.15) | | 17,731,034 | .82 | 1.14 | 36.90 |
|
| |
| CLASS B | | | | | | | | | | | | | | | | | |
| April 30, 2006** | $19.13 | .07(d,g) | 1.77 | 1.84 | | (.05) | (.40) | (.45) | | —(e) | $20.52 | 9.75*(g) | | $2,019,425 | .79*(d,g) | .38*(d,g) | 32.28* |
| October 31, 2005 | 17.80 | .10(d,f) | 1.35 | 1.45 | | (.09) | (.03) | (.12) | | —(e) | 19.13 | 8.15(f) | | 2,427,671 | 1.64(d) | .55(d,f) | 52.80 |
| October 31, 2004 | 16.33 | .09(d) | 1.50 | 1.59 | | (.12) | — | (.12) | | —(e) | 17.80 | 9.77 | | 3,364,807 | 1.67(d) | .50(d) | 29.44 |
| October 31, 2003 | 13.75 | .11 | 2.56 | 2.67 | | (.09) | — | (.09) | | — | 16.33 | 19.51 | | 3,886,995 | 1.65 | .78 | 32.71 |
| October 31, 2002 | 16.62 | .09 | (2.56) | (2.47) | | (.08) | (.32) | (.40) | | — | 13.75 | (15.37) | | 4,009,396 | 1.61 | .56 | 29.94 |
| October 31, 2001 | 19.53 | .07 | (2.52) | (2.45) | | (.10) | (.36) | (.46) | | — | 16.62 | (12.80) | | 7,397,121 | 1.57 | .39 | 36.90 |
|
| |
| CLASS C | | | | | | | | | | | | | | | | | |
| April 30, 2006** | $19.34 | .07(d,g) | 1.79 | 1.86 | | (.05) | (.40) | (.45) | | —(e) | $20.75 | 9.76*(g) | | $99,094 | .79*(d,g) | .36*(d,g) | 32.28* |
| October 31, 2005 | 17.99 | .10(d,f) | 1.37 | 1.47 | | (.09) | (.03) | (.12) | | —(e) | 19.34 | 8.18(f ) | | 97,924 | 1.64(d) | .52(d,f ) | 52.80 |
| October 31, 2004 | 16.50 | .09(d) | 1.52 | 1.61 | | (.12) | — | (.12) | | —(e) | 17.99 | 9.76 | | 109,312 | 1.67(d) | .50(d) | 29.44 |
| October 31, 2003 | 13.90 | .12 | 2.57 | 2.69 | | (.09) | — | (.09) | | — | 16.50 | 19.44 | | 140,116 | 1.65 | .78 | 32.71 |
| October 31, 2002 | 16.79 | .09 | (2.58) | (2.49) | | (.08) | (.32) | (.40) | | — | 13.90 | (15.30) | | 132,854 | 1.61 | .57 | 29.94 |
| October 31, 2001 | 19.75 | .07 | (2.55) | (2.48) | | (.12) | (.36) | (.48) | | — | 16.79 | (12.84) | | 168,471 | 1.57 | .38 | 36.90 |
|
| |
| CLASS M | | | | | | | | | | | | | | | | | |
| April 30, 2006** | $19.29 | .10(d,g) | 1.78 | 1.88 | | (.07) | (.40) | (.47) | | —(e) | $20.70 | 9.92*(g) | | $118,025 | .66*(d,g) | .49*(d,g) | 32.28* |
| October 31, 2005 | 17.95 | .15(d,f) | 1.36 | 1.51 | | (.14) | (.03) | (.17) | | —(e) | 19.29 | 8.41(f) | | 123,425 | 1.39(d) | .78(d,f) | 52.80 |
| October 31, 2004 | 16.46 | .13(d) | 1.52 | 1.65 | | (.16) | — | (.16) | | —(e) | 17.95 | 10.06 | | 145,209 | 1.42(d) | .75(d) | 29.44 |
| October 31, 2003 | 13.86 | .15 | 2.58 | 2.73 | | (.13) | — | (.13) | | — | 16.46 | 19.78 | | 196,091 | 1.40 | 1.03 | 32.71 |
| October 31, 2002 | 16.75 | .13 | (2.58) | (2.45) | | (.12) | (.32) | (.44) | | — | 13.86 | (15.14) | | 205,097 | 1.36 | .82 | 29.94 |
| October 31, 2001 | 19.68 | .12 | (2.54) | (2.42) | | (.15) | (.36) | (.51) | | — | 16.75 | (12.58) | | 309,868 | 1.32 | .64 | 36.90 |
|
| |
| CLASS R | | | | | | | | | | | | | | | | | |
| April 30, 2006** | $19.36 | .12(d,g) | 1.79 | 1.91 | | (.10) | (.40) | (.50) | | —(e) | $20.77 | 10.04*(g) | | $1,055 | .54*(d,g) | .59*(d,g) | 32.28* |
| October 31, 2005 | 18.03 | .17(d,f ) | 1.40 | 1.57 | | (.21) | (.03) | (.24) | | —(e) | 19.36 | 8.70(f ) | | 729 | 1.14(d) | .90(d,f ) | 52.80 |
| October 31, 2004 | 16.58 | .18(d) | 1.50 | 1.68 | | (.23) | — | (.23) | | —(e) | 18.03 | 10.20 | | 191 | 1.17(d) | 1.00(d) | 29.44 |
| October 31, 2003† | 14.58 | .15 | 1.98 | 2.13 | | (.13) | — | (.13) | | — | 16.58 | 14.71* | | 1 | .90* | .99* | 32.71 |
|
| |
| CLASS Y | | | | | | | | | | | | | | | | | |
| April 30, 2006** | $19.46 | .18(d,g) | 1.79 | 1.97 | | (.15) | (.40) | (.55) | | —(e) | $20.88 | 10.30*(g) | | $1,312,337 | .29*(d,g) | .87*(d,g) | 32.28* |
| October 31, 2005 | 18.10 | .30(d,f ) | 1.38 | 1.68 | | (.29) | (.03) | (.32) | | —(e) | 19.46 | 9.28(f ) | | 1,323,254 | .64(d) | 1.54(d,f ) | 52.80 |
| October 31, 2004 | 16.61 | .26(d) | 1.53 | 1.79 | | (.30) | — | (.30) | | —(e) | 18.10 | 10.81 | | 1,744,446 | .67(d) | 1.49(d) | 29.44 |
| October 31, 2003 | 13.98 | .26 | 2.61 | 2.87 | | (.24) | — | (.24) | | — | 16.61 | 20.73 | | 1,627,740 | .65 | 1.77 | 32.71 |
| October 31, 2002 | 16.89 | .26 | (2.60) | (2.34) | | (.25) | (.32) | (.57) | | — | 13.98 | (14.46) | | 1,360,104 | .61 | 1.58 | 29.94 |
| October 31, 2001 | 19.85 | .26 | (2.56) | (2.30) | | (.30) | (.36) | (.66) | | — | 16.89 | (11.96) | | 1,460,710 | .57 | 1.39 | 36.90 |
|
| |
| See notes to financial highlights at the end of this section. | | | | | | | | | | | | | | | |
| |
| The accompanying notes are an integral part of these financial statements. | | | | | | | | | | | | | | |
| | | | | | | | | | | | | | |
| 42 | | | | | | | | | | | | | | 43 |
& nbsp;
Financial highlights (Continued)
* Not annualized.
** Unaudited.
† For the period January 21, 2003 (commencement of operations) to October 31, 2003.
(a) Per share net investment income (loss) has been determined on the basis of the weighted average number of shares outstanding during the period.
(b) Total return assumes dividend reinvestment and does not reflect the effect of sales charges.
(c) Includes amounts paid through expense offset and brokerage service arrangements (Note 2).
(d) Reflects waivers of certain fund expenses in connection with investments in Putnam Prime Market Fund during the period. As a result of such waivers, the expenses of each class, as a percentage of its net assets, reflect a reduction of the following amounts (Note 5):
| | 4/30/06 | 10/31/05 | 10/31/04 |
|
| Class A | < 0.01% | < 0.01% | < 0.01% |
|
| Class B | < 0.01 | < 0.01 | < 0.01 |
|
| Class C | < 0.01 | < 0.01 | < 0.01 |
|
| Class M | < 0.01 | < 0.01 | < 0.01 |
|
| Class R | < 0.01 | < 0.01 | < 0.01 |
|
| Class Y | < 0.01 | < 0.01 | < 0.01 |
|
(e) Amount represents less than $0.01 per share.
(f) Reflects a non-recurring accrual related to Putnam Management’s settlement with the SEC regarding brokerage allocation practices, which amounted to the following amounts (Note 6):
| | | Percentage of |
| | Per share | net assets |
|
| Class A | $0.01 | 0.03% |
|
| Class B | 0.01 | 0.03 |
|
| Class C | 0.01 | 0.03 |
|
| Class M | 0.01 | 0.03 |
|
| Class R | 0.01 | 0.03 |
|
| Class Y | 0.01 | 0.03 |
|
(g) Reflects a non-recurring accrual related to a reimbursement to the fund from Putnam Investments relating to the calculation of certain amounts paid by the fund to Putnam in previous years for transfer agent services, which amounted to $0.01 per share and 0.03% of average net assets for the period ended April 30, 2006 (Note 6).
The accompanying notes are an integral part of these financial statements.
44
Notes to financial statements 4/30/06 (Unaudited)
Note 1: Significant accounting policies
The Putnam Fund for Growth and Income (the “fund”), a Massachusetts business trust, is registered under the Investment Company Act of 1940, as amended, as a diversified, open-end management investment company. The fund seeks capital growth and current income by investing primarily in a portfolio of common stocks that offer the potential for capital growth, current income or both.
The fund offers class A, class B, class C, class M, class R and class Y shares. Class A and class M shares are sold with a maximum front-end sales charge of 5.25% and 3.25%, respectively, and generally do not pay a contingent deferred sales charge. Class B shares, which convert to class A shares after approximately eight years, do not pay a front-end sales charge and are subject to a contingent deferred sales charge, if those shares are redeemed within six years of purchase. Class C shares have a one-year 1.00% contingent deferred sales charge and do not convert to class A shares. Class R shares, which are offered to qualified employee-benefit plans are sold without a front-end sales charge or a contingent deferred sales charge. The expenses for class A, class B, class C, class M and class R shares may differ based on the distribution fee of each class, which is identified in Note 2. Class Y shares, which are sold at net asset value, are generally subject to the same expenses as class A, class B, class C, class M and class R shares, but do not bear a distribution fee. Class Y shares are sold to certain eligible purchasers including certain defined contribution plans (including corporate IRAs), bank trust departments, trust companies, other Putnam funds and products, and certain college savings plans.
A 2.00% redemption fee may apply to any shares that are redeemed (either by selling or exchanging into another fund) within 5 days of purchase. The redemption fee is accounted for as an addition to paid-in-capital.
Investment income, realized and unrealized gains and losses and expenses of the fund are borne pro-rata based on the relative net assets of each class to the total net assets of the fund, except that each class bears expenses unique to that class (including the distribution fees applicable to such classes). Each class votes as a class only with respect to its own distribution plan or other matters on which a class vote is required by law or determined by the Trustees. Shares of each class would receive their pro-rata share of the net assets of the fund, if the fund were liquidated. In addition, the Trustees declare separate dividends on each class of shares.
In the normal course of business, the fund enters into contracts that may include agreements to indemnify another party under given circumstances. The fund’s maximum exposure under these arrangements is unknown as this would involve future claims that may be, but have not yet been, made against the fund. However, the fund expects the risk of material loss to be remote.
The following is a summary of significant accounting policies consistently followed by the fund in the preparation of its financial statements. The preparation of financial statements is in conformity with accounting principles generally accepted in the United States of America and requires management to make estimates and assumptions that affect the reported amounts of assets and liabilities in the financial statements and the reported amounts of increases and decreases in net assets from operations during the reporting period. Actual results could differ from those estimates.
A) Security valuation Investments for which market quotations are readily available are valued at the last reported sales price on their principal exchange, or official closing price for certain markets. If no sales are reported — as in the case of some securities traded over-the-counter — a security is valued at its last reported bid price. Many securities markets and exchanges outside the U.S. close prior to the close of the New York Stock Exchange and therefore the closing prices for securities in such markets or on such exchanges may not fully reflect events that occur after such close but before the close of
45
the New York Stock Exchange. Accordingly, on certain days, the fund will fair value foreign equity securities taking into account multiple factors, including movements in the U.S. securities markets. The number of days on which fair value prices will be used will depend on market activity and it is possible that fair value prices will be used by the fund to a significant extent. Securities quoted in foreign currencies, if any, are translated into U.S. dollars at the current exchange rate. Other investments, including certain restricted securities, are valued at fair value following procedures approved by the Trustees. Such valuations and procedures are reviewed periodically by the Trustees.
B) Joint trading account Pursuant to an exemptive order from the Securities and Exchange Commission, the fund may transfer uninvested cash balances, including cash collateral received under security lending arrangements, into a joint trading account along with the cash of other registered investment companies and certain other accounts managed by Putnam Investment Management, LLC (“Putnam Management”), the fund’s manager, an indirect wholly-owned subsidiary of Putnam, LLC. These balances may be invested in issues of high-grade, short-term investments having maturities of up to 397 days for collateral received under security lending arrangements and up to 90 days for other cash investments.
C) Repurchase agreements The fund, or any joint trading account, through its custodian, receives delivery of the underlying securities, the market value of which at the time of purchase is required to be in an amount at least equal to the resale price, including accrued interest. Collateral for certain tri-party repurchase agreements is held at the counterparty’s custodian in a segregated account for the benefit of the fund and the counterparty. Putnam Management is responsible for determining that the value of these underlying securities is at all times at least equal to the resale price, including accrued interest.
D) Security transactions and related investment income Security transactions are recorded on the trade date (the date the order to buy or sell is executed). Gains or losses on securities sold are determined on the identified cost basis.
Interest income is recorded on the accrual basis. Dividend income, net of applicable withholding taxes, is recognized on the ex-dividend date except that certain dividends from foreign securities, if any, are recognized as soon as the fund is informed of the ex-dividend date. Non-cash dividends, if any, are recorded at the fair market value of the securities received.
E) Foreign currency translation The accounting records of the fund are maintained in U.S. dollars. The market value of foreign securities, currency holdings, and other assets and liabilities are recorded in the books and records of the fund after translation to U.S. dollars based on the exchange rates on that day. The cost of each security is determined using historical exchange rates. Income and withholding taxes are translated at prevailing exchange rates when earned or incurred. The fund does not isolate that portion of realized or unrealized gains or losses resulting from changes in the foreign exchange rate on investments from fluctuations arising from changes in the market prices of the securities. Such gains and losses are included with the net realized and unrealized gain or loss on investments. Net realized gains and losses on foreign currency transactions represent net realized exchange gains or losses on closed forward currency contracts, disposition of foreign currencies, currency gains and losses realized between the trade and settlement dates on securities transactions and the difference between the amount of investment income and foreign withholding taxes recorded on the fund’s books and the U.S. dollar equivalent amounts actually received or paid. Net unrealized appreciation and depreciation of assets and liabilities in foreign currencies arise from changes in the value of open forward currency contracts and assets and liabilities other
46
than investments at the period end, resulting from changes in the exchange rate. Investments in foreign securities involve certain risks, including those related to economic instability, unfavorable political developments, and currency fluctuations, not present with domestic investments.
F) Futures and options contracts The fund may use futures and options contracts to hedge against changes in the values of securities the fund owns or expects to purchase, or for other investment purposes. The fund may also write options on swaps or securities it owns or in which it may invest to increase its current returns.
The potential risk to the fund is that the change in value of futures and options contracts may not correspond to the change in value of the hedged instruments. In addition, losses may arise from changes in the value of the underlying instruments, if there is an illiquid secondary market for the contracts, or if the counterparty to the contract is unable to perform. Risks may exceed amounts recognized on the statement of assets and liabilities. When the contract is closed, the fund records a realized gain or loss equal to the difference between the value of the contract at the time it was opened and the value at the time it was closed. Realized gains and losses on purchased options are included in realized gains and losses on investment securities. If a written call option is exercised, the premium originally received is recorded as an addition to sales proceeds. If a written put option is exercised, the premium originally received is recorded as a reduction to the cost of investments.
Futures contracts are valued at the quoted daily settlement prices established by the exchange on which they trade. The fund and the broker agree to exchange an amount of cash equal to the daily fluctuation in the value of the futures contract. Such receipts or payments are known as “variation margin.” Exchange traded options are valued at the last sale price or, if no sales are reported, the last bid price for purchased options and the last ask price for written options. Options traded over-the-counter are valued using prices supplied by dealers. Futures and written option contracts outstanding at period end, if any, are listed after the fund’s portfolio.
G) Security lending The fund may lend securities, through its agents, to qualified borrowers in order to earn additional income. The loans are collateralized by cash and/or securities in an amount at least equal to the market value of the securities loaned. The market value of securities loaned is determined daily and any additional required collateral is allocated to the fund on the next business day. The risk of borrower default will be borne by the fund’s agents; the fund will bear the risk of loss with respect to the investment of the cash collateral. Income from securities lending is included in investment income on the statement of operations. At April 30, 2006, the value of securities loaned amounted to $245,981,065. The fund received cash collateral of $253,589,425, which is pooled with collateral of other Putnam funds into 31 issues of high-grade, short-term investments.
H) Federal taxes It is the policy of the fund to distribute all of its taxable income within the prescribed time and otherwise comply with the provisions of the Internal Revenue Code of 1986 (the “Code”) applicable to regulated investment companies. It is also the intention of the fund to distribute an amount sufficient to avoid imposition of any excise tax under Section 4982 of the Code, as amended. Therefore, no provision has been made for federal taxes on income, capital gains or unrealized appreciation on securities held nor for excise tax on income and capital gains.
The aggregate identified cost on a tax basis is $13,081,485,140, resulting in gross unrealized appreciation and depreciation of $3,243,361,955 and $331,637,512, respectively, or net unrealized appreciation of $2,911,724,443.
I) Distributions to shareholders Distributions to shareholders from net investment income are recorded by the fund on the ex-dividend
47
date. Distributions from capital gains, if any, are recorded on the ex-dividend date and paid at least annually. The amount and character of income and gains to be distributed are determined in accordance with income tax regulations, which may differ from generally accepted accounting principles. Dividend sources are estimated at the time of declaration. Actual results may vary. Any non-taxable return of capital cannot be determined until final tax calculations are completed after the end of the fund’s fiscal year. Reclassifications are made to the fund’s capital accounts to reflect income and gains available for distribution (or available capital loss carryovers) under income tax regulations.
Note 2: Management fee, administrative services and other transactions
Putnam Management is paid for management and investment advisory services quarterly based on the average net assets of the fund. Such fee is based on the following annual rates: 0.65% of the first $500 million of average net assets, 0.55% of the next $500 million, 0.50% of the next $500 million, 0.45% of the next $5 billion, 0.425% of the next $5 billion, 0.405% of the next $5 billion, 0.39% of the next $5 billion, 0.38% of the next $5 billion, 0.37% of the next $5 billion, 0.36% of the next $5 billion, 0.35% of the next $5 billion, 0.34% of the next $5 billion, 0.33% of the next $8.5 billion and 0.32% thereafter.
Putnam Management has agreed to waive fees and reimburse expenses of the fund through October 31, 2006, to the extent necessary to ensure that the fund’s expenses do not exceed the simple average of the expenses of all front-end load funds viewed by Lipper Inc. as having the same investment classification or objective as the fund. The expense reimbursement is based on a comparison of the fund’s expenses with the average annualized operating expenses of the funds in its Lipper peer group for each calendar quarter during the fund’s last fiscal year, excluding 12b-1 fees and without giving effect to any expense offset and brokerage service arrangements that may reduce fund expenses. For the period ended April 30, 2006, Putnam Management did not waive any of its management fee from the fund.
For the period ended April 30, 2006, Putnam Management has assumed $105,558 of legal, shareholder servicing and communication, audit and Trustee fees incurred by the fund in connection with certain legal and regulatory matters (including those described in Note 6).
The fund reimburses Putnam Management an allocated amount for the compensation and related expenses of certain officers of the fund and their staff who provide administrative services to the fund. The aggregate amount of all such reimbursements is determined annually by the Trustees.
Custodial functions for the fund’s assets are provided by Putnam Fiduciary Trust Company (“PFTC”), a subsidiary of Putnam, LLC. PFTC receives fees for custody services based on the fund’s asset level, the number of its security holdings and transaction volumes. Putnam Investor Services, a division of PFTC, provides investor servicing agent functions to the fund. Putnam Investor Services receives fees for investor servicing based on the number of shareholder accounts in the fund and the level of defined contribution plan assets in the fund. During the period ended April 30, 2006, the fund incurred $14,157,513 for these services.
The fund has entered into an arrangement with PFTC whereby credits realized as a result of uninvested cash balances are used to reduce a portion of the fund’s expenses. The fund also reduced expenses through brokerage service arrangements. For the six months ended April 30, 2006, the fund’s expenses were reduced by $1,561,691 under these arrangements.
Each independent Trustee of the fund receives an annual Trustee fee, of which $3,133, as a quarterly retainer, has been allocated to the fund, and an additional fee for each Trustees meeting attended. Trustees receive additional fees for attendance at
48
certain committee meetings, industry seminars and for certain compliance-related matters. Trustees also are reimbursed for expenses they incur relating to their services as Trustees. George Putnam, III, who is not an independent Trustee, also receives the foregoing fees for his services as Trustee.
The fund has adopted a Trustee Fee Deferral Plan (the “Deferral Plan”) which allows the Trustees to defer the receipt of all or a portion of Trustees fees payable on or after July 1, 1995. The deferred fees remain invested in certain Putnam funds until distribution in accordance with the Deferral Plan.
The fund has adopted an unfunded noncontributory defined benefit pension plan (the “Pension Plan”) covering all Trustees of the fund who have served as a Trustee for at least five years and were first elected prior to 2004. Benefits under the Pension Plan are equal to 50% of the Trustee’s average annual attendance and retainer fees for the three years ended December 31, 2005. Pension expense for the fund is included in Trustee compensation and expenses in the statement of operations. Accrued pension liability is included in Payable for Trustee compensation and expenses in the statement of assets and liabilities. The Trustees have terminated the Pension Plan with respect to any Trustee first elected after 2003.
The fund has adopted distribution plans (the “Plans”) with respect to its class A, class B, class C, class M and class R shares pursuant to Rule 12b-1 under the Investment Company Act of 1940. The purpose of the Plans is to compensate Putnam Retail Management, a wholly-owned subsidiary of Putnam, LLC and Putnam Retail Management GP, Inc., for services provided and expenses incurred in distributing shares of the fund. The Plans provide for payments by the fund to Putnam Retail Management at an annual rate of up to 0.35%, 1.00%, 1.00%, 1.00% and 1.00% of the average net assets attributable to class A, class B, class C, class M and class R shares, respectively. The Trustees have approved payment by the fund at an annual rate of 0.25%, 1.00%, 1.00%, 0.75% and 0.50% of the average net assets attributable to class A, class B, class C, class M and class R shares, respectively.
For the six months ended April 30, 2006, Putnam Retail Management, acting as underwriter, received net commissions of $203,646 and $1,747 from the sale of class A and class M shares, respectively, and received $956,509 and $2,492 in contingent deferred sales charges from redemptions of class B and class C shares, respectively. A deferred sales charge of up to 1.00% and 0.65% is assessed on certain redemptions of class A and class M shares, respectively. For the six months ended April 30, 2006, Putnam Retail Management, acting as underwriter, received $14,588 and no monies on class A and class M redemptions, respectively.
Note 3: Purchases and sales of securities
During the six months ended April 30, 2006, cost of purchases and proceeds from sales of investment securities other than short-term investments aggregated $5,005,431,526 and $6,355,714,745, respectively. There were no purchases or sales of U.S. government securities.
Written option transactions during the period ended April 30, 2006 are summarized as follows:
| | Contract | Premiums |
| | Amounts | Received |
|
| Written options | | |
| outstanding at | | |
| beginning of period | 399,725 | $ 389,679 |
|
| Options opened | 495,574 | 348,746 |
| Options exercised | (583,559) | (369,684) |
| Options expired | (140,446) | (175,145) |
| Options closed | (171,294) | (193,596) |
|
| Written options | | |
| outstanding at | | |
| end of period | — | $ — |
Note 4: Capital shares
At April 30, 2006, there was an unlimited number of shares of beneficial interest authorized. Transactions in capital shares were as follows:
49
| CLASS A | Shares | | Amount |
| Six months ended 4/30/06: | | |
| Shares sold | 30,835,459 | $ | 624,641,570 |
|
| Shares issued | | | |
| in connection | | | |
| with reinvestment | | | |
| of distributions | 14,673,539 | | 290,875,769 |
|
| | 45,508,998 | | 915,517,339 |
|
| Shares | | | |
| repurchased | (64,149,241) | | (1,293,558,465) |
|
| Net decrease | (18,640,243) | $ | (378,041,126) |
| |
| Year ended 10/31/05: | | |
| Shares sold | 61,879,373 | $ | 1,191,574,589 |
|
| Shares issued | | | |
| in connection | | | |
| with reinvestment | | | |
| of distributions | 8,081,523 | | 157,085,106 |
|
| | 69,960,896 | | 1,348,659,695 |
|
| Shares | | | |
| repurchased | (144,549,010) | | (2,785,662,373) |
|
| Net decrease | (74,588,114) | $ | (1,437,002,678) |
|
| |
| CLASS B | Shares | | Amount |
| Six months ended 4/30/06: | | |
| Shares sold | 2,607,876 | $ | 51,829,001 |
|
| Shares issued | | | |
| in connection | | | |
| with reinvestment | | | |
| of distributions | 2,668,780 | | 52,091,932 |
|
| | 5,276,656 | | 103,920,933 |
|
| Shares | | | |
| repurchased | (33,771,314) | | (673,593,169) |
|
| Net decrease | (28,494,658) | $ | (569,672,236) |
| |
| Year ended 10/31/05: | | |
| Shares sold | 7,301,432 | $ | 138,079,476 |
|
| Shares issued | | | |
| in connection | | | |
| with reinvestment | | | |
| of distributions | 980,648 | | 18,709,707 |
|
| | 8,282,080 | | 156,789,183 |
|
| Shares | | | |
| repurchased | (70,439,851) | | (1,337,148,136) |
|
| Net decrease | (62,157,771) | $ | (1,180,358,953) |
| CLASS C | Shares | | Amount |
| Six months ended 4/30/06: | | |
| Shares sold | 236,883 | $ | 4,752,265 |
|
| Shares issued | | | |
| in connection | | | |
| with reinvestment | | | |
| of distributions | 104,856 | | 2,069,982 |
|
| | 341,739 | | 6,822,247 |
|
| Shares | | | |
| repurchased | (629,166) | | (12,643,431) |
|
| Net decrease | (287,427) | | $ (5,821,184) |
| |
| Year ended 10/31/05: | | | |
| Shares sold | 688,876 | | $ 13,195,853 |
|
| Shares issued | | | |
| in connection | | | |
| with reinvestment | | | |
| of distributions | 31,863 | | 615,205 |
|
| | 720,739 | | 13,811,058 |
|
| Shares | | | |
| repurchased | (1,733,028) | | (33,275,840) |
|
| Net decrease | (1,012,289) | | $(19,464,782) |
|
| |
| CLASS M | Shares | | Amount |
| Six months ended 4/30/06: | | |
| Shares sold | 164,067 | | $ 3,289,815 |
|
| Shares issued | | | |
| in connection | | | |
| with reinvestment | | | |
| of distributions | 147,090 | | 2,895,812 |
|
| | 311,157 | | 6,185,627 |
|
| Shares | | | |
| repurchased | (1,006,386) | | (20,089,319) |
|
| Net decrease | (695,229) | $ | (13,903,692) |
| |
| Year ended 10/31/05: | | | |
| Shares sold | 593,514 | $ | 11,301,717 |
|
| Shares issued | | | |
| in connection | | | |
| with reinvestment | | | |
| of distributions | 62,781 | | 1,210,245 |
|
| | 656,295 | | 12,511,962 |
|
| Shares | | | |
| repurchased | (2,349,318) | | (45,121,183) |
|
| Net decrease | (1,693,023) | $ | (32,609,221) |
50
| CLASS R | Shares | Amount |
| Six months ended 4/30/06: | |
| Shares sold | 16,136 | $325,462 |
|
| Shares issued | | |
| in connection | | |
| with reinvestment | | |
| of distributions | 997 | 19,712 |
|
| | 17,133 | 345,174 |
|
| Shares | | |
| repurchased | (3,991) | (80,233) |
|
| Net increase | 13,142 | $264,941 |
| |
| Year ended 10/31/05: | |
| Shares sold | 29,709 | $571,862 |
|
| Shares issued | | |
| in connection | | |
| with reinvestment | | |
| of distributions | 287 | 5,590 |
|
| | 29,996 | 577,452 |
|
| Shares | | |
| repurchased | (2,961) | (57,217) |
|
| Net increase | 27,035 | $520,235 |
|
| |
| CLASS Y | Shares | Amount |
| Six months ended 4/30/06: | |
| Shares sold | 7,232,463 | $ 145,921,172 |
|
| Shares issued | | |
| in connection | | |
| with reinvestment | | |
| of distributions | 1,771,684 | 35,200,259 |
|
| | 9,004,147 | 181,121,431 |
|
| Shares | | |
| repurchased | (14,150,645) | (286,391,179) |
|
| Net decrease | (5,146,498) | $(105,269,748) |
| |
| Year ended 10/31/05: | |
| Shares sold | 18,152,973 | $ 350,212,284 |
|
| Shares issued | | |
| in connection | | |
| with reinvestment | | |
| of distributions | 1,396,645 | 27,173,140 |
|
| | 19,549,618 | 377,385,424 |
|
| Shares | | |
| repurchased | (47,909,086) | (928,028,811) |
|
| Net decrease | (28,359,468) | $(550,643,387) |
Note 5: Investment in Putnam Prime Money Market Fund
Pursuant to an exemptive order from the Securities and Exchange Commission, the fund invests in Putnam Prime Money Market Fund, an open-end management investment company managed by Putnam Management. Management fees paid by the fund are reduced by an amount equal to the management and administrative services fees paid by Putnam Prime Money Market Fund with respect to assets invested by the fund in Putnam Prime Money Market Fund. For the period ended April 30, 2006, management fees paid were reduced by $83,921 relating to the fund’s investment in Putnam Prime Money Market Fund. Income distributions earned by the fund are recorded as income in the statement of operations and totaled $3,176,849 for the period ended April 30, 2006. During the period ended April 30, 2006, cost of purchases and cost of sales of investments in Putnam Prime Money Market Fund aggregated $1,223,504,522 and $1,149,744,734, respectively.
Note 6: Regulatory matters and litigation
Putnam Management has entered into agreements with the Securities and Exchange Commission and the Massachusetts Securities Division settling charges connected with excessive short-term trading by Putnam employees and, in the case of the charges brought by the Massachusetts Securities Division, by participants in some Putnam-administered 401(k) plans. Pursuant to these settlement agreements, Putnam Management will pay a total of $193.5 million in penalties and restitution, with $153.5 million being paid to certain open-end funds and their shareholders. The amount will be allocated to shareholders and funds pursuant to a plan developed by an independent consultant, and will be paid following approval of the plan by the SEC and the Massachusetts Securities Division.
The Securities and Exchange Commission’s and Massachusetts Securities Division’s allegations and related matters also serve as the general basis for numerous lawsuits, including purported class
51
action lawsuits filed against Putnam Management and certain related parties, including certain Putnam funds. Putnam Management will bear any costs incurred by Putnam funds in connection with these lawsuits. Putnam Management believes that the likelihood that the pending private lawsuits and purported class action lawsuits will have a material adverse financial impact on the fund is remote, and the pending actions are not likely to materially affect its ability to provide investment management services to its clients, including the Putnam funds.
Pursuant to a settlement with the Securities and Exchange Commission relating to Putnam Management’s brokerage allocation practices, on October 13, 2005 the fund received $4,955,159 in proceeds paid by Putnam Management. The fund had accrued a receivable for this amount in the prior fiscal year.
In March 2006, the fund received $4,741,691 from Putnam to address issues relating to the calculation of certain amounts paid by the Putnam mutual funds to Putnam for transfer agent services. This amount is included in Fees waived and reimbursed by Manager or affiliate on the Statement of operations. Review of this matter is ongoing and the amount received by the fund may be adjusted in the future. Such adjustment is not expected to be material.
Putnam Management and Putnam Retail Management are named as defendants in a civil suit in which the plaintiffs allege that the management and distribution fees paid by certain Putnam funds were excessive and seek recovery under the Investment Company Act of 1940. Putnam Management and Putnam Retail Management have contested the plaintiffs’ claims and the matter is currently pending in the U.S. District Court for the District of Massachusetts. Based on currently available information, Putnam Management believes that this action is without merit and that it is unlikely to have a material effect on Putnam Management’s and Putnam Retail Management’s ability to provide services to their clients, including the fund.
52
Founded over 65 years ago, Putnam Investments was built around the concept that a balance between risk and reward is the hallmark of a well-rounded financial program. We manage over 100 mutual funds in growth, value, blend, fixed income, and international.
| Investment Manager | Officers | Francis J. McNamara, III |
| Putnam Investment | George Putnam, III | Vice President and |
| Management, LLC | President | Chief Legal Officer |
| One Post Office Square | | |
| Boston, MA 02109 | Charles E. Porter | Charles A. Ruys de Perez |
| Executive Vice President, | Vice President and |
| Marketing Services | Associate Treasurer and | Chief Compliance Officer |
| Putnam Retail Management | Principal Executive Officer | |
| One Post Office Square | | Mark C. Trenchard |
| Boston, MA 02109 | Jonathan S. Horwitz | Vice President and |
| Senior Vice President | BSA Compliance Officer |
| Custodian | and Treasurer | |
| Putnam Fiduciary | | Judith Cohen |
| Trust Company | Steven D. Krichmar | Vice President, Clerk and |
| Vice President and | Assistant Treasurer |
| Legal Counsel | Principal Financial Officer | |
| Ropes & Gray LLP | | Wanda M. McManus |
| Michael T. Healy | Vice President, Senior Associate |
| Trustees | Assistant Treasurer and | Treasurer and Assistant Clerk |
| John A. Hill, Chairman | Principal Accounting Officer | |
| Jameson Adkins Baxter, | | Nancy E. Florek |
| Vice Chairman | Daniel T. Gallagher | Vice President, Assistant Clerk, |
| Charles B. Curtis | Senior Vice President, | Assistant Treasurer |
| Myra R. Drucker | Staff Counsel and | and Proxy Manager |
| Charles E. Haldeman, Jr. | Compliance Liaison | |
| Paul L. Joskow | | |
| Elizabeth T. Kennan | Beth S. Mazor | |
| John H. Mullin, III | Vice President | |
| Robert E. Patterson | | |
| George Putnam, III | James P. Pappas | |
| W. Thomas Stephens | Vice President | |
| Richard B. Worley | | |
| Richard S. Robie, III | |
| Vice President | |
This report is for the information of shareholders of The Putnam Fund for Growth and Income. It may also be used as sales literature when preceded or accompanied by the current prospectus, the most recent copy of Putnam’s Quarterly Performance Summary, and Putnam’s Quarterly Ranking Summary. For more recent performance, please visit www.putnam.com. Investors should carefully consider the investment objective, risks, charges, and expenses of a fund, which are described in its prospectus. For this and other information or to request a prospectus, call 1-800-225-1581 toll free. Please read the prospectus carefully before investing. The fund’s Statement of Additional Information contains additional information about the fund’s Trustees and is available without charge upon request by calling 1-800-225-1581.

Item 2. Code of Ethics:
Not applicable
Item 3. Audit Committee Financial Expert:
Not applicable
Item 4. Principal Accountant Fees and Services:
Not applicable
Item 5. Audit Committee of Listed Registrants
Not applicable
Item 6. Schedule of Investments:
The registrant’s schedule of investments in unaffiliated issuers is included in the report to shareholders in Item 1 above.
Item 7. Disclosure of Proxy Voting Policies and Procedures For Closed-End Management
Investment Companies:
|
Not applicable
Item 8. Portfolio Managers of Closed-End Investment Companies
Not Applicable
Item 9. Purchases of Equity Securities by Closed-End Management Investment Companies and
Affiliated Purchasers:
|
Not applicable
Item 10. Submission of Matters to a Vote of Security Holders:
Not applicable
Item 11. Controls and Procedures:
(a) The registrant's principal executive officer and principal financial officer have concluded, based on their evaluation of the effectiveness of the design and operation of the registrant's disclosure controls and procedures as of a date within 90 days of the filing date of this report, that the design and operation of such procedures are generally effective to provide reasonable assurance that information required to be disclosed by the registrant in this report is recorded, processed, summarized and reported within the time periods specified in the Commission's rules and forms.
(b) Changes in internal control over financial reporting: Not applicable
Item 12. Exhibits:
(a)(1) Not applicable
(a)(2) Separate certifications for the principal executive officer and principal financial officer of the registrant as required by Rule 30a-2(a) under the Investment Company Act of 1940, as amended, are filed herewith.
(b) The certifications required by Rule 30a-2(b) under the Investment Company Act of 1940, as amended, are filed herewith.
SIGNATURES
Pursuant to the requirements of the Securities Exchange Act of 1934 and the Investment Company Act of 1940, the registrant has duly caused this report to be signed on its behalf by the undersigned, thereunto duly authorized.
The Putnam Fund for Growth and Income
By (Signature and Title):
/s/Michael T. Healy
Michael T. Healy
Principal Accounting Officer
|
Date: June 28, 2006
Pursuant to the requirements of the Securities Exchange Act of 1934 and the Investment Company Act of 1940, this report has been signed below by the following persons on behalf of the registrant and in the capacities and on the dates indicated.
By (Signature and Title):
/s/Charles E. Porter
Charles E. Porter
Principal Executive Officer
|
Date: June 28, 2006
By (Signature and Title):
/s/Steven D. Krichmar
Steven D. Krichmar
Principal Financial Officer
|
Date: June 28, 2006