Sidoti & Company LLC March 17, 2014 Emerging Growth Institutional Investor Forum
Safe Harbor Statement Today’s presentation contains historical information and forward-looking statements. Forward-looking statements typically contain words such as “expect,” “believe,” “estimate,” “anticipate,” or similar words indicating that future outcomes are uncertain. Statements looking forward in time, including statements regarding future growth and profitability, price increases, cost savings, product lines, enhanced competitive posture and acquisitions, are included in the company’s most recent Annual Report pursuant to the “safe harbor” provision of the Private Securities Litigation Reform Act of 1995. They involve known and unknown risks and uncertainties that may cause the company’s actual results in future periods to be materially different from any future performance suggested herein. Further, the company operates in an industry sector where securities values may be volatile and may be influenced by economic and other factors beyond the company’s control. Some of the factors that could affect future performance of the company are changes in, or delays in the implementation of, regulations that cause a market for our products, acquisitions, higher energy and raw material costs, costs of imports and related tariffs, labor relations, capital and environmental requirements, changes in foreign currency exchange rates, borrowing restrictions, validity of patents and other intellectual property, and pension costs. In the context of the forward-looking information provided in this news release, please refer to the discussions of risk factors and other information detailed in, as well as the other information contained in the company’s most recent Annual Report.
Title: Agenda Calgon Carbon’s Products and Services Drivers of Sales Growth Reactivation Mercury Removal Ballast Water Treatment Drivers of Value Creation Cost Improvement Program Returning Value to Shareholders Financial Highlights
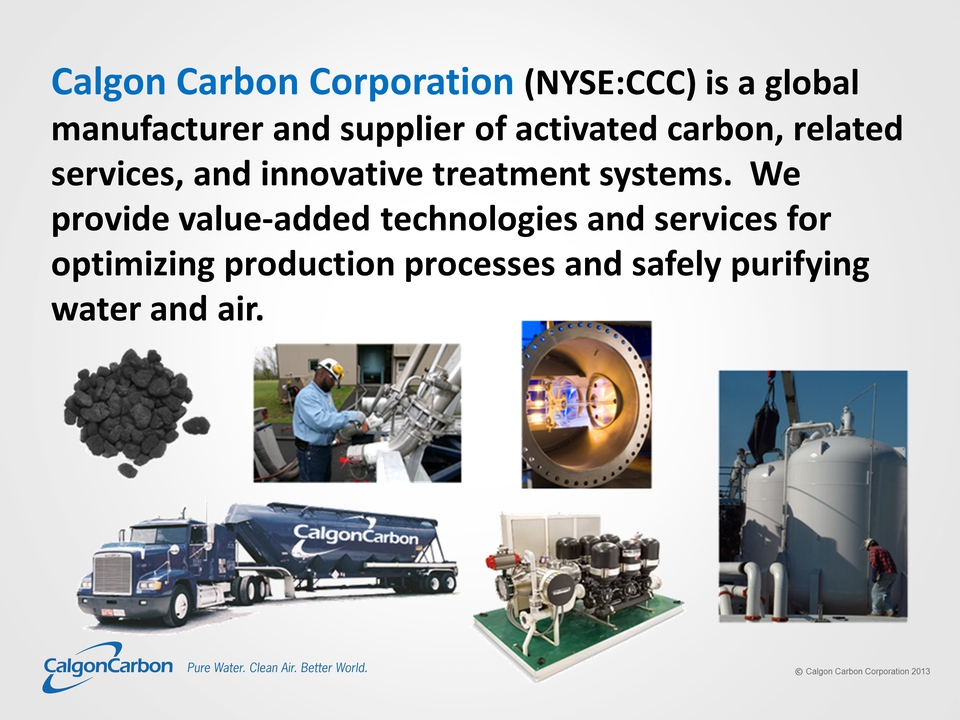
Calgon Carbon Corporation (NYSE:CCC) is a global manufacturer and supplier of activated carbon, related services, and innovative treatment systems. We provide value-added technologies and services for optimizing production processes and safely purifying water and air.
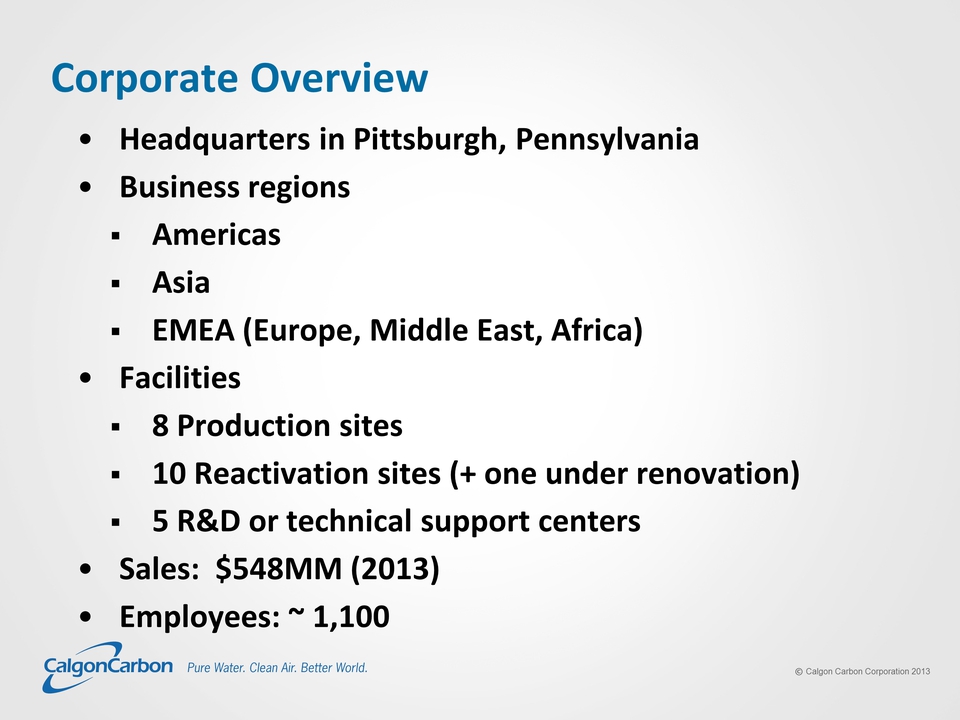
Title: Corporate Overview Headquarters in Pittsburgh, Pennsylvania Business regions Americas Asia EMEA (Europe, Middle East, Africa) Facilities 8 Production sites 10 Reactivation sites (+ one under renovation) 5 R&D or technical support centers Sales: $548MM (2013) Employees: ~ 1,100
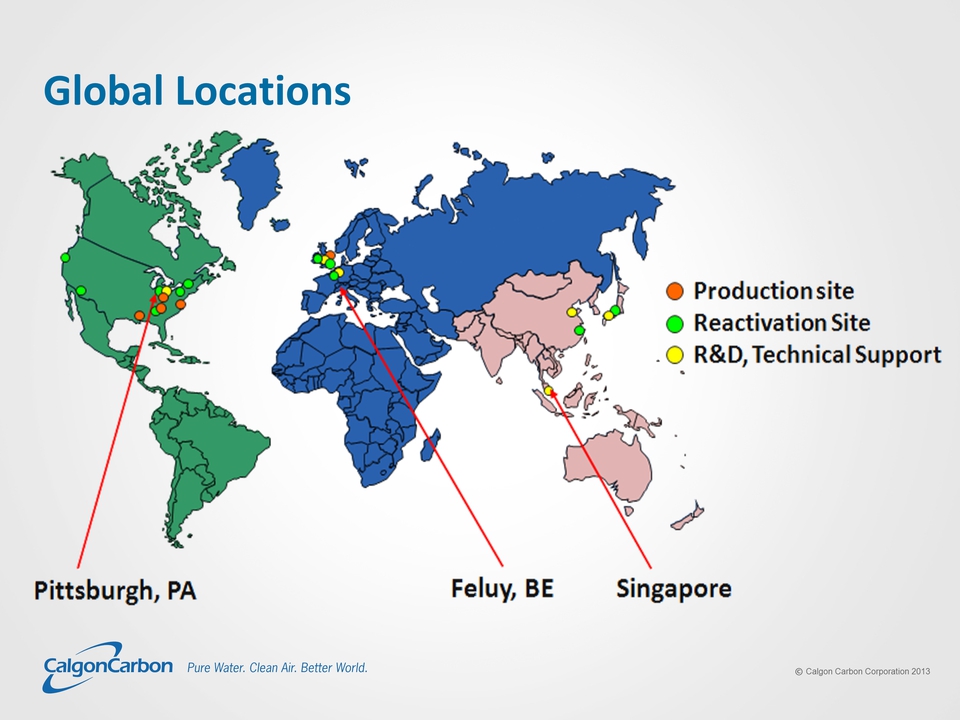
Title: Global Locations Production site Reactivation Site R&D, Technical Support Pittsburgh, PA Feluy, BE Singapore
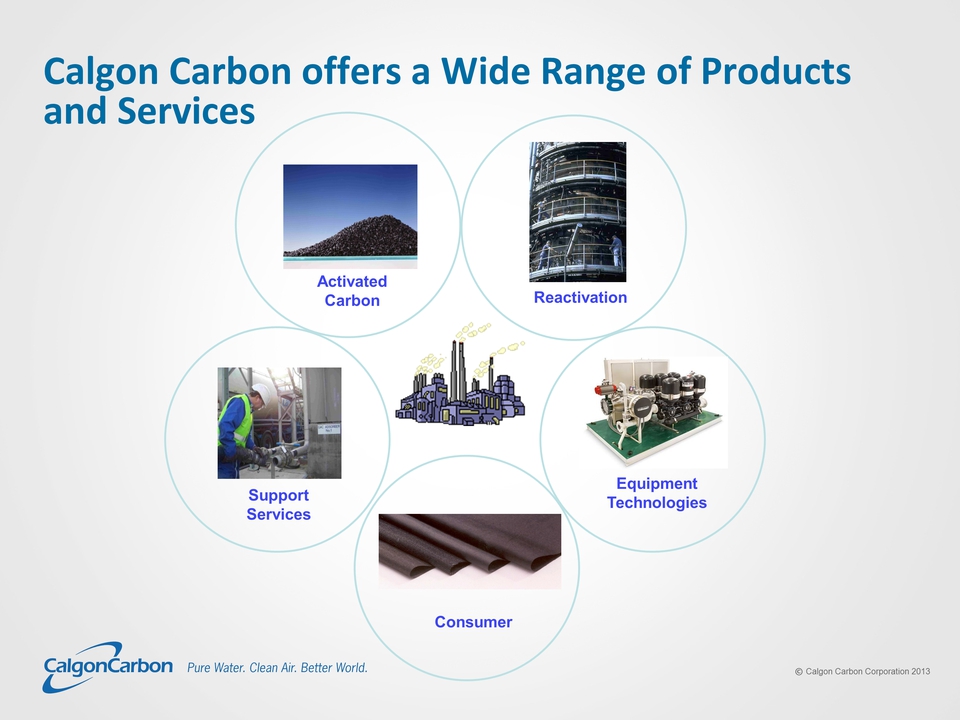
Title: Calgon Carbon offers a Wide Range of Products and Services Consumer Activated Carbon Reactivation Equipment Technologies Support Services
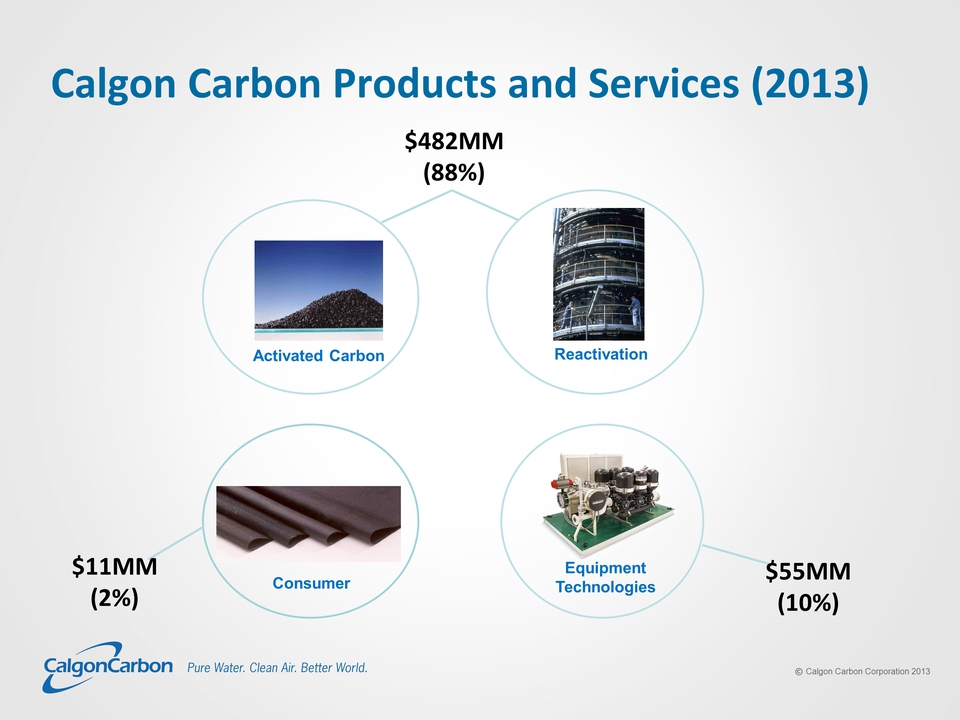
Title: Calgon Carbon Products and Services (2013) Activated Carbon Reactivation Equipment Technologies Consumer $482MM (88%) $55MM (10%) $11MM (2%)
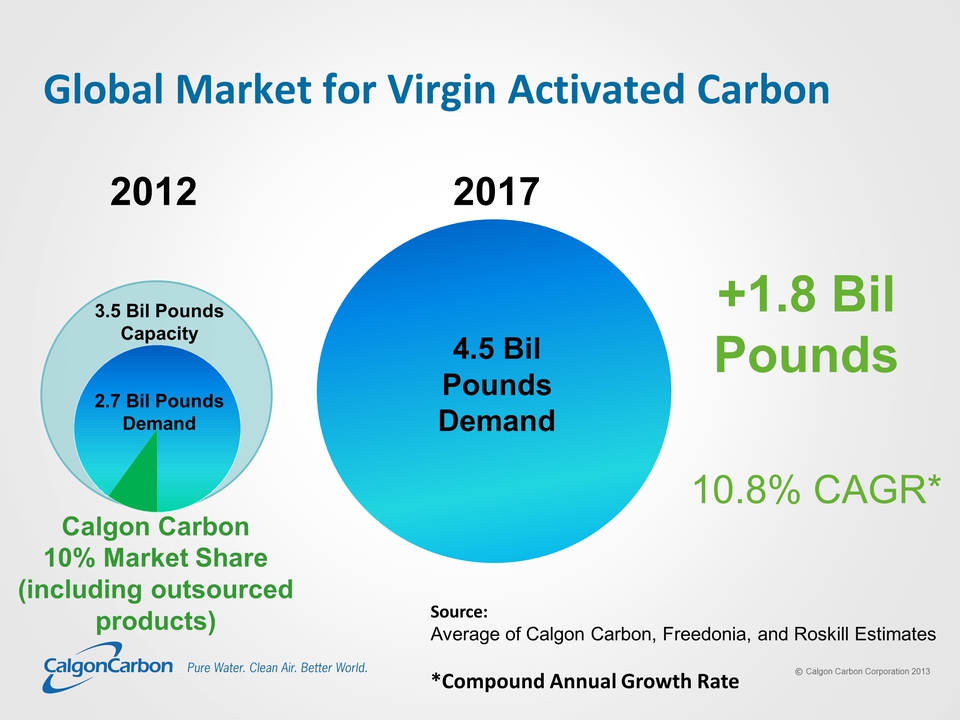
Title: Global Market for Virgin Activated Carbon Source: Average of Calgon Carbon, Freedonia, and Roskill Estimates *Compound Annual Growth Rate 2012 2017 Calgon Carbon 10% Market Share (including outsourced products) 4.5 Bil Pounds Demand +1.8 Bil Pounds 10.8% CAGR* (Gp:) 3.5 Bil Pounds Capacity 2.7 Bil Pounds Demand
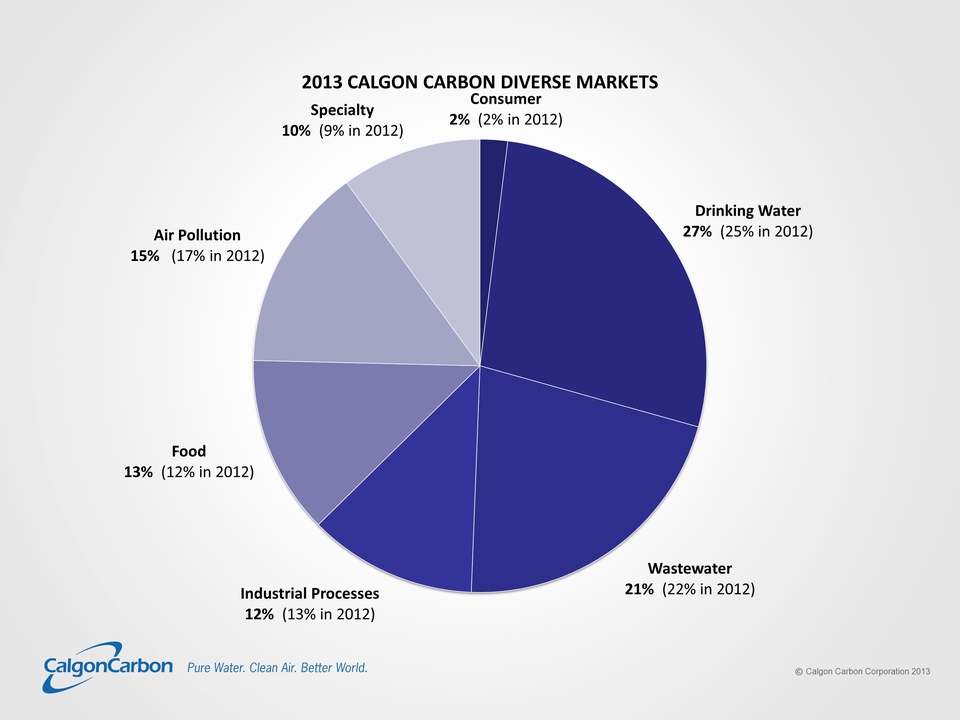
2% (2% in 2012) Drinking Water 27% (25% in 2012) Wastewater 21% (22% in 2012) Industrial Processes 12% (13% in 2012) Food 13% (12% in 2012) Air Pollution 15% (17% in 2012) Specialty 10% (9% in 2012) 2013 CALGON CARBON DIVERSE MARKETS
Drivers of Sales Growth Reactivation Mercury Removal Ballast Water Treatment
Business Expansion Through Reactivation
Title: Reactivation Reactivation is the reprocessing (recycling) of spent activated carbon at high temperatures Heat destroys the adsorbed organic material in a safe and environmentally responsible way Carbon is then reusable Frequency of reactivation is dependent on application
Title: Customer Benefits of Reactivation Other Placeholder: Lower costs than using virgin carbon Certified destruction of the adsorbed materials (which may be classified as hazardous) No landfill liabilities Lower cost than incineration Sustainability benefits Only generates 20% of the CO2 VS. the production of virgin carbon Assured supply Expert Field Service support and logistics CCC has available capacity in all geographic areas for industrial and potable reactivation
Title: Disinfection Byproduct (DPB) Regulations Increases demand in U.S. for potable reactivation
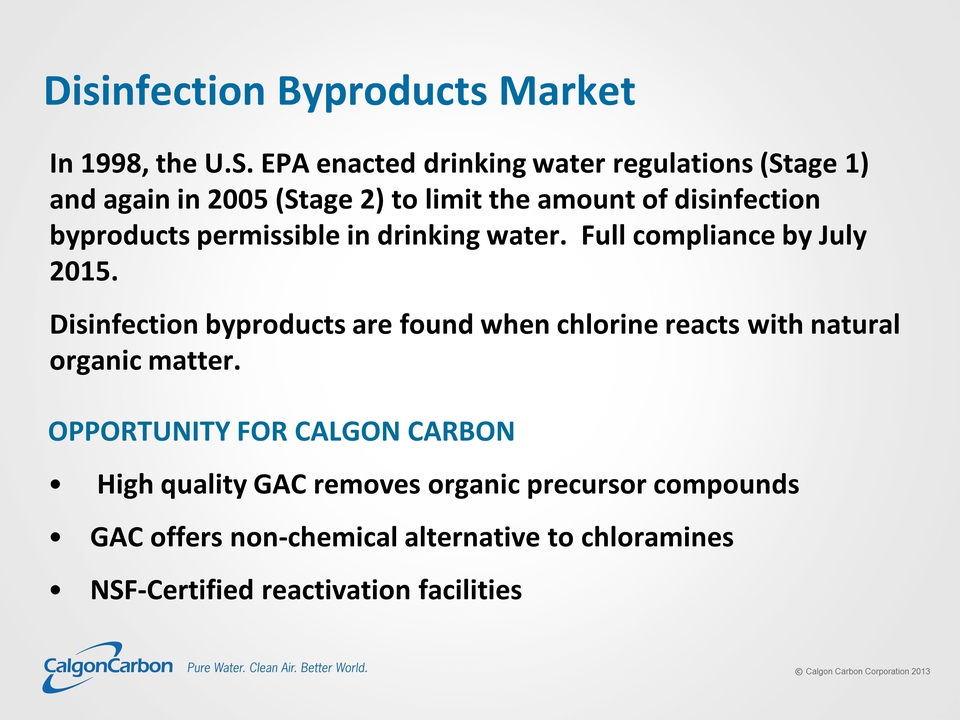
Title: Disinfection Byproducts Market In 1998, the U.S. EPA enacted drinking water regulations (Stage 1) and again in 2005 (Stage 2) to limit the amount of disinfection byproducts permissible in drinking water. Full compliance by July 2015. Disinfection byproducts are found when chlorine reacts with natural organic matter. OPPORTUNITY FOR CALGON CARBON High quality GAC removes organic precursor compounds GAC offers non-chemical alternative to chloramines NSF-Certified reactivation facilities
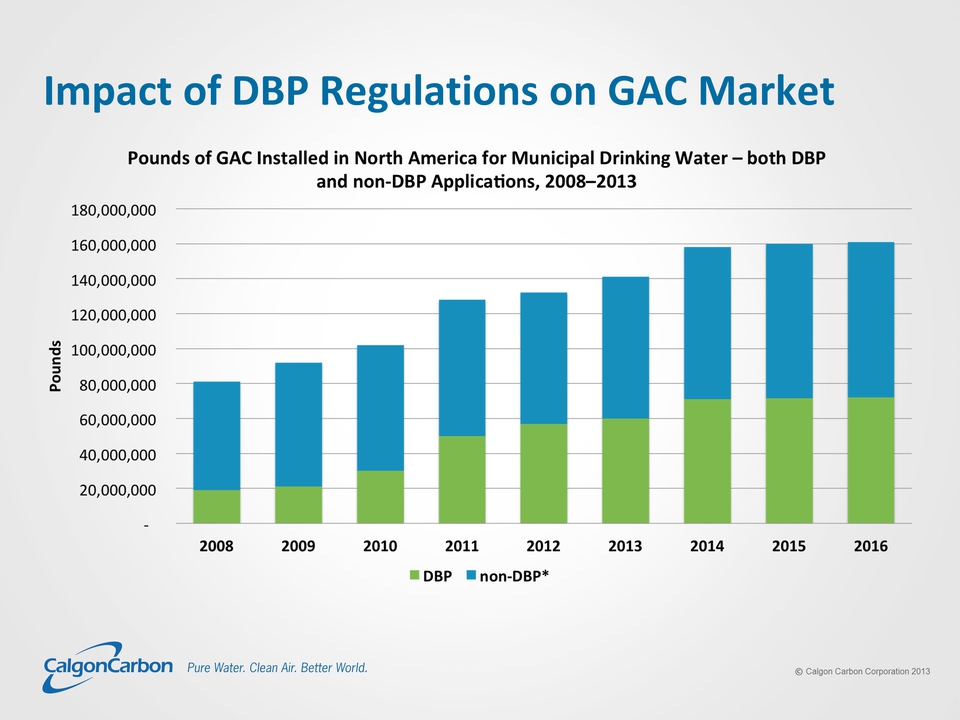
Title: Impact of DBP Regulations on GAC Market Pounds of GAC Installed in North America for Municipal Drinking Water both DBP and non-DBP Applications, 2008-2013 2008 2009 2010 2011 2012 2013 2014 2015 2016 20,000,000 40,000,000 60,000,000 80,000,000 100,000,000 120,000,000 140,000,000 160,000,000 180,000,000
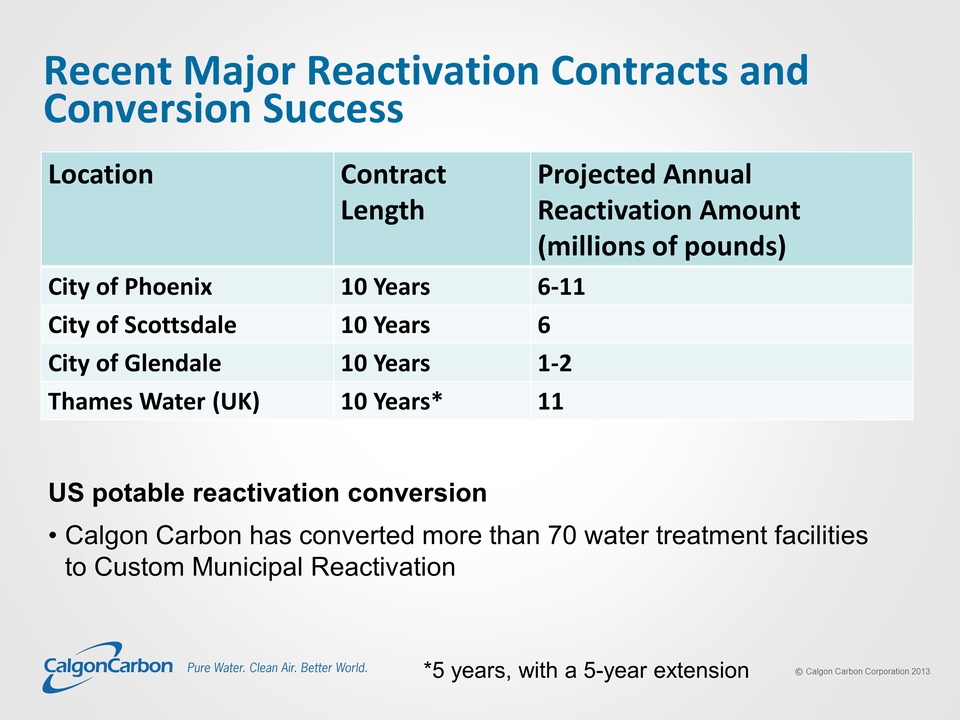
Recent Major Reactivation Contracts and Conversion Success Location Contract Length Projected Annual Reactivation Amount (millions of pounds) City of Phoenix 10 Years 6‐11 City of Scottsdale 10 Years 6 City of Glendale 10 Years 1‐2 Thames Water (UK) 10 Years* 11 *5 years, with a 5-year extension US potable reactivation conversion • Calgon Carbon has converted more than 70 water treatment facilities to Custom Municipal Reactivation
Mercury Removal
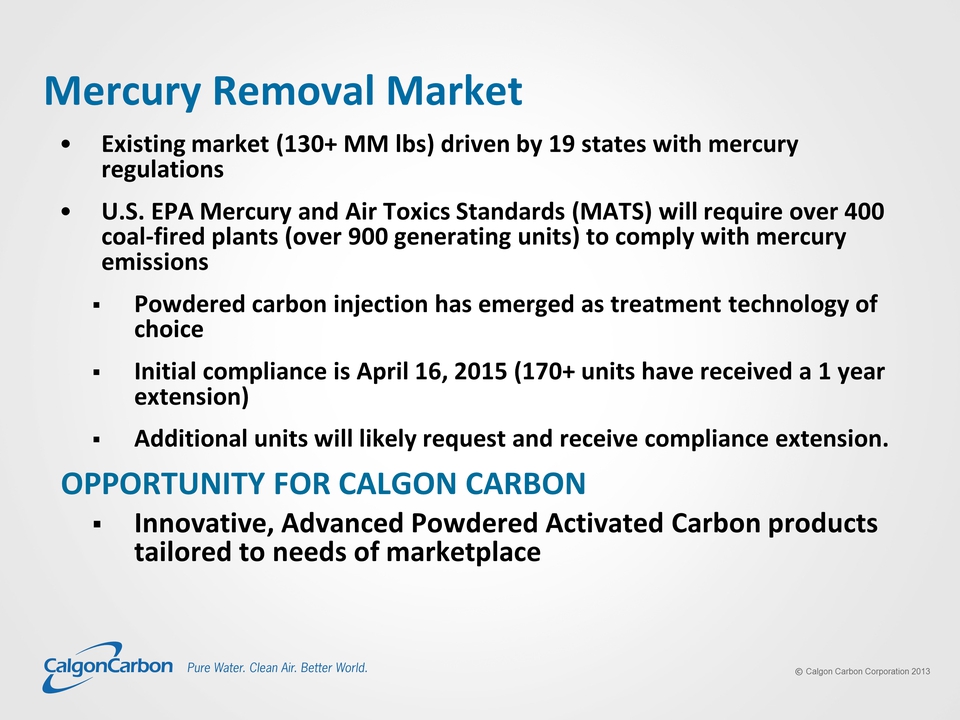
Title: Mercury Removal Market Existing market (130+ MM lbs) driven by 19 states with mercury regulations U.S. EPA Mercury and Air Toxics Standards (MATS) will require over 400 coal-fired plants (over 900 generating units) to comply with mercury emissions Powdered carbon injection has emerged as treatment technology of choice Initial compliance is April 16, 2015 (170+ units have received a 1 year extension) Additional units will likely request and receive compliance extension. OPPORTUNITY FOR CALGON CARBON Innovative, Advanced Powdered Activated Carbon products tailored to needs of marketplace
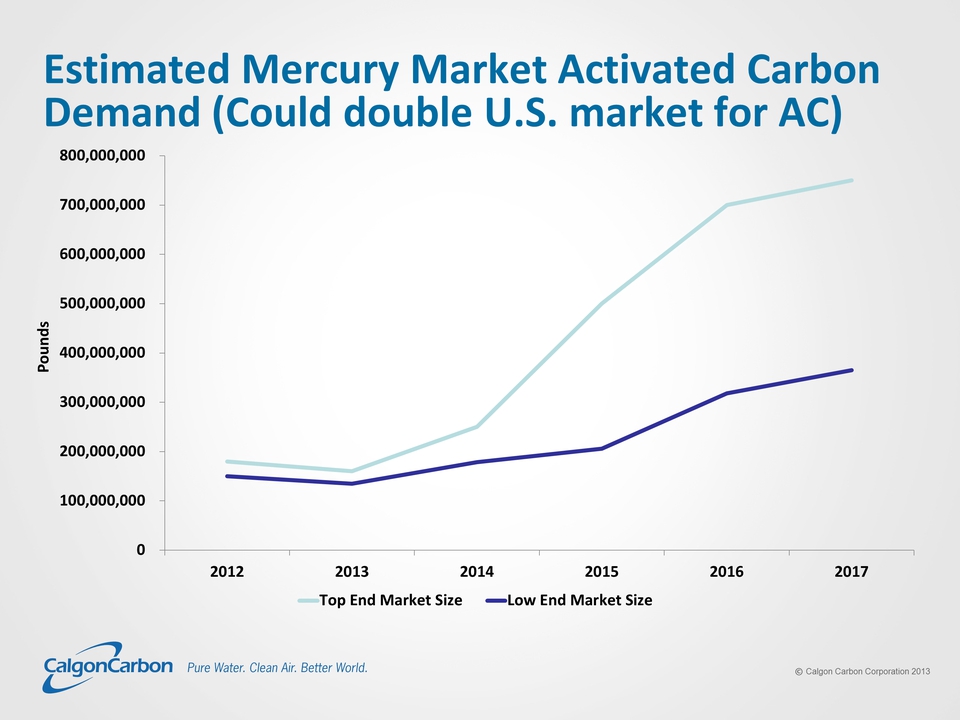
Title: Estimated Mercury Market Activated Carbon Demand (Could double U.S. market for AC) 2012 2013 2014 2015 2016 2017 Top End Market Size Low End Market Size 0 100,000,000 200,000,000 300,000,000 400,000,000 500,000,000 600,000,000 700,000,000 800,000,000
Title: Mercury Market Full-scale testing is best way to demonstrate benefits of Advanced Products Calgon Carbon’s Advanced FLUEPAC® Products have been top performers in 25 full-scale trials (particularly effective when SO3 present) More trials planned in upcoming months Proven Superior Products tailored to unique customer needs
Ballast Water Treatment
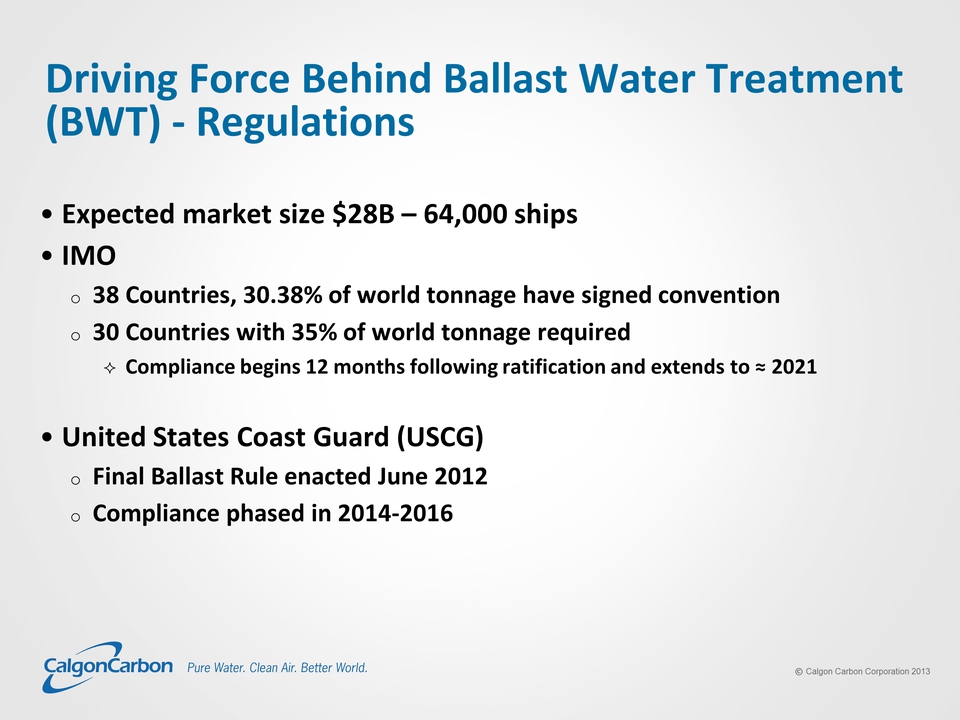
Title: Driving Force Behind Ballast Water Treatment (BWT) – Regulations Expected market size $28B – 64,000 ships IMO 38 Countries, 30.38% of world tonnage have signed convention 30 Countries with 35% of world tonnage required Compliance begins 12 months following ratification and extends to ˜ 2021 United States Coast Guard (USCG) Final Ballast Rule enacted June 2012 Compliance phased in 2014-2016
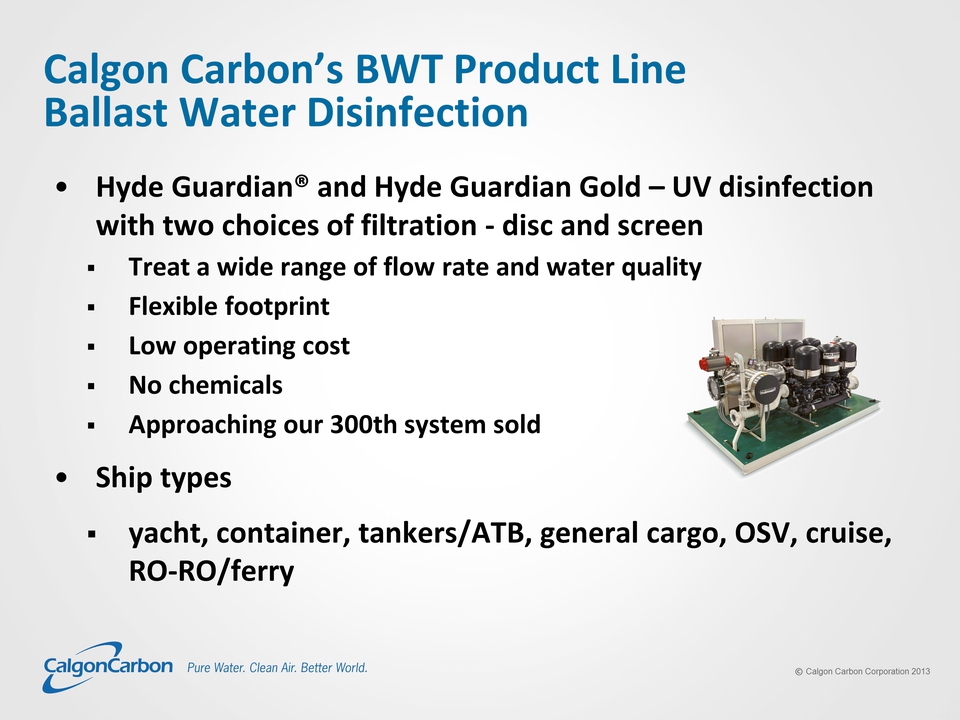
Title: Calgon Carbon’s BWT Product Line Ballast Water Disinfection Hyde Guardian® and Hyde Guardian Gold – UV disinfection with two choices of filtration - disc and screen Treat a wide range of flow rate and water quality Flexible footprint Low operating cost No chemicals Approaching our 300th system sold Ship types yacht, container, tankers/ATB, general cargo, OSV, cruise, RO-RO/ferry
Title: Hyde GUARDIAN® Value Proposition Hyde vs. UV Competitors Largest installed base Superior reliability reputation Shortest commissioning time Most retrofit experience (20+) Close relationships with US regulators Backed by solid parent with UV and water treatment expertise Worldwide after-sales support network Hyde vs. Non-UV Systems All left column items Chemical-free and neutralization-free Simple operation & maintenance No potential for damage to ships’ systems Personnel and ship safety benefits
Cost Improvement
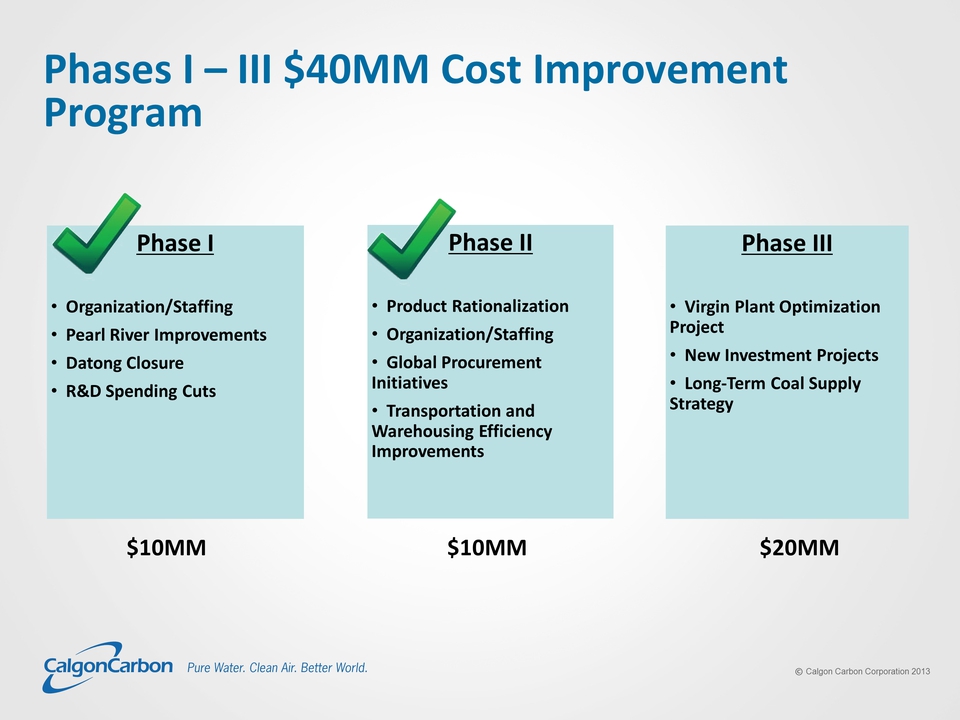
Title: Phases I – III $40MM Cost Improvement Program to (Gp:) Phase I Organization/Staffing Pearl River Improvements Datong Closure R&D Spending Cuts (Gp:) Phase II Product Rationalization Organization/Staffing Global Procurement Initiatives Transportation and Warehousing Efficiency Improvements (Gp:) Phase III Virgin Plant Optimization Project New Investment Projects Long-Term Coal Supply Strategy $10MM $10MM $20MM
Drivers for Value Creation
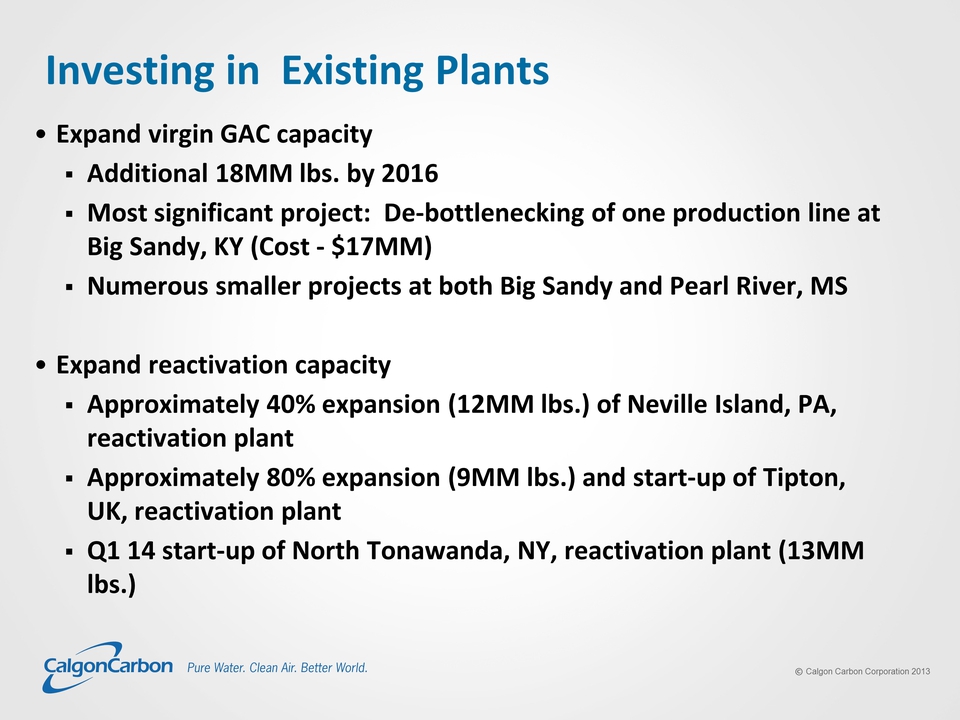
Title: Investing in Existing Plants Expand virgin GAC capacity Additional 18MM lbs. by 2016 Most significant project: De-bottlenecking of one production line at Big Sandy, KY (Cost - $17MM) Numerous smaller projects at both Big Sandy and Pearl River, MS Expand reactivation capacity Approximately 40% expansion (12MM lbs.) of Neville Island, PA, reactivation plant Approximately 80% expansion (9MM lbs.) and start-up of Tipton, UK, reactivation plant Q1 14 start-up of North Tonawanda, NY, reactivation plant (13MM lbs.)
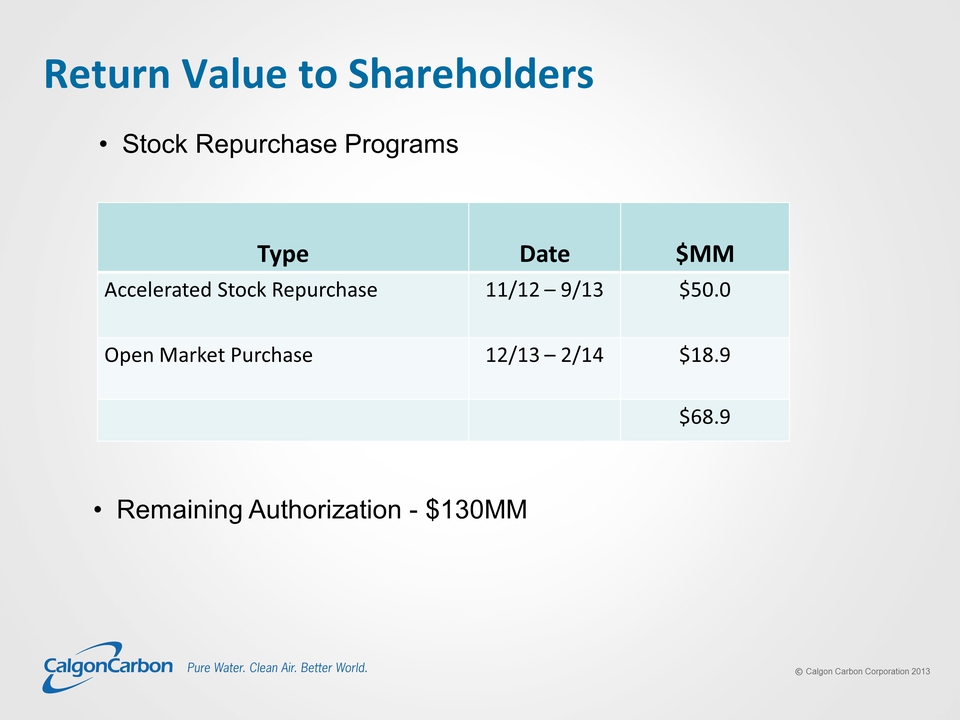
Title: Return Value to Shareholders Stock Repurchase Programs Accelerated Stock Repurchase Open Market Purchase 11/12 – 9/13 12/13-2/14 $50.0 $18.9 $68.9 Remaining Authorization - $130MM
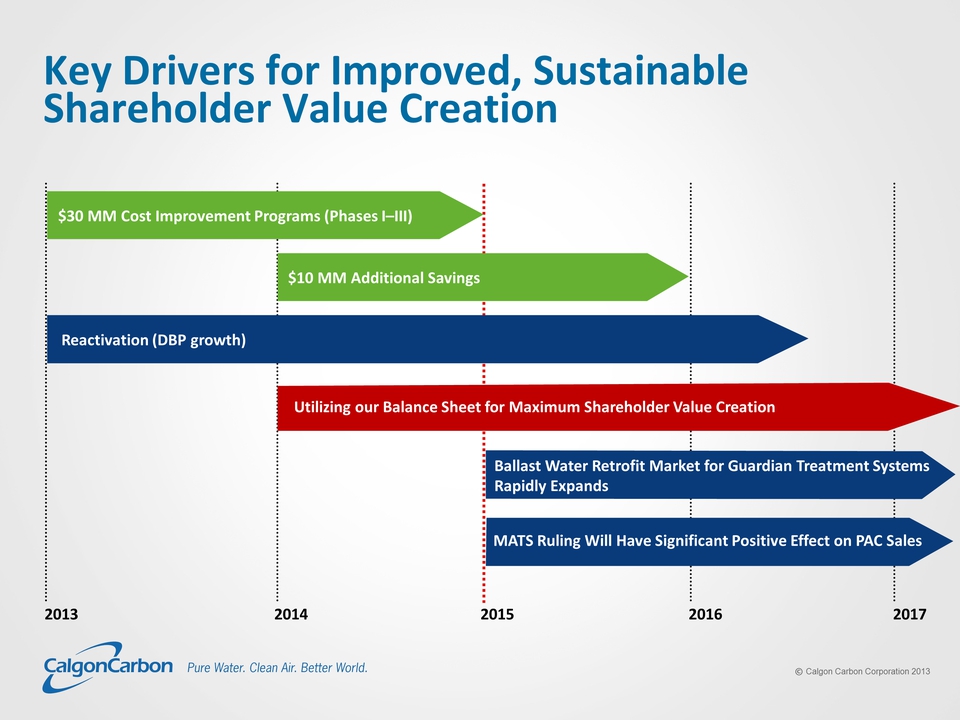
Title: Key Drivers for Improved, Sustainable Shareholder Value Creation 2013 2014 2015 2016 2017 (Gp:) Ballast Water Retrofit Market for Guardian Treatment Systems Rapidly Expands (Gp:) Utilizing our Balance Sheet for Maximum Shareholder Value Creation (Gp:) $30 MM Cost Improvement Programs (Phases I–III) (Gp:) Reactivation (DBP growth) (Gp:) MATS Ruling Will Have Significant Positive Effect on PAC Sales (Gp:) $10 MM Additional Savings
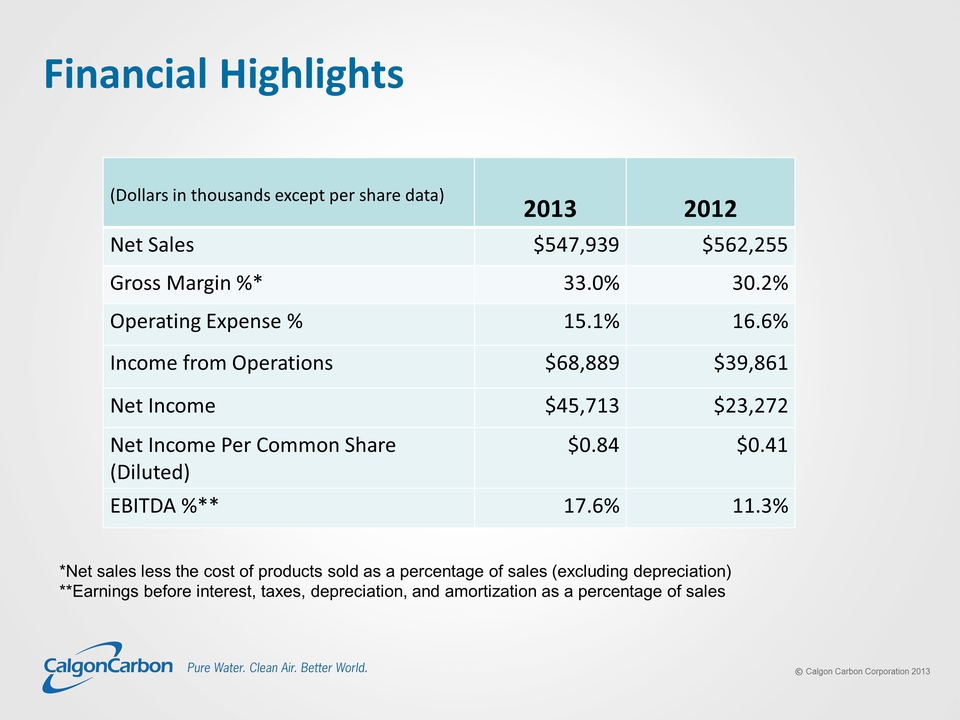
Title: Financial Highlights *Net sales less the cost of products sold as a percentage of sales (excluding depreciation) **Earnings before interest, taxes, depreciation, and amortization as a percentage of sales (Dollars in thousands except per share data) 2013 2012 Net Sales $547,939 $562,255 Gross Margin %* 33.0% 30.2% Operating Expense % 15.1% 16.6% Income from Operations $68,889 $39,861 Net Income $45,713 $23,272 Net Income Per Common Share (Diluted) $0.84 $0.41 EBITDA %** 17.6% 11.3%
Title: Thank You