UNITED STATES
SECURITIES AND EXCHANGE COMMISSION
Washington, D.C. 20549
FORM N-CSR
CERTIFIED SHAREHOLDER REPORT OF REGISTERED
MANAGEMENT INVESTMENT COMPANIES
| Investment Company Act file number: (811- 01682 ) |
| Exact name of registrant as specified in charter: Putnam Voyager Fund |
| Address of principal executive offices: One Post Office Square, Boston, Massachusetts 02109 |
| Name and address of agent for service: | Beth S. Mazor, Vice President |
| | One Post Office Square |
| | Boston, Massachusetts 02109 |
| |
| Copy to: | John W. Gerstmayr, Esq. |
| | Ropes & Gray LLP |
| | One International Place |
| | Boston, Massachusetts 02110 |
| |
| Registrant’s telephone number, including area code: | (617) 292-1000 |
Date of fiscal year end: July 31, 2007
Date of reporting period: August 1, 2006— January 31, 2007
Item 1. Report to Stockholders:
The following is a copy of the report transmitted to stockholders pursuant to Rule 30e-1 under the Investment Company Act of 1940:

What makes Putnam different?

In 1830, Massachusetts Supreme Judicial Court Justice Samuel Putnam established The Prudent Man Rule, a legal foundation for responsible money management.
THE PRUDENT MAN RULE
All that can be required of a trustee to invest is that he shall conduct himself faithfully and exercise a sound discretion. He is to observe how men of prudence, discretion, and intelligence manage their own affairs, not in regard to speculation, but in regard to the permanent disposition of their funds, considering the probable income, as well as the probable safety of the capital to be invested.

A time-honored tradition in money management
Since 1937, our values have been rooted in a profound sense of responsibility for the money entrusted to us.
A prudent approach to investing
We use a research-driven team approach to seek consistent, dependable, superior investment results over time, although there is no guarantee a fund will meet its objectives.
Funds for every investment goal
We offer a broad range of mutual funds and other financial products so investors and their financial representatives can build diversified portfolios.
A commitment to doing what’s right for investors
We have below-average expenses and stringent investor protections, and provide a wealth of information about the Putnam funds.
Industry-leading service
We help investors, along with their financial representatives, make informed investment decisions with confidence.
Putnam
Voyager
Fund
1| 31| 07
Semiannual Report
| Message from the Trustees | 2 |
| About the fund | 4 |
| Report from the fund managers | 7 |
| Performance | 13 |
| Expenses | 16 |
| Portfolio turnover | 18 |
| Risk | 18 |
| Your fund’s management | 19 |
| Terms and definitions | 22 |
| Trustee approval of management contract | 24 |
| Other information for shareholders | 29 |
| Financial statements | 30 |
| Brokerage commissions | 52 |
Cover photograph: Vineyard, Napa County, California © Charles O’Rear
Message from the Trustees
Dear Fellow Shareholder
Although the global economy continues to move forward, it has become apparent over the past few months that certain sectors of the U.S. economy may have slowed somewhat. We consequently consider slower job growth and perhaps a rise in the unemployment rate as possible developments for 2007. On the other hand, since the Federal Reserve (the Fed) stopped raising interest rates, stock prices have moved higher, bond yields have remained relatively low, and the weaker dollar appears to be making U.S. exports more competitive. With the benefit of this financial cushion, we believe 2007 may hold the potential for a renewed economic expansion.
As you may have heard, on February 1, 2007, Marsh & McLennan Companies, Inc. announced that it had signed a definitive agreement to sell its ownership interest in Putnam Investments Trust, the parent company of Putnam Management and its affiliates, to Great-West Lifeco Inc. Great-West Lifeco Inc. is a financial services holding company with operations in Canada, the United States, and Europe and is a member of the Power Financial Corporation group of companies. This transaction is subject to regulatory approvals and other conditions, including the approval of new management contracts by shareholders of a substantial number of Putnam funds at shareholder meetings expected to be held in May 2007. Proxy solicitation materials related to these meetings, which provide detailed information regarding the proposed transaction, were recently mailed. The transaction is currently expected to be completed by the middle of 2007.
Putnam’s team of investment and business professionals will continue to be led by Putnam President and Chief Executive Officer Ed Haldeman. Your Trustees have been actively involved through every step of the discussions, and we will continue in our role of overseeing the Putnam funds on your behalf.
2
We would like to take this opportunity to announce that a new independent Trustee, Kenneth R. Leibler, has joined your fund’s Board of Trustees. Mr. Leibler has had a distinguished career as a leader in the investment management industry. He is the founding Chairman of the Boston Options Exchange and currently serves as a Trustee of Beth Israel Deaconess Hospital in Boston; a lead director of Ruder Finn Group, a global communications and advertising firm; and a director of Northeast Utilities.
In the following pages, members of your fund’s management team discuss the fund’s performance and strategies for the fiscal period ended January 31, 2007, and provide their outlook for the months ahead. As always, we thank you for your support of the Putnam funds.
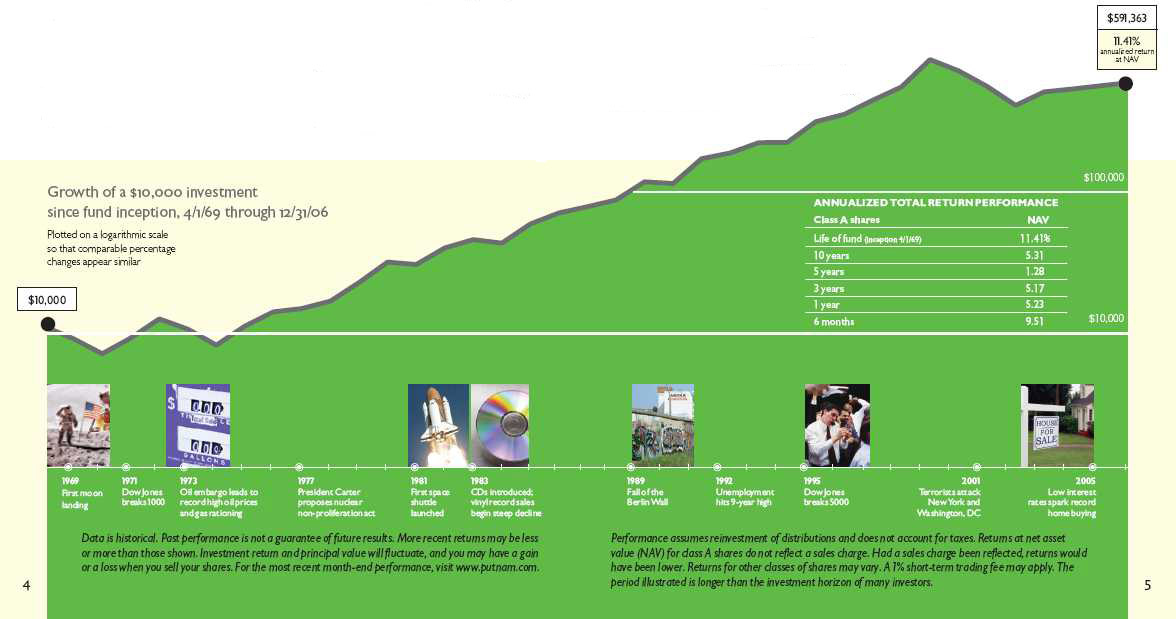
Putnam Voyager Fund: seeking growth
for investors for over 37 years
In 1969, when Putnam Voyager Fund made its debut, Richard M. Nixon became the 37th U.S. President and Americans landed on the moon for the first time. For the U.S. financial markets, it was the eve of a sluggish decade in which the Dow Jones Industrial Average would gain only 4.8% . Despite Vietnam War tensions and worries over inflation and recession, the fund’s first management team was ready to tap into the long-term growth potential of American businesses.
“The basic qualities underlying the dynamism of our economy are not at issue here,” said the first report to shareholders in 1969. “The future has never been brighter.”
The report also discussed the risk of “underestimating the potential growth of companies with strong fundamental trends.”
In the 37 years since its first report was published, the fund has witnessed many more difficult markets, as well as unprecedented stock market growth and extraordinary innovation. One emerging growth trend was noted in the fund’s 1988 annual report: “Several years from now, when you’re leaving home … you may find yourself tossing something new into your tote bag or briefcase — your phone. That’s right: the era of truly portable telephones is dawning.”
Today, the fund continues to look for promising growth trends as well as companies across a wide range of sectors that can grow revenues and earnings at a rate that we believe the market underestimates. While much has changed since the fund’s management team wrestled with the challenges of the 1970s, some things have not — including the team’s commitment to prudently manage the money that investors entrust to Putnam.
The fund invests some or all of its assets in small and/or midsize companies. Such investments increase the risk of fluctuations in the value of your investment. Stocks with above-average earnings growth may be more volatile, especially if earnings do not continue to grow.
In 1969, the year Putnam
Voyager Fund was
introduced, the Dow Jones
Industrial Average closed
at just over 800. At the
close of the fund’s most
recent fiscal year, the Dow
topped 11,000.
Putnam Voyager Fund seeks capital appreciation by investing mainly in stocks of U.S. companies believed by Putnam Management to offer above-average growth potential. The fund invests mainly in a diversified portfolio of large and midsize companies across a range of industries, although the fund may invest in companies of any size. The fund targets companies with unique competitive advantages and which offer either a growth rate, or a sustainability of growth and returns, that Putnam believes the market underestimates. The fund may be appropriate for investors seeking growth of capital and broad exposure to growth-oriented companies.
Highlights
• For the six months ended January 31, 2007, Putnam Voyager Fund’s class A shares returned 15.93% without sales charges.
• The fund’s benchmark, the Russell 1000 Growth Index, returned 15.12% .
• The average return for the fund’s Lipper category, Large-Cap Growth Funds, was 13.34% .
• Additional fund performance, comparative performance, and Lipper data can be found in the performance section beginning on page 13.
Performance
Total return for class A shares for periods ended 1/31/07
Since the fund’s inception (4/1/69), average annual return is 11.46% at NAV and 11.30% at POP.
| | Average annual return | Cumulative return |
| | NAV | POP | NAV | POP |
|
| 10 years | 5.13% | 4.56% | 64.88% | 56.24% |
|
| 5 years | 2.13 | 1.04 | 11.12 | 5.31 |
|
| 3 years | 5.32 | 3.44 | 16.82 | 10.67 |
|
| 1 year | 6.52 | 0.91 | 6.52 | 0.91 |
|
| 6 months | — | — | 15.93 | 9.83 |
|
Data is historical. Past performance does not guarantee future results. More recent returns may be less or more than those shown. Investment return and principal value will fluctuate, and you may have a gain or a loss when you sell your shares. Performance assumes reinvestment of distributions and does not account for taxes. Returns at POP reflect a maximum sales charge of 5.25% . For a portion of the period, this fund limited expenses, without which returns would have been lower. For the most recent month-end performance, visit www.putnam.com. A 1% short-term trading fee may apply.
6
Report from the fund managers
The period in review
We are pleased to report that your fund benefited from the rally in the stock market over the past six months, the first half of its 2007 fiscal year. As market leadership shifted toward growth-oriented stocks, your fund’s focus on these stocks enabled it to deliver double-digit returns, well above the long-term average for stocks in general. Based on results at net asset value (NAV, or without sales charges), the fund outpaced both its benchmark index and the average for its Lipper peer group. In addition, the fund ranked in the top 25% of its peer group, Large-Cap Growth Funds, for the period. Gains within the consumer cyclical, financial, and technology sectors were the most notable contributors to relative performance. The success of our stock selection in these sectors more than offset weaker results from the fund’s holdings in the capital goods and communications services sectors.
Market overview
The stock market rallied strongly during your fund’s semiannual reporting period, which began on August 1, 2006, and ended January 31, 2007. Gains were both substantial and broadly based, as corporations were rewarded for delivering double-digit earnings growth, on average. Supported by sustained rises in revenue and solid margins, many corporations have been making wise use of their bountiful profits by rewarding shareholders — both directly, through stock buybacks and special dividend payments, and indirectly, with prudent capital investments and expansion. Also, there were signs that individual investors were returning to U.S. stocks in force during recent months, after exhibiting reluctance in the wake of the tech-stock bubble and ensuing market slump earlier in the decade.
Growth-style investing also returned as the market leader. This represented a major shift from the trend that dominated the market earlier in 2006 and which had been particularly intense from April until August. In fact, this has been a multi-year trend, as value-style
7
stocks have outperformed growth-style stocks for seven consecutive years. Between April and August of 2006, investors generally avoided growth stocks due to concerns about higher inflation and oil prices, coupled with the effects of a weakening housing market on employment and consumer spending. In August, however, inflation data began to moderate, oil prices dropped, and the Fed refrained from raising interest rates. These positive events helped reverse the negative trend for growth stocks. For the remainder of the calendar year, the overall economy continued to expand and investors’ returning confidence in the long-term potential of growth stocks led to increasing demand and higher prices.
Strategy overview
Your fund seeks capital appreciation by investing in large growth companies that have what we consider unique products and services that effectively bar rival businesses from successfully entering the same market segments. In our view, investors routinely underestimate the sustainability of growth and returns on capital that can be achieved by companies with unique and powerful competitive advantages. This is the market inefficiency we are attempting to exploit as we look for opportunities to buy mispriced growth stocks.
At each step of our process, we combine quantitative and fundamental research. Our quantitative models examine historical data to assess the strength, quality, and sustainability of
Market sector performance
These indexes provide an overview of performance in different market sectors for the six months ended 1/31/07.
| Equities | |
|
| Russell 1000 Growth Index (large-company growth stocks) | 15.12% |
|
| MSCI EAFE Index (international stocks) | 14.33% |
|
| Russell 2000 Index (small-company stocks) | 14.95% |
|
| S&P 500 Index (broad stock market) | 13.75% |
| |
| Bonds | |
|
| Lehman Aggregate Bond Index (broad bond market) | 3.65% |
|
| Lehman Government Bond Index (U.S. Treasury and agency securities) | 3.05% |
|
| JPMorgan Global High Yield Index (global high-yield corporate bonds) | 8.32% |
|
8
earnings growth in the companies we follow and to determine the relative attractiveness of company valuations. Our fundamental analysts study industries and businesses, looking toward the future to forecast the potential growth of cash flows for each company. With these forecasts, we produce a range of possible outcomes for each company we evaluate. Our goal is to select stocks for the portfolio with the greatest potential appreciation relative to their risks.
We work to keep the fund’s portfolio well balanced and diversified. While its sector weightings and overall characteristics are generally similar to those of the benchmark, the Russell 1000 Growth Index, the fund’s specific holdings and the weightings of these holdings typically differ from the index because of our stock selection decisions. During the semiannual period, for example, the stocks we added to the portfolio resulted in larger weightings in financial and consumer cyclical stocks, and smaller weightings in consumer staples and communications services stocks, in comparison to the index.
Your fund’s holdings
As concerns over housing and consumer spending waned in the second half of 2006, many of the fund’s holdings in the consumer cyclical sectors gained in value. Retail stocks, in particular, benefited from their companies’ successful sales strategies and adept merchandising. Abercrombie & Fitch,
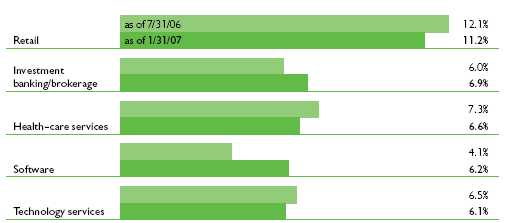
Comparison of top industry weightings
This chart shows how the fund’s top weightings have changed over the last six months. Weightings are shown as a percentage of net assets. Holdings will vary over time.
9
Ross Stores, and Kohl’s were among the holdings that contributed to the fund’s strength in this industry. The fund’s position in homebuilder NVR also helped performance, as declining mortgage interest rates in the closing months of 2006 stimulated demand for new homes, reversing the prior downward trend in new home sales. With regard to the overall consumer cyclicals sector, however, one of the most significant contributions to results came from the stock of casino and hotel operator Las V egas Sands. The company’s shares rose sharply on the strength of its existing properties as well as the continued optimism about the company’s growth prospects in Macau, China, and Singapore.
Holdings within the financial sector also delivered strong performance, especially those in the investment banking and real estate industries. The stock of investment banking firm Goldman Sachs was one of the top overall contributors to the fund’s performance in the period. Robust growth in securities trading and burgeoning merger-and-acquisition (M&A) activity, which led to record profits for the industry in 2006, continued to drive Goldman Sachs’ earnings. CB Richard Ellis Group, the world’s largest commercial real estate firm, benefited as the pace of corporate expansion has reinforced the demand for office space. The resulti ng reductions in vacancies and increases in rental rates were key factors in the company’s growth.
Top holdings
This table shows the fund’s top holdings, and the percentage of the fund’s net assets that each represented, as of 1/31/07. The fund’s holdings will change over time.
| Holding (percent of fund’s net assets) | Industry |
|
| Cisco Systems, Inc. (3.8%) | Communications equipment |
|
| Johnson & Johnson (2.9%) | Pharmaceuticals |
|
| UnitedHealth Group, Inc. (2.7%) | Health-care services |
|
| Goldman Sachs Group, Inc. (The) (2.6%) | Investment banking/brokerage |
|
| Lowe’s Cos., Inc. (2.3%) | Retail |
|
| Staples, Inc. (2.3%) | Retail |
|
| Oracle Corp. (2.2%) | Software |
|
| Google, Inc. Class A (2.1%) | Technology services |
|
| Bear Stearns Cos., Inc. (The) (2.1%) | Investment banking/brokerage |
|
| WellPoint, Inc. (2.1%) | Health-care services |
|
10
The shift in investor sentiment appeared to have its greatest impact within the technology sector. As confidence in the market improved, investors demonstrated a greater willingness to invest in stocks offering sustained future growth potential. Stocks from communications equipment, Internet services, and computer industries benefited from this change of heart. Investors sent the shares of networking giant Cisco Systems sharply higher amid strong demand for its products, particularly from cable and telephone firms seeking to upgrade their networks for high-speed data and video. The fund’s overweight position in Internet auctioneer eBay gained in value, reflecting growth in the company’s merchandise listings and usage of its PayPal online payment service. A position in Apple also added to returns as strong Macintosh and iPod sales continued to impress the market. Apple’s January 2007 announcement of plans to introduce the iPhone, its first integrated mobile phone, later this year, also lifted the stock price.
Relative weakness within the capital goods sector modestly detracted from performance over the period. The fund’s position in earth-moving equipment giant Caterpillar declined in value after higher manufacturing costs caused its results to fall short of expectations. Given our belief that the company’s valuation adequately reflected our revised expectations for its growth potential, we liquidated the position in favor of more compelling opportunities elsewhere.
Unrewarded positions within the transportation sector also restrained results, particularly the fund’s holdings in the airline industry. The stock of discount carrier Southwest Airlines weakened as higher spending for jet fuel more than offset record sales. However, we have remained committed to the position because we believe investors are unduly focused on near-term issues and underestimate the sustainability of the company’s competitive advantage and its ability to drive growth.
Please note that the holdings discussed in this report may not have been held by the fund for the entire period. Portfolio composition is subject to review in accordance with the fund’s investment strategy and may vary in the future.
11
The outlook for your fund
The following commentary reflects anticipated developments that could affect your fund over the next six months, as well as your management team’s plans for responding to them.
The market rally during the second half of 2006 was fueled by strong corporate profitability and supported by a benign macroeconomic backdrop. As neither of these conditions seems likely to change in the near future, we expect continued market appreciation. While we do not expect stocks to rally without interruption, the basis of the bull market appears to be intact. Moreover, we anticipate that the ongoing and gradual transition of leadership to larger and more growth-oriented companies will persist in 2007.
Currently, as a result of bottom-up stock selection decisions, the fund’s largest sector overweight relative to the benchmark is in financials, followed by consumer cyclicals. Although two of the fund’s largest sector weightings in absolute terms are in health care and technology, the fund is modestly underweight in both sectors relative to the benchmark. The fund is also underweight in the consumer staples and conglomerates sectors due to what we see as generally lackluster growth prospects and poor valuations in both sectors. We believe that the fund’s performance will continue to be rewarded as investors recognize that companies that are able to continue growing over the long term deserve a higher relative valuation than companies whose growth is more cyclical or inconsistent.
The views expressed in this report are exclusively those of Putnam Management. They are not meant as investment advice.
The fund invests some or all of its assets in small and/or midsize companies. Such investments increase the risk of fluctuations in the value of your investment. Stocks with above-average earnings growth may be more volatile, especially if earnings do not continue to grow.
12
Your fund’s performance
This section shows your fund’s performance for periods ended January 31, 2007, the end of the first half of its current fiscal year. In accordance with regulatory requirements for mutual funds, we also include performance as of the most recent calendar quarter-end. Performance should always be considered in light of a fund’s investment strategy. Data represents past performance. Past performance does not guarantee future results. More recent returns may be less or more than those shown. Investment return and principal value will fluctuate, and you may have a gain or a loss when you sell your shares. For the most recent month-end performance, please visit www.putnam.com or call Putnam at 1-800-225-1581. Class Y shares are generally only available to corporate and institutional clients. See the Terms and Definitions section in this report for definitions of the share classes offered by your fund.
Fund performance
Total return for periods ended 1/31/07
| | Class A | | Class B | | Class C | | Class M | | Class R | Class Y |
| (inception dates) | (4/1/69) | | (4/27/92) | | (7/26/99) | | (12/1/94) | | (1/21/03) | (3/31/94) |
| | NAV | POP | NAV | CDSC | NAV | CDSC | NAV | POP | NAV | NAV |
|
| Annual average | | | | | | | | | | |
| (life of fund) | 11.46% | 11.30% | 10.46% | 10.46% | 10.62% | 10.62% | 10.75% | 10.66% | 11.18% | 11.56% |
|
| 10 years | 64.88 | 56.24 | 52.93 | 52.93 | 53.05 | 53.05 | 56.89 | 51.79 | 60.85 | 69.07 |
| Annual average | 5.13 | 4.56 | 4.34 | 4.34 | 4.35 | 4.35 | 4.61 | 4.26 | 4.87 | 5.39 |
|
| 5 years | 11.12 | 5.31 | 7.03 | 5.03 | 7.00 | 7.00 | 8.42 | 4.88 | 9.80 | 12.53 |
| Annual average | 2.13 | 1.04 | 1.37 | 0.99 | 1.36 | 1.36 | 1.63 | 0.96 | 1.89 | 2.39 |
|
| 3 years | 16.82 | 10.67 | 14.23 | 11.23 | 14.17 | 14.17 | 15.08 | 11.37 | 15.91 | 17.66 |
| Annual average | 5.32 | 3.44 | 4.53 | 3.61 | 4.52 | 4.52 | 4.79 | 3.65 | 5.04 | 5.57 |
|
| 1 year | 6.52 | 0.91 | 5.78 | 0.78 | 5.73 | 4.73 | 6.02 | 2.56 | 6.28 | 6.82 |
|
| 6 months | 15.93 | 9.83 | 15.44 | 10.44 | 15.42 | 14.42 | 15.64 | 11.89 | 15.72 | 16.07 |
|
Performance assumes reinvestment of distributions and does not account for taxes. Returns at public offering price (POP) for class A and M shares reflect a maximum sales charge of 5.25% and 3.25%, respectively. Class B share returns reflect the applicable contingent deferred sales charge (CDSC), which is 5% in the first year, declining to 1% in the sixth year, and is eliminated thereafter. Class C shares reflect a 1% CDSC for the first year and is eliminated thereafter. Class R and Y shares have no initial sales charge or CDSC. Performance for class B, C, M, R, and Y shares before their inception is derived from the historical performance of class A shares, adjusted for the applicable sales charge (or CDSC) and, except for class Y shares, the higher operating expenses for such shares.
For a portion of the period, this fund limited expenses, without which returns would have been lower.
A 1% short-term trading fee may be applied to shares exchanged or sold within 7 days of purchase.
13
Comparative index returns
For periods ended 1/31/07
| | Russell 1000 | Lipper Large-Cap |
| | Growth Index | Growth Funds† |
|
| Annual average | | |
| (life of fund) | —* | 9.74% |
|
| 10 years | 62.85% | 69.34 |
| Annual average | 5.00 | 5.23 |
|
| 5 years | 19.24 | 17.13 |
| Annual average | 3.58 | 3.12 |
|
| 3 years | 22.68 | 21.05 |
| Annual average | 7.05 | 6.52 |
|
| 1 year | 9.95 | 4.96 |
|
| 6 months | 15.12 | 13.34 |
|
Index and Lipper results should be compared to fund performance at net asset value.
* The inception date of the Russell 1000 Growth Index was 12/31/78.
† Over the 6-month and 1-, 3-, 5-, and 10-year periods ended 1/31/07, there were 756, 731, 622, 511, and 194 funds, respectively, in this Lipper category.
Fund price and distribution* information
For the six-month period ended 1/31/07
| | Class A | | Class B | Class C | Class M | | Class R | Class Y |
| Share value: | NAV | POP | NAV | NAV | NAV | POP | NAV | NAV |
|
| 7/31/06 | $16.20 | $17.10 | $14.12 | $15.50 | $15.22 | $15.73 | $16.09 | $16.74 |
|
| 1/31/07 | 18.78 | 19.82 | 16.30 | 17.89 | 17.60 | 18.19 | 18.62 | 19.43 |
|
* The fund made no distributions during the period.
14
Fund performance as of most recent calendar quarter
Total return for periods ended 12/31/06
| | Class A | | Class B | | Class C | | Class M | | Class R | Class Y |
| (inception dates) | (4/1/69) | | (4/27/92) | | (7/26/99) | | (12/1/94) | | (1/21/03) | (3/31/94) |
| | NAV | POP | NAV | CDSC | NAV | CDSC | NAV | POP | NAV | NAV |
|
| Annual average | | | | | | | | | | |
| (life of fund) | 11.41% | 11.25% | 10.41% | 10.41% | 10.58% | 10.58% | 10.71% | 10.61% | 11.13% | 11.51% |
|
| 10 years | 67.83 | 59.05 | 55.66 | 55.66 | 55.82 | 55.82 | 59.78 | 54.55 | 63.74 | 72.10 |
| Annual average | 5.31 | 4.75 | 4.52 | 4.52 | 4.54 | 4.54 | 4.80 | 4.45 | 5.05 | 5.58 |
|
| 5 years | 6.59 | 0.98 | 2.65 | 0.65 | 2.65 | 2.65 | 3.98 | 0.58 | 5.29 | 7.90 |
| Annual average | 1.28 | 0.20 | 0.52 | 0.13 | 0.52 | 0.52 | 0.78 | 0.12 | 1.04 | 1.53 |
|
| 3 years | 16.34 | 10.22 | 13.73 | 10.73 | 13.75 | 13.75 | 14.66 | 10.96 | 15.48 | 17.22 |
| Annual average | 5.17 | 3.30 | 4.38 | 3.46 | 4.39 | 4.39 | 4.67 | 3.53 | 4.91 | 5.44 |
|
| 1 year | 5.23 | –0.27 | 4.47 | –0.53 | 4.49 | 3.49 | 4.76 | 1.36 | 4.97 | 5.52 |
|
| 6 months | 9.51 | 3.74 | 9.05 | 4.05 | 9.13 | 8.13 | 9.22 | 5.66 | 9.33 | 9.67 |
|
15
Your fund’s expenses
As a mutual fund investor, you pay ongoing expenses, such as management fees, distribution fees (12b-1 fees), and other expenses. In the most recent six-month period, your fund limited these expenses; had it not done so, expenses would have been higher. Using the information below, you can estimate how these expenses affect your investment and compare them with the expenses of other funds. You may also pay one-time transaction expenses, including sales charges (loads) and redemption fees, which are not shown in this section and would have resulted in higher total expenses. For more information, see your fund’s prospectus or talk to your financial advisor.
Review your fund’s expenses
The table below shows the expenses you would have paid on a $1,000 investment in Putnam Voyager Fund from August 1, 2006, to January 31, 2007. It also shows how much a $1,000 investment would be worth at the close of the period, assuming actual returns and expenses.
| | Class A | Class B | Class C | Class M | Class R | Class Y |
|
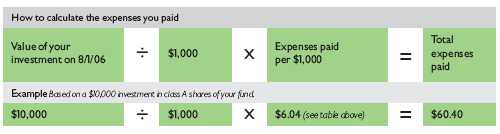
| Expenses paid per $1,000* | $ 6.04 | $ 10.10 | $ 10.10 | $ 8.75 | $ 7.39 | $ 4.68 |
|
| Ending value (after expenses) | $1,159.30 | $1,154.40 | $1,154.20 | $1,156.40 | $1,157.20 | $1,160.70 |
|
* Expenses for each share class are calculated using the fund’s annualized expense ratio for each class, which represents the ongoing expenses as a percentage of average net assets for the six months ended 1/31/07. The expense ratio may differ for each share class (see the last table in this section). Expenses are calculated by multiplying the expense ratio by the average account value for the period; then multiplying the result by the number of days in the period; and then dividing that result by the number of days in the year.
Estimate the expenses you paid
To estimate the ongoing expenses you paid for the six months ended January 31, 2007, use the calculation method below. To find the value of your investment on August 1, 2006, go to www.putnam.com and log on to your account. Click on the “Transaction History” tab in your Daily Statement and enter 08/01/2006 in both the “from” and “to” fields. Alternatively, call Putnam at 1-800-225-1581.
16
Compare expenses using the SEC’s method
The Securities and Exchange Commission (SEC) has established guidelines to help investors assess fund expenses. Per these guidelines, the table below shows your fund’s expenses based on a $1,000 investment, assuming a hypothetical 5% annualized return. You can use this information to compare the ongoing expenses (but not transaction expenses or total costs) of investing in the fund with those of other funds. All mutual fund shareholder reports will provide this information to help you make this comparison. Please note that you cannot use this information to estimate your actual ending account balance and expenses paid during the period.
| | Class A | Class B | Class C | Class M | Class R | Class Y |
|
| Expenses paid per $1,000* | $ 5.65 | $ 9.45 | $ 9.45 | $ 8.19 | $ 6.92 | $ 4.38 |
|
| Ending value (after expenses) | $1,019.61 | $1,015.83 | $1,015.83 | $1,017.09 | $1,018.35 | $1,020.87 |
|
* Expenses for each share class are calculated using the fund’s annualized expense ratio for each class, which represents the ongoing expenses as a percentage of average net assets for the six months ended 1/31/07. The expense ratio may differ for each share class (see the last table in this section). Expenses are calculated by multiplying the expense ratio by the average account value for the period; then multiplying the result by the number of days in the period; and then dividing that result by the number of days in the year.
Compare expenses using industry averages
You can also compare your fund’s expenses with the average of its peer group, as defined by Lipper, an independent fund-rating agency that ranks funds relative to others that Lipper considers to have similar investment styles or objectives. The expense ratio for each share class shown below indicates how much of your fund’s average net assets have been used to pay ongoing expenses during the period.
| | Class A | Class B | Class C | Class M | Class R | Class Y |
|
| Your fund’s annualized | | | | | | |
| expense ratio | 1.11% | 1.86% | 1.86% | 1.61% | 1.36% | 0.86% |
|
| Average annualized expense | | | | | | |
| ratio for Lipper peer group* | 1.33% | 2.08% | 2.08% | 1.83% | 1.58% | 1.08% |
|
* Simple average of the expenses of all front-end load funds in the fund’s Lipper peer group, calculated in accordance with Lipper’s standard method for comparing fund expenses (excluding 12b-1 fees and without giving effect to any expense offset and brokerage service arrangements that may reduce fund expenses). This average reflects each fund’s expenses for its most recent fiscal year available to Lipper as of 12/31/06. To facilitate comparison, Putnam has adjusted this average to reflect the 12b-1 fees carried by each class of shares other than class Y shares, which do not incur 12b-1 fees. The peer group may include funds that are significantly smaller or larger than the fund, which may limit the comparability of the fund’s expenses to the simple average, which typically is higher than the asset-weighted average.
17
Your fund’s
portfolio turnover
Putnam funds are actively managed by teams of experts who buy and sell securities based on intensive analysis of companies, industries, economies, and markets. Portfolio turnover is a measure of how often a fund’s managers buy and sell securities for your fund. A portfolio turnover of 100%, for example, means that the managers sold and replaced securities valued at 100% of a fund’s assets within a one-year period. Funds with high turnover may be more likely to generate capital gains and dividends that must be distributed to shareholders as taxable income. High turnover may also cause a fund to pay more brokerage commissions and other transaction costs, which may detract from performance.
Turnover comparisons
Percentage of holdings that change every year
| | 2006 | 2005 | 2004 | 2003 | 2002 |
|
| Putnam Voyager Fund | 76% | 93% | 46% | 62% | 91% |
|
| Lipper Large-Cap Growth Funds | | | | | |
| category average | 90% | 96% | 92% | 102% | 105% |
|
Turnover data for the fund is calculated based on the fund’s fiscal-year period, which ends on July 31. Turnover data for the fund’s Lipper category is calculated based on the average of the turnover of each fund in the category for its fiscal year ended during the indicated year. Fiscal years vary across funds in the Lipper category, which may limit the comparability of the fund’s portfolio turnover rate to the Lipper average. Comparative data for 2006 is based on information available as of 12/31/06.
Your fund’s risk
This risk comparison is designed to help you understand how your fund compares with other funds. The comparison utilizes a risk measure developed by Morningstar, an independent fund-rating agency. This risk measure is referred to as the fund’s Morningstar Risk.
Your fund’s Morningstar® Risk
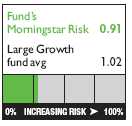
Your fund’s Morningstar Risk is shown alongside that of the average fund in its Morningstar category. The risk bar broadens the comparison by translating the fund’s Morningstar Risk into a percentile, which is based on the fund’s ranking among all funds rated by Morningstar as of December 31, 2006. A higher Morningstar Risk generally indicates that a fund’s monthly returns have varied more widely.
Morningstar determines a fund’s Morningstar Risk by assessing variations in the fund’s monthly returns — with an emphasis on downside variations — over a 3-year period, if available. Those measures are weighted and averaged to produce the fund’s Morningstar Risk. The information shown is provided for the fund’s class A shares only; information for other classes may vary. Morningstar Risk is based on historical data and does not indicate future results. Morningstar does not purport to measure the risk associated with a current investment in a fund, either on an absolute basis or on a relative basis. Low Morningstar Risk does not mean that you cannot lose money on an investment in a fund. Copyright 2007 Morningstar, Inc. All Rights Reserved. The information contained herein (1) is proprietary to Morningstar and/or its content providers; (2) may not be copied or distributed; and (3) is not warranted to be accurate, complete, or timely. Neither Morningstar nor its content providers are responsible for any damages or losses arising from any use of this information.
18
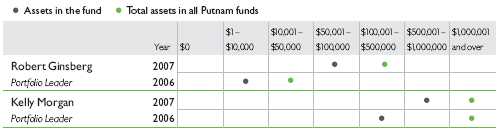
Your fund’s management
Your fund is managed by the members of the Putnam Large-Cap Growth Team. Robert Ginsberg and Kelly Morgan are Portfolio Leaders of your fund. The Portfolio Leaders coordinate the team’s management of the fund.
For a complete listing of the members of the Putnam Large-Cap Growth Team, including those who are not Portfolio Leaders or Portfolio Members of your fund, visit Putnam’s Individual Investor Web site at www.putnam.com.
Investment team fund ownership
The table below shows how much the fund’s current Portfolio Leaders have invested in the fund and in all Putnam mutual funds (in dollar ranges). Information shown is as of January 31, 2007, and January 31, 2006.
Trustee and Putnam employee fund ownership
As of January 31, 2007, all of the Trustees of the Putnam funds owned fund shares. The table below shows the approximate value of investments in the fund and all Putnam funds as of that date by the Trustees and Putnam employees. These amounts include investments by the Trustees’ and employees’ immediate family members and investments through retirement and deferred compensation plans.
| | | Total assets in |
| | Assets in the fund | all Putnam funds |
|
| Trustees | $ 826,000 | $101,000,000 |
|
| Putnam employees | $16,516,000 | $454,000,000 |
|
19
Fund manager compensation
The total 2006 fund manager compensation that is attributable to your fund is approximately $2,000,000. This amount includes a portion of 2006 compensation paid by Putnam Management to the fund managers listed in this section for their portfolio management responsibilities, calculated based on the fund assets they manage taken as a percentage of the total assets they manage. The compensation amount also includes a portion of the 2006 compensation paid to the Chief Investment Officer of the team and the Group Chief Investment Officer of the fund’s broader investment category for their oversight responsibilities, calculated based on the fund assets they oversee taken as a percentage of the total assets they oversee. This amount does not include compensation of other personnel involved in research, trading, administration, systems, compliance, or fund operations; nor does it include non-compensation costs. These percentages are determi ned as of the fund’s fiscal period-end. For personnel who joined Putnam Management during or after 2006, the calculation reflects annualized 2006 compensation or an estimate of 2007 compensation, as applicable.
Other Putnam funds managed by the Portfolio Leaders
Robert Ginsberg is also a Portfolio Leader of Putnam Growth Opportunities Fund and a Portfolio Member of Putnam Discovery Growth Fund.
Kelly Morgan is also a Portfolio Leader of Putnam Growth Opportunities Fund and Putnam Research Fund.
Robert Ginsberg and Kelly Morgan may also manage other accounts and variable trust funds advised by Putnam Management or an affiliate.
Changes in your fund’s Portfolio Leader and Portfolio Members
During the year ended January 31, 2007, Portfolio Member Saba Malak left your fund’s management team.
20
Putnam fund ownership by Putnam’s Executive Board
The table below shows how much the members of Putnam’s Executive Board have invested in all Putnam mutual funds (in dollar ranges). Information shown is as of January 31, 2007, and January 31, 2006.
| | | $1 – | $10,001 – | $50,001 – | $100,001 – | $500,001 – | $1,000,001 |
| | Year | $0 | $10,000 | $50,000 | $100,000 | $500,000 | $1,000,000 | and over |
|
| Philippe Bibi | 2007 | | | | | | • |
|
|
| Chief Technology Officer | 2006 | | | | | | • |
|
| Joshua Brooks | 2007 | | | | | | • |
|
|
| Deputy Head of Investments | 2006 | | | | | | • |
|
| William Connolly | 2007 | | | | | | • |
|
|
| Head of Retail Management | 2006 | | | | | | • |
|
| Kevin Cronin | 2007 | | | | | | • |
|
|
| Head of Investments | 2006 | | | | | | • |
|
| Charles Haldeman, Jr. | 2007 | | | | | | • |
|
|
| President and CEO | 2006 | | | | | | • |
|
| Amrit Kanwal | 2007 | | | | | • | |
|
|
| Chief Financial Officer | 2006 | | | | | • | |
|
| Steven Krichmar | 2007 | | | | | | • |
|
|
| Chief of Operations | 2006 | | | | | • | |
|
| Francis McNamara, III | 2007 | | | | | | • |
|
|
| General Counsel | 2006 | | | | | | • |
|
| Jeffrey Peters | 2007 | | | | | | • |
|
|
| Head of International Business | N/A | | | | | |
|
| Richard Robie, III | 2007 | | | | | • | |
|
|
| Chief Administrative Officer | 2006 | | | | | • | |
|
| Edward Shadek | 2007 | | | | | | • |
|
|
| Deputy Head of Investments | 2006 | | | | | | • |
|
| Sandra Whiston | 2007 | | | | | • | |
|
|
| Head of Institutional Management | 2006 | | | | | • | |
|
N/A indicates the individual was not a member of Putnam’s Executive Board as of 1/31/06.
21
Terms and definitions
Important terms
Total return shows how the value of the fund’s shares changed over time, assuming you held the shares through the entire period and reinvested all distributions in the fund.
Net asset value (NAV) is the price, or value, of one share of a mutual fund, without a sales charge. NAVs fluctuate with market conditions. NAV is calculated by dividing the net assets of each class of shares by the number of outstanding shares in the class.
Public offering price (POP) is the price of a mutual fund share plus the maximum sales charge levied at the time of purchase. POP performance figures shown here assume the 5.25% maximum sales charge for class A shares and 3.25% for class M shares.
Contingent deferred sales charge (CDSC) is generally a charge applied at the time of the redemption of class B or C shares and assumes redemption at the end of the period. Your fund’s class B CDSC declines from a 5% maximum during the first year to 1% during the sixth year. After the sixth year, the CDSC no longer applies. The CDSC for class C shares is 1% for one year after purchase.
Share classes
Class A shares are generally subject to an initial sales charge and no CDSC (except on certain redemptions of shares bought without an initial sales charge).
Class B shares are not subject to an initial sales charge. They may be subject to a CDSC.
Class C shares are not subject to an initial sales charge and are subject to a CDSC only if the shares are redeemed during the first year.
Class M shares have a lower initial sales charge and a higher 12b-1 fee than class A shares and no CDSC (except on certain redemptions of shares bought without an initial sales charge).
Class R shares are not subject to an initial sales charge or CDSC and are available only to certain defined contribution plans.
Class Y shares are not subject to an initial sales charge or CDSC, and carry no 12b-1 fee. They are only available to eligible purchasers, including eligible defined contribution plans or corporate IRAs.
22
Comparative indexes
JPMorgan Global High Yield Index is an unmanaged index of global high-yield fixed-income securities.
Lehman Aggregate Bond Index is an unmanaged index of U.S. investment-grade fixed-income securities.
Lehman Government Bond Index is an unmanaged index of U.S. Treasury and agency securities.
Morgan Stanley Capital International (MSCI) EAFE Index is an unmanaged index of equity securities from developed countries in Western Europe, the Far East, and Australasia.
Russell 1000 Growth Index is an unmanaged index of those companies in the large-cap Russell 1000 Index chosen for their growth orientation.
Russell 2000 Index is an unmanaged index of the 2,000 smallest companies in the Russell 3000 Index.
S&P 500 Index is an unmanaged index of common stock performance.
Indexes assume reinvestment of all distributions and do not account for fees. Securities and performance of a fund and an index will differ. You cannot invest directly in an index.
Lipper is a third-party industry-ranking entity that ranks mutual funds. Its rankings do not reflect sales charges. Lipper rankings are based on total return at net asset value relative to other funds that have similar current investment styles or objectives as determined by Lipper. Lipper may change a fund’s category assignment at its discretion. Lipper category averages reflect performance trends for funds within a category.
23
Trustee approval of
management contract
General conclusions
The Board of Trustees of the Putnam funds oversees the management of each fund and, as required by law, determines annually whether to approve the continuance of your fund’s management contract with Putnam Management. In this regard, the Board of Trustees, with the assistance of its Contract Committee consisting solely of Trustees who are not “interested persons” (as such term is defined in the Investment Company Act of 1940, as amended) of the Putnam funds (the “Independent Trustees”), requests and evaluates all information it deems reasonably necessary under the circumstances. Over the course of several months ending in June 2006, the Contract Committee met four times to consider the information provided by Putnam Management and other information developed with the assistance of the Board’s independent counsel and independent staff. The Contract Committee reviewed and discussed key aspects of this informat ion with all of the Independent Trustees. Upon completion of this review, the Contract Committee recommended, and the Independent Trustees approved, the continuance of your fund’s management contract, effective July 1, 2006.
This approval was based on the following conclusions:
• That the fee schedule in effect for your fund represented reasonable compensation in light of the nature and quality of the services being provided to the fund, the fees paid by competitive funds and the costs incurred by Putnam Management in providing such services, and
• That such fee schedule represented an appropriate sharing between fund shareholders and Putnam Management of such economies of scale as may exist in the management of the fund at current asset levels.
These conclusions were based on a comprehensive consideration of all information provided to the Trustees and were not the result of any single factor. Some of the factors that figured particularly in the Trustees’ deliberations and how the Trustees considered these factors are described below, although individual Trustees may have evaluated the information presented differently, giving different weights to various factors. It is also important to recognize that the fee arrangements for your fund and the other Putnam funds are the result of many years of review and discussion between the Independent Trustees and Putnam Management, that certain aspects of such arrangements may receive greater scrutiny in some years than others, and that the Trustees’ conclusions may be based, in part, on their consideration of these same arrangements in prior years.
24
Management fee schedules and categories; total expenses
The Trustees reviewed the management fee schedules in effect for all Putnam funds, including fee levels and breakpoints, and the assignment of funds to particular fee categories. In reviewing fees and expenses, the Trustees generally focused their attention on material changes in circumstances — for example, changes in a fund’s size or investment style, changes in Putnam Management’s operating costs, or changes in competitive practices in the mutual fund industry — that suggest that consideration of fee changes might be warranted. The Trustees concluded that the circumstances did not warrant changes to the management fee structure of your fund, which had been carefully developed over the years, re-examined on many occasions and adjusted where appropriate. The Trustees focused on two areas of particular interest, as discussed further below:
• Competitiveness. The Trustees reviewed comparative fee and expense information for competitive funds, which indicated that, in a custom peer group of competitive funds selected by Lipper Inc., your fund ranked in the 14th percentile in management fees and in the 17th percentile in total expenses (less any applicable 12b-1 fees) as of December 31, 2005 (the first percentile being the least expensive funds and the 100th percentile being the most expensive funds). The Trustees noted that expense ratios for a number of Putnam funds, which show the percentage of fund assets used to pay for management and administrative services, distribution (12b-1) fees and other expenses, had been increasing recently as a result of declining net assets and the natural operation of fee breakpoints.
The Trustees noted that the expense ratio increases described above were currently being controlled by expense limitations implemented in January 2004 and which Putnam Management, in consultation with the Contract Committee, has committed to maintain at least through 2007. These expense limitations give effect to a commitment by Putnam Management that the expense ratio of each open-end fund would be no higher than the average expense ratio of the competitive funds included in the fund’s relevant Lipper universe (exclusive of any applicable 12b-1 charges in each case). The Trustees observed that this commitment to limit fund expenses has served shareholders well since its inception. In order to ensure that the expenses of the Putnam funds continue to meet evolving competitive standards, the Trustees requested, and Putnam Management agreed, to implement an additional expense limitation for certain funds for the twelve months beginning January 1, 2007 equal to the average expense ratio (exclusive of 12b-1 charges) of a custom peer group of competitive funds selected by Lipper based on the size of the fund. This additional expense limitation will be applied to those open-end funds that had above-average expense ratios (exclusive of 12b-1 charges) based on the Lipper custom peer group data for the period ended December 31, 2005. This additional expense limitation will not be applied to your fund.
• Economies of scale. Your fund currently has the benefit of breakpoints in its management fee that provide shareholders with significant economies of scale, which means that the effective management fee rate of a fund (as a percentage of fund assets) declines as a fund grows in
25
size and crosses specified asset thresholds. Conversely, as a fund shrinks in size — as has been the case for many Putnam funds in recent years — these breakpoints result in increasing fee levels. In recent years, the Trustees have examined the operation of the existing breakpoint structure during periods of both growth and decline in asset levels. The Trustees concluded that the fee schedules in effect for the funds represented an appropriate sharing of economies of scale at current asset levels. In reaching this conclusion, the Trustees considered the Contract Committee’s stated intent to continue to work with Putnam Management to plan for an eventual resumption in the growth of assets, including a study of potential economies that might be produced under various growth assumptions.
In connection with their review of the management fees and total expenses of the Putnam funds, the Trustees also reviewed the costs of the services to be provided and profits to be realized by Putnam Management and its affiliates from the relationship with the funds. This information included trends in revenues, expenses and profitability of Putnam Management and its affiliates relating to the investment management and distribution services provided to the funds. In this regard, the Trustees also reviewed an analysis of Putnam Management’s revenues, expenses and profitability with respect to the funds’ management contracts, allocated on a fund-by-fund basis. Because many of the costs incurred by Putnam Management in managing the funds are not readily identifiable to particular funds, the Trustees observed that the methodology for allocating costs is an important factor in evaluating Putnam Management’s costs and profitabil ity, both as to the Putnam funds in the aggregate and as to individual funds. The Trustees reviewed Putnam Management’s cost allocation methodology with the assistance of independent consultants and concluded that this methodology was reasonable and well-considered.
Investment performance
The quality of the investment process provided by Putnam Management represented a major factor in the Trustees’ evaluation of the quality of services provided by Putnam Management under your fund’s management contract. The Trustees were assisted in their review of the Putnam funds’ investment process and performance by the work of the Investment Process Committee of the Trustees and the Investment Oversight Committees of the Trustees, which meet on a regular monthly basis with the funds’ portfolio teams throughout the year. The Trustees concluded that Putnam Management generally provides a high-quality investment process — as measured by the experience and skills of the individuals assigned to the management of fund portfolios, the resources made available to such personnel, and in general the ability of Putnam Management to attract and retain high-quality personnel — but also recognize that this does not gu arantee favorable investment results for every fund in every time period. The Trustees considered the investment performance of each fund over multiple time periods and considered information comparing each fund’s performance with various benchmarks and with the performance of competitive funds.
26
The Trustees noted the satisfactory investment performance of many Putnam funds. They also noted the disappointing investment performance of certain funds in recent years and discussed with senior management of Putnam Management the factors contributing to such underperformance and actions being taken to improve performance. The Trustees recognized that, in recent years, Putnam Management has made significant changes in its investment personnel and processes and in the fund product line to address areas of underperformance. In particular, they noted the important contributions of Putnam Management’s leadership in attracting, retaining and supporting high-quality investment professionals and in systematically implementing an investment process that seeks to merge the best features of fundamental and quantitative analysis. The Trustees indicated their intention to continue to monitor performance trends to assess the effectiveness of t hese changes and to evaluate whether additional changes to address areas of underperformance are warranted.
In the case of your fund, the Trustees considered that your fund’s class A share cumulative total return performance at net asset value was in the following percentiles of its Lipper Inc. peer group (Lipper Large-Cap Growth Funds) for the one-, three- and five-year periods ended March 31, 2006 (the first percentile being the best performing funds and the 100th percentile being the worst performing funds):
| One-year period | Three-year period | Five-year period |
|
| 64th | 78th | 69th |
(Because of the passage of time, these performance results may differ from the performance results for more recent periods shown elsewhere in this report. Over the one-, three- and five-year periods ended March 31, 2006, there were 694, 593, and 479 funds, respectively, in your fund’s Lipper peer group.* Past performance is no guarantee of future performance.)
The Trustees noted the disappointing performance for your fund for the three-year period ended March 31, 2006. In this regard, the Trustees considered that Putnam Management had made changes to the fund’s investment team that it believed would strengthen the investment process by focusing on a blend of quantitative techniques and fundamental analysis.
As a general matter, the Trustees concluded that cooperative efforts between the Trustees and Putnam Management represent the most effective way to address investment performance problems. The Trustees noted that investors in the Putnam funds have, in effect, placed their trust in the Putnam organization, under the oversight of the funds’ Trustees, to make appropriate decisions regarding the management of the funds. Based on the responsiveness of Putnam Management in the recent past to Trustee concerns about investment performance, the Trustees concluded that it is preferable to seek change within Putnam Management to
* The percentile rankings for your fund’s class A share annualized total return performance in the Lipper Large-Cap Growth Funds category for the one-, five- and ten-year periods ended December 31, 2006, were 58%, 63%, and 57%,, respectively. Over the one-, five- and ten-year periods ended December 31, 2006, the fund ranked 418 out of 723, 316 out of 505, and 106 out of 186 funds, respectively. Note that this more recent information was not available when the Trustees approved the continuance of your fund’s management contract.
27
address performance shortcomings. In the Trustees’ view, the alternative of terminating a management contract and engaging a new investment adviser for an underperforming fund would entail significant disruptions and would not provide any greater assurance of improved investment performance.
Brokerage and soft-dollar allocations; other benefits
The Trustees considered various potential benefits that Putnam Management may receive in connection with the services it provides under the management contract with your fund. These include benefits related to brokerage and soft-dollar allocations, whereby a portion of the commissions paid by a fund for brokerage may be used to acquire research services that may be useful to Putnam Management in managing the assets of the fund and of other clients. The Trustees indicated their continued intent to monitor the potential benefits associated with the allocation of fund brokerage to ensure that the principle of seeking “best price and execution” remains paramount in the portfolio trading process.
The Trustees’ annual review of your fund’s management contract also included the review of its distributor’s contract and distribution plan with Putnam Retail Management Limited Partnership and the custodian agreement and investor servicing agreement with Putnam Fiduciary Trust Company, all of which provide benefits to affiliates of Putnam Management.
Comparison of retail and institutional fee schedules
The information examined by the Trustees as part of their annual contract review has included for many years information regarding fees charged by Putnam Management and its affiliates to institutional clients such as defined benefit pension plans, college endowments, etc. This information included comparison of such fees with fees charged to the funds, as well as a detailed assessment of the differences in the services provided to these two types of clients. The Trustees observed, in this regard, that the differences in fee rates between institutional clients and the funds are by no means uniform when examined by individual asset sectors, suggesting that differences in the pricing of investment management services to these types of clients reflect to a substantial degree historical competitive forces operating in separate market places. The Trustees considered the fact that fee rates across all asset sectors are higher on average for funds than for institutional clients, as well as the differences between the services that Putnam Management provides to the Putnam funds and those that it provides to institutional clients of the firm, but did not rely on such comparisons to any significant extent in concluding that the management fees paid by your fund are reasonable.
28
Other information
for shareholders
Important notice regarding delivery of shareholder documents
In accordance with SEC regulations, Putnam sends a single copy of annual and semiannual shareholder reports, prospectuses, and proxy statements to Putnam shareholders who share the same address, unless a shareholder requests otherwise. If you prefer to receive your own copy of these documents, please call Putnam at 1-800-225-1581, and Putnam will begin sending individual copies within 30 days.
Proxy voting
Putnam is committed to managing our mutual funds in the best interests of our shareholders. The Putnam funds’ proxy voting guidelines and procedures, as well as information regarding how your fund voted proxies relating to portfolio securities during the 12-month period ended June 30, 2006, are available on the Putnam Individual Investor Web site, www.putnam.com/individual, and on the SEC’s Web site, www.sec.gov. If you have questions about finding forms on the SEC’s Web site, you may call the SEC at 1-800-SEC-0330. You may also obtain the Putnam funds’ proxy voting guidelines and procedures at no charge by calling Putnam’s Shareholder Services at 1-800-225-1581.
Fund portfolio holdings
The fund will file a complete schedule of its portfolio holdings with the SEC for the first and third quarters of each fiscal year on Form N-Q. Shareholders may obtain the fund’s Forms N-Q on the SEC’s Web site at www.sec.gov. In addition, the fund’s Forms N-Q may be reviewed and copied at the SEC’s Public Reference Room in Washington, D.C. You may call the SEC at 1-800-SEC-0330 for information about the SEC’s Web site or the operation of the Public Reference Room.
29
Financial statements
A guide to financial statements
These sections of the report, as well as the accompanying Notes, constitute the fund’s financial statements.
The fund’s portfolio lists all the fund’s investments and their values as of the last day of the reporting period. Holdings are organized by asset type and industry sector, country, or state to show areas of concentration and diversification.
Statement of assets and liabilities shows how the fund’s net assets and share price are determined. All investment and noninvestment assets are added together. Any unpaid expenses and other liabilities are subtracted from this total. The result is divided by the number of shares to determine the net asset value per share, which is calculated separately for each class of shares. (For funds with preferred shares, the amount subtracted from total assets includes the liquidation preference of preferred shares.)
Statement of operations shows the fund’s net investment gain or loss. This is done by first adding up all the fund’s earnings — from dividends and interest income — and subtracting its operating expenses to determine net investment income (or loss). Then, any net gain or loss the fund realized on the sales of its holdings — as well as any unrealized gains or losses over the period — is added to or subtracted from the net investment result to determine the fund’s net gain or loss for the fiscal period.
Statement of changes in net assets shows how the fund’s net assets were affected by the fund’s net investment gain or loss, by distributions to shareholders, and by changes in the number of the fund’s shares. It lists distributions and their sources (net investment income or realized capital gains) over the current reporting period and the most recent fiscal year-end. The distributions listed here may not match the sources listed in the Statement of operations because the distributions are determined on a tax basis and may be paid in a different period from the one in which they were earned. Dividend sources are estimated at the time of declaration. Actual results may vary. Any non-taxable return of capital cannot be determined until final tax calculations are completed after the end of the fund’s fiscal year.
Financial highlights provide an overview of the fund’s investment results, per-share distributions, expense ratios, net investment income ratios, and portfolio turnover in one summary table, reflecting the five most recent reporting periods. In a semiannual report, the highlight table also includes the current reporting period.
30
The fund’s portfolio 1/31/07 (Unaudited)
| COMMON STOCKS (99.3%)* | | | |
| | Shares | | Value |
|
| Advertising and Marketing Services (0.8%) | | | |
| Omnicom Group, Inc. | 591,600 | $ | 62,236,320 |
|
| |
| Aerospace and Defense (5.3%) | | | |
| Boeing Co. (The) | 1,421,600 | | 127,318,496 |
| General Dynamics Corp. | 1,484,500 | | 116,013,675 |
| L-3 Communications Holdings, Inc. | 524,700 | | 43,203,798 |
| United Technologies Corp. | 2,123,500 | | 144,440,470 |
| | | | 430,976,439 |
|
| |
| Airlines (0.9%) | | | |
| JetBlue Airways Corp. † | 3,016,000 | | 41,258,880 |
| Southwest Airlines Co. (S) | 2,205,000 | | 33,295,500 |
| | | | 74,554,380 |
|
| |
| Automotive (1.1%) | | | |
| Harley-Davidson, Inc. (S) | 1,297,899 | | 88,607,565 |
|
| |
| Banking (2.2%) | | | |
| Commerce Bancorp, Inc. | 3,588,800 | | 121,229,664 |
| Wells Fargo & Co. (S) | 1,636,400 | | 58,779,488 |
| | | | 180,009,152 |
|
| |
| Biotechnology (2.9%) | | | |
| Amgen, Inc. † | 1,862,600 | | 131,071,162 |
| Genentech, Inc. † | 1,188,100 | | 103,804,297 |
| | | | 234,875,459 |
|
| |
| Broadcasting (0.4%) | | | |
| Grupo Televisa SA de CV ADR (Mexico) | 1,141,800 | | 33,637,428 |
|
| |
| Building Materials (0.7%) | | | |
| Sherwin-Williams Co. (The) | 788,900 | | 54,512,990 |
|
| |
| Commercial and Consumer Services (2.3%) | | | |
| Corporate Executive Board Co. (The) (S) | 265,800 | | 24,116,034 |
| Dun & Bradstreet Corp. (The) (S) † | 498,011 | | 42,330,935 |
| Equifax, Inc. | 1,043,900 | | 43,353,167 |
| Paychex, Inc. | 2,034,600 | | 81,404,346 |
| | | | 191,204,482 |
|
| |
| Communications Equipment (5.6%) | | | |
| Cisco Systems, Inc. † | 11,593,800 | | 308,279,142 |
| Qualcomm, Inc. # | 3,969,800 | | 149,502,668 |
| | | | 457,781,810 |
31
| COMMON STOCKS (99.3%)* continued | | | |
| | Shares | | Value |
|
| Computers (5.5%) | | | |
| Apple Computer, Inc. † # | 1,916,500 | $ | 164,301,545 |
| Dell, Inc. † | 5,420,300 | | 131,442,275 |
| EMC Corp. † | 7,271,900 | | 101,733,881 |
| Network Appliance, Inc. † | 1,329,400 | | 49,985,440 |
| | | | 447,463,141 |
|
| |
| Conglomerates (1.4%) | | | |
| Danaher Corp. (S) | 1,581,700 | | 117,140,702 |
|
| |
| Consumer Finance (3.5%) | | | |
| Capital One Financial Corp. | 2,050,800 | | 164,884,318 |
| Countrywide Financial Corp. | 2,803,800 | | 121,909,224 |
| | | | 286,793,542 |
|
| |
| Consumer Goods (2.0%) | | | |
| Colgate-Palmolive Co. | 1,116,100 | | 76,229,630 |
| Procter & Gamble Co. (The) | 1,352,200 | | 87,717,214 |
| | | | 163,946,844 |
|
| |
| Consumer Services (0.6%) | | | |
| Liberty Media Holding Corp. — Interactive Class A † | 2,133,300 | | 51,988,521 |
|
| |
| Electronics (1.0%) | | | |
| Amphenol Corp. Class A | 448,700 | | 30,385,964 |
| Microchip Technology, Inc. (S) | 1,584,700 | | 55,084,172 |
| | | | 85,470,136 |
|
| |
| Financial (3.6%) | | | |
| American Express Co. | 1,860,700 | | 108,329,954 |
| Chicago Mercantile Exchange Holdings, Inc. (The) (S) | 106,800 | | 60,160,440 |
| Moody’s Corp. | 854,800 | | 61,169,488 |
| SLM Corp. | 1,350,800 | | 62,082,768 |
| | | | 291,742,650 |
|
| |
| Health Care Services (6.6%) | | | |
| Caremark Rx, Inc. | 1,158,800 | | 70,988,088 |
| Medco Health Solutions, Inc. † | 1,331,100 | | 78,814,431 |
| UnitedHealth Group, Inc. | 4,250,200 | | 222,115,452 |
| WellPoint, Inc. † | 2,129,700 | | 166,925,886 |
| | | | 538,843,857 |
|
| |
| Homebuilding (0.6%) | | | |
| NVR, Inc. † (S) | 65,157 | | 45,122,526 |
|
| |
| Insurance (2.7%) | | | |
| American International Group, Inc. | 1,970,400 | | 134,873,880 |
| Berkshire Hathaway, Inc. Class B † | 22,191 | | 81,382,164 |
| | | | 216,256,044 |
32
| COMMON STOCKS (99.3%)* continued | | | |
| | Shares | | Value |
|
| Investment Banking/Brokerage (6.9%) | | | |
| Bear Stearns Cos., Inc. (The) | 1,013,200 | $ | 167,026,020 |
| BlackRock, Inc. (S) | 358,900 | | 60,209,064 |
| Franklin Resources, Inc. | 154,994 | | 18,461,335 |
| Goldman Sachs Group, Inc. (The) | 1,006,400 | | 213,517,824 |
| Morgan Stanley | 554,199 | | 45,882,135 |
| T. Rowe Price Group, Inc. | 1,115,200 | | 53,518,448 |
| | | | 558,614,826 |
|
| |
| Lodging/Tourism (1.7%) | | | |
| Las Vegas Sands Corp. † | 651,700 | | 67,822,419 |
| Royal Caribbean Cruises, Ltd. | 1,069,300 | | 48,043,649 |
| Wyndham Worldwide Corp. † | 808,563 | | 25,227,166 |
| | | | 141,093,234 |
|
| |
| Machinery (0.9%) | | | |
| Parker-Hannifin Corp. | 843,300 | | 69,791,508 |
|
| |
| Medical Technology (3.6%) | | | |
| Becton, Dickinson and Co. | 809,700 | | 62,298,318 |
| Medtronic, Inc. | 2,447,900 | | 130,840,255 |
| Nobel Biocare Holding AG (Switzerland) | 121,774 | | 40,523,406 |
| St. Jude Medical, Inc. † | 1,304,800 | | 55,793,248 |
| | | | 289,455,227 |
|
| |
| Oil & Gas (2.6%) | | | |
| Devon Energy Corp. | 955,800 | | 66,992,022 |
| EOG Resources, Inc. | 1,139,700 | | 78,787,461 |
| Valero Energy Corp. | 1,235,500 | | 67,062,940 |
| | | | 212,842,423 |
|
| |
| Pharmaceuticals (3.9%) | | | |
| Barr Pharmaceuticals, Inc. † | 780,400 | | 41,767,008 |
| Johnson & Johnson | 3,516,100 | | 234,875,480 |
| Teva Pharmaceutical Industries, Ltd. ADR (Israel) (S) | 1,232,800 | | 43,271,280 |
| | | | 319,913,768 |
|
| |
| Publishing (2.0%) | | | |
| McGraw-Hill Cos., Inc. (The) | 2,410,300 | | 161,682,924 |
|
| |
| Real Estate (1.1%) | | | |
| CB Richard Ellis Group, Inc. Class A † | 2,455,700 | | 92,358,877 |
|
| |
| Restaurants (1.9%) | | | |
| Starbucks Corp. † | 1,924,400 | | 67,238,536 |
| Yum! Brands, Inc. | 1,393,200 | | 83,605,932 |
| | | | 150,844,468 |
|
| |
| Retail (11.2%) | | | |
| Abercrombie & Fitch Co. Class A (S) | 613,800 | | 48,821,652 |
| Bed Bath & Beyond, Inc. † | 1,632,100 | | 68,858,299 |
33
| COMMON STOCKS (99.3%)* continued | | | | |
| | | Shares | | Value |
|
| Retail continued | | | | |
| Best Buy Co., Inc. | | 1,814,700 | $ | 91,460,880 |
| CVS Corp. (S) | | 1,252,400 | | 42,143,260 |
| Home Depot, Inc. (The) | | 3,840,200 | | 156,449,748 |
| Kohl’s Corp. † | | 915,300 | | 64,903,923 |
| Lowe’s Cos., Inc. (S) | | 5,530,000 | | 186,416,300 |
| Ross Stores, Inc. | | 1,997,300 | | 64,692,547 |
| Staples, Inc. | | 7,195,800 | | 185,075,976 |
| | | | | 908,822,585 |
|
| |
| Semiconductor (1.1%) | | | | |
| Applied Materials, Inc. | | 5,182,300 | | 91,882,179 |
|
| |
| Software (6.2%) | | | | |
| Adobe Systems, Inc. † | | 2,650,100 | | 103,009,387 |
| Autodesk, Inc. † | | 2,114,100 | | 92,428,452 |
| Microsoft Corp. (S) | | 4,260,300 | | 131,472,858 |
| Oracle Corp. † | | 10,401,900 | | 178,496,604 |
| | | | | 505,407,301 |
|
| |
| Technology Services (6.1%) | | | | |
| Accenture, Ltd. Class A (Bermuda) | | 847,500 | | 31,993,125 |
| Automatic Data Processing, Inc. | | 1,882,200 | | 89,818,584 |
| eBay, Inc. † (S) | | 3,765,500 | | 121,964,545 |
| Google, Inc. Class A † | | 348,692 | | 174,799,300 |
| Western Union Co. (The) | | 3,379,909 | | 75,507,167 |
| | | | | 494,082,721 |
|
| |
| Textiles (0.1%) | | | | |
| Coach, Inc. † | | 202,860 | | 9,303,160 |
|
| |
| Transportation Services (0.3%) | | | | |
| Expeditors International of Washington, Inc. (S) | | 579,940 | | 24,757,639 |
|
| |
| Total common stocks (cost $7,209,384,661) | | | $ | 8,084,016,828 |
|
| |
| |
| SHORT-TERM INVESTMENTS (6.2%)* | | | | |
| | | Principal amount/shares | | Value |
|
| Interest in $551,000,000 joint tri-party repurchase | | | | |
| agreement dated January 31, 2007 with Bank | | | | |
| of America Securities, LLC due February 1, 2007 | | | | |
| with respect to various U.S. Government obligations | | | | |
| — maturity value of $111,816,366 for an effective | | | | |
| yield of 5.27% (collateralized by Fannie Mae | | | | |
| securities with a coupon rate of 5.00% and due | | | | |
| date of May 1, 2035 valued at $562,020,001) | $ | 111,800,000 | $ | 111,800,000 |
34
| SHORT-TERM INVESTMENTS (6.2%)* continued | | | | |
| | | Principal amount/shares | | Value |
|
| Short-term investments held as collateral for loaned | | | | |
| securities with yields ranging from 5.27% to 5.46% | | | | |
| and due dates ranging from February 1, 2007 | | | | |
| to March 23, 2007 (d) | $ | 389,970,846 | | 389,335,552 |
| Putnam Prime Money Market Fund (e) | | 6,505,138 | | 6,505,138 |
|
| Total short-term investments (cost $507,640,690) | | | $ | 507,640,690 |
|
| |
| TOTAL INVESTMENTS | | | | |
|
| Total investments (cost $7,717,025,351) | | | $ | 8,591,657,518 |
* Percentages indicated are based on net assets of $8,138,268,510.
† Non-income-producing security.
# A portion of these securities were pledged and segregated with the custodian to cover margin requirements for futures contracts at January 31, 2007.
(d) See Note 1 to the financial statements.
(e) See Note 5 to the financial statements regarding investments in Putnam Prime Money Market Fund.
(S) Securities on loan, in part or in entirety, at January 31, 2007.
At January 31, 2007, liquid assets totaling $49,162,650 have been designated as collateral for open futures contracts.
ADR after the name of a foreign holding stands for American Depository Receipts, representing ownership of foreign securities on deposit with a custodian bank.
| FUTURES CONTRACTS OUTSTANDING at 1/31/07 (Unaudited) | | | |
|
| | Number of | | | Expiration | Unrealized |
| | contracts | Value | | date | appreciation |
|
| NASDAQ 100 Index E-Mini (Long) | 303 | $10,923,150 | | Mar-07 | $ 97,496 |
| S&P 500 Index (Long) | 106 | 38,239,500 | | Mar-07 | 443,811 |
|
| Total | | | | | $541,307 |
The accompanying notes are an integral part of these financial statements.
35
Statement of assets and liabilities 1/31/07 (Unaudited)
| ASSETS | | |
|
| Investment in securities, at value, including $379,670,170 | | |
| of securities on loan (Note 1): | | |
| Unaffiliated issuers (identified cost $7,710,520,213) | $ | 8,585,152,380 |
| Affiliated issuers (identified cost $6,505,138) (Note 5) | | 6,505,138 |
|
| Cash | | 46,577 |
|
| Dividends, interest and other receivables | | 4,727,970 |
|
| Receivable for shares of the fund sold | | 3,904,742 |
|
| Receivable for securities sold | | 77,881,097 |
|
| Receivable for variation margin (Note 1) | | 633,389 |
|
| Total assets | | 8,678,851,293 |
|
| |
| LIABILITIES | | |
|
| Payable to subcustodian (Note 2) | | 2,498,766 |
|
| Payable for securities purchased | | 64,508,768 |
|
| Payable for shares of the fund repurchased | | 66,959,821 |
|
| Payable for compensation of Manager (Notes 2 and 5) | | 10,915,177 |
|
| Payable for investor servicing and custodian fees (Note 2) | | 2,140,487 |
|
| Payable for Trustee compensation and expenses (Note 2) | | 1,165,686 |
|
| Payable for administrative services (Note 2) | | 14,754 |
|
| Payable for distribution fees (Note 2) | | 2,119,646 |
|
| Collateral on securities loaned, at value (Note 1) | | 389,335,552 |
|
| Other accrued expenses | | 924,126 |
|
| Total liabilities | | 540,582,783 |
|
| Net assets | $ | 8,138,268,510 |
|
| |
| REPRESENTED BY | | |
|
| Paid-in capital (Unlimited shares authorized) (Notes 1 and 4) | $ | 10,072,041,339 |
|
| Accumulated net investment loss (Note 1) | | (17,406,871) |
|
| Accumulated net realized loss on investments (Note 1) | | (2,791,539,181) |
|
| Net unrealized appreciation of investments | | |
| and assets and liabilities in foreign currencies | | 875,173,223 |
|
| Total — Representing net assets applicable to capital shares outstanding | $ | 8,138,268,510 |
(Continued on next page)
36
Statement of assets and liabilities (Continued)
| COMPUTATION OF NET ASSET VALUE AND OFFERING PRICE | |
|
| Net asset value and redemption price per class A share | |
| ($5,546,159,565 divided by 295,321,667 shares) | $18.78 |
|
| Offering price per class A share | |
| (100/94.75 of $18.78)* | $19.82 |
|
| Net asset value and offering price per class B share | |
| ($969,687,220 divided by 59,501,243 shares)** | $16.30 |
|
| Net asset value and offering price per class C share | |
| ($70,050,849 divided by 3,914,565 shares)** | $17.89 |
|
| Net asset value and redemption price per class M share | |
| ($58,059,004 divided by 3,298,856 shares) | $17.60 |
|
| Offering price per class M share | |
| (100/96.75 of $17.60)* | $18.19 |
|
| Net asset value, offering price and redemption price per class R share | |
| ($2,096,599 divided by 112,582 shares) | $18.62 |
|
| Net asset value, offering price and redemption price per class Y share | |
| ($1,492,215,273 divided by 76,802,333 shares) | $19.43 |
* On single retail sales of less than $50,000. On sales of $50,000 or more the offering price is reduced.
** Redemption price per share is equal to net asset value less any applicable contingent deferred sales charge.
The accompanying notes are an integral part of these financial statements.
37
Statement of operations Six months ended 1/31/07 (Unaudited)
| INVESTMENT INCOME | | |
|
| Dividends (net of foreign tax of $33,021) | $ | 29,002,599 |
|
| Interest (including interest income of $357,020 | | |
| from investments in affiliated issuers) (Note 5) | | 743,169 |
|
| Securities lending | | 833,445 |
|
| Total investment income | | 30,579,213 |
|
| |
| EXPENSES | | |
|
| Compensation of Manager (Note 2) | | 21,837,500 |
|
| Investor servicing fees (Note 2) | | 13,384,401 |
|
| Custodian fees (Note 2) | | 182,617 |
|
| Trustee compensation and expenses (Note 2) | | 116,535 |
|
| Administrative services (Note 2) | | 44,471 |
|
| Distribution fees — Class A (Note 2) | | 7,077,626 |
|
| Distribution fees — Class B (Note 2) | | 5,230,958 |
|
| Distribution fees — Class C (Note 2) | | 360,744 |
|
| Distribution fees — Class M (Note 2) | | 226,098 |
|
| Distribution fees — Class R (Note 2) | | 4,953 |
|
| Other | | 1,051,427 |
|
| Non-recurring costs (Notes 2 and 6) | | 23,432 |
|
| Costs assumed by Manager (Notes 2 and 6) | | (23,432) |
|
| Fees waived and reimbursed by Manager (Note 5) | | (6,432) |
|
| Total expenses | | 49,510,898 |
|
| Expense reduction (Note 2) | | (1,446,742) |
|
| Net expenses | | 48,064,156 |
|
| Net investment loss | | (17,484,943) |
|
| Net realized gain on investments (Notes 1 and 3) | | 265,725,305 |
|
| Net realized gain on futures contracts (Note 1) | | 3,171,596 |
|
| Net increase from payments by affiliates (Note 2) | | 722,400 |
|
| Net unrealized depreciation of assets and liabilities | | |
| in foreign currencies during the period | | (164) |
|
| Net unrealized appreciation of investments | | |
| and futures contracts during the period | | 987,139,293 |
|
| Net gain on investments | | 1,256,758,430 |
|
| Net increase in net assets resulting from operations | $ | 1,239,273,487 |
The accompanying notes are an integral part of these financial statements.
38
Statement of changes in net assets
| DECREASE IN NET ASSETS | | | | |
| | | Six months ended | | Year ended |
| | | 1/31/07* | | 7/31/06 |
|
| Operations: | | | | |
| Net investment loss | $ | (17,484,943) | $ | (30,961,999) |
|
| Net realized gain on investments and assets and liabilities | | | | |
| in foreign currency transactions | | 269,619,301 | | 681,275,432 |
|
| Net unrealized appreciation (depreciation) of investments | | | | |
| and assets and liabilities in foreign currencies | | 987,139,129 | | (1,064,139,625) |
|
| Net increase (decrease) in net assets resulting | | | | |
| from operations | | 1,239,273,487 | | (413,826,192) |
|
| Distributions to shareholders: (Note 1) | | | | |
|
| From ordinary income | | | | |
|
| Net investment income | | | | |
|
| Class A | | — | | (49,154,144) |
|
| Class M | | — | | (143,049) |
|
| Class R | | — | | (5,224) |
|
| Class Y | | — | | (18,061,382) |
|
| Redemption fees (Note 1) | | 5,606 | | 14,764 |
|
| Decrease from capital share transactions (Note 4) | | (1,433,328,717) | | (2,683,955,999) |
|
| Total decrease in net assets | | (194,049,624) | | (3,165,131,226) |
|
| |
| NET ASSETS | | | | |
|
| Beginning of period | | 8,332,318,134 | | 11,497,449,360 |
|
| End of period (including accumulated net investment | | | | |
| loss of $17,406,871 and undistributed net investment | | | | |
| income of $78,072, respectively) | $ | 8,138,268,510 | $ | 8,332,318,134 |
* Unaudited
The accompanying notes are an integral part of these financial statements.
39
Financial highlights (For a common share outstanding throughout the period)
| INVESTMENT OPERATIONS: | | | | LESS DISTRIBUTIONS: | | | | | | RATIOS AND SUPPLEMENTAL DATA: | |
|
| | | | Net | | | | | | | | Total | | | Ratio of net | |
| | Net asset | | realized and | Total | From | From | From | | | Net asset | return | Net | Ratio of | investment | |
| | value, | Net | unrealized | from | net | net realized | return | | | value, | at net | assets, | expenses to | income (loss) | Portfolio |
| | beginning | investment | gain (loss) on | investment | investment | gain on | of | Total | Redemption | end | asset | end of period | average net | to average | turnover |
| Period ended | of period | income (loss)(a) | investments | operations | income | investments | capital | distributions | fees | of period | value (%)(b) | (in thousands) | assets (%)(c) | net assets (%) | (%) |
|
| CLASS A | | | | | | | | | | | | | | | |
| January 31, 2007** | $16.20 | (.03)(d) | 2.61 | 2.58 | — | — | — | — | —(e) | $18.78 | 15.93* | $5,546,160 | .56*(d) | (.18)*(d) | 32.29* |
| July 31, 2006 | 17.16 | (.04)(d,h) | (.79) | (.83) | (.13) | — | — | (.13) | —(e) | 16.20 | (4.93)(h) | 5,528,893 | 1.04(d,h) | (.23)(d,h) | 75.88 |
| July 31, 2005 | 15.13 | .09(d,f,g) | 1.94 | 2.03 | — | — | — | — | —(e) | 17.16 | 13.42(g) | 7,410,811 | 1.08(d) | .55(d,f,g) | 93.29 |
| July 31, 2004 | 14.45 | (.01)(d) | .69 | .68 | — | — | — | — | —(e) | 15.13 | 4.71 | 8,710,655 | 1.04(d) | (.04)(d) | 45.73 |
| July 31, 2003 | 13.42 | .01 | 1.02 | 1.03 | —(e) | — | —(e) | —(e) | — | 14.45 | 7.68 | 11,909,405 | 1.02 | .10 | 62.09 |
| July 31, 2002 | 19.53 | .03 | (5.35) | (5.32) | (.04) | (.75) | — | (.79) | — | 13.42 | (28.24) | 11,811,007 | .96 | .21 | 91.27 |
|
| |
| CLASS B | | | | | | | | | | | | | | | |
| January 31, 2007** | $14.12 | (.09)(d) | 2.27 | 2.18 | — | — | — | — | —(e) | $16.30 | 15.44* | $969,687 | .94*(d) | (.56)*(d) | 32.29* |
| July 31, 2006 | 14.95 | (.15)(d,h) | (.68) | (.83) | — | — | — | — | —(e) | 14.12 | (5.55)(h) | 1,089,121 | 1.79(d,h) | (.98)(d,h) | 75.88 |
| July 31, 2005 | 13.28 | (.03)(d,f,g) | 1.70 | 1.67 | — | — | — | — | —(e) | 14.95 | 12.58(g) | 1,875,616 | 1.83(d) | (.19)(d,f,g) 93.29 |
| July 31, 2004 | 12.78 | (.11)(d) | .61 | .50 | — | — | — | — | —(e) | 13.28 | 3.91 | 2,343,329 | 1.79(d) | (.80)(d) | 45.73 |
| July 31, 2003 | 11.96 | (.08) | .90 | .82 | — | — | — | — | — | 12.78 | 6.86 | 2,815,586 | 1.77 | (.65) | 62.09 |
| July 31, 2002 | 17.59 | (.08) | (4.80) | (4.88) | — | (.75) | — | (.75) | — | 11.96 | (28.82) | 3,406,811 | 1.71 | (.53) | 91.27 |
|
| |
| CLASS C | | | | | | | | | | | | | | | |
| January 31, 2007** | $15.50 | (.09)(d) | 2.48 | 2.39 | — | — | — | — | —(e) | $17.89 | 15.42* | $70,051 | .94*(d) | (.56)*(d) | 32.29* |
| July 31, 2006 | 16.42 | (.16)(d,h) | (.76) | (.92) | — | — | — | — | —(e) | 15.50 | (5.60)(h) | 72,213 | 1.79(d,h) | (.98)(d,h) | 75.88 |
| July 31, 2005 | 14.58 | (.03)(d,f,g) | 1.87 | 1.84 | — | — | — | — | —(e) | 16.42 | 12.62(g) | 96,509 | 1.83(d) | (.20)(d,f,g) 93.29 |
| July 31, 2004 | 14.03 | (.12)(d) | .67 | .55 | — | — | — | — | —(e) | 14.58 | 3.92 | 116,854 | 1.79(d) | (.79)(d) | 45.73 |
| July 31, 2003 | 13.13 | (.08) | .98 | .90 | — | — | — | — | — | 14.03 | 6.85 | 157,925 | 1.77 | (.65) | 62.09 |
| July 31, 2002 | 19.23 | (.09) | (5.26) | (5.35) | — | (.75) | — | (.75) | — | 13.13 | (28.81) | 156,830 | 1.71 | (.54) | 91.27 |
|
| |
| CLASS M | | | | | | | | | | | | | | | |
| January 31, 2007** | $15.22 | (.07)(d) | 2.45 | 2.38 | — | — | — | — | —(e) | $17.60 | 15.64* | $58,059 | .81*(d) | (.43)*(d) | 32.29* |
| July 31, 2006 | 16.12 | (.12)(d,h) | (.75) | (.87) | (.03) | — | — | (.03) | —(e) | 15.22 | (5.42)(h) | 60,394 | 1.54(d,h) | (.73)(d,h) | 75.88 |
| July 31, 2005 | 14.28 | .01(d,f,g) | 1.83 | 1.84 | — | — | — | — | —(e) | 16.12 | 12.89(g) | 95,640 | 1.58(d) | .07(d,f,g) | 93.29 |
| July 31, 2004 | 13.70 | (.08)(d) | .66 | .58 | — | — | — | — | —(e) | 14.28 | 4.23 | 125,904 | 1.54(d) | (.54)(d) | 45.73 |
| July 31, 2003 | 12.79 | (.05) | .96 | .91 | — | — | — | — | — | 13.70 | 7.12 | 307,046 | 1.52 | (.40) | 62.09 |
| July 31, 2002 | 18.71 | (.05) | (5.12) | (5.17) | — | (.75) | — | (.75) | — | 12.79 | (28.64) | 317,614 | 1.46 | (.29) | 91.27 |
|
| |
| CLASS R | | | | | | | | | | | | | | | |
| January 31, 2007** | $16.09 | (.05)(d) | 2.58 | 2.53 | — | — | — | — | —(e) | $18.62 | 15.72* | $2,097 | .69*(d) | (.31)*(d) | 32.29* |
| July 31, 2006 | 17.06 | (.09)(d,h) | (.77) | (.86) | (.11) | — | — | (.11) | —(e) | 16.09 | (5.12)(h) | 1,740 | 1.29(d,h) | (.50)(d,h) | 75.88 |
| July 31, 2005 | 15.08 | .02(d,f,g) | 1.96 | 1.98 | — | — | — | — | —(e) | 17.06 | 13.13(g) | 734 | 1.33(d) | .14(d,f,g) | 93.29 |
| July 31, 2004 | 14.44 | (.05)(d) | .69 | .64 | — | — | — | — | —(e) | 15.08 | 4.43 | 253 | 1.29(d) | (.34)(d) | 45.73 |
| July 31, 2003† | 12.98 | (.01) | 1.47 | 1.46 | — | — | — | — | — | 14.44 | 11.25* | 13 | .67* | (.08)* | 62.09 |
|
| |
| CLASS Y | | | | | | | | | | | | | | | |
| January 31, 2007** | $16.74 | (.01)(d) | 2.70 | 2.69 | — | — | — | — | —(e) | $19.43 | 16.07* | $1,492,215 | .44*(d) | (.05)*(d) | 32.29* |
| July 31, 2006 | 17.73 | —(d,e,h) | (.82) | (.82) | (.17) | — | — | (.17) | —(e) | 16.74 | (4.69)(h) | 1,579,957 | .79(d,h) | .02(d,h) | 75.88 |
| July 31, 2005 | 15.59 | .13(d,f,g) | 2.01 | 2.14 | — | — | — | — | —(e) | 17.73 | 13.73(g) | 2,018,139 | .83(d) | .80(d,f,g) | 93.29 |
| July 31, 2004 | 14.85 | .03(d) | .71 | .74 | — | — | — | — | —(e) | 15.59 | 4.98 | 2,807,926 | .79(d) | .20(d) | 45.73 |
| July 31, 2003 | 13.80 | .05 | 1.04 | 1.09 | (.02) | — | (.02) | (.04) | — | 14.85 | 7.92 | 2,945,482 | .77 | .34 | 62.09 |
| July 31, 2002 | 20.07 | .08 | (5.51) | (5.43) | (.09) | (.75) | — | (.84) | — | 13.80 | (28.08) | 2,568,208 | .71 | .45 | 91.27 |
|
See notes to financial highlights at the end of this section.
The accompanying notes are an integral part of these financial statements.
Financial highlights (Continued)
* Not annualized.
** Unaudited.
† For the period January 21, 2003 (commencement of operations) to July 31, 2003.
(a) Per share net investment income (loss) has been determined on the basis of the weighted average number of shares outstanding during the period.
(b) Total return assumes dividend reinvestment and does not reflect the effect of sales charges.
(c) Includes amounts paid through expense offset and brokerage service arrangements (Note 2).
(d) Reflects waivers of certain fund expenses in connection with investments in Putnam Prime Money Market Fund during the period. As a result of such limitation and waivers, the expenses of each class, as a percentage of its average net assets, reflect a reduction of the following amounts (Notes 2 and 5):
| | 1/31/07 | 7/31/06 | 7/31/05 | 7/31/04 |
|
| Class A | <0.01% | <0.01% | <0.01% | <0.01% |
|
| Class B | <0.01 | <0.01 | <0.01 | <0.01 |
|
| Class C | <0.01 | <0.01 | <0.01 | <0.01 |
|
| Class M | <0.01 | <0.01 | <0.01 | <0.01 |
|
| Class R | <0.01 | <0.01 | <0.01 | <0.01 |
|
| Class Y | <0.01 | <0.01 | <0.01 | <0.01 |
|
(e) Amount represents less than $0.01 per share.
(f) Reflects a special dividend received by the fund which amounted to the following amounts:
| | | Percentage |
| | | of average |
| | Per share | net assets |
|
| Class A | $0.08 | 0.51% |
|
| Class B | 0.07 | 0.52 |
|
| Class C | 0.08 | 0.52 |
|
| Class M | 0.08 | 0.53 |
|
| Class R | 0.06 | 0.37 |
|
| Class Y | 0.08 | 0.52 |
|
(g) Reflects a non-recurring accrual related to Putnam Management’s settlement with the SEC regarding brokerage allocation practices, which amounted to the following amounts:
| | | Percentage |
| | | of average |
| | Per share | net assets |
|
| Class A | $0.01 | 0.08% |
|
| Class B | 0.01 | 0.08 |
|
| Class C | 0.01 | 0.08 |
|
| Class M | 0.01 | 0.07 |
|
| Class R | 0.02 | 0.10 |
|
| Class Y | 0.01 | 0.07 |
|
(h) Reflects a non-recurring reimbursement from Putnam Investments relating to the calculation of certain amounts paid by the fund to Putnam in previous years for transfer agent services, which amounted to $0.01 per share and 0.06% of average net assets for the period ended July 31, 2006 (Note 6).
The accompanying notes are an integral part of these financial statements.
42
Notes to financial statements 1/31/07 (Unaudited)
Note 1: Significant accounting policies
Putnam Voyager Fund (the “fund”), a Massachusetts business trust, is registered under the Investment Company Act of 1940, as amended, as a diversified, open-end management investment company. The fund invests mainly in common stocks of U.S. companies, with a focus on growth stocks.
The fund offers class A, class B, class C, class M, class R and class Y shares. Class A and class M shares are sold with a maximum front-end sales charge of 5.25% and 3.25%, respectively, and generally do not pay a contingent deferred sales charge. Class B shares, which convert to class A shares after approximately eight years, do not pay a front-end sales charge and are subject to a contingent deferred sales charge, if those shares are redeemed within six years of purchase. Class C shares have a one-year 1.00% contingent deferred sales charge and do not convert to class A shares. Class R shares, which are offered to qualified employee-benefit plans, are sold without a front-end sales charge or a contingent deferred sales charge. The expenses for class A, class B, class C, class M and class R shares may differ based on the distribution fee of each class, which is identified in Note 2. Class Y shares, which are sold at net asset value, ar e generally subject to the same expenses as class A, class B, class C, class M and class R shares, but do not bear a distribution fee. Class Y shares are sold to certain eligible purchasers including certain defined contribution plans (including corporate IRAs), bank trust departments, trust companies, other Putnam funds and products, and certain college savings plans.
Effective October 2, 2006, a 1.00% redemption fee may apply on any shares purchased on or after such date that are redeemed (either by selling or exchanging into another fund) within 7 days of purchase. The redemption fee is accounted for as an addition to paid-in-capital. Prior to October 2, 2006, a 2.00% redemption fee applied to any shares that were redeemed (either by selling or exchanging into another fund) within 5 days of purchase.
Investment income, realized and unrealized gains and losses and expenses of the fund are borne pro-rata based on the relative net assets of each class to the total net assets of the fund, except that each class bears expenses unique to that class (including the distribution fees applicable to such classes). Each class votes as a class only with respect to its own distribution plan or other matters on which a class vote is required by law or determined by the Trustees. Shares of each class would receive their pro-rata share of the net assets of the fund, if the fund were liquidated. In addition, the Trustees declare separate dividends on each class of shares.
In the normal course of business, the fund enters into contracts that may include agreements to indemnify another party under given circumstances. The fund’s maximum exposure under these arrangements is unknown as this would involve future claims that may be, but have not yet been, made against the fund. However, the fund expects the risk of material loss to be remote.
The following is a summary of significant accounting policies consistently followed by the fund in the preparation of its financial statements. The preparation of financial statements is in conformity with accounting principles generally accepted in the United States of America and requires management to make estimates and assumptions that affect the reported amounts of assets and liabilities in the financial statements and the reported amounts of increases and decreases in net assets from operations during the reporting period. Actual results could differ from those estimates.
A) Security valuation Investments for which market quotations are readily available are valued at the last reported sales price on their principal exchange, or official closing price for certain markets. If no sales are reported — as in the case of some securities traded over-the-counter — a security is valued at its last reported bid price. Many securities markets and exchanges outside the U.S. close prior to the close of the New York Stock Exchange and therefore the closing prices for securities in such markets or on such
43
exchanges may not fully reflect events that occur after such close but before the close of the New York Stock Exchange. Accordingly, on certain days, the fund will fair value foreign equity securities taking into account multiple factors, including movements in the U.S. securities markets. The number of days on which fair value prices will be used will depend on market activity and it is possible that fair value prices will be used by the fund to a significant extent. At January 31, 2007, fair value pricing was used for certain foreign securities in the portfolio. Securities quoted in foreign currencies, if any, are translated into U.S. dollars at the current exchange rate. Certain investments, including certain restricted securities, are also valued at fair value following procedures approved by the Trustees. Such valuations and procedures are reviewed periodically by the Trustees. The fair value of securities is generally determined as the amount that the fund could reasonably expect to realize from an orderly disposition of such securities over a reasonable period of time. By its nature, a fair value price is a good faith estimate of the value of a security at a given point in time and does not reflect an actual market price, which may be different by a material amount.
B) Joint trading account Pursuant to an exemptive order from the Securities and Exchange Commission, the fund may transfer uninvested cash balances, including cash collateral received under security lending arrangements, into a joint trading account along with the cash of other registered investment companies and certain other accounts managed by Putnam Investment Management, LLC (“Putnam Management”), the fund’s manager, an indirect wholly-owned subsidiary of Putnam, LLC. These balances may be invested in issues of high-grade short-term investments having maturities of up to 397 days for collateral received under security lending arrangements and up to 90 days for other cash investments.
C) Repurchase agreements The fund, or any joint trading account, through its custodian, receives delivery of the underlying securities, the market value of which at the time of purchase is required to be in an amount at least equal to the resale price, including accrued interest. Collateral for certain tri-party repurchase agreements is held at the counterparty’s custodian in a segregated account for the benefit of the fund and the counterparty. Putnam Management is responsible for determining that the value of these underlying securities is at all times at least equal to the resale price, including accrued interest.
D) Security transactions and related investment income Security transactions are recorded on the trade date (the date the order to buy or sell is executed). Gains or losses on securities sold are determined on the identified cost basis.
Interest income is recorded on the accrual basis. Dividend income, net of applicable withholding taxes, is recognized on the ex-dividend date except that certain dividends from foreign securities, if any, are recognized as soon as the fund is informed of the ex-dividend date. Non-cash dividends, if any, are recorded at the fair market value of the securities received. Dividends representing a return of capital or capital gains, if any, are reflected as a reduction of cost and/or as a realized gain.
E) Foreign currency translation The accounting records of the fund are maintained in U.S. dollars. The market value of foreign securities, currency holdings, and other assets and liabilities are recorded in the books and records of the fund after translation to U.S. dollars based on the exchange rates on that day. The cost of each security is determined using historical exchange rates. Income and withholding taxes are translated at prevailing exchange rates when earned or incurred. The fund does not isolate that portion of realized or unrealized gains or losses resulting from changes in the foreign exchange rate on investments from fluctuations arising from changes in the market prices of the securities. Such gains and losses are included with the net realized and unrealized gain or loss on investments. Net realized gains and losses on foreign currency transactions represen t net realized exchange gains or losses on closed forward
44
currency contracts, disposition of foreign currencies, currency gains and losses realized between the trade and settlement dates on securities transactions and the difference between the amount of investment income and foreign withholding taxes recorded on the fund’s books and the U.S. dollar equivalent amounts actually received or paid. Net unrealized appreciation and depreciation of assets and liabilities in foreign currencies arise from changes in the value of open forward currency contracts and assets and liabilities other than investments at the period end, resulting from changes in the exchange rate. Investments in foreign securities involve certain risks, including those related to economic instability, unfavorable political developments, and currency fluctuations, not present with domestic investments.
F) Futures and options contracts The fund may use futures and options contracts to hedge against changes in the values of securities the fund owns or expects to purchase, or for other investment purposes. The fund may also write options on swaps or securities it owns or in which it may invest to increase its current returns.
The potential risk to the fund is that the change in value of futures and options contracts may not correspond to the change in value of the hedged instruments. In addition, losses may arise from changes in the value of the underlying instruments, if there is an illiquid secondary market for the contracts, or if the counterparty to the contract is unable to perform. Risks may exceed amounts recognized on the statement of assets and liabilities. When the contract is closed, the fund records a realized gain or loss equal to the difference between the value of the contract at the time it was opened and the value at the time it was closed. Realized gains and losses on purchased options are included in realized gains and losses on investment securities. If a written call option is exercised, the premium originally received is recorded as an addition to sales proceeds. If a written put option is exercised, the premium originally received is re corded as a reduction to the cost of investments.
Futures contracts are valued at the quoted daily settlement prices established by the exchange on which they trade. The fund and the broker agree to exchange an amount of cash equal to the daily fluctuation in the value of the futures contract. Such receipts or payments are known as “variation margin.” Exchange traded options are valued at the last sale price or, if no sales are reported, the last bid price for purchased options and the last ask price for written options. Options traded over-the-counter are valued using prices supplied by dealers. Futures and written option contracts outstanding at period end, if any, are listed after the fund’s portfolio.
G) Security lending The fund may lend securities, through its agents, to qualified borrowers in order to earn additional income. The loans are collateralized by cash and/or securities in an amount at least equal to the market value of the securities loaned. The market value of securities loaned is determined daily and any additional required collateral is allocated to the fund on the next business day. The risk of borrower default will be borne by the fund’s agents; the fund will bear the risk of loss with respect to the investment of the cash collateral. Income from securities lending is included in investment income on the statement of operations. At January 31, 2007, the value of securities loaned amounted to $379,670,170. The fund received cash collateral of $389,335,552 which is pooled with collateral of other Putnam funds into 36 issues of high grade short-term i nvestments.
H) Federal taxes It is the policy of the fund to distribute all of its taxable income within the prescribed time and otherwise comply with the provisions of the Internal Revenue Code of 1986 (the “Code”) applicable to regulated investment companies. It is also the intention of the fund to distribute an amount sufficient to avoid imposition of any excise tax under Section 4982 of the Code, as amended. Therefore, no provision has been made for federal taxes on income, capital gains or unrealized appreciation on securities held nor for excise tax on income and capital gains.
45
At July 31, 2006, the fund had a capital loss carryover of $3,052,570,108 available to the extent allowed by the Code to offset future net capital gain, if any. This capital loss carryover will expire on July 31, 2011.
The aggregate identified cost on a tax basis is $7,725,535,652 resulting in gross unrealized appreciation and depreciation of $1,024,599,794 and $158,477,928, respectively, or net unrealized appreciation of $866,121,866.
I) Distributions to shareholders Distributions to shareholders from net investment income are recorded by the fund on the ex-dividend date. Distributions from capital gains, if any, are recorded on the ex-dividend date and paid at least annually. The amount and character of income and gains to be distributed are determined in accordance with income tax regulations, which may differ from generally accepted accounting principles. Dividend sources are estimated at the time of declaration. Actual results may vary. Any non-taxable return of capital cannot be determined until final tax calculations are completed after the end of the fund’s fiscal year. Reclassifications are made to the fund’s capital accounts to reflect income and gains available for distribution (or available capital loss carryovers) under income tax regulations.
Note 2: Management fee, administrative services and other transactions
Putnam Management is paid for management and investment advisory services quarterly based on the average net assets of the fund. Such fee is based on the following annual rates: 0.70% of the first $500 million of average net assets, 0.60% of the next $500 million, 0.55% of the next $500 million, 0.50% of the next $5 billion, 0.475% of the next $5 billion, 0.455% of the next $5 billion, 0.44% of the next $5 billion, 0.43% of the next $5 billion, 0.42% of the next $5 billion, 0.41% of the next $5 billion, 0.40% of the next $5 billion, 0.39% of the next $5 billion, 0.38% of the next $8.5 billion and 0.37% thereafter.
Putnam Management has agreed to waive fees and reimburse expenses of the fund through June 30, 2009 to the extent necessary to ensure that the fund’s expenses do not exceed the simple average of the expenses of all front-end load funds viewed by Lipper Inc. as having the same investment classification or objective as the fund. The expense reimbursement is based on a comparison of the fund’s expenses with the average annualized operating expenses of the funds in its Lipper peer group for each calendar quarter during the fund’s last fiscal year, excluding 12b-1 fees and without giving effect to any expense offset and brokerage service arrangements that may reduce fund expenses. For the period ended January 31, 2007, Putnam Management did not waive any of its management fee from the fund.
Putnam Management voluntarily reimbursed the fund $722,400 for a trading error which occurred during the period. The effect of the losses incurred and the reimbursement by Putnam Management of such losses had no effect on total return.
For the period ended January 31, 2007, Putnam Management has assumed $23,432 of legal, shareholder servicing and communication, audit and Trustee fees incurred by the fund in connection with certain legal and regulatory matters (including those described in Note 6).
The fund reimburses Putnam Management an allocated amount for the compensation and related expenses of certain officers of the fund and their staff who provide administrative services to the fund. The aggregate amount of all such reimbursements is determined annually by the Trustees.
Custodial functions for the fund’s assets were provided by Putnam Fiduciary Trust Company (“PFTC”), a subsidiary of Putnam, LLC. PFTC received fees for custody services based on the fund’s asset level, the number of its security holdings and transaction volumes. Putnam Investor Services,
46
a division of PFTC, provided investor servicing agent functions to the fund. Putnam Investor Services received fees for investor servicing based on the number of shareholder accounts in the fund and the level of defined contribution plan assets in the fund. During the period ended January 31, 2007, the fund incurred $13,558,311 for these services provided by PFTC. State Street Bank and Trust Company began providing custodial functions for the fund’s assets during the period.
Under the subcustodian contract between the subcustodian bank and PFTC, the subcustodian bank has a lien on the securities of the fund to the extent permitted by the fund’s investment restrictions to cover any advances made by the subcustodian bank for the settlement of securities purchased by the fund. At January 31, 2007, the payable to the subcustodian bank represents the amount due for cash advanced for the settlement of securities purchased.
The fund has entered into arrangements with PFTC and State Street Bank and Trust Company whereby credits realized as a result of uninvested cash balances are used to reduce a portion of the fund’s expenses. The fund also reduced expenses through brokerage service arrangements. For the six months ended January 31, 2007, the fund’s expenses were reduced by $1,446,742 under these arrangements.
Each independent Trustee of the fund receives an annual Trustee fee, of which $1,868, as a quarterly retainer, has been allocated to the fund, and an additional fee for each Trustees meeting attended. Trustees receive additional fees for attendance at certain committee meetings, industry seminars and for certain compliance-related matters. Trustees also are reimbursed for expenses they incur relating to their services as Trustees. George Putnam, III, who is not an independent Trustee, also receives the foregoing fees for his services as Trustee.
The fund has adopted a Trustee Fee Deferral Plan (the “Deferral Plan”) which allows the Trustees to defer the receipt of all or a portion of Trustees fees payable on or after July 1, 1995. The deferred fees remain invested in certain Putnam funds until distribution in accordance with the Deferral Plan.
The fund has adopted an unfunded noncontributory defined benefit pension plan (the “Pension Plan”) covering all Trustees of the fund who have served as a Trustee for at least five years and were first elected prior to 2004. Benefits under the Pension Plan are equal to 50% of the Trustee’s average annual attendance and retainer fees for the three years ended December 31, 2005. The retirement benefit is payable during a Trustee’s lifetime, beginning the year following retirement, for the number of years of service through December 31, 2006. Pension expense for the fund is included in Trustee compensation and expenses in the statement of operations. Accrued pension liability is included in Payable for Trustee compensation and expenses in the statement of assets and liabilities. The Trustees have terminated the Pension Plan with respect to any Trustee first elected after 2003.
The fund has adopted distribution plans (the “Plans”) with respect to its class A, class B, class C, class M and class R shares pursuant to Rule 12b-1 under the Investment Company Act of 1940. The purpose of the Plans is to compensate Putnam Retail Management, a wholly-owned subsidiary of Putnam, LLC and Putnam Retail Management GP, Inc., for services provided and expenses incurred in distributing shares of the fund. The Plans provide for payments by the fund to Putnam Retail Management at an annual rate of up to 0.35%, 1.00%, 1.00%, 1.00% and 1.00% of the average net assets attributable to class A, class B, class C, class M and class R shares, respectively. The Trustees have approved payment by the fund at an annual rate of 0.25%, 1.00%, 1.00%, 0.75% and 0.50% of the average net assets attributable to class A, class B, class C, class M and class R shares, respectively.
For the six months ended January 31, 2007, Putnam Retail Management, acting as underwriter, received net commissions of $71,166 and $824
47
from the sale of class A and class M shares, respectively, and received $655,254 and $2,230 in contingent deferred sales charges from redemptions of class B and class C shares, respectively. A deferred sales charge of up to 1.00% and 0.65% is assessed on certain redemptions of class A and class M shares, respectively. For the six months ended January 31, 2007, Putnam Retail Management, acting as underwriter, received $2,533 and no monies on class A and class M redemptions, respectively.
Note 3: Purchases and sales of securities
During the six months ended January 31, 2007, cost of purchases and proceeds from sales of investment securities other than short-term investments aggregated $2,679,011,356 and $4,173,884,696, respectively. There were no purchases or sales of U.S. government securities.
Note 4: Capital shares
At January 31, 2007, there was an unlimited number of shares of beneficial interest authorized. Transactions in capital shares were as follows:
| CLASS A | Shares | | Amount |
|
| Six months ended 1/31/07: | | |
| | | | |
| Shares sold | 14,114,619 | $ | 248,569,217 |
|
| Shares issued | | | |
| in connection | | | |
| with reinvestment | | | |
| of distributions | — | | — |
|
| | 14,114,619 | | 248,569,217 |
|
| Shares | | | |
| repurchased | (59,987,115) | | (1,059,986,530) |
|
| Net decrease | (45,872,496) | $ | (811,417,313) |
| |
| Year ended 7/31/06: | | |
| | | | |
| Shares sold | 44,376,245 | $ | 763,727,345 |
|
| Shares issued | | | |
| in connection | | | |
| with reinvestment | | | |
| of distributions | 2,671,700 | | 47,235,647 |
|
| | 47,047,945 | | 810,962,992 |
|
| Shares | | | |
| repurchased | (137,712,864) | | (2,372,067,859) |
|
| Net decrease | (90,664,919) | $ | (1,561,104,867) |
|
| |
| CLASS B | Shares | | Amount |
|
| Six months ended 1/31/07: | | |
| | | | |
| Shares sold | 1,401,346 | $ | 21,351,278 |
|
| Shares issued | | | |
| in connection | | | |
| with reinvestment | | | |
| of distributions | — | | — |
|
| | 1,401,346 | | 21,351,278 |
|
| Shares | | | |
| repurchased | (19,057,795) | | (290,861,303) |
|
| Net decrease | (17,656,449) | $ | (269,510,025) |
| |
| Year ended 7/31/06: | | |
| | | | |
| Shares sold | 4,383,067 | $ | 65,972,896 |
|
| Shares issued | | | |
| in connection | | | |
| with reinvestment | | | |
| of distributions | — | | — |
|
| | 4,383,067 | | 65,972,896 |
|
| Shares | | | |
| repurchased | (52,650,908) | | (788,294,135) |
|
| Net decrease | (48,267,841) | $ | (722,321,239) |
48
| CLASS C | Shares | | Amount |
|
| Six months ended 1/31/07: | | |
| | | | |
| Shares sold | 181,968 | $ | 3,041,197 |
|
| Shares issued | | | |
| in connection | | | |
| with reinvestment | | | |
| of distributions | — | | — |
|
| | 181,968 | | 3,041,197 |
|
| Shares | | | |
| repurchased | (926,448) | | (15,490,180) |
|
| Net decrease | (744,480) | $ | (12,448,983) |
| |
| Year ended 7/31/06: | | | |
| | | | |
| Shares sold | 615,956 | $ | 10,154,650 |
|
| Shares issued | | | |
| in connection | | | |
| with reinvestment | | | |
| of distributions | — | | — |
|
| | 615,956 | | 10,154,650 |
|
| Shares | | | |
| repurchased | (1,834,266) | | (30,055,186) |
|
| Net decrease | (1,218,310) | $ | (19,900,536) |
|
| |
| CLASS M | Shares | | Amount |
|
| Six months ended 1/31/07: | | |
| | | | |
| Shares sold | 111,672 | $ | 1,849,968 |
|
| Shares issued | | | |
| in connection | | | |
| with reinvestment | | | |
| of distributions | — | | — |
|
| | 111,672 | | 1,849,968 |
|
| Shares | | | |
| repurchased | (779,830) | | (12,868,597) |
|
| Net decrease | (668,158) | $ | (11,018,629) |
| |
| Year ended 7/31/06: | | | |
| | | | |
| Shares sold | 357,534 | $ | 5,786,086 |
|
| Shares issued | | | |
| in connection | | | |
| with reinvestment | | | |
| of distributions | 8,295 | | 138,203 |
|
| | 365,829 | | 5,924,289 |
|
| Shares | | | |
| repurchased | (2,333,408) | | (37,802,986) |
|
| Net decrease | (1,967,579) | $ | (31,878,697) |
| CLASS R | Shares | | Amount |
|
| Six months ended 1/31/07: | | |
| | | | |
| Shares sold | 17,911 | $ | 313,485 |
|
| Shares issued | | | |
| in connection | | | |
| with reinvestment | | | |
| of distributions | — | | — |
|
| | 17,911 | | 313,485 |
|
| Shares | | | |
| repurchased | (13,489) | | (241,494) |
|
| Net increase | 4,422 | $ | 71,991 |
| |
| Year ended 7/31/06: | | | |
| | | | |
| Shares sold | 81,191 | $ | 1,410,693 |
|
| Shares issued | | | |
| in connection | | | |
| with reinvestment | | | |
| of distributions | 293 | | 5,151 |
|
| | 81,484 | | 1,415,844 |
|
| Shares | | | |
| repurchased | (16,328) | | (282,290) |
|
| Net increase | 65,156 | $ | 1,133,554 |
| |
| |
| CLASS Y | Shares | | Amount |
|
| Six months ended 1/31/07: | | |
| | | | |
| Shares sold | 8,574,819 | $ | 156,982,026 |
|
| Shares issued | | | |
| in connection | | | |
| with reinvestment | | | |
| of distributions | — | | — |
|
| | 8,574,819 | 156,982,026 |
|
| Shares | | | |
| repurchased | (26,134,144) | (485,987,784) |
|
| Net decrease | (17,559,325) | $ | (329,005,758) |
| |
| Year ended 7/31/06: | | | |
| | | | |
| Shares sold | 23,642,280 | $ | 416,473,931 |
|
| Shares issued | | | |
| in connection | | | |
| with reinvestment | | | |
| of distributions | 982,126 | 17,913,985 |
|
| | 24,624,406 | | 434,387,916 |
|
| Shares | | | |
| repurchased | (44,096,994) | (784,272,130) |
|
| Net decrease | (19,472,588) | $ | (349,884,214) |
49
Note 5: Investment in Putnam Prime Money Market Fund
The fund invests in Putnam Prime Money Market Fund, an open-end management investment company managed by Putnam Management. Investments in Putnam Prime Money Market Fund are valued at its closing net asset value each business day. Management fees paid by the fund are reduced by an amount equal to the management and administrative services fees paid by Putnam Prime Money Market Fund with respect to assets invested by the fund in Putnam Prime Money Market Fund. For the period ended January 31, 2007, management fees paid were reduced by $6,432 relating to the fund’s investment in Putnam Prime Money Market Fund. Income distributions earned by the fund are recorded as income in the statement of operations and totaled $357,020 for the period ended January 31, 2007. During the period ended January 31, 2007, cost of purchases and proceeds of sales of investments in Putnam Prime Money Market Fund aggregated $412,362,940 and $405,857,802, res pectively.
Note 6: Regulatory matters and litigation
In late 2003 and 2004, Putnam Management settled charges brought by the Securities and Exchange Commission (“SEC”) and the Massachusetts Securities Division (“MSD”) in connection with excessive short-term trading by certain former Putnam employees and, in the case of charges brought by the MSD, excessive short-term trading by participants in some Putnam-administered 401(k) plans. Putnam Management agreed to pay $193.5 million in penalties and restitution, of which $153.5 million will be distributed to certain open-end Putnam funds and their shareholders after the SEC and MSD approve a distribution plan being developed by an independent consultant. The allegations of the SEC and MSD and related matters have served as the general basis for certain lawsuits, including purported class action lawsuits filed against Putnam Management and, in a limited number of cases, against some Putnam funds. Putnam Management believes th at these lawsuits will have no material adverse effect on the funds or on Putnam Management’s ability to provide investment management services. In addition, Putnam Management has agreed to bear any costs incurred by the Putnam funds as a result of these matters.
In connection with a settlement between Putnam and the fund’s Trustees in September 2006, the fund received $6,125,083 from Putnam to address issues relating to the calculation of certain amounts paid by the Putnam mutual funds to Putnam for transfer agent services.
Putnam Management and Putnam Retail Management are named as defendants in a civil suit in which the plaintiffs allege that the management and distribution fees paid by certain Putnam funds were excessive and seek recovery under the Investment Company Act of 1940. Putnam Management and Putnam Retail Management have contested the plaintiffs’ claims and the matter is currently pending in the U.S. District Court for the District of Massachusetts. Based on currently available information, Putnam Management believes that this action is without merit and that it is unlikely to have a material effect on Putnam Management’s and Putnam Retail Management’s ability to provide services to their clients, including the fund.
Note 7: New accounting pronouncements
In June 2006, the Financial Accounting Standards Board (“FASB”) issued Interpretation No. 48, Accounting for Uncertainty in Income Taxes (the “Interpretation”). The Interpretation prescribes a minimum threshold for financial statement recognition of the benefit of a tax position taken or expected to be taken by a filer in the filer’s tax return. The Interpretation will become effective for fiscal years beginning after December 15, 2006 but will also apply to tax positions reflected in the fund’s financial statements as of that date. No determination has been made whether the adoption of the Interpretation will require the fund to make any adjustments to its net assets or have any other effect on the fund’s financial statements. The effects of implementing this pr onouncement, if
50
any, will be noted in the fund’s next semiannual financial statements.
In September 2006, the FASB issued Statement of Financial Accounting Standards No. 157, Fair Value Measurements (the “Standard”). The Standard defines fair value, sets out a framework for measuring fair value and requires additional disclosures about fair value measurements. The Standard applies to fair value measurements already required or permitted by existing standards. The Standard is effective for financial statements issued for fiscal years beginning after November 15, 2007 and interim periods within those fiscal years. Putnam Management is currently evaluating what impact the adoption of the Standard will have on the fund’s financial statements.
51
Brokerage commissions
(Unaudited)
Brokerage commissions are paid to firms that execute trades on behalf of your fund. When choosing these firms, Putnam is required by law to seek the best execution of the trades, taking all relevant factors into consideration, including expected quality of execution and commission rate. Listed below are the largest relationships based upon brokerage commissions for your fund and the other funds in Putnam’s Large-Cap Growth group for the year ended January 31, 2007. The other Putnam mutual funds in this group are Putnam Growth Opportunities Fund, Putnam VT Growth Opportunities Fund, and Putnam VT Voyager Fund.
The top five firms that received brokerage commissions for trades executed for the Large-Cap Growth group are (in descending order) Goldman Sachs, Citigroup Global Markets, Merrill Lynch, UBS Warburg, and RBC Capital Markets. Commissions paid to these firms together represented approximately 47% of the total brokerage commissions paid for the year ended January 31, 2007.
Commissions paid to the next 10 firms together represented approximately 34% of the total brokerage commissions paid during the period. These firms are (in alphabetical order) Bank of America, Bear Stearns & Company, Credit Suisse First Boston, Deutsche Bank Securities, JPMorgan Clearing, Lehman Brothers, Morgan Stanley Dean Witter, Sanford Bernstein, SG Cowen Securities Corp., and Wachovia Securities.
Additional information about brokerage commissions is available on the Securities and Exchange Commission (SEC) Web site at www.sec.gov. Putnam funds disclose commissions by firm to the SEC in semiannual filings on Form N-SAR.
52
Fund information
Founded over 65 years ago, Putnam Investments was built around the concept that a balance between risk and reward is the hallmark of a well-rounded financial program. We manage over 100 mutual funds in growth, value, blend, fixed income, and international.
| Investment Manager | Officers | Francis J. McNamara, III |
| Putnam Investment | George Putnam, III | Vice President and |
| Management, LLC | President | Chief Legal Officer |
| One Post Office Square | | |
| Boston, MA 02109 | Charles E. Porter | Charles A. Ruys de Perez |
| | Executive Vice President, | Vice President and |
| Marketing Services | Principal Executive Officer, | Chief Compliance Officer |
| Putnam Retail Management | Associate Treasurer and | |
| One Post Office Square | Compliance Liaison | Mark C. Trenchard |
| Boston, MA 02109 | | Vice President and |
| | Jonathan S. Horwitz | BSA Compliance Officer |
| Custodians | Senior Vice President | |
| Putnam Fiduciary Trust | and Treasurer | Judith Cohen |
| Company, State Street Bank | | Vice President, Clerk and |
| and Trust Company | Steven D. Krichmar | Assistant Treasurer |
| | Vice President and | |
| Legal Counsel | Principal Financial Officer | Wanda M. McManus |
| Ropes & Gray LLP | | Vice President, Senior Associate |
| | Janet C. Smith | Treasurer and Assistant Clerk |
| Trustees | Vice President, Principal | |
| John A. Hill, Chairman | Accounting Officer and | Nancy E. Florek |
| Jameson Adkins Baxter, | Assistant Treasurer | Vice President, Assistant Clerk, |
| Vice Chairman | | Assistant Treasurer and |
| Charles B. Curtis | Susan G. Malloy | Proxy Manager |
| Myra R. Drucker | Vice President and | |
| Charles E. Haldeman, Jr. | Assistant Treasurer | |
| Paul L. Joskow | | |
| Elizabeth T. Kennan | Beth S. Mazor | |
| Kenneth R. Leibler | Vice President | |
| Robert E. Patterson | | |
| George Putnam, III | James P. Pappas | |
| W. Thomas Stephens | Vice President | |
| Richard B. Worley | | |
| Richard S. Robie, III | |
| Vice President | |
This report is for the information of shareholders of Putnam Voyager Fund. It may also be used as sales literature when preceded or accompanied by the current prospectus, the most recent copy of Putnam’s Quarterly Performance Summary, and Putnam’s Quarterly Ranking Summary. For more recent performance, please visit www.putnam.com. Investors should carefully consider the investment objective, risks, charges, and expenses of a fund, which are described in its prospectus. For this and other information or to request a prospectus, call 1-800-225-1581 toll free. Please read the prospectus carefully before investing. The fund’s Statement of Additional Information contains additional information about the fund’s Trustees and is available without charge upon request by calling 1-800-225-1581.

Item 2. Code of Ethics:
Not applicable
Item 3. Audit Committee Financial Expert:
Not applicable
Item 4. Principal Accountant Fees and Services:
Not applicable
Item 5. Audit Committee of Listed Registrants
Not applicable
Item 6. Schedule of Investments:
The registrant’s schedule of investments in unaffiliated issuers is included in the report to
shareholders in Item 1 above.
Item 7. Disclosure of Proxy Voting Policies and Procedures For Closed-End Management
Investment Companies:
Not applicable
Item 8. Portfolio Managers of Closed-End Investment Companies
Not Applicable
Item 9. Purchases of Equity Securities by Closed-End Management Investment Companies and
Affiliated Purchasers:
Not applicable
Item 10. Submission of Matters to a Vote of Security Holders:
Not applicable
Item 11. Controls and Procedures:
(a) The registrant's principal executive officer and principal financial officer have concluded, based on their evaluation of the effectiveness of the design and operation of the registrant's disclosure controls and procedures as of a date within 90 days of the filing date of this report, that the design and operation of such procedures are generally effective to provide reasonable assurance that information required to be disclosed by the registrant in this report is recorded, processed, summarized and reported within the time periods specified in the Commission's rules and forms.
(b) Changes in internal control over financial reporting:
Effective January 1, 2007, the fund retained State Street Bank and Trust Company ("State Street") as its custodian. Putnam Fiduciary Trust Company, the fund's previous custodian, is managing the transfer of the fund's assets to State Street. This transfer is expected to be completed for all Putnam funds during the first half of 2007, with PFTC remaining as custodian with respect to fund assets until the assets are transferred.
Also effective January 1, 2007, the fund's investment manager, Putnam
Investment Management, LLC entered into a Master Sub-Accounting Services Agreement with State Street, under which the investment manager has delegated to State Street responsibility for providing certain administrative, pricing, and bookkeeping services for the fund.
Item 12. Exhibits:
(a)(1) Not applicable
(a)(2) Separate certifications for the principal executive officer and principal financial officer of the registrant as required by Rule 30a-2(a) under the Investment Company Act of 1940, as amended, are filed herewith.
(b) The certifications required by Rule 30a-2(b) under the Investment Company Act of 1940, as amended, are filed herewith.
SIGNATURES
Pursuant to the requirements of the Securities Exchange Act of 1934 and the Investment Company Act of 1940, the registrant has duly caused this report to be signed on its behalf by the undersigned, thereunto duly authorized.
Putnam Voyager Fund
By (Signature and Title):
/s/Janet C. Smith
Janet C. Smith
Principal Accounting Officer
Date: March 28, 2007
Pursuant to the requirements of the Securities Exchange Act of 1934 and the Investment Company Act of 1940, this report has been signed below by the following persons on behalf of the registrant and in the capacities and on the dates indicated.
By (Signature and Title):
/s/Charles E. Porter
Charles E. Porter
Principal Executive Officer
Date: March 28, 2007
By (Signature and Title):
/s/Steven D. Krichmar
Steven D. Krichmar
Principal Financial Officer
Date: March 28, 2007