| | | |
| | |
| UNITED STATES |
| SECURITIES AND EXCHANGE COMMISSION |
| Washington, D.C. 20549 |
| |
| FORM N-CSR |
| |
| CERTIFIED SHAREHOLDER REPORT OF REGISTERED |
| MANAGEMENT INVESTMENT COMPANIES |
| | |
| Investment Company Act file number: (811-01682) | |
| | |
| Exact name of registrant as specified in charter: | Putnam Voyager Fund |
| |
| Address of principal executive offices: One Post Office Square, Boston, Massachusetts 02109 |
| | |
| Name and address of agent for service: | Beth S. Mazor, Vice President |
| | One Post Office Square |
| | Boston, Massachusetts 02109 |
| | | |
| Copy to: | | John W. Gerstmayr, Esq. |
| | Ropes & Gray LLP |
| | 800 Boylston Street |
| | Boston, Massachusetts 02199-3600 |
| |
| Registrant’s telephone number, including area code: | (617) 292-1000 |
| | | |
| Date of fiscal year end: July 31, 2011 | | |
| |
| Date of reporting period: August 1, 2010 — January 31, 2011 |
Item 1. Report to Stockholders:
The following is a copy of the report transmitted to stockholders pursuant to Rule 30e-1 under the Investment Company Act of 1940:
Putnam
Voyager
Fund
Semiannual report
1 | 31 | 11
| | |
| Message from the Trustees | 1 | |
| |
| About the fund | 2 | |
| |
| Performance snapshot | 4 | |
| |
| Interview with your fund’s portfolio manager | 5 | |
| |
| Your fund’s performance | 10 | |
| |
| Your fund’s expenses | 12 | |
| |
| Terms and definitions | 14 | |
| |
| Other information for shareholders | 15 | |
| |
| Financial statements | 16 | |
| |
Message from the Trustees
Dear Fellow Shareholder:
The U.S. economy and most economies around the world have continued to strengthen in early 2011, building on last year’s solid growth. The U.S. stock market added gains, delivering one of the best January returns in several years. Investors are encouraged by positive economic data, healthy corporate earnings, extended tax cuts, and historically low interest rates. Bond markets remain mixed, however, as U.S. Treasury yields have risen from their historic lows and investors have sought returns in riskier asset classes.
Putnam’s investment team maintains a positive outlook for U.S. equities in 2011, encouraged by steadily improving conditions in both the economy and in corporate America. The global outlook is less certain, with ongoing European debt issues, signs of inflation in emerging markets, and recent political uprisings in Egypt and other countries. While these global developments may well lead to future market volatility, we also believe that an active, research-focused manager like Putnam can uncover opportunities for shareholders in this environment.
In developments affecting oversight of your fund, we wish to thank Richard B. Worley and Myra R. Drucker, who have retired from the Board of Trustees, for their many years of dedicated and thoughtful leadership.
Lastly, we would like to take this opportunity to welcome new shareholders to the fund and to thank all of our investors for your continued confidence in Putnam.

About the fund
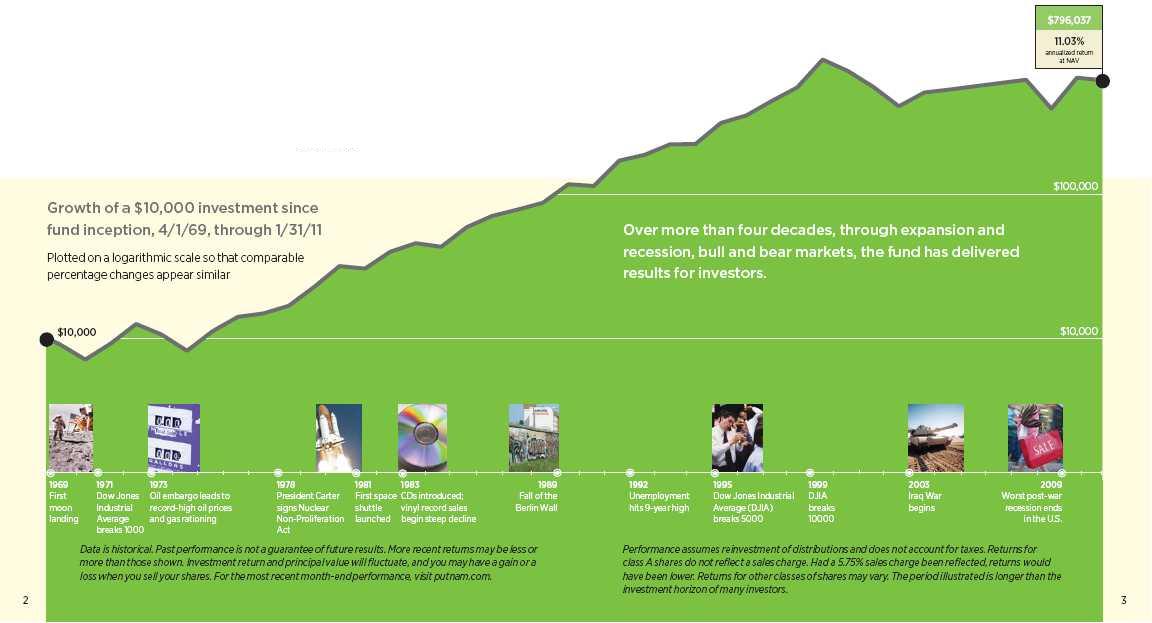
Seeking growth for investors for over 40 years
In 1969, when Putnam Voyager Fund made its debut, Richard M. Nixon became the 37th U.S. President and Americans landed on the moon for the first time. For the U.S. financial markets, it was the eve of a sluggish decade in which the Dow Jones Industrial Average would gain only 4.8%. Despite Vietnam War tensions and worries over inflation and recession, the fund’s first management team was ready to tap into the long-term growth potential of American businesses.
“The basic qualities underlying the dynamism of our economy are not at issue here,” said the first report to shareholders in 1969. “The future has never been brighter.” The report also discussed the risk of “underestimating the potential growth of companies with strong fundamental trends.”
In the 42 years since its first report was published, the fund has witnessed many more difficult markets, as well as unprecedented stock market growth and extraordinary innovation. One emerging growth trend was noted in the fund’s 1988 annual report: “Several years from now, when you’re leaving home . . . you may find yourself tossing something new into your tote bag or briefcase — your phone. That’s right: The era of truly portable telephones is dawning.”
Today, the fund continues to look for promising growth trends as well as companies across a wide range of sectors that have the potential to grow revenues and earnings at a rate that the market underestimates. While much has changed since the fund’s management wrestled with the challenges of the 1970s, some things have not — including the fund’s focus on seeking the most promising growth opportunities for investors.
Consider these risks before investing: The fund invests some or all of its assets in small and/or midsize companies. Such investments increase the risk of greater price fluctuations. Stocks with above-average earnings may be more volatile, especially if earnings do not continue to grow.
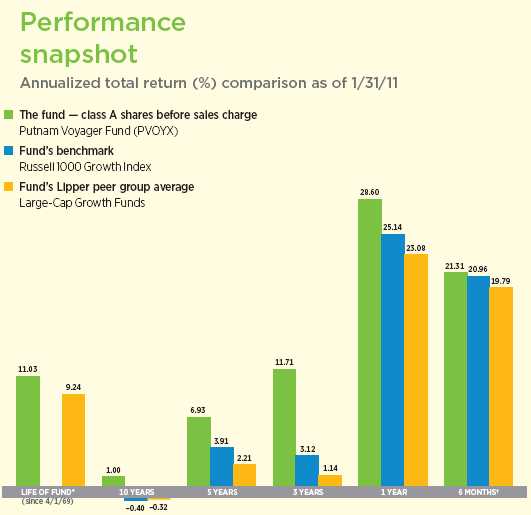
Current performance may be lower or higher than the quoted past performance, which cannot guarantee future results. Share price, principal value, and return will fluctuate, and you may have a gain or a loss when you sell your shares. Performance of class A shares assumes reinvestment of distributions and does not account for taxes. Fund returns in the bar chart do not reflect a sales charge of 5.75%; had they, returns would have been lower. See pages 5 and 10–11 for additional performance information. For a portion of the periods, the fund had expense limitations, without which returns would have been lower. To obtain the most recent month-end performance, visit putnam.com.
* The fund’s benchmark, the Russell 1000 Growth Index, was introduced on 12/31/78, which post-dates the inception of the fund’s class A shares.
† Returns for the six-month period are not annualized, but cumulative.
4
Interview with your fund’s portfolio manager
Nick Thakore
The U.S. stock market has moved steadily higher in recent months. What is driving these gains?
Energized by the market rally that kicked off in early September, U.S. equities delivered strong results during the semiannual period that ended January 31, 2011. U.S. equities outperformed international stocks, which struggled because of European sovereign debt problems and inflationary fears in emerging economies such as China and Brazil. A number of market-friendly events restored confidence in the U.S. economic recovery, including healthy corporate profits and the extension of the Bush-era tax cuts. During the six-month period ended January 31, 2011, growth stocks, such as those in which Putnam Voyager Fund invests, generally outperformed value stocks.
How did Putnam Voyager Fund perform in this environment?
I am pleased to report that the fund’s class A shares posted a 21.31% gain over the six-month period, again surpassing its benchmark index return of 20.96% and the 19.79% average return of its Lipper peer group. Over the trailing 12 months, your fund has gained 28.60% at net asset value.
The main driver of performance was stock selection. Positive performance came from a wide number of sectors, including consumer cyclicals, consumer staples, basic materials, and technology. Holdings in the energy and financials sectors detracted from results, relative to the benchmark.
I take a risk-conscious approach to large-cap growth investing for the fund. I focus on finding companies that can grow earnings and cash flow faster than the overall market in the

This comparison shows you fund’s performance in the context of broad market indexes for the six months ended 1/31/11. See pages 4 and 10–11 for additional fund performance information. Index descriptions can be found on page 14.
5
ensuing couple of years, and I strive not to pay too much for that growth. This strategy has worked well during the recent market volatility, allowing me to seize opportunities to add to positions of companies that I want to own. Today, I believe the fund reflects a portfolio of companies that can grow earnings faster than the market. Importantly, it’s a portfolio made up of holdings that we did not pay a premium to own. For example, the fund’s average historical five-year earnings per share growth, or EPS, as of the end of January, was 21.0%, compared with 13.9% for the Russell 1000 Growth Index. That means the fund’s holdings have grown earnings faster, on average, than the benchmark. At the same time, the fund’s average price-to-earnings ratio, a measure of valuation, was 15.5X at the end of January, versus 20.1X for the benchmark. That means the fund paid less on average to purchase those fast-growing companies than the prices in the benchmark today.
From a sector view, how did you position the fund?
During the period, the fund had a modest bias to economically sensitive, cyclical growth sectors versus the more stable sectors. The fund had an overweight position in financials based on my belief that the sector was trading at depressed levels, earnings growth would be strong for the foreseeable future, credit trends would substantially improve, and regulatory concerns would eventually pass. Late in 2010, however, the financials sector struggled because of concerns about the slow rate of loan issuance and weak net interest margins that could potentially lead to lower revenue growth. Nevertheless, I still view financials as attractive and own various positions across insurance, banks, and diversified companies.
On the portfolio’s stable growth side, the fund had an overweight position to health care during the period. In my view, the regulatory risks and the market’s preference for other sectors created a number of attractive

Allocations are represented as a percentage of the fund’s net assets. Summary information may differ from the portfolio schedule included in the financial statements due to the inclusion of derivative securities and the exclusion of as-of trades, if any, and the use of different classifications of securities for presentation purposes. Holdings and allocations may vary over time.
6
valuations in such areas as biotech, health-care services, and pharmaceuticals. On January 31, 2011, the largest overweights versus the benchmark were in financials, technology, and basic materials. The fund’s most significant underweight versus the benchmark was in the consumer staples sector.

What holdings contributed to the fund’s positive return?
One of the biggest contributors to performance was the fund’s overweight position in telecommunications pioneer Qualcomm, which is also a top-10 holding. Qualcomm sells technology used in digital wireless telecommunications equipment. The company’s strengths can be seen in its revenue growth, its solid balance sheet, and its record of earnings per share growth.
In the basic materials sector, several investments benefited from the global rebound in commodity prices. National Oilwell Varco, which provides mechanical components for land-based and offshore drilling rigs, is capitalizing on a new cycle of exploration and development companies building new rigs. Teck Resources, a Canadian mining company that produces copper and metallurgical coal used in the production of steel, also performed well. I bought the stock at attractive price levels after an industry-wide sell-off. The company performed well, and its share price rallied strongly as global demand for commodities recovered.
It is also worth mentioning that the fund received a $6.2 million settlement related to the Enron bankruptcy case. This payment added slightly to the fund’s return during the period.
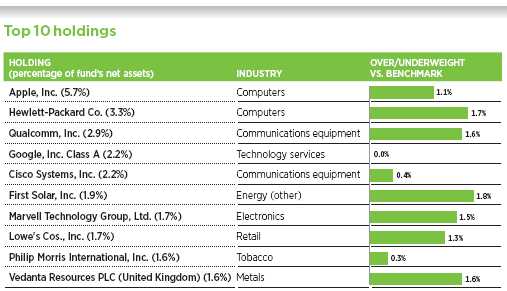
This table shows the fund’s top 10 holdings by percentage of the fund’s net assets as of 1/31/11. Short-term holdings are excluded. Holdings will vary over time.
7
What were some of the fund’s detractors?
Detractors from performance included technology company Hewlett-Packard in which we held an overweight position relative to the benchmark. Shares of several technology stocks slipped during the fourth quarter of 2010 after a weak earnings outlook from technology heavyweight Cisco Systems fueled worries that economic softness would hurt profits across the sector. However, shares of Hewlett-Packard did rebound late in the period after the maker of computers, printers, and servers raised its fiscal 2011 forecast.
The fund’s largest detractor from performance was the result of being underweight to Exxon Mobil, the largest integrated energy company in the world. Its production of crude oil and natural gas liquids declined between 2006 and 2008 because of economic uncertainty, while the costs of producing oil continued to increase. Nevertheless, Exxon Mobil shares registered strong gains in the final months of 2010, based on investor optimism about the strengthening global economy. While the fund is underweight Exxon Mobil, we own other integrated oil stocks such as Chevron and Petrobras [Petroleo Brasileiro], that I believe offer a better combination of growth and valuation.
What is your outlook for the coming months?
I am relatively optimistic about U.S. stock market performance and the U.S. economic recovery in 2011. Although risks remain, the recent round of stimulus, combined with improving economic trends and a shift in Washington, D.C., toward a more moderately pro-business legislative environment, may prove positive for equity investors. I expect year-over-year growth in profit margins to slow somewhat, but at the same time to continue at today’s historically high levels. Corporations have elevated cash reserves and, with balance sheets at their strongest since the 1960s, I anticipate the stock market rally will continue. In particular, I expect capital management and mergers and acquisitions to play a significant role in 2011, augmenting earnings growth as a share-price driver. Moreover, with stocks
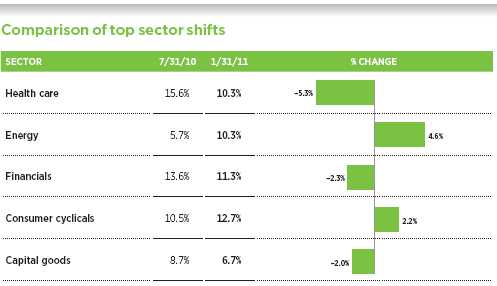
This chart shows the fund’s largest allocation shifts, by percentage, over the past six months. Weightings are shown as a percentage of net assets. Summary information may differ from the portfolio schedule included in the financial statements due to the inclusion of derivative securities and the exclusion of as-of trades, if any, and the use of different classifications of securities for presentation purposes. Holdings will vary over time.
8
hovering at about the cheapest they have ever been versus bonds, I anticipate increased interest in equities from fixed-income investors, and this potential influx of investment dollars could be a potent catalyst for equities if investor sentiment improves.
Thank you, Nick, for your time and insights today.
The views expressed in this report are exclusively those of Putnam Management. They are not meant as investment advice.
Please note that the holdings discussed in this report may not have been held by the fund for the entire period. Portfolio composition is subject to review in accordance with the fund’s investment strategy and may vary in the future. Current and future portfolio holdings are subject to risk.

Portfolio Manager Nick Thakore is Head of U.S. Equities at Putnam. He has an M.B.A. from the Wharton School of the University of Pennsylvania and a B.B.A. from the University of Michigan. Nick joined Putnam in 2008 and has been in the investment industry since 1993.
IN THE NEWS
The U.S. economic recovery is progressing, although the unemployment rate remains persistently high. Increases in exports, consumer spending, and existing home sales drove the fourth-quarter GDP growth of 2.8%, the Commerce Department reported. At its December meeting, the Federal Open Market Committee noted that the recent economic growth has been “insufficient to bring about a significant improvement in labor market conditions.” In January, the U.S. unemployment rate did inch down to 9.0% from 9.4%. Consumer spending remains constrained by high unemployment, while businesses may be investing more in equipment and less on new hires.
9
Your fund’s performance
This section shows your fund’s performance, price, and distribution information for periods ended January 31, 2011, the end of the first half of its current fiscal year. In accordance with regulatory requirements for mutual funds, we also include performance as of the most recent calendar quarter-end and expense information taken from the fund’s current prospectus. Performance should always be considered in light of a fund’s investment strategy. Data represent past performance. Past performance does not guarantee future results. More recent returns may be less or more than those shown. Investment return and principal value will fluctuate, and you may have a gain or a loss when you sell your shares. Performance information does not reflect any deduction for taxes a shareholder may owe on fund distributions or on the redemption of fund shares. For the most recent month-end performance, please visit the Individual Investors section at putnam.com or call Putnam at 1-800-225-1581. Class R and class Y shares are not available to all investors. See the Terms and Definitions section in this report for definitions of the share classes offered by your fund.
Fund performance Total return for periods ended 1/31/11
| | | | | | | | | | |
| | Class A | Class B | Class C | Class M | Class R | Class Y |
| (inception dates) | (4/1/69) | (4/27/92) | (7/26/99) | (12/1/94) | (1/21/03) | (3/31/94) |
|
| | NAV | POP | NAV | CDSC | NAV | CDSC | NAV | POP | NAV | NAV |
|
| Annual average | | | | | | | | | | |
| (life of fund) | 11.03% | 10.87% | 10.05% | 10.05% | 10.20% | 10.20% | 10.34% | 10.25% | 10.75% | 11.15% |
|
| 10 years | 10.50 | 4.15 | 2.44 | 2.44 | 2.46 | 2.46 | 5.06 | 1.37 | 7.81 | 13.29 |
| Annual average | 1.00 | 0.41 | 0.24 | 0.24 | 0.24 | 0.24 | 0.49 | 0.14 | 0.75 | 1.26 |
|
| 5 years | 39.80 | 31.73 | 34.61 | 32.61 | 34.68 | 34.68 | 36.36 | 31.61 | 38.10 | 41.56 |
| Annual average | 6.93 | 5.67 | 6.12 | 5.81 | 6.14 | 6.14 | 6.40 | 5.65 | 6.67 | 7.20 |
|
| 3 years | 39.41 | 31.38 | 36.20 | 33.20 | 36.29 | 36.29 | 37.36 | 32.53 | 38.34 | 40.49 |
| Annual average | 11.71 | 9.52 | 10.85 | 10.03 | 10.87 | 10.87 | 11.16 | 9.84 | 11.42 | 12.00 |
|
| 1 year | 28.60 | 21.19 | 27.63 | 22.63 | 27.68 | 26.68 | 27.93 | 23.44 | 28.29 | 28.92 |
|
| 6 months | 21.31 | 14.32 | 20.83 | 15.83 | 20.87 | 19.86 | 20.98 | 16.77 | 21.16 | 21.42 |
|
Current performance may be lower or higher than the quoted past performance, which cannot guarantee future results. After-sales-charge returns (public offering price, or POP) for class A and M shares reflect a maximum 5.75% and 3.50% load, respectively. Class B share returns reflect the applicable contingent deferred sales charge (CDSC), which is 5% in the first year, declining over time to 1% in the sixth year, and is eliminated thereafter. Class C shares reflect a 1% CDSC for the first year that is eliminated thereafter. Class R and Y shares have no initial sales charge or CDSC. Performance for class B, C, M, R, and Y shares before their inception is derived from the historical performance of class A shares, adjusted for the applicable sales charge (or CDSC) and the higher operating expenses for such shares, except for class Y shares, for which 12b-1 fees are not applicable.
Prior performance benefited from the receipt of an Enron Class Action Settlement pertaining to investments made prior to 2002.
For a portion of the periods, the fund had expense limitations, without which returns would have been lower.
Class B share performance does not reflect conversion to class A shares.
10
Comparative index returns For periods ended 1/31/11
| | |
| | | Lipper Large-Cap Growth Funds |
| | Russell 1000 Growth Index | category average* |
|
| Annual average (life of fund) | —† | 9.24% |
|
| 10 years | –3.92% | –0.99 |
| Annual average | –0.40 | –0.32 |
|
| 5 years | 21.17 | 11.96 |
| Annual average | 3.91 | 2.21 |
|
| 3 years | 9.64 | 3.77 |
| Annual average | 3.12 | 1.14 |
|
| 1 year | 25.14 | 23.08 |
|
| 6 months | 20.96 | 19.79 |
|
Index and Lipper results should be compared to fund performance at net asset value.
* Over the 6-month, 1-year, 3-year, 5-year, 10-year, and life-of-fund periods ended 1/31/11, there were 906, 865, 764, 643, 394, and 13 funds, respectively, in this Lipper category.
† The fund’s benchmark, the Russell 1000 Growth Index, was introduced on 12/31/78, which post-dates the inception of the fund’s class A shares.
Fund price and distribution information For the six-month period ended 1/31/11
| | | | | | | | |
| | | | | | |
| Distributions | Class A | Class B | Class C | Class M | Class R | Class Y |
|
| Number | 1 | — | — | — | 1 | 1 |
|
| Income | $0.084 | — | — | — | $0.067 | $0.136 |
|
| Capital gains | — | — | — | — | — | — |
|
| Total | $0.084 | — | — | — | $0.067 | $0.136 |
|
| Share value | NAV | POP | NAV | NAV | NAV | POP | NAV | NAV |
|
| 7/31/10 | $20.12 | $21.35 | $17.09 | $18.74 | $18.59 | $19.26 | $19.80 | $20.97 |
|
| 1/31/11 | 24.32 | 25.80 | 20.65 | 22.65 | 22.49 | 23.31 | 23.92 | 25.32 |
|
The classification of distributions, if any, is an estimate. Final distribution information will appear on your year-end tax forms.
Fund performance as of most recent calendar quarter
Total return for periods ended 12/31/10
| | | | | | | | | | |
| | Class A | Class B | Class C | Class M | Class R | Class Y |
|
| (inception dates) | (4/1/69) | (4/27/92) | (7/26/99) | (12/1/94) | (1/21/03) | (3/31/94) |
|
| | NAV | POP | NAV | CDSC | NAV | CDSC | NAV | POP | NAV | NAV |
|
| Annual average | | | | | | | | | | |
| (life of fund) | 10.99% | 10.83% | 10.01% | 10.01% | 10.15% | 10.15% | 10.30% | 10.20% | 10.71% | 11.10% |
|
| 10 years | 8.47 | 2.24 | 0.57 | 0.57 | 0.62 | 0.62 | 3.18 | –0.43 | 5.86 | 11.21 |
| Annual average | 0.82 | 0.22 | 0.06 | 0.06 | 0.06 | 0.06 | 0.31 | –0.04 | 0.57 | 1.07 |
|
| 5 years | 38.10 | 30.17 | 32.99 | 30.99 | 33.06 | 33.06 | 34.73 | 30.05 | 36.41 | 39.89 |
| Annual average | 6.67 | 5.41 | 5.87 | 5.55 | 5.88 | 5.88 | 6.14 | 5.40 | 6.41 | 6.94 |
|
| 3 years | 24.63 | 17.44 | 21.86 | 18.86 | 21.90 | 21.90 | 22.82 | 18.53 | 23.75 | 25.61 |
| Annual average | 7.62 | 5.50 | 6.81 | 5.93 | 6.82 | 6.82 | 7.09 | 5.83 | 7.36 | 7.90 |
|
| 1 year | 20.61 | 13.69 | 19.66 | 14.66 | 19.72 | 18.72 | 19.96 | 15.78 | 20.30 | 20.88 |
|
| 6 months | 29.96 | 22.47 | 29.50 | 24.50 | 29.47 | 28.47 | 29.67 | 25.16 | 29.77 | 30.13 |
|
11
Your fund’s expenses
As a mutual fund investor, you pay ongoing expenses, such as management fees, distribution fees (12b-1 fees), and other expenses. Using the following information, you can estimate how these expenses affect your investment and compare them with the expenses of other funds. You may also pay one-time transaction expenses, including sales charges (loads) and redemption fees, which are not shown in this section and would have resulted in higher total expenses. For more information, see your fund’s prospectus or talk to your financial representative.
Expense ratios
| | | | | | |
| | Class A | Class B | Class C | Class M | Class R | Class Y |
|
| Total annual operating expenses for the fiscal year | | | | | | |
| ended 7/31/10 | 1.30% | 2.05% | 2.05% | 1.80% | 1.55% | 1.05% |
|
| Annualized expense ratio for the six-month period | | | | | | |
| ended 1/31/11* | 1.21% | 1.96% | 1.96% | 1.71% | 1.46% | 0.96% |
|
Fiscal-year expense information in this table is taken from the most recent prospectus, is subject to change, and may differ from that shown for the annualized expense ratio and in the financial highlights of this report. Expenses are shown as a percentage of average net assets.
* Includes 0.02% of annualized performance fees for the six months ended 1/31/11.
Expenses per $1,000
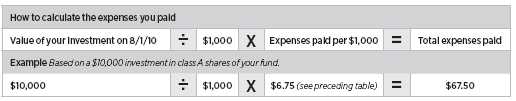
The following table shows the expenses you would have paid on a $1,000 investment in the fund from August 1, 2010, to January 31, 2011. It also shows how much a $1,000 investment would be worth at the close of the period, assuming actual returns and expenses.
| | | | | | |
| | Class A | Class B | Class C | Class M | Class R | Class Y |
|
| Expenses paid per $1,000*† | $6.75 | $10.91 | $10.91 | $9.52 | $8.14 | $5.36 |
|
| Ending value (after expenses) | $1,213.10 | $1,208.30 | $1,208.70 | $1,209.80 | $1,211.60 | $1,214.20 |
|
* Expenses for each share class are calculated using the fund’s annualized expense ratio for each class, which represents the ongoing expenses as a percentage of average net assets for the six months ended 1/31/11. The expense ratio may differ for each share class.
† Expenses are calculated by multiplying the expense ratio by the average account value for the period; then multiplying the result by the number of days in the period; and then dividing that result by the number of days in the year.
12
Estimate the expenses you paid
To estimate the ongoing expenses you paid for the six months ended January 31, 2011, use the following calculation method. To find the value of your investment on August 1, 2010, call Putnam at 1-800-225-1581.
Compare expenses using the SEC’s method
The Securities and Exchange Commission (SEC) has established guidelines to help investors assess fund expenses. Per these guidelines, the following table shows your fund’s expenses based on a $1,000 investment, assuming a hypothetical 5% annualized return. You can use this information to compare the ongoing expenses (but not transaction expenses or total costs) of investing in the fund with those of other funds. All mutual fund shareholder reports will provide this information to help you make this comparison. Please note that you cannot use this information to estimate your actual ending account balance and expenses paid during the period.
| | | | | | |
| | Class A | Class B | Class C | Class M | Class R | Class Y |
|
| Expenses paid per $1,000*† | $6.16 | $9.96 | $9.96 | $8.69 | $7.43 | $4.89 |
|
| Ending value (after expenses) | $1,019.11 | $1,015.32 | $1,015.32 | $1,016.59 | $1,017.85 | $1,020.37 |
|
* Expenses for each share class are calculated using the fund’s annualized expense ratio for each class, which represents the ongoing expenses as a percentage of average net assets for the six months ended 1/31/11. The expense ratio may differ for each share class.
† Expenses are calculated by multiplying the expense ratio by the average account value for the period; then multiplying the result by the number of days in the period; and then dividing that result by the number of days in the year.
13
Terms and definitions
Important terms
Total return shows how the value of the fund’s shares changed over time, assuming you held the shares through the entire period and reinvested all distributions in the fund.
Net asset value (NAV) is the price, or value, of one share of a mutual fund, without a sales charge. NAVs fluctuate with market conditions. NAV is calculated by dividing the net assets of each class of shares by the number of outstanding shares in the class.
Public offering price (POP) is the price of a mutual fund share plus the maximum sales charge levied at the time of purchase. POP performance figures shown here assume the 5.75% maximum sales charge for class A shares and 3.50% for class M shares.
Contingent deferred sales charge (CDSC) is generally a charge applied at the time of the redemption of class B or C shares and assumes redemption at the end of the period. Your fund’s class B CDSC declines over time from a 5% maximum during the first year to 1% during the sixth year. After the sixth year, the CDSC no longer applies. The CDSC for class C shares is 1% for one year after purchase.
Share classes
Class A shares are generally subject to an initial sales charge and no CDSC (except on certain redemptions of shares bought without an initial sales charge).
Class B shares are not subject to an initial sales charge. They may be subject to a CDSC.
Class C shares are not subject to an initial sales charge and are subject to a CDSC only if the shares are redeemed during the first year.
Class M shares have a lower initial sales charge and a higher 12b-1 fee than class A shares and no CDSC (except on certain redemptions of shares bought without an initial sales charge).
Class R shares are not subject to an initial sales charge or CDSC and are available only to certain defined contribution plans.
Class Y shares are not subject to an initial sales charge or CDSC, and carry no 12b-1 fee. They are generally only available to corporate and institutional clients and clients in other approved programs.
Comparative indexes
Barclays Capital Aggregate Bond Index is an unmanaged index of U.S. investment-grade fixed-income securities.
BofA (Bank of America) Merrill Lynch U.S. 3-Month Treasury Bill Index is an unmanaged index that seeks to measure the performance of U.S. Treasury bills available in the marketplace.
Russell 1000 Growth Index is an unmanaged index of those companies in the large-cap Russell 1000 Index chosen for their growth orientation.
S&P 500 Index is an unmanaged index of common stock performance.
Indexes assume reinvestment of all distributions and do not account for fees. Securities and performance of a fund and an index will differ. You cannot invest directly in an index.
Lipper is a third-party industry-ranking entity that ranks mutual funds. Its rankings do not reflect sales charges. Lipper rankings are based on total return at net asset value relative to other funds that have similar current investment styles or objectives as determined by Lipper. Lipper may change a fund’s category assignment at its discretion. Lipper category averages reflect performance trends for funds within a category.
14
Other information for shareholders
Important notice regarding delivery of shareholder documents
In accordance with SEC regulations, Putnam sends a single copy of annual and semiannual shareholder reports, prospectuses, and proxy statements to Putnam shareholders who share the same address, unless a shareholder requests otherwise. If you prefer to receive your own copy of these documents, please call Putnam at 1-800-225-1581, and Putnam will begin sending individual copies within 30 days.
Proxy voting
Putnam is committed to managing our mutual funds in the best interests of our shareholders. The Putnam funds’ proxy voting guidelines and procedures, as well as information regarding how your fund voted proxies relating to portfolio securities during the 12-month period ended June 30, 2010, are available in the Individual Investors section of putnam.com, and on the SEC’s Web site, www.sec.gov. If you have questions about finding forms on the SEC’s Web site, you may call the SEC at 1-800-SEC-0330. You may also obtain the Putnam funds’ proxy voting guidelines and procedures at no charge by calling Putnam’s Shareholder Services at 1-800-225-1581.
Fund portfolio holdings
The fund will file a complete schedule of its portfolio holdings with the SEC for the first and third quarters of each fiscal year on Form N-Q. Shareholders may obtain the fund’s Forms N-Q on the SEC’s Web site at www.sec.gov. In addition, the fund’s Forms N-Q may be reviewed and copied at the SEC’s Public Reference Room in Washington, D.C. You may call the SEC at 1-800-SEC-0330 for information about the SEC’s Web site or the operation of the Public Reference Room.
Trustee and employee fund ownership
Putnam employees and members of the Board of Trustees place their faith, confidence, and, most importantly, investment dollars in Putnam mutual funds. As of January 31, 2011, Putnam employees had approximately $352,000,000 and the Trustees had approximately $68,000,000 invested in Putnam mutual funds. These amounts include investments by the Trustees’ and employees’ immediate family members as well as investments through retirement and deferred compensation plans.
15
Financial statements
A guide to financial statements
These sections of the report, as well as the accompanying Notes, constitute the fund’s financial statements.
The fund’s portfolio lists all the fund’s investments and their values as of the last day of the reporting period. Holdings are organized by asset type and industry sector, country, or state to show areas of concentration and diversification.
Statement of assets and liabilities shows how the fund’s net assets and share price are determined. All investment and non-investment assets are added together. Any unpaid expenses and other liabilities are subtracted from this total. The result is divided by the number of shares to determine the net asset value per share, which is calculated separately for each class of shares. (For funds with preferred shares, the amount subtracted from total assets includes the liquidation preference of preferred shares.)
Statement of operations shows the fund’s net investment gain or loss. This is done by first adding up all the fund’s earnings — from dividends and interest income — and subtracting its operating expenses to determine net investment income (or loss). Then, any net gain or loss the fund realized on the sales of its holdings — as well as any unrealized gains or losses over the period — is added to or subtracted from the net investment result to determine the fund’s net gain or loss for the fiscal period.
Statement of changes in net assets shows how the fund’s net assets were affected by the fund’s net investment gain or loss, by distributions to shareholders, and by changes in the number of the fund’s shares. It lists distributions and their sources (net investment income or realized capital gains) over the current reporting period and the most recent fiscal year-end. The distributions listed here may not match the sources listed in the Statement of operations because the distributions are determined on a tax basis and may be paid in a different period from the one in which they were earned. Dividend sources are estimated at the time of declaration. Actual results may vary. Any non-taxable return of capital cannot be determined until final tax calculations are completed after the end of the fund’s fiscal year.
Financial highlights provide an overview of the fund’s investment results, per-share distributions, expense ratios, net investment income ratios, and portfolio turnover in one summary table, reflecting the five most recent reporting periods. In a semiannual report, the highlights table also includes the current reporting period.
16
The fund’s portfolio 1/31/11 (Unaudited)
| | |
| COMMON STOCKS (90.9%)* | Shares | Value |
|
| Advertising and marketing services (0.2%) | | |
| Focus Media Holding, Ltd. ADR (China) † | 420,800 | $10,482,128 |
|
| | | 10,482,128 |
| Aerospace and defense (3.0%) | | |
| L-3 Communications Holdings, Inc. | 538,800 | 42,161,100 |
|
| Northrop Grumman Corp. | 165,400 | 11,462,220 |
|
| Precision Castparts Corp. | 384,000 | 54,908,160 |
|
| Raytheon Co. | 221,284 | 11,061,987 |
|
| Safran SA (France) | 588,456 | 21,265,839 |
|
| United Technologies Corp. | 87,100 | 7,081,230 |
|
| | | 147,940,536 |
| Automotive (2.6%) | | |
| Dongfeng Motor Group Co., Ltd. (China) | 970,000 | 1,704,388 |
|
| Fiat Industrial SpA (Italy) † | 694,330 | 9,399,154 |
|
| Fiat SpA (Italy) | 2,140,986 | 20,846,125 |
|
| Ford Motor Co. † S | 1,244,100 | 19,843,395 |
|
| General Motors Co. † | 133,600 | 4,875,064 |
|
| Nissan Motor Co., Ltd. (Japan) | 3,351,100 | 33,825,835 |
|
| Tata Motors, Ltd. (India) | 371,857 | 9,265,726 |
|
| Visteon Corp. 144A † | 321,062 | 22,551,395 |
|
| Volkswagen AG (Preference) (Germany) | 38,330 | 6,189,908 |
|
| | | 128,500,990 |
| Banking (2.3%) | | |
| Bond Street Holdings, LLC 144A Class A † F | 167,181 | 3,418,851 |
|
| JPMorgan Chase & Co. | 553,800 | 24,887,772 |
|
| State Street Corp. | 988,703 | 46,192,204 |
|
| Wells Fargo & Co. | 1,212,400 | 39,306,008 |
|
| | | 113,804,835 |
| Biotechnology (3.4%) | | |
| Amarin Corp. PLC ADR (United Kingdom) † | 535,000 | 4,750,800 |
|
| Auxilium Pharmaceuticals, Inc. † S | 926,900 | 21,031,361 |
|
| Celgene Corp. † | 1,259,800 | 64,917,494 |
|
| Dendreon Corp. † | 988,675 | 34,643,172 |
|
| Human Genome Sciences, Inc. † | 850,400 | 20,630,704 |
|
| Ironwood Pharmaceuticals, Inc. † | 759,300 | 8,192,847 |
|
| Sequenom, Inc. † S | 1,279,199 | 8,762,513 |
|
| | | 162,928,891 |
| Broadcasting (0.4%) | | |
| Liberty Media Corp. — Capital Ser. A † | 270,985 | 17,792,875 |
|
| Sirius XM Radio, Inc. † S | 744,435 | 1,202,263 |
|
| | | 18,995,138 |
| Building materials (0.3%) | | |
| Owens Corning, Inc. † | 463,500 | 15,513,345 |
|
| | | 15,513,345 |
| Cable television (1.6%) | | |
| Comcast Corp. Class A | 1,217,638 | 27,701,265 |
|
| DIRECTV Class A † | 1,134,669 | 48,098,619 |
|
| | | 75,799,884 |
| Chemicals (1.2%) | | |
| CF Industries Holdings, Inc. | 123,100 | 16,623,424 |
|
| Dow Chemical Co. (The) | 393,600 | 13,964,928 |
|
17
| | |
| COMMON STOCKS (90.9%)* cont. | Shares | Value |
|
| Chemicals cont. | | |
| Huabao International Holdings, Ltd. (China) | 6,196,000 | $9,167,261 |
|
| Mosaic Co. (The) | 60,200 | 4,878,608 |
|
| Potash Corp. of Saskatchewan, Inc. (Canada) | 42,400 | 7,537,872 |
|
| Syngenta AG (Switzerland) | 22,462 | 7,245,784 |
|
| | | 59,417,877 |
| Commercial and consumer services (1.5%) | | |
| Green Dot Corp. Class A † S | 69,800 | 4,391,118 |
|
| Mastercard, Inc. Class A | 83,700 | 19,795,887 |
|
| Priceline.com, Inc. † S | 65,200 | 27,939,504 |
|
| Visa, Inc. Class A S | 277,300 | 19,369,405 |
|
| | | 71,495,914 |
| Communications equipment (6.4%) | | |
| Cisco Systems, Inc. † | 4,994,120 | 105,625,638 |
|
| Corning, Inc. | 1,522,800 | 33,821,388 |
|
| Harris Corp. | 619,453 | 28,829,343 |
|
| Qualcomm, Inc. | 2,610,309 | 141,296,026 |
|
| | | 309,572,395 |
| Computers (12.0%) | | |
| Apple, Inc. † | 821,600 | 278,785,309 |
|
| EMC Corp. † | 1,039,100 | 25,863,199 |
|
| Fujitsu, Ltd. (Japan) | 2,343,000 | 14,573,228 |
|
| Hewlett-Packard Co. | 3,550,900 | 162,240,621 |
|
| Polycom, Inc. † | 681,800 | 29,896,930 |
|
| Seagate Technology † | 1,777,123 | 24,879,722 |
|
| SXC Health Solutions Corp. (Canada) † | 204,355 | 9,831,519 |
|
| Western Digital Corp. † | 873,900 | 29,730,078 |
|
| Xerox Corp. | 880,500 | 9,350,910 |
|
| | | 585,151,516 |
| Conglomerates (2.4%) | | |
| General Electric Co. | 2,709,300 | 54,565,302 |
|
| Honeywell International, Inc. | 176,000 | 9,857,760 |
|
| Mitsui & Co., Ltd. (Japan) | 568,000 | 9,534,138 |
|
| Tyco International, Ltd. | 966,400 | 43,323,712 |
|
| | | 117,280,912 |
| Consumer (0.2%) | | |
| Stanley Black & Decker, Inc. | 105,900 | 7,696,812 |
|
| | | 7,696,812 |
| Consumer finance (0.1%) | | |
| Air Lease Corp. 144A | 197,533 | 4,049,427 |
|
| | | 4,049,427 |
| Consumer goods (0.7%) | | |
| Colgate-Palmolive Co. | 127,200 | 9,765,144 |
|
| hhgregg, Inc. † S | 840,131 | 15,399,601 |
|
| Procter & Gamble Co. (The) | 142,300 | 8,983,399 |
|
| | | 34,148,144 |
| Consumer services (0.4%) | | |
| WebMD Health Corp. † | 354,500 | 18,533,260 |
|
| | | 18,533,260 |
| Electric utilities (0.2%) | | |
| EnerNOC, Inc. † S | 408,642 | 10,632,865 |
|
| | | 10,632,865 |
18
| | |
| COMMON STOCKS (90.9%)* cont. | Shares | Value |
|
| Electrical equipment (0.8%) | | |
| Emerson Electric Co. | 83,300 | $4,904,704 |
|
| GrafTech International, Ltd. † | 473,900 | 9,951,900 |
|
| Mitsubishi Electric Corp. (Japan) | 1,968,000 | 21,681,238 |
|
| | | 36,537,842 |
| Electronics (3.4%) | | |
| Intel Corp. | 215,800 | 4,631,068 |
|
| Jabil Circuit, Inc. | 274,000 | 5,537,540 |
|
| Kyocera Corp. (Japan) | 92,300 | 9,587,450 |
|
| Marvell Technology Group, Ltd. † | 4,343,600 | 82,571,836 |
|
| Micron Technology, Inc. † | 581,573 | 6,129,779 |
|
| SanDisk Corp. † | 897,000 | 40,696,890 |
|
| Texas Instruments, Inc. | 420,700 | 14,265,937 |
|
| | | 163,420,500 |
| Energy (oil field) (3.5%) | | |
| National Oilwell Varco, Inc. | 706,300 | 52,195,570 |
|
| Schlumberger, Ltd. | 766,987 | 68,254,173 |
|
| Weatherford International, Ltd. (Switzerland) † | 2,139,500 | 50,748,940 |
|
| | | 171,198,683 |
| Energy (other) (1.9%) | | |
| First Solar, Inc. † S | 602,843 | 93,187,471 |
|
| | | 93,187,471 |
| Financial (0.8%) | | |
| CME Group, Inc. | 22,600 | 6,973,456 |
|
| Criteria Caixacorp SA (Spain) | 806,074 | 5,562,874 |
|
| KKR & Co. LP | 1,874,313 | 28,095,952 |
|
| | | 40,632,282 |
| Food (0.2%) | | |
| Global Bio-Chem Technology Group Co., Ltd. (China) † | 50,324,000 | 8,180,369 |
|
| | | 8,180,369 |
| Forest products and packaging (0.4%) | | |
| International Paper Co. | 637,200 | 18,402,336 |
|
| | | 18,402,336 |
| Health-care services (2.0%) | | |
| Aetna, Inc. | 1,178,100 | 38,806,614 |
|
| Alapis Hldg. Industrial and Commercial SA of Pharmaceutical | | |
| Chemical Products (Greece) | 3,406,504 | 2,472,909 |
|
| AmerisourceBergen Corp. | 195,700 | 7,017,802 |
|
| Express Scripts, Inc. † | 461,776 | 26,011,842 |
|
| Lincare Holdings, Inc. S | 380,400 | 10,289,820 |
|
| WellPoint, Inc. † | 230,200 | 14,300,024 |
|
| | | 98,899,011 |
| Homebuilding (0.2%) | | |
| Lennar Corp. S | 293,100 | 5,674,416 |
|
| M.D.C. Holdings, Inc. S | 159,800 | 4,939,418 |
|
| | | 10,613,834 |
| Industrial (0.2%) | | |
| China Ming Yang Wind Power Group, Ltd. ADS (China) † S | 815,137 | 7,523,715 |
|
| | | 7,523,715 |
| Insurance (4.2%) | | |
| Aflac, Inc. | 1,103,846 | 63,559,453 |
|
| Assured Guaranty, Ltd. (Bermuda) | 4,394,423 | 63,543,357 |
|
| Hartford Financial Services Group, Inc. (The) | 2,712,176 | 75,344,249 |
|
| | | 202,447,059 |
19
| | |
| COMMON STOCKS (90.9%)* cont. | Shares | Value |
|
| Investment banking/Brokerage (0.8%) | | |
| Blackstone Group LP (The) | 1,056,863 | $16,624,455 |
|
| Goldman Sachs Group, Inc. (The) | 111,951 | 18,317,423 |
|
| Morgan Stanley | 169,300 | 4,977,420 |
|
| | | 39,919,298 |
| Leisure (0.1%) | | |
| Brunswick Corp. S | 215,079 | 4,284,374 |
|
| | | 4,284,374 |
| Machinery (1.0%) | | |
| Cummins, Inc. | 96,600 | 10,228,008 |
|
| Parker Hannifin Corp. | 421,100 | 37,650,551 |
|
| | | 47,878,559 |
| Manufacturing (1.2%) | | |
| Illinois Tool Works, Inc. | 300,100 | 16,052,349 |
|
| Ingersoll-Rand PLC S | 919,600 | 43,405,120 |
|
| | | 59,457,469 |
| Media (0.3%) | | |
| Walt Disney Co. (The) | 358,100 | 13,919,347 |
|
| | | 13,919,347 |
| Medical technology (2.3%) | | |
| Baxter International, Inc. | 892,200 | 43,262,778 |
|
| China Medical Technologies, Inc. ADR (China) † S | 932,200 | 11,447,416 |
|
| Covidien PLC (Ireland) | 457,045 | 21,695,926 |
|
| Medtronic, Inc. | 203,500 | 7,798,120 |
|
| Thermo Fisher Scientific, Inc. † | 452,900 | 25,937,583 |
|
| | | 110,141,823 |
| Metals (3.3%) | | |
| Freeport-McMoRan Copper & Gold, Inc. Class B | 34,360 | 3,736,650 |
|
| Newcrest Mining, Ltd. (Australia) | 223,960 | 8,383,864 |
|
| Nucor Corp. S | 533,700 | 24,502,167 |
|
| Rio Tinto PLC (United Kingdom) | 213,201 | 14,724,960 |
|
| Teck Resources, Ltd. Class B (Canada) | 496,700 | 30,088,749 |
|
| Vedanta Resources PLC (United Kingdom) S | 2,103,062 | 76,692,514 |
|
| | | 158,128,904 |
| Oil and gas (5.0%) | | |
| Apache Corp. | 156,020 | 18,622,547 |
|
| Cairn Energy PLC (United Kingdom) † | 4,083,605 | 27,138,552 |
|
| Chevron Corp. | 318,900 | 30,273,177 |
|
| Occidental Petroleum Corp. | 415,300 | 40,151,204 |
|
| Petrohawk Energy Corp. † | 1,788,113 | 35,851,666 |
|
| Petroleo Brasileiro SA ADR (Brazil) S | 1,193,800 | 43,848,274 |
|
| Southwestern Energy Co. † S | 1,164,400 | 45,993,800 |
|
| | | 241,879,220 |
| Pharmaceuticals (2.5%) | | |
| Abbott Laboratories | 414,600 | 18,723,336 |
|
| Pfizer, Inc. | 1,936,932 | 35,290,901 |
|
| Sanofi-Aventis (France) | 348,811 | 23,801,999 |
|
| Teva Pharmaceutical Industries, Ltd. ADR (Israel) | 825,986 | 45,140,135 |
|
| | | 122,956,371 |
| Power producers (0.2%) | | |
| China Power New Energy Development Co., Ltd. (China) † | 44,092,000 | 4,086,807 |
|
| China WindPower Group, Ltd. (China) † | 35,310,000 | 3,402,424 |
|
| | | 7,489,231 |
20
| | |
| COMMON STOCKS (90.9%)* cont. | Shares | Value |
|
| Publishing (0.5%) | | |
| Gannett Co., Inc. S | 1,766,100 | $26,032,314 |
|
| | | 26,032,314 |
| Regional Bells (0.1%) | | |
| Verizon Communications, Inc. | 135,200 | 4,815,824 |
|
| | | 4,815,824 |
| Restaurants (0.6%) | | |
| Starbucks Corp. | 945,500 | 29,811,615 |
|
| | | 29,811,615 |
| Retail (5.8%) | | |
| Bed Bath & Beyond, Inc. † | 321,500 | 15,432,000 |
|
| Best Buy Co., Inc. | 999,699 | 33,989,766 |
|
| CVS Caremark Corp. | 255,271 | 8,730,268 |
|
| Kohl’s Corp. † | 566,900 | 28,787,182 |
|
| Lowe’s Cos., Inc. | 3,262,500 | 80,910,000 |
|
| Office Depot, Inc. † | 4,994,881 | 26,223,125 |
|
| OfficeMax, Inc. † | 572,348 | 9,197,632 |
|
| Staples, Inc. | 1,189,400 | 26,535,514 |
|
| Target Corp. | 529,500 | 29,032,485 |
|
| Urban Outfitters, Inc. † | 672,600 | 22,747,332 |
|
| | | 281,585,304 |
| Schools (0.8%) | | |
| Apollo Group, Inc. Class A † | 890,029 | 36,731,497 |
|
| | | 36,731,497 |
| Semiconductor (0.3%) | | |
| Novellus Systems, Inc. † | 418,400 | 15,091,688 |
|
| | | 15,091,688 |
| Shipping (0.1%) | | |
| Swift Transporation Co. † S | 357,600 | 5,110,104 |
|
| | | 5,110,104 |
| Software (2.1%) | | |
| Adobe Systems, Inc. † | 148,200 | 4,898,010 |
|
| Longtop Financial Technologies Ltd. ADR (Hong Kong) † S | 178,300 | 5,866,070 |
|
| Microsoft Corp. | 2,057,600 | 57,046,960 |
|
| Oracle Corp. | 960,400 | 30,761,612 |
|
| VMware, Inc. Class A † | 50,100 | 4,284,552 |
|
| | | 102,857,204 |
| Technology (0.1%) | | |
| Tech Data Corp. † | 95,600 | 4,484,596 |
|
| | | 4,484,596 |
| Technology services (3.9%) | | |
| Google, Inc. Class A † | 178,936 | 107,426,017 |
|
| Unisys Corp. † § S | 2,457,125 | 69,610,351 |
|
| VeriSign, Inc. S | 427,000 | 14,368,550 |
|
| | | 191,404,918 |
| Telecommunications (0.5%) | | |
| Iridium Communications, Inc. † S | 927,367 | 7,122,179 |
|
| Sprint Nextel Corp. † S | 3,204,725 | 14,485,357 |
|
| Sycamore Networks, Inc. | 210,400 | 4,388,944 |
|
| | | 25,996,480 |
| Textiles (0.6%) | | |
| Hanesbrands, Inc. † | 1,259,200 | 28,986,784 |
|
| | | 28,986,784 |
21
| | |
| COMMON STOCKS (90.9%)* cont. | Shares | Value |
|
| Tobacco (1.6%) | | |
| Philip Morris International, Inc. | 1,383,069 | $79,166,870 |
|
| | | 79,166,870 |
| Toys (0.2%) | | |
| Hasbro, Inc. | 215,400 | 9,496,986 |
|
| | | 9,496,986 |
| Trucks and parts (0.5%) | | |
| ArvinMeritor, Inc. † S | 1,148,919 | 25,115,369 |
|
| | | 25,115,369 |
| | | |
| Total common stocks (cost $4,006,852,706) | | $4,415,730,120 |
| | | |
| | | | |
| WARRANTS (2.2%)* † | Expiration | Strike | | |
| | date | price | Warrants | Value |
|
| Bank of America Corp. W | 10/28/18 | $30.79 | 7,722,843 | $20,079,392 |
|
| Citigroup, Inc. | 1/04/19 | 10.61 | 3,249,058 | 3,216,567 |
|
| Hartford Financial Services Group, Inc. (The) W | 6/26/19 | 9.79 | 571,000 | 10,974,620 |
|
| JPMorgan Chase & Co. W | 10/28/18 | 42.42 | 3,077,686 | 44,934,216 |
|
| Visteon Corp. F | 10/01/10 | 9.66 | 20,310 | 1,230,380 |
|
| Wells Fargo & Co. W | 10/28/18 | 34.01 | 2,711,400 | 28,822,182 |
|
| Total warrants (cost $92,278,516) | | | | $109,257,357 |
| | | |
| | | | |
| PURCHASED OPTIONS | Expiration date/ | | Contract | |
| OUTSTANDING (0.8%)* | strike price | | amount | Value |
|
| CurrencyShares Euro Trust (Put) | Feb-11/$122.00 | | 3,573,843 | $143,704 |
|
| CurrencyShares Euro Trust (Put) | Feb-11/125.00 | | 3,068,940 | 220,442 |
|
| General Electric Co. (Call) | Apr-11/22.00 | | 6,956,178 | 1,669,483 |
|
| Hewlett-Packard Co. (Call) | May-11/46.00 | | 5,969,971 | 13,310,349 |
|
| JPMorgan Chase & Co. (Call) | Jan-12/45.00 | | 738,710 | 3,396,005 |
|
| SPDR S&P ETF 500 Trust (Put) | Feb-11/127.00 | | 3,780,963 | 4,814,414 |
|
| SPDR S&P ETF 500 Trust (Put) | Feb-11/129.00 | | 588,496 | 1,159,049 |
|
| TiVo, Inc. (Call) | Feb-11/15.00 | | 3,744,985 | 259,340 |
|
| TOPIX Index (Call) | Jun-11/JPY 995.39 | | JPY 23,507,653 | 2,127,340 |
|
| WellPoint, Inc. (Call) | Jun-11/$60.00 | | 2,355,328 | 12,247,706 |
|
| Total purchased options outstanding (cost $29,646,080) | | | $39,347,832 |
| | | | |
| | |
| INVESTMENT COMPANIES (0.7%)* | Shares | Value |
|
| Market Vectors Gold Miners ETF S | 248,300 | $13,696,228 |
|
| SPDR S&P Homebuilders ETF S | 1,172,300 | 20,737,987 |
|
| Total investment companies (cost $31,364,115) | | $34,434,215 |
| |
| |
| U.S. TREASURY OBLIGATIONS (0.3%)* | Principal amount | Value |
|
| U.S. Treasury Inflation Protected Securities | | |
| 2 1/2s, July 15, 2016 i | $4,568,613 | $5,199,996 |
| 2s, July 15, 2014 i | 5,776,903 | 6,320,452 |
|
| U.S. Treasury Notes | | |
| 3 1/4s, December 31, 2016 i | 1,700,000 | 1,789,947 |
| 2 3/4s, February 15, 2019 i | 246,000 | 245,702 |
| 1 3/8s, September 15, 2012 i | 2,793,000 | 2,848,022 |
|
| Total U.S. treasury obligations (cost $16,404,119) | | $16,404,119 |
22
| | |
| SHORT-TERM INVESTMENTS (14.6%)* | Principal amount/shares | Value |
|
| U.S. Treasury Bills for an effective yield of 0.24%, | | |
| July 28, 2011 ## | $3,700,000 | $3,695,371 |
|
| U.S. Treasury Bills for an effective yield of 0.20%, | | |
| June 2, 2011 ## | 409,000 | 408,629 |
|
| U.S. Treasury Bills zero %, August 25, 2011 i | 1,450,000 | 1,448,695 |
|
| Putnam Cash Collateral Pool, LLC 0.20% d | 415,665,058 | 415,665,058 |
|
| Putnam Money Market Liquidity Fund 0.17% e | 280,546,078 | 280,546,078 |
|
| SSgA Prime Money Market Fund 0.14% i P | 8,810,000 | 8,810,000 |
|
| Total short-term investments (cost $710,574,228) | | $710,573,831 |
|
| |
| TOTAL INVESTMENTS | | |
|
| Total investments (cost $4,887,119,764) | | $5,325,747,474 |
| |
| Key to holding’s currency abbreviations |
| |
| JPY | Japanese Yen |
| | |
| Key to holding’s abbreviations |
| |
| ADR | American Depository Receipts |
| ADS | American Depository Shares |
| ETF | Exchange Traded Fund |
| SPDR | S&P 500 Index Depository Receipts |
Notes to the fund’s portfolio
Unless noted otherwise, the notes to the fund’s portfolio are for the close of the fund’s reporting period, which ran from August 1, 2010 through January 31, 2011 (the reporting period).
* Percentages indicated are based on net assets of $4,859,541,160.
† Non-income-producing security.
§ Affilated Companies (Note 7).
## These securities, in part or in entirety, were pledged and segregated with the custodian for collateral on certain derivatives contracts at the close of the reporting period.
d See Note 1 to the financial statements regarding securities lending. The rate quoted in the security description is the annualized 7-day yield of the fund at the close of the reporting period.
e See Note 6 to the financial statements regarding investments in Putnam Money Market Liquidity Fund. The rate quoted in the security description is the annualized 7-day yield of the fund at the close of the reporting period.
F Is valued at fair value following procedures approved by the Trustees. Securities may be classified as Level 2 or Level 3 for Accounting Standards Codification ASC 820 Fair Value Measurements and Disclosures (ASC 820) based on the securities’ valuation inputs. At the close of the reporting period, fair value pricing was also used for certain foreign securities in the portfolio (Note 1).
i Securities purchased with cash or securities received, that were pledged to the fund for collateral on certain derivatives contracts (Note 1).
P The rate quoted in the security description is the annualized 7-day yield of the fund at the close of the reporting period.
S Securities on loan, in part or in entirety, at the close of the reporting period.
W Warrants issued to the U.S. Treasury under the Troubled Asset Relief Program (TARP).
At the close of the reporting period, the fund maintained liquid assets totaling $6,166,119 to cover certain derivatives contracts.
144A after the name of an issuer represents securities exempt from registration under Rule 144A under the Securities Act of 1933, as amended. These securities may be resold in transactions exempt from registration, normally to qualified institutional buyers.
23
ADR or ADS after the name of a foreign holding represents ownership of foreign securities on deposit with custodian bank.
The dates shown on debt obligations are the original maturity dates.
FORWARD CURRENCY CONTRACTS at 1/31/11 (aggregate face value $285,681,909) (Unaudited)
| | | | | | |
| | | | | | Unrealized |
| | | Contract | Delivery | | Aggregate | appreciation/ |
| Counterparty | Currency | type | date | Value | face value | (depreciation) |
|
| Credit Suisse AG | | | | | | |
|
| Euro | Sell | 2/16/11 | $76,241,194 | $74,270,296 | $(1,970,898) |
|
| Japanese Yen | Sell | 2/16/11 | 93,627,406 | 93,966,606 | 339,200 |
|
| UBS AG | | | | | | |
|
| | British Pound | Sell | 2/16/11 | 121,495,528 | 117,445,007 | (4,050,521) |
|
| Total | | | | | | $(5,682,219) |
| | | | |
WRITTEN OPTIONS OUTSTANDING at 1/31/11 (premiums received $12,129,312) (Unaudited)
| | | | | |
| | | Contract | | Expiration date/ | |
| | | amount | | strike price | Value |
|
| CurrencyShares Euro Trust (Put) | | 3,573,843 | | Feb-11/$120.00 | $357,384 |
|
| CurrencyShares Euro Trust (Put) | | 3,068,941 | | Feb-11/123.00 | 147,248 |
|
| Hewlett-Packard Co. (Call) | | 5,969,971 | | May-11/50.00 | 4,663,101 |
|
| SPDR S&P 500 ETF Trust (Put) | | 3,780,963 | | Feb-11/125.00 | 3,257,640 |
|
| SPDR S&P 500 ETF Trust (Put) | | 588,496 | | Feb-11/124.00 | 424,488 |
|
| TiVo, Inc. (Call) | | 3,744,985 | | Feb-11/17.50 | 117,705 |
|
| TOPIX Index (Call) | JPY | 23,507,653 | | Jun-11/JPY 1,040.64 | 758,585 |
|
| WellPoint, Inc. (Call) | | 2,355,328 | | Jun-11/$65.00 | 6,406,493 |
|
| Total | | | | | $16,132,644 |
| | | |
TOTAL RETURN SWAP CONTRACTS OUTSTANDING at 1/31/11 (Unaudited)
| | | | | | | |
| | | Upfront | | | Fixed payments | Total return | Unrealized |
| Swap counterparty / | premium | Termination | | received (paid) by | received by | appreciation/ |
| Notional amount | received (paid) | date | | fund per annum | or paid by fund | (depreciation) |
|
| Citibank, N.A. | | | | | | | |
| baskets | 1,214,697 | $— | 1/24/12 | | (3 month USD- | A basket | $2,545,105 |
| | | | | | LIBOR-BBA plus | (CGPUTTR1) | |
| | | | | | 0.15 bp) | of common stocks | |
|
| Goldman Sachs International | | | | | |
| baskets | 132,455 | — | 12/21/11 | | (1 month USD- | A basket | (342,093) |
| | | | | | LIBOR-BBA plus | (GSCBPBAT) | |
| | | | | | 35 bp) | of common stocks | |
|
| Total | | | | | | | $2,203,012 |
24
ASC 820 establishes a three-level hierarchy for disclosure of fair value measurements. The valuation hierarchy is based upon the transparency of inputs to the valuation of the fund’s investments. The three levels are defined as follows:
Level 1 — Valuations based on quoted prices for identical securities in active markets.
Level 2 — Valuations based on quoted prices in markets that are not active or for which all significant inputs are observable, either directly or indirectly.
Level 3 — Valuations based on inputs that are unobservable and significant to the fair value measurement.
The following is a summary of the inputs used to value the fund’s net assets as of the close of the reporting period:
| | | |
| | | Valuation inputs | |
|
| Investments in securities: | Level 1 | Level 2 | Level 3 |
|
| Common stocks: | | | |
|
| Basic materials | $119,734,734 | $116,214,383 | $— |
|
| Capital goods | 281,506,413 | 42,947,077 | — |
|
| Communication services | 106,612,188 | — | — |
|
| Conglomerates | 107,746,774 | 9,534,138 | — |
|
| Consumer cyclicals | 515,090,471 | 103,782,531 | — |
|
| Consumer staples | 207,121,654 | 8,180,369 | — |
|
| Energy | 479,126,822 | 27,138,552 | — |
|
| Financials | 387,821,749 | 9,612,301 | 3,418,851 |
|
| Health care | 468,651,188 | 26,274,908 | — |
|
| Technology | 1,347,822,139 | 24,160,678 | — |
|
| Transportation | 5,110,104 | — | — |
|
| Utilities and power | 10,632,865 | 7,489,231 | — |
|
| Total common stocks | 4,036,977,101 | 375,334,168 | 3,418,851 |
| | | |
| Investment Companies | 34,434,215 | — | — |
|
| Purchased options outstanding | — | 39,347,832 | — |
|
| U.S. Treasury Obligations | — | 16,404,119 | — |
|
| Warrants | 108,026,977 | — | 1,230,380 |
|
| Short-term investments | 289,356,078 | 421,217,753 | — |
|
| Totals by level | $4,468,794,371 | $852,303,872 | $4,649,231 |
| | | | |
| | | Valuation inputs | |
|
| Other financial instruments: | Level 1 | Level 2 | Level 3 |
|
| Forward currency contracts | $— | $(5,682,219) | $— |
|
| Written options | — | (16,132,644) | — |
|
| Total return swap contracts | — | 2,203,012 | — |
|
| Totals by level | $— | $(19,611,851) | $— |
At the start and close of the reporting period, Level 3 investments in securities and other financial instruments were not considered a significant portion of the fund’s portfolio.
The accompanying notes are an integral part of these financial statements.
25
Statement of assets and liabilities 1/31/11 (Unaudited)
| |
| ASSETS | |
|
| Investment in securities, at value, including $410,455,215 of securities on loan (Note 1): | |
| Unaffiliated issuers (identified cost $4,128,859,892) | $4,559,925,987 |
| Affiliated issuers (identified cost $758,259,872) (Notes 1, 6 and 7) | 765,821,487 |
|
| Cash | 3,544,877 |
|
| Foreign currency (cost $42) (Note 1) | 47 |
|
| Dividends, interest and other receivables | 4,286,904 |
|
| Receivable for shares of the fund sold | 46,880,772 |
|
| Receivable for investments sold | 134,652,207 |
|
| Unrealized appreciation on swap contracts (Note 1) | 2,545,105 |
|
| Unrealized appreciation on forward currency contracts (Note 1) | 339,200 |
|
| Total assets | 5,517,996,586 |
| |
| LIABILITIES | |
|
| Payable for investments purchased | 181,149,048 |
|
| Payable for shares of the fund repurchased | 5,985,366 |
|
| Payable for compensation of Manager (Note 2) | 2,666,307 |
|
| Payable for investor servicing fees (Note 2) | 1,128,149 |
|
| Payable for custodian fees (Note 2) | 42,031 |
|
| Payable for Trustee compensation and expenses (Note 2) | 1,089,196 |
|
| Payable for administrative services (Note 2) | 8,358 |
|
| Payable for distribution fees (Note 2) | 1,159,597 |
|
| Unrealized depreciation on forward currency contracts (Note 1) | 6,021,419 |
|
| Written options outstanding, at value (premiums received $12,129,312) (Notes 1 and 3) | 16,132,644 |
|
| Unrealized depreciation on swap contracts (Note 1) | 342,093 |
|
| Collateral on securities loaned, at value (Note 1) | 415,665,058 |
|
| Collateral on certain derivative contracts, at value (Note 1) | 26,662,814 |
|
| Other accrued expenses | 403,346 |
|
| Total liabilities | 658,455,426 |
| |
| Net assets | $4,859,541,160 |
|
| |
| REPRESENTED BY | |
|
| Paid-in capital (Unlimited shares authorized) (Notes 1 and 4) | $6,374,326,949 |
|
| Distributions in excess of net investment income (Note 1) | (3,848,046) |
|
| Accumulated net realized loss on investments and foreign currency transactions (Note 1) | (1,942,097,622) |
|
| Net unrealized appreciation of investments and assets and liabilities in foreign currencies | 431,159,879 |
|
| Total — Representing net assets applicable to capital shares outstanding | $4,859,541,160 |
| |
| (Continued on next page) | |
26
Statement of assets and liabilities (Continued)
| |
| COMPUTATION OF NET ASSET VALUE AND OFFERING PRICE | |
|
| Net asset value and redemption price per class A share | |
| ($3,912,358,741 divided by 160,899,153 shares) | $24.32 |
|
| Offering price per class A share (100/94.25 of $24.32)* | $25.80 |
|
| Net asset value and offering price per class B share ($191,824,343 divided by 9,287,867 shares)** | $20.65 |
|
| Net asset value and offering price per class C share ($182,300,061 divided by 8,049,502 shares)** | $22.65 |
|
| Net asset value and redemption price per class M share ($33,722,943 divided by 1,499,492 shares) | $22.49 |
|
| Offering price per class M share (100/96.50 of $22.49)* | $23.31 |
|
| Net asset value, offering price and redemption price per class R share | |
| ($12,621,780 divided by 527,627 shares) | $23.92 |
|
| Net asset value, offering price and redemption price per class Y share | |
| ($526,713,292 divided by 20,801,683 shares) | $25.32 |
|
* On single retail sales of less than $50,000. On sales of $50,000 or more the offering price is reduced.
** Redemption price per share is equal to net asset value less any applicable contingent deferred sales charge.
The accompanying notes are an integral part of these financial statements.
27
Statement of operations Six months ended 1/31/11 (Unaudited)
| |
| INVESTMENT INCOME | |
|
| Dividends (net of foreign tax of $282,382) | $22,837,712 |
|
| Interest (including interest income of $53,832 from investments in affiliated issuers) (Note 6) | 1,108,814 |
|
| Securities lending (Note 1) | 759,554 |
|
| Total investment income | 24,706,080 |
|
| |
| EXPENSES | |
|
| Compensation of Manager (Note 2) | 12,179,570 |
|
| Investor servicing fees (Note 2) | 7,068,311 |
|
| Custodian fees (Note 2) | 50,026 |
|
| Trustee compensation and expenses (Note 2) | 215,185 |
|
| Administrative services (Note 2) | 58,273 |
|
| Distribution fees — Class A (Note 2) | 4,346,392 |
|
| Distribution fees — Class B (Note 2) | 929,168 |
|
| Distribution fees — Class C (Note 2) | 605,397 |
|
| Distribution fees — Class M (Note 2) | 117,917 |
|
| Distribution fees — Class R (Note 2) | 19,714 |
|
| Other | 622,671 |
|
| Total expenses | 26,212,624 |
| | |
| Expense reduction (Note 2) | (11,049) |
|
| Net expenses | 26,201,575 |
| |
| Net investment loss | (1,495,495) |
|
| |
| Net realized gain on investments (including realized gain of $2,602,842 | |
| on affiliated issuers) (Notes 1, 3 and 7) | 289,742,710 |
|
| Net realized gain on swap contracts (Note 1) | 466,477 |
|
| Net realized loss on foreign currency transactions (Note 1) | (3,763,817) |
|
| Net realized gain on written options (Notes 1 and 3) | 73,730,998 |
|
| Net unrealized depreciation of assets and liabilities in foreign currencies during the period | (4,220,274) |
|
| Net unrealized appreciation of investments, swap contracts and written options | |
| during the period | 441,656,317 |
|
| Net gain on investments | 797,612,411 |
| |
| Net increase in net assets resulting from operations | $796,116,916 |
|
The accompanying notes are an integral part of these financial statements.
28
Statement of changes in net assets
| | |
| INCREASE IN NET ASSETS | Six months ended 1/31/11* | Year ended 7/31/10 |
|
| Operations: | | |
| Net investment loss | $(1,495,495) | $(2,614,860) |
|
| Net realized gain on investments | | |
| and foreign currency transactions | 360,176,368 | 968,585,018 |
|
| Net unrealized appreciation (depreciation) of investments | | |
| and assets and liabilities in foreign currencies | 437,436,043 | (337,724,559) |
|
| Net increase in net assets resulting from operations | 796,116,916 | 628,245,599 |
|
| Distributions to shareholders (Note 1): | | |
| From ordinary income | | |
| Net investment income | | |
|
| Class A | (13,010,997) | (29,854,006) |
|
| Class B | — | (1,013,327) |
|
| Class C | — | (328,745) |
|
| Class M | — | (183,395) |
|
| Class R | (24,298) | (23,854) |
|
| Class Y | (2,169,494) | (2,000,365) |
|
| Increase in capital from settlement payments | — | 8,472 |
|
| Redemption fees (Note 1) | 612 | 13,392 |
|
| Increase from capital share transactions (Note 4) | 349,805,128 | 12,864,933 |
|
| Total increase in net assets | 1,130,717,867 | 607,728,704 |
|
| |
| NET ASSETS | | |
|
| Beginning of period | 3,728,823,293 | 3,121,094,589 |
|
| End of period (including distributions in excess of | | |
| net investment income of $3,848,046 and undistributed | | |
| net investment income of $12,852,238, respectively) | $4,859,541,160 | $3,728,823,293 |
|
| * Unaudited | | |
The accompanying notes are an integral part of these financial statements.
29
Financial highlights (For a common share outstanding throughout the period)
| | | | | | | | | | | | | | |
| INVESTMENT OPERATIONS: | LESS DISTRIBUTIONS: | RATIOS AND SUPPLEMENTAL DATA: | |
|
| | | | | | | | | | | | | Ratio | Ratio | |
| | | | Net realized | | | | | | | | | of expenses | of net investment | |
| | Net asset value, | | and unrealized | Total from | From | | | | | Total return | Net assets, | to average | income (loss) | Portfolio |
| | beginning | Net investment | gain (loss) | investment | net investment | Total | Redemption | Non-recurring | Net asset value, | at net asset | end of period | net assets | to average | turnover |
| Period ended | of period | income (loss) a | on investments | operations | income | distributions | fees e | reimbursements | end of period | value (%) b | (in thousands) | (%) c | net assets (%) | (%) |
|
| Class A | | | | | | | | | | | | | | |
| January 31, 2011** | $20.12 | — e | 4.28 | 4.28 | (.08) | (.08) | — | — | $24.32 | 21.31 * | $3,912,359 | .61* | (.02)* | 89.24* |
| July 31, 2010 | 16.85 | — e | 3.46 | 3.46 | (.19) | (.19) | — | — e,f | 20.12 | 20.58 | 3,111,020 | 1.26 | (.03) | 177.37 |
| July 31, 2009 | 16.93 | .08 | (.16) h | (.08) | — | — | — | — e,i | 16.85 | (.47) h | 2,715,001 | 1.26 d | .61 d | 186.67 |
| July 31, 2008 | 18.54 | (.01) | (1.60) | (1.61) | — | — | — | — | 16.93 | (8.68) | 3,213,102 | 1.20 d | (.08) d | 67.79 |
| July 31, 2007 | 16.20 | (.06) | 2.40 | 2.34 | — | — | — | — | 18.54 | 14.44 | 4,790,506 | 1.14 d | (.33) d | 65.48 |
| July 31, 2006 | 17.16 | (.04) g | (.79) | (.83) | (.13) | (.13) | — | — | 16.20 | (4.93) g | 5,528,893 | 1.04 d,g | (.23) d,g | 75.88 |
|
| Class B | | | | | | | | | | | | | | |
| January 31, 2011** | $17.09 | (.07) | 3.63 | 3.56 | — | — | — | — | $20.65 | 20.83 * | $191,824 | .99* | (.39)* | 89.24* |
| July 31, 2010 | 14.35 | (.13) | 2.94 | 2.81 | (.07) | (.07) | — | — e,f | 17.09 | 19.64 | 182,569 | 2.01 | (.77) | 177.37 |
| July 31, 2009 | 14.52 | (.02) | (.15) h | (.17) | — | — | — | — e,i | 14.35 | (1.17) h | 217,981 | 2.01 d | (.13) d | 186.67 |
| July 31, 2008 | 16.03 | (.13) | (1.38) | (1.51) | — | — | — | — | 14.52 | (9.42) | 368,079 | 1.95 d | (.84) d | 67.79 |
| July 31, 2007 | 14.12 | (.17) | 2.08 | 1.91 | — | — | — | — | 16.03 | 13.53 | 726,751 | 1.89 d | (1.08) d | 65.48 |
| July 31, 2006 | 14.95 | (.15) g | (.68) | (.83) | — | — | — | — | 14.12 | (5.55) g | 1,089,121 | 1.79 d,g | (.98) d,g | 75.88 |
|
| Class C | | | | | | | | | | | | | | |
| January 31, 2011** | $18.74 | (.09) | 4.00 | 3.91 | — | — | — | — | $22.65 | 20.87 * | $182,300 | .99* | (.41)* | 89.24* |
| July 31, 2010 | 15.76 | (.15) | 3.24 | 3.09 | (.11) | (.11) | — | — e,f | 18.74 | 19.63 | 87,221 | 2.01 | (.79) | 177.37 |
| July 31, 2009 | 15.95 | (.02) | (.17) h | (.19) | — | — | — | — e,i | 15.76 | (1.19) h | 37,356 | 2.01 d | (.14) d | 186.67 |
| July 31, 2008 | 17.60 | (.14) | (1.51) | (1.65) | — | — | — | — | 15.95 | (9.38) | 45,990 | 1.95 d | (.82) d | 67.79 |
| July 31, 2007 | 15.50 | (.19) | 2.29 | 2.10 | — | — | — | — | 17.60 | 13.55 | 59,248 | 1.89 d | (1.08) d | 65.48 |
| July 31, 2006 | 16.42 | (.16) g | (.76) | (.92) | — | — | — | — | 15.50 | (5.60) g | 72,213 | 1.79 d,g | (.98) d,g | 75.88 |
|
| Class M | | | | | | | | | | | | | | |
| January 31, 2011** | $18.59 | (.05) | 3.95 | 3.90 | — | — | — | — | $22.49 | 20.98 * | $33,723 | .86* | (.27)* | 89.24* |
| July 31, 2010 | 15.60 | (.10) | 3.21 | 3.11 | (.12) | (.12) | — | — e,f | 18.59 | 19.94 | 28,857 | 1.76 | (.53) | 177.37 |
| July 31, 2009 | 15.74 | .01 | (.15) h | (.14) | — | — | — | — e,i | 15.60 | (.89) h | 25,635 | 1.76 d | .11 d | 186.67 |
| July 31, 2008 | 17.34 | (.10) | (1.50) | (1.60) | — | — | — | — | 15.74 | (9.23) | 32,089 | 1.70 d | (.58) d | 67.79 |
| July 31, 2007 | 15.22 | (.14) | 2.26 | 2.12 | — | — | — | — | 17.34 | 13.93 | 47,801 | 1.64 d | (.83) d | 65.48 |
| July 31, 2006 | 16.12 | (.12) g | (.75) | (.87) | (.03) | (.03) | — | — | 15.22 | (5.42) g | 60,394 | 1.54 d,g | (.73) d,g | 75.88 |
|
| Class R | | | | | | | | | | | | | | |
| January 31, 2011** | $19.80 | (.04) | 4.23 | 4.19 | (.07) | (.07) | — | — | $23.92 | 21.16 * | $12,622 | .74* | (.16)* | 89.24* |
| July 31, 2010 | 16.61 | (.06) | 3.41 | 3.35 | (.16) | (.16) | — | — e,f | 19.80 | 20.23 | 5,573 | 1.51 | (.29) | 177.37 |
| July 31, 2009 | 16.72 | .05 | (.16) h | (.11) | — | — | — | — e,i | 16.61 | (.66) h | 2,156 | 1.51 d | .35 d | 186.67 |
| July 31, 2008 | 18.37 | (.05) | (1.60) | (1.65) | — | — | — | — | 16.72 | (8.98) | 2,363 | 1.45 d | (.30) d | 67.79 |
| July 31, 2007 | 16.09 | (.10) | 2.38 | 2.28 | — | — | — | — | 18.37 | 14.17 | 2,243 | 1.39 d | (.58) d | 65.48 |
| July 31, 2006 | 17.06 | (.09) g | (.77) | (.86) | (.11) | (.11) | — | — | 16.09 | (5.12) g | 1,740 | 1.29 d,g | (.50) d,g | 75.88 |
|
| Class Y | | | | | | | | | | | | | | |
| January 31, 2011** | $20.97 | .02 | 4.47 | 4.49 | (.14) | (.14) | — | — | $25.32 | 21.42 * | $526,713 | .49* | .10* | 89.24* |
| July 31, 2010 | 17.54 | .04 | 3.62 | 3.66 | (.23) | (.23) | — | — e,f | 20.97 | 20.91 | 313,583 | 1.01 | .21 | 177.37 |
| July 31, 2009 | 17.58 | .14 | (.18) h | (.04) | — | — | — | — e,i | 17.54 | (.23) h | 122,966 | 1.01 d | .96 d | 186.67 |
| July 31, 2008 | 19.21 | .03 | (1.66) | (1.63) | — | — | — | — | 17.58 | (8.49) | 935,875 | .95 d | .18 d | 67.79 |
| July 31, 2007 | 16.74 | (.02) | 2.49 | 2.47 | — | — | — | — | 19.21 | 14.76 | 1,297,987 | .89 d | (.08) d | 65.48 |
| July 31, 2006 | 17.73 | — e,g | (.82) | (.82) | (.17) | (.17) | — | — | 16.74 | (4.69) g | 1,579,957 | .79 d,g | .02 d,g | 75.88 |
|
See notes to financial highlights at the end of this section.
The accompanying notes are an integral part of these financial statements.
Financial highlights (Continued)
* Not annualized.
** Unaudited.
a Per share net investment income (loss) has been determined on the basis of the weighted average number of shares outstanding during the period.
b Total return assumes dividend reinvestment and does not reflect the effect of sales charges.
c Includes amounts paid through expense offset and brokerage/service arrangements (Note 2).
d Reflects an involuntary contractual expense limitation and/or waivers of certain fund expenses in connection with investments in Putnam Prime Money Market Fund in effect during the period. As a result of such limitation and/or waivers, the expenses of each class reflect a reduction of the following amounts:
| |
| | Percentage of |
| | average net assets |
|
| July 31, 2009 | 0.03% |
|
| July 31, 2008 | <0.01 |
|
| July 31, 2007 | <0.01 |
|
| July 31, 2006 | <0.01 |
|
e Amount represents less than $0.01 per share.
f Reflects a non-recurring reimbursement pursuant to a settlement between the Securities and Exchange Commission (SEC) and Prudential Securities, Inc., which amounted to less than $0.01 per share outstanding as of March 30, 2010.
g Reflects a non-recurring reimbursement from Putnam Investments relating to the calculation of certain amounts paid by the fund to Putnam in previous years for transfer agent services, which amounted to $0.01 per share and 0.06% of average net assets for the period ended July 31, 2006.
h Reflects a non-recurring litigation payment from Enron Corporation which amounted to the following amounts per share outstanding as of December 29, 2008:
| |
| | Per share |
|
| Class A | $0.11 |
|
| Class B | 0.10 |
|
| Class C | 0.11 |
|
| Class M | 0.10 |
|
| Class R | 0.11 |
|
| Class Y | 0.12 |
|
This payment resulted in an increase to total returns of 0.71% for the year ended July 31, 2009.
i Reflects a non-recurring reimbursement pursuant to a settlement between the SEC and Millennium Partners, L.P., Millennium Management, L.L.C., and Millennium International Management, L.L.C., which amounted to less than $0.01 per share outstanding as of June 23, 2009.
The accompanying notes are an integral part of these financial statements.
32
Notes to financial statements 1/31/11 (Unaudited)
Note 1: Significant accounting policies
Putnam Voyager Fund (the fund), is a Massachusetts business trust, which is registered under the Investment Company Act of 1940, as amended, as a diversified, open-end management investment company. The fund invests mainly in common stocks of midsize and large U.S. companies, with a focus on growth stocks.
The fund offers class A, class B, class C, class M, class R and class Y shares. Class A and class M shares are sold with a maximum front-end sales charge of 5.75% and 3.50%, respectively, and generally do not pay a contingent deferred sales charge. Class B shares, which convert to class A shares after approximately eight years, do not pay a front-end sales charge and are subject to a contingent deferred sales charge if those shares are redeemed within six years of purchase. Class C shares have a one-year 1.00% contingent deferred sales charge and do not convert to class A shares. Class R shares, which are not available to all investors, are sold at net asset value. The expenses for class A, class B, class C, class M and class R shares may differ based on the distribution fee of each class, which is identified in Note 2. Class Y shares, which are sold at net asset value, are generally subject to the same expenses as class A, class B, class C, class M and class R shares, but do not bear a distribution fee. Class Y shares are not available to all investors.
Prior to August 2, 2010, a 1.00% redemption fee applied to certain shares that were redeemed (either by selling or exchanging into another fund) within 7 days of purchase. The redemption fee was accounted for as an addition to paid-in-capital. Effective August 2, 2010, this redemption fee no longer applies to shares redeemed.
Investment income, realized and unrealized gains and losses and expenses of the fund are borne pro-rata based on the relative net assets of each class to the total net assets of the fund, except that each class bears expenses unique to that class (including the distribution fees applicable to such classes). Each class votes as a class only with respect to its own distribution plan or other matters on which a class vote is required by law or determined by the Trustees. If the fund were liquidated, shares of each class would receive their pro-rata share of the net assets of the fund. In addition, the Trustees declare separate dividends on each class of shares.
In the normal course of business, the fund enters into contracts that may include agreements to indemnify another party under given circumstances. The fund’s maximum exposure under these arrangements is unknown as this would involve future claims that may be, but have not yet been, made against the fund. However, the fund’s management team expects the risk of material loss to be remote.
The following is a summary of significant accounting policies consistently followed by the fund in the preparation of its financial statements. The preparation of financial statements is in conformity with accounting principles generally accepted in the United States of America and requires management to make estimates and assumptions that affect the reported amounts of assets and liabilities in the financial statements and the reported amounts of increases and decreases in net assets from operations. Actual results could differ from those estimates. Subsequent events after the Statement of assets and liabilities date through the date that the financial statements were issued have been evaluated in the preparation of the financial statements. Unless otherwise noted, the “reporting period” represents the period from August 1, 2010 through January 31, 2011.
A) Security valuation Investments for which market quotations are readily available are valued at the last reported sales price on their principal exchange, or official closing price for certain markets, and are classified as Level 1 securities. If no sales are reported — as in the case of some securities traded over-the-counter — a security is valued at its last reported bid price and is generally categorized as a Level 2 security.
Market quotations are not considered to be readily available for certain debt obligations; such investments are valued on the basis of valuations furnished by an independent pricing service approved by the Trustees or dealers selected by Putnam Investment Management, LLC (Putnam Management), the fund’s manager, an indirect wholly-owned subsidiary of Putnam Investments, LLC. Such services or dealers determine valuations for normal institutional-size trading units of such securities using methods based on market transactions for comparable securities and various relationships, generally recognized by institutional traders, between securities (which considers such factors as security prices, yields, maturities and ratings). These securities will generally be categorized as Level 2.
Many securities markets and exchanges outside the U.S. close prior to the close of the New York Stock Exchange and therefore the closing prices for securities in such markets or on such exchanges may not fully reflect events that occur after such close but before the close of the New York Stock Exchange. Accordingly, on certain days, the fund will fair value foreign equity securities taking into account multiple factors including movements in the U.S. securities markets, currency valuations and comparisons to the valuation of American Depository Receipts,
33
exchange-traded funds and futures contracts. These securities, which will generally represent a transfer from a Level 1 to a Level 2 security, will be classified as Level 2. The number of days on which fair value prices will be used will depend on market activity and it is possible that fair value prices will be used by the fund to a significant extent. At the close of the reporting period, fair value pricing was used for certain foreign securities in the portfolio. Securities quoted in foreign currencies, if any, are translated into U.S. dollars at the current exchange rate.
To the extent a pricing service or dealer is unable to value a security or provides a valuation that Putnam Management does not believe accurately reflects the security’s fair value, the security will be valued at fair value by Putnam Management. Certain investments, including certain restricted and illiquid securities and derivatives, are also valued at fair value following procedures approved by the Trustees. These valuations consider such factors as significant market or specific security events such as interest rate or credit quality changes, various relationships with other securities, discount rates, U.S. Treasury, U.S. swap and credit yields, index levels, convexity exposures and recovery rates. These securities are classified as Level 2 or as Level 3 depending on the priority of the significant inputs.
Such valuations and procedures are reviewed periodically by the Trustees. The fair value of securities is generally determined as the amount that the fund could reasonably expect to realize from an orderly disposition of such securities over a reasonable period of time. By its nature, a fair value price is a good faith estimate of the value of a security in a current sale and does not reflect an actual market price, which may be different by a material amount.
B) Security transactions and related investment income Security transactions are recorded on the trade date (the date the order to buy or sell is executed). Gains or losses on securities sold are determined on the identified cost basis.
Interest income is recorded on the accrual basis. Dividend income, net of applicable withholding taxes, is recognized on the ex-dividend date except that certain dividends from foreign securities, if any, are recognized as soon as the fund is informed of the ex-dividend date. Non-cash dividends, if any, are recorded at the fair market value of the securities received. Dividends representing a return of capital or capital gains, if any, are reflected as a reduction of cost and/or as a realized gain. All premiums/discounts are amortized/accreted on a yield-to-maturity basis.
C) Foreign currency translation The accounting records of the fund are maintained in U.S. dollars. The market value of foreign securities, currency holdings, and other assets and liabilities is recorded in the books and records of the fund after translation to U.S. dollars based on the exchange rates on that day. The cost of each security is determined using historical exchange rates. Income and withholding taxes are translated at prevailing exchange rates when earned or incurred. The fund does not isolate that portion of realized or unrealized gains or losses resulting from changes in the foreign exchange rate on investments from fluctuations arising from changes in the market prices of the securities. Such gains and losses are included with the net realized and unrealized gain or loss on investments. Net realized gains and losses on foreign currency transactions represent net realized exchange gains or losses on closed forward currency contracts, disposition of foreign currencies, currency gains and losses realized between the trade and settlement dates on securities transactions and the difference between the amount of investment income and foreign withholding taxes recorded on the fund’s books and the U.S. dollar equivalent amounts actually received or paid. Net unrealized appreciation and depreciation of assets and liabilities in foreign currencies arise from changes in the value of open forward currency contracts and assets and liabilities other than investments at the period end, resulting from changes in the exchange rate. Investments in foreign securities involve certain risks, including those related to economic instability, unfavorable political developments, and currency fluctuations, not present with domestic investments.
D) Options contracts The fund uses options contracts to hedge against changes in values of securities it owns, owned or expects to own. The potential risk to the fund is that the change in value of options contracts may not correspond to the change in value of the hedged instruments. In addition, losses may arise from changes in the value of the underlying instruments if there is an illiquid secondary market for the contracts, if interest or exchange rates move unexpectedly or if the counterparty to the contract is unable to perform. Realized gains and losses on purchased options are included in realized gains and losses on investment securities. If a written call option is exercised, the premium originally received is recorded as an addition to sales proceeds. If a written put option is exercised, the premium originally received is recorded as a reduction to the cost of investments.
Exchange traded options are valued at the last sale price or, if no sales are reported, the last bid price for purchased options and the last ask price for written options. Options traded over-the-counter are valued using prices supplied by dealers. Written option contracts outstanding at period end, if any, are listed after the fund’s portfolio. The fund had an average contract amount of approximately 43,300,000 on purchased options contracts for the reporting period. See Note 3 for the volume of written options contracts activity for the reporting period.
34
E) Forward currency contracts The fund buys and sells forward currency contracts, which are agreements between two parties to buy and sell currencies at a set price on a future date. These contracts are used to hedge foreign exchange risk. The U.S. dollar value of forward currency contracts is determined using current forward currency exchange rates supplied by a quotation service. The market value of the contract will fluctuate with changes in currency exchange rates. The contract is marked to market daily and the change in market value is recorded as an unrealized gain or loss. When the contract is closed, the fund records a realized gain or loss equal to the difference between the value of the contract at the time it was opened and the value at the time it was closed. The fund could be exposed to risk if the value of the currency changes unfavorably, if the counterparties to the contracts are unable to meet the terms of their contracts or if the fund is unable to enter into a closing position. Risks may exceed amounts recognized on the Statement of assets and liabilities. Forward currency contracts outstanding at period end, if any, are listed after the fund’s portfolio. The fund had an average contract amount of approximately $185,000,000 on forward currency contracts for the reporting period.
F) Total return swap contracts The fund enters into total return swap contracts, which are arrangements to exchange a market linked return for a periodic payment, both based on a notional principal amount to gain exposure to specific sectors/industries. To the extent that the total return of the security, index or other financial measure underlying the transaction exceeds or falls short of the offsetting interest rate obligation, the fund will receive a payment from or make a payment to the counterparty. Total return swap contracts are marked to market daily based upon quotations from market makers and the change, if any, is recorded as an unrealized gain or loss. Payments received or made are recorded as realized gains or losses. Certain total return swap contracts may include extended effective dates. Payments related to these swap contracts are accrued based on the terms of the contract. The fund could be exposed to credit or market risk due to unfavorable changes in the fluctuation of interest rates or in the price of the underlying security or index, the possibility that there is no liquid market for these agreements or that the counterparty may default on its obligation to perform. The fund’s maximum risk of loss from counterparty risk is the fair value of the contract. This risk may be mitigated by having a master netting arrangement between the fund and the counterparty. Risk of loss may exceed amounts recognized on the Statement of assets and liabilities. Total return swap contracts outstanding at period end, if any, are listed after the fund’s portfolio. The fund had an average notional amount of approximately $87,400,000 on total return swap contracts for the reporting period.
G) Master agreements The fund is a party to ISDA (International Swap and Derivatives Association, Inc.) Master Agreements (Master Agreements) with certain counterparties that govern over-the-counter derivative and foreign exchange contracts entered into from time to time. The Master Agreements may contain provisions regarding, among other things, the parties’ general obligations, representations, agreements, collateral requirements, events of default and early termination. With respect to certain counterparties, in accordance with the terms of the Master Agreements, collateral posted to the fund is held in a segregated account by the fund’s custodian and with respect to those amounts which can be sold or repledged, are presented in the fund’s portfolio. Collateral posted to the fund which cannot be sold or repledged totaled $5,093,610 at the close of the reporting period. Collateral pledged by the fund is segregated by the fund’s custodian and identified in the fund’s portfolio. Collateral can be in the form of cash or debt securities issued by the U.S. Government or related agencies or other securities as agreed to by the fund and the applicable counterparty. Collateral requirements are determined based on the fund’s net position with each counterparty. Termination events applicable to the fund may occur upon a decline in the fund’s net assets below a specified threshold over a certain period of time. Termination events applicable to counterparties may occur upon a decline in the counterparty’s long-term and short-term credit ratings below a specified level. In each case, upon occurrence, the other party may elect to terminate early and cause settlement of all derivative and foreign exchange contracts outstanding, including the payment of any losses and costs resulting from such early termination, as reasonably determined by the terminating party. Any decision by one or more of the fund’s counterparties to elect early termination could impact the fund’s future derivative activity.
At the close of the reporting period, the fund had a net liability position of $4,012,757 on derivative contracts subject to the Master Agreements. Collateral posted by the fund totaled $3,729,394.
H) Securities lending The fund may lend securities, through its agent, to qualified borrowers in order to earn additional income. The loans are collateralized by cash in an amount at least equal to the market value of the securities loaned. The market value of securities loaned is determined daily and any additional required collateral is allocated to the fund on the next business day. The risk of borrower default will be borne by the fund’s agent; the fund will bear the risk of loss with respect to the investment of the cash collateral. Income from securities lending is included in investment income on the Statement of operations. Cash collateral is invested in Putnam Cash Collateral Pool,
35
LLC, a limited liability company managed by an affiliate of Putnam Management. Investments in Putnam Cash Collateral Pool, LLC are valued at its closing net asset value each business day. There are no management fees charged by Putnam Cash Collateral Pool, LLC. At the close of the reporting period, the value of securities loaned amounted to $410,455,215 and the fund received cash collateral of $415,665,058.
I) Interfund lending Effective July 2010, the fund, along with other Putnam funds, may participate in an inter-fund lending program pursuant to an exemptive order issued by the Securities and Exchange Commission (the SEC). This program allows the fund to borrow from or lend to other Putnam funds that permit such transactions. Interfund lending transactions are subject to each fund’s investment policies and borrowing and lending limits. Interest earned or paid on the interfund lending transaction will be based on the average of certain current market rates. During the reporting period, the fund did not utilize the program.
J) Line of credit Effective July 2010, the fund participates, along with other Putnam funds, in a $285 million unsecured committed line of credit and a $165 million unsecured uncommitted line of credit, both provided by State Street Bank and Trust Company (State Street). Borrowings may be made for temporary or emergency purposes, including the funding of shareholder redemption requests and trade settlements. Interest is charged to the fund based on the fund’s borrowing at a rate equal to the Federal Funds rate plus 1.25% for the committed line of credit and the Federal Funds rate plus 1.30% for the uncommitted line of credit. A closing fee equal to 0.03% of the committed line of credit and $100,000 for the uncommitted line of credit has been paid by the participating funds. In addition, a commitment fee of 0.15% per annum on any unutilized portion of the committed line of credit is allocated to the participating funds based on their relative net assets and paid quarterly. During the reporting period, the fund had no borrowings against these arrangements.
K) Federal taxes It is the policy of the fund to distribute all of its taxable income within the prescribed time period and otherwise comply with the provisions of the Internal Revenue Code of 1986, as amended (the Code), applicable to regulated investment companies. It is also the intention of the fund to distribute an amount sufficient to avoid imposition of any excise tax under Section 4982 of the Code. The fund is subject to the provisions of Accounting Standards Codification ASC 740 Income Taxes (ASC 740). ASC 740 sets forth a minimum threshold for financial statement recognition of the benefit of a tax position taken or expected to be taken in a tax return. The fund did not have a liability to record for any unrecognized tax benefits in the accompanying financial statements. No provision has been made for federal taxes on income, capital gains or unrealized appreciation on securities held nor for excise tax on income and capital gains. Each of the fund’s federal tax returns for the prior three fiscal years remains subject to examination by the Internal Revenue Service.
At July 31, 2010, the fund had a capital loss carryover of $2,286,630,820 available to the extent allowed by the Code to offset future net capital gain, if any. The amounts of the carryovers and the expiration dates are:
| | |
| Loss carryover | | Expiration |
|
| $1,987,450,372 | | July 31, 2011 |
|
| 299,180,448 | | July 31, 2017 |
|
The aggregate identified cost on a tax basis is $4,900,955,158, resulting in gross unrealized appreciation and depreciation of $575,462,146 and $150,669,830, respectively, or net unrealized appreciation of $424,792,316.
L) Distributions to shareholders Distributions to shareholders from net investment income are recorded by the fund on the ex-dividend date. Distributions from capital gains, if any, are recorded on the ex-dividend date and paid at least annually. The amount and character of income and gains to be distributed are determined in accordance with income tax regulations, which may differ from generally accepted accounting principles. Dividend sources are estimated at the time of declaration. Actual results may vary. Any non-taxable return of capital cannot be determined until final tax calculations are completed after the end of the fund’s fiscal year. Reclassifications are made to the fund’s capital accounts to reflect income and gains available for distribution (or available capital loss carryovers) under income tax regulations.
Note 2: Management fee, administrative services and other transactions
The fund pays Putnam Management a management fee (base fee) (based on the fund’s average net assets and computed and paid monthly) at annual rates that may vary based on the average of the aggregate net assets of most open-end funds, as defined in the fund’s management contract, sponsored by Putnam Management. Such annual rates may vary as follows: 0.710% of the first $5 billion, 0.660% of the next $5 billion, 0.610% of the next $10 billion,
36
0.560% of the next $10 billion, 0.510% of the next $50 billion, 0.490% of the next $50 billion, 0.480% of the next $100 billion, and 0.475% of any excess thereafter.
In addition, beginning with the fund’s thirteenth complete calendar month of operation under the management contract (January 2011), the monthly management fee consists of the monthly base fee plus or minus a performance adjustment for the month. The performance adjustment is determined based on performance over the thirty-six month period then ended or, if the management contract has not yet been effective for thirty-six complete calendar months, the period from the date the management contract became effective to the end of the month for which the fee adjustment is being computed. Each month, the performance adjustment is calculated by multiplying the performance adjustment rate and the fund’s average net assets over the performance period and the result is divided by twelve. The resulting dollar amount is added to, or subtracted from the base fee for that month. The performance adjustment rate is equal to 0.03 multiplied by the difference between the fund’s annualized performance (measured by the fund’s class A shares) and the annualized performance of the Russell 1000 Growth Index, each measured over the performance period. The maximum annualized performance adjustment rates are +/– 0.12%. The monthly base fee is determined based on the fund’s average net assets for the month, while the performance adjustment is determined based on the fund’s average net assets over the performance period of up to thirty-six months. This means it is possible that, if the fund underperforms significantly over the performance period, and the fund’s assets have declined significantly over that period, the negative performance adjustment may exceed the base fee. In this event, Putnam Management would make a payment to the fund.
For the reporting period ended, the base fee represented an effective rate of 0.28% of the fund’s average net assets before an increase of $391,623 (0.01% of the fund’s average net assets) based on performance.
Putnam Management has contractually agreed, through June 30, 2011, to waive fees or reimburse the fund’s expenses to the extent necessary to limit the cumulative expenses of the fund, exclusive of brokerage, interest, taxes, investment-related expenses, extraordinary expenses and payments under the fund’s investor servicing contract, investment management contract and distribution plans, on a fiscal year-to-date basis to an annual rate of 0.20% of the fund’s average net assets over such fiscal year-to-date period. During the reporting period, the fund’s expenses were not reduced as a result of this limit.
Putnam Investments Limited (PIL), an affiliate of Putnam Management, is authorized by the Trustees to manage a separate portion of the assets of the fund as determined by Putnam Management from time to time. Putnam Management pays a quarterly sub-management fee to PIL for its services at an annual rate of 0.35% of the average net assets of the portion of the fund managed by PIL.
The fund reimburses Putnam Management an allocated amount for the compensation and related expenses of certain officers of the fund and their staff who provide administrative services to the fund. The aggregate amount of all such reimbursements is determined annually by the Trustees.
Custodial functions for the fund’s assets are provided by State Street. Custody fees are based on the fund’s asset level, the number of its security holdings and transaction volumes.
Putnam Investor Services, Inc., an affiliate of Putnam Management, provides investor servicing agent functions to the fund. Putnam Investor Services, Inc. received fees for investor servicing based on the fund’s retail asset level, the number of shareholder accounts in the fund and the level of defined contribution plan assets in the fund. Investor servicing fees will not exceed an annual rate of 0.375% of the fund’s average net assets. The amounts incurred for investor servicing agent functions during the reporting period are included in Investor servicing fees in the Statement of operations.
The fund has entered into expense offset arrangements with Putnam Investor Services, Inc. and State Street whereby Putnam Investor Services, Inc.’s and State Street’s fees are reduced by credits allowed on cash balances. The fund also reduced expenses through brokerage/service arrangements. For the reporting period, the fund’s expenses were reduced by $10,747 under the expense offset arrangements and by $302 under the brokerage/service arrangements.
Each independent Trustee of the fund receives an annual Trustee fee, of which $2,852, as a quarterly retainer, has been allocated to the fund, and an additional fee for each Trustees meeting attended. Trustees also are reimbursed for expenses they incur relating to their services as Trustees.
The fund has adopted a Trustee Fee Deferral Plan (the Deferral Plan) which allows the Trustees to defer the receipt of all or a portion of Trustees fees payable on or after July 1, 1995. The deferred fees remain invested in certain Putnam funds until distribution in accordance with the Deferral Plan.
37
The fund has adopted an unfunded noncontributory defined benefit pension plan (the Pension Plan) covering all Trustees of the fund who have served as a Trustee for at least five years and were first elected prior to 2004. Benefits under the Pension Plan are equal to 50% of the Trustee’s average annual attendance and retainer fees for the three years ended December 31, 2005. The retirement benefit is payable during a Trustee’s lifetime, beginning the year following retirement, for the number of years of service through December 31, 2006. Pension expense for the fund is included in Trustee compensation and expenses in the Statement of operations. Accrued pension liability is included in Payable for Trustee compensation and expenses in the Statement of assets and liabilities. The Trustees have terminated the Pension Plan with respect to any Trustee first elected after 2003.
The fund has adopted distribution plans (the Plans) with respect to its class A, class B, class C, class M and class R shares pursuant to Rule 12b-1 under the Investment Company Act of 1940. The purpose of the Plans is to compensate Putnam Retail Management Limited Partnership, a wholly-owned subsidiary of Putnam Investments, LLC and Putnam Retail Management GP, Inc., for services provided and expenses incurred in distributing shares of the fund. The Plans provide for payments by the fund to Putnam Retail Management Limited Partnership at an annual rate of up to 0.35%, 1.00%, 1.00%, 1.00% and 1.00% of the average net assets attributable to class A, class B, class C, class M and class R shares, respectively. The Trustees have approved payment by the fund at an annual rate of 0.25%, 1.00%, 1.00%, 0.75% and 0.50% of the average net assets attributable to class A, class B, class C, class M and class R shares, respectively.
For the reporting period, Putnam Retail Management Limited Partnership, acting as underwriter, received net commissions of $339,688 and $1,388 from the sale of class A and class M shares, respectively, and received $73,464 and $10,568 in contingent deferred sales charges from redemptions of class B and class C shares, respectively.
A deferred sales charge of up to 1.00% and 0.65% is assessed on certain redemptions of class A and class M shares, respectively. For the reporting period, Putnam Retail Management Limited Partnership, acting as underwriter, received $35 and no monies on class A and class M redemptions, respectively.
Note 3: Purchases and sales of securities
During the reporting period, cost of purchases and proceeds from sales of investment securities other than short-term investments aggregated $3,734,716,762 and $3,557,372,723, respectively. There were no purchases or proceeds from sales of long-term U.S. government securities.
Written option transactions during the reporting period are summarized as follows:
| | | |
| | | Contract amounts | Premiums received |
|
| Written options outstanding at the | | | |
| beginning of the reporting period | USD | 56,843,796 | $69,818,559 |
|
| Options opened | USD | 154,807,666 | 61,246,624 |
| | JPY | 23,507,653 | 1,379,485 |
|
| Options exercised | USD | — | — |
|
| Options expired | USD | (97,415,773) | (32,310,038) |
|
| Options closed | USD | (91,153,162) | (88,005,318) |
|
| Written options outstanding at the | USD | 23,082,527 | $10,749,827 |
| end of the reporting period | JPY | 23,507,653 | $1,379,485 |
|
Note 4: Capital shares
At the close of the reporting period, there was an unlimited number of shares of beneficial interest authorized.
Transactions in capital shares were as follows:
| | | | |
| | Six months ended 1/31/11 | Year ended 7/31/10 |
|
| Class A | Shares | Amount | Shares | Amount |
|
| Shares sold | 17,871,069 | $409,251,072 | 20,917,576 | $414,621,152 |
|
| Shares issued in connection with | | | | |
| reinvestment of distributions | 513,472 | 11,938,213 | 1,485,196 | 28,322,682 |
|
| | 18,384,541 | 421,189,285 | 22,402,772 | 442,943,834 |
|
| Shares repurchased | (12,122,016) | (268,572,798) | (28,871,725) | (564,527,763) |
|
| Net increase (decrease) | 6,262,525 | $152,616,487 | (6,468,953) | $(121,583,929) |
|
38
| | | | |
| | Six months ended 1/31/11 | Year ended 7/31/10 |
|
| Class B | Shares | Amount | Shares | Amount |
|
| Shares sold | 698,507 | $13,403,778 | 1,218,106 | $20,382,301 |
|
| Shares issued in connection with | | | | |
| reinvestment of distributions | — | — | 60,422 | 983,669 |
|
| | 698,507 | 13,403,778 | 1,278,528 | 21,365,970 |
|
| Shares repurchased | (2,092,692) | (39,371,727) | (5,787,196) | (96,975,052) |
|
| Net decrease | (1,394,185) | $(25,967,949) | (4,508,668) | $(75,609,082) |
|
| |
| | Six months ended 1/31/11 | Year ended 7/31/10 |
|
| Class C | Shares | Amount | Shares | Amount |
|
| Shares sold | 3,749,182 | $80,470,579 | 2,908,403 | $53,745,988 |
|
| Shares issued in connection with | | | | |
| reinvestment of distributions | — | — | 14,172 | 252,964 |
|
| | 3,749,182 | 80,470,579 | 2,922,575 | 53,998,952 |
|
| Shares repurchased | (353,680) | (7,307,729) | (638,989) | (11,647,956) |
|
| Net increase | 3,395,502 | $73,162,850 | 2,283,586 | $42,350,996 |
|
| |
| | Six months ended 1/31/11 | Year ended 7/31/10 |
|
| Class M | Shares | Amount | Shares | Amount |
|
| Shares sold | 96,980 | $2,016,158 | 180,748 | $3,298,531 |
|
| Shares issued in connection with | | | | |
| reinvestment of distributions | — | — | 10,034 | 177,403 |
|
| | 96,980 | 2,016,158 | 190,782 | 3,475,934 |
|
| Shares repurchased | (150,017) | (3,083,715) | (281,887) | (5,112,273) |
|
| Net decrease | (53,037) | $(1,067,557) | (91,105) | $(1,636,339) |
|
| |
| | Six months ended 1/31/11 | Year ended 7/31/10 |
|
| Class R | Shares | Amount | Shares | Amount |
|
| Shares sold | 286,111 | $6,538,548 | 222,112 | $4,468,999 |
|
| Shares issued in connection with | | | | |
| reinvestment of distributions | 773 | 17,695 | 1,240 | 23,316 |
|
| | 286,884 | 6,556,243 | 223,352 | 4,492,315 |
|
| Shares repurchased | (40,664) | (893,814) | (71,734) | (1,387,560) |
|
| Net increase | 246,220 | $5,662,429 | 151,618 | $3,104,755 |
|
| |
| | Six months ended 1/31/11 | Year ended 7/31/10 |
|
| Class Y | Shares | Amount | Shares | Amount |
|
| Shares sold | 10,379,695 | $249,063,815 | 10,795,507 | $224,743,980 |
|
| Shares issued in connection with | | | | |
| reinvestment of distributions | 64,437 | 1,560,026 | 92,495 | 1,835,103 |
|
| | 10,444,132 | 250,623,841 | 10,888,002 | 226,579,083 |
|
| Shares repurchased | (4,599,437) | (105,224,973) | (2,939,764) | (60,340,551) |
|
| Net increase | 5,844,695 | $145,398,868 | 7,948,238 | $166,238,532 |
|
39
Note 5: Summary of derivative activity
The following is a summary of the market values of derivative instruments as of the close of the reporting period:
Market values of derivative instruments as of the close of the reporting period
| | | | |
| | Asset derivatives | Liability derivatives |
|
| Derivatives not | | | | |
| accounted for as | Statement of | | Statement of | |
| hedging instruments | assets and | | assets and | |
| under ASC 815 | liabilities location | Market value | liabilities location | Market value |
|
| Foreign exchange | | | | |
| contracts | Receivables | $339,200 | Payables | $6,021,419 |
|
| | Investments, | | | |
| Equity contracts | Receivables | 151,150,294 | Payables | 16,474,737 |
|
| Total | | $151,489,494 | | $22,496,156 |
|
The following is a summary of realized and change in unrealized gains or losses of derivative instruments on the Statement of operations for the reporting period (see Note 1):
Amount of realized gain or (loss) on derivatives recognized in net gain or (loss) on investments
| | | | | |
| Derivatives not | | | | | |
| accounted for as | | | Forward | | |
| hedging instruments | | | currency | | |
| under ASC 815 | Options | Warrants | contracts | Swaps | Total |
|
| Foreign exchange | | | | | |
| contracts | $— | $— | $(3,539,389) | $— | $(3,539,389) |
|
| Equity contracts | (42,016,199) | (758,118) | — | 466,477 | (42,307,840) |
|
| Total | $(42,016,199) | $(758,118) | $(3,539,389) | $466,477 | $(45,847,229) |
|
Change in unrealized appreciation or (depreciation) on derivatives recognized in net gain or (loss) on investments
| | | | | |
| Derivatives not | | | | | |
| accounted for as | | | Forward | | |
| hedging instruments | | | currency | | |
| under ASC 815 | Options | Warrants | contracts | Swaps | Total |
|
| Foreign exchange | | | | | |
| contracts | $— | $— | $(4,207,492) | $— | $(4,207,492) |
|
| Equity contracts | 22,479,682 | 12,528,318 | — | (1,274,387) | 33,733,613 |
|
| Total | $22,479,682 | $12,528,318 | $(4,207,492) | $(1,274,387) | $29,526,121 |
|
Note 6: Investment in Putnam Money Market Liquidity Fund
The fund invested in Putnam Money Market Liquidity Fund, an open-end management investment company managed by Putnam Management. Investments in Putnam Money Market Liquidity Fund are valued at its closing net asset value each business day. Income distributions earned by the fund are recorded as interest income in the Statement of operations and totaled $53,832 for the reporting period. During the reporting period, cost of purchases and proceeds of sales of investments in Putnam Money Market Liquidity Fund aggregated $1,068,927,374 and $943,325,794, respectively. Management fees charged to Putnam Money Market Liquidity Fund have been waived by Putnam Management.
40
Note 7: Transactions with affiliated issuers
Transactions during the reporting period with companies in which the fund owned at least 5% of the voting securities were as follows:
| | | | |
| | Purchase | Sales | Dividends | Market |
| Affiliates | cost | proceeds | Income | Value |
|
| Unisys Corp. | $13,723,722 | $8,564,194 | $— | $69,610,351 |
|
| Totals | $13,723,722 | $8,564,194 | $— | $69,610,351 |
|
Market values are shown for those securities affiliated at the close of the reporting period.
Note 8: Regulatory matters and litigation
In late 2003 and 2004, Putnam Management settled charges brought by the SEC and the Massachusetts Securities Division in connection with excessive short-term trading in Putnam funds. Distribution of payments from Putnam Management to certain open-end Putnam funds and their shareholders is expected to be completed in the next several months. These allegations and related matters have served as the general basis for certain lawsuits, including purported class action lawsuits against Putnam Management and, in a limited number of cases, some Putnam funds. Putnam Management believes that these lawsuits will have no material adverse effect on the funds or on Putnam Management’s ability to provide investment management services. In addition, Putnam Management has agreed to bear any costs incurred by the Putnam funds as a result of these matters.
Note 9: Market and credit risk
In the normal course of business, the fund trades financial instruments and enters into financial transactions where risk of potential loss exists due to changes in the market (market risk) or failure of the contracting party to the transaction to perform (credit risk). The fund may be exposed to additional credit risk that an institution or other entity with which the fund has unsettled or open transactions will default.
41
The Putnam family of funds
The following is a list of Putnam’s open-end mutual funds offered to the public. Investors should carefully consider the investment objective, risks, charges, and expenses of a fund before investing. For a prospectus, or a summary prospectus if available, containing this and other information for any Putnam fund or product, call your financial advisor at 1-800-225-1581 and ask for a prospectus. Please read the prospectus carefully before investing.
| |
| Growth | Value |
| Growth Opportunities Fund | Convertible Securities Fund |
| International Growth Fund | Prior to September 30, 2010, the fund was known as |
| Prior to January 1, 2010, the fund was known as | Putnam Convertible Income-Growth Trust |
| Putnam International New Opportunities Fund | Equity Income Fund |
| Multi-Cap Growth Fund | George Putnam Balanced Fund |
| Prior to September 1, 2010, the fund was known as | Prior to September 30, 2010, the fund was known as |
| Putnam New Opportunities Fund | The George Putnam Fund of Boston |
| Small Cap Growth Fund | The Putnam Fund for Growth and Income |
| Voyager Fund | International Value Fund |
| | Prior to January 1, 2010, the fund was known as |
| Blend | Putnam International Growth and Income Fund |
| Asia Pacific Equity Fund | Multi-Cap Value Fund |
| Capital Opportunities Fund | Prior to September 1, 2010, the fund was known as |
| Capital Spectrum Fund | Putnam Mid Cap Value Fund |
| Emerging Markets Equity Fund | Small Cap Value Fund |
| Equity Spectrum Fund | |
| Europe Equity Fund | Income |
| Global Equity Fund | American Government Income Fund |
| International Capital Opportunities Fund | Diversified Income Trust |
| International Equity Fund | Floating Rate Income Fund |
| Investors Fund | Global Income Trust |
| Multi-Cap Core Fund | High Yield Advantage Fund |
| Research Fund | High Yield Trust |
| Income Fund |
| | Money Market Fund* |
| | U.S. Government Income Trust |
* An investment in a money market fund is not insured or guaranteed by the Federal Deposit Insurance Corporation or any other government agency. Although the fund seeks to preserve the value of your investment at $1.00 per share, it is possible to lose money by investing in the fund.
42
| |
| Tax-free income | Asset allocation |
| AMT-Free Municipal Fund | Income Strategies Fund |
| Tax Exempt Income Fund | Putnam Asset Allocation Funds — three |
| Tax Exempt Money Market Fund* | investment portfolios that spread your |
| Tax-Free High Yield Fund | money across a variety of stocks, bonds, |
| and money market investments. |
| State tax-free income funds: | |
| Arizona, California, Massachusetts, Michigan, | The three portfolios: |
| Minnesota, New Jersey, New York, Ohio, | Asset Allocation: Balanced Portfolio |
| and Pennsylvania | Asset Allocation: Conservative Portfolio |
| Asset Allocation: Growth Portfolio |
| Absolute Return | |
| Absolute Return 100 Fund | Putnam RetirementReady® |
| Absolute Return 300 Fund | Putnam RetirementReady Funds — 10 |
| Absolute Return 500 Fund | investment portfolios that offer diversifi- |
| Absolute Return 700 Fund | cation among stocks, bonds, and money |
| market instruments and adjust to become |
| Global Sector | more conservative over time based on a |
| Global Consumer Fund | target date for withdrawing assets. |
| Global Energy Fund | |
| Global Financials Fund | The 10 funds: |
| Global Health Care Fund | Putnam RetirementReady 2055 Fund |
| Global Industrials Fund | Putnam RetirementReady 2050 Fund |
| Global Natural Resources Fund | Putnam RetirementReady 2045 Fund |
| Global Sector Fund | Putnam RetirementReady 2040 Fund |
| Global Technology Fund | Putnam RetirementReady 2035 Fund |
| Global Telecommunications Fund | Putnam RetirementReady 2030 Fund |
| Global Utilities Fund | Putnam RetirementReady 2025 Fund |
| | Putnam RetirementReady 2020 Fund |
| | Putnam RetirementReady 2015 Fund |
| | Putnam RetirementReady Maturity Fund |
A short-term trading fee of 1% may apply to redemptions or exchanges from certain funds within the time period specified in the fund's prospectus.
Check your account balances and the most recent month-end performance in the Individual Investors section at putnam.com.
43
Services for shareholders
Investor services
Systematic investment plan Tell us how much you wish to invest regularly — weekly, semimonthly, or monthly — and the amount you choose will be transferred automatically from your checking or savings account. There’s no additional fee for this service, and you can suspend it at any time. This plan may be a great way to save for college expenses or to plan for your retirement.
Please note that regular investing does not guarantee a profit or protect against loss in a declining market. Before arranging a systematic investment plan, consider your financial ability to continue making purchases in periods when prices are low.
Systematic exchange You can make regular transfers from one Putnam fund to another Putnam fund. There are no additional fees for this service, and you can cancel or change your options at any time.
Dividends PLUS You can choose to have the dividend distributions from one of your Putnam funds automatically reinvested in another Putnam fund at no additional charge.
Free exchange privilege You can exchange money between Putnam funds free of charge, as long as they are the same class of shares. A signature guarantee is required if you are exchanging more than $500,000. The fund reserves the right to revise or terminate the exchange privilege.
Reinstatement privilege If you’ve sold Putnam shares or received a check for a dividend or capital gain, you may reinvest the proceeds with Putnam within 90 days of the transaction and they will be reinvested at the fund’s current net asset value — with no sales charge. However, reinstatement of class B shares may have special tax consequences. Ask your financial or tax representative for details.
Check-writing service You have ready access to many Putnam accounts. It’s as simple as writing a check, and there are no special fees or service charges. For more information about the check-writing service, call Putnam or visit our Web site.
Dollar cost averaging When you’re investing for long-term goals, it’s time, not timing, that counts. Investing on a systematic basis is a better strategy than trying to figure out when the markets will go up or down. This means investing the same amount of money regularly over a long period. This method of investing is called dollar cost averaging. When a fund’s share price declines, your investment dollars buy more shares at lower prices. When it increases, they buy fewer shares. Over time, you will pay a lower average price per share.
For more information
Visit the Individual Investors section at putnam.com A secure section of our Web site contains complete information on your account, including balances and transactions, updated daily. You may also conduct transactions, such as exchanges, additional investments, and address changes. Log on today to get your password.
Call us toll free at 1-800-225-1581 Ask a helpful Putnam representative or your financial advisor for details about any of these or other services, or see your prospectus.
44
Fund information
Founded over 70 years ago, Putnam Investments was built around the concept that a balance between risk and reward is the hallmark of a well-rounded financial program. We manage over 100 funds across income, value, blend, growth, asset allocation, absolute return, and global sector categories.
| | |
| Investment Manager | Kenneth R. Leibler | Mark C. Trenchard |
| Putnam Investment | Robert E. Patterson | Vice President and |
| Management, LLC | George Putnam, III | BSA Compliance Officer |
| One Post Office Square | Robert L. Reynolds | |
| Boston, MA 02109 | W. Thomas Stephens | Francis J. McNamara, III |
| | | Vice President and |
| Investment Sub-Manager | Officers | Chief Legal Officer |
| Putnam Investments Limited | Robert L. Reynolds | |
| 57–59 St James’s Street | President | James P. Pappas |
| London, England SW1A 1LD | | Vice President |
| | Jonathan S. Horwitz | |
| Marketing Services | Executive Vice President, | Judith Cohen |
| Putnam Retail Management | Principal Executive | Vice President, Clerk and |
| One Post Office Square | Officer, Treasurer and | Assistant Treasurer |
| Boston, MA 02109 | Compliance Liaison | |
| | | Michael Higgins |
| Custodian | Steven D. Krichmar | Vice President, Senior Associate |
| State Street Bank | Vice President and | Treasurer and Assistant Clerk |
| and Trust Company | Principal Financial Officer | |
| | | Nancy E. Florek |
| Legal Counsel | Janet C. Smith | Vice President, Assistant Clerk, |
| Ropes & Gray LLP | Vice President, Assistant | Assistant Treasurer and |
| | Treasurer and Principal | Proxy Manager |
| Trustees | Accounting Officer | |
| John A. Hill, Chairman | | Susan G. Malloy |
| Jameson A. Baxter, | Beth S. Mazor | Vice President and |
| Vice Chairman | Vice President | Assistant Treasurer |
| Ravi Akhoury | | |
| Barbara M. Baumann | Robert R. Leveille | |
| Charles B. Curtis | Vice President and | |
| Robert J. Darretta | Chief Compliance Officer | |
| Paul L. Joskow | | |
| | |
This report is for the information of shareholders of Putnam Voyager Fund. It may also be used as sales literature when preceded or accompanied by the current prospectus, the most recent copy of Putnam’s Quarterly Performance Summary, and Putnam’s Quarterly Ranking Summary. For more recent performance, please visit putnam.com. Investors should carefully consider the investment objective, risks, charges, and expenses of a fund, which are described in its prospectus. For this and other information or to request a prospectus, or a summary prospectus if available, call 1-800-225-1581 toll free. Please read the prospectus carefully before investing. The fund’s Statement of Additional Information contains additional information about the fund’s Trustees and is available without charge upon request by calling 1-800-225-1581.
Item 2. Code of Ethics:
Not applicable
Item 3. Audit Committee Financial Expert:
Not applicable
Item 4. Principal Accountant Fees and Services:
Not applicable
Item 5. Audit Committee of Listed Registrants
Not applicable
Item 6. Schedule of Investments:
The registrant’s schedule of investments in unaffiliated issuers is included in the report to shareholders in Item 1 above.
Item 7. Disclosure of Proxy Voting Policies and Procedures For Closed-End Management Investment Companies:
Not applicable
Item 8. Portfolio Managers of Closed-End Investment Companies
Not Applicable
Item 9. Purchases of Equity Securities by Closed-End Management Investment Companies and Affiliated Purchasers:
Not applicable
Item 10. Submission of Matters to a Vote of Security Holders:
Not applicable
Item 11. Controls and Procedures:
(a) The registrant's principal executive officer and principal financial officer have concluded, based on their evaluation of the effectiveness of the design and operation of the registrant's disclosure controls and procedures as of a date within 90 days of the filing date of this report, that the design and operation of such procedures are generally effective to provide reasonable assurance that information required to be disclosed by the registrant in this report is recorded, processed, summarized and reported within the time periods specified in the Commission's rules and forms.
(b) Changes in internal control over financial reporting: Not applicable
Item 12. Exhibits:
(a)(1) Not applicable
(a)(2) Separate certifications for the principal executive officer and principal financial officer of the registrant as required by Rule 30a-2(a) under the Investment Company Act of 1940, as amended, are filed herewith.
(b) The certifications required by Rule 30a-2(b) under the Investment Company Act of 1940, as amended, are filed herewith.
Putnam Voyager Fund
By (Signature and Title):
/s/Janet C. Smith
Janet C. Smith
Principal Accounting Officer
Date: March 31, 2011
Pursuant to the requirements of the Securities Exchange Act of 1934 and the Investment Company Act of 1940, this report has been signed below by the following persons on behalf of the registrant and in the capacities and on the dates indicated.
By (Signature and Title):
/s/Jonathan S. Horwitz
Jonathan S. Horwitz
Principal Executive Officer
Date: March 31, 2011
By (Signature and Title):
/s/Steven D. Krichmar
Steven D. Krichmar
Principal Financial Officer
Date: March 31, 2011