CERTIFIED SHAREHOLDER REPORT OF REGISTERED MANAGEMENT INVESTMENT COMPANIES
Investment Company Act file number:
(811-01682)
Exact name of registrant as specified in charter:
Putnam Voyager Fund
Address of principal executive offices:
One Post Office Square, Boston, Massachusetts 02109
Name and address of agent for service:
Robert T. Burns, Vice President One Post Office Square Boston, Massachusetts 02109
Copy to:
Bryan Chegwidden, Esq. Ropes & Gray LLP 1211 Avenue of the Americas New York, New York 10036
Registrant’s telephone number, including area code:
(617) 292-1000
Date of fiscal year end:
July 31, 2014
Date of reporting period :
August 1, 2013 — July 31, 2014
Item 1. Report to Stockholders:
The following is a copy of the report transmitted to stockholders pursuant to Rule 30e-1 under the Investment Company Act of 1940:
Putnam Voyager Fund
Annual report 7 | 31 | 14
Message from the Trustees
1
About the fund
2
Performance snapshot
4
Interview with your fund’s portfolio manager
5
Your fund’s performance
10
Your fund’s expenses
13
Terms and definitions
15
Other information for shareholders
16
Important notice regarding Putnam’s privacy policy
17
Trustee approval of management contract
18
Financial statements
24
Federal tax information
56
Shareholder meeting results
57
About the Trustees
58
Officers
60
Consider these risks before investing: Investments in small and/or midsize companies increase the risk of greater price fluctuations. Growth stocks may be more susceptible to earnings disappointments, and the market may not favor growth-style investing. Stock prices may fall or fail to rise over time for several reasons, including general financial market conditions and factors related to a specific issuer or industry. You can lose money by investing in the fund.
Message from the Trustees
Dear Fellow Shareholder:
The first half of 2014 proved to be an exceptional time for U.S. equities, with markets exhibiting great resilience in the face of rising geopolitical strife around the world. Then, after hovering near record lows earlier in the year, volatility spiked in mid-summer, generated by escalating military conflicts in Ukraine, Iraq, and Gaza, as well as concern that the U.S. Federal Reserve would raise interest rates sooner than expected because of an improving U.S. economy.
We believe that the fundamentals of the U.S. economy and equity markets are sound. Unemployment has declined significantly and second-quarter GDP growth has reaccelerated after the weather-related slowdown in the first three months of 2014. The stock market advance appears to be on solid footing, in our opinion, with valuations in the middle of their historic ranges, a strong corporate earnings outlook, and a rise in merger-and-acquisition activity. Moreover, government bonds have generally performed well, as have other fixed-income securities.
Abroad, however, we note headwinds. Unemployment in Europe remains stubbornly high. Also, the European Union has imposed economic sanctions on Russia as a penalty for its annexation of Ukraine’s Crimea region, and these appear to be having a negative impact on Europe’s tentative recovery, which stalled in the second quarter.
The recent uptick in volatility and modest stock market retreat serve as a clear reminder that markets will experience inevitable ups and downs. That’s why Putnam offers a wide range of strategies for all environments, including products designed to manage risk during periods of higher volatility. As we advance into the second half of the year, we encourage you to meet with your financial advisor to ensure that your portfolio is properly diversified and aligned with your objectives and tolerance for risk.
As always, thank you for investing with Putnam.
Respectfully yours,
Robert L. Reynolds President and Chief Executive Officer Putnam Investments
Jameson A. Baxter Chair, Board of Trustees
September 8, 2014
Performance snapshot
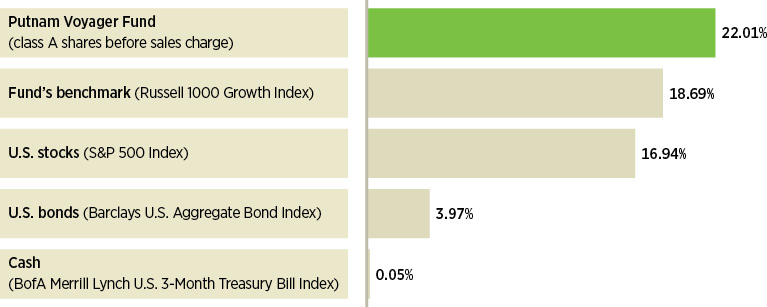
Annualized total return (%) comparison as of 7/31/14
Current performance may be lower or higher than the quoted past performance, which cannot guarantee future results. Share price, principal value, and return will fluctuate, and you may have a gain or a loss when you sell your shares. Performance of class A shares assumes reinvestment of distributions and does not account for taxes. Fund returns in the bar chart do not reflect a sales charge of 5.75%; had they, returns would have been lower. See pages 5 and 10–12 for additional performance information. For a portion of the periods, the fund had expense limitations, without which returns would have been lower. To obtain the most recent month-end performance, visit putnam.com.
* The fund’s benchmark, the Russell 1000 Growth Index, was introduced on 12/31/78, which post-dates the inception of the fund’s class A shares.
4 Voyager Fund
Interview with your fund’s portfolio manager
Nick C. Thakore
Could you describe the investing environment for the 12 months ended July 31, 2014?
With the exception of January and July, the period offered favorable conditions for investing in stocks. The market ended the 2013 calendar year in a position of strength, as continued economic growth propelled U.S. stocks to extend their rally and deliver record-setting performance. The start of 2014 brought a bout of volatility when investors grew concerned about turmoil in emerging markets and mixed economic signals in the United States. Subsequent analysis suggested that harsh winter weather in many regions of the United States might also have played a role in dampening first-quarter economic growth. Markets remained choppy through April and declined sharply at the end of July, but managed to deliver solid double-digit gains for the period overall.
How did the fund perform for the period?
I am pleased to report that the fund delivered a solid positive return and outperformed both its benchmark, the Russell 1000 Growth Index, and the average return for funds within its Lipper peer group, Large-Cap Growth Funds.
The primary driver of performance was stock selection, which is the foundation of our investment process. For much of the previous three years, the market had not been rewarding the types of stocks I target, but this finally began to change during this 12-month period.
Broad market index and fund performance
This comparison shows your fund’s performance in the context of broad market indexes for the 12 months ended 7/31/14. See pages 4 and 10–12 for additional fund performance information. Index descriptions can be found on page 15.
Voyager Fund 5
Can you provide more detail about the market’s transition to the types of stocks you target?
It is always important to consider what is going on under the surface of the market. In 2011 and portions of 2012, many stocks in cyclical sectors were left behind as investors favored the yield potential and perceived safety of defensive stocks. We had record-low interest rates, the last sharp market downturn was still fresh in investors’ minds, and the market was driven by anxiety over macroeconomic risks. During these periods, stocks were moving in contrast to the normal relationships between prices, fundamentals, and valuation. Even in periods when the market was advancing sharply, cyclical stocks continued to underperform, despite strong earnings growth for many cyclical businesses. In 2013, this trend began to reverse, and many fund holdings that I believed offered a combination of attractive growth potential and reasonable valuations have since been rewarded.
What were some stocks that bolstered fund performance for the period?
In terms of sectors, the strongest performance came from information technology holdings, followed by consumer staples, where a large underweight position relative to the benchmark proved prudent when the sector lagged.
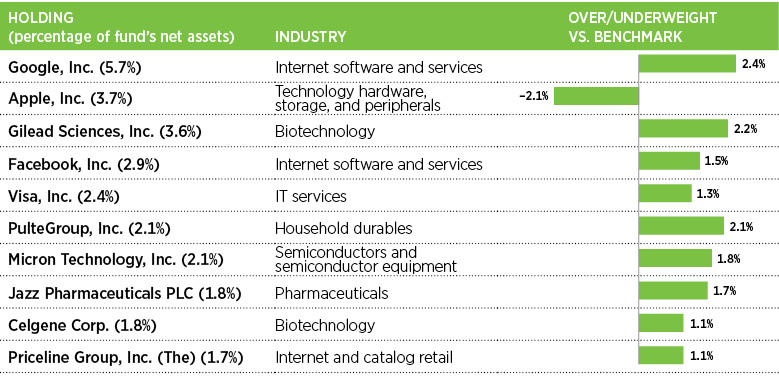
In the information technology sector, an out-of-benchmark position in semiconductor company Micron Technology was the fund’s top contributor to relative performance. The stock soared after the firm announced that second quarter 2014 revenues had risen considerably due to higher revenues from its DRAM memory products, positive
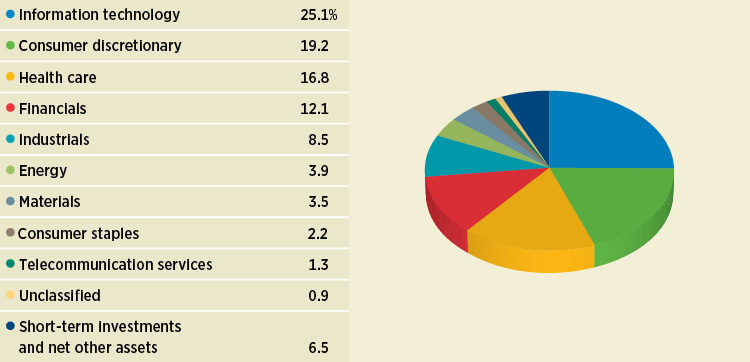
Sector allocations
Allocations are shown as a percentage of the fund’s net assets as of 7/31/14. Short-term investments and net other assets, if any, represent the market value weights of cash, derivatives, short-term securities, and other unclassified assets in the portfolio. Summary information may differ from the portfolio schedule included in the financial statements due to the inclusion of derivative securities, any interest accruals, the exclusion of as-of trades, if any, and the use of different classifications of securities for presentation purposes. Holdings and allocations may vary over time.
* The unclassified sector includes exchange-traded funds and other securities not able to be classified by sector.
6 Voyager Fund
“The primary driver of performance was stock selection, which is the foundation of our investment process.”
Nick Thakore
market conditions, and favorable operating performance. An overweight position in Facebook, which announced solid earnings based on strong advertising revenues, also buoyed fund returns, and shares of Apple rose substantially after the firm announced earnings that beat expectations, driven by strong iPhone sales.
Health-care holdings also proved beneficial to relative performance. The most notable example was Gilead Sciences, a biotechnology company. Gilead’s stock soared after the company reported strong quarterly results mainly driven by Sovaldi, its new hepatitis C virus drug. The drug delivered sales of $2.3 billion in its first full quarter on the market.
Could you provide examples of strategies or holdings that detracted from fund performance for the period?
The consumer discretionary and financial sectors detracted most from the fund’s relative results during the period. Among consumer discretionary holdings, a position in for-profit educational organization ITT Educational Services was the fund’s largest detractor. An out-of-benchmark position in travel company Thomas Cook declined significantly due to concerns about a slowdown in European leisure and business travel. An underweight position in benchmark heavyweight Microsoft also detracted from relative performance when the company’s stock rose
Top 10 holdings
This table shows the fund’s top 10 holdings by percentage of the fund’s net assets as of 7/31/14. Short-term holdings and derivatives, if any, are excluded. Holdings may vary over time.
Voyager Fund 7
sharply over the period. Weak same-store sales led fund holding Best Buy to underperform, and we had eliminated this position from the fund by the close of the period.
As the fund enters a new fiscal year, what is your outlook?
From a fundamental perspective, U.S. economic growth has been accelerating, and I believe the corporate earnings outlook is solid. Valuations for stocks, in my view, are reasonable, particularly considering the level of interest rates. However, the U.S. stock market has been rallying for quite some time and, although I believe the market’s advance was rational, we are keeping an eye on sectors or stocks whose valuations may have become stretched. Within the Russell 1000 Growth universe, there has been a subset of momentum growth stocks that have had significant multiyear rallies. Their valuations advanced to extreme levels, and many of these stocks corrected sharply.
We believe, however, that these selloffs were not the result of company-specific problems, and whenever declines are unrelated to fundamentals, it creates opportunity. When researching these stocks, we are focused on finding strong growth potential combined with attractive valuations. An example of this is in the biotechnology sector, where, after a sharp correction, several stocks reached valuations below the market average, based on projected 2015 earnings, despite far superior growth outlooks.
Another positive factor for stocks, in my view, is the tremendous amount of merger-and-acquisition activity in today’s market. Many of these deals are accretive, meaning
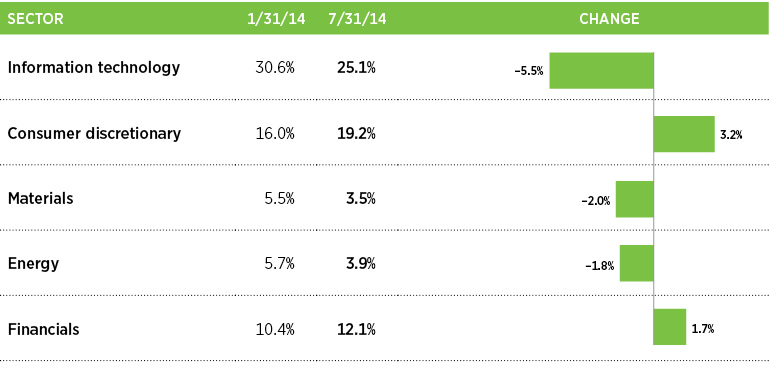
Comparison of top sector shifts
This chart shows the fund’s largest allocation shifts, by percentage, over the past six months. Allocations are shown as a percentage of the fund’s net assets. Current period summary information may differ from the portfolio schedule included in the financial statements due to the inclusion of derivative securities, any interest accruals, the exclusion of as-of trades, if any, and the use of different classifications of securities for presentation purposes. Holdings and allocations may vary over time.
8 Voyager Fund
they should elevate the earnings growth of the companies involved. Additionally, share buybacks are quite significant, and these, too, can contribute to earnings growth. While I would not describe earnings potential as explosive, I believe there is room for improvement as long as economic growth remains supportive. Based on the earnings that companies have delivered and still-reasonable stock valuations, I believe U.S. stocks still offer potential.
Thank you, Nick, for your time and insights today.
The views expressed in this report are exclusively those of Putnam Management and are subject to change. They are not meant as investment advice.
Please note that the holdings discussed in this report may not have been held by the fund for the entire period. Portfolio composition is subject to review in accordance with the fund’s investment strategy and may vary in the future. Current and future portfolio holdings are subject to risk.
Portfolio Manager Nick C. Thakore is Co-Head of U.S. Equities at Putnam. He has an M.B.A. from the University of Pennsylvania Wharton School of Business and a B.B.A. from the University of Michigan. Nick joined Putnam in 2008 and has been in the investment industry since 1993.
IN THE NEWS
Since Russia’s annexation of Ukraine’s Crimea region in March, economic sanctions have escalated between Russia and the West. Russia’s weapons arsenal in this battle has included import bans on agricultural goods like U.S. chicken, Norwegian salmon, Dutch cheese, and Polish apples. As a minor trading partner of Russia, the United States will likely see little economic impact, but the sanctions come at a difficult time for Europe’s agricultural sector and the eurozone’s anemic economic recovery. Also harmed will be the Russian consumer, who will wind up paying more for goods as supplies dwindle. While Western sanctions earlier this year targeted Russia’s banks, and its military and oil industries, Russia fired a retaliatory salvo in consumer sectors in early August, banning the import of meat, fish, dairy products, and other agricultural products from nations that have imposed sanctions on Russia. For now, disruption of the trade in Russian natural gas, vitally important to Russia’s export earnings and to Europe’s energy supply, appears to be off the table. But if the Ukrainian situation should deteriorate, sanctions in this critical sector could have far-reaching effects on both sides.
Voyager Fund 9
Your fund’s performance
This section shows your fund’s performance, price, and distribution information for periods ended July 31, 2014, the end of its most recent fiscal year. In accordance with regulatory requirements for mutual funds, we also include performance information as of the most recent calendar quarter-end and expense information taken from the fund’s current prospectus. Performance should always be considered in light of a fund’s investment strategy. Data represent past performance. Past performance does not guarantee future results. More recent returns may be less or more than those shown. Investment return and principal value will fluctuate, and you may have a gain or a loss when you sell your shares. Performance information does not reflect any deduction for taxes a shareholder may owe on fund distributions or on the redemption of fund shares. For the most recent month-end performance, please visit the Individual Investors section at putnam.com or call Putnam at 1-800-225-1581. Class R, R5, R6, and Y shares are not available to all investors. See the Terms and Definitions section in this report for definitions of the share classes offered by your fund.
Fund performance Total return for periods ended 7/31/14
Class A
Class B
Class C
Class M
Class R
Class R5
Class R6
Class Y
(inception dates)
(4/1/69)
(4/27/92)
(7/26/99)
(12/1/94)
(1/21/03)
(7/2/12)
(7/2/12)
(3/31/94)
Before sales charge
After sales charge
Before CDSC
After CDSC
Before CDSC
After CDSC
Before sales charge
After sales charge
Net asset value
Net asset value
Net asset value
Net asset value
Annual average
(life of fund)
10.88%
10.74%
10.69%
10.69%
10.05%
10.05%
10.20%
10.12%
10.61%
11.02%
11.02%
11.01%
10 years
122.90
110.08
109.93
109.93
106.87
106.87
112.02
104.60
117.45
129.08
129.59
128.57
Annual average
8.35
7.71
7.70
7.70
7.54
7.54
7.80
7.42
8.08
8.64
8.67
8.62
5 years
98.74
87.31
91.40
89.40
91.38
91.38
93.75
86.97
96.25
101.71
102.16
101.26
Annual average
14.72
13.37
13.86
13.63
13.86
13.86
14.14
13.33
14.44
15.07
15.12
15.01
3 years
44.93
36.59
41.74
38.74
41.75
41.75
42.79
37.80
43.86
46.35
46.68
46.02
Annual average
13.17
10.95
12.33
11.53
12.33
12.33
12.61
11.28
12.89
13.54
13.62
13.45
1 year
22.01
14.99
21.13
16.13
21.12
20.12
21.37
17.12
21.70
22.39
22.53
22.33
Current performance may be lower or higher than the quoted past performance, which cannot guarantee future results. After-sales-charge returns for class A and M shares reflect the deduction of the maximum 5.75% and 3.50% sales charge, respectively, levied at the time of purchase. Class B share returns after contingent deferred sales charge (CDSC) reflect the applicable CDSC, which is 5% in the first year, declining over time to 1% in the sixth year, and is eliminated thereafter. Class C share returns after CDSC reflect a 1% CDSC for the first year that is eliminated thereafter. Class R, R5, R6, and Y shares have no initial sales charge or CDSC. Performance for class B, C, M, R, and Y shares before their inception is derived from the historical performance of class A shares, adjusted for the applicable sales charge (or CDSC) and the higher operating expenses for such shares, except for class Y shares, for which 12b-1 fees are not applicable. Performance for class R5 and R6 shares prior to their inception is derived from the historical performance of class Y shares and has not been adjusted for the lower investor servicing fees applicable to class R5 and R6 shares; had it, returns would have been higher.
Recent performance may have benefited from one or more legal settlements.
For a portion of the periods, the fund had expense limitations, without which returns would have been lower.
Class B share performance reflects conversion to class A shares after eight years.
10 Voyager Fund
Comparative index returns For periods ended 7/31/14
Russell 1000 Growth Index
Lipper Large-Cap Growth Funds category average*
Annual average (life of fund)
—†
9.72%
10 years
129.44%
117.73
Annual average
8.66
8.02
5 years
121.61
106.16
Annual average
17.25
15.50
3 years
56.30
49.80
Annual average
16.05
14.38
1 year
18.69
18.20
Index and Lipper results should be compared with fund performance before sales charge, before CDSC, or at net asset value.
*Over the 1-year, 3-year, 5-year, 10-year, and life-of-fund periods ended 7/31/14, there were 728, 611, 545, 378, and 8 funds, respectively, in this Lipper category.
†The fund’s benchmark, the Russell 1000 Growth Index, was introduced on 12/31/78, which post-dates the inception of the fund’s class A shares.
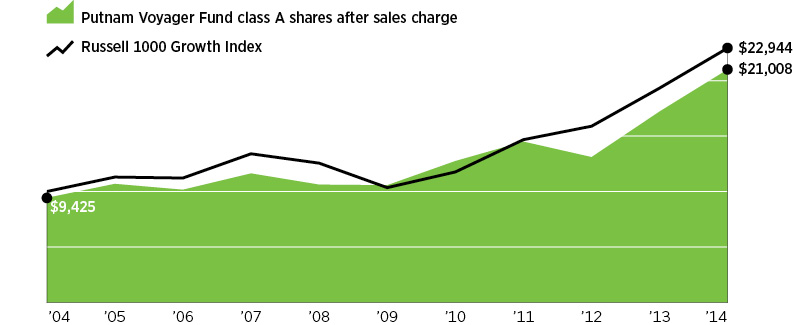
Change in the value of a $10,000 investment ($9,425 after sales charge)
Cumulative total return from 7/31/04 to 7/31/14
Past performance does not indicate future results. At the end of the same time period, a $10,000 investment in the fund’s class B and class C shares would have been valued at $20,993 and $20,687, respectively, and no contingent deferred sales charges would apply. A $10,000 investment in the fund’s class M shares ($9,650 after sales charge) would have been valued at $20,460. A $10,000 investment in the fund’s class R, R5, R6, and Y shares would have been valued at $21,745, $22,908, $22,959, and $22,857, respectively.
Voyager Fund 11
Fund price and distribution information For the 12-month period ended 7/31/14
Distributions
Class A
Class B
Class C
Class M
Class R
Class R5
Class R6
Class Y
Number
1
1
1
1
1
1
1
1
Income
$0.271
$0.112
$0.084
$0.156
$0.190
$0.369
$0.400
$0.334
Capital gains
—
—
—
—
—
—
—
—
Total
$0.271
$0.112
$0.084
$0.156
$0.190
$0.369
$0.400
$0.334
Share value
Before sales charge
After sales charge
Net asset value
Net asset value
Before sales charge
After sales charge
Net asset value
Net asset value
Net asset value
Net asset value
7/31/13
$26.76
$28.39
$22.43
$24.67
$24.55
$25.44
$26.23
$28.07
$28.09
$27.98
7/31/14
32.36
34.33
27.05
29.79
29.63
30.70
31.72
33.96
33.99
33.87
The classification of distributions, if any, is an estimate. Before-sales-charge share value and current dividend rate for class A and M shares, if applicable, do not take into account any sales charge levied at the time of purchase. After-sales-charge share value, current dividend rate, and current 30-day SEC yield, if applicable, are calculated assuming that the maximum sales charge (5.75% for class A shares and 3.50% for class M shares) was levied at the time of purchase. Final distribution information will appear on your year-end tax forms.
Fund performance as of most recent calendar quarter Total return for periods ended 6/30/14
Class A
Class B
Class C
Class M
Class R
Class R5
Class R6
Class Y
(inception dates)
(4/1/69)
(4/27/92)
(7/26/99)
(12/1/94)
(1/21/03)
(7/2/12)
(7/2/12)
(3/31/94)
Before sales charge
After sales charge
Before CDSC
After CDSC
Before CDSC
After CDSC
Before sales charge
After sales charge
Net asset value
Net asset value
Net asset value
Net asset value
Annual average
(life of fund)
10.98%
10.83%
10.78%
10.78%
10.14%
10.14%
10.29%
10.21%
10.70%
11.11%
11.11%
11.10%
10 years
115.69
103.29
103.19
103.19
100.08
100.08
105.17
97.99
110.37
121.69
122.18
121.21
Annual average
7.99
7.35
7.35
7.35
7.18
7.18
7.45
7.07
7.72
8.29
8.31
8.26
5 years
121.91
109.15
113.59
111.59
113.57
113.57
116.37
108.80
119.09
125.06
125.56
124.57
Annual average
17.28
15.90
16.39
16.17
16.39
16.39
16.69
15.86
16.98
17.61
17.67
17.56
3 years
44.79
36.47
41.50
38.50
41.56
41.56
42.62
37.63
43.65
46.14
46.46
45.82
Annual average
13.13
10.92
12.27
11.47
12.28
12.28
12.56
11.23
12.83
13.48
13.56
13.40
1 year
35.23
27.46
34.19
29.19
34.19
33.19
34.49
29.79
34.82
35.63
35.77
35.55
See the discussion following the fund performance table on page 10 for information about the calculation of fund performance.
12 Voyager Fund
Your fund’s expenses
As a mutual fund investor, you pay ongoing expenses, such as management fees, distribution fees (12b-1 fees), and other expenses. Using the following information, you can estimate how these expenses affect your investment and compare them with the expenses of other funds. You may also pay one-time transaction expenses, including sales charges (loads) and redemption fees, which are not shown in this section and would have resulted in higher total expenses. For more information, see your fund’s prospectus or talk to your financial representative.
Expense ratios
Class A
Class B
Class C
Class M
Class R
Class R5
Class R6
Class Y
Total annual operating expenses for the fiscal year ended 7/31/13
1.01%
1.76%
1.76%
1.51%
1.26%
0.64%
0.54%
0.76%
Annualized expense ratio for the six-month period ended 7/31/14*†
0.96%
1.71%
1.71%
1.46%
1.21%
0.65%
0.55%
0.71%
Fiscal-year expense information in this table is taken from the most recent prospectus, is subject to change, and may differ from that shown for the annualized expense ratio and in the financial highlights of this report.
Prospectus expense information also includes the impact of acquired fund fees and expenses of 0.01%, which is not included in the financial highlights or annualized expense ratios. Expenses are shown as a percentage of average net assets.
*For the fund’s most recent fiscal half year; may differ from expense ratios based on one-year data in the financial highlights.
†Includes a decrease of 0.10% from annualizing the performance fee adjustment for the six months ended 7/31/14.
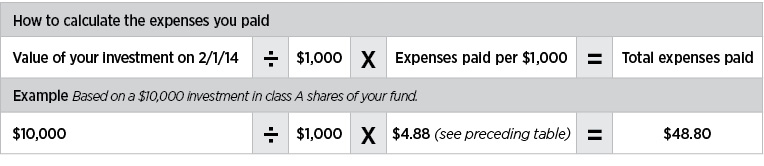
Expenses per $1,000
The following table shows the expenses you would have paid on a $1,000 investment in the fund from February 1, 2014, to July 31, 2014. It also shows how much a $1,000 investment would be worth at the close of the period, assuming actual returns and expenses.
Class A
Class B
Class C
Class M
Class R
Class R5
Class R6
Class Y
Expenses paid per $1,000*†
$4.88
$8.67
$8.67
$7.41
$6.14
$3.31
$2.80
$3.61
Ending value (after expenses)
$1,049.60
$1,046.00
$1,046.00
$1,047.00
$1,048.20
$1,051.10
$1,052.00
$1,050.90
*Expenses for each share class are calculated using the fund’s annualized expense ratio for each class, which represents the ongoing expenses as a percentage of average net assets for the six months ended 7/31/14. The expense ratio may differ for each share class.
†Expenses are calculated by multiplying the expense ratio by the average account value for the period; then multiplying the result by the number of days in the period; and then dividing that result by the number of days in the year.
Voyager Fund 13
Estimate the expenses you paid
To estimate the ongoing expenses you paid for the six months ended July 31, 2014, use the following calculation method. To find the value of your investment on February 1, 2014, call Putnam at 1-800-225-1581.
Compare expenses using the SEC’s method
The Securities and Exchange Commission (SEC) has established guidelines to help investors assess fund expenses. Per these guidelines, the following table shows your fund’s expenses based on a $1,000 investment, assuming a hypothetical 5% annualized return. You can use this information to compare the ongoing expenses (but not transaction expenses or total costs) of investing in the fund with those of other funds. All mutual fund shareholder reports will provide this information to help you make this comparison. Please note that you cannot use this information to estimate your actual ending account balance and expenses paid during the period.
Class A
Class B
Class C
Class M
Class R
Class R5
Class R6
Class Y
Expenses paid per $1,000*†
$4.81
$8.55
$8.55
$7.30
$6.06
$3.26
$2.76
$3.56
Ending value (after expenses)
$1,020.03
$1,016.31
$1,016.31
$1,017.55
$1,018.79
$1,021.57
$1,022.07
$1,021.27
*Expenses for each share class are calculated using the fund’s annualized expense ratio for each class, which represents the ongoing expenses as a percentage of average net assets for the six months ended 7/31/14. The expense ratio may differ for each share class.
†Expenses are calculated by multiplying the expense ratio by the average account value for the six-month period; then multiplying the result by the number of days in the six-month period; and then dividing that result by the number of days in the year.
14 Voyager Fund
Terms and definitions
Important terms
Total return shows how the value of the fund’s shares changed over time, assuming you held the shares through the entire period and reinvested all distributions in the fund.
Before sales charge, or net asset value, is the price, or value, of one share of a mutual fund, without a sales charge. Before-sales-charge figures fluctuate with market conditions, and are calculated by dividing the net assets of each class of shares by the number of outstanding shares in the class.
After sales charge is the price of a mutual fund share plus the maximum sales charge levied at the time of purchase. After-sales-charge performance figures shown here assume the 5.75% maximum sales charge for class A shares and 3.50% for class M shares.
Contingent deferred sales charge (CDSC) is generally a charge applied at the time of the redemption of class B or C shares and assumes redemption at the end of the period. Your fund’s class B CDSC declines over time from a 5% maximum during the first year to 1% during the sixth year. After the sixth year, the CDSC no longer applies. The CDSC for class C shares is 1% for one year after purchase.
Share classes
Class A shares are generally subject to an initial sales charge and no CDSC (except on certain redemptions of shares bought without an initial sales charge).
Class B shares are not subject to an initial sales charge. They may be subject to a CDSC.
Class C shares are not subject to an initial sales charge and are subject to a CDSC only if the shares are redeemed during the first year.
Class M shares have a lower initial sales charge and a higher 12b-1 fee than class A shares and no CDSC (except on certain redemptions of shares bought without an initial sales charge).
Class R shares are not subject to an initial sales charge or CDSC and are available only to certain employer-sponsored retirement plans.
Class R5 shares and class R6 shares are not subject to an initial sales charge or CDSC, and carry no 12b-1 fee. They are only available to employer-sponsored retirement plans.
Class Y shares are not subject to an initial sales charge or CDSC, and carry no 12b-1 fee. They are generally only available to corporate and institutional clients and clients in other approved programs.
Comparative indexes
Barclays U.S. Aggregate Bond Index is an unmanaged index of U.S. investment-grade fixed-income securities.
BofA Merrill Lynch U.S. 3-Month Treasury Bill Index is an unmanaged index that seeks to measure the performance of U.S. Treasury bills available in the marketplace.
Russell 1000 Growth Index is an unmanaged index of those companies in the large-cap Russell 1000 Index chosen for their growth orientation.
S&P 500 Index is an unmanaged index of common stock performance.
Indexes assume reinvestment of all distributions and do not account for fees. Securities and performance of a fund and an index will differ. You cannot invest directly in an index.
Lipper is a third-party industry-ranking entity that ranks mutual funds. Its rankings do not reflect sales charges. Lipper rankings are based on total return at net asset value relative to other funds that have similar current investment styles or objectives as determined by Lipper. Lipper may change a fund’s category assignment at its discretion. Lipper category averages reflect performance trends for funds within a category.
Voyager Fund 15
Other information for shareholders
Proxy voting
Putnam is committed to managing our mutual funds in the best interests of our shareholders. The Putnam funds’ proxy voting guidelines and procedures, as well as information regarding how your fund voted proxies relating to portfolio securities during the 12-month period ended June 30, 2014, are available in the Individual Investors section of putnam.com, and on the Securities and Exchange Commission (SEC) website, www.sec.gov. If you have questions about finding forms on the SEC’s website, you may call the SEC at 1-800-SEC-0330. You may also obtain the Putnam funds’ proxy voting guidelines and procedures at no charge by calling Putnam’s Shareholder Services at 1-800-225-1581.
Fund portfolio holdings
The fund will file a complete schedule of its portfolio holdings with the SEC for the first and third quarters of each fiscal year on Form N-Q. Shareholders may obtain the fund’s Forms N-Q on the SEC’s website at www.sec.gov. In addition, the fund’s Forms N-Q may be reviewed and copied at the SEC’s Public Reference Room in Washington, D.C. You may call the SEC at 1-800-SEC-0330 for information about the SEC’s website or the operation of the Public Reference Room.
Trustee and employee fund ownership
Putnam employees and members of the Board of Trustees place their faith, confidence, and, most importantly, investment dollars in Putnam mutual funds. As of July 31, 2014, Putnam employees had approximately $486,000,000 and the Trustees had approximately $134,000,000 invested in Putnam mutual funds. These amounts include investments by the Trustees’ and employees’ immediate family members as well as investments through retirement and deferred compensation plans.
16 Voyager Fund
Important notice regarding Putnam’s privacy policy
In order to conduct business with our shareholders, we must obtain certain personal information such as account holders’ names, addresses, Social Security numbers, and dates of birth. Using this information, we are able to maintain accurate records of accounts and transactions.
It is our policy to protect the confidentiality of our shareholder information, whether or not a shareholder currently owns shares of our funds. In particular, it is our policy not to sell information about you or your accounts to outside marketing firms. We have safeguards in place designed to prevent unauthorized access to our computer systems and procedures to protect personal information from unauthorized use.
Under certain circumstances, we must share account information with outside vendors who provide services to us, such as mailings and proxy solicitations. In these cases, the service providers enter into confidentiality agreements with us, and we provide only the information necessary to process transactions and perform other services related to your account. Finally, it is our policy to share account information with your financial representative, if you’ve listed one on your Putnam account.
Voyager Fund 17
Trustee approval of management contract
General conclusions
The Board of Trustees of the Putnam funds oversees the management of each fund and, as required by law, determines annually whether to approve the continuance of your fund’s management contract with Putnam Investment Management, LLC (“Putnam Management”) and the sub-management contract with respect to your fund between Putnam Management and its affiliate, Putnam Investments Limited (“PIL”). The Board of Trustees, with the assistance of its Contract Committee, requests and evaluates all information it deems reasonably necessary under the circumstances in connection with its annual contract review. The Contract Committee consists solely of Trustees who are not “interested persons” (as this term is defined in the Investment Company Act of 1940, as amended (the “1940 Act”)) of the Putnam funds (“Independent Trustees”).
At the outset of the review process, members of the Board’s independent staff and independent legal counsel met with representatives of Putnam Management to review the annual contract review materials furnished to the Contract Committee during the course of the previous year’s review and to discuss possible changes in these materials that might be necessary or desirable for the coming year. Following these discussions and in consultation with the Contract Committee, the Independent Trustees’ independent legal counsel requested that Putnam Management furnish specified information, together with any additional information that Putnam Management considered relevant, to the Contract Committee. Over the course of several months ending in June 2014, the Contract Committee met on a number of occasions with representatives of Putnam Management, and separately in executive session, to consider the information that Putnam Management provided, as well as supplemental information provided in response to additional requests made by the Contract Committee. Throughout this process, the Contract Committee was assisted by the members of the Board’s independent staff and by independent legal counsel for the Putnam funds and the Independent Trustees.
In May 2014, the Contract Committee met in executive session to discuss and consider its preliminary recommendations with respect to the continuance of the contracts. At the Trustees’ June 20, 2014 meeting, the Contract Committee met in executive session with the other Independent Trustees to review a summary of the key financial, performance and other data that the Contract Committee considered in the course of its review. The Contract Committee then presented its written report, which summarized the key factors that the Committee had considered and set forth its final recommendations. The Contract Committee then recommended, and the Independent Trustees approved, the continuance of your fund’s management and sub-management contracts, effective July 1, 2014. (Because PIL is an affiliate of Putnam Management and Putnam Management remains fully responsible for all services provided by PIL, the Trustees have not attempted to evaluate PIL as a separate entity, and all subsequent references to Putnam Management below should be deemed to include reference to PIL as necessary or appropriate in the context.)
The Independent Trustees’ approval was based on the following conclusions:
•That the fee schedule in effect for your fund represented reasonable compensation in light of the nature and quality of the services being provided to the fund, the fees paid by competitive funds, and the costs incurred by Putnam Management in providing services to the fund; and
18 Voyager Fund
•That the fee schedule in effect for your fund represented an appropriate sharing between fund shareholders and Putnam Management of such economies of scale as may exist in the management of the fund at current asset levels.
These conclusions were based on a comprehensive consideration of all information provided to the Trustees and were not the result of any single factor. Some of the factors that figured particularly in the Trustees’ deliberations and how the Trustees considered these factors are described below, although individual Trustees may have evaluated the information presented differently, giving different weights to various factors. It is also important to recognize that the management arrangements for your fund and the other Putnam funds are the result of many years of review and discussion between the Independent Trustees and Putnam Management, that some aspects of the arrangements may receive greater scrutiny in some years than others, and that the Trustees’ conclusions may be based, in part, on their consideration of fee arrangements in previous years. For example, with some minor exceptions, the current fee arrangements under the management contracts for the Putnam funds were implemented at the beginning of 2010 following extensive review by the Contract Committee and discussions with representatives of Putnam Management, as well as approval by shareholders. Shareholders also voted overwhelmingly to approve these fee arrangements again in early 2014, when they were asked to approve new management contracts (with the same fees and substantially identical other provisions) following the possible termination of the previous management contracts as a result of the death of the Honorable Paul G. Desmarais. (Mr. Desmarais, both directly and through holding companies, controlled a majority of the voting shares of Power Corporation of Canada, which (directly and indirectly) is the majority owner of Putnam Management. Mr. Desmarais’ voting control of shares of Power Corporation of Canada was transferred to The Desmarais Family Residuary Trust upon his death and this transfer, as a technical matter, may have constituted an “assignment” within the meaning of the 1940 Act, causing the Putnam funds’ management contracts to terminate automatically.)
Management fee schedules and total expenses
The Trustees reviewed the management fee schedules in effect for all Putnam funds, including fee levels and breakpoints. The Trustees also reviewed the total expenses of each Putnam fund, recognizing that in most cases management fees represented the major, but not the sole, determinant of total costs to shareholders.
In reviewing fees and expenses, the Trustees generally focus their attention on material changes in circumstances — for example, changes in assets under management, changes in a fund’s investment style, changes in Putnam Management’s operating costs or profitability, or changes in competitive practices in the mutual fund industry — that suggest that consideration of fee changes might be warranted. The Trustees concluded that the circumstances did not warrant changes to the management fee structure of your fund.
Under its management contract, your fund has the benefit of breakpoints in its management fee schedule that provide shareholders with economies of scale in the form of reduced fee levels as assets under management in the Putnam family of funds increase. The Trustees concluded that the fee schedule in effect for your fund represented an appropriate sharing of economies of scale between fund shareholders and Putnam Management.
In addition, your fund’s management contract provides that its management fees will be adjusted up or down depending upon whether your fund’s performance is better or worse than the performance of an appropriate
Voyager Fund 19
index of securities prices specified in the management contract. In the course of reviewing investment performance, the Trustees examined the operation of your fund’s performance fees and concluded that these fees were operating effectively to align further Putnam Management’s economic interests with those of the fund’s shareholders.
As in the past, the Trustees also focused on the competitiveness of each fund’s total expense ratio. In order to ensure that expenses of the Putnam funds continue to meet competitive standards, the Trustees and Putnam Management have implemented certain expense limitations. These expense limitations were: (i) a contractual expense limitation applicable to all retail open-end funds of 32 basis points on investor servicing fees and expenses and (ii) a contractual expense limitation applicable to all open-end funds of 20 basis points on so-called “other expenses” (i.e., all expenses exclusive of management fees, investor servicing fees, distribution fees, investment-related expenses, interest, taxes, brokerage commissions, extraordinary expenses and acquired fund fees and expenses). These expense limitations serve in particular to maintain competitive expense levels for funds with large numbers of small shareholder accounts and funds with relatively small net assets. Most funds, including your fund, had sufficiently low expenses that these expense limitations did not apply. Putnam Management’s support for these expense limitation arrangements was an important factor in the Trustees’ decision to approve the continuance of your fund’s management and sub-management contracts.
The Trustees reviewed comparative fee and expense information for a custom group of competitive funds selected by Lipper Inc. (“Lipper”). This comparative information included your fund’s percentile ranking for effective management fees and total expenses (excluding any applicable 12b-1 fee), which provides a general indication of your fund’s relative standing. In the custom peer group, your fund ranked in the first quintile in effective management fees (determined for your fund and the other funds in the custom peer group based on fund asset size and the applicable contractual management fee schedule) and in the first quintile in total expenses (excluding any applicable 12b-1 fees) as of December 31, 2013 (the first quintile representing the least expensive funds and the fifth quintile the most expensive funds). The fee and expense data reported by Lipper as of December 31, 2013 reflected the most recent fiscal year-end data available in Lipper’s database at that time.
In connection with their review of the management fees and total expenses of the Putnam funds, the Trustees also reviewed the costs of the services provided and the profits realized by Putnam Management and its affiliates from their contractual relationships with the funds. This information included trends in revenues, expenses and profitability of Putnam Management and its affiliates relating to the investment management, investor servicing and distribution services provided to the funds. In this regard, the Trustees also reviewed an analysis of Putnam Management’s revenues, expenses and profitability, allocated on a fund-by-fund basis, with respect to the funds’ management, distribution, and investor servicing contracts. For each fund, the analysis presented information about revenues, expenses and profitability for each of the agreements separately and for the agreements taken together on a combined basis. The Trustees concluded that, at current asset levels, the fee schedules in place represented reasonable compensation for the services being provided and represented an appropriate sharing of such economies of scale as may exist in the management of the Putnam funds at that time.
The information examined by the Trustees as part of their annual contract review for the
20 Voyager Fund
Putnam funds has included for many years information regarding fees charged by Putnam Management and its affiliates to institutional clients such as defined benefit pension plans, college endowments, and the like. This information included comparisons of those fees with fees charged to the Putnam funds, as well as an assessment of the differences in the services provided to these different types of clients. The Trustees observed that the differences in fee rates between institutional clients and mutual funds are by no means uniform when examined by individual asset sectors, suggesting that differences in the pricing of investment management services to these types of clients may reflect historical competitive forces operating in separate markets. The Trustees considered the fact that in many cases fee rates across different asset classes are higher on average for mutual funds than for institutional clients, as well as the differences between the services that Putnam Management provides to the Putnam funds and those that it provides to its institutional clients. The Trustees did not rely on these comparisons to any significant extent in concluding that the management fees paid by your fund are reasonable.
Investment performance
The quality of the investment process provided by Putnam Management represented a major factor in the Trustees’ evaluation of the quality of services provided by Putnam Management under your fund’s management contract. The Trustees were assisted in their review of the Putnam funds’ investment process and performance by the work of the investment oversight committees of the Trustees, which meet on a regular basis with the funds’ portfolio teams and with the Chief Investment Officer and other senior members of Putnam Management’s Investment Division throughout the year. The Trustees concluded that Putnam Management generally provides a high-quality investment process — based on the experience and skills of the individuals assigned to the management of fund portfolios, the resources made available to them, and in general Putnam Management’s ability to attract and retain high-quality personnel — but also recognized that this does not guarantee favorable investment results for every fund in every time period.
The Trustees considered that 2013 was a year of strong competitive performance for many of the Putnam funds, with only a relatively small number of exceptions. They noted that this strong performance was exemplified by the fact that the Putnam funds were recognized by Barron’s as the second-best performing mutual fund complex for both 2013 and the five-year period ended December 31, 2013. They also noted, however, the disappointing investment performance of some funds for periods ended December 31, 2013 and considered information provided by Putnam Management regarding the factors contributing to the underperformance and actions being taken to improve the performance of these particular funds. The Trustees indicated their intention to continue to monitor performance trends to assess the effectiveness of these efforts and to evaluate whether additional actions to address areas of underperformance are warranted.
For purposes of evaluating investment performance, the Trustees generally focus on competitive industry rankings for the one-year, three-year and five-year periods. For a number of Putnam funds with relatively unique investment mandates for which meaningful competitive performance rankings are not considered available, the Trustees evaluated performance based on comparisons of their returns with the returns of selected investment benchmarks. In the case of your fund, the Trustees considered that its class A share cumulative total return performance at net asset value was in the following quartiles of its Lipper peer group (Lipper Large-Cap Growth Funds) for the one-year, three-year and five-year periods
Voyager Fund 21
ended December 31, 2013 (the first quartile representing the best-performing funds and the fourth quartile the worst-performing funds):
One-year period
1st
Three-year period
4th
Five-year period
1st
For the one-year period ended December 31, 2013, your fund’s performance was in the top decile of its Lipper peer group. Over the one-year, three-year and five-year periods ended December 31, 2013, there were 723, 609 and 536 funds, respectively, in your fund’s Lipper peer group. (When considering performance information, shareholders should be mindful that past performance is not a guarantee of future results.)
The Trustees, while noting that your fund’s investment performance over the one-year and five-year periods ended December 31, 2013 had been favorable, expressed concern about your fund’s fourth quartile performance over the three-year period then ended and considered the circumstances that may have contributed to this disappointing performance. The Trustees considered Putnam Management’s view that the fund’s underperformance over the three-year period was due in significant part to the fund’s poor performance in 2011, which Putnam Management largely attributed to an emphasis on cyclical companies (those whose performance tends to be tied to overall economic conditions) and a de-emphasis on mega-cap companies at a time when non-cyclicals and mega-cap companies broadly outperformed other market segments, combined with poor stock selection in the information technology, financials, and consumer discretionary sectors.
The Trustees also observed that, although the fund had not performed well in 2011, the fund ranked in the top decile for the one-year period ended December 31, 2013 and in the top quartile for the five-year period then ended and that Putnam Management remained confident in the portfolio manager and his investment process. The Trustees also considered Putnam Management’s continued efforts to support fund performance through initiatives including structuring compensation for portfolio managers and research analysts to enhance accountability for fund performance, emphasizing accountability in the portfolio management process, and affirming its commitment to a fundamental-driven approach to investing. The Trustees noted further that Putnam Management continued to strengthen its fundamental research capabilities by adding new investment personnel.
As a general matter, the Trustees believe that cooperative efforts between the Trustees and Putnam Management represent the most effective way to address investment performance issues that may arise from time to time. The Trustees noted that investors in the Putnam funds have, in effect, placed their trust in the Putnam organization, under the oversight of the funds’ Trustees, to make appropriate decisions regarding the management of the funds. Based on past responsiveness of Putnam Management to Trustee concerns about investment performance, the Trustees concluded that it is preferable to seek change within Putnam Management to address performance shortcomings. In the Trustees’ view, the alternative of engaging a new investment adviser for an underperforming fund would entail significant disruptions and would not provide any greater assurance of improved investment performance.
Brokerage and soft-dollar allocations; investor servicing
The Trustees considered various potential benefits that Putnam Management may receive in connection with the services it provides under the management contract with your fund. These include benefits related to brokerage allocation and the use of soft dollars, whereby a portion of the commissions paid by a fund
22 Voyager Fund
for brokerage may be used to acquire research services that are expected to be useful to Putnam Management in managing the assets of the fund and of other clients. Subject to policies established by the Trustees, soft dollars generated by these means are used primarily to acquire brokerage and research services that enhance Putnam Management’s investment capabilities and supplement Putnam Management’s internal research efforts. However, the Trustees noted that a portion of available soft dollars continues to be used to pay fund expenses. The Trustees indicated their continued intent to monitor regulatory and industry developments in this area with the assistance of their Brokerage Committee and also indicated their continued intent to monitor the allocation of the Putnam funds’ brokerage in order to ensure that the principle of seeking best price and execution remains paramount in the portfolio trading process.
Putnam Management may also receive benefits from payments that the funds make to Putnam Management’s affiliates for investor or distribution services. In conjunction with the annual review of your fund’s management and sub-management contracts, the Trustees reviewed your fund’s investor servicing agreement with Putnam Investor Services, Inc. (“PSERV”) and its distributor’s contracts and distribution plans with Putnam Retail Management Limited Partnership (“PRM”), both of which are affiliates of Putnam Management. The Trustees concluded that the fees payable by the funds to PSERV and PRM, as applicable, for such services are reasonable in relation to the nature and quality of such services, the fees paid by competitive funds, and the costs incurred by PSERV and PRM, as applicable, in providing such services.
Voyager Fund 23
Financial statements
A note about your fund’s auditors
Between July 18, 2013 and December 16, 2013, which included a portion of your fund’s fiscal year, a non-U.S. member firm in PricewaterhouseCoopers LLP’s (“PwC”) global network of firms had an investment in certain non-U.S. funds that became affiliated with Putnam Investments as a result of the acquisition of the funds’ advisor by Putnam’s parent company, Great-West Lifeco Inc. The investment consisted of pension plan assets for the benefit of the member firm’s personnel. This investment is inconsistent with the SEC’s independence rules applicable to auditors. Although upon the disposition of the investment by the member firm on December 16, 2013, PwC and its affiliates took all necessary steps to eliminate this issue, the requirements of the SEC’s independence rules were not met for your fund’s fiscal year because the SEC’s rules require an audit firm to be independent for the entire fiscal year under audit. Based on its knowledge of the facts and its experience with PwC, the Audit and Compliance Committee of your fund’s Board of Trustees concluded that the investment by the PwC member firm would not affect PwC’s ability to render an objective audit opinion to your fund. Based on this conclusion and consideration of the potential risks that the disruption of a change of auditor could present, the Audit and Compliance Committee determined that PwC should continue to act as auditor for your fund.
These sections of the report, as well as the accompanying Notes, preceded by the Report of Independent Registered Public Accounting Firm, constitute the fund’s financial statements.
The fund’s portfolio lists all the fund’s investments and their values as of the last day of the reporting period. Holdings are organized by asset type and industry sector, country, or state to show areas of concentration and diversification.
Statement of assets and liabilities shows how the fund’s net assets and share price are determined. All investment and non-investment assets are added together. Any unpaid expenses and other liabilities are subtracted from this total. The result is divided by the number of shares to determine the net asset value per share, which is calculated separately for each class of shares. (For funds with preferred shares, the amount subtracted from total assets includes the liquidation preference of preferred shares.)
Statement of operations shows the fund’s net investment gain or loss. This is done by first adding up all the fund’s earnings — from dividends and interest income — and subtracting its operating expenses to determine net investment income (or loss). Then, any net gain or loss the fund realized on the sales of its holdings — as well as any unrealized gains or losses over the period — is added to or subtracted from the net investment result to determine the fund’s net gain or loss for the fiscal year.
Statement of changes in net assets shows how the fund’s net assets were affected by the fund’s net investment gain or loss, by distributions to shareholders, and by changes in the number of the fund’s shares. It lists distributions and their sources (net investment income or realized capital gains) over the current reporting period and the most recent fiscal year-end. The distributions listed here may not match the sources listed in the Statement of operations because the distributions are determined on a tax basis and may be paid in a different period from the one in which they were earned.
Financial highlights provide an overview of the fund’s investment results, per-share distributions, expense ratios, net investment income ratios, and portfolio turnover in one summary table, reflecting the five most recent reporting periods. In a semiannual report, the highlights table also includes the current reporting period.
24 Voyager Fund
Report of Independent Registered Public Accounting Firm
To the Trustees and Shareholders of Putnam Voyager Fund:
In our opinion, the accompanying statement of assets and liabilities, including the portfolio, and the related statements of operations and of changes in net assets and the financial highlights present fairly, in all material respects, the financial position of Putnam Voyager Fund (the “fund”) at July 31, 2014, and the results of its operations, the changes in its net assets and the financial highlights for each of the periods indicated, in conformity with accounting principles generally accepted in the United States of America. These financial statements and financial highlights (hereafter referred to as “financial statements”) are the responsibility of the fund’s management. Our responsibility is to express an opinion on these financial statements based on our audits. We conducted our audits of these financial statements in accordance with the standards of the Public Company Accounting Oversight Board (United States). Those standards require that we plan and perform the audit to obtain reasonable assurance about whether the financial statements are free of material misstatement. An audit includes examining, on a test basis, evidence supporting the amounts and disclosures in the financial statements, assessing the accounting principles used and significant estimates made by management, and evaluating the overall financial statement presentation. We believe that our audits, which included confirmation of investments owned at July 31, 2014 by correspondence with the custodian, brokers, and transfer agent, provide a reasonable basis for our opinion.
PricewaterhouseCoopers LLP Boston, Massachusetts September 8, 2014
Voyager Fund 25
The fund’s portfolio 7/31/14
COMMON STOCKS (90.7%)*
Shares
Value
Aerospace and defense (3.1%)
Airbus Group NV (France)
422,196
$24,415,626
General Dynamics Corp.
125,300
14,631,281
Honeywell International, Inc.
351,900
32,314,977
Northrop Grumman Corp.
141,200
17,405,724
Raytheon Co.
113,500
10,302,395
United Technologies Corp.
291,000
30,598,650
129,668,653
Airlines (1.6%)
American Airlines Group, Inc. †
773,800
30,062,130
Delta Air Lines, Inc.
1,035,810
38,801,443
68,863,573
Automobiles (1.0%)
General Motors Co.
665,600
22,510,592
Tesla Motors, Inc. † S
57,500
12,839,750
Toyota Motor Corp. (Japan)
139,500
8,252,602
43,602,944
Banks (3.5%)
Bank of America Corp.
2,268,800
34,599,200
Bank of Ireland (Ireland) †
12,708,416
4,503,059
Citigroup, Inc.
936,800
45,818,888
Dubai Islamic Bank PJSC (United Arab Emirates) †
5,443,024
11,376,124
Fifth Third Bancorp
199,600
4,087,808
JPMorgan Chase & Co.
518,500
29,901,895
Societe Generale SA (France)
168,752
8,432,793
SVB Financial Group †
34,704
3,783,430
Wells Fargo & Co.
84,300
4,290,870
146,794,067
Biotechnology (8.7%)
Aegerion Pharmaceuticals, Inc. † S
1,144,340
38,461,267
Biogen Idec, Inc. †
123,700
41,364,043
Celgene Corp. †
859,300
74,887,995
Cubist Pharmaceuticals, Inc. † S
521,000
31,728,900
Dynavax Technologies Corp. † S
5,170,700
7,652,636
Gilead Sciences, Inc. † S
1,657,500
151,744,125
Vertex Pharmaceuticals, Inc. †
183,209
16,289,112
362,128,078
Capital markets (2.2%)
Charles Schwab Corp. (The)
1,359,400
37,723,350
E*Trade Financial Corp. †
617,000
12,969,340
KKR & Co. LP
1,080,000
24,753,600
State Street Corp.
263,900
18,589,116
94,035,406
Chemicals (2.0%)
Chemtura Corp. †
454,056
10,561,343
Dow Chemical Co. (The)
131,700
6,725,919
Monsanto Co.
486,200
54,984,358
Tronox, Ltd. Class A S
497,921
13,214,823
85,486,443
26 Voyager Fund
COMMON STOCKS (90.7%)* cont.
Shares
Value
Commercial services and supplies (0.2%)
Tyco International, Ltd.
166,000
$7,162,900
7,162,900
Communications equipment (1.1%)
Alcatel-Lucent ADR (France)
3,507,800
12,031,754
Qualcomm, Inc.
471,509
34,750,213
46,781,967
Construction materials (0.2%)
CaesarStone Sdot-Yam, Ltd. (Israel)
154,443
6,696,648
6,696,648
Consumer finance (—%)
Ally Financial, Inc. † F
27,531
632,112
632,112
Diversified consumer services (0.6%)
ITT Educational Services, Inc. † Ω S
1,876,173
26,697,942
26,697,942
Diversified financial services (0.5%)
CME Group, Inc.
295,700
21,864,058
21,864,058
Diversified telecommunication services (0.2%)
Telecom Italia SpA RSP (Italy)
6,639,745
6,193,935
6,193,935
Electrical equipment (0.9%)
Eaton Corp PLC
398,300
27,052,536
Generac Holdings, Inc. † S
217,600
9,443,840
36,496,376
Electronic equipment, instruments, and components (0.6%)
Zalando AG (acquired 9/30/13, cost $15,738,412) (Private) (Germany) † ΔΔ F
702
15,590,117
121,502,698
Internet software and services (9.3%)
eBay, Inc. †
324,555
17,136,504
Facebook, Inc. Class A †
1,667,881
121,171,555
Google, Inc. Class A †
415,394
240,741,593
Yahoo!, Inc. †
283,100
10,137,811
389,187,463
IT Services (3.0%)
MasterCard, Inc. Class A
170,300
12,627,745
Unisys Corp. †
527,833
11,237,565
Visa, Inc. Class A S
479,800
101,242,598
125,107,908
Leisure products (0.2%)
Brunswick Corp.
198,325
7,998,447
7,998,447
Life sciences tools and services (0.6%)
Agilent Technologies, Inc.
114,000
6,394,260
Thermo Fisher Scientific, Inc.
159,800
19,415,700
25,809,960
Media (3.9%)
Atresmedia Corporacion de Medios de Comunicacion SA (Spain) S
833,685
12,192,797
CBS Corp. Class B (non-voting shares)
561,600
31,915,728
Comcast Corp. Class A
919,335
49,395,870
Grupo Televisa SAB ADR (Mexico)
248,800
8,854,792
Liberty Global PLC Ser. A (United Kingdom) † S
640,651
26,651,082
28 Voyager Fund
COMMON STOCKS (90.7%)* cont.
Shares
Value
Media cont.
Live Nation Entertainment, Inc. †
200,900
$4,662,889
Mediaset SpA (Italy) †
2,588,045
10,264,637
Time Warner Cable, Inc.
31,500
4,570,650
Time Warner, Inc.
116,900
9,705,038
Twenty-First Century Fox, Inc.
185,424
5,874,232
164,087,715
Metals and mining (0.6%)
Barrick Gold Corp. (Canada)
1,034,700
18,707,376
Freeport-McMoRan, Inc. (Indonesia)
163,114
6,071,103
24,778,479
Multiline retail (0.4%)
Macy’s, Inc.
143,700
8,304,423
Target Corp.
149,500
8,908,705
17,213,128
Oil, gas, and consumable fuels (1.4%)
Cobalt International Energy, Inc. †
233,500
3,740,670
EOG Resources, Inc.
301,400
32,985,216
Genel Energy PLC (United Kingdom) †
915,074
15,371,634
Royal Dutch Shell PLC Class A (United Kingdom)
172,546
7,095,202
59,192,722
Paper and forest products (0.2%)
International Paper Co.
89,100
4,232,250
Louisiana-Pacific Corp. † S
298,500
4,041,690
8,273,940
Personal products (0.9%)
Coty, Inc. Class A S
2,195,253
37,560,779
37,560,779
Pharmaceuticals (5.9%)
AbbVie, Inc.
618,000
32,346,120
Actavis PLC † S
289,485
62,025,056
Allergan, Inc.
143,800
23,850,668
Bristol-Myers Squibb Co.
391,700
19,827,854
Jazz Pharmaceuticals PLC †
552,845
77,249,032
Medicines Co. (The) † S
668,400
15,620,508
Perrigo Co. PLC
55,400
8,334,930
Salix Pharmaceuticals, Ltd. †
48,700
6,424,017
245,678,185
Real estate investment trusts (REITs) (0.6%)
Gaming and Leisure Properties, Inc. R S
185,086
6,231,846
Hibernia REIT PLC (Ireland) † R
12,035,000
16,962,530
23,194,376
Real estate management and development (0.6%)
RE/MAX Holdings, Inc. Class A S
874,977
25,636,826
25,636,826
Road and rail (0.9%)
Genesee & Wyoming, Inc. Class A †
121,386
12,105,826
Union Pacific Corp.
237,900
23,387,949
35,493,775
Semiconductors and semiconductor equipment (2.8%)
Avago Technologies, Ltd.
60,200
4,176,676
Canadian Solar, Inc. (Canada) † S
758,500
18,932,160
Marvell Technology Group, Ltd.
472,241
6,299,695
Micron Technology, Inc. †
2,895,754
88,465,285
117,873,816
Voyager Fund 29
COMMON STOCKS (90.7%)* cont.
Shares
Value
Software (3.2%)
Longtop Financial Technologies, Ltd. ADR (Hong Kong) † F
478,830
$—
Microsoft Corp.
1,214,600
52,422,136
Oracle Corp.
1,177,389
47,554,742
TiVo, Inc. †
1,276,100
17,176,306
VMware, Inc. Class A † S
37,400
3,716,064
Zynga, Inc. Class A †
4,280,437
12,498,876
133,368,124
Specialty retail (2.7%)
Bed Bath & Beyond, Inc. † S
35,924
2,273,630
Home Depot, Inc. (The)
436,500
35,291,025
Lowe’s Cos., Inc.
385,100
18,427,035
Office Depot, Inc. † S
8,665,776
43,415,538
Sears Hometown and Outlet Stores, Inc. † S
150,031
2,844,588
Tile Shop Holdings, Inc. † S
225,293
2,277,712
TJX Cos., Inc. (The)
195,000
10,391,550
114,921,078
Technology hardware, storage, and peripherals (5.2%)
Apple, Inc.
1,626,847
155,477,768
EMC Corp.
346,900
10,164,170
Nokia OYJ ADR (Finland)
1,148,200
9,105,226
SanDisk Corp. S
309,600
28,393,416
Western Digital Corp.
159,880
15,960,820
219,101,400
Textiles, apparel, and luxury goods (0.1%)
Tumi Holdings, Inc. † S
97,900
2,063,732
2,063,732
Thrifts and mortgage finance (0.4%)
Radian Group, Inc. S
1,438,900
18,216,474
18,216,474
Tobacco (1.1%)
Japan Tobacco, Inc. (Japan)
345,400
12,051,470
Lorillard, Inc.
247,100
14,944,608
Philip Morris International, Inc.
256,069
21,000,219
47,996,297
Wireless telecommunication services (1.3%)
SoftBank Corp. (Japan)
346,600
24,573,284
Vodafone Group PLC ADR (United Kingdom)
849,100
28,207,100
52,780,384
Total common stocks (cost $3,523,750,697)
$3,798,813,460
PURCHASED OPTIONS OUTSTANDING (2.2%)*
Expiration date/strike price
Contract amount
Value
Anixter International, Inc. (Call)
Nov-14/$110.00
$915,977
$403,854
Assured Guaranty, Ltd. (Call)
Aug-14/26.00
2,112,429
93,581
DISH Network Corp. (Call)
Jan-15/65.00
739,799
3,406,604
DISH Network Corp. (Call)
Jan-15/75.00
265,460
471,399
DISH Network Corp. (Call)
Aug-14/47.50
314,546
4,591,336
Fortune Brands Home & Security, Inc. (Call)
Aug-14/30.00
677,567
5,281,689
Gap, Inc. (The) (Call)
Aug-14/34.00
536,300
3,271,430
Hartford Financial Services Group, Inc. (The) (Call)
Aug-14/32.00
429,405
1,236,686
30 Voyager Fund
PURCHASED OPTIONS OUTSTANDING (2.2%)* cont.
Expiration date/strike price
Contract amount
Value
Huntsman Corp. (Call)
Aug-14/$21.00
$1,243,409
$6,284,003
iShares Russell 2000 ETF (Call)
Aug-14/120.00
6,411,438
170,993
iShares Russell 2000 ETF (Call)
Aug-14/119.00
5,667,292
167,809
iShares Russell 2000 ETF (Call)
Aug-14/119.50
5,198,285
70,645
iShares U.S. Home Construction ETF (Call)
Aug-14/27.00
3,359,523
863
iShares U.S. Home Construction ETF (Call)
Aug-14/27.00
1,210,426
311
iShares U.S. Home Construction ETF (Call)
Aug-14/26.00
1,175,856
1
ITT Educational Services, Inc. (Call)
Oct-14/24.00
1,175,905
173,399
ITT Educational Services, Inc. (Call)
Oct-14/25.00
623,586
75,735
ITT Educational Services, Inc. (Call)
Aug-14/10.00
119,662
556,428
ITT Educational Services, Inc. (Call)
Aug-14/16.00
175,201
78,858
Jazz Pharmaceuticals PLC (Call)
Dec-14/170.00
391,949
2,332,097
Jazz Pharmaceuticals PLC (Call)
Dec-14/180.00
433,948
1,768,937
Jazz Pharmaceuticals PLC (Call)
Dec-14/190.00
391,949
1,166,048
Lam Research Corp. (Call)
Sep-14/52.50
119,547
2,318,016
Lions Gate Entertainment Corp. (Call)
Dec-14/37.00
1,086,770
758,576
Market Vectors Gold Miners ETF (Call)
Sep-14/27.00
2,572,391
1,629,944
Market Vectors Gold Miners ETF (Call)
Sep-14/29.00
2,287,048
491,670
Market Vectors Gold Miners ETF (Call)
Sep-14/30.00
1,870,976
242,928
Market Vectors Gold Miners ETF (Call)
Sep-14/31.00
1,372,049
99,240
Market Vectors Gold Miners ETF (Call)
Sep-14/32.00
1,870,976
86,271
Pandora Media, Inc. (Call)
Sep-14/18.00
605,458
4,393,012
PulteGroup, Inc. (Call)
Dec-14/22.00
1,648,700
303,476
PulteGroup, Inc. (Call)
Oct-14/23.00
3,322,455
134,227
Qihoo 360 Technology Co., Ltd. (Call)
Dec-14/120.00
888,974
3,519,270
Qihoo 360 Technology Co., Ltd. (Call)
Sep-14/70.00
206,078
4,572,675
SPDR S&P 500 ETF Trust (Put)
Sep-14/192.00
2,317,126
9,002,035
SPDR S&P 500 ETF Trust (Put)
Sep-14/184.00
2,317,126
4,228,454
SPDR S&P 500 ETF Trust (Put)
Sep-14/195.00
1,471,191
264,741
SPDR S&P 500 ETF Trust (Put)
Aug-14/191.50
4,888,889
12,534,965
SPDR S&P 500 ETF Trust (Put)
Aug-14/187.50
4,888,889
7,754,805
SPDR S&P 500 ETF Trust (Put)
Aug-14/188.00
4,022,572
6,749,795
Vodafone Group PLC (Call)
Jan-15/40.00
1,377,329
261,734
Whirlpool Corp. (Call)
Jan-15/175.00
225,596
269,738
Whirlpool Corp. (Call)
Dec-14/165.00
666,945
1,273,151
Whirlpool Corp. (Call)
Dec-14/175.00
274,435
241,706
Zynga, Inc. (Call)
Dec-14/4.00
3,434,989
527,340
Total purchased options outstanding (cost $92,841,734)
$93,260,475
INVESTMENT COMPANIES (2.0%)*
Shares
Value
CSOP FTSE China A50 ETF (China)
12,629,800
$15,652,737
iShares Dow Jones U.S. Home Construction Index Fund S
1,131,500
25,130,615
iShares FTSE A50 China Index ETF (China)
16,414,800
20,316,467
Market Vectors Gold Miners ETF
292,573
7,574,715
Market Vectors Junior Gold Miners ETF †
321,800
13,370,790
Total investment companies (cost $79,924,754)
$82,045,324
Voyager Fund 31
WARRANTS (0.7%)* †
Expiration date
Strike price
Warrants
Value
Global Mediacom Tbk PT 144A (Indonesia)
10/4/16
$0.00
22,345,500
$3,705,733
JPMorgan Chase & Co. W
10/28/18
42.42
354,054
6,684,540
Wells Fargo & Co. W
10/28/18
34.01
1,018,855
19,694,467
Total warrants (cost $17,922,048)
$30,084,740
U.S. TREASURY OBLIGATIONS (—%)*
Principal amount
Value
U.S. Treasury Strips zero % August 15, 2013 i
$881,000
$697,822
Total U.S. treasury obligations (cost $697,822)
$697,822
SHORT-TERM INVESTMENTS (15.9%)*
Principal amount/shares
Value
Putnam Cash Collateral Pool, LLC 0.18% d
shares419,799,552
$419,799,552
Putnam Short Term Investment Fund 0.05% L
shares218,450,175
218,450,175
SSgA Prime Money Market Fund 0.01% P
shares25,234,703
25,234,703
U.S. Treasury Bills with effective yields ranging from 0.04% to 0.05%, November 13, 2014
$510,000
509,945
U.S. Treasury Bills with an effective yield of 0.04%, October 23, 2014 Δ
890,000
889,954
Total short-term investments (cost $664,884,286)
$664,884,329
TOTAL INVESTMENTS
Total investments (cost $4,380,021,341)
$4,669,786,150
Key to holding’s abbreviations
ADR
American Depository Receipts: represents ownership of foreign securities on deposit with a custodian bank
ETF
Exchange Traded Fund
PJSC
Public Joint Stock Company
SPDR
S&P Depository Receipts
Notes to the fund’s portfolio
Unless noted otherwise, the notes to the fund’s portfolio are for the close of the fund’s reporting period, which ran from August 1, 2013 through July 31, 2014 (the reporting period). Within the following notes to the portfolio, references to “ASC 820” represent Accounting Standards Codification 820 Fair Value Measurements and Disclosures and references to “OTC”, if any, represent over-the-counter.
*
Percentages indicated are based on net assets of $4,187,751,523.
†
Non-income-producing security.
ΔΔ
Security is restricted with regard to public resale. The total fair value of this security and any other restricted securities (excluding 144A securities), if any, held at the close of the reporting period was $21,670,243, or 0.5% of net assets.
Ω
Affiliated company (Note 5).
Δ
This security, in part or in entirety, was pledged and segregated with the custodian for collateral on certain derivative contracts at the close of the reporting period.
d
Affiliated company. See Note 1 to the financial statements regarding securities lending. The rate quoted in the security description is the annualized 7-day yield of the fund at the close of the reporting period.
F
Security is valued at fair value following procedures approved by the Trustees. Securities may be classified as Level 2 or Level 3 for ASC 820 based on the securities’ valuation inputs. At the close of the reporting period, fair value pricing was also used for certain foreign securities in the portfolio (Note 1).
32 Voyager Fund
i
Security was pledged, or purchased with cash that was pledged, to the fund for collateral on certain derivative contracts (Note 1).
L
Affiliated company (Note 5). The rate quoted in the security description is the annualized 7-day yield of the fund at the close of the reporting period.
P
Security was pledged, or purchased with cash that was pledged, to the fund for collateral on certain derivative contracts. The rate quoted in the security description is the annualized 7-day yield of the fund at the close of the reporting period (Note 1).
R
Real Estate Investment Trust.
S
Security on loan, in part or in entirety, at the close of the reporting period (Note 1).
W
Warrants issued to the U.S. Treasury under the Troubled Asset Relief Program (TARP).
At the close of the reporting period, the fund maintained liquid assets totaling $51,841,228 to cover certain derivatives contracts.
Debt obligations are considered secured unless otherwise indicated.
144A after the name of an issuer represents securities exempt from registration under Rule 144A under the Securities Act of 1933, as amended. These securities may be resold in transactions exempt from registration, normally to qualified institutional buyers.
The dates shown on debt obligations are the original maturity dates.
FORWARD CURRENCY CONTRACTS at 7/31/14 (aggregate face value $368,875,202)
Counterparty
Currency
Contract type
Delivery date
Value
Aggregate face value
Unrealized appreciation/ (depreciation)
Credit Suisse International
British Pound
Sell
9/17/14
$31,540,011
$32,049,515
$509,504
Euro
Sell
9/17/14
143,397,201
146,236,002
2,838,801
Japanese Yen
Sell
8/20/14
108,265,466
108,403,117
137,651
UBS AG
British Pound
Sell
9/17/14
82,870,795
82,186,568
(684,227)
Total
$2,801,729
WRITTEN OPTIONS OUTSTANDING at 7/31/14 (premiums $37,281,299)
Expiration date/strike price
Contract amount
Value
Anixter International, Inc. (Call)
Nov-14/$115.00
$915,977
$268,656
Assured Guaranty, Ltd. (Call)
Aug-14/28.00
2,112,429
33,799
DISH Network Corp. (Call)
Jan-15/75.00
739,799
1,313,720
DISH Network Corp. (Call)
Jan-15/85.00
265,460
157,232
iShares Russell 2000 ETF (Call)
Aug-14/120.00
5,667,292
151,147
iShares Russell 2000 ETF (Call)
Aug-14/121.00
6,411,438
142,077
iShares Russell 2000 ETF (Call)
Aug-14/120.50
5,198,285
19,390
iShares U.S. Home Construction ETF (Call)
Aug-14/28.00
3,359,523
292
iShares U.S. Home Construction ETF (Call)
Aug-14/27.00
1,175,856
1
ITT Educational Services, Inc. (Call)
Oct-14/26.00
1,175,905
86,794
ITT Educational Services, Inc. (Call)
Oct-14/30.00
623,586
11,037
Jazz Pharmaceuticals PLC (Call)
Dec-14/180.00
783,898
3,292,372
Jazz Pharmaceuticals PLC (Call)
Dec-14/200.00
433,948
862,298
Lions Gate Entertainment Corp. (Call)
Dec-14/39.00
1,086,770
428,035
Market Vectors Gold Miners ETF (Call)
Sep-14/29.00
2,572,391
553,013
Voyager Fund 33
WRITTEN OPTIONS OUTSTANDING at 7/31/14 (premiums $37,281,299) cont.
Expiration date/strike price
Contract amount
Value
Market Vectors Gold Miners ETF (Call)
Sep-14/$31.00
$3,741,952
$270,655
Market Vectors Gold Miners ETF (Call)
Sep-14/31.00
2,287,048
165,422
Market Vectors Gold Miners ETF (Call)
Sep-14/32.50
1,372,049
68,863
PulteGroup, Inc. (Call)
Dec-14/24.00
1,648,700
153,923
PulteGroup, Inc. (Call)
Oct-14/25.00
3,322,455
94,856
Qihoo 360 Technology Co., Ltd. (Call)
Dec-14/130.00
888,974
2,390,291
SPDR S&P 500 ETF Trust (Put)
Sep-14/188.00
4,634,252
12,253,009
SPDR S&P 500 ETF Trust (Put)
Aug-14/189.50
9,777,778
19,646,196
SPDR S&P 500 ETF Trust (Put)
Aug-14/186.00
4,022,572
5,339,522
Vodafone Group PLC (Call)
Jan-15/45.00
1,377,329
44,040
Whirlpool Corp. (Call)
Jan-15/185.00
225,596
143,145
Whirlpool Corp. (Call)
Dec-14/175.00
666,945
584,951
Whirlpool Corp. (Call)
Dec-14/185.00
274,435
118,581
Zynga, Inc. (Call)
Dec-14/5.00
3,434,989
293,725
Total
$48,887,042
OTC TOTAL RETURN SWAP CONTRACTS OUTSTANDING at 7/31/14
Swap counterparty/ Notional amount
Upfront premium received (paid)
Termination date
Payments received (paid) by fund per annum
Total return received by or paid by fund
Unrealized appreciation/ (depreciation)
Deutsche Bank AG
baskets
539,839
$—
7/28/15
(3 month USD-LIBOR-BBA plus 0.32%)
A basket (DBPTMATR) of common stocks
$(1,949,572)
JPMorgan Chase Bank N.A.
baskets
82,685
—
7/16/15
(3 month USD-LIBOR-BBA plus 30 bp)
A basket (JPCMPTMD) of common stocks
(122,568)
Total
$—
$(2,072,140)
34 Voyager Fund
ASC 820 establishes a three-level hierarchy for disclosure of fair value measurements. The valuation hierarchy is based upon the transparency of inputs to the valuation of the fund’s investments. The three levels are defined as follows:
Level 1: Valuations based on quoted prices for identical securities in active markets.
Level 2: Valuations based on quoted prices in markets that are not active or for which all significant inputs are observable, either directly or indirectly.
Level 3: Valuations based on inputs that are unobservable and significant to the fair value measurement.
The following is a summary of the inputs used to value the fund’s net assets as of the close of the reporting period:
Valuation inputs
Investments in securities:
Level 1
Level 2
Level 3
Common stocks*:
Consumer discretionary
$651,280,675
$130,629,436
$21,670,243
Consumer staples
79,774,762
12,051,470
—
Energy
121,872,375
41,744,861
—
Financials
397,991,882
41,906,618
—
Health care
700,296,169
—
—
Industrials
253,269,651
104,781,036
—
Information technology
1,053,338,644
3,995,809
—
Materials
125,235,510
—
—
Telecommunication services
28,207,100
30,767,219
—
Total common stocks
3,411,266,768
365,876,449
21,670,243
Investment companies
46,076,120
35,969,204
—
Purchased options outstanding
3,271,430
89,989,045
—
U.S. Treasury obligations
—
697,822
—
Warrants
26,379,007
3,705,733
—
Short-term investments
243,684,878
421,199,451
—
Totals by level
$3,730,678,203
$917,437,704
$21,670,243
Valuation inputs
Other financial instruments:
Level 1
Level 2
Level 3
Forward currency contracts
$—
$2,801,729
$—
Written options outstanding
—
(48,887,042)
—
Total return swap contracts
—
(2,072,140)
—
Totals by level
$—
$(48,157,453)
$—
*Common stock classifications are presented at the sector level, which may differ from the fund’s portfolio presentation.
At the start and close of the reporting period, Level 3 investments in securities were not considered a significant portion of the fund’s portfolio.
The accompanying notes are an integral part of these financial statements.
Voyager Fund 35
Statement of assets and liabilities 7/31/14
ASSETS
Investment in securities, at value, including $379,900,243 of securities on loan (Note 1):
Affiliated issuers (identified cost $694,969,229) (Notes 1 and 5)
664,947,669
Cash
718,860
Foreign currency (cost $6,454) (Note 1)
6,386
Dividends, interest and other receivables
2,836,305
Receivable for shares of the fund sold
1,017,842
Receivable for investments sold
87,890,724
Unrealized appreciation on forward currency contracts (Note 1)
3,485,956
Prepaid assets
45,359
Total assets
4,765,787,582
LIABILITIES
Payable for investments purchased
71,423,037
Payable for shares of the fund repurchased
3,282,816
Payable for compensation of Manager (Note 2)
1,729,473
Payable for custodian fees (Note 2)
58,483
Payable for investor servicing fees (Note 2)
532,029
Payable for Trustee compensation and expenses (Note 2)
1,595,030
Payable for administrative services (Note 2)
13,759
Payable for distribution fees (Note 2)
1,023,149
Unrealized depreciation on OTC swap contracts (Note 1)
2,072,140
Unrealized depreciation on forward currency contracts (Note 1)
684,227
Written options outstanding, at value (premiums $37,281,299) (Notes 1 and 3)
48,887,042
Collateral on securities loaned, at value (Note 1)
419,799,552
Collateral on certain derivative contracts, at value (Note 1)
25,932,525
Other accrued expenses
1,002,797
Total liabilities
578,036,059
Net assets
$4,187,751,523
REPRESENTED BY
Paid-in capital (Unlimited shares authorized) (Notes 1 and 4)
$3,401,862,367
Undistributed net investment income (Note 1)
15,868,718
Accumulated net realized gain on investments and foreign currency transactions (Note 1)
491,147,807
Net unrealized appreciation of investments and assets and liabilities in foreign currencies
278,872,631
Total — Representing net assets applicable to capital shares outstanding
$4,187,751,523
(Continued on next page)
The accompanying notes are an integral part of these financial statements.
36 Voyager Fund
Statement of assets and liabilities (Continued)
COMPUTATION OF NET ASSET VALUE AND OFFERING PRICE
Net asset value and redemption price per class A share ($3,489,889,916 divided by 107,840,539 shares)
$32.36
Offering price per class A share (100/94.25 of $32.36)*
$34.33
Net asset value and offering price per class B share ($104,735,946 divided by 3,872,453 shares)**
$27.05
Net asset value and offering price per class C share ($162,611,150 divided by 5,459,096 shares)**
$29.79
Net asset value and redemption price per class M share ($28,098,565 divided by 948,242 shares)
$29.63
Offering price per class M share (100/96.50 of $29.63)*
$30.70
Net asset value, offering price and redemption price per class R share ($18,033,370 divided by 568,523 shares)
$31.72
Net asset value, offering price and redemption price per class R5 share ($15,921 divided by 469 shares)†
$33.96
Net asset value, offering price and redemption price per class R6 share ($36,801,833 divided by 1,082,875 shares)
$33.99
Net asset value, offering price and redemption price per class Y share ($347,564,822 divided by 10,261,258 shares)
$33.87
*
On single retail sales of less than $50,000. On sales of $50,000 or more the offering price is reduced.
**
Redemption price per share is equal to net asset value less any applicable contingent deferred sales charge.
†
Net asset value may not recalculate due to rounding of fractional shares.
The accompanying notes are an integral part of these financial statements.
Voyager Fund 37
Statement of operations Year ended 7/31/14
INVESTMENT INCOME
Dividends (net of foreign tax of $786,939)
$67,845,081
Interest (including interest income of $46,302 from investments in affiliated issuers) (Note 5)
28,793
Securities lending (Note 1)
1,451,804
Total investment income
69,325,678
EXPENSES
Compensation of Manager (Note 2)
18,309,908
Investor servicing fees (Note 2)
9,012,771
Custodian fees (Note 2)
175,555
Trustee compensation and expenses (Note 2)
277,825
Distribution fees (Note 2)
11,589,324
Administrative services (Note 2)
107,912
Other
1,640,447
Total expenses
41,113,742
Expense reduction (Note 2)
(663,111)
Net expenses
40,450,631
Net investment income
28,875,047
Net realized gain on investments (net of foreign tax of $6,452) (Notes 1 and 3)
715,192,477
Net realized gain on swap contracts (Note 1)
1,222,694
Net realized loss on foreign currency transactions (Note 1)
(9,139,814)
Net realized gain on written options (Notes 1 and 3)
86,859,326
Net unrealized appreciation of assets and liabilities in foreign currencies during the year
3,131,272
Net unrealized depreciation of investments, swap contracts and written options during the year
(24,616,643)
Net gain on investments
772,649,312
Net increase in net assets resulting from operations
$801,524,359
The accompanying notes are an integral part of these financial statements.
38 Voyager Fund
Statement of changes in net assets
INCREASE IN NET ASSETS
Year ended 7/31/14
Year ended 7/31/13
Operations:
Net investment income
$28,875,047
$28,826,705
Net realized gain on investments and foreign currency transactions
794,134,683
271,829,461
Net unrealized appreciation (depreciation) of investments and assets and liabilities in foreign currencies
(21,485,371)
677,087,519
Net increase in net assets resulting from operations
801,524,359
977,743,685
Distributions to shareholders (Note 1):
From ordinary income
Net investment income
Class A
(30,753,419)
(33,747,664)
Class B
(495,285)
(639,731)
Class C
(467,255)
(486,272)
Class M
(151,826)
(174,466)
Class R
(117,416)
(172,011)
Class R5
(171)
(129)
Class R6
(432,629)
(133)
Class Y
(3,478,480)
(4,208,289)
Decrease from capital share transactions (Note 4)
(336,099,580)
(694,257,185)
Total increase in net assets
429,528,298
244,057,805
NET ASSETS
Beginning of year
3,758,223,225
3,514,165,420
End of year (including undistributed net investment income of $15,868,718 and $34,079,674, respectively)
$4,187,751,523
$3,758,223,225
The accompanying notes are an integral part of these financial statements.
Voyager Fund 39
Financial highlights (For a common share outstanding throughout the period)
INVESTMENT OPERATIONS:
LESS DISTRIBUTIONS:
RATIOS AND SUPPLEMENTAL DATA:
Period ended
Net asset value, beginning of period
Net investment income (loss)a
Net realized and unrealized gain (loss) on investments
Total from investment operations
From net investment income
Total distributions
Redemption fees
Non-recurring reimbursements
Net asset value, end of period
Total return at net asset value (%)b
Net assets, end of period (in thousands)
Ratio of expenses to average net assets (%)c
Ratio of net investment income (loss) to average net assets (%)
Portfolio turnover (%)
Class A
July 31, 2014
$26.76
.22
5.65
5.87
(.27)
(.27)
—
—
$32.36
22.01
$3,489,890
.97
.73
146
July 31, 2013
20.61
.19
6.22
6.41
(.26)
(.26)
—
—
26.76
31.40
3,142,831
1.00
.84
130
July 31, 2012
22.80
.07
(2.26)
(2.19)
—
—
—
—e,h
20.61
(9.61)
2,874,779
1.07
.35
140
July 31, 2011
20.12
.01
2.74
2.75
(.08)
(.08)
—e
.01g
22.80
13.73
3,692,512
1.17
.05
176
July 31, 2010
16.85
—e
3.46
3.46
(.19)
(.19)
—e
—e,f
20.12
20.58
3,111,020
1.26
(.03)
177
Class B
July 31, 2014
$22.43
—e
4.73
4.73
(.11)
(.11)
—
—
$27.05
21.13
$104,736
1.72
(.01)
146
July 31, 2013
17.31
.02
5.22
5.24
(.12)
(.12)
—
—
22.43
30.40
104,780
1.75
.10
130
July 31, 2012
19.29
(.07)
(1.91)
(1.98)
—
—
—
—e,h
17.31
(10.26)
105,363
1.82
(.40)
140
July 31, 2011
17.09
(.14)
2.33
2.19
—
—
—e
.01g
19.29
12.87
157,197
1.92
(.70)
176
July 31, 2010
14.35
(.13)
2.94
2.81
(.07)
(.07)
—e
—e,f
17.09
19.64
182,569
2.01
(.77)
177
Class C
July 31, 2014
$24.67
(.01)
5.21
5.20
(.08)
(.08)
—
—
$29.79
21.12
$162,611
1.72
(.03)
146
July 31, 2013
18.98
.03
5.73
5.76
(.07)
(.07)
—
—
24.67
30.42
141,971
1.75
.12
130
July 31, 2012
21.15
(.08)
(2.09)
(2.17)
—
—
—
—e,h
18.98
(10.26)
166,329
1.82
(.40)
140
July 31, 2011
18.74
(.15)
2.55
2.40
—
—
—e
.01g
21.15
12.86
247,712
1.92
(.71)
176
July 31, 2010
15.76
(.15)
3.24
3.09
(.11)
(.11)
—e
—e,f
18.74
19.63
87,221
2.01
(.79)
177
Class M
July 31, 2014
$24.55
.06
5.18
5.24
(.16)
(.16)
—
—
$29.63
21.37
$28,099
1.47
.22
146
July 31, 2013
18.92
.07
5.72
5.79
(.16)
(.16)
—
—
24.55
30.77
24,935
1.50
.34
130
July 31, 2012
21.03
(.03)
(2.08)
(2.11)
—
—
—
—e,h
18.92
(10.03)
23,150
1.57
(.15)
140
July 31, 2011
18.59
(.10)
2.53
2.43
—
—
—e
.01g
21.03
13.13
29,618
1.67
(.45)
176
July 31, 2010
15.60
(.10)
3.21
3.11
(.12)
(.12)
—e
—e,f
18.59
19.94
28,857
1.76
(.53)
177
Class R
July 31, 2014
$26.23
.14
5.54
5.68
(.19)
(.19)
—
—
$31.72
21.70
$18,033
1.22
.48
146
July 31, 2013
20.20
.14
6.09
6.23
(.20)
(.20)
—
—
26.23
31.08
17,812
1.25
.61
130
July 31, 2012
22.40
.02
(2.22)
(2.20)
—
—
—
—e,h
20.20
(9.82)
18,921
1.32
.09
140
July 31, 2011
19.80
(.05)
2.71
2.66
(.07)
(.07)
—e
.01g
22.40
13.46
22,351
1.42
(.20)
176
July 31, 2010
16.61
(.06)
3.41
3.35
(.16)
(.16)
—e
—e,f
19.80
20.23
5,573
1.51
(.29)
177
Class R5
July 31, 2014
$28.07
.34
5.92
6.26
(.37)
(.37)
—
—
$33.96
22.39
$16
.65
1.04
146
July 31, 2013
21.54
.30
6.51
6.81
(.28)
(.28)
—
—
28.07
31.95
13
.63
1.19
130
July 31, 2012†
21.85
.01
(.32)
(.31)
—
—
—
—
21.54
(1.42) *
10
.05*
.03*
140
Class R6
July 31, 2014
$28.09
.37
5.93
6.30
(.40)
(.40)
—
—
$33.99
22.53
$36,802
.55
1.15
146
July 31, 2013
21.54
.24d
6.60
6.84
(.29)
(.29)
—
—
28.09
32.10
31,033
.53
.89d
130
July 31, 2012†
21.85
.01
(.32)
(.31)
—
—
—
—
21.54
(1.42) *
10
.04*
.04*
140
Class Y
July 31, 2014
$27.98
.31
5.91
6.22
(.33)
(.33)
—
—
$33.87
22.33
$347,565
.72
.98
146
July 31, 2013
21.54
.27
6.49
6.76
(.32)
(.32)
—
—
27.98
31.73
294,849
.75
1.12
130
July 31, 2012
23.77
.13
(2.36)
(2.23)
—
—
—
—e,h
21.54
(9.38)
325,603
.82
.59
140
July 31, 2011
20.97
.07
2.86
2.93
(.14)
(.14)
—e
.01g
23.77
13.99
569,805
.92
.29
176
July 31, 2010
17.54
.04
3.62
3.66
(.23)
(.23)
—e
—e,f
20.97
20.91
313,583
1.01
.21
177
See notes to financial highlights at the end of this section.
The accompanying notes are an integral part of these financial statements.
40
Voyager Fund
Voyager Fund
41
Financial highlights (Continued)
* Not annualized.
† For the period July 3, 2012 (commencement of operations) to July 31, 2012.
a Per share net investment income (loss) has been determined on the basis of the weighted average number of shares outstanding during the period.
b Total return assumes dividend reinvestment and does not reflect the effect of sales charges.
c Includes amounts paid through expense offset and/or brokerage/service arrangements, if any (Note 2). Also excludes acquired fund fees and expenses, if any.
d The net investment income ratio and per share amount shown for the period ending July 31, 2013 may not correspond with the expected class specific differences for the period due to the timing of subscriptions into the class.
e Amount represents less than $0.01 per share.
f Reflects a non-recurring reimbursement pursuant to a settlement between the Securities and Exchange Commission (SEC) and Prudential Securities, Inc., which amounted to less than $0.01 per share outstanding as of March 30, 2010.
g Reflects a non-recurring reimbursement related to restitution amounts in connection with a distribution plan approved by the SEC which amounted to $0.01 per share outstanding on July 21, 2011. Also reflects a non-recurring reimbursement related to short-term trading related lawsuits, which amounted to less than $0.01 per share outstanding on May 11, 2011.
h Reflects a non-recurring reimbursement pursuant to a settlement between the SEC and Canadian Imperial Holdings, Inc./CIBC World Markets Corp. which amounted to less than $0.01 per share outstanding on November 29, 2011.
The accompanying notes are an integral part of these financial statements.
42 Voyager Fund
Notes to financial statements 7/31/14
Within the following Notes to financial statements, references to “State Street” represent State Street Bank and Trust Company, references to “the SEC” represent the Securities and Exchange Commission, references to “Putnam Management” represent Putnam Investment Management, LLC, the fund’s manager, an indirect wholly-owned subsidiary of Putnam Investments, LLC and references to “OTC”, if any, represent over-the-counter. Unless otherwise noted, the “reporting period” represents the period from August 1, 2013 through July 31, 2014.
Putnam Voyager Fund (the fund) is a Massachusetts business trust, which is registered under the Investment Company Act of 1940, as amended, as a diversified, open-end management investment company. The goal of the fund is to seek capital appreciation. The fund invests mainly in common stocks of midsize and large U.S. companies, with a focus on growth stocks. Growth stocks are issued by companies whose earnings are expected to grow faster than those of similar firms, and whose business growth and other characteristics may lead to an increase in stock price. Putnam Management may consider, among other factors, a company’s valuation, financial strength, growth potential, competitive position in its industry, projected future earnings, cash flows and dividends when deciding whether to buy or sell investments.
The fund offers class A, class B, class C, class M, class R, class R5, class R6 and class Y shares. Class A and class M shares are sold with a maximum front-end sales charge of 5.75% and 3.50%, respectively, and generally do not pay a contingent deferred sales charge. Class B shares, which convert to class A shares after approximately eight years, do not pay a front-end sales charge and are subject to a contingent deferred sales charge if those shares are redeemed within six years of purchase. Class C shares have a one-year 1.00% contingent deferred sales charge and do not convert to class A shares. Class R shares, which are not available to all investors, are sold at net asset value. The expenses for class A, class B, class C, class M and class R shares may differ based on the distribution fee of each class, which is identified in Note 2. Class R5, class R6 and class Y shares, which are sold at net asset value, are generally subject to the same expenses as class A, class B, class C, class M and class R shares, but do not bear a distribution fee and in the case of class R5 and class R6 shares, bear a lower investor servicing fee, which is identified in Note 2. Class R5, class R6 and class Y shares are not available to all investors.
In the normal course of business, the fund enters into contracts that may include agreements to indemnify another party under given circumstances. The fund’s maximum exposure under these arrangements is unknown as this would involve future claims that may be, but have not yet been, made against the fund. However, the fund’s management team expects the risk of material loss to be remote.
Note 1: Significant accounting policies
The following is a summary of significant accounting policies consistently followed by the fund in the preparation of its financial statements. The preparation of financial statements is in conformity with accounting principles generally accepted in the United States of America and requires management to make estimates and assumptions that affect the reported amounts of assets and liabilities in the financial statements and the reported amounts of increases and decreases in net assets from operations. Actual results could differ from those estimates. Subsequent events after the Statement of assets and liabilities date through the date that the financial statements were issued have been evaluated in the preparation of the financial statements.
Investment income, realized and unrealized gains and losses and expenses of the fund are borne pro-rata based on the relative net assets of each class to the total net assets of the fund, except that each class bears expenses unique to that class (including the distribution fees applicable to such classes). Each class votes as a class only with respect to its own distribution plan or other matters on which a class vote is required by law or determined by the Trustees. If the fund were liquidated, shares of each class would receive their pro-rata share of the net assets of the fund. In addition, the Trustees declare separate dividends on each class of shares.
Security valuation Investments for which market quotations are readily available are valued at the last reported sales price on their principal exchange, or official closing price for certain markets, and are classified as Level 1 securities under Accounting Standards Codification 820 Fair Value Measurements and Disclosures (ASC 820). If no sales are reported, as in the case of some securities that are traded OTC, a security is valued at its last reported bid price and is generally categorized as a Level 2 security.
Investments in open-end investment companies (excluding exchange traded funds), if any, which can be classified as Level 1 or Level 2 securities, are valued based on their net asset value. The net asset value of such investment companies equals the total value of their assets less their liabilities and divided by the number of their outstanding shares.
Voyager Fund 43
Market quotations are not considered to be readily available for certain debt obligations and other investments; such investments are valued on the basis of valuations furnished by an independent pricing service approved by the Trustees or dealers selected by Putnam Management. Such services or dealers determine valuations for normal institutional-size trading units of such securities using methods based on market transactions for comparable securities and various relationships, generally recognized by institutional traders, between securities (which consider such factors as security prices, yields, maturities and ratings). These securities will generally be categorized as Level 2. Short-term securities with remaining maturities of 60 days or less may be valued at amortized cost, which approximates fair value and are classified as Level 2 securities.
Many securities markets and exchanges outside the U.S. close prior to the close of the New York Stock Exchange and therefore the closing prices for securities in such markets or on such exchanges may not fully reflect events that occur after such close but before the close of the New York Stock Exchange. Accordingly, on certain days, the fund will fair value foreign equity securities taking into account multiple factors including movements in the U.S. securities markets, currency valuations and comparisons to the valuation of American Depository Receipts, exchange-traded funds and futures contracts. These securities, which would generally be classified as Level 1 securities, will be transferred to Level 2 of the fair value hierarchy when they are valued at fair value. The number of days on which fair value prices will be used will depend on market activity and it is possible that fair value prices will be used by the fund to a significant extent. At the close of the reporting period, fair value pricing was used for certain foreign securities in the portfolio. Securities quoted in foreign currencies, if any, are translated into U.S. dollars at the current exchange rate.
To the extent a pricing service or dealer is unable to value a security or provides a valuation that Putnam Management does not believe accurately reflects the security’s fair value, the security will be valued at fair value by Putnam Management in accordance with policies and procedures approved by the Trustees. Certain investments, including certain restricted and illiquid securities and derivatives, are also valued at fair value following procedures approved by the Trustees. These valuations consider such factors as significant market or specific security events such as interest rate or credit quality changes, various relationships with other securities, discount rates, U.S. Treasury, U.S. swap and credit yields, index levels, convexity exposures and recovery rates. These securities are classified as Level 2 or as Level 3 depending on the priority of the significant inputs.
Such valuations and procedures are reviewed periodically by the Trustees. The fair value of securities is generally determined as the amount that the fund could reasonably expect to realize from an orderly disposition of such securities over a reasonable period of time. By its nature, a fair value price is a good faith estimate of the value of a security in a current sale and does not reflect an actual market price, which may be different by a material amount.
Security transactions and related investment income Security transactions are recorded on the trade date (the date the order to buy or sell is executed). Gains or losses on securities sold are determined on the identified cost basis.
Interest income, net of any applicable withholding taxes, is recorded on the accrual basis. Dividend income, net of any applicable withholding taxes, is recognized on the ex-dividend date except that certain dividends from foreign securities, if any, are recognized as soon as the fund is informed of the ex-dividend date. Non-cash dividends, if any, are recorded at the fair value of the securities received. Dividends representing a return of capital or capital gains, if any, are reflected as a reduction of cost and/or as a realized gain.
All premiums/discounts are amortized/accreted on a yield-to-maturity basis.
Foreign currency translation The accounting records of the fund are maintained in U.S. dollars. The fair value of foreign securities, currency holdings, and other assets and liabilities is recorded in the books and records of the fund after translation to U.S. dollars based on the exchange rates on that day. The cost of each security is determined using historical exchange rates. Income and withholding taxes are translated at prevailing exchange rates when earned or incurred. The fund does not isolate that portion of realized or unrealized gains or losses resulting from changes in the foreign exchange rate on investments from fluctuations arising from changes in the market prices of the securities. Such gains and losses are included with the net realized and unrealized gain or loss on investments. Net realized gains and losses on foreign currency transactions represent net realized exchange gains or losses on closed forward currency contracts, disposition of foreign currencies, currency gains and losses realized between the trade and settlement dates on securities transactions and the difference between the amount of investment income and foreign withholding taxes recorded on the fund’s books and the U.S. dollar equivalent amounts actually received or paid. Net unrealized appreciation and depreciation of assets and liabilities in foreign currencies arise from changes in the value of open forward currency contracts and assets and liabilities other than investments at the period end, resulting from changes in the exchange rate.
44 Voyager Fund
Options contracts The fund uses options to hedge against changes in values of securities it owns, owned or expects to own and to manage downside risks.
The potential risk to the fund is that the change in value of options contracts may not correspond to the change in value of the hedged instruments. In addition, losses may arise from changes in the value of the underlying instruments if there is an illiquid secondary market for the contracts, if interest or exchange rates move unexpectedly or if the counterparty to the contract is unable to perform. Realized gains and losses on purchased options are included in realized gains and losses on investment securities. If a written call option is exercised, the premium originally received is recorded as an addition to sales proceeds. If a written put option is exercised, the premium originally received is recorded as a reduction to the cost of investments.
Exchange traded options are valued at the last sale price or, if no sales are reported, the last bid price for purchased options and the last ask price for written options. OTC traded options are valued using prices supplied by dealers.
Options on swaps are similar to options on securities except that the premium paid or received is to buy or grant the right to enter into a previously agreed upon interest rate or credit default contract. Forward premium swap option contracts include premiums that have extended settlement dates. The delayed settlement of the premiums is factored into the daily valuation of the option contracts. In the case of interest rate cap and floor contracts, in return for a premium, ongoing payments between two parties are based on interest rates exceeding a specified rate, in the case of a cap contract, or falling below a specified rate in the case of a floor contract.
Written option contracts outstanding at period end, if any, are listed after the fund’s portfolio.
Forward currency contracts The fund buys and sells forward currency contracts, which are agreements between two parties to buy and sell currencies at a set price on a future date. These contracts are used to hedge foreign exchange risk.
The U.S. dollar value of forward currency contracts is determined using current forward currency exchange rates supplied by a quotation service. The fair value of the contract will fluctuate with changes in currency exchange rates. The contract is marked to market daily and the change in fair value is recorded as an unrealized gain or loss. The fund records a realized gain or loss equal to the difference between the value of the contract at the time it was opened and the value at the time it was closed when the contract matures or by delivery of the currency. The fund could be exposed to risk if the value of the currency changes unfavorably, if the counterparties to the contracts are unable to meet the terms of their contracts or if the fund is unable to enter into a closing position. Risks may exceed amounts recognized on the Statement of assets and liabilities.
Forward currency contracts outstanding at period end, if any, are listed after the fund’s portfolio.
Total return swap contracts The fund entered into OTC total return swap contracts, which are arrangements to exchange a market linked return for a periodic payment, both based on a notional principal amount, to gain exposure to specific markets or countries and to gain exposure to specific sectors or industries.
To the extent that the total return of the security, index or other financial measure underlying the transaction exceeds or falls short of the offsetting interest rate obligation, the fund will receive a payment from or make a payment to the counterparty. OTC total return swap contracts are marked to market daily based upon quotations from an independent pricing service or market makers and the change, if any, is recorded as an unrealized gain or loss. Payments received or made are recorded as realized gains or losses. Certain OTC total return swap contracts may include extended effective dates. Payments related to these swap contracts are accrued based on the terms of the contract. The fund could be exposed to credit or market risk due to unfavorable changes in the fluctuation of interest rates or in the price of the underlying security or index, the possibility that there is no liquid market for these agreements or that the counterparty may default on its obligation to perform. The fund’s maximum risk of loss from counterparty risk is the fair value of the contract. This risk may be mitigated by having a master netting arrangement between the fund and the counterparty. Risk of loss may exceed amounts recognized on the Statement of assets and liabilities.
OTC total return swap contracts outstanding, including their respective notional amounts at period end, if any, are listed after the fund’s portfolio.
Master agreements The fund is a party to ISDA (International Swaps and Derivatives Association, Inc.) Master Agreements (Master Agreements) with certain counterparties that govern OTC derivative and foreign exchange contracts entered into from time to time. The Master Agreements may contain provisions regarding, among other things, the parties’ general obligations, representations, agreements, collateral requirements, events of default and early termination. With respect to certain counterparties, in accordance with the terms of the Master Agreements,
Voyager Fund 45
collateral posted to the fund is held in a segregated account by the fund’s custodian and with respect to those amounts which can be sold or repledged, is presented in the fund’s portfolio. Collateral posted to the fund which cannot be sold or repledged totaled $13,355,210 at the close of the reporting period.
Collateral pledged by the fund is segregated by the fund’s custodian and identified in the fund’s portfolio. Collateral can be in the form of cash or debt securities issued by the U.S. Government or related agencies or other securities as agreed to by the fund and the applicable counterparty. Collateral requirements are determined based on the fund’s net position with each counterparty.
Termination events applicable to the fund may occur upon a decline in the fund’s net assets below a specified threshold over a certain period of time. Termination events applicable to counterparties may occur upon a decline in the counterparty’s long-term and short-term credit ratings below a specified level. In each case, upon occurrence, the other party may elect to terminate early and cause settlement of all derivative and foreign exchange contracts outstanding, including the payment of any losses and costs resulting from such early termination, as reasonably determined by the terminating party. Any decision by one or more of the fund’s counterparties to elect early termination could impact the fund’s future derivative activity.
At the close of the reporting period, the fund had a net liability position of $93,652 on open derivative contracts subject to the Master Agreements. Collateral posted by the fund at period end for these agreements totaled $119,988 and may include amounts related to unsettled agreements.
Securities lending The fund may lend securities, through its agent, to qualified borrowers in order to earn additional income. The loans are collateralized by cash in an amount at least equal to the fair value of the securities loaned. The fair value of securities loaned is determined daily and any additional required collateral is allocated to the fund on the next business day. The risk of borrower default will be borne by the fund’s agent; the fund will bear the risk of loss with respect to the investment of the cash collateral. Income from securities lending is included in investment income on the Statement of operations. Cash collateral is invested in Putnam Cash Collateral Pool, LLC, a limited liability company managed by an affiliate of Putnam Management. Investments in Putnam Cash Collateral Pool, LLC are valued at its closing net asset value each business day. There are no management fees charged to Putnam Cash Collateral Pool, LLC. At the close of the reporting period, the fund received cash collateral of $419,799,552 and the value of securities loaned amounted to $401,175,374. Certain of these securities were sold prior to the close of the reporting period and are included in Receivable for investments sold on the Statement of assets and liabilities.
Interfund lending The fund, along with other Putnam funds, may participate in an interfund lending program pursuant to an exemptive order issued by the SEC. This program allows the fund to borrow from or lend to other Putnam funds that permit such transactions. Interfund lending transactions are subject to each fund’s investment policies and borrowing and lending limits. Interest earned or paid on the interfund lending transaction will be based on the average of certain current market rates. During the reporting period, the fund did not utilize the program.
Lines of credit The fund participates, along with other Putnam funds, in a $392.5 million unsecured committed line of credit and a $235.5 million unsecured uncommitted line of credit, both provided by State Street. Borrowings may be made for temporary or emergency purposes, including the funding of shareholder redemption requests and trade settlements. Interest is charged to the fund based on the fund’s borrowing at a rate equal to the Federal Funds rate plus 1.25% for the committed line of credit and the Federal Funds rate plus 1.30% for the uncommitted line of credit. A closing fee equal to 0.04% of the committed line of credit and 0.04% of the uncommitted line of credit has been paid by the participating funds. In addition, a commitment fee of 0.11% per annum on any unutilized portion of the committed line of credit is allocated to the participating funds based on their relative net assets and paid quarterly. During the reporting period, the fund had no borrowings against these arrangements.
Federal taxes It is the policy of the fund to distribute all of its taxable income within the prescribed time period and otherwise comply with the provisions of the Internal Revenue Code of 1986, as amended (the Code), applicable to regulated investment companies. It is also the intention of the fund to distribute an amount sufficient to avoid imposition of any excise tax under Section 4982 of the Code.
The fund is subject to the provisions of Accounting Standards Codification 740 Income Taxes (ASC 740). ASC 740 sets forth a minimum threshold for financial statement recognition of the benefit of a tax position taken or expected to be taken in a tax return. The fund did not have a liability to record for any unrecognized tax benefits in the accompanying financial statements. No provision has been made for federal taxes on income, capital gains or unrealized appreciation on securities held nor for excise tax on income and capital gains. Each of the fund’s federal tax returns for the prior three fiscal years remains subject to examination by the Internal Revenue Service.
46 Voyager Fund
The fund may also be subject to taxes imposed by governments of countries in which it invests. Such taxes are generally based on either income or gains earned or repatriated. The fund accrues and applies such taxes to net investment income, net realized gains and net unrealized gains as income and/or capital gains are earned. In some cases, the fund may be entitled to reclaim all or a portion of such taxes, and such reclaim amounts, if any, are reflected as an asset on the fund’s books. In many cases, however, the fund may not receive such amounts for an extended period of time, depending on the country of investment.
Distributions to shareholders Distributions to shareholders from net investment income are recorded by the fund on the ex-dividend date. Distributions from capital gains, if any, are recorded on the ex-dividend date and paid at least annually. The amount and character of income and gains to be distributed are determined in accordance with income tax regulations, which may differ from generally accepted accounting principles. These differences include temporary and/or permanent differences from losses on wash sale transactions, foreign currency gains and losses, unrealized gains and losses on passive investment companies, income on swap contracts and partnership income. Reclassifications are made to the fund’s capital accounts to reflect income and gains available for distribution (or available capital loss carryovers) under income tax regulations. At the close of the reporting period, the fund reclassified $11,189,522 to decrease undistributed net investment income, $4,615 to decrease paid-in-capital and $11,194,137 to increase accumulated net realized gain.
The tax basis components of distributable earnings and the federal tax cost as of the close of the reporting period were as follows:
Unrealized appreciation
$464,937,586
Unrealized depreciation
(185,299,334)
Net unrealized appreciation
279,638,252
Undistributed ordinary income
16,579,190
Undistributed long-term gain
285,583,723
Undistributed short-term gain
216,165,384
Cost for federal income tax purposes
$4,390,147,898
Note 2: Management fee, administrative services and other transactions
The fund pays Putnam Management a management fee (base fee) (based on the fund’s average net assets and computed and paid monthly) at annual rates that may vary based on the average of the aggregate net assets of most open-end funds, as defined in the fund’s management contract, sponsored by Putnam Management. Such annual rates may vary as follows:
0.710%
of the first $5 billion,
0.660%
of the next $5 billion,
0.610%
of the next $10 billion,
0.560%
of the next $10 billion,
0.510%
of the next $50 billion,
0.490%
of the next $50 billion,
0.480%
of the next $100 billion and
0.475%
of any excess thereafter.
The fund’s shareholders approved the fund’s current management contract with Putnam Management effective February 27, 2014. Shareholders were asked to approve the fund’s management contract following the death on October 8, 2013 of The Honourable Paul G. Desmarais, who had controlled directly and indirectly a majority of the voting shares of Power Corporation of Canada, the ultimate parent company of Putnam Management. The substantive terms of the management contract, including terms relating to fees, are identical to the terms of the fund’s previous management contract and reflect the rates provided in the table above.
In addition, beginning with January 2011, the monthly management fee consists of the monthly base fee plus or minus a performance adjustment for the month. The performance adjustment is determined based on performance over the thirty-six month period then ended. Each month, the performance adjustment is calculated by multiplying the performance adjustment rate and the fund’s average net assets over the performance period and the result is divided by twelve. The resulting dollar amount is added to, or subtracted from the base fee for that month. The performance adjustment rate is equal to 0.03 multiplied by the difference between the fund’s annualized performance (measured by the fund’s class A shares) and the annualized performance of the Russell 1000 Growth Index, each measured over the performance period. The maximum annualized performance adjustment rates are +/– 0.12%. The monthly base fee is determined based on the fund’s average net assets for the month, while the performance adjustment is determined based on the fund’s average net assets over the performance period of up to thirty-six months. This means it is possible that, if the fund underperforms significantly over the performance
Voyager Fund 47
period, and the fund’s assets have declined significantly over that period, the negative performance adjustment may exceed the base fee. In this event, Putnam Management would make a payment to the fund.
Because the performance adjustment is based on the fund’s performance relative to its applicable benchmark index, and not its absolute performance, the performance adjustment could increase Putnam Management’s fee even if the fund’s shares lose value during the performance period provided that the fund outperformed its benchmark index, and could decrease Putnam Management’s fee even if the fund’s shares increase in value during the performance period provided that the fund underperformed its benchmark index.
For the reporting period, the base fee represented an effective rate (excluding the impact from any expense waivers in effect) of 0.554% of the fund’s average net assets before a decrease of $4,566,706 (0.111% of the fund’s average net assets) based on performance.
Putnam Management has contractually agreed, through June 30, 2015, to waive fees or reimburse the fund’s expenses to the extent necessary to limit the cumulative expenses of the fund, exclusive of brokerage, interest, taxes, investment-related expenses, extraordinary expenses, acquired fund fees and expenses and payments under the fund’s investor servicing contract, investment management contract and distribution plans, on a fiscal year-to-date basis to an annual rate of 0.20% of the fund’s average net assets over such fiscal year-to-date period. During the reporting period, the fund’s expenses were not reduced as a result of this limit.
Putnam Investments Limited (PIL), an affiliate of Putnam Management, is authorized by the Trustees to manage a separate portion of the assets of the fund as determined by Putnam Management from time to time. Putnam Management pays a quarterly sub-management fee to PIL for its services at an annual rate of 0.35% of the average net assets of the portion of the fund managed by PIL.
The fund reimburses Putnam Management an allocated amount for the compensation and related expenses of certain officers of the fund and their staff who provide administrative services to the fund. The aggregate amount of all such reimbursements is determined annually by the Trustees.
Custodial functions for the fund’s assets are provided by State Street. Custody fees are based on the fund’s asset level, the number of its security holdings and transaction volumes.
Putnam Investor Services, Inc., an affiliate of Putnam Management, provides investor servicing agent functions to the fund. Putnam Investor Services, Inc. received fees for investor servicing (except for Class R5 and R6 shares) based on the fund’s retail asset level, the number of shareholder accounts in the fund and the level of defined contribution plan assets in the fund. Class R5 shares pay a monthly fee based on the average net assets of class R5 shares at an annual rate of 0.15%. Class R6 shares pay a monthly fee based on the average net assets of class R6 shares at an annual rate of 0.05%. Investor servicing fees will not exceed an annual rate of 0.32% of the fund’s average net assets. During the reporting period, the expenses for each class of shares related to investor servicing fees were as follows:
Class A
$7,574,447
Class B
240,872
Class C
345,285
Class M
60,170
Class R
40,122
Class R5
23
Class R6
17,669
Class Y
734,183
Total
$9,012,771
The fund has entered into expense offset arrangements with Putnam Investor Services, Inc. and State Street whereby Putnam Investor Services, Inc.’s and State Street’s fees are reduced by credits allowed on cash balances. The fund also reduced expenses through brokerage/service arrangements. For the reporting period, the fund’s expenses were reduced by $5,931 under the expense offset arrangements and by $657,180 under the brokerage/service arrangements.
Each Independent Trustee of the fund receives an annual Trustee fee, of which $2,502, as a quarterly retainer, has been allocated to the fund, and an additional fee for each Trustees meeting attended. Trustees also are reimbursed for expenses they incur relating to their services as Trustees.
The fund has adopted a Trustee Fee Deferral Plan (the Deferral Plan) which allows the Trustees to defer the receipt of all or a portion of Trustees fees payable on or after July 1, 1995. The deferred fees remain invested in certain Putnam funds until distribution in accordance with the Deferral Plan.
48 Voyager Fund
The fund has adopted an unfunded noncontributory defined benefit pension plan (the Pension Plan) covering all Trustees of the fund who have served as a Trustee for at least five years and were first elected prior to 2004. Benefits under the Pension Plan are equal to 50% of the Trustee’s average annual attendance and retainer fees for the three years ended December 31, 2005. The retirement benefit is payable during a Trustee’s lifetime, beginning the year following retirement, for the number of years of service through December 31, 2006. Pension expense for the fund is included in Trustee compensation and expenses in the Statement of operations. Accrued pension liability is included in Payable for Trustee compensation and expenses in the Statement of assets and liabilities. The Trustees have terminated the Pension Plan with respect to any Trustee first elected after 2003.
The fund has adopted distribution plans (the Plans) with respect to its class A, class B, class C, class M and class R shares pursuant to Rule 12b–1 under the Investment Company Act of 1940. The purpose of the Plans is to compensate Putnam Retail Management Limited Partnership, an indirect wholly-owned subsidiary of Putnam Investments, LLC, for services provided and expenses incurred in distributing shares of the fund. The Plans provide for payments by the fund to Putnam Retail Management Limited Partnership at an annual rate of up to 0.35%, 1.00%, 1.00%, 1.00% and 1.00% of the average net assets attributable to class A, class B, class C, class M and class R shares, respectively. The Trustees have approved payment by the fund at an annual rate of 0.25%, 1.00%, 1.00%, 0.75% and 0.50% of the average net assets attributable to class A, class B, class C, class M and class R shares, respectively. During the reporting period, the class specific expenses related to distribution fees were as follows:
Class A
$8,623,447
Class B
1,095,007
Class C
1,573,921
Class M
205,624
Class R
91,325
Total
$11,589,324
For the reporting period, Putnam Retail Management Limited Partnership, acting as underwriter, received net commissions of $278,677 and $2,770 from the sale of class A and class M shares, respectively, and received $57,793 and $1,307 in contingent deferred sales charges from redemptions of class B and class C shares, respectively.
A deferred sales charge of up to 1.00% and 0.65% is assessed on certain redemptions of class A and class M shares, respectively. For the reporting period, Putnam Retail Management Limited Partnership, acting as underwriter, received $227 and no monies on class A and class M redemptions, respectively.
Note 3: Purchases and sales of securities
During the reporting period, cost of purchases and proceeds from sales of investment securities other than short-term investments aggregated $5,812,662,095 and $6,264,711,804, respectively. There were no purchases or proceeds from sales of long-term U.S. government securities.
Written option transactions during the reporting period are summarized as follows:
Written option contract amount
Written option premiums
Written options outstanding at the beginning of the reporting period
$68,656,914
$8,902,378
Options opened
867,936,741
215,360,245
Options exercised
—
—
Options expired
(734,013,894)
(161,335,748)
Options closed
(132,382,130)
(25,645,576)
Written options outstanding at the end of the reporting period
$70,197,631
$37,281,299
Voyager Fund 49
Note 4: Capital shares
At the close of the reporting period, there was an unlimited number of shares of beneficial interest authorized. Transactions in capital shares were as follows:
Year ended 7/31/14
Year ended 7/31/13
Class A
Shares
Amount
Shares
Amount
Shares sold
5,083,664
$155,397,538
5,584,636
$130,712,953
Shares issued in connection with reinvestment of distributions
945,299
28,585,821
1,453,391
31,247,903
6,028,963
183,983,359
7,038,027
161,960,856
Shares repurchased
(15,627,833)
(476,677,197)
(29,073,151)
(672,214,967)
Net decrease
(9,598,870)
$(292,693,838)
(22,035,124)
$(510,254,111)
Year ended 7/31/14
Year ended 7/31/13
Class B
Shares
Amount
Shares
Amount
Shares sold
352,932
$9,033,292
359,782
$7,012,805
Shares issued in connection with reinvestment of distributions
18,043
458,121
32,648
591,263
370,975
9,491,413
392,430
7,604,068
Shares repurchased
(1,169,391)
(29,880,541)
(1,808,140)
(35,203,269)
Net decrease
(798,416)
$(20,389,128)
(1,415,710)
$(27,599,201)
Year ended 7/31/14
Year ended 7/31/13
Class C
Shares
Amount
Shares
Amount
Shares sold
621,925
$17,543,210
398,061
$8,571,127
Shares issued in connection with reinvestment of distributions
12,351
345,455
17,065
339,927
634,276
17,888,665
415,126
8,911,054
Shares repurchased
(929,693)
(25,934,900)
(3,423,221)
(72,073,489)
Net decrease
(295,417)
$(8,046,235)
(3,008,095)
$(63,162,435)
Year ended 7/31/14
Year ended 7/31/13
Class M
Shares
Amount
Shares
Amount
Shares sold
45,399
$1,263,926
43,124
$925,533
Shares issued in connection with reinvestment of distributions
5,319
147,750
8,545
169,109
50,718
1,411,676
51,669
1,094,642
Shares repurchased
(118,346)
(3,263,608)
(259,265)
(5,469,679)
Net decrease
(67,628)
$(1,851,932)
(207,596)
$(4,375,037)
50 Voyager Fund
Year ended 7/31/14
Year ended 7/31/13
Class R
Shares
Amount
Shares
Amount
Shares sold
177,145
$5,341,769
182,129
$4,165,365
Shares issued in connection with reinvestment of distributions
2,841
84,346
5,767
121,739
179,986
5,426,115
187,896
4,287,104
Shares repurchased
(290,523)
(8,598,903)
(445,460)
(10,152,270)
Net decrease
(110,537)
$(3,172,788)
(257,564)
$(5,865,166)
Year ended 7/31/14
Year ended 7/31/13
Class R5
Shares
Amount
Shares
Amount
Shares sold
—
$—
—
$—
Shares issued in connection with reinvestment of distributions
6
171
5
129
6
171
5
129
Shares repurchased
—
—
—
—
Net increase
6
$171
5
$129
Year ended 7/31/14
Year ended 7/31/13
Class R6
Shares
Amount
Shares
Amount
Shares sold
88,024
$2,802,257
1,180,085
$29,854,960
Shares issued in connection with reinvestment of distributions
13,661
432,629
6
133
101,685
3,234,886
1,180,091
29,855,093
Shares repurchased
(123,670)
(3,933,547)
(75,689)
(1,974,844)
Net increase (decrease)
(21,985)
$(698,661)
1,104,402
$27,880,249
Year ended 7/31/14
Year ended 7/31/13
Class Y
Shares
Amount
Shares
Amount
Shares sold
2,308,229
$74,098,441
3,218,184
$77,537,538
Shares issued in connection with reinvestment of distributions
93,508
2,954,851
160,304
3,598,822
2,401,737
77,053,292
3,378,488
81,136,360
Shares repurchased
(2,676,769)
(86,300,461)
(7,956,105)
(192,017,973)
Net decrease
(275,032)
$(9,247,169)
(4,577,617)
$(110,881,613)
At the close of the reporting period, Putnam Investments, LLC owned the following shares of the fund:
Shares owned
Percentage of ownership
Value
Class R5
469
100%
$15,921
Class R6
469
0.04
15,941
Voyager Fund 51
Note 5: Affiliated transactions
Transactions during the reporting period with a company which is under common ownership or control, or involving securities of companies in which the fund owned at least 5% of the outstanding voting securities, were as follows:
Name of affiliates
Fair value at the beginning of the reporting period
Purchase cost
Sale proceeds
Investment income
Fair value at the end of the reporting period
Putnam Short Term Investment Fund*
$121,496,391
$1,772,216,937
$1,675,263,153
$46,302
$218,450,175
ITT Educational Services, Inc.†
—
19,891,404
—
—
26,697,942
Totals
$121,496,391
$1,792,108,341
$1,675,263,153
$46,302
$245,148,117
*Management fees charged to Putnam Short Term Investment Fund have been waived by Putnam Management.
†Security was only in affiliation for a portion of the reporting period.
Note 6: Market, credit and other risks
In the normal course of business, the fund trades financial instruments and enters into financial transactions where risk of potential loss exists due to changes in the market (market risk) or failure of the contracting party to the transaction to perform (credit risk). The fund may be exposed to additional credit risk that an institution or other entity with which the fund has unsettled or open transactions will default. Investments in foreign securities involve certain risks, including those related to economic instability, unfavorable political developments, and currency fluctuations.
Note 7: Summary of derivative activity
The volume of activity for the reporting period for any derivative type that was held during the period is listed below and was as follows based on an average of the holdings at the end of each fiscal quarter:
Written equity option contracts (contract amount) (Note 3)
$75,600,000
Forward currency contracts (contract amount)
$434,200,000
OTC total return swap contracts (notional)
$67,300,000
Warrants (number of warrants)
43,100,000
The following is a summary of the fair value of derivative instruments as of the close of the reporting period:
Fair value of derivative instruments as of the close of the reporting period
Asset derivatives
Liability derivatives
Derivatives not accounted for as hedging instruments under ASC 815
Statement of assets and liabilities location
Fair value
Statement of assets and liabilities location
Fair value
Foreign exchange contracts
Receivables
$3,485,956
Payables
$684,227
Equity contracts
Investments
123,345,215
Payables
50,959,182
Total
$126,831,171
$51,643,409
52 Voyager Fund
The following is a summary of realized and change in unrealized gains or losses of derivative instruments on the Statement of operations for the reporting period (see Note 1):
Amount of realized gain or (loss) on derivatives recognized in net gain or (loss) on investments
Derivatives not accounted for as hedging instruments under ASC 815
Warrants
Options
Forward currency contracts
Swaps
Total
Foreign exchange contracts
$—
$—
$(8,478,724)
$—
$(8,478,724)
Equity contracts
(9,854,435)
443,163
—
1,222,694
$(8,188,578)
Total
$(9,854,435)
$443,163
$(8,478,724)
$1,222,694
$(16,667,302)
Change in unrealized appreciation or (depreciation) on derivatives recognized in net gain or (loss) on investments
Derivatives not accounted for as hedging instruments under ASC 815
Warrants
Options
Forward currency contracts
Swaps
Total
Foreign exchange contracts
$—
$—
$3,161,683
$—
$3,161,683
Equity contracts
13,888,979
(19,983,776)
—
(3,480,980)
$(9,575,777)
Total
$13,888,979
$(19,983,776)
$3,161,683
$(3,480,980)
$(6,414,094)
Voyager Fund 53
Note 8: Offsetting of financial and derivative assets and liabilities
The following table summarizes any derivatives, repurchase agreements and reverse repurchase agreements, at the end of the reporting period, that are subject to an enforceable master netting agreement or similar agreement. For securities lending transactions or borrowing transactions associated with securities sold short, if any, see Note 1. For financial reporting purposes, the fund does not offset financial assets and financial liabilities that are subject to the master netting agreements in the Statement of assets and liabilities.
Bank of America N.A.
Barclays Bank PLC
Citibank, N.A.
Credit Suisse International
Deutsche Bank AG
Goldman Sachs International
JPMorgan Chase Bank N.A.
Morgan Stanley & co. International PLC
UBS AG
Total
Assets:
OTC Total return swap contracts*#
$—
$—
$—
$—
$—
$—
$—
$—
$—
$—
Forward currency contracts#
—
—
—
3,485,956
—
—
—
—
—
3,485,956
Purchased options**#
1,727,071
6,676,065
30,415,042
30,675,642
9,466,028
2,617,191
170,993
4,572,675
3,668,338
89,989,045
Total Assets
$1,727,071
$6,676,065
$30,415,042
$34,161,598
$9,466,028
$2,617,191
$170,993
$4,572,675
$3,668,338
$93,475,001
Liabilities:
OTC Total return swap contracts*#
—
—
—
—
1,949,572
—
122,568
—
—
2,072,140
Forward currency contracts#
—
—
—
—
—
—
—
—
684,227
684,227
Written options#
818,903
3,446,295
20,897,730
18,471,775
2,642,507
1,109,995
142,077
—
1,357,760
48,887,042
Total Liabilities
$818,903
$3,446,295
$20,897,730
$18,471,775
$4,592,079
$1,109,995
$264,645
$—
$2,041,987
$51,643,409
Total Financial and Derivative Net Assets
$908,168
$3,229,770
$9,517,312
$15,689,823
$4,873,949
$1,507,196
$(93,652)
$4,572,675
$1,626,351
$41,831,592
Total collateral received (pledged)†##
$775,703
$697,822
$8,189,000
$9,809,866
$4,873,949
$1,507,196
$(93,652)
$4,572,675
$1,356,881
Net amount
$132,465
$2,531,948
$1,328,312
$5,879,957
$—
$—
$—
$—
$269,470
*
Excludes premiums, if any. Included in unrealized appreciation and depreciation on OTC swap contracts on the Statement of assets and liabilities.
**
Included with Investments in securities on the Statement of assets and liabilities.
†
Additional collateral may be required from certain brokers based on individual agreements.
#
Covered by master netting agreement. (Note 1)
##
Any over-collateralization of total financial and derivative net assets is not shown. Collateral may include amounts related to unsettled agreements.
54 Voyager Fund
Voyager Fund 55
Federal tax information (Unaudited)
Pursuant to §852 of the Internal Revenue Code, as amended, the fund hereby designates $314,142,095 as a capital gain dividend with respect to the taxable year ended July 31, 2014, or, if subsequently determined to be different, the net capital gain of such year.
The fund designated 12.76% of ordinary income distributions as qualifying for the dividends received deduction for corporations.
For the reporting period, the fund hereby designates 14.88%, or the maximum amount allowable, of its taxable ordinary income distributions as qualified dividends taxed at the individual net capital gain rates.
For the reporting period, pursuant to §871(k) of the Internal Revenue Code, the fund hereby designates $35,896 of distributions paid as qualifying to be taxed as interest-related dividends, and no amount to be taxed as short-term capital gain dividends for nonresident alien shareholders.
The Form 1099 that will be mailed to you in January 2015 will show the tax status of all distributions paid to your account in calendar 2014.
56 Voyager Fund
Shareholder meeting results (Unaudited)
February 27, 2014 special meeting
At the meeting, each of the nominees for Trustees was elected, as follows:
Votes for
Votes withheld
Liaquat Ahamed
84,903,952
3,897,626
Ravi Akhoury
84,783,331
4,018,247
Barbara M. Baumann
85,444,847
3,356,730
Jameson A. Baxter
85,356,431
3,445,147
Charles B. Curtis
85,260,643
3,540,935
Robert J. Darretta
85,369,801
3,431,777
Katinka Domotorffy
85,111,948
3,689,629
John A. Hill
85,322,465
3,479,112
Paul L. Joskow
85,277,912
3,523,665
Kenneth R. Leibler
85,312,945
3,488,633
Robert E. Patterson
85,401,044
3,400,533
George Putnam, III
85,369,021
3,432,556
Robert L. Reynolds
85,375,086
3,426,491
W. Thomas Stephens
85,317,931
3,483,646
A proposal to approve a new management contract between the fund and Putnam Management was approved as follows:
Votes for
Votes against
Abstentions
Broker non-votes
65,318,044
2,536,401
4,134,435
16,812,698
March 27, 2014 special meeting
A proposal to adopt an Amended and Restated Declaration of Trust, with respect to which the February 27, 2014 meeting had been adjourned, was approved as follows:
Votes for
Votes against
Abstentions
Broker non-votes
69,142,923
3,468,907
5,341,094
15,499,587
All tabulations are rounded to the nearest whole number.
Voyager Fund 57
About the Trustees
Independent Trustees
Liaquat Ahamed
Born 1952, Trustee since 2012
Principal occupations during past five years: Pulitzer Prize-winning author of Lords of Finance: The Bankers Who Broke the World, whose articles on economics have appeared in such publications as the New York Times, Foreign Affairs, and the Financial Times. Director of Aspen Insurance Co., a New York Stock Exchange company, and Chair of the Aspen Board’s Investment Committee. Trustee of the Brookings Institution and Chair of its Investment Committee.
Other directorships: The Rohatyn Group, an emerging-market fund complex that manages money for institutions
Ravi Akhoury
Born 1947, Trustee since 2009
Principal occupations during past five years: Trustee of American India Foundation and of the Rubin Museum. From 1992 to 2007, was Chairman and CEO of MacKay Shields, a multi-product investment management firm.
Other directorships: RAGE Frameworks, Inc., a private software company; English Helper, Inc., a private software company
Barbara M. Baumann
Born 1955, Trustee since 2010
Principal occupations during past five years: President and Owner of Cross Creek Energy Corporation, a strategic consultant to domestic energy firms and direct investor in energy projects. Current Board member of The Denver Foundation. Former Chair and current Board member of Girls Incorporated of Metro Denver. Member of the Finance Committee, the Children’s Hospital of Colorado.
Other directorships: Devon Energy Corporation, a leading independent natural gas and oil exploration and production company; UNS Energy Corporation, an Arizona utility; Cody Resources Management, a private company in the energy and ranching businesses
Jameson A. Baxter
Born 1943, Trustee since 1994, Vice Chair from 2005 to 2011, and Chair since 2011
Principal occupations during past five years: President of Baxter Associates, Inc., a private investment firm. Chair of Mutual Fund Directors Forum. Chair Emeritus of the Board of Trustees of Mount Holyoke College. Director of the Adirondack Land Trust and Trustee of the Nature Conservancy’s Adirondack Chapter.
Charles B. Curtis
Born 1940, Trustee since 2001
Principal occupations during past five years: Senior Advisor to the Center for Strategic and International Studies. President Emeritus and former President and Chief Operating Officer of the Nuclear Threat Initiative, a private foundation dealing with national security issues. Member of the Council on Foreign Relations and U.S. State Department International Security Advisory Board.
Robert J. Darretta
Born 1946, Trustee since 2007
Principal occupations during past five years: From 2009 until 2012, served as Health Care Industry Advisor to Permira, a global private equity firm. Until April 2007, was Vice Chairman of the Board of Directors of Johnson & Johnson. Served as Johnson & Johnson’s Chief Financial Officer for a decade.
Other directorships: UnitedHealth Group, a diversified health-care company
Katinka Domotorffy
Born 1975, Trustee since 2012
Principal occupations during past five years: Voting member of the Investment Committees of the Anne Ray Charitable Trust and Margaret A. Cargill Foundation, part of the Margaret A. Cargill Philanthropies. Until 2011, Partner, Chief Investment Officer, and Global Head of Quantitative Investment Strategies at Goldman Sachs Asset Management.
Other directorships: Reach Out and Read of Greater New York, an organization dedicated to promoting childhood literacy
John A. Hill
Born 1942, Trustee since 1985 and Chairman from 2000 to 2011
Principal occupations during past five years: Founder and Vice-Chairman of First Reserve Corporation, the leading private equity buyout firm focused on the worldwide energy industry. Trustee and Chairman of the Board of Trustees of Sarah Lawrence College. Member of the Advisory Board of the Millstein Center for Global Markets and Corporate Ownership at The Columbia University Law School.
Other directorships: Devon Energy Corporation, a leading independent natural gas and oil exploration and production company
58 Voyager Fund
Paul L. Joskow
Born 1947, Trustee since 1997
Principal occupations during past five years: Economist and President of the Alfred P. Sloan Foundation, a philanthropic institution focused primarily on research and education on issues related to science, technology, and economic performance. Elizabeth and James Killian Professor of Economics, Emeritus at the Massachusetts Institute of Technology (MIT). Prior to 2007, served as the Director of the Center for Energy and Environmental Policy Research at MIT.
Other directorships: Yale University; Exelon Corporation, an energy company focused on power services; Boston Symphony Orchestra; Prior to April 2013, served as Director of TransCanada Corporation and TransCanada Pipelines Ltd., energy companies focused on natural gas transmission, oil pipelines and power services
Kenneth R. Leibler
Born 1949, Trustee since 2006
Principal occupations during past five years: Founder and former Chairman of Boston Options Exchange, an electronic marketplace for the trading of derivative securities. Serves on the Board of Trustees of Beth Israel Deaconess Hospital in Boston, Massachusetts. Director of Beth Israel Deaconess Care Organization. Until November 2010, director of Ruder Finn Group, a global communications and advertising firm.
Other directorships: Northeast Utilities, which operates New England’s largest energy delivery system
Robert E. Patterson
Born 1945, Trustee since 1984
Principal occupations during past five years: Co-Chairman of Cabot Properties, Inc., a private equity firm investing in commercial real estate, and Chairman of its Investment Committee. Past Chairman and Trustee of the Joslin Diabetes Center.
George Putnam, III
Born 1951, Trustee since 1984
Principal occupations during past five years: Chairman of New Generation Research, Inc., a publisher of financial advisory and other research services. Founder and President of New Generation Advisors, LLC, a registered investment advisor to private funds. Director of The Boston Family Office, LLC, a registered investment advisor.
W. Thomas Stephens
Born 1942, Trustee from 1997 to 2008 and since 2009
Principal occupations during past five years: Retired as Chairman and Chief Executive Officer of Boise Cascade, LLC, a paper, forest products, and timberland assets company, in December 2008. Prior to 2010, Director of Boise Inc., a manufacturer of paper and packaging products.
Other directorships: TransCanada Pipelines Ltd., an energy infrastructure company
Interested Trustee
Robert L. Reynolds*
Born 1952, Trustee since 2008 and President of the Putnam Funds since 2009
Principal occupations during past five years: President and Chief Executive Officer of Putnam Investments since 2008 and, since 2014, President and Chief Executive Officer of Great-West Financial, a financial services company that provides retirement savings plans, life insurance, and annuity and executive benefits products, and of Great-West Lifeco U.S. Inc., a holding company that owns Putnam Investments and Great-West Financial. Prior to joining Putnam Investments, served as Vice Chairman and Chief Operating Officer of Fidelity Investments from 2000 to 2007.
*Mr. Reynolds is an “interested person” (as defined in the Investment Company Act of 1940) of the fund and Putnam Investments. He is President and Chief Executive Officer of Putnam Investments, as well as the President of your fund and each of the other Putnam funds.
The address of each Trustee is One Post Office Square, Boston, MA 02109.
As of July 31, 2014, there were 116 Putnam funds. All Trustees serve as Trustees of all Putnam funds.
Each Trustee serves for an indefinite term, until his or her resignation, retirement at age 75, removal, or death.
Voyager Fund 59
Officers
In addition to Robert L. Reynolds, the other officers of the fund are shown below:
Jonathan S. Horwitz (Born 1955)
Executive Vice President, Principal Executive Officer, and Compliance Liaison
Since 2004
Steven D. Krichmar (Born 1958)
Vice President and Principal Financial Officer
Since 2002
Chief of Operations, Putnam Investments and Putnam Management
Robert T. Burns (Born 1961)
Vice President and Chief Legal Officer
Since 2011
General Counsel, Putnam Investments, Putnam Management, and Putnam Retail Management
Manager of Finance, Dunkin’ Brands (2008–2010); Senior Financial Analyst, Old Mutual Asset Management (2007–2008); Senior Financial Analyst, Putnam Investments (1999–2007)
Janet C. Smith (Born 1965)
Vice President, Principal Accounting Officer, and Assistant Treasurer
Since 2007
Director of Fund Administration Services, Putnam Investments and Putnam Management
Susan G. Malloy (Born 1957)
Vice President and Assistant Treasurer
Since 2007
Director of Accounting & Control Services, Putnam Investments and Putnam Management
James P. Pappas (Born 1953)
Vice President
Since 2004
Director of Trustee Relations, Putnam Investments and Putnam Management
Mark C. Trenchard (Born 1962)
Vice President and BSA Compliance Officer
Since 2002
Director of Operational Compliance, Putnam Investments and Putnam Retail Management
Nancy E. Florek (Born 1957)
Vice President, Director of Proxy Voting and Corporate Governance, Assistant Clerk, and Associate Treasurer
Since 2000
The principal occupations of the officers for the past five years have been with the employers as shown above, although in some cases they have held different positions with such employers. The address of each Officer is One Post Office Square, Boston, MA 02109.
60 Voyager Fund
Fund information
Founded over 75 years ago, Putnam Investments was built around the concept that a balance between risk and reward is the hallmark of a well-rounded financial program. We manage over 100 funds across income, value, blend, growth, asset allocation, absolute return, and global sector categories.
Investment Manager
Putnam Investment Management, LLC One Post Office Square Boston, MA 02109
Investment Sub-Manager
Putnam Investments Limited 57–59 St James’s Street London, England SW1A 1LD
Marketing Services
Putnam Retail Management One Post Office Square Boston, MA 02109
Custodian
State Street Bank and Trust Company
Legal Counsel
Ropes & Gray LLP
Auditor
PricewaterhouseCoopers LLP
Trustees
Jameson A. Baxter, Chair Liaquat Ahamed Ravi Akhoury Barbara M. Baumann Charles B. Curtis Robert J. Darretta Katinka Domotorffy John A. Hill Paul L. Joskow Kenneth R. Leibler Robert E. Patterson George Putnam, III Robert L. Reynolds W. Thomas Stephens
Officers
Robert L. Reynolds President
Jonathan S. Horwitz Executive Vice President, Principal Executive Officer, and Compliance Liaison
Steven D. Krichmar Vice President and Principal Financial Officer
Robert T. Burns Vice President and Chief Legal Officer
Robert R. Leveille Vice President and Chief Compliance Officer
Michael J. Higgins Vice President, Treasurer, and Clerk
Janet C. Smith Vice President, Principal Accounting Officer, and Assistant Treasurer
Susan G. Malloy Vice President and Assistant Treasurer
James P. Pappas Vice President
Mark C. Trenchard Vice President and BSA Compliance Officer
Nancy E. Florek Vice President, Director of Proxy Voting and Corporate Governance, Assistant Clerk, and Associate Treasurer
This report is for the information of shareholders of Putnam Voyager Fund. It may also be used as sales literature when preceded or accompanied by the current prospectus, the most recent copy of Putnam’s Quarterly Performance Summary, and Putnam’s Quarterly Ranking Summary. For more recent performance, please visit putnam.com. Investors should carefully consider the investment objectives, risks, charges, and expenses of a fund, which are described in its prospectus. For this and other information or to request a prospectus or summary prospectus, call 1-800-225-1581 toll free. Please read the prospectus carefully before investing. The fund’s Statement of Additional Information contains additional information about the fund’s Trustees and is available without charge upon request by calling 1-800-225-1581.
Item 2. Code of Ethics:
(a) The fund’s principal executive, financial and accounting officers are employees of Putnam Investment Management, LLC, the Fund’s investment manager. As such they are subject to a comprehensive Code of Ethics adopted and administered by Putnam Investments which is designed to protect the interests of the firm and its clients. The Fund has adopted a Code of Ethics which incorporates the Code of Ethics of Putnam Investments with respect to all of its officers and Trustees who are employees of Putnam Investment Management, LLC. For this reason, the Fund has not adopted a separate code of ethics governing its principal executive, financial and accounting officers.
(c) In July 2013, the Code of Ethics of Putnam Investment Management, LLC was amended. The changes to the Code of Ethics were as follows: (i) eliminating the requirement for employees to hold their shares of Putnam mutual funds for specified periods of time, (ii) removing the requirement to preclear transactions in certain kinds of exchange-traded funds and exchange-traded notes, although reporting of all such instruments remains required; (iii) eliminating the excessive trading rule related to employee transactions in securities requiring preclearance under the Code; (iv) adding provisions related to monitoring of employee trading; (v) changing from a set number of shares to a set dollar value of stock of mid- and large-cap companies on the Restricted List that can be purchased or sold; (vi) adding a requirement starting in March 2014 for employees to generally use certain approved brokers that provide Putnam with an electronic feed of transactions and statements for their personal brokerage accounts; and (vii) certain other changes.
Item 3. Audit Committee Financial Expert:
The Funds’ Audit and Compliance Committee is comprised solely of Trustees who are “independent” (as such term has been defined by the Securities and Exchange Commission (“SEC”) in regulations implementing Section 407 of the Sarbanes-Oxley Act (the “Regulations”)). The Trustees believe that each of the members of the Audit and Compliance Committee also possess a combination of knowledge and experience with respect to financial accounting matters, as well as other attributes, that qualify them for service on the Committee. In addition, the Trustees have determined that each of Mr. Leibler, Mr. Hill, Mr. Darretta, and Ms. Baumann qualifies as an “audit committee financial expert” (as such term has been defined by the Regulations) based on their review of his or her pertinent experience and education. The SEC has stated, and the funds’ amended and restated agreement and Declaration of Trust provides, that the designation or identification of a person as an audit committee financial expert pursuant to this Item 3 of Form N-CSR does not impose on such person any duties, obligations or liability that are greater than the duties, obligations and liability imposed on such person as a member of the Audit and Compliance Committee and the Board of Trustees in the absence of such designation or identification.
Item 4. Principal Accountant Fees and Services:
The following table presents fees billed in each of the last two fiscal years for services rendered to the fund by the fund’s independent auditor:
Fiscal year ended
Audit Fees
Audit-Related Fees
Tax Fees
All Other Fees
July 31, 2014
$172,157
$ —
$10,598
$ —
July 31, 2013
$220,449
$ —
$9,756
$ —
For the fiscal years ended July 31, 2014 and July 31, 2013, the fund’s independent auditor billed aggregate non-audit fees in the amounts of $586,722 and $157,256 respectively, to the fund, Putnam Management and any entity controlling, controlled by or under common control with Putnam Management that provides ongoing services to the fund.
Audit Fees represent fees billed for the fund’s last two fiscal years relating to the audit and review of the financial statements included in annual reports and registration statements, and other services that are normally provided in connection with statutory and regulatory filings or engagements.
Audit-Related Fees represent fees billed in the fund’s last two fiscal years for services traditionally performed by the fund’s auditor, including accounting consultation for proposed transactions or concerning financial accounting and reporting standards and other audit or attest services not required by statute or regulation.
Tax Fees represent fees billed in the fund’s last two fiscal years for tax compliance, tax planning and tax advice services. Tax planning and tax advice services include assistance with tax audits, employee benefit plans and requests for rulings or technical advice from taxing authorities.
Pre-Approval Policies of the Audit and Compliance Committee. The Audit and Compliance Committee of the Putnam funds has determined that, as a matter of policy, all work performed for the funds by the funds’ independent auditors will be pre-approved by the Committee itself and thus will generally not be subject to pre-approval procedures.
The Audit and Compliance Committee also has adopted a policy to pre-approve the engagement by Putnam Management and certain of its affiliates of the funds’ independent auditors, even in circumstances where pre-approval is not required by applicable law. Any such requests by Putnam Management or certain of its affiliates are typically submitted in writing to the Committee and explain, among other things, the nature of the proposed engagement, the estimated fees, and why this work should be performed by that particular audit firm as opposed to another one. In reviewing such requests, the Committee considers, among other things, whether the provision of such services by the audit firm are compatible with the independence of the audit firm.
The following table presents fees billed by the fund’s independent auditor for services required to be approved pursuant to paragraph (c)(7)(ii) of Rule 2-01 of Regulation S-X.
Fiscal year ended
Audit-Related Fees
Tax Fees
All Other Fees
Total Non-Audit Fees
July 31, 2014
$ —
$576,174
$ —
$ —
July 31, 2013
$ —
$147,500
$ —
$ —
Item 5. Audit Committee of Listed Registrants
Not applicable
Item 6. Schedule of Investments:
The registrant’s schedule of investments in unaffiliated issuers is included in the report to shareholders in Item 1 above.
Item 7. Disclosure of Proxy Voting Policies and Procedures For Closed-End Management Investment Companies:
Not applicable
Item 8. Portfolio Managers of Closed-End Investment Companies
Not Applicable
Item 9. Purchases of Equity Securities by Closed-End Management Investment Companies and Affiliated Purchasers:
Not applicable
Item 10. Submission of Matters to a Vote of Security Holders:
Not applicable
Item 11. Controls and Procedures:
(a) The registrant’s principal executive officer and principal financial officer have concluded, based on their evaluation of the effectiveness of the design and operation of the registrant’s disclosure controls and procedures as of a date within 90 days of the filing date of this report, that the design and operation of such procedures are generally effective to provide reasonable assurance that information required to be disclosed by the registrant in this report is recorded, processed, summarized and reported within the time periods specified in the Commission’s rules and forms.
(b) Changes in internal control over financial reporting: Not applicable
Item 12. Exhibits:
(a)(1) The Code of Ethics of The Putnam Funds, which incorporates the Code of Ethics of Putnam Investments, is filed herewith.
(a)(2) Separate certifications for the principal executive officer and principal financial officer of the registrant as required by Rule 30a-2(a) under the Investment Company Act of 1940, as amended, are filed herewith.
(b) The certifications required by Rule 30a-2(b) under the Investment Company Act of 1940, as amended, are filed herewith.
SIGNATURES
Pursuant to the requirements of the Securities Exchange Act of 1934 and the Investment Company Act of 1940, the registrant has duly caused this report to be signed on its behalf by the undersigned, thereunto duly authorized.
Putnam Voyager Fund
By (Signature and Title):
/s/Janet C. Smith Janet C. Smith Principal Accounting Officer
Date: September 26, 2014
Pursuant to the requirements of the Securities Exchange Act of 1934 and the Investment Company Act of 1940, this report has been signed below by the following persons on behalf of the registrant and in the capacities and on the dates indicated.
By (Signature and Title):
/s/Jonathan S. Horwitz Jonathan S. Horwitz Principal Executive Officer
Date: September 26, 2014
By (Signature and Title):
/s/Steven D. Krichmar Steven D. Krichmar Principal Financial Officer
Date: September 26, 2014
We use cookies on this site to provide a more responsive and personalized service. Continuing to browse, clicking I Agree, or closing this banner indicates agreement. See our Cookie Policy for more information.