CERTIFIED SHAREHOLDER REPORT OF REGISTERED MANAGEMENT INVESTMENT COMPANIES
Investment Company Act file number:
(811-01682)
Exact name of registrant as specified in charter:
Putnam Voyager Fund
Address of principal executive offices:
One Post Office Square, Boston, Massachusetts 02109
Name and address of agent for service:
Robert T. Burns, Vice President One Post Office Square Boston, Massachusetts 02109
Copy to:
Bryan Chegwidden, Esq. Ropes & Gray LLP 1211 Avenue of the Americas New York, New York 10036
Registrant’s telephone number, including area code:
(617) 292-1000
Date of fiscal year end:
July 31, 2015
Date of reporting period:
August 1, 2014 – January 31, 2015
Item 1. Report to Stockholders:
The following is a copy of the report transmitted to stockholders pursuant to Rule 30e-1 under the Investment Company Act of 1940:
Putnam Voyager Fund
Semiannual report 1 | 31 | 15
Message from the Trustees
1
About the fund
2
Performance snapshot
4
Interview with your fund’s portfolio manager
5
Your fund’s performance
10
Your fund’s expenses
12
Terms and definitions
14
Other information for shareholders
15
Financial statements
16
Consider these risks before investing: Investments in small and/or midsize companies increase the risk of greater price fluctuations. Growth stocks may be more susceptible to earnings disappointments, and the market may not favor growth-style investing. Stock prices may fall or fail to rise over time for several reasons, including general financial market conditions and factors related to a specific issuer or industry. You can lose money by investing in the fund.
Message from the Trustees
Dear Fellow Shareholder:
The U.S. economic recovery is gaining steam, with three consecutive quarters of positive GDP growth, accelerated hiring, and rising consumer confidence, which recently hit multi-year highs. U.S. markets, however, have experienced some turbulence since the start of the year.
Cheaper energy prices benefit consumers and many businesses, but the sharp decline in oil prices has also fostered uncertainty. A stronger U.S. dollar may hurt profits for many large multinational companies headquartered in the United States that rely on exports for growth. In addition, investors appear to be anticipating when the Federal Reserve will begin raising interest rates. Overseas growth, meanwhile, remains tepid at best.
In an economically uncertain environment, it can be worthwhile to consider a range of investment opportunities. Putnam invests across many asset classes and pursues flexible strategies that seek out opportunities for growth or income with careful awareness of risk. Our experienced equity and fixed-income teams employ new ways of thinking and integrate innovative investment ideas into time-tested, traditional strategies. In today’s environment, it is also important to rely on your financial advisor, who can ensure your portfolio matches your individual goals and tolerance for risk.
As always, thank you for investing with Putnam.
Respectfully yours,
Robert L. Reynolds President and Chief Executive Officer Putnam Investments
Jameson A. Baxter Chair, Board of Trustees
March 10, 2015
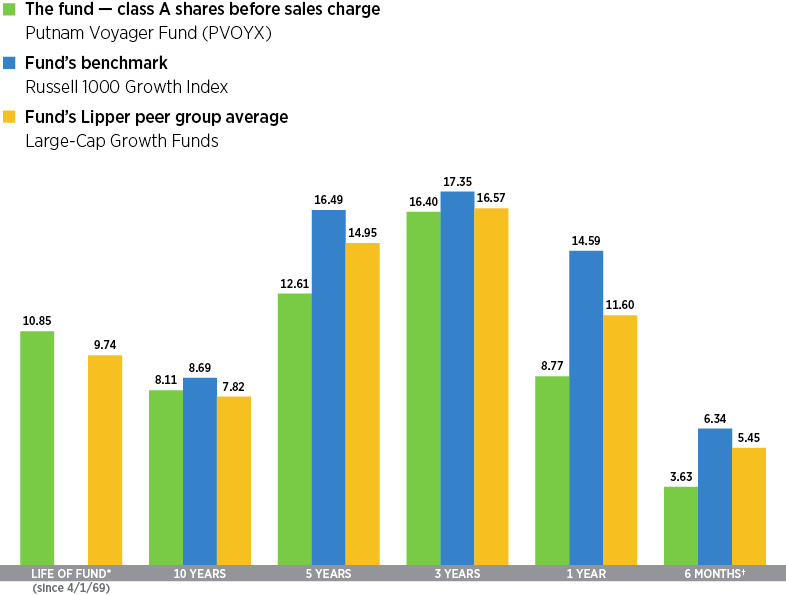
Performance snapshot
Annualized total return (%) comparison as of 1/31/15
Current performance may be lower or higher than the quoted past performance, which cannot guarantee future results. Share price, principal value, and return will fluctuate, and you may have a gain or a loss when you sell your shares. Performance of class A shares assumes reinvestment of distributions and does not account for taxes. Fund returns in the bar chart do not reflect a sales charge of 5.75%; had they, returns would have been lower. See pages 5 and 10–12 for additional performance information. For a portion of the periods, the fund had expense limitations, without which returns would have been lower. To obtain the most recent month-end performance, visit putnam.com.
* The fund’s benchmark, the Russell 1000 Growth Index, was introduced on 12/31/78, which post-dates the inception of the fund’s class A shares.
† Returns for the six-month period are not annualized, but cumulative.
4 Voyager Fund
Interview with your fund’s portfolio manager
Nick C. Thakore
Nick, could you tell us about the investing environment for the six-month reporting period ended January 31, 2015?
The geopolitical situations and economic concerns that produced flat equity performance in the first few months of 2014 faded as investors focused on a steady stream of data showing strong U.S. economic growth potential for the remainder of 2014 and heading into 2015. Government reports indicated that both consumer and business spending was fueling growth, while the Federal Reserve affirmed a mostly upbeat assessment of the country’s economic strength. By the close of 2014, U.S. stocks had delivered yet another annual gain, with the S&P 500 Index, a broad measure of U.S. stock performance, posting a double-digit advance for the third consecutive year. In January 2015, the final month of the period, stocks struggled as investors became worried about some disappointing early corporate earnings reports.
How did the fund perform for the period?
The fund delivered a positive return, but underperformed its benchmark, the Russell 1000 Growth Index, and the average return for funds within its Lipper peer group, Large-Cap Growth Funds. I strive to construct a portfolio with higher expected growth rates for earnings and cash flow than those of the Russell 1000 Growth Index, but to do so without paying too much for that growth. One persistent stock
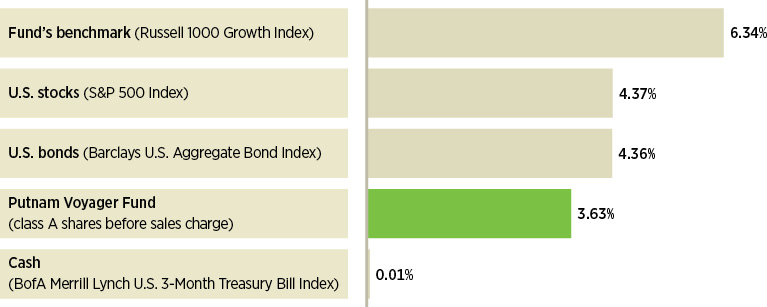
Broad market index and fund performance
This comparison shows your fund’s performance in the context of broad market indexes for the six months ended 1/31/15. See pages 4 and 10–12 for additional fund performance information. Index descriptions can be found on page 14.
Voyager Fund 5
market trend has been an investor preference for stocks that offer apparent safety and yield, regardless of the fundamentals or valuations of the companies. Many of these are “household name” companies whose stocks have become quite expensive while offering very little growth potential, in my view. As investors drove up the prices of these stocks, many other companies with impressive growth potential and attractive valuations lagged, especially during 2014. Although this began to change recently, there were still many holdings in the portfolio whose growth potential was not rewarded during the period.
What were some stocks or strategies that helped fund performance for the period?
The top contributor to fund performance versus the benchmark was the stock of Office Depot, a retailer of office supplies and services. Another highlight was home appliance manufacturer Whirlpool, which reported strong 2014 earnings and has benefited from lower raw material costs. By the close of the period, Whirlpool had been sold from the portfolio.
Fund performance was also helped by our decision to avoid the stocks of IBM and Verizon Communications, both of which underperformed in the period. Health-care holdings proved beneficial to relative returns. Among the fund’s top-performing holdings was the stock of Cubist Pharmaceuticals, a company that specializes in developing antibacterial drugs for use in hospitals. The stock advanced during the period, particularly after the announcement that Cubist was being acquired by Merck, the second-largest U.S. pharmaceutical company. Cubist was no longer a portfolio holding at the close of the period.
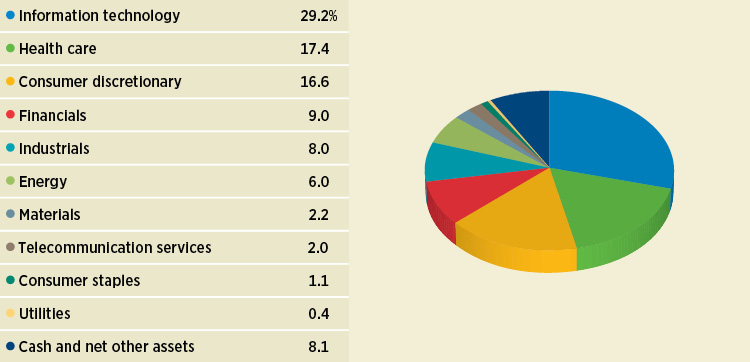
Sector allocations
Allocations are shown as a percentage of the fund’s net assets as of 1/31/15. Cash and net other assets, if any, represent the market value weights of cash, derivatives, short-term securities, and other unclassified assets in the portfolio. Summary information may differ from the portfolio schedule included in the financial statements due to the inclusion of derivative securities, any interest accruals, the exclusion of as-of trades, if any, and the use of different classifications of securities for presentation purposes. Holdings and allocations may vary over time.
6 Voyager Fund
“In my view, there is significant growth potential within segments of the technology sector.”
Nick Thakore
Could you provide examples of holdings that detracted from fund performance for the period?
Plunging energy prices were a major theme for the financial markets. The price of oil dropped more than 50% from June to December, when it hit a five-year low. The decline was largely in response to greater oil supplies combined with reduced energy demand. Although lower oil prices put more money into U.S. consumers’ pockets, they had a negative effect on most stocks in the energy sector and were a primary cause of the market’s volatility.
Energy companies were among the top detractors in the fund’s portfolio for the period. Examples include Halliburton, which provides products and services to oil and gas exploration and production companies, and Whiting Petroleum, which is engaged in oil and gas exploration and production. Also among the notable detractors was ITT Educational Services, a for-profit education company whose stock has struggled due to declining new enrollments and regulatory scrutiny of its private student loan programs.
What role did derivatives play in the portfolio?
Although derivative investments were not a significant part of the portfolio, they did affect performance during the period. Forward currency contracts, which are designed to hedge foreign exchange risk, had a positive impact on the portfolio’s performance. These gains were slightly offset by total return swaps, which are designed to gain exposure to specific markets, countries, sectors, or industries, and by purchased and written
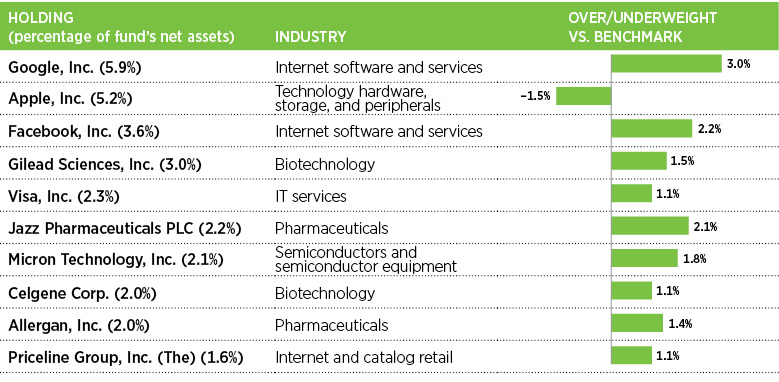
Top 10 holdings
This table shows the fund’s top 10 holdings by percentage of the fund’s net assets as of 1/31/15. Short-term holdings and derivatives, if any, are excluded. Holdings may vary over time.
Voyager Fund 7
options, which are designed to manage downside risks and hedge against changes in values of securities that are currently held or expected to be purchased.
What are some themes or sectors that offer growth potential today?
In my view, there is significant growth potential within segments of the technology sector. One area is Internet advertising, which has already seen incredibly rapid growth as businesses make the transition from more traditional forms of advertising. However, I believe we are only in the very early stages of this transition, and many interesting companies are poised to capitalize on it.
The technology sector also offers great growth potential outside the United States, in my view. Even in markets where overall economic growth is slowing, such as in China, the adoption of mobile technology is happening so rapidly that I believe it is creating incredible opportunities for the right companies. Another notable trend in technology is the transition to the cloud. I believe this is an area that offers growth potential, but also requires intensive research. Finally, it’s important to remember that technology is not a new sector, and there is tremendous opportunity in industries that have transformed themselves to adapt to change. One example is computer memory, where consolidation has led to more controlled capacity and strong demand growth, which could result in solid earnings growth potential for a number of companies.
As the fund enters the second half of its fiscal year, what is your outlook for economies and markets?
What is most interesting as we head into 2015 is the broad disparity in outlooks based on regions, and whether you are looking at consumers or at corporations. At this point, I believe the strongest area is the U.S. consumer. Throughout 2014, consumers in the United
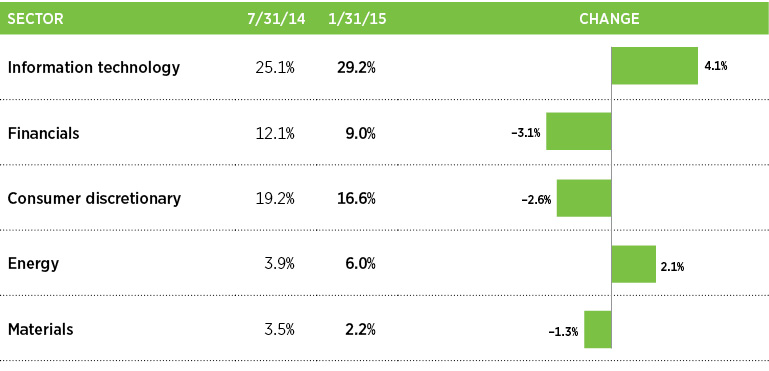
Comparison of top sector shifts
This chart shows the fund’s largest allocation shifts, by percentage, over the past six months. Allocations are shown as a percentage of the fund’s net assets. Current period summary information may differ from the portfolio schedule included in the financial statements due to the inclusion of derivative securities, any interest accruals, the exclusion of as-of trades, if any, and the use of different classifications of securities for presentation purposes. Holdings and allocations may vary over time.
8 Voyager Fund
States received a number of stimulative “gifts” — collapsing oil prices, continued low interest rates, a healing housing market, and improving employment along with moderate wage growth. The outlook changes considerably for overseas markets. For example, economic growth has weakened in emerging markets, particularly China.
My outlook for U.S. corporations is also solid, although businesses are facing a few more hurdles in terms of earnings. Many are starting to reinvest in their businesses for future growth, which can be a drag on earnings in the near term. In addition, weakness in overseas economies may create headwinds, particularly for businesses that derive a significant portion of their revenues from international markets. As a result, our outlook for earnings growth is a bit more cautious for the coming year.
Thank you, Nick, for this update.
The views expressed in this report are exclusively those of Putnam Management and are subject to change. They are not meant as investment advice.
Please note that the holdings discussed in this report may not have been held by the fund for the entire period. Portfolio composition is subject to review in accordance with the fund’s investment strategy and may vary in the future. Current and future portfolio holdings are subject to risk.
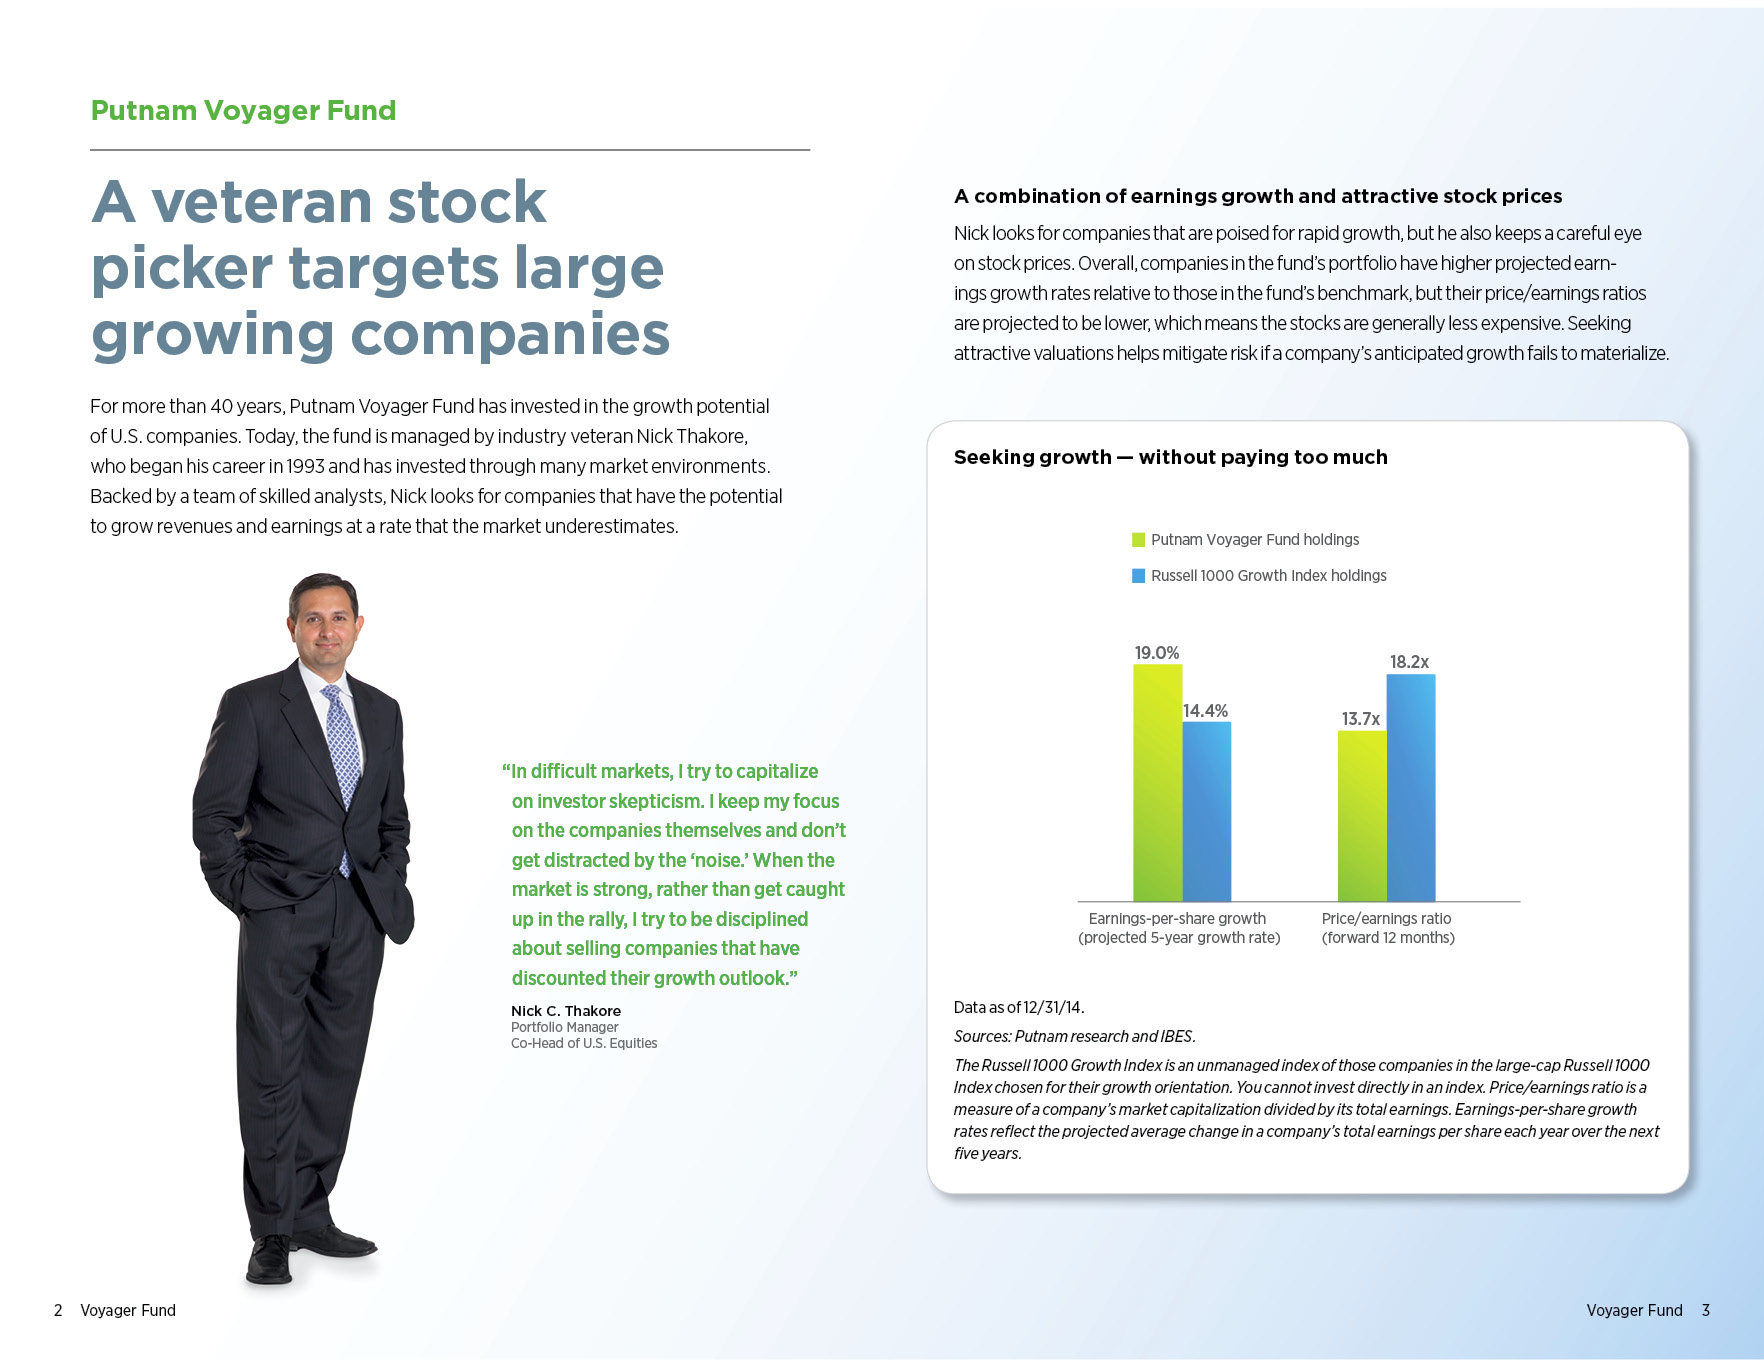
Portfolio Manager Nick C. Thakore is Co-Head of U.S. Equities at Putnam. He has an M.B.A. from the Wharton School of the University of Pennsylvania and a B.B.A. from the University of Michigan. Nick joined Putnam in 2008 and has been in the investment industry since 1993.
IN THE NEWS
How can an increase in the unemployment rate — to 5.7% in January 2015 from 5.6% in December 2014 — mean good news? The answer: More than one million people entered the workforce in January — which includes those actively seeking work. This is good news because it appeared that many people had abandoned looking for a job altogether in the wake of the Great Recession. That’s changing. The labor participation rate ticked up to 62.9% in January from 62.7% in December, according to the Bureau of Labor Statistics (BLS). Many believe that, for the economic recovery to continue, more people who have been sitting on the sidelines will need to reenter the labor market, even though they may not land a job right away. The BLS also noted that 257,000 jobs were added in January, slightly above expectations. More importantly, figures from previous months were revised higher: There were 329,000 additional jobs in December and an even more impressive 423,000 jobs in November. The BLS also reported a gain in average hourly earnings, which rose 0.5% in January after declining slightly in December. Wage growth might be luring people back to the workforce, particularly within lower-paying industries such as retail.
Voyager Fund 9
Your fund’s performance
This section shows your fund’s performance, price, and distribution information for periods ended January 31, 2015, the end of the first half of its current fiscal year. In accordance with regulatory requirements for mutual funds, we also include performance information as of the most recent calendar quarter-end and expense information taken from the fund’s current prospectus. Performance should always be considered in light of a fund’s investment strategy. Data represent past performance. Past performance does not guarantee future results. More recent returns may be less or more than those shown. Investment return and principal value will fluctuate, and you may have a gain or a loss when you sell your shares. Performance information does not reflect any deduction for taxes a shareholder may owe on fund distributions or on the redemption of fund shares. For the most recent month-end performance, please visit the Individual Investors section at putnam.com or call Putnam at 1-800-225-1581. Class R, R5, R6, and Y shares are not available to all investors. See the Terms and Definitions section in this report for definitions of the share classes offered by your fund.
Fund performance Total return for periods ended 1/31/15
Class A
Class B
Class C
Class M
Class R
Class R5
Class R6
Class Y
(inception dates)
(4/1/69)
(4/27/92)
(7/26/99)
(12/1/94)
(1/21/03)
(7/2/12)
(7/2/12)
(3/31/94)
Before sales charge
After sales charge
Before CDSC
After CDSC
Before CDSC
After CDSC
Before sales charge
After sales charge
Net asset value
Net asset value
Net asset value
Net asset value
Annual average
(life of fund)
10.85%
10.70%
10.65%
10.65%
10.01%
10.01%
10.17%
10.08%
10.57%
10.98%
10.99%
10.98%
10 years
118.15
105.61
105.43
105.43
102.29
102.29
107.54
100.28
112.73
124.20
124.74
123.66
Annual average
8.11
7.47
7.46
7.46
7.30
7.30
7.57
7.19
7.84
8.41
8.43
8.38
5 years
81.06
70.65
74.41
72.41
74.44
74.44
76.58
70.40
78.84
83.81
84.25
83.36
Annual average
12.61
11.28
11.77
11.51
11.77
11.77
12.04
11.25
12.33
12.95
13.00
12.89
3 years
57.73
48.66
54.20
51.20
54.19
54.19
55.37
49.93
56.55
59.31
59.70
58.92
Annual average
16.40
14.13
15.53
14.78
15.53
15.53
15.82
14.45
16.11
16.79
16.89
16.70
1 year
8.77
2.52
7.96
3.31
7.97
7.02
8.23
4.44
8.47
9.07
9.19
9.03
6 months
3.63
–2.33
3.21
–1.23
3.22
2.32
3.37
–0.24
3.47
3.77
3.79
3.75
Current performance may be lower or higher than the quoted past performance, which cannot guarantee future results. After-sales-charge returns for class A and M shares reflect the deduction of the maximum 5.75% and 3.50% sales charge, respectively, levied at the time of purchase. Class B share returns after contingent deferred sales charge (CDSC) reflect the applicable CDSC, which is 5% in the first year, declining over time to 1% in the sixth year, and is eliminated thereafter. Class C share returns after CDSC reflect a 1% CDSC for the first year that is eliminated thereafter. Class R, R5, R6, and Y shares have no initial sales charge or CDSC. Performance for class B, C, M, R, and Y shares before their inception is derived from the historical performance of class A shares, adjusted for the applicable sales charge (or CDSC) and the higher operating expenses for such shares, except for class Y shares, for which 12b-1 fees are not applicable. Performance for class R5 and R6 shares prior to their inception is derived from the historical performance of class Y shares and has not been adjusted for the lower investor servicing fees applicable to class R5 and R6 shares; had it, returns would have been higher.
Recent performance may have benefited from one or more legal settlements.
For a portion of the periods, the fund had expense limitations, without which returns would have been lower.
Class B share performance reflects conversion to class A shares after eight years.
10 Voyager Fund
Comparative index returns For periods ended 1/31/15
Russell 1000 Growth Index
Lipper Large-Cap Growth Funds category average*
Annual average (life of fund)
—†
9.74%
10 years
130.16%
113.72
Annual average
8.69
7.82
5 years
114.53
101.18
Annual average
16.49
14.95
3 years
61.62
58.55
Annual average
17.35
16.57
1 year
14.59
11.60
6 months
6.34
5.45
Index and Lipper results should be compared with fund performance before sales charge, before CDSC, or at net asset value.
* Over the 6-month, 1-year, 3-year, 5-year, 10-year, and life-of-fund periods ended 1/31/15, there were 715, 698, 615, 543, 383, and 8 funds, respectively, in this Lipper category.
† The fund’s benchmark, the Russell 1000 Growth Index, was introduced on 12/31/78, which post-dates the inception of the fund’s class A shares.
Fund price and distribution information For the six-month period ended 1/31/15
Distributions
Class A
Class B
Class C
Class M
Class R
Class R5
Class R6
Class Y
Number
1
1
1
1
1
1
1
1
Income
$0.136
—
—
—
$0.042
$0.247
$0.274
$0.225
Capital gains — Long term
2.298
$2.298
$2.298
$2.298
2.298
2.298
2.298
2.298
Capital gains — Short term
1.740
1.740
1.740
1.740
1.740
1.740
1.740
1.740
Total
$4.174
$4.038
$4.038
$4.038
$4.080
$4.285
$4.312
$4.263
Share value
Before sales charge
After sales charge
Net asset value
Net asset value
Before sales charge
After sales charge
Net asset value
Net asset value
Net asset value
Net asset value
7/31/14
$32.36
$34.33
$27.05
$29.79
$29.63
$30.70
$31.72
$33.96
$33.99
$33.87
1/31/15
29.51
31.31
24.03
26.86
26.74
27.71
28.89
31.11
31.12
31.03
The classification of distributions, if any, is an estimate. Before-sales-charge share value and current dividend rate for class A and M shares, if applicable, do not take into account any sales charge levied at the time of purchase. After-sales-charge share value, current dividend rate, and current 30-day SEC yield, if applicable, are calculated assuming that the maximum sales charge (5.75% for class A shares and 3.50% for class M shares) was levied at the time of purchase. Final distribution information will appear on your year-end tax forms.
Voyager Fund 11
Fund performance as of most recent calendar quarter Total return for periods ended 12/31/14
Class A
Class B
Class C
Class M
Class R
Class R5
Class R6
Class Y
(inception dates)
(4/1/69)
(4/27/92)
(7/26/99)
(12/1/94)
(1/21/03)
(7/2/12)
(7/2/12)
(3/31/94)
Before sales charge
After sales charge
Before CDSC
After CDSC
Before CDSC
After CDSC
Before sales charge
After sales charge
Net asset value
Net asset value
Net asset value
Net asset value
Annual average
(life of fund)
10.93%
10.79%
10.73%
10.73%
10.10%
10.10%
10.25%
10.17%
10.65%
11.07%
11.07%
11.06%
10 years
116.11
103.68
103.47
103.47
100.51
100.51
105.65
98.45
110.82
122.06
122.66
121.54
Annual average
8.01
7.37
7.36
7.36
7.20
7.20
7.48
7.09
7.74
8.30
8.33
8.28
5 years
78.90
68.62
72.24
70.24
72.31
72.31
74.42
68.32
76.70
81.51
82.01
81.08
Annual average
12.34
11.01
11.49
11.23
11.50
11.50
11.77
10.98
12.06
12.66
12.72
12.61
3 years
80.36
69.99
76.33
73.33
76.42
76.42
77.73
71.51
79.04
82.18
82.68
81.75
Annual average
21.73
19.35
20.81
20.12
20.83
20.83
21.13
19.70
21.43
22.13
22.24
22.04
1 year
9.55
3.25
8.74
4.06
8.77
7.82
9.03
5.21
9.30
9.91
10.06
9.87
6 months
3.49
–2.46
3.11
–1.33
3.12
2.22
3.27
–0.34
3.40
3.67
3.73
3.65
See the discussion following the fund performance table on page 10 for information about the calculation of fund performance.
Your fund’s expenses
As a mutual fund investor, you pay ongoing expenses, such as management fees, distribution fees (12b-1 fees), and other expenses. Using the following information, you can estimate how these expenses affect your investment and compare them with the expenses of other funds. You may also pay one-time transaction expenses, including sales charges (loads) and redemption fees, which are not shown in this section and would have resulted in higher total expenses. For more information, see your fund’s prospectus or talk to your financial representative.
Expense ratios
Class A
Class B
Class C
Class M
Class R
Class R5
Class R6
Class Y
Total annual operating expenses for the fiscal year ended 7/31/14
0.98%
1.73%
1.73%
1.48%
1.23%
0.66%
0.56%
0.73%
Annualized expense ratio for the six-month period ended 1/31/15
1.04%
1.79%
1.79%
1.54%
1.29%
0.74%
0.64%
0.79%
Fiscal-year expense information in this table is taken from the most recent prospectus, is subject to change, and may differ from that shown for the annualized expense ratio and in the financial highlights of this report.
Prospectus expense information also includes the impact of acquired fund fees and expenses of 0.01%, which is not included in the financial highlights or annualized expense ratios. Expenses are shown as a percentage of average net assets.
12 Voyager Fund
Expenses per $1,000
The following table shows the expenses you would have paid on a $1,000 investment in the fund from August 1, 2014, to January 31, 2015. It also shows how much a $1,000 investment would be worth at the close of the period, assuming actual returns and expenses.
Class A
Class B
Class C
Class M
Class R
Class R5
Class R6
Class Y
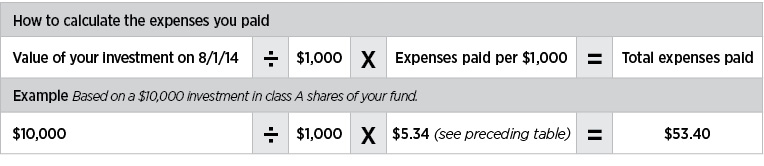
Expenses paid per $1,000*†
$5.34
$9.17
$9.17
$7.89
$6.62
$3.80
$3.29
$4.06
Ending value (after expenses)
$1,036.30
$1,032.10
$1,032.20
$1,033.70
$1,034.70
$1,037.70
$1,037.90
$1,037.50
* Expenses for each share class are calculated using the fund’s annualized expense ratio for each class, which represents the ongoing expenses as a percentage of average net assets for the six months ended 1/31/15. The expense ratio may differ for each share class.
† Expenses are calculated by multiplying the expense ratio by the average account value for the period; then multiplying the result by the number of days in the period; and then dividing that result by the number of days in the year.
Estimate the expenses you paid
To estimate the ongoing expenses you paid for the six months ended January 31, 2015, use the following calculation method. To find the value of your investment on August 1, 2014, call Putnam at 1-800-225-1581.
Compare expenses using the SEC’s method
The Securities and Exchange Commission (SEC) has established guidelines to help investors assess fund expenses. Per these guidelines, the following table shows your fund’s expenses based on a $1,000 investment, assuming a hypothetical 5% annualized return. You can use this information to compare the ongoing expenses (but not transaction expenses or total costs) of investing in the fund with those of other funds. All mutual fund shareholder reports will provide this information to help you make this comparison. Please note that you cannot use this information to estimate your actual ending account balance and expenses paid during the period.
Class A
Class B
Class C
Class M
Class R
Class R5
Class R6
Class Y
Expenses paid per $1,000*†
$5.30
$9.10
$9.10
$7.83
$6.56
$3.77
$3.26
$4.02
Ending value (after expenses)
$1,019.96
$1,016.18
$1,016.18
$1,017.44
$1,018.70
$1,021.48
$1,021.98
$1,021.22
* Expenses for each share class are calculated using the fund’s annualized expense ratio for each class, which represents the ongoing expenses as a percentage of average net assets for the six months ended 1/31/15. The expense ratio may differ for each share class.
† Expenses are calculated by multiplying the expense ratio by the average account value for the six-month period; then multiplying the result by the number of days in the six-month period; and then dividing that result by the number of days in the year.
Voyager Fund 13
Terms and definitions
Important terms
Total return shows how the value of the fund’s shares changed over time, assuming you held the shares through the entire period and reinvested all distributions in the fund.
Before sales charge, or net asset value, is the price, or value, of one share of a mutual fund, without a sales charge. Before-sales-charge figures fluctuate with market conditions, and are calculated by dividing the net assets of each class of shares by the number of outstanding shares in the class.
After sales charge is the price of a mutual fund share plus the maximum sales charge levied at the time of purchase. After-sales-charge performance figures shown here assume the 5.75% maximum sales charge for class A shares and 3.50% for class M shares.
Contingent deferred sales charge (CDSC) is generally a charge applied at the time of the redemption of class B or C shares and assumes redemption at the end of the period. Your fund’s class B CDSC declines over time from a 5% maximum during the first year to 1% during the sixth year. After the sixth year, the CDSC no longer applies. The CDSC for class C shares is 1% for one year after purchase.
Share classes
Class A shares are generally subject to an initial sales charge and no CDSC (except on certain redemptions of shares bought without an initial sales charge).
Class B shares are not subject to an initial sales charge and may be subject to a CDSC.
Class C shares are not subject to an initial sales charge and are subject to a CDSC only if the shares are redeemed during the first year.
Class M shares have a lower initial sales charge and a higher 12b-1 fee than class A shares and no CDSC (except on certain redemptions of shares bought without an initial sales charge).
Class R shares are not subject to an initial sales charge or CDSC and are available only to certain employer-sponsored retirement plans.
Class R5 and R6 shares are not subject to an initial sales charge or CDSC, and carry no 12b-1 fee. They are only available to employer-sponsored retirement plans.
Class Y shares are not subject to an initial sales charge or CDSC, and carry no 12b-1 fee. They are generally only available to corporate and institutional clients and clients in other approved programs.
Comparative indexes
Barclays U.S. Aggregate Bond Index is an unmanaged index of U.S. investment-grade fixed-income securities.
BofA Merrill Lynch U.S. 3-Month Treasury Bill Index is an unmanaged index that seeks to measure the performance of U.S. Treasury bills available in the marketplace.
Russell 1000 Growth Index is an unmanaged index of those companies in the large-cap Russell 1000 Index chosen for their growth orientation.
S&P 500 Index is an unmanaged index of common stock performance.
Indexes assume reinvestment of all distributions and do not account for fees. Securities and performance of a fund and an index will differ. You cannot invest directly in an index.
Lipper is a third-party industry-ranking entity that ranks mutual funds. Its rankings do not reflect sales charges. Lipper rankings are based on total return at net asset value relative to other funds that have similar current investment styles or objectives as determined by Lipper. Lipper may change a fund’s category assignment at its discretion. Lipper category averages reflect performance trends for funds within a category.
14 Voyager Fund
Other information for shareholders
Important notice regarding delivery of shareholder documents
In accordance with Securities and Exchange Commission (SEC) regulations, Putnam sends a single copy of annual and semiannual shareholder reports, prospectuses, and proxy statements to Putnam shareholders who share the same address, unless a shareholder requests otherwise. If you prefer to receive your own copy of these documents, please call Putnam at 1-800-225-1581, and Putnam will begin sending individual copies within 30 days.
Proxy voting
Putnam is committed to managing our mutual funds in the best interests of our shareholders. The Putnam funds’ proxy voting guidelines and procedures, as well as information regarding how your fund voted proxies relating to portfolio securities during the 12-month period ended June 30, 2014, are available in the Individual Investors section of putnam.com, and on the SEC’s website, www.sec.gov. If you have questions about finding forms on the SEC’s website, you may call the SEC at 1-800-SEC-0330. You may also obtain the Putnam funds’ proxy voting guidelines and procedures at no charge by calling Putnam’s Shareholder Services at 1-800-225-1581.
Fund portfolio holdings
The fund will file a complete schedule of its portfolio holdings with the SEC for the first and third quarters of each fiscal year on Form N-Q. Shareholders may obtain the fund’s Form N-Q on the SEC’s website at www.sec.gov. In addition, the fund’s Form N-Q may be reviewed and copied at the SEC’s Public Reference Room in Washington, D.C. You may call the SEC at 1-800-SEC-0330 for information about the SEC’s website or the operation of the Public Reference Room.
Trustee and employee fund ownership
Putnam employees and members of the Board of Trustees place their faith, confidence, and, most importantly, investment dollars in Putnam mutual funds. As of January 31, 2015, Putnam employees had approximately $470,000,000 and the Trustees had approximately $138,000,000 invested in Putnam mutual funds. These amounts include investments by the Trustees’ and employees’ immediate family members as well as investments through retirement and deferred compensation plans.
Voyager Fund 15
Financial statements
A guide to financial statements
These sections of the report, as well as the accompanying Notes, constitute the fund’s financial statements.
The fund’s portfolio lists all the fund’s investments and their values as of the last day of the reporting period. Holdings are organized by asset type and industry sector, country, or state to show areas of concentration and diversification.
Statement of assets and liabilities shows how the fund’s net assets and share price are determined. All investment and non-investment assets are added together. Any unpaid expenses and other liabilities are subtracted from this total. The result is divided by the number of shares to determine the net asset value per share, which is calculated separately for each class of shares. (For funds with preferred shares, the amount subtracted from total assets includes the liquidation preference of preferred shares.)
Statement of operations shows the fund’s net investment gain or loss. This is done by first adding up all the fund’s earnings — from dividends and interest income — and subtracting its operating expenses to determine net investment income (or loss). Then, any net gain or loss the fund realized on the sales of its holdings — as well as any unrealized gains or losses over the period — is added to or subtracted from the net investment result to determine the fund’s net gain or loss for the fiscal period.
Statement of changes in net assets shows how the fund’s net assets were affected by the fund’s net investment gain or loss, by distributions to shareholders, and by changes in the number of the fund’s shares. It lists distributions and their sources (net investment income or realized capital gains) over the current reporting period and the most recent fiscal year-end. The distributions listed here may not match the sources listed in the Statement of operations because the distributions are determined on a tax basis and may be paid in a different period from the one in which they were earned. Dividend sources are estimated at the time of declaration. Actual results may vary. Any non-taxable return of capital cannot be determined until final tax calculations are completed after the end of the fund’s fiscal year.
Financial highlights provide an overview of the fund’s investment results, per-share distributions, expense ratios, net investment income ratios, and portfolio turnover in one summary table, reflecting the five most recent reporting periods. In a semiannual report, the highlights table also includes the current reporting period.
16 Voyager Fund
The fund’s portfolio 1/31/15 (Unaudited)
COMMON STOCKS (90.9%)*
Shares
Value
Aerospace and defense (2.6%)
Airbus Group NV (France)
511,544
$27,239,885
Honeywell International, Inc.
262,400
25,652,224
Northrop Grumman Corp.
141,200
22,161,340
Raytheon Co.
75,013
7,505,051
United Technologies Corp.
227,200
26,078,016
108,636,516
Airlines (2.0%)
American Airlines Group, Inc.
1,106,900
54,326,652
Delta Air Lines, Inc.
502,710
23,783,210
Spirit Airlines, Inc. †
88,400
6,553,976
84,663,838
Automobiles (1.6%)
Fiat Chrysler Automobiles NV (United Kingdom) † S
1,744,976
23,051,133
Tesla Motors, Inc. † S
119,400
24,309,840
Yamaha Motor Co., Ltd. (Japan)
849,300
18,645,826
66,006,799
Banks (1.2%)
Bank of Ireland (Ireland) †
12,708,416
3,841,579
Citigroup, Inc.
665,100
31,226,445
ING Groep NV GDR (Netherlands) †
824,214
10,254,105
UniCredit SpA (Italy)
582,150
3,427,668
48,749,797
Biotechnology (7.8%)
Aegerion Pharmaceuticals, Inc. † S
504,711
11,719,389
AMAG Pharmaceuticals, Inc. †
321,900
14,224,761
ARIAD Pharmaceuticals, Inc. † S
2,132,568
13,755,064
Biogen Idec, Inc. †
161,700
62,927,172
Celgene Corp. †
697,400
83,102,184
Dynavax Technologies Corp. † S
631,090
10,791,639
Gilead Sciences, Inc. †
1,190,100
124,758,183
321,278,392
Building products (0.2%)
Assa Abloy AB Class B (Sweden)
128,455
7,009,759
7,009,759
Capital markets (2.2%)
Blackstone Group LP (The)
93,376
3,486,660
Carlyle Group LP (The)
170,027
4,471,710
Charles Schwab Corp. (The)
1,003,600
26,073,528
E*Trade Financial Corp. †
453,815
10,460,436
KKR & Co. LP
1,872,600
44,961,126
89,453,460
Chemicals (1.7%)
Dow Chemical Co. (The)
370,100
16,713,716
LyondellBasell Industries NV Class A
53,400
4,223,406
Monsanto Co.
349,700
41,257,606
Sherwin-Williams Co. (The)
30,900
8,382,243
70,576,971
Commercial services and supplies (0.5%)
Tyco International PLC
487,200
19,882,632
19,882,632
Voyager Fund 17
COMMON STOCKS (90.9%)* cont.
Shares
Value
Communications equipment (0.5%)
Alcatel-Lucent ADR (France) † S
2,470,200
$8,522,190
QUALCOMM, Inc.
184,109
11,499,448
20,021,638
Consumer finance (0.9%)
American Express Co.
218,700
17,646,903
Discover Financial Services
338,200
18,391,316
36,038,219
Diversified consumer services (0.4%)
ITT Educational Services, Inc. † Ω S
1,995,959
14,510,622
Weight Watchers International, Inc. † S
151,295
2,505,445
17,016,067
Diversified telecommunication services (0.2%)
Telecom Italia SpA RSP (Italy)
9,025,102
8,535,581
8,535,581
Electric utilities (0.4%)
Exelon Corp.
441,500
15,911,660
15,911,660
Electrical equipment (0.5%)
Eaton Corp PLC
322,271
20,332,077
20,332,077
Electronic equipment, instruments, and components (0.2%)
Anixter International, Inc. †
104,185
7,851,382
7,851,382
Energy equipment and services (2.5%)
Baker Hughes, Inc.
589,700
34,196,703
Ezion Holdings, Ltd. (Singapore)
11,677,000
11,044,407
Halliburton Co.
1,298,652
51,933,093
Transocean, Ltd. (Switzerland) S
346,600
5,649,580
102,823,783
Food products (0.1%)
Keurig Green Mountain, Inc.
49,000
6,005,440
6,005,440
Health-care equipment and supplies (1.3%)
Becton Dickinson and Co.
116,800
16,127,744
Boston Scientific Corp. †
2,115,700
31,333,517
Medtronic PLC
112,600
8,039,640
55,500,901
Health-care technology (0.2%)
Castlight Health, Inc. Class B † S
822,440
7,303,267
7,303,267
Hotels, restaurants, and leisure (3.1%)
Hilton Worldwide Holdings, Inc. †
174,400
4,529,168
Las Vegas Sands Corp.
337,900
18,371,623
Melco Crown Entertainment, Ltd. ADR (Hong Kong)
960,300
23,047,200
Restaurant Brands International LP (Units) (Canada) † S
Global Fashion Holding SA (acquired 8/2/13, cost $9,259,308) (Private) (Brazil) † ΔΔ F
218,573
5,130,886
New Bigfoot Other Assets GmbH (acquired 8/2/13, cost $186) (Private) (Brazil) † ΔΔ F
140
119
New Middle East Other Assets GmbH (acquired 8/2/13, cost $76) (Private) (Brazil) † ΔΔ F
57
48
Priceline Group, Inc. (The) †
66,997
67,632,132
Zalando SE (acquired 9/30/13, cost $15,738,412) (Germany) † ΔΔ F
656,370
16,020,674
144,673,079
Internet software and services (12.5%)
Alibaba Group Holding, Ltd. ADR (China) †
649,443
57,852,382
AOL, Inc. †
447,000
19,332,750
Baidu, Inc. ADR (China) †
74,400
16,213,248
Facebook, Inc. Class A †
1,942,881
147,484,097
Google, Inc. Class A †
456,694
245,495,860
Monster Worldwide, Inc. †
3,223,191
13,311,779
Twitter, Inc. †
327,000
12,272,310
Yahoo!, Inc. †
127,100
5,591,129
517,553,555
IT Services (2.7%)
MasterCard, Inc. Class A
170,300
13,969,709
Unisys Corp. †
146,414
3,210,859
Visa, Inc. Class A
371,200
94,622,592
111,803,160
Life sciences tools and services (0.4%)
Agilent Technologies, Inc.
310,300
11,720,031
Thermo Fisher Scientific, Inc.
43,400
5,434,114
17,154,145
Media (2.3%)
Atresmedia Corporacion de Medios de Comunicacion SA (Spain)
449,287
6,600,560
Comcast Corp. Class A
623,035
33,111,195
Liberty Global PLC Ser. A (United Kingdom) †
587,251
27,436,367
Time Warner, Inc.
158,855
12,379,570
Walt Disney Co. (The)
189,200
17,209,632
96,737,324
Metals and mining (0.1%)
Hi-Crush Partners LP (Units)
85,476
2,789,082
2,789,082
Voyager Fund 19
COMMON STOCKS (90.9%)* cont.
Shares
Value
Multiline retail (0.2%)
Macy’s, Inc.
100,000
$6,388,000
6,388,000
Oil, gas, and consumable fuels (3.5%)
Anadarko Petroleum Corp.
208,700
17,061,225
Devon Energy Corp.
202,200
12,186,594
EOG Resources, Inc.
475,500
42,333,765
EP Energy Corp. Class A † S
1,199,892
12,418,882
Genel Energy PLC (United Kingdom) †
826,847
7,790,588
Gulfport Energy Corp. †
571,400
21,993,186
MarkWest Energy Partners LP
140,400
8,273,772
Scorpio Tankers, Inc.
1,445,200
11,373,724
Whiting Petroleum Corp. †
371,500
11,152,430
144,584,166
Personal products (0.8%)
Avon Products, Inc.
532,400
4,120,776
Coty, Inc. Class A †
1,473,653
28,028,880
32,149,656
Pharmaceuticals (7.8%)
AbbVie, Inc.
524,100
31,629,435
Actavis PLC †
149,685
39,897,040
Allergan, Inc.
374,600
82,134,796
Bristol-Myers Squibb Co.
132,700
7,997,829
Endo International PLC †
336,700
26,804,687
Jazz Pharmaceuticals PLC †
535,501
90,681,739
Mylan, Inc. †
91,800
4,879,170
Perrigo Co. PLC
134,900
20,469,726
Teva Pharmaceutical Industries, Ltd. ADR (Israel)
285,200
16,216,472
320,710,894
Real estate investment trusts (REITs) (0.4%)
Hibernia REIT PLC (Ireland) R
12,740,879
16,029,917
16,029,917
Real estate management and development (0.3%)
RE/MAX Holdings, Inc. Class A
391,677
13,035,011
13,035,011
Road and rail (0.9%)
Genesee & Wyoming, Inc. Class A †
130,986
10,799,796
Union Pacific Corp.
213,700
25,047,777
35,847,573
Semiconductors and semiconductor equipment (4.2%)
Applied Materials, Inc.
706,800
16,143,312
Avago Technologies, Ltd.
245,100
25,215,888
Broadcom Corp. Class A
656,900
27,875,552
Canadian Solar, Inc. (Canada) † S
112,900
2,302,031
Intel Corp.
158,700
5,243,448
Micron Technology, Inc. †
2,987,654
87,433,694
SunEdison, Inc. †
438,900
8,220,597
172,434,522
Software (3.0%)
Longtop Financial Technologies, Ltd. ADR (Hong Kong) † F
478,830
—
Microsoft Corp.
1,031,400
41,668,560
Oracle Corp.
715,689
29,980,212
Salesforce.com, Inc. †
291,400
16,449,530
20 Voyager Fund
COMMON STOCKS (90.9%)* cont.
Shares
Value
Software cont.
TiVo, Inc. †
2,475,300
$25,891,638
Zynga, Inc. Class A †
3,774,537
9,662,815
123,652,755
Specialty retail (2.9%)
Home Depot, Inc. (The)
428,500
44,743,970
Lowe’s Cos., Inc.
182,200
12,345,872
Office Depot, Inc. † S
7,972,771
60,593,060
117,682,902
Technology hardware, storage, and peripherals (6.4%)
Apple, Inc.
1,821,147
213,365,583
Casetek Holdings, Ltd. (Taiwan)
1,831,000
10,387,770
EMC Corp.
722,800
18,742,204
Samsung Electronics Co., Ltd. (South Korea)
6,517
8,134,332
Western Digital Corp.
132,480
12,881,030
263,510,919
Textiles, apparel, and luxury goods (0.4%)
Michael Kors Holdings, Ltd. †
235,000
16,635,650
16,635,650
Tobacco (0.2%)
Japan Tobacco, Inc. (Japan)
298,700
8,115,724
8,115,724
Wireless telecommunication services (1.8%)
SoftBank Corp. (Japan)
671,000
39,356,304
Vodafone Group PLC ADR (United Kingdom)
1,044,200
36,682,742
76,039,046
Total common stocks (cost $3,376,455,822)
$3,753,578,008
PURCHASED OPTIONS OUTSTANDING (1.7%)*
Expiration date/strike price
Contract amount
Value
Activision Blizzard, Inc. (Call)
Feb-15/$15.00
$1,306,098
$7,706,553
DISH Network Corp. (Call)
Feb-15/55.00
632,020
9,864,492
Genworth Financial, Inc. (Call)
Feb-15/9.00
4,639,064
319,353
Genworth Financial, Inc. (Call)
Feb-15/10.00
5,023,124
208,610
Genworth Financial, Inc. (Call)
Feb-15/9.00
1,293,000
89,010
Genworth Financial, Inc. (Call)
Feb-15/11.00
3,595,764
53,936
Groupon, Inc. (Call)
Feb-15/6.00
2,910,224
4,075,216
Huntsman Corp. (Call)
Feb-15/16.00
961,787
5,817,965
Huntsman Corp. (Call)
Feb-15/16.00
691,075
4,181,695
L-3 Communications Holdings, Inc. (Call)
Feb-15/105.00
231,549
4,207,697
Lam Research Corp. (Call)
Mar-15/60.00
273,057
4,528,596
Pandora Media, Inc. (Call)
Feb-15/12.00
2,275,559
10,730,590
Qihoo 360 Technology Co., Ltd. (Call)
Mar-15/45.00
397,243
5,760,024
Salix Pharmaceuticals, Ltd. (Call)
Feb-15/95.00
82,743
3,285,413
SPDR S&P 500 ETF Trust (Call)
Feb-15/212.00
2,586,001
192,373
SPDR S&P 500 ETF Trust (Call)
Feb-15/214.00
3,447,902
155,949
SPDR S&P 500 ETF Trust (Call)
Feb-15/214.00
1,477,570
66,830
Wynn Resorts, Ltd. (Call)
Feb-15/110.00
199,202
7,594,576
Total purchased options outstanding (cost $72,144,151)
$68,838,878
Voyager Fund 21
INVESTMENT COMPANIES (1.2%)*
Shares
Value
iShares Dow Jones U.S. Home Construction Index Fund
266,700
$6,758,178
Market Vectors Junior Gold Miners ETF
552,000
15,312,480
SPDR S&P Regional Banking ETF S
715,500
26,366,175
Total investment companies (cost $48,255,351)
$48,436,833
U.S. TREASURY OBLIGATIONS (0.7%)*
Principal amount
Value
U.S. Treasury Inflation Protected Securities 2 1/8s, February 15, 2041 i
$11,438,816
$16,143,422
U.S. Treasury Notes
1s, May 31, 2018 i
7,173,000
7,209,342
2 1/8s, June 30, 2021 i
5,163,000
5,388,912
7/8s, January 31, 2017 i
727,000
732,817
Total U.S. Treasury obligations (cost $29,474,493)
$29,474,493
WARRANTS (0.5%)* †
Expiration date
Strike price
Warrants
Value
JPMorgan Chase & Co. W
10/28/18
$42.42
45,309
$687,791
Wells Fargo & Co. W
10/28/18
34.01
1,018,855
18,848,818
Total warrants (cost $9,589,754)
$19,536,609
SHORT-TERM INVESTMENTS (9.6%)*
Principal amount/shares
Value
Putnam Cash Collateral Pool, LLC 0.19% d
Shares 139,079,945
$139,079,945
Putnam Short Term Investment Fund 0.10% L
Shares 219,198,209
219,198,209
SSgA Prime Money Market Fund Class N 0.01% P
Shares 35,729,000
35,729,000
U.S. Treasury Bills with an effective yield of 0.03%, April 9, 2015
$340,000
339,997
Total short-term investments (cost $394,347,137)
$394,347,151
TOTAL INVESTMENTS
Total investments (cost $3,930,266,708)
$4,314,211,972
Key to holding’s abbreviations
ADR
American Depository Receipts: represents ownership of foreign securities on deposit with a custodian bank
bp
Basis points
ETF
Exchange Traded Fund
GDR
Global Depository Receipts: represents ownership of foreign securities on deposit with a custodian bank
SPDR
S&P Depository Receipts
Notes to the fund’s portfolio
Unless noted otherwise, the notes to the fund’s portfolio are for the close of the fund’s reporting period, which ran from August 1, 2014 through January 31, 2015 (the reporting period). Within the following notes to the portfolio, references to “ASC 820” represent Accounting Standards Codification 820 Fair Value Measurements and Disclosures and references to “OTC”, if any, represent over-the-counter.
*
Percentages indicated are based on net assets of $4,128,062,181.
†
This security is non-income-producing.
ΔΔ
This security is restricted with regard to public resale. The total fair value of this security and any other restricted securities (excluding 144A securities), if any, held at the close of the reporting period was $21,151,846, or 0.5% of net assets.
Ω
Affiliated company (Note 5).
22 Voyager Fund
d
Affiliated company. See Note 1 to the financial statements regarding securities lending. The rate quoted in the security description is the annualized 7-day yield of the fund at the close of the reporting period.
F
This security is valued at fair value following procedures approved by the Trustees. Securities may be classified as Level 2 or Level 3 for ASC 820 based on the securities’ valuation inputs. At the close of the reporting period, fair value pricing was also used for certain foreign securities in the portfolio (Note 1).
i
This security was pledged, or purchased with cash that was pledged, to the fund for collateral on certain derivative contracts (Note 1).
L
Affiliated company (Note 5). The rate quoted in the security description is the annualized 7-day yield of the fund at the close of the reporting period.
P
This security was pledged, or purchased with cash that was pledged, to the fund for collateral on certain derivative contracts. The rate quoted in the security description is the annualized 7-day yield of the fund at the close of the reporting period (Note 1).
R
Real Estate Investment Trust.
S
Security on loan, in part or in entirety, at the close of the reporting period (Note 1).
W
Warrants issued to the U.S. Treasury under the Troubled Asset Relief Program (TARP).
At the close of the reporting period, the fund maintained liquid assets totaling $3,821,657 to cover certain derivative contracts and the settlement of certain securities.
Debt obligations are considered secured unless otherwise indicated.
The dates shown on debt obligations are the original maturity dates.
FORWARD CURRENCY CONTRACTS at 1/31/15 (aggregate face value $264,837,425) (Unaudited)
Counterparty
Currency
Contract type
Delivery date
Value
Aggregate face value
Unrealized appreciation/ (depreciation)
Credit Suisse International
British Pound
Sell
3/18/15
$32,778,434
$34,697,894
$1,919,460
Euro
Sell
3/18/15
58,252,515
69,005,363
10,752,848
Japanese Yen
Sell
2/13/15
94,838,417
97,915,549
3,077,132
UBS AG
British Pound
Sell
3/18/15
59,990,801
63,218,619
3,227,818
Total
$18,977,258
WRITTEN OPTIONS OUTSTANDING at 1/31/15 (premiums $928,359) (Unaudited)
Expiration date/strike price
Contract amount
Value
Genworth Financial, Inc. (Call)
Feb-15/$10.00
$4,639,064
$192,659
Genworth Financial, Inc. (Call)
Feb-15/12.00
3,595,764
171,317
Genworth Financial, Inc. (Call)
Feb-15/11.00
5,023,124
75,347
Genworth Financial, Inc. (Call)
Feb-15/10.00
1,293,000
53,698
SPDR S&P 500 ETF Trust (Call)
Feb-15/214.00
2,586,001
116,965
SPDR S&P 500 ETF Trust (Call)
Feb-15/216.00
3,447,902
110,885
SPDR S&P 500 ETF Trust (Call)
Feb-15/216.00
1,477,570
47,519
Total
$768,390
Voyager Fund 23
OTC TOTAL RETURN SWAP CONTRACTS OUTSTANDING at 1/31/15 (Unaudited)
Swap counterparty/ Notional amount
Upfront premium received (paid)
Termination date
Payments received (paid) by fund per annum
Total return received by or paid by fund
Unrealized appreciation/ (depreciation)
Deutsche Bank AG
baskets
607,185
$—
7/28/15
(3 month USD-LIBOR-BBA plus 32 bp)
A basket (DBPTMATR) of common stocks
$(909,732)
Goldman Sachs International
baskets
32,036
—
12/7/15
(1 month USD-LIBOR-BBA minus 225 bp)
A basket (GSCBMSX4) of common stocks
(167,390)
baskets
63,227
—
12/7/15
(1 month USD-LIBOR-BBA minus 225 bp)
A basket (GSCBMSX4) of common stocks
(297,483)
baskets
30,307
—
12/7/15
(1 month USD-LIBOR-BBA minus 225 bp)
A basket (GSCBMSX4) of common stocks
(158,356)
baskets
32,471
—
12/7/15
(1 month USD-LIBOR-BBA minus 225 bp)
A basket (GSCBMSX4) of common stocks
(169,663)
baskets
31,878
—
12/7/15
(1 month USD-LIBOR-BBA minus 225 bp)
A basket (GSCBMSX4) of common stocks
(166,565)
baskets
31,570
—
12/7/15
(1 month USD-LIBOR-BBA minus 225 bp)
A basket (GSCBMSX4) of common stocks
(164,955)
JPMorgan Chase Bank N.A.
baskets
129,810
—
7/16/15
(3 month USD-LIBOR-BBA plus 30 bp)
A basket (JPCMPTMD) of common stocks
(30,025)
Total
$—
$(2,064,169)
24 Voyager Fund
ASC 820 establishes a three-level hierarchy for disclosure of fair value measurements. The valuation hierarchy is based upon the transparency of inputs to the valuation of the fund’s investments. The three levels are defined as follows:
Level 1: Valuations based on quoted prices for identical securities in active markets.
Level 2: Valuations based on quoted prices in markets that are not active or for which all significant inputs are observable, either directly or indirectly.
Level 3: Valuations based on inputs that are unobservable and significant to the fair value measurement.
The following is a summary of the inputs used to value the fund’s net assets as of the close of the reporting period:
Valuation inputs
Investments in securities:
Level 1
Level 2
Level 3
Common stocks*:
Consumer discretionary
$550,085,606
$114,770,303
$21,151,846
Consumer staples
38,155,096
8,115,724
—
Energy
228,572,954
18,834,995
—
Financials
291,480,957
33,553,269
—
Health care
721,947,599
—
—
Industrials
242,122,751
94,106,637
—
Information technology
1,198,305,829
18,522,102
—**
Materials
73,366,053
—
—
Telecommunication services
36,682,742
47,891,885
—
Utilities
15,911,660
—
—
Total common stocks
3,396,631,247
335,794,915
21,151,846
Investment companies
48,436,833
—
—
Purchased options outstanding
—
68,838,878
—
U.S. Treasury obligations
—
29,474,493
—
Warrants
19,536,609
—
—
Short-term investments
254,927,209
139,419,942
—
Totals by level
$3,719,531,898
$573,528,228
$21,151,846
Valuation inputs
Other financial instruments:
Level 1
Level 2
Level 3
Forward currency contracts
$—
$18,977,258
$—
Written options outstanding
—
(768,390)
—
Total return swap contracts
—
(2,064,169)
—
Totals by level
$—
$16,144,699
$—
* Common stock classifications are presented at the sector level, which may differ from the fund’s portfolio presentation.
** Value of level 3 security is $—.
During the reporting period, transfers within the fair value hierarchy, if any, (other than certain transfers involving non-U.S. equity securities as described in Note 1) did not represent, in the aggregate, more than 1% of the fund’s net assets measured as of the end of the period.
At the start and close of the reporting period, Level 3 investments in securities represented less than 1% of the fund’s net assets and were not considered a significant portion of the fund’s portfolio.
The accompanying notes are an integral part of these financial statements.
Voyager Fund 25
Statement of assets and liabilities 1/31/15 (Unaudited)
ASSETS
Investment in securities, at value, including $128,853,098 of securities on loan (Note 1):
Affiliated issuers (identified cost $414,425,924) (Notes 1 and 5)
372,788,776
Cash
5,228,826
Foreign currency (cost $1,818,165) (Note 1)
1,818,940
Dividends, interest and other receivables
2,430,770
Foreign tax reclaim
163,311
Receivable for shares of the fund sold
1,165,320
Receivable for investments sold
94,357,131
Unrealized appreciation on forward currency contracts (Note 1)
18,977,258
Prepaid assets
63,832
Total assets
4,438,417,360
LIABILITIES
Payable for investments purchased
88,063,184
Payable for shares of the fund repurchased
9,181,961
Payable for compensation of Manager (Note 2)
1,855,143
Payable for custodian fees (Note 2)
36,768
Payable for investor servicing fees (Note 2)
1,124,131
Payable for Trustee compensation and expenses (Note 2)
1,494,098
Payable for administrative services (Note 2)
35,709
Payable for distribution fees (Note 2)
979,593
Unrealized depreciation on OTC swap contracts (Note 1)
2,064,169
Written options outstanding, at value (premiums $928,359) (Notes 1 and 3)
768,390
Collateral on securities loaned, at value (Note 1)
139,079,945
Collateral on certain derivative contracts, at value (Note 1)
65,203,493
Other accrued expenses
468,595
Total liabilities
310,355,179
Net assets
$4,128,062,181
REPRESENTED BY
Paid-in capital (Unlimited shares authorized) (Notes 1 and 4)
$3,718,765,856
Distributions in excess of net investment income (Note 1)
(1,879,911)
Accumulated net realized gain on investments and foreign currency transactions (Note 1)
10,154,608
Net unrealized appreciation of investments and assets and liabilities in foreign currencies
401,021,628
Total — Representing net assets applicable to capital shares outstanding
$4,128,062,181
(Continued on next page)
The accompanying notes are an integral part of these financial statements.
26 Voyager Fund
Statement of assets and liabilities (Continued)
COMPUTATION OF NET ASSET VALUE AND OFFERING PRICE
Net asset value and redemption price per class A share ($3,398,619,220 divided by 115,180,784 shares)
$29.51
Offering price per class A share (100/94.25 of $29.51)*
$31.31
Net asset value and offering price per class B share ($99,353,773 divided by 4,134,492 shares)**
$24.03
Net asset value and offering price per class C share ($160,109,693 divided by 5,961,361 shares)**
$26.86
Net asset value and redemption price per class M share ($27,864,401 divided by 1,042,197 shares)
$26.74
Offering price per class M share (100/96.50 of $26.74)*
$27.71
Net asset value, offering price and redemption price per class R share ($16,493,110 divided by 570,851 shares)
$28.89
Net asset value, offering price and redemption price per class R5 share ($2,201,886 divided by 70,774 shares)
$31.11
Net asset value, offering price and redemption price per class R6 share ($36,616,920 divided by 1,176,457 shares)
$31.12
Net asset value, offering price and redemption price per class Y share ($386,803,178 divided by 12,465,926 shares)
$31.03
*
On single retail sales of less than $50,000. On sales of $50,000 or more the offering price is reduced.
**
Redemption price per share is equal to net asset value less any applicable contingent deferred sales charge.
The accompanying notes are an integral part of these financial statements.
Voyager Fund 27
Statement of operations Six months ended 1/31/15 (Unaudited)
INVESTMENT INCOME
Dividends (net of foreign tax of $333,125)
$20,288,052
Interest (including interest income of $37,669 from investments in affiliated issuers) (Note 5)
69,951
Securities lending (Note 1)
1,291,995
Total investment income
21,649,998
EXPENSES
Compensation of Manager (Note 2)
11,798,806
Investor servicing fees (Note 2)
4,212,379
Custodian fees (Note 2)
92,096
Trustee compensation and expenses (Note 2)
25,901
Distribution fees (Note 2)
5,916,668
Administrative services (Note 2)
63,705
Other
631,314
Total expenses
22,740,869
Expense reduction (Note 2)
(295,615)
Net expenses
22,445,254
Net investment loss
(795,256)
Net realized loss on investments (including realized loss of $1,714,792 on sales of investments in affiliated issuers) (Notes 1, 3 and 5)
(24,273,353)
Net realized loss on swap contracts (Note 1)
(13,748,149)
Net realized gain on foreign currency transactions (Note 1)
31,110,872
Net realized gain on written options (Notes 1 and 3)
36,758,836
Net unrealized appreciation of assets and liabilities in foreign currencies during the period
16,194,859
Net unrealized appreciation of investments, swap contracts and written options during the period
105,954,138
Net gain on investments
151,997,203
Net increase in net assets resulting from operations
$151,201,947
The accompanying notes are an integral part of these financial statements.
28 Voyager Fund
Statement of changes in net assets
INCREASE (DECREASE) IN NET ASSETS
Six months ended 1/31/15*
Year ended 7/31/14
Operations:
Net investment income (loss)
$(795,256)
$28,875,047
Net realized gain on investments and foreign currency transactions
29,848,206
794,134,683
Net unrealized appreciation (depreciation) of investments and assets and liabilities in foreign currencies
122,148,997
(21,485,371)
Net increase in net assets resulting from operations
151,201,947
801,524,359
Distributions to shareholders (Note 1):
From ordinary income
Net investment income
Class A
(14,111,564)
(30,753,419)
Class B
—
(495,285)
Class C
—
(467,255)
Class M
—
(151,826)
Class R
(21,808)
(117,416)
Class R5
(138)
(171)
Class R6
(290,011)
(432,629)
Class Y
(2,529,852)
(3,478,480)
Net realized short-term gain on investments
Class A
(180,585,425)
—
Class B
(6,372,525)
—
Class C
(9,247,244)
—
Class M
(1,609,327)
—
Class R
(903,466)
—
Class R5
(974)
—
Class R6
(1,841,676)
—
Class Y
(19,564,188)
—
From net realized long-term gain on investments
Class A
(238,497,302)
—
Class B
(8,416,128)
—
Class C
(12,212,740)
—
Class M
(2,125,422)
—
Class R
(1,193,199)
—
Class R5
(1,286)
—
Class R6
(2,432,282)
—
Class Y
(25,838,221)
—
Increase (decrease) from capital share transactions (Note 4)
316,903,489
(336,099,580)
Total increase (decrease) in net assets
(59,689,342)
429,528,298
NET ASSETS
Beginning of period
4,187,751,523
3,758,223,225
End of period (including distributions in excess of net investment income of $1,879,911 and undistributed net investment income of $15,868,718, respectively)
$4,128,062,181
$4,187,751,523
*
Unaudited.
The accompanying notes are an integral part of these financial statements.
Voyager Fund 29
Financial highlights (For a common share outstanding throughout the period)
INVESTMENT OPERATIONS:
LESS DISTRIBUTIONS:
RATIOS AND SUPPLEMENTAL DATA:
Period ended
Net asset value, beginning of period
Net investment income (loss)a
Net realized and unrealized gain (loss) on investments
Total from investment operations
From net investment income
From net realized gain on investments
Total distributions
Redemption fees
Non-recurring reimbursements
Net asset value, end of period
Total return at net asset value (%)b
Net assets, end of period (in thousands)
Ratio of expenses to average net assets (%)c
Ratio of net investment income (loss) to average net assets (%)
Portfolio turnover (%)
Class A
January 31, 2015**
$32.36
—e
1.33
1.33
(.14)
(4.04)
(4.18)
—
—
$29.51
3.63*
$3,398,619
.52*
(.01)*
66*
July 31, 2014
26.76
.22
5.65
5.87
(.27)
—
(.27)
—
—
32.36
22.01
3,489,890
.97
.73
146
July 31, 2013
20.61
.19
6.22
6.41
(.26)
—
(.26)
—
—
26.76
31.40
3,142,831
1.00
.84
130
July 31, 2012
22.80
.07
(2.26)
(2.19)
—
—
—
—
—e,h
20.61
(9.61)
2,874,779
1.07
.35
140
July 31, 2011
20.12
.01
2.74
2.75
(.08)
—
(.08)
—e
.01g
22.80
13.73
3,692,512
1.17
.05
176
July 31, 2010
16.85
—e
3.46
3.46
(.19)
—
(.19)
—e
—e,f
20.12
20.58
3,111,020
1.26
(.03)
177
Class B
January 31, 2015**
$27.05
(.10)
1.12
1.02
—
(4.04)
(4.04)
—
—
$24.03
3.21*
$99,354
.90*
(.38)*
66*
July 31, 2014
22.43
—e
4.73
4.73
(.11)
—
(.11)
—
—
27.05
21.13
104,736
1.72
(.01)
146
July 31, 2013
17.31
.02
5.22
5.24
(.12)
—
(.12)
—
—
22.43
30.40
104,780
1.75
.10
130
July 31, 2012
19.29
(.07)
(1.91)
(1.98)
—
—
—
—
—e,h
17.31
(10.26)
105,363
1.82
(.40)
140
July 31, 2011
17.09
(.14)
2.33
2.19
—
—
—
—e
.01g
19.29
12.87
157,197
1.92
(.70)
176
July 31, 2010
14.35
(.13)
2.94
2.81
(.07)
—
(.07)
—e
—e,f
17.09
19.64
182,569
2.01
(.77)
177
Class C
January 31, 2015**
$29.79
(.11)
1.22
1.11
—
(4.04)
(4.04)
—
—
$26.86
3.22*
$160,110
.90*
(.38)*
66*
July 31, 2014
24.67
(.01)
5.21
5.20
(.08)
—
(.08)
—
—
29.79
21.12
162,611
1.72
(.03)
146
July 31, 2013
18.98
.03
5.73
5.76
(.07)
—
(.07)
—
—
24.67
30.42
141,971
1.75
.12
130
July 31, 2012
21.15
(.08)
(2.09)
(2.17)
—
—
—
—
—e,h
18.98
(10.26)
166,329
1.82
(.40)
140
July 31, 2011
18.74
(.15)
2.55
2.40
—
—
—
—e
.01g
21.15
12.86
247,712
1.92
(.71)
176
July 31, 2010
15.76
(.15)
3.24
3.09
(.11)
—
(.11)
—e
—e,f
18.74
19.63
87,221
2.01
(.79)
177
Class M
January 31, 2015**
$29.63
(.08)
1.23
1.15
—
(4.04)
(4.04)
—
—
$26.74
3.37*
$27,864
.78*
(.26)*
66*
July 31, 2014
24.55
.06
5.18
5.24
(.16)
—
(.16)
—
—
29.63
21.37
28,099
1.47
.22
146
July 31, 2013
18.92
.07
5.72
5.79
(.16)
—
(.16)
—
—
24.55
30.77
24,935
1.50
.34
130
July 31, 2012
21.03
(.03)
(2.08)
(2.11)
—
—
—
—
—e,h
18.92
(10.03)
23,150
1.57
(.15)
140
July 31, 2011
18.59
(.10)
2.53
2.43
—
—
—
—e
.01g
21.03
13.13
29,618
1.67
(.45)
176
July 31, 2010
15.60
(.10)
3.21
3.11
(.12)
—
(.12)
—e
—e,f
18.59
19.94
28,857
1.76
(.53)
177
Class R
January 31, 2015**
$31.72
(.04)
1.29
1.25
(.04)
(4.04)
(4.08)
—
—
$28.89
3.47*
$16,493
.65*
(.13)*
66*
July 31, 2014
26.23
.14
5.54
5.68
(.19)
—
(.19)
—
—
31.72
21.70
18,033
1.22
.48
146
July 31, 2013
20.20
.14
6.09
6.23
(.20)
—
(.20)
—
—
26.23
31.08
17,812
1.25
.61
130
July 31, 2012
22.40
.02
(2.22)
(2.20)
—
—
—
—
—e,h
20.20
(9.82)
18,921
1.32
.09
140
July 31, 2011
19.80
(.05)
2.71
2.66
(.07)
—
(.07)
—e
.01g
22.40
13.46
22,351
1.42
(.20)
176
July 31, 2010
16.61
(.06)
3.41
3.35
(.16)
—
(.16)
—e
—e,f
19.80
20.23
5,573
1.51
(.29)
177
Class R5
January 31, 2015**
$33.96
(.01)
1.45
1.44
(.25)
(4.04)
(4.29)
—
—
$31.11
3.77*
$2,202
.37*
(.02)*
66*
July 31, 2014
28.07
.34
5.92
6.26
(.37)
—
(.37)
—
—
33.96
22.39
16
.65
1.04
146
July 31, 2013
21.54
.30
6.51
6.81
(.28)
—
(.28)
—
—
28.07
31.95
13
.63
1.19
130
July 31, 2012†
21.85
.01
(.32)
(.31)
—
—
—
—
—
21.54
(1.42)*
10
.05*
.03*
140
Class R6
January 31, 2015**
$33.99
.07
1.37
1.44
(.27)
(4.04)
(4.31)
—
—
$31.12
3.79*
$36,617
.32*
.19*
66*
July 31, 2014
28.09
.37
5.93
6.30
(.40)
—
(.40)
—
—
33.99
22.53
36,802
.55
1.15
146
July 31, 2013
21.54
.24d
6.60
6.84
(.29)
—
(.29)
—
—
28.09
32.10
31,033
.53
.89d
130
July 31, 2012†
21.85
.01
(.32)
(.31)
—
—
—
—
—
21.54
(1.42)*
10
.04*
.04*
140
See notes to financial highlights at the end of this section.
The accompanying notes are an integral part of these financial statements.
30
Voyager Fund
Voyager Fund
31
Financial highlights (Continued)
INVESTMENT OPERATIONS:
LESS DISTRIBUTIONS:
RATIOS AND SUPPLEMENTAL DATA:
Period ended
Net asset value, beginning of period
Net investment income (loss)a
Net realized and unrealized gain (loss) on investments
Total from investment operations
From net investment income
From net realized gain on investments
Total distributions
Redemption fees
Non-recurring reimbursements
Net asset value, end of period
Total return at net asset value (%)b
Net assets, end of period (in thousands)
Ratio of expenses to average net assets (%)c
Ratio of net investment income (loss) to average net assets (%)
Portfolio turnover (%)
Class Y
January 31, 2015**
$33.87
.04
1.39
1.43
(.23)
(4.04)
(4.27)
—
—
$31.03
3.75*
$386,803
.40*
.12*
66*
July 31, 2014
27.98
.31
5.91
6.22
(.33)
—
(.33)
—
—
33.87
22.33
347,565
.72
.98
146
July 31, 2013
21.54
.27
6.49
6.76
(.32)
—
(.32)
—
—
27.98
31.73
294,849
.75
1.12
130
July 31, 2012
23.77
.13
(2.36)
(2.23)
—
—
—
—
—e,h
21.54
(9.38)
325,603
.82
.59
140
July 31, 2011
20.97
.07
2.86
2.93
(.14)
—
(.14)
—e
.01g
23.77
13.99
569,805
.92
.29
176
July 31, 2010
17.54
.04
3.62
3.66
(.23)
—
(.23)
—e
—e,f
20.97
20.91
313,583
1.01
.21
177
* Not annualized.
** Unaudited.
† For the period July 3, 2012 (commencement of operations) to July 31, 2012.
a Per share net investment income (loss) has been determined on the basis of the weighted average number of shares outstanding during the period.
b Total return assumes dividend reinvestment and does not reflect the effect of sales charges.
c Includes amounts paid through expense offset and/or brokerage/service arrangements, if any (Note 2). Also excludes acquired fund fees and expenses, if any.
d The net investment income ratio and per share amount shown for the period ending July 31, 2013 may not correspond with the expected class specific differences for the period due to the timing of subscriptions into the class.
e Amount represents less than $0.01 per share.
f Reflects a non-recurring reimbursement pursuant to a settlement between the Securities and Exchange Commission (SEC) and Prudential Securities, Inc., which amounted to less than $0.01 per share outstanding as of March 30, 2010.
g Reflects a non-recurring reimbursement related to restitution amounts in connection with a distribution plan approved by the SEC which amounted to $0.01 per share outstanding on July 21, 2011. Also reflects a non-recurring reimbursement related to short-term trading related lawsuits, which amounted to less than $0.01 per share outstanding on May 11, 2011.
h Reflects a non-recurring reimbursement pursuant to a settlement between the SEC and Canadian Imperial Holdings, Inc./CIBC World Markets Corp. which amounted to less than $0.01 per share outstanding on November 29, 2011.
The accompanying notes are an integral part of these financial statements.
The accompanying notes are an integral part of these financial statements.
32
Voyager Fund
Voyager Fund
33
Notes to financial statements 1/31/15 (Unaudited)
Within the following Notes to financial statements, references to “State Street” represent State Street Bank and Trust Company, references to “the SEC” represent the Securities and Exchange Commission, references to “Putnam Management” represent Putnam Investment Management, LLC, the fund’s manager, an indirect wholly-owned subsidiary of Putnam Investments, LLC and references to “OTC”, if any, represent over-the-counter. Unless otherwise noted, the “reporting period” represents the period from August 1, 2014 through January 31, 2015.
Putnam Voyager Fund (the fund) is a Massachusetts business trust, which is registered under the Investment Company Act of 1940, as amended, as a diversified, open-end management investment company. The goal of the fund is to seek capital appreciation. The fund invests mainly in common stocks of midsize and large U.S. companies, with a focus on growth stocks. Growth stocks are issued by companies whose earnings are expected to grow faster than those of similar firms, and whose business growth and other characteristics may lead to an increase in stock price. Putnam Management may consider, among other factors, a company’s valuation, financial strength, growth potential, competitive position in its industry, projected future earnings, cash flows and dividends when deciding whether to buy or sell investments.
The fund offers class A, class B, class C, class M, class R, class R5, class R6 and class Y shares. Class A and class M shares are sold with a maximum front-end sales charge of 5.75% and 3.50%, respectively, and generally do not pay a contingent deferred sales charge. Class B shares, which convert to class A shares after approximately eight years, do not pay a front-end sales charge and are subject to a contingent deferred sales charge if those shares are redeemed within six years of purchase. Class C shares have a one-year 1.00% contingent deferred sales charge and do not convert to class A shares. Class R shares, which are not available to all investors, are sold at net asset value. The expenses for class A, class B, class C, class M and class R shares may differ based on the distribution fee of each class, which is identified in Note 2. Class R5, class R6 and class Y shares, which are sold at net asset value, are generally subject to the same expenses as class A, class B, class C, class M and class R shares, but do not bear a distribution fee and in the case of class R5 and class R6 shares, bear a lower investor servicing fee, which is identified in Note 2. Class R5, class R6 and class Y shares are not available to all investors.
In the normal course of business, the fund enters into contracts that may include agreements to indemnify another party under given circumstances. The fund’s maximum exposure under these arrangements is unknown as this would involve future claims that may be, but have not yet been, made against the fund. However, the fund’s management team expects the risk of material loss to be remote.
Note 1: Significant accounting policies
The following is a summary of significant accounting policies consistently followed by the fund in the preparation of its financial statements. The preparation of financial statements is in conformity with accounting principles generally accepted in the United States of America and requires management to make estimates and assumptions that affect the reported amounts of assets and liabilities in the financial statements and the reported amounts of increases and decreases in net assets from operations. Actual results could differ from those estimates. Subsequent events after the Statement of assets and liabilities date through the date that the financial statements were issued have been evaluated in the preparation of the financial statements.
Investment income, realized and unrealized gains and losses and expenses of the fund are borne pro-rata based on the relative net assets of each class to the total net assets of the fund, except that each class bears expenses unique to that class (including the distribution fees applicable to such classes). Each class votes as a class only with respect to its own distribution plan or other matters on which a class vote is required by law or determined by the Trustees. If the fund were liquidated, shares of each class would receive their pro-rata share of the net assets of the fund. In addition, the Trustees declare separate dividends on each class of shares.
Security valuation Portfolio securities and other investments are valued using policies and procedures adopted by the Board of Trustees. The Trustees have formed a Pricing Committee to oversee the implementation of these procedures and has delegated responsibility for valuing the fund’s assets in accordance with these procedures to Putnam Management. Putnam Management has established an internal Valuation Committee that is responsible for making fair value determinations, evaluating the effectiveness of the pricing policies of the fund and reporting to the Pricing Committee.
Investments for which market quotations are readily available are valued at the last reported sales price on their principal exchange, or official closing price for certain markets, and are classified as Level 1 securities under Accounting Standards Codification 820 Fair Value Measurements and Disclosures (ASC 820). If no sales are
34 Voyager Fund
reported, as in the case of some securities that are traded OTC, a security is valued at its last reported bid price and is generally categorized as a Level 2 security.
Investments in open-end investment companies (excluding exchange-traded funds), if any, which can be classified as Level 1 or Level 2 securities, are valued based on their net asset value. The net asset value of such investment companies equals the total value of their assets less their liabilities and divided by the number of their outstanding shares.
Market quotations are not considered to be readily available for certain debt obligations and other investments; such investments are valued on the basis of valuations furnished by an independent pricing service approved by the Trustees or dealers selected by Putnam Management. Such services or dealers determine valuations for normal institutional-size trading units of such securities using methods based on market transactions for comparable securities and various relationships, generally recognized by institutional traders, between securities (which consider such factors as security prices, yields, maturities and ratings). These securities will generally be categorized as Level 2. Short-term securities with remaining maturities of 60 days or less may be valued at amortized cost, which approximates fair value, and are classified as Level 2 securities.
Many securities markets and exchanges outside the U.S. close prior to the close of the New York Stock Exchange and therefore the closing prices for securities in such markets or on such exchanges may not fully reflect events that occur after such close but before the close of the New York Stock Exchange. Accordingly, on certain days, the fund will fair value foreign equity securities taking into account multiple factors including movements in the U.S. securities markets, currency valuations and comparisons to the valuation of American Depository Receipts, exchange-traded funds and futures contracts. These securities, which would generally be classified as Level 1 securities, will be transferred to Level 2 of the fair value hierarchy when they are valued at fair value. The number of days on which fair value prices will be used will depend on market activity and it is possible that fair value prices will be used by the fund to a significant extent. At the close of the reporting period, fair value pricing was used for certain foreign securities in the portfolio. Securities quoted in foreign currencies, if any, are translated into U.S. dollars at the current exchange rate.
To the extent a pricing service or dealer is unable to value a security or provides a valuation that Putnam Management does not believe accurately reflects the security’s fair value, the security will be valued at fair value by Putnam Management in accordance with policies and procedures approved by the Trustees. Certain investments, including certain restricted and illiquid securities and derivatives, are also valued at fair value following procedures approved by the Trustees. These valuations consider such factors as significant market or specific security events such as interest rate or credit quality changes, various relationships with other securities, discount rates, U.S. Treasury, U.S. swap and credit yields, index levels, convexity exposures, recovery rates, sales and other multiples and resale restrictions. These securities are classified as Level 2 or as Level 3 depending on the priority of the significant inputs.
To assess the continuing appropriateness of fair valuations, the Valuation Committee reviews and affirms the reasonableness of such valuations on a regular basis after considering all relevant information that is reasonably available. Such valuations and procedures are reviewed periodically by the Trustees. The fair value of securities is generally determined as the amount that the fund could reasonably expect to realize from an orderly disposition of such securities over a reasonable period of time. By its nature, a fair value price is a good faith estimate of the value of a security in a current sale and does not reflect an actual market price, which may be different by a material amount.
Security transactions and related investment income Security transactions are recorded on the trade date (the date the order to buy or sell is executed). Gains or losses on securities sold are determined on the identified cost basis.
Interest income, net of any applicable withholding taxes, is recorded on the accrual basis. Dividend income, net of any applicable withholding taxes, is recognized on the ex-dividend date except that certain dividends from foreign securities, if any, are recognized as soon as the fund is informed of the ex-dividend date. Non-cash dividends, if any, are recorded at the fair value of the securities received. Dividends representing a return of capital or capital gains, if any, are reflected as a reduction of cost and/or as a realized gain.
All premiums/discounts are amortized/accreted on a yield-to-maturity basis.
Foreign currency translation The accounting records of the fund are maintained in U.S. dollars. The fair value of foreign securities, currency holdings, and other assets and liabilities is recorded in the books and records of the fund after translation to U.S. dollars based on the exchange rates on that day. The cost of each security is determined using historical exchange rates. Income and withholding taxes are translated at prevailing exchange rates when earned or incurred. The fund does not isolate that portion of realized or unrealized gains or losses resulting
Voyager Fund 35
from changes in the foreign exchange rate on investments from fluctuations arising from changes in the market prices of the securities. Such gains and losses are included with the net realized and unrealized gain or loss on investments. Net realized gains and losses on foreign currency transactions represent net realized exchange gains or losses on closed forward currency contracts, disposition of foreign currencies, currency gains and losses realized between the trade and settlement dates on securities transactions and the difference between the amount of investment income and foreign withholding taxes recorded on the fund’s books and the U.S. dollar equivalent amounts actually received or paid. Net unrealized appreciation and depreciation of assets and liabilities in foreign currencies arise from changes in the value of open forward currency contracts and assets and liabilities other than investments at the period end, resulting from changes in the exchange rate.
Options contracts The fund uses options contracts to hedge against changes in values of securities it owns, owned or expects to own, and to manage downside risks.
The potential risk to the fund is that the change in value of options contracts may not correspond to the change in value of the hedged instruments. In addition, losses may arise from changes in the value of the underlying instruments if there is an illiquid secondary market for the contracts, if interest or exchange rates move unexpectedly or if the counterparty to the contract is unable to perform. Realized gains and losses on purchased options are included in realized gains and losses on investment securities. If a written call option is exercised, the premium originally received is recorded as an addition to sales proceeds. If a written put option is exercised, the premium originally received is recorded as a reduction to the cost of investments.
Exchange-traded options are valued at the last sale price or, if no sales are reported, the last bid price for purchased options and the last ask price for written options. OTC traded options are valued using prices supplied by dealers.
Options on swaps are similar to options on securities except that the premium paid or received is to buy or grant the right to enter into a previously agreed upon interest rate or credit default contract. Forward premium swap option contracts include premiums that have extended settlement dates. The delayed settlement of the premiums is factored into the daily valuation of the option contracts. In the case of interest rate cap and floor contracts, in return for a premium, ongoing payments between two parties are based on interest rates exceeding a specified rate, in the case of a cap contract, or falling below a specified rate in the case of a floor contract.
Written option contracts outstanding at period end, if any, are listed after the fund’s portfolio.
Forward currency contracts The fund buys and sells forward currency contracts, which are agreements between two parties to buy and sell currencies at a set price on a future date. These contracts are used to hedge foreign exchange risk.
The U.S. dollar value of forward currency contracts is determined using current forward currency exchange rates supplied by a quotation service. The fair value of the contract will fluctuate with changes in currency exchange rates. The contract is marked to market daily and the change in fair value is recorded as an unrealized gain or loss. The fund records a realized gain or loss equal to the difference between the value of the contract at the time it was opened and the value at the time it was closed when the contract matures or by delivery of the currency. The fund could be exposed to risk if the value of the currency changes unfavorably, if the counterparties to the contracts are unable to meet the terms of their contracts or if the fund is unable to enter into a closing position. Risks may exceed amounts recognized on the Statement of assets and liabilities.
Forward currency contracts outstanding at period end, if any, are listed after the fund’s portfolio.
Total return swap contracts The fund entered into OTC total return swap contracts, which are arrangements to exchange a market linked return for a periodic payment, both based on a notional principal amount, to gain exposure to specific markets or countries and to gain exposure to specific sectors or industries.
To the extent that the total return of the security, index or other financial measure underlying the transaction exceeds or falls short of the offsetting interest rate obligation, the fund will receive a payment from or make a payment to the counterparty. OTC total return swap contracts are marked to market daily based upon quotations from an independent pricing service or market makers and the change, if any, is recorded as an unrealized gain or loss. Payments received or made are recorded as realized gains or losses. Certain OTC total return swap contracts may include extended effective dates. Payments related to these swap contracts are accrued based on the terms of the contract. The fund could be exposed to credit or market risk due to unfavorable changes in the fluctuation of interest rates or in the price of the underlying security or index, the possibility that there is no liquid market for these agreements or that the counterparty may default on its obligation to perform. The fund’s maximum risk of loss from counterparty risk is the fair value of the contract. This risk may be mitigated by having a master
36 Voyager Fund
netting arrangement between the fund and the counterparty. Risk of loss may exceed amounts recognized on the Statement of assets and liabilities.
OTC total return swap contracts outstanding, including their respective notional amounts at period end, if any, are listed after the fund’s portfolio.
Master agreements The fund is a party to ISDA (International Swaps and Derivatives Association, Inc.) Master Agreements (Master Agreements) with certain counterparties that govern OTC derivative and foreign exchange contracts entered into from time to time. The Master Agreements may contain provisions regarding, among other things, the parties’ general obligations, representations, agreements, collateral requirements, events of default and early termination. With respect to certain counterparties, in accordance with the terms of the Master Agreements, collateral posted to the fund is held in a segregated account by the fund’s custodian and with respect to those amounts which can be sold or repledged, is presented in the fund’s portfolio. Collateral posted to the fund which cannot be sold or repledged totaled $26,739,820 at the close of the reporting period.
Collateral pledged by the fund is segregated by the fund’s custodian and identified in the fund’s portfolio. Collateral can be in the form of cash or debt securities issued by the U.S. Government or related agencies or other securities as agreed to by the fund and the applicable counterparty. Collateral requirements are determined based on the fund’s net position with each counterparty.
Termination events applicable to the fund may occur upon a decline in the fund’s net assets below a specified threshold over a certain period of time. Termination events applicable to counterparties may occur upon a decline in the counterparty’s long-term and short-term credit ratings below a specified level. In each case, upon occurrence, the other party may elect to terminate early and cause settlement of all derivative and foreign exchange contracts outstanding, including the payment of any losses and costs resulting from such early termination, as reasonably determined by the terminating party. Any decision by one or more of the fund’s counterparties to elect early termination could impact the fund’s future derivative activity.
At the close of the reporting period, the fund had a net liability position of $10,714 on open derivative contracts subject to the Master Agreements. There was no collateral posted by the fund at period end for these agreements.
Securities lending The fund may lend securities, through its agent, to qualified borrowers in order to earn additional income. The loans are collateralized by cash in an amount at least equal to the fair value of the securities loaned. The fair value of securities loaned is determined daily and any additional required collateral is allocated to the fund on the next business day. The risk of borrower default will be borne by the fund’s agent; the fund will bear the risk of loss with respect to the investment of the cash collateral. Income from securities lending is included in investment income on the Statement of operations. Cash collateral is invested in Putnam Cash Collateral Pool, LLC, a limited liability company managed by an affiliate of Putnam Management. Investments in Putnam Cash Collateral Pool, LLC are valued at its closing net asset value each business day. There are no management fees charged to Putnam Cash Collateral Pool, LLC. At the close of the reporting period, the fund received cash collateral of $139,079,945 and the value of securities loaned amounted to $134,241,449. Certain of these securities were sold prior to the close of the reporting period and are included in Receivable for investments sold on the Statement of assets and liabilities.
Interfund lending The fund, along with other Putnam funds, may participate in an interfund lending program pursuant to an exemptive order issued by the SEC. This program allows the fund to borrow from or lend to other Putnam funds that permit such transactions. Interfund lending transactions are subject to each fund’s investment policies and borrowing and lending limits. Interest earned or paid on the interfund lending transaction will be based on the average of certain current market rates. During the reporting period, the fund did not utilize the program.
Lines of credit The fund participates, along with other Putnam funds, in a $392.5 million unsecured committed line of credit and a $235.5 million unsecured uncommitted line of credit, both provided by State Street. Borrowings may be made for temporary or emergency purposes, including the funding of shareholder redemption requests and trade settlements. Interest is charged to the fund based on the fund’s borrowing at a rate equal to the Federal Funds rate plus 1.25% for the committed line of credit and the Federal Funds rate plus 1.30% for the uncommitted line of credit. A closing fee equal to 0.04% of the committed line of credit and 0.04% of the uncommitted line of credit has been paid by the participating funds. In addition, a commitment fee of 0.11% per annum on any unutilized portion of the committed line of credit is allocated to the participating funds based on their relative net assets and paid quarterly. During the reporting period, the fund had no borrowings against these arrangements.
Federal taxes It is the policy of the fund to distribute all of its taxable income within the prescribed time period and otherwise comply with the provisions of the Internal Revenue Code of 1986, as amended (the Code), applicable
Voyager Fund 37
to regulated investment companies. It is also the intention of the fund to distribute an amount sufficient to avoid imposition of any excise tax under Section 4982 of the Code.
The fund is subject to the provisions of Accounting Standards Codification 740 Income Taxes (ASC 740). ASC 740 sets forth a minimum threshold for financial statement recognition of the benefit of a tax position taken or expected to be taken in a tax return. The fund did not have a liability to record for any unrecognized tax benefits in the accompanying financial statements. No provision has been made for federal taxes on income, capital gains or unrealized appreciation on securities held nor for excise tax on income and capital gains. Each of the fund’s federal tax returns for the prior three fiscal years remains subject to examination by the Internal Revenue Service.
The fund may also be subject to taxes imposed by governments of countries in which it invests. Such taxes are generally based on either income or gains earned or repatriated. The fund accrues and applies such taxes to net investment income, net realized gains and net unrealized gains as income and/or capital gains are earned. In some cases, the fund may be entitled to reclaim all or a portion of such taxes, and such reclaim amounts, if any, are reflected as an asset on the fund’s books. In many cases, however, the fund may not receive such amounts for an extended period of time, depending on the country of investment.
The aggregate identified cost on a tax basis is $3,940,393,265, resulting in gross unrealized appreciation and depreciation of $601,007,899 and $227,189,192, respectively, or net unrealized appreciation of $373,818,707.
Distributions to shareholders Distributions to shareholders from net investment income are recorded by the fund on the ex-dividend date. Distributions from capital gains, if any, are recorded on the ex-dividend date and paid at least annually. The amount and character of income and gains to be distributed are determined in accordance with income tax regulations, which may differ from generally accepted accounting principles. Dividend sources are estimated at the time of declaration. Actual results may vary. Any non-taxable return of capital cannot be determined until final tax calculations are completed after the end of the fund’s fiscal year. Reclassifications are made to the fund’s capital accounts to reflect income and gains available for distribution (or available capital loss carryovers) under income tax regulations.
Note 2: Management fee, administrative services and other transactions
The fund pays Putnam Management a management fee (base fee) (based on the fund’s average net assets and computed and paid monthly) at annual rates that may vary based on the average of the aggregate net assets of most open-end funds, as defined in the fund’s management contract, sponsored by Putnam Management. Such annual rates may vary as follows:
0.710%
of the first $5 billion,
0.660%
of the next $5 billion,
0.610%
of the next $10 billion,
0.560%
of the next $10 billion,
0.510%
of the next $50 billion,
0.490%
of the next $50 billion,
0.480%
of the next $100 billion and
0.475%
of any excess thereafter.
In addition, the monthly management fee consists of the monthly base fee plus or minus a performance adjustment for the month. The performance adjustment is determined based on performance over the thirty-six month period then ended. Each month, the performance adjustment is calculated by multiplying the performance adjustment rate and the fund’s average net assets over the performance period and the result is divided by twelve. The resulting dollar amount is added to, or subtracted from the base fee for that month. The performance adjustment rate is equal to 0.03 multiplied by the difference between the fund’s annualized performance (measured by the fund’s class A shares) and the annualized performance of the Russell 1000 Growth Index, each measured over the performance period. The maximum annualized performance adjustment rates are +/– 0.12%. The monthly base fee is determined based on the fund’s average net assets for the month, while the performance adjustment is determined based on the fund’s average net assets over the performance period of up to thirty-six months. This means it is possible that, if the fund underperforms significantly over the performance period, and the fund’s assets have declined significantly over that period, the negative performance adjustment may exceed the base fee. In this event, Putnam Management would make a payment to the fund.
Because the performance adjustment is based on the fund’s performance relative to its applicable benchmark index, and not its absolute performance, the performance adjustment could increase Putnam Management’s fee even if the fund’s shares lose value during the performance period provided that the fund outperformed its benchmark index, and could decrease Putnam Management’s fee even if the fund’s shares increase in value during the performance period provided that the fund underperformed its benchmark index.
38 Voyager Fund
For the reporting period, the base fee represented an effective rate (excluding the impact from any expense waivers in effect) of 0.277% of the fund’s average net assets before an increase of $56,791 (0.001% of the fund’s average net assets) based on performance.
Putnam Management has contractually agreed, through June 30, 2015, to waive fees or reimburse the fund’s expenses to the extent necessary to limit the cumulative expenses of the fund, exclusive of brokerage, interest, taxes, investment-related expenses, extraordinary expenses, acquired fund fees and expenses and payments under the fund’s investor servicing contract, investment management contract and distribution plans, on a fiscal year-to-date basis to an annual rate of 0.20% of the fund’s average net assets over such fiscal year-to-date period. During the reporting period, the fund’s expenses were not reduced as a result of this limit.
Putnam Investments Limited (PIL), an affiliate of Putnam Management, is authorized by the Trustees to manage a separate portion of the assets of the fund as determined by Putnam Management from time to time. Putnam Management pays a quarterly sub-management fee to PIL for its services at an annual rate of 0.35% of the average net assets of the portion of the fund managed by PIL.
The fund reimburses Putnam Management an allocated amount for the compensation and related expenses of certain officers of the fund and their staff who provide administrative services to the fund. The aggregate amount of all such reimbursements is determined annually by the Trustees.
Custodial functions for the fund’s assets are provided by State Street. Custody fees are based on the fund’s asset level, the number of its security holdings and transaction volumes.
Putnam Investor Services, Inc., an affiliate of Putnam Management, provides investor servicing agent functions to the fund. Putnam Investor Services, Inc. received fees for investor servicing (except for class R5 and R6 shares) based on the fund’s retail asset level, the number of shareholder accounts in the fund and the level of defined contribution plan assets in the fund. Class R5 shares pay a monthly fee based on the average net assets of class R5 shares at an annual rate of 0.15%. Class R6 shares pay a monthly fee based on the average net assets of class R6 shares at an annual rate of 0.05%. Investor servicing fees will not exceed an annual rate of 0.32% of the fund’s average net assets. During the reporting period, the expenses for each class of shares related to investor servicing fees were as follows:
Class A
$3,500,341
Class B
103,533
Class C
163,857
Class M
28,540
Class R
17,519
Class R5
427
Class R6
9,369
Class Y
388,793
Total
$4,212,379
The fund has entered into expense offset arrangements with Putnam Investor Services, Inc. and State Street whereby Putnam Investor Services, Inc.’s and State Street’s fees are reduced by credits allowed on cash balances. The fund also reduced expenses through brokerage/service arrangements. For the reporting period, the fund’s expenses were reduced by $2,973 under the expense offset arrangements and by $292,642 under the brokerage/service arrangements.
Each Independent Trustee of the fund receives an annual Trustee fee, of which $2,396, as a quarterly retainer, has been allocated to the fund, and an additional fee for each Trustees meeting attended. Trustees also are reimbursed for expenses they incur relating to their services as Trustees.
The fund has adopted a Trustee Fee Deferral Plan (the Deferral Plan) which allows the Trustees to defer the receipt of all or a portion of Trustees fees payable on or after July 1, 1995. The deferred fees remain invested in certain Putnam funds until distribution in accordance with the Deferral Plan.
The fund has adopted an unfunded noncontributory defined benefit pension plan (the Pension Plan) covering all Trustees of the fund who have served as a Trustee for at least five years and were first elected prior to 2004. Benefits under the Pension Plan are equal to 50% of the Trustee’s average annual attendance and retainer fees for the three years ended December 31, 2005. The retirement benefit is payable during a Trustee’s lifetime, beginning the year following retirement, for the number of years of service through December 31, 2006. Pension expense for the fund is included in Trustee compensation and expenses in the Statement of operations. Accrued pension liability is included in Payable for Trustee compensation and expenses in the Statement of assets and liabilities. The Trustees have terminated the Pension Plan with respect to any Trustee first elected after 2003.
Voyager Fund 39
The fund has adopted distribution plans (the Plans) with respect to its class A, class B, class C, class M and class R shares pursuant to Rule 12b–1 under the Investment Company Act of 1940. The purpose of the Plans is to compensate Putnam Retail Management Limited Partnership, an indirect wholly-owned subsidiary of Putnam Investments, LLC, for services provided and expenses incurred in distributing shares of the fund. The Plans provide for payments by the fund to Putnam Retail Management Limited Partnership at an annual rate of up to 0.35%, 1.00%, 1.00%, 1.00% and 1.00% of the average net assets attributable to class A, class B, class C, class M and class R shares, respectively. The Trustees have approved payment by the fund at an annual rate of 0.25%, 1.00%, 1.00%, 0.75% and 0.50% of the average net assets attributable to class A, class B, class C, class M and class R shares, respectively. During the reporting period, the class specific expenses related to distribution fees were as follows:
Class A
$4,414,664
Class B
522,576
Class C
827,181
Class M
108,055
Class R
44,192
Total
$5,916,668
For the reporting period, Putnam Retail Management Limited Partnership, acting as underwriter, received net commissions of $126,415 and $898 from the sale of class A and class M shares, respectively, and received $35,089 and $570 in contingent deferred sales charges from redemptions of class B and class C shares, respectively.
A deferred sales charge of up to 1.00% and 0.65% is assessed on certain redemptions of class A and class M shares, respectively. For the reporting period, Putnam Retail Management Limited Partnership, acting as underwriter, received $44 and no monies on class A and class M redemptions, respectively.
Note 3: Purchases and sales of securities
During the reporting period, cost of purchases and proceeds from sales, excluding short-term investments were as follows:
Cost of purchases
Proceeds from sales
Investments in securities (Long-term)
$2,667,824,803
$2,881,628,601
U.S. government securities (Long-term)
—
—
Total
$2,667,824,803
$2,881,628,601
Written option transactions during the reporting period are summarized as follows:
Written option contract amounts
Written option premiums
Written options outstanding at the beginning of the reporting period
$70,197,631
$37,281,299
Options opened
251,821,214
62,429,903
Options exercised
—
—
Options expired
(245,808,974)
(80,475,454)
Options closed
(54,147,446)
(18,307,389)
Written options outstanding at the end of the reporting period
$22,062,425
$928,359
40 Voyager Fund
Note 4: Capital shares
At the close of the reporting period, there were an unlimited number of shares of beneficial interest authorized. Transactions in capital shares were as follows:
Six months ended 1/31/15
Year ended 7/31/14
Class A
Shares
Amount
Shares
Amount
Shares sold
2,341,576
$74,481,212
5,083,664
$155,397,538
Shares issued in connection with reinvestment of distributions
13,234,452
405,106,571
945,299
28,585,821
15,576,028
479,587,783
6,028,963
183,983,359
Shares repurchased
(8,235,783)
(263,976,495)
(15,627,833)
(476,677,197)
Net increase (decrease)
7,340,245
$215,611,288
(9,598,870)
$(292,693,838)
Six months ended 1/31/15
Year ended 7/31/14
Class B
Shares
Amount
Shares
Amount
Shares sold
183,679
$4,823,505
352,932
$9,033,292
Shares issued in connection with reinvestment of distributions
549,742
13,721,566
18,043
458,121
733,421
18,545,071
370,975
9,491,413
Shares repurchased
(471,382)
(12,477,835)
(1,169,391)
(29,880,541)
Net increase (decrease)
262,039
$6,067,236
(798,416)
$(20,389,128)
Six months ended 1/31/15
Year ended 7/31/14
Class C
Shares
Amount
Shares
Amount
Shares sold
368,186
$10,625,001
621,925
$17,543,210
Shares issued in connection with reinvestment of distributions
601,192
16,767,235
12,351
345,455
969,378
27,392,236
634,276
17,888,665
Shares repurchased
(467,113)
(13,692,479)
(929,693)
(25,934,900)
Net increase (decrease)
502,265
$13,699,757
(295,417)
$(8,046,235)
Six months ended 1/31/15
Year ended 7/31/14
Class M
Shares
Amount
Shares
Amount
Shares sold
16,622
$488,130
45,399
$1,263,926
Shares issued in connection with reinvestment of distributions
131,156
3,640,889
5,319
147,750
147,778
4,129,019
50,718
1,411,676
Shares repurchased
(53,823)
(1,561,164)
(118,346)
(3,263,608)
Net increase (decrease)
93,955
$2,567,855
(67,628)
$(1,851,932)
Six months ended 1/31/15
Year ended 7/31/14
Class R
Shares
Amount
Shares
Amount
Shares sold
78,648
$2,445,157
177,145
$5,341,769
Shares issued in connection with reinvestment of distributions
56,040
1,680,074
2,841
84,346
134,688
4,125,231
179,986
5,426,115
Shares repurchased
(132,360)
(4,152,359)
(290,523)
(8,598,903)
Net increase (decrease)
2,328
$(27,128)
(110,537)
$(3,172,788)
Voyager Fund 41
Six months ended 1/31/15
Year ended 7/31/14
Class R5
Shares
Amount
Shares
Amount
Shares sold
75,083
$2,311,022
—
$—
Shares issued in connection with reinvestment of distributions
74
2,398
6
171
75,157
2,313,420
6
171
Shares repurchased
(4,852)
(154,672)
—
—
Net increase
70,305
$2,158,748
6
$171
Six months ended 1/31/15
Year ended 7/31/14
Class R6
Shares
Amount
Shares
Amount
Shares sold
30,160
$1,026,156
88,024
$2,802,257
Shares issued in connection with reinvestment of distributions
141,431
4,563,969
13,661
432,629
171,591
5,590,125
101,685
3,234,886
Shares repurchased
(78,009)
(2,631,078)
(123,670)
(3,933,547)
Net increase (decrease)
93,582
2,959,047
(21,985)
$(698,661)
Six months ended 1/31/15
Year ended 7/31/14
Class Y
Shares
Amount
Shares
Amount
Shares sold
2,236,697
$76,316,139
2,308,229
$74,098,441
Shares issued in connection with reinvestment of distributions
1,275,470
41,044,609
93,508
2,954,851
3,512,167
117,360,748
2,401,737
77,053,292
Shares repurchased
(1,307,499)
(43,494,062)
(2,676,769)
(86,300,461)
Net increase (decrease)
2,204,668
$73,866,686
(275,032)
$(9,247,169)
At the close of the reporting period, Putnam Investments, LLC owned the following shares of the fund:
Shares owned
Percentage of ownership
Value
Class R5
531
0.75%
$16,519
Class R6
532
0.05
16,556
Note 5: Affiliated transactions
Transactions during the reporting period with a company which is under common ownership or control, or involving securities of companies in which the fund owned at least 5% of the outstanding voting securities, were as follows:
Name of affiliates
Fair value at the beginning of the reporting period
Purchase cost
Sale proceeds
Investment income
Fair value at the end of the reporting period
Putnam Short Term Investment Fund*
$218,450,175
$910,357,316
$909,609,282
$37,669
$219,198,209
ITT Educational Services, Inc.
26,697,942
1,981,152
838,092
—
14,510,622
Totals
$245,148,117
$912,338,468
$910,447,374
$37,669
$233,708,831
* Management fees charged to Putnam Short Term Investment Fund have been waived by Putnam Management.
42 Voyager Fund
Note 6: Market, credit and other risks
In the normal course of business, the fund trades financial instruments and enters into financial transactions where risk of potential loss exists due to changes in the market (market risk) or failure of the contracting party to the transaction to perform (credit risk). The fund may be exposed to additional credit risk that an institution or other entity with which the fund has unsettled or open transactions will default. Investments in foreign securities involve certain risks, including those related to economic instability, unfavorable political developments, and currency fluctuations.
Note 7: Summary of derivative activity
The volume of activity for the reporting period for any derivative type that was held during the period is listed below and was as follows based on an average of the holdings at the end of each fiscal quarter:
Written equity option contracts (contract amount) (Note 3)
$26,300,000
Forward currency contracts (contract amount)
$395,100,000
OTC total return swap contracts (notional)
$60,100,000
Warrants (number of warrants)
14,000,000
The following is a summary of the fair value of derivative instruments as of the close of the reporting period:
Fair value of derivative instruments as of the close of the reporting period
Asset derivatives
Liability derivatives
Derivatives not accounted for as hedging instruments under ASC 815
Statement of assets and liabilities location
Fair value
Statement of assets and liabilities location
Fair value
Foreign exchange contracts
Receivables
$18,977,258
Payables
$—
Equity contracts
Investments
88,375,487
Payables
2,832,559
Total
$107,352,745
$2,832,559
The following is a summary of realized and change in unrealized gains or losses of derivative instruments on the Statement of operations for the reporting period (see Note 1):
Amount of realized gain or (loss) on derivatives recognized in net gain or (loss) on investments
Derivatives not accounted for as hedging instruments under ASC 815
Warrants
Options
Forward currency contracts
Swaps
Total
Foreign exchange contracts
$—
$—
$31,088,061
$—
$31,088,061
Equity contracts
459,844
(15,586,661)
—
(13,748,149)
$(28,874,966)
Total
$459,844
$(15,586,661)
$31,088,061
$(13,748,149)
$2,213,095
Change in unrealized appreciation or (depreciation) on derivatives recognized in net gain or (loss) on investments
Derivatives not accounted for as hedging instruments under ASC 815
Warrants
Options
Forward currency contracts
Swaps
Total
Foreign exchange contracts
$—
$—
$16,175,529
$—
$16,175,529
Equity contracts
(2,215,837)
8,041,698
—
7,971
$5,833,832
Total
$(2,215,837)
$8,041,698
$16,175,529
$7,971
$22,009,361
Voyager Fund 43
Note 8: Offsetting of financial and derivative assets and liabilities
The following table summarizes any derivatives, repurchase agreements and reverse repurchase agreements, at the end of the reporting period, that are subject to an enforceable master netting agreement or similar agreement. For securities lending transactions or borrowing transactions associated with securities sold short, if any, see Note 1. For financial reporting purposes, the fund does not offset financial assets and financial liabilities that are subject to the master netting agreements in the Statement of assets and liabilities.
Bank of America N.A.
Barclays Bank PLC
Citibank, N.A.
Credit Suisse International
Deutsche Bank AG
Goldman Sachs International
JPMorgan Chase Bank N.A.
UBS AG
Total
Assets:
OTC Total return swap contracts*#
$—
$—
$—
$—
$—
$—
$—
$—
$—
Forward currency contracts#
—
—
—
15,749,440
—
—
—
3,227,818
18,977,258
Purchased options**#
89,010
25,455,722
13,631,974
348,322
19,382,528
9,864,492
66,830
—
68,838,878
Total Assets
$89,010
$25,455,722
$13,631,974
$16,097,762
$19,382,528
$9,864,492
$66,830
$3,227,818
$87,816,136
Liabilities:
OTC Total return swap contracts*#
—
—
—
—
909,732
1,124,412
30,025
—
2,064,169
Forward currency contracts#
—
—
—
—
—
—
—
—
—
Written options#
53,698
192,659
—
227,850
246,664
—
47,519
—
768,390
Total Liabilities
$53,698
$192,659
$—
$227,850
$1,156,396
$1,124,412
$77,544
$—
$2,832,559
Total Financial and Derivative Net Assets
$35,312
$25,263,063
$13,631,974
$15,869,912
$18,226,132
$8,740,080
$(10,714)
$3,227,818
$84,983,577
Total collateral received (pledged)†##
$—
$25,263,063
$13,631,974
$15,366,063
$18,226,132
$8,662,810
$—
$2,710,947
Net amount
$35,312
$—
$—
$503,849
$—
$77,270
$(10,714)
$516,871
*
Excludes premiums, if any. Included in unrealized appreciation and depreciation on OTC swap contracts on the Statement of assets and liabilities.
**
Included with Investments in securities on the Statement of assets and liabilities.
†
Additional collateral may be required from certain brokers based on individual agreements.
#
Covered by master netting agreement (Note 1).
##
Any over-collateralization of total financial and derivative net assets is not shown. Collateral may include amounts related to unsettled agreements.
44 Voyager Fund
Fund information
Founded over 75 years ago, Putnam Investments was built around the concept that a balance between risk and reward is the hallmark of a well-rounded financial program. We manage over 100 funds across income, value, blend, growth, asset allocation, absolute return, and global sector categories.
Investment Manager
Putnam Investment Management, LLC One Post Office Square Boston, MA 02109
Investment Sub-Manager
Putnam Investments Limited 57–59 St James’s Street London, England SW1A 1LD
Marketing Services
Putnam Retail Management One Post Office Square Boston, MA 02109
Custodian
State Street Bank and Trust Company
Legal Counsel
Ropes & Gray LLP
Trustees
Jameson A. Baxter, Chair Liaquat Ahamed Ravi Akhoury Barbara M. Baumann Charles B. Curtis Robert J. Darretta Katinka Domotorffy John A. Hill Paul L. Joskow Kenneth R. Leibler Robert E. Patterson George Putnam, III Robert L. Reynolds W. Thomas Stephens
Officers
Robert L. Reynolds President
Jonathan S. Horwitz Executive Vice President, Principal Executive Officer, and Compliance Liaison
Steven D. Krichmar Vice President and Principal Financial Officer
Robert T. Burns Vice President and Chief Legal Officer
Robert R. Leveille Vice President and Chief Compliance Officer
Michael J. Higgins Vice President, Treasurer, and Clerk
Janet C. Smith Vice President, Principal Accounting Officer, and Assistant Treasurer
Susan G. Malloy Vice President and Assistant Treasurer
James P. Pappas Vice President
Mark C. Trenchard Vice President and BSA Compliance Officer
Nancy E. Florek Vice President, Director of Proxy Voting and Corporate Governance, Assistant Clerk, and Associate Treasurer
This report is for the information of shareholders of Putnam Voyager Fund. It may also be used as sales literature when preceded or accompanied by the current prospectus, the most recent copy of Putnam’s Quarterly Performance Summary, and Putnam’s Quarterly Ranking Summary. For more recent performance, please visit putnam.com. Investors should carefully consider the investment objectives, risks, charges, and expenses of a fund, which are described in its prospectus. For this and other information or to request a prospectus or summary prospectus, call 1-800-225-1581 toll free. Please read the prospectus carefully before investing. The fund’s Statement of Additional Information contains additional information about the fund’s Trustees and is available without charge upon request by calling 1-800-225-1581.
Item 2. Code of Ethics:
Not applicable
Item 3. Audit Committee Financial Expert:
Not applicable
Item 4. Principal Accountant Fees and Services:
Not applicable
Item 5. Audit Committee of Listed Registrants
Not applicable
Item 6. Schedule of Investments:
The registrant’s schedule of investments in unaffiliated issuers is included in the report to shareholders in Item 1 above.
Item 7. Disclosure of Proxy Voting Policies and Procedures For Closed-End Management Investment Companies:
Not applicable
Item 8. Portfolio Managers of Closed-End Investment Companies
Not Applicable
Item 9. Purchases of Equity Securities by Closed-End Management Investment Companies and Affiliated Purchasers:
Not applicable
Item 10. Submission of Matters to a Vote of Security Holders:
Not applicable
Item 11. Controls and Procedures:
(a) The registrant’s principal executive officer and principal financial officer have concluded, based on their evaluation of the effectiveness of the design and operation of the registrant’s disclosure controls and procedures as of a date within 90 days of the filing date of this report, that the design and operation of such procedures are generally effective to provide reasonable assurance that information required to be disclosed by the registrant in this report is recorded, processed, summarized and reported within the time periods specified in the Commission’s rules and forms.
(b) Changes in internal control over financial reporting: Not applicable
Item 12. Exhibits:
(a)(1) Not applicable
(a)(2) Separate certifications for the principal executive officer and principal financial officer of the registrant as required by Rule 30a-2(a) under the Investment Company Act of 1940, as amended, are filed herewith.
(b) The certifications required by Rule 30a-2(b) under the Investment Company Act of 1940, as amended, are filed herewith.
Putnam Voyager Fund
By (Signature and Title):
/s/ Janet C. Smith Janet C. Smith Principal Accounting Officer
Date: March 31, 2015
Pursuant to the requirements of the Securities Exchange Act of 1934 and the Investment Company Act of 1940, this report has been signed below by the following persons on behalf of the registrant and in the capacities and on the dates indicated.
By (Signature and Title):
/s/ Jonathan S. Horwitz Jonathan S. Horwitz Principal Executive Officer
Date: March 31, 2015
By (Signature and Title):
/s/ Steven D. Krichmar Steven D. Krichmar Principal Financial Officer
Date: March 31, 2015
We use cookies on this site to provide a more responsive and personalized service. Continuing to browse, clicking I Agree, or closing this banner indicates agreement. See our Cookie Policy for more information.