Exhibit 13.1
2 0 0 2 A N N U A L R E P O R T


SAKS
INCORPORATED
Intent. On Strategy.


2002

Intent. On Strategy.
F I N A N C I A L H I G H L I G H T S
SAKS INCORPORATED FINANCIAL HIGHLIGHTS
| | | Year Ended | | | 
|
| |
(In Thousands, except per share amounts) | | February 1, 2003 | | | February 2, 2002 | | | February 3, 2001 | | |
| |
| | | | | |
Net Sales | | $ | 5,911,122 | | | $ | 6,070,568 | | | $ | 6,581,236 | | |
Income Before Accounting Change | | $ | 69,837 | | | $ | 322 | | | $ | 75,216 | | |
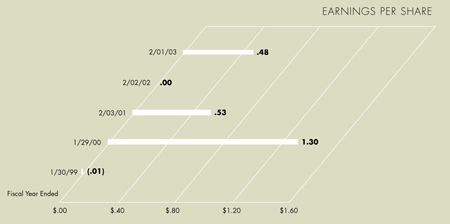
Diluted Earnings Per Common Share Before Accounting Change | | $ | 0.48 | | | $ | 0.00 | | | $ | 0.53 | | |
Diluted Weighted Average Common Shares | | | 146,707 | | | | 144,498 | | | | 142,718 | | |
Total Assets | | $ | 4,579,356 | | | $ | 4,595,521 | | | $ | 5,050,611 | | |
Shareholders’ Equity | | $ | 2,267,272 | | | $ | 2,271,437 | | | $ | 2,293,829 | | |
| |
Management excludes certain items from its view of ongoing core operations. Below is a summary of these items and their effect on net income. | |
Income Before Certain Items | | $ | 90,416 | | | $ | 23,868 | | | $ | 132,710 | | |
Diluted Earnings Per Common Share Before Certain Items | | $ | 0.62 | | | $ | 0.17 | | | $ | 0.93 | | |
| |
Certain Items: | | | | | | | | | | | | | |
Losses from long-lived assets | | $ | 19,547 | | | $ | 32,621 | | | $ | 73,572 | | |
Integration charges | | | 9,981 | | | | 1,539 | | | | 19,886 | | |
Reorganization charges | | | 763 | | | | 20,049 | | | | 7,652 | | |
Gains on extinguishment of debt | | | (709 | ) | | | (26,110 | ) | | | — | | |
Other | | | 2,820 | | | | 9,897 | | | | (925 | ) | |
| |
Total certain items, before income taxes | | | 32,402 | | | | 37,996 | | | | 100,185 | | |
Tax benefit from real estate investment | | | — | | | | — | | | | (4,120 | ) | |
Tax effect of certain items | | | (11,823 | ) | | | (14,450 | ) | | | (38,571 | ) | |
| |
Total Certain Items | | $ | 20,579 | | | $ | 23,546 | | | $ | 57,494 | | |
|
|
|
2

| | L E T T E R T O O U R S H A R E H O L D E R S Intent. On Strategy. |
| | | TO OUR SHAREHOLDERS During the past year, Saks achieved gains in operating profits and return on invested capital in an extremely difficult retail environment. Earnings per share increased from the depressed 2001 level to $.48 in 2002 despite a comparable store sales decrease of 1.4%. Profit improvement was the result of increased merchandise margins and a reduction in operating expenses. During the year, we generated $276 million in cash flow from operations. |

| | 
|
| | |
IMPROVED OPERATING PERFORMANCE
3
L E T T E R T O O U R S H A R E H O L D E R S
Intent. On Strategy.
RETURNS ON INVESTED CAPITAL*
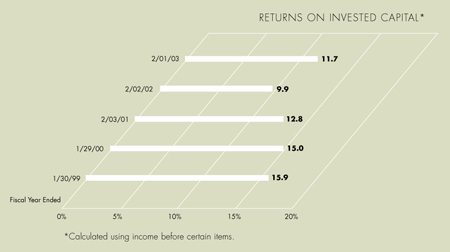
We manage Saks Incorporated and report the results of the Company in two business segments, Saks Department Store Group (SDSG) and Saks Fifth Avenue Enterprises (SFAE). SDSG’s 2002 operating income declined from the 2001 level by 12% to $197 million. Comparable store sales decreased 1.6%. The entire decline in operating income occurred in the fourth quarter of the year when holiday selling did not materialize at planned levels. While these results were disappointing, SDSG did execute a number of important strategic merchandising and service initiatives in 2002 to ensure that our SDSG stores are indeed “the best place to shop in your hometown.” We will update you on a number of these initiatives later in this report. Consistent with our focus on productivity and efficiency, we consolidated the home office of our Younkers department store division into our Carson Pirie Scott Milwaukee headquarters at the end of the fiscal year. Beginning in 2003, this action will save approximately $12 million of pre-tax expense annually. | | 
|
| |
| |
4

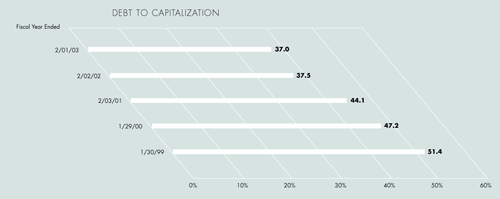
| | LE T T E R T O O U R S H A R E H O L D E R S Intent. On Strategy. A STRONGER BALANCE SHEET At SFAE, 2002 operating income climbed by nearly $125 million to $101.5 million from the depressed post–September 11th levels of 2001. This occurred through a substantial improvement in merchandise margins resulting from disciplined inventory control and lower operating expenses. SFAE made strategic advancements in merchandising, customer service, store operations, and marketing strategies in 2002, all designed to deliver to our customers “the most inviting luxury shopping experience.” Details are outlined later in this report as well. We made strategic investments and achieved important objectives during the year which will position Saks Incorporated for long-term growth. In 2002, we: • Strengthened our balance sheet. During 2002, we lowered our total debt to $1.33 billion in spite of the difficult external environment. Over the past two years, we have reduced debt by nearly $500 million and our year-end debt-to-capitalization ratio to 37%. We ended the year with more than $200 million in cash and no outstanding debt on our $700 million revolving credit facility. Through careful management, we were able to finish the year with comparable store inventories essentially unchanged from prior year levels. |
| |
| |
5
L E T T E R T O O U R S H A R E H O L D E R S
Intent. On Strategy.

| | SAKS FIFTH AVENUE LAS VEGAS | | 
|
| | • We further enhanced our store base. During the year, we opened four new stores and four replacement stores while closing four underproductive units. Our store base is in excellent condition. We improved productivity and reduced costs. • We reduced Selling, General, and Administrative SG&A expenses by $58 million in 2002 through the integration of our Saks Direct business and diligent expense management, in spite of an environment of rising health care and insurance costs. • We invested in strategic systems improvements. We completed the installation of common merchandising systems, web-enablement tools, and logistics systems, all designed to improve productivity. |
| | ENHANCED STORE BASE | | 
|
| | |
6

| | L E T T E R T O O U R S H A R E H O L D E R S Intent. On Strategy. |
| | | During the 2002 calendar year, our stock price increased by 20% reflecting the quality of our assets and improved operating results. Subsequent to calendar year-end, the share price has fallen substantially, along with those of many other general merchandise retailers, as our outlook for 2003 is very cautious given the volatility of the financial markets, higher oil prices, general economic weakness, and geopolitical concerns. We have built our short-term business plans to reflect this difficult environment and will continue with a conservative operating bias until we see more robust general conditions. While managing very carefully in the short-term, we will continue to make the strategic investments and operating transformations necessary to respond to the longer-term opportunities in this business. We will continue to be innovative in our product offerings and service strategies while remaining steadfastly focused on delivering within SDSG on our promise to be “the best place to shop in your hometown” and at SFAE to deliver on the promise of being “the most inviting luxury shopping experience.” We intend to do so while generating free cash flow and continued improvement in returns on invested capital. We welcome any suggestions you might have to help us to do so. Thank you for your interest and your investment. |
|
| | | 
| | | | 
|
| | | R. Brad Martin | | | | Stephen I. Sadove |
| | | Chairman and Chief Executive Officer | | Vice Chairman |
| | | | | |
| | | | | |
| | | | | |
|
STEADFASTLY FOCUSED |
7

L E T T E R T O O U R S H A R E H O L D E R S
Intent. On Strategy.
SAKS DEPARTMENT STORE GROUP
SDSG operates 241 department stores in 24 states with 26.5 million square feet under the nameplates of Parisian, Proffitt’s, McRae’s, Younkers, Herberger’s, Carson Pirie Scott, Bergner’s, and Boston Store. We are the “hometown” store with the number one or number two department store market share in approximately 90% of our trade areas. We are delivering on our promise to be “the best place to shop in your hometown” through the execution of our merchandising and service strategies.
Our merchandising strategy is focused on franchise businesses, key items, and product differentiation.
| | • | | Our franchise businesses—cosmetics, women’s shoes, women’s sportswear, women’s special sizes, social occasion dressing, and gifts—are clearly becoming “top of mind” when our customers shop. These categories generated comparable store sales increases in 2002 and comprised one-third of our department store revenues. |
| | • | | Our key item strategy is delivered with authoritative presentations of “must-have” selections in meaningful quantities on our sales floor, supported by compelling fixturing and signing. Revenues from key items exceeded 13% of total sales in 2002, up from 11% in 2001. |
THE BEST PLACE TO SHOP IN YOUR HOMETOWN
9
L E T T E R T O O U R S H A R E H O L D E R S
Intent. On Strategy.
JANE SEYMOUR HOME PRODUCTS 
RUFF HEWN WOMEN’S APPAREL
| | • We progressed in product differentiation, increasing our sales from differentiated products (including private brands) to over 23% of sales in 2002 from 17% in 2001. Our existing twelve proprietary brands, including Relativity in women’s, Consensus in men’s, and LivingQuarters in home, continue to gain momentum. Our exclusive Laura Ashley private brand women’s apparel merchandise debuted in July 2002, and we acquired the exclusive license for Ruff Hewn men’s and women’s apparel and Jane Seymour home products and children’s apparel during the year. These unique offerings will be introduced into SDSG stores in the second half of 2003. Consistent with this strategic direction of differentiation, we announced our planned partnership with FAO, Inc. to add FAO Schwarz, The Right Start, and/or Zany Brainy Kids boutiques in the majority of our department stores beginning in the second half of 2003. These brands are synonymous with high-quality toys and educational and developmental products for children, and this merchandise will be an attractive category expansion for our stores. Additionally, we anticipate the placement of seasonal Zany Brainy Kids and FAO Express shops in most SDSG stores for the 2003 holidays. | | 
|
FAO SCHWARZ BOUTIQUES 
| | 
| |
| | | | |
FOCUSED MERCHANDISING AND SERVICE STRATEGIES | | |
10
L E T T E R T O O U R S H A R E H O L D E R S
Intent. On Strategy.

| | We continued to improve the shopping experience for our customers and in 2002 implemented various innovative service features in our stores, including: • High-visibility directional signing in all SDSG stores. • A “Wrap-it Express” program in all stores where customers can leave their packages and receive a specific time their gifts will be wrapped and ready, allowing customers to continue shopping. In select stores, customers are notified by a personal pager that their packages are wrapped and ready. • “Comfort zones” and “living room” areas in over 60 stores. • Headsets in the high-traffic shoe departments of over 50 stores, allowing sales associates to remain on the selling floor while stockroom attendants deliver requested shoes to the floor. • A myriad of other features in key stores ranging from valet parking to personal shoppers to fitting room technology. As we enter 2003, we will: • Continue to strengthen our franchise businesses, expand key items to over 14% of revenues, and increase differentiated product to over 26% of sales. • Enhance the customers’ shopping experience through the implementation of in-store service initiatives to additional stores and improved training programs. • Demonstrate our local focus through more “hometown” marketing initiatives and an increased emphasis on customer relationship management as a sustainable competitive advantage. | | 
SDSG COMFORT ZONES |
LOCAL FOCUS AND “HOMETOWN” MARKETING |
11

L E T T E R T O O U R S H A R E H O L D E R S
Intent. On Strategy.
SAKS FIFTH AVENUE ENTERPRISES
SFAE operates 60 Saks Fifth Avenue luxury department stores in 24 states with 6.3 million square feet of space, and 53 Saks Off 5th stores in 23 states with 1.4 million square feet.
Saks Fifth Avenue is the most powerful name in luxury retailing, and as an emporium for world-class luxury brands, we are an authority on “style.” The mission of Saks Fifth Avenue is to be “the most inviting luxury shopping experience.” We provide our customers “inviting luxury” with differentiated merchandise and special service strategies.
In merchandising, we have identified certain focus categories including contemporary women’s sportswear, “Gold Range” women’s apparel, fine jewelry, footwear, and handbags. These businesses generated mid-single digit comparable store sales growth in 2002, resulting from our differentiated luxury assortments and marketing efforts. Our renovated New York flagship store clearly reflects our commitment to these growth businesses.
SAKS FIFTH AVENUE
NEW YORK CITY

THE MOST INVITING LUXURY SHOPPING EXPERIENCE
13
L E T T E R T O O U R S H A R E H O L D E R S
Intent. On Strategy.

SAKS.COM ON-LINE SHOPPING 
ONE-ON-ONE BRIDAL REGISTRY 
SFA COMFORT ZONE SEATING CORPORTATE GIFT CATALOG
| | We enhanced our marketing and improved the customer experience in 2002. Customer satisfaction continually improved throughout the year as evidenced by the scores from our independent monitoring service. In 2002, we: • IntegratedSaks Direct into the Saks Fifth Avenue organization, resulting in a more consistent customer experience across multiple channels. • Strengthenedhiring and training procedures to ensure that customers are offered the “inviting luxury” experience they expect. • Introducedour one-on-one bridal registry in the New York flagship store. • Introducedvarious distinctive service initiatives, including concierge services, “one-on-one” walk-in personal shopping, and multiple seating/comfort zones in our new Saks Fifth Avenue store in Las Vegas. This store serves as the prototype for our innovative service initiatives. • Launchedour “Make It Your Own” marketing campaign, designed to reinforce our positioning of “inviting luxury.” • Launchedour Saks Fifth Avenue corporate gift program and catalog. • Strengthenedour strategic affiliations with world-class partners including Mercedes-Benz, Ritz-Carlton, Continental Airlines, and American Express. 
IMPROVED CUSTOMER EXPERIENCE |
14
| | | L E T T E R T O O U R S H A R E H O L D E R S Intent. On Strategy. |

| | In 2003, we will: • Continueto increase the sales penetration of our focus businesses through our differentiated merchandise offerings supported by service, store design, visual elements, and marketing. We also will continue to add unique merchandise from additional exclusive vendors. • Furtherenhance the store experience by implementing key service initiatives found in the Las Vegas prototype store into other stores, incorporating our bridal registry into additional stores, launching our nationwide on-line Saks Fifth Avenue gift registry, and adding new in-store product categories to create excitement. |
| | | | |
| | | | 
|
15

| | L E T T E R T O O U R S H A R E H O L D E R S Intent. On Strategy. |
| | In 2003, we will heighten our emphasis on customer relationship management (CRM), which will foster engagement, repeat visits, and loyalty through marketing and clienteling efforts. Through sophisticated segmentation of our customer database, we are able to create relevant and motivating marketing and communications strategies to discrete groups of similar customers. Clienteling ensures our associates are the “personal connection” between our customers and SFA. Our CRM strategies provide sales associates with training to better understand and identify different customer segments and their potential needs, as well as with tools and incentives at point-of-service personalized to specific customers. In 2003, we will also continue to strengthen our SaksFirst loyalty program and our strategic third-party alliances and to develop our corporate gift business. The Saks Off 5th business has been repositioned to ensure that we deliver on our commitment to offer a selection of Saks Fifth Avenue products for a “gem of a deal.” By upgrading the merchandise mix to a higher designer penetration and prominently displaying and signing merchandise direct from Saks Fifth Avenue, the operating contribution of this business substantially improved during 2002. In 2003, we will continue to upgrade the merchandise mix, improve customer service, and execute our key item gift strategy. |
| | HEIGHTENED EMPHASIS ON CRM |
16

| | L E T T E R T O O U R S H A R E H O L D E R S Intent. On Strategy. |
| | LOOKING AHEAD Our real estate strategy remains focused on entering certain strategic markets and enhancing our position in existing core markets. Consistent with that focus, we plan to open six new units in 2003, totaling nearly 650,000 square feet. We will add a Bergner’s replacement store in Peoria, Illinois; a second Younkers unit in the Lansing, Michigan market; an additional Younkers store in the metropolitan Green Bay, Wisconsin area; Saks Fifth Avenue stores in Richmond, Virginia and Indianapolis, Indiana; and an Off 5th store in St. Louis, Missouri. We are continuing to enhance merchandising systems, such as size allocation by store and markdown optimization, and service technology including customer relationship management and improved point-of-service clienteling. We believe these advanced tools will contribute to improved sales and merchandise margins in the future. We are confident that we have the merchandising and service strategies in place at both SDSG and SFAE to further differentiate from our competitors, generate increased customer traffic, create a more exciting and appealing shopping experience, and enhance store productivity. |
| | This letter and the SDSG and SFAE information on pages 3 through 17 of this report contain “forward-looking” information within the definition of the Federal securities laws. For a discussion of risk factors, please refer to “Forward-Looking Information” contained in Management’s Discussion and Analysis appearing on page 35 of this annual report. |
17
SAKS INCORPORATED & SUBSIDIARIES
FIVE-YEAR FINANCIAL SUMMARY
(In Thousands, except per share amounts) | | February 1, 2003 | | | February 2, 2002 | | | February 3, 2001 | | | January 29, 2000 | | | January 30, 1999 | |
| | | | | |
|
CONSOLIDATED INCOME STATEMENT DATA: | | | | | | | | | | | | | | | | | | | | |
Net sales | | $ | 5,911,122 | | | $ | 6,070,568 | | | $ | 6,581,236 | | | $ | 6,434,167 | | | $ | 5,963,813 | |
|
Cost of sales (excluding depreciation and amortization) | | | 3,739,247 | | | | 3,960,129 | | | | 4,211,707 | | | | 4,028,779 | | | | 3,794,340 | |
|
Gross margin | | | 2,171,875 | | | | 2,110,439 | | | | 2,369,529 | | | | 2,405,388 | | | | 2,169,473 | |
Selling, general and administrative expenses | | | 1,331,137 | | | | 1,389,287 | | | | 1,433,357 | | | | 1,359,386 | | | | 1,332,275 | |
Other operating expenses | | | 578,111 | | | | 582,623 | | | | 580,853 | | | | 535,670 | | | | 498,733 | |
Losses from long-lived assets | | | 19,547 | | | | 32,621 | | | | 73,572 | | | | 12,547 | | | | 61,785 | |
Integration and year 2000 charges | | | 9,981 | | | | 1,539 | | | | 19,886 | | | | 41,577 | | | | 121,744 | |
|
OPERATING INCOME | | | 233,099 | | | | 104,369 | | | | 261,861 | | | | 456,208 | | | | 154,936 | |
Interest expense | | | (124,052 | ) | | | (131,039 | ) | | | (149,995 | ) | | | (138,968 | ) | | | (110,971 | ) |
Gain (loss) on extinguishment of debt | | | 709 | | | | 26,110 | | | | — | | | | (15,182 | ) | | | (42,369 | ) |
Other income (expense), net | | | 229 | | | | 1,083 | | | | 3,733 | | | | 140 | | | | 22,201 | |
|
INCOME BEFORE INCOME TAXES AND CUMULATIVE EFFECT OF ACCOUNTING CHANGE | | | 109,985 | | | | 523 | | | | 115,599 | | | | 302,198 | | | | 23,797 | |
Provision for income taxes | | | 40,148 | | | | 201 | | | | 40,383 | | | | 112,555 | | | | 24,693 | |
|
INCOME BEFORE CUMULATIVE EFFECT OF ACCOUNTING CHANGE | | | 69,837 | | | | 322 | | | | 75,216 | | | | 189,643 | | | | (896 | ) |
Cumulative effect of a change in accounting principle, net of taxes | | | (45,593 | ) | | | — | | | | — | | | | — | | | | — | |
| | | | | |
|
NET INCOME | | $ | 24,244 | | | $ | 322 | | | $ | 75,216 | | | $ | 189,643 | | | $ | (896 | ) |
|
Basic earnings per common share: | | | | | | | | | | | | | | | | | | | | |
Before cumulative effect of accounting change | | $ | 0.49 | | | $ | 0.00 | | | $ | 0.53 | | | $ | 1.32 | | | $ | (0.01 | ) |
After cumulative effect of accounting change | | $ | 0.17 | | | $ | 0.00 | | | $ | 0.53 | | | $ | 1.32 | | | $ | (0.01 | ) |
Diluted earnings per common share: | | | | | | | | | | | | | | | | | | | | |
Before cumulative effect of accounting change | | $ | 0.48 | | | $ | 0.00 | | | $ | 0.53 | | | $ | 1.30 | | | $ | (0.01 | ) |
After cumulative effect of accounting change | | $ | 0.17 | | | $ | 0.00 | | | $ | 0.53 | | | $ | 1.30 | | | $ | (0.01 | ) |
Weighted average common shares: | | | | | | | | | | | | | | | | | | | | |
Basic | | | 142,750 | | | | 141,988 | | | | 141,656 | | | | 144,174 | | | | 142,856 | |
Diluted | | | 146,707 | | | | 144,498 | | | | 142,718 | | | | 146,056 | | | | 146,383 | |
CONSOLIDATED BALANCE SHEET DATA: | | | | | | | | | | | | | | | | | | | | |
Working capital | | $ | 1,123,833 | | | $ | 983,151 | | | $ | 1,085,956 | | | $ | 1,110,976 | | | $ | 887,875 | |
Total assets | | $ | 4,579,356 | | | $ | 4,595,521 | | | $ | 5,050,611 | | | $ | 5,098,952 | | | $ | 5,188,981 | |
Long-term debt, less current portion | | $ | 1,327,381 | | | $ | 1,356,580 | | | $ | 1,801,657 | | | $ | 1,966,802 | | | $ | 2,114,647 | |
Shareholders’ equity | | $ | 2,267,272 | | | $ | 2,271,437 | | | $ | 2,293,829 | | | $ | 2,208,343 | | | $ | 2,007,575 | |
18
M A N A G E M E N T’ S D I S C U S S I O N A N D A N A L Y S I S
Saks Incorporated (hereinafter the “Company”) is a national retailer currently operating, through subsidiaries, 354 traditional and luxury department stores. The Company operates the Saks Department Store Group (“SDSG”), which consists of 241 traditional department stores under the names of Parisian, Proffitt’s, McRae’s, Younkers, Herberger’s, Carson Pirie Scott, Bergner’s and Boston Store. The Company also operates Saks Fifth Avenue Enterprises (“SFAE”), which consists of 60 luxury Saks Fifth Avenue stores and 53 Saks Off 5th stores.
Since 1994, the Company has experienced significant growth principally through a series of acquisitions, the construction of new units and through the acquisition of select store locations.
Name | | Headquarters | | Number of Stores Acquired | | Locations | | Date Acquired | | Accounting Treatment |
|
McRae’s | | Jackson, MS | | 31 | | Southeast | | March 31, 1994 | | Purchase |
Younkers | | Des Moines, IA | | 50 | | Midwest | | February 3, 1996 | | Pooling |
Parisian | | Birmingham, AL | | 40 | | Southeast/Midwest | | October 11, 1996 | | Purchase |
Herberger’s | | St. Cloud, MN | | 37 | | Midwest | | February 1, 1997 | | Pooling |
Carson Pirie Scott (“Carson’s”) | | Milwaukee, WI | | 55 | | Midwest | | January 31, 1998 | | Pooling |
Saks Fifth Avenue | | New York, NY | | 95 | | National | | September 17, 1998 | | Pooling |
The following table sets forth, for the periods indicated, selected items from the Company’s consolidated statements of income, expressed as percentages of net sales (numbers may not total due to rounding):
| | | Year Ended | |
|
| | | February 1, 2003 (“2002”) | | | February 2, 2002 (“2001”) | | | February 3, 2001 (“2000”) | |
|
Net sales | | 100.0 | % | | 100.0 | % | | 100.0 | % |
Cost of sales (excluding depreciation and amortization) | | 63.3 | | | 65.2 | | | 64.0 | |
|
Gross margin | | 36.7 | | | 34.8 | | | 36.0 | |
Selling, general and administrative expenses | | 22.5 | | | 22.9 | | | 21.8 | |
Other operating expenses | | 9.8 | | | 9.6 | | | 8.8 | |
Losses from long-lived assets | | 0.3 | | | 0.5 | | | 1.1 | |
Integration charges | | 0.2 | | | 0.0 | | | 0.3 | |
|
Operating income | | 3.9 | | | 1.7 | | | 4.0 | |
Interest expense | | (2.1 | ) | | (2.2 | ) | | (2.3 | ) |
Gain on extinguishment of debt | | 0.0 | | | 0.4 | | | 0.0 | |
Other income expense, net | | 0.0 | | | 0.0 | | | 0.1 | |
|
Income before income taxes and cumulative effect of accounting change | | 1.9 | | | 0.0 | | | 1.8 | |
Provision for income taxes | | 0.7 | | | 0.0 | | | 0.6 | |
|
Income before cumulative effect of accounting change | | 1.2 | | | 0.0 | | | 1.1 | |
Cumulative effect of a change in accounting principle, net of taxes | | (0.8 | ) | | 0.0 | | | 0.0 | |
|
Net income | | 0.4 | % | | 0.0 | % | | 1.1 | % |
|
19
M A N A G E M E N T’ S D I S C U S S I O N A N D A N A L Y S I S
FISCAL YEAR ENDED FEBRUARY 1, 2003 COMPARED TO FISCAL YEAR ENDED FEBRUARY 2, 2002
MANAGEMENT’S DISCUSSION OF OPERATIONS
Operating income increased to $233.1 million in 2002 from $104.4 million in 2001. The increase in operating income of $128.7 million was largely attributable to an increase in SFAE’s operating income of $124.2 million, the absence of charges associated with the reorganization of Saks Direct (SFAE’s catalog and e-commerce operations) of $35.1 million in 2001 and a decrease of $9.0 million in charges associated with store closings and dispositions. These improvements were partially offset by a decrease in SDSG’s operating income of $25.7 million and $13.9 million of charges associated with the consolidation of the Younkers home office into Carson’s.
The decrease in operating income at SDSG was primarily due to a 1.6% decrease in comparable store sales, which contributed to a $17.3 million reduction in gross margin. Increased insurance and retirement expenses of $10.6 million and increased store selling payroll of $9.3 million were partially offset by decreased amortization expense of $10.2 million. Although comparable store sales at SFAE declined 1.1%, significantly lower levels of merchandise allowed for a significant reduction in markdowns and contributed to an $82.5 million improvement in gross margin. SFAE’s store operating expenses were reduced by $18.3 million, and the reorganization of Saks Direct contributed to a year-over-year improvement of approximately $30 million in operating contribution.
The 2002 charges associated with the Younkers consolidation, store closings and impairments and other expense reduction efforts aggregated $33.1 million. Charges associated with the consolidation of Younkers totaled $13.9 million, which consisted primarily of property write-downs and employee severance costs. An additional $15.6 million of property write-downs were associated with the impairment and closure of underproductive stores, and $3.6 million of other charges related primarily to other expense reduction efforts.
The Company believes that current economic conditions and geopolitical risks create an environment of uncertainty making the forecasting of near-term operating results particularly difficult. However, based on prevailing trends and conditions, management believes that there may be a decline in 2003 comparable store sales in the low-single digits, accompanied by continued improvements in the gross margin rate driven by enhanced merchandise mix, inventory control and benefits related to the Younkers consolidation.
NET SALES
Net sales decreased $159.4 million or 2.6% in 2002 over 2001. Approximately one-half of the decrease was due to a consolidated comparable store sales decrease of 1.4%, consisting of a 1.6% decrease at SDSG and a 1.1% decrease at SFAE. The decline in comparable store sales was primarily attributable to a poor fourth quarter holiday selling season as a result of continued geopolitical and economic uncertainty. In addition to the comparable store sales decrease, year-over-year sales were approximately $58 million less due to the sale or closure of underproductive stores and approximately $80 million less due to the cessation of SFAE’s catalog operations. These decreases were partially offset by sales generated from new store additions of $62.5 million.
GROSS MARGIN
Gross margin increased $61.4 million or 2.9% in 2002 over 2001. Approximately $65 million of the improvement was in comparable stores and was the result of fewer year-over-year markdowns, particularly at SFAE. Approximately $23 million of margin contribution related to new stores. These increases were partially offset by the loss of approximately $10 million in margin from the reorganization of the Saks Direct operations and the loss of $16.5 million in margin from the sale or closure of stores.
Gross margin as a percentage of net sales was 36.7% in 2002 compared to 34.8% in 2001. The increase in gross margin percent in 2002 was attributable to the decline in year-over-year markdowns taken to clear inventory, principally at SFAE. The 2001 markdowns were due to the weakness in the luxury sector, particularly following September 11th, in addition to markdowns associated with the reorganization of Saks Direct and store closings. Amounts received from vendors as partial reimbursement for excessive markdowns in 2002 were proportionate to the amounts realized in 2001 and did not materially alter the year-over-year improvement in gross margin as a percentage of net sales.
20
M A N A G E M E N T’ S D I S C U S S I O N A N D A N A L Y S I S
SELLING, GENERAL AND ADMINISTRATIVE EXPENSES
Selling, general and administrative expenses (“SG&A”) decreased $58.2 million or 4.2% in 2002 over 2001, due primarily to a reduction of approximately $40 million in operating expenses related to the reorganization of the Saks Direct business. Additionally, comparable store expense reductions of approximately $2 million were achieved in spite of an $11.9 million increase in insurance and retirement expenses. There was also a year-over-year decline of $12.7 million in severance costs and other certain items, principally related to fewer reorganization and other expense reduction initiatives. Amounts received from vendors in conjunction with compensation programs and cooperative advertising were consistent with the related gross compensation and cooperative advertising expenditures and therefore had no impact on SG&A expense, in dollars or as a percentage of net sales. Amounts received from vendors related to compensation programs were $76.1 million and $67.7 million in 2002 and 2001, respectively. Amounts received from vendors related to cooperative advertising programs were $78.4 million and $85.4 million in 2002 and 2001, respectively.
SG&A as a percentage of net sales decreased to 22.5% in 2002 from 22.9% in 2001. The rate decrease reflected the effect of targeted expense reduction initiatives in excess of the decline in sales.
OTHER OPERATING EXPENSES
Other operating expenses in 2002 decreased slightly from 2001 as the discontinuation of $12.7 million of goodwill amortization was partially offset by $8.2 million of expense increases, principally related to increased depreciation and rental expenses associated with the remodel and expansion of comparable stores and infrastructure capital spending.
Other operating expenses as a percentage of net sales were 9.8% in 2002 compared to 9.6% in 2001. The increase was primarily due to (1) the inability to leverage increased depreciation and rental expenses during a period of comparable store sales decline and (2) the inability to reduce non-store rent and depreciation commensurate with the loss of sales associated with disposed stores and the discontinued catalog operations.
INTEGRATION CHARGES
The Company incurred certain costs to integrate and combine its operations to further enhance the efficiency of back office functions and processes. These charges are primarily comprised of severance benefits, relocation and systems conversion costs. The 2002 charges of $10.0 million related to the consolidation of Younkers into Carson’s. The 2001 charges of $1.5 million related to costs incurred to complete the consolidation of three SDSG southern distribution centers.
LOSSES FROM LONG-LIVED ASSETS
Losses from long-lived assets in 2002 of $19.5 million were comprised of the impairment or closure of underproductive stores totaling $15.6 million and $3.9 million of property write-downs associated with the Younkers consolidation. Losses from long-lived assets of $32.6 million in 2001 consisted of the write-off of goodwill and property and equipment related to Saks Direct of $22.6 million and the impairment or closure of underproductive stores of $10.0 million.
INTEREST EXPENSE
Interest expense declined to $124.1 million in 2002 from $131.0 million in 2001 and as a percentage of net sales decreased to 2.1% in 2002 from 2.2% in 2001. The decrease was due principally to lower average borrowing rates on floating rate debt and lower average debt levels.
21
M A N A G E M E N T’ S D I S C U S S I O N A N D A N A L Y S I S
GAIN ON EXTINGUISHMENT OF DEBT
The gain on extinguishment of debt in 2002 related primarily to the recognition of gains related to the prior termination of a related interest rate swap agreement that resulted from the repurchase of senior notes. The 2001 gain was primarily the result of the repurchase of senior notes at a discount to the carrying value.
INCOME TAXES
For 2002 and 2001, the effective income tax rate differs from the federal statutory tax rate due to state income taxes and non-deductible goodwill amortization. The decline in the effective income tax rate was attributable to the discontinuation of non-deductible goodwill amortization and the favorable conclusion to a number of state tax examinations, partially offset by increasing the valuation allowance against deferred income tax assets. Management anticipates that income tax rates in future years will approximate the 2002 rate of 36.5%.
CUMULATIVE EFFECT OF A CHANGE IN ACCOUNTING PRINCIPLE
The cumulative effect of a change in accounting principle is the result of the 2002 adoption of SFAS No. 142, “Goodwill and Other Intangible Assets,” in which the Company recorded a non-cash charge of $45.6 million for the write-off of non-deductible SFAE goodwill.
NET INCOME
Net income in 2002 improved to $24.2 million from $0.3 million in 2001 primarily due to the improvement in operating income and the decline in interest expense, partially offset by lower gains on debt extinguishment and the 2002 cumulative effect of accounting change.
22
M A N A G E M E N T’ S D I S C U S S I O N A N D A N A L Y S I S
FISCAL YEAR ENDED FEBRUARY 2, 2002 COMPARED TO FISCAL YEAR ENDED FEBRUARY 3, 2001
MANAGEMENT’S DISCUSSION OF OPERATIONS
Operating income decreased to $104.4 million in 2001 from $261.9 million in 2000. The decrease in operating income of $157.5 million was attributable to a decrease in SDSG’s operating income of $54.5 million, a decrease in SFAE’s operating income of $138.5 million and $35.1 million in charges associated with the reorganization of Saks Direct, partially offset by a decrease in integration costs of $18.3 million and a decrease in charges from the impairment or disposition of stores totaling $52.8 million.
The decrease in operating income at SDSG was due to a 2.1% decrease in comparable store sales, which contributed to an $11.8 million reduction in gross margin, and the effect of the sale or closure of underproductive stores totaling $16.4 million. The decrease in operating income at SFAE resulted principally from a 7.8% decrease in comparable store sales, which contributed significantly to a $126.6 million reduction in gross margin. During 2001, both segments took aggressive actions to control operating expenses; however, these actions only partially offset the effect of the comparable store sales decline. Fiscal year 2001 included 52 weeks while fiscal year 2000 included 53 weeks, which is consistent with the retail calendar. The year-over-year effect of the incremental week on operating income was minimal.
The 2001 charges associated with the reorganization of Saks Direct, several store closings, the impairment of several stores and other expense reduction efforts aggregated $64.1 million. Charges associated with the reorganization of the Saks Direct business totaling $35.1 million consisted of a write-down of goodwill, property and equipment and inventory in addition to employee severance costs. Charges associated with store closings and store impairments of $19.9 million were lower in 2001 principally due to charges of $50.9 million in 2000 related to nine SDSG stores sold to the May Department Stores Company. Charges associated with other reorganization and expense reduction efforts of $9.2 million consisted principally of employee severance costs.
NET SALES
Net sales decreased 7.8% in 2001 over 2000 primarily due to a comparable store sales decrease of 4.5%, consisting of a 2.1% decrease at SDSG and a 7.8% decrease at SFAE. The decline in comparable store sales was primarily attributable to the weakness in the luxury goods sector, particularly following the events of September 11th, and the effects of general recessionary economic conditions. Additionally, year-over-year sales were $194.5 million less due to the sale or closure of underproductive stores and $83.8 million less due to the sales from the 53rd week in 2000, partially offset by sales generated from new store additions of $64.5 million.
GROSS MARGIN
Gross margin decreased $259.1 million to $2,110.4 million in 2001. A decrease of $170.2 million was attributable to the negative comparable store sales and related markdowns, the effect of the sale or closure of underproductive stores of $77.3 million, and the 53rd week in 2000, partially offset by new store additions of $20.0 million.
Gross margin as a percentage of net sales was 34.8% in 2001 compared to 36.0% in 2000. The decrease in gross margin percent in 2001 was primarily attributable to markdowns taken to clear inventory, principally at SFAE. These markdowns were principally due to the weakness in the luxury sector, particularly following the events of September 11th, and included markdowns associated with the reorganization of Saks Direct and store closings of ($13.7 million). Amounts received from vendors as partial reimbursement for excessive markdowns were proportionate to the amount of excessive markdowns realized in 2001 and 2000 and did not materially alter the year-over-year decline in gross margin as a percentage of net sales.
23
M A N A G E M E N T’ S D I S C U S S I O N A N D A N A L Y S I S
SELLING, GENERAL AND ADMINISTRATIVE EXPENSES
SG&A decreased $44.1 million to $1,389.3 million in 2001 due to the absence of expenses associated with the sale or closure of underproductive stores totaling $44.5 million, decreased operating expenses of $24.7 million related to Saks Direct and the effect of the 53rd week in 2000. These decreases were partially offset by an increase in expenses associated with new store additions of $14.3 million and $16.3 million in other items, primarily related to the reorganization of Saks Direct and other expense reduction initiatives. Comparable store SG&A expenses increased $7.0 million, which is relatively constant as a percent of sales (0.1%). Reductions in media spending were offset by increased maintenance, insurance and other employee costs. Amounts received from vendors in conjunction with compensation programs and cooperative advertising were consistent with the related gross compensation and cooperative advertising expenditures and therefore had no impact on SG&A expense or SG&A expense as a percentage of net sales. Amounts received from vendors related to compensation programs were $67.7 million and $56.8 million in 2001 and 2000, respectively. Amounts received from vendors related to cooperative advertising programs were $85.4 million and $101.6 million in 2001 and 2000, respectively.
SG&A as a percentage of net sales increased to 22.9% in 2001 from 21.8% in 2000. The rate increase reflected the inability to reduce operating expenses commensurate with the comparable store sales decline at both SDSG and SFAE.
OTHER OPERATING EXPENSES
Other operating expenses in 2001 were relatively constant with 2000 as increased depreciation and rental expenses associated with the remodel and expansion of comparable stores and increased infrastructure capital (spending principally information technology) of $16.1 million were offset by the decreased depreciation, goodwill amortization and rent associated with disposed stores and reduced property taxes totaling $14.4 million.
Other operating expenses as a percentage of net sales were 9.6% in 2001 compared to 8.8% in 2000. The increase was primarily due to (1) the inability to leverage increased depreciation and rental expenses during a period of comparable store sales decline and (2) the inability to reduce non-store rent and depreciation commensurate with the loss of sales associated with disposed stores.
INTEGRATION CHARGES
The Company incurred certain costs to integrate and combine the operations of previously acquired companies. The 2001 charges of $1.5 million and the 2000 charges of $19.9 million were primarily comprised of severance benefits, relocation and systems conversions related to the consolidation of the McRae’s and Herberger’s operating divisions into Proffitt’s and Carson’s, respectively, and the consolidation of three SDSG southern distribution centers.
LOSSES FROM LONG-LIVED ASSETS
Losses from long-lived assets in 2001 of $32.6 million were comprised of the non-cash write-off of goodwill and property and equipment related to Saks Direct totaling $22.6 million and the impairment or closure of underproductive stores of $10.0 million. Losses from long-lived assets in 2000 of $73.6 million were primarily comprised of the non-cash write-off of goodwill associated with the sale of nine SDSG stores to the May Department Stores Company and, to a lesser extent, impairments on abandoned software and underproductive stores.
INTEREST EXPENSE
Interest expense declined to $131.0 million in 2001 from $150.0 million in 2000 and as a percentage of net sales decreased to 2.2% in 2001 from 2.3% in 2000. The decrease was due principally to lower average borrowing rates on floating rate debt and lower average debt levels.
24
M A N A G E M E N T’ S D I S C U S S I O N A N D A N A L Y S I S
GAIN ON EXTINGUISHMENT OF DEBT
The gain on extinguishment of debt in 2001 related primarily to the repurchase of senior notes at a discount to the carrying value.
INCOME TAXES
For 2001, the effective income tax rate differs from the federal statutory tax rate due to state income taxes and non-deductible goodwill amortization. In 2000, the effective income tax rate differs from the federal statutory tax rate due to state income taxes and non-deductible goodwill amortization, offset by the favorable effect of the disposal of a real estate investment ($4.1 million). The change in year-over-year effective income tax rates was due to the favorable effect of the real estate disposition in 2000.
NET INCOME
Net income in 2001 decreased to $0.3 million from $75.2 million in 2000 primarily due to the decline in operating income, partially offset by lower interest expense and a gain on extinguishment of debt.
LIQUIDITY AND CAPITAL RESOURCES
CASH FLOW
The primary needs for cash are to acquire or construct new stores, renovate and expand existing stores, provide working capital for new and existing stores and service debt. The Company anticipates that cash generated from operating activities, borrowings under its revolving credit agreement and maintaining a proprietary credit card securitization program (until the closing of the transaction with Household Bank (SB), N.A. discussed in “Proprietary Credit Card Receivables Securitization”) will be sufficient to meet its financial commitments and provide opportunities for future growth.
Cash provided by operating activities was $276.3 million in 2002, $374.0 million in 2001 and $485.5 million in 2000. Cash provided by operating activities principally represents income before depreciation and amortization charges and losses from long-lived assets and also includes changes in working capital. The decrease in 2002 from 2001 was primarily due to an increase in invested working capital, resulting from depressed 2001 inventory levels and the use of operating cash to fund pensions. The decrease in 2001 from 2000 was related to a reduction in operating cash flow attributable to the year-over-year earnings decline and was partially offset by a reduction in invested working capital, principally through managing inventory levels down.
Cash provided by used in investing activities was $(139.9) million in 2002, $85.6 million in 2001 and $(248.7) million in 2000. Cash used in investing activities principally consists of construction of new stores and renovation and expansion of existing stores and investments in support areas (e.g. technology, distribution centers, e-business infrastructure). The “net cash provided” in 2001 was largely attributable to $308.0 million of proceeds ($275.5 million after the repurchase of sold receivables) from the sale of nine SDSG stores in early 2001. Additionally, there was a $77.5 million decrease in capital spending from 2001 to 2002. While capital expenditures for distributions centers, e-business and other non-store areas were relatively constant in 2002, the Company significantly decreased the capital expended for new stores, remodels and expansions.
Cash used in financing activities was $(25.9) million in 2002, $(425.1) million in 2001 and $(191.6) million in 2000. The decrease in 2002 from 2001 and the increase in 2001 from 2000 were both attributable primarily to the use of the cash received from the sale of the nine SDSG stores to pay down debt in 2001.
25
M A N A G E M E N T’ S D I S C U S S I O N A N D A N A L Y S I S
CASH BALANCES AND LIQUIDITY
The Company’s primary sources of short-term liquidity are comprised of cash on hand and availability under its $700 million revolving credit facility. At February 1, 2003 and February 2, 2002, the Company maintained cash and cash equivalent balances of $209.6 million and $99.1 million, respectively. These amounts consisted principally of invested cash and approximately $30 million of store operating cash. At February 1, 2003 the Company’s utilization of its capacity under the $700 million revolving credit facility consisted of $106.0 million in unfunded letters of credit leaving unutilized availability under the facility of $594.0 million. The amount of cash on hand and borrowings under the facility are influenced by a number of factors, including sales, retained accounts receivable, inventory levels, vendor terms, the level of capital expenditures, cash requirements related to financing instruments, and the Company’s tax payment obligations, among others.
Another source of liquidity for the Company has been the securitization of proprietary credit card receivables generated by National Bank of the Great Lakes (“NBGL”), the Company’s national credit card bank subsidiary, in the asset-backed securitization market. At February 1, 2003, the Company had $1,080.2 million of receivables sold, $434.3 million of which represents a fixed amount series due to mature in 2006, and $645.9 million of which represents outstanding amounts under committed bank-sponsored conduit programs maturing in April 2003. The bank-sponsored conduit programs provide for funding of up to $865 million of receivables, which can be amortized with customer payments at any time. The Company has announced that it and NBGL will sell the Company’s proprietary credit card program to Household Bank (SB), N.A., which will eliminate the need for the securitization facility. If the consummation of that transaction is delayed or does not occur, the Company will continue to utilize the securitization facility to extend the funding under its bank-sponsored conduits or sell new asset-backed instruments, which is discussed in the following capital structure discussion under the heading “Proprietary Credit Cards Receivable Securitization.”
CAPITAL STRUCTURE
The Company’s capital and financing structure is comprised of a revolving credit agreement, senior unsecured notes, the sale of beneficial interests in a trust that owns NBGL’s proprietary credit card receivables, capital and operating leases and real estate mortgage financing.
At February 1, 2003, the Company maintained a $700 million senior revolving credit facility maturing in 2006, which is secured by eligible inventory, the capital stock of all material subsidiaries, and certain intangibles. Borrowings are limited to a prescribed percentage of eligible inventories. There are no debt ratings-based provisions in the facility. The facility includes a fixed-charge coverage ratio requirement of 1:1 that the Company is subject to only if availability under the facility becomes less than $100 million. The facility contains default provisions that are typical for this type of financing, including a provision that would trigger a default of the facility if a default were to occur in another instrument resulting in the acceleration of principal of more than $20 million in that other instrument.
The Company had $1,185.8 million of unsecured senior notes outstanding as of February 1, 2003 comprised of six separate series having maturities ranging from 2004 to 2019. The terms of each senior note call for all principal to be repaid at maturity. The senior notes have substantially identical terms except for the maturity dates and the interest coupons payable to investors. Each senior note contains limitations on the amount of secured indebtedness the Company may incur. During 2002, the Company used cash from operations to repurchase $24.3 million in senior notes. During 2001, certain of the proceeds from the sale of the nine SDSG store locations in March 2001 were used to repurchase $298.4 million of senior notes. During 2001, the Company also exchanged $141.6 million of cash and $141.6 million of new 9.875% notes due 2011 for $283.1 million of the 2004 notes.
At February 1, 2003 the Company had $135 million in capitalized leases covering various properties and pieces of equipment. The terms of the capitalized leases provide the lessor with a security interest in the asset being leased and require the Company to make periodic lease payments, aggregating between $4 million and $7 million per year.
26
M A N A G E M E N T’ S D I S C U S S I O N A N D A N A L Y S I S
The contractual cash obligations at February 1, 2003 associated with this capital and financing structure are illustrated in the following table:
| | | Payments Due by Period (excluding interest) |
|
| | | 2003 | | 2004 | | 2005 | | 2006 | | 2007 | | After 2007 | | Total |
|
| | | (Dollars in Millions) |
Senior unsecured notes | | $ | — | | $ | 143 | | $ | — | | $ | — | | $ | — | | $ | 1,043 | | $ | 1,186 |
Revolving credit agreement | | | — | | | — | | | — | | | — | | | — | | | — | | | — |
Capital leases | | | 4 | | | 5 | | | 5 | | | 5 | | | 7 | | | 113 | | | 139 |
Operating leases | | | 140 | | | 132 | | | 125 | | | 115 | | | 105 | | | 669 | | | 1,286 |
Real estate mortgages | | | 1 | | | 5 | | | 1 | | | — | | | — | | | — | | | 7 |
Other licensing fees | | | 4 | | | 4 | | | 4 | | | 4 | | | 4 | | | — | | | 20 |
|
Total contractual cash obligations | | $ | 149 | | $ | 289 | | $ | 135 | | $ | 124 | | $ | 116 | | $ | 1,825 | | $ | 2,638 |
|
The Company’s other principal commercial commitments are comprised of the guarantee of $20 million residual value of leased transportation equipment expiring in 2003, pension funding obligations, short-term merchandise purchase commitments, short-term construction commitments, common area maintenance costs and contingent rent payments. Substantially all of the Company’s merchandise purchase commitments are cancelable several weeks prior to a date that precedes the vendor’s scheduled shipment date.
The Company is obligated to fund two cash balance pension plans. At November 1, 2002 (the most recent measurement date), the projected benefit obligation of these plans was $346.4 million, and the fair value of the pension plans’ assets was $195.9 million resulting in an underfunded status of $150.5 million. During January 2003, the Company voluntarily contributed approximately $47 million to the plans to reduce the underfunding and expects no further contributions in 2003. While the Company’s contributions exceed the minimum funding requirements under ERISA and IRS rules and regulations, the significant decrease in the U.S. stock market during recent years contributed substantially to the underfunded status. This increased funding coupled with a recovery in the U.S. stock market should begin to contribute to correcting the funded status of the plans. To the extent the U.S. stock market does not recover or continues to deteriorate, the Company’s cash funding requirements will increase. The Company expects to generate adequate cash flows from operating activities combined with borrowings under its revolving credit agreement in order to meet the pension funding requirements.
PROPRIETARY CREDIT CARDS RECEIVABLE SECURITIZATION
The Company’s proprietary credit cards are issued by NBGL, a wholly owned subsidiary of the Company. Receivables generated from the sale of merchandise on these credit cards are sold by NBGL to another wholly owned subsidiary, Saks Credit Corporation (“SCC”). SCC transfers the receivables to a trust, Saks Credit Card Master Trust (“SCCMT”), which sells to third-party investors, certificates representing an undivided beneficial interest in the pool of receivables held in SCCMT. The certificates have maturity dates and represent an ownership in the cash generated by the credit card receivables. The Company retains an interest in the receivables held in SCCMT, which interest is subordinate to the rights of the third-party investors to the cash flows of the receivables held in SCCMT.
At February 1, 2003, SCCMT held credit card receivables aggregating $1,270.8 million, while certificates of ownership aggregating $1,080.2 million had been sold to third-party investors. Prior to maturity of the certificates, the Company has access to the cash generated by the receivables net of allocations of cash to investors representing the coupon interest rate on their beneficial interests. Upon maturity, the third-party investors are repaid in full with cash collections of payments made by customers, after which the Company will receive all remaining cash to recover its residual ownership interest in the pool of receivables.
27
M A N A G E M E N T’ S D I S C U S S I O N A N D A N A L Y S I S
During 2002, the Company and Household Bank (SB), N.A. (“Household”), an affiliate of Household International, entered into an agreement pursuant to which Household and its affiliates will acquire all of the Company’s proprietary credit card business, consisting of the proprietary credit card accounts owned by NBGL and the Company’s ownership interest in the assets of SCCMT. On March 31, 2003, the transaction was approved by the U.S. Comptroller of the Currency subject to certain conditions. The principal condition is for the Company and NBGL to enter into consent orders that require the Company and NBGL to implement and monitor policies and procedures to ensure compliance with the provisions of the Bank Secrecy Act. It is expected that the transaction will close in April 2003. Any of the parties to the transaction may terminate the agreement if the transaction has not been consummated by August 15, 2003, unless such date is otherwise extended by mutual agreement.
As part of the transaction, for a term of ten years following the closing and pursuant to a program agreement, Household will establish and own proprietary credit card accounts for customers of the Company’s operating subsidiaries. Household will retain the benefits and risks associated with the ownership of the accounts, will receive the finance charge income and incur the bad debts associated with those accounts, and will pay a portion of the finance charge income to the Company. During the ten-year term, pursuant to a servicing agreement, the Company will continue to provide key customer service functions, including new account opening, transaction authorization, billing adjustments and customer inquiries, and will receive compensation from Household for these services.
At the closing of the transaction, the Company will receive an amount in cash equal to the difference of (1) the sum of 100% of the outstanding accounts receivable balances, a premium, the value of investments held in securitization accounts, the value of miscellaneous consumable inventory, minus (2) the outstanding principal balance, together with unpaid accrued interest, of specified certificates issued by SCCMT held by public investors, which certificates will be assumed by Household at the closing. The Company plans to use a portion of the cash received at closing to repay amounts due under the SCCMT certificates and related obligations held at the time of the closing by bank-sponsored commercial paper conduit investors, which certificates and obligations will not be assumed by Household. After deducting these repayment amounts and transaction fees and expenses, the Company expects that its net cash proceeds resulting from the transaction at closing will total approximately $300 million. After allocating the cash proceeds to the sold accounts, the program agreement and the servicing agreement, the Company expects to realize a gain of less than $10 million in 2003. The cash proceeds allocated to the ongoing program agreement and to the servicing agreement will be reflected in income over the lives of the agreements.
The Company anticipates utilizing the approximate $300 million in net proceeds to repurchase common stock, reduce debt and to make strategic investments in its core business. With the exception of depreciation expense, all components of the credit operation have been included in the SG&A line item of the income statement (e.g. finance charge income plus securitization gains, less interest cost on the sold receivables, less bad debt expense and less credit administration expenses). The inclusion of the credit operation has historically generated a positive financial contribution, resulting in a net decrease to the SG&A line item. Upon the consummation of the Household transaction, the components of the credit operation will continue to be included in SG&A (e.g. program compensation plus servicing compensation, less servicing expenses). The credit operations are expected to continue producing a positive financial contribution and net reduction to SG&A, but to a lesser degree than historically. Therefore, SG&A is expected to increase after closing. A portion of this increase will be offset by lower interest expense attributable to the planned debt reduction as well as the contribution of any strategic investments made with the net proceeds from closing.
Prior to the closing of the Household transaction, the Company will continue to obtain funding through its existing accounts receivable securitization program. The certificates held by the bank-sponsored commercial paper conduit investors mature on April 15, 2003. If the Company is not able to close the transaction with Household by April 15, 2003, then the Company believes that it will be able to successfully extend the current funding availability with the bank-sponsored conduits or refinance the maturing certificates in the asset-backed securitization market. However, to extend availability of the conduits, the Company would be required to obtain an extension of the maturity of the SCCMT certificates held by the bank-sponsored commercial paper conduit investors to arrange for, negotiate the terms of and implement the refinancing. Should the Company choose to refinance maturing certificates in the asset-backed securitization market, it is expected that the refinancing would take place
28
M A N A G E M E N T’ S D I S C U S S I O N A N D A N A L Y S I S
over a three to six-month period, during which customer payments on receivables would be utilized to pay down the certificate holders’ ownership interest. During this period, the Company believes that it would have sufficient cash on hand and availability under its revolving credit agreement to fund working capital needs. Any refinancing of these certificates could be subject to higher pricing or more restrictive terms than those carried by the outstanding certificates. The Company believes that it will be successful in meeting the capital needs of the Company by either obtaining the extensions on the bank-sponsored conduits or selling sufficient replacement certificates into the asset-backed securities market.
CAPITAL NEEDS
The Company estimates capital expenditures for 2003 will approximate $200 million, primarily for the construction of new stores opening in 2003, initial construction work on stores expected to open in 2004, store expansions and renovations, enhancements to management information systems and replacement capital expenditures.
The Company anticipates that working capital requirements related to new and existing stores and capital expenditures will be funded through cash provided by operations and the revolving credit agreement. Maximum availability under the revolving credit agreement is $700 million. There is no debt rating trigger. During periods in which availability under the agreement exceeds $100 million, the Company is not subject to financial covenants. If availability under the agreement were to decrease to less than $100 million, the Company would be subject to a minimum fixed charge coverage ratio of 1 to 1. During 2002, weighted average borrowings and letters of credit issued under this credit agreement were $123.5 million. The highest amount of borrowings and letters of credit outstanding under the agreement during 2002 was $235.4 million. The Company expects to generate adequate cash flows from operating activities combined with borrowings under its revolving credit agreement in order to sustain its current levels of operations.
Until the Household transaction is consummated, the most significant requirement for new or replacement financing in 2003 is the accounts receivable securitization program. On April 15, 2003, certificates representing $645.9 million in sold receivables (at February 1, 2003) and availability of up to $865 million under bank sponsored conduits will mature. As discussed under the previous heading, “Proprietary Credit Cards Receivable Securitization,” management believes that the Company’s near-term financial risk is minimal with respect to the maturing certificates as the Company believes that it will be able to successfully extend its existing bank-sponsored conduits or refinance the maturing certificates in the asset-backed securitization market. Factors that affect the Company’s ability to sell new certificates include continued high quality in the receivables portfolio and the capacity of the U.S. securitization markets. The Company does expect that the coupon interest rate of the certificate holders will increase over current levels. However, the Company does not believe the increase will significantly affect cash flows or operating results.
CRITICAL ACCOUNTING POLICIES AND ESTIMATES
The Company’s critical accounting policies and estimates are discussed in the notes to the consolidated financial statements. Certain judgments and estimates utilized in implementing these accounting policies are likewise discussed in each of the notes to the consolidated financial statements. The following discussion aggregates the judgments and uncertainties affecting the application of these policies and estimates and the likelihood that materially different amounts would be reported under varying conditions and assumptions.
Revenue Recognition. Sales and the related gross margin are recorded at the time customers provide a satisfactory form of payment and take ownership of the merchandise or direct its shipment. There are minimal accounting judgments and uncertainties affecting the application of this policy. The Company estimates the amount of goods that will be returned for a refund and reduces sales and gross margin by that amount. However, given that approximately 15% of merchandise sold is later returned and that the vast majority of merchandise returns are affected within a matter of days of the selling transaction, the risk of the Company realizing a materially different amount for sales and gross margin than reported in the consolidated financial statements is minimal.
Cost of Sales and Inventory Valuation. The Company’s inventory is stated at the lower of LIFO cost or market using the retail method. Under the retail method, the valuation of inventories at cost and the resulting gross margins are determined by applying a calculated cost-to-retail ratio to the retail value of inventories. The cost of the inventory reflected on the consolidated balance sheet is decreased with a charge to Cost of Sales contemporaneous with the lowering of the retail value of the
29
M A N A G E M E N T’ S D I S C U S S I O N A N D A N A L Y S I S
inventory on the sales floor through the use of markdowns. Hence, earnings are negatively impacted as the merchandise is being devalued with markdowns prior to the sale of the merchandise. The areas requiring significant management judgment include (1) setting the original retail value for the merchandise held for sale, (2) recognizing merchandise for which the customer’s perception of value has declined and appropriately marking the retail value of the merchandise down to the perceived value and (3) estimating the shrinkage that has occurred through theft during the period between physical inventory counts. These judgments and estimates, coupled with the averaging processes within the retail method can, under certain circumstances, produce varying financial results. Factors that can lead to different financial results include (1) setting original retail values for merchandise held for sale at too high a level, (2) failure to identify a decline in perceived value of inventories and process the appropriate retail value markdowns and (3) overly optimistic or overly conservative shrinkage estimates. The Company believes it has the appropriate merchandise valuation and pricing controls in place to minimize the risk that its inventory values would be materially undervalued or overvalued.
Credit Card Income and Expenses. The carrying value of the Company’s retained interest in credit card receivables requires a substantial amount of management judgment and estimates. At the time credit card receivables are sold to third-party investors through the securitization program, generally accepted accounting principles require that the Company recognize a gain or loss equal to the excess of the estimated fair value of the consideration to be received from the credit card receivables sold over their cost. As the receivables are collected, the estimated gains and losses are reconciled to the actual gains and losses. Given that the Company generates credit card receivables of approximately $3 billion per year and average outstanding sold receivables are generally $1.0 billion to $1.2 billion, a substantial majority of the annual estimated credit gains and losses have been reconciled to actual gains and losses. Only that portion of the gains and losses attributable to the outstanding securitized portfolio at year end remains subject to estimating risk. At February 1, 2003, the net gain recognized within the “Retained Interest in Accounts Receivable” asset was $48.2 million.
Determining the fair value of the consideration to be received from the credit card receivables sold includes estimates of the following associated amounts: (1) the gross finance charge income to be generated by the receivables that requires estimates of payment rates, (2) the coupon interest rate due to the third-party investors, (3) bad debts, (4) cost of servicing the receivables and (5) assumed cash flow discount rates. The notes to the consolidated financial statements reflect the critical estimates and assumptions utilized during the two most recent fiscal years. Items that were considered in making judgments and preparing estimates and factors that can lead to variations in the consolidated financial results are as follows:
| | • | | Finance charge income is billed at a contractual rate monthly and warrants little judgment or estimates. The expected credit card customer payment rate is based on historical payment rates weighted to recent payment rate trends. To the extent credit card customers pay off their balances sooner than estimated, this net gain is reduced. Conversely, should the credit card customers pay off balances over a longer period of time, the net gain is increased. |
| | • | | The future coupon interest rate due to the third-party investors is estimated using the fixed interest rates in place and estimated floating interest rates over the estimated life of the receivables. To the extent floating interest rates increase beyond the increase embedded in the estimates, the net gain will be reduced. To the extent floating interest rates do not increase to the level embedded in the estimates, the net gain will be increased. |
| | • | | Bad debts expected from the sold receivables are based on historical write-off rates, weighted to recent write-off trends and increased or decreased to reflect management’s outlook for trends to develop over the next 12 to 24 months. To the extent there are positive or negative factors on the credit card customers’ ability or intent to pay off the outstanding balance (e.g. unemployment rates, level of consumer debt, bankruptcy legislation), the actual bad debt to be realized could exceed or be less than the amount estimated. Bad debts in excess of those embedded in the estimates reduce the net gain. Conversely, bad debts less than those embedded increase the net gain. |
| | • | | Delinquent credit card accounts are written off automatically after the passage of seven months without receiving a monthly payment equal to 80% of the minimum contractual payment. Minimum monthly contractual payments range from 5% to 10%. Accounts are written off sooner in the event of customer bankruptcy, customer death or fraud. |
| | • | | The cost of servicing the receivables is estimated using our historical operating costs. This estimate is subject to minimal risk of deviation. |
30
M A N A G E M E N T’ S D I S C U S S I O N A N D A N A L Y S I S
| | • | | The assumed cash flow discount rates are based on the weighted average cost of debt and are subject to typical interest rate volatility in the debt markets. |
The most sensitive assumptions in calculating the gain on sold credit card receivables are the credit card customers’ payment rate, the estimate for bad debts and the assumed cash flow discount rates.
The following table represents the Company’s assumptions in measuring the fair value of retained interests in accounts receivable in 2002, 2001 and 2000:
| | | 2002 | | | 2001 | | | 2000 | |
|
Weighted average interest rates applied to credit card balances | | 21.6 | % | | 21.6 | % | | 21.6 | % |
Weighted average payment rate | | 14.4 | % | | 14.4 | % | | 18.0 | % |
Credit losses expected from the principal amount of receivables sold | | 3.3 | % | | 3.4 | % | | 3.3 | % |
Weighted average cost of funding | | 2.8 | % | | 4.2 | % | | 6.1 | % |
|
Depreciation and Recoverability of Capital Assets. Over one-half of the Company’s assets at February 1, 2003 are represented by investments in Property and Equipment and Goodwill and Intangible Assets. Determining appropriate depreciable lives and reasonable assumptions for use in evaluating the carrying value of capital assets requires judgments and estimates.
| | • | | The Company utilizes the straight-line depreciation method and a variety of depreciable lives. Land is not depreciated. Buildings and improvements are depreciated over 20 to 40 years. Store fixtures are depreciated over 10 years. Equipment utilized in stores (e.g. escalators) and in support areas (e.g. distribution centers, technology) and fixtures in support areas are depreciated over 3 to 15 years. Leasehold improvements are amortized over the shorter of their estimated useful lives or their related lease terms, generally ranging from 10 to 20 years. Internally generated computer software is amortized over 3 to 10 years. Generally, no estimated salvage value at the end of the useful life of the assets is considered. |
| | • | | To the extent the Company remodels or otherwise replaces or disposes of property and equipment prior to the end of their assigned depreciable lives, the Company could realize a loss or gain on the disposition. To the extent assets continue to be used beyond their assigned depreciable lives, no depreciation expense is being realized. The Company reassesses the depreciable lives in an effort to reduce the risk of significant losses or gains at disposition and utilization of assets with no depreciation charges. The reassessment of depreciable lives involves utilizing historical remodel and disposition activity and forward-looking capital expenditure plans. |
| | • | | Recoverability of the carrying value of store assets is assessed upon the occurrence of certain events (e.g., opening a new store near an existing store or announcing plans for a store closing) and absent certain events, annually. The recoverability assessment requires judgment and estimates for future store generated cash flows. The underlying estimates for cash flows include estimates for future sales, gross margin rates, inflation and store expense increases and decreases. During 2002, the Company recorded $11.0 million in impairment charges associated with stores in which the estimated discounted cash flows would be less than the carrying value of the store assets. There are other stores in which current cash flows are not adequate to recover the carrying value of the store assets. However, the Company believes that estimated sales growth and gross margin improvement will enhance the cash flows of these stores such that the carrying value of the store assets will be recovered. Generally these stores were recently opened and require a two to five-year period to develop the customer base to attain the required cash flows. To the extent management’s estimates for sales growth and gross margin improvement are not realized, future annual assessments could result in impairment charges. |
| | • | | Recoverability of goodwill and intangible assets is assessed annually and upon the occurrence of certain events. The recoverability assessment requires management to make judgements and estimates regarding the fair values of its defined reporting units, SDSG and SFAE. The fair values of these units are determined using estimated future cash flows including growth assumptions for future sales, gross margin rates, the effects of inflation and other estimates. To the extent that management’s estimates are not realized, future assessments could result in impairment charges. |
31
M A N A G E M E N T’ S D I S C U S S I O N A N D A N A L Y S I S
Income Taxes. The majority of the Company’s deferred tax assets at February 1, 2003 consist of federal net operating loss carryforwards that will expire between 2004 and 2018. At February 1, 2003, the Company believes that it will be profitable during the periods 2003 through 2018, allowing it to sufficiently utilize the carrying value of the benefit of the federal net operating loss carryforwards. During 2002, the Company concluded a number of state tax examinations, many of which had addressed corporate organization changes that had occurred over the previous five years in conjunction with the Company’s multiple acquisitions. As a result of these examinations, the Company decreased the tax benefit associated with the state net operating loss carryforwards of certain taxing jurisdictions, reduced the deferred state tax rate associated with the Company’s tax basis differences, and reduced the liability representing exposures associated with various state tax positions. To the extent management’s estimates of future taxable income by jurisdiction is greater than or less than management’s current estimates, future increases or decreases in the benefit of net operating loss carryforwards could occur.
The Company is routinely under audit by federal, state or local authorities in the areas of income taxes and the remittance of sales and use taxes. These audits include questioning the timing and amount of deductions, the nexus of income among various tax jurisdictions and compliance with federal, state and local tax laws. In evaluating the exposure associated with various tax filing positions, the Company often accrues charges for probable exposures. During 2002, the Company concluded a number of state tax examinations with favorable results. Therefore, during the annual evaluation of tax positions for 2002, the Company decreased the amount previously accrued for probable exposures. At February 1, 2003, the Company believes it has appropriately accrued for probable exposures. To the extent the Company were to prevail in matters for which accruals have been established or be required to pay amounts in excess of reserves, the Company’s effective tax rate in a given financial statement period could be materially affected. At February 1, 2003, two of the Company’s five open tax years were undergoing examination by the Internal Revenue Service.
Pension Plans. Pension expense is based on information provided by outside actuarial firms that use assumptions to estimate the total benefits ultimately payable to associates and allocates this cost to service periods. The actuarial assumptions used to calculate pension costs are reviewed annually. The pension plans are valued annually on November 1. The projected unit credit method is utilized in recognizing the pension liabilities.
Pension assumptions are based upon management’s best estimates, after consulting with outside investment advisors and actuaries, as of the annual measurement date.
| | • | | The assumed discount rate utilized is based upon the Aa corporate bond yield as of the measurement date. The discount rate is utilized principally in calculating the Company’s pension obligation, which is represented by the Accumulated Benefit Obligation (ABO) and the Projected Benefit Obligation (PBO) and in calculating net pension expense. At November 1, 2002, the discount rate was 6.75%. To the extent the discount rate increases or decreases, the Company’s ABO is decreased or increased, accordingly. The estimated effect of a 0.25% change in the discount rate is $7.5 million on the ABO and $0.8 million on pension expense. To the extent the ABO increases, the after-tax effect of such increase serves to reduce Other Comprehensive Income and Shareholders’ Equity. |
| | • | | The assumed expected long-term rate of return on assets is the weighted average rate of earnings expected on the funds invested or to be invested to provide for the benefits included in the PBO. It is the Company’s policy to invest approximately 60% to 65% of the pension fund assets in equities and 35% to 40% in fixed income securities. This expected average long-term rate of return on assets is based principally on the counsel of the Company’s outside investment advisors. This rate is utilized principally in calculating the expected return on plan assets component of the annual pension expense. To the extent the actual rate of return on assets realized over the course of a year is greater than the assumed rate, that year’s annual pension expense is not affected. Rather this gain reduces future pension expense over a period of approximately 15 to 20 years. To the extent the actual rate of return on assets is less than the assumed rate, that year’s annual pension expense is likewise not affected. Rather this loss increases pension expense over approximately 15 to 20 years. During 2002, the Company utilized 9.0% as the expected long-term rate of return on assets and expects to lower the expected long-term rate of return on assets to 8.5% in 2003, which is expected to increase the annual pension expense approximately $1 million. |
32
M A N A G E M E N T’ S D I S C U S S I O N A N D A N A L Y S I S
| | • | | The assumed average rate of compensation increases is the average annual compensation increase expected over the remaining employment periods for the participating employees. This rate is estimated to be 4% for the periods following November 1, 2002 and is utilized principally in calculating the PBO and annual pension expense. The estimated effect of a 0.25% change in the assumed rate of compensation increases would not be material to the PBO or annual pension expense. |
| | • | | At November 1, 2002, the Company had unrecognized pension expense of $121.8 million related to the expected return on assets exceeding actual investment returns; actual compensation increases exceeding assumed average rate of compensation; plan amendments; contributions subsequent to the measurement date and other differences between underlying actuarial assumptions and actual results. This delayed recognition of expense is incorporated into the $150.5 million underfunded status of the plans at November 1, 2002. |
INFLATION AND DEFLATION
Inflation and deflation affect the costs incurred by the Company in its purchase of merchandise and in certain components of its SG&A expenses. The Company attempts to offset the effects of inflation, which has occurred in recent years in SG&A, through price increases and control of expenses, although the Company’s ability to increase prices is limited by competitive factors in its markets. The Company attempts to offset the effects of merchandise deflation, which has occurred in recent years, through control of expenses.
SEASONALITY
The Company’s business, like that of most retailers, is subject to seasonal influences, with a significant portion of net sales and net income realized during the fall season, which includes the fourth quarter holiday selling season. In light of these patterns, SG&A expenses are typically higher as a percentage of net sales during the first three quarters of each year, and working capital needs are greater in the last two quarters of each year. The increases in working capital needs during the fall season have typically been financed with cash flow from operations, borrowings under the Company’s revolving credit agreement and cash provided from maintaining a proprietary credit cards securitization program. Generally, more than 30% of the Company’s net sales and more than 75% of net income are generated during the fourth fiscal quarter.
NEW ACCOUNTING PRONOUNCEMENTS
During 2002, the Company adopted SFAS No. 142, “Goodwill and Other Intangible Assets,” which superseded APB Opinion No. 17 and revised the financial accounting and reporting for goodwill and intangible assets. Among the revisions and guidance set forth in SFAS No. 142 are the discontinuation of the amortization of goodwill and certain intangible assets, periodic testing (at least annually) for the impairment of goodwill and intangible assets at the reporting unit level and additional financial statement disclosures. The adoption of this standard resulted in a non-cash charge of $45.6 million for the write-off of non-deductible SFAE goodwill.
SFAS No. 144, “Accounting for the Impairment or Disposal of Long-Lived Assets,” became effective in 2002. This standard emphasizes and resolves certain issues related to the recognition and measurement of the impairment of long-lived assets, whether held and used or to be disposed of by sale. This standard also extends the reporting of discontinued operations, separate from continuing operations, to include “a component of an entity” that has either been disposed of or is held for sale. It is not expected that this standard will have a significant effect on the Company’s consolidated financial position or results of operations; however, the standard may affect the presentation of income and expenses associated with closed or disposed stores.
33
M A N A G E M E N T’ S D I S C U S S I O N A N D A N A L Y S I S
During 2002, the Company adopted SFAS No. 145, “Rescission of FASB Statements No. 4, 44, and 64, Amendment of FASB Statement No. 13, and Technical Corrections,” which addresses a variety of accounting practices, including the discontinuation of classifying gains and losses from the extinguishment of debt as “extraordinary items.” The Company has made reclassifications within previously issued income statements to include gains and losses on the early extinguishment of debt in income before income taxes. These reclassifications had no effect on previously reported net income.
In July 2002, the FASB issued SFAS No. 146, “Accounting for Costs Associated with Exit or Disposal Activities.” This standard requires recognition of costs associated with exit or disposal activities when they are incurred rather than at the date of a commitment to an exit or disposal plan. During the third quarter 2002, the Company elected to early adopt this standard as encouraged by the FASB, effective as of the beginning of the year with no effect on prior quarters in 2002. The adoption of this standard had the effect of recognizing costs (principally severance and retention costs) associated with the Younkers consolidation over the period beginning with the consolidation announcement in October 2002 and ending with the severance payments in 2003, as opposed to expensing substantially all of the severance upon announcement in the third fiscal quarter ended November 2, 2002. Thus, costs to complete the Younkers consolidation will be expensed in the first and second quarters of 2003, as opposed to during 2002 under the previous accounting standards.
In August 2002, the Company announced that beginning in 2003, it expected to begin expensing its employee stock-based compensation in accordance with SFAS No. 123, “Accounting for Stock-Based Compensation.” Subsequent to this announcement, in December 2002, the FASB issued SFAS No. 148, “Accounting for Stock-Based Compensation-Transition and Disclosure, an amendment of FASB Statement No. 123,” which provides alternative methods of transition for the voluntary change to the fair value based method of accounting for stock-based employee compensation. The Company anticipates that beginning in the first fiscal quarter of 2003, all future employee stock option grants will be expensed over the stock option vesting period based on the fair value at the date the options are granted. This is consistent with the “prospective method” as defined in SFAS No. 148. It is not expected that this accounting change will have a significant effect on the Company’s financial position or results of operations. Assuming the value and number of option grants remain similar to 2002 levels, the 2003 expense would be approximately $0.02 per share and would grow to approximately $0.05 per share in 2006.
During 2002, FASB Interpretation No. 45 (“FIN 45”) was issued, which provided accounting and disclosure requirements for the issuance of certain types of guarantees, and FIN 46 was issued, which provided guidance on the identification of and financial reporting for, entities over which control is achieved through means other than voting rights, also known as variable-interest entities. Also, during 2002, EITF Issue No. 02-16 was issued, which addresses the accounting by a customer (including a reseller) for certain consideration received from a vendor. Management does not believe that any of these pronouncements will have a significant effect on the Company’s consolidated financial position or results of operations.
RELATED PARTY TRANSACTIONS
During 2002, the Company engaged the services of a law firm, one of whose principals includes a family member of certain executive officers. Fees paid to this firm were at market rates and aggregated approximately $0.1 million in 2002. The Company has also loaned amounts aggregating approximately $1 million to executive officers as a component of the Company’s compensation programs. The Company does not believe these services, fees and loans are material to the consolidated financial position or results from operations.
34
M A N A G E M E N T’ S D I S C U S S I O N A N D A N A L Y S I S
FORWARD-LOOKING INFORMATION
Certain information presented in this report addresses future results or expectations and is considered “forward-looking” information within the definition of the Federal securities laws. Forward-looking statements can be identified through the use of words such as “may,” “will,” “intend,” “plan,” “project,” “expect,” “anticipate,” “should,” “would,” “believe,” “estimate,” “contemplate,” “possible,” “attempts,” “seeks” and “point.” The forward-looking information is premised on many factors. Actual consolidated results might differ materially from projected forward-looking information if there are any material changes in management’s assumptions.
The forward-looking information and statements are based on a series of projections and estimates that involve risks and uncertainties. Potential risks and uncertainties include such factors as: the level of consumer spending for apparel and other merchandise carried by the Company and its ability to respond quickly to consumer trends; adequate and stable sources of merchandise; the competitive pricing environment within the department and specialty store industries as well as other retail channels; the effectiveness of planned advertising, marketing and promotional campaigns; favorable customer response to increased relationship marketing efforts and proprietary credit card loyalty programs; appropriate inventory management; effective operations of NBGL’s credit card operations; the closing of the proposed Household transaction; and changes in interest rates. For additional information regarding these and other risk factors, please refer to Exhibit 99.1 of the Company’s Form 10-K for the year ended February 1, 2003 filed with the Securities and Exchange Commission, which may be accessed via EDGAR through the Internet atwww.sec.gov.
The Company undertakes no obligation to correct or update any forward-looking statements, whether as a result of new information, future events or otherwise. Readers are advised, however, to consult any further disclosures the Company makes on related subjects in its reports with the Securities and Exchange Commission and in its press releases.
QUANTITATIVE AND QUALITATIVE DISCLOSURES ABOUT MARKET RISK
The Company’s exposure to market risk primarily arises from changes in interest rates and the U.S. equity, securitization and bond markets. The effects of changes in interest rates on earnings generally have been small relative to other factors that also affect earnings, such as sales and operating margins. The Company seeks to manage exposure to adverse interest rate changes through its normal operating and financing activities and, if appropriate, through the use of derivative financial instruments. Although the Company maintains no derivative financial instruments at February 1, 2003, such instruments are used as part of an overall risk management program in order to manage the costs and risks associated with various financial exposures. The Company does not enter into derivative instruments for trading purposes, as clearly defined in its risk management policies.
During February 2003 and subsequent to year-end, the Company entered an interest rate swap agreement for a notional amount of $75 million related to its 8.25% senior notes maturing 2008. The agreement swaps the fixed 8.25% coupon rate to a variable rate based on the one-month LIBOR rate and matures in 2008.
The effects of changes in the U.S. equity and bond markets serve to increase or decrease the value of pension plan assets, resulting in increased or decreased cash funding by the Company. The Company seeks to manage exposure to adverse equity and bond returns by maintaining diversified mutual fund investment portfolios and utilizing professional managers. The Company maintains no derivative financial instruments as a part of the investment risk management program.
35
M A N A G E M E N T’ S D I S C U S S I O N A N D A N A L Y S I S
The Company’s assumptions in measuring the retained interests in accounts receivable as of and for the period ended February 1, 2003 and the sensitivity of the fair value to immediate 10% and 20% adverse changes in those assumptions are as follows:
| | | Assumption | | | Fair Value Impact of 10% Adverse Change | | | Fair Value Impact of 20% Adverse Change | |
|
Weighted average interest rates applied to credit card balances | | 21.6 | % | | $ | (11.4 | ) | | $ | (23.1 | ) |
Weighted average payment rate | | 14.4 | % | | $ | (7.2 | ) | | $ | (13.5 | ) |
Credit losses expected from the February 1, 2003 principal amount of receivables sold | | 3.3 | % | | $ | (4.0 | ) | | $ | (8.0 | ) |
Weighted average cost of funding | | 2.8 | % | | $ | (1.2 | ) | | $ | (2.5 | ) |
|
These sensitivities are hypothetical and should be used with caution. The effect of an adverse change in a particular assumption on the fair value of the retained interest is calculated without changing any other assumption. In reality, changes in one factor may result in changes in another, which might alter the reported sensitivities.
36
SAKS INCORPORATED & SUBSIDIARIES
CONSOLIDATED STATEMENTS OF INCOME
| | | Year Ended | |
|
(In Thousands, except per share amounts) | | February 1, 2003 | | | February 2, 2002 | | | February 3, 2001 | |
|
NET SALES | | $ | 5,911,122 | | | $ | 6,070,568 | | | $ | 6,581,236 | |
Cost of sales (excluding depreciation and amortization) | | | 3,739,247 | | | | 3,960,129 | | | | 4,211,707 | |
|
Gross margin | | | 2,171,875 | | | | 2,110,439 | | | | 2,369,529 | |
Selling, general and administrative expenses | | | 1,331,137 | | | | 1,389,287 | | | | 1,433,357 | |
Other operating expenses | | | | | | | | | | | | |
Property and equipment rentals | | | 203,636 | | | | 200,932 | | | | 196,813 | |
Depreciation and amortization | | | 216,022 | | | | 219,773 | | | | 214,099 | |
Taxes other than income taxes | | | 153,834 | | | | 156,788 | | | | 163,745 | |
Store pre-opening costs | | | 4,619 | | | | 5,130 | | | | 6,196 | |
Losses from long-lived assets | | | 19,547 | | | | 32,621 | | | | 73,572 | |
Integration charges | | | 9,981 | | | | 1,539 | | | | 19,886 | |
|
OPERATING INCOME | | | 233,099 | | | | 104,369 | | | | 261,861 | |
Interest expense | | | (124,052 | ) | | | (131,039 | ) | | | (149,995 | ) |
Gain on extinguishment of debt | | | 709 | | | | 26,110 | | | | — | |
Other income (expense), net | | | 229 | | | | 1,083 | | | | 3,733 | |
|
INCOME BEFORE INCOME TAXES AND CUMULATIVE EFFECT OF ACCOUNTING CHANGE | | | 109,985 | | | | 523 | | | | 115,599 | |
Provision for income taxes | | | 40,148 | | | | 201 | | | | 40,383 | |
|
INCOME BEFORE CUMULATIVE EFFECT OF ACCOUNTING CHANGE | | | 69,837 | | | | 322 | | | | 75,216 | |
Cumulative effect of a change in accounting principle, net of taxes | | | (45,593 | ) | | | — | | | | — | |
|
NET INCOME | | $ | 24,244 | | | $ | 322 | | | $ | 75,216 | |
|
Earnings per common share: | | | | | | | | | | | | |
Basic earnings per common share before cumulative effect of accounting change | | $ | 0.49 | | | $ | 0.00 | | | $ | 0.53 | |
Cumulative effect of accounting change | | | (0.32 | ) | | | — | | | | — | |
|
Basic earnings per common share | | $ | 0.17 | | | $ | 0.00 | | | $ | 0.53 | |
|
Diluted earnings per common share before cumulative effect of accounting change | | $ | 0.48 | | | $ | 0.00 | | | $ | 0.53 | |
Cumulative effect of accounting change | | | (0.32 | ) | | | — | | | | — | |
|
Diluted earnings per common share | | $ | 0.17 | | | $ | 0.00 | | | $ | 0.53 | |
|
Weighted average common shares: | | | | | | | | | | | | |
Basic | | | 142,750 | | | | 141,988 | | | | 141,656 | |
Diluted | | | 146,707 | | | | 144,498 | | | | 142,718 | |
|
The accompanying notes are an integral part of these consolidated financial statements.
37
SAKS INCORPORATED & SUBSIDIARIES
CONSOLIDATED BALANCE SHEETS
(In Thousands) | | February 1, 2003 | | | February 2, 2002 | |
|
ASSETS | | | | | | | | |
CURRENT ASSETS | | | | | | | | |
Cash and cash equivalents | | $ | 209,568 | | | $ | 99,102 | |
Retained interest in accounts receivable | | | 267,062 | | | | 239,420 | |
Merchandise inventories | | | 1,306,667 | | | | 1,295,878 | |
Other current assets | | | 93,422 | | | | 74,960 | |
Deferred income taxes, net | | | 41,806 | | | | 60,569 | |
|
TOTAL CURRENT ASSETS | | | 1,918,525 | | | | 1,769,929 | |
| | | | | | | | | |
PROPERTY AND EQUIPMENT, NET OF DEPRECIATION | | | 2,143,105 | | | | 2,246,818 | |
GOODWILL AND INTANGIBLES, NET OF AMORTIZATION | | | 316,430 | | | | 363,528 | |
DEFERRED INCOME TAXES, NET | | | 148,805 | | | | 173,077 | |
OTHER ASSETS | | | 52,491 | | | | 42,169 | |
|
TOTAL ASSETS | | $ | 4,579,356 | | | $ | 4,595,521 | |
|
LIABILITIES AND SHAREHOLDERS’ EQUITY | | | | | | | | |
CURRENT LIABILITIES | | | | | | | | |
Accounts payable | | $ | 273,989 | | | $ | 238,818 | |
Accrued expenses | | | 416,024 | | | | 444,146 | |
Accrued compensation and related items | | | 55,049 | | | | 51,469 | |
Sales taxes payable | | | 44,849 | | | | 47,284 | |
Current portion of long-term debt | | | 4,781 | | | | 5,061 | |
|
TOTAL CURRENT LIABILITIES | | | 794,692 | | | | 786,778 | |
|
LONG-TERM DEBT | | | 1,327,381 | | | | 1,356,580 | |
OTHER LONG-TERM LIABILITIES | | | 190,011 | | | | 180,726 | |
|
COMMITMENTS AND CONTINGENCIES | | | | | | | | |
|
SHAREHOLDERS’ EQUITY | | | | | | | | |
Common stock | | | 14,496 | | | | 14,399 | |
Additional paid-in capital | | | 2,131,091 | | | | 2,119,343 | |
Accumulated other comprehensive loss | | | (69,158 | ) | | | (28,904 | ) |
Retained earnings | | | 190,843 | | | | 166,599 | |
|
TOTAL SHAREHOLDERS’ EQUITY | | | 2,267,272 | | | | 2,271,437 | |
|
TOTAL LIABILITIES AND SHAREHOLDERS’ EQUITY | | $ | 4,579,356 | | | $ | 4,595,521 | |
|
The accompanying notes are an integral part of these consolidated financial statements.
38
SAKS INCORPORATED & SUBSIDIARIES
CONSOLIDATED STATEMENTS OF CHANGES IN SHAREHOLDERS’ EQUITY
(In Thousands) | | Common Stock Shares | | | Common Stock Amount | | | Additional Paid-in Capital | | | Retained Earnings | | Accumulated Other Comprehensive Loss | | | Total Shareholders’ Equity | |
|
BALANCE AT JANUARY 29, 2000 | | 142,815 | | | $ | 14,281 | | | $ | 2,103,001 | | | $ | 91,061 | | | | | | $ | 2,208,343 | |
Net income | | | | | | | | | | | | | | 75,216 | | | | | | | 75,216 | |
Change in minimum pension liability | | | | | | | | | | | | | | | | $ | (1,852 | ) | | | (1,852 | ) |
| | | | | | | | | | | |
|
Comprehensive income | | | | | | | | | | | | | | | | | | | | | 73,364 | |
Issuance of common stock | | 1,715 | | | | 172 | | | | 17,296 | | | | | | | | | | | 17,468 | |
Income tax expense related to employee stock plans | | | | | | | | | | (1,323 | ) | | | | | | | | | | (1,323 | ) |
Decrease in tax valuation allowance | | | | | | | | | | 15,405 | | | | | | | | | | | 15,405 | |
Net activity under stock compensation plans | | 644 | | | | 64 | | | | 5,518 | | | | | | | | | | | 5,582 | |
Repurchase of common stock | | (2,041 | ) | | | (204 | ) | | | (24,806 | ) | | | | | | | | | | (25,010 | ) |
|
BALANCE AT FEBRUARY 3, 2001 | | 143,133 | | | | 14,313 | | | | 2,115,091 | | | | 166,277 | | | (1,852 | ) | | | 2,293,829 | |
Net income | | | | | | | | | | | | | | 322 | | | | | | | 322 | |
Change in minimum pension liability | | | | | | | | | | | | | | | | | (27,052 | ) | | | (27,052 | ) |
| | | | | | | | | | | |
|
Comprehensive income (loss) | | | | | | | | | | | | | | | | | | | | | (26,730 | ) |
Issuance of common stock | | 524 | | | | 52 | | | | 3,329 | | | | | | | | | | | 3,381 | |
Income tax expense related to employee stock plans | | | | | | | | | | (1,639 | ) | | | | | | | | | | (1,639 | ) |
Net activity under stock compensation plans | | 792 | | | | 80 | | | | 6,102 | | | | | | | | | | | 6,182 | |
Repurchase of common stock | | (460 | ) | | | (46 | ) | | | (3,540 | ) | | | | | | | | | | (3,586 | ) |
|
BALANCE AT FEBRUARY 2, 2002 | | 143,989 | | | | 14,399 | | | | 2,119,343 | | | | 166,599 | | | (28,904 | ) | | | 2,271,437 | |
Net income | | | | | | | | | | | | | | 24,244 | | | | | | | 24,244 | |
Change in minimum pension liability | | | | | | | | | | | | | | | | | (40,254 | ) | | | (40,254 | ) |
| | | | | | | | | | | |
|
Comprehensive income (loss) | | | | | | | | | | | | | | | | | | | | | (16,010 | ) |
Issuance of common stock | | 1,336 | | | | 132 | | | | 10,433 | | | | | | | | | | | 10,565 | |
Income tax benefits related to employee stock plans | | | | | | | | | | 1,178 | | | | | | | | | | | 1,178 | |
Net activity under stock compensation plans | | 335 | | | | 35 | | | | 7,178 | | | | | | | | | | | 7,213 | |
Repurchase of common stock | | (700 | ) | | | (70 | ) | | | (7,041 | ) | | | | | | | | | | (7,111 | ) |
|
BALANCE AT FEBRUARY 1, 2003 | | 144,960 | | | $ | 14,496 | | | $ | 2,131,091 | | | $ | 190,843 | | $ | (69,158 | ) | | $ | 2,267,272 | |
|
The accompanying notes are an integral part of these consolidated financial statements.
39
SAKS INCORPORATED & SUBSIDIARIES
CONSOLIDATED STATEMENTS OF CASH FLOWS
| | | Year Ended | |
|
(In Thousands) | | February 1, 2003 | | | February 2, 2002 | | | February 3, 2001 | |
|
OPERATING ACTIVITIES | | | | | | | | | | | | |
Net income | | $ | 24,244 | | | $ | 322 | | | $ | 75,216 | |
Adjustments to reconcile net income to net cash provided by operating activities: | | | | | | | | | | | | |
Gain on extinguishment of debt | | | (709 | ) | | | (26,110 | ) | | | — | |
Cumulative effect of accounting change | | | 45,593 | | | | — | | | | — | |
Depreciation and amortization | | | 216,022 | | | | 219,773 | | | | 214,099 | |
Provision for employee stock compensation | | | 7,213 | | | | 6,182 | | | | 5,582 | |
Deferred income taxes | | | 40,368 | | | | 1,065 | | | | 73,671 | |
Losses from long-lived assets | | | 19,547 | | | | 32,621 | | | | 73,572 | |
Changes in operating assets and liabilities: | | | | | | | | | | | | |
Retained interest in accounts receivable | | | (27,642 | ) | | | (18,611 | ) | | | 4,491 | |
Merchandise inventories | | | (10,789 | ) | | | (189,266 | ) | | | (29,428 | ) |
Other current assets | | | (18,462 | ) | | | (26,811 | ) | | | 14,234 | |
Accounts payable and accrued liabilities | | | 34,869 | | | | (31,829 | ) | | | 48,063 | |
Other operating assets and liabilities | | | (53,953 | ) | | | 28,104 | | | | 5,952 | |
|
NET CASH PROVIDED BY OPERATING ACTIVITIES | | | 276,301 | | | | 373,972 | | | | 485,452 | |
|
INVESTING ACTIVITIES | | | | | | | | | | | | |
Purchases of property and equipment | | | (142,355 | ) | | | (219,838 | ) | | | (274,852 | ) |
Proceeds from sale of stores and property and equipment | | | 2,434 | | | | 305,441 | | | | 26,107 | |
|
NET CASH PROVIDED BY USED IN INVESTING ACTIVITIES | | | (139,921 | ) | | | 85,603 | | | | (248,745 | ) |
|
FINANCING ACTIVITIES | | | | | | | | | | | | |
Payments on long-term debt | | | (29,393 | ) | | | (422,829 | ) | | | (8,267 | ) |
Net borrowings (repayments) under revolving credit agreement | | | — | | | | — | | | | (159,000 | ) |
Purchases and retirements of common stock | | | (7,111 | ) | | | (3,586 | ) | | | (25,010 | ) |
Proceeds from issuance of stock | | | 10,590 | | | | 1,282 | | | | 670 | |
|
NET CASH USED IN FINANCING ACTIVITIES | | | (25,914 | ) | | | (425,133 | ) | | | (191,607 | ) |
|
INCREASE IN CASH AND CASH EQUIVALENTS | | | 110,466 | | | | 34,442 | | | | 45,100 | |
CASH AND CASH EQUIVALENTS AT BEGINNING OF YEAR | | | 99,102 | | | | 64,660 | | | | 19,560 | |
|
CASH AND CASH EQUIVALENTS AT END OF YEAR | | $ | 209,568 | | | $ | 99,102 | | | $ | 64,660 | |
|
Non-cash investing and financing activities are further described in the accompanying notes.
The accompanying notes are an integral part of these consolidated financial statements.
40
SAKS INCORPORATED & SUBSIDIARIES
NOTES TO CONSOLIDATED FINANCIAL STATEMENTS
(IN THOUSANDS, EXCEPT PER SHARE AMOUNTS)
NOTE 1 ORGANIZATION
Saks Incorporated (hereinafter the “Company”) is a national retailer currently operating, through subsidiaries, traditional and luxury department stores. The Company operates the Saks Department Store Group (“SDSG”), which consists of stores operated under the following nameplates: Proffitt’s, McRae’s, Younkers, Parisian, Herberger’s, Carson Pirie Scott (“Carson’s”), Bergner’s and Boston Stores. The Company also operates Saks Fifth Avenue Enterprises (“SFAE”), which consists of Saks Fifth Avenue stores and Saks Off 5th stores.
NOTE 2 SUMMARY OF SIGNIFICANT ACCOUNTING POLICIES
GENERAL
The preparation of financial statements in conformity with generally accepted accounting principles requires management to make estimates and assumptions that affect the reported amounts of assets and liabilities and disclosure of contingent assets and liabilities at the date of the financial statements and the reported amounts of revenues and expenses during the reporting period. Actual results could differ from these estimates.
The accompanying consolidated financial statements include the accounts of the Company and its subsidiaries. All intercompany accounts and transactions have been eliminated.
In order to maintain consistency and comparability between periods presented, certain amounts have been reclassified from the previously reported consolidated financial statements to conform to the presentation in the current period. Additionally, in accordance with SFAS No. 145, the Company reclassified its gains from extinguishment of debt from “extraordinary items” to a component of “income before income taxes.” These reclassifications have no effect on previously reported total assets, shareholders’ equity, net income or cash flows.
The Company’s fiscal year ends on the Saturday closest to January 31. Fiscal year 2002 (“2002”) contained 52 weeks and ended on February 1, 2003. Fiscal year 2001 (“2001”) contained 52 weeks and ended on February 2, 2002. Fiscal year 2000 (“2000”) contained 53 weeks and ended on February 3, 2001.
NET SALES
Net sales include sales of merchandise (net of returns and exclusive of sales taxes), commissions from leased departments and shipping and handling revenues related to merchandise sold. Net sales are recognized at the time customers provide a satisfactory form of payment and take ownership of the merchandise or direct its shipment.
Revenues from shipping and handling included in net sales were $2,357 in 2002, $8,572 in 2001 and $10,597 in 2000. Commissions from leased departments were $42,203, $40,988 and $41,260 in 2002, 2001 and 2000, respectively. Leased department sales were $290,098 in 2002, $276,164 in 2001 and $277,050 in 2000 and were excluded from net sales.
CASH AND CASH EQUIVALENTS
Cash and cash equivalents primarily consists of cash on hand in the stores, deposits with banks and investments with banks and financial institutions that have original maturities of three months or less. Cash equivalents are stated at cost, which approximates fair value. Restricted cash associated with the accounts receivable securitization program is included in “Retained Interest in Accounts Receivable.” This restricted cash is comprised of lockbox receipts of proprietary credit card payments and finance charge collections held in a trust.
RETAINED INTEREST IN ACCOUNTS RECEIVABLE
Receivables generated from the sale of merchandise using proprietary credit cards issued by National Bank of the Great Lakes “NBGL”, the Company’s wholly owned subsidiary, are securitized through the sale of undivided interests to third-party investors for a portion of the receivables portfolio. A gain or loss is recorded equal to the excess or deficiency of the estimated fair value of the consideration to be received over the cost of the receivables sold. The Company estimates fair value based on the present value of expected future cash flows determined using management’s best estimates of portfolio yield, credit losses, payment rates and the weighted average cost of funding. The carrying value of the Company’s retained interest approximates fair value, and the Company retains the servicing rights to all receivables sold.
41
SAKS INCORPORATED & SUBSIDIARIES
NOTES TO CONSOLIDATED FINANCIAL STATEMENTS
(IN THOUSANDS, EXCEPT PER SHARE AMOUNTS)
MERCHANDISE INVENTORIES AND COST OF SALES
Merchandise inventories are valued by the retail method and are stated at the lower of cost (last-in, first-out “LIFO”) or market and include freight and certain buying and distribution costs. The Company also takes markdowns related to slow moving inventory, ensuring the appropriate inventory valuation. At February 1, 2003 and February 2, 2002, the LIFO value of inventories exceeded market value and, as a result, inventory was stated at the lower market amount.
Consignment merchandise on hand of $112,435 and $110,567 at February 1, 2003 and February 2, 2002, respectively, is not reflected in the consolidated balance sheets.
Consistent with industry business practice, the Company receives reimbursement from certain vendors for excessive markdowns related to the vendor’s merchandise. These reimbursements are included in cost of sales in the fiscal period in which the markdowns are incurred.
SELLING, GENERAL AND ADMINISTRATIVE EXPENSES
Selling, general and administrative expenses (“SG&A”) are comprised principally of the costs related to employee compensation and benefits in the selling and administrative support areas, advertising, certain store and headquarters occupancy, operating and maintenance costs (exclusive of rent, depreciation, and property taxes), insurance programs, telecommunications, and other operating expenses not specifically categorized elsewhere in the consolidated statements of income. The Company receives allowances from merchandise vendors in conjunction with incentive compensation programs for employees who sell the vendors’ merchandise. These allowances are netted against the related compensation expense. Amounts received from vendors related to compensation programs were $76,052, $67,731 and $56,769 in 2002, 2001 and 2000, respectively.
Consistent with industry practice, the Company and certain of its merchandise vendors jointly produce and distribute print and television media. Gross expenditures for such advertising is reduced by the portion funded by the vendor, and the net advertising expense is included in SG&A. Amounts received from vendors related to these cooperative advertising programs were $78,355, $85,388 and $101,558 in 2002, 2001 and 2000, respectively. Net advertising expenses were $185,431, $195,765 and $222,020 in 2002, 2001 and 2000, respectively.
STORE PRE-OPENING COSTS
Store pre-opening costs primarily consist of payroll and related media costs incurred in connection with new store openings and are expensed when incurred.
PROPERTY AND EQUIPMENT
Property and equipment are stated at historical cost less accumulated depreciation. Capital expenditures are reduced when the Company receives cash and allowances from merchandise vendors to fund the construction of vendor shops and cash from developers to fund building improvements. For financial reporting purposes, depreciation is computed principally using the straight-line method over the estimated useful lives of the assets. Buildings and improvements are depreciated over 20 to 40 years while fixtures and equipment are primarily depreciated over 3 to 15 years. Leasehold improvements are amortized over the shorter of their estimated useful lives or their related lease terms, generally ranging from 10 to 20 years. Costs incurred for the development of internal computer software are capitalized and amortized using the straight-line method over 3 to 10 years. Costs incurred in the discovery and post-implementation stages of obtaining internal computer software are expensed as incurred.
At each balance sheet date and as changes in circumstances arise, the Company evaluates the recoverability of its property and equipment based upon the utilization of the assets and expected future cash flows. Write-downs associated with the evaluation and any gains or losses on the sale of assets recorded at the time of disposition are reflected in “Losses from Long-lived Assets.”
GOODWILL AND INTANGIBLES
The Company has allocated the purchase price of previous purchase transactions to identifiable tangible assets and liabilities based on estimates of their fair values, with the remainder allocated to goodwill and intangible assets. During 2002, the Company adopted SFAS No. 142, “Goodwill and Other Intangible Assets,” which required the discontinuation of goodwill amortization and set parameters for the periodic testing (at least annually) for the impairment of goodwill and intangible assets. SFAS No. 142 required the Company to establish reporting units for testing goodwill recoverability, whereby estimates of fair value of the reporting units are compared to their respective carrying values to determine any impairment of goodwill. The Company established two reporting units, SDSG and SFAE, for purposes of measuring recoverability. Commensurate with
42
SAKS INCORPORATED & SUBSIDIARIES
NOTES TO CONSOLIDATED FINANCIAL STATEMENTS
(IN THOUSANDS, EXCEPT PER SHARE AMOUNTS)
adopting the standard in 2002, the Company performed recoverability tests and determined all of the SFAE non-deductible goodwill of $45,593 to be impaired, which is reflected in the consolidated statements of income as the cumulative effect of adopting the standard. At February 1, 2003, the fair value of the SDSG reporting unit exceeded the carrying amount of its assets and goodwill. Amortization of the remaining amortizable intangible assets is provided on the straight-line basis over the estimated useful lives of the assets, ranging from 10 to 15 years.
Prior to 2002, the Company also performed annual assessments of goodwill recoverability based on comparing the carrying amount of the assets to their respective fair values. Fair value was estimated based upon the utilization of the assets and the expected future cash flows. In 2001 and 2000, the Company recorded charges of approximately $18,000 and $42,000, respectively, related to dispositions and impairments of goodwill and intangibles, which are included in “Losses from Long-Lived Assets” in the consolidated statements of income. The 2001 charges primarily relate to the write-off of Saks Direct goodwill and intangible assets resulting from the reorganization of that business. The 2000 charges primarily relate to the write-down of goodwill associated with the sale of nine SDSG stores.
DERIVATIVES
The Company uses financial derivatives only to manage its costs and risks in conjunction with specific business transactions. All derivative instruments are recognized on the balance sheet at fair value. Changes in fair value of the effective portion of cash flow hedges are included in other comprehensive income as a component of shareholders’ equity. Changes in the fair value of certain non-cash flow hedges and the ineffective portion of cash flow hedges are recognized immediately in earnings.
There were no derivative instruments held by the Company at February 1, 2003 or February 2, 2002. However, during 2001, the Company entered into a commodity management agreement with Enron Energy Services that served to hedge certain of the Company’s exposures to energy price volatility. Upon Enron’s bankruptcy filing in the fourth quarter of 2001, the Company terminated the agreement.
Subsequent to year-end in February 2003, the Company entered an interest rate swap agreement for a notional amount of $75,000 related to its 8.25% senior notes maturing 2008. The agreement swaps the fixed 8.25% coupon rate to a variable rate based on the one-month LIBOR rate and matures in 2008.
STOCK-BASED COMPENSATION PLANS
The Company records compensation expense for all stock-based compensation plans using the intrinsic value method. Compensation expense, if any, is measured as the excess of the market price of the stock over the exercise price of the award on the measurement date. In 2003, the Company will begin expensing the fair value of stock option grants over the vesting period in accordance with the “prospective method” as defined in SFAS No. 148, “Accounting for Stock-Based Compensation-Transition and Disclosure, an amendment of FASB Statement No. 123.”
43
SAKS INCORPORATED & SUBSIDIARIES
NOTES TO CONSOLIDATED FINANCIAL STATEMENTS
(IN THOUSANDS, EXCEPT PER SHARE AMOUNTS)
Under the intrinsic value method, as the option exercise price is generally equal to fair value of the common shares at the date of the option grant, no compensation cost is recognized. Had compensation cost for the Company’s stock-based compensation plans been determined under the fair value method, using the Black-Scholes option-pricing model, the Company’s net income and earnings per share would have been reduced to the pro forma amounts indicated below.
| | | 2002 | | | 2001 | | | 2000 | |
|
Net income as reported | | $ | 24,244 | | | $ | 322 | | | $ | 75,216 | |
Add: Stock-based employee compensation expense included in net income, net of related tax effects | | | 7,213 | | | | 6,182 | | | | 5,582 | |
Deduct: Total stock-based employee compensation expense determined under the fair value method for awards | | | (24,899 | ) | | | (33,377 | ) | | | (24,993 | ) |
Pro forma net income(loss) | | $ | (6,558 | ) | | $ | (26,873 | ) | | $ | 55,805 | |
Basic earnings (loss) per common share | | | | | | | | | | | | |
As reported | | $ | 0.17 | | | $ | 0.00 | | | $ | 0.53 | |
Pro forma | | $ | (0.05 | ) | | $ | (0.19 | ) | | $ | 0.39 | |
Diluted earnings(loss) per common share | | | | | | | | | | | | |
As reported | | $ | 0.17 | | | $ | 0.00 | | | $ | 0.53 | |
Pro forma | | $ | (0.04 | ) | | $ | (0.19 | ) | | $ | 0.39 | |
|
The four assumptions for determining compensation costs under the fair value method include (1) a risk-free interest rate based on zero-coupon government issues on each grant date with the maturity equal to the expected term of the option (3.70%, 4.85% and 6.17% for 2002, 2001 and 2000, respectively), (2) an expected term of five years, (3) an expected volatility of 48.8%, 45.7% and 45.7% for 2002, 2001 and 2000, respectively, and (4) no expected dividend yield. The Black-Scholes option-pricing model does not include the inability to sell or transfer options, vesting requirements and a reduced exercise period upon termination of employment – all of which would reduce the fair value of the options.
PENSION PLANS
Pension expense is based on information provided by outside actuarial firms that use assumptions to estimate the total benefits ultimately payable to associates and allocates this cost to service periods. The actuarial assumptions used to calculate pension costs are reviewed annually. The Company’s funding policy provides that payments to the pension trusts shall be at least equal to the minimum funding requirement of the Employee Retirement Income Security Act of 1974. The Company may also provide additional payments from time to time, not to exceed the maximum tax-deductible limitation.
The pension plans are valued annually on November 1. The projected unit credit method is utilized in recognizing the pension liabilities.
INCOME TAXES
The Company uses the asset and liability method of accounting for income taxes. Under this method, deferred tax assets and liabilities are determined based on differences between financial reporting and tax bases of assets and liabilities and are measured using the enacted tax rates and laws that will be in effect when the differences are expected to reverse.
44
SAKS INCORPORATED & SUBSIDIARIES
NOTES TO CONSOLIDATED FINANCIAL STATEMENTS
(IN THOUSANDS, EXCEPT PER SHARE AMOUNTS)
EARNINGS PER SHARE
Basic earnings per share (“EPS”) have been computed based on the weighted average number of common shares outstanding.
| | | 2002 | | | 2001 | | 2000 |
|
| | | Income | | Shares | | Per Share Amount | | | Income | | Shares | | Per Share Amount | | Income | | Shares | | Per Share Amount |
|
Basic EPS – | | | | | | | | | | | | | | | | | | | | | | | | | |
Income before cumulative effect of accounting change | | $ | 69,837 | | 142,750 | | $ | 0.49 | | | $ | 322 | | 141,988 | | $ | 0.00 | | $ | 75,216 | | 141,656 | | $ | 0.53 |
Effect of dilutive stock options | | | — | | 3,957 | | | (0.01 | ) | | | — | | 2,510 | | | — | | | — | | 1,062 | | | — |
|
Diluted EPS – | | | | | | | | | | | | | | | | | | | | | | | | | |
Income before cumulative effect of accounting change | | $ | 69,837 | | 146,707 | | $ | 0.48 | | | $ | 322 | | 144,498 | | $ | 0.00 | | $ | 75,216 | | 142,718 | | $ | 0.53 |
|
Additionally, the Company had 14,909, 27,051 and 14,910 options to purchase shares of common stock outstanding at 2002, 2001 and 2000, respectively, that were not included in the computation of diluted EPS because the exercise price of the options was greater than the market price of the common shares. At February 1, 2003, these options had exercise prices ranging from $11.43 to $48.78 per share. If the market price becomes greater than the exercise price, these options will be dilutive and the treasury stock method will be applied to determine the number of dilutive shares.
NOTE 3 ACCOUNTS RECEIVABLE SECURITIZATIONS
Asset securitization is the process whereby proprietary credit card receivable balances are converted into securities generally referred to as asset-backed securities. The securitization of credit card receivables is accomplished primarily through public and private issuances of these asset-backed securities. Asset securitization removes credit card receivables from the consolidated balance sheet through the sale of the securities.
The Company’s proprietary credit cards are issued by NBGL. Receivables generated from the sale of merchandise on these credit cards are sold by NBGL to another wholly owned subsidiary, Saks Credit Corporation (“SCC”). SCC transfers, conveys and assigns all its rights and interests in the receivables, including its interests in proceeds, to a trust, Saks Credit Card Master Trust (“SCCMT”). SCCMT was formed pursuant to the Master Pooling and Services Agreement by and among Saks Incorporated as Servicer, Saks Credit Corporation as Transferor and Wells Fargo Bank as Trustee. SCCMT maintains no indebtedness. As Servicer, the Company is responsible for administering the credit card program, including the collection and application of funds with respect to SCCMT. The Trustee ensures that such servicing and administration is conducted in accordance with the Master Pooling and Services Agreement. Certificates representing undivided beneficial interests in the pool of receivables held in SCCMT are issued to third-party investors, proceeds from which are remitted by SCCMT back to SCC as consideration for its conveyance of receivables to SCCMT. SCC retains an interest in SCCMT that is subordinate to the rights of third-party investors to cash flows from receivables and repayment. The amount of receivables representing certificates sold to third-party investors are accounted for as having been sold, and the subordinated interest of SCC is recorded as an asset under “Retained Interest in Accounts Receivable” on the Company’s consolidated balance sheet.
Prior to maturity, third-party investors are paid a coupon rate of interest on the balance of certificates issued. Interest is paid from cash held in SCCMT representing collections of principal and finance charge income payments on accounts by customers. On a monthly basis, after all such interest has been paid to the third-party investors, SCC is entitled to any residual cash collected for such month. Prior to maturity of the certificates, the Company has access to the cash generated by the receivables net of allocations of cash to investors representing the coupon interest rate on their beneficial interests. Upon maturity, the certificate owners are repaid in full with cash collections of payments made by customers, after which the Company will receive all remaining cash to recover its residual ownership interest in the pool of receivables.
45
SAKS INCORPORATED & SUBSIDIARIES
NOTES TO CONSOLIDATED FINANCIAL STATEMENTS
(IN THOUSANDS, EXCEPT PER SHARE AMOUNTS)
During 2002, the Company and Household Bank (SB), N.A. (“Household”), an affiliate of Household International, entered into an agreement pursuant to which Household and its affiliates will acquire all of the Company’s proprietary credit card business, consisting of the proprietary credit card accounts owned by NBGL and the Company’s ownership interest in the assets of SCCMT. On March 31, 2003, the transaction was approved by the U.S. Comptroller of the Currency subject to certain conditions. The principal condition is for the Company and NBGL to enter into consent orders that require the Company and NBGL to implement and monitor policies and procedures to ensure compliance with the provisions of the Bank Secrecy Act. It is expected that the transaction will close in April 2003. Any of the parties to the transaction may terminate the agreement if the transaction has not been consummated by August 15, 2003, unless such date is otherwise extended by mutual agreement.
As part of the transaction, for a term of ten years following the closing and pursuant to a program agreement, Household will establish and own proprietary credit card accounts for customers of the Company’s operating subsidiaries. Household will retain the benefits and risks associated with the ownership of the accounts, will receive the finance charge income and incur the bad debts associated with those accounts, and will pay a portion of the finance charge income to the Company. During the ten-year term, pursuant to a servicing agreement, the Company will continue to provide key customer service functions, including new account opening, transaction authorization, billing adjustments and customer inquiries, and will receive compensation from Household for these services.
At the closing of the transaction, the Company will receive an amount in cash equal to the difference of (1) the sum of 100% of the outstanding accounts receivable balances, a premium, the value of investments held in securitization accounts and the value of miscellaneous consumable inventory, minus (2) the outstanding principal balance, together with unpaid accrued interest, of specified certificates issued by SCCMT held by public investors, which certificates will be assumed by Household at the closing. The Company plans to use a portion of the cash received at closing to repay amounts due under the SCCMT certificates and related obligations held at the time of the closing by bank-sponsored commercial paper conduit investors, which certificates and obligations will not be assumed by Household. After deducting these repayment amounts and transaction fees and expenses, the Company expects that its net cash proceeds resulting from the transaction at closing will total approximately $300 million. After allocating the cash proceeds to the sold accounts, the program agreement and the servicing agreement, the Company does not expect to realize a significant gain. The cash proceeds allocated to the ongoing program agreement and to the servicing agreement will be reflected in income over the lives of the agreements. During 2002, the Company incurred $1.5 million of pre-tax charges related to this transaction, primarily associated with professional and other transaction fees. These charges were included in SG&A.
With the exception of depreciation expense, all components of the credit operation have been included in the SG&A line item of the income statement (e.g. finance charge income plus securitization gains, less interest cost on the sold receivables, less bad debt expense and less credit administration expenses). Upon the consummation of the Household transaction, the components of the credit operation will continue to be included in SG&A (e.g. program compensation plus servicing compensation, less servicing expenses).
Prior to the closing of the Household transaction, the Company will continue to obtain funding through its existing accounts receivable securitization program. The certificates held by the bank-sponsored commercial paper conduit investors mature on April 15, 2003. If the Company is not able to close the transaction with Household by April 15, 2003, then the Company believes that it will be able to successfully extend the current funding availability with the bank-sponsored conduits or refinance the maturing certificates in the asset-backed securitization market. However, to extend availability of the conduits, the Company would be required to obtain an extension of the maturity of the SCCMT certificates held by the bank-sponsored commercial paper conduit investors to arrange for, negotiate the terms of, and implement the refinancing. Should the Company choose to refinance maturing certificates in the asset-backed securitization market, it is expected that the refinancing would take place over a three to six-month period, during which customer payments on receivables would be utilized to pay down the certificate holders’ ownership interest. During this period, the Company believes that it would have sufficient cash on hand and availability under its revolving credit agreement to fund working capital needs. Any refinancing of these certificates could be subject to higher pricing or more restrictive terms than those carried by the outstanding certificates. The Company believes that it will be successful in meeting the capital needs of the Company by either obtaining the extensions on the bank-sponsored conduits or selling sufficient replacement certificates into the asset-backed securities market.
46
SAKS INCORPORATED & SUBSIDIARIES
NOTES TO CONSOLIDATED FINANCIAL STATEMENTS
(IN THOUSANDS, EXCEPT PER SHARE AMOUNTS)
The certificates outstanding at February 1, 2003 mature at the dates indicated in the following tables and are subject to certain terms and conditions. The most significant terms and conditions include: a limitation on sold certificates (approximately 85% to 90% of the pool of receivables), a minimum net yield on the portfolio (net yield is defined as the quotient of gross finance charges collected from customers, minus a servicing fee paid to the Company, minus the amount of defaulted receivables, minus the amount of interest paid to third-party investors; divided by the outstanding principal balance of certificates issued by SCCMT; all stated on an annualized basis), a minimum customer payment rate and, for the variable certificate only, a minimum fixed charge ratio of 1 to 1 if and when availability under the Company’s revolving credit agreement decreases to less than $100,000. The fixed charge coverage ratio and availability requirement contained in the agreements governing the variable funding certificates is identical to the requirement contained in the Company’s revolving credit agreement. This provision relates to the Company and its financial condition as Servicer under the Master Pooling and Servicing Agreement.
Noncompliance with the terms and conditions could result in acceleration of the maturity dates. Upon maturity, the certificate owners are repaid with cash collections of principal payments made by customers until such time their ownership interests are satisfied, after which the Company receives all such cash to recover its residual ownership interest. Maturity dates for securitization instruments are determined based on (1) the minimum and maximum maturities as established by investors in the market for similar instruments; and (2) the aggregate level of receivables expected to be held by SCCMT and the timing and magnitude of the related cash flows. Historically, all maturing securitization instruments have been successfully renewed or refinanced on acceptable terms.
The Company’s and the certificate holders’ owned interest in the receivables at February 1, 2003 and February 2, 2002, was as follows:
| | | February 1, 2003 | | | February 2, 2002 | |
|
Amount of receivables securitized | | $ | 1,255,910 | | | $ | 1,295,608 | |
Amounts sold to third-party investors | | | (1,080,156 | ) | | | (1,147,731 | ) |
|
Retained interest in amount of receivables securitized | | | 175,754 | | | | 147,877 | |
Restricted cash associated with securitization | | | 28,136 | | | | 34,482 | |
Fair value of retained interest in amounts sold to third-party investors | | | 48,234 | | | | 37,728 | |
Receivables not securitized | | | 14,938 | | | | 19,333 | |
|
Retained interest in accounts receivable | | $ | 267,062 | | | $ | 239,420 | |
|
The Company has the ability to issue certificates of beneficial interest in fixed or variable denominations with fixed or variable implicit discount rates. At February 1, 2003, the Company had available the following funding sources:
Funding Capacity | | Amount Outstanding February 1, 2003 | | Average Outstanding During 2002 | | Maturity Date |
|
Fixed amount | | $ | 434,250 | | $ | 434,250 | | July 2006 |
Variable amount up to $ 550,500 | | | 516,151 | | | 417,421 | | April 2003 |
Variable amount up to $ 315,000 | | | 129,755 | | | 79,477 | | April 2003 |
|
| | | $ | 1,080,156 | | $ | 931,148 | | |
|
While the Company has no obligations to reimburse the trust or investors for credit losses, the Company is obligated to repurchase receivables related to customer credits such as merchandise returns and other receivables defects.
47
SAKS INCORPORATED & SUBSIDIARIES
NOTES TO CONSOLIDATED FINANCIAL STATEMENTS
(IN THOUSANDS, EXCEPT PER SHARE AMOUNTS)
Income, losses and expenses associated with the credit card receivables are included in SG&A. For 2002, 2001 and 2000, these amounts were as follows:
| | | 2002 | | | 2001 | | | 2000 | |
|
Finance charge income and fees | | $ | 250,570 | | | $ | 268,005 | | | $ | 269,812 | |
Securitization gains | | | 8,586 | | | | 6,247 | | | | 6,972 | |
Finance charge income and fees retained by certificate holders | | | (30,700 | ) | | | (52,020 | ) | | | (77,119 | ) |
Bad debt expense: | | | | | | | | | | | | |
Write-offs, net of recoveries, including fraud | | | (89,269 | ) | | | (81,957 | ) | | | (81,451 | ) |
Change in the allowance for bad debts | | | 6,971 | | | | 3,560 | | | | 13,197 | |
|
| | | | 82,298 | | | | 78,397 | | | | 68,254 | |
Net credit card contribution before operating and marketing expenses, overhead and other financing costs | | $ | 146,158 | | | $ | 143,835 | | | $ | 131,411 | |
|
Finance charge income and fees retained by certificate holders represent the coupon interest rate on the principal balances of the SCCMT certificates held by the certificate holders. Gains are recorded at the time of the sale equal to the excess of the estimated fair value of the receivables sold over the cost of the receivables sold. Cash associated with the gains is realized as the underlying credit card receivables are paid down.
The Company’s assumptions in measuring the retained interests in accounts receivable as of and for the year ended February 1, 2003 and the sensitivity of the fair value to immediate 10% and 20% adverse changes in those assumptions are as follows:
| | | Assumption | | | Fair Value Impact of 10% Adverse Change | | | Fair Value Impact of 20% Adverse Change | |
|
Weighted average interest rates applied to credit card balances | | 21.6 | % | | $ | (11.4 | ) | | $ | (23.1 | ) |
Weighted average payment rate | | 14.4 | % | | $ | (7.2 | ) | | $ | (13.5 | ) |
Credit losses expected from the February 1, 2003 principal amount of receivables sold | | 3.3 | % | | $ | (4.0 | ) | | $ | (8.0 | ) |
Weighted average cost of funding | | 2.8 | % | | $ | (1.2 | ) | | $ | (2.5 | ) |
|
These sensitivities are hypothetical and should be used with caution. The effect of an adverse change in a particular assumption on the fair value of the retained interest is calculated without changing any other assumption. In reality, changes in one factor may result in changes in another, which might alter the reported sensitivities. Outstanding delinquencies associated with principal amounts of securitized receivables were $33,606 or 2.7% and $38,623 or 3.0% at February 1, 2003 and February 2, 2002, respectively.
The table below summarizes cash flow movements between the credit card trusts and the Company for 2002 and 2001:
| | | 2002 | | | 2001 | |
|
Net proceeds from new securitizations | | $ | 516,150 | | | $ | 434,250 | |
Proceeds from collections reinvested in previous securitizations | | $ | 2,924,288 | | | $ | 3,064,844 | |
Trust principal payments on previous securitizations | | $ | (583,725 | ) | | $ | (498,552 | ) |
Interest received on retained interests | | $ | 263 | | | $ | 931 | |
Interest paid to third-party interests in credit card related trusts | | $ | 32,383 | | | $ | 54,130 | |
|
48
SAKS INCORPORATED & SUBSIDIARIES
NOTES TO CONSOLIDATED FINANCIAL STATEMENTS
(IN THOUSANDS, EXCEPT PER SHARE AMOUNTS)
While the Company’s store locations are distributed across 39 states, there are concentrations of related credit card receivables in certain geographic areas as illustrated below:
| | | Gross Receivables | |
|
Illinois | | 16.8 | % |
Alabama | | 11.2 | % |
Mississippi | | 6.2 | % |
Wisconsin | | 5.8 | % |
Florida | | 5.7 | % |
New York | | 5.1 | % |
Other states, individually less than 5% | | 49.2 | % |
|
| | | 100.0 | % |
|
NOTE 4 PROPERTY AND EQUIPMENT
A summary of property and equipment is as follows:
| | | February 1, 2003 | | | February 2, 2002 | |
|
Land and land improvements | | $ | 274,460 | | | $ | 271,686 | |
Buildings | | | 1,028,299 | | | | 997,353 | |
Leasehold improvements | | | 589,864 | | | | 594,733 | |
Fixtures and equipment | | | 1,447,677 | | | | 1,385,548 | |
Construction in progress | | | 13,783 | | | | 34,565 | |
|
| | | | 3,354,083 | | | | 3,283,885 | |
Accumulated depreciation | | | (1,210,978 | ) | | | (1,037,067 | ) |
|
| | | $ | 2,143,105 | | | $ | 2,246,818 | |
|
For 2002 and 2001, the Company recognized charges related to property and equipment of approximately $19,000 and $15,000, respectively, that are included in Losses from Long-Lived Assets in the accompanying consolidated statements of income. The 2002 charges largely related to the impairment of underproductive or closed store locations and, to a lesser extent, the write-down of fixed assets associated with the Younkers consolidation into Carson. The 2001 charges primarily relate to the write-off of fixed assets associated with the reorganization of Saks Direct and impairment charges taken on underproductive or closed store locations. These underproductive stores, at both SDSG and SFAE, had estimated future cash flows that were not in excess of their carrying book values. Based upon its most recent analyses at February 1, 2003, the Company believes that no additional impairment of property and equipment currently exists, other than that which has been reflected in the consolidated statements of income.
During 2001, the Company completed the sale of nine SDSG stores to the May Department Stores Company for an aggregate purchase price of approximately $308,000. The transaction included the sale of real and personal property, along with certain merchandise inventory and customer accounts receivable.
49
SAKS INCORPORATED & SUBSIDIARIES
NOTES TO CONSOLIDATED FINANCIAL STATEMENTS
(IN THOUSANDS, EXCEPT PER SHARE AMOUNTS)
SFAS No. 144, “Accounting for the Impairment or Disposal of Long-Lived Assets,” which replaced SFAS No. 121 and replaced certain provisions of APB Opinion No. 30, became effective in 2002. This standard reemphasizes significant issues addressed by SFAS 121 related to the recognition and measurement of the impairment of long-lived assets, whether held and used or to be disposed of by sale. This standard also extends the provisions of APB 30 regarding the reporting of discontinued operations, separate from continuing operations, to include “a component of an entity” that has either been disposed of or is held for sale. It is not expected that this standard will have a significant effect on the Company’s consolidated financial position or results of operations. However, the standard may impact the presentation of income and expenses associated with closed or disposed stores.
NOTE 5 GOODWILL AND OTHER INTANGIBLE ASSETS
SFAS No. 142, “Goodwill and Other Intangible Assets,” became effective for the Company in 2002. The standard revised the financial accounting to require the discontinuation of the amortization of goodwill and certain intangible assets, and the requirement of periodic testing (at least annually) for the impairment of goodwill. The standard required a goodwill impairment test as of the adoption date.
Consistent with its reportable operating segments, the Company identified its reporting units to be SDSG and SFAE. The fair value of these reporting units was estimated using the expected present value of associated future cash flows and market values of related businesses, where appropriate. The Company completed its impairment test during the first quarter of 2002 and determined that all of the $45,593 of non-deductible goodwill recorded within the SFAE reporting unit was impaired. This impairment was the result of sequential periods of decreased operating profit and generally reduced market values for luxury retailers. Accordingly, the Company recognized a charge for the cumulative effect of adopting the accounting standard as shown in the accompanying consolidated statements of income.
The changes in the carrying amounts of goodwill for 2002 and the components of other amortizable assets at February 1, 2003 were as follows:
| | | SDSG | | | SFAE | | | Consolidated | |
|
Goodwill balance at February 2, 2002 | | $ | 308,522 | | | $ | 45,593 | | | $ | 354,115 | |
Cumulative effect of adopting SFAS No. 142 | | | — | | | | (45,593 | ) | | | (45,593 | ) |
|
Goodwill balance at February 1, 2003 | | | 308,522 | | | | — | | | | 308,522 | |
Other amortizable intangible assets: | | | | | | | | | | | | |
Carrying amount of credit card base and customer lists | | | 8,115 | | | | 14,595 | | | | 22,710 | |
Accumulated amortization | | | (2,191 | ) | | | (12,611 | ) | | | (14,802 | ) |
|
Other amortizable intangible assets, net | | | 5,924 | | | | 1,984 | | | | 7,908 | |
|
Total goodwill and intangibles at February 1, 2003 | | $ | 314,446 | | | $ | 1,984 | | | $ | 316,430 | |
|
50
SAKS INCORPORATED & SUBSIDIARIES
NOTES TO CONSOLIDATED FINANCIAL STATEMENTS
(IN THOUSANDS, EXCEPT PER SHARE AMOUNTS)
The Company reassessed the lives of its amortizable intangible assets in connection with the adoption of the standard, which resulted in no changes to the useful lives. The components of amortization expense for 2002 and the related estimated amortization expense for the next five fiscal years are as follows:
| | | Credit Card Base | | Customer Lists | | Total Amortization |
|
Actual and estimated aggregate amortization expense: | | | | | | | | | |
2002 actual | | $ | 541 | | $ | 964 | | $ | 1,505 |
2003 estimated | | $ | 541 | | $ | 964 | | $ | 1,505 |
2004 estimated | | $ | 541 | | $ | 876 | | $ | 1,417 |
2005 estimated | | $ | 541 | | $ | 27 | | $ | 568 |
2006 estimated | | $ | 541 | | $ | 27 | | $ | 568 |
2007 estimated | | $ | 541 | | $ | 27 | | $ | 568 |
|
The following table presents the income and related earnings per share data adjusted for the effect of the change in goodwill amortization.
| | | 2002 | | 2001 | | 2000 |
|
Reported income before accounting change | | $ | 69,837 | | $ | 322 | | $ | 75,216 |
Add back: goodwill amortization | | | — | | | 13,084 | | | 19,569 |
| | |
|
| |
|
| |
|
|
Adjusted income before accounting change | | $ | 69,837 | | $ | 13,406 | | $ | 94,785 |
|
|
Reported net income | | $ | 24,244 | | $ | 322 | | $ | 75,216 |
Add back: goodwill amortization | | | — | | | 13,084 | | | 19,569 |
| | |
|
| |
|
| |
|
|
Adjusted net income | | $ | 24,244 | | $ | 13,406 | | $ | 94,785 |
|
|
Basic earnings per common share: | | | | | | | | | |
Reported income before accounting change | | $ | 0.49 | | $ | 0.00 | | $ | 0.53 |
Add back: goodwill amortization | | | — | | | 0.09 | | | 0.14 |
| |
|
Adjusted income before accounting change | | $ | 0.49 | | $ | 0.09 | | $ | 0.67 |
|
|
Reported net income | | $ | 0.17 | | $ | 0.00 | | $ | 0.53 |
Goodwill amortization | | | — | | | 0.09 | | | 0.14 |
| |
|
Adjusted net income | | $ | 0.17 | | $ | 0.09 | | $ | 0.67 |
|
|
Diluted earnings per common share: | | | | | | | | | |
Reported income before accounting change | | $ | 0.48 | | $ | 0.00 | | $ | 0.53 |
Add back: goodwill amortization | | | — | | | 0.09 | | | 0.14 |
| | |
|
| |
|
| |
|
|
Adjusted income before accounting change | | $ | 0.48 | | $ | 0.09 | | $ | 0.67 |
|
|
Reported net income | | $ | 0.17 | | $ | 0.00 | | $ | 0.53 |
Goodwill amortization | | | — | | | 0.09 | | | 0.14 |
| | |
|
| |
|
| |
|
|
Adjusted net income | | $ | 0.17 | | $ | 0.09 | | $ | 0.67 |
|
51
SAKS INCORPORATED & SUBSIDIARIES
NOTES TO CONSOLIDATED FINANCIAL STATEMENTS
(IN THOUSANDS, EXCEPT PER SHARE AMOUNTS)
NOTE 6 INCOME TAXES
The components of income tax expense were as follows:
| | | 2002 | | | 2001 | | | 2000 | |
|
Current: | | | | | | | | | | | | |
Federal | | $ | (395 | ) | | $ | (2,672 | ) | | $ | (34,871 | ) |
State | | | 175 | | | | 1,808 | | | | 1,583 | |
|
Deferred: | | | (220 | ) | | | (864 | ) | | | (33,288 | ) |
Federal | | | 40,196 | | | | 7,289 | | | | 73,833 | |
State | | | 172 | | | | (6,224 | ) | | | (162 | ) |
|
| | | | 40,368 | | | | 1,065 | | | | 73,671 | |
|
Total expense | | $ | 40,148 | | | $ | 201 | | | $ | 40,383 | |
|
Components of the net deferred tax asset or liability recognized in the consolidated balance sheets were as follows:
| | | February 1, 2003 | | | February 2, 2002 | |
|
Current: | | | | | | | | |
Deferred tax assets: | | | | | | | | |
Accrued expenses | | $ | 45,605 | | | $ | 47,492 | |
AMT credit | | | 3,518 | | | | 5,794 | |
NOL carryforwards | | | 29,614 | | | | 32,999 | |
Deferred tax liabilities: | | | | | | | | |
Retained interest in accounts receivable | | | (24,440 | ) | | | (21,804 | ) |
Inventory | | | (12,491 | ) | | | (3,912 | ) |
|
Net current deferred tax asset | | $ | 41,806 | | | $ | 60,569 | |
|
Non-current: | | | | | | | | |
Deferred tax assets: | | | | | | | | |
Capital leases | | $ | 24,118 | | | $ | 23,076 | |
Other long-term liabilities | | | 73,674 | | | | 73,998 | |
NOL carryforwards | | | 205,398 | | | | 232,166 | |
Valuation allowance | | | (24,931 | ) | | | (6,868 | ) |
Deferred tax liabilities: | | | | | | | | |
Property and equipment | | | (122,523 | ) | | | (139,937 | ) |
Other assets | | | (6,931 | ) | | | (9,358 | ) |
|
Net non-current deferred tax asset | | $ | 148,805 | | | $ | 173,077 | |
|
52
SAKS INCORPORATED & SUBSIDIARIES
NOTES TO CONSOLIDATED FINANCIAL STATEMENTS
(IN THOUSANDS, EXCEPT PER SHARE AMOUNTS)
At February 1, 2003, the Company had $636,957 of federal tax net operating loss carryforwards (“NOLs”). During 2002, the Company recorded a full valuation allowance against its state tax NOL carryforwards. The carryforwards will expire between 2004 and 2018. The future utilization of the federal carryforwards is restricted under federal income tax change-in-ownership rules. The Company believes it will be profitable during periods from 2003 through 2018 sufficiently to utilize the benefit of the NOLs, after considering the valuation allowance, and it is more likely than not that the benefit of the net deferred tax assets will be realized.
The valuation allowance attributable to Carson’s federal losses and tax basis differences was reduced by $15,405 for 2000, based on management’s reassessment of the realizability of the related deferred tax asset in future years. The tax benefit resulting from the reduction in the valuation allowance was credited directly to Shareholders’ Equity.
Income tax expense varies from the amount computed by applying the statutory federal income tax rate to income before taxes. The reasons for this difference were as follows:
| | | 2002 | | 2001 | | | 2000 | |
|
Expected income taxes at 35% | | $ | 22,533 | | $ | 183 | | | $ | 40,460 | |
State income taxes, net of federal benefit | | | 455 | | | (3,829 | ) | | | 2,848 | |
Non-deductible goodwill | | | 15,957 | | | 3,297 | | | | 3,755 | |
Effect of concluding state tax examinations, net | | | 23 | | | — | | | | — | |
Non-deductible merger related costs | | | — | | | — | | | | (1,694 | ) |
Other items, net (includes nontaxable gain in 2000) | | | 1,180 | | | 550 | | | | (4,986 | ) |
|
Provision for income taxes | | $ | 40,148 | | $ | 201 | | | $ | 40,383 | |
|
During 2002, the Company favorably concluded a number of state tax examinations, many of which had addressed corporate organization changes that had occurred over the previous five years in conjunction with the Company’s multiple acquisitions. The effect of the favorable conclusion to the state examinations and the related corporate organization changes was to reduce the asset representing the future utilization of state net operating loss carryforwards ($20,123), to reduce the deferred tax rate representing the state tax benefit of tax basis differences ($17,700), and to reduce the liability representing exposures associated with various state and federal tax positions ($37,800).
The Company made income tax payments, net of refunds received, of $1,134, $319 and $4,691 during 2002, 2001 and 2000, respectively.
53
SAKS INCORPORATED & SUBSIDIARIES
NOTES TO CONSOLIDATED FINANCIAL STATEMENTS
(IN THOUSANDS, EXCEPT PER SHARE AMOUNTS)
NOTE 7 LONG-TERM DEBT
A summary of long-term debt is as follows:
| | | February 1, 2003 | | | February 2, 2002 | |
|
Notes 7.25%, maturing 2004 | | $ | 70,363 | | | $ | 73,613 | |
Notes 7.00%, maturing 2004 | | | 72,286 | | | | 93,286 | |
Notes 8.25%, maturing 2008 | | | 451,550 | | | | 451,550 | |
Notes 7.50%, maturing 2010 | | | 250,000 | | | | 250,000 | |
Notes 9.875%, maturing 2011 | | | 141,557 | | | | 141,557 | |
Notes 7.375%, maturing 2019 | | | 200,000 | | | | 200,000 | |
Revolving credit agreement | | | — | | | | — | |
Real estate and mortgage | | | 7,168 | | | | 7,819 | |
Capital lease obligations | | | 139,238 | | | | 143,816 | |
|
| | | | 1,332,162 | | | | 1,361,641 | |
Current portion | | | (4,781 | ) | | | (5,061 | ) |
|
| | | $ | 1,327,381 | | | $ | 1,356,580 | |
|
REVOLVING CREDIT AGREEMENT
At February 1, 2003, the Company had in place a $700,000 revolving credit agreement that will mature in November 2006. Borrowings under the agreement are secured by substantially all of the Company’s merchandise inventories and the capital stock of most of the Company’s subsidiaries. Borrowings are limited to a prescribed percentage of eligible inventories. At February 1, 2003 the carrying amount of inventories securing the credit agreement was $1,202,437, and the prescribed percentage of eligible inventories exceeded the $700,000 credit limit by $105,036.
During periods in which availability under the agreement exceeds $100,000, the Company is not subject to financial covenants. If and when availability under the agreement decreases to less than $100,000, the Company will be subject to a minimum fixed charge coverage ratio of 1 to 1. There is no debt rating trigger. During 2002, weighted average borrowings and letters of credit issued under this credit agreement were $123,510. The highest amount of borrowings and letters of credit outstanding under the agreement during 2002 was $235,380 in November 2002, principally related to the funding of seasonal working capital needs. Borrowings bear interest at LIBOR plus a percentage ranging from 2.00% to 3.00% or at a bank’s base rate plus a percentage ranging from .50% to 1.50%.
The Company routinely issues stand-by and documentary letters of credit for purposes of securing foreign sourced merchandise, certain equipment leases, certain insurance programs and other contingent liabilities. Outstanding letters of credit serve to reduce availability under the revolving line of credit. During 2002, the maximum amount of letters of credit outstanding at any time was approximately $130,000 (and $106,000 was outstanding at February 1, 2003).
SENIOR NOTES
The Company had $1,185,756 of outstanding senior unsecured notes at February 1, 2003. There are no financial covenants associated with these notes, and there are no debt rating triggers. The notes restrict incurring secured debt to (1) the financing associated with proprietary credit card receivables and the $700,000 revolving credit agreement and (2) debt that could be placed on certain property and equipment acquired since 1998.
During 2002, the Company used cash from operations to repurchase $24,250 in senior notes. This repurchase resulted in a gain on extinguishment of debt of $709 associated with the prior termination of a related interest rate swap agreement. During 2001, certain of the proceeds from the sale of the nine SDSG store locations in March 2001 were used to repurchase $298,410 of senior notes. The senior notes were repurchased at a discount to the carrying value resulting in a gain on extinguishment of debt of $22,836. During 2001, the Company also exchanged $141,584 of cash and $141,557 of new 9.875% Notes due 2011 for $283,141 of the 2004 Notes. The Company realized a $3,274 gain on this extinguishment of debt resulting from the termination of an interest rate swap agreement.
54
SAKS INCORPORATED & SUBSIDIARIES
NOTES TO CONSOLIDATED FINANCIAL STATEMENTS
(IN THOUSANDS, EXCEPT PER SHARE AMOUNTS)
MATURITIES
At February 1, 2003, maturities of long-term debt for the next five years and thereafter are as follows:
Year | | Maturities |
|
2003 | | $ | 4,781 |
2004 | | | 152,889 |
2005 | | | 5,127 |
2006 | | | 5,434 |
2007 | | | 7,795 |
Thereafter | | | 1,156,136 |
|
| | | $ | 1,332,162 |
|
The Company made interest payments of $119,979, $130,053 and $156,730, of which $2,897, $4,757 and $12,507 was capitalized during 2002, 2001 and 2000, respectively.
NOTE 8COMMITMENTS AND CONTINGENCIES
The Company leases certain property and equipment under various non-cancelable capital and operating leases. The leases provide for monthly fixed amount rentals or contingent rentals based upon sales in excess of stated amounts and normally require the Company to pay real estate taxes, insurance, common area maintenance costs and other occupancy costs. Generally, the leases have primary terms ranging from 20 to 30 years and include renewal options ranging from 5 to 20 years.
At February 1, 2003, future minimum rental commitments under capital leases and non-cancelable operating leases consisted of the following:
| | | Operating Leases | | Capital Leases | |
|
2003 | | $ | 139,724 | | $ | 23,041 | |
2004 | | | 132,139 | | | 23,161 | |
2005 | | | 125,156 | | | 19,585 | |
2006 | | | 114,791 | | | 18,871 | |
2007 | | | 105,060 | | | 23,097 | |
Thereafter | | | 669,499 | | | 251,574 | |
|
| | | | 1,286,369 | | | 359,329 | |
|
Amounts representing interest | | | | | | (220,091 | ) |
|
Capital lease obligations | | | | | $ | 139,238 | |
|
Total rental expense for operating leases was $203,636, $200,932 and $196,813 during 2002, 2001 and 2000, respectively, including contingent rents of $22,838, $24,722 and $27,466, respectively, and common area maintenance costs of $26,075, $26,019 and $23,718, respectively.
The Company maintains two operating leases for transportation equipment that provide for a guaranteed residual value aggregating $20,000 upon expiration of the leases in 2003.
The Company has no commitments that are tied to the value of Saks Incorporated’s common stock. The Company has one agreement related to providing security to support prior years’ workers’ compensation obligations, which could require posting a letter of credit for $22,000 upon a reduction in debt ratings.
55
SAKS INCORPORATED & SUBSIDIARIES
NOTES TO CONSOLIDATED FINANCIAL STATEMENTS
(IN THOUSANDS, EXCEPT PER SHARE AMOUNTS)
The Company maintains certain licensing agreements related to some of its private brand merchandise and information technology software. These agreements have terms that generally do not exceed five years. Annual commitments for these agreements are approximately $4,000.
The Company purchases merchandise under purchase commitments and enters contractual commitments with real estate developers and construction companies for new store construction and store remodeling in the normal course of business. Commitments for purchasing merchandise generally do not extend beyond six months and may be cancelable several weeks prior to the vendor shipping the merchandise. Contractual commitments for the construction and remodeling of stores are typical lump sum or cost plus construction contracts.
The Company is involved in several legal proceedings arising from its normal business activities, and reserves for such claims have been established where appropriate. Management believes that none of these legal proceedings will have a material adverse effect on the Company’s consolidated financial condition, results of operations or liquidity. Also, the Company and NBGL will voluntarily enter into consent orders with the U.S. Office of the Comptroller of the Currency (the “OCC”). The consent orders require, among other things, that the Company and NBGL implement and monitor policies and procedures to ensure compliance with the provisions of the Bank Secrecy Act and the related regulations of the OCC, including without limitation the requirements to maintain policies and procedures designed to comply with the recordkeeping and reporting requirements of the Bank Secrecy Act and to timely file Currency Transaction Reports and Suspicious Activity Reports with respect to certain currency payments taken on NBGL’s credit card accounts and on credit card accounts for which the Company or its subsidiaries act as servicer.
The Company is routinely under audit by federal, state or local authorities in the areas of income taxes and the remittance of sales and use taxes. These audits include questioning the timing and amount of deductions and the allocation of income among various tax jurisdictions. In evaluating the exposure associated with various tax filing positions, the Company often accrues charges for probable exposures. Based on annual evaluations of tax positions, the Company believes it has appropriately accrued for probable exposures. To the extent the Company were to prevail in matters for which accruals have been established or be required to pay amounts in excess of reserves, the Company’s effective tax rate in a given financial statement period may be materially impacted. At February 1, 2003, two of the Company’s five open tax years were undergoing examination by the Internal Revenue Service.
NOTE 9 EMPLOYEE BENEFIT PLANS
EMPLOYEE SAVINGS PLANS
The Company sponsors various qualified savings plans that cover substantially all full-time employees. Company contributions charged to expense under these plans, or similar predecessor plans, for 2002, 2001 and 2000 were $16,623, $9,800 and $9,512, respectively. At February 1, 2003, total invested assets related to the employee savings plans was $432,767, of which approximately 3% was invested in the Company’s stock at the discretion of the participating employees.
DEFINED BENEFIT PLANS
The Company sponsors defined benefit pension plans for many employees of Carson’s and SFAE. Benefits are principally based upon years of service and compensation prior to retirement. The Company generally funds pension costs currently, subject to regulatory funding limitations.
The components of net periodic pension expense are as follows:
| | | 2002 | | | 2001 | | | 2000 | |
|
Net periodic pension expense: | | | | | | | | | | | | |
Service cost | | $ | 8,157 | | | $ | 12,992 | | | $ | 12,476 | |
Interest cost | | | 22,852 | | | | 22,424 | | | | 20,895 | |
Expected return on plan assets | | | (21,310 | ) | | | (24,144 | ) | | | (22,906 | ) |
Net amortization of gains (losses) and prior service costs | | | 2,015 | | | | (542 | ) | | | (541 | ) |
|
Net pension expense | | $ | 11,714 | | | $ | 10,730 | | | $ | 9,924 | |
|
56
SAKS INCORPORATED & SUBSIDIARIES
NOTES TO CONSOLIDATED FINANCIAL STATEMENTS
(IN THOUSANDS, EXCEPT PER SHARE AMOUNTS)
| | | 2002 | | | 2001 | |
|
Change in benefit obligation: | | | | | | | | |
Benefit obligation at beginning of period (November 1) | | $ | 332,179 | | | $ | 291,040 | |
Service cost | | | 8,157 | | | | 12,992 | |
Interest cost | | | 22,852 | | | | 22,424 | |
Plan amendment | | | (1,274 | ) | | | — | |
Actuarial loss | | | 13,229 | | | | 26,852 | |
Benefits paid | | | (28,769 | ) | | | (21,129 | ) |
|
Benefit obligation at end of period (November 1) | | $ | 346,374 | | | $ | 332,179 | |
|
Change in plan assets: | | | | | | | | |
Fair value of plan assets at beginning of period (November 1) | | $ | 216,851 | | | $ | 267,339 | |
Actual return on plan assets | | | (15,297 | ) | | | (30,944 | ) |
Employer contributions | | | 23,120 | | | | 1,585 | |
Benefits paid | | | (28,769 | ) | | | (21,129 | ) |
|
Fair value of plan assets at end of period (November 1) | | $ | 195,905 | | | $ | 216,851 | |
|
Pension plans’ funding status: | | | | | | | | |
Accumulated benefit obligation at November 1 | | $ | (340,212 | ) | | $ | (307,296 | ) |
Effect of projected salary increases | | | (6,162 | ) | | | (24,883 | ) |
|
Projected benefit obligation at November 1 | | | (346,374 | ) | | | (332,179 | ) |
Fair value of plan assets at November 1 | | | 195,905 | | | | 216,851 | |
|
Funded status at November 1 | | | (150,469 | ) | | | (115,328 | ) |
Unrecognized actuarial loss | | | 121,593 | | | | 69,584 | |
Unrecognized prior service cost | | | 178 | | | | 1,829 | |
Contributions subsequent to November 1 | | | 47,586 | | | | 2,163 | |
|
Prepaid (accrued) pension cost classified in other liabilities at balance sheet date | | $ | 18,888 | | | $ | (41,752 | ) |
|
Amounts recognized in the consolidated balance sheet: | | | | | | | | |
Accrued benefit liability (reflected in Other Long-Term Liabilities) | | $ | (98,003 | ) | | $ | (90,848 | ) |
Intangible asset | | | 7,117 | | | | 1,713 | |
Additional minimum pension liability (reflected in Shareholders’ Equity, net of tax) | | | 109,774 | | | | 47,383 | |
|
Net amount recognized at balance sheet date | | $ | 18,888 | | | $ | (41,752 | ) |
|
Assumptions: | | | | | | | | |
Discount rate, at end of period | | | 6.75 | % | | | 7.25 | % |
Expected long-term rate of return on assets, for periods ended February 1, 2003 and February 2, 2002 | | | 9.00 | % | | | 9.50 | % |
Average assumed rate of compensation increase | | | 4.00 | % | | | 4.00 | % |
Measurement date | | | 11/1/02 | | | | 11/1/01 | |
57
SAKS INCORPORATED & SUBSIDIARIES
NOTES TO CONSOLIDATED FINANCIAL STATEMENTS
(IN THOUSANDS, EXCEPT PER SHARE AMOUNTS)
At November 1, 2002, the plans’ Projected Benefit Obligation exceeded the fair value of the plans’ assets by $150,469. The underfunded status is reflected in the accompanying balance sheet as follows:
Amount previously recognized through expense and reflected in Other Long-Term Liabilities at February 1, 2003 | | $ | 28,698 |
Amount not recognized in expense, yet recognized in Other Comprehensive Income, in Other Long-Term Liabilities and in Shareholders’ Equity | | | 109,774 |
Amount not recognized in expense, yet reflected in Other Assets and Other Long-Term Liabilities | | | 7,117 |
Amount not recognized in expense and not reflected in Other Long-Term Liabilities | | | 4,880 |
|
Total underfunded status at November 1, 2002 | | $ | 150,469 |
|
The Company contributed $47,586 to the plans in January 2003. This contribution served to reduce the underfunded status of the plan and the liability reflected in Other Long-Term Liabilities. The effect of this contribution will be reflected in Other Comprehensive Income in 2003.
Pension assumptions are based upon management’s best estimates, after consulting with outside investment advisors and actuaries, as of the annual measurement date.
| | • | | To the extent the discount rate increases or decreases, the Company’s Accumulated Benefit Obligation (ABO) is decreased or increased, respectively. The estimated effect of a 0.25% change in the discount rate is $7.5 million on the ABO and $0.8 million on annual pension expense. To the extent the ABO increases, the after-tax effect of such serves to reduce Other Comprehensive Income and reduce Shareholders’ Equity. |
| | • | | To the extent the actual rate of return on assets realized is greater than the assumed rate, that year’s annual pension expense is not affected. Rather this gain reduces future pension expense over a period of approximately 15 to 20 years. To the extent the actual rate of return on assets is less than the assumed rate, that year’s annual pension expense is likewise not affected. Rather, this loss increases pension expense over approximately 15 to 20 years. The Company will lower the expected long-term rate of return on assets to 8.50% in 2003, which is expected to increase the annual pension expense approximately $1.0 million. |
| | • | | The average rate of compensation increases is utilized principally in calculating the Projected Benefit Obligation and annual pension expense. The estimated effect of a 0.25% change in the expected compensation increase would not be material to the Projected Benefit Obligation or to annual pension expense. |
| | • | | At November 1, 2002, the Company had unrecognized pension expense of $121,771 related to the delayed recognition of differences between underlying actuarial assumptions and actual results, and plan amendments. This delayed recognition of expense is incorporated into the $150,469 underfunded status of the plans as presented in the table above. |
58
SAKS INCORPORATED & SUBSIDIARIES
NOTES TO CONSOLIDATED FINANCIAL STATEMENTS
(IN THOUSANDS, EXCEPT PER SHARE AMOUNTS)
RETIREE HEALTH CARE PLANS
The Company provides health care benefits for certain groups of employees who retired before 1997. The plans were contributory with the Company providing a frozen annual credit of varying amounts per year of service. The net annual expense and liabilities for the unfunded plans reflected in the Company’s consolidated balance sheets are as follows:
| | | 2002 | | | 2001 | |
|
Change in benefit obligation: | | | | | | | | |
Change in benefit obligation: | | | | | | | | |
Benefit obligation at beginning of period (November 1) | | $ | 7,578 | | | $ | 7,013 | |
Interest cost | | | 520 | | | | 529 | |
Actuarial loss | | | 569 | | | | 675 | |
Benefits paid | | | (648 | ) | | | (639 | ) |
|
Benefit obligation at end of period (November 1) | | $ | 8,019 | | | $ | 7,578 | |
|
Plan funding status: | | | | | | | | |
Accumulated post-retirement benefit obligation at November 1 | | $ | (8,019 | ) | | $ | (7,578 | ) |
Fair value of plan assets at November 1 | | | — | | | | — | |
Funded status at November 1 | | | (8,019 | ) | | | (7,578 | ) |
|
Unrecognized actuarial gain | | | (4,606 | ) | | | (5,566 | ) |
Contributions subsequent to measurement date | | | 140 | | | | 146 | |
|
Accrued pension cost classified in other liabilities at balance sheet date | | $ | (12,485 | ) | | $ | (12,998 | ) |
|
Sensitivity analysis: | | | | | | | | |
Effect of a 1.0% increase in health care cost trend assumption on total service cost and interest cost components | | $ | 28 | | | $ | 27 | |
Effect on benefit obligations | | $ | 422 | | | $ | 427 | |
Effect of a 1.0% decrease in health care cost trend assumption on total service cost and interest cost components | | $ | (26 | ) | | $ | (25 | ) |
Effect on benefit obligation | | $ | (381 | ) | | $ | (388 | ) |
| | | | | | | | | |
Assumptions: | | | | | | | | |
Discount rate, at end of period | | | 6.75 | % | | | 7.25 | % |
Pre-Medicare medical inflation | | | 10.00 | % | | | 10.00 | % |
Post-Medicare medical inflation | | | 10.00 | % | | | 10.00 | % |
Ultimate medical inflation | | | 5.50 | % | | | 5.50 | % |
Measurement date | | | 11/1/02 | | | | 11/1/01 | |
NOTE 10 SHAREHOLDERS’ EQUITY
PREFERRED STOCK
The Company has 10,000 shares of Series A Cumulative Convertible Exchangeable Preferred Stock authorized and no shares issued and outstanding at February 1, 2003 or February 2, 2002.
COMMON STOCK
The Company has 500,000 shares of $.10 par value common shares authorized of which 144,960 and 143,989 shares were issued and outstanding at February 1, 2003 and February 2, 2002, respectively.
59
SAKS INCORPORATED & SUBSIDIARIES
NOTES TO CONSOLIDATED FINANCIAL STATEMENTS
(IN THOUSANDS, EXCEPT PER SHARE AMOUNTS)
The Company maintains authorized common share repurchase programs. During 2002, 2001 and 2000, the Company repurchased 700, 460 and 2,041 shares under the programs for an aggregate amount of $7,111, $3,586 and $25,010, respectively. There were 4,796 shares available for repurchase under authorized programs at February 1, 2003.
Each outstanding share of common stock has one preferred stock purchase right attached. The rights generally become exercisable ten days after an outside party acquires, or makes an offer for, 20% or more of the common stock. Each right entitles its holder to buy 1/200 share of Series C Junior Preferred Stock at an exercise price of $278 per 1/100 of a share, subject to adjustment in certain cases. The rights expire in March 2008. Once exercisable, if the Company is involved in a merger or other business combination or an outside party acquires 20% or more of the common stock, each right will be modified to entitle its holder (other than the acquirer) to purchase common stock of the acquiring company or, in certain circumstances, common stock having a market value of twice the exercise price of the right.
NOTE 11 EMPLOYEE STOCK PLANS
STOCK OPTIONS AND GRANTS
The Company maintains stock plans for the granting of options, stock appreciation rights and restricted shares to officers, employees and directors. At February 1, 2003 and February 2, 2002, the Company had available for grant 1,379 and 3,291 shares of common stock, respectively. Options granted generally vest over a four-year period after issue and have an exercise term of seven to ten years from the grant date. Restricted shares generally vest one to ten years after the grant date with accelerated vesting at the discretion of the Company’s Board of Directors.
A summary of the stock option plans for 2002, 2001 and 2000 is presented below:
| | | 2002 | | 2001 | | 2000 |
|
| | | Shares | | | Weighted Average Exercise Price | | Shares | | | Weighted Average Exercise Price | | Shares | | | Weighted Average Exercise Price |
|
Outstanding at beginning of year | | 27,602 | | | $ | 14.57 | | 25,094 | | | $ | 15.20 | | 11,892 | | | $ | 21.92 |
Granted | | 2,352 | | | | 13.14 | | 4,707 | | | | 11.18 | | 14,964 | | | | 10.35 |
Exercised | | (1,521 | ) | | | 9.83 | | (267 | ) | | | 8.75 | | (76 | ) | | | 7.54 |
Forfeited | | (1,399 | ) | | | 15.97 | | (1,932 | ) | | | 15.24 | | (1,686 | ) | | | 19.69 |
|
Outstanding at end of year | | 27,034 | | | $ | 14.65 | | 27,602 | | | $ | 14.57 | | 25,094 | | | $ | 15.20 |
Options exercisable at year end | | 17,530 | | | $ | 16.31 | | 14,303 | | | $ | 16.94 | | 7,780 | | | $ | 20.42 |
|
Weighted average fair value of options granted during the year | | $6.25 | | $6.11 | | $5.88 |
|
The following table summarizes information about stock options outstanding at February 1, 2003:
| | | Options Outstanding | | Options Exercisable |
|
Range of Exercise Prices | | Number Outstanding at February 1, 2003 | | Weighted Average Remaining Contractual Life (Years) | | Weighted Average Exercise Price | | Number Exercisable at February 1, 2003 | | Weighted Average Exercise Price |
|
$5.64 to $ 8.45 | | 215 | | 2 | | $ | 6.15 | | 181 | | $ | 6.00 |
$8.46 to $ 12.69 | | 17,582 | | 7 | | $ | 10.66 | | 9,437 | | $ | 10.62 |
$12.70 to $ 18.69 | | 2,448 | | 6 | | $ | 15.21 | | 1,365 | | $ | 15.66 |
$18.70 to $ 28.05 | | 4,143 | | 5 | | $ | 21.15 | | 4,100 | | $ | 21.12 |
$28.06 to $ 42.09 | | 2,582 | | 5 | | $ | 30.69 | | 2,383 | | $ | 30.88 |
$42.10 to $ 63.15 | | 64 | | 4 | | $ | 47.45 | | 64 | | $ | 47.45 |
|
| | | 27,034 | | | | $ | 14.65 | | 17,530 | | $ | 16.31 |
|
60
SAKS INCORPORATED & SUBSIDIARIES
NOTES TO CONSOLIDATED FINANCIAL STATEMENTS
(IN THOUSANDS, EXCEPT PER SHARE AMOUNTS)
The Company also granted restricted stock awards of 585, 900 and 790 shares to certain employees in 2002, 2001 and 2000, respectively. The fair value of these awards on the dates of grants was $6,790, $9,621 and $8,877 for 2002, 2001 and 2000, respectively. During 2002, 2001 and 2000, compensation cost of $7,213, $6,182 and $5,582, respectively, had been recognized in connection with these awards. At February 1, 2003 and February 2, 2002, the Company had unearned compensation amounts related to these awards of $11,280 and $13,894, respectively, included in Additional Paid-in Capital. The Company has committed to make additional grants of stock aggregating up to 500 shares upon the Company’s share value attaining certain appreciated values (ranging from $17.57 to $29.30) prior to May 31, 2006.
STOCK PURCHASE PLAN
The stock purchase plan provides for an aggregate of 1,450 shares of the Company’s common stock to be purchased. At February 1, 2003, the plan had 561 shares available for purchase. Under the stock purchase plan, an eligible employee may elect to participate by authorizing limited payroll deductions to be applied toward the purchase of common stock at a 15.0% discount to market value. Under the stock purchase plan, 127 ($1.0 million), 123 ($0.9 million) and 221 ($1.9 million) shares of the Company’s common stock were purchased by employees in 2002, 2001 and 2000, respectively. At February 1, 2003, the stock purchase plan had 623 shares available for future offerings.
NOTE 12 FAIR VALUES OF FINANCIAL INSTRUMENTS
The fair values of the Company’s cash and cash equivalents, retained interest in accounts receivable and accounts payable approximate their carrying amounts reported in the consolidated balance sheets, due to the immediate or short-term maturity of these instruments. For variable rate notes that reprice frequently, such as the revolving credit agreement, fair value approximates carrying value. The fair value of fixed rate real estate and mortgage notes is estimated using discounted cash flow analyses with interest rates currently offered for loans with similar terms and credit risk, and as of February 1, 2003 and February 2, 2002 the fair value of these notes approximated the carrying value.
The fair values of the Company’s financial instruments other than the instruments considered short-term in nature at February 1, 2003 and February 2, 2002 were as follows:
| | | Carrying Amount | | Estimated Fair Value |
|
February 1, 2003 | | | | | | |
7.25% senior notes | | $ | 70,363 | | $ | 71,100 |
7.00% senior notes | | $ | 72,286 | | $ | 73,000 |
8.25% senior notes | | $ | 451,550 | | $ | 440,300 |
7.50% senior notes | | $ | 250,000 | | $ | 232,500 |
9.875% senior notes | | $ | 141,557 | | $ | 145,100 |
7.375% senior notes | | $ | 200,000 | | $ | 165,000 |
|
February 2, 2002 | | | | | | |
7.25% senior notes | | $ | 73,613 | | $ | 69,900 |
7.00% senior notes | | $ | 93,286 | | $ | 88,600 |
8.25% senior notes | | $ | 451,550 | | $ | 388,300 |
7.50% senior notes | | $ | 250,000 | | $ | 197,500 |
9.875% senior notes | | $ | 141,557 | | $ | 127,400 |
7.375% senior notes | | $ | 200,000 | | $ | 136,000 |
The fair values of the long-term debt were estimated based on quotes obtained from financial institutions for those or similar instruments or on the basis of quoted market prices.
61
SAKS INCORPORATED & SUBSIDIARIES
NOTES TO CONSOLIDATED FINANCIAL STATEMENTS
(IN THOUSANDS, EXCEPT PER SHARE AMOUNTS)
NOTE 13 INTEGRATION AND REORGANIZATION CHARGES
In October 2002, the Company announced plans to consolidate its Younkers home office operations into its Carson’s headquarters in an effort to further integrate its northern SDSG operations. Consistent with the adoption of SFAS 146, “Accounting for Costs Associated with Exit or Disposal Activities,” the Company has applied the provisions of this standard such that Younkers consolidation costs would be recognized when the expenses are incurred. The consolidation was substantially complete at February 1, 2003. The 2002 actual and 2003 estimated charges are summarized as follows:
| | | Actual 2002 | | Estimated 2003 | | Total Charges |
|
Severance and retention | | $ | 8,275 | | $ | 944 | | $ | 9,219 |
Property write-offs and accelerated depreciation | | | 3,961 | | | 401 | | | 4,362 |
Other | | | 1,706 | | | 72 | | | 1,778 |
|
Total | | $ | 13,942 | | $ | 1,417 | | $ | 15,359 |
|
At February 1, 2003, $4,089 of Younkers charges remained unpaid. All Younkers consolidation charges in 2002 are reflected in the Integration Charges and the Losses from Long-Lived Assets line items of the accompanying consolidated statements of income.
During 2001 and the first quarter of 2002, the Company reorganized its Saks Direct business (SFAE’s catalog and e-commerce operations). The charges for 2001 of $35,100 primarily related to severance, inventory markdowns, and the write-off of fixed assets and associated goodwill. During the first quarter of 2002, the Company incurred $763 of severance charges to complete the reorganization of these businesses. All Saks Direct charges are reflected in SG&A, Cost of Sales or Losses from Long-Lived Assets in the accompanying consolidated statements of income. At February 1, 2003, $543 of Saks Direct charges remained unpaid, of which the majority related to severance costs.
During 2001 and 2000, the Company incurred $1,539 and $19,886 of other integration charges, respectively, primarily related to the consolidation of three SDSG southern distribution centers and the consolidation of the McRae’s and Herberger’s operating divisions into Proffitt’s and Carson’s, respectively. At February 1, 2003, $1,051 of these integration charges remained unpaid, which principally consisted of severance amounts to be paid through 2004. All charges associated with these consolidations are reflected in the Integration Charges line item of the accompanying consolidated statements of income.
62
SAKS INCORPORATED & SUBSIDIARIES
NOTES TO CONSOLIDATED FINANCIAL STATEMENTS
(IN THOUSANDS, EXCEPT PER SHARE AMOUNTS)
NOTE 14 SEGMENT INFORMATION
The following tables represent summary segment financial information for 2002, 2001 and 2000 and are consistent with management’s view of the business operating structure.
| | | Year Ended | |
|
| | | February 1, 2003 | | | February 2, 2002 | | | February 3, 2001 | |
|
Net Sales: | | | | | | | | | | | | |
Saks Department Stores Group | | $ | 3,574,080 | | | $ | 3,621,819 | | | $ | 3,909,268 | |
Saks Fifth Avenue Enterprises | | | 2,337,042 | | | | 2,448,749 | | | | 2,671,968 | |
|
| | | $ | 5,911,122 | | | $ | 6,070,568 | | | $ | 6,581,236 | |
|
Operating Income: | | | | | | | | | | | | |
Saks Department Stores Group | | $ | 197,227 | | | $ | 222,910 | | | $ | 277,397 | |
Saks Fifth Avenue Enterprises | | | 101,466 | | | | (22,744 | ) | | | 115,730 | |
Other | | | (32,483 | ) | | | (31,691 | ) | | | (31,081 | ) |
Certain items, net | | | (33,111 | ) | | | (64,106 | ) | | | (100,185 | ) |
|
| | | $ | 233,099 | | | $ | 104,369 | | | $ | 261,861 | |
|
Depreciation and Amortization: | | | | | | | | | | | | |
Saks Department Stores Group | | $ | 113,247 | | | $ | 117,919 | | | $ | 117,881 | |
Saks Fifth Avenue Enterprises | | | 98,684 | | | | 99,196 | | | | 94,152 | |
Other | | | 4,091 | | | | 2,658 | | | | 2,066 | |
|
| | | $ | 216,022 | | | $ | 219,773 | | | $ | 214,099 | |
|
Total Assets: | | | | | | | | | | | | |
Saks Department Stores Group | | $ | 2,195,498 | | | $ | 2,202,762 | | | $ | 2,568,095 | |
Saks Fifth Avenue Enterprises | | | 1,770,820 | | | | 1,852,648 | | | | 2,018,990 | |
Other | | | 613,038 | | | | 540,111 | | | | 463,526 | |
|
| | | $ | 4,579,356 | | | $ | 4,595,521 | | | $ | 5,050,611 | |
|
Capital Expenditures: | | | | | | | | | | | | |
Saks Department Stores Group | | $ | 52,408 | | | $ | 67,723 | | | $ | 78,379 | |
Saks Fifth Avenue Enterprises | | | 47,459 | | | | 87,503 | | | | 99,775 | |
Other | | | 42,488 | | | | 64,612 | | | | 96,698 | |
|
| | | $ | 142,355 | | | $ | 219,838 | | | $ | 274,852 | |
|
63
SAKS INCORPORATED & SUBSIDIARIES
NOTES TO CONSOLIDATED FINANCIAL STATEMENTS
(IN THOUSANDS, EXCEPT PER SHARE AMOUNTS)
“Operating Income” for the segments includes revenue, cost of sales, direct selling, general and administrative expenses, other direct operating expenses for the respective segment and an allocation of certain operating expenses, including depreciation, shared by the two segments. “Other” consists of the assets, revenue and expenses associated with the corporate offices, certain accounting, finance, human resource, and information technology activities and other items managed on a company-wide basis. “Certain items” consist of those items that management excludes from its view of ongoing core operations and are not charged to the segments. During 2002, 2001 and 2000, certain items were comprised of the following:
| | | 2002 | | | 2001 | | | 2000 | |
|
Losses from long-lived assets | | $ | (19,547 | ) | | $ | (32,621 | ) | | $ | (73,572 | ) |
Integration charges | | | (9,981 | ) | | | (1,539 | ) | | | (19,886 | ) |
Reorganization charges | | | (763 | ) | | | (20,049 | ) | | | (7,652 | ) |
Other | | | (2,820 | ) | | | (9,897 | ) | | | 925 | |
|
Effect of Certain Items on Operating Income | | $ | (33,111 | ) | | $ | (64,106 | ) | | $ | (100,185 | ) |
|
64
SAKS INCORPORATED & SUBSIDIARIES
NOTES TO CONSOLIDATED FINANCIAL STATEMENTS
(IN THOUSANDS, EXCEPT PER SHARE AMOUNTS)
NOTE 15 QUARTERLY FINANCIAL INFORMATION (UNAUDITED)
Summarized quarterly financial information, including the reclassification effect of gains on extinguishment of debt in accordance with SFAS No. 145, is as follows:
| | | First Quarter* | | | Second Quarter | | | Third Quarter | | Fourth Quarter |
|
Fiscal year ended February 1, 2003 | | | | | | | | | | | | | | |
Total sales | | $ | 1,426,227 | | | $ | 1,237,232 | | | $ | 1,406,142 | | $ | 1,841,521 |
Gross margin | | | 536,854 | | | | 449,747 | | | | 530,384 | | | 654,890 |
Net income (loss) | | | (25,392 | ) | | | (20,400 | ) | | | 1,922 | | | 68,114 |
Basic earnings (loss) per common share, before cumulative effect of accounting change | | $ | 0.14 | | | $ | (0.14 | ) | | $ | 0.01 | | $ | 0.48 |
Basic earnings (loss) per common share, after cumulative effect of accounting change | | $ | (0.18 | ) | | $ | (0.14 | ) | | $ | 0.01 | | $ | 0.48 |
Diluted earnings (loss) per common share, before cumulative effect of accounting change | | $ | 0.14 | | | $ | (0.14 | ) | | $ | 0.01 | | $ | 0.47 |
Diluted earnings (loss) per common share, after cumulative effect of accounting change | | $ | (0.17 | ) | | $ | (0.14 | ) | | $ | 0.01 | | $ | 0.47 |
|
| * | | Includes the adoption of SFAS No. 142, which resulted in a charge of $45,593 representing the cumulative effect of adopting the standard. |
| | | First Quarter | | Second Quarter | | | Third Quarter | | | Fourth Quarter |
|
Fiscal year ended February 2, 2002 | | | | | | | | | | | | | | |
Total sales | | $ | 1,464,350 | | $ | 1,270,708 | | | $ | 1,423,551 | | | $ | 1,911,959 |
Gross margin | | | 546,561 | | | 422,418 | | | | 498,237 | | | | 643,223 |
Net income (loss) | | | 26,498 | | | (58,389 | ) | | | (21,753 | ) | | | 53,966 |
Basic earnings (loss) per common share, before cumulative effect of accounting change | | $ | 0.19 | | $ | (0.41 | ) | | $ | (0.15 | ) | | $ | 0.38 |
Basic earnings (loss) per common share, after cumulative effect of accounting change | | $ | 0.19 | | $ | (0.41 | ) | | $ | (0.15 | ) | | $ | 0.38 |
Diluted earnings (loss) per common share, before cumulative effect of accounting change | | $ | 0.18 | | $ | (0.41 | ) | | $ | (0.15 | ) | | $ | 0.37 |
Diluted earnings (loss) per common share, after cumulative effect of accounting change | | $ | 0.18 | | $ | (0.41 | ) | | $ | (0.15 | ) | | $ | 0.37 |
65
SAKS INCORPORATED & SUBSIDIARIES
NOTES TO CONSOLIDATED FINANCIAL STATEMENTS
(IN THOUSANDS, EXCEPT PER SHARE AMOUNTS)
NOTE 16 CONDENSED CONSOLIDATING FINANCIAL INFORMATION
The following tables present condensed consolidating financial information for 2002, 2001 and 2000 for: (1) Saks Incorporated; (2) on a combined basis, the guarantors of Saks Incorporated’s Senior Notes (which are all of the subsidiaries of Saks Incorporated except for NBGL, the subsidiaries associated with the Company’s proprietary credit card securitization program, and other immaterial subsidiaries); and (3) on a combined basis, NBGL, the subsidiaries associated with the Company’s proprietary credit card securitization program, and other immaterial subsidiaries, which collectively represent the only subsidiaries of the Company that are not guarantors of the Senior Notes. The condensed consolidating financial statements presented as of and for the years ended February 1, 2003, February 2, 2002 and February 3, 2001 reflect the legal entity compositions at the respective dates. Separate financial statements of the guarantor subsidiaries are not presented because the guarantors are jointly, severally, fully and unconditionally liable under the guarantees. Borrowings and the related interest expense under the Company’s revolving credit agreement are allocated to Saks Incorporated and the guarantor subsidiaries under an intercompany revolving credit arrangement. There are also management and royalty fee arrangements among Saks Incorporated and the subsidiaries. At February 1, 2003, Saks Incorporated was the sole obligor for a majority of the Company’s long-term debt, owned one store location and maintained a small group of corporate employees.
66
SAKS INCORPORATED & SUBSIDIARIES
NOTES TO CONSOLIDATED FINANCIAL STATEMENTS
(IN THOUSANDS, EXCEPT PER SHARE AMOUNTS)
CONDENSED CONSOLIDATING STATEMENTS OF INCOME FOR THE YEAR ENDED FEBRUARY 1, 2003
| | | Saks Incorporated | | | Guarantor Subsidiaries | | | Non-Guarantor Subsidiaries | | | Eliminations | | | Consolidated | |
|
NET SALES | | $ | 16,253 | | | $ | 5,894,869 | | | | | | | | | | | $ | 5,911,122 | |
Cost of sales | | | 10,172 | | | | 3,729,075 | | | | | | | | | | | | 3,739,247 | |
|
Gross Margin | | | 6,081 | | | | 2,165,794 | | | | | | | | | | | | 2,171,875 | |
Selling, general and administrative expenses | | | 11,221 | | | | 1,454,712 | | | $ | 93,660 | | | $ | (228,456 | ) | | | 1,331,137 | |
Other operating expenses | | | 3,828 | | | | 569,664 | | | | | | | | | | | | 573,492 | |
Store pre-opening costs | | | | | | | 4,619 | | | | | | | | | | | | 4,619 | |
Losses from long-lived assets | | | | | | | 19,547 | | | | | | | | | | | | 19,547 | |
Integration charges | | | | | | | 9,981 | | | | | | | | | | | | 9,981 | |
|
OPERATING INCOME (LOSS) | | | (8,968 | ) | | | 107,271 | | | | (93,660 | ) | | | 228,456 | | | | 233,099 | |
|
OTHER INCOME (EXPENSE) | | | | | | | | | | | | | | | | | | | | |
Finance charge income, net | | | | | | | | | | | 228,456 | | | | (228,456 | ) | | | | |
Intercompany exchange fees | | | | | | | (43,893 | ) | | | 43,893 | | | | | | | | | |
Intercompany servicer fees | | | | | | | 46,511 | | | | (46,511 | ) | | | | | | | | |
Equity in earnings of subsidiaries | | | 94,934 | | | | 47,910 | | | | | | | | (142,844 | ) | | | | |
Interest expense | | | (101,028 | ) | | | (20,189 | ) | | | (2,835 | ) | | | | | | | (124,052 | ) |
Gain on extinguishment of debt | | | 709 | | | | | | | | | | | | | | | | 709 | |
Other income (expense), net | | | | | | | 229 | | | | | | | | | | | | 229 | |
|
INCOME (LOSS) BEFORE PROVISION (BENEFIT) FOR INCOME TAXES AND CUMULATIVE EFFECT OF ACCOUNTING CHANGE | | | (14,353 | ) | | | 137,839 | | | | 129,343 | | | | (142,844 | ) | | | 109,985 | |
Provision (benefit) for income taxes | | | (38,597 | ) | | | 33,274 | | | | 45,471 | | | | | | | | 40,148 | |
|
Income before cumulative effect of accounting change | | | 24,244 | | | | 104,565 | | | | 83,872 | | | | (142,844 | ) | | | 69,837 | |
Cumulative effect of a change in accounting principle, net of taxes | | | | | | | (45,593 | ) | | | | | | | | | | | (45,593 | ) |
|
NET INCOME | | $ | 24,244 | | | $ | 58,972 | | | $ | 83,872 | | | $ | (142,844 | ) | | $ | 24,244 | |
|
67
SAKS INCORPORATED & SUBSIDIARIES
NOTES TO CONSOLIDATED FINANCIAL STATEMENTS
(IN THOUSANDS, EXCEPT PER SHARE AMOUNTS)
CONDENSED CONSOLIDATING BALANCE SHEETS AS OF FEBRUARY 1, 2003
| | | Saks Incorporated | | Guarantor Subsidiaries | | Non-Guarantor Subsidiaries | | | Eliminations | | | Consolidated |
|
ASSETS | | | | | | | | | | | | | | | | | |
CURRENT ASSETS | | | | | | | | | | | | | | | | | |
Cash and cash equivalents | | $ | 180,000 | | $ | 13,781 | | $ | 15,787 | | | | | | | $ | 209,568 |
Retained interest in accounts receivable | | | | | | | | | 267,062 | | | | | | | | 267,062 |
Merchandise inventories | | | 3,317 | | | 1,303,350 | | | | | | | | | | | 1,306,667 |
Intercompany borrowings | | | | | | 4,778 | | | 65,137 | | | $ | (69,915 | ) | | | |
Other current assets | | | | | | 93,422 | | | | | | | | | | | 93,422 |
Deferred income taxes, net | | | | | | 58,688 | | | (16,882 | ) | | | | | | | 41,806 |
|
TOTAL CURRENT ASSETS | | | 183,317 | | | 1,474,019 | | | 331,104 | | | | (69,915 | ) | | | 1,918,525 |
|
PROPERTY AND EQUIPMENT, NET | | | 6,793 | | | 2,136,312 | | | | | | | | | | | 2,143,105 |
GOODWILL AND INTANGIBLES, NET | | | | | | 316,430 | | | | | | | | | | | 316,430 |
DEFERRED INCOME TAXES, NET | | | | | | 148,805 | | | | | | | | | | | 148,805 |
OTHER ASSETS | | | 14,268 | | | 36,074 | | | 2,149 | | | | | | | | 52,491 |
INVESTMENT IN AND ADVANCES TO SUBSIDIARIES | | | 3,273,059 | | | 177,958 | | | | | | | (3,451,017 | ) | | | |
|
TOTAL ASSETS | | $ | 3,477,437 | | $ | 4,289,598 | | $ | 333,253 | | | $ | (3,520,932 | ) | | $ | 4,579,356 |
|
LIABILITIES AND SHAREHOLDERS’ EQUITY CURRENT LIABILITIES | | | | | | | | | | | | | | | | | |
Accounts payable | | $ | 829 | | $ | 273,160 | | | | | | | | | | $ | 273,989 |
Accrued expenses and other current liabilities | | | 22,591 | | | 493,331 | | | | | | | | | | | 515,922 |
Intercompany borrowings | | | | | | 65,137 | | $ | 4,778 | | | $ | (69,915 | ) | | | |
Current portion of long-term debt | | | | | | 4,781 | | | | | | | | | | | 4,781 |
|
TOTAL CURRENT LIABILITIES | | | 23,420 | | | 836,409 | | | 4,778 | | | | (69,915 | ) | | | 794,692 |
|
LONG-TERM DEBT | | | 1,185,756 | | | 141,625 | | | | | | | | | | | 1,327,381 |
OTHER LONG-TERM LIABILITIES | | | 989 | | | 189,022 | | | | | | | | | | | 190,011 |
INVESTMENT BY AND ADVANCES FROM PARENT | | | | | | 3,122,542 | | | 328,475 | | | | (3,451,017 | ) | | | |
SHAREHOLDERS’ EQUITY | | | 2,267,272 | | | | | | | | | | | | | | 2,267,272 |
|
TOTAL LIABILITIES AND SHAREHOLDERS’ EQUITY | | $ | 3,477,437 | | $ | 4,289,598 | | $ | 333,253 | | | $ | (3,520,932 | ) | | $ | 4,579,356 |
|
68
SAKS INCORPORATED & SUBSIDIARIES
NOTES TO CONSOLIDATED FINANCIAL STATEMENTS
(IN THOUSANDS, EXCEPT PER SHARE AMOUNTS)
CONDENSED CONSOLIDATING STATEMENTS OF CASH FLOWS FOR THE YEAR ENDED FEBRUARY 1, 2003
| | | Saks Incorporated | | | Guarantor Subsidiaries | | | Non-Guarantor Subsidiaries | | | Eliminations | | | Consolidated | |
|
OPERATING ACTIVITIES | | | | | | | | | | | | | | | | | | | | |
Net income | | $ | 24,244 | | | $ | 58,972 | | | $ | 83,872 | | | $ | (142,844 | ) | | $ | 24,244 | |
Adjustments to reconcile net income to net cash (used in) provided by operating activities: | | | | | | | | | | | | | | | | | | | | |
Equity in earnings of subsidiaries | | | (94,934 | ) | | | (47,910 | ) | | | | | | | 142,844 | | | | | |
Gain on extinguishment of debt | | | (709 | ) | | | | | | | | | | | | | | | (709 | ) |
Cumulative effect of accounting change | | | | | | | 45,593 | | | | | | | | | | | | 45,593 | |
Depreciation and amortization | | | 1,081 | | | | 214,941 | | | | | | | | | | | | 216,022 | |
Provision for employee deferred compensation | | | 7,213 | | | | | | | | | | | | | | | | 7,213 | |
Deferred income taxes | | | | | | | 38,200 | | | | 2,168 | | | | | | | | 40,368 | |
Losses from long-lived assets | | | | | | | 19,547 | | | | | | | | | | | | 19,547 | |
Changes in operating assets and liabilities, net | | | (82 | ) | | | (46,600 | ) | | | (29,295 | ) | | | | | | | (75,977 | ) |
|
NET CASH USED IN PROVIDED BY OPERATING ACTIVITIES | | | (63,187 | ) | | | 282,743 | | | | 56,745 | | | | | | | | 276,301 | |
|
INVESTING ACTIVITIES | | | | | | | | | | | | | | | | | | | | |
Purchases of property and equipment | | | | | | | (142,355 | ) | | | | | | | | | | | (142,355 | ) |
Proceeds from sale of assets | | | | | | | 2,434 | | | | | | | | | | | | 2,434 | |
|
NET CASH USED IN INVESTING ACTIVITIES | | | | | | | (139,921 | ) | | | | | | | | | | | (139,921 | ) |
|
FINANCING ACTIVITIES | | | | | | | | | | | | | | | | | | | | |
Intercompany borrowings | | | 196,872 | | | | (150,443 | ) | | | (46,429 | ) | | | | | | | | |
Payments on long-term debt | | | (24,164 | ) | | | (5,229 | ) | | | | | | | | | | | (29,393 | ) |
Purchases and retirements of common stock | | | (7,111 | ) | | | | | | | | | | | | | | | (7,111 | ) |
Proceeds from issuance of stock | | | 10,590 | | | | | | | | | | | | | | | | 10,590 | |
|
NET CASH PROVIDED BY (USED IN) FINANCING ACTIVITIES | | | 176,187 | | | | (155,672 | ) | | | (46,429 | ) | | | | | | | (25,914 | ) |
|
INCREASE (DECREASE) IN CASH AND CASH EQUIVALENTS | | | 113,000 | | | | (12,850 | ) | | | 10,316 | | | | | | | | 110,466 | |
CASH AND CASH EQUIVALENTS AT BEGINNING OF YEAR | | | 67,000 | | | | 26,631 | | | | 5,471 | | | | | | | | 99,102 | |
|
CASH AND CASH EQUIVALENTS AT END OF YEAR | | $ | 180,000 | | | $ | 13,781 | | | $ | 15,787 | | | | | | | $ | 209,568 | |
|
69
SAKS INCORPORATED & SUBSIDIARIES
NOTES TO CONSOLIDATED FINANCIAL STATEMENTS
(IN THOUSANDS, EXCEPT PER SHARE AMOUNTS)
CONDENSED CONSOLIDATING STATEMENTS OF INCOME FOR THE YEAR ENDED FEBRUARY 2, 2002
| | | Saks Incorporated | | | Guarantor Subsidiaries | | | Non-Guarantor Subsidiaries | | | Eliminations | | | Consolidated | |
|
NET SALES | | $ | 16,185 | | | $ | 6,043,677 | | | $ | 10,706 | | | | | | | $ | 6,070,568 | |
Cost of sales | | | 10,193 | | | | 3,936,928 | | | | 13,008 | | | | | | | | 3,960,129 | |
|
Gross Margin | | | 5,992 | | | | 2,106,749 | | | | (2,302 | ) | | | | | | | 2,110,439 | |
Selling, general and administrative expenses | | | 10,806 | | | | 1,498,493 | | | | 102,220 | | | $ | (222,232 | ) | | | 1,389,287 | |
Other operating expenses | | | 3,734 | | | | 572,085 | | | | 1,674 | | | | | | | | 577,493 | |
Store pre-opening costs | | | | | | | 5,130 | | | | | | | | | | | | 5,130 | |
Losses from long-lived assets | | | | | | | 32,621 | | | | | | | | | | | | 32,621 | |
Integration charges | | | | | | | 1,539 | | | | | | | | | | | | 1,539 | |
|
OPERATING INCOME (LOSS) | | | (8,548 | ) | | | (3,119 | ) | | | (106,196 | ) | | | 222,232 | | | | 104,369 | |
| | | | | | | | | | | | | | | | | | | | | |
OTHER INCOME (EXPENSE) | | | | | | | | | | | | | | | | | | | | |
Finance charge income, net | | | | | | | | | | | 222,232 | | | | (222,232 | ) | | | | |
Intercompany exchange fees | | | | | | | (42,826 | ) | | | 42,826 | | | | | | | | | |
Intercompany servicer fees | | | | | | | 49,407 | | | | (49,407 | ) | | | | | | | | |
Equity in earnings of subsidiaries | | | 52,808 | | | | 45,021 | | | | | | | | (97,829 | ) | | | | |
Interest expense | | | (105,772 | ) | | | (22,127 | ) | | | (3,140 | ) | | | | | | | (131,039 | ) |
Gain on extinguishment of debt | | | 26,110 | | | | | | | | | | | | | | | | 26,110 | |
Other income (expense), net | | | (68 | ) | | | 1,151 | | | | | | | | | | | | 1,083 | |
|
INCOME (LOSS) BEFORE PROVISION (BENEFIT) FOR INCOME TAXES | | | (35,470 | ) | | | 27,507 | | | | 106,315 | | | | (97,829 | ) | | | 523 | |
Provision (benefit) for income taxes | | | (35,792 | ) | | | (6,480 | ) | | | 42,473 | | | | | | | | 201 | |
|
NET INCOME | | $ | 322 | | | $ | 33,987 | | | $ | 63,842 | | | $ | (97,829 | ) | | $ | 322 | |
|
70
SAKS INCORPORATED & SUBSIDIARIES
NOTES TO CONSOLIDATED FINANCIAL STATEMENTS
(IN THOUSANDS, EXCEPT PER SHARE AMOUNTS)
CONDENSED CONSOLIDATING BALANCE SHEETS AS OF FEBRUARY 2, 2002
| | | Saks Incorporated | | Guarantor Subsidiaries | | Non-Guarantor Subsidiaries | | | Eliminations | | | Consolidated |
|
ASSETS | | | | | | | | | | | | | | | | | |
CURRENT ASSETS | | | | | | | | | | | | | | | | | |
Cash and cash equivalents | | $ | 67,000 | | $ | 26,631 | | $ | 5,471 | | | | | | | $ | 99,102 |
Retained interest in accounts receivable | | | | | | | | | 239,420 | | | | | | | | 239,420 |
Merchandise inventories | | | 3,349 | | | 1,292,529 | | | | | | | | | | | 1,295,878 |
Intercompany borrowings | | | | | | 2,880 | | | 30,286 | | | $ | (33,166 | ) | | | |
Other current assets | | | | | | 74,960 | | | | | | | | | | | 74,960 |
Deferred income taxes, net | | | | | | 75,283 | | | (14,714 | ) | | | | | | | 60,569 |
|
TOTAL CURRENT ASSETS | | | 70,349 | | | 1,472,283 | | | 260,463 | | | | (33,166 | ) | | | 1,769,929 |
|
PROPERTY AND EQUIPMENT, NET | | | 7,804 | | | 2,239,014 | | | | | | | | | | | 2,246,818 |
GOODWILL AND INTANGIBLES, NET | | | | | | 363,528 | | | | | | | | | | | 363,528 |
DEFERRED INCOME TAXES, NET | | | | | | 173,077 | | | | | | | | | | | 173,077 |
OTHER ASSETS | | | 15,207 | | | 23,215 | | | 3,747 | | | | | | | | 42,169 |
INVESTMENT IN AND ADVANCES TO SUBSIDIARIES | | | 3,417,119 | | | 166,107 | | | | | | | (3,583,226 | ) | | | |
|
TOTAL ASSETS | | $ | 3,510,479 | | $ | 4,437,224 | | $ | 264,210 | | | $ | (3,616,392 | ) | | $ | 4,595,521 |
|
|
LIABILITIES AND SHAREHOLDERS’ EQUITY CURRENT LIABILITIES | | | | | | | | | | | | | | | | | |
Accounts payable | | $ | 1,005 | | $ | 237,813 | | | | | | | | | | $ | 238,818 |
Accrued expenses and other current liabilities | | | 21,979 | | | 520,865 | | $ | 55 | | | | | | | | 542,899 |
Intercompany borrowings | | | 5,490 | | | 24,796 | | | 2,880 | | | $ | (33,166 | ) | | | |
Current portion of long-term debt | | | | | | 5,061 | | | | | | | | | | | 5,061 |
|
TOTAL CURRENT LIABILITIES | | | 28,474 | | | 788,535 | | | 2,935 | | | | (33,166 | ) | | | 786,778 |
|
LONG-TERM DEBT | | | 1,210,006 | | | 146,574 | | | | | | | | | | | 1,356,580 |
OTHER LONG-TERM LIABILITIES | | | 562 | | | 180,164 | | | | | | | | | | | 180,726 |
INVESTMENT BY AND ADVANCES FROM PARENT | | | | | | 3,321,951 | | | 261,275 | | | | (3,583,226 | ) | | | |
SHAREHOLDERS’ EQUITY | | | 2,271,437 | | | | | | | | | | | | | | 2,271,437 |
|
TOTAL LIABILITIES AND SHAREHOLDERS’ EQUITY | | $ | 3,510,479 | | $ | 4,437,224 | | $ | 264,210 | | | $ | (3,616,392 | ) | | $ | 4,595,521 |
|
71
SAKS INCORPORATED & SUBSIDIARIES
NOTES TO CONSOLIDATED FINANCIAL STATEMENTS
(IN THOUSANDS, EXCEPT PER SHARE AMOUNTS)
CONDENSED CONSOLIDATING STATEMENTS OF CASH FLOWS FOR THE YEAR ENDED FEBRUARY 2, 2002
| | | Saks Incorporated | | | Guarantor Subsidiaries | | | Non-Guarantor Subsidiaries | | | Eliminations | | | Consolidated | |
|
OPERATING ACTIVITIES | | | | | | | | | | | | | | | | | | | | |
Net income | | $ | 322 | | | $ | 33,987 | | | $ | 63,842 | | | $ | (97,829 | ) | | $ | 322 | |
Adjustments to reconcile net income to net cash (used in) provided by operating activities: | | | | | | | | | | | | | | | | | | | | |
Equity in earnings of subsidiaries | | | (52,808 | ) | | | (45,021 | ) | | | | | | | 97,829 | | | | | |
Gain on extinguishment of debt | | | (26,110 | ) | | | | | | | | | | | | | | | (26,110 | ) |
Depreciation and amortization | | | 1,035 | | | | 218,043 | | | | 695 | | | | | | | | 219,773 | |
Provision for employee deferred compensation | | | 6,182 | | | | | | | | | | | | | | | | 6,182 | |
Deferred income taxes | | | | | | | (55 | ) | | | 1,120 | | | | | | | | 1,065 | |
Losses from long-lived assets | | | | | | | 32,621 | | | | | | | | | | | | 32,621 | |
Changes in operating assets and liabilities, net | | | 2,036 | | | | 155,383 | | | | (17,300 | ) | | | | | | | 140,119 | |
|
NET CASH (USED IN) PROVIDED BY OPERATING ACTIVITIES | | | (69,343 | ) | | | 394,958 | | | | 48,357 | | | | | | | | 373,972 | |
|
INVESTING ACTIVITIES | | | | | | | | | | | | | | | | | | | | |
Purchases of property and equipment | | | | | | | (217,153 | ) | | | (2,685 | ) | | | | | | | (219,838 | ) |
Proceeds from sale of assets | | | | | | | 305,441 | | | | | | | | | | | | 305,441 | |
|
NET CASH PROVIDED BY (USED IN) INVESTING ACTIVITIES | | | | | | | 88,288 | | | | (2,685 | ) | | | | | | | 85,603 | |
|
FINANCING ACTIVITIES | | | | | | | | | | | | | | | | | | | | |
Intercompany borrowings | | | 515,805 | | | | (447,792 | ) | | | (68,013 | ) | | | | | | | | |
Payments on long-term debt | | | (417,158 | ) | | | (5,671 | ) | | | | | | | | | | | (422,829 | ) |
Purchases and retirements of common stock | | | (3,586 | ) | | | | | | | | | | | | | | | (3,586 | ) |
Proceeds from issuance of stock | | | 1,282 | | | | | | | | | | | | | | | | 1,282 | |
|
NET CASH PROVIDED BY (USED IN) FINANCING ACTIVITIES | | | 96,343 | | | | (453,463 | ) | | | (68,013 | ) | | | | | | | (425,133 | ) |
|
INCREASE (DECREASE) IN CASH AND CASH EQUIVALENTS | | | 27,000 | | | | 29,783 | | | | (22,341 | ) | | | | | | | 34,442 | |
CASH AND CASH EQUIVALENTS AT BEGINNING OF YEAR | | | 40,000 | | | | (3,152 | ) | | | 27,812 | | | | | | | | 64,660 | |
|
CASH AND CASH EQUIVALENTS AT END OF YEAR | | $ | 67,000 | | | $ | 26,631 | | | $ | 5,471 | | | | | | | $ | 99,102 | |
|
72
SAKS INCORPORATED & SUBSIDIARIES
NOTES TO CONSOLIDATED FINANCIAL STATEMENTS
(IN THOUSANDS, EXCEPT PER SHARE AMOUNTS)
CONDENSED CONSOLIDATING STATEMENTS OF INCOME FOR THE YEAR ENDED FEBRUARY 3, 2001
| | | Saks Incorporated | | | Guarantor Subsidiaries | | | Non-Guarantor Subsidiaries | | | Eliminations | | | Consolidated | |
|
NET SALES | | $ | 15,073 | | | $ | 6,560,410 | | | $ | 5,753 | | | | | | | $ | 6,581,236 | |
Cost of sales | | | 9,845 | | | | 4,190,606 | | | | 11,256 | | | | | | | | 4,211,707 | |
|
Gross Margin | | | 5,228 | | | | 2,369,804 | | | | (5,503 | ) | | | | | | | 2,369,529 | |
Selling, general and administrative expenses | | | 11,841 | | | | 1,524,483 | | | | 96,698 | | | $ | (199,665 | ) | | | 1,433,357 | |
Other operating expenses | | | 3,632 | | | | 568,736 | | | | 2,289 | | | | | | | | 574,657 | |
Store pre-opening costs | | | | | | | 6,196 | | | | | | | | | | | | 6,196 | |
Losses from long-lived assets | | | | | | | 64,134 | | | | 9,438 | | | | | | | | 73,572 | |
Integration charges | | | | | | | 19,886 | | | | | | | | | | | | 19,886 | |
|
OPERATING INCOME (LOSS) | | | (10,245 | ) | | | 186,369 | | | | (113,928 | ) | | | 199,665 | | | | 261,861 | |
|
OTHER INCOME (EXPENSE) | | | | | | | | | | | | | | | | | | | | |
Finance charge income, net | | | | | | | | | | | 199,665 | | | | (199,665 | ) | | | | |
Intercompany exchange fees | | | | | | | (37,964 | ) | | | 37,964 | | | | | | | | | |
Intercompany servicer fees | | | | | | | 42,500 | | | | (42,500 | ) | | | | | | | | |
Equity in earnings of subsidiaries | | | 174,959 | | | | 17,797 | | | | | | | | (192,756 | ) | | | | |
Interest expense | | | (138,130 | ) | | | (9,226 | ) | | | (2,639 | ) | | | | | | | (149,995 | ) |
Other income (expense), net | | | | | | | 3,733 | | | | | | | | | | | | 3,733 | |
|
INCOME BEFORE PROVISION (BENEFIT) FOR INCOME TAXES | | | 26,584 | | | | 203,209 | | | | 78,562 | | | | (192,756 | ) | | | 115,599 | |
Provision (benefit) for income taxes | | | (48,632 | ) | | | 62,958 | | | | 26,057 | | | | | | | | 40,383 | |
|
NET INCOME | | $ | 75,216 | | | $ | 140,251 | | | $ | 52,505 | | | $ | (192,756 | ) | | $ | 75,216 | |
|
73
SAKS INCORPORATED & SUBSIDIARIES
NOTES TO CONSOLIDATED FINANCIAL STATEMENTS
(IN THOUSANDS, EXCEPT PER SHARE AMOUNTS)
CONDENSED CONSOLIDATING STATEMENTS OF CASH FLOWS FOR THE YEAR ENDED FEBRUARY 3, 2001
| | | Saks Incorporated | | | Guarantor Subsidiaries | | | Non-Guarantor Subsidiaries | | | Eliminations | | | Consolidated | |
|
OPERATING ACTIVITIES | | | | | | | | | | | | | | | | | | | | |
Net income | | $ | 75,216 | | | $ | 140,251 | | | $ | 52,505 | | | $ | (192,756 | ) | | $ | 75,216 | |
Adjustments to reconcile net income to net cash (used in) provided by operating activities: | | | | | | | | | | | | | | | | | | | | |
Equity in earnings of subsidiaries | | | (174,959 | ) | | | (17,797 | ) | | | | | | | 192,756 | | | | | |
Depreciation and amortization | | | 1,003 | | | | 211,866 | | | | 1,230 | | | | | | | | 214,099 | |
Provision for employee deferred compensation | | | 5,582 | | | | | | | | | | | | | | | | 5,582 | |
Deferred income taxes | | | | | | | 65,117 | | | | 8,554 | | | | | | | | 73,671 | |
Losses from long-lived assets | | | | | | | 64,134 | | | | 9,438 | | | | | | | | 73,572 | |
Changes in operating assets and liabilities, net | | | (31,381 | ) | | | 69,674 | | | | 5,019 | | | | | | | | 43,312 | |
|
NET CASH (USED IN) PROVIDED BY OPERATING ACTIVITIES | | | (124,539 | ) | | | 533,245 | | | | 76,746 | | | | | | | | 485,452 | |
|
INVESTING ACTIVITIES | | | | | | | | | | | | | | | | | | | | |
Purchases of property and equipment | | | | | | | (258,476 | ) | | | (16,376 | ) | | | | | | | (274,852 | ) |
Proceeds from sale of assets | | | | | | | 26,107 | | | | | | | | | | | | 26,107 | |
|
NET CASH (USED IN) INVESTING ACTIVITIES | | | | | | | (232,369 | ) | | | (16,376 | ) | | | | | | | (248,745 | ) |
|
FINANCING ACTIVITIES | | | | | | | | | | | | | | | | | | | | |
Intercompany borrowings | | | 347,879 | | | | (292,712 | ) | | | (55,167 | ) | | | | | | | | |
Payments on long-term debt | | | | | | | (8,267 | ) | | | | | | | | | | | (8,267 | ) |
Net repayments under revolving credit agreement | | | (159,000 | ) | | | | | | | | | | | | | | | 159,000 | |
Purchases and retirements of common stock | | | (25,010 | ) | | | | | | | | | | | | | | | (25,010 | ) |
Proceeds from issuance of stock | | | 670 | | | | | | | | | | | | | | | | 670 | |
|
NET CASH PROVIDED BY (USED IN) FINANCING ACTIVITIES | | | 164,539 | | | | (300,979 | ) | | | (55,167 | ) | | | | | | | (191,607 | ) |
|
INCREASE (DECREASE) IN CASH AND CASH EQUIVALENTS | | | 40,000 | | | | (103 | ) | | | 5,203 | | | | | | | | 45,100 | |
CASH AND CASH EQUIVALENTS AT BEGINNING OF YEAR | | | | | | | (3,049 | ) | | | 22,609 | | | | | | | | 19,560 | |
|
CASH AND CASH EQUIVALENTS AT END OF YEAR | | $ | 40,000 | | | $ | (3,152 | ) | | $ | 27,812 | | | | | | | $ | 64,660 | |
|
74
2 0 0 2 S A K S I N C O R P O R A T E D
Reports.
REPORT OF INDEPENDENT ACCOUNTANTS
To the Board of Directors and Shareholders of Saks Incorporated
In our opinion, the accompanying consolidated balance sheets and the related consolidated statements of income, changes in shareholders’ equity and cash flows present fairly, in all material respects, the financial position of Saks Incorporated and its subsidiaries at February 1, 2003 and February 2, 2002 and the results of their operations and their cash flows for each of the three years in the period ended February 1, 2003 in conformity with accounting principles generally accepted in the United States of America. These financial statements are the responsibility of the Company’s management; our responsibility is to express an opinion on these financial statements based on our audits. We conducted our audits of these statements in accordance with auditing standards generally accepted in the United States of America, which require that we plan and perform the audit to obtain reasonable assurance about whether the financial statements are free of material misstatement. An audit includes examining, on a test basis, evidence supporting the amounts and disclosures in the financial statements, assessing the accounting principles used and significant estimates made by management, and evaluating the overall financial statement presentation. We believe that our audits provide a reasonable basis for our opinion.
Effective February 3, 2002, the Company adopted Statement of Financial Accounting Standard (SFAS) No.142, “Goodwill and Other Intangible Assets,” as explained in Note 2 and Note 5, and SFAS No.146, “Accounting for Costs Associated with Exit or Disposal Activities,” as explained in Note 13.

PricewaterhouseCoopers LLP
Birmingham, Alabama
March 14, 2003, except for Note 3, as for which the date is March 31, 2003
REPORT OF MANAGEMENT
The accompanying consolidated financial statements, including the notes thereto, and the other financial information presented in the Annual Report have been prepared by management. The financial statements have been prepared in accordance with generally accepted accounting principles and include amounts that are based upon our best estimates and judgments. Management is responsible for the consolidated financial statements, as well as the other financial information in this Annual Report.
The Company maintains an effective system of internal accounting control and related disclosure control. We believe that this system provides reasonable assurance that transactions are executed in accordance with management authorization and that they are appropriately recorded in order to permit preparation of financial statements in conformity with generally accepted accounting principles and to adequately safeguard, verify and maintain accountability of assets. Reasonable assurance is based on the recognition that the cost of a system of internal control should not exceed the benefits derived.
The consolidated financial statements and related notes have been audited by independent certified public accountants. Management has made available to them all of the Company’s financial records and related data and believes all representations made to them during their audits were valid and appropriate. Their report provides an independent opinion upon the fairness of the financial statements.
The Audit Committee of the Board of Directors is composed of four independent Directors. The Committee is responsible for recommending the independent certified public accounting firm to be appointed by the Board of Directors, subject to shareholder approval. The Audit Committee meets periodically with the independent auditors, as well as with management, to review accounting, auditing, internal control, disclosure control and financial reporting matters. The independent auditors have unrestricted access to the Audit Committee.
|
| | 
|
R. Brad Martin Chairman of the Board and Chief Executive Officer | | Douglas E. Coltharp Executive Vice President and Chief Financial Officer |
75
2 0 0 2 S A K S I N C O R P O R A T E D
Market Information
The Company’s common stock trades on the New York Stock Exchange under the Symbol SKS. As of March 14, 2003, there were approximately 2,600 shareholders of record. The prices in the table below represent the high and low sales prices for the stock as reported by the New York Stock Exchange.
The Company presently follows the policy of retaining earnings to provide funds for the operation and expansion of the business and has no present intention to declare cash dividends in the foreseeable future. Future dividends, if any, will be determined by the Board of Directors of the Company in light of circumstances then existing, including the earnings of the Company, its financial requirements and general business conditions. The Company declared no dividends to common shareholders in either 2002 or 2001.
| | | Fiscal Year Ended |
|
| | | February 1, 2003 Price Range | | February 2, 2002 Price Range |
|
Quarter | | High | | Low | | High | | Low |
|
First | | $ | 15.75 | | $ | 8.95 | | $ | 13.95 | | $ | 10.90 |
Second | | $ | 15.64 | | $ | 9.52 | | $ | 13.20 | | $ | 9.60 |
Third | | $ | 12.30 | | $ | 8.55 | | $ | 10.94 | | $ | 4.60 |
Fourth | | $ | 14.17 | | $ | 8.11 | | $ | 10.38 | | $ | 6.59 |
76
2 0 0 2 S A K S I N C O R P O R A T E D
Directors and Certain Officers.
BOARD OF DIRECTORS | | | | |
|
R. BRAD MARTIN Chairman of the Board and Chief Executive Officer of Saks Incorporated RONALD DE WAAL Vice Chairman of the Board; Chairman of We International, B.V. BERNARD E. BERNSTEIN Senior Partner in the law firm of Bernstein, Stair & McAdams LLP STANTON J. BLUESTONE Retired Chairman and Chief Executive Officer of Carson Pirie Scott & Co. JAMES A. COGGIN President and Chief Administrative Officer of Saks Incorporated | | JULIUS W. ERVING President of The Erving Group; Executive Vice President of RDV Sports/Orlando Magic MICHAEL S. GROSS Principal of Apollo Advisors, L.P. DONALD E. HESS Chairman Emeritus of Parisian; Chief Executive Officer of Southwood Partners GEORGE L. JONES President and Chief Executive Officer of Saks Department Store Group and Chief Operating Officer of Saks Incorporated NORA P. McANIFF Executive Vice President of Time, Inc. | | DR. C. WARREN NEEL Director, Corporate Governance Center at the University of Tennessee STEPHEN I. SADOVE Vice Chairman of Saks Incorporated MARGUERITE W. SALLEE President and Chief Executive Officer of The Brown Schools CHRISTOPHER J. STADLER Management Committee Member of Investcorp, S.A. |
|
CERTAIN CORPORATE OFFICERS | | | | |
|
R. BRAD MARTIN Chairman of the Board and Chief Executive Officer STEPHEN I. SADOVE Vice Chairman JAMES A. COGGIN President and Chief Administrative Officer
| | GEORGE L. JONES President and Chief Executive Officer of Saks Department Store Group and Chief Operating Officer of Saks Incorporated R. THOMAS COAN Executive Vice President of Human Resources DOUGLAS E. COLTHARP Executive Vice President and Chief Financial Officer | | BRIAN J. MARTIN Executive Vice President of Law and General Counsel DONALD E. WRIGHT Executive Vice President of Finance and Chief Accounting Officer |
|
BUSINESS UNIT AND STORE OFFICERS | | | | |
|
CHRISTINA JOHNSON President and Chief Executive Officer of Saks Fifth Avenue Enterprises GEORGE L. JONES President and Chief Executive Officer of Saks Department Store Group and Chief Operating Officer of Saks Incorporated | | TONI E. BROWNING President and Chief Executive Officer of Proffitt’s/McRae’s ANTHONY J. BUCCINA President of Carson Pirie Scott & Co. | | MICHAEL R. MACDONALD Chairman and Chief Executive Officer of Carson Pirie Scott & Co. |
77
2 0 0 2 S A K S I N C O R P O R A T E D
Store Locations.
SAKS FIFTH AVENUE ENTERPRISES
SAKS FIFTH AVENUE | | ILLINOIS | | OREGON | | FLORIDA | | NEW YORK |
STORES | | Chicago | | Portland | | Ellenton | | Central Valley |
| | | Highland Park | | | | Miami | | Niagara Falls |
| | | Skokie | | PENNSYLVANIA | | Naples | | Riverhead |
ALABAMA | | | | Bala Cynwyd | | Orlando | | Westbury |
Birmingham | | | | | | | | |
| | | LOUISIANA | | Pittsburgh | | Sunrise | | |
ARIZONA | | New Orleans | | | | | | NORTH CAROLINA |
Phoenix | | | | SOUTH CAROLINA | | GEORGIA | | Concord |
| | | MARYLAND | | Charleston | | Dawsonville | | Morrisville |
CALIFORNIA | | Chevy Chase | | Hilton Head | | Lawrenceville | | |
Beverly Hills | | | | | | | | OHIO |
Carmel | | MASSACHUSETTS | | TEXAS | | HAWAII | | Aurora |
Costa Mesa | | Boston | | Austin | | Waipahu | | Cincinnati |
La Jolla | | | | Dallas | | | | |
Mission Viejo | | MICHIGAN | | Houston | | ILLINOIS | | PENNSYLVANIA |
Palm Desert | | Troy | | Hurst | | Gurnee | | Grove City |
Palos Verdes | | | | San Antonio | | Schaumburg | | Philadelphia |
Pasadena | | MINNESOTA | | | | Skokie | | |
San Diego | | Minneapolis | | VIRGINIA | | | | SOUTH CAROLINA |
San Francisco | | | | McLean | | KANSAS | | Myrtle Beach |
Santa Barbara | | MISSOURI | | | | Olathe | | |
| | | St. Louis | | | | | | TENNESSEE |
COLORADO | | Kansas City | | OFF 5TH STORES | | MARYLAND | | Nashville (2) |
Denver | | | | | | Baltimore | | |
| | | NEVADA | | ARIZONA | | | | TEXAS |
CONNECTICUT | | Las Vegas | | Tempe | | MASSACHUSETTS | | Grapevine |
Greenwich | | | | Tucson | | Worcester | | Katy |
Stamford | | NEW JERSEY | | | | Wrentham | | San Marcos |
| | | Hackensack | | | | | | Stafford |
| | | | | | | | | |
FLORIDA | | Short Hills | | CALIFORNIA | | MICHIGAN | | |
Bal Harbor | | | | Anaheim | | Auburn Hills | | VIRGINIA |
Boca Raton | | NEW YORK | | Cabazon | | Dearborn | | Leesburg |
Ft. Lauderdale | | Garden City | | Camarillo | | | | Woodbridge |
Ft. Myers | | Huntington | | Folsom | | MINNESOTA | | |
Naples | | New York City | | Milpitas | | Minneapolis | | |
Orlando | | Southampton | | Ontario | | | | |
Palm Beach | | | | Petaluma | | NEVADA | | |
Palm Beach Gardens | | OHIO | | San Diego | | Las Vegas | | |
Sarasota | | Beachwood | | | | | | |
South Miami | | Cincinnati | | COLORADO | | NEW JERSEY | | |
Tampa | | Columbus | | Castle Rock | | Elizabeth | | |
| | | | | Denver | | Paramus | | |
| | | | | | | | | |
GEORGIA | | OKLAHOMA | | | | | | |
Atlanta | | Tulsa | | CONNECTICUT | | | | |
| | | | | Clinton | | | | |
78
2 0 0 2 S A K S I N C O R P O R A T E D
Store Locations.
SAKS DEPARTMENT STORE GROUP
PARISIAN STORES | | SOUTH CAROLINA | | YOUNKERS STORES | | HERBERGER’S | | CARSON PIRIE |
| | | Greenville | | | | STORES | | SCOTT STORES |
ALABAMA | | Spartanburg | | ILLINOIS | | | | |
Birmingham(6) | | | | Moline | | COLORADO | | ILLINOIS |
Decatur | | TENNESSEE | | | | Grand Junction | | Aurora(3) |
Dothan | | Athens | | IOWA | | | | Bloomingdale |
Florence | | Chattanooga(2) | | Ames | | IOWA | | Bourbonnais |
Huntsville(2) | | Cleveland | | Cedar Falls | | Ottumwa | | Calumet City |
Mobile | | Greeneville | | Cedar Rapids(2) | | | | Chicago(3) |
Montgomery(2) | | Johnson City | | Coralville | | MINNESOTA | | Chicago Ridge |
Tuscaloosa | | Kingsport | | Davenport | | Albert Lea | | Dundee |
| | | Knoxville(2) | | Des Moines(4) | | Alexandria | | Evergreen Park |
FLORIDA | | Maryville | | Dubuque | | Bemidji | | Hammond |
Jacksonville | | Morristown | | Fort Dodge | | Bloomington | | Joliet |
Orlando(2) | | Oak Ridge | | Iowa City | | Brainerd | | Lincolnwood |
Pensacola | | | | Marshalltown | | Fergus Falls | | Lombard(2) |
Tallahassee | | VIRGINIA | | Mason City | | Mankato | | Matteson |
| | | Bristol | | Sioux City(2) | | Minneapolis | | Mount Prospect |
GEORGIA | | | | Waterloo | | Moorhead | | Naperville |
Atlanta(7) | | WEST VIRGINIA | | West Burlington | | New Ulm | | Norridge |
Columbus | | Morgantown | | | | Rochester | | North Riverside |
Macon | | Parkersburg | | MICHIGAN | | Roseville | | Orland Park |
| | | | | Bay City | | St. Cloud | | St. Charles |
INDIANA | | | | Grandville | | St. Paul | | Schaumburg(2) |
Indianapolis(2) | | McRAE’S STORES | | Holland | | Stillwater | | Vernon Hills |
| | | | | Lansing | | Virginia | | Waukegan |
MICHIGAN | | ALABAMA | | Marquette | | Willmar | | Wilmette(2) |
Livonia | | Birmingham(3) | | Muskegon | | | | |
Rochester Hills | | Dothan | | Port Huron | | MONTANA | | INDIANA |
| | | Gadsden | | Traverse City | | Billings | | Merrillville |
MISSISSIPPI | | Huntsville | | | | Butte | | Michigan City |
Tupelo | | Mobile | | MINNESOTA | | Great Falls | | |
| | | Selma | | Austin | | Havre | | |
OHIO | | Tuscaloosa | | Duluth | | Kalispell | | BOSTON STORES |
Cincinnati | | | | | | Missoula | | |
Dayton | | FLORIDA | | NEBRASKA | | | | WISCONSIN |
| | | Mary Esther | | Grand Island | | NEBRASKA | | Brookfield(2) |
SOUTH CAROLINA | | Pensacola | | Lincoln | | Hastings | | Janesville |
Charleston | | | | Omaha(3) | | Kearney | | Madison(2) |
Columbia(2) | | LOUISIANA | | | | Norfolk | | Milwaukee(4) |
| | | Baton Rouge | | SOUTH DAKOTA | | North Platte | | Racine |
TENNESSEE | | Monroe | | Sioux Falls | | Scottsbluff | | |
Chattanooga | | | | | | | | |
Knoxville | | MISSISSIPPI | | WISCONSIN | | NORTH DAKOTA | | BERGNER’SSTORES |
Nashville | | Biloxi | | Appleton | | Bismarck | | |
| | | Columbus | | Eau Claire | | Dickinson | | ILLINOIS |
| | | Gautier | | Fond du Lac | | Fargo | | Bloomington |
PROFFITT’S STORES | | Greenville | | Green Bay | | Minot | | Champaign |
| | | Hattiesburg | | Manitowoc | | | | Forsyth |
GEORGIA | | Jackson(4) | | Marinette | | SOUTH DAKOTA | | Galesburg |
Dalton | | Laurel | | Marshfield | | Aberdeen | | Machesney Park |
Rome | | McComb | | Sheboygan | | Rapid City | | Pekin |
| | | Meridian | | Sturgeon Bay | | Watertown | | Peoria(2) |
KENTUCKY | | Natchez | | Superior | | | | Peru |
Ashland | | Tupelo | | Wausau | | WISCONSIN | | Quincy |
Elizabethtown | | Vicksburg | | Wisconsin Rapids | | Beaver Dam | | Rockford(2) |
| | | | | | | LaCrosse | | Springfield |
NORTH CAROLINA | | | | | | Rice Lake | | Sterling |
Asheville | | | | | | | | |
Goldsboro | | | | | | WYOMING | | |
Greenville | | | | | | Rock Springs | | |
Kinston | | | | | | | | |
Rocky Mount | | | | | | | | |
79
2 0 0 2 S A K S I N C O R P O R A T E D
Shareholder Information.
SALES RELEASE DATES FOR 2003
Sales Period | | Release Date |
February 2003 | | 3/6/03 |
March 2003 | | 4/10/03 |
April 2003 | | 5/8/03 |
May 2003 | | 6/5/03 |
June 2003 | | 7/10/03 |
July 2003 | | 8/7/03 |
August 2003 | | 9/4/03 |
September 2003 | | 10/9/03 |
October 2003 | | 11/6/03 |
November 2003 | | 12/4/03 |
December 2003 | | 1/8/04 |
January 2004 | | 2/5/04 |
EARNINGS RELEASE DATES FOR 2003
Quarter | | Release Date |
First | | 5/20/03 |
Second | | 8/19/03 |
Third | | 11/18/03 |
Fourth | | To be announced |
ANNUAL MEETING
The Annual Meeting of Shareholders of Saks Incorporated will be held at 1:00 p.m. Central Time, Wednesday, June 11, 2003, at the Company’s corporate offices at 750 Lakeshore Parkway, Birmingham, Alabama 35211. Shareholders are cordially invited to attend.
INQUIRIES REGARDING YOUR
STOCK HOLDINGS
Registered shareholders (shares held by you in your name) should address communications to the Company’s Transfer Agent and Registrar:
The Bank of New York
(866) 455-3121 (telephone)
shareowner-svcs@bankofny.com (e-mail)
www.stockbny.com (web site)
Address shareholder inquiries to:
Shareholder Relations Department
P.O. Box 11258
Church Street Station
New York, New York 10286
Send certificates for transfer and address changes to:
Receive and Deliver Department
P.O. Box 11002
Church Street Station
New York, New York 10286
In all correspondence or telephone inquiries, please mention Saks Incorporated, your name as printed on your stock certificate, your Social Security number, your address, and your phone number.
Beneficial shareholders (shares held by you in the name of your broker or other nominee) should direct communications on all administrative matters to your nominee owner.
FINANCIAL AND OTHER INFORMATION
Copies of financial documents and other company information such as Saks Incorporated’s Form10-K and 10-Q reports as filed with the SEC are available free of charge by contacting:
Investor Relations
Saks Incorporated
P.O. Box 9388
Alcoa, Tennessee 37701
(865) 981-9541
Security analysts, portfolio managers, representatives of financial institutions, and other individuals with questions regarding Saks Incorporated are invited to contact:
Julia Bentley
Senior Vice President of Investor Relations and Communications
P.O. Box 9388
Alcoa, Tennessee 37701
(865) 981-6243 (telephone)
(865) 981-6325 (facsimile)
julia_bentley@saksinc.com (e-mail)
SEC filings, financial results, corporate news, and other Company information are available on Saks Incorporated’s web site:
www.saksincorporated.com
80
2 0 0 2 S A K S I N C O R P O R A T E D
Corporate Information.
CORPORATE HEADQUARTERS
750 Lakeshore Parkway
Birmingham, Alabama 35211
(205) 940-4000
SAKS FIFTH AVENUE ENTERPRISES
HEADQUARTERS
12 East 49th Street
New York, New York 10017
(212) 940-4048
SAKS DEPARTMENT STORE GROUP
HEADQUARTERS
PARISIAN
750 Lakeshore Parkway
Birmingham, Alabama 35211
(205) 940-4000
PROFFITT’S AND McRAE’S
115 North Calderwood Street
Alcoa, Tennessee 37701
(865) 983-7000
NORTHERN DEPARTMENT STORE GROUP
(CARSON PIRIE SCOTT, BOSTON STORE,
BERGNER’S, HERBERGER’S, AND YOUNKERS)
331 West Wisconsin Avenue
Milwaukee, Wisconsin 53203
(414) 347-4141
INDEPENDENT ACCOUNTANTS
PricewaterhouseCoopers LLP
Birmingham, Alabama
©2003 Saks Incorporated
S A K S
I N C O R P O R A T E D | | 
|