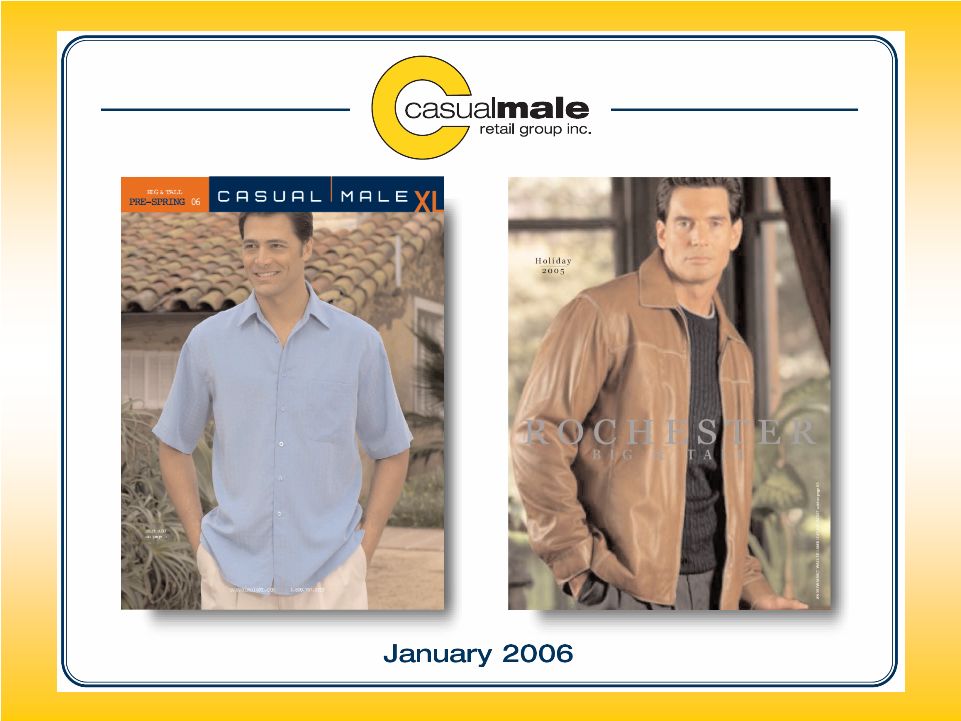
2 ’06 & ’07 Initiatives • Redefine Casual Male image to increase market share • Store growth – expansion of Rochester Clothing • Continued accelerated growth of internet and catalog • Gross margin improvement |
3 Redefine Casual Male Image |
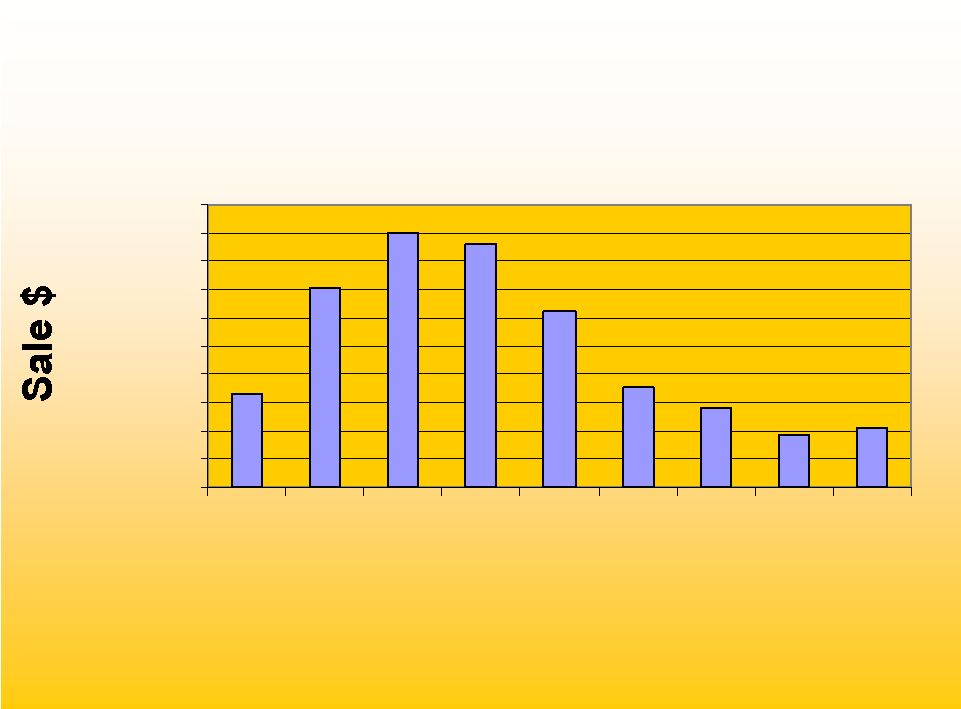
4 Market Share Size Opportunity Casual Male Sales by Size $0 $20,000 $40,000 $60,000 $80,000 $100,000 $120,000 $140,000 $160,000 $180,000 $200,000 Waist Size Data based on ’04 sales of Casual Pants, Dress Pants and Jeans |
5 National Sales by Size $0 $200,000 $400,000 $600,000 $800,000 $1,000,000 $1,200,000 $1,400,000 $1,600,000 $1,800,000 $2,000,000 30 32 34 36 38 40 42 44 46+ Waist |
6 Customer Research Least favorite aspect of clothing shopping was “difficulty finding items in my size” – They were shopping at “the end of the rack” – Stigma with “big and tall” store – “big and tall” stores were consistently referred to as places where “fat guys” shop Current image associated with Casual Male – A degree of discomfort with shopping at the store for “big and tall” – Belief that the clothing started around a 48” waist – Merchandise and selection lacked a sense of style – Had unattractive, inconvenient locations – Casual Male was a place of necessity rather than a destination of choice |
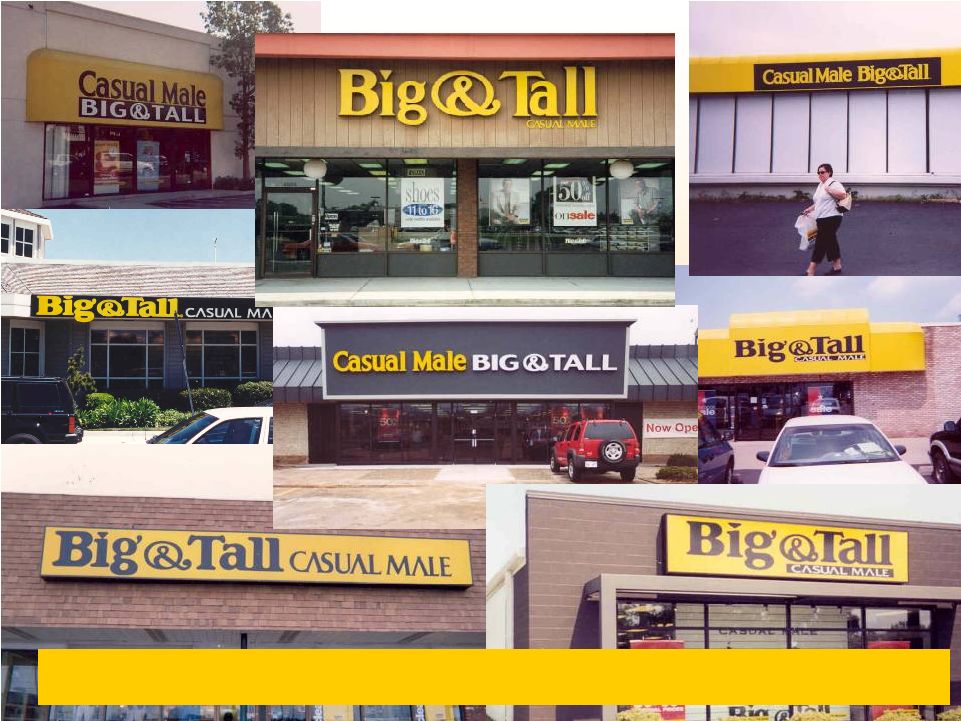
7 50% of customers refer to Casual Male as the “Big & Tall” store |
8 Objectives • Change the consumer perception of Casual Male to increase awareness of brands, sizes and comfort carried in all channels and appeal to the younger, smaller and taller B&T consumers. • Re-engineer the look and feel of the Casual Male brand in all communications including in- store experience, web & catalog |
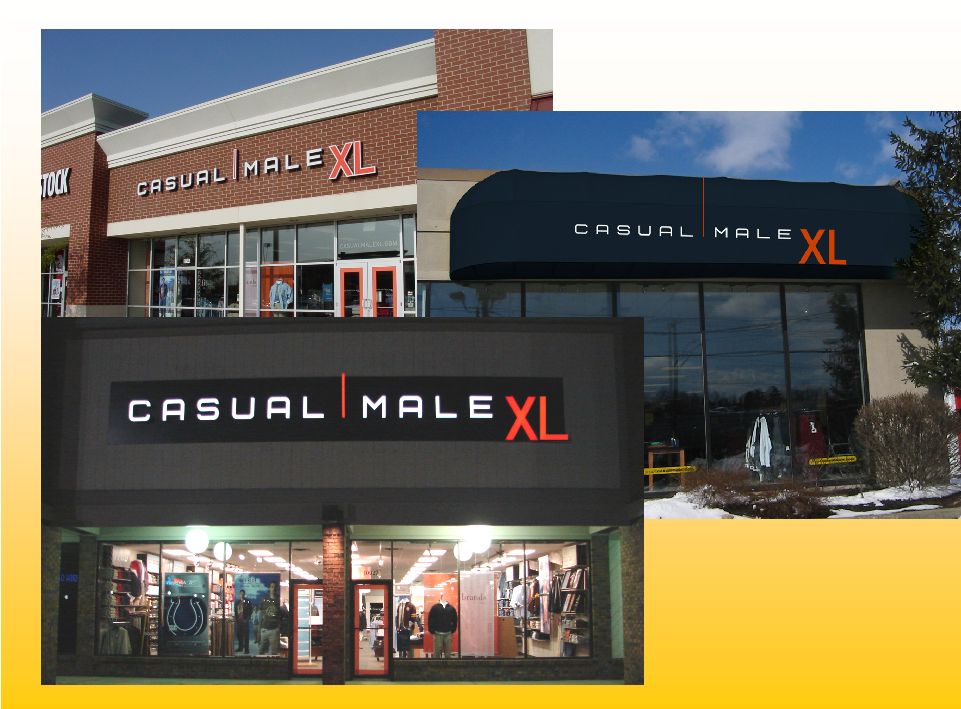
10 Reactions to “XL” logo concept Majority of respondents reacted positively to these concepts: – “Yes, that’s my size.” / “That’s what I’m looking for.” – “XL” seen as “manly, powerful” rather than overweight – Appeared to create a sense of distinctiveness for brand – Would communicate “change” at Casual Male – Seen as youthful by some respondents |
11 Developmental Markets DMA Population Market Rank Anchor Stores Outlet Stores Phoenix, AZ 2017.3 15 5 1 Columbus, OH 630.1 34 4 2 Grand Rapids, MI 683.5 38 3 0 Indianapolis, IN 589.6 25 6 1 Rochester, NY 392.6 74 4 0 San Antonio, TX 643.6 37 4 0 Total: 4956.7 26 4 |
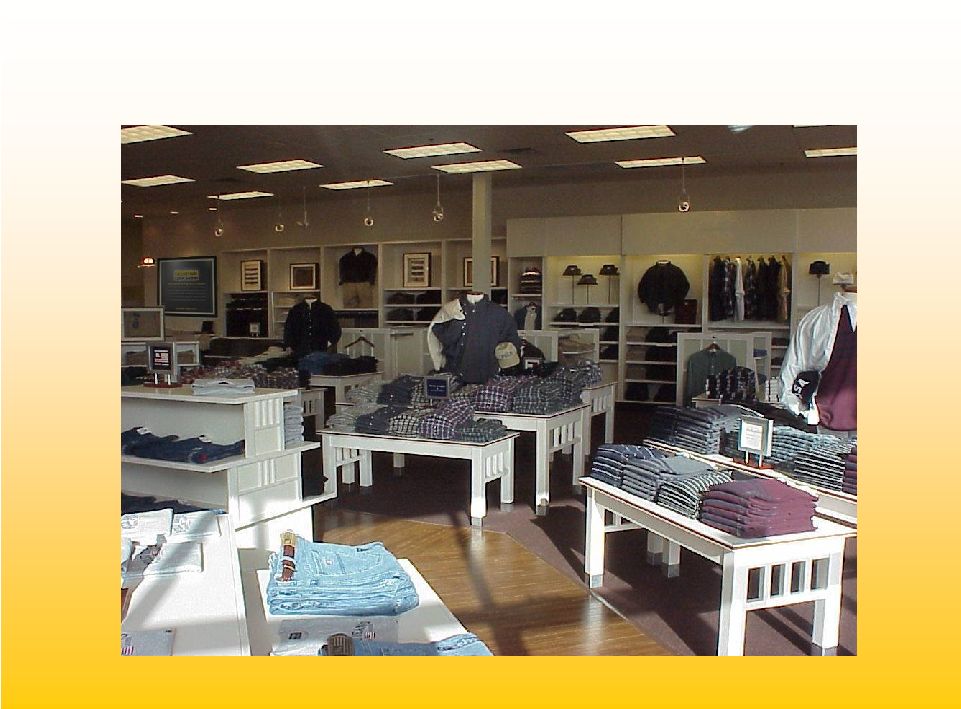
12 Effected Change • Exterior store • Interior of store, visual presentation, signage, POS package • Bags • All communications – Direct mail – Email – Catalog version – Website – New Private label credit card • Associate training |
17 Developmental Market Results • Increase in traffic • Increase in transactions • Higher % of sales in smaller sizes as compared to chain • Increase in comp sales |
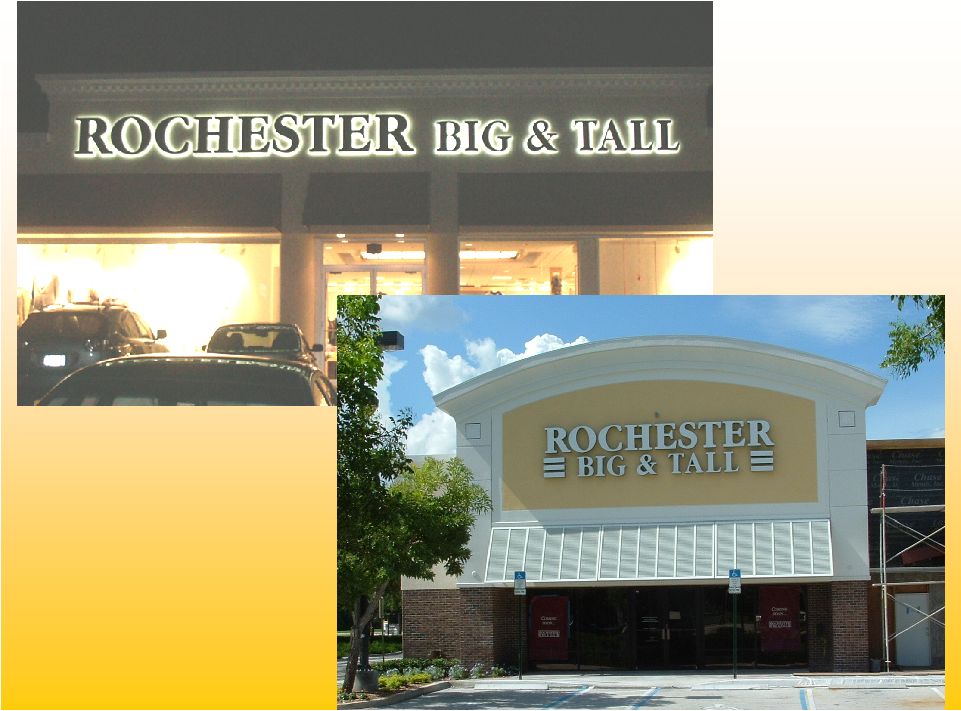
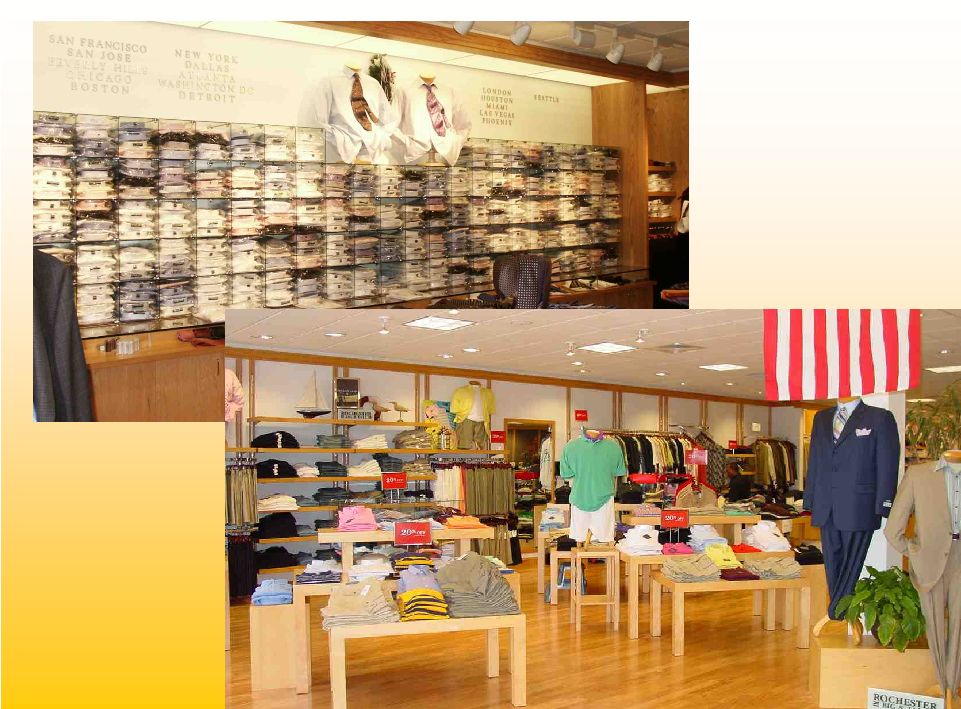
20 Rochester Overview • Major growth for next 5 years. We will be in expanding Rochester from 24 stores to 40 more stores Rochester * 1 London, United Kingdom 9 2 2 |
24 Benefits to CMRG • Combined entities give CMRG 65% market share of specialty retail sector • Not a turn around – accretive to earnings in year one • Senior management continues with incentive contracts • Synergies will increase gross margin, reduce overhead costs (warehouse, administration, insurance, etc.) • Comparable multi-channel opportunities to Casual Male – Internet/catalog over 20% of sales in less than 3 years • Store growth opportunities – Underserved markets – Growth of 5 – 7 stores/yr – International opportunities |
25 Rochester Big & Tall Transaction • 21 U.S. stores; 1 in London • Total revenue $65.0M • Audited EBIDTA of $3.3M • Potential for an additional 3 million dollar savings through integration – Average sales per store $2.3M vs CM $650,000 – Average transaction $400 vs CM $75 – Average store sq. footage 5,000-6,000 sq. ft. vs CM 3,500 sq. ft. – Average income of customer $100,000+ vs CM $71,000 – Cost to open new store $100 sq. ft. vs CM $36 sq. ft. – Inventory needed $375,000 vs CM $125,000 |
28 Continued accelerated growth of internet and catalog |
29 -5.0% -2.3% -1.1% 2.4% 9.2% 4.8% 2.3% 2.0% 3.70% 2.5% 1.6% -6.0% -4.0% -2.0% 0.0% 2.0% 4.0% 6.0% 8.0% 10.0% Q1 Q2 Q3 Q4 Q1 Q2 Q3 Q4 Q1 Q2 Q3 Comp Store Trend 2004 2003 Stores change to lifestyle presentation Launch of George Foreman collection and TV campaign 2005 |
30 Internet Sales by Month $0 $200,000 $400,000 $600,000 $800,000 $1,000,000 $1,200,000 $1,400,000 $1,600,000 $1,800,000 Jan Feb Mar Apr May Jun Jul Aug Sep Oct Nov Dec 2002 - $3,357,447 2003 - $6,229,617 +46.1% 2004 - $9,874,481 +194.1% 2005 |
31 Store Catalog Sales * % gains over FYE02 Catalog Sales $7,053,300 $7,283,100 $7,968,900 $8,814,100 $10,056,800 $- $2,000,000 $4,000,000 $6,000,000 $8,000,000 $10,000,000 $12,000,000 2001 2002 2003 2004 2005 |
32 Store 2.9% 7.4% 0% 20% 40% 60% 80% 100% online catalog Catalog 46.6% 18.6% 0% 20% 40% 60% 80% 100% store online Online 51.1% 32.1% 0% 20% 40% 60% 80% 100% store catalog Multi-Channel |
33 Customer Sales by Channel 455 Retail & Catalog & E-commerce 286 Catalog & E-commerce 290 Retail & E-commerce 276 Retail & Catalog 104 E-commerce Only 123 Catalog Only 100 Retail only * Indexed to retail only shoppers |
35 Gross Margin Improvements • Inventory management • Direct sourcing • Building proprietary brands |
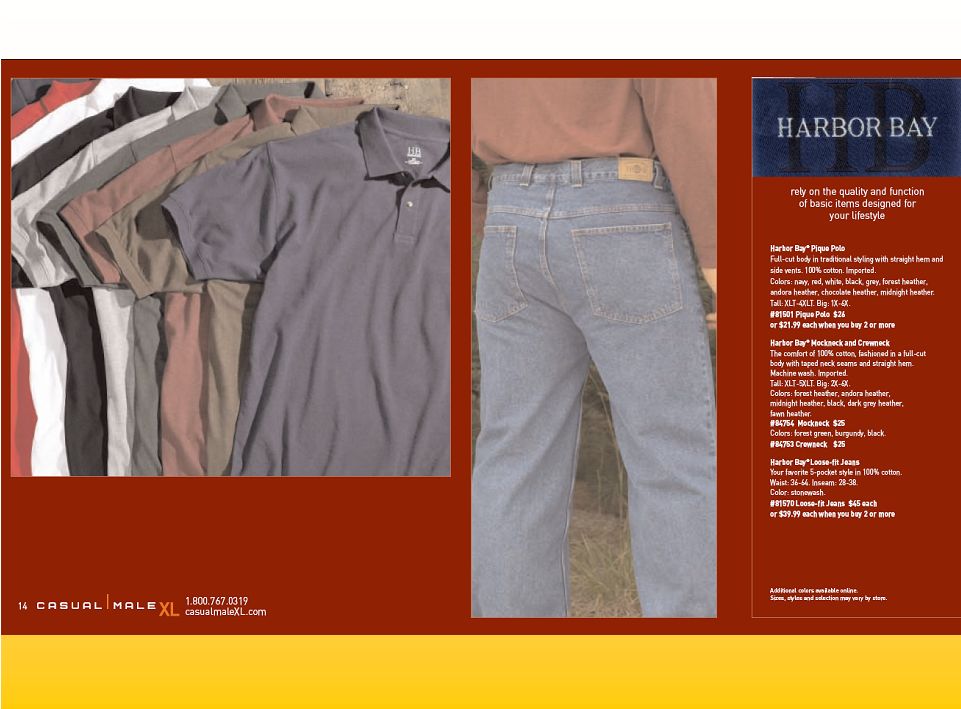
36 Gross Margin Opportunity • Core vs. seasonal/fashion – core year round basic stock items (5 pocket jean, pique polo, pocket tee, underwear, etc.) • Implementation of E3 (replenishment system) determined that we were 25% out of stocks on core items – demand exceeded supply – Better margins on core products than seasonal/fashion |
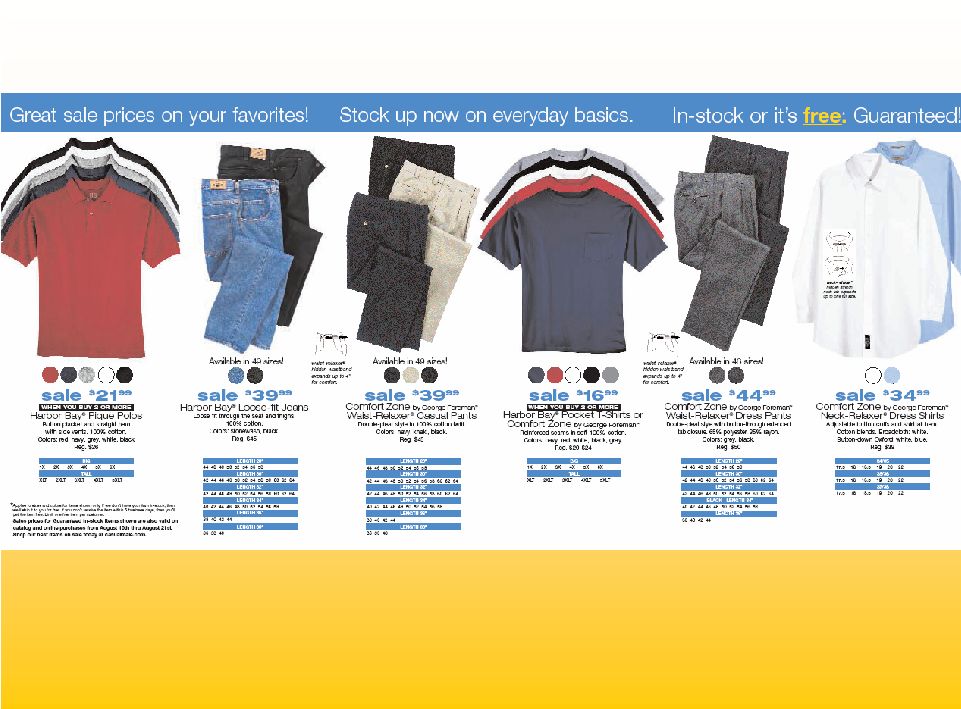
37 Guaranteed In-stock Program • 7 key items – 12% of sales • GIS Program – Bottoms 49 sizes, delivery in 5 working days or FREE • 8/21 launch • Sold 449,405 units • Units 26% increase • 4,564 units fulfilled through catalog • 9 pieces of free items given away |
39 Direct Sourcing • Direct Sourcing of goods through Li & Fung, as agent beginning in 2006 • New Department created, hiring of industry veteran • Potential for 40% of Casual Male Inventory to go Direct • Cost saving of up to 15% • Better sourcing (reduction of # of Vendors) • Rochester has very little private label, potential for 20% • Cost savings of up to 20% for Rochester |
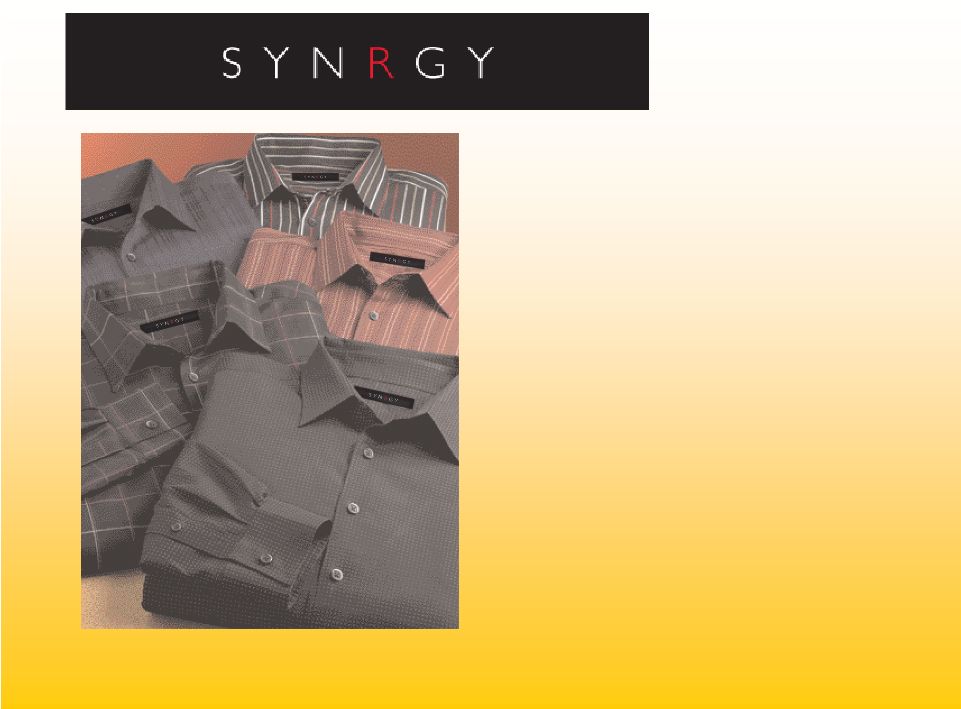
44 Collection will consist of Wovens, Casual Pant, and Knits Assortment will reflect items/attitude and overall look of successful contemporary brands such as George Foreman Signature, Perry Ellis, I.N.C., etc. |
46 2 Year Goal • 4% comp annually • 100 basis point improvement annually • 100 basis point improvement in SG&A annually 2007 = 9 to 10% operating income |
47 Any remarks that we make today about future expectations, plans and prospects for Casual Male Retail Group, Inc. which are not historical facts, are forward-looking statements that involve risks and uncertainties. For a discussion of such risks and uncertainties, which could cause the Company’s actual results to differ from those contained in the forward- looking statements, please read the section entitled “Forward-Looking Statements” in the Company’s most recent Form 10-K and Form 10-Q and the Form 8-K filed on April 8, 2005 with the Securities and Exchange Commission. Forward - Looking Statement |
48 Casual Male Retail Group 555 Turnpike Street Canton, MA 02021 (781) 828-9300 x 2004 jeffunger@usa.net clinsky@cmal.com |
