UNITED STATES
SECURITIES AND EXCHANGE COMMISSION
FORM 10-K
| | | | | |
| ANNUAL REPORT PURSUANT TO SECTION 13 OR 15(d) OF THE SECURITIES EXCHANGE ACT OF 1934 |
For the fiscal year ended December 31, 2024
OR
| | | | | |
| ☐ | TRANSITION REPORT PURSUANT TO SECTION 13 OR 15(d) OF THE SECURITIES EXCHANGE ACT OF 1934 |
For the transition period from _____ to _____
Commission file number 001-12019 QUAKER CHEMICAL CORPORATION
(Exact name of registrant as specified in its charter)
| | | | | |
| Pennsylvania | 23-0993790 |
| (State or other jurisdiction of incorporation or organization) | (I.R.S. Employer Identification No.) |
| |
901 E. Hector Street, Conshohocken, Pennsylvania | 19428-2380 |
| (Address of principal executive offices) | (Zip Code) |
Registrant’s telephone number, including area code: (610) 832-4000
Securities registered pursuant to Section 12(b) of the Act:
| | | | | | | | | | | | | | |
| Title of each class | | Trading Symbol(s) | | Name of each exchange on which registered |
| Common Stock, $1 par value | | KWR | | New York Stock Exchange |
Securities registered pursuant to Section 12(g) of the Act: None
Indicate by check mark if the registrant is a well-known seasoned issuer, as defined in Rule 405 of the Securities Act. Yes x No o
Indicate by check mark if the registrant is not required to file reports pursuant to Section 13 or Section 15(d) of the Act. Yes ☐ No x
Indicate by check mark whether the registrant (1) has filed all reports required to be filed by Section 13 or 15(d) of the Securities Exchange Act of 1934 during the preceding 12 months (or for such shorter period that the registrant was required to file such reports), and (2) has been subject to such filing requirements for the past 90 days. Yes x No o
Indicate by check mark whether the registrant has submitted electronically every Interactive Data File required to be submitted pursuant to Rule 405 of Regulation S- T (§ 232.405 of this chapter) during the preceding 12 months (or for such shorter period that the registrant was required to submit such files). Yes x No o
Indicate by check mark whether the registrant is a large accelerated filer, an accelerated filer, a non-accelerated filer, a smaller reporting company, or an emerging growth company. See the definitions of “large accelerated filer,” “accelerated filer,” “smaller reporting company,” and “emerging growth company” in Rule 12b-2 of the Exchange Act.
| | | | | | | | | | | | | | | | | | | | |
| Large accelerated filer | x | | Accelerated filer | o | |
| Non-accelerated filer | o | | Smaller reporting company | o | |
| | | | Emerging growth company | o | |
If an emerging growth company, indicate by check mark if the registrant has elected not to use the extended transition period for complying with any new or revised financial accounting standards provided pursuant to Section 13(a) of the Exchange Act. o
Indicate by check mark whether the registrant has filed a report on and attestation to its management’s assessment of the effectiveness of its internal control over financial reporting under Section 404(b) of the Sarbanes-Oxley Act (15 U.S.C. 7262(b)) by the registered public accounting firm that prepared or issued its audit report. x
If securities are registered pursuant to Section 12(b) of the Act, indicate by check mark whether the financial statements of the registrant included in the filing reflect the correction of an error to previously issued financial statements. o
Indicate by check mark whether any of those error corrections are restatements that required a recovery analysis of incentive-based compensation received by any of the registrant’s executive officers during the relevant recovery period pursuant to §240.10D-1(b). o
Indicate by check mark whether the registrant is a shell company (as defined in Rule 12b-2 of the Act). Yes o No x
State the aggregate market value of the voting and non-voting common equity held by non-affiliates computed by reference to the price at which the common equity was last sold, or the average bid and asked price of such common equity, as of the last business day of the registrant’s most recently completed second fiscal quarter. (The aggregate market value is computed by reference to the last reported sale on the New York Stock Exchange on June 30, 2024): $2,337,846,765
Indicate the number of shares outstanding of each of the registrant’s classes of common stock, as of the latest practicable date: 17,671,654 shares of Common Stock, $1.00 Par Value, as of February 19, 2025.
DOCUMENTS INCORPORATED BY REFERENCE
Portions of the Registrant’s definitive Proxy Statement relating to the 2025 Annual Meeting of Shareholders are incorporated by reference into Part III.
Quaker Chemical Corporation
Table of Contents
PART I
As used in this Annual Report on Form 10-K (the “Report”), the terms “Quaker Houghton,” the “Company,” “we,” and “our” refer to Quaker Chemical Corporation (doing business as Quaker Houghton), its subsidiaries, and associated companies, unless the context otherwise requires.
Item 1. Business.
General Description
The Company was organized in 1918 and incorporated as a Pennsylvania business corporation in 1930. Quaker Houghton is the global leader in industrial process fluids. With a robust presence around the world, including operations in over 25 countries, the Company’s customers include thousands of the world’s most advanced and specialized steel, aluminum, automotive, aerospace, offshore, can, mining, and metalworking companies. Quaker Houghton develops, produces, and markets a broad range of formulated specialty chemical products and offers chemical management services (which we refer to as “FluidcareTM”) for various heavy industrial and manufacturing applications throughout its three segments: Americas; Europe, Middle East and Africa (“EMEA”); and Asia/Pacific.
The major product lines of Quaker Houghton include metal removal fluids, cleaning fluids, corrosion inhibitors, metal drawing and forming fluids, die cast mold releases, heat treatment and quenchants, metal forging fluids, hydraulic fluids, specialty greases, offshore sub-sea energy control fluids, rolling lubricants, rod and wire drawing fluids and surface treatment chemicals. The following are the respective contributions to consolidated net sales of each of our principal product lines representing more than 10% of consolidated net sales for any of the past three years based on the Company’s current product line segmentation:
| | | | | | | | | | | | | | | | | | | | |
| Major Product Line | | 2024 | | 2023 | | 2022 |
| Metal removal fluids | | 22.4 | % | | 23.6 | % | | 22.9 | % |
| Rolling lubricants | | 20.5 | % | | 19.5 | % | | 20.8 | % |
| Hydraulic fluids | | 14.2 | % | | 14.1 | % | | 14.1 | % |
Sales Revenue
The Company’s sales worldwide are made directly through its own employees and its FluidcareTM programs, with the balance sold through distributors and agents. The Company’s employees typically visit the plants of customers regularly, work on site, and through training and experience, identify production needs which can be resolved or otherwise addressed either by utilizing the Company’s existing products or by applying new formulations developed in its laboratories.
As part of the Company’s FluidcareTM business, certain third-party product sales to customers are managed by the Company. Where the Company acts as principal, revenues are recognized on a gross reporting basis at the selling price negotiated with its customers. Where the Company acts as an agent for its customers, revenue is recognized on a net reporting basis at the amount of the administrative fee earned by the Company for ordering the goods. See Note 5, Net Sales and Revenue Recognition, to the Consolidated Financial Statements for more information.
Competition
The specialty chemical industry comprises a number of companies similar in size to Quaker Houghton, as well as companies larger and smaller in size. The Company cannot readily determine its precise competitive position in every industry it serves. However, the Company estimates it holds the leading global position in the market for industrial process fluids including leading global positions in the markets for process fluids in portions of the automotive and industrial markets, and a leading position in the market for process fluids to produce sheet steel and aluminum. The offerings of many of the Company’s competitors differ from those of Quaker Houghton; some offer a broad portfolio of fluids, including general lubricants, while others have more specialized product ranges. All competitors provide different levels of technical services to individual customers. Competition in the industry is based primarily on the ability to supply products and provide technical services that meet the needs of the customer at an appropriate price and value to both the Company and the customer.
Major Customers and Markets
In 2024, Quaker Houghton’s five largest customers (each composed of multiple subsidiaries or divisions with semi-autonomous purchasing authority) accounted for approximately 12% of consolidated net sales, with its largest customer accounting for approximately 3% of consolidated net sales. A significant portion of the Company’s revenues are realized from the sale of process fluids and services to manufacturers of steel, aluminum, automotive, aerospace, industrial equipment, and durable goods and, therefore, Quaker Houghton is subject to the same business cycles as those experienced by these manufacturers and their customers.
The Company’s financial performance is generally correlated to the volume of global production within the industries it serves, rather than directly related to the financial performance of its customers. Furthermore, steel and aluminum customers typically have limited manufacturing locations compared to metalworking customers and generally use higher volumes of products at a single location.
Raw Materials
Quaker Houghton uses approximately 3,000 raw materials, including animal fats, vegetable oils, mineral oils, oleochemicals, surfactant agents, and various chemical compounds that act as additives to our base formulations. Quaker Houghton utilizes a significant number of raw materials derived from crude oil and natural gas. The price of mineral oil and its derivatives can be affected by the price of crude oil and industry refining capacity. Animal fat and vegetable oil prices, as well as the prices of other raw materials, are impacted by their own unique supply and demand factors, and by biodiesel consumption, which in turn can be affected by the price of crude oil and by government incentives for low-carbon fuels. Accordingly, significant fluctuations in the price of crude oil can have a material impact on the cost of these raw materials. In addition, many of the raw materials used by Quaker Houghton are commodity chemicals which can experience significant price volatility. As experienced during 2024 and 2023, the Company’s earnings have been and could continue to be affected by market changes in raw material prices. Refer to the disclosure contained in Item 7A of this Report for additional information.
Patents and Trademarks
Quaker Houghton has a limited number of patents and patent applications including patents issued, applied for, or acquired in the U.S. and in various foreign countries, some of which may be material to its business, with the earliest patent expiry in 2026. The Company principally relies on its proprietary formulae and its applications know-how and experience to meet customer needs. Quaker Houghton products are identified by numerous trademarks that are registered throughout its marketing area.
Research and Development- Laboratories
The Company maintains approximately 30 separate laboratory facilities worldwide that are primarily devoted to applied research and development. In addition, the Company maintains quality control labs at each of its manufacturing facilities. Quaker Houghton research and development is directed primarily toward applied technology since the nature of the Company’s business requires continual modification and improvement of formulations to provide specialty chemicals to satisfy customer requirements. If problems are encountered which cannot be resolved by local laboratories, the problem is referred to one of our 10 principal laboratories, located in Conshohocken, Pennsylvania; Valley Forge, Pennsylvania; Aurora, Illinois; Santa Fe Springs, California; Uithoorn, Netherlands; Coventry, United Kingdom; Dortmund, Germany; Barcelona, Spain; Turin, Italy or Qingpu, China.
Research and development costs are expensed as incurred. Research and development expenses during the years ended December 31, 2024, 2023 and 2022 were $57.3 million, $50.3 million and $46.0 million, respectively.
Recent Acquisition Activity
Subsequent to the date of these financial statements, in February 2025, the Company acquired Chemical Solutions & Innovations (Pty) Ltd. (“CSI”), for approximately $3.9 million, subject to routine and customary post-closing adjustments. CSI is based in South Africa and is a supplier of metalworking fluids and lubricants to the South African market. CSI will be reported as part of the EMEA reportable segment. This acquisition strengthens Quaker Houghton’s position in South Africa and expands the Company’s presence in that region.
In July 2024, the Company acquired the Sutai Group (“Sutai”), for approximately $16.2 million, including an initial cash payment of $14.6 million, subject to routine and customary post-closing adjustments related to working capital and net indebtedness levels, as well as earn-out provisions with an initial estimated payout of $1.6 million related to the finalization of 2024 and 2025 earnings. Assets acquired included cash and cash equivalents of $5.5 million. Sutai is based in Japan and provides impregnation treatment products and services to the automotive and other industries. Sutai is reported as part of the Asia/Pacific reportable segment. This acquisition strengthens Quaker Houghton’s technology portfolio, enabling the Company to better support and optimize production processes for customers across the Japanese, Asia Pacific and global markets.
During February 2024, the Company acquired I.K.V. Tribologie IKVT and its subsidiaries (“IKV”) for $35.2 million, including an initial cash payment of $29.7 million, subject to routine and customary post-closing adjustments related to working capital and net indebtedness levels as well as earn-out provisions related to the finalization of 2023 earnings. Assets acquired included approximately $4.8 million of cash and cash equivalents. IKV, which is part of the Company’s EMEA segment, specializes in high-performance lubricants and greases, including original equipment manufacturer first-fill greases that are primarily used in the automotive, aerospace, electronics and other industrial markets. The acquisition of IKV strengthens the Company’s position in first-fill greases.
The results of operations of Sutai and IKV subsequent to the acquisition dates are included in the Consolidated Statements of Operations for the year ended December 31, 2024.
Regulatory Matters
In order to facilitate compliance with applicable federal, state, and local statutes and regulations relating to occupational health and safety and protection of the environment, the Company has an ongoing program of site assessments for the purpose of identifying capital expenditures or other actions that may be necessary to comply with such requirements. The program includes periodic inspections of each facility by the Company and/or independent experts, as well as ongoing inspections and training by on-site personnel. Such inspections, among other things, address operational matters, record keeping, reporting requirements and capital improvements. Capital expenditures directed solely or primarily to regulatory compliance amounted to approximately $6.0 million, $3.5 million and $2.2 million during the years ended December 31, 2024, 2023 and 2022, respectively.
Company Segmentation
The Company’s operating segments, which are consistent with its reportable segments, reflect the structure of the Company’s internal organization, the method by which the Company’s resources are allocated and the manner by which the Chief Operating Decision Maker assesses the Company’s performance.
During the first quarter of 2023, the Company reorganized its executive management team to align with its new business structure. The Company’s new structure includes three reportable segments: (i) Americas; (ii) EMEA; and (iii) Asia/Pacific. Prior period information has been recast to align with the Company’s business structure as of January 1, 2023, including reportable segments and customer industry disaggregation. See Notes 4, 5, and 15 of Notes to Consolidated Financial Statements in Item 8 of this Report.
Non-U.S. Activities
Since significant revenues and earnings are generated by non-U.S. operations, the Company’s financial results are affected by currency fluctuations, particularly between the U.S. dollar and the euro, the Brazilian real, the Mexican peso, the Chinese renminbi, the British pound sterling and the Indian rupee, and the impact of those currency fluctuations on the underlying economies. In addition, trade policies and tariffs, including those affecting the Company’s key markets, could further impact exchange rates and economic stability, influencing both the cost of raw materials and the competitiveness of the Company’s products in international markets. Reference is made to (i) the foreign exchange risk information contained in Item 7A of this Report, (ii) the geographic information in Note 4, Business Segments, to the Consolidated Financial Statements and (iii) information regarding risks attendant to foreign operations included in Item 1A of this Report.
Number of Employees
On December 31, 2024, Quaker Houghton had approximately 4,400 full-time employees globally of whom approximately 1,000 were employed by the parent company and its U.S. subsidiaries, and approximately 3,400 were employed by its non-U.S. subsidiaries. Associated companies of Quaker Houghton (in which it owns 50% or less and has significant influence) employed approximately 600 people on December 31, 2024.
Core Values
Quaker Houghton considers its employees as its greatest strength in differentiating our business and strengthening our market positions. The Company’s goal is to have an organization that is inclusive of all of its people and is representative of the communities in which we operate.
The Company’s core values are (i) live safe; (ii) act with integrity; (iii) drive results; (iv) exceed customer expectations; (v) embrace diversity; and (vi) do great things together. Our core values embody who we are as a company, build a safer, stronger Quaker Houghton, and guide the Company’s internal conduct and relationship with the outside world. By fostering a culture and environment that exemplifies our core values, we gain, as a company, unique perspectives, backgrounds and varying experiences to ensure continued long-term success.
Aligned to our core values, all full-time employees are provided up to 16 hours per calendar year to volunteer for a non-profit or charity of their choice. The approach is supported by recommendations to our employees regarding volunteering opportunities, such as environmental conservation, STEM education, community health, safety and development opportunities for underrepresented groups. In 2024, we expanded our donation-matching and grantmaking programs to impact our local communities globally with matching and grants available to eligible organizations across the globe.
Sustainability Governance and Strategy
In 2020, the Company established the Board Sustainability Committee, which has specific responsibility to assist the Board of Directors (the “Board”) in its assessment, evaluation, and oversight of the Company’s sustainability programs and initiatives. In formulating our sustainability strategy, our Executive Leadership Team (“ELT”) and Board consider certain risks and uncertainties that may materially impact our financial condition and results of operations. These risks and uncertainties are further described in Item 1A of this Report.
In 2020, we completed an impact materiality assessment identifying critical environmental, social, and governance topics that our sustainability program was founded on in 2021. Since then we have made significant progress towards our strategy to Innovate Together for a Better Tomorrow, Protect Our Planet, Empower Our Colleagues and Communities, and Source Our Materials Responsibly. Details of that progress can be found in our Sustainability Report. In 2024, the Company initiated its first double materiality assessment to identify its material sustainability impacts, risks and opportunities as a part of Corporate Sustainability Responsibility Directive (“CSRD”) compliance. The potential impacts of this assessment are still being evaluated.
In 2024, we achieved eighteen of the twenty internal sustainability goals set to support our strategy. The Company increased its renewable electricity usage by approximately 5% compared to 2023 and implemented over 167 projects to reduce waste, water and energy usage. The Company consumes approximately 76% of its electricity consumption from renewable and zero carbon sources. Additionally, the Company launched its See Beyond™ portfolio of sustainable solutions and avoided or eliminated over 23,000 metric tons of waste at FluidcareTM customer locations. Finally, we achieved zero serious injury recordables and exceeded our industry’s standard for volunteering. We plan to provide further progress updates in our 2024 Sustainability Report.
Sustainability Report
We report our progress on our Sustainability strategy in our sustainability report, which is published annually and is available on our corporate website at https://home.quakerhoughton.com/sustainability. The Company’s 2023 Sustainability Report reflects the most recent data on a variety of topics, including specific information relating to the Company’s environmental, social, and governance initiatives. Information in these sustainability reports and on our website are not incorporated by reference in this Report and, accordingly, should not be considered part of this Report.
Talent Development, Culture and Total Rewards
Our Compensation and Human Resources Committee is responsible for overseeing our policies and strategies related to culture and human capital. We place importance on developing our leaders at all levels. Our leaders have access to training on coaching, performance and rewards, development planning and change management, as well as specialized opportunities for external coaching, leadership assessments, or external development programs. We continue to utilize a robust process in which each department’s talent landscape is evaluated, talent is assessed, critical roles are identified, and succession planning occurs. Output of these processes results in career development and other related talent plans designed to ensure we have the talent we need to deliver results both now and in the future.
Additionally, we regularly evaluate our total rewards offerings to ensure that our total compensation and benefits packages are aligned with our business strategy and organizational culture. We strive to create a culture where recognition is ingrained, including utilization of an enterprise reward and recognition program that incentivizes the results and behaviors of our employees and their impacts on our teams and business.
Inclusion
Quaker Houghton strives to cultivate an inclusive culture. Accordingly, Quaker Houghton provides equal employment opportunities and does not discriminate based on age, ethnicity, sex, sexual identity, disability/medical condition, race, religion, or sexual orientation.
Inclusion begins with the Board and ELT. For additional information on the Company’s leadership, refer to Item 4(a) Information about our Executive Officers and Item 10. Directors, Executive Officers and Corporate Governance.
Workplace Safety
We are committed to maintaining a strong safety culture and to emphasizing the importance of our employees’ role in identifying, mitigating and communicating safety risks. We maintain policies and operational practices that communicate a culture where all levels of employees are responsible for safety. We believe that the achievement of superior safety performance is both an important short-term and long-term strategic goal in managing our operations. We emphasize ten “lifesaving” rules which make a significant difference in preventing serious injuries and fatalities. We have launched several “Live Safe” initiatives to create an environment of openness and awareness in which all employees are actively engaged in meeting safety targets. We are keen in reporting near misses, hazard identifications and educating our employees on their “Stop Work Authority”, which are seen as leading indicators, helping us to get to zero incidents. Our leading indicators are proactive and preventive measures that can shed light about the effectiveness of safety and health activities and reveal potential problems in a safety and health program. We also require all employees to regularly complete safety training. Additionally, our ELT is closely involved in our safety programs, conducts regular reviews of safety performance metrics and reviews the Company’s safety performance during Company-wide meetings.
Quaker Houghton on the Internet
Financial results, news and other information about Quaker Houghton can be accessed from the Company’s website at https://www.quakerhoughton.com. This site includes important information on the Company’s locations, products and services, financial reports, news releases and career opportunities. The Company’s periodic and current reports on Forms 10-K, 10-Q, 8-K, and other filings, including exhibits and supplemental schedules filed therewith, and amendments to those reports, filed with the Securities and Exchange Commission (“SEC”) are available on the Company’s website as soon as reasonably practicable after they are electronically filed with or furnished to the SEC. Information contained on, or that may be accessed through, the Company’s website is not incorporated by reference in this Report and, accordingly, you should not consider that information part of this Report.
Factors that May Affect Our Future Results
Certain information included in this Report and other materials filed or to be filed by us with the SEC, including the Company’s other periodic reports on Forms 10-K, 10-Q and 8-K, press releases, and other materials released to, or statements made to, the public, as well as information included in oral statements or other written statements made or to be made by us, contain or may contain forward-looking statements that fall under the safe harbor provisions of the Private Securities Litigation Reform Act of 1995 and the Securities Act of 1933, as amended. These statements can be identified by the fact that they do not relate strictly to historical or current facts and can generally be identified by words such as “may,” “could,” “should,” “would,” “believe,” “expect,” “anticipate,” “estimate,” “intend,” “outlook,” “target,” “possible,” “potential,” “plan” or similar expressions, but these terms are not the exclusive means of identifying such statements. Such statements include information relating to current and future business activities, operational matters, capital spending, and financing sources. We have based these forward-looking statements on assumptions, projections and expectations about future events that we believe are reasonable based on currently available information, including statements regarding the potential effects of economic downturns, tariffs, including uncertainty surrounding changes in tariffs, inflation, and global supply chain constraints on the Company’s business, results of operations, and financial condition; our expectation that we will maintain sufficient liquidity and remain in compliance with the terms of the Company’s credit facility; expectations about future demand and raw material costs; and statements regarding the impact of increased raw material costs and pricing initiatives.
These forward-looking statements include statements with respect to our beliefs, plans, objectives, goals, expectations, anticipations, intentions, financial condition, results of operations, future performance, and business, which may differ materially from expectations, estimates and projections because of many factors, including, but not limited to:
•the timing and extent of the impacts on our business from acts of war, terrorism and military conflicts, including those in Ukraine and the Middle East, as well as related economic, political and governmental actions taken by various governments and governmental organizations in response;
•inflationary pressures, increases in raw material costs, supply chain constraints and other impacts of economic downturns, as well as high interest rates and their impact on our and our customers’ business operations;
•the potential timing, impacts, benefits and other uncertainties of acquisitions and divestitures, including our ability to realize synergies, integrate acquisitions and acquired businesses or separate divested assets and businesses;
•broader macroeconomic factors, including potential for changes in global and regional economic conditions, the possibility of global or regional slowdowns or recessions, a global pandemic, interest rate fluctuations, tariffs, deflation or stagflation and the potential for an economic recession; and
•our future results and plans including our sustainability goals and enterprise strategy.
A major risk is that demand for the Company’s products and services is largely derived from the demand for our customers’ products, which subjects the Company to uncertainties related to downturns in a customer’s business and unanticipated customer production slowdowns and shutdowns.
Other major risks and uncertainties include, but are not limited to, legislative and regulatory developments including changes to existing laws and regulations, or the way they are interpreted, applied or enforced; tariffs, trade restrictions and the economic and other sanctions imposed by other nations on Russia and Belarus and/or other governments or government organizations; suspensions of activities in Russia by many multinational companies; foreign currency fluctuations; significant changes in applicable tax rates and regulations; terrorist attacks and other acts of violence; the impacts of consolidation in our industry, including loss or consolidation of a major customer; the effects of climate change, fire or other natural disasters; and the potential occurrence of cyber-security breaches, cyber-security attacks, other technology outages and security incidents.
Furthermore, the Company is subject to the same business cycles as those experienced by our customers in the steel, automotive, aerospace, industrial equipment, aluminum, and durable goods industries.
Any or all of the forward-looking statements in this Report, in the Company’s Annual Report to Shareholders for 2024 or in any other public statements we make may prove to be incorrect due to inaccurate assumptions or unforeseen risks and uncertainties. In addition to the factors above, our forward-looking statements are qualified with respect to the risks disclosed elsewhere in this Report, including in Item 1A, Risk Factors, Item 7, Management’s Discussion and Analysis of Financial Condition and Results of Operations, and Item 7A, Quantitative and Qualitative Disclosures About Market Risk. These risks, uncertainties, and possible inaccurate assumptions relevant to our business could materially impact our future performance and cause our actual results to differ materially from expected and historical results. We undertake no obligation to publicly update any forward-looking statement, whether as a result of new information, future events or otherwise. However, additional disclosures on related subjects can be found in the Company’s subsequent reports on Forms 10-K, 10-Q, 8-K and other related filings.
We caution you not to place undue reliance on our forward-looking statements.
Item 1A. Risk Factors.
There are many factors that may affect our business and results of operations, including the following risks relating to: (1) the demand for our products and services and our ability to grow our customer base; (2) our business operations, including internal and external factors that may impact our operational continuity; (3) our international operations; (4) our supply chain; (5) domestic and foreign taxation and government regulation and oversight; and (6) more general risk factors that may impact our business.
Risks Related to the Demand for our Products and Services and our Customer Base
Changes to the industries and markets that we serve could have a material adverse effect on our liquidity, financial position and results of operations.
As a leader in industrial process fluids, the Company is subject to the same business cycles as those experienced by our customers that participate in the steel, automotive, industrial equipment, aerospace, aluminum and durable goods industries. Because demand for our products and services is largely derived from the global demand for our customers’ products, we are subject to uncertainties related to downturns in our customers’ businesses and shutdowns or curtailments of our customers’ production, including as a result of adverse changes affecting national, regional and global economies or increased competitive pressure within our customers’ industries. Our customers may experience deterioration of their businesses, cash flow shortages and difficulty obtaining financing, leading them to delay or cancel plans to purchase products, and they may not be able to pay our bills or fulfill their other obligations in a timely fashion. We have limited ability to adjust our costs contemporaneously with changes in sales; thus, a significant sudden downturn in sales or increased credit losses due to reductions in global production within the industries we serve and/or weak end-user markets could have a material adverse effect on our liquidity, financial position and results of operations. Further, our suppliers and other business partners may experience similar conditions, which could impact their ability to fulfill their obligations to us and also result in material adverse effects on our liquidity, financial position and results of operations.
Changes in competition in the industries and markets we serve could have a material adverse effect on our liquidity, financial position and results of operations.
The specialty chemical industry is highly competitive and there are many companies with significant financial resources and/or customer relationships that compete with us to provide similar products and services. Some competitors may be able to offer more favorable or flexible pricing and service terms or may be better able to adapt to changes in conditions in our industries, fluctuations in the costs of raw materials or to changes in global economic conditions, potentially resulting in reduced profitability and/or a loss of market share for us. The pricing decisions of our competitors could lead us to decrease our prices which could negatively affect our margins and profitability. In addition, our competitors could potentially consolidate their businesses and gain scale or better position their product offerings, which could have a negative impact on our profitability and market share. Competition in our industry historically has also been based on the ability to provide products that meet the needs of the customer and render technical services and laboratory assistance, which our competitors may be able to accomplish more effectively than us. If we are unsuccessful with differentiating ourselves, it could have a material adverse effect on our liquidity, financial position and results of operations and we could lose market share to our competitors.
Loss of a significant customer, bankruptcy of a major customer, or the closure of or significant reduction in production at a customer site could have a material adverse effect on our liquidity, financial position and results of operations.
During 2024, the Company’s top five largest customers (each composed of multiple subsidiaries or divisions with semi-autonomous purchasing authority) together accounted for approximately 12% of our consolidated net sales, with the largest customer accounting for approximately 3% of our consolidated net sales. The loss of a significant customer could have a material adverse effect on our liquidity, financial position and results of operations. Also, a significant portion of our revenues is derived from sales to customers in the cyclical steel, aerospace, aluminum and automotive industries, where bankruptcies have occurred in the past and where companies have periodically experienced financial difficulties. If a significant customer experiences financial difficulties or files for bankruptcy protection, we may be unable to collect on our receivables, customer manufacturing sites may be closed, or our contracts may be voided. The bankruptcy of a major customer could therefore have a material adverse effect on our liquidity, financial position and results of operations. Also, some of our customers, primarily in the steel, aluminum and aerospace industries, often have fewer manufacturing locations compared to other metalworking customers and generally use higher volumes of products at a single location. The loss, closure, or significant reduction in production at one or more of these locations or other major sites of a significant customer could have a material adverse effect on our business.
We may not be able to timely develop, manufacture and gain market acceptance of new and enhanced products required to maintain or expand our business, which could adversely affect our competitive position and our liquidity, financial position and results of operations.
We believe that our continued success depends on our ability to continuously develop and manufacture new products and product enhancements on a timely and cost-effective basis in response to customer demands for higher performance process chemicals and other product offerings. Our competitors may develop new products or enhancements to their products that offer performance, features and lower prices that may render our products less competitive or obsolete, and cause us to lose business and/or significant market share. The development and commercialization of new products require significant expenditures over an extended period of time, and some products that we seek to develop may fail to gain traction or never become profitable. In any event, ongoing investments in research and development for the future do not yield an immediate beneficial impact on our operating results and therefore could result in higher costs without a proportional increase in revenues.
In addition, our customers use our specialty chemicals for a broad range of applications. Changes in our customers’ products or processes or changes in regulatory, legislative or industry requirements may lead our customers to reduce consumption of the specialty chemicals that we produce or make them unnecessary or less attractive. Customers may also adopt alternative materials or processes that do not require our products. Examples of such evolving customer demands and industry trends are the movement towards lighter-weight materials and the growing prevalence of electric vehicles. Should a customer decide to use a different material or technology due to price, performance or other considerations, we may not be able to supply a product that meets the customer’s new requirements. Consequently, it is important that we develop new products to replace the products that mature and decline in use. Despite our efforts, we may not be able to develop and introduce products incorporating new technologies in a timely manner that will satisfy our customers’ future needs or achieve market acceptance. Moreover, new products may have lower margins than the products they replace. Our business, results of operations, cash flows and margins could be materially adversely affected if we are unable to successfully manage the maturation or obsolescence of our existing products and the introduction of new products successfully.
Risks Related to Business Operations, Including Internal and External Factors that May Impact Our Operational Continuity
Our ability to successfully implement our business strategy requires that we effectively and efficiently execute and integrate the acquisitions we identify as strategic as well as successfully divest those operations that are no longer important to that strategy. If we are unsuccessful, we may be unable to achieve our strategic objectives and could also be subject to unanticipated integration costs and claims for indemnification from the buyers of businesses we may divest, all of which could adversely impact our liquidity, financial position and results of operation.
Our business strategy includes making acquisitions and other investments that complement our existing businesses, and based on an evaluation of our business portfolio, sometimes divesting existing businesses that are not important to our strategy. We continually analyze and evaluate acquisition opportunities with the potential to strengthen our industry position, enhance our existing product offerings or deepen our relationships with our customers. We may not successfully identify suitable acquisition candidates or have sufficient financing and/or cash available to successfully complete acquisitions we identify, especially in a competitive sales process.
In addition, strategic acquisitions present operational, financial, and managerial challenges to integration, including diversion of management attention from existing businesses, difficulty with integrating or separating personnel and financial and other systems, increased expenses and raw material costs, assumption of unknown liabilities and indemnities that may not be discovered before an acquisition or fully reflected in the price we pay, and potential disputes with the sellers. If we are unable to consummate such transactions, or successfully integrate and grow completed acquisitions and achieve contemplated revenue synergies and cost savings, our financial condition and results of operations could be adversely affected.
We may also need to finance future acquisitions, and the terms of any financing, and the need to ultimately repay or refinance any indebtedness, may have negative effects on us. Acquisitions also could have a dilutive effect on our financial results. Acquisitions also generally result in goodwill, which would need to be written off against earnings in the future if it becomes impaired. Acquisitions and investments may involve significant cash expenditures, debt incurrences, equity issuances, operating losses, and expenses.
Further, the success of any acquisition we complete depends on our ability to navigate risks such as those listed above and successfully integrate acquisitions, including, but not limited to, our ability to:
•develop or modify financial reporting, information systems, and other related financial tools to ensure overall financial integrity and adequacy of internal control procedures;
•identify and capitalize on potential synergies, including cost reduction opportunities;
•adequately address challenges arising from the increased scope, geographic diversity and complexity of our operations; and
•further penetrate existing, and expand into new, markets with the products and capabilities acquired in acquisitions.
If we fail to successfully integrate acquisitions into our existing business, our financial condition and results of operations could be adversely affected. We may fail to obtain the benefits we anticipate from our recently completed or future acquisitions or joint ventures and we may not create the appropriate infrastructure to support the additional growth from organic or acquired businesses, which could also have a material adverse effect on our liquidity, financial position and results of operations.
Divestitures have inherent risks, including the possibility that we may not be able to achieve the proceeds we desire from a sale, potential post-closing liabilities and claims for indemnification, that may impact our ability to fully realize the anticipated benefits of a given divestiture. In particular, in connection with the sale of certain properties and businesses, we agreed to indemnify the purchasers for certain types of matters, including certain breaches of representations and warranties, taxes and certain environmental matters. With respect to environmental matters, the discovery of contamination arising from properties that we have divested may expose us to indemnity obligations under the sale agreements with the buyers of such properties or cleanup obligations and other damages under applicable environmental laws, even if we were not aware of the contamination. We may not have insurance coverage for such indemnity obligations. Further, we cannot predict the nature or amount of any indemnity or other obligations we may have to pay. These payments may be costly and may adversely affect our financial position and results of operations. If these or other post-closing risks materialize, the benefits of any divestiture may not be fully realized, if at all, and our business, financial condition, and results of operations could be negatively impacted.
Gulf and its wholly-owned subsidiary, QH Hungary Holdings Limited, have a significant minority stake in the Company and the contractual ability to nominate certain directors of the Company, which may enable them to influence the direction of our business and significant corporate decisions.
Gulf and its wholly-owned subsidiary, QH Hungary Holdings Limited (together, the “Gulf Affiliates”), remain our largest shareholders. If they were to make available for sale a portion of their shares, that portion could represent a significant amount of common stock of the Company being sold and any such transaction (if it were to occur) could have an adverse impact on the Company’s stock price or otherwise cause price volatility.
In addition, under our shareholders agreement with the Gulf Affiliates, they currently have the right to designate three individuals for election to the Board and this right, together with their share ownership, gives them substantial influence over our business, including over matters submitted to a vote of our shareholders, including the election of directors, amendment of our organizational documents, acquisitions or other business combinations involving the Company, and potentially the ability to prevent extraordinary transactions such as a takeover attempt or business combination. The concentration of ownership of our shares held by the Gulf Affiliates may make some future actions more difficult without their support. The Gulf Affiliates, however, among other provisions in the shareholders agreement, have agreed that for so long as any of their designees are on the Board, and for six months thereafter, they will vote all Quaker Houghton shares consistent with the recommendations of the Board for each director nominee as reflected in each proxy statement of the Company, including in support of any Quaker Houghton directors nominated for election or re-election to the Board (except as would conflict with their rights to designees on the Board). Nevertheless, the interests of Gulf may conflict with our interests or the interests of our other shareholders, though we are not aware of any such existing conflicts of interest at this time.
The timing and amount of the Company’s share repurchases are subject to a number of uncertainties, and there can be no assurance that we will continue to repurchase shares of our common stock.
On February 28, 2024, the Board approved a new share repurchase program (“2024 Share Repurchase Program”), authorizing the Company to repurchase up to an aggregate of $150 million of the Company’s outstanding common stock. The 2024 Share Repurchase Program replaced an earlier program, was effective immediately and has no expiration date. Under the 2024 Share Repurchase Program, the Company is authorized to repurchase shares through open market purchases, privately-negotiated transactions, accelerated share repurchases or otherwise in accordance with applicable federal securities laws, including through Rule 10b5-1 and under Rule 10b-18 of the Securities Exchange Act of 1934, as amended. The Company continues to employ trading plans for the repurchase of shares pursuant to the 2024 Share Repurchase Program, which permit the Company to purchase shares, at predetermined price targets, when it may otherwise be precluded from doing so. The 2024 Share Repurchase Program does not obligate us to acquire any particular amount of common stock, and it may be terminated at any time at the Company’s discretion. The specific timing and amount of repurchases will vary based on available capital resources and other financial and operational performance, market conditions, securities law limitations, and other factors. Important factors that could cause the Company to limit, suspend or delay its share repurchases include unfavorable trading market conditions, the price of the Company’s common stock, the nature of other investment opportunities presented to us from time to time, the ability to obtain financing at attractive rates and the availability of U.S. cash, all of which we cannot predict.
Repurchase activities could affect the price of our common stock and increase its volatility. The existence of the 2024 Share Repurchase Program could also cause the price of our common stock to be higher than it would be in the absence of such a program and could potentially reduce the market liquidity for our common stock. There can be no assurance that any stock repurchases will enhance stockholder value because the market price of our common stock could decline below the levels at which we repurchased such shares, as we experienced in 2024. Any failure to repurchase shares after we have announced our intention to do so could negatively impact our reputation and investor confidence in us and could negatively impact our stock price. Although the 2024 Share Repurchase Program is intended to enhance long-term shareholder value, short-term stock price fluctuations could reduce the program’s effectiveness.
Failure to comply with any material provision of our principal credit facility or other debt agreements could have a material adverse effect on our liquidity, financial position and results of operations.
Our principal credit facility requires the Company to comply with certain provisions and covenants and while we do not currently consider these provisions and covenants to be overly restrictive, they could become more difficult to comply with as our business or financial conditions change. We are also subject to interest rate risk due to the variable interest rates within the credit facility and if interest rates rise, interest costs would increase as well.
Our principal credit facility contains provisions that are customary for facilities of its type, including affirmative and negative covenants, financial covenants and events of default, including restrictions on (a) the incurrence of additional indebtedness, (b) investments in and acquisitions of other businesses, lines of business and divisions, (c) the making of dividends or capital stock purchases and (d) dispositions of assets. Other financial covenants contained in our principal credit facility include a consolidated interest coverage test and a consolidated net leverage test. Customary events of default in the credit facility include, among others, defaults for non-payment, breach of representations and warranties, non-performance of covenants, cross-defaults, insolvency, and a change of control of the Company in certain circumstances. If we are unable to comply with the financial and other provisions of our principal credit facility, we could become in default. The occurrence of an event of default under the credit facility could result in all loans and other obligations becoming immediately due and payable and the facility being terminated. In addition, deterioration in the Company’s results of operations or financial position could significantly increase borrowing costs.
Our variable-rate indebtedness subjects us to interest rate risk, which could cause our debt service obligations to increase significantly or result in an inability to obtain sufficient financing on favorable terms. Additionally, rising interest rates could have a material adverse effect on our business, financial condition, results of operations, or cash flows.
We carry, and expect to continue to carry for the foreseeable future, a substantial amount of debt and other fixed obligations. Our ability to satisfy these obligations, finance acquisitions, repurchase shares, and pay dividends rely on our access to capital, which depends in large part on cash flow generated by our business and the availability of debt financing. The Company’s principal credit facility permits interest on certain variable-rate borrowings to be calculated based on the Term Secured Overnight Financing Rate (“Term SOFR”), which exposes us to interest rate risk. See Note 19, Debt, to the Consolidated Financial Statements for more information.
Interest rate increases, which we have experienced in the past and may experience again in the future, increase our debt service obligations on the variable-rate indebtedness even though the amount borrowed remains the same, which requires us to use more of our available cash to service our indebtedness. In order to manage the Company’s exposure to variable interest rate risk associated with the Company’s principal credit facility, in the first quarter of 2023, the Company entered into three-year interest rate swaps to convert a portion of the Company’s variable interest rate borrowings to an average fixed rate plus an applicable margin as provided in the Company’s principal credit facility, based on the Company’s consolidated net leverage ratio. These swaps only cover a portion of our variable rate indebtedness. See Note 24, Hedging Activities, to the Consolidated Financial Statements for more information.
Rising interest rates not only increase our cost of capital but could also have a dampening effect on overall economic activity and the financial condition of the Company's customers, either or both of which could negatively affect customer demand for the Company's products and customers' ability to repay their obligations. Rising interest rates could also cause credit market dislocations, which could have an impact on the Company’s and its customers' cost of capital.
Risks Related to our International Operations
Our global presence subjects us to political and economic risks that could adversely affect our business, liquidity, financial position and results of operations.
A significant portion of our revenues and earnings are generated by our non-U.S. operations. Our success as a global business depends, in part, upon our ability to succeed across different legal, regulatory, economic, social and political conditions by developing, implementing and maintaining policies and strategies that are effective in all of the locations where we do business. Risks inherent in our global operations include:
•trade protection measures including import and export controls, trade embargoes, and trade sanctions affecting countries or regions we serve that could result in our losing access to customers and suppliers in those countries or regions;
•unexpected adverse changes in export duties, quotas and tariffs and difficulties in obtaining export licenses;
•termination or substantial modification of international trade agreements that may adversely affect our access to raw materials and to markets for our products;
•our agreements with counterparties in countries outside the U.S. may be difficult for us to enforce and related receivables may take longer or be difficult for us to collect;
•less protective foreign intellectual property laws, and more generally, legal systems that may be less developed and predictable than those in the U.S.;
•limitations on ownership or participation in local enterprises as well as the potential for expropriation or nationalization of enterprises;
•instability in or adverse changes to the economic, political, social, legal or regulatory conditions in a country or region where we do business, as a result of terrorist activities, political disruption and/or military conflict such as those that are being experienced in multiple areas around the world; and
•complex and dynamic local tax regulations, including changes in foreign laws and tax rates or U.S. laws and tax rates with respect to foreign income that may unexpectedly increase the rate at which our income is taxed, impose new and additional taxes on remittances, repatriation or other payments by subsidiaries, or cause the loss of previously recorded tax benefits.
The current global geopolitical and trade environment creates the potential for increased escalation of domestic and international tariffs and retaliatory trade policies, including the possibility of a “trade war” involving the United States and one or more of its trading partners. If tariffs are imposed or increased, materials and goods that U.S. companies import and export may face higher prices, and this could lead to significant shortages or price increases in our raw materials, decreased international sales, reduced margins or increased prices. Changes in U.S. trade policy and retaliatory actions by U.S. trade partners could also result in weakening economic conditions. If we are unable to successfully manage these and other risks associated with our international businesses, the risks could have a material adverse effect on our business, results of operations and financial condition.
The scope of our international operations subjects us to risks from currency fluctuations that could adversely affect our liquidity, financial position and results of operations.
Our non-U.S. operations generate significant revenues and earnings. Fluctuations in foreign currency exchange rates, including hyperinflationary conditions, may affect product demand and may adversely affect the profitability in U.S. dollars of the products and services we provide in international markets where payment for our products and services is made in the local currency. Our financial results are affected by currency fluctuations, particularly between the U.S. dollar and the Euro, the British pound sterling, the Brazilian real, the Mexican peso, the Chinese renminbi and the Indian rupee. During the past three years, sales by our non-U.S. subsidiaries accounted for approximately 63% to 65% of our consolidated net sales. We generally do not use financial instruments that expose us to significant risk involving foreign currency transactions; however, the relative size of our non-U.S. activities has a significant impact on reported operating results and our net assets. Therefore, as exchange rates change, our results can be materially affected. Incorporated by reference is the foreign exchange risk information contained in Item 7A of this Report and the geographic information in Note 4, Business Segments, to the Consolidated Financial Statements included in Item 8 of this Report.
Also, we occasionally source inventory in a different country than that of the intended sale. This practice can give rise to foreign exchange risk. We seek to mitigate this risk through local sourcing of raw materials in the majority of our locations.
Risks Relating to Our Supply Chain
If we are unable to obtain price increases or contract concessions sufficient to offset increases in the costs of raw materials, this could result in a loss of sales, gross profit, and/or market share and could have a material adverse effect on our liquidity, financial position and results of operations. Conversely, if we fail to adjust prices in a declining raw material cost environment, we could lose sales, gross profit, and/or market share which could have a material adverse effect on our liquidity, financial position and results of operations.
Quaker Houghton uses approximately 3,000 raw materials, including animal fats, vegetable oils, mineral oils, oleochemicals, ethylene, solvents, surfactant agents, and various chemical compounds that act as additives to our base formulations, and a wide variety of other organic and inorganic compounds and various derivatives of the foregoing. The price of mineral oil and its derivatives can be affected by the price of crude oil and industry refining capacity. Animal fat and vegetable oil prices, as well as the prices of other raw materials, are impacted by their own unique supply and demand factors, and by biodiesel consumption, which in turn can be affected by the price of crude oil and by government incentives for low-carbon fuels. Accordingly, significant fluctuations in the price of crude oil can have a material impact on the cost of these raw materials. In addition, many of the raw materials used by Quaker Houghton are commodity chemicals which can experience significant price volatility.
We generally attempt to pass through changes in the prices of raw materials to our customers, but we may be unable to do so (or may be delayed in doing so). In addition, raising prices we charge to our customers in order to offset increases in the prices we pay for raw materials could cause us to suffer a loss of sales volumes. Although we have been successful in recovering a substantial amount of raw material cost increases while retaining our customers, there can be no assurance that we will be able to continue to offset higher raw material costs or retain customers in the future. A significant change in margin or the loss of customers due to pricing actions could result in a material adverse effect on our liquidity, financial position and results of operations as described within Item 7 of this Report.
Lack of availability of raw materials and issues associated with sourcing from single suppliers and suppliers in volatile economic environments could have a material adverse effect on our liquidity, financial position and results of operations.
The specialty chemical industry periodically experiences supply shortages for certain raw materials. In addition, we source some materials from a single supplier or from suppliers in jurisdictions that have experienced political or economic instability. Even where we have multiple suppliers of a particular raw material, there are occasionally shortages. Any significant disruption in supply, such as was experienced several years ago, could affect our ability to obtain raw materials or satisfactory substitutes or could increase the cost of such raw materials or substitutes, which could have a material adverse effect on our liquidity, financial position and results of operations. In addition, certain raw materials that we use are subject to various regulatory laws, and a change in our ability to legally use such raw materials may impact the products or services we are able to offer which could negatively affect our ability to compete and could adversely affect our liquidity, financial position and results of operations.
Loss of a significant manufacturing facility or disruptions within our supply chain or in transportation could have a material adverse effect on our liquidity, financial position and results of operations.
Our manufacturing facilities are located throughout the world. While we have some redundant capabilities, if one of our facilities is forced to shut down or curtail operations because of damage or other unforeseen factors, including natural disasters, labor difficulties or public health crises, we may not be able to timely supply our customers. This could result in a loss of sales over an extended period or permanently. While the Company seeks to mitigate this risk through business continuity and contingency planning and other measures, the loss of production in any one region over an extended period of time could have a material adverse effect on our liquidity, financial position and results of operations. Any losses due to these events may not be covered by our existing insurance policies or may be subject to deductibles.
We could be similarly adversely affected by disruptions to our supply chain and transportation network. The Company relies heavily on railroads, ships, and over-the-road shipping methods to transport raw materials to its manufacturing facilities and to transport finished products to customers. The costs of transporting our products could be negatively affected by factors outside of our control, including shipping container shortages or global imbalances in shipping capabilities, port strikes or other labor disruptions, transportation disruptions or rate increases, increased border controls or closures, extreme weather events, tariffs, rising fuel costs, armed conflicts and capacity constraints. Significant delays or increased costs affecting our supply chain could materially affect our liquidity, financial condition and results of operations. Disruptions at our suppliers could lead to increases in raw material or energy costs and/or reduced availability of materials or energy, potentially affecting our liquidity, financial condition and results of operations.
Risks Relating to Domestic and Foreign Taxation and Government Regulation and Oversight
Changes in tax laws could result in fluctuations in our effective tax rate and have a material effect on our liquidity, financial position and results of operations.
We pay income taxes in the U.S. and various foreign jurisdictions. Our effective tax rate is derived from a combination of local tax rates and tax attributes applicable to our operations in the various countries, states and other jurisdictions in which we operate. Our effective tax rates and tax liabilities could therefore be materially affected by changes in the mix of earnings in countries with differing statutory tax rates, changes in tax rates, expiration or lapses of tax credits or incentives, changes in uncertain tax positions, changes in the valuation of deferred tax assets and liabilities, or changes in tax laws or in how they are interpreted or enforced, including matters such as transfer pricing. In addition, we are regularly under audit by tax authorities, and the final decisions of such audits could materially affect our current tax estimates and tax positions. See Note 10, Incomes Taxes, and Note 25, Commitments and Contingencies, to the Consolidated Financial Statements in Item 8 of this Report for a discussion of uncertain tax positions, tax years subject to examination, and audits and inspections. Any of these factors or similar tax-related risks could cause our effective tax rate and tax-related payments, including any such payments related to tax liabilities of businesses we have acquired, to significantly differ from previous periods and current or future expectations which could have a material effect on our liquidity, financial position and results of operations.
Pending and future legal proceedings including environmental matters could have a material adverse effect on our liquidity, financial position and results of operations, as well as our reputation in the markets we serve.
The Company and its subsidiaries are routinely party to proceedings, cases, and requests for information from, and negotiations with, various claimants and federal and state agencies relating to various legal matters, including tax and environmental matters. See Note 10, Incomes Taxes, and Note 25, Commitments and Contingencies, to the Consolidated Financial Statements in Item 8 of this Report, which describes uncertain tax positions and audits and inspections, as well as information concerning amounts accrued associated with certain environmental remediation costs and other potential commitments or contingencies. An adverse result in one or more pending or ongoing matters or any potential future matter of a similar nature could materially and adversely affect our liquidity, financial position, and results of operations, as well as our reputation in the markets we serve.
Failure to comply with the complex global regulatory environment in which we operate could have an adverse impact on our reputation and/or a material adverse effect on our liquidity, financial position and results of operations.
We are subject to government regulation in all jurisdictions in which we conduct business. Changes in the regulatory environments in which we operate, particularly, but not limited to, the U.S., Mexico, Brazil, China, India, Thailand, Australia, the U.K. and the EU, could lead to heightened regulatory compliance costs and scrutiny, could adversely impact our ability to continue selling certain products in the U.S. or foreign markets, and/or could otherwise increase the cost of doing business. While we seek to mitigate these risks through a variety of actions, including receiving Responsible Care Certification, ongoing employee training, and employing comprehensive environmental, health and safety programs, there is no guarantee these actions will prevent all potential regulatory compliance issues. For instance, failure to comply with the EU’s Registration, Evaluation, Authorization and Restriction of Chemicals (“REACH”) regulations or other similar laws and regulations could result in our inability to sell certain products or we could incur fines, ongoing monitoring obligations or other future business consequences, which could have a material adverse effect on our liquidity, financial position and results of operations. In addition, the U.S. Toxic Substances Control Act (“TSCA”) requires chemicals to be assessed against a risk-based safety standard and then requires that unreasonable risks that are identified be eliminated. This regulation and other pending initiatives at the U.S. state level, as well as initiatives in Canada, Asia and other regions, could potentially require toxicological testing and risk assessments of a wide variety of chemicals, including chemicals used or produced by us. These assessments may result in heightened concerns about the chemicals involved and additional requirements being placed on their production, handling, labeling or use. These concerns and additional requirements could also increase the cost incurred by our customers to use our chemical products and otherwise limit their use which could lead to a decrease in demand for these products. A decrease in demand due to these issues could have an adverse impact on our liquidity, financial position, and results of operations.
Further, we are subject to the U.S. Foreign Corrupt Practices Act (the “FCPA”), the U.K. Bribery Act and other anti-bribery, anti-corruption and anti-money laundering laws in jurisdictions around the world. These and similar laws generally prohibit companies and their officers, directors, employees and third-party intermediaries, business partners and agents, from making improper payments or providing other improper items of value to government officials or other persons. While we have policies and procedures and internal controls designed to address compliance with such laws, including employee training programs, we cannot guarantee that our employees and third-party intermediaries, business partners and agents will not take, or be alleged to have taken, actions in violation of such policies and laws for which we may be ultimately held responsible. Detecting, investigating and resolving actual or alleged violations can be extensive and require a significant diversion of time, resources and attention from senior management. Any violation of these or other applicable anti-bribery, anti-corruption and anti-money laundering laws could result in whistleblower complaints, adverse media coverage, investigations, loss of export privileges, and criminal or civil sanctions, penalties and fines, any of which could adversely affect our business and financial condition.
The shipment of goods, services and technology across international borders subjects us to extensive trade laws and regulations. Our import activities are governed by the unique customs laws and regulations in each of the countries where we operate. Moreover, many countries, including the U.S., control the export and re-export of certain goods, services and technology and impose related export record-keeping and reporting obligations, which can be burdensome. Governments may also impose economic sanctions against certain countries, persons and entities that may restrict or prohibit transactions involving such countries, persons and entities, which may limit or prevent our conduct of business in certain jurisdictions.
The laws and regulations concerning import activity, export record-keeping and reporting, export control and economic sanctions are complex and constantly changing. These laws and regulations can cause delays in shipments and unscheduled operational downtime. Moreover, any failure to comply with applicable legal and regulatory trading obligations could result in criminal and civil penalties and sanctions such as fines, imprisonment, debarment from governmental contracts, seizure of shipments and loss of import and export privileges. In addition, investigations by government authorities as well as legal, social, economic and political issues in these countries could have a material adverse effect on our business, results of operations and financial condition. We are also subject to the risks that our employees, joint venture partners and agents outside of the U.S. may fail to comply with other applicable laws.
Uncertainty related to environmental regulation and industry standards relating to, as well as physical risks of, climate change and biodiversity loss, could impact our liquidity, financial position, and results of operations.
Increased public and stakeholder awareness of global climate change, biodiversity loss, and other environmental risks have contributed to, and may result in, even more extensive, international, regional and/or federal requirements or industry standards to reduce or mitigate the effects of these changes. These regulations could mandate even more restrictive regulatory or industry standards than the voluntary goals that we have established or require changes to be adopted on a more accelerated time frame. New disclosure requirements have been adopted in the EU and California and additional rule making is expected to be adopted by the SEC. There continues to be a lack of consistent legislation related to disclosure and operational matters, which creates complexity and economic and regulatory uncertainty. Though we are closely following developments in this area and changes in the regulatory landscape in the U.S. and our other markets, we cannot predict how or when those challenges may ultimately impact our business. While certain climate change initiatives may result in new business opportunities for us in the area of alternative fuel technologies and emissions control, compliance with these initiatives may also result in additional costs to us including, among other things, increased production costs, additional taxes and compliance costs, reduced emission allowances or additional restrictions on production or operations.
In addition, the potential physical impacts of climate change and biodiversity loss are highly uncertain. These may include extreme weather events and long-term changes in temperature levels and water availability as well as damaged ecosystems. The physical risks of climate change and biodiversity loss may impact our facilities, customers and suppliers, and the availability and costs of materials and natural resources, sources and supply of energy, product demand and manufacturing. In addition, climate change may increase both the frequency and severity of natural disasters that may affect our business operations.
If environmental laws or regulations or industry standards are either changed or adopted and impose significant operational restrictions and compliance requirements upon us or our products, or our operations are disrupted due to physical impacts of climate change or biodiversity loss, our business, capital expenditures, liquidity, results of operations, financial condition and competitive position could be negatively impacted.
We are subject to stringent labor and employment laws in many jurisdictions in which we operate, and our relationship with our employees could deteriorate which could adversely impact our operations.
A majority of our full-time employees are employed outside the U.S. In many jurisdictions where we operate, labor and employment laws and regulations grant significant job protection to some employees including rights on termination of employment. In addition, in some countries our employees are represented by works councils or are governed by collective bargaining agreements and we are often required to consult with and seek the consent or advice of such representatives. These laws and regulations, together with our obligations to seek consent or consult with the relevant unions or works councils, could have a significant impact on our flexibility in managing costs and responding to market changes. While the Company believes it has generally positive relations with its labor unions and employees, there is no guarantee the Company will be able to successfully negotiate new or renew labor agreements without work stoppages, labor difficulties or unfavorable terms. If we were to experience an extended interruption of operations at any of our facilities because of strikes or other work stoppages, our liquidity, results of operations and financial condition could be materially and adversely affected.
We may be unable to adequately protect our proprietary rights and trade brands, which may limit our ability to compete in our markets and could adversely affect our liquidity, financial position and results of operations.
We have a limited number of patents and patent applications, including patents issued, applied for, or acquired in the U.S. and in various foreign countries, some of which are material to our business. However, we rely principally on our proprietary formulae and the applications know-how and experience to meet customer needs. Also, our products are identified by trademarks that are registered throughout our marketing area. Despite our efforts to protect our proprietary information through patent and trademark filings, and the use of appropriate trade secret protections, it is possible that competitors or other unauthorized third parties may obtain, copy, use, disclose or replicate our formulae, products, and processes. Similarly, third parties may assert claims against us and our customers and distributors alleging our products infringe upon third-party intellectual property rights. In addition, the laws and/or judicial systems of foreign countries in which we design, manufacture, market and sell our products may afford little or no effective protection of our proprietary technology or trade brands. Also, security over our global information technology structure is subject to increasing risks associated with cyber-crime and other related cyber-security threats. These potential risks to our proprietary information, trade brands and other intellectual property could subject us to increased competition and a failure to protect, defend or enforce our intellectual property rights could negatively impact our liquidity, financial position and results of operations.
General Risk Factors
Our business could be adversely affected by environmental, health and safety laws and regulations or by potential product, service or other related liability claims.
The development, manufacture and sale of specialty chemicals and other services involve inherent exposure to potential product liability claims, service level claims, product recalls and related adverse publicity. Some customers have and may in the future require us to represent that our products conform to certain product specifications provided by them. Any failure to comply with such specifications could result in claims or legal action against us. Any of the foregoing potential product or service risks could also result in substantial and unexpected expenditures and affect customer confidence in our products and services, which could have a material adverse effect on our liquidity, financial position and results of operations.
In addition, our business is subject to hazards associated with the manufacturing, handling, use, storage, and transportation of chemical materials and products, including historical operations at our current and former facilities. These potential hazards could cause personal injury and loss of life, severe damage to, or destruction of, property or equipment and environmental contamination or other environmental damage, which could have an adverse effect on our business, financial condition and results of operations. In the jurisdictions in which we operate, we are subject to numerous U.S. and non-U.S. national, federal, state and local environmental, health and safety laws and regulations, including those governing the discharge of pollutants into the air and water, the management and disposal of hazardous substances and wastes and the cleanup of contaminated properties. We currently use, and in the past have used, hazardous substances at many of our facilities, and we have in the past been, and may in the future be, subject to claims relating to exposure to or contamination caused by hazardous materials. We also have generated, and continue to generate, hazardous wastes at a number of our facilities. Liabilities associated with the investigation and cleanup of hazardous substances, as well as personal injury, property damages or natural resource damages arising from the release of, or exposure to, such hazardous substances, may be imposed in many situations without regard to violations of laws or regulations or other fault, and may also be imposed jointly and severally (so that a responsible party may be held liable for more than its share of the losses involved, or even the entire loss). These liabilities may also be imposed on many different entities, including, for example, current and prior property owners or operators, as well as entities that arranged for the disposal of the hazardous substances. The liabilities may be material and can be difficult to identify or quantify. In addition, the occurrence of disruptions, shutdowns or other material operating problems at our facilities or those of our customers due to any of these risks could adversely affect our reputation and have a material adverse effect on our operations as a whole, including our results of operations and cash flows, both during and after the period of operational difficulties.
Further, some of the raw materials we handle are subject to government regulation that affect the manufacturing processes, handling, uses and applications of our products. In addition, our production facilities and a number of our distribution centers require numerous operating permits. Due to the nature of these requirements and changes in our operations, our operations may exceed limits under permits or we may not have the proper permits to conduct our operations.
Ongoing compliance with environmental laws, regulations and permits that impact registration/approval requirements, transportation and storage of raw materials and finished products, and storage and disposal of wastes could require us to make changes in manufacturing processes or product formulations and could have a material adverse effect on our results of operations. We may incur substantial costs, including fines, damages, criminal or civil sanctions and remediation costs, or experience interruptions in our operations, including as a result of revocation, non-renewal or modification of the Company’s operating permits and revocation of the Company’s product registrations, for violations arising under these laws or permit requirements. Any such revocation, modification or non-renewal may require the Company to cease or limit the manufacture and sale of its products at one or more of its facilities, which may limit or prevent the Company’s ability to meet product demand or build new facilities and may have a material adverse effect on liquidity, financial position, and results of operations. Additional information may arise in the future concerning the nature or extent of our liability with respect to identified sites, and additional sites may be identified for which we are alleged to be liable, which could cause us to materially increase our environmental accrual or the upper range of the costs we believe we could reasonably incur for such matters. Increased compliance costs may not affect competitors in the same way that they affect us due to differences in product formulations, manufacturing locations or other factors, and we could be at a competitive disadvantage, which might adversely affect our financial performance.
Our insurance may not fully cover all potential exposures.
We maintain product, property, business interruption, casualty, and other general liability insurance, but this may not cover all risks associated with the hazards of our business and these coverages are subject to limitations, including deductibles and coverage limits. We may incur losses beyond the limits, or outside the coverage, of our insurance policies, including liabilities for environmental remediation. In addition, from time to time, various types of insurance for companies in the specialty chemical industry have not been available on commercially acceptable terms and, in some cases, have not been available at all. We are potentially at additional risk if one or more of our insurance carriers fail. Additionally, severe disruptions in the domestic and global financial markets could adversely impact the ratings and survival of some of our insurers. Future downgrades in the ratings of insurers could adversely impact both the availability of appropriate insurance coverage and its cost. In the future, we may not be able to obtain coverage at current levels, if at all, and our premiums may increase significantly on coverage that we maintain.
Impairment evaluations of goodwill, intangible assets, investments or other long-lived assets could result in a reduction in our recorded asset values, which could have a material adverse effect on our financial position and results of operations.
We perform reviews of goodwill and indefinite-lived intangible assets on an annual basis, or more frequently if triggering events indicate a possible impairment. We test goodwill at the reporting unit level by comparing the carrying value of the net assets of the reporting unit, including goodwill, to the reporting unit's fair value. Similarly, we test indefinite-lived intangible assets by comparing the fair value of the assets to their carrying values. If the carrying values of goodwill or indefinite-lived intangible assets exceed their fair value, the goodwill or indefinite-lived intangible assets would be considered impaired. In addition, we perform a review of a definite-lived intangible assets or other long-lived assets when changes in circumstances or events indicate a possible impairment. If any impairment or related charge is warranted, as we determined to be the case in the fourth quarter of 2022 when we recognized a $93.0 million impairment charge related to our EMEA reportable segment, then our financial position and results of operations could be materially affected. See Note 15, Goodwill and Other Intangible Assets, to the Consolidated Financial Statements included in Item 8 of this Report.
If we identify a material weakness in internal control over financial reporting, or if we fail to maintain an effective system of internal controls, we may not be able to accurately determine our financial results or prevent fraud, either of which could have a material effect on us.
Effective internal controls are necessary for us to provide reliable financial reports and effectively prevent fraud. Section 404 of the Sarbanes-Oxley Act of 2002 requires us to evaluate and report on our internal control over financial reporting. We cannot be certain that we will be successful in maintaining adequate internal control over financial reporting and financial processes. We may in the future discover areas of our internal controls that need improvement. Furthermore, to the extent our business grows or significantly changes, our internal controls may become more complex, and we could require significantly more resources to ensure our internal controls remain effective. If we identify material weaknesses in the future, it could negatively impact our operations or the market value of our common stock. Additionally, the existence of any material weakness may require management to devote significant time and incur significant expense to remediate any such material weaknesses and management may not be able to remediate any such material weaknesses in a timely manner.
Disruption of critical information systems or material breaches in the security of our systems could adversely affect our business and our customer relationships and subject us to fines or other regulatory actions.
We rely on information technology systems, digital telecommunications and other computer resources to obtain, process, analyze, manage, transmit, and store electronic information in our day-to-day operations. We also rely on our technology infrastructure in all aspects of our business, including to interact with customers and suppliers, fulfill orders and bill, collect and make payments, ship products, provide support to customers, and fulfill contractual obligations. Further, we rely on our vendors and third-party service providers to maintain effective cybersecurity measures to keep our information secure. Our information technology systems are subject to potential disruptions, including significant network or power outages, usage errors by our employees, business partners, or outside service providers, cyberattacks, ransomware attacks, computer viruses, other malicious codes, and/or unauthorized access attempts, any of which, if successful, could result in data leaks or otherwise compromise our confidential or proprietary information and disrupt our operations. Security breaches could result in unauthorized disclosure of confidential information or personal data belonging to our employees, partners, customers or suppliers for which we may incur liability. Cyberattacks and other security threats could originate from a wide variety of external sources, including cyber-criminals, nation-state hackers, hacktivists and other outside parties. Cyberattacks and other security threats could also originate from the malicious or accidental acts of insiders, such as employees, and other business partners and outside service providers. Cybersecurity threats, attempted intrusions and other incidents, such as these, are becoming more sophisticated and frequent. Security breaches and cyber incidents have, from time to time, occurred and may occur in the future. Although the breaches and cyber incidents experienced to date have not had a material impact, there can be no assurance that our protective measures will prevent security breaches that could have a significant impact on our business, reputation and financial results. Additionally, the costs to combat cyber or other security threats can be significant, and our efforts to address these problems may not be successful and could result in interruptions, delays, cessation of service and loss of existing or potential customers that may impede our sales, manufacturing, distribution or other critical functions. Media or other reports of perceived vulnerabilities in our network security, regardless of their immediacy or accuracy, could adversely impact our reputation and materially affect our business and financial results. While we have implemented security measures and internal controls designed to protect against cyber and other security threats, such measures cannot provide absolute security and may not be successful in preventing future security breaches.
We are subject to the data privacy and protection laws and regulations adopted by federal, state and foreign legislatures and governmental agencies in various countries in which we operate, including the EU General Data Protection Regulation. Implementing and complying with these laws and regulations may be more costly or take longer than we anticipate or could otherwise affect our business operations.
In addition, some U.S. state governments have enacted or are considering enacting more stringent laws and regulations protecting personal information and data. For instance, California passed the California Consumer Privacy Act of 2018, (“CCPA”), which went into effect in January 2020. The CCPA gives California residents expanded rights to access and delete their personal information, opt out of certain personal information sharing, and receive detailed information about how their personal information is used. The CCPA provides for civil penalties for violations, as well as for private rights of action for certain data breaches that result in the loss of personal information. In addition, the California Consumer Rights Act (“CPRA”) was recently enacted to strengthen elements of the CCPA and became effective January 1, 2023. A number of other states have considered similar privacy proposals, with states like Virginia and Colorado enacting their own privacy laws. These privacy laws and the evolving regulatory environment related to personal data may impact our business activities, and while we carry cyber insurance, we cannot be certain that our coverage will be adequate for liabilities actually incurred, that insurance will continue to be available to us on economically reasonable terms, or at all, or that any insurer will not deny coverage as to any future claim.
Breaches, cyber incidents and disruptions, or failure to comply with laws and regulations related to information security or privacy by us, our vendors and third-party service providers could result in legal claims or proceedings against us by governmental entities or individuals, significant fines, penalties or judgements, disruption of our operations, remediation requirements, changes to our business practices, and damage to our reputation. Therefore, a failure to monitor, maintain or protect our information technology systems and data integrity effectively or to anticipate, plan for and recover from significant disruptions to these systems could have a material adverse effect on our results of operations or financial condition.
Our business depends on attracting and retaining qualified management and other key personnel.
Due to the specialized and technical nature of our business, our future performance is dependent on our ability to attract, develop and retain qualified leadership, commercial, technical, and other key personnel. Competition for such talent is intense and has further increased in light of evolving labor and employment trends, including the increase in remote, hybrid or other alternative flexible work arrangements and, in many jurisdictions, laws and regulations aimed at limiting or eliminating the enforceability of non-competition and other restrictive covenants with employees. In the current labor and employment environment, we may be unable to continue to attract or retain such personnel. In an effort to mitigate such risks, the Company utilizes retention bonuses, offers competitive total rewards and maintains continuous succession planning, including for our senior executive officers. However, there can be no assurance that these mitigating factors will be adequate to attract or retain qualified management or other key personnel. Failure to retain key employees, failure to effectively implement our succession planning efforts and successfully transition key roles, or the inability to hire, train, retain and manage qualified personnel could also adversely affect our business.
Increasing scrutiny and changing expectations from stakeholders with respect to our Environmental, Social and Governance (“ESG”) practices may impose additional costs on us or expose us to new or additional risks.
Companies across all industries are facing increasing scrutiny from stakeholders related to their ESG practices. Investor advocacy groups, institutional investors, investment funds, and other influential parties are also increasingly focused on ESG practices and in recent years have placed increasing importance on the implications and social cost of their investments. Regardless of the industry, investors’ increased focus and activism related to ESG and similar matters may impact access to capital, as investors may decide to reallocate capital or to not commit capital as a result of their assessment of a company’s ESG practices.
We face pressures from certain stakeholders to prioritize and promote sustainable practices and reduce our carbon footprint. Our stakeholders may pressure us to implement ESG procedures or standards beyond those we have in place in order to continue engaging with us, to remain invested in us, or before they will make further investments in us. Additionally, we may face reputational challenges in the event our ESG procedures or standards do not meet the standards set by certain constituencies. We have adopted certain practices as highlighted in the Company’s Sustainability Report, including with respect to environmental stewardship. The Company’s Sustainability Report is published annually and is available on the Company’s corporate website at home.quakerhoughton.com/sustainability.
Further, as we work to align with the recommendations of recognized third-party frameworks, we continue to expand our disclosures in these areas. This is consistent with our commitment to executing on a strategy that reflects the economic, social, and environmental impact we have on the world while advancing and complementing our business strategy. Our disclosures on these matters and standards we set for ourselves or a failure to meet these standards, may influence our reputation and the value of our brand. It is possible that our stakeholders might not be satisfied with our ESG efforts or the speed of their adoption. If we do not meet our stakeholders’ expectations, our business and/or our ability to access capital could be harmed. Any harm to our reputation resulting from setting these standards or our failure or perceived failure to meet such standards could adversely affect our business, financial performance, and growth.
Additionally, adverse effects upon our customers’ industries related to the worldwide social and political environment may also adversely affect demand for our services. This includes the uncertainty or instability resulting from climate change or biodiversity loss, changes in political leadership and environmental policies, changes in geopolitical-social views toward fossil fuels and renewable energy, concern about the environmental impact of climate change or biodiversity loss, and investors’ expectations regarding ESG matters. Any long-term material adverse effect on our customers or their industries could have a significant financial and operational adverse impact on our business.
Legislation requiring disclosure related to ESG matters is increasingly being adopted by governments in various jurisdictions, including the EU and California, which requirements are expected to be applicable to us or certain of our operations and which impose varying and differing requirements. These developing requirements can significantly expand climate and other sustainability related disclosure requirements, which could require substantial time and attention of management and financial resources. Additionally, we could be subjected to negative responses by governmental actors, such as anti-ESG legislation, which could have a material adverse effect on our business, liquidity, financial position, and results of operations. We are closely monitoring these developments.
Terrorist attacks, other acts of violence or war, natural disasters, widespread public health crises or other uncommon events may affect the markets in which we operate and our profitability which could adversely affect our business, liquidity, financial position, and results of operations.
Terrorist attacks, other acts of armed conflicts or war, cyber-attacks, natural disasters, widespread public health crises or an outbreak of a contagious disease, or other uncommon global events, such as the current military conflicts between Russia and Ukraine and in the Middle East, as well as responses to such events including sanctions, boycotts, protests or other restrictive actions by the United States and/or other countries or its residents, may negatively affect our operations. There can be no assurance that there will not be terrorist attacks against the U.S. or other locations where we do business. Also, natural disasters such as earthquakes, tornados, hurricanes, fires, floods, and tsunamis cannot be predicted.
Terrorist attacks, other acts of armed conflicts or war, cyber-attacks, and natural disasters, which may be amplified by ongoing global climate change and biodiversity loss, may directly impact our physical facilities and/or those of our suppliers or customers. In addition, terrorist attacks or natural disasters may disrupt the global insurance and reinsurance industries with the result that we may not be able to obtain insurance at historical terms and levels, if at all, for all of our facilities. In addition, available insurance coverage may not be sufficient to cover all of the damage incurred or, if available, may be prohibitively expensive. Widespread public health crises, including contagious diseases, could also disrupt operations of the Company, its suppliers and customers which could have a material adverse impact on our results of operations. A significant outbreak of contagious diseases in the human population similar to the COVID-19 pandemic could also result in an economic downturn that could affect demand for our products and likely impact our operating results. To the extent that the Company’s customers and suppliers are materially and adversely impacted by a widespread outbreak of contagious disease, this could reduce the availability, or result in delays, of materials or supplies to or from the Company, which in turn could materially interrupt the Company’s business operations.
The consequences of terrorist attacks, other acts of armed conflicts or war, including cyber-attacks, natural disasters, widespread public health crises or other uncommon global events can be unpredictable, and we may not be able to foresee or effectively plan for these events, resulting in a material adverse effect on our business, liquidity, financial position, and results of operations.
Item 1B. Unresolved Staff Comments.
None.
Item 1C. Cybersecurity.
The Company is subject to various cybersecurity risks that could adversely affect our business, financial condition, and results of operations, including intellectual property theft; fraud; extortion; harm to employees or customers; violation of privacy laws and other litigation and legal risk; and reputational risk. Refer to the “Risk Factors” section, which appears in Item 1A of this Report for more information regarding these risks. In response to these risks, we have implemented cybersecurity processes, technologies, and controls detailed below to aid in our efforts to assess, identify, and manage cybersecurity risks. Our Global Cyber Security team works to identify, assess and manage cybersecurity threat risks, their severity, and potential mitigations.
As of the date of this report, we are not aware of any risks from cybersecurity incidents that have materially affected or are reasonably likely to materially affect our business strategy, results of operations, or financial condition, individually or in the aggregate.
Governance
The Board, primarily through the Audit Committee, oversees management's approach to managing cybersecurity risks. Management provides cybersecurity updates to the Audit Committee, at least quarterly, and material cybersecurity incidents are reported to the Board.
Quaker Houghton has a dedicated Global Cyber Security team led by the Senior Director, Cybersecurity and Compliance that is responsible for identifying, assessing, monitoring, managing and communicating the Company’s cybersecurity risks. Collectively this team has decades of dedicated cybersecurity experience with personnel experienced and certified in various disciplines, including data security and privacy, enterprise risk management, cloud security and ethical hacking.
The Global Cyber Security team reports to the Chief Digital Information Officer (“CDIO”), who in turn reports to the Chief Executive Officer (“CEO”). Refer to the “Information about our Executive Officers” section, which appears in Item 4(a) of this report for more information about the CDIO’s relevant professional experience and qualifications.
Risk Management and Strategy
Key cybersecurity risks are incorporated into our enterprise risk management framework. Our cybersecurity risk management program leverages the National Institute of Standards and Technology (“NIST”) framework, which organizes cybersecurity risk management actions into six categories: govern, identify, protect, detect, respond, and recover. The Company’s cybersecurity risk management program and strategy includes the following:
•Cybersecurity Operations Centers - We, along with certain third-parties, operate several global cybersecurity operations centers, which provide 24/7 monitoring and incident response capabilities. In the event of an alert, our cybersecurity operations centers coordinate the investigation and remediation of such alerts.
•Partnerships with Cybersecurity Companies - We partner with specialized cybersecurity companies and organizations, leveraging third-party technology and expertise. These partnerships help monitor and maintain the performance and effectiveness of our cybersecurity tools and program.
•Annual and Periodic Assessments by Third Parties - Our cyber risk management program undergoes periodic assessments by third parties including annual penetration and disaster recovery tests.
•Policies and Training - We maintain company-wide policies and procedures concerning cybersecurity, which are reviewed and approved by appropriate management members. All employees are required to complete cybersecurity training periodically, with additional specialized trainings for certain roles. We conduct monthly phishing simulation exercises with mandatory training on failure.
•Incident Response - In case of a cybersecurity incident, we follow a documented incident response process, which outlines steps from detection to mitigation, recovery, and notification, including notifying senior leadership and the Board as appropriate based on severity.
•Third-Party Service Providers - In addition to assessing our own cybersecurity preparedness, we also consider and evaluate cybersecurity risks associated with use of third-party service providers. We assess third party cybersecurity controls through a cybersecurity questionnaire and include security and privacy addendums to our contracts where applicable.
Item 2. Properties.
Quaker Houghton’s corporate headquarters and a laboratory facility are located in Conshohocken, Pennsylvania. The laboratory facility is within the Americas’ segment. The Company’s other principal facilities in its Americas’ segment are located in Santa Fe Springs, California; Carrollton, Georgia; Aurora, Illinois; Zion, Illinois; Detroit, Michigan; Madison Heights, Michigan; Batavia, New York; Cleveland, Ohio; Dayton, Ohio; Middletown, Ohio; Strongsville, Ohio; Lewisburg, Tennessee; Waterloo, Ontario; Monterrey, N.L., Mexico; Rio de Janeiro, Brazil and Sao Paulo, Brazil. The Company’s EMEA segment has principal facilities in Uithoorn, the Netherlands; Dortmund, Germany; Monheim am Rhein, Germany; Barbera, Spain; Bera, Spain; Santa Perpetua de Mogoda, Spain; Karlshamn, Sweden; Moncalieri, Italy; Coventry, U.K; Broms Grove, U.K, and Saint-Donat, France. The Company’s Asia/Pacific segment operates out of its principal facilities located in Chongqing, China; Qingpu, China; Shanghai, China; Songjiang, China; Dahej, India; Rayong, Thailand; Moorabbin, Australia; Perth, Australia, and Gamagori, Japan.
With the exception of the Conshohocken, Santa Fe Springs, Madison Heights, Lewisburg, Monheim am Rhein, Aurora, Karlshamn, Songjiang, Rayong, and Coventry sites, which are leased, the remaining principal facilities are owned by the Company and, as of December 31, 2024, were mortgage free. Quaker Houghton also leases sales, laboratory, manufacturing, and warehouse facilities in other locations.
Quaker Houghton’s principal facilities consist of various manufacturing, administrative, warehouse, and laboratory buildings. Most locations have raw material storage tanks, ranging from 1 to 155 at each location with capacities ranging from 300 to 70,000 gallons, and processing or manufacturing vessels ranging from 1 to 54 at each location with capacities ranging from 2 to 29,000 gallons.
Each of Quaker Houghton’s non-U.S. associated companies (in which it owns a 50% or less interest and has significant influence) owns or leases a plant and/or sales facilities in various locations, with the exception of Primex, Ltd.
Item 3. Legal Proceedings.
The Company is a party to proceedings, cases, and requests for information from, and negotiations with, various claimants and Federal and state agencies relating to various matters, including environmental matters. For information concerning pending certain environmental non-capital remediation costs and other legal-related matters, refer to Note 25, Commitments and Contingencies, to the Consolidated Financial Statements. The Company is a party to other litigation which management currently believes will not have a material adverse effect on the Company’s results of operations, cash flow or financial condition.
Item 4. Mine Safety Disclosures.
Not applicable.
Item 4(a). Information about our Executive Officers.
Our executive officers as of February 24, 2025 are listed below with their respective ages, positions currently held at the Company, and principal occupation and business experience during at least the last five years. Each of the executive officers, with the exception of Jeffrey Kutz, is appointed annually to a one-year term. Mr. Kutz is considered an executive officer in his capacity as principal accounting officer for purposes of this Item 4(a).
| | | | | | | | |
Name, Age, and Present
Position with the Company | | Business Experience During the Past Five
Years and Period Served as an Officer |
| | |
Joseph A. Berquist, 53 Chief Executive Officer and President | | Mr. Berquist was named Chief Executive Officer and President of Quaker Houghton and appointed to the Board as a director on November 18, 2024. Mr. Berquist, who has been employed by the Company since 1997, served as Executive Vice President, Chief Commercial Officer from January 2023 to November 2024. Prior to that role, he served as Executive Vice President, Chief Strategy Officer, and Managing Director, Global Specialty Businesses from September 2021 until December 2022. Additionally, he served as Interim Managing Director of EMEA from August 2022 through December 2022. Before that, he served as Senior Vice President, Global Specialty Businesses and Chief Strategy Officer from August 2019 to September 2021. Mr. Berquist served as Vice President and Managing Director – North America from April 2010 until July 2019. |
| | |
| | |
| | |
Jeewat Bijlani, 48 Executive Vice President, Chief Strategy Officer | | Mr. Bijlani, who has been employed by the Company since August 2019, has served as Executive Vice President, Chief Strategy Officer since April 2023. Prior to that role, he served as Senior Vice President, Managing Director - Americas from August 2019 until March 2023. Prior to joining the Company, Mr. Bijlani served as President, Americas and Global Strategic Businesses of Houghton from March 2015 until July 2019. |
| | |
Thomas Coler, 51 Executive Vice President, Chief Financial Officer | | Mr. Coler has served as Executive Vice President and Chief Financial Officer since he joined the Company on June 10, 2024. Prior to joining the Company, Mr. Coler served as Executive Vice President and Chief Financial Officer at Savage Companies from October 2022 until May 2024. Preceding his role at Savage, he served as Vice President, Finance and Chief Financial Officer for the Health, Hygiene & Consumables business unit at H.B. Fuller Corporation from September 2019 to October 2022. Before that, he served as Vice President, Corporate Finance at H.B. Fuller Corporation from February 2017 to August 2019. Mr. Coler’s previous experience also includes various finance leadership positions at Polaris Industries, Ecolab and Boston Scientific. |
| | |
Jeffrey L. Fleck, 54 Senior Vice President, Chief Global Supply Chain Officer | | Mr. Fleck has served as Senior Vice President, Chief Global Supply Chain Officer since he joined the Company in February 2023. Prior to joining the Company, Mr. Fleck served as Senior Vice President, Chief Supply Chain Officer at Georgia-Pacific Consumer Products Company. Before that, he served as Senior Vice President, Chief Supply Chain and R&D Officer at Zep, Inc. from 2010 to 2015. Mr. Fleck’s previous experience also includes various supply chain management leadership positions at The Clorox Company, American Home Products and Cargill Incorporated. |
| | |
Jeffrey J. Kutz, 65 Vice President, Chief Accounting Officer | | Mr. Kutz has served as the Vice President, Chief Accounting Officer since he joined the Company in January 2024. Prior to joining the Company, Mr. Kutz served as Vice President, Corporate Controller & Principal Accounting Officer and Director, Technical Accounting & Reporting and Executive Director, Accounting Policy & Reporting at Air Products and Chemicals Inc. from 2012 until December 2023. He also held leadership roles at Exelon Corporation from 2008 to 2012 and Chatham Financial from 2001 to 2008. |
| | |
Kristin M. Rokosky, 54 Senior Vice President, Chief Human Resources Officer | | Ms. Rokosky, who has been employed by the Company since January 2023, has served as Senior Vice President, Chief Human Resources Officer since January 2025. She previously served as Vice President, HR Business Partner from September 2024 through December 2024 and Sr. Director, HR Business Partner from January 2023 through September 2024. Prior to joining the Company, Ms. Rokosky served as a Global Human Resources Director at FMC from February 2017 to January 2023. |
| | |
| | | | | | | | |
Name, Age, and Present
Position with the Company | | Business Experience During the Past Five
Years and Period Served as an Officer |
Anna Ransley, 47 Senior Vice President, Chief Digital Information Officer | | Ms. Ransley has served as Senior Vice President, Chief Digital Information Officer since she joined the Company in July 2023. Prior to joining the Company, Ms. Ransley served as Global Chief Information Officer at Godiva Chocolatier from September 2021 through March 2023. Prior to joining Godiva, she served as Vice President, Digital and Technology and US Chief Information Officer at Heineken from January 2017 through September 2021. Previously, Ms. Ransley held various IT leadership positions at companies such as Boehringer Ingelheim, Connolly, Inc. and Hyperion/Oracle. |
| | |
Dr. David Slinkman, 60 Senior Vice President, Chief Technology Officer | | Dr. Slinkman has served as Senior Vice President, Chief Technology Officer since he joined the Company in August 2019. Prior to joining the Company, Dr. Slinkman served as Vice President of Technology of Houghton from March 2012 until July 2019. |
| | |
Robert T. Traub, 60 Senior Vice President, General Counsel and Corporate Secretary | | Mr. Traub, who has been employed by the Company since 2000, has served as Senior Vice President, General Counsel and Corporate Secretary since August 2019. He previously served as Vice President, General Counsel and Corporate Secretary from April 2015 until July 2019. |
| | |
PART II
Item 5. Market for Registrant’s Common Equity, Related Stockholder Matters and Issuer Purchases of Equity Securities.
The Company’s common stock is listed on the New York Stock Exchange (“NYSE”) under the trading symbol KWR. The Board declared cash dividends that totaled $1.88 per share of outstanding common stock or $33.6 million during the year ended December 31, 2024 and $1.78 per share of outstanding common stock or $32.0 million during the year ended December 31, 2023. In February and May 2024, our Board declared quarterly cash dividends of $0.455 per share of outstanding common stock, payable to shareholders of record in April 2024 and July 2024, respectively. Subsequently, our Board declared quarterly dividends of $0.485 per share of outstanding common stock in July and November 2024, payable to shareholders of record in October 2024 and January 2025, respectively. We currently expect to continue paying comparable cash dividends on a quarterly basis in the future. Future declaration of dividends and the establishment of future record dates and payment dates are subject to the final determination of our Board, and will be based on our future financial condition, results of operations, capital requirements, capital expenditure requirements, contractual restrictions, anticipated cash needs, business prospects, provisions of applicable law and other factors our Board may deem relevant.
There are currently no restrictions on the Company’s ability to pay dividends. However, in the event that our net leverage ratio were to rise above 2.5x, certain restrictions would apply. Refer to the description of the Company’s primary Credit Facility in Note 19, Debt, to the Consolidated Financial Statements in Item 8 of this Report for more information about the covenants.
As of January 17, 2025, 17,673,437 shares of Quaker common stock were issued and outstanding and were held by 549 shareholders of record. Each share of common stock is entitled to one vote per share.
Reference is made to the information in Item 12 of this Report under the caption “Equity Compensation Plans,” which is incorporated herein by this reference.
The following table sets forth information concerning shares of the Company’s common stock acquired by the Company during the fourth quarter of 2024 for the period covered by this report:
| | | | | | | | | | | | | | | | | | | | | | | | | | |
| | Issuer Purchases of Equity Securities | | | | |
| Period | | (a)
Total Number
of Shares
Purchased (1)(2) | | (b)
Average
Price Paid
Per Share (1) (2) | | (c)
Total Number of
Shares Purchased
as part of Publicly
Announced Plans
or Programs (2) | | (d)
Approximate Dollar
Value of Shares that
May Yet be
Purchased Under the
Plans or Programs (2) |
| October 1 - October 31, 2024 | | 72,200 | | $ | 157.45 | | | 72,033 | | $ | 115,756,544 | |
| November 1 - November 30, 2024 | | 3,353 | | $ | 167.15 | | | — | | $ | 115,756,544 | |
| December 1 - December 31, 2024 | | 103,068 | | $ | 145.80 | | | 102,876 | | $ | 100,758,700 | |
| Total | | 178,621 | | $ | 150.91 | | | 174,909 | | $ | 100,758,700 | |
(1)3,712 of these shares were acquired from employees related to the surrender of shares in payment of the vesting of restricted stock awards or units. The price paid for shares acquired from employees pursuant to employee benefit and equity compensation plans is based on the closing price of the Company’s common stock on the date of vesting as specified by the plan pursuant to which the applicable option, restricted stock award, or restricted stock unit was granted.
(2)On February 28, 2024, the Board of Directors of the Company approved, and the Company announced, a share repurchase program, pursuant to which the Company is authorized to repurchase up to $150 million of Quaker Chemical Corporation common stock (“2024 Share Repurchase Program”), which replaced a prior authorization and has no expiration date. The number of shares to be repurchased and the timing of such transactions will depend on a variety of factors, including market conditions. See Note 8, Equity, to the Consolidated Financial Statements for more information.
Stock Performance Graph
The following graph compares the cumulative total return (assuming reinvestment of dividends) from December 31, 2019 to December 31, 2024 for (i) Quaker’s common stock, (ii) the S&P MidCap 400 Index (the “MidCap Index”), (iii) the S&P 400 Materials Group Index (the “Materials Group Index”) and (iv) S&P Composite 1500 Chemicals Index (the “Chemicals Index”), the new published industry index we have selected to use. The graph assumes the investment of $100 on December 31, 2019 in each of Quaker’s common stock, the stocks comprising the MidCap Index, Materials Group Index and the Chemicals Index, respectively. We included the Chemicals Index this year because the Chemicals Index was also the peer group used to assess the 2024 performance stock unit’s total shareholder return relative to the performance of our peer group.
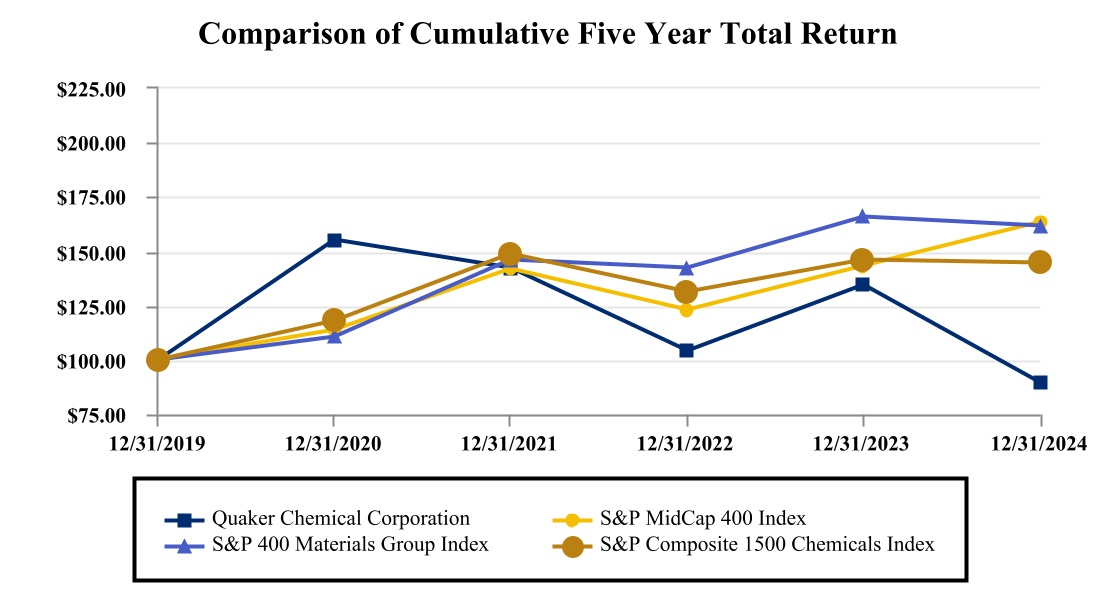
| | | | | | | | | | | | | | | | | | | | | | | | | | | | | | | | | | | | | | |
| Company / Index | | 12/31/2019 | | 12/31/2020 | | 12/31/2021 | | 12/31/2022 | | 12/31/2023 | | 12/31/2024 |
| Quaker Chemical Corp. | | $ | 100.00 | | | $ | 155.43 | | | $ | 142.48 | | | $ | 104.16 | | | $ | 134.50 | | | $ | 89.60 | |
| S&P MidCap 400 Index | | 100.00 | | | 113.66 | | | 141.80 | | | 123.28 | | | 143.54 | | | 163.54 | |
| S&P 400 Materials Group Index | | 100.00 | | | 110.65 | | | 146.30 | | | 142.31 | | | 165.83 | | | 161.74 | |
| S&P Composite 1500 Chemicals Index | | 100.00 | | | 118.22 | | | 148.89 | | | 131.59 | | | 146.19 | | | 144.62 | |
Item 6. Reserved.
Item 7. Management’s Discussion and Analysis of Financial Condition and Results of Operations.
As used in this Annual Report on Form 10-K (the “Report”), the terms “Quaker Houghton,” the “Company,” “we,” and “our” refer to Quaker Chemical Corporation (doing business as Quaker Houghton), its subsidiaries, and associated companies, unless the context otherwise requires.
Executive Summary
Quaker Houghton is the global leader in industrial process fluids. With a presence around the world, including operations in over 25 countries, our customers include thousands of the world’s most advanced and specialized steel, aluminum, automotive, aerospace, offshore, container, mining, and metalworking companies. Our high-performing, innovative and sustainable solutions are backed by best-in-class technology, deep process knowledge, and customized services. Quaker Houghton is headquartered in Conshohocken, Pennsylvania, located near Philadelphia in the U.S.
Net sales of $1,839.7 million in 2024 decreased 6% compared to $1,953.3 million in 2023, primarily due to a decrease in selling price and product mix of approximately 4%, a decrease in sales volumes of approximately 2%, and an unfavorable impact from foreign currency translation of approximately 1%, partially offset by an increase in sales from acquisitions of approximately 1%. The decrease in selling price and product mix was attributable to the impact of our index-based customer contracts and the mix of products and services. The decline in sales volumes was primarily a result of the continuation of soft end market conditions compared to the prior year in the Americas and Europe, Middle East and Africa (“EMEA”) segments, partially offset by an increase in sales volumes in the Asia/Pacific segment, continued business wins across all segments and a contribution from acquisitions in the EMEA and Asia/Pacific segments.
The Company generated net income of $116.6 million or $6.51 per diluted share in 2024, compared to a net income of $112.7 million or $6.26 per diluted share in 2023. The increase in current year earnings was primarily driven by lower interest expense and lower foreign exchange losses, partially offset by lower operating income. Excluding non-recurring and non-core items, the Company’s current year non-GAAP net income and non-GAAP earnings per diluted share were $133.5 million and $7.44, respectively, compared to $137.6 million and $7.65, respectively, in 2023. The decrease in current year non-GAAP earnings was primarily driven by a decrease in net sales, partially offset by an improvement in gross margins, lower interest expense, and an increase in other income (expense), net. The Company generated adjusted EBITDA of $310.9 million compared to $320.4 million in 2023, a decrease of 3%. The decrease in adjusted EBITDA was primarily a result of a decrease in net sales, partially offset by an increase in other income (expense), net. See the Non-GAAP Measures section of this Item below.
The Company’s 2024 operating performance in the Americas and EMEA reportable segments reflect similar drivers to that of the Company’s consolidated performance. Operating earnings for the Americas and EMEA segments decreased compared to the prior year, primarily driven by a decrease in net sales, partially offset by an increase in segment operating margins. Asia/Pacific segment operating earnings increased compared to the prior year, primarily driven by an increase in net sales, partially offset by a decrease in segment operating margins. Additional details of each segment’s operating performance are further discussed in the Company’s reportable segments review, in the Operations section of this Item 7, below.
Net cash flows provided by operating activities were $204.6 million in 2024 compared to $279.0 million in 2023. The decrease in net operating cash flows was primarily driven by a reduction in cash inflow from working capital in the current year. The key drivers of the Company’s operating cash flow and overall liquidity are further discussed in the Company’s Liquidity and Capital Resources section of this Item 7, below.
Overall, the Company’s results in 2024 reflect the Company’s continued execution on its financial and operational priorities despite a continuation of soft end market conditions that have impacted the Company’s customers. Looking ahead to 2025, we believe Quaker Houghton is well positioned to continue to deliver above market growth rates through new business wins, by delivering value-added solutions and services to its customers. The Company expects to continue to advance its enterprise growth strategy, including investing in its long-term growth initiatives, further strengthening its focus on customer intimacy, progressing with its sustainability program and positioning the Company to deliver earnings growth in 2025 and beyond.
Critical Accounting Policies and Estimates
Quaker Houghton’s discussion and analysis of its financial condition and results of operations are based on its consolidated financial statements which have been prepared in accordance with accounting principles generally accepted in the United States (“U.S. GAAP”). The preparation of these financial statements requires the Company to make estimates and judgments that affect the reported amounts of assets, liabilities, revenues and expenses, and related disclosure of contingent assets and liabilities. On an ongoing basis, the Company evaluates its estimates, including those related to customer sales incentives, product returns, credit losses, inventories, property, plant and equipment (“PP&E”), investments, goodwill, intangible assets, income taxes, business combinations, and restructuring. These estimates reflect historical experience as well as our best judgment about current and/or future economic and market conditions and their effects and various other assumptions that are believed to be reasonable based on currently available information, the results of which form the basis for making judgments about the carrying values of assets and liabilities that are not readily apparent from other sources. However, actual results may differ materially from these estimates under different assumptions or conditions.
Quaker Houghton believes the following critical accounting policies describe the more significant judgments and estimates used in the preparation of its consolidated financial statements:
Accounts receivable and inventory exposures: The Company establishes allowances for credit losses for estimated losses resulting from the inability of its customers to make required payments. If the financial condition of the Company’s customers was to deteriorate, resulting in an impairment of their ability to make payments, additional allowances may be required. As part of our terms of trade, we may custom manufacture products for certain large customers and/or may ship products on a consignment basis. Further, a significant portion of our revenue is derived from sales to customers in industries where companies have previously experienced financial difficulties. If a significant customer bankruptcy occurs, then we must judge the amount of proceeds, if any, that may ultimately be received through the bankruptcy or liquidation process. These matters may increase the Company’s exposure should a bankruptcy occur and may require a write down or a disposal of certain inventory as well as the failure to collect receivables. Reserves for customers filing for bankruptcy protection are established based on a percentage of the amount of receivables outstanding at the bankruptcy filing date. However, initially establishing this reserve and the amount thereof is dependent on the Company’s evaluation of likely proceeds to be received from the bankruptcy process, which could result in the Company recognizing minimal or no reserve at the date of bankruptcy. We generally reserve for large and/or financially distressed customers on a specific review basis, while a general reserve is maintained for other customers based on historical experience. The Company’s consolidated allowance for credit losses was $13.6 million and $13.3 million as of December 31, 2024 and 2023, respectively. The Company recorded expense to increase its provision for credit losses by $2.1 million, $1.3 million and $4.3 million for the years ended December 31, 2024, 2023 and 2022, respectively.
Tax exposures, uncertain tax positions and valuation allowances: The Company records expenses and liabilities for taxes based on estimates of amounts that will be determined as deductible or taxable in tax returns filed in various jurisdictions. The filed tax returns are subject to audit, which often occur several years subsequent to the date of the financial statements. Disputes or disagreements may arise during audits over the timing or validity of certain items, such as taxable income or deductions, which may not be resolved for extended periods of time. The Company also evaluates uncertain tax positions on all income tax positions taken on previously filed tax returns or expected to be taken on a future tax return in accordance with FIN 48, which prescribes the recognition threshold and measurement attributes for financial statement recognition and measurement of tax positions taken or expected to be taken on a tax return and, also, whether the benefits of tax positions are probable or if they are more likely than not to be sustained upon audit based upon the technical merits of the tax position. For tax positions that are determined to be more likely than not to be sustained upon audit, the Company recognizes the largest amount of benefit that is greater than 50% likely of being realized upon ultimate settlement in the financial statements. For tax positions that are not determined to be more likely than not sustained upon audit, the Company does not recognize any portion of the benefit in its financial statements. In addition, the Company’s continuing practice is to recognize interest and/or penalties related to income tax matters in income tax expense. Also, the Company nets its liability for unrecognized tax benefits against deferred tax assets related to net operating losses or other tax credit carryforward on the basis that the uncertain tax position is settled for the presumed amount at the balance sheet date.
The Company also records valuation allowances when necessary to reduce its deferred tax assets to the amount that is more likely than not to be realized. While the Company has considered future taxable income and assesses the need for a valuation allowance, in the event Quaker Houghton were to determine that it would be able to realize its deferred tax assets in the future in excess of its net recorded amount, an adjustment to the deferred tax asset would increase income in the period such determination was made. Likewise, should the Company determine that it would not be able to realize all or part of its net deferred tax assets in the future, an adjustment to the deferred tax asset would be charged to income in the period such determination was made. Both determinations could have a material impact on the Company’s financial statements.
Pursuant to the Tax Cuts and Jobs Act (“U.S. Tax Reform”), the Company recorded a $15.5 million transition tax liability for U.S. income taxes on the undistributed earnings of non-U.S. subsidiaries. As of December 31, 2024, $11.6 million in installments have been paid with the remaining $3.9 million to be paid in 2025. However, the Company may also be subject to other taxes, such as withholding taxes and dividend distribution taxes, if certain undistributed earnings are ultimately remitted to the U.S. As of December 31, 2024, the Company has a deferred tax liability of $8.4 million, which primarily represents the estimate of the non-U.S. taxes the Company will incur to remit certain previously taxed earnings to the U.S. It is the Company’s current intention to reinvest its future undistributed earnings of non-U.S. subsidiaries to support working capital needs and certain other growth initiatives outside of the U.S. The amount of such undistributed earnings at December 31, 2024 was approximately $359.8 million. Any tax liability which might result from ultimate remittance of these earnings is expected to be substantially offset by foreign tax credits (subject to certain limitations), however, certain withholding taxes could apply. It is currently impractical to estimate any such incremental tax expense. See Note 10, Income Taxes, to the Consolidated Financial Statements for more information.
Goodwill and other intangible assets: The Company accounts for business combinations under the acquisition method of accounting. This method requires the recording of acquired assets, including separately identifiable intangible assets, at their acquisition date fair values. Any excess of the purchase price over the estimated fair value of the identifiable net assets acquired is recorded as goodwill. The determination of the estimated fair value of assets acquired requires management’s judgment and often involves the use of significant estimates and assumptions, including assumptions with respect to projected revenue growth rates, gross margins, and operating margins, the weighted average cost of capital (“WACC”), royalty rates, asset lives and market multiples, among other items. When necessary, the Company consults with external advisors to help determine fair value. For non-observable market values, the Company may determine fair value using acceptable valuation principles, including the excess earnings, relief from royalty, lost profit or cost methods.
The Company amortizes definite-lived intangible assets on a straight-line basis over their useful lives. Goodwill and intangible assets that have indefinite lives are not amortized and are required to be assessed at least annually for impairment. The Company completes its annual goodwill and indefinite-lived intangible asset impairment test during the fourth quarter of each year, or more frequently if triggering events indicate a possible impairment. The Company’s consolidated goodwill at December 31, 2024 and 2023 was $518.9 million and $512.5 million, respectively. As of December 31, 2024 and 2023, the Company had indefinite-lived intangible assets for trademarks and intangibles totaling $185.3 million and $193.2 million, respectively.
During the fourth quarter of 2022, the Company recorded a non-cash impairment charge of $93.0 million to write down the carrying value of the EMEA reporting unit goodwill to its estimated fair values. In connection with the Company’s reorganization and the associated change in reportable segments and reporting units during the first quarter of 2023, the Company performed the required impairment assessments directly before and immediately after the change in reporting units and concluded that it was not more likely than not that the fair values of any of the Company’s previous or new reporting units were less than their respective carrying amounts. Additionally, the Company completed its annual impairment assessment as of October 1, 2023 and October 1, 2024 and concluded in each case that no impairment existed.
In completing the annual impairment assessment, the Company used a WACC assumption of approximately 10.5% and holding all other assumptions constant, the WACC would have to increase by approximately 2.6 percentage points before the Company’s EMEA reporting unit’s remaining goodwill would be impaired. In addition, holding EBITDA margins and all other assumptions constant, the Company’s compound annual revenue growth rate during the entire projection period would need to decline by approximately 1.9 percentage points before the Company’s EMEA reporting unit’s remaining goodwill would be impaired. Similarly, holding revenue growth rates and all other assumptions constant, the Company’s average EBITDA margins throughout the discreet projection period would need to decline by approximately 9.8 percentage points before the Company’s EMEA reporting unit’s remaining goodwill would be impaired.
The Company continually evaluates financial performance, economic conditions and other recent developments in assessing if a triggering event indicates that the carrying value of goodwill, indefinite-lived, or long-lived assets might be impaired. Notwithstanding the results of the Company’s impairment assessments during 2023 and 2024, if the Company is unable to maintain the actions aimed at improving the financial performance of the EMEA reporting unit, or interest rates rise, which leads to an increase in the cost of capital, then these conditions could result in a triggering event for the EMEA reporting unit. This assessment could result in an impairment of the EMEA reporting unit’s remaining goodwill, indefinite-lived intangible assets, or long-lived assets. See Note 15, Goodwill and Other Intangible Assets, to the Consolidated Financial Statements for more information.
Pension and Postretirement benefits: The Company provides certain defined benefit pension and other postretirement benefits to current employees, former employees and retirees. Independent actuaries, in accordance with U.S. GAAP, perform the required valuations to determine benefit expense and, if necessary, non-cash charges to equity for additional minimum pension liabilities. Critical assumptions used in the actuarial valuation include the weighted average discount rate, which is based on applicable yield curve data, including the use of a split discount rate (spot-rate approach) for the U.S. plans and certain foreign plans, rates of increase in compensation levels, and expected long-term rates of return on assets.
Recently Issued Accounting Standards
See Note 3, Recently Issued Accounting Standards, to the Consolidated Financial Statements for more information for a discussion regarding recently adopted accounting standards and recently issued accounting standards not yet adopted.
Liquidity and Capital Resources
The Company had cash and cash equivalents of $188.9 million and $194.5 million at December 31, 2024 and 2023, respectively. Cash held by subsidiaries in foreign countries was approximately $180.6 million and $177.1 million at December 31, 2024 and 2023, respectively. The $5.6 million decrease in cash and cash equivalents was the net result of $204.6 million of cash provided by operating activities, largely offset by $122.7 million of cash used in financing activities, $76.4 million of cash used in investing activities, and an unfavorable impact of foreign currency translation of approximately $11.1 million.
Net cash flows provided by operating activities were $204.6 million in 2024 compared to $279.0 million in 2023. The decrease in net operating cash flow year-over-year reflects a decrease in cash inflow from working capital, notably due to an approximately $53.0 million decrease in cash flow associated with inventory, as inventory purchases returned to normalized levels after inventory reductions in 2023 due to customer destocking.
Net cash flows used in investing activities were $76.4 million in 2024 compared to $27.6 million in 2023. The increase in cash used in investing activities year-over-year is primarily the result of $39.3 million of payments in the current year related to the acquisitions of the Sutai Group (“Sutai”) and I.K.V. Tribologie IKVT and its subsidiaries (“IKV”), a $3.0 million increase in capital expenditures, and a reduction of proceeds from asset dispositions of $6.5 million. See Note 2, Business Combinations, to the Consolidated Financial Statements for further information about business acquisitions.
Net cash flows used in financing activities were $122.7 million in 2024 compared to $238.6 million in 2023. The decrease in net cash outflows was primarily related to $17.9 million of net borrowings on the Company’s revolving credit facility in the current year compared to $164.8 million of net repayments in the prior year. This was offset by payments of approximately $49.2 million for repurchases of the Company’s common stock under its share repurchase program in the current year and payments of $57.2 million to reduce long-term debt in the current year, an $18.3 million increase compared to the prior year. In addition, the Company paid $33.2 million of cash dividends to shareholders during 2024, a $1.5 million increase compared to the prior year.
During June 2022, the Company, and its wholly owned subsidiary, Quaker Houghton B.V., as borrowers, Bank of America, N.A., as administrative agent, U.S. Dollar swing line lender and letter of credit issuer, Bank of America Europe Designated Active Company, as Euro Swing Line Lender, certain guarantors and other lenders entered into an amendment to its primary credit facility (the “ Original Credit Facility”). The amended credit facility (“Credit Facility”) established (A) a new $150.0 million Euro equivalent senior secured term loan (the “Euro Term Loan”), (B) a new $600.0 million senior secured term loan (the “U.S. Term Loan”), and (C) a new $500.0 million senior secured revolving credit facility (the “Revolver”), each maturing in June 2027. The Company has the right to increase the amount of the Credit Facility by an aggregate amount not to exceed the greater of $300.0 million or 100% of Consolidated EBITDA, subject to certain conditions including the agreement to provide financing by any lender providing such increase. In addition, the Credit Facility also:
(i) eliminated the requirement that material foreign subsidiaries must guaranty the Original Euro Term Loan;
(ii) replaced the U.S. Dollar borrowings reference rate from LIBOR to SOFR;
(iii) extended the maturity date of the Original Credit Facility from August 2024 to June 2027; and
(iv) effected other less significant changes to the Original Credit Facility.
As of December 31, 2024, the Company had Credit Facility borrowings outstanding of $696.5 million. The Company’s other debt obligations are primarily industrial development bonds, bank lines of credit and municipality-related loans, which totaled $11.8 million as of December 31, 2024. Total unused capacity under these arrangements as of December 31, 2024 was approximately $32.9 million. The Company’s total net debt as of December 31, 2024 was $519.4 million, which consists of total borrowings of $708.3 million less cash and cash equivalents of $188.9 million. The Credit Facility contains affirmative and negative covenants, financial covenants and events of default. Financial covenants contained in the Credit Facility include a consolidated interest coverage ratio test and a consolidated net leverage ratio test. As of December 31, 2024, the Company was in compliance with all of the Credit Facility covenants. Refer to the description of the Company’s primary Credit Facility in Note 19, Debt, to the Consolidated Financial Statements for more information about the covenants and events of default.
The weighted average variable interest rate incurred on the outstanding borrowings under the Credit Facility during the twelve months ended December 31, 2024 was approximately 6.1%. As of December 31, 2024, the interest rate on the outstanding borrowings under the Credit Facility was approximately 5.2%. As part of the Credit Facility, the Company is required to pay an annual commitment fee ranging from 0.150% to 0.275% related to unutilized commitments under the Revolver, depending on the Company’s consolidated net leverage ratio. The Company had unused capacity under the Revolver of approximately $448.7 million, which is net of bank letters of credit of approximately $2.4 million, as of December 31, 2024.
In order to manage the Company’s exposure to variable interest rate risk associated with the Credit Facility, in the first quarter of 2023, the Company entered into $300.0 million notional amounts of three-year interest rate swaps to convert a portion of the Company’s variable rate borrowings into an average fixed rate obligation of 3.64% plus an applicable margin as provided in the Credit Facility based on the Company’s consolidated net leverage ratio. As of December 31, 2024, the aggregate interest rate on the swaps, including the fixed base rate plus the applicable margin, was 4.9%. See Note 24, Hedging Activities, to the Consolidated Financial Statements for more information.
In connection with executing the Credit Facility, the Company recorded a loss on extinguishment of debt of approximately $6.8 million in Other income (expense), net on the Consolidated Statement of Operations during the year ended December 31, 2022. The loss on extinguishment of debt included the write-off of certain previously unamortized deferred financing costs as well as a portion of the third-party and creditor debt issuance costs incurred to execute the Credit Facility. The Company capitalized third-party and credit debt issuance costs attributed to the Euro Term Loan, U.S. Term Loan and Revolver in connection to the amended Credit Facility during the second quarter of 2022. Capitalized costs attributed to the Euro Term Loan and U.S. Term Loan are recorded as a direct offset to Long-term debt on the Consolidated Balance Sheets. Capitalized costs attributed to the Revolver are recorded within Other assets on the Consolidated Balance Sheets. These capitalized costs will collectively be amortized into Interest expense over the five year term of the Credit Facility. As of December 31, 2024 and 2023, the Company had $1.1 million and $1.5 million, respectively, of debt issuance costs recorded as a reduction of Long-term debt and $2.4 million and $3.3 million, respectively, of debt issuance costs recorded within Other assets.
The Company uses foreign exchange forward contracts to economically hedge the impact of the variability in exchange rates on certain assets and/or liabilities denominated in certain foreign currencies. During the year ended December 31, 2024, the Company entered into and settled forward contracts resulting in other expense of $2.0 million compared to other income of $2.1 million in the prior year. See Note 24, Hedging Activities, to the Consolidated Financial Statements for more information.
During 2022, the Company’s management initiated a global cost and optimization program to improve its cost structure and drive a more profitable and productive organization. The Company has achieved its initial full run-rate cost savings goal from the global cost and optimization program of approximately $20 million. In the first quarter of 2025, the Company approved additional actions under the program, which are expected to generate additional run-rate cost savings of at least $20 million. The program is expected to be substantially complete in the first half of 2025. The Company recognized $6.5 million, $7.6 million and $3.2 million of restructuring and related charges for the years ended December 31, 2024, 2023 and 2022, respectively, as a result of these programs and other facility closure actions. The Company made cash payments related to the settlement of restructuring liabilities under the program of $7.6 million and $9.8 million during the years ended December 31, 2024 and 2023, respectively. The Company expects total one-time cash costs of this program to be approximately 1 to 1.5 times annualized savings. See Note 7, Restructuring and Related Activities, to the Consolidated Financial Statements for more information.
As of December 31, 2024, the Company’s gross liability for uncertain tax positions, including interest and penalties, was $17.3 million. The Company cannot determine a reliable estimate of the timing of cash flows by period related to its uncertain tax position liability. However, should the entire liability be paid, the amount of the payment may be reduced by up to $5.6 million as a result of offsetting benefits in other tax jurisdictions. See Note 10, Income Taxes, to the Consolidated Financial Statements for more information.
On February 28, 2024, the Board approved a new share repurchase program (“2024 Share Repurchase Program”), authorizing the Company to repurchase up to an aggregate of $150 million of the Company’s outstanding common stock and replacing the prior share repurchase program, under which no repurchases were made in 2024. The 2024 Share Repurchase Program was effective immediately upon approval and has no expiration date. The Company made certain repurchases under the 2024 Repurchase Program during the year ended December 31, 2024, as mentioned above. As of December 31, 2024, there was approximately $100.8 million of capacity remaining under the 2024 Share Repurchase Program. See Note 8, Equity, to the Consolidated Financial Statements for more information.
The Company previously disclosed in its 2023 Form 10-K that one of its North American production facilities experienced an electrical fire in 2021 that resulted in property damage and the temporary shutdown of production. The Company and its insurance carrier reviewed the impact of the electrical fire on the production facility’s operations as it relates to a potential business interruption insurance claim. In July 2024, the Company and its insurance carrier settled this claim for $1.0 million. See Note 25, Commitments and Contingencies, to the Consolidated Financial Statements for more information.
The Company believes that its existing cash, anticipated cash flows from operations and available liquidity will be sufficient to support its operating requirements and fund its business objectives for at least the next twelve months, including but not limited to, payments of dividends to shareholders, share repurchases, capital expenditures, other growth opportunities (including potential acquisitions), pension plan contributions, implementing actions to achieve the Company’s sustainability goals and other potential known or anticipated contingencies. The Company also believes it has sufficient additional liquidity to support its operating requirements and to fund its business obligations for the period beyond the next twelve months, including the aforementioned items which are expected to recur annually, as well as future principal and interest payments on the Company’s Credit Facility, tax obligations and other long-term liabilities. The Company’s liquidity is affected by many factors, some based on normal operations of our business and others related to the impact of global events on our business and on global economic conditions as well as industry uncertainties, which we cannot predict. We also cannot predict economic conditions and industry downturns or the timing, strength or duration of recoveries. We may seek, as we believe appropriate, additional debt or equity financing that would provide capital for corporate purposes, working capital funding, additional liquidity needs or to fund future growth opportunities, including possible acquisitions and organic investments. The timing and amount of potential capital requirements cannot be determined at this time and will depend on a number of factors, including the actual and projected demand for our products, specialty chemical industry conditions, competitive factors, and the condition of financial markets, among others.
The following table summarizes the Company’s contractual obligations as of December 31, 2024, and the effect such obligations are expected to have on its liquidity and cash flows in future periods. Pension and postretirement plan contributions beyond 2025 are not determinable since the amount of any contribution is heavily dependent on the future economic environment and investment returns on pension trust assets. The timing of payments related to other long-term liabilities which consists primarily of deferred compensation agreements and environmental reserves, also cannot be readily determined due to their uncertainty. Interest obligations on the Company’s long-term debt and capital leases assume the current debt levels will be outstanding for the entire respective period and apply the interest rates in effect as of December 31, 2024.
| | | | | | | | | | | | | | | | | | | | | | | | | | | | | | | | | | | | | | | | | |
| Payments due by period |
| (dollars in thousand) | | | | | | | | | | | | | 2030 and
Beyond |
| Contractual Obligations | Total | | 2025 | | 2026 | | 2027 | | 2028 | | 2029 | |
| Long-term debt (See Note 19 of Notes to Consolidated Financial Statements) | $ | 707,214 | | | $ | 34,318 | | | $ | 34,285 | | | $ | 628,342 | | | $ | 10,269 | | | $ | — | | | $ | — | |
| Interest obligations (See Note 19 of Notes to Consolidated Financial Statements) | 90,902 | | | 38,204 | | | 35,739 | | | 16,784 | | | 175 | | | — | | | — | |
| Capital lease obligations (See Note 6 of Notes to Consolidated Financial Statements) | 1,053 | | | 447 | | | 352 | | | 231 | | | 23 | | | — | | | — | |
| Operating leases (See Note 6 of Notes to Consolidated Financial Statements) | 116,061 | | | 12,753 | | | 11,597 | | | 9,619 | | | 7,594 | | | 6,460 | | | 68,038 | |
| Purchase obligations | 480 | | | 480 | | | — | | | — | | | — | | | — | | | — | |
| Income taxes payable (See Note 10 and Note 21 of Notes to Consolidated Financial Statements) | 4,770 | | | 4,648 | | | 122 | | | — | | | — | | | — | | | — | |
| Pension and other postretirement plan contributions (See Note 20 of Notes to Consolidated Financial Statements) | 6,165 | | | 6,165 | | | — | | | — | | | — | | | — | | | — | |
| Other long-term liabilities (See Note 21 of Notes to Consolidated Financial Statements) | 7,188 | | | — | | | — | | | — | | | — | | | — | | | 7,188 | |
| Total contractual cash obligations | $ | 933,833 | | | $ | 97,015 | | | $ | 82,095 | | | $ | 654,976 | | | $ | 18,061 | | | $ | 6,460 | | | $ | 75,226 | |
Non-GAAP Measures
The information in this Report includes non-GAAP (unaudited) financial information that includes EBITDA, adjusted EBITDA, adjusted EBITDA margin, non-GAAP operating income, non-GAAP operating margin, non-GAAP net income and non-GAAP earnings per diluted share. The Company believes these non-GAAP financial measures provide meaningful supplemental information as they enhance a reader’s understanding of the financial performance of the Company, facilitate a comparison among fiscal periods, and exclude items that management believes are not indicative of future operating performance or core to the Company’s operations. Non-GAAP results are presented for supplemental informational purposes only and should not be considered a substitute for the financial information presented in accordance with GAAP. In addition, our definitions of EBITDA, adjusted EBITDA, adjusted EBITDA margin, non-GAAP operating income, non-GAAP operating margin, non-GAAP net income, and non-GAAP earnings per share, as discussed and reconciled below to the most comparable GAAP measures, may not be comparable to similarly named measures reported by other companies.
The Company presents EBITDA which is calculated as net income attributable to the Company before depreciation and amortization, interest expense, net, and taxes on income before equity in net income of associated companies. The Company also presents adjusted EBITDA which is calculated as EBITDA plus or minus certain items that management believes are not indicative of future operating performance or not considered core to the Company’s operations. In addition, the Company presents non-GAAP operating income which is calculated as operating income plus or minus certain items that management believes are not indicative of future operating performance or considers core to the Company’s operations. Adjusted EBITDA margin and non-GAAP operating margin are calculated as the percentage of adjusted EBITDA and non-GAAP operating income to consolidated net sales, respectively. The Company believes these non-GAAP measures provide transparent and useful information and are widely used by analysts, investors, and competitors in our industry as well as by management in assessing the operating performance of the Company on a consistent basis.
Additionally, the Company presents non-GAAP net income and non-GAAP earnings per diluted share as additional performance measures. Non-GAAP net income is calculated as adjusted EBITDA, defined above, less depreciation and amortization, interest expense, net, and taxes on income before equity in net income of associated companies, in each case adjusted, as applicable, for any depreciation, amortization, interest or tax impacts resulting from the non-core items identified in the reconciliation of net income attributable to the Company to adjusted EBITDA. Non-GAAP earnings per diluted share is calculated as non-GAAP net income per diluted share as accounted for under the “two-class share method.” The Company believes that non-GAAP net income and non-GAAP earnings per diluted share provide transparent and useful information and are widely used by analysts, investors, and competitors in our industry as well as by management in assessing the performance of the Company on a consistent basis.
Certain of the prior period non-GAAP financial measures presented in the following tables have been adjusted to conform with current period presentation. The following tables reconcile the Company’s non-GAAP financial measures (unaudited) to their most directly comparable GAAP financial measures (dollars in thousands, unless otherwise noted, except per share amounts):
| | | | | | | | | | | | | | | | | |
| Non-GAAP Operating Income and Margin Reconciliations | For the years ended December 31, |
| 2024 | | 2023 | | 2022 |
| Operating income | $ | 194,706 | | | $ | 214,495 | | | $ | 52,304 | |
| Acquisition-related expenses (a) | 1,854 | | | — | | | 8,812 | |
| Restructuring and related charges, net (b) | 6,530 | | | 7,588 | | | 3,163 | |
| Strategic planning (credits) expenses (c) | (290) | | | 4,704 | | | 14,446 | |
| Executive transition costs (d) | 7,288 | | | 688 | | | 2,813 | |
| Customer insolvency costs (e) | 3,213 | | | — | | | — | |
| Impairment charges (k) | — | | | — | | | 93,000 | |
| Russia-Ukraine conflict related expenses (l) | — | | | — | | | 2,487 | |
| Other charges (n) | 399 | | | 299 | | | 866 | |
| Non-GAAP operating income | $ | 213,700 | | | $ | 227,774 | | | $ | 177,891 | |
| Non-GAAP operating margin (%) (r) | 11.6 | % | | 11.7 | % | | 9.2 | % |
| | | | | | | | | | | | | | | | | |
| EBITDA, Adjusted EBITDA, Adjusted EBITDA Margin and Non-GAAP Net Income Reconciliations | For the years ended December 31, |
| 2024 | | 2023 | | 2022 |
| Net income (loss) attributable to Quaker Chemical Corporation | $ | 116,644 | | | $ | 112,748 | | | $ | (15,931) | |
| Depreciation and amortization (p) | 85,108 | | | 83,020 | | | 81,514 | |
| Interest expense, net | 41,002 | | | 50,699 | | | 32,579 | |
| Taxes on income (loss) before equity in net income of associated companies (q) | 49,300 | | | 55,585 | | | 24,925 | |
| EBITDA | 292,054 | | | 302,052 | | | 123,087 | |
| Equity (income) loss in a captive insurance company (h) | (2,930) | | | (2,090) | | | 1,427 | |
| Acquisition-related expenses (credits) (a) | 1,454 | | | (475) | | | 10,990 | |
| Restructuring and related charges, net (b) | 6,530 | | | 7,588 | | | 3,163 | |
| Strategic planning (credits) expenses (c) | (290) | | | 4,704 | | | 14,446 | |
| Executive transition costs (d) | 7,288 | | | 688 | | | 2,813 | |
| Customer insolvency costs (e) | 3,213 | | | — | | | — | |
| Facility remediation recoveries, net (f) | — | | | (2,141) | | | (1,804) | |
| Product liability claim costs, net (g) | 2,040 | | | — | | | — | |
| Business interruption insurance proceeds (i) | (1,000) | | | — | | | — | |
| Currency conversion impacts of hyper-inflationary economies (j) | 811 | | | 7,849 | | | 1,617 | |
| Impairment charges (k) | — | | | — | | | 93,000 | |
| Russia-Ukraine conflict related expenses (l) | — | | | — | | | 2,487 | |
| Loss on extinguishment of debt (m) | — | | | — | | | 6,763 | |
| Other charges (credits) (n) | 1,748 | | | 2,204 | | | (839) | |
| Adjusted EBITDA | $ | 310,918 | | | $ | 320,379 | | | $ | 257,150 | |
| Adjusted EBITDA margin (%) (r) | 16.9 | % | | 16.4 | % | | 13.2 | % |
| | | | | |
| Adjusted EBITDA | $ | 310,918 | | | $ | 320,379 | | | $ | 257,150 | |
| Less: Depreciation and amortization - adjusted (p) | 85,108 | | | 83,020 | | | 81,514 | |
| Less: Interest expense, net | 41,002 | | | 50,699 | | | 32,579 | |
| Less: Taxes on income (loss) before equity in net income of associated companies - adjusted (o)(q) | 51,352 | | | 49,017 | | | 37,737 | |
| Non-GAAP net income | $ | 133,456 | | | $ | 137,643 | | | $ | 105,320 | |
| | | | | | | | | | | | | | | | | |
| Non-GAAP Earnings per Diluted Share Reconciliations | For the years ending December 31, |
| 2024 | | 2023 | | 2022 |
| GAAP earnings (loss) per diluted share attributable to Quaker Chemical Corporation common shareholders | $ | 6.51 | | | $ | 6.26 | | | $ | (0.89) | |
| Equity (income) loss in a captive insurance company per diluted share (h) | (0.16) | | | (0.12) | | | 0.08 | |
| Acquisition-related expenses (credits) per diluted share (a) | 0.06 | | | (0.03) | | | 0.49 | |
| Restructuring and related charges, net per diluted share (b) | 0.28 | | | 0.32 | | | 0.13 | |
| Strategic planning (credits) expenses per diluted share (c) | (0.01) | | | 0.21 | | | 0.63 | |
| Executive transition costs per diluted share (d) | 0.31 | | | 0.03 | | | 0.12 | |
| Customer insolvency costs per diluted share (e) | 0.13 | | | — | | | — | |
| Facility remediation recoveries, net per diluted share (f) | — | | | (0.09) | | | (0.08) | |
| Product liability claim costs, net per diluted share (g) | 0.09 | | | — | | | — | |
| Business interruption insurance proceeds per diluted share (i) | (0.04) | | | — | | | — | |
| Currency conversion impacts of hyper-inflationary economies per diluted share (j) | 0.05 | | | 0.44 | | | 0.09 | |
| Impairment charges per diluted share (k) | — | | | — | | | 5.19 | |
| Russia-Ukraine conflict related expenses per diluted share (l) | — | | | — | | | 0.12 | |
| Loss on extinguishment of debt per diluted share (m) | — | | | — | | | 0.29 | |
| Other charges (credits) per diluted share (n) | 0.05 | | | 0.09 | | | (0.04) | |
| Impact of certain discrete tax items per diluted share (o) | 0.17 | | | 0.54 | | | (0.26) | |
| Non-GAAP earnings per diluted share (s) | $ | 7.44 | | | $ | 7.65 | | | $ | 5.87 | |
(a)Acquisition-related expenses (credits) include expense associated with the Company's recent and potential acquisitions, including legal, financial, consulting and other costs. For the year ended December 31, 2022, these amounts also include costs incurred in connection with integration activities relating to the Houghton acquisition. See Note 2, Business Combinations, to the Consolidated Financial Statements for additional information.
(b)Restructuring and related charges, net represent the costs incurred by the Company associated with the Company’s restructuring program and facility closures. During 2024, 2023 and 2022, the Company recorded restructuring and related charges of $6.5 million, $7.6 million and $3.2 million, respectively. See Note 7, Restructuring and Related Activities, to the Consolidated Financial Statements for additional information.
(c)Strategic planning (credits) expenses include certain consultant and advisory expenses for the Company's long-term strategic planning, as well as process optimization and the next phase of the Company's long-term integration to further optimize its footprint, processes and other functions.
(d)Executive transition costs represent the costs related to the Company’s transition of executive officers.
(e)Customer insolvency costs represent charges associated with specific reserves for trade accounts receivable within the Company’s EMEA and America’s reportable segments related to two specific customers that filed for bankruptcy protection.
(f)Facility remediation recoveries, net represent insurance recoveries received for remediation and restoration of property damage to certain of the Company’s facilities and are recorded in Other income (expense). There were no gains recognized during the year ended December 31, 2024. See Note 25, Commitments and Contingencies, to the Consolidated Financial Statements for additional information.
(g)Product liability claim costs, net represents expenses related to the payments by the Company in connection with product liability disputes with customers, net of insurance recoveries during 2024. See Note 9, Other Income (Expense), net to the Consolidated Financial Statements for additional information.
(h)Equity income (loss) in a captive insurance company represents the after-tax income attributable to the Company’s equity interest in Primex, Ltd. (“Primex”), a captive insurance company. The Company holds a 32% investment in and has significant influence over Primex, and therefore accounts for this investment under the equity method of accounting. See Note 16, Investments in Associated Companies, to the Consolidated Financial Statements for additional information.
(i)Business interruption insurance proceeds reflects an insurance claim settlement receipt for the for the year ended December 31, 2024 related to production losses due to an electrical fire in 2021 that resulted in the temporary shutdown of production at one of the Company’s production facilities. See Note 25, Commitments and Contingencies, to the Consolidated Financial Statements for additional information.
(j)Currency conversion impacts of hyper-inflationary economies represent the foreign currency remeasurement impacts associated with the Company’s affiliates in Argentina and Türkiye whose local economies are designated as hyper-inflationary under U.S. GAAP. These pre-tax foreign currency remeasurement impacts are not deductible for tax purposes for each of the years ended December 31, 2024 and 2023 and 2022. The charges incurred related to the immediate recognition of foreign currency remeasurement in the Consolidated Statements of Operations. See Note 1, Basis of Presentation and Significant Accounting Policies, to the Consolidated Financial Statements for additional information.
(k)Impairment charges represent the non-cash charges taken to write down the value of goodwill for the year ended December 31, 2022. See Note 15, Goodwill and Other Intangible Assets, to the Consolidated Financial Statements for additional information.
(l)Expenses related to the Russia-Ukraine conflict represent the direct costs associated with the Company's exit of operations in Russia during 2022. These costs included employee separation benefits, as well as costs associated with reserves for trade accounts receivable within the Company's EMEA reportable segment, where certain customers were impacted by the conflict between Russia and Ukraine or the Company's decision to end operations in Russia.
(m)In connection with executing the Credit Facility, the Company recorded a loss on extinguishment of debt of approximately $6.8 million which includes the write-off of certain previously unamortized deferred financing costs as well as a portion of the third-party and creditor debt issuance costs incurred to execute the Credit Facility. See Note 19, Debt, to the Consolidated Financial Statements for additional information.
(n)Other charges (credits) include charges incurred by an inactive subsidiary of the Company as a result of the termination of restrictions on insurance settlement reserves, non-service components of the Company’s pension and postretirement net periodic benefit income and expense and net gains recognized for the sale of certain facilities previously classified as held-for-sale. See Note 1, Basis of Presentation and Significant Accounting Policies, Note 7, Restructuring and Related Activities, and Note 20, Pension and Other Postretirement Benefits, to the Consolidated Financial Statements for additional information.
(o)The impacts of certain discrete tax items include certain impacts of tax law changes, valuation allowance adjustments, uncertain tax positions, provision to return and other adjustments, and the impact of certain intercompany asset transfers. For the year ended December 31, 2023, the impacts also included $6.7 million of withholding taxes for the repatriation of non-U.S. earnings. See Note 10, Income Taxes, to the Consolidated Financial Statements for additional information.
(p)Depreciation and amortization includes $1.0 million for each of the years ended December 31, 2024, 2023 and 2022, respectively, of amortization expense recorded within equity in net income of associated companies in the Company’s Consolidated Statements of Operations, which is attributable to amortization of the fair value purchase accounting step-up in connection with acquisition of the Company’s 50% equity interest in Korea Houghton Corporation.
(q)Taxes on income before equity in net income of associated companies – adjusted presents the impact of any current and deferred income tax expense (benefit), as applicable, of the reconciling items presented in the reconciliation of net income attributable to Quaker Chemical Corporation to adjusted EBITDA and was determined utilizing the applicable rates in the taxing jurisdictions in which these adjustments occurred, subject to deductibility.
(r)The Company calculates adjusted EBITDA margin and non-GAAP operating margin as the percentage of adjusted EBITDA and non-GAAP operating income, respectively, to consolidated net sales.
(s)The Company calculates non-GAAP earnings per diluted share as non-GAAP net income attributable to the Company per weighted average diluted shares outstanding using the “two-class share method” to calculate such in each given period.
Off-Balance Sheet Arrangements
The Company had approximately $6 million of bank letters of credit and guarantees as of December 31, 2024. The bank letters of credit and guarantees are not significant to the Company’s liquidity or capital resources.
Operations
Consolidated Operations Review – Comparison of 2024 with 2023
The following table summarizes the sales variances by reportable segment and consolidated operations from the prior year:
| | | | | | | | | | | | | | | | | | | | | | | | | | | | | |
| | Sales volumes | | Selling price & product mix | | Foreign currency | | Acquisition & other | Total |
| Americas | | (5) | % | | (4) | % | | (1) | % | | — | % | (10) | % |
| EMEA | | (5) | % | | (4) | % | | — | % | | 3 | % | (6) | % |
| Asia/Pacific | | 7 | % | | (3) | % | | (2) | % | | 2 | % | 4 | % |
| Consolidated | | (2) | % | | (4) | % | | (1) | % | | 1 | % | (6) | % |
Net sales of $1,839.7 million in 2024 decreased 6% compared to $1,953.3 million in 2023, primarily due to a decrease in selling price and product mix of approximately 4%, a decrease in sales volumes of approximately 2%, and unfavorable impacts from foreign currency translation of approximately 1%, partially offset by an increase in sales from acquisitions of approximately 1%. The decrease in selling price and product mix was primarily attributable to the impact of our index-based customer contracts and the mix of products and services. The decline in sales volumes was primarily a result of continuation of soft end market conditions compared to the prior year, primarily in the Americas and EMEA segments, partially offset by an increase in sales volumes in the Asia/Pacific segment, continued business wins across all segments and a contribution from acquisitions in the EMEA and Asia/Pacific segments.
Cost of goods sold (“COGS”) were $1,153.7 million in 2024 compared to $1,247.7 million in 2023. The decrease of COGS of $94.0 million, or 8%, reflects lower spend on the decline in current year sales volumes and a modest decline in the Company’s global raw material costs.
Gross profit was $686.0 million in 2024 compared to $705.6 million in 2023, a decrease of approximately $19.6 million, or 3%, primarily as a result of the decline in sales mentioned above, partially offset by a modest reduction in the Company’s global raw material costs. The Company’s reported gross margin in 2024 was 37.3% compared to 36.1% in 2023. The Company’s current year improvement in gross margin was primarily driven by our value-based pricing model and modest improvements in raw material costs.
SG&A was $484.8 million in 2024 compared to $483.6 million in 2023, an increase of $1.2 million, or 0.3%, primarily as a result of higher executive transition costs, higher customer insolvency costs, and SG&A relating to the IKV and Sutai acquisitions, partially offset by lower strategic planning expenses and favorable foreign currency translation compared to the prior year.
The Company incurred Restructuring and related charges of $6.5 million and $7.6 million during 2024 and 2023, respectively, related to reductions in headcount and facility closure costs under the Company’s restructuring program. See the Non-GAAP Measures section of this Item above and Note 7, Restructuring and Related Activities, to the Consolidated Financial Statements for additional information.
Operating income in 2024 was $194.7 million compared to $214.5 million in 2023. Excluding non-core items that are not indicative of future operating performance, as detailed above, the Company’s current year non-GAAP operating income was $213.7 million compared to $227.8 million in the prior year. The decrease in non-GAAP operating income was primarily due to lower gross profit, as described above.
The Company had Other income, net of $1.4 million in 2024 compared to Other expense, net of $10.7 million in 2023 due to lower foreign exchange losses of $1.8 million in the current year compared to losses of $14.8 million in the prior year. Additionally, the Company had higher non-income tax refunds of $3.7 million in the current year compared to non-income tax refunds of $1.3 million in the prior year. Other income, net in 2024 also included a business interruption insurance recovery of $1.0 million, other income of $0.4 million relating to adjustments to the earnout provisions for the Sutai acquisition, and $2.0 million of product liability claim costs. Prior year’s Other expense, net included $2.1 million of facility remediation recoveries, net.
Interest expense, net, of $41.0 million decreased $9.7 million in 2024 compared to $50.7 million in 2023, primarily as a result of lower outstanding borrowings and decreases in interest rates.
The Company’s effective tax rates for 2024 and 2023 were 31.8% and 36.3%, respectively. The Company’s current year effective tax rate was primarily impacted by the mix of pre-tax earnings, certain one-time charges related to an intercompany intangible asset transfer, provision to return and other adjustments, and withholding taxes, offset by changes in uncertain tax positions. The Company’s 2023 effective tax rate was primarily impacted by changes to the valuation allowance for and the usage of certain foreign tax credits, withholding taxes and deferred taxes on unremitted earnings, and the mix of pre-tax earnings. Excluding the impact of all non-core items in each year, described in the Non-GAAP Measures section of this Item, above, the Company estimates that the 2024 and 2023 effective tax rates would have been approximately 29% and 28%, respectively. In 2023, the Company recognized $6.7 million of withholding taxes for the repatriation of non-U.S. earnings that the Company does not believe is core or indicative of future performance and has adjusted these withholding taxes as a Non-GAAP measure. The Company may experience continued volatility in its effective tax rates due to several factors, including the timing of tax audits and the expiration of applicable statutes of limitations as they relate to uncertain tax positions, the unpredictability of the timing and amount of certain incentives in various tax jurisdictions, and the timing and amount of certain share-based compensation-related tax benefits, among other factors. In addition, the foreign tax credit valuation allowance, or absence thereof, is based on a number of variables, including forecasted earnings, which may vary.
Equity in net income of associated companies was $11.0 million in 2024 compared to $15.3 million in 2023. The decrease of $4.3 million was primarily due to lower current year income from the Company’s 50% equity interest in a joint venture in Korea offset by higher current year income from the Company’s equity interest in Primex.
Net income attributable to noncontrolling interest was approximately $0.1 million for both 2024 and 2023.
Consolidated Operations Review – Comparison of 2023 with 2022
The following table summarizes sales variances by segment and consolidated operations from the prior year:
| | | | | | | | | | | | | | | | | | | | | | | | | | | | | | | | |
| | Sales volumes | | Selling price & product mix | | Foreign currency | | Acquisition & other | | Total |
| Americas | | (6) | % | | 8 | % | | 1 | % | | — | % | | 3 | % |
| EMEA | | (9) | % | | 9 | % | | 2 | % | | — | % | | 2 | % |
| Asia/Pacific | | (7) | % | | 4 | % | | (4) | % | | — | % | | (7) | % |
| Consolidated | | (7) | % | | 7 | % | | 1 | % | | — | % | | 1 | % |
Net sales were a record $1,953.3 million in 2023 compared to $1,943.6 million in 2022. The increase in net sales of approximately $9.7 million or 1% year-over-year was primarily due to an increase in selling price and product mix of 7% and approximately 1% favorable impact of foreign currency translations, partially offset by a decline in sales volumes of approximately 7%. The increase in selling price and product mix was primarily driven by year-over-year impact of our value-based pricing initiatives. The decline in sales volumes was primarily attributable to softer end market conditions across all regions, including the direct and indirect impacts of the UAW strike, the Company’s value-based pricing initiatives and customer order patterns, as well as the impacts of the ongoing war in Ukraine in the EMEA segment, and the wind-down of the tolling agreement for products previously divested related to the Quaker combination with Houghton International, Inc. (“Houghton”), partially offset by new business wins in all segments, as mentioned above.
COGS were $1,247.7 million in 2023 compared to $1,330.9 million in 2022. The decrease in COGS of 6% reflects lower spend on the decline in current year sales volumes, which more than offset higher costs due to inflationary pressures in the Company’s global raw material, manufacturing and supply chain and logistics costs compared to the prior year.
Gross profit in 2023 of $705.6 million increased $93.0 million or approximately 15% from 2022. The Company’s reported gross margin in 2023 was 36.1% compared to 31.5% in 2022. The Company’s current year improvement in gross margin was primarily driven by the year-over-year impact of our value-based pricing and margin improvement initiatives.
SG&A in 2023 increased $28.2 million compared to 2022 driven by higher labor-related costs including year-over-year inflationary increases and higher levels of incentive compensation on improved Company performance, partially offset by lower SG&A due to foreign currency translation compared to the prior year.
During 2022, the Company incurred $8.8 million of Acquisition-related expenses (credits). See the Non-GAAP Measures section of this Item, above. There were no similar costs incurred during 2023.
The Company incurred Restructuring and related charges of $7.6 million and $3.2 million during 2023 and 2022, respectively, related to the Company’s previous and current restructuring programs. See the Non-GAAP Measures section of this Item, above.
In 2022, the Company recorded a $93.0 million non-cash impairment charge to write down the value of goodwill associated with the Company’s EMEA reportable segment. This non-cash impairment charge was the result of the Company’s trigger based fourth quarter of 2022 impairment assessment. There were no similar impairment charges in 2023. See the Critical Accounting Policies and Estimates section as well as the Non-GAAP Measures section, of this Item, above.
Operating income in 2023 was $214.5 million compared to $52.3 million in 2022. Excluding the non-cash impairment charge, as well as other non-core items that are not indicative of future operating performance, the Company’s current year non-GAAP operating income was $227.8 million compared to $177.9 million in the prior year. The increase in non-GAAP operating income was primarily due to higher gross profit partially offset by higher SG&A, as described above.
The Company had Other expense, net of $10.7 million in 2023 compared to $12.6 million in 2022. The 2023 and 2022 results include $2.1 million and $1.8 million, respectively of facility remediation recoveries, net, while prior year’s Other expense, net also includes $6.8 million of loss on extinguishment of debt related to the Company’s refinancing the Original Credit Facility and $2.4 million of expense related to an indemnification asset. Also, there were higher foreign currency transaction losses in 2023 compared to 2022.
Interest expense, net, increased $18.1 million compared to 2022, primarily driven by increases in the average borrowings outstanding coupled with an increase in interest rates year-over-year as the weighted average interest rate incurred on borrowings under the Company’s primary credit facility was approximately 6.2% during 2023 compared to approximately 3.0% during 2022.
The Company’s effective tax rates for 2023 and 2022 were an expense of 36.3% and 350.2%, respectively. The Company’s 2023 effective tax rate was primarily impacted by changes to the valuation allowance for and the usage of certain foreign tax credits, withholding taxes and deferred taxes on unremitted earnings, and the mix of pre-tax earnings. The Company’s 2022 effective tax rate was driven by the non-cash impairment charge, the mix of pre-tax earnings, foreign tax inclusions and withholding taxes, partially offset by a reduction in reserves for uncertain tax positions and changes in the valuation allowance for foreign tax credits. Excluding the impact of all non-core items in each year, described in the Non-GAAP Measures section of this Item, above, the Company estimates that the 2023 and 2022 effective tax rates would have been approximately 28% and 27%, respectively. In 2023, the Company recognized $6.7 million of withholding taxes for the repatriation of non-U.S. earnings that the Company does not believe is core or indicative of future performance and has adjusted these withholding taxes as a Non-GAAP measure. The Company may experience continued volatility in its effective tax rates due to several factors, including the timing of tax audits and the expiration of applicable statutes of limitations as they relate to uncertain tax positions, the unpredictability of the timing and amount of certain incentives in various tax jurisdictions, and the timing and amount of certain share-based compensation-related tax benefits, among other factors. In addition, the foreign tax credit valuation allowance, or absence thereof, is based on a number of variables, including forecasted earnings, which may vary.
Equity in net income of associated companies increased $13.4 million in 2023 compared to 2022, primarily due to higher current year income from the Company’s interest in a captive insurance company (see the Non-GAAP Measures section of this Item, above) due to higher market performance on equity investments and from the Company’s 50% interest in a joint venture in Korea due to overall market improvement.
Net income attributable to noncontrolling interest was approximately $0.1 million for both 2023 and 2022.
Reportable Segments Review - Comparison of 2024 with 2023
The Company’s reportable segments reflect the structure of the Company’s internal organization, the method by which the Company’s resources are allocated and the manner by which the Chief Operating Decision Maker of the Company assesses its performance. During the first quarter of 2023, the Company reorganized certain of its executive management team to align with its new business structure, which reflects the method by which the Company currently assesses its performance and allocates its resources. The Company has three reportable segments: (i) Americas; (ii) EMEA; and (iii) Asia/Pacific. See Notes 1, 4, 5, and 15 of Notes to Consolidated Financial Statements in Item 8 of this Report.
Segment operating earnings for each of the Company’s reportable segments are comprised of the segment’s net sales less directly related product costs and other operating expenses. Operating expenses not directly attributable to the net sales of each respective segment, such as certain corporate and administrative costs, impairment charges, and restructuring charges, are not included in segment operating earnings. Other items not specifically identified with the Company’s reportable segments include Interest expense, net and Other income (expense), net.
Americas
Americas represented approximately 48% of the Company’s consolidated net sales in 2024. The segment’s net sales were $882.1 million, a decrease of $95.0 million or 10% compared to 2023. This was driven by a decline in sales volumes of 5%, a decline in selling price and product mix of 4% and unfavorable foreign currency impacts of 1%. The decline in sales volumes was primarily driven by softer market conditions broadly across the portfolio, partially offset by new business wins. The decline in selling price and product mix was primarily attributable to the impact of our index-based customer contacts and the mix of products and services. The unfavorable foreign exchange impact was primarily due to the strengthening of the U.S. dollar against the Mexican peso and Brazilian real. Segment operating earnings in the Americas were $244.0 million, a decrease of $22.1 million or 8% compared to 2023 primarily driven by the decrease in net sales, partially offset by an improvement in segment operating margins driven by the Company’s margin improvement initiatives.
EMEA
EMEA represented approximately 29% of the Company’s consolidated net sales in 2024. The segment’s net sales were $536.4 million, a decrease of $34.9 million or 6% compared to 2023. This was driven by a decline in sales volumes of 5% and a decline in selling price and product mix of 4%, partially offset by a contribution of sales from the acquisition of IKV of 3%. The decline in sales volumes was driven by the continuation of soft end market conditions in the region, partially offset by new business wins. The decline in selling price and product mix was primarily attributable to the impact of our index-based customer contracts and the mix of products and services. Segment operating earnings in EMEA were $99.4 million, a decrease of $5.4 million or 5% compared to 2023 primarily driven by the decrease in net sales, partially offset by an improvement in segment operating margins driven by the Company’s margin improvement initiatives.
Asia/Pacific
Asia/Pacific represented approximately 23% of the Company’s consolidated net sales in 2024. The segment’s net sales were $421.1 million, an increase of 4% or approximately $16.2 million compared to 2023. This was driven by an increase in sales volumes of 7%, a contribution of sales from the acquisition of Sutai of 2%, partially offset by a decline in selling price and product mix of 3% and unfavorable impact from foreign currency translation of 2%. The increase in sales volumes was primarily driven by new business wins coupled with a modest improvement in the end market environment. The decline in selling price and product mix was primarily attributable to the impact of our index-based customer contracts and mix of products and services. The unfavorable foreign currency translation was primarily due to the strengthening of the U.S. dollar against the Chinese renminbi. Segment operating earnings in Asia/Pacific were $122.7 million, an increase of $4.3 million, or 4%, compared to 2023 as a result of improvement in net sales, partially offset by a decrease in segment operating margins.
Reportable Segments Review – Comparison of 2023 with 2022
Americas
Americas represented approximately 50% of the Company’s consolidated net sales in 2023. The segment’s net sales were $977.1 million, an increase of $30.6 million or 3% compared to 2022. The increase in net sales was due to higher selling price and product mix of 8% and favorable foreign currency impacts of 1%, partially offset by a decrease in sales volumes of approximately 6%. The decline in sales volumes was primarily driven by softer market conditions, customer order patterns, the direct and indirect impacts of the UAW strike, and the Company’s value-based pricing initiatives, partially offset by new business wins. The increase in selling price and product mix was primarily driven by value-based price increases implemented to offset the significant increases in raw material, manufacturing and other input costs. The favorable foreign exchange impact was primarily due to the weakening of the U.S. dollar against the Mexican peso. This segment’s operating earnings were $266.0 million, an increase of $42.4 million or 19% compared to 2022 primarily driven by an increase in net sales and an improvement in segment operating margins driven by the Company’s ongoing margin improvement initiatives.
EMEA
EMEA represented approximately 29% of the Company’s consolidated net sales in 2023. The segment’s net sales were $571.3 million, an increase of $8.8 million or 2% compared to 2022. The increase in net sales was a result of a 9% increase in selling price and a favorable impact from foreign currency translation of 2%, which was partially offset by a decrease in sales volumes of approximately 9%. The increase in selling price and product mix was primarily driven by value-based price increases implemented to offset the significant increases in raw material, manufacturing and other input costs. The favorable foreign currency translation impact was primarily due to the weakening of the U.S. dollar against the Euro. The decrease in sales volumes was primarily driven by softer market conditions, the Company’s value-based pricing initiatives, customer order patterns and the impacts of the wind-down of the tolling agreement for products previously divested related to the Combination as well as the ongoing war in Ukraine, partially offset by new business wins. This segment’s operating earnings were $104.8 million, an increase of $28.4 million or 37% compared to 2022. The increase in segment operating earnings was primarily driven by an increase in net sales and an improvement in segment operating margins driven by the Company’s ongoing margin improvement initiatives.
Asia/Pacific
Asia/Pacific represented approximately 21% of the Company’s consolidated net sales in 2023. The segment’s net sales were $404.9 million, a decrease of 7% or approximately $29.7 million compared to 2022. The decrease in net sales was a result of lower sales volumes of 7% and an unfavorable impact from foreign currency translation of 4%, partially offset by a 4% increase in selling price and product mix. The decrease in sales volumes was primarily driven by softer end market conditions and the impacts of the Company’s value-based pricing initiatives, partially offset by new business wins. The increase in selling price and product mix was primarily driven by value-based price increases implemented to offset the significant increases in raw material, manufacturing and other input costs. The unfavorable foreign exchange impact was primarily due to the strengthening of the U.S. dollar against the Chinese renminbi. This segment’s operating earnings were $118.5 million, an increase of $12.6 million or 12% compared to 2022 as a result of higher gross margins reflecting the Company’s value-based pricing initiatives and the Company’s ongoing margin improvement initiatives.
Environmental Clean-up Activities
The Company is involved in environmental clean-up activities in connection with an existing plant location and former waste disposal sites. This includes certain soil and groundwater contamination the Company identified in 1992 at AC Products, Inc. (“ACP”), a wholly owned subsidiary. In voluntary coordination with the Santa Ana California Regional Water Quality Board, ACP has been remediating the contamination, the principal contaminant of which is perchloroethylene (“PERC”). In 2004, the Orange County Water District (“OCWD”) filed a civil complaint against ACP and other parties seeking to recover compensatory and other damages related to the investigation and remediation of the contamination in the groundwater. Pursuant to a settlement agreement with OCWD, ACP agreed, among other things, to operate the two groundwater treatment systems to hydraulically contain groundwater contamination emanating from ACP’s site until the concentrations of PERC released by ACP fell below the current Federal maximum contaminant level for four consecutive quarterly sampling events. In 2014, ACP ceased operation at one of its two groundwater treatment systems, as it had met the above condition for closure. In 2020, the Santa Ana Regional Water Quality Control Board asked that ACP conduct some additional indoor and outdoor soil vapor testing on and near the ACP site to confirm that ACP continues to meet the applicable local standards. ACP began to perform such testing program work in 2022, and an additional round of testing is expected to commence in 2025. As of December 31, 2024, ACP believes it is close to meeting the conditions for closure of the remaining groundwater treatment system but continues to operate this system while in discussions with the relevant authorities.
As of December 31, 2024, the Company believes that the range of potential-known liabilities associated with the balance of the ACP water remediation program is approximately $0.1 million to $1.0 million. The low and high ends of the range are based on the length of operation of the treatment system as determined by groundwater modeling. Costs of operation include the operation and maintenance of the extraction well, groundwater monitoring, program management, and soil vapor testing.
The Company is also party to other environmental matters related to certain domestic and foreign properties. These environmental matters primarily require the Company to perform ongoing monitoring and maintenance at each of the applicable sites. During the year ended December 31, 2024, there have been no significant changes to the facts or circumstances of these matters. Based on the Company’s current obligations, historical costs incurred, and projected costs to be incurred over the next 24 years, the Company estimated the present value range of costs for all of these environmental matters, on a discounted basis, to be between approximately $3.5 million and $6.0 million as of December 31, 2024, for which $3.6 million is accrued within other accrued liabilities and other non-current liabilities on the Company’s Consolidated Balance Sheets as of December 31, 2024. Comparatively, as of December 31, 2023, the Company had $5.1 million accrued for these matters. These accrued amounts are inclusive of the Brazilian environmental matter discussed below.
The Company’s Sao Paulo, Brazil site was required under Brazilian environmental, health and safety regulations to perform an environmental assessment as part of a permit renewal process. Initial investigations identified soil and ground water contamination in select areas of the site. The site has conducted a multi-year soil and groundwater investigation and corresponding risk assessments based on the result of the investigations. In 2017, the site had to submit a new 5-year permit renewal request and was asked to complete additional investigations to further delineate the site based on review of the technical data by the local regulatory agency, Companhia Ambiental do Estado de São Paulo (“CETESB”). Based on review of the updated investigation data, CETESB issued a Technical Opinion regarding the investigation and remedial actions taken to date. The site developed an action plan and submitted it to CETESB in 2018 based on CETESB requirements. The site intervention plan primarily requires the site, amongst other actions, to conduct periodic monitoring for methane in soil vapors, source zone delineation, groundwater plume delineation, bedrock aquifer assessment, update the human health risk assessment, develop a current site conceptual model and conduct a remedial feasibility study and provide a revised intervention plan. In 2020, the site submitted a report on the activities completed including the revised site conceptual model and results of the remedial feasibility study and recommended remedial strategy for the site.
The Company believes that it has made adequate accruals for costs associated with other environmental matters of which it is aware. Approximately $0.6 million and $0.2 million were accrued as of December 31, 2024 and 2023, respectively, to provide for such anticipated future environmental assessments and remediation costs.
Notwithstanding the foregoing, the Company cannot be certain that future liabilities in the form of remediation expenses and damages will not exceed amounts reserved. See Note 25, Commitments and Contingencies, to the Consolidated Financial Statements for additional details.
General
See Item 7A of this Report, below, for further discussion of certain quantitative and qualitative disclosures about market risk.
Item 7A. Quantitative and Qualitative Disclosures About Market Risk.
Quaker Houghton’s earnings, cash flows and financial position are exposed to the impact of fluctuations in interest rates, foreign currency exchange rates, and commodity prices, as well as credit risk. Except as otherwise disclosed below, the market risks discussed below did not change materially from December 31, 2023.
Interest Rate Risk. During June 2022, the Company entered into an amendment to its primary credit facility (the “Credit Facility”). See Note 19, Debt, to the Consolidated Financial Statements for additional details. As of December 31, 2024, borrowings under the Credit Facility bear interest at either term SOFR or a base rate, in each case, plus an applicable margin based upon the Company’s consolidated net leverage ratio, and, in the case of term SOFR, a spread adjustment equal to 0.10% per annum. As a result of the variable interest rates applicable under the Credit Facility, if interest rates rise significantly, the cost of debt to the Company will increase. This may have an adverse effect on the Company, depending on the extent of the Company’s borrowings outstanding throughout a given year. As of December 31, 2024, the Company had outstanding borrowings under the Credit Facility of approximately $696.5 million. The interest rate applicable on outstanding borrowings under the Credit Facility was approximately 5.2% as of December 31, 2024. An interest rate change of 100 basis points would result in an approximate $7.0 million increase or decrease to interest expense for the year ended December 31, 2024.
In order to manage the Company’s exposure to variable interest rate risk associated with the Credit Facility in the first quarter of 2023, the Company entered into $300.0 million notional amounts of three year interest rate swaps to convert a portion of the Company’s variable rate borrowings into an average fixed rate obligation of 3.64% plus an applicable margin as provided in the Credit Facility based on the Company’s consolidated net leverage ratio. As of December 31, 2024, the aggregate interest rate on the swaps, including the fixed base rate plus the applicable margin, was 4.9%. These interest rate swaps are designated and qualify as cash flow hedges.
Foreign Exchange Risk. A significant portion of the Company’s revenues and earnings are generated by its foreign operations. During the past three years, sales by its non-U.S. subsidiaries accounted for approximately 63% to 65% of its consolidated net sales. These foreign operations also represent a significant portion of Quaker Houghton’s assets and liabilities. In addition, the Company occasionally sources inventory among its worldwide operations. This practice can give rise to foreign exchange risk resulting from the varying cost of inventory to the receiving location, as well as from the revaluation of intercompany balances. The Company primarily mitigates this risk through local sourcing efforts.
Generally, these foreign operations use the local currency as their functional currency. Accordingly, Quaker Houghton’s financial results are affected by foreign currency fluctuations, particularly between the U.S. dollar and the euro, the British pound sterling, the Brazilian real, the Mexican peso, the Chinese renminbi and the Indian rupee. Quaker Houghton’s results can be materially affected depending on the volatility and magnitude of foreign exchange rate changes. If the euro, the British pound sterling, the Brazilian real, the Mexican peso, the Chinese renminbi and the Indian rupee had all weakened or strengthened by 10% against the U.S. dollar, the Company’s 2024 revenues would have correspondingly decreased or increased by approximately $97.6 million. Similarly, pre-tax earnings would increase or decrease by approximately $14.3 million.
Commodity Price Risk. Many of the raw materials used by Quaker Houghton are derivatives of commodity chemicals, which can experience significant price volatility, and therefore Quaker Houghton’s earnings can be materially affected by market changes in raw material prices. At times, the Company has entered into fixed-price purchase contracts to manage this risk. These contracts provide protection to Quaker Houghton if the prices for the contracted raw materials rise; however, in certain circumstances, the Company may not realize the benefit if such prices decline. A gross margin change of one percentage point would correspondingly have increased or decreased the Company’s pre-tax earnings by approximately $18.4 million.
Credit Risk. Quaker Houghton establishes allowances for credit losses for estimated losses resulting from the inability of its customers to make required payments. If the financial condition of Quaker Houghton’s customers were to deteriorate, resulting in an impairment of their ability to make payments, additional allowances might be required. Downturns in the overall economic climate may also exacerbate specific customer financial issues. A significant portion of the Company’s revenues are derived from sales to customers in the steel and automotive industries, including some of our larger customers, where bankruptcies have occurred in the past and where companies have experienced past financial difficulties. Though infrequent, when a bankruptcy occurs, Quaker Houghton must judge the amount of proceeds, if any, that may ultimately be received through the bankruptcy or liquidation process.
In addition, as part of its terms of trade, Quaker Houghton may custom manufacture products for certain large customers and may also ship products on a consignment basis. These practices may increase the Company’s exposure to customer credit risk, including bankruptcy and may require a write-down or disposal of inventory due to obsolescence or limited marketability as well as a reserve for accounts receivable. Customer product returns or disputes may also result in similar issues related to the realizability of accounts receivable or inventory. The Company recorded expense to increase its provision for credit losses by $2.1 million, $1.3 million and $4.3 million for the years ended December 31, 2024, 2023 and 2022, respectively. A change of 10% to the expense recorded to the Company’s provision would have increased or decreased the Company’s pre-tax earnings by $0.2 million, $0.1 million and $0.4 million for the years ended December 31, 2024, 2023 and 2022, respectively.
Item 8. Financial Statements and Supplementary Data.
Quaker Chemical Corporation
Index to Consolidated Financial Statements
Report of Independent Registered Public Accounting Firm
To the Board of Directors and Shareholders of Quaker Chemical Corporation
Opinions on the Financial Statements and Internal Control over Financial Reporting
We have audited the accompanying consolidated balance sheets of Quaker Chemical Corporation and its subsidiaries (the "Company") as of December 31, 2024 and 2023, and the related consolidated statements of operations, of comprehensive income (loss), of changes in equity and of cash flows for each of the three years in the period ended December 31, 2024, including the related notes (collectively referred to as the "consolidated financial statements"). We also have audited the Company's internal control over financial reporting as of December 31, 2024, based on criteria established in Internal Control - Integrated Framework (2013) issued by the Committee of Sponsoring Organizations of the Treadway Commission (COSO).
In our opinion, the consolidated financial statements referred to above present fairly, in all material respects, the financial position of the Company as of December 31, 2024 and 2023, and the results of its operations and its cash flows for each of the three years in the period ended December 31, 2024 in conformity with accounting principles generally accepted in the United States of America. Also in our opinion, the Company maintained, in all material respects, effective internal control over financial reporting as of December 31, 2024, based on criteria established in Internal Control - Integrated Framework (2013) issued by the COSO.
Basis for Opinions
The Company's management is responsible for these consolidated financial statements, for maintaining effective internal control over financial reporting, and for its assessment of the effectiveness of internal control over financial reporting, included in Management’s Report on Internal Control over Financial Reporting appearing under Item 9A. Our responsibility is to express opinions on the Company’s consolidated financial statements and on the Company's internal control over financial reporting based on our audits. We are a public accounting firm registered with the Public Company Accounting Oversight Board (United States) (PCAOB) and are required to be independent with respect to the Company in accordance with the U.S. federal securities laws and the applicable rules and regulations of the Securities and Exchange Commission and the PCAOB.
We conducted our audits in accordance with the standards of the PCAOB. Those standards require that we plan and perform the audits to obtain reasonable assurance about whether the consolidated financial statements are free of material misstatement, whether due to error or fraud, and whether effective internal control over financial reporting was maintained in all material respects.
Our audits of the consolidated financial statements included performing procedures to assess the risks of material misstatement of the consolidated financial statements, whether due to error or fraud, and performing procedures that respond to those risks. Such procedures included examining, on a test basis, evidence regarding the amounts and disclosures in the consolidated financial statements. Our audits also included evaluating the accounting principles used and significant estimates made by management, as well as evaluating the overall presentation of the consolidated financial statements. Our audit of internal control over financial reporting included obtaining an understanding of internal control over financial reporting, assessing the risk that a material weakness exists, and testing and evaluating the design and operating effectiveness of internal control based on the assessed risk. Our audits also included performing such other procedures as we considered necessary in the circumstances. We believe that our audits provide a reasonable basis for our opinions.
Definition and Limitations of Internal Control over Financial Reporting
A company’s internal control over financial reporting is a process designed to provide reasonable assurance regarding the reliability of financial reporting and the preparation of financial statements for external purposes in accordance with generally accepted accounting principles. A company’s internal control over financial reporting includes those policies and procedures that (i) pertain to the maintenance of records that, in reasonable detail, accurately and fairly reflect the transactions and dispositions of the assets of the company; (ii) provide reasonable assurance that transactions are recorded as necessary to permit preparation of financial statements in accordance with generally accepted accounting principles, and that receipts and expenditures of the company are being made only in accordance with authorizations of management and directors of the company; and (iii) provide reasonable assurance regarding prevention or timely detection of unauthorized acquisition, use, or disposition of the company’s assets that could have a material effect on the financial statements.
Because of its inherent limitations, internal control over financial reporting may not prevent or detect misstatements. Also, projections of any evaluation of effectiveness to future periods are subject to the risk that controls may become inadequate because of changes in conditions, or that the degree of compliance with the policies or procedures may deteriorate.
Critical Audit Matters
The critical audit matter communicated below is a matter arising from the current period audit of the consolidated financial statements that was communicated or required to be communicated to the audit committee and that (i) relates to accounts or disclosures that are material to the consolidated financial statements and (ii) involved our especially challenging, subjective, or complex judgments. The communication of critical audit matters does not alter in any way our opinion on the consolidated financial statements, taken as a whole, and we are not, by communicating the critical audit matter below, providing a separate opinion on the critical audit matter or on the accounts or disclosures to which it relates.
Annual Goodwill Impairment Assessment for the EMEA Reporting Unit
As described in Notes 1, 15, and 23 to the consolidated financial statements, the Company’s consolidated goodwill balance was $519 million as of December 31, 2024, of which $80 million relates to the EMEA reporting unit. Management completes its annual goodwill impairment test during the fourth quarter of each year, or more frequently if triggering events indicate a possible impairment in one or more of its reporting units. In completing a quantitative goodwill impairment test, management compares the reporting unit’s fair value, primarily based on future discounted cash flows, to its carrying value in order to determine if an impairment charge is warranted. The determination of the estimated fair value requires management’s judgment and involves the use of significant estimates and assumptions, including revenue growth rates, gross margin levels, operating expenses, and weighted average cost of capital, among other items. Management completed its annual impairment assessment as of October 1, 2024, and concluded no impairment existed.
The principal considerations for our determination that performing procedures relating to the annual goodwill impairment assessment for the EMEA reporting unit is a critical audit matter are (i) the significant judgment by management when developing the fair value estimate of the EMEA reporting unit; (ii) a high degree of auditor judgment, subjectivity, and effort in performing procedures and evaluating management’s significant assumptions related to revenue growth rates and gross margin levels; and (iii) the audit effort involved the use of professionals with specialized skill and knowledge.
Addressing the matter involved performing procedures and evaluating audit evidence in connection with forming our overall opinion on the consolidated financial statements. These procedures included testing the effectiveness of controls relating to management’s goodwill impairment assessment, including controls over the valuation of the EMEA reporting unit. These procedures also included, among others, (i) testing management’s process for developing the fair value estimate of the EMEA reporting unit; (ii) evaluating the appropriateness of the discounted cash flow model used by management; (iii) testing the completeness and accuracy of underlying data used in the discounted cash flow model; and (iv) evaluating the reasonableness of significant assumptions used by management related to the revenue growth rates and gross margin levels. Evaluating management’s assumptions related to the revenue growth rates and gross margin levels, involved evaluating whether the assumptions used by management were reasonable considering (i) the current and past performance of the EMEA reporting unit; (ii) whether the assumptions were consistent with evidence obtained in other areas of the audit; and (iii) for revenue growth rates, whether the assumptions were consistent with external market and industry data. Professionals with specialized skill and knowledge were used to assist in evaluating the appropriateness of the Company’s discounted cash flow model.
/s/PricewaterhouseCoopers LLP
Philadelphia, Pennsylvania
February 24, 2025
We have served as the Company’s auditor since at least 1972. We have not been able to determine the specific year we began serving as auditor of the Company.
QUAKER CHEMICAL CORPORATION
CONSOLIDATED STATEMENTS OF OPERATIONS
(Dollars in thousands, except per share data)
| | | | | | | | | | | | | | | | | |
| Year Ended December 31, |
| 2024 | | 2023 | | 2022 |
| Net sales | $ | 1,839,686 | | | $ | 1,953,313 | | | $ | 1,943,585 | |
| Cost of goods sold (excluding amortization expense - See Note 15) | 1,153,656 | | | 1,247,669 | | | 1,330,931 | |
| Gross profit | 686,030 | | | 705,644 | | | 612,654 | |
| Selling, general and administrative expenses | 484,794 | | | 483,561 | | | 464,187 | |
| Impairment charges | — | | | — | | | 93,000 | |
| Restructuring and related charges, net | 6,530 | | | 7,588 | | | 3,163 | |
| | | | | |
| Operating income | 194,706 | | | 214,495 | | | 52,304 | |
| Other income (expense), net | 1,354 | | | (10,672) | | | (12,607) | |
| Interest expense, net | (41,002) | | | (50,699) | | | (32,579) | |
| Income before taxes and equity in net income of associated companies | 155,058 | | | 153,124 | | | 7,118 | |
| Taxes on income before equity in net income of associated companies | 49,300 | | | 55,585 | | | 24,925 | |
| Income (loss) before equity in net income of associated companies | 105,758 | | | 97,539 | | | (17,807) | |
| Equity in net income of associated companies | 10,971 | | | 15,333 | | | 1,965 | |
| Net income (loss) | 116,729 | | | 112,872 | | | (15,842) | |
| Less: Net income attributable to noncontrolling interest | 85 | | | 124 | | | 89 | |
| Net income (loss) attributable to Quaker Chemical Corporation | $ | 116,644 | | | $ | 112,748 | | | $ | (15,931) | |
| Per share data: | | | | | |
| Net income (loss) attributable to Quaker Chemical Corporation common shareholders – basic | $ | 6.51 | | | $ | 6.27 | | | $ | (0.89) | |
| Net income (loss) attributable to Quaker Chemical Corporation common shareholders – diluted | $ | 6.51 | | | $ | 6.26 | | | $ | (0.89) | |
The accompanying notes are an integral part of these consolidated financial statements.
QUAKER CHEMICAL CORPORATION
CONSOLIDATED STATEMENTS OF COMPREHENSIVE INCOME (LOSS)
(Dollars in thousands)
| | | | | | | | | | | | | | | | | |
| Year Ended December 31, |
| 2024 | | 2023 | | 2022 |
| Net income (loss) | $ | 116,729 | | | $ | 112,872 | | | $ | (15,842) | |
| | | | | |
| Other comprehensive (loss) income, net of tax | | | | | |
| Currency translation adjustments | (77,496) | | | 16,725 | | | (82,368) | |
| Defined benefit retirement plans | | | | | |
| Net gain (loss) arising during the period, other | 105 | | | (5,792) | | | 8,177 | |
| Amortization of actuarial loss (gain) | 301 | | | (385) | | | 628 | |
| Amortization of prior service cost (gain) | 19 | | | 34 | | | (228) | |
| Current period change in fair value of derivatives | (159) | | | 1,407 | | | 1,372 | |
| Unrealized (loss) gain on available-for-sale securities | (46) | | | 1,817 | | | (1,881) | |
| Other comprehensive (loss) income | (77,276) | | | 13,806 | | | (74,300) | |
| | | | | |
| Comprehensive income (loss) | 39,453 | | | 126,678 | | | (90,142) | |
| Less: Comprehensive income attributable to noncontrolling interest | (13) | | | (106) | | | (39) | |
| Comprehensive income (loss) attributable to Quaker Chemical Corporation | $ | 39,440 | | | $ | 126,572 | | | $ | (90,181) | |
The accompanying notes are an integral part of these consolidated financial statements.
QUAKER CHEMICAL CORPORATION
CONSOLIDATED BALANCE SHEETS
(Dollars in thousands, except par value)
| | | | | | | | | | | |
| December 31, |
| 2024 | | 2023 |
| ASSETS | | | |
| Current assets | | | |
| Cash and cash equivalents | $ | 188,880 | | | $ | 194,527 | |
| Accounts receivable, net | 400,126 | | | 444,950 | |
| Inventories | 227,472 | | | 233,857 | |
| Prepaid expenses and other current assets | 59,939 | | | 54,555 | |
| Total current assets | 876,417 | | | 927,889 | |
| Property, plant and equipment, net | 229,532 | | | 207,811 | |
| Right-of-use lease assets | 34,120 | | | 38,614 | |
| Goodwill | 518,894 | | | 512,518 | |
| Other intangible assets, net | 827,098 | | | 896,721 | |
| Investments in associated companies | 98,012 | | | 101,151 | |
| Deferred tax assets | 9,216 | | | 10,737 | |
| Other non-current assets | 17,360 | | | 18,770 | |
| Total assets | $ | 2,610,649 | | | $ | 2,714,211 | |
| | | |
| LIABILITIES AND EQUITY | | | |
| Current liabilities | | | |
| Short-term borrowings and current portion of long-term debt | $ | 37,554 | | | $ | 23,444 | |
| Accounts payable | 198,137 | | | 184,813 | |
| Dividends payable | 8,572 | | | 8,186 | |
| Accrued compensation | 50,212 | | | 55,194 | |
| Accrued restructuring | 2,297 | | | 3,350 | |
| Accrued pension and postretirement benefits | 2,328 | | | 2,208 | |
| Other accrued liabilities | 80,668 | | | 90,315 | |
| Total current liabilities | 379,768 | | | 367,510 | |
| Long-term debt | 669,614 | | | 730,623 | |
| Long-term lease liabilities | 20,028 | | | 22,937 | |
| Deferred tax liabilities | 138,828 | | | 146,957 | |
| Non-current accrued pension and postretirement benefits | 23,783 | | | 29,457 | |
| Other non-current liabilities | 24,445 | | | 31,805 | |
| Total liabilities | 1,256,466 | | | 1,329,289 | |
| Commitments and contingencies (Note 25) | | | |
| Equity | | | |
| Common stock, $1 par value; authorized 30,000,000 shares; issued and outstanding 2024 – 17,673,607 shares; 2023 – 17,991,988 shares | 17,674 | | | 17,992 | |
| Capital in excess of par value | 903,781 | | | 940,101 | |
| Retained earnings | 633,731 | | | 550,641 | |
| Accumulated other comprehensive loss | (201,619) | | | (124,415) | |
| Total Quaker shareholders’ equity | 1,353,567 | | | 1,384,319 | |
| Noncontrolling interest | 616 | | | 603 | |
| Total equity | 1,354,183 | | | 1,384,922 | |
| Total liabilities and equity | $ | 2,610,649 | | | $ | 2,714,211 | |
The accompanying notes are an integral part of these consolidated financial statements.
QUAKER CHEMICAL CORPORATION
CONSOLIDATED STATEMENTS OF CASH FLOWS
(Dollars in thousands)
| | | | | | | | | | | | | | | | | |
| Year Ended December 31, |
| 2024 | | 2023 | | 2022 |
| Cash flows from operating activities | | | | | |
| Net income (loss) | $ | 116,729 | | | $ | 112,872 | | | $ | (15,842) | |
| Adjustments to reconcile net income (loss) to net cash provided by operating activities: | | | | | |
| Amortization of debt issuance costs | 1,413 | | | 1,413 | | | 2,942 | |
| Depreciation and amortization | 84,119 | | | 81,987 | | | 80,467 | |
| Equity in undistributed earnings of associated companies, net of dividends | (2,733) | | | (11,149) | | | 1,005 | |
| | | | | |
| Deferred income taxes | (10,033) | | | (11,442) | | | (10,552) | |
| Uncertain tax positions (non-deferred portion) | (2,372) | | | (644) | | | (6,398) | |
| | | | | |
| Deferred compensation and other, net | 4,867 | | | 5,711 | | | 2,613 | |
| Share-based compensation | 14,991 | | | 14,605 | | | 11,666 | |
| Loss on extinguishment of debt | — | | | — | | | 5,246 | |
| Gain on disposal of property, plant, equipment and other assets | (810) | | | (1,307) | | | (168) | |
| | | | | |
| Impairment charges | — | | | — | | | 93,000 | |
| | | | | |
| | | | | |
| Restructuring and related charges | 6,530 | | | 7,588 | | | 3,163 | |
| Pension and other postretirement benefits | (4,460) | | | (2,079) | | | (7,964) | |
| Increase (decrease) in cash from changes in current assets and current liabilities, net of acquisitions: | | | | | |
| Accounts receivable | 24,975 | | | 32,169 | | | (59,112) | |
| Inventories | (3,244) | | | 49,751 | | | (29,858) | |
| Prepaid expenses and other current assets | (6,242) | | | (21) | | | 3,705 | |
| Accrued restructuring | (7,595) | | | (9,786) | | | (1,532) | |
| Accounts payable and accrued liabilities | (8,637) | | | 5,937 | | | (27,899) | |
| Estimated taxes on income (loss) | (2,920) | | | 3,415 | | | (2,688) | |
| Net cash provided by operating activities | 204,578 | | | 279,020 | | | 41,794 | |
| Cash flows from investing activities | | | | | |
| Investments in property, plant and equipment | (41,794) | | | (38,800) | | | (28,539) | |
| Payments related to acquisitions, net of cash acquired | (39,302) | | | — | | | (13,115) | |
| Proceeds from disposition of assets | 4,676 | | | 11,179 | | | 1,463 | |
| | | | | |
| Net cash used in investing activities | (76,420) | | | (27,621) | | | (40,191) | |
| Cash flows from financing activities | | | | | |
| Payments of long-term debt | (57,221) | | | (38,932) | | | (673,203) | |
| | | | | |
| Proceeds from long-term debt | — | | | — | | | 750,000 | |
| Borrowings (payments) on revolving credit facilities, net | 17,916 | | | (164,769) | | | (16,281) | |
| Borrowings (payments) on other debt, net | 1,441 | | | (506) | | | (1,629) | |
| | | | | |
| Financing-related debt issuance costs | — | | | — | | | (3,734) | |
| Dividends paid | (33,170) | | | (31,650) | | | (30,103) | |
| Shares purchased under share repurchase program | (49,247) | | | — | | | — | |
| Other stock related activity | (2,383) | | | (2,749) | | | (378) | |
| | | | | |
| | | | | |
| Net cash (used in) provided by financing activities | (122,664) | | | (238,606) | | | 24,672 | |
| Effect of foreign exchange rate changes on cash | (11,141) | | | 771 | | | (10,488) | |
| Net (decrease) increase in cash and cash equivalents | (5,647) | | | 13,564 | | | 15,787 | |
| Cash and cash equivalents at the beginning of the period | 194,527 | | | 180,963 | | | 165,176 | |
| Cash and cash equivalents at the end of the period | $ | 188,880 | | | $ | 194,527 | | | $ | 180,963 | |
| Supplemental cash flow disclosures: | | | | | |
| Cash paid during the year for: | | | | | |
| Income taxes, net of refunds | $ | 60,581 | | | $ | 57,410 | | | $ | 35,327 | |
| Interest | 44,536 | | | 54,892 | | | 29,074 | |
| Non-cash activities: | | | | | |
| Change in accrued purchases of property, plant and equipment, net | $ | 11,282 | | | $ | (746) | | | $ | 278 | |
The accompanying notes are an integral part of these consolidated financial statements.
QUAKER CHEMICAL CORPORATION
CONSOLIDATED STATEMENTS OF CHANGES IN EQUITY
(Dollars in thousands, except per share amounts)
| | | | | | | | | | | | | | | | | | | | | | | | | | | | | | | | | | | |
| Common
stock | | Capital in
excess of
par value | | Retained
earnings | | Accumulated
other
comprehensive
loss | | Noncontrolling
interest | | Total |
| | | | | | | | | | | |
| | | | | | | | | | | |
| Balance as of December 31, 2021 | $ | 17,897 | | | $ | 917,053 | | | $ | 516,334 | | | $ | (63,990) | | | $ | 628 | | | $ | 1,387,922 | |
| Net (loss) income | — | | | — | | | (15,931) | | | — | | | 89 | | | (15,842) | |
| Amounts reported in other comprehensive (loss) income | — | | | — | | | — | | | (74,250) | | | (50) | | | (74,300) | |
| Dividends declared ($1.70 per share) | — | | | — | | | (30,483) | | | — | | | — | | | (30,483) | |
| | | | | | | | | | | |
| | | | | | | | | | | |
| Share issuance and equity-based compensation plans, net | 53 | | | 11,235 | | | — | | | — | | | — | | | 11,288 | |
| Balance as of December 31, 2022 | 17,950 | | | 928,288 | | | 469,920 | | | (138,240) | | | 667 | | | 1,278,585 | |
| Net income | — | | | — | | | 112,748 | | | — | | | 124 | | | 112,872 | |
| Amounts reported in other comprehensive income (loss) | — | | | — | | | — | | | 13,825 | | | (19) | | | 13,806 | |
| Dividends declared ($1.78 per share) | — | | | — | | | (32,027) | | | — | | | — | | | (32,027) | |
| Distributions to noncontrolling interest affiliate shareholders | — | | | — | | | — | | | — | | | (169) | | | (169) | |
| Share issuance and equity-based compensation plans, net | 42 | | | 11,813 | | | — | | | — | | | — | | | 11,855 | |
| Balance as of December 31, 2023 | 17,992 | | | 940,101 | | | 550,641 | | | (124,415) | | | 603 | | | 1,384,922 | |
| Net income | — | | | — | | | 116,644 | | | — | | | 85 | | | 116,729 | |
| Amounts reported in other comprehensive (loss) income | — | | | — | | | — | | | (77,204) | | | (72) | | | (77,276) | |
| Dividends declared ($1.88 per share) | — | | | — | | | (33,554) | | | — | | | — | | | (33,554) | |
| Shares purchased under share repurchase program, net of excise taxes | (313) | | | (49,346) | | | — | | | — | | | — | | | (49,659) | |
| | | | | | | | | | | |
| Share issuance and equity-based compensation plans, net | (5) | | | 13,026 | | | — | | | — | | | — | | | 13,021 | |
| Balance as of December 31, 2024 | $ | 17,674 | | | $ | 903,781 | | | $ | 633,731 | | | $ | (201,619) | | | $ | 616 | | | $ | 1,354,183 | |
The accompanying notes are an integral part of these consolidated financial statements.
QUAKER CHEMICAL CORPORATION
NOTES TO CONSOLIDATED FINANCIAL STATEMENTS
(Dollars in thousands, except per share amounts, unless otherwise stated)
QUAKER CHEMICAL CORPORATION
NOTES TO CONSOLIDATED FINANCIAL STATEMENTS
(Dollars in thousands, except per share amounts, unless otherwise stated)
Note 1 – Basis of Presentation and Significant Accounting Policies
As used in these Notes to Consolidated Financial Statements, the terms “Quaker,” “Quaker Houghton,” the “Company,” “we,” and “our” refer to Quaker Chemical Corporation (doing business as Quaker Houghton), its subsidiaries, and associated companies, unless the context otherwise requires.
Basis of presentation: The accompanying consolidated financial statements were prepared in accordance with generally accepted accounting principles in the United States (“U.S. GAAP”) and include the accounts of Quaker Houghton and its controlled subsidiaries.
Principles of consolidation: We consolidate all entities we control, which generally applies to entities in which we own a majority of the voting interests. Intercompany transactions and balances are eliminated in consolidation. For consolidated subsidiaries in which the Company’s ownership is less than 100%, the outside shareholders’ interests are reflected as non-controlling interests within the consolidated financial statements. The Company is not the primary beneficiary of any variable interest entities (“VIEs”) and therefore the Company’s consolidated financial statements do not include the accounts of any VIEs.
Equity method investments: The Company applies the equity method of accounting to investments in which the Company has significant influence but does not control the operating and financial decisions of the investee. This generally applies when the Company’s ownership interest in common stock of the investee is between 20% and 50%. Such investments are presented in “Investments in associated companies” on the Consolidated Balance Sheets. We initially record our investment at cost and subsequently adjust the investment to recognize our share of net earnings and losses and distributions received. The Company’s share of net income or losses in these investments in associated companies is included in the Consolidated Statements of Operations. The Company reviews these investments for impairments when events or changes in circumstances indicate that the carrying amount of the investment may be other-than-temporarily impaired. See Note 16, Investments in Associated Companies, for additional information.
Accounting estimates: The preparation of financial statements in conformity with U.S. GAAP requires management to make estimates and assumptions that affect the amounts reported in the consolidated financial statements and the accompanying notes. Actual results could differ from such estimates.
Foreign currency: Since we do business in many foreign countries, fluctuations in currency exchange rates affect our financial position and result of operations. In most of our non-U.S. operations, the local currency is considered the functional currency. The assets and liabilities of non-U.S. subsidiaries and associated companies are translated into U.S. dollars at the respective rates of exchange prevailing at the end of the year. Income and expense accounts are translated at average exchange rates prevailing during the year. Translation adjustments resulting from this process are recorded directly in equity as accumulated other comprehensive income (“AOCI”). Some transactions are made in currencies different from an entity’s functional currency. Gains and losses from remeasurement of these foreign currency transactions, and the impact of related hedges, are generally reflected in “Other income (expense), net” in the consolidated income statements as they occur. See Note 9, Other Income (Expense), Net, and our policy on accounting for hyperinflation below, for additional information.
Hyper-inflationary accounting: Economies that have a cumulative three-year rate of inflation exceeding 100% are considered hyper-inflationary. A legal entity that operates within an economy deemed to be hyper-inflationary is required to remeasure its monetary assets and liabilities to the applicable published exchange rates and record the associated gains or losses resulting from the remeasurement directly to the Consolidated Statements of Operations.
Argentina’s and Türkiye’s economies were considered hyper-inflationary effective July 1, 2018 and April 1, 2022, respectively. As of, and for the year ended December 31, 2024, the Company's Argentine and Turkish subsidiaries represented a combined 1% and 2% of the Company’s consolidated total assets and net sales, respectively. For the years ended December 31, 2024, 2023 and 2022, the Company recorded $0.8 million, $7.8 million, and $1.6 million, respectively, of remeasurement losses associated with the applicable currency conversions related to Argentina and Türkiye. These losses were recorded within foreign exchange losses, net, which is a component of Other income (expense), net, in the Company’s Consolidated Statements of Operations.
Segments: The Company’s operating segments, which are consistent with its reportable segments, reflect the structure of the Company’s internal organization, the method by which the Company’s resources are allocated and the manner by which the Chief Operating Decision Maker assesses the Company’s performance.
QUAKER CHEMICAL CORPORATION
NOTES TO CONSOLIDATED FINANCIAL STATEMENTS - Continued
(Dollars in thousands, except per share amounts, unless otherwise stated)
During the first quarter of 2023, the Company reorganized its executive management team to align with its new business structure. The Company’s new structure includes three reportable segments: (i) Americas; (ii) Europe, Middle East and Africa (“EMEA”); and (iii) Asia/Pacific. Prior to the Company’s reorganization, the Company’s historical reportable segments were: (i) Americas; (ii) EMEA; (iii) Asia/Pacific; and (iv) Global Specialty Businesses. Prior period information has been recast to align with the Company’s business structure as of January 1, 2023, including reportable segments and customer industry disaggregation. As a result of the Company’s new organizational structure effective January 1, 2023, the Company reallocated goodwill previously held by the former Global Specialty Businesses segment to the remaining business segments as of January 1, 2023. However, the Company did not recast the carrying amount of goodwill for the year ended December 31, 2022. See Notes 4, 5, and 15 for additional information.
Reclassifications: Certain information has been reclassified to conform to the current year presentation.
Business combinations: The Company accounts for business combinations under the acquisition method of accounting. This method requires the recording of acquired assets, including separately identifiable intangible assets, and assumed liabilities at their respective acquisition date estimated fair values. Any excess of the purchase price over the estimated fair value of the identifiable net assets acquired is recorded as goodwill. The determination of the estimated fair value of assets acquired and liabilities assumed requires significant estimates and assumptions. Based on the assessment of additional information during the measurement period, which may be up to one year from the acquisition date, the Company may record adjustments to the estimated fair value of assets acquired and liabilities assumed. See Note 2, Business Combinations, for additional information.
Revenue recognition: The Company recognizes revenue in an amount that reflects the consideration to which the Company expects to be entitled in exchange for goods or services transferred to its customers. To do this, the Company applies a five-step model, which requires the Company to: (i) identify the contract with a customer; (ii) identify the performance obligations in the contract; (iii) determine the transaction price; (iv) allocate the transaction price to the performance obligations in the contract; and (v) recognize revenue when, or as, the Company satisfies the performance obligation.
The Company identifies a contract with a customer when a sales agreement indicates approval and commitment of the parties; identifies the rights of the parties; identifies the payment terms; has commercial substance; and it is probable that the Company will collect the consideration to which it will be entitled in exchange for the goods or services that will be transferred to the customer.
The Company identifies a performance obligation in a contract for each promised good or service that is separately identifiable from other obligations in the contract and for which the customer can benefit from the good or service either on its own or together with other resources that are readily available to the customer. The Company determines the transaction price as the amount of consideration it expects to be entitled to in exchange for fulfilling the performance obligations, including the effects of any variable consideration, significant financing elements, amounts payable to the customer or noncash consideration. For any contracts that have more than one performance obligation, the Company allocates the transaction price to each performance obligation in an amount that depicts the amount of consideration to which the Company expects to be entitled in exchange for satisfying each performance obligation.
In accordance with the last step of the five-step model, the Company recognizes revenue when, or as, it satisfies the performance obligation in a contract by transferring control of a promised good or providing the service to the customer. The Company typically satisfies its performance obligations and recognizes revenue at a point in time for product sales, generally when products are shipped or delivered to the customer, depending on the terms underlying each arrangement. In circumstances where the Company’s products are on consignment, revenue is generally recognized upon usage or consumption by the customer. For any FluidcareTM or other services provided by the Company to the customer, the Company typically satisfies its performance obligations and recognizes revenue over time, as the promised services are performed. The Company uses input methods to recognize revenue over time related to these services, including labor costs and time incurred. The Company believes that these input methods represent the most indicative measure of the FluidcareTM or other service work performed by the Company.
The Company does not have standard payment terms for all customers; however, the Company’s general payment terms require customers to pay for products or services once the performance obligation is satisfied. The Company does not have significant financing arrangements with its customers.
In addition, the Company expenses costs to obtain a contract as incurred when the expected period of benefit, and therefore the amortization period, is one year or less. In addition, the Company excludes from the measurement of the transaction price all taxes assessed by a governmental authority that are both imposed on and concurrent with a specific revenue-producing transaction and collected by the entity from a customer, including sales, use, value added, excise and various other taxes. Lastly, the Company has elected to account for shipping and handling costs incurred after the customer has obtained control of a good as a fulfillment cost, rather than an additional promised service. The Company does not have significant amounts of variable consideration in its contracts with customers.
QUAKER CHEMICAL CORPORATION
NOTES TO CONSOLIDATED FINANCIAL STATEMENTS - Continued
(Dollars in thousands, except per share amounts, unless otherwise stated)
The Company records license fees received from third-parties in Other income (expense), net, in its Consolidated Statements of Operations, which generally include sales-based royalties in exchange for the license of intellectual property. These license fees are recognized in accordance with their agreed-upon terms and when performance obligations are satisfied, which is generally when the third party has a subsequent sale.
The Company recognizes a contract asset or receivable on its Consolidated Balance Sheet when the Company performs a service or transfers a good in advance of receiving consideration. A receivable is the Company’s right to consideration that is unconditional and only the passage of time is required before payment of that consideration is due. A contract asset is the Company’s right to consideration in exchange for goods or services that the Company has transferred to a customer.
A contract liability is recognized when the Company receives consideration, or if it has the unconditional right to receive consideration, in advance of performance. A contract liability is the Company’s obligation to transfer goods or services to a customer for which the Company has received consideration, or a specified amount of consideration is due, from the customer.
See Note 5, Net Sales and Revenue Recognition, for additional information.
Right-of-use lease assets and lease liabilities: The Company determines if an arrangement is a lease at its inception. This determination generally depends on whether the arrangement conveys the right to control the use of an identified asset for a period of time in exchange for consideration. Control of an underlying asset is conveyed if the Company obtains the right to direct the use of the asset, and obtains substantially all of the economic benefits from its use. Lease expense for variable leases and short-term leases is recognized when the obligation is incurred.
The lease term for all of the Company’s leases includes the non-cancellable period of the lease, adjusted for any renewal and termination options that the Company is reasonably certain it will exercise. Operating leases are included in right-of-use lease assets, other accrued liabilities and long-term lease liabilities on the Consolidated Balance Sheet. Right-of-use lease assets and liabilities are recognized on the lease commencement date based on the present value of lease payments over the respective lease term. Operating lease expense is recognized on a straight-line basis over the lease term.
The Company uses the stated borrowing rate for a lease when readily determinable. When a stated borrowing rate is not available in a lease agreement, the Company uses its incremental borrowing rate at the lease commencement date to determine the present value of its lease payments. In determining the incremental borrowing rate, the Company considers information including fully secured borrowing rates readily available to the Company and its subsidiaries. The Company includes finance leases in property, plant and equipment (“PP&E”), current portion of long-term debt and long-term debt on the Consolidated Balance Sheet. See Note 6, Leases, for additional information.
Restructuring activities: Restructuring programs consist of employee severance, rationalization of manufacturing or other facilities and other related items. To account for such programs, the Company recognizes a liability for the cost associated with an exit or disposal activity, when the liability is incurred, is estimable, and payment is probable. See Note 7, Restructuring and Related Activities, for additional information.
Share-based compensation: The Company has long-term incentive programs (“LTIP”) for key employees which provides for the granting of stock options, restricted stock units (“RSU”), restricted stock awards (“RSAs”), and performance-based stock awards (“PSUs”). Share-based awards may also be granted under other equity compensation plans. Share-based compensation cost for awards under LTIP and equity compensation plans is measured at the grant date based on the fair value and is recognized as expense over the requisite service period, which is the vesting period.
The fair value of stock options granted is determined using the Black-Scholes option valuation model on the grant date. The fair value of time-based RSAs, time-based RSUs, and performance-based PSUs, for which the performance measure is return on investment capital (“ROIC”), is based on the trading price of the Company’s common stock on the date of grant. The fair value of market-based PSUs, for which the performance measure is total shareholder return (“TSR”), is determined using a Monte Carlo simulation model.
Prior to 2023, the Company elected to assume an estimated forfeiture rate of 13% based on historical experience. Beginning in 2023, the Company elected to account for forfeitures on new awards as they occur.
See Note 8, Equity, for additional information.
Research and development costs: Research and development costs are expensed as incurred and are included in selling, general and administrative expenses (“SG&A”). Research and development expenses were $57.3 million, $50.3 million and $46.0 million for the years ended December 31, 2024, 2023 and 2022, respectively.
QUAKER CHEMICAL CORPORATION
NOTES TO CONSOLIDATED FINANCIAL STATEMENTS - Continued
(Dollars in thousands, except per share amounts, unless otherwise stated)
Income taxes and uncertain tax positions: The provision for income taxes is determined using the asset and liability approach of accounting for income taxes. Under this approach, deferred taxes represent the future tax consequences expected to occur when the reported amounts of assets and liabilities are recovered or paid. The provision for income taxes represents income taxes paid or payable for the current year and the change in deferred taxes during the year. Deferred taxes result from differences between the financial and tax bases of the Company’s assets and liabilities and are adjusted for changes in tax rates and tax laws when changes are enacted. Valuation allowances are recorded to reduce deferred tax assets when it is more likely than not that a tax benefit will not be realized. The Company accounts for uncertainty in income taxes by applying the recognition threshold and measurement attributes for financial statement recognition and measurement of tax positions taken or expected to be taken on a tax return. The Company determines whether the benefits of tax positions are probable or more likely than not sustained upon audit based upon the technical merits of the tax position. For tax positions that are determined to be more likely than not sustained upon audit, the Company recognizes the largest amount of benefit that is greater than 50% likely of being realized upon ultimate settlement in the financial statements. For tax positions that are not determined to be more likely than not sustained upon audit, the Company does not recognize any portion of the benefit in the financial statements. Additionally, the Company monitors and adjusts for derecognition, classification, and penalties and interest in interim periods, with appropriate disclosure and transition thereto. Also, the amount of interest expense and income related to uncertain tax positions is computed by applying the applicable statutory rate of interest to the difference between the tax position recognized, including timing differences, and the amount previously taken or expected to be taken in a tax return. The Company recognizes interest and/or penalties related to income tax matters in income tax expense. Finally, when applicable, the Company nets its liability for unrecognized tax benefits against deferred tax assets related to net operating losses or other tax credit carryforwards that would apply if the uncertain tax position were settled for the presumed amount at the balance sheet date.
Pursuant to the Tax Cuts and Jobs Act (“U.S. Tax Reform”), specifically the one-time tax on deemed repatriation (the “Transition Tax”), the Company has provided for U.S. income tax on its undistributed earnings of non-U.S. subsidiaries. However, the Company is subject to and will incur other taxes, such as withholding taxes and dividend distribution taxes, if these undistributed earnings were ultimately remitted to the U.S. The Company currently intends to reinvest its future undistributed earnings of non-U.S. subsidiaries to support working capital needs and certain other growth initiatives of those subsidiaries. However, in certain cases the Company has and may in the future change its indefinite reinvestment assertion for any or all of these undistributed earnings. In this case, the Company would estimate and record a tax liability and corresponding tax expense for the amount of non-U.S. income taxes it would incur to ultimately remit these earnings to the U.S. See Note 10, Income Taxes, for additional information.
Earnings per share: In the Company’s earnings per share calculation, non-vested stock awards with rights to non-forfeitable dividends are included as part of the basic weighted average share calculation under the two-class method. See Note 11, Earnings per Share, for additional information.
Comprehensive income (loss): The Company presents Other comprehensive (loss) income in its Statements of Comprehensive Income (Loss). The Company discloses significant amounts reclassified from each component of AOCI, the related tax amounts and the income statement line items affected by such reclassifications. See Note 22, Accumulated Other Comprehensive Loss, for additional information.
Cash and cash equivalents: The Company invests temporary and excess funds in money market securities and financial instruments having maturities within 90 days. The Company considers all highly liquid investments with original maturities of three months or less to be cash equivalents. The Company has not experienced losses from the aforementioned investments.
Accounts receivable and allowance for credit losses: Trade accounts receivable subject the Company to credit risk. Trade accounts receivable are recorded at the invoiced amount and generally do not bear interest. The Company recognizes an allowance for credit losses, which represents the portion of the receivable that the Company does not expect to collect over its contractual life, considering past events and reasonable and supportable forecasts of future economic conditions. The Company’s allowance for credit losses on its trade accounts receivable is based on specific collectability facts and circumstances, the aging of outstanding receivables, and the associated collection risk the Company estimates for certain past due aging categories, and also, the general risk to all outstanding accounts receivable based on historical amounts determined to be uncollectible. The Company does not have any off-balance-sheet credit exposure related to its customers. See Note 12, Accounts Receivable and Allowance for Credit Losses, for additional information.
Inventories: Inventories are valued at the lower of cost or net realizable value, and are valued using the first-in, first-out method. See Note 13, Inventories, for additional information.
QUAKER CHEMICAL CORPORATION
NOTES TO CONSOLIDATED FINANCIAL STATEMENTS - Continued
(Dollars in thousands, except per share amounts, unless otherwise stated)
Long-lived assets: PP&E is stated at gross cost, less accumulated depreciation. Depreciation is computed using the straight-line method on an individual asset basis over the following estimated useful lives: buildings and improvements, 10 to 33 years (for finance leases, the remaining term of the lease); and machinery and equipment, 4 to 10 years (for financing leases, the remaining term of the lease). The carrying values of long-lived assets are evaluated whenever changes in circumstances or current events indicate the carrying amount of such assets may not be recoverable. An estimate of undiscounted cash flows produced by the asset, or the appropriate group of assets, is compared with the carrying value to determine whether an impairment exists. If necessary, the Company recognizes an impairment loss for the difference between the carrying amount of the assets and their estimated fair value. Fair value is based on current and anticipated future cash flows. Upon sale or other disposition of long-lived assets, the applicable asset cost and accumulated depreciation are removed from the accounts and the net amount, less proceeds from disposals, is recorded in the Consolidated Statements of Operations. Expenditures for improvements that increase the estimated useful life or capacity of the assets are capitalized, whereas expenditures for repairs and maintenance are expensed when incurred. See Note 14, Property, Plant, and Equipment, for additional information.
Capitalized software: The Company capitalizes certain costs in connection with developing or obtaining software for internal use. These costs are amortized over the expected useful life of the software- generally 3 to 5 years once the assets are ready for their intended use. In connection with implementations and upgrades to the Company’s global transaction, consolidation and other related systems, approximately $2.9 million and $4.5 million of net costs were capitalized in PP&E on the Company’s Consolidated Balance Sheets as of December 31, 2024 and 2023, respectively.
The Company capitalizes costs incurred with the implementation of a cloud computing arrangement that is a service contract, consistent with its policy for software for internal use. The capitalized costs are reflected in "Other non-current assets" on its Consolidated Balance Sheets and expensed over the term of the related hosting arrangement.
Goodwill and other intangible assets: The Company records goodwill, definite-lived intangible assets and indefinite-lived intangible assets at fair value at the date of acquisition. Goodwill and indefinite-lived intangible assets are not amortized but tested for impairment at least annually. These tests will be performed more frequently if triggering events indicate potential impairment. In completing a quantitative goodwill impairment test, the Company compares a reporting unit’s fair value, primarily based on future discounted cash flows, to its carrying value in order to determine if an impairment charge is warranted.
Definite-lived intangible assets are amortized on a straight-line basis over their estimated useful lives, generally for periods ranging from 3 to 24 years. The Company continually evaluates the reasonableness of the useful lives of these assets, consistent with the discussion of long-lived assets, above.
See Note 15, Goodwill and Other Intangible Assets, and Note 23, Fair Value Measures, for additional information.
Fair value measurements: Fair value is defined as an exit price, or the price that would be received to sell an asset or paid to transfer a liability in an orderly transaction between market participants at the measurement date. The Company utilizes a fair value hierarchy that prioritizes the inputs to valuation techniques used to measure fair value into three broad levels. See Notes 20, 23 and 24 for additional information. The following briefly describes those three levels:
•Level 1: Observable inputs such as quoted prices (unadjusted) in active markets for identical assets or liabilities.
•Level 2: Inputs other than quoted prices that are observable for the asset or liability, either directly or indirectly, for sustainability the full term of the asset or liability. These include quoted prices for similar assets or liabilities in active markets and quoted prices for identical or similar assets or liabilities in markets that are not active.
•Level 3: Unobservable inputs for the asset or liability that reflect the reporting entity's own assumptions about the assumptions that market participants would use in pricing the asset or liability.
Pension and other postretirement benefits: The Company maintains various noncontributory retirement plans, covering a portion of its employees in the U.S. and certain other countries, including the Netherlands, the United Kingdom (“U.K.”), Mexico, Sweden, Germany and France. The plans of the remaining non-U.S. subsidiaries are, for the most part, either fully insured or integrated with the local governments’ plans. The Company recognizes the funded status of defined benefit pension and other postretirement plans on its Consolidated Balance Sheets and also, recognizes as a component of AOCI, net of tax, the gains or losses and prior service costs that arise during the period but are not recognized as components of net periodic benefit cost. In addition, the Company recognizes a settlement charge in its Consolidated Statements of Operations when certain events occur, including plan termination or the settlement of certain plan liabilities. A settlement charge represents the immediate recognition into expense of a portion of the unrecognized loss within AOCI on the balance sheet in proportion to the share of the projected benefit obligation that was settled. The measurement date for the Company’s postretirement benefits plan is December 31.
QUAKER CHEMICAL CORPORATION
NOTES TO CONSOLIDATED FINANCIAL STATEMENTS - Continued
(Dollars in thousands, except per share amounts, unless otherwise stated)
The Company’s global pension investment policies are designed to ensure that pension assets are invested in a manner consistent with meeting the future benefit obligations of the pension plans and maintaining compliance with various laws and regulations including the Employee Retirement Income Security Act of 1974. The Company establishes strategic asset allocation percentage targets and benchmarks for significant asset classes with the aim of achieving a prudent balance between return and risk. The Company’s investment horizon is generally long term, and, accordingly, the target asset allocations encompass a long-term perspective of capital markets, expected risk and return and perceived future economic conditions while also considering the profile of plan liabilities. To the extent feasible, the short-term investment portfolio is managed to match the short-term obligations, the intermediate portfolio duration is matched to reduce the risk of volatility in intermediate plan distributions, and the total return portfolio is managed to maximize the long-term real growth of plan assets. The critical investment principles of diversification, assessment of risk and targeting the optimal expected returns for given levels of risk are applied. The Company’s investment guidelines prohibit the use of securities such as letter stock and other unregistered securities, commodities or commodity contracts, short sales, margin transactions, private placements (unless specifically addressed by addendum), or any derivatives, options or futures for the purpose of portfolio leveraging.
The target asset allocation is reviewed periodically and is determined based on a long-term projection of capital market outcomes, inflation rates, fixed income yields, returns, volatilities and correlation relationships. The interaction between plan assets and benefit obligations is periodically studied to assist in establishing such strategic asset allocation targets. Asset performance is monitored with an overall expectation that plan assets will meet or exceed benchmark performance over rolling five-year periods. The Company’s pension committee, as authorized by the Company’s Board, has discretion to manage the assets within established asset allocation ranges approved by senior management of the Company. See Note 20, Pension and Other Postretirement Benefits, for additional information.
Derivatives: The Company uses interest rate swap agreements to manage risk, including exposure to variability in interest payments associated with its variable rate debt. Interest rate swaps are designated as cash flow hedges and, as such, the contracts are marked-to-market at each reporting date and any unrealized gains or losses are included in AOCI to the extent effective and reclassified to interest expense in the period during which the transaction affects earnings or it becomes probable that the forecasted transaction will not occur.
The Company uses foreign exchange forward contracts to economically hedge the impact of variability in exchange rates on certain assets and/or liabilities denominated in foreign currencies. Forward contracts are marked-to-market at each reporting date, with changes in the fair value of the underlying instruments, as well as gains and losses on the hedged foreign currency transactions, recognized in earnings in Other income (expense), net. The fair value of forward contracts are determined from sources independent of the Company, including the financial institutions which are party to the derivative instruments. See Note 24, Hedging Activities, for additional information.
Environmental liabilities and expenditures: Accruals for environmental matters are recorded when it is probable that a liability has been incurred and the amount of the liability can be reasonably estimable. If there is a range of estimated liability and no amount in that range is considered more probable than another, then the Company records the lowest amount in the range. Environmental costs and remediation costs are capitalized if the costs extend the life, increase the capacity or improve safety or efficiency of the property from the date acquired or constructed, and/or mitigate or prevent contamination in the future. See Note 25, Commitments and Contingencies, for additional information.
Note 2 – Business Combinations
Recent Acquisition Activity
Subsequent to the date of these financial statements, in February 2025, the Company acquired Chemical Solutions & Innovations (Pty) Ltd. (“CSI”), for approximately $3.9 million, subject to routine and customary post-closing adjustments. CSI is based in South Africa and is a supplier of metalworking fluids and lubricants to the South African market. CSI will be reported as part of the EMEA reportable segment. This acquisition strengthens Quaker Houghton’s position in South Africa and expands the Company’s presence in that region. As of the date of this Report, purchase accounting has not been finalized.
QUAKER CHEMICAL CORPORATION
NOTES TO CONSOLIDATED FINANCIAL STATEMENTS - Continued
(Dollars in thousands, except per share amounts, unless otherwise stated)
In July 2024, the Company acquired the Sutai Group (“Sutai”), for approximately $16.2 million, including an initial cash payment of $14.6 million, subject to routine and customary post-closing adjustments related to working capital and net indebtedness levels, as well as earn-out provisions with an initial estimated payout of $1.6 million related to the finalization of 2024 and 2025 earnings. Assets acquired included cash and cash equivalents of $5.5 million. The Company recorded incremental income of $0.4 million during the year ended December 31, 2024 relating to adjustments to these earnout provisions in Other income (expense), net on the Consolidated Statements of Operations. As of December 31, 2024, the Company has remaining earnout liabilities recorded on its Consolidated Balance Sheets of $1.2 million. Sutai is based in Japan and provides impregnation treatment products and services to the automotive and other industries. Sutai is reported as part of the Asia/Pacific reportable segment. This acquisition strengthens Quaker Houghton’s technology portfolio, enabling the Company to better support and optimize production processes for customers across the Japanese, Asia Pacific and global markets. The Company allocated $3.1 million of the purchase price to intangible assets and recognized $5.5 million of goodwill in the Asia/Pacific segment, none of which is deductible for tax purposes. The goodwill is primarily attributable to expected synergies. As of December 31, 2024, the allocation of the purchase price has not been finalized.
During February 2024, the Company acquired I.K.V. Tribologie IKVT and its subsidiaries (“IKV”) for $35.2 million, including an initial cash payment of $29.7 million, subject to routine and customary post-closing adjustments related to working capital and net indebtedness levels as well as earn-out provisions related to the finalization of 2023 earnings. Assets acquired included approximately $4.8 million of cash and cash equivalents. IKV, which is part of the Company’s EMEA segment, specializes in high-performance lubricants and greases, including original equipment manufacturer first-fill greases that are primarily used in the automotive, aerospace, electronics and other industrial markets. The acquisition of IKV strengthens the Company’s position in first-fill greases. The Company allocated $15.0 million of the purchase price to intangible assets, comprised of approximately $11.1 million of customer relationships to be amortized over 16 years; $3.2 million of product technologies to be amortized over 14 years; and $0.7 million of trademarks to be amortized over 5 years. In addition, the Company recognized $16.4 million of goodwill in the EMEA segment, none of which is deductible for tax purposes. The goodwill is primarily attributable to expected cost and growth synergies. In July 2024, the 2023 earnings were finalized and the Company made a payment of $5.5 million in connection with the post-closing adjustments and earn-out provision. As of December 31, 2024, the allocation of the purchase price has been finalized.
The results of operations of Sutai and IKV subsequent to the acquisition dates are included in the Consolidated Statements of Operations for the year ended December 31, 2024.
Previous Acquisitions
In October 2022, the Company acquired a business that provides pickling and rinsing products and services, which is part of the EMEA reportable segment, for approximately $3.5 million. The Company allocated $2.8 million of the purchase price to intangible assets, comprised of $2.3 million of customer relationships to be amortized over 10 years; $0.2 million of existing product technologies to be amortized over 10 years; and $0.3 million of licensed trademarks to be amortized over 10 years. In addition, the Company recorded $0.8 million of goodwill related to expected value not allocated to other acquired assets.
In January 2022, the Company acquired a business that provides pickling inhibitor technologies, drawing lubricants and stamping oil, and various other lubrication, rust preventative, and cleaner applications, which is part of the Americas reportable segment for approximately $8.0 million. The Company allocated $5.6 million of the purchase price to intangible assets, comprised of $5.1 million of customer relationships to be amortized over 14 years; and $0.5 million of existing product technologies to be amortized over 14 years. In addition, the Company recorded $1.8 million of goodwill related to expected value not allocated to other acquired assets, all of which is expected to be tax deductible in various jurisdictions in which the Company operates.
In January 2022, the Company acquired a business related to the sealing and impregnation of metal castings for the automotive sector, as well as impregnation resin and impregnation systems for metal parts, which is part of the EMEA reportable segment for approximately $1.4 million.
The results of operations of each acquisition completed prior to December 31, 2024 and subsequent to the respective acquisition dates are included in the Consolidated Statements of Operations. Applicable transaction expenses associated with these acquisitions are included in SG&A in the Company’s Consolidated Statements of Operations. Certain pro forma and other information is not presented, as the operations of the acquired assets and businesses are not considered material to the overall operations of the Company for the periods presented.
QUAKER CHEMICAL CORPORATION
NOTES TO CONSOLIDATED FINANCIAL STATEMENTS - Continued
(Dollars in thousands, except per share amounts, unless otherwise stated)
Note 3 – Recently Issued Accounting Standards
Recently Adopted Accounting Standards
The Company adopted Accounting Standards Update (“ASU”) 2023-07, Segment Reporting (Topic 280): Improvements to Reportable Segment Disclosures in this Report and will adopt the interim reportable segment disclosure requirements in the first quarter of 2025. This ASU expands reportable segment disclosure requirements, primarily through enhanced disclosures about significant segment expenses, defined as those expenses that are regularly provided to the Chief Operating Decision Maker (“CODM”) and included in the reported measure of segment profit or loss. The Company disclosed that the CODM, which is the Chief Executive Officer, assesses segment performance and makes decisions about allocating resources to its operating segments using segment operating earnings. Based on the Company’s assessment, the Company determined that product costs are significant segment expenses that are regularly provided to the CODM and included in segment operating earnings. The Company disclosed product costs and other operating expenses included in segment operating earnings by reportable segment. See Note 4, Business Segments, for additional information.
Recently Issued Accounting Standards Not Yet Adopted
The FASB issued ASU 2023-09, Income Taxes (Topic 740): Improvements to Income Tax Disclosures in December 2023. This ASU requires public business entities to disclose additional information in specified categories with respect to the reconciliation of the effective tax rate to the statutory rate (the “rate reconciliation”) for federal, state, and foreign income taxes, requiring greater detail about individual reconciling items in the rate reconciliation to the extent the impact of those items exceeds a specified threshold. The ASU also requires public business entities to disclose income taxes paid disaggregated by federal, state, and foreign taxes. Further disaggregation is also required in jurisdictions where income taxes paid exceeds a certain threshold. ASU 2023-09 is effective for fiscal years beginning after December 15, 2024. The Company is currently evaluating the disclosure requirements of this standard and the impact on its consolidated financial statements.
The FASB issued ASU 2024-03, Income Statement- Reporting Comprehensive Income- Expense Disaggregation Disclosures (Subtopic 220-40): Disaggregation of Income Statement Expenses in November 2024. This ASU requires public business entities (“PBEs”) to disclose, in interim and annual reporting periods, additional information about certain expenses in the notes to the financial statements, including disclosing the amounts of purchases of inventory, employee compensation, depreciation, and intangible asset amortization in each relevant expense caption. It also requires PBEs to disclose a qualitative description of the amounts remaining in relevant expense captions that are not separately disaggregated quantitatively and to disclose the total amount of selling expenses, and in the annual reporting periods, an entity’s definition of selling expenses. ASU 2024-03 is effective for fiscal years beginning after December 15, 2026, with early adoption permitted. The Company is currently evaluating the disclosure requirements of this standard and the impact on its consolidated financial statements.
Note 4 – Business Segments
The Company’s operating segments, which are consistent with its reportable segments, reflect the structure of the Company’s internal organization and the manner by which the Chief Operating Decision Maker, which is the Company’s Chief Executive Officer, allocates resources and assesses performance.
The Chief Operating Decision Maker evaluates performance for the Company’s operating segments based on segment operating earnings. Segment operating earnings for each of the Company’s reportable segments are comprised of the segment’s net sales less directly related product costs and other operating expenses. Operating expenses not directly attributable to the net sales of each respective segment, such as certain corporate and administrative costs, impairment charges, and restructuring charges, are not included in segment operating earnings. Other items not specifically identified with the Company’s reportable segments include Interest expense, net and Other income (expense), net.
The Chief Operating Decision Maker uses segment operating earnings to allocate resources for each segment predominantly in the annual budget and forecasting process. The Chief Operating Decision Maker considers budget-to-actual variances on a monthly basis for segment operating earnings when making decisions about allocating capital and personnel to the segments. The Chief Operating Decision Maker also uses segment operating earnings to assess the performance for each segment and in the compensation of certain employees.
QUAKER CHEMICAL CORPORATION
NOTES TO CONSOLIDATED FINANCIAL STATEMENTS - Continued
(Dollars in thousands, except per share amounts, unless otherwise stated)
The following table presents information about the performance of the Company’s reportable segments for the years ended December 31, 2024, 2023 and 2022.
| | | | | | | | | | | | | | | | | | | | | | | |
| Americas | | EMEA | | Asia/Pacific | | Totals |
| 2024 | | | | | | | |
| Net sales | $ | 882,131 | | | $ | 536,435 | | | $ | 421,120 | | | $ | 1,839,686 | |
| Significant segment expenses | | | | | | | |
Product costs (1) | 427,399 | | | 286,330 | | | 216,432 | | | 930,161 | |
Other operating expenses (2) | 210,775 | | | 150,679 | | | 81,950 | | | 443,404 | |
| Segment operating earnings | $ | 243,957 | | | $ | 99,426 | | | $ | 122,738 | | | $ | 466,121 | |
| 2023 | | | | | | | |
| Net sales | $ | 977,095 | | | $ | 571,347 | | | $ | 404,871 | | | $ | 1,953,313 | |
| Significant segment expenses | | | | | | | |
Product costs (1) | 497,690 | | | 318,279 | | | 209,422 | | | 1,025,391 | |
Other operating expenses (2) | 213,369 | | | 148,257 | | | 76,991 | | | 438,617 | |
| Segment operating earnings | $ | 266,036 | | | $ | 104,811 | | | $ | 118,458 | | | $ | 489,305 | |
| 2022 | | | | | | | |
| Net sales | $ | 946,516 | | | $ | 562,508 | | | $ | 434,561 | | | $ | 1,943,585 | |
| Significant segment expenses | | | | | | | |
Product costs (1) | 519,705 | | | 340,864 | | | 249,493 | | | 1,110,062 | |
Other operating expenses (2) | 203,182 | | | 145,280 | | | 79,226 | | | 427,688 | |
| Segment operating earnings | $ | 223,629 | | | $ | 76,364 | | | $ | 105,842 | | | $ | 405,835 | |
(1) Product costs include the costs of raw materials and are recorded in Cost of goods sold in the Company’s Consolidated Statements of Operations.
(2) Other operating expenses include overhead costs of operating the Company’s production facilities and providing chemical management services to customers and direct SG&A costs.
The following table presents a reconciliation of the Company’s segment operating earnings to income before taxes and equity in net income of associated companies in the Company’s Consolidated Statements of Operations for the years ended December 31, 2024, 2023 and 2022.
| | | | | | | | | | | | | | | | | |
| 2024 | | 2023 | | 2022 |
| Segment operating earnings | $ | 466,121 | | | $ | 489,305 | | | $ | 405,835 | |
| Restructuring and related charges, net | (6,530) | | | (7,588) | | | (3,163) | |
| Impairment charges | — | | | — | | | (93,000) | |
| Non-operating and administrative expenses | (203,956) | | | (206,398) | | | (196,620) | |
| Depreciation of corporate assets and amortization | (60,929) | | | (60,824) | | | (60,748) | |
| Operating income | $ | 194,706 | | | $ | 214,495 | | | $ | 52,304 | |
| Other income (expense), net | 1,354 | | | (10,672) | | | (12,607) | |
| Interest expense, net | (41,002) | | | (50,699) | | | (32,579) | |
| Income before taxes and equity in net income of associated companies | $ | 155,058 | | | $ | 153,124 | | | $ | 7,118 | |
The following tables present information regarding the Company’s reportable segments’ assets and long-lived assets, excluding goodwill, as of December 31, 2024, 2023 and 2022. Management does not use goodwill by segment to evaluate performance or allocate resources.
| | | | | | | | | | | | | | | | | | | | |
| Segment assets, excluding goodwill | | 2024 | | 2023 | | 2022 |
| Americas | | $ | 834,327 | | | $ | 903,319 | | | $ | 1,196,906 | |
| EMEA | | 650,045 | | | 703,338 | | | 583,861 | |
| Asia/Pacific | | 607,383 | | | 595,036 | | | 525,847 | |
| Total segment assets | | $ | 2,091,755 | | | $ | 2,201,693 | | | $ | 2,306,614 | |
QUAKER CHEMICAL CORPORATION
NOTES TO CONSOLIDATED FINANCIAL STATEMENTS - Continued
(Dollars in thousands, except per share amounts, unless otherwise stated)
| | | | | | | | | | | | | | | | | | | | |
| Segment long-lived assets | | 2024 | | 2023 | | 2022 |
| Americas | | $ | 164,450 | | | $ | 159,015 | | | $ | 150,294 | |
| EMEA | | 80,668 | | | 83,488 | | | 87,279 | |
| Asia/Pacific | | 133,906 | | | 123,846 | | | 120,761 | |
| Total segment long-lived assets | | $ | 379,024 | | | $ | 366,349 | | | $ | 358,334 | |
The following tables present information regarding the Company’s reportable segments’ capital expenditures and depreciation for identifiable assets for the years ended December 31, 2024, 2023 and 2022:
| | | | | | | | | | | | | | | | | | | | |
| Capital expenditures | | 2024 | | 2023 | | 2022 |
| Americas | | $ | 21,191 | | | $ | 25,650 | | | $ | 19,121 | |
| EMEA | | 11,989 | | | 7,561 | | | 6,065 | |
| Asia/Pacific | | 8,614 | | | 5,589 | | | 3,353 | |
| Total segment capital expenditures | | $ | 41,794 | | | $ | 38,800 | | | $ | 28,539 | |
| | | | | | | | | | | | | | | | | | | | |
| Depreciation | | 2024 | | 2023 | | 2022 |
| Americas | | $ | 13,646 | | | $ | 12,298 | | | $ | 11,723 | |
| EMEA | | 7,641 | | | 7,321 | | | 6,608 | |
| Asia/Pacific | | 4,608 | | | 4,214 | | | 4,593 | |
| Total segment depreciation | | $ | 25,895 | | | $ | 23,833 | | | $ | 22,924 | |
The following tables summarize net sales and long-lived assets attributable to U.S. and non-U.S. domiciled operations for the years ended December 31, 2024, 2023 and 2022:
| | | | | | | | | | | | | | | | | | | | |
| Net sales | | 2024 | | 2023 | | 2022 |
| United States | | $ | 637,755 | | | $ | 718,742 | | | $ | 696,885 | |
| China | | 230,622 | | | 231,331 | | | 265,418 | |
| Other foreign operations | | 971,309 | | | 1,003,240 | | | 981,282 | |
| Total net sales | | $ | 1,839,686 | | | $ | 1,953,313 | | | $ | 1,943,585 | |
| | | | | | | | | | | | | | | | | | | | |
| Long-lived assets | | 2024 | | 2023 | | 2022 |
| United States | | $ | 217,687 | | | $ | 217,834 | | | $ | 201,960 | |
| Foreign operations | | 161,337 | | | 148,515 | | | 156,374 | |
| Total long-lived assets | | $ | 379,024 | | | $ | 366,349 | | | $ | 358,334 | |
Total net sales and operating earnings by segment include inter-segment sales which are generally recorded at cost-plus a specified fee or at a negotiated fixed price. All inter-segment transactions have been eliminated from each reportable segment’s net sales and earnings for all periods presented in the above tables. The following table summarizes inter-segment revenues for the years ended December 31, 2024, 2023 and 2022:
| | | | | | | | | | | | | | | | | | | | |
| Inter-segment revenues | | 2024 | | 2023 | | 2022 |
| Americas | | $ | 9,300 | | | $ | 9,005 | | | $ | 11,552 | |
| EMEA | | 19,781 | | | 24,865 | | | 44,605 | |
| Asia/Pacific | | 6,397 | | | 2,651 | | | 957 | |
Note 5 – Net Sales and Revenue Recognition
Arrangements Resulting in Net Reporting
As part of the Company’s FluidcareTM business, certain third-party product sales to customers are managed by the Company. The Company transferred third-party products under arrangements recognized on a net reporting basis of $75.5 million, $81.8 million and $83.8 million for the years ended December 31, 2024, 2023 and 2022, respectively.
QUAKER CHEMICAL CORPORATION
NOTES TO CONSOLIDATED FINANCIAL STATEMENTS - Continued
(Dollars in thousands, except per share amounts, unless otherwise stated)
Customer Concentration
A significant portion of the Company’s revenues are realized from the sale of process fluids and services to manufacturers of steel, aluminum, automotive, aerospace, industrial and agricultural equipment, and durable goods. During the year ended December 31, 2024, the Company’s five largest customers (each composed of multiple subsidiaries or divisions with semiautonomous purchasing authority) accounted for approximately 12% of consolidated net sales, with its largest customer accounting for approximately 3% of consolidated net sales.
Contract Assets and Liabilities
The Company had no material contract assets recorded on its Consolidated Balance Sheets as of December 31, 2024 and 2023.
The Company had approximately $4.2 million and $4.5 million of deferred revenue as of December 31, 2024 and 2023, respectively. During the years ended December 31, 2024 and 2023, the Company satisfied materially all of the associated performance obligations and recognized into revenue the advance payments received and recorded as of December 31, 2023 and 2022, respectively.
Disaggregated Revenue
The Company sells its industrial process fluids, specialty chemicals and technical expertise as a global product portfolio. The Company generally manages and evaluates its performance by reportable segment first, and then by customer industries. Net sales of each of the Company’s major product lines are generally spread throughout all three of the Company’s segments, and in most cases, approximately proportionate to the level of total sales in each segment.
The following tables present disaggregated information regarding the Company’s net sales, first by major product lines that represent more than 10% of the Company’s consolidated net sales for the years ended December 31, 2024, 2023 and 2022, and followed then by a disaggregation of the Company’s net sales by segment and customer industry for the years ended December 31, 2024, 2023 and 2022.
| | | | | | | | | | | | | | | | | | | | |
| Major Product Line | | 2024 | | 2023 | | 2022 |
| Metal removal fluids | | 22.4 | % | | 23.6 | % | | 22.9 | % |
| Rolling lubricants | | 20.5 | % | | 19.5 | % | | 20.8 | % |
| Hydraulic fluids | | 14.2 | % | | 14.1 | % | | 14.1 | % |
| | | | | | | | | | | | | | | | | | | | | | | | | | |
| | Net sales for the year ending December 31, 2024 |
| | Americas | | EMEA | | Asia/Pacific | | Consolidated
Total |
| Customer Industries | | | | |
| Metals | | $ | 258,818 | | | $ | 135,373 | | | $ | 207,324 | | | $ | 601,515 | |
| Metalworking and other | | 623,313 | | | 401,062 | | | 213,796 | | | 1,238,171 | |
| | $ | 882,131 | | | $ | 536,435 | | | $ | 421,120 | | | $ | 1,839,686 | |
| | | | | | | | | | | | | | | | | | | | | | | | | | | |
| | Net sales for the year ending December 31, 2023 | |
| | Americas | | EMEA | | Asia/Pacific | | Consolidated
Total | |
| Customer Industries | | | | | |
| Metals | | $ | 268,174 | | | $ | 136,979 | | | $ | 195,578 | | | $ | 600,731 | | |
| Metalworking and other | | 708,921 | | | 434,368 | | | 209,293 | | | 1,352,582 | | |
| | $ | 977,095 | | | $ | 571,347 | | | $ | 404,871 | | | $ | 1,953,313 | | |
| | | | | | | | | | | | | | | | | | | | | | | | | | | |
| | Net sales for the year ending December 31, 2022 | |
| | Americas | | EMEA | | Asia/Pacific | | Consolidated
Total | |
| Customer Industries | | | | | |
| Metals | | $ | 252,513 | | | $ | 137,767 | | | $ | 214,377 | | | $ | 604,657 | | |
| Metalworking and other | | 694,003 | | | 424,741 | | | 220,184 | | | 1,338,928 | | |
| | $ | 946,516 | | | $ | 562,508 | | | $ | 434,561 | | | $ | 1,943,585 | | |
Note 6 – Leases
The Company has operating leases for facilities, vehicles, and machinery and equipment with remaining lease terms up to 10 years. In addition, the Company has land use leases with remaining lease terms up to 90 years.
QUAKER CHEMICAL CORPORATION
NOTES TO CONSOLIDATED FINANCIAL STATEMENTS - Continued
(Dollars in thousands, except per share amounts, unless otherwise stated)
The Company’s finance leases are included in PP&E in the Consolidated Balance Sheets. See Note 14, Property, Plant and Equipment, for additional information. The Company has no material variable lease costs or sublease income for the years ended December 31, 2024, 2023 and 2022.
During the year ended December 31, 2024, the Company entered into a new lease agreement for office and laboratory space in Radnor, PA for the purposes of relocating its global headquarters. The lease is expected to commence in the third quarter of 2025 with a total lease commitment of $79.7 million.
The components of the Company’s lease expense for the years ended December 31, 2024, 2023 and 2022 are as follows:
| | | | | | | | | | | | | | | | | |
| December 31, 2024 | | December 31, 2023 | | December 31, 2022 |
| Operating lease expense | $ | 15,096 | | | $ | 14,981 | | | $ | 15,171 | |
| Short-term lease expense | 807 | | | 760 | | | 816 | |
Supplemental cash flow information related to the Company’s leases is as follows:
| | | | | | | | | | | | | | | | | |
| December 31,
2024 | | December 31,
2023 | | December 31,
2022 |
| Cash paid for amounts included in the measurement of lease liabilities | | | | | |
| Operating cash flows from operating leases | $ | 14,923 | | | $ | 16,020 | | | $ | 19,215 | |
| | | | | |
| Non-cash lease liabilities activity | | | | | |
| Leased right-of-use assets obtained in exchange for new operating lease liabilities | 9,792 | | | 10,044 | | | 23,356 | |
Supplemental balance sheet information related to the Company’s leases is as follows:
| | | | | | | | | | | |
| December 31, 2024 | | December 31, 2023 |
| Right-of-use lease assets | $ | 34,120 | | | $ | 38,614 | |
| | | |
| Other accrued liabilities | 10,619 | | | 11,965 | |
| Long-term lease liabilities | 20,028 | | | 22,937 | |
| Total operating lease liabilities | $ | 30,647 | | | $ | 34,902 | |
| | | |
| Weighted average remaining lease term (years) | 5.0 | | 5.1 |
| Weighted average discount rate | 5.63 | % | | 4.91 | % |
Maturities of operating lease liabilities as of December 31, 2024 were as follows:
| | | | | |
| |
| For the year ended December 31, 2025 | $ | 12,753 | |
| For the year ended December 31, 2026 | 9,006 | |
| For the year ended December 31, 2027 | 5,112 | |
| For the year ended December 31, 2028 | 2,974 | |
| For the year ended December 31, 2029 | 1,724 | |
| For the year ended December 31, 2030 and beyond | 4,827 | |
| Total lease payments | 36,396 | |
| Less: imputed interest | (5,749) | |
Present value of lease liabilities (1) | $ | 30,647 | |
(1) The $79.7 million of future lease commitments for the office and laboratory lease that is expected to commence in the third quarter of 2025 was not included in the lease liabilities balance as of December 31, 2024.
QUAKER CHEMICAL CORPORATION
NOTES TO CONSOLIDATED FINANCIAL STATEMENTS - Continued
(Dollars in thousands, except per share amounts, unless otherwise stated)
Note 7 – Restructuring and Related Activities
In 2022, the Company initiated a global cost and optimization program to improve its cost structure and drive a more profitable and productive organization. As of December 31, 2024, the program included restructuring and associated severance costs to reduce headcount by approximately 200 positions globally. These actions are expected to be substantially complete in the first half of 2025.
Employee separation benefits vary depending on local regulations within certain foreign countries and include severance and other benefits. The exact timing to complete, and final costs associated with, all actions will depend on a number of factors and are subject to change. In addition to the global cost and optimization program described above, the Company continues to take actions to optimize its facilities’ footprint. Restructuring costs incurred during the years ended December 31, 2024, 2023 and 2022 include employee severance, asset related and facility closure costs, including non-cash asset write-offs, that are recorded in Restructuring and related charges, net in the Company’s Consolidated Statements of Operations.
Activity in the Company’s accrual for its restructuring program and facility closure actions for the years ended December 31, 2024 and 2023 are as follows:
| | | | | |
| |
| Accrued restructuring as of December 31, 2022 | $ | 5,483 | |
| Severance costs | 7,162 |
| Asset-related charges | 426 | |
| Cash payments | (9,786) | |
| Currency translation adjustments | 65 | |
| Accrued restructuring as of December 31, 2023 | 3,350 | |
| Severance costs | 3,259 | |
| Asset-related charges | 3,271 |
| Cash payments | (7,595) | |
| Currency translation adjustments | 12 | |
| Accrued restructuring as of December 31, 2024 | $ | 2,297 | |
In connection with the plans for closure of certain manufacturing and non-manufacturing facilities, the Company made available for sale certain facilities and properties. During the years ended December 31, 2024, 2023 and 2022, the Company completed the sale of certain facilities previously classified as held-for-sale for a net gain of $0.4 million, $1.4 million and $0.2 million, respectively, which is recorded in Other income (expense), net on the Consolidated Statements of Operations. As of December 31, 2024, the Company classified a property in the EMEA segment with an aggregate book value of approximately $0.7 million as held-for-sale and recorded it in Prepaid expenses and other current assets on the Company’s Consolidated Balance Sheets. The Company expects to complete the sale of this property over the next twelve months. The Company will continue to evaluate its existing facilities and footprint, which may include making other facilities or property available for sale in the future.
Note 8 – Equity
Share-based Compensation
The Company recognized the following share-based compensation expense in its Consolidated Statements of Operations for the years ended December 31, 2024, 2023 and 2022:
| | | | | | | | | | | | | | | | | |
| 2024 | | 2023 | | 2022 |
| Stock options | $ | 215 | | | $ | 1,039 | | | $ | 1,774 | |
| Non-vested stock awards and restricted stock units | 9,996 | | | 9,305 | | | 6,679 | |
| | | | | |
| Director stock ownership plan | 138 | | | 86 | | | 63 | |
| Performance stock units | 4,642 | | | 4,175 | | | 3,150 | |
| Before-tax share-based compensation expense | $ | 14,991 | | | $ | 14,605 | | | $ | 11,666 | |
| Income tax benefit | (2,222) | | | (2,742) | | | (2,007) | |
| After-tax share-based compensation expense | $ | 12,769 | | | $ | 11,863 | | | $ | 9,659 | |
Before-tax share-based compensation expense is primarily included in SG&A in the Consolidated Statements of Operations. No cost was capitalized during the years ended December 31, 2024, 2023 and 2022.
QUAKER CHEMICAL CORPORATION
NOTES TO CONSOLIDATED FINANCIAL STATEMENTS - Continued
(Dollars in thousands, except per share amounts, unless otherwise stated)
Stock Options
Stock options granted under the LTIP program are subject to time vesting and generally become exercisable within three years after the date of the grant for a period of time determined by the Company, but not to exceed seven years from the date of grant. The Company has not granted stock options since fiscal year 2022. Share-based compensation for stock options is recognized using the graded vesting method over the vesting periods.
Stock option activity under all plans is as follows:
| | | | | | | | | | | | | | | | | | | | | | | |
| Number of
Options | | Weighted
Average
Exercise
Price
(per option) | | Weighted
Average
Remaining
Contractual
Term (years) | | Aggregate
Intrinsic
Value |
| Options outstanding as of January 1, 2024 | 62,853 | | $ | 214.40 | | | | | |
| | | | | | | |
| Options exercised | 2,263 | | 145.95 | | | | | |
| Options forfeited | 1,978 | | 152.65 | | | | | |
| Options outstanding as of December 31, 2024 | 58,612 | | $ | 219.13 | | | 3.3 | | $ | — | |
| Options expected to vest after December 31, 2024 | 7,033 | | $ | 178.29 | | | 4.2 | | $ | — | |
| Options exercisable as of December 31, 2024 | 51,579 | | $ | 194.91 | | | 3.1 | | $ | — | |
The total intrinsic value of stock options exercised during the years ended December 31, 2024, 2023 and 2022 was approximately $0.1 million, $3.6 million and $0.8 million, respectively. The intrinsic value is calculated as the difference between the current market price of the underlying security and the strike price of a related option.
As of December 31, 2024, unrecognized compensation expense related to stock options was an inconsequential amount to be recognized over a weighted average period of 0.2 years.
The Company used a Black-Scholes option pricing model to determine the fair value of stock option awards and used the assumptions set forth in the table below:
| | | | | | | | | | | | | |
| July 2022 Grant | | March 2022 Grant | | |
| Number of stock options granted | 4,837 | | 27,077 | | |
| Dividend yield | 0.79 | % | | 0.80 | % | | |
| Expected volatility | 40.47 | % | | 38.60 | % | | |
| Risk-free interest rate | 2.87 | % | | 2.07 | % | | |
| Expected term (years) | 4.0 | | 4.0 | | |
Restricted Stock Awards
RSAs granted under the LTIP program are subject to time vesting generally over a one to three-year period. In addition, as part of the Company’s Annual Incentive Plan, non-vested shares may be issued to key employees, which generally would vest over a period of two-to five-years. Share-based compensation for RSAs is recognized using the graded vesting method over the vesting periods.
Activity of restricted stock awards granted under the Company’s LTIP plan is shown below:
| | | | | | | | | | | |
| Number of
Shares | | Weighted Average Grant Date Fair Value (per share) |
| Non-vested restricted stock awards, December 31, 2023 | 77,757 | | $ | 187.24 | |
| Granted | 872 | | 200.48 | |
| Vested | 41,555 | | 197.32 | |
| Forfeited | 7,323 | | 172.65 | |
| Non-vested restricted stock awards, December 31, 2024 | 29,751 | | $ | 177.12 | |
QUAKER CHEMICAL CORPORATION
NOTES TO CONSOLIDATED FINANCIAL STATEMENTS - Continued
(Dollars in thousands, except per share amounts, unless otherwise stated)
The fair value of the non-vested stock is based on the trading price of the Company’s common stock on the date of grant. As of December 31, 2024, unrecognized compensation expense related to these awards was $1.1 million, to be recognized over a weighted average remaining period of 0.8 years.
Restricted Stock Units
As a component of its LTIP, the Company granted RSUs subject to time vesting generally over a one to three year period. Share-based compensation for time-based RSUs is recognized on a graded basis over the vesting periods.
Additionally, during the fourth quarter of 2024, the Company granted 9,820 time-based RSUs subject to a performance modifier based on the Company’s relative TSR compared to the S&P 1500 Chemicals Index that vest on the third anniversary of the grant. The target number of RSUs that vest may range from 75% to 125% of the target number of RSUs depending on the achievement of the relative TSR performance criteria measured at the end of the three-year performance period. Share-based compensation expense for these awards is recognized on a straight-line basis over the vesting period.
Activity of restricted stock units granted under the Company’s LTIP plan is shown below:
| | | | | | | | | | | |
| Number of
Units | | Weighted Average Grant Date Fair Value (per unit) |
| Non-vested restricted stock units, December 31, 2023 | 16,202 | | $ | 180.14 | |
| Granted | 71,866 | | 187.74 | |
| Vested | 10,267 | | 192.13 | |
| Forfeited | 9,171 | | 195.22 | |
| Non-vested restricted stock units, December 31, 2024 | 68,630 | | $ | 182.90 | |
The fair value of the time-based non-vested RSUs is based on the trading price of the Company’s common stock on the date of grant. The fair value of RSUs subject to a performance modifier is valued using a Monte Carlo simulation on the grant date and used the following assumptions set below:
| | | | | |
| December 2024 Grant |
| Risk-free interest rate | 4.21 | % |
| Dividend yield | 0.00% |
| Expected term (years) | 3.0 |
As of December 31, 2024, unrecognized compensation expense related to RSUs was $6.9 million, to be recognized over a weighted average remaining period of 1.5 years.
Performance Stock Units
The Company grants PSUs as a component of its LTIP and other equity compensation plans. The number of shares that may ultimately be issued as settlement for each award may range from 0% up to 200% of the target award, subject to the achievement of the Company’s market-based TSR relative to the performance of a selected peer group, and separately the achievement of a performance-based return on invested capital (“ROIC”) measure. The service period required for the PSUs is generally three years and the measurement period of the market-based and performance objectives is generally from January 1 of the year of grant through December 31 of the year prior to issuances of the shares. Share-based compensation for PSUs subject to time vesting is recognized on a straight-line basis over the vesting period.
As mentioned above, a portion of the Company’s PSUs are subject to achievement of the Company’s TSR relative to the performance of a selected peer group. For PSUs granted prior to 2024, the Company’s peer group was the S&P Midcap 400 Materials group. For PSUs subject to relative TSR performance granted in 2024, the Company made an election to change peer groups to the S&P 1500 Chemicals Group.
QUAKER CHEMICAL CORPORATION
NOTES TO CONSOLIDATED FINANCIAL STATEMENTS - Continued
(Dollars in thousands, except per share amounts, unless otherwise stated)
Activity of performance stock units granted under the Company’s LTIP plan is shown below:
| | | | | | | | | | | |
| Number of
Units | | Weighted Average Grant Date Fair Value (per unit) |
| Non-vested performance stock units, December 31, 2023 | 51,491 | | $ | 212.85 | |
| Granted | 42,485 | | 217.12 | |
| Vested | — | | | — | |
| Forfeited | 38,283 | | 212.26 | |
| Non-vested performance stock units, December 31, 2024 | 55,693 | | $ | 216.51 | |
The fair value of PSUs granted with a ROIC condition is based on the trading price of the Company’s common stock on the date of grant. PSUs granted with a relative TSR condition are valued using a Monte Carlo simulation on the grant date. The grant-date fair value of the PSUs valued using a Monte Carlo simulation included the following assumptions set forth in the table below:
| | | | | | | | | | | | | | | | | | |
| | March 2024 Grant | | March 2023 Grant | | March 2022 Grant |
| | | | | | |
| Risk-free interest rate | | 4.55 | % | | 3.85 | % | | 2.11 | % |
| Dividend yield | | 0.91 | % | | 0.96 | % | | 0.93 | % |
| Expected term (years) | | 3.0 | | 3.0 | | 3.0 |
As of December 31, 2024, there was approximately $4.5 million of total unrecognized compensation cost related to PSUs which the Company expects to recognize over a weighted-average period of 1.7 years.
2023 Director Stock Ownership Plan
In March 2023, the Company adopted the 2023 Director Stock Ownership Plan (the “Plan”), to encourage the Directors to increase their individual investment in the Company, which was approved at the Company’s May 2023 shareholders’ meeting. The Plan authorizes the issuance of up to 75,000 shares of Quaker common stock in accordance with the terms of the Plan in payment of all or a portion of the annual cash retainer payable to each of the Company’s non-employee directors in 2023 and subsequent years during the term of the Plan. Under the Plan, each director who, on May 1 of the applicable calendar year, owns less than 500% of the annual cash retainer for the applicable calendar year, divided by the average of the closing price of a share of Quaker Common Stock as reported by the composite tape of the New York Stock Exchange for the previous calendar year (the “Threshold Amount”), is required to receive 75% of the annual cash retainer in Quaker common stock and 25% of the retainer in cash, unless the director elects to receive a greater percentage of Quaker common stock, up to 100% of the annual cash retainer for the applicable year. Each director who owns more than the Threshold Amount may elect to receive common stock in payment of a percentage (up to 100%) of the annual cash retainer. The annual retainer is approximately $0.1 million and the retainer payment date is June 1.
Common Stock and Preferred Stock
The Company has 30,000,000 shares of common stock authorized with a par value of $1.00, and 17,673,607 and 17,991,988 shares issued and outstanding as of December 31, 2024 and 2023, respectively. The change in shares issued and outstanding during 2024 was primarily related to 312,997 shares repurchased by the Company under the share repurchase program described below, 12,784 shares surrendered from employees in payment of the vesting of restricted stock awards or units, 7,294 shares forfeited by employees under equity compensation plans, offset by 14,694 share issuances relating to equity compensation plans.
The Company is authorized to issue 10,000,000 shares of preferred stock with $1.00 par value, subject to approval by the Board. The Board may designate one or more series of preferred stock and the number of shares, rights, preferences, and limitations of each series. As of December 31, 2024, no preferred stock had been issued.
QUAKER CHEMICAL CORPORATION
NOTES TO CONSOLIDATED FINANCIAL STATEMENTS - Continued
(Dollars in thousands, except per share amounts, unless otherwise stated)
Share Repurchase Program
On February 28, 2024, the Board approved a new share repurchase program (“2024 Share Repurchase Program”), authorizing the Company to repurchase up to an aggregate of $150 million of the Company’s outstanding common stock and replacing the prior share repurchase program, under which no repurchases were made in 2024. The 2024 Share Repurchase Program was effective immediately upon approval and has no expiration date. The number of shares to be repurchased and the timing of such transactions depend on a variety of factors, including market conditions. As of December 31, 2024, there was approximately $100.8 million of capacity remaining under the 2024 Share Repurchase Program. The Company repurchased 312,997 shares under the 2024 Share Repurchase Program for the year ended December 31, 2024. The Company did not repurchase any shares in 2024 under the prior repurchase program or for the years ended December 31, 2023 and 2022.
Under the 2024 Share Repurchase Program, the Company is authorized to repurchase shares through open market purchases, privately-negotiated transactions, accelerated share repurchases or otherwise in accordance with applicable federal securities laws, including through Rule 10b5-1 and under Rule 10b-18 of the Securities Exchange Act of 1934, as amended. The Company currently expects to employ trading plans for the repurchase of shares pursuant to the 2024 Share Repurchase Program, which would permit the Company to purchase shares, at predetermined price targets, when it may otherwise be precluded from doing so. The repurchases may be suspended or discontinued at any time. The specific timing and amount of repurchases will vary based on available capital resources and other financial and operational performance, market conditions, securities law limitations, and other factors.
Note 9 – Other Income (Expense), net
Other income (expense), net for the years ended December 31, 2024, 2023 and 2022 are as follows:
| | | | | | | | | | | | | | | | | |
| 2024 | | 2023 | | 2022 |
| Income from third party license fees | $ | 810 | | | $ | 1,210 | | | $ | 1,268 | |
| Foreign exchange losses, net | (1,783) | | | (14,785) | | | (9,399) | |
| Gain on disposals of property, plant, equipment and other assets, net | 810 | | | 1,307 | | | 168 | |
| Non-income tax refunds and other related credits (expense) | 3,742 | | | 1,339 | | | (1,613) | |
| Pension and postretirement benefit (costs) income, non-service components | (1,827) | | | (2,033) | | | 1,704 | |
| Loss on extinguishment of debt | — | | | — | | | (6,763) | |
| Facility remediation recoveries, net | — | | | 2,141 | | | 1,804 | |
| Business interruption insurance proceeds | 1,000 | | | — | | | — | |
| Product liability claim costs, net | (2,040) | | | — | | | — | |
| Earnout liability adjustment | 400 | | | — | | | — | |
| Other non-operating income, net | 242 | | | 149 | | | 224 | |
| Total other income (expense), net | $ | 1,354 | | | $ | (10,672) | | | $ | (12,607) | |
Foreign exchange losses, net, during the years ended December 31, 2024, 2023 and 2022, include foreign currency transaction losses of approximately $0.8 million, $7.8 million and $1.6 million, respectively, related to hyper-inflationary accounting. See Note 1, Basis of Presentation and Significant Accounting Policies, for additional information.
Gain on disposals of property, plant, equipment and other assets, net, includes losses related to certain fixed asset disposals resulting from the property damage caused by flooding of the Company’s Conshohocken, Pennsylvania headquarters in 2022, as described in Note 25, Commitments and Contingencies. This caption also includes gains recognized in 2024, 2023 and 2022 for the sale of certain facilities previously classified as held-for-sale, as described in Note 7, Restructuring and Related Activities.
Business interruption insurance proceeds for the year ended December 31, 2024 reflects an insurance recovery of $1.0 million related to production losses due to an electrical fire in 2021 that resulted in temporary shutdown of production at one of the Company’s production facilities. See Note 25, Commitments and Contingencies, for additional discussion regarding the Company’s business interruption claims.
Product liability claim costs, net represents expense related to payments by the Company in connection with product liability disputes with customers, net of insurance recoveries during the year ended December 31, 2024.
Facility remediation recoveries, net, for the years ended December 31, 2023 and 2022 reflects insurance recoveries of costs for remediation and restoration of property damage. See Note 25, Commitments and Contingencies, for additional discussion regarding the Company’s insurance recoveries for facility remediation and property damage.
QUAKER CHEMICAL CORPORATION
NOTES TO CONSOLIDATED FINANCIAL STATEMENTS - Continued
(Dollars in thousands, except per share amounts, unless otherwise stated)
Loss on extinguishment of debt during the year ended December 31, 2022 includes the write-off of certain previously unamortized deferred financing costs as well as a portion of the third-party and creditor debt issuance costs incurred to execute an amendment to the Company’s primary credit facility. See Note 19, Debt, for additional information.
Note 10 – Income Taxes
On December 22, 2017, the U.S. government enacted comprehensive tax legislation which we refer to as U.S. Tax Reform. U.S. Tax Reform implemented a new system of taxation for non-U.S. earnings which eliminated U.S. federal income taxes on dividends from certain foreign subsidiaries and imposed a one-time transition tax on the deemed repatriation of undistributed earnings of certain foreign subsidiaries that is payable over eight years. Accordingly, the Company had initially recorded a $15.5 million transition tax liability for U.S. income taxes on undistributed earnings of non-U.S. subsidiaries. As of December 31, 2024, $11.6 million in installments have been paid with the remaining $3.9 million to be paid in 2025. The Company may also be subject to other taxes, such as withholding taxes and dividend distribution taxes, if these undistributed earnings are ultimately remitted to the U.S.
Taxes on income before equity in net income of associated companies for the years ended December 31, 2024, 2023 and 2022 are as follows:
| | | | | | | | | | | | | | | | | |
| 2024 | | 2023 | | 2022 |
| Current: | | | | | |
| Federal | $ | 15,276 | | | $ | 12,159 | | | $ | (708) | |
| State | 2,395 | | | 2,938 | | | 1,450 | |
| Foreign | 41,662 | | | 51,930 | | | 34,735 | |
| Total | 59,333 | | | 67,027 | | | 35,477 | |
| Deferred: | | | | | |
| Federal | (4,385) | | | 518 | | | (2,798) | |
| State | (24) | | | (163) | | | (713) | |
| Foreign | (5,624) | | | (11,797) | | | (7,041) | |
| Total | $ | (10,033) | | | $ | (11,442) | | | $ | (10,552) | |
| Taxes on income before equity in net income of associated companies | $ | 49,300 | | | $ | 55,585 | | | $ | 24,925 | |
The components of income before taxes and equity of associated companies for the years ended December 31, 2024, 2023 and 2022 are as follows:
| | | | | | | | | | | | | | | | | |
| 2024 | | 2023 | | 2022 |
| U.S. | $ | 17,167 | | | $ | 14,520 | | | $ | (4,933) | |
| Foreign | 137,891 | | | 138,604 | | | 12,051 | |
| Total | $ | 155,058 | | | $ | 153,124 | | | $ | 7,118 | |
QUAKER CHEMICAL CORPORATION
NOTES TO CONSOLIDATED FINANCIAL STATEMENTS - Continued
(Dollars in thousands, except per share amounts, unless otherwise stated)
Total deferred tax assets and liabilities are composed of the following as of December 31, 2024 and 2023:
| | | | | | | | | | | | |
| 2024 | | 2023 | |
| Pension and other postretirement benefits | $ | 5,472 | | | $ | 6,539 | | |
| Allowance for credit losses | 1,895 | | | 2,627 | | |
| Insurance and litigation reserves | 565 | | | 534 | | |
| Performance incentives | 5,582 | | | 5,839 | | |
| Equity-based compensation | 2,891 | | | 2,980 | | |
| Prepaid expense | 426 | | | 541 | | |
| Operating loss carryforward | 24,702 | | | 22,693 | | |
| Foreign tax credit and other credits | 19,516 | | | 13,360 | | |
| Interest | 16,423 | | | 12,926 | | |
| Restructuring reserves | 158 | | | 403 | | |
| Right-of-use lease assets | 7,629 | | | 8,018 | | |
| Inventory reserves | 2,423 | | | 4,810 | | |
| Research and development | 12,608 | | | 11,125 | | |
| Other | 1,261 | | | 5,712 | | |
| Total deferred tax assets, gross | 101,551 | | | 98,107 | | |
| Valuation allowance | (27,993) | | | (24,182) | | |
| Total deferred tax assets, net | $ | 73,558 | | | $ | 73,925 | | |
| Depreciation | 9,814 | | | 10,240 | | |
| | | | |
| Intangibles | 170,309 | | | 177,320 | | |
| Lease liabilities | 8,575 | | | 9,105 | | |
| Outside basis in equity investment | 6,080 | | | 5,276 | | |
| Unremitted earnings | 8,392 | | | 8,204 | | |
| Total deferred tax liabilities | $ | 203,170 | | | $ | 210,145 | | |
| Total net deferred tax liabilities | $ | (129,612) | | | $ | (136,220) | | |
The Company’s net deferred tax assets and liabilities are classified in the Consolidated Balance Sheets as of December 31, 2024 and 2023 as follows:
| | | | | | | | | | | |
| 2024 | | 2023 |
| Non-current deferred tax assets | $ | 9,216 | | | $ | 10,737 | |
| Non-current deferred tax liabilities | 138,828 | | | 146,957 | |
| Total net deferred tax liabilities | $ | (129,612) | | | $ | (136,220) | |
As of December 31, 2024, the Company has a deferred tax liability of $8.4 million on certain undistributed foreign earnings, which primarily represents the Company’s estimate of the non-U.S. income taxes the Company will incur to ultimately remit certain earnings to the U.S. Otherwise, it is the Company’s current intention to reinvest its additional undistributed earnings of certain non-U.S. subsidiaries to support working capital needs and certain other growth initiatives outside of the U.S. The amount of such undistributed earnings at December 31, 2024 was approximately $359.8 million. Any tax liability which might result from ultimate remittance of these earnings is expected to be substantially offset by foreign tax credits (subject to certain limitations); however, certain withholding taxes could apply. It is currently impractical to estimate any such incremental tax expense.
The Company has $6.1 million of deferred tax assets related to state net operating losses. Management analyzed the expected impact of the reversal of existing taxable temporary differences, considered expiration dates, analyzed current state tax laws, and determined that $1.4 million of state net operating loss carryforwards is expected to be realized as a future benefit. Accordingly, a partial valuation allowance of $4.7 million has been established. These state net operating losses are subject to various carryforward periods of 5 years to 20 years or an indefinite carryforward period. An additional $0.6 million of valuation allowance was established for other net state deferred tax assets.
QUAKER CHEMICAL CORPORATION
NOTES TO CONSOLIDATED FINANCIAL STATEMENTS - Continued
(Dollars in thousands, except per share amounts, unless otherwise stated)
The Company has $18.5 million of deferred tax assets related to foreign net operating loss carryforwards. A partial valuation allowance of $2.8 million has been established against this amount resulting in a net $15.7 million expected future benefit. These foreign net operating losses are subject to various carryforward periods with the majority having an indefinite carryforward period. An additional partial valuation allowance of $2.8 million has been established against certain other foreign deferred tax assets.
Foreign tax credits may be carried forward for 10 years. Management analyzed the expected impact of the utilization of foreign tax credits based on certain assumptions such as projected U.S. taxable income, overall domestic loss recapture, and applicable limitations if any. The Company had a foreign tax credit carry forward of $19.2 million and $13.0 million as of December 31, 2024 and 2023, respectively, with a $17.2 million and $12.5 million valuation allowance as of December 31, 2024 and 2023, respectively, reflecting the amount of credits that are not expected to be utilized before expiration.
The following are the changes in the Company’s deferred tax asset valuation allowance for the years ended December 31, 2024, 2023 and 2022:
| | | | | | | | | | | | | | | | | |
| 2024 | | 2023 | | 2022 |
| | | | | |
| Balance at January 1, | $ | 24,182 | | | $ | 11,730 | | | $ | 17,400 | |
| Net charges to income tax expense | $ | 5,693 | | | $ | 14,393 | | | $ | 1,119 | |
| Release of valuation allowance | $ | (1,882) | | | $ | (1,941) | | | $ | (6,789) | |
| Balance at December 31, | $ | 27,993 | | | $ | 24,182 | | | $ | 11,730 | |
The following is a reconciliation of income taxes at the Federal statutory rate with income taxes recorded by the Company for the years ended December 31, 2024, 2023 and 2022:
| | | | | | | | | | | | | | | | | |
| 2024 | | 2023 | | 2022 |
| Income tax provision at the Federal statutory tax rate | $ | 32,562 | | | $ | 32,156 | | | $ | 1,495 | |
| Unremitted earnings | (30) | | | 1,211 | | | (1,839) | |
| Tax law changes / reform | (37) | | | 47 | | | 823 | |
| U.S. tax on foreign operations | 9,625 | | | 9,014 | | | 4,864 | |
| | | | | |
| Foreign derived intangible income | (1,336) | | | (1,147) | | | (917) | |
| | | | | |
| Withholding taxes | 8,418 | | | 11,193 | | | 7,785 | |
| Foreign tax credits | (6,898) | | | (3,432) | | | (5,850) | |
| Share-based compensation | 2,345 | | | 1,814 | | | 1,372 | |
| Foreign tax rate differential | 1,315 | | | 4,731 | | | 4,782 | |
| Research and development credit | (1,902) | | | (2,000) | | | (1,757) | |
| Audit settlements | — | | | 456 | | | 2,697 | |
| Uncertain tax positions | (2,372) | | | (598) | | | (6,375) | |
| State income tax provisions, net | 1,905 | | | 2,158 | | | 432 | |
| Non-deductible expenses | 341 | | | 416 | | | 190 | |
| Intercompany transfer of intangible assets | 2,295 | | | (584) | | | (1,932) | |
| Goodwill impairment | — | | | — | | | 19,550 | |
| Provision to return and other adjustments | 2,655 | | | (930) | | | 21 | |
| Miscellaneous items, net | 414 | | | 1,080 | | | (416) | |
| Taxes on income before equity in net income of associated companies | $ | 49,300 | | | $ | 55,585 | | | $ | 24,925 | |
For the years ended December 31, 2024 and 2023, the Company’s cumulative liability for gross unrecognized tax benefits were $13.9 million and $15.7 million, respectively. For the years ended December 31, 2024 and 2023, the Company had accrued approximately $0.8 million and $1.1 million, respectively, for cumulative penalties and $2.6 million and $2.9 million, respectively, for cumulative interest.
QUAKER CHEMICAL CORPORATION
NOTES TO CONSOLIDATED FINANCIAL STATEMENTS - Continued
(Dollars in thousands, except per share amounts, unless otherwise stated)
The Company continues to recognize interest and penalties associated with uncertain tax positions as a component of tax expense on income before equity in net income of associated companies in its Consolidated Statements of Operations. The Company recognized a benefit of $0.2 million for penalties and a benefit of $0.2 million for interest (net of expirations and settlements) in its Consolidated Statements of Operations for the year ended December 31, 2024, a benefit of $0.4 million for penalties and an expense of $0.1 million for interest (net of expirations and settlements) in its Consolidated Statement of Operations for the year ended December 31, 2023, and a benefit of $1.7 million for penalties and a benefit of $0.3 million for interest (net of expirations and settlements) in its Consolidated Statement of Operations for the year ended December 31, 2022.
The Company estimates that during the year ending December 31, 2024, it will reduce its cumulative liability for gross unrecognized tax benefits by approximately $3.6 million due to the expiration of the statute of limitations with regard to certain tax positions. This estimated reduction in the cumulative liability for unrecognized tax benefits does not consider any increase in liability for unrecognized tax benefits with regard to existing tax positions or any increase in cumulative liability for unrecognized tax benefits with regard to new tax positions for the year ending December 31, 2024.
A reconciliation of the beginning and ending amounts of unrecognized tax benefits for the years ended December 31, 2024, 2023 and 2022, respectively, is as follows:
| | | | | | | | | | | | | | | | | |
| 2024 | | 2023 | | 2022 |
| Unrecognized tax benefits as of January 1 | $ | 15,659 | | | $ | 16,340 | | | $ | 22,464 | |
| Decrease in unrecognized tax benefits taken in prior periods | (88) | | | (147) | | | (1,174) | |
| Increase in unrecognized tax benefits taken in current period | 2,684 | | | 1,799 | | | 953 | |
| Decrease in unrecognized tax benefits due to lapse of statute of limitations | (3,559) | | | (2,736) | | | (2,378) | |
| Decrease in unrecognized tax benefits due to audit settlements | — | | | — | | | (2,509) | |
| | | | | |
| (Decrease) increase due to foreign exchange rates | (747) | | | 403 | | | (1,016) | |
| Unrecognized tax benefits as of December 31 | $ | 13,949 | | | $ | 15,659 | | | $ | 16,340 | |
The amount of net unrecognized tax benefits above that, if recognized, would impact the Company’s tax expense and effective tax rate is $8.3 million, $10.1 million and $10.2 million for the years ended December 31, 2024, 2023 and 2022, respectively.
The Company and its subsidiaries are subject to U.S. Federal income tax, as well as the income tax of various state and foreign tax jurisdictions. Tax years that remain subject to examination by major tax jurisdictions are shown in the table below:
| | | | | | | | |
| Jurisdiction | | Open Years |
| Brazil | | 2019-2024 |
| China | | 2019-2024 |
| Germany | | 2018-2024 |
| India | | 2019-2024 |
| Italy | | 2019-2024 |
| Mexico | | 2019-2024 |
| Netherlands | | 2018-2024 |
| Spain | | 2018-2024 |
| U.S. Federal and State | | 2020-2024 |
| United Kingdom | | 2021-2024 |
Positions challenged by the taxing authorities may be settled or applied by the Company. As a result, income tax uncertainties are recognized in the Company’s financial statements in accordance with the accounting for income taxes, when applicable.
QUAKER CHEMICAL CORPORATION
NOTES TO CONSOLIDATED FINANCIAL STATEMENTS - Continued
(Dollars in thousands, except per share amounts, unless otherwise stated)
Note 11 – Earnings Per Share
The following table summarizes earnings per share calculations for the years ended December 31, 2024, 2023 and 2022:
| | | | | | | | | | | | | | | | | |
| 2024 | | 2023 | | 2022 |
| Basic earnings (loss) per common share | | | | | |
| Net income (loss) attributable to Quaker Chemical Corporation | $ | 116,644 | | | $ | 112,748 | | | $ | (15,931) | |
| Less: (income) loss allocated to participating securities | (375) | | | (555) | | | 92 | |
| Net income (loss) available to common shareholders | $ | 116,269 | | | $ | 112,193 | | | $ | (15,839) | |
| Basic weighted average common shares outstanding | 17,850,462 | | 17,892,461 | | 17,841,487 |
| Basic earnings (loss) per common share | $ | 6.51 | | | $ | 6.27 | | | $ | (0.89) | |
| | | | | |
| Diluted earnings (loss) per common share | | | | | |
| Net income (loss) attributable to Quaker Chemical Corporation | $ | 116,644 | | | $ | 112,748 | | | $ | (15,931) | |
| Less: (income) loss allocated to participating securities | (375) | | | (554) | | | 92 | |
| Net income (loss) available to common shareholders | $ | 116,269 | | | $ | 112,194 | | | $ | (15,839) | |
| Basic weighted average common shares outstanding | 17,850,462 | | 17,892,461 | | 17,841,487 |
| Effect of dilutive securities | 19,605 | | 22,348 | | 15,005 |
| Diluted weighted average common shares outstanding | 17,870,067 | | 17,914,809 | | 17,856,492 |
| Diluted earnings (loss) per common share | $ | 6.51 | | | $ | 6.26 | | | $ | (0.89) | |
Certain stock options, restricted stock units and PSUs are not included in the diluted earnings per share calculation when the effect would be anti-dilutive. The number of anti-dilutive shares were 32,353, 10,621, and 28,222 for the years ended December 31, 2024, 2023 and 2022, respectively.
Note 12 – Accounts Receivable and Allowance for Credit Losses
As of December 31, 2024 and 2023, the Company had gross trade accounts receivable totaling $413.7 million and $458.3 million, respectively. The following are changes in the allowance for credit losses during the years ended December 31, 2024, 2023 and 2022:
| | | | | | | | | | | | | | | | | | | | | | | | | | | | | |
| Balance at
Beginning
of Period | | Changes
to Costs and
Expenses | | Write-Offs
Charged to
Allowance | | Exchange Rate
Changes
and Other
Adjustments | | Balance
at End
of Period |
| Year ended December 31, 2024 | $ | 13,302 | | | $ | 2,120 | | | $ | (1,215) | | | $ | (620) | | | $ | 13,587 | |
| Year ended December 31, 2023 | $ | 13,527 | | | $ | 1,327 | | | $ | (961) | | | $ | (591) | | | $ | 13,302 | |
| Year ended December 31, 2022 | $ | 12,334 | | | $ | 4,319 | | | $ | (2,441) | | | $ | (685) | | | $ | 13,527 | |
Note 13 – Inventories
Inventories as of December 31, 2024 and 2023 were as follows:
| | | | | | | | | | | |
| 2024 | | 2023 |
| Raw materials and supplies | $ | 112,457 | | | $ | 119,047 | |
| Work in process, finished goods and reserves | 115,015 | | | 114,810 | |
| Total inventories | $ | 227,472 | | | $ | 233,857 | |
QUAKER CHEMICAL CORPORATION
NOTES TO CONSOLIDATED FINANCIAL STATEMENTS - Continued
(Dollars in thousands, except per share amounts, unless otherwise stated)
Note 14 – Property, Plant and Equipment
Property, plant and equipment as of December 31, 2024 and 2023 were as follows:
| | | | | | | | | | | |
| 2024 | | 2023 |
| Land | $ | 25,143 | | | $ | 26,110 | |
| Building and improvements | 149,783 | | | 147,135 | |
| Machinery and equipment | 272,188 | | | 263,999 | |
| Construction in progress | 35,919 | | | 16,175 | |
| Property, plant and equipment, at cost | 483,033 | | | 453,419 | |
| Less: accumulated depreciation | (253,501) | | | (245,608) | |
| Total property, plant and equipment, net | $ | 229,532 | | | $ | 207,811 | |
As of December 31, 2024, PP&E includes $1.0 million of finance lease assets and future minimum lease payments. See Note 6, Leases, for additional information.
Note 15 – Goodwill and Other Intangible Assets
Changes in the carrying amount of goodwill for the years ended December 31, 2024 and 2023 were as follows:
| | | | | | | | | | | | | | | | | | | | | | | | | | | | | |
| Americas | | EMEA | | Asia/Pacific | | Global Specialty Businesses | | Total |
| | | |
| | | |
| Balance as of December 31, 2022 | $ | 215,899 | | | $ | 34,567 | | | $ | 150,375 | | | $ | 114,167 | | | $ | 515,008 | |
Reallocation of reporting units (1) | 63,697 | | | 31,711 | | | 18,759 | | | (114,167) | | | — | |
| Balance as of January 1, 2023 | 279,596 | | | 66,278 | | | 169,134 | | | — | | | 515,008 | |
| | | | | | | | | |
| Currency translation and other adjustments | 3,507 | | | (338) | | | (5,659) | | | — | | | (2,490) | |
| Balance as of December 31, 2023 | 283,103 | | | 65,940 | | | 163,475 | | | — | | | 512,518 | |
| Goodwill from acquisitions | — | | | 16,448 | | | 5,511 | | | — | | | 21,959 | |
| Currency translation and other adjustments | (6,228) | | | (1,984) | | | (7,371) | | | — | | | (15,583) | |
| Balance as of December 31, 2024 | $ | 276,875 | | | $ | 80,404 | | | $ | 161,615 | | | $ | — | | | $ | 518,894 | |
(1) In connection with the Company’s reorganization and the associated change in reportable segments and reporting units during the first quarter of 2023, the Company reallocated goodwill previously held by the former Global Specialty Businesses segment to the remaining business segments as of January 1, 2023.
| | | | | | | | | | | | | | | | | | | | |
| 2024 | | 2023 | | 2022 | |
| Goodwill, gross | $ | 611,498 | | | $ | 609,571 | | | $ | 608,008 | | |
Accumulated impairment losses (1) | (92,604) | | | (97,053) | | | (93,000) | | |
| Goodwill, net | $ | 518,894 | | | $ | 512,518 | | | $ | 515,008 | | |
(1) Accumulated impairment losses are attributable to the non-cash impairment charge of $93.0 million to write down the carrying value of the EMEA reporting unit during the fourth quarter of 2022 and includes the impact of currency translation.
QUAKER CHEMICAL CORPORATION
NOTES TO CONSOLIDATED FINANCIAL STATEMENTS - Continued
(Dollars in thousands, except per share amounts, unless otherwise stated)
Gross carrying amounts and accumulated amortization for definite-lived intangible assets as of December 31, 2024 and 2023 were as follows:
| | | | | | | | | | | | | | | | | | | | | | | | | | | | | | | | | | | |
| Gross Carrying
Amount | | Accumulated
Amortization | | Net Book Value |
| 2024 | | 2023 | | 2024 | | 2023 | | 2024 | | 2023 |
| Customer lists and rights to sell | $ | 829,255 | | | $ | 841,562 | | | $ | 285,450 | | | $ | 243,872 | | | $ | 543,805 | | | $ | 597,690 | |
| Trademarks, formulations and product technology | 160,257 | | | 161,613 | | | 62,373 | | | 55,879 | | | 97,884 | | | 105,734 | |
| Other | 5,759 | | | 5,892 | | | 5,663 | | | 5,776 | | | 96 | | | 116 | |
| Total definite-lived intangible assets | $ | 995,271 | | | $ | 1,009,067 | | | $ | 353,486 | | | $ | 305,527 | | | $ | 641,785 | | | $ | 703,540 | |
The Company recorded $58.2 million, $58.2 million and $57.5 million of amortization expense during the years ended December 31, 2024, 2023 and 2022, respectively. Amortization expense is recorded within SG&A in the Company’s Consolidated Statements of Operations. Estimated annual aggregate amortization expense for the subsequent five years is as follows:
| | | | | |
| For the year ended December 31, 2025 | $ | 56,464 | |
| For the year ended December 31, 2026 | 56,174 | |
| For the year ended December 31, 2027 | 55,833 | |
| For the year ended December 31, 2028 | 55,374 | |
| For the year ended December 31, 2029 | 54,320 | |
As of December 31, 2024 and December 31, 2023, the Company had indefinite-lived intangible assets for trademarks and tradenames totaling $185.3 million and $193.2 million, respectively.
The Company completes its annual goodwill and indefinite-lived intangible asset impairment tests during the fourth quarter of each year, or more frequently if triggering events indicate a possible impairment in one or more of its reporting units. During the fourth quarter of 2022, the Company recorded a non-cash impairment charge of $93.0 million to write down the carrying value of the EMEA reporting unit goodwill to its estimated fair values. In connection with the Company’s reorganization and the associated change in reportable segments and reporting units during the first quarter of 2023, the Company performed the required impairment assessments directly before and immediately after the change in reporting units and concluded that it was not more likely than not that the fair values of any of the Company’s previous or new reporting units were less than their respective carrying amounts. Additionally, the Company completed its annual impairment assessment as of October 1, 2023 and October 1, 2024 and concluded in each case that no impairment existed. See Note 23, Fair Value Measures, for additional information.
The Company continually evaluates financial performance, economic conditions and other recent developments in assessing if a triggering event indicates that the carrying value of goodwill, indefinite-lived, or long-lived assets might be impaired. Notwithstanding the results of the Company’s impairment assessments during 2023 and 2024, if the Company is unable to maintain the actions aimed at improving the financial performance of the EMEA reporting unit, or interest rates rise, which leads to an increase in the cost of capital, then these conditions could result in a triggering event for the EMEA reporting unit. This assessment could result in an impairment of the EMEA reporting unit’s remaining goodwill, indefinite-lived intangible assets, or long-lived assets.
Note 16 – Investments in Associated Companies
As of December 31, 2024, the Company held a 50% investment in and had significant influence over Nippon Quaker Chemical, Ltd. (“Nippon Japan”), Kelko Quaker Chemical, S.A. (“Kelko Panama”) and Houghton Korea, and held a 32% investment in and had significant influence over Primex, Ltd. (“Primex”).
The carrying amount of the Company’s equity investments as of December 31, 2024 was $98.0 million, which includes investments of $66.3 million in Houghton Korea; $24.9 million in Primex; $6.3 million in Nippon Japan; and $0.5 million in Kelko Panama. The carrying amount of the Company’s equity investments as of December 31, 2023 was $101.2 million, which includes investments of $72.0 million in Houghton Korea; $22.1 million in Primex; $6.6 million in Nippon Japan; and $0.5 million in Kelko Panama.
Dividends and distributions received from associated companies by investment were $9.1 million, $4.2 million, and $3.0 million in the years ended December 31, 2024, 2023 and 2022.
QUAKER CHEMICAL CORPORATION
NOTES TO CONSOLIDATED FINANCIAL STATEMENTS - Continued
(Dollars in thousands, except per share amounts, unless otherwise stated)
The following table is a summary of equity income in associated companies by investment for the years ending December 31, 2024, 2023 and 2022:
| | | | | | | | | | | | | | | | | |
| |
| 2024 | | 2023 | | 2022 |
| Houghton Korea | $ | 6,795 | | | $ | 11,442 | | | $ | 2,644 | |
| Nippon Japan | 925 | | | 1,492 | | | 323 | |
| Kelko Panama | 321 | | | 309 | | | 425 | |
| | | | | |
| Primex | 2,930 | | | 2,090 | | | (1,427) | |
| Total equity in net income of associated companies | $ | 10,971 | | | $ | 15,333 | | | $ | 1,965 | |
Note 17 – Other Non-Current Assets
Other non-current assets as of December 31, 2024 and 2023 were as follows:
| | | | | | | | | | | |
| 2024 | | 2023 |
| Uncertain tax positions (See Note 10) | $ | 5,334 | | | $ | 5,307 | |
| Pension assets (See Note 20) | 2,245 | | | 3,879 | |
| Debt issuance costs (See Note 19) | 2,374 | | | 3,340 | |
| Interest rate swap (See Note 24) | 1,621 | | | 1,828 | |
| Long-term note receivable | 925 | | | 1,014 | |
| Trust investment | 1,566 | | | 601 | |
| Indemnification assets (See Notes 10 and 21) | 405 | | | 430 | |
| Supplemental retirement income program (See Notes 20 and 23) | 297 | | | 286 | |
| Other | 2,593 | | | 2,085 | |
| Total other non-current assets | $ | 17,360 | | | $ | 18,770 | |
As of December 31, 2024, two of the Company’s foreign pension plans’ fair value of plan assets exceeded its gross benefit obligation and were therefore over-funded, which is represented by the line Pension assets in the table above. As of December 31, 2023, one of the Company’s foreign pension plans’ fair value of plan assets exceeded its gross benefit obligation and was therefore over-funded. Approximately $1.0 million of payments related to the foreign pension plan’s have been made to escrow and are excluded from the plan’s net benefit obligation as of December 31, 2023. No such payments related to this plan has been made to escrow as of December 31, 2024. See Note 20 for additional information.
Note 18 – Other Accrued Liabilities
Other accrued liabilities as of December 31, 2024 and 2023 were as follows:
| | | | | | | | | | | |
| 2024 | | 2023 |
| Non-income taxes | $ | 25,455 | | | $ | 27,295 | |
| Short-term lease liabilities (See Note 6) | 10,619 | | | 11,965 | |
| Selling expenses and freight accruals | 10,716 | | | 7,789 | |
| Current income taxes payable (See Note 10) | 12,772 | | | 14,835 | |
| Professional fees, legal, and acquisition-related accruals | 5,340 | | | 5,577 | |
| Accrued interest (See Note 19) | 1,289 | | | 2,630 | |
| Customer advances and sales return reserves | 3,855 | | | 2,454 | |
| Accrued insurance | 6,041 | | | 2,295 | |
| Accrued environmental reserves (See Note 25) | 1,235 | | | 1,187 | |
| Earnout liability (See Note 2) | 1,160 | | | — | |
| Accrued rent and facilities | 1,129 | | | 1,104 | |
| Accrued non-pension benefits | 833 | | | 581 | |
| Foreign currency forward contracts (See Note 24) | 67 | | | 159 | |
| Other | 157 | | | 12,444 | |
| Total other accrued liabilities | $ | 80,668 | | | $ | 90,315 | |
QUAKER CHEMICAL CORPORATION
NOTES TO CONSOLIDATED FINANCIAL STATEMENTS - Continued
(Dollars in thousands, except per share amounts, unless otherwise stated)
Note 19 – Debt
Debt as of December 31, 2024 and 2023 includes the following:
| | | | | | | | | | | | | | | | | | | | |
| As of December 31, 2024 | | As of December 31, 2023 |
| Interest
Rate | | Outstanding
Balance | | Interest
Rate | Outstanding
Balance |
| Credit Facilities: | | | | | | |
| Revolver | 4.00% | | 48,820 | | | 5.13% | 30,904 | |
| U.S. Term Loan | 5.62% | | 508,863 | | | 6.71% | 561,250 | |
| EURO Term Loan | 4.00% | | 138,767 | | | 5.13% | 152,366 | |
| Industrial development bonds | 5.26% | | 10,000 | | | 5.26% | 10,000 | |
| Bank lines of credit and other debt obligations | Various | | 1,817 | | | Various | 1,092 | |
| Total debt | | | $ | 708,267 | | | | $ | 755,612 | |
| Less: debt issuance costs | | | (1,099) | | | | (1,545) | |
| Less: short-term and current portion of long-term debts | | | (37,554) | | | | (23,444) | |
| Total long-term debt | | | $ | 669,614 | | | | $ | 730,623 | |
Credit facilities
During June 2022, the Company, and its wholly owned subsidiary, Quaker Houghton B.V., as borrowers, Bank of America, N.A., as administrative agent, U.S. Dollar swing line lender and letter of credit issuer, Bank of America Europe Designated Active Company, as Euro Swing Line Lender, certain guarantors and other lenders entered into an amendment to its primary credit facility (the “ Original Credit Facility”). The amended credit facility (“Credit Facility”) established (A) a new $150.0 million Euro equivalent senior secured term loan (the “Euro Term Loan”), (B) a new $600.0 million senior secured term loan (the “U.S. Term Loan”), and (C) a new $500.0 million senior secured revolving credit facility (the “Revolver”), each maturing in June 2027. The Company has the right to increase the amount of the Credit Facility by an aggregate amount not to exceed the greater of $300.0 million or 100% of Consolidated EBITDA, subject to certain conditions including the agreement to provide financing by any lender providing such increase. In addition, the Credit Facility also:
(i) eliminated the requirement that material foreign subsidiaries must guaranty the Original Euro Term Loan;
(ii) replaced the U.S. Dollar borrowings reference rate from LIBOR to SOFR;
(iii) extended the maturity date of the Original Credit Facility from August 2024 to June 2027; and
(iv) effected other less significant changes to the Original Credit Facility.
The Company used the proceeds of the Credit Facility to repay all outstanding loans under the Original Credit Facility, unpaid accrued interest and fees on the closing date under the Original Credit Facility and certain expenses and fees. U.S. Dollar-denominated borrowings under the Credit Facility bear interest, at the Company’s election, at the base rate or term SOFR plus an applicable rate ranging from 1.00% to 1.75% for term SOFR loans and from 0.00% to 0.75% for base rate loans, depending upon the Company’s consolidated net leverage ratio. Loans based on term SOFR also include a spread adjustment equal to 0.10% per annum. Borrowings under the Credit Facility denominated in currencies other than U.S. Dollars bear interest at the alternative currency term rate plus the applicable rate ranging from 1.00% to 1.75%.
The Credit Facility contains affirmative and negative covenants, financial covenants and events of default, including without limitation restrictions on (a) the incurrence of additional indebtedness; (b) investments in and acquisitions of other businesses, lines of business and divisions; (c) the making of dividends or capital stock purchases; and (d) dispositions of assets. Dividends and share repurchases are permitted in annual amounts not exceeding the greater of $75 million annually and 25% of Consolidated EBITDA if there is no default. If the consolidated net leverage ratio is less than 2.50 to 1.00, then the Company is no longer subject to restricted payments.
QUAKER CHEMICAL CORPORATION
NOTES TO CONSOLIDATED FINANCIAL STATEMENTS - Continued
(Dollars in thousands, except per share amounts, unless otherwise stated)
Financial covenants contained in the Credit Facility include a consolidated interest coverage ratio test and a consolidated net leverage ratio test. The consolidated net leverage ratio at the end of a quarter may not be greater than 4.00 to 1.00, subject to a permitted increase during a four-quarter period after certain acquisitions. The Company has the option of replacing the consolidated net leverage ratio test with a consolidated senior net leverage ratio test if the Company issues certain types of unsecured notes, subject to certain limitations. Events of default in the Credit Facility include without limitation defaults for non-payment, breach of representations and warranties, non-performance of covenants, cross-defaults, insolvency, and a change of control in certain circumstances. The occurrence of an event of default under the Credit Facility could result in all loans and other obligations becoming immediately due and payable and the Credit Facility being terminated. As of December 31, 2024 and December 31, 2023, the Company was in compliance with all of the Credit Facility covenants.
The weighted average variable interest rate incurred on the outstanding borrowings under the Credit Facility during the twelve months ended December 31, 2024 was approximately 6.1%. As of December 31, 2024, the interest rate on the outstanding borrowings under the Credit Facility was approximately 5.2%. As part of the Credit Facility, the Company is required to pay an annual commitment fee ranging from 0.150% to 0.275% related to unutilized commitments under the Revolver, depending on the Company’s consolidated net leverage ratio. The Company had unused capacity under the Revolver of approximately $448.7 million, which is net of bank letters of credit of approximately $2.4 million, as of December 31, 2024.
In order to manage the Company’s exposure to variable interest rate risk associated with the Credit Facility, in the first quarter of 2023, the Company entered into $300.0 million notional amounts of three-year interest rate swaps to convert a portion of the Company’s variable rate borrowings into an average fixed rate obligation of 3.64% plus an applicable margin as provided in the Credit Facility based on the Company’s consolidated net leverage ratio. As of December 31, 2024, the aggregate interest rate on the swaps, including the fixed base rate plus the applicable margin, was 4.9%. See Note 24, Hedging Activities, for additional information.
In connection with executing the Credit Facility, the Company recorded a loss on extinguishment of debt of approximately $6.8 million in Other income (expense), net on the Consolidated Statement of Operations during the year ended December 31, 2022. The loss on extinguishment of debt included the write-off of certain previously unamortized deferred financing costs as well as a portion of the third-party and creditor debt issuance costs incurred to execute the Credit Facility. The Company capitalized third-party and credit debt issuance costs attributed to the Euro Term Loan, U.S. Term Loan and Revolver in connection to the amended Credit Facility during the second quarter of 2022. Capitalized costs attributed to the Euro Term Loan and U.S. Term Loan are recorded as a direct offset to Long-term debt on the Consolidated Balance Sheets. Capitalized costs attributed to the Revolver are recorded within Other assets on the Consolidated Balance Sheets. These capitalized costs will collectively be amortized into Interest expense over the five year term of the Credit Facility. As of December 31, 2024 and 2023, the Company had $1.1 million and $1.5 million, respectively, of debt issuance costs recorded as a reduction of Long-term debt and $2.4 million and $3.3 million, respectively, of debt issuance costs recorded within Other assets.
Industrial development bonds
As of December 31, 2024 and 2023, the Company had fixed rate, industrial development authority bonds totaling $10.0 million in principal amount due in 2028. These bonds have similar covenants to the Credit Facility noted above.
Bank lines of credit and other debt obligations
The Company has certain unsecured bank lines of credit and discounting facilities in certain foreign subsidiaries, which are not collateralized. The Company’s other debt obligations primarily consist of certain domestic and foreign low interest rate or interest-free municipality-related loans, local credit facilities of certain foreign subsidiaries and finance lease obligations. Total unused capacity under these arrangements as of December 31, 2024, was approximately $32.9 million.
In addition to the bank letters of credit described in the “Credit facilities” subsection above, the Company’s other off-balance sheet arrangements include certain financial and other guarantees. The Company’s total bank letters of credit and guarantees outstanding as of December 31, 2024 were approximately $6 million.
The Company incurred the following debt related expenses included within Interest expense, net, in the Consolidated Statements of Operations for the years ended December 31, 2024, 2023 and 2022:
| | | | | | | | | | | | | | | | | |
| |
| 2024 | | 2023 | | 2022 |
| Interest expense | $ | 43,223 | | | $ | 53,582 | | | $ | 33,691 | |
| Amortization of debt issuance costs | 1,413 | | | 1,413 | | | 2,942 | |
| Total | $ | 44,636 | | | $ | 54,995 | | | $ | 36,633 | |
QUAKER CHEMICAL CORPORATION
NOTES TO CONSOLIDATED FINANCIAL STATEMENTS - Continued
(Dollars in thousands, except per share amounts, unless otherwise stated)
Based on the variable interest rates associated with the Credit Facility, as of December 31, 2024 and 2023, the amounts at which the Company’s total debt were recorded are not materially different from their fair market value.
As of December 31, 2024, annual principal maturities on long-term borrowings, including the current portion, are as follows:
| | | | | |
| For the year ended December 31, 2025 | $ | 34,318 | |
| For the year ended December 31, 2026 | 34,285 | |
| For the year ended December 31, 2027 | 628,342 | |
| For the year ended December 31, 2028 | 10,269 | |
| For the year ended December 31, 2029 | — | |
| Total maturities on debt in the next five fiscal years | 707,214 | |
Note 20 – Pension and Other Postretirement Benefits
The following table shows the funded status of the Company’s plans’ reconciled with amounts reported in the Consolidated Balance Sheets as of December 31, 2024 and 2023:
| | | | | | | | | | | | | | | | | | | | | | | | | | | | | | | | | | | | | | | | | | | | | | | |
| Pension Benefits | | Other Post-
Retirement Benefits |
| 2024 | | 2023 | | 2024 | | 2023 |
| Foreign | | U.S. | | Total | | Foreign | | U.S. | | Total | | U.S. | | U.S. |
| Change in benefit obligation | | | | | | | | | | | | | | | |
| Gross benefit obligation at beginning of year | $ | 144,779 | | | $ | 79,063 | | | $ | 223,842 | | | $ | 130,554 | | | $ | 79,086 | | | $ | 209,640 | | | $ | 1,343 | | | $ | 1,606 | |
| Service cost | 417 | | | — | | | 417 | | | 399 | | | 28 | | | 427 | | | — | | | — | |
| Interest cost | 5,817 | | | 3,672 | | | 9,489 | | | 6,083 | | | 3,849 | | | 9,932 | | | 61 | | | 69 | |
| | | | | | | | | | | | | | | |
| Effect of plan amendments | — | | | — | | | — | | | — | | | (15) | | | (15) | | | — | | | — | |
| Curtailment (gain) loss | (19) | | | — | | | (19) | | | (213) | | | — | | | (213) | | | — | | | — | |
| | | | | | | | | | | | | | | |
| Benefits paid | (6,377) | | | (6,519) | | | (12,896) | | | (6,086) | | | (6,031) | | | (12,117) | | | (156) | | | (182) | |
| Plan expenses and premiums paid | (36) | | | — | | | (36) | | | — | | | — | | | — | | | — | | | — | |
| | | | | | | | | | | | | | | |
| Actuarial (gain) loss | (6,589) | | | (2,845) | | | (9,434) | | | 7,809 | | | 2,146 | | | 9,955 | | | (61) | | | (150) | |
| Translation differences and other | (6,198) | | | (1) | | | (6,199) | | | 6,233 | | | — | | | 6,233 | | | 26 | | | — | |
| Gross benefit obligation at end of year | $ | 131,794 | | | $ | 73,370 | | | $ | 205,164 | | | $ | 144,779 | | | $ | 79,063 | | | $ | 223,842 | | | $ | 1,213 | | | $ | 1,343 | |
QUAKER CHEMICAL CORPORATION
NOTES TO CONSOLIDATED FINANCIAL STATEMENTS - Continued
(Dollars in thousands, except per share amounts, unless otherwise stated)
| | | | | | | | | | | | | | | | | | | | | | | | | | | | | | | | | | | | | | | | | | | | | | | |
| Pension Benefits | | Other Post-
Retirement Benefits |
| 2024 | | 2023 | | 2024 | | 2023 |
| Foreign | | U.S. | | Total | | Foreign | | U.S. | | Total | | U.S. | | U.S. |
| Change in plan assets | | | | | | | | | | | | | | | |
| Fair value of plan assets at beginning of year | $ | 135,387 | | | $ | 60,967 | | | $ | 196,354 | | | $ | 129,944 | | | $ | 59,591 | | | $ | 189,535 | | | $ | — | | | $ | — | |
| Actual return on plan assets | (3,003) | | | 1,349 | | | (1,654) | | | 4,474 | | | 4,640 | | | 9,114 | | | — | | | — | |
| Employer contributions | 2,043 | | | 3,751 | | | 5,794 | | | 1,566 | | | 2,767 | | | 4,333 | | | 156 | | | 182 | |
| | | | | | | | | | | | | | | |
| | | | | | | | | | | | | | | |
| Benefits paid | (6,377) | | | (6,519) | | | (12,896) | | | (6,086) | | | (6,031) | | | (12,117) | | | (156) | | | (182) | |
| Plan expenses and premiums paid | (36) | | | — | | | (36) | | | — | | | — | | | — | | | — | | | — | |
| Translation differences | (5,051) | | | — | | | (5,051) | | | 5,489 | | | — | | | 5,489 | | | — | | | — | |
| Fair value of plan assets at end of year | $ | 122,963 | | | $ | 59,548 | | | $ | 182,511 | | | $ | 135,387 | | | $ | 60,967 | | | $ | 196,354 | | | $ | — | | | $ | — | |
| Net benefit obligation recognized | $ | (8,831) | | | $ | (13,822) | | | $ | (22,653) | | | $ | (9,392) | | | $ | (18,096) | | | $ | (27,488) | | | $ | (1,213) | | | $ | (1,343) | |
| | | | | | | | | | | | | | | |
| Amounts recognized in the balance sheet consist of: | | | | | | | | | | | | | | | |
| Non-current assets | $ | 2,245 | | | $ | — | | | $ | 2,245 | | | $ | 2,834 | | | $ | — | | | $ | 2,834 | | | $ | — | | | $ | — | |
| Current liabilities | (400) | | | (1,758) | | | (2,158) | | | (273) | | | (1,757) | | | (2,030) | | | (170) | | | (178) | |
| Non-current liabilities | (10,676) | | | (12,064) | | | (22,740) | | | (11,953) | | | (16,339) | | | (28,292) | | | (1,043) | | | (1,165) | |
| Net benefit obligation recognized | $ | (8,831) | | | $ | (13,822) | | | $ | (22,653) | | | $ | (9,392) | | | $ | (18,096) | | | $ | (27,488) | | | $ | (1,213) | | | $ | (1,343) | |
| Amounts not yet reflected in net periodic benefit costs and included in accumulated other comprehensive loss: | | | | | | | | | | | | | | | |
| Prior service cost | (265) | | | — | | | (265) | | | (353) | | | — | | | (353) | | | — | | | — | |
| Accumulated (loss) gain | (19,775) | | | 3,905 | | | (15,870) | | | (19,117) | | | 2,248 | | | (16,869) | | | 1,199 | | | 1,241 | |
| | | | | | | | | | | | | | | |
| AOCI | (20,040) | | | 3,905 | | | (16,135) | | | (19,470) | | | 2,248 | | | (17,222) | | | 1,199 | | | 1,241 | |
| Cumulative employer contributions in excess of or (below) net periodic benefit cost | 11,209 | | | (17,727) | | | (6,518) | | | 10,078 | | | (20,344) | | | (10,266) | | | (2,412) | | | (2,584) | |
| Net benefit obligation recognized | $ | (8,831) | | | $ | (13,822) | | | $ | (22,653) | | | $ | (9,392) | | | $ | (18,096) | | | $ | (27,488) | | | $ | (1,213) | | | $ | (1,343) | |
The accumulated benefit obligation for all defined benefit pension plans was $199.9 million ($73.4 million U.S. and $126.5 million Foreign) and $217.5 million ($79.1 million U.S. and $138.4 million Foreign) as of December 31, 2024 and 2023, respectively.
Information for pension plans with an accumulated benefit obligation in excess of plan assets:
| | | | | | | | | | | | | | | | | | | | | | | | | | | | | | | | | | | |
| 2024 | | 2023 |
| Foreign | | U.S. | | Total | | Foreign | | U.S. | | Total |
| Accumulated benefit obligation | 72,836 | | | 73,370 | | | 146,206 | | | 75,402 | | | 79,063 | | | 154,465 | |
| Fair value of plan assets | 66,838 | | | 59,548 | | | 126,386 | | | 69,419 | | | 60,967 | | | 130,386 | |
QUAKER CHEMICAL CORPORATION
NOTES TO CONSOLIDATED FINANCIAL STATEMENTS - Continued
(Dollars in thousands, except per share amounts, unless otherwise stated)
Information for pension plans with a projected benefit obligation in excess of plan assets:
| | | | | | | | | | | | | | | | | | | | | | | | | | | | | | | | | | | |
| 2024 | | 2023 |
| Foreign | | U.S. | | Total | | Foreign | | U.S. | | Total |
| Projected benefit obligation | $ | 77,914 | | | $ | 73,370 | | | $ | 151,284 | | | $ | 93,733 | | | $ | 79,063 | | | $ | 172,796 | |
| Fair value of plan assets | 66,838 | | | 59,548 | | | 126,386 | | | 81,507 | | | 60,967 | | | 142,474 | |
Components of net periodic benefit costs – pension plans:
| | | | | | | | | | | | | | | | | | | | | | | | | | | | | | | | | | | |
| 2024 | | 2023 |
| Foreign | | U.S. | | Total | | Foreign | | U.S. | | Total |
| Service cost | $ | 417 | | | $ | — | | | $ | 417 | | | $ | 399 | | | $ | 28 | | | $ | 427 | |
| Interest cost | 5,817 | | | 3,672 | | | 9,489 | | | 6,083 | | | 3,849 | | | 9,932 | |
| Expected return on plan assets | (5,571) | | | (2,562) | | | (8,133) | | | (5,271) | | | (2,799) | | | (8,070) | |
| | | | | | | | | | | |
| Curtailment (gain) loss | (19) | | | — | | | (19) | | | (213) | | | 15 | | | (198) | |
| Actuarial loss amortization | 481 | | | 24 | | | 505 | | | 388 | | | 22 | | | 410 | |
| Prior service cost amortization | 27 | | | (1) | | | 26 | | | 28 | | | 6 | | | 34 | |
| Net periodic benefit cost | $ | 1,152 | | | $ | 1,133 | | | $ | 2,285 | | | $ | 1,414 | | | $ | 1,121 | | | $ | 2,535 | |
| | | | | | | | | | | | | | | | | |
| 2022 |
| Foreign | | U.S. | | Total |
| Service cost | $ | 465 | | | $ | 47 | | | $ | 512 | |
| Interest cost | 3,079 | | | 2,145 | | | 5,224 | |
| Expected return on plan assets | (4,472) | | | (3,509) | | | (7,981) | |
| Settlement gain | (71) | | | — | | | (71) | |
| Curtailment charge | 207 | | | — | | | 207 | |
| Actuarial loss amortization | 658 | | | 323 | | | 981 | |
| Prior service credit amortization | 3 | | | 7 | | | 10 | |
| Net periodic benefit income | $ | (131) | | | $ | (987) | | | $ | (1,118) | |
Other changes recognized in other comprehensive income – pension plans:
| | | | | | | | | | | | | | | | | | | | | | | | | | | | | | | | | | | |
| 2024 | | 2023 |
| Foreign | | U.S. | | Total | | Foreign | | U.S. | | Total |
| Net loss (gain) arising during the period | $ | 1,985 | | | $ | (1,631) | | | $ | 354 | | | $ | 8,605 | | | $ | 398 | | | $ | 9,003 | |
| | | | | | | | | | | |
| | | | | | | | | | | |
| Settlement loss | — | | | (24) | | | (24) | | | — | | | (23) | | | (23) | |
| Prior service cost | — | | | — | | | — | | | — | | | (15) | | | (15) | |
| Actuarial loss | (481) | | | — | | | (481) | | | (388) | | | (92) | | | (480) | |
| Curtailment recognition | (27) | | | — | | | (27) | | | (28) | | | — | | | (28) | |
| Effect of exchange rates on amounts included in AOCI | (908) | | | — | | | (908) | | | 560 | | | — | | | 560 | |
| Total recognized in other comprehensive loss (income) | 569 | | | (1,655) | | | (1,086) | | | 8,749 | | | 268 | | | 9,017 | |
| Total recognized in net periodic benefit cost and other comprehensive loss (income) | $ | 1,721 | | | $ | (521) | | | $ | 1,200 | | | $ | 10,163 | | | $ | 1,389 | | | $ | 11,552 | |
QUAKER CHEMICAL CORPORATION
NOTES TO CONSOLIDATED FINANCIAL STATEMENTS - Continued
(Dollars in thousands, except per share amounts, unless otherwise stated)
| | | | | | | | | | | | | | | | | |
| 2022 |
| Foreign | | U.S. | | Total |
| Net gain arising during period | $ | (7,008) | | | $ | (3,555) | | | $ | (10,563) | |
| Settlement loss | — | | | (323) | | | (323) | |
| Prior service credit (cost) | 303 | | | (7) | | | 296 | |
| Actuarial (loss) gain | (587) | | | 1,247 | | | 660 | |
| Curtailment recognition | (3) | | | — | | | (3) | |
| Effect of exchange rates on amounts included in AOCI | (1,169) | | | — | | | (1,169) | |
| Total recognized in other comprehensive income | (8,464) | | | (2,638) | | | (11,102) | |
| Total recognized in net periodic benefit cost and other comprehensive income | $ | (8,595) | | | $ | (3,625) | | | $ | (12,220) | |
Components of net periodic benefit costs – other postretirement plan:
| | | | | | | | | | | | | | | | | |
| 2024 | | 2023 | | 2022 |
| Service cost | $ | — | | | $ | — | | | $ | — | |
| Interest cost | 61 | | | 69 | | | 37 | |
| Actuarial gain amortization | (102) | | | (128) | | | (79) | |
| Prior service credit amortization | — | | | (16) | | | (32) | |
| Net periodic benefit costs | $ | (41) | | | $ | (75) | | | $ | (74) | |
Other changes recognized in other comprehensive income – other postretirement benefit plans:
| | | | | | | | | | | | | | | | | |
| 2024 | | 2023 | | 2022 |
| Net gain arising during period | $ | (61) | | | $ | (150) | | | $ | (263) | |
| Recognition of amortizations in net periodic benefit cost | — | | | — | | | (2) | |
| Prior service credit | — | | | 16 | | | 32 | |
| Actuarial gain amortization | 102 | | | 127 | | | 79 | |
| Total recognized in other comprehensive loss (income) | 41 | | | (7) | | | (154) | |
| Total recognized in net periodic benefit cost and other comprehensive loss (income) | $ | — | | | $ | (82) | | | $ | (228) | |
Weighted-average assumptions used to determine benefit obligations as of December 31, 2024 and 2023:
| | | | | | | | | | | | | | | | | | | | | | | |
| Pension Benefits | | Other Postretirement
Benefits |
| 2024 | | 2023 | | 2024 | | 2023 |
| U.S. Plans | | | | | | | |
| Discount rate | 5.49% | | 4.94% | | 5.34% | | 4.87% |
| Rate of compensation increase | N/A | | N/A | | N/A | | N/A |
| | | | | | | |
| Foreign Plans | | | | | | | |
| Discount rate | 4.64% | | 4.35% | | N/A | | N/A |
| Rate of compensation increase | 3.33% | | 3.27% | | N/A | | N/A |
QUAKER CHEMICAL CORPORATION
NOTES TO CONSOLIDATED FINANCIAL STATEMENTS - Continued
(Dollars in thousands, except per share amounts, unless otherwise stated)
Weighted-average assumptions used to determine net periodic benefit costs for the years ended December 31, 2024, 2023 and 2022:
| | | | | | | | | | | | | | | | | | | | | | | | | | | | | | | | | | | |
| Pension Benefits | | Other Postretirement
Benefits |
| 2024 | | 2023 | | 2022 | | 2024 | | 2023 | | 2022 |
| U.S. Plans | | | | | | | | | | | |
| Discount rate | 4.94 | % | | 5.21 | % | | 2.67 | % | | 4.87 | % | | 5.15 | % | | 2.45 | % |
| Expected long-term return on plan assets | 5.50 | % | | 5.50 | % | | 5.75 | % | | N/A | | N/A | | N/A |
| Rate of compensation increase | N/A | | N/A | | N/A | | N/A | | N/A | | N/A |
| | | | | | | | | | | |
| Foreign Plans | | | | | | | | | | | |
| Discount rate | 4.33 | % | | 4.77 | % | | 3.97 | % | | N/A | | N/A | | N/A |
| Expected long-term return on plan assets | 4.20 | % | | 4.03 | % | | 2.26 | % | | N/A | | N/A | | N/A |
| Rate of compensation increase | 3.26 | % | | 3.38 | % | | 3.21 | % | | N/A | | N/A | | N/A |
The long-term rates of return on assets were selected from within the reasonable range of rates determined by (a) historical real returns for the asset classes covered by the investment policy and (b) projections of inflation over the long-term period during which benefits are payable to plan participants. See Note 1, Basis of Presentation and Significant Accounting Policies, for additional information.
Assumed health care cost trend rates as of December 31, 2024, 2023 and 2022:
| | | | | | | | | | | | | | | | | |
| 2024 | | 2023 | | 2022 |
| Health care cost trend rate for next year | 7.05 | % | | 6.87 | % | | 5.60 | % |
| Rate to which the cost trend rate is assumed to decline (the ultimate trend rate) | 4.00 | % | | 4.00 | % | | 4.00 | % |
| Year that the rate reaches the ultimate trend rate | 2049 | | 2048 | | 2047 |
Plan Assets and Fair Value
The Company’s pension plan target asset allocation and the weighted-average asset allocations as of December 31, 2024 and 2023 by asset category were as follows:
| | | | | | | | | | | | | | | | | |
| Asset Category | Target | | 2024 | | 2023 |
| U.S. Plans | | | | | |
| Equity securities | 30 | % | | 27 | % | | 23 | % |
| Debt securities | 70 | % | | 71 | % | | 70 | % |
| Other | — | % | | 2 | % | | 7 | % |
| Total | 100 | % | | 100 | % | | 100 | % |
| | | | | |
| Foreign Plans | | | | | |
| Equity securities | 17 | % | | 18 | % | | 15 | % |
| Debt securities | 65 | % | | 62 | % | | 63 | % |
| Other | 18 | % | | 20 | % | | 22 | % |
| Total | 100 | % | | 100 | % | | 100 | % |
As of December 31, 2024 and 2023, “Other” consisted principally of cash and cash equivalents, and investments in real estate funds.
The following is a description of the valuation methodologies used for the investments measured at fair value, including the general classification of such instruments pursuant to the fair value hierarchy, where applicable (refer to Note 1, Basis of Presentation and Significant Accounting Policies, for a definition of the levels of the fair value hierarchy):
Cash and Cash Equivalents
Cash and cash equivalents consist of cash and money market funds and are classified as Level 1 investments.
QUAKER CHEMICAL CORPORATION
NOTES TO CONSOLIDATED FINANCIAL STATEMENTS - Continued
(Dollars in thousands, except per share amounts, unless otherwise stated)
Commingled Funds
Investments in the U.S. pooled separate accounts consist primarily of mutual funds, each of which follows a separate investment strategy, and are valued based on the reported unit value at year end. Foreign pension plan commingled funds represent pooled institutional investments, including primarily collective investment trusts. These commingled funds are not available on an exchange or in an active market and these investments are valued using their net asset value (“NAV”), which is generally based on the underlying asset values of the investments held in the trusts. As of December 31, 2024, the foreign pension plan commingled funds included approximately 37 percent of investments in equity securities, 48 percent of investments in fixed income securities, and 15 percent of other non-related investments, primarily real estate. As of December 31, 2023, the foreign pension plan commingled funds included approximately 35 percent of investments in equity securities, 50 percent of investments in fixed income securities, and 14 percent of other non-related investments, primarily real estate.
Pooled Separate Accounts
Investments in the U.S. pension plan pooled separate accounts consist of annuity contracts and are valued based on the reported unit value at year end. Units of the pooled separate account are not traded on an exchange or in an active market; however, valuation is based on the underlying investments of each pooled separate account and are classified as Level 2 investments. As of December 31, 2024, the U.S. pension plan pooled separate accounts included approximately 28 percent of investments in equity securities and 72 percent of investments in fixed income securities.
Fixed Income Government Securities
Investments in foreign pension plans fixed income government securities were valued using third party pricing services which are based on a combination of quoted market prices on an exchange in an active market as well as proprietary pricing models and inputs using observable market data and are classified as Level 2 investments.
Insurance Contract
The Company’s foreign pension plans invest in two separate insurance contracts. Investments in the first foreign pension plan insurance contract are valued at the highest value available for the Company at year end, either the reported cash surrender value of the contract or the vested benefit obligation. Both the cash surrender value and the vested benefit obligation are determined based on unobservable inputs, which are contractually or actuarially determined, regarding returns, fees, the present value of the future cash flows of the contract and benefit obligations.
During 2023, one of the Company’s foreign pension plans invested in an insurance contract that is valued at the value available for the Company at year end (i.e. the vested benefit obligation). The vested benefit obligation is determined based on unobservable inputs, which are actuarially determined, regarding returns, the present value of the future cash flows of the contract and benefit obligations. Both this contract and the contract described above are classified as Level 3 investments.
Diversified Equity Securities - Registered Investment Companies
Investments in the foreign pension plans diversified equity securities of registered investment companies are based upon the quoted redemption value of shares in the fund owned by the plan at year end. The shares of the fund are not available on an exchange or in an active market; however, the fair value is determined based on the underlying investments in the fund as traded on an exchange in an active market and are classified as Level 2 investments.
Fixed Income – Foreign Registered Investment Companies
Investments in the foreign pension plans fixed income securities of foreign registered investment companies are based upon the quoted redemption value of shares in the fund owned by the plan at year end. The shares of the fund are not available on an exchange or in an active market; however, the fair value is determined based on the underlying investments in the fund as traded on an exchange in an active market and are classified as Level 2 investments.
Diversified Investment Fund - Registered Investment Companies
Investments in the foreign pension plan diversified investment fund of registered investment companies are based upon the quoted redemption value of shares in the fund owned by the plan at year end. This fund is not available on an exchange or in an active market and this investment is valued using its NAV, which is generally based on the underlying asset values of the investments held. There were no such investments as of December 31, 2024 and 2023.
QUAKER CHEMICAL CORPORATION
NOTES TO CONSOLIDATED FINANCIAL STATEMENTS - Continued
(Dollars in thousands, except per share amounts, unless otherwise stated)
Other – Alternative Investments
Investments in the foreign pension plans include certain other alternative investments such as inflation and interest rate swaps. These investments are valued based on unobservable inputs, which are contractually or actuarially determined, regarding returns, fees, the present value of future cash flows of the contract and benefit obligations. These alternative investments are classified as Level 3 investments.
Real Estate
The U.S. and foreign pension plans’ investment in real estate consists of investments in property funds. The funds’ underlying investments consist of real property which are valued using unobservable inputs. These property funds are classified as Level 3 investments.
As of December 31, 2024 and 2023, the U.S. and foreign plans’ investments measured at fair value on a recurring basis were as follows:
| | | | | | | | | | | | | | | | | | | | | | | | | | | |
| | | | Fair Value Measurements at December 31, 2024 | |
| | Total
Fair Value | | Using Fair Value Hierarchy | |
| U.S. Pension Assets | | | Level 1 | | Level 2 | | Level 3 | |
| Pooled separate accounts | | $ | 58,454 | | | $ | — | | | $ | 58,454 | | | $ | — | | |
| Real estate | | 1,094 | | | — | | | — | | | 1,094 | | |
| Subtotal U.S. pension plan assets in fair value hierarchy | | $ | 59,548 | | | $ | — | | | $ | 58,454 | | | $ | 1,094 | | |
| Total U.S. pension plan assets | | $ | 59,548 | | | | | | | | |
| | | | | | | | | |
| Foreign Pension Assets | | | | | | | | | |
| Cash and cash equivalents | | $ | 1,014 | | | $ | 1,014 | | | $ | — | | | $ | — | | |
| Insurance contract | | 107,797 | | | — | | | — | | | 107,797 | | |
| Diversified equity securities - registered investment companies | | 2,045 | | | — | | | 2,045 | | | — | | |
| Fixed income – foreign registered investment companies | | 8,355 | | | — | | | 8,355 | | | — | | |
| Real estate | | 1,717 | | | — | | | — | | | 1,717 | | |
| Subtotal foreign pension assets in fair value hierarchy | | $ | 120,928 | | | $ | 1,014 | | | $ | 10,400 | | | $ | 109,514 | | |
| Commingled funds measured at NAV | | 2,035 | | | | | | | | |
| Total foreign pension assets | | $ | 122,963 | | | | | | | | |
| | | | | | | | | |
| Total pension assets in fair value hierarchy | | $ | 180,476 | | | $ | 1,014 | | | $ | 68,854 | | | $ | 110,608 | | |
| Total pension assets measured at NAV | | 2,035 | | | | | | | | |
| Total pension assets | | $ | 182,511 | | | | | | | | |
QUAKER CHEMICAL CORPORATION
NOTES TO CONSOLIDATED FINANCIAL STATEMENTS - Continued
(Dollars in thousands, except per share amounts, unless otherwise stated)
| | | | | | | | | | | | | | | | | | | | | | | | | | | |
| | | | Fair Value Measurements at December 31, 2023 | |
| | Total
Fair Value | | Using Fair Value Hierarchy | |
| U.S. Pension Assets | | | Level 1 | | Level 2 | | Level 3 | |
| Pooled separate accounts | | $ | 56,820 | | | $ | — | | | $ | 56,820 | | | $ | — | | |
| Real estate | | 4,147 | | | — | | | — | | | 4,147 | | |
| Subtotal U.S. pension plan assets in fair value hierarchy | | $ | 60,967 | | | $ | — | | | $ | 56,820 | | | $ | 4,147 | | |
| Total U.S. pension plan assets | | $ | 60,967 | | | | | | | | |
| | | | | | | | | |
| Foreign Pension Assets | | | | | | | | | |
| Cash and cash equivalents | | $ | 1,582 | | | $ | 1,582 | | | $ | — | | | $ | — | | |
| Insurance contract | | 118,393 | | | — | | | — | | | 118,393 | | |
| Diversified equity securities - registered investment companies | | 1,892 | | | — | | | 1,892 | | | — | | |
| Fixed income – foreign registered investment companies | | 9,676 | | | — | | | 9,676 | | | — | | |
| | | | | | | | | |
| Real estate | | 1,771 | | | — | | | — | | | 1,771 | | |
| | | | | | | | | |
| Subtotal foreign pension assets in fair value hierarchy | | $ | 133,314 | | | $ | 1,582 | | | $ | 11,568 | | | $ | 120,164 | | |
| Commingled funds measured at NAV | | 2,073 | | | | | | | | |
| Total foreign pension assets | | $ | 135,387 | | | | | | | | |
| | | | | | | | | |
| Total pension assets in fair value hierarchy | | $ | 194,281 | | | $ | 1,582 | | | $ | 68,388 | | | $ | 124,311 | | |
| Total pension assets measured at NAV | | 2,073 | | | | | | | | |
| Total pension assets | | $ | 196,354 | | | | | | | | |
During the third quarter of 2023, one of the Company’s pension plans in the U.K. liquidated approximately $50 million of its invested assets and subsequently funded and entered into an insurance annuity contract, which will provide for the pension plan’s defined benefit obligations to participants.
Certain investments that are measured at fair value using the NAV per share (or its equivalent) have not been classified in the fair value hierarchy. The fair value amounts presented for these investments in the preceding tables are intended to permit reconciliation of the fair value hierarchies to the line items presented in the statements of net assets available for benefits.
Changes in the fair value of the plans’ Level 3 investments during the years ended December 31, 2024 and 2023 were as follows:
| | | | | | | | | | | | | | | | | | | | | |
| Insurance
Contract | | Real Estate | | | | Total |
| Balance as of December 31, 2022 | $ | 59,963 | | | $ | 8,902 | | | | | $ | 68,865 | |
| Purchases (Sales) | 47,640 | | | (303) | | | | | 47,337 | |
| | | | | | | |
| Unrealized gains (losses) | 7,621 | | | (2,867) | | | | | 4,754 | |
| Currency translation adjustment | 3,169 | | | 186 | | | | | 3,355 | |
| Balance as of December 31, 2023 | 118,393 | | | 5,918 | | | | | 124,311 | |
| Sales | (1,310) | | | (2,952) | | | | | (4,262) | |
| Unrealized losses | (4,620) | | | (128) | | | | | (4,748) | |
| Currency translation adjustment | (4,666) | | | (27) | | | | | (4,693) | |
| Balance as of December 31, 2024 | $ | 107,797 | | | $ | 2,811 | | | | | $ | 110,608 | |
QUAKER CHEMICAL CORPORATION
NOTES TO CONSOLIDATED FINANCIAL STATEMENTS - Continued
(Dollars in thousands, except per share amounts, unless otherwise stated)
The Company contributes to a multiemployer defined benefit pension plan under terms of a collective bargaining union contract (the Cleveland Bakers and Teamsters Pension Fund, Employer Identification Number: 34-0904419-001). The expiration date of the collective bargaining contract is May 1, 2025. As of January 1, 2024, the last valuation date available for the multiemployer plan, total plan liabilities were approximately $555 million. As of December 31, 2023, the multiemployer pension plan had total plan assets of approximately $348 million. The Company’s contribution rate to the multiemployer pension plan is specified in the collective bargaining union contract and contributions are made to the plan based on its union employee payroll. The Company contributed $0.1 million during the year ended December 31, 2024. The Employee Retirement Income Security Act of 1974, as amended by the Multi-Employer Pension Plan Amendments Act of 1980, imposes certain contingent liabilities upon an employer who is a contributor to a multiemployer pension plan if the employer withdraws from the plan or the plan is terminated or experiences a mass withdrawal. In connection with a site closure, the Company intends to withdraw from the multiemployer pension plan during the first half of 2025 and will be charged for its share of the multiemployer pension plan’s unfunded liability. The Company will record a withdrawal liability once an amount is determined and reasonably estimable in 2025. While the Company may also have additional liabilities imposed by law as a result of its participation in the multiemployer defined benefit pension plan, there is no liability as of December 31, 2024.
The Pension Protection Act of 2006 (the “PPA”) also added special funding and operational rules generally applicable to plan years beginning after 2007 for multiemployer plans with certain classifications based on a multitude of factors (including, for example, the plan’s funded percentage, cash flow position and whether the plan is projected to experience a minimum funding deficiency). The plan to which the Company contributes is in “critical” status. Plans in the “critical” status classification must adopt measures to improve their funded status through a funding improvement or rehabilitation plan which may require additional contributions from employers (which may take the form of a surcharge on benefit contributions) and/or modifications to retiree benefits. The amount of additional funds that the Company may be obligated to contribute to the plan in the future cannot be estimated as such amounts will be likely based on future levels of work that require the specific use of those union employees covered by the plan, and the amount of that future work and the number of affected employees that may be needed is not reasonably estimable.
Cash Flows
Contributions
The Company expects to make cash contributions of approximately $6.0 million to its pension plans (approximately $3.3 million U.S. and $2.7 million Foreign) and approximately $0.2 million to its other postretirement benefit plan in 2025.
Estimated Future Benefit Payments
Excluding any impact related to the PPA noted above, the following benefit payments, which reflect expected future service, as appropriate, are expected to be paid:
| | | | | | | | | | | | | | | | | | | | | | | |
| Pension Benefits | | Other Post-
Retirement
Benefits |
| Foreign | | U.S. | | Total | |
| 2025 | $ | 6,354 | | | $ | 7,958 | | | $ | 14,312 | | | $ | 170 | |
| 2026 | 7,099 | | | 6,930 | | | 14,029 | | | 161 | |
| 2027 | 6,800 | | | 6,247 | | | 13,047 | | | 140 | |
| 2028 | 6,945 | | | 6,173 | | | 13,118 | | | 130 | |
| 2029 | 8,453 | | | 6,070 | | | 14,523 | | | 120 | |
| 2030 to 2034 | 43,345 | | | 28,280 | | | 71,625 | | | 469 | |
The Company maintains a plan under which supplemental retirement benefits are provided to certain officers. Benefits payable under the plan are based on a combination of years of service and existing postretirement benefits. Included in total pension costs are charges of $0.6 million for both the years ended December 31, 2024 and 2023, respectively, and $0.7 million for the year ended December 31, 2022, representing the annual accrued benefits under this plan.
QUAKER CHEMICAL CORPORATION
NOTES TO CONSOLIDATED FINANCIAL STATEMENTS - Continued
(Dollars in thousands, except per share amounts, unless otherwise stated)
Defined Contribution Plan
The Company sponsors various defined contribution plans in both its U.S. and non-U.S. subsidiaries, under which eligible participants may defer a portion of their compensation up to the allowable amount as determined by the plan. All contributions and Company matches are invested at the direction of the participant. The most significant plan is the Company's primary U.S. 401(k) plan with an employer match covering a majority of its U.S. employees. Beginning in April 2020 and continuing through March 2021, the Company matched both non-elective and elective 401(k) contributions in fully vested shared of the Company’s common stock rather than cash. See Note 8, Equity, for additional information. Total Company contributions under this U.S. 401(k) plan were $6.6 million, $6.1 million and $7.2 million for the years ended December 31, 2024, 2023 and 2022, respectively.
Note 21 – Other Non-Current Liabilities
Other non-current liabilities as of December 31, 2024 and 2023 were as follows:
| | | | | | | | | | | |
| 2024 | | 2023 |
| Uncertain tax positions, including interest and penalties (See Note 10) | $ | 17,257 | | | $ | 19,630 | |
| Non-current income taxes payable (See Note 10) | — | | | 4,695 | |
| Environmental reserves (See Note 25) | 2,941 | | | 3,874 | |
| Deferred and other long-term compensation | 2,833 | | | 2,871 | |
| Acquisition-related earnout liability (See Note 2) | — | | | 475 | |
| | | |
| Other | 1,414 | | | 260 | |
| Total other non-current liabilities | $ | 24,445 | | | $ | 31,805 | |
Note 22 – Accumulated Other Comprehensive Loss
The following table shows the reclassifications from and resulting balances of AOCI for the years ended December 31, 2024, 2023 and 2022:
| | | | | | | | | | | | | | | | | | | | | | | | | | | | | |
| Currency
Translation
Adjustments | | Defined
Benefit
Pension
Plans | | Unrealized
Gain (Loss) in
Available-for-
Sale Securities | | Derivative
Instruments | | Total |
| Balance as of December 31, 2021 | $ | (49,843) | | | $ | (13,172) | | | $ | 397 | | | $ | (1,372) | | | $ | (63,990) | |
| Other comprehensive income (loss) before reclassifications | (82,318) | | | 10,789 | | | (3,276) | | | — | | | (74,805) | |
| Amounts reclassified from AOCI | — | | | 479 | | | 895 | | | 1,372 | | | 2,746 | |
| Related tax amounts | — | | | (2,691) | | | 500 | | | — | | | (2,191) | |
| Balance as of December 31, 2022 | (132,161) | | | (4,595) | | | (1,484) | | | — | | | (138,240) | |
| Other comprehensive income (loss) before reclassifications | 16,744 | | | (7,702) | | | 1,753 | | | 1,828 | | | 12,623 | |
| Amounts reclassified from AOCI | — | | | (464) | | | 547 | | | — | | | 83 | |
| Related tax amounts | — | | | 2,023 | | | (483) | | | (421) | | | 1,119 | |
| Balance as of December 31, 2023 | (115,417) | | | (10,738) | | | 333 | | | 1,407 | | | (124,415) | |
| Other comprehensive income (loss) before reclassifications | (77,424) | | | 250 | | | (44) | | | (207) | | | (77,425) | |
| Amounts reclassified from AOCI | | | 265 | | | (14) | | | — | | | 251 | |
| Related tax amounts | — | | | (90) | | | 12 | | | 48 | | | (30) | |
| Balance as of December 31, 2024 | $ | (192,841) | | | $ | (10,313) | | | $ | 287 | | | $ | 1,248 | | | $ | (201,619) | |
All reclassifications related to Unrealized (loss) gain on available-for-sale securities relate to the Company’s equity interest in a captive insurance company and are recorded in Equity in net income of associated companies. The amounts reported in Other comprehensive (loss) income for non-controlling interest are related to currency translation adjustments.
Note 23 – Fair Value Measures
Fair value is defined as an exit price, or the price that would be received to sell an asset or paid to transfer a liability in an orderly transaction between market participants at the measurement date. The fair value hierarchy prioritizes the inputs to valuation techniques used to measure fair value into three broad levels as follows:
• Level 1 - Quoted prices (unadjusted) in active markets for identical assets or liabilities.
QUAKER CHEMICAL CORPORATION
NOTES TO CONSOLIDATED FINANCIAL STATEMENTS - Continued
(Dollars in thousands, except per share amounts, unless otherwise stated)
• Level 2 - Inputs that are observable for the asset or liability, either directly or indirectly through market corroboration, for substantially the full term of the asset or liability.
• Level 3 - Inputs that are unobservable for the asset or liability based on our own assumptions about the assumptions market participants would use in pricing the asset or liability.
Refer to Note 24, Hedging Activities, for a description of the Company’s derivative instruments including the valuation techniques used to determine fair value and support for their classification within Level 2 of the fair value hierarchy.
The Company values its company-owned life insurance policies at fair value based on quotes for like instruments with similar credit ratings and terms. During June 2023, the Company surrendered and liquidated $1.9 million of these life insurance policies. As a result, the Company owns an immaterial remaining amount of company-owned life insurance policies as of the year ended December 31, 2024.
The Company did not own any Level 3 investments as of December 31, 2024 and 2023, respectively.
Items Measured at Fair Value on Nonrecurring Basis
The Company is also required to measure certain items, including intangible assets and goodwill, at fair value on a nonrecurring basis. For non-observable market values, the Company determines fair value using acceptable valuation principles, including the excess earnings, relief from royalty, lost profit, or cost methods. The determination of the estimated fair values of intangible assets and goodwill requires management’s judgment and involves the use of significant estimates and assumptions, including revenue growth rates, gross margin levels, operating expenses, the weighted average cost of capital (“WACC”), and royalty rates, among other items. Significant unobservable inputs used to estimate the fair values as of the Company’s October 1, 2024 goodwill impairment assessment included WACCs of 10.0%, 10.5% and 10.0% for the Company’s Americas, EMEA and Asia/Pacific reporting units, respectively. See Note 15, Goodwill and Other Intangible Assets, for additional information.
Note 24 – Hedging Activities
The Company’s ongoing business operations expose it to various risks, including fluctuating foreign exchange rates and interest rate risk. To manage these risks, the Company periodically enters into derivative financial instruments, such as foreign exchange forward contracts and interest rate swap agreements. The Company does not hold or enter into derivative financial instruments for trading or speculative purposes.
Foreign Exchange Forward Contracts
The Company uses foreign exchange forward contracts to economically hedge the impact of the variability in exchange rates on certain assets and/or liabilities denominated in foreign currencies. These forward contracts are marked-to-market at each reporting date. Changes in the fair value of the underlying instrument and settlements are recognized in earnings in Other income (expense), net. The fair value of the forward contract is determined from sources independent of the Company, including the financial institutions which are party to the derivative instruments.
Open foreign exchange forward contracts as of December 31, 2024 were entered into as hedges of Japanese yen and Mexican peso against the U.S. dollar and had the following notional U.S. dollar values:
| | | | | | | | |
| Currency | | December 31,
2024 |
| Mexican Peso | | $ | 17,800 | |
| Japanese Yen | | 4,500 | |
| Total | | $ | 22,300 | |
Open foreign exchange forward contracts as of December 31, 2024 had maturities occurring over a period of one month.
Interest Rate Swaps
In order to manage the Company’s exposure to variable interest rate risk associated with the Credit Facility, such as the Secured Overnight Financing Rate (“SOFR”), in the first quarter of 2023, the Company entered into $300.0 million notional amounts of three year interest rate swaps to convert a portion of the Company’s variable rate borrowings into a fixed rate obligation. See Note 19, Debt, for additional information.
QUAKER CHEMICAL CORPORATION
NOTES TO CONSOLIDATED FINANCIAL STATEMENTS - Continued
(Dollars in thousands, except per share amounts, unless otherwise stated)
These interest rate swaps are designated as cash flow hedges and, as such, the contracts are marked-to-market at each reporting date and any unrealized gains or losses are included in AOCI to the extent effective and reclassified to interest expense in the period during which the hedged transaction affects earnings or it becomes probable that the forecasted transaction will not occur. Interest rate swaps are entered into with a limited number of counterparties within several tranches, each of which allows for net settlement of all contracts through a single payment to participating counterparties in a single currency in the event of a default or termination of any one contract. As such, in accordance with the Company’s accounting policy, these derivative instruments are recorded on a net basis within the Consolidated Balance Sheets.
The fair value of the Company’s interest rate swaps and forward exchange contracts is determined from sources independent of the Company, including the financial institutions which are party to the derivative instruments, using standard pricing models that consider the value of future cash flows as of the balance sheet date, discounted to a present value using discount factors that match both the time to maturity and currency of the underlying instruments. These standard pricing models utilize inputs that are derived from or corroborated by observable market data such as interest rate yield curves as well as currency spot and forward rates; therefore, the fair value of our derivatives is classified as a Level 2 measurement. The balance sheet classification and fair values of the Company’s derivative instruments are as follows:
| | | | | | | | | | | | | | | | | | |
| Derivative instruments | Consolidated Balance Sheet Location | | December 31, | |
| 2024 | | 2023 | |
| | | | | | |
| Interest rate swaps | Other non-current assets | | $ | 1,621 | | | $ | 1,828 | | |
| Foreign currency forward contracts | Other accrued liabilities | | 67 | | | 159 | | |
| | | | | | |
The following table presents the net unrealized loss deferred to AOCI:
| | | | | | | | | | | | | | |
| | December 31, |
| | 2024 | | 2023 |
| Derivatives designated as cash flow hedges | | | | |
| Interest rate swaps | AOCI | $ | 1,248 | | | $ | 1,407 | |
| | | | |
The following table presents the net gain or loss recognized in the Company’s Consolidated Statements of Operations for the years ended December 31, 2024, 2023 and 2022:
| | | | | | | | | | | | | | | | | | | | | | | |
| Derivative instruments | Consolidated Statements of Operations Location | | 2024 | | 2023 | | 2022 |
| Interest rate swaps | Interest expense, net | | $ | 4,770 | | | $ | 3,555 | | | $ | — | |
| Foreign exchange forward contracts | Other (expense) income, net | | (2,026) | | | 2,134 | | | — | |
| Total | | | $ | 2,744 | | | $ | 5,689 | | | $ | — | |
Note 25 – Commitments and Contingencies
In the early 1990s, the Company identified certain soil and groundwater contamination at AC Products, Inc. (“ACP”), a wholly owned subsidiary . In voluntary coordination with the Santa Ana California Regional Water Quality Board, ACP has been remediating the contamination, the principal contaminant of which is perchloroethylene (“PERC”). In 2004, the Orange County Water District (“OCWD”) filed a civil complaint against ACP and other parties seeking to recover compensatory and other damages related to the investigation and remediation of the contamination in the groundwater. Pursuant to a settlement agreement with OCWD, ACP agreed, among other things, to operate the two groundwater treatment systems to hydraulically contain groundwater contamination emanating from ACP’s site until the concentrations of PERC released by ACP fell below the current Federal maximum contaminant level for four consecutive quarterly sampling events. In 2014, ACP ceased operation at one of its two groundwater treatment systems, as it had met the above condition for closure. In 2020, the Santa Ana Regional Water Quality Control Board asked that ACP conduct some additional indoor and outdoor soil vapor testing on and near the ACP site to confirm that ACP continues to meet the applicable local standards. ACP began to perform such testing program work in 2022, and an additional round of testing is expected to commence in 2025. As of December 31, 2024, ACP believes it is close to meeting the conditions for closure of the remaining groundwater treatment system but continues to operate this system while in discussions with the relevant authorities.
As of December 31, 2024, the Company believes that the range of potential-known liabilities associated with the balance of the ACP water remediation program is approximately $0.1 million to $1.0 million. The low and high ends of the range are based on the length of operation of the treatment system as determined by groundwater modeling. Costs of operation include the operation and maintenance of the extraction well, groundwater monitoring, program management, and soil vapor testing.
QUAKER CHEMICAL CORPORATION
NOTES TO CONSOLIDATED FINANCIAL STATEMENTS - Continued
(Dollars in thousands, except per share amounts, unless otherwise stated)
The Company’s Sao Paulo, Brazil site was required under Brazilian environmental, health and safety regulations to perform an environmental assessment as part of a permit renewal process. Initial investigations identified soil and ground water contamination in select areas of the site. The site has conducted a multi-year soil and groundwater investigation and corresponding risk assessments based on the result of the investigations. In 2017, the site had to submit a new 5-year permit renewal request and was asked to complete additional investigations to further delineate the site based on review of the technical data by the local regulatory agency, Companhia Ambiental do Estado de São Paulo (“CETESB”). Based on review of the updated investigation data, CETESB issued a Technical Opinion regarding the investigation and remedial actions taken to date. The site developed an action plan and submitted it to CETESB in 2018 based on CETESB requirements. The site intervention plan primarily requires the site, amongst other actions, to conduct periodic monitoring for methane in soil vapors, source zone delineation, groundwater plume delineation, bedrock aquifer assessment, update the human health risk assessment, develop a current site conceptual model and conduct a remedial feasibility study and provide a revised intervention plan. In 2020, the site submitted a report on the activities completed including the revised site conceptual model and results of the remedial feasibility study and recommended remedial strategy for the site.
Additionally, the Company is party to environmental matters related to certain domestic and foreign properties. These environmental matters primarily require the Company to perform ongoing monitoring and maintenance at each of the applicable sites. During the year ended December 31, 2024, there have been no significant changes to the facts or circumstances of these matters. Based on the Company’s current obligations, historical costs incurred, and projected costs to be incurred over the next 24 years, the Company estimated the present value range of costs for all of these environmental matters, on a discounted basis, to be between approximately $3.5 million and $6.0 million as of December 31, 2024, for which $3.6 million is accrued within other accrued liabilities and other non-current liabilities on the Company’s Consolidated Balance Sheets as of December 31, 2024. Comparatively, as of December 31, 2023, the Company had $5.1 million accrued for these matters.
Other environmental matters include participation in certain payments in connection with four currently active environmental consent orders related to certain hazardous waste cleanup activities under the U.S. Federal Superfund statute. The Company has been designated a potentially responsible party (“PRP”) by the Environmental Protection Agency along with other PRPs depending on the site, and has other obligations to perform cleanup activities at certain other foreign subsidiaries. These environmental matters primarily require the Company to perform long-term monitoring as well as operating and maintenance at each of the applicable sites. The Company believes that it has made adequate accruals for costs associated with other environmental matters of which it is aware. Approximately $0.6 million and $0.2 million were accrued as of December 31, 2024 and 2023, respectively, to provide for such anticipated future environmental assessments and remediation costs.
The Company previously disclosed in its 2023 Form 10-K that one of its North American production facilities experienced an electrical fire in 2021 that resulted in property damage and the temporary shutdown of production. The Company and its insurance carrier reviewed the impact of the electrical fire on the production facility’s operations as it relates to a potential business interruption insurance claim. In July 2024, the Company and its insurance carrier settled this claim for $1.0 million.
The Company is party to other litigation which management currently believes will not have a material adverse effect on the Company’s results of operations, cash flows or financial condition. In addition, the Company has an immaterial amount of contractual purchase obligations.
Item 9. Changes in and Disagreements With Accountants on Accounting and Financial Disclosure.
Not Applicable.
Item 9A. Controls and Procedures.
Conclusion Regarding the Effectiveness of Disclosure Controls and Procedures
As required by Rule 13a-15(b) under the Securities Exchange Act of 1934, as amended (the “Exchange Act”), our management, including our principal executive officer and principal financial officer, has evaluated the effectiveness of our disclosure controls and procedures (as defined in Rule 13a-15(e) under the Exchange Act) as of the end of the period covered by this report. Based on that evaluation, our principal executive officer and our principal financial officer have concluded that, as of December 31, 2024, the end of the period covered by this Report, our disclosure controls and procedures (as defined in Rule 13a-15(e) under the Exchange Act) were effective.
Management’s Report on Internal Control over Financial Reporting
Management is responsible for establishing and maintaining adequate internal control over financial reporting as such term is defined in Rule 13a-15(f) under the Exchange Act. Internal control over financial reporting is a process designed to provide reasonable assurance regarding the reliability of financial reporting and the preparation of financial statements for external purposes in accordance with generally accepted accounting principles.
Because of its inherent limitations, internal control over financial reporting may not prevent or detect misstatements. Also, projections of any evaluation of effectiveness to future periods are subject to the risk that controls may become inadequate because of changes in conditions or that the degree of compliance with the policies or procedures may deteriorate.
Our management, with the participation of our principal executive officer and principal financial officer, assessed the effectiveness of the Company’s internal control over financial reporting as of December 31, 2024. In making this assessment, our management used the criteria set forth by the Committee of Sponsoring Organizations of the Treadway Commission in Internal Control—Integrated Framework (2013) (the “COSO framework”). Based on its assessment, Management has concluded that as of December 31, 2024, the Company’s internal control over financial reporting is effective based on those criteria. Management’s assessment of the effectiveness of the Company’s internal control over financial reporting as of December 31, 2024 excluded the I.K.V. Tribologie IKVT and its subsidiaries, which was acquired by the Company in February 2024, and the Sutai Group, which was acquired by the Company in July 2024. Companies are permitted to exclude acquisitions from their assessment of internal control over financial reporting in the year of acquisition while integrating the acquired company under guidelines established by the Securities and Exchange Commission staff.
The effectiveness of the Company’s internal control over financial reporting as of December 31, 2024 has been audited by PricewaterhouseCoopers LLP, an independent registered public accounting firm, as stated in its report which is included in “Item 8. Financial Statements and Supplementary Data.”
Changes in Internal Control Over Financial Reporting
As required by Rule 13a-15(d) under the Exchange Act, our management, including our principal executive officer and principal financial officer, has evaluated our internal control over financial reporting to determine whether any changes to our internal control over financial reporting occurred during the quarter ended December 31, 2024, that have materially affected, or are reasonably likely to materially affect, our internal control over financial reporting. Based on that evaluation, there were no changes that have materially affected, or are reasonably likely to materially affect, our internal control over financial reporting during the quarter ended December 31, 2024.
Item 9B. Other Information.
Insider Trading Arrangements and Policies
No director or officer (as defined in Rule 16a-1(f) promulgated under the Exchange Act) of the Company adopted or terminated any Rule 10b5-1 trading arrangement or any non-Rule 10b5-1 trading arrangement (as such terms are defined in Item 408 of Regulation S-K) during the Company’s fourth quarter ended December 31, 2024.
Item 9C. Disclosure Regarding Foreign Jurisdictions that Prevent Inspections.
Not applicable.
PART III
Item 10. Directors, Executive Officers and Corporate Governance.
Incorporated by reference is (i) the information beginning with and including the caption “Proposal 1—Election of Directors and Nominee Biographies” in Quaker Houghton’s definitive Proxy Statement relating to the 2025 Annual Meeting of Shareholders, to be filed with the Securities and Exchange Commission no later than 120 days after the close of its fiscal year ended December 31, 2024 (the “2025 Proxy Statement”) to, but not including, the sub-caption “Governance Committee Procedures for Selecting Director Nominees,” (ii) the information appearing in Item 4(a) of this Report, (iii) the information in the 2025 Proxy Statement beginning with and including the sub-caption “Code of Conduct” to, but not including, the caption “Compensation Committee Interlocks and Insider Participation,” and (iv) the information in the 2025 Proxy Statement beginning with and including the sub-caption “Shareholder Nominations and Recommendations” to, but not including, the sub-caption “Board Oversight of Risk.” Information about our Executive Officers is included in Item 4(a) of this Report.
Item 11. Executive Compensation.
Incorporated by reference is (i) the information in the 2025 Proxy Statement beginning with and including the caption “Compensation Committee Interlocks and Insider Participation” to, but not including, the caption “Pay versus Performance Disclosure” as well as including the disclosure under the captions (ii) “Director Compensation” and (iii) “Compensation Policies and Practices – Risk Assessment.”
Item 12. Security Ownership of Certain Beneficial Owners and Management and Related Stockholder Matters.
Incorporated by reference is the information in the 2025 Proxy Statement beginning with and including the caption “Stock Ownership of Certain Beneficial Owners and Management” to, but not including, the caption “Certain Relationships and Related Party Transactions.”
Equity Compensation Plans
The following table sets forth certain information relating to the Company’s equity compensation plans as of December 31, 2024. Each number of securities reflected in the table is a reference to shares of Quaker common stock.
| | | | | | | | | | | | | | | | | | | | | | | |
| | Equity Compensation Plan Information | |
| Plan Category | | Number of securities to be issued upon exercise of outstanding options, warrants and rights | | Weighted-average exercise price of outstanding options, warrants and rights | | Number of securities remaining available for future issuance under equity compensation plans (excluding securities reflected in column (a)) | |
| | (a) | | (b) | | (c) | |
| Equity compensation plans approved by security holders | | 58,612 | | $ | 219.13 | | | 1,187,754 | (1) |
| Equity compensation plans not approved by security holders | | — | | — | | | — | |
| Total | | 58,612 | | $ | 219.13 | | | 1,187,754 | (1) |
(1)As of December 31, 2024, 304,900 of these shares were available for issuance as restricted stock awards under the Company’s 2001 Global Annual Incentive Plan, 809,624 shares were available for issuance upon the exercise of stock options and/or as restricted stock awards and/or restricted stock unit awards under the Company’s 2024 Long-Term Performance Incentive Plan and 73,230 shares were available for issuance under the 2023 Director Stock Ownership Plan.
Item 13. Certain Relationships and Related Transactions, and Director Independence.
Incorporated by reference is (i) the information in the 2025 Proxy Statement beginning with and including the caption “Certain Relationships and Related Party Transactions” to, but not including, the caption “Proposal 3 — Ratification of Appointment of Independent Registered Public Accounting Firm,” (ii) the information in the 2025 Proxy Statement beginning with and including the sub-caption “Director Independence” to, but not including, the sub-caption “Governance Committee Procedures for Selecting Director Nominees,” and (iii) the information in the 2025 Proxy Statement beginning with and including the caption “Meetings and Committees of the Board” to, but not including, the caption “Compensation Committee Interlocks and Insider Participation.”
Incorporated by reference is the information in the 2025 Proxy Statement required by Item 408(b) of Regulation S-K beginning with and including the sub-caption “Insider Trading Policy” to, but not including the sub-caption “Compensation Recoupment Policy.”
Item 14. Principal Accountant Fees and Services.
Incorporated by reference is the information in the 2025 Proxy Statement beginning with and including the sub-caption “Audit Fees” to, but not including, the statement recommending a vote for ratification of the appointment of PricewaterhouseCoopers LLP as the Company’s independent registered public accounting firm for the year ending December 31, 2025.
PART IV
Item 15. Exhibits and Financial Statement Schedules.
(a)Exhibits and Financial Statement Schedules
1.Financial Statements and Supplementary Data
2.Financial Statement Schedules
All schedules are omitted because they are not applicable or the required information is shown in the financial statements or notes thereto. Financial statements of 50% or less owned companies have been omitted because none of the companies meets the criteria requiring inclusion of such statements.
3.Exhibits - filed pursuant to, and numbered in accordance with Item 601 of Regulation S-K (all of which are under Commission File number 001-12019, except as otherwise noted):
| | | | | | | | |
| 2.1 | — | Share Purchase Agreement, dated April 4, 2017, by and among Quaker Chemical Corporation, a Pennsylvania corporation, Gulf Houghton Lubricants, Ltd., an exempted company incorporated under the laws of the Cayman Islands, Global Houghton Ltd., an exempted company incorporated under the laws of the Cayman Islands, and certain members of the management of Global Houghton Ltd. and Gulf Houghton Lubricants, Ltd., as agent for the Sellers. Incorporated by reference to Exhibit 10.1 as filed by the Registrant with Form 8-K, filed on April 5, 2017.*** |
| | |
| 3.1 | — | |
| | |
| 3.2 | — | |
| | |
| 4.1 | — | |
| | |
| 4.2 | — | |
| | |
| 10.1 | — | |
| | |
| 10.2 | — | |
| | |
| 10.3 | — | |
| | |
| 10.4 | — | |
| | |
| 10.5 | — | |
| | |
| | | | | | | | |
| 10.6 | — | |
| | |
| 10.7 | — | |
| | |
| 10.8 | — | |
| | |
| 10.9 | — | |
| | |
| 10.10 | — | |
| | |
| 10.11 | — | |
| | |
| 10.12 | — | |
| | |
| 10.13 | — | |
| | |
| 10.14 | — | |
| | |
| 10.15 | — | |
| | |
| 10.16 | — | |
| | |
| 10.17 | — | |
| | |
| 10.18 | — | |
| | |
| 10.19 | — | |
| | |
| 10.20 | — | |
| | |
| 10.21 | — | |
| | |
| 10.22 | — | |
| | |
| | | | | | | | |
| 10.23 | — | |
| | |
| 10.24 | — | |
| | |
| 10.25 | — | |
| | |
| 10.26 | — | |
| | |
| 10.27 | — | |
| | |
| 10.28 | — | |
| | |
| 10.29 | — | |
| | |
| 10.30 | — | |
| | |
| 10.31 | — | |
| | |
| 10.32 | — | |
| | |
| 10.33 | — | |
| | |
| 10.34 | — | |
| | |
| 10.35 | — | |
| | |
| 10.36 | — | |
| | |
| 10.37 | — | |
| | |
| 10.38 | — | |
| | |
| 10.39 | — | |
| | |
| 10.40 | — | |
| | |
| 10.41 | — | |
| | |
| 10.42 | — | |
| | |
| | | | | | | | |
| 10.43 | — | |
| | |
| 10.44 | — | |
| | |
| 10.45 | — | |
| | |
| 10.46 | — | |
| | |
| 10.47 | — | |
| | |
| 10.48 | — | |
| | |
| 10.49 | — | |
| | |
| 10.50 | — | |
| | |
| 10.51 | — | |
| | |
| 10.52 | — | Senior Secured Credit Facilities Commitment Letter, dated April 4, 2017, by and among Quaker Chemical Corporation, Bank of America, N.A., Merrill Lynch, Pierce, Fenner & Smith Incorporated, Deutsche Bank AG New York Branch and Deutsche Bank Securities Inc. Incorporated by reference to Exhibit 10.1 as filed by the Registrant with Form 8-K, filed on April 7, 2017. |
| | |
| 10.53 | — | |
| | |
| 10.54 | — | |
| | |
| 10.55 | — | |
| | |
| 10.56 | — | |
| | |
| 10.57 | — | |
| | |
| 10.58 | — | |
| | |
| 10.59 | — | |
| | |
| 10.60 | — | |
| | |
| 10.61 | — | |
| | |
| 19.0 | — | |
| | |
| 21.0 | — | |
| | | | | | | | |
| | |
| 23.0 | — | |
| | |
| 31.1 | — | |
| | |
| 31.2 | — | |
| | |
| 32.1 | — | |
| | |
| 32.2 | — | |
| | |
| 97.0 | — | |
| | |
| 101.INS | — | Inline XBRL Instance Document* |
| | |
| 101.SCH | — | Inline XBRL Taxonomy Extension Schema Document* |
| | |
| 101.CAL | — | Inline XBRL Taxonomy Calculation Linkbase Document* |
| | |
| 101.DEF | — | Inline XBRL Taxonomy Definition Linkbase Document* |
| | |
| 101.LAB | — | Inline XBRL Taxonomy Label Linkbase Document* |
| | |
| 101.PRE | — | Inline XBRL Taxonomy Presentation Linkbase Document* |
| | |
| 104.0 | — | Cover Page Interactive Data File (formatted as Inline XBRL and contained in Exhibit 101.INS)* |
| | | | | |
| * | Filed herewith. |
| |
| ** | Furnished herewith. |
| |
| *** | Certain exhibits and schedules have been omitted, and the Company agrees to furnish supplementally to the Securities and Exchange commission a copy of any omitted exhibits and schedules upon request. |
| |
| † | Management contract or compensatory plan |
Item 16. Form 10-K Summary.
The Company has elected not to include a Form 10-K summary under this Item 16.
SIGNATURES
Pursuant to the requirements of Section 13 or 15(d) of the Securities Exchange Act of 1934, the Registrant has duly caused this Report to be signed on its behalf by the undersigned, thereunto duly authorized.
| | | | | | | | |
| QUAKER CHEMICAL CORPORATION |
| Registrant |
| | |
| By: | /s/ JOSEPH A. BERQUIST |
| | |
| | Joseph A. Berquist |
| | Director, Chief Executive Officer and President |
Date: February 24, 2025
Pursuant to the requirements of the Securities Exchange Act of 1934, this Report has been signed below by the following persons on behalf of the Registrant and in the capacities and on the dates indicated.
| | | | | | | | | | | | | | |
| Signatures | | Capacity | | Date |
| | | | |
| /s/ JOSEPH A. BERQUIST | | Chief Executive Officer and President | | February 24, 2025 |
| Joseph A. Berquist | | Principal Executive Officer and Director | | |
| | | | |
| /s/ THOMAS COLER | | Executive Vice President, Chief Financial Officer | | February 24, 2025 |
| Thomas Coler | | Principal Financial Officer | | |
| | | | |
| /s/ JEFFREY J. KUTZ | | Vice President, Chief Accounting Officer | | February 24, 2025 |
| Jeffrey J. Kutz | | Principal Accounting Officer | | |
| | | | |
| /s/ MICHAEL F. BARRY | | Director, Non-Executive Chair of the Board | | February 24, 2025 |
| Michael F. Barry | | | | |
| | | | |
| /s/ RUSSELL R. SHALLER | | Director | | February 24, 2025 |
| Russell R. Shaller | | | | |
| | | | |
| /s/ CHARLOTTE C. HENRY | | Director | | February 24, 2025 |
| Charlotte C. Henry | | | | |
| | | | |
| /s/ MARK A. DOUGLAS | | Director | | February 24, 2025 |
| Mark A. Douglas | | | | |
| | | | |
| /s/ JEFFRY D. FRISBY | | Director | | February 24, 2025 |
| Jeffry D. Frisby | | | | |
| | | | |
| /s/ WILLIAM H. OSBORNE | | Director | | February 24, 2025 |
| William H. Osborne | | | | |
| | | | |
| /s/ FAY WEST | | Director | | February 24, 2025 |
| Fay West | | | | |
| | | | |
| /s/ SANJAY HINDUJA | | Director | | February 24, 2025 |
| Sanjay Hinduja | | | | |
| | | | |
| /s/ RAMASWAMI SESHASAYEE | | Director | | February 24, 2025 |
| Ramaswami Seshasayee | | | | |
| | | | |
| /s/ NANDITA BAKHSHI | | Director | | February 24, 2025 |
| Nandita Bakhshi | | | | |
| | | | |
| /s/ LUCRÈCE FOUFOPOULOS-DE RIDDER | | Director | | February 24, 2025 |
| Lucrèce Foufopoulos-De Ridder | | | | |