Exhibit (c)(2)
Presentation to the Board of Directors of the General Partner of: November 14, 2011
Northland Cable Properties Seven Limited Partnership
The information contained herein is of a confidential nature and is intended for the exclusive use of the persons or firm to whom it is furnished by us. Reproduction, publication, or dissemination of portions hereof may not be made without prior approval of Duff & Phelps, LLC.
Duff & Phelps Disclaimer
• The following pages contain material that is being provided by Duff & Phelps, LLC (“Duff & Phelps”) to the board of directors (the “Board”) of Northland Communications Corporation (the “General Partner”) of Northland Cable Properties Seven Limited Partnership (“NCP7”) in connection with the Proposed Transaction, as herein defined.
• The accompanying material was compiled on a confidential basis for the sole reliance of the Board in connection with its evaluation of the Proposed Transaction and may not be distributed to any other party, publicly disclosed, or relied upon for any other purpose without the prior written consent of Duff & Phelps.
• Because this material was prepared for use in the context of an oral presentation to the Board, which is familiar with the business and affairs of NCP7, Duff & Phelps does not take any responsibility for the accuracy or completeness of any of the material if used by persons other than the Board.
• These materials are not intended to represent an opinion but rather to serve as discussion materials for the Board to review and as a basis upon which Duff & Phelps may render an opinion.
• An opinion would not i) address the merits of the underlying business decision of the Board or NCP7 or any other party to the Proposed Transaction to enter into the Proposed Transaction versus any alternative strategy or transaction; ii) constitute a recommendation to the Board, the General Partner, NCP7, the limited partners of NCP7, or any other person as to how such person should vote or act as to any other specific action that should be taken in connection with the Proposed Transaction; or iii) create any fiduciary duty on Duff & Phelps’ part to any party.
• The information utilized in preparing this presentation was obtained from the General Partner and public sources. Any estimates and projections contained herein have been prepared by the General Partner and involve numerous and significant subjective determinations, which may or may not prove to be correct. No representation or warranty, expressed or implied, is made as to the accuracy or completeness of such information and nothing contained herein is, or shall be relied upon as, a representation, whether as to the past or the future. Duff & Phelps did not attempt to independently verify such information.
• Duff & Phelps does not believe that any selected public company or selected M&A transaction used in its analysis are directly comparable to NCP7 or the Proposed Transaction.
Duff & Phelps | NCP 7
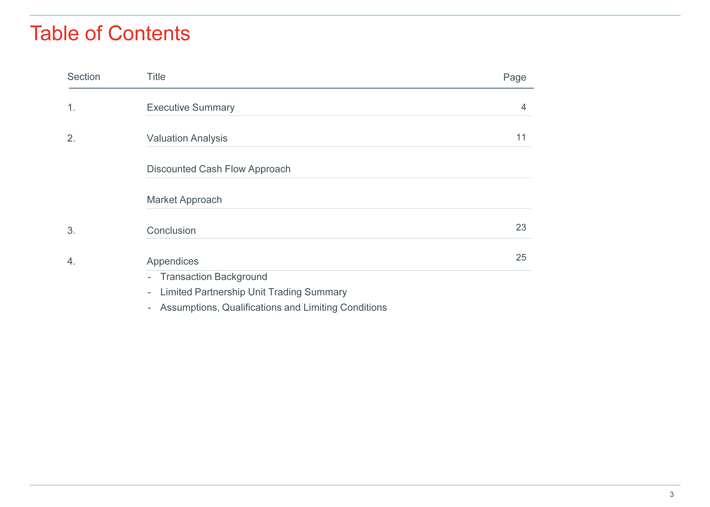
Table of Contents
Executive Summary
Valuation Analysis
Discounted Cash Flow Approach Market Approach Conclusion
Appendices
- Transaction Background
- Limited Partnership Unit Trading Summary
- Assumptions, Qualifications and Limiting Conditions
Section Title Page

Executive Summary 1.
Executive Summary
Overview
The Engagement
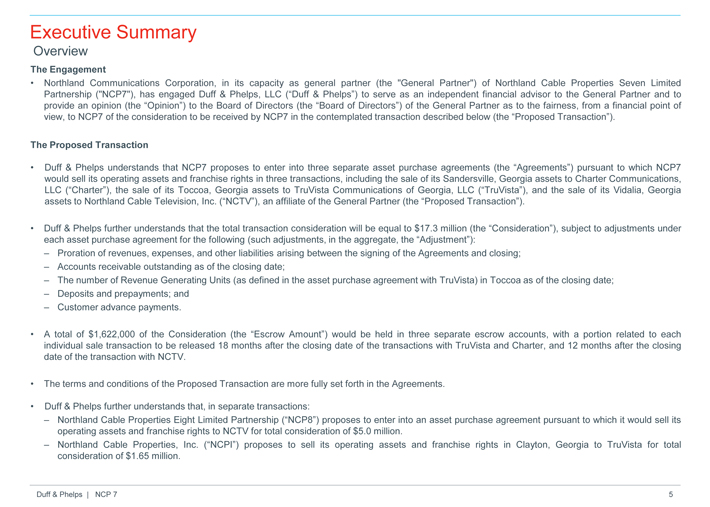
• Northland Communications Corporation, in its capacity as general partner (the “General Partner”) of Northland Cable Properties Seven Limited Partnership (“NCP7”), has engaged Duff & Phelps, LLC (“Duff & Phelps”) to serve as an independent financial advisor to the General Partner and to provide an opinion (the “Opinion”) to the Board of Directors (the “Board of Directors”) of the General Partner as to the fairness, from a financial point of view, to NCP7 of the consideration to be received by NCP7 in the contemplated transaction described below (the “Proposed Transaction”).
The Proposed Transaction
• Duff & Phelps understands that NCP7 proposes to enter into three separate asset purchase agreements (the “Agreements”) pursuant to which NCP7 would sell its operating assets and franchise rights in three transactions, including the sale of its Sandersville, Georgia assets to Charter Communications, LLC (“Charter”), the sale of its Toccoa, Georgia assets to TruVista Communications of Georgia, LLC (“TruVista”), and the sale of its Vidalia, Georgia assets to Northland Cable Television, Inc. (“NCTV”), an affiliate of the General Partner (the “Proposed Transaction”).
• Duff & Phelps further understands that the total transaction consideration will be equal to $17.3 million (the “Consideration”), subject to adjustments under each asset purchase agreement for the following (such adjustments, in the aggregate, the “Adjustment”):
– Proration of revenues, expenses, and other liabilities arising between the signing of the Agreements and closing;
– Accounts receivable outstanding as of the closing date;
– The number of Revenue Generating Units (as defined in the asset purchase agreement with TruVista) in Toccoa as of the closing date;
– Deposits and prepayments; and
– Customer advance payments.
• A total of $1,622,000 of the Consideration (the “Escrow Amount”) would be held in three separate escrow accounts, with a portion related to each individual sale transaction to be released 18 months after the closing date of the transactions with TruVista and Charter, and 12 months after the closing date of the transaction with NCTV.
• The terms and conditions of the Proposed Transaction are more fully set forth in the Agreements.
• Duff & Phelps further understands that, in separate transactions:
– Northland Cable Properties Eight Limited Partnership (“NCP8”) proposes to enter into an asset purchase agreement pursuant to which it would sell its operating assets and franchise rights to NCTV for total consideration of $5.0 million.
– Northland Cable Properties, Inc. (“NCPI”) proposes to sell its operating assets and franchise rights in Clayton, Georgia to TruVista for total consideration of $1.65 million.
Duff & Phelps | NCP 7
Executive Summary
Scope of Analysis
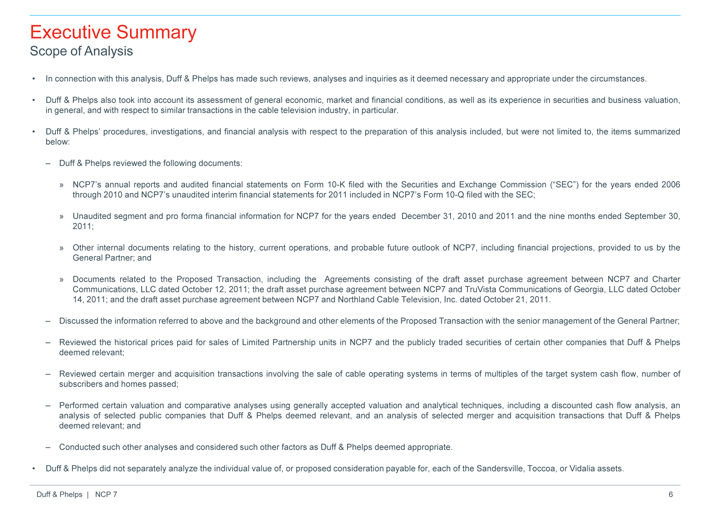
• In connection with this analysis, Duff & Phelps has made such reviews, analyses and inquiries as it deemed necessary and appropriate under the circumstances.
• Duff & Phelps also took into account its assessment of general economic, market and financial conditions, as well as its experience in securities and business valuation, in general, and with respect to similar transactions in the cable television industry, in particular.
• Duff & Phelps’ procedures, investigations, and financial analysis with respect to the preparation of this analysis included, but were not limited to, the items summarized below:
– Duff & Phelps reviewed the following documents:
» NCP7’s annual reports and audited financial statements on Form 10-K filed with the Securities and Exchange Commission (“SEC”) for the years ended 2006 through 2010 and NCP7’s unaudited interim financial statements for 2011 included in NCP7’s Form 10-Q filed with the SEC;
» Unaudited segment and pro forma financial information for NCP7 for the years ended December 31, 2010 and 2011 and the nine months ended September 30, 2011;
» Other internal documents relating to the history, current operations, and probable future outlook of NCP7, including financial projections, provided to us by the General Partner; and
» Documents related to the Proposed Transaction, including the Agreements consisting of the draft asset purchase agreement between NCP7 and Charter Communications, LLC dated October 12, 2011; the draft asset purchase agreement between NCP7 and TruVista Communications of Georgia, LLC dated October 14, 2011; and the draft asset purchase agreement between NCP7 and Northland Cable Television, Inc. dated October 21, 2011.
– Discussed the information referred to above and the background and other elements of the Proposed Transaction with the senior management of the General Partner;
– Reviewed the historical prices paid for sales of Limited Partnership units in NCP7 and the publicly traded securities of certain other companies that Duff & Phelps deemed relevant;
– Reviewed certain merger and acquisition transactions involving the sale of cable operating systems in terms of multiples of the target system cash flow, number of subscribers and homes passed;
– Performed certain valuation and comparative analyses using generally accepted valuation and analytical techniques, including a discounted cash flow analysis, an analysis of selected public companies that Duff & Phelps deemed relevant, and an analysis of selected merger and acquisition transactions that Duff & Phelps deemed relevant; and
– Conducted such other analyses and considered such other factors as Duff & Phelps deemed appropriate.
• Duff & Phelps did not separately analyze the individual value of, or proposed consideration payable for, each of the Sandersville, Toccoa, or Vidalia assets.
Duff & Phelps | NCP 7
Financial Overview
NCP7 Financial Performance (Original Plan)
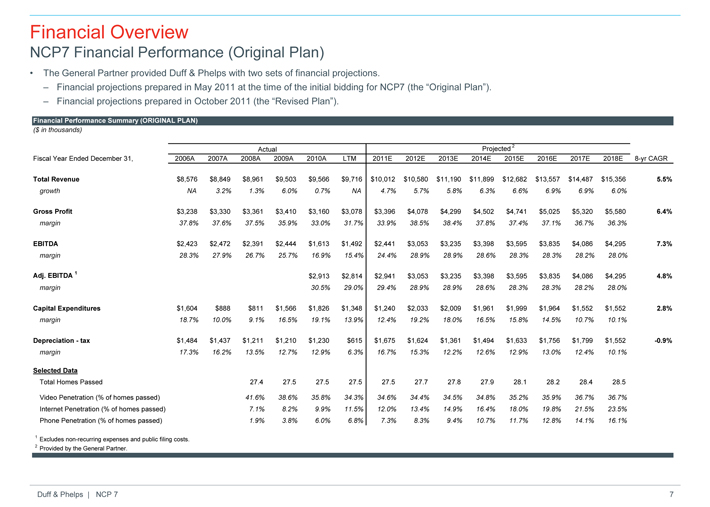
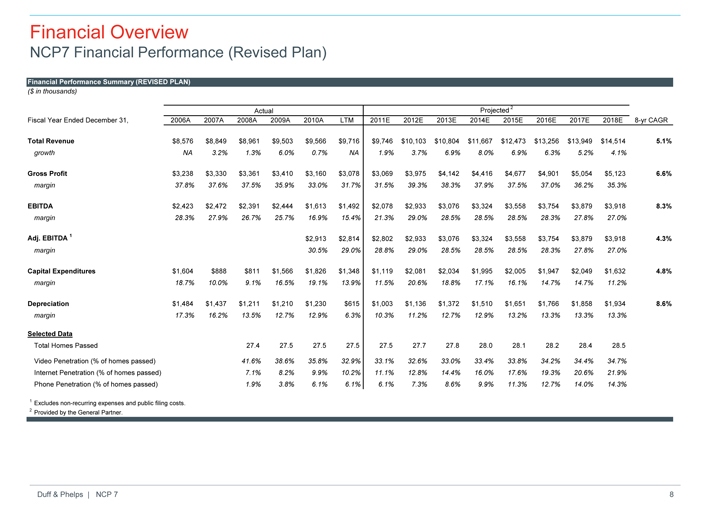
• The General Partner provided Duff & Phelps with two sets of financial projections.
– Financial projections prepared in May 2011 at the time of the initial bidding for NCP7 (the “Original Plan”).
– Financial projections prepared in October 2011 (the “Revised Plan”).
Financial Performance Summary (ORIGINAL PLAN)
($ in thousands)
Actual Projected 2
Fiscal Year Ended December 31, 2006A 2007A 2008A 2009A 2010A LTM 2011E 2012E 2013E 2014E 2015E 2016E 2017E 2018E 8-yr CAGR
Total Revenue $8,576 $8,849 $8,961 $9,503 $9,566 $9,716 $10,012 $10,580 $11,190 $11,899 $12,682 $13,557 $14,487 $15,356 5.5%
growth NA 3.2% 1.3% 6.0% 0.7% NA 4.7% 5.7% 5.8% 6.3% 6.6% 6.9% 6.9% 6.0%
Gross Profit $3,238 $3,330 $3,361 $3,410 $3,160 $3,078 $3,396 $4,078 $4,299 $4,502 $4,741 $5,025 $5,320 $5,580 6.4%
margin 37.8% 37.6% 37.5% 35.9% 33.0% 31.7% 33.9% 38.5% 38.4% 37.8% 37.4% 37.1% 36.7% 36.3%
EBITDA $2,423 $2,472 $2,391 $2,444 $1,613 $1,492 $2,441 $3,053 $3,235 $3,398 $3,595 $3,835 $4,086 $4,295 7.3%
margin 28.3% 27.9% 26.7% 25.7% 16.9% 15.4% 24.4% 28.9% 28.9% 28.6% 28.3% 28.3% 28.2% 28.0%
Adj. EBITDA 1 $2,913 $2,814 $2,941 $3,053 $3,235 $3,398 $3,595 $3,835 $4,086 $4,295 4.8%
margin 30.5% 29.0% 29.4% 28.9% 28.9% 28.6% 28.3% 28.3% 28.2% 28.0%
Capital Expenditures $1,604 $888 $811 $1,566 $1,826 $1,348 $1,240 $2,033 $2,009 $1,961 $1,999 $1,964 $1,552 $1,552 2.8%
margin 18.7% 10.0% 9.1% 16.5% 19.1% 13.9% 12.4% 19.2% 18.0% 16.5% 15.8% 14.5% 10.7% 10.1%
Depreciation—tax $1,484 $1,437 $1,211 $1,210 $1,230 $615 $1,675 $1,624 $1,361 $1,494 $1,633 $1,756 $1,799 $1,552 -0.9%
margin 17.3% 16.2% 13.5% 12.7% 12.9% 6.3% 16.7% 15.3% 12.2% 12.6% 12.9% 13.0% 12.4% 10.1%
Selected Data
Total Homes Passed 27.4 27.5 27.5 27.5 27.5 27.7 27.8 27.9 28.1 28.2 28.4 28.5
Video Penetration (% of homes passed) 41.6% 38.6% 35.8% 34.3% 34.6% 34.4% 34.5% 34.8% 35.2% 35.9% 36.7% 36.7%
Internet Penetration (% of homes passed) 7.1% 8.2% 9.9% 11.5% 12.0% 13.4% 14.9% 16.4% 18.0% 19.8% 21.5% 23.5%
Phone Penetration (% of homes passed) 1.9% 3.8% 6.0% 6.8% 7.3% 8.3% 9.4% 10.7% 11.7% 12.8% 14.1% 16.1%
1 | Excludes non-recurring expenses and public filing costs. |
2 | Provided by the General Partner. |
Duff & Phelps | NCP 7
Financial Overview
NCP7 Financial Performance (Revised Plan)
Financial Performance Summary (REVISED PLAN)
($ in thousands)
Actual Projected 2
Fiscal Year Ended December 31, 2006A 2007A 2008A 2009A 2010A LTM 2011E 2012E 2013E 2014E 2015E 2016E 2017E 2018E 8-yr CAGR
Total Revenue $8,576 $8,849 $8,961 $9,503 $9,566 $9,716 $9,746 $10,103 $10,804 $11,667 $12,473 $13,256 $13,949 $14,514 5.1%
growth NA 3.2% 1.3% 6.0% 0.7% NA 1.9% 3.7% 6.9% 8.0% 6.9% 6.3% 5.2% 4.1%
Gross Profit $3,238 $3,330 $3,361 $3,410 $3,160 $3,078 $3,069 $3,975 $4,142 $4,416 $4,677 $4,901 $5,054 $5,123 6.6%
margin 37.8% 37.6% 37.5% 35.9% 33.0% 31.7% 31.5% 39.3% 38.3% 37.9% 37.5% 37.0% 36.2% 35.3%
EBITDA $2,423 $2,472 $2,391 $2,444 $1,613 $1,492 $2,078 $2,933 $3,076 $3,324 $3,558 $3,754 $3,879 $3,918 8.3%
margin 28.3% 27.9% 26.7% 25.7% 16.9% 15.4% 21.3% 29.0% 28.5% 28.5% 28.5% 28.3% 27.8% 27.0%
Adj. EBITDA 1 $2,913 $2,814 $2,802 $2,933 $3,076 $3,324 $3,558 $3,754 $3,879 $3,918 4.3%
margin 30.5% 29.0% 28.8% 29.0% 28.5% 28.5% 28.5% 28.3% 27.8% 27.0%
Capital Expenditures $1,604 $888 $811 $1,566 $1,826 $1,348 $1,119 $2,081 $2,034 $1,995 $2,005 $1,947 $2,049 $1,632 4.8%
margin 18.7% 10.0% 9.1% 16.5% 19.1% 13.9% 11.5% 20.6% 18.8% 17.1% 16.1% 14.7% 14.7% 11.2%
Depreciation $1,484 $1,437 $1,211 $1,210 $1,230 $615 $1,003 $1,136 $1,372 $1,510 $1,651 $1,766 $1,858 $1,934 8.6%
margin 17.3% 16.2% 13.5% 12.7% 12.9% 6.3% 10.3% 11.2% 12.7% 12.9% 13.2% 13.3% 13.3% 13.3%
Selected Data
Total Homes Passed 27.4 27.5 27.5 27.5 27.5 27.7 27.8 28.0 28.1 28.2 28.4 28.5
Video Penetration (% of homes passed) 41.6% 38.6% 35.8% 32.9% 33.1% 32.6% 33.0% 33.4% 33.8% 34.2% 34.4% 34.7%
Internet Penetration (% of homes passed) 7.1% 8.2% 9.9% 10.2% 11.1% 12.8% 14.4% 16.0% 17.6% 19.3% 20.6% 21.9%
Phone Penetration (% of homes passed) 1.9% 3.8% 6.1% 6.1% 6.1% 7.3% 8.6% 9.9% 11.3% 12.7% 14.0% 14.3%
1 | Excludes non-recurring expenses and public filing costs. |
2 | Provided by the General Partner. |
Duff & Phelps | NCP 7
Executive Summary
Valuation Conclusions
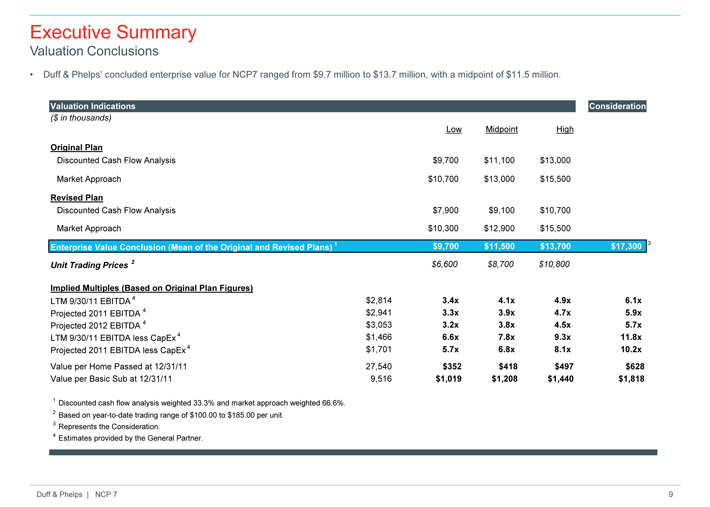
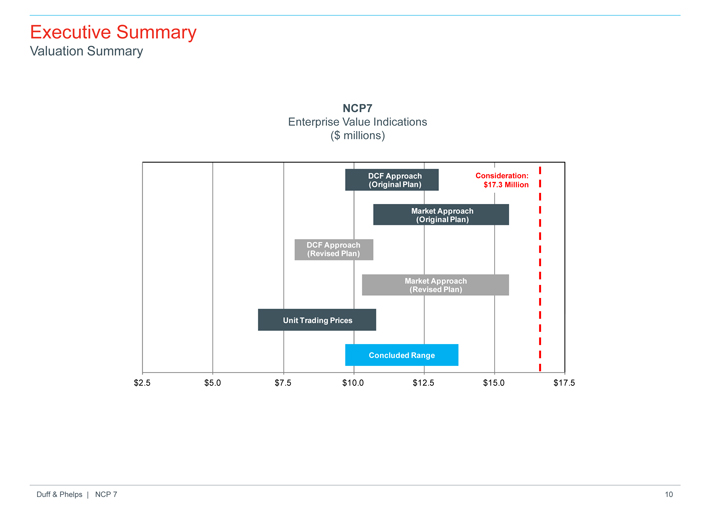
• Duff & Phelps’ concluded enterprise value for NCP7 ranged from $9.7 million to $13.7 million, with a midpoint of $11.5 million.
Valuation Indications Consideration
($ in thousands)
Low Midpoint High
Original Plan
Discounted Cash Flow Analysis $9,700 $11,100 $13,000
Market Approach $10,700 $13,000 $15,500
Revised Plan
Discounted Cash Flow Analysis $7,900 $9,100 $10,700
Market Approach $10,300 $12,900 $15,500
Enterprise Value Conclusion (Mean of the Original and Revised Plans) 1 $9,700 $11,500 $13,700 $17,300 3
Unit Trading Prices 2 $6,600 $8,700 $10,800
Implied Multiples (Based on Original Plan Figures)
LTM 9/30/11 EBITDA 4 $2,814 3.4x 4.1x 4.9x 6.1x
Projected 2011 EBITDA 4 $2,941 3.3x 3.9x 4.7x 5.9x
Projected 2012 EBITDA 4 $3,053 3.2x 3.8x 4.5x 5.7x
LTM 9/30/11 EBITDA less CapEx 4 $1,466 6.6x 7.8x 9.3x 11.8x
Projected 2011 EBITDA less CapEx 4 $1,701 5.7x 6.8x 8.1x 10.2x
Value per Home Passed at 12/31/11 27,540 $352 $418 $497 $628
Value per Basic Sub at 12/31/11 9,516 $1,019 $1,208 $1,440 $1,818
1 Discounted cash flow analysis weighted 33.3% and market approach weighted 66.6%.
2 Based on year-to-date trading range of $100.00 to $185.00 per unit.
3 Represents the Consideration.
4 Estimates provided by the General Partner.
Duff & Phelps | NCP 7
Executive Summary
Valuation Summary
NCP7
Enterprise Value Indications ($ millions)
DCF Approach Consideration: (Original Plan) $17.3 Million
Market Approach (Original Plan)
DCF Approach (Revised Plan)
Market Approach (Revised Plan)
Unit Trading Prices
Concluded Range
$2.5 $5.0 $7.5 $10.0 $12.5 $15.0 $17.5
Duff & Phelps | NCP 7
Valuation Analysis II.
Valuation Analysis
Discounted Cash Flow Analysis – Key Assumptions
• The Discounted Cash Flow (“DCF”) approach to valuation is based on the theory that the current value of an investment is derived from the expected receipt of future economic benefits. In the valuation of the enterprise value of a company, indications of value are developed by discounting projected debt-free net cash flows to their present value at a rate that reflects both the current return requirements of the market and risks inherent in the specific investment.
• Discounted cash flow analysis methodology:
– The DCF analysis determines the net present value of future free cash flows utilizing a weighted average cost of capital for the discount rate.
– Free cash flow is defined as cash that is available to either reinvest or to distribute to security holders.
– The projected free cash flows are discounted to the present at a rate which reflects the relative risk associated with these cash flows as well as the rates of return that security holders could expect to realize on alternative investment opportunities involving similar risk.
– The DCF analysis was based on, financial projections provided by the General Partner including the Original Plan and the Revised Plan for 2011 through 2018 (the “Financial Projections”).
• Development of Projections:
– The General Partner prepared the Financial Projections assuming that NCP7 would continue to operate on a standalone basis.
– Adjustments to operating expenses made by the General Partner included add backs for costs associated with operation as a limited partnership, including public filing costs.
– The General Partner prepared two sets of financial projections:
» Financial projections prepared in May 2011 at the time of the initial bidding for NCP7.
» Financial projections prepared in October 2011.
Duff & Phelps | NCP 7
Valuation Analysis
Discounted Cash Flow Analysis – Original Plan
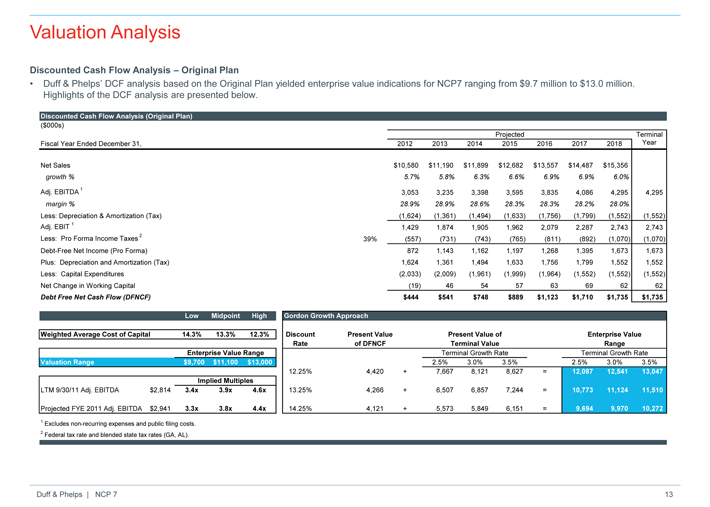
• Duff & Phelps’ DCF analysis based on the Original Plan yielded enterprise value indications for NCP7 ranging from $9.7 million to $13.0 million. Highlights of the DCF analysis are presented below.
Discounted Cash Flow Analysis (Original Plan)
($000s)
Projected Terminal
Fiscal Year Ended December 31, 2012 2013 2014 2015 2016 2017 2018 Year
Net Sales $10,580 $11,190 $11,899 $12,682 $13,557 $14,487 $15,356
growth % 5.7% 5.8% 6.3% 6.6% 6.9% 6.9% 6.0%
Adj. EBITDA 1 2,941 3,053 3,235 3,398 3,595 3,835 4,086 4,295 4,295
margin % 28.9% 28.9% 28.6% 28.3% 28.3% 28.2% 28.0%
Less: Depreciation & Amortization (Tax)(1,624)(1,361)(1,494)(1,633)(1,756)(1,799)(1,552)(1,552)
Adj. EBIT 1 1,429 1,874 1,905 1,962 2,079 2,287 2,743 2,743
Less: Pro Forma Income Taxes 2 39%(557)(731)(743)(765)(811)(892)(1,070)(1,070)
Debt-Free Net Income (Pro Forma) 872 1,143 1,162 1,197 1,268 1,395 1,673 1,673
Plus: Depreciation and Amortization (Tax) 1,624 1,361 1,494 1,633 1,756 1,799 1,552 1,552
Less: Capital Expenditures(1,240)(2,033)(2,009)(1,961)(1,999)(1,964)(1,552)(1,552)(1,552)
Net Change in Working Capital(19) 46 54 57 63 69 62 62
Debt Free Net Cash Flow (DFNCF) $444 $541 $748 $889 $1,123 $1,710 $1,735 $1,735
Low Midpoint High Gordon Growth Approach
Weighted Average Cost of Capital 14.3% 13.3% 12.3% Discount Present Value Present Value of Enterprise Value
Rate of DFNCF Terminal Value Range
Enterprise Value Range Terminal Growth Rate Terminal Growth Rate
Valuation Range $9,700 $11,100 $13,000 2.5% 3.0% 3.5% 2.5% 3.0% 3.5%
12.25% 4,420 + 7,667 8,121 8,627 = 12,087 12,541 13,047
Implied Multiples
LTM 9/30/11 Adj. EBITDA $2,814 3.4x 3.9x 4.6x 13.25% 4,266 + 6,507 6,857 7,244 = 10,773 11,124 11,510
Projected FYE 2011 Adj. EBITDA $2,941 3.3x 3.8x 4.4x 14.25% 4,121 + 5,573 5,849 6,151 = 9,694 9,970 10,272
1 Excludes non-recurring expenses and public filing costs.
2 Federal tax rate and blended state tax rates (GA, AL).
Duff & Phelps | NCP 7
Valuation Analysis
Discounted Cash Flow Analysis – Revised Plan
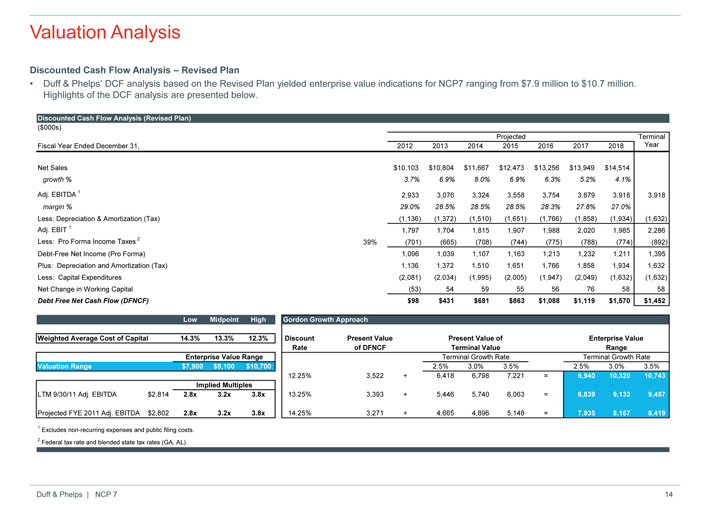
• Duff & Phelps’ DCF analysis based on the Revised Plan yielded enterprise value indications for NCP7 ranging from $7.9 million to $10.7 million. Highlights of the DCF analysis are presented below.
Discounted Cash Flow Analysis (Revised Plan)
($000s)
Projected Terminal
Fiscal Year Ended December 31, 2012 2013 2014 2015 2016 2017 2018 Year
Net Sales $10,103 $10,804 $11,667 $12,473 $13,256 $13,949 $14,514
growth % 3.7% 6.9% 8.0% 6.9% 6.3% 5.2% 4.1%
Adj. EBITDA 1 2,933 3,076 3,324 3,558 3,754 3,879 3,918 3,918
margin % 29.0% 28.5% 28.5% 28.5% 28.3% 27.8% 27.0%
Less: Depreciation & Amortization (Tax)(1,136)(1,372)(1,510)(1,651)(1,766)(1,858)(1,934)(1,632)
Adj. EBIT 1 1,797 1,704 1,815 1,907 1,988 2,020 1,985 2,286
Less: Pro Forma Income Taxes 2 39%(701)(665)(708)(744)(775)(788)(774)(892)
Debt-Free Net Income (Pro Forma) 1,096 1,039 1,107 1,163 1,213 1,232 1,211 1,395
Plus: Depreciation and Amortization (Tax) 1,136 1,372 1,510 1,651 1,766 1,858 1,934 1,632
Less: Capital Expenditures(2,081)(2,034)(1,995)(2,005)(1,947)(2,049)(1,632)(1,632)
Net Change in Working Capital(53) 54 59 55 56 76 58 58
Debt Free Net Cash Flow (DFNCF) $98 $431 $681 $863 $1,088 $1,119 $1,570 $1,452
Low Midpoint High Gordon Growth Approach
Weighted Average Cost of Capital 14.3% 13.3% 12.3% Discount Present Value Present Value of Enterprise Value
Rate of DFNCF Terminal Value Range
Enterprise Value Range Terminal Growth Rate Terminal Growth Rate
Valuation Range $7,900 $9,100 $10,700 2.5% 3.0% 3.5% 2.5% 3.0% 3.5%
12.25% 3,522 + 6,418 6,798 7,221 = 9,940 10,320 10,743
Implied Multiples
LTM 9/30/11 Adj. EBITDA $2,814 2.8x 3.2x 3.8x 13.25% 3,393 + 5,446 5,740 6,063 = 8,839 9,133 9,457
Projected FYE 2011 Adj. EBITDA $2,802 2.8x 3.2x 3.8x 14.25% 3,271 + 4,665 4,896 5,148 = 7,935 8,167 8,419
1 Excludes non-recurring expenses and public filing costs.
2 Federal tax rate and blended state tax rates (GA, AL).
Duff & Phelps | NCP 7
Valuation Analysis
Market Approach
Selected Public Company Analysis
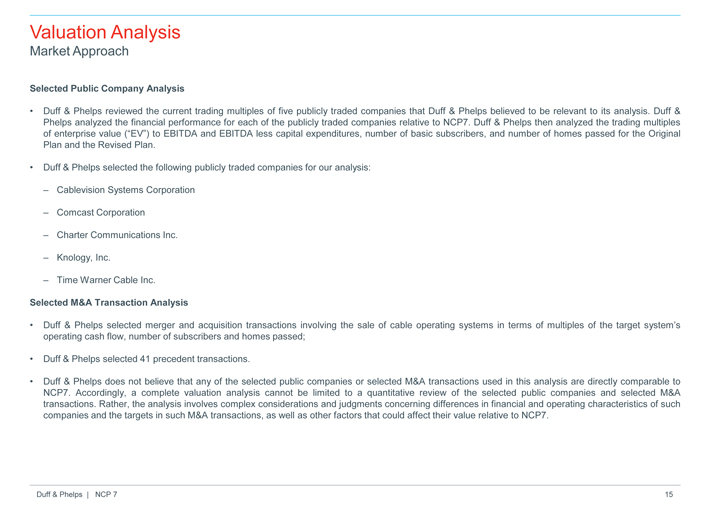
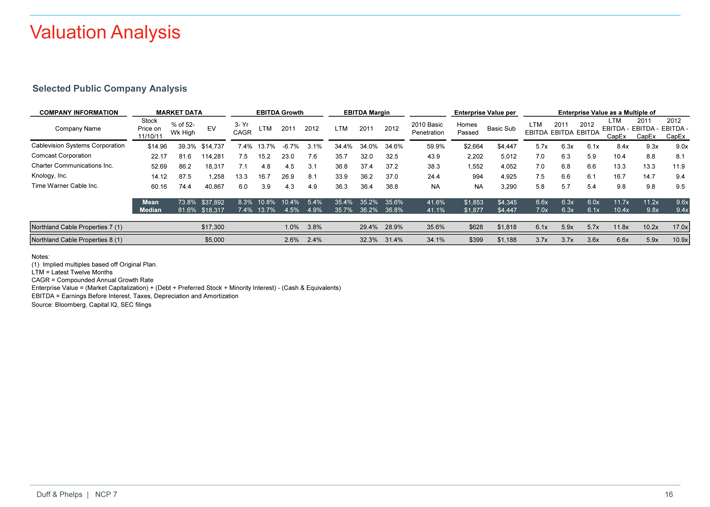
• Duff & Phelps reviewed the current trading multiples of five publicly traded companies that Duff & Phelps believed to be relevant to its analysis. Duff & Phelps analyzed the financial performance for each of the publicly traded companies relative to NCP7. Duff & Phelps then analyzed the trading multiples of enterprise value (“EV”) to EBITDA and EBITDA less capital expenditures, number of basic subscribers, and number of homes passed for the Original Plan and the Revised Plan.
• Duff & Phelps selected the following publicly traded companies for our analysis:
– Cablevision Systems Corporation
– Comcast Corporation
– Charter Communications Inc.
– Knology, Inc.
– Time Warner Cable Inc.
Selected M&A Transaction Analysis
• Duff & Phelps selected merger and acquisition transactions involving the sale of cable operating systems in terms of multiples of the target system’s operating cash flow, number of subscribers and homes passed;
• Duff & Phelps selected 41 precedent transactions.
• Duff & Phelps does not believe that any of the selected public companies or selected M&A transactions used in this analysis are directly comparable to NCP7. Accordingly, a complete valuation analysis cannot be limited to a quantitative review of the selected public companies and selected M&A transactions. Rather, the analysis involves complex considerations and judgments concerning differences in financial and operating characteristics of such companies and the targets in such M&A transactions, as well as other factors that could affect their value relative to NCP7.
Duff & Phelps | NCP 7
Valuation Analysis
Selected Public Company Analysis
COMPANY INFORMATION MARKET DATA EBITDA Growth EBITDA Margin Enterprise Value per Enterprise Value as a Multiple of
Stock LTM 2011 2012
% of 52- 3- Yr 2010 Basic Homes LTM 2011 2012
Company Name Price on EV LTM 2011 2012 LTM 2011 2012 Basic Sub EBITDA—EBITDA—EBITDA -
Wk High CAGR Penetration Passed EBITDA EBITDA EBITDA
11/10/11 CapEx CapEx CapEx
Cablevision Systems Corporation $14.96 39.3% $14,737 7.4% 13.7% -6.7% 3.1% 34.4% 34.0% 34.6% 59.9% $2,664 $4,447 5.7x 6.3x 6.1x 8.4x 9.3x 9.0x
Comcast Corporation 22.17 81.6 114,281 7.5 15.2 23.0 7.6 35.7 32.0 32.5 43.9 2,202 5,012 7.0 6.3 5.9 10.4 8.8 8.1
Charter Communications Inc. 52.69 86.2 18,317 7.1 4.8 4.5 3.1 36.8 37.4 37.2 38.3 1,552 4,052 7.0 6.8 6.6 13.3 13.3 11.9
Knology, Inc. 14.12 87.5 1,258 13.3 16.7 26.9 8.1 33.9 36.2 37.0 24.4 994 4,925 7.5 6.6 6.1 16.7 14.7 9.4
Time Warner Cable Inc. 60.16 74.4 40,867 6.0 3.9 4.3 4.9 36.3 36.4 36.8 NA NA 3,290 5.8 5.7 5.4 9.8 9.8 9.5
Mean 73.8% $37,892 8.3% 10.8% 10.4% 5.4% 35.4% 35.2% 35.6% 41.6% $1,853 $4,345 6.6x 6.3x 6.0x 11.7x 11.2x 9.6x
Median 81.6% $18,317 7.4% 13.7% 4.5% 4.9% 35.7% 36.2% 36.8% 41.1% $1,877 $4,447 7.0x 6.3x 6.1x 10.4x 9.8x 9.4x
Northland Cable Properties 7 (1) $17,300 1.0% 3.8% 29.4% 28.9% 35.6% $628 $1,818 6.1x 5.9x 5.7x 11.8x 10.2x 17.0x
Northland Cable Properties 8 (1) $5,000 2.6% 2.4% 32.3% 31.4% 34.1% $399 $1,188 3.7x 3.7x 3.6x 6.6x 5.9x 10.9x
Notes:
(1) Implied multiples based off Original Plan.
LTM = Latest Twelve Months
CAGR = Compounded Annual Growth Rate
Enterprise Value = (Market Capitalization) + (Debt + Preferred Stock + Minority Interest)—(Cash & Equivalents)
EBITDA = Earnings Before Interest, Taxes, Depreciation and Amortization
Source: Bloomberg, Capital IQ, SEC filings
Duff & Phelps | NCP 7
Valuation Analysis
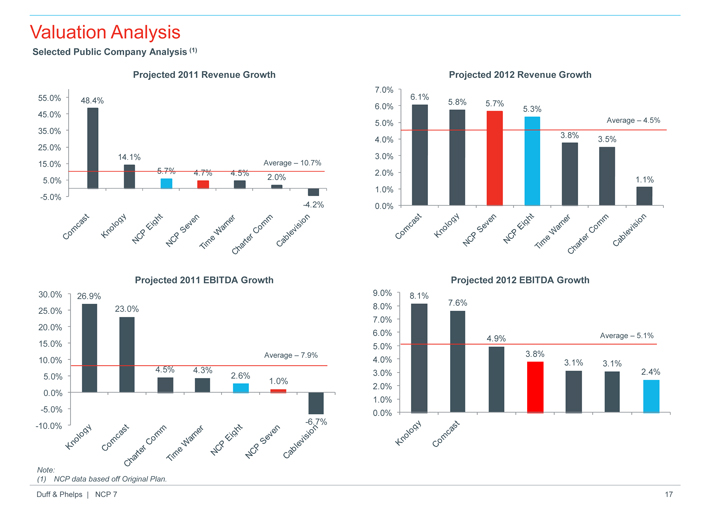
Selected Public Company Analysis (1)
Projected 2011 Revenue Growth Projected 2012 Revenue Growth
55.0% 45.0% 35.0% 25.0% 15.0% 5.0% -5.0% 48.4%
14.1% Average – 10.7%
5.7% 4.7% 4.5% 2.0%
Comcast Knology NCP Eight NCP Seven Time Warner Charter Comm Cablevision -4.2%
7.0% 6.0% 5.0% 4.0% 3.0% 2.0% 1.0% 0.0%
6.1% 5.8% 5.7% 5.3% Average – 4.5% 3.8% 3.5% 1.1%
Average – 4.5%
30.0% 25.0% 20.0% 15.0% 10.0% 5.0% 0.0% -5.0% -10.0%
26.9% 23.0% 4.5% 4.3% 2.6% 1.0% Average – 7.9%
9.0% 8.0% 7.0% 6.0% 5.0% 4.0% 3.0% 2.0% 1.0% 0.0%
8.1% 7.6% 4.9% Average – 5.1% 3.8% 3.1% 3.1% 2.4%
Note: (1) NCP data based off Original Plan. Duff & Phelps | NCP 7
Duff & Phelps | NCP 7
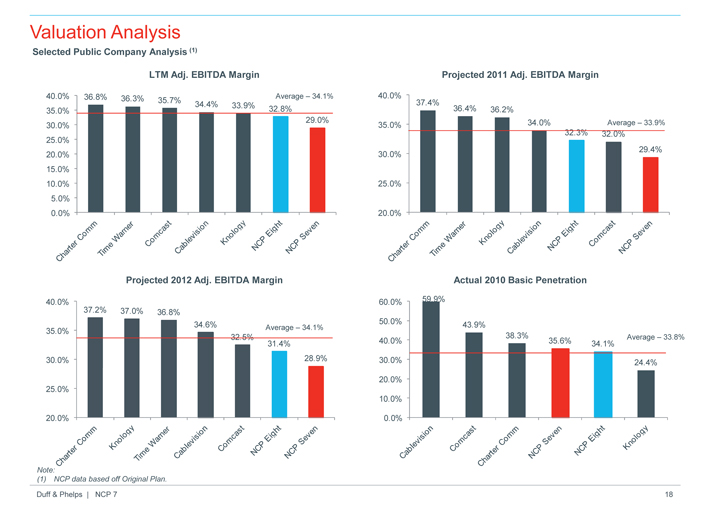
Valuation Analysis
Selected Public Company Analysis (1)
Comcast Knology NCP Eight NCP Seven Time Warner Charter Comm Cablevision -4.2%
LTM Adj. EBITDA Margin
40.0% 35.0% 30.0% 25.0% 20.0% 15.0% 10.0% 5.0% 0.0%
36.8% 36.3% Average – 34.1% 35.7% 34.4% 33.9% 32.8% 29.0%
37.2% 37.0% 36.8% 34.6% Average – 34.1% 32.5% 31.4% 28.9%
40.0% 35.0% 30.0% 25.0% 20.0%
40.0% 35.0% 30.0% 25.0% 20.0%
Projected 2011 Adj. EBITDA Margin
37.4% 36.4% 36.2% 34.0% Average – 33.9% 32.3% 32.0% 29.4% 60.0% 50.0% 40.0% 30.0% 20.0% 10.0% 0.0%
Actual 2010 Basic Penetration
59.9% 43.9% 38.3% Average – 33.8% 35.6% 34.1% 24.4%
Note:
(1) | NCP data based off Original Plan. |
Duff & Phelps | NCP 7
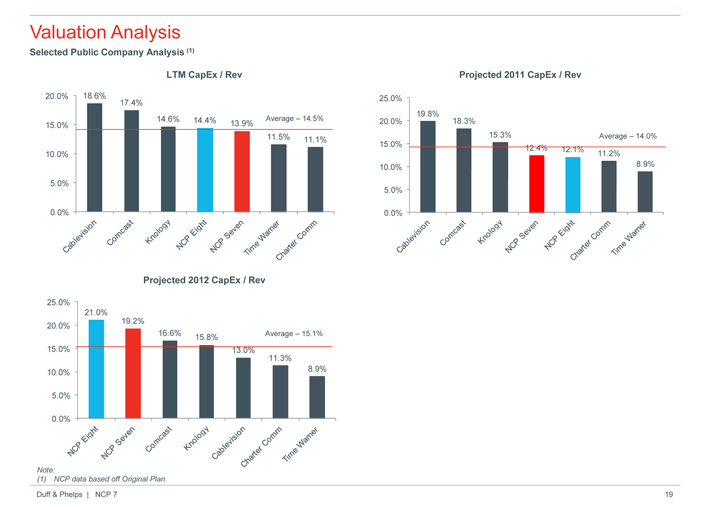
Valuation Analysis
Selected Public Company Analysis (1)
Comcast Knology NCP Eight NCP Seven Time Warner Charter Comm Cablevision -4.2%
LTM CapEx / Rev
20.0% 15.0% 10.0% 5.0% 0.0%
18.6% 17.4% 14.6% 14.4% Average – 14.5% 13.9% 11.5% 11.1%
25.0% 20.0% 15.0% 10.0% 5.0% 0.0%
Projected 2012 CapEx / Rev
21.0% 19.2% 16.6% Average – 15.1% 15.8% 13.0% 11.3% 8.9%
25.0% 20.0% 15.0% 10.0% 5.0% 0.0%
Projected 2011 CapEx / Rev
19.8% 18.3% 15.3% Average – 14.0% 12.4% 12.1% 11.2% 8.9%
Note:
(1) | NCP data based off Original Plan. |
Duff & Phelps | NCP 7
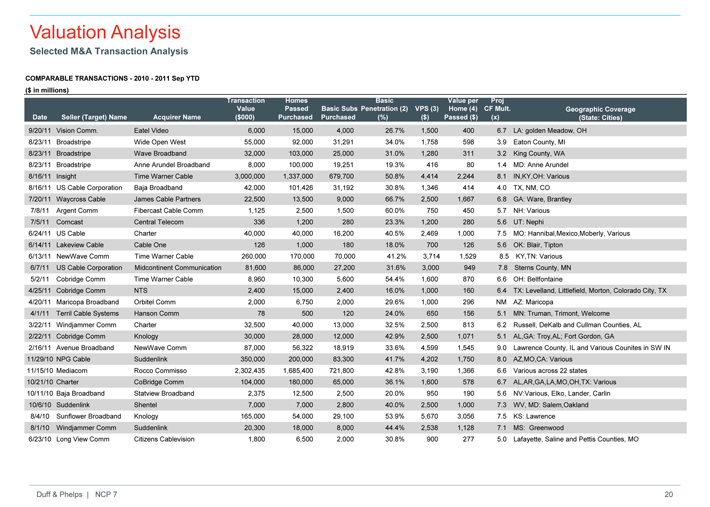
Valuation Analysis
Selected M&A Transaction Analysis
COMPARABLE TRANSACTIONS—2010—2011 Sep YTD ($ in millions)
Transaction Homes Basic Value per Proj
Value Passed Basic Subs Penetration (2) VPS (3) Home (4) CF Mult. Geographic Coverage
Date Seller (Target) Name Acquirer Name($000) Purchased Purchased(%)($) Passed ($)(x)(State: Cities)
9/20/11 Vision Comm. Eatel Video 6,000 15,000 4,000 26.7% 1,500 400 6.7 LA: golden Meadow, OH
8/23/11 Broadstripe Wide Open West 55,000 92,000 31,291 34.0% 1,758 598 3.9 Eaton County, MI
8/23/11 Broadstripe Wave Broadband 32,000 103,000 25,000 31.0% 1,280 311 3.2 King County, WA
8/23/11 Broadstripe Anne Arundel Broadband 8,000 100,000 19,251 19.3% 416 80 1.4 MD: Anne Arundel
8/16/11 Insight Time Warner Cable 3,000,000 1,337,000 679,700 50.8% 4,414 2,244 8.1 IN,KY,OH: Various
8/16/11 US Cable Corporation Baja Broadband 42,000 101,426 31,192 30.8% 1,346 414 4.0 TX, NM, CO
7/20/11 Waycross Cable James Cable Partners 22,500 13,500 9,000 66.7% 2,500 1,667 6.8 GA: Ware, Brantley
7/8/11 Argent Comm Fibercast Cable Comm 1,125 2,500 1,500 60.0% 750 450 5.7 NH: Various
7/5/11 Comcast Central Telecom 336 1,200 280 23.3% 1,200 280 5.6 UT: Nephi
6/24/11 US Cable Charter 40,000 40,000 16,200 40.5% 2,469 1,000 7.5 MO: Hannibal,Mexico,Moberly, Various
6/14/11 Lakeview Cable Cable One 126 1,000 180 18.0% 700 126 5.6 OK: Blair, Tipton
6/13/11 NewWave Comm Time Warner Cable 260,000 170,000 70,000 41.2% 3,714 1,529 8.5 KY,TN: Various
6/7/11 US Cable Corporation Midcontinent Communications 81,600 86,000 27,200 31.6% 3,000 949 7.8 Sterns County, MN
5/2/11 Cobridge Comm Time Warner Cable 8,960 10,300 5,600 54.4% 1,600 870 6.6 OH: Bellfontaine
4/25/11 Cobridge Comm NTS 2,400 15,000 2,400 16.0% 1,000 160 6.4 TX: Levelland, Littlefield, Morton, Colorado City, TX
4/20/11 Maricopa Broadband Orbitel Comm 2,000 6,750 2,000 29.6% 1,000 296 NM AZ: Maricopa
4/1/11 Terril Cable Systems Hanson Comm 78 500 120 24.0% 650 156 5.1 MN: Truman, Trimont, Welcome
3/22/11 Windjammer Comm Charter 32,500 40,000 13,000 32.5% 2,500 813 6.2 Russell, DeKalb and Cullman Counties, AL
2/22/11 Cobridge Comm Knology 30,000 28,000 12,000 42.9% 2,500 1,071 5.1 AL,GA: Troy,AL; Fort Gordon, GA
2/16/11 Avenue Broadband NewWave Comm 87,000 56,322 18,919 33.6% 4,599 1,545 9.0 Lawrence County, IL and Various Counites in SW IN
11/29/10 NPG Cable Suddenlink 350,000 200,000 83,300 41.7% 4,202 1,750 8.0 AZ,MO,CA: Various
11/15/10 Mediacom Rocco Commisso 2,302,435 1,685,400 721,800 42.8% 3,190 1,366 6.6 Various across 22 states
10/21/10 Charter CoBridge Comm 104,000 180,000 65,000 36.1% 1,600 578 6.7 AL,AR,GA,LA,MO,OH,TX: Various
10/11/10 Baja Broadband Statview Broadband 2,375 12,500 2,500 20.0% 950 190 5.6 NV:Various, Elko, Lander, Carlin
10/6/10 Suddenlink Shentel 7,000 7,000 2,800 40.0% 2,500 1,000 7.3 WV, MD: Salem,Oakland
8/4/10 Sunflower Broadband Knology 165,000 54,000 29,100 53.9% 5,670 3,056 7.5 KS: Lawrence
8/1/10 Windjammer Comm Suddenlink 20,300 18,000 8,000 44.4% 2,538 1,128 7.1 MS: Greenwood
6/23/10 Long View Comm Citizens Cablevision 1,800 6,500 2,000 30.8% 900 277 5.0 Lafayette, Saline and Pettis Counties, MO
Duff & Phelps | NCP 7
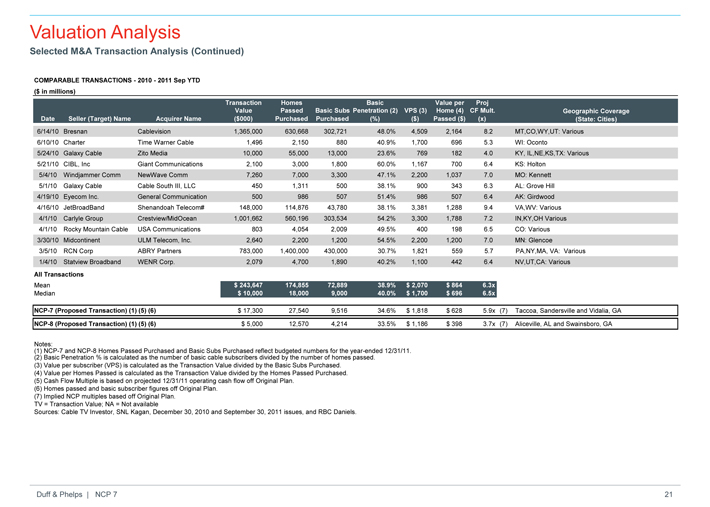
Valuation Analysis
Selected M&A Transaction Analysis (Continued)
COMPARABLE TRANSACTIONS—2010—2011 Sep YTD ($ in millions)
Transaction Homes Basic Value per Proj
Value Passed Basic Subs Penetration (2) VPS (3) Home (4) CF Mult. Geographic Coverage
Date Seller (Target) Name Acquirer Name($000) Purchased Purchased(%)($) Passed ($)(x)(State: Cities)
6/14/10 Bresnan Cablevision 1,365,000 630,668 302,721 48.0% 4,509 2,164 8.2 MT,CO,WY,UT: Various
6/10/10 Charter Time Warner Cable 1,496 2,150 880 40.9% 1,700 696 5.3 WI: Oconto
5/24/10 Galaxy Cable Zito Media 10,000 55,000 13,000 23.6% 769 182 4.0 KY, IL,NE,KS,TX: Various
5/21/10 CIBL, Inc Giant Communications 2,100 3,000 1,800 60.0% 1,167 700 6.4 KS: Holton
5/4/10 Windjammer Comm NewWave Comm 7,260 7,000 3,300 47.1% 2,200 1,037 7.0 MO: Kennett
5/1/10 Galaxy Cable Cable South III, LLC 450 1,311 500 38.1% 900 343 6.3 AL: Grove Hill
4/19/10 Eyecom Inc. General Communication 500 986 507 51.4% 986 507 6.4 AK: Girdwood
4/16/10 JetBroadBand Shenandoah Telecom# 148,000 114,876 43,780 38.1% 3,381 1,288 9.4 VA,WV: Various
4/1/10 Carlyle Group Crestview/MidOcean 1,001,662 560,196 303,534 54.2% 3,300 1,788 7.2 IN,KY,OH Various
4/1/10 Rocky Mountain Cable USA Communications 803 4,054 2,009 49.5% 400 198 6.5 CO: Various
3/30/10 Midcontinent ULM Telecom, Inc. 2,640 2,200 1,200 54.5% 2,200 1,200 7.0 MN: Glencoe
3/5/10 RCN Corp ABRY Partners 783,000 1,400,000 430,000 30.7% 1,821 559 5.7 PA,NY,MA, VA: Various
1/4/10 Statview Broadband WENR Corp. 2,079 4,700 1,890 40.2% 1,100 442 6.4 NV,UT,CA: Various
All Transactions
Mean $ 243,647 174,855 72,889 38.9% $ 2,070 $ 864 6.3x
Median $ 10,000 18,000 9,000 40.0% $ 1,700 $ 696 6.5x
NCP-7 (Proposed Transaction) (1) (5) (6) $ 17,300 27,540 9,516 34.6% $ 1,818 $ 628 5.9x(7) Taccoa, Sandersville and Vidalia, GA
NCP-8 (Proposed Transaction) (1) (5) (6) $ 5,000 12,570 4,214 33.5% $ 1,186 $ 398 3.7x(7) Aliceville, AL and Swainsboro, GA
Notes:
(1) NCP-7 and NCP-8 Homes Passed Purchased and Basic Subs Purchased reflect budgeted numbers for the year-ended 12/31/11.
(2) Basic Penetration % is calculated as the number of basic cable subscribers divided by the number of homes passed.
(3) Value per subscriber (VPS) is calculated as the Transaction Value divided by the Basic Subs Purchased.
(4) Value per Homes Passed is calculated as the Transaction Value divided by the Homes Passed Purchased.
(5) Cash Flow Multiple is based on projected 12/31/11 operating cash flow off Original Plan.
(6) Homes passed and basic subscriber figures off Original Plan.
(7) Implied NCP multiples based off Original Plan.
TV = Transaction Value; NA = Not available
Sources: Cable TV Investor, SNL Kagan, December 30, 2010 and September 30, 2011 issues, and RBC Daniels.
Duff & Phelps | NCP 7
Valuation Analysis
Summary of the Market Approach
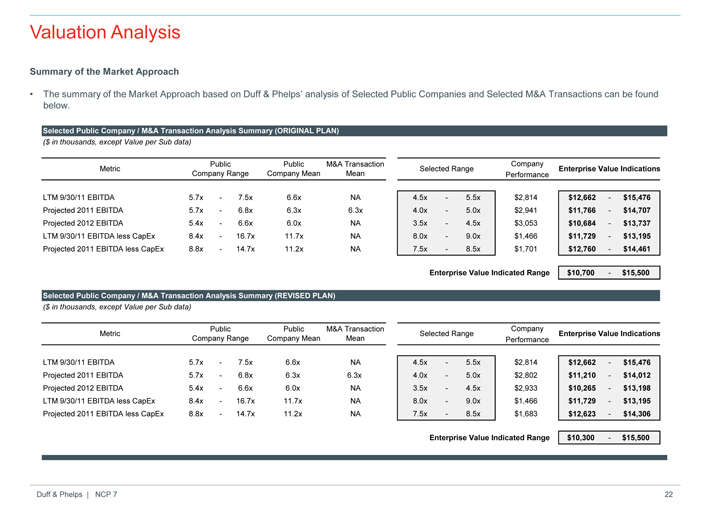
• The summary of the Market Approach based on Duff & Phelps’ analysis of Selected Public Companies and Selected M&A Transactions can be found below.
Selected Public Company / M&A Transaction Analysis Summary (ORIGINAL PLAN)
($ in thousands, except Value per Sub data)
Public Public M&A Transaction Company
Metric Selected Range Enterprise Value Indications
Company Range Company Mean Mean Performance
LTM 9/30/11 EBITDA 5.7x—7.5x 6.6x NA 4.5x—5.5x $2,814 $12,662—$15,476
Projected 2011 EBITDA 5.7x—6.8x 6.3x 6.3x 4.0x—5.0x $2,941 $11,766—$14,707
Projected 2012 EBITDA 5.4x—6.6x 6.0x NA 3.5x—4.5x $3,053 $10,684—$13,737
LTM 9/30/11 EBITDA less CapEx 8.4x—16.7x 11.7x NA 8.0x—9.0x $1,466 $11,729—$13,195
Projected 2011 EBITDA less CapEx 8.8x—14.7x 11.2x NA 7.5x—8.5x $1,701 $12,760—$14,461
Enterprise Value Indicated Range $10,700—$15,500
Selected Public Company / M&A Transaction Analysis Summary (REVISED PLAN)
($ in thousands, except Value per Sub data)
Public Public M&A Transaction Company
Metric Selected Range Enterprise Value Indications
Company Range Company Mean Mean Performance
LTM 9/30/11 EBITDA 5.7x—7.5x 6.6x NA 4.5x—5.5x $2,814 $12,662—$15,476
Projected 2011 EBITDA 5.7x—6.8x 6.3x 6.3x 4.0x—5.0x $2,802 $11,210—$14,012
Projected 2012 EBITDA 5.4x—6.6x 6.0x NA 3.5x—4.5x $2,933 $10,265—$13,198
LTM 9/30/11 EBITDA less CapEx 8.4x—16.7x 11.7x NA 8.0x—9.0x $1,466 $11,729—$13,195
Projected 2011 EBITDA less CapEx 8.8x—14.7x 11.2x NA 7.5x—8.5x $1,683 $12,623—$14,306
Enterprise Value Indicated Range $10,300—$15,500
Duff & Phelps | NCP 7

Conclusion III.
Executive Summary
Valuation Conclusions
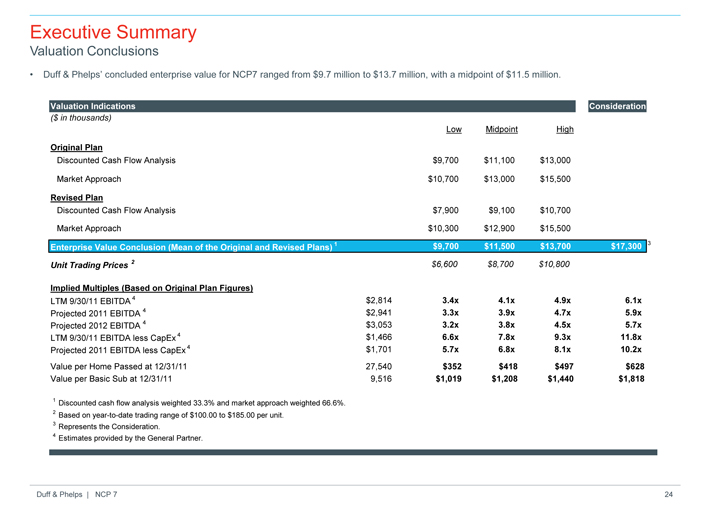
• Duff & Phelps’ concluded enterprise value for NCP7 ranged from $9.7 million to $13.7 million, with a midpoint of $11.5 million.
Valuation Indications Consideration
($ in thousands)
Low Midpoint High
Original Plan
Discounted Cash Flow Analysis $9,700 $11,100 $13,000
Market Approach $10,700 $13,000 $15,500
Revised Plan
Discounted Cash Flow Analysis $7,900 $9,100 $10,700
Market Approach $10,300 $12,900 $15,500
Enterprise Value Conclusion (Mean of the Original and Revised Plans) 1 $9,700 $11,500 $13,700 $17,300 3
Unit Trading Prices 2 $6,600 $8,700 $10,800
Implied Multiples (Based on Original Plan Figures)
LTM 9/30/11 EBITDA 4 $2,814 3.4x 4.1x 4.9x 6.1x
Projected 2011 EBITDA 4 $2,941 3.3x 3.9x 4.7x 5.9x
Projected 2012 EBITDA 4 $3,053 3.2x 3.8x 4.5x 5.7x
LTM 9/30/11 EBITDA less CapEx 4 $1,466 6.6x 7.8x 9.3x 11.8x
Projected 2011 EBITDA less CapEx 4 $1,701 5.7x 6.8x 8.1x 10.2x
Value per Home Passed at 12/31/11 27,540 $352 $418 $497 $628
Value per Basic Sub at 12/31/11 9,516 $1,019 $1,208 $1,440 $1,818
1 Discounted cash flow analysis weighted 33.3% and market approach weighted 66.6%.
2 Based on year-to-date trading range of $100.00 to $185.00 per unit.
3 Represents the Consideration.
4 Estimates provided by the General Partner.
Duff & Phelps | NCP 7
IV. Appendix
– Transaction Background
– Limited Partnership Unit Trading Summary
– Assumptions, Qualifications and Limiting Conditions
Transaction Background
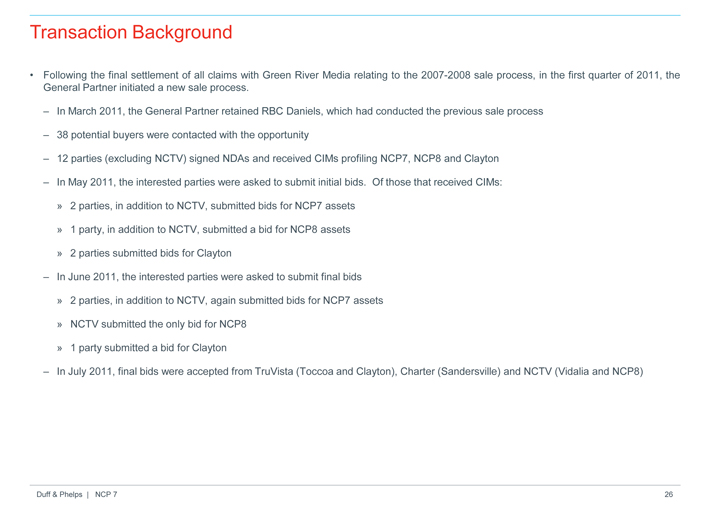
• Following the final settlement of all claims with Green River Media relating to the 2007-2008 sale process, in the first quarter of 2011, the General Partner initiated a new sale process.
– In March 2011, the General Partner retained RBC Daniels, which had conducted the previous sale process
– 38 potential buyers were contacted with the opportunity
– 12 parties (excluding NCTV) signed NDAs and received CIMs profiling NCP7, NCP8 and Clayton
– In May 2011, the interested parties were asked to submit initial bids. Of those that received CIMs:
» 2 parties, in addition to NCTV, submitted bids for NCP7 assets
» 1 party, in addition to NCTV, submitted a bid for NCP8 assets
» 2 parties submitted bids for Clayton
– In June 2011, the interested parties were asked to submit final bids
» 2 parties, in addition to NCTV, again submitted bids for NCP7 assets
» NCTV submitted the only bid for NCP8
» 1 party submitted a bid for Clayton
– In July 2011, final bids were accepted from TruVista (Toccoa and Clayton), Charter (Sandersville) and NCTV (Vidalia and NCP8)
Duff & Phelps | NCP 7
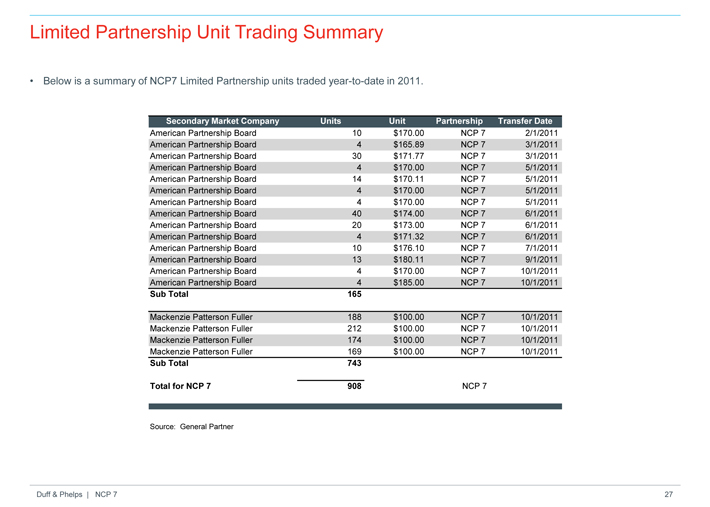
Limited Partnership Unit Trading Summary
• Below is a summary of NCP7 Limited Partnership units traded year-to-date in 2011.
Secondary Market Company Units Unit Partnership Transfer Date
American Partnership Board 10 $170.00 NCP 7 2/1/2011
American Partnership Board 4 $165.89 NCP 7 3/1/2011
American Partnership Board 30 $171.77 NCP 7 3/1/2011
American Partnership Board 4 $170.00 NCP 7 5/1/2011
American Partnership Board 14 $170.11 NCP 7 5/1/2011
American Partnership Board 4 $170.00 NCP 7 5/1/2011
American Partnership Board 4 $170.00 NCP 7 5/1/2011
American Partnership Board 40 $174.00 NCP 7 6/1/2011
American Partnership Board 20 $173.00 NCP 7 6/1/2011
American Partnership Board 4 $171.32 NCP 7 6/1/2011
American Partnership Board 10 $176.10 NCP 7 7/1/2011
American Partnership Board 13 $180.11 NCP 7 9/1/2011
American Partnership Board 4 $170.00 NCP 7 10/1/2011
American Partnership Board 4 $185.00 NCP 7 10/1/2011
Sub Total 165
Mackenzie Patterson Fuller 188 $100.00 NCP 7 10/1/2011
Mackenzie Patterson Fuller 212 $100.00 NCP 7 10/1/2011
Mackenzie Patterson Fuller 174 $100.00 NCP 7 10/1/2011
Mackenzie Patterson Fuller 169 $100.00 NCP 7 10/1/2011
Sub Total 743
Total for NCP 7 908 NCP 7
Source: General Partner
Duff & Phelps | NCP 7
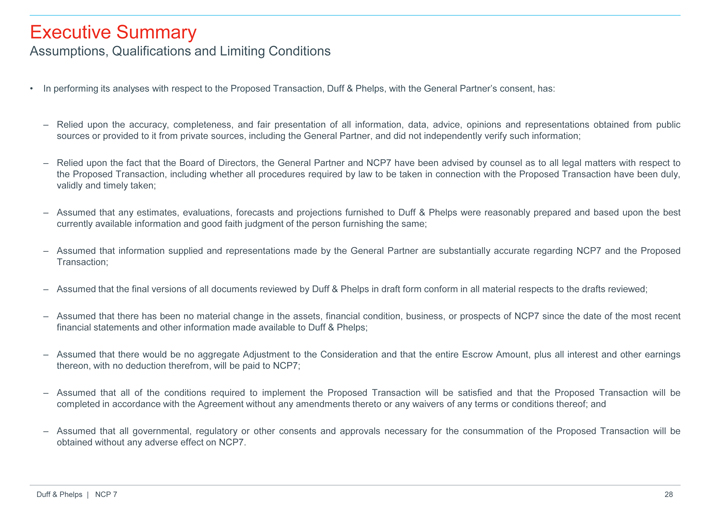
Executive Summary
Assumptions, Qualifications and Limiting Conditions
• In performing its analyses with respect to the Proposed Transaction, Duff & Phelps, with the General Partner’s consent, has:
– Relied upon the accuracy, completeness, and fair presentation of all information, data, advice, opinions and representations obtained from public sources or provided to it from private sources, including the General Partner, and did not independently verify such information;
– Relied upon the fact that the Board of Directors, the General Partner and NCP7 have been advised by counsel as to all legal matters with respect to the Proposed Transaction, including whether all procedures required by law to be taken in connection with the Proposed Transaction have been duly, validly and timely taken;
– Assumed that any estimates, evaluations, forecasts and projections furnished to Duff & Phelps were reasonably prepared and based upon the best currently available information and good faith judgment of the person furnishing the same;
– Assumed that information supplied and representations made by the General Partner are substantially accurate regarding NCP7 and the Proposed Transaction;
– Assumed that the final versions of all documents reviewed by Duff & Phelps in draft form conform in all material respects to the drafts reviewed;
– Assumed that there has been no material change in the assets, financial condition, business, or prospects of NCP7 since the date of the most recent financial statements and other information made available to Duff & Phelps;
– Assumed that there would be no aggregate Adjustment to the Consideration and that the entire Escrow Amount, plus all interest and other earnings thereon, with no deduction therefrom, will be paid to NCP7;
– Assumed that all of the conditions required to implement the Proposed Transaction will be satisfied and that the Proposed Transaction will be completed in accordance with the Agreement without any amendments thereto or any waivers of any terms or conditions thereof; and
– Assumed that all governmental, regulatory or other consents and approvals necessary for the consummation of the Proposed Transaction will be obtained without any adverse effect on NCP7.
Duff & Phelps | NCP 7


