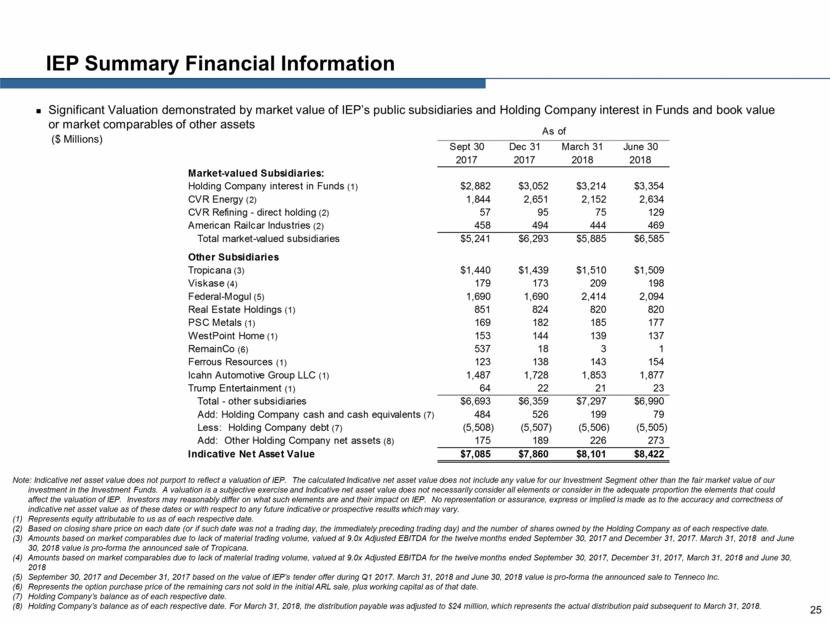
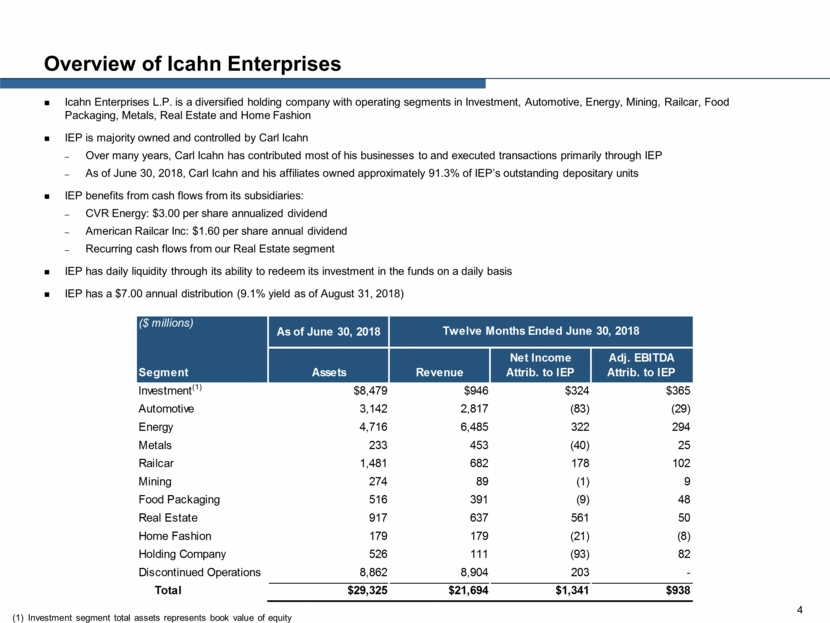
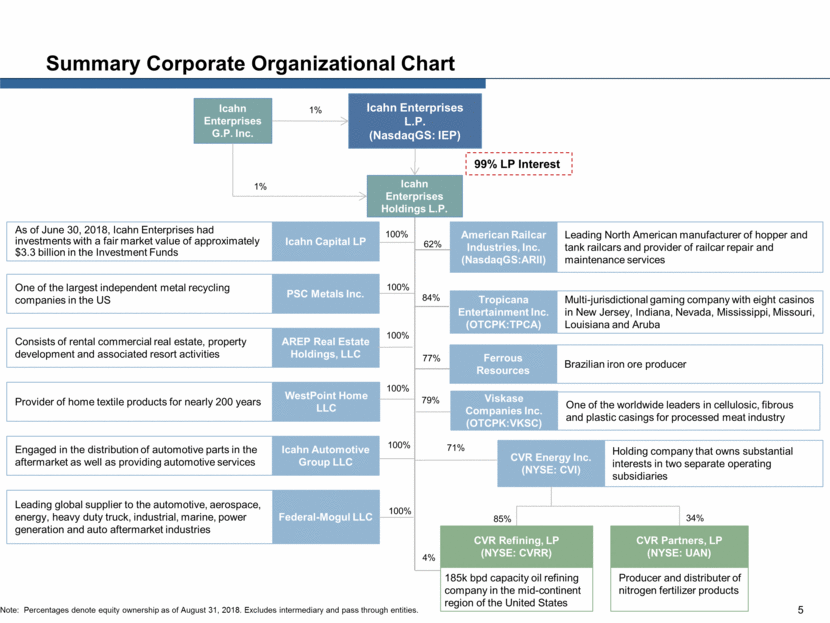
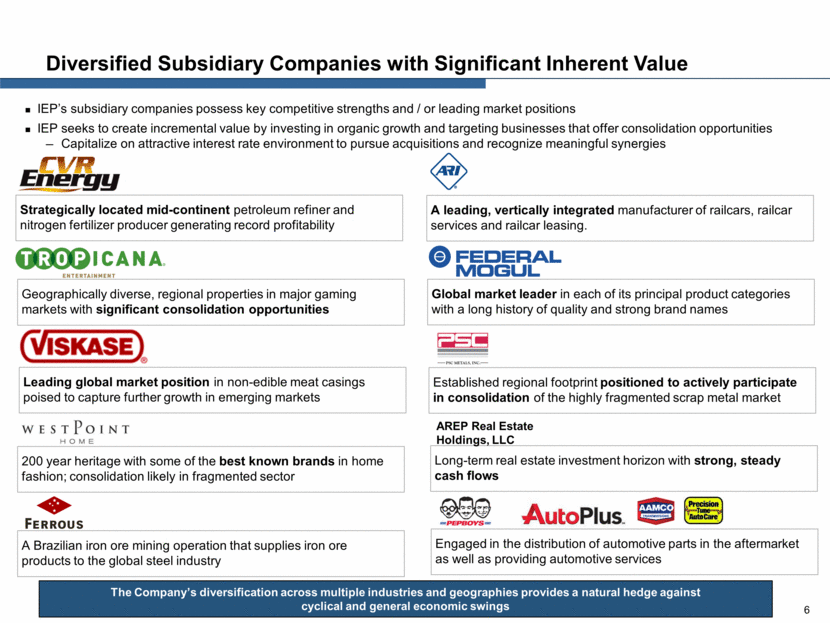
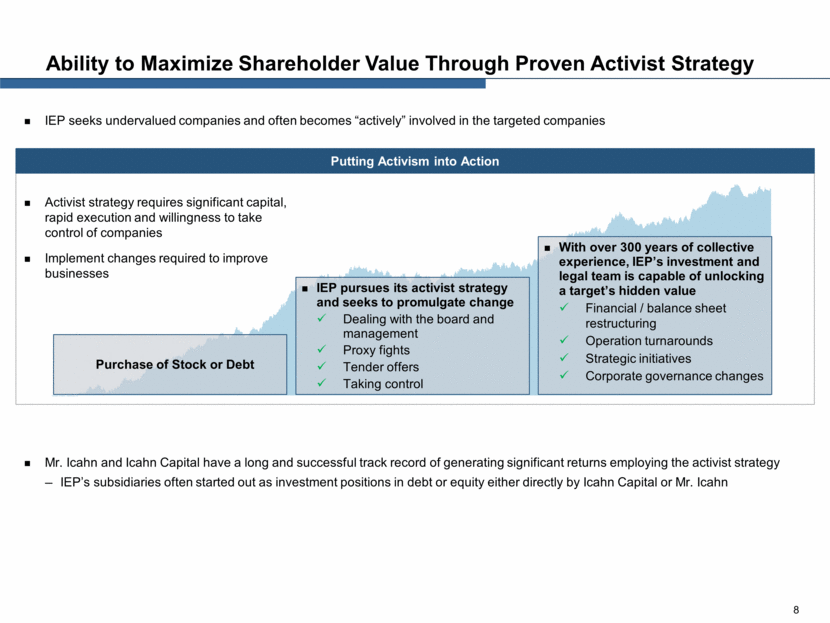
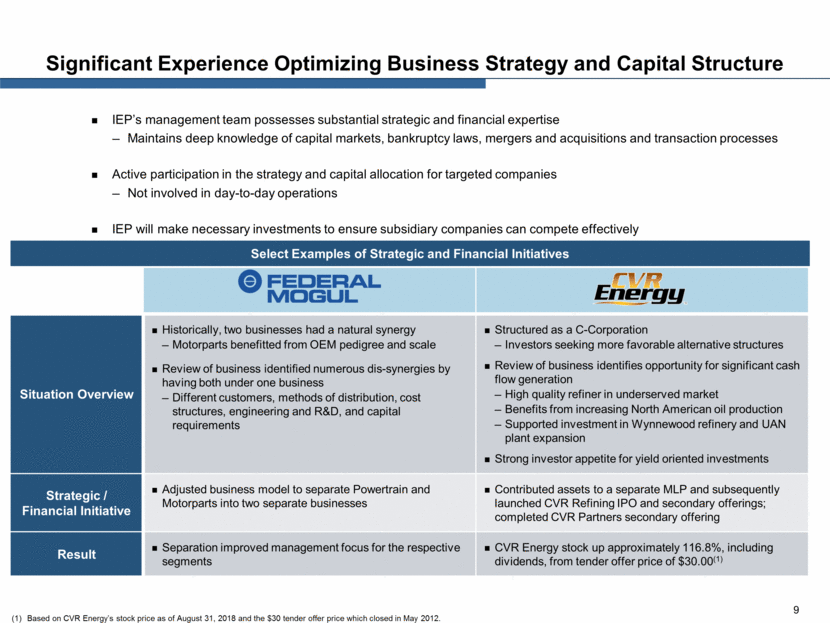
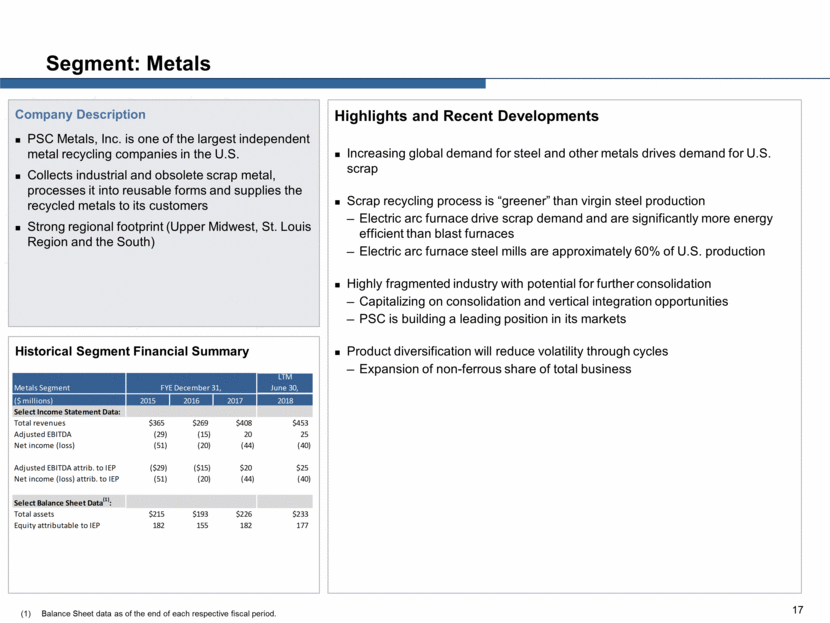
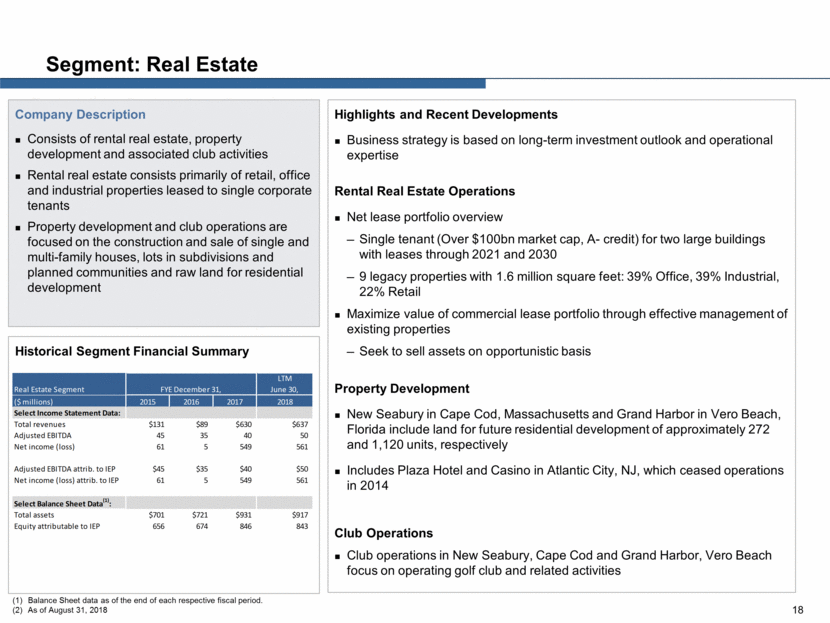
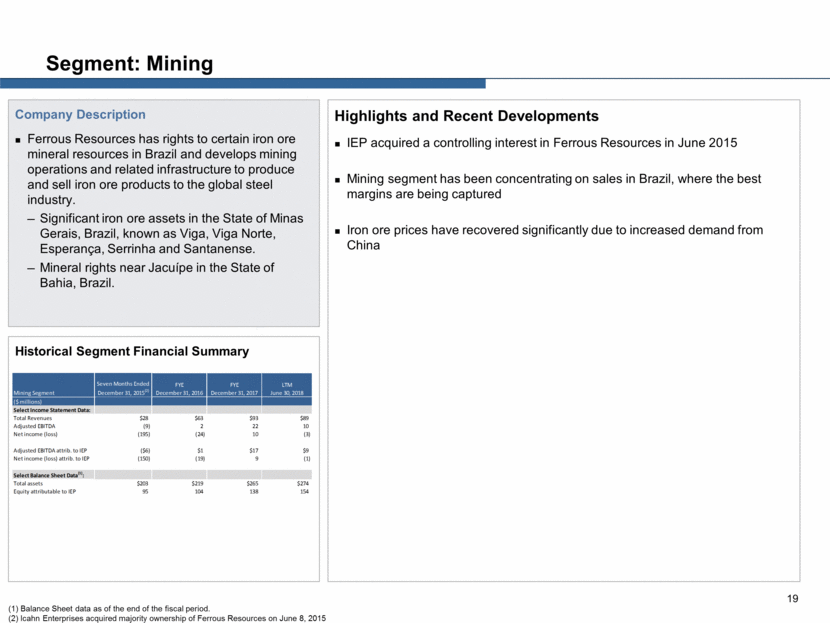
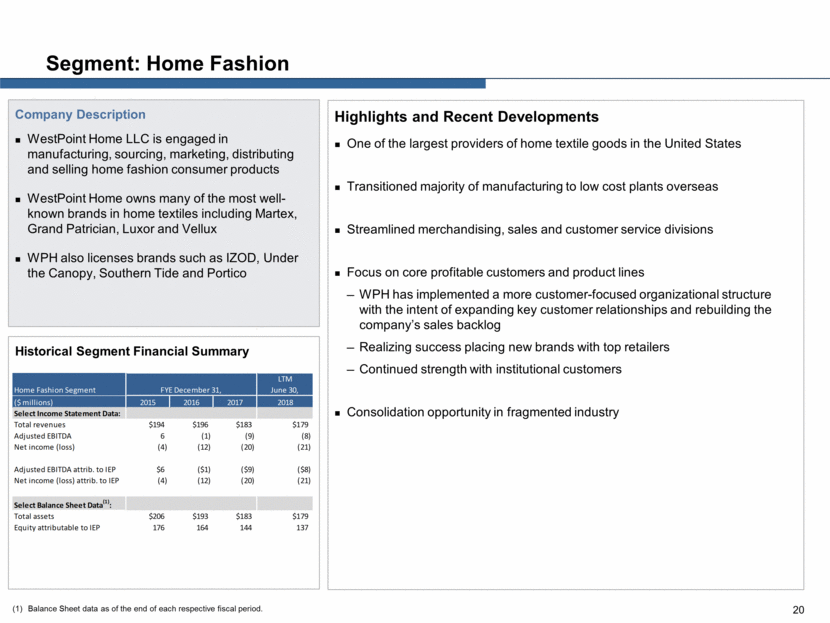
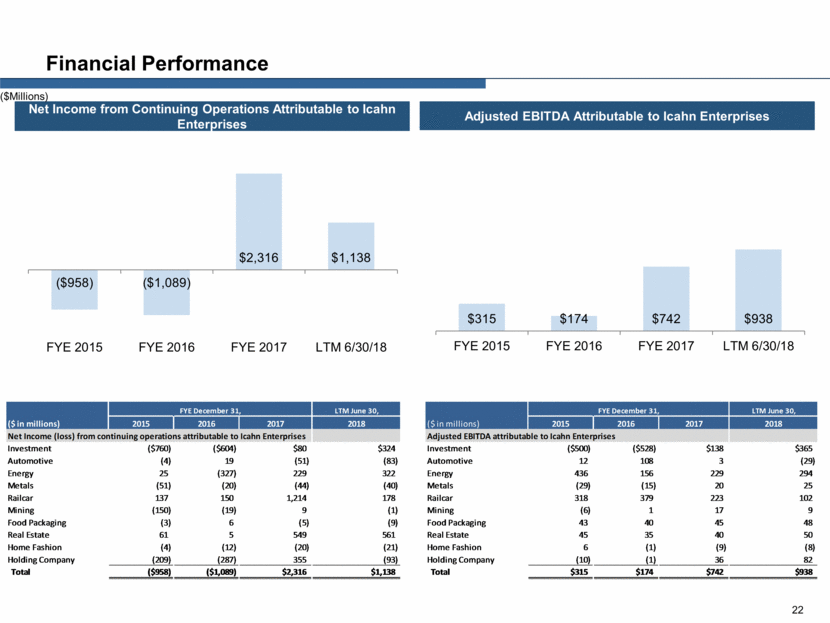
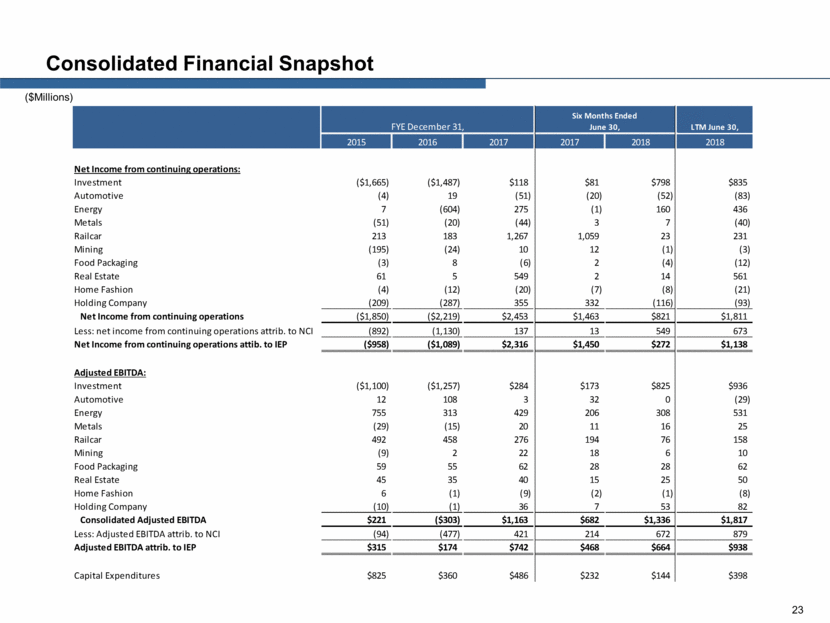
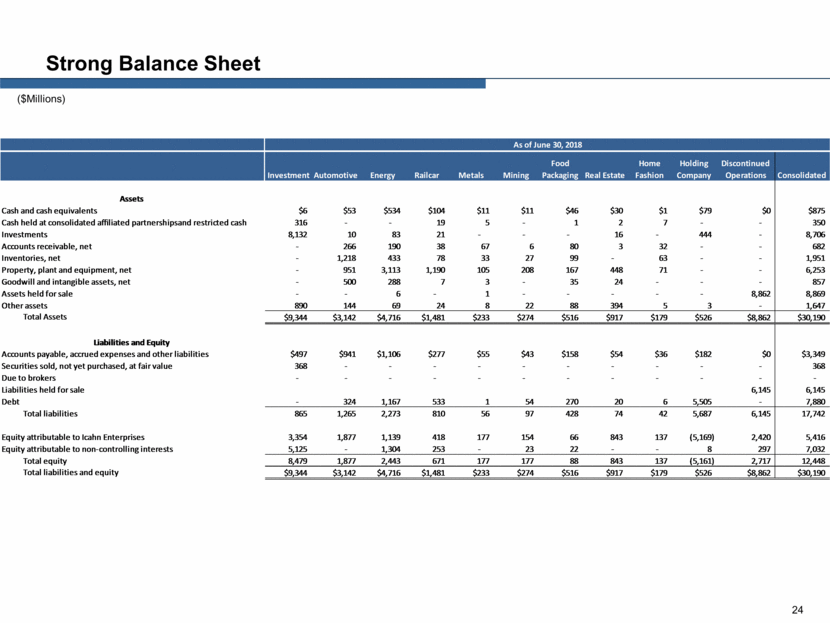
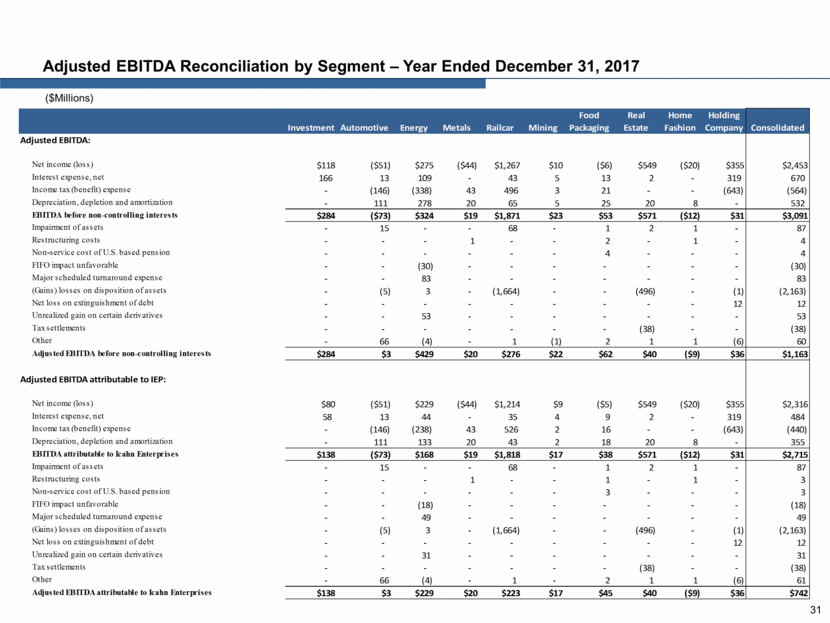
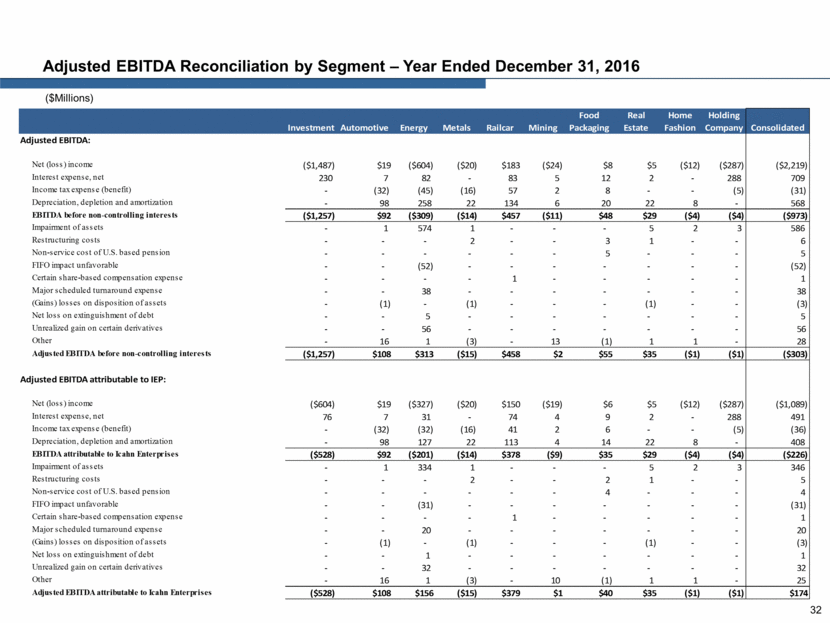
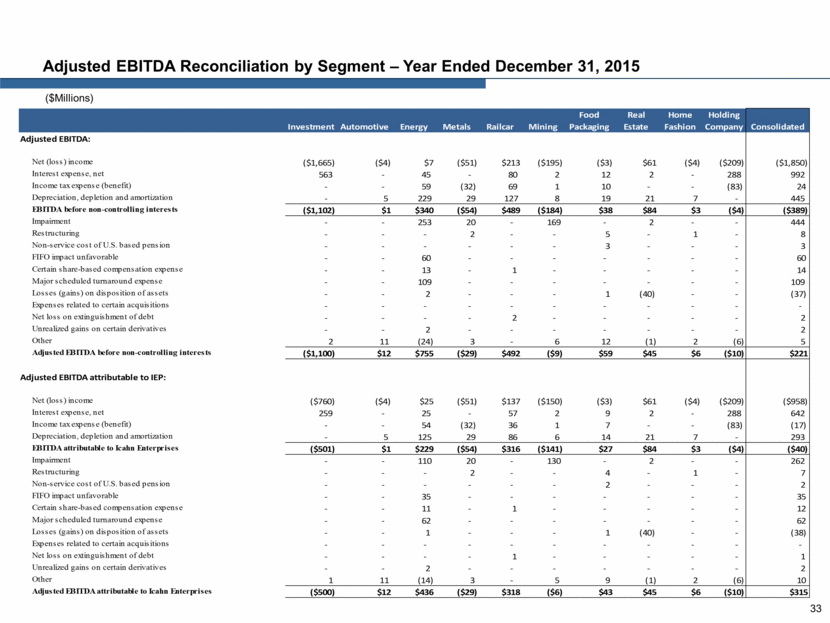
IEP Summary Financial Information Significant Valuation demonstrated by market value of IEP’s public subsidiaries and Holding Company interest in Funds and book value or market comparables of other assets 25 ($ Millions) Note: Indicative net asset value does not purport to reflect a valuation of IEP. The calculated Indicative net asset value does not include any value for our Investment Segment other than the fair market value of our investment in the Investment Funds. A valuation is a subjective exercise and Indicative net asset value does not necessarily consider all elements or consider in the adequate proportion the elements that could affect the valuation of IEP. Investors may reasonably differ on what such elements are and their impact on IEP. No representation or assurance, express or implied is made as to the accuracy and correctness of indicative net asset value as of these dates or with respect to any future indicative or prospective results which may vary. (1) Represents equity attributable to us as of each respective date. (2) Based on closing share price on each date (or if such date was not a trading day, the immediately preceding trading day) and the number of shares owned by the Holding Company as of each respective date. (3) Amounts based on market comparables due to lack of material trading volume, valued at 9.0x Adjusted EBITDA for the twelve months ended September 30, 2017 and December 31, 2017. March 31, 2018 and June 30, 2018 value is pro-forma the announced sale of Tropicana. (4) Amounts based on market comparables due to lack of material trading volume, valued at 9.0x Adjusted EBITDA for the twelve months ended September 30, 2017, December 31, 2017, March 31, 2018 and June 30, 2018 (5) September 30, 2017 and December 31, 2017 based on the value of IEP’s tender offer during Q1 2017. March 31, 2018 and June 30, 2018 value is pro-forma the announced sale to Tenneco Inc. (6) Represents the option purchase price of the remaining cars not sold in the initial ARL sale, plus working capital as of that date. (7) Holding Company’s balance as of each respective date. (8) Holding Company’s balance as of each respective date. For March 31, 2018, the distribution payable was adjusted to $24 million, which represents the actual distribution paid subsequent to March 31, 2018. Sept 30 Dec 31 March 31 June 30 2017 2017 2018 2018 Market-valued Subsidiaries: Holding Company interest in Funds (1) $2,882 $3,052 $3,214 $3,354 CVR Energy (2) 1,844 2,651 2,152 2,634 CVR Refining - direct holding (2) 57 95 75 129 American Railcar Industries (2) 458 494 444 469 Total market-valued subsidiaries $5,241 $6,293 $5,885 $6,585 Other Subsidiaries Tropicana (3) $1,440 $1,439 $1,510 $1,509 Viskase (4) 179 173 209 198 Federal-Mogul (5) 1,690 1,690 2,414 2,094 Real Estate Holdings (1) 851 824 820 820 PSC Metals (1) 169 182 185 177 WestPoint Home (1) 153 144 139 137 RemainCo (6) 537 18 3 1 Ferrous Resources (1) 123 138 143 154 Icahn Automotive Group LLC (1) 1,487 1,728 1,853 1,877 Trump Entertainment (1) 64 22 21 23 Total - other subsidiaries $6,693 $6,359 $7,297 $6,990 Add: Holding Company cash and cash equivalents (7) 484 526 199 79 Less: Holding Company debt (7) (5,508) (5,507) (5,506) (5,505) Add: Other Holding Company net assets (8) 175 189 226 273 Indicative Net Asset Value $7,085 $7,860 $8,101 $8,422 As of
