SECURITIES AND EXCHANGE COMMISSION
Washington, D.C. 20549
FORM 8-K
CURRENT REPORT
Pursuant to Section 13 or 15(d)
of the Securities Exchange Act of 1934
Date of Report (Date of earliest event reported): February 26, 2003
REPUBLIC BANCORP INC.
(Exact name of registrant as specified in its charter)
| | | | | |
| Michigan | | 0-15734 | | 38-2604669 |
| (State or other jurisdiction | | (Commission File No.) | | (IRS Employer |
| of incorporation) | | | | Identification No.) |
1070 East Main Street, Owosso, Michigan 48867
(Address of principal executive offices) (Zip Code)
Registrant’s telephone number, including area code: (989) 725-7337
(Former name or former address, if changed since last report)
TABLE OF CONTENTS
Item 9. Regulation F-D Disclosure
On February 26, 2003, Dana M. Cluckey, Republic Bancorp’s President and Chief Executive Officer, and Thomas F. Menacher, Executive Vice President, Treasurer and Chief Financial Officer, made a presentation at the Midwest 2003 Super-Community Bank Conference in Chicago, Illinois. The slide presentation is attached as Exhibit A to this Item 9.

| Midwest 2003 Super Community Bank Conference |
| Forward Looking Statements Statements contained in this presentation which are not historical facts are forward-looking statements as that item is defined in the Private Securities Litigation Reform Act of 1995. Such forward-looking statements are subject to risks and uncertainties which could cause actual results to differ materially from estimated results. Such risks and uncertainties are detailed in the Company's filings with the Securities and Exchange Commission. |
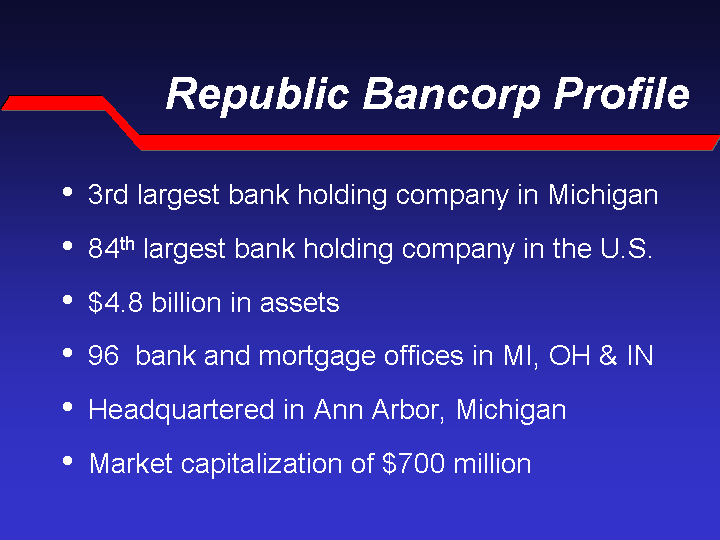
| Republic Bancorp Profile 3rd largest bank holding company in Michigan 84th largest bank holding company in the U.S. $4.8 billion in assets 96 bank and mortgage offices in MI, OH & IN Headquartered in Ann Arbor, Michigan Market capitalization of $700 million |
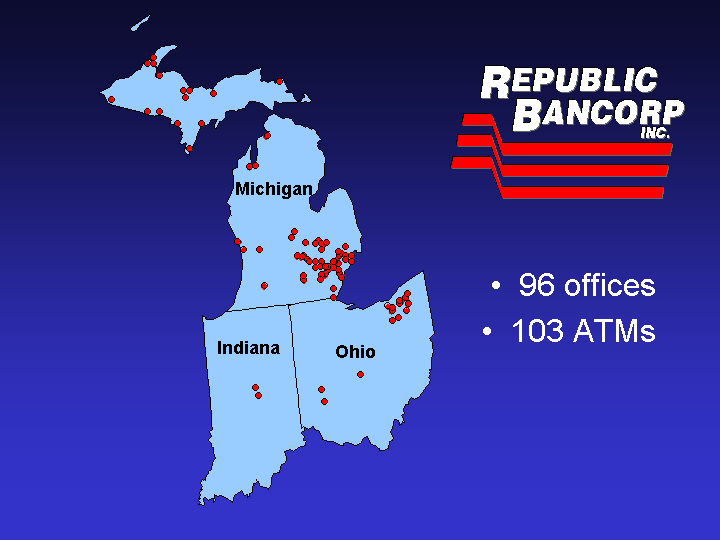
| Michigan Indiana Ohio 96 offices 103 ATMs |
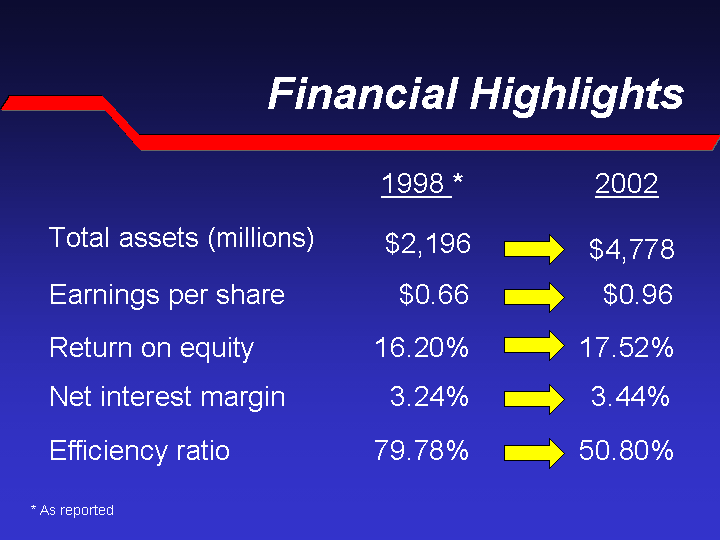
| Financial Highlights 1998 * 2002 Total assets (millions) Earnings per share $0.66 $0.96 Return on equity 16.20% 17.52% Net interest margin 3.24% 3.44% Efficiency ratio 79.78% 50.80% * As reported $2,196 $4,778 |

| Contribution to Income By Business Line Mortgage Retail Commercial East 0.4 0.4 0.2 Commercial Retail Mortgage 20% 40% 40% Mortgage Retail Commercial East 0.17 0.56 0.27 1998 2002 Mortgage 17% Commercial 27% Retail 56% |
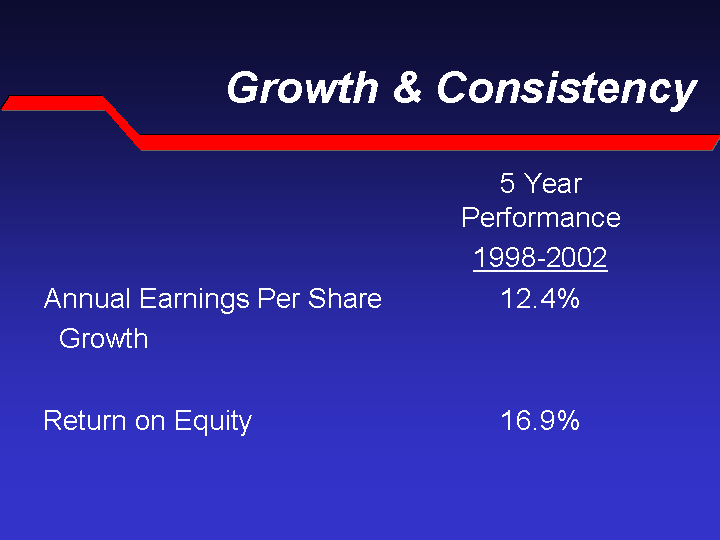
| Growth & Consistency 5 Year Performance 1998-2002 Annual Earnings Per Share Growth 12.4% Return on Equity 16.9% |
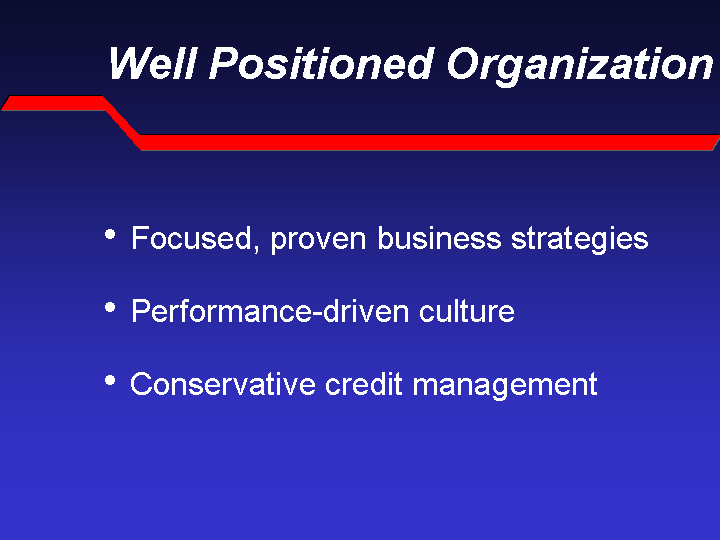
| Well Positioned Organization Focused, proven business strategies Performance-driven culture Conservative credit management |

| Focused Business Strategies Grow commercial real estate and SBA loans Further expand mortgage banking franchise in Bank's footprint Grow core deposits and home equity loans through relationship banking and cross-sell opportunities |
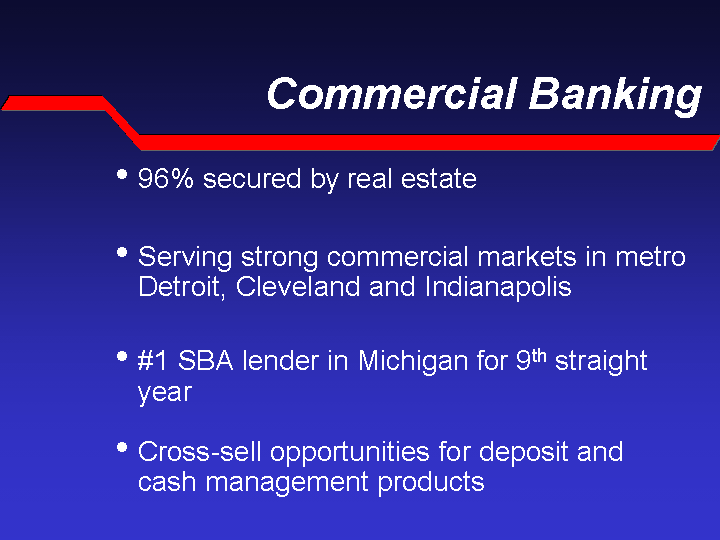
| Commercial Banking 96% secured by real estate Serving strong commercial markets in metro Detroit, Cleveland and Indianapolis #1 SBA lender in Michigan for 9th straight year Cross-sell opportunities for deposit and cash management products |

| Mortgage Banking Top ten retail mortgage lender in Midwest Mortgage loan originators in retail branches Significant cross-sell opportunities for home equity loans and deposit products |
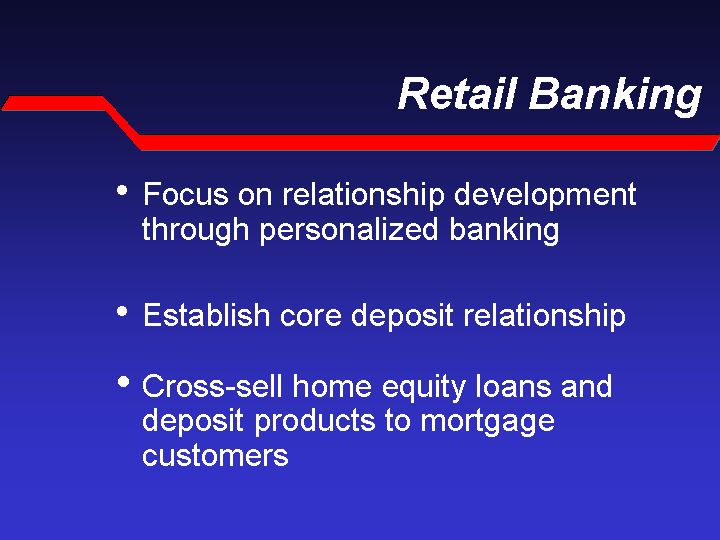
| Retail Banking Focus on relationship development through personalized banking Establish core deposit relationship Cross-sell home equity loans and deposit products to mortgage customers |
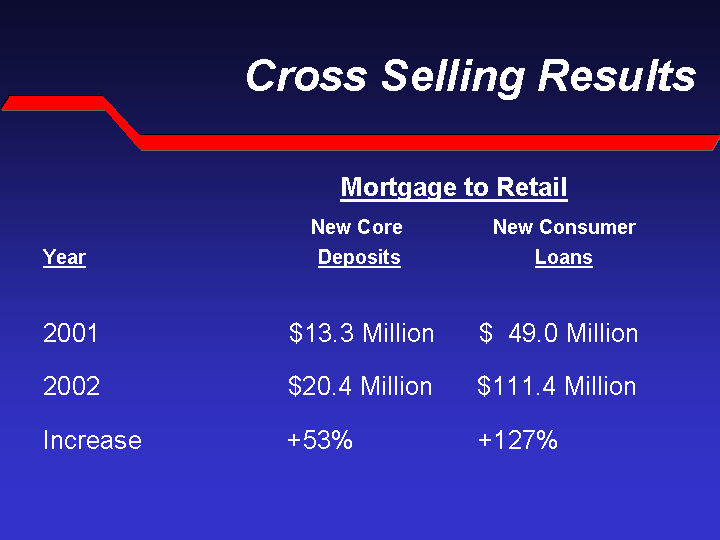
| Cross Selling Results Mortgage to Retail New Core New Consumer Year Deposits Loans 2001 $13.3 Million $ 49.0 Million 2002 $20.4 Million $111.4 Million Increase +53% +127% |
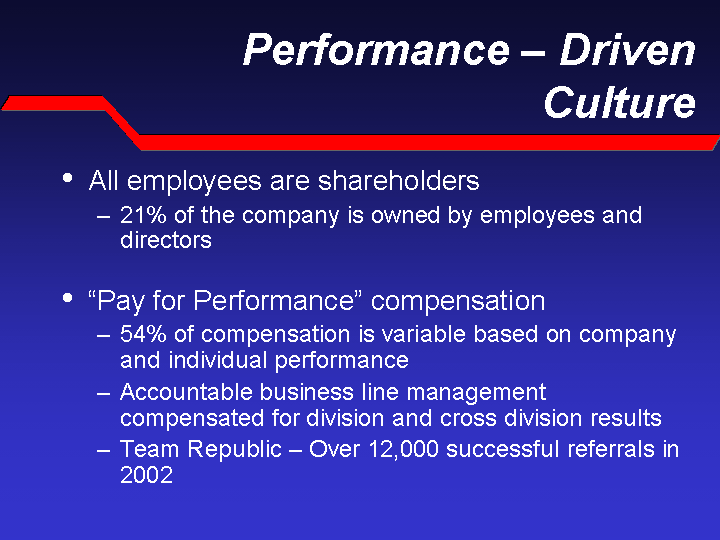
| Performance - Driven Culture All employees are shareholders 21% of the company is owned by employees and directors "Pay for Performance" compensation 54% of compensation is variable based on company and individual performance Accountable business line management compensated for division and cross division results Team Republic - Over 12,000 successful referrals in 2002 |
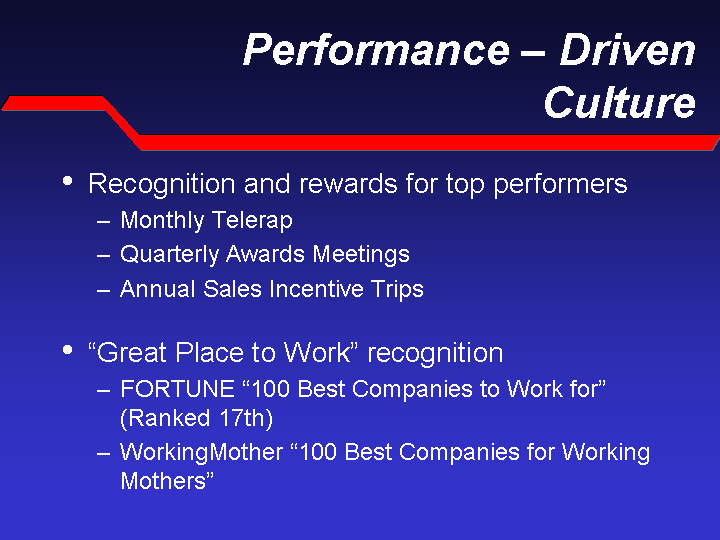
| Performance - Driven Culture Recognition and rewards for top performers Monthly Telerap Quarterly Awards Meetings Annual Sales Incentive Trips "Great Place to Work" recognition FORTUNE "100 Best Companies to Work for" (Ranked 17th) WorkingMother "100 Best Companies for Working Mothers" |
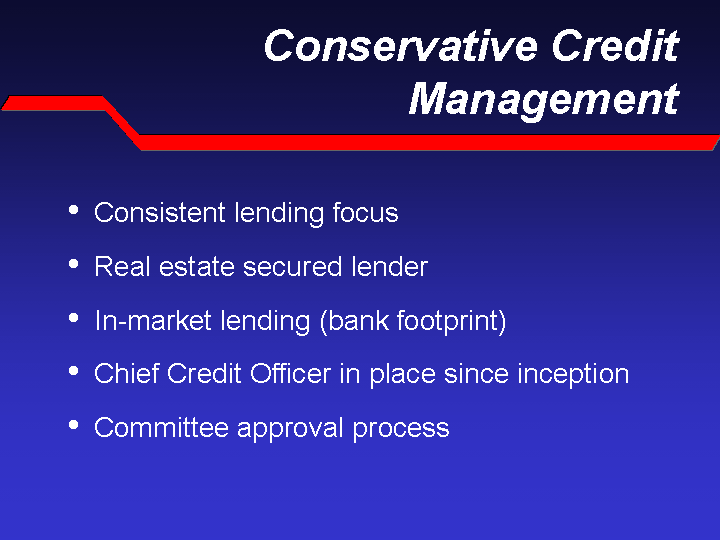
| Conservative Credit Management Consistent lending focus Real estate secured lender In-market lending (bank footprint) Chief Credit Officer in place since inception Committee approval process |
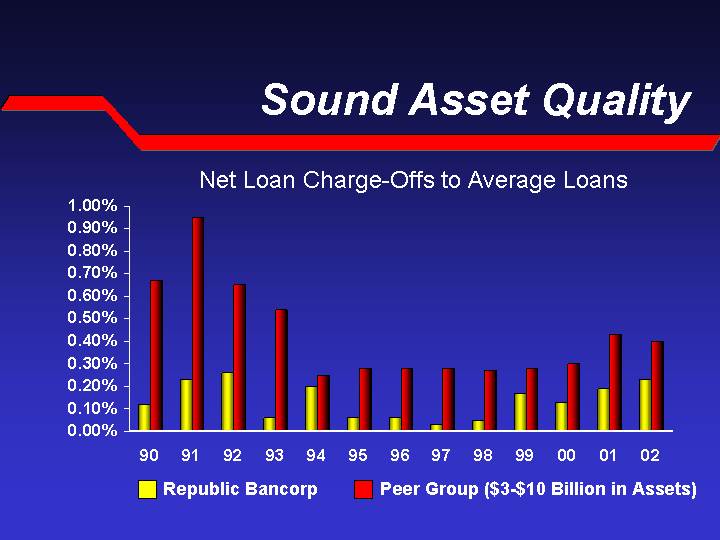
| Sound Asset Quality 90 91 92 93 94 95 96 97 98 99 00 01 02 RBI 0.0012 0.0023 0.0026 0.0006 0.002 0.0006 0.0006 0.0003 0.0005 0.0017 0.0013 0.0019 0.0023 Peers 0.0067 0.0095 0.0065 0.0054 0.0025 0.0028 0.0028 0.0028 0.0027 0.0028 0.003 0.0043 0.004 Peer Group ($3-$10 Billion in Assets) Net Loan Charge-Offs to Average Loans Republic Bancorp |

| Financial Highlights 9% 6.83 6.28 Tangible shareholders' equity to assets (%) 4% 2% 9% 11% % Change $0.96 $0.87 Earnings per share 3.44 3.31 Net interest margin (%) 17.52 17.25 Return on equity (%) 1.24 1.14 Return on assets (%) 2002 2001 |
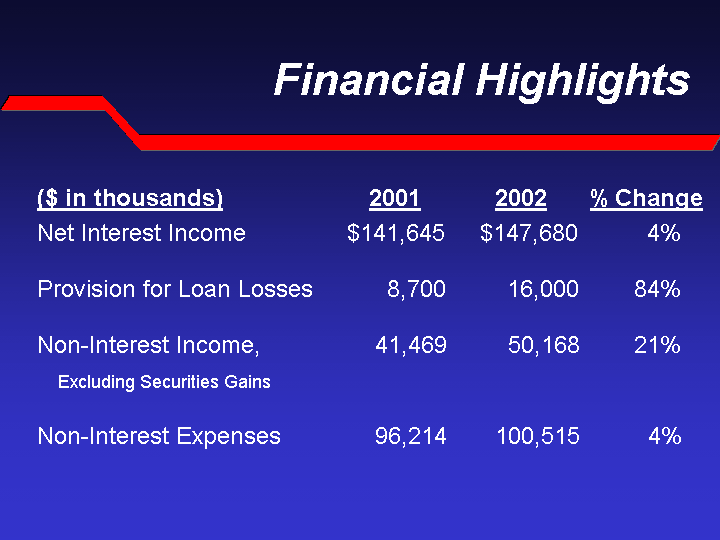
| Financial Highlights ($ in thousands) 2001 2002 % Change Net Interest Income $141,645 $147,680 4% Provision for Loan Losses 8,700 16,000 84% Non-Interest Income, 41,469 50,168 21% Excluding Securities Gains Non-Interest Expenses 96,214 100,515 4% |
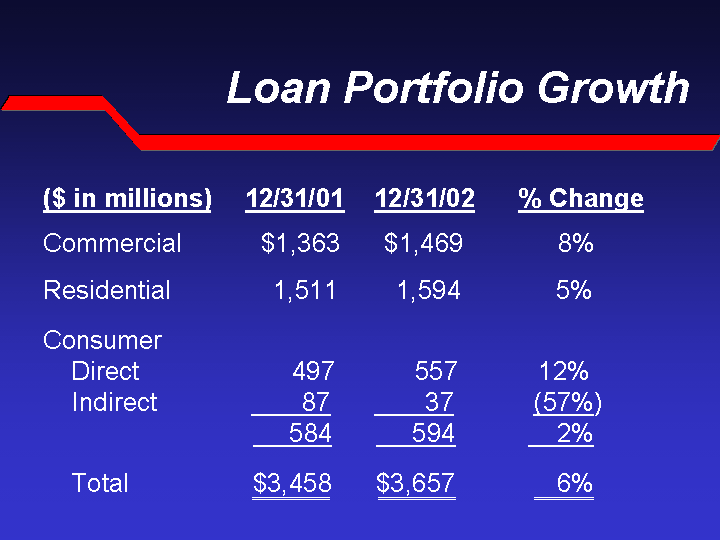
| Loan Portfolio Growth ($ in millions) 12/31/01 12/31/02 % Change Commercial $1,363 $1,469 8% Residential 1,511 1,594 5% Consumer Direct 497 557 12% Indirect 87 37 (57%) 584 594 2% Total $3,458 $3,657 6% |
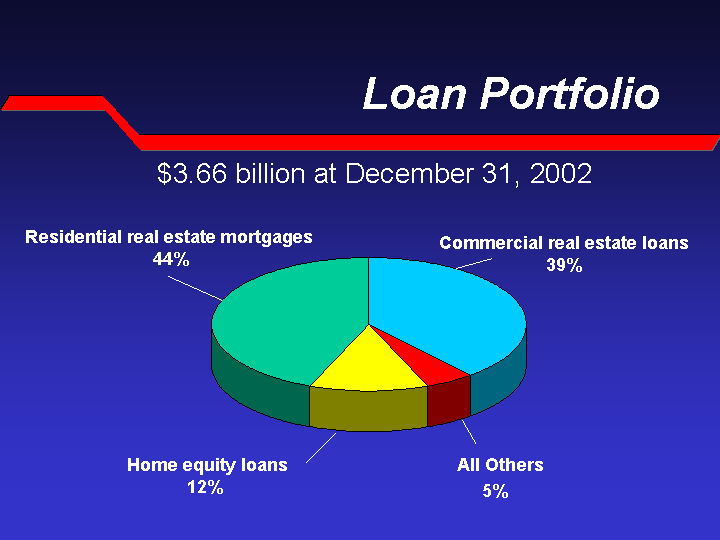
| Loan Portfolio Commercial All Others Home Equity Residential East 0.39 0.05 0.12 0.44 Residential real estate mortgages 44% Commercial real estate loans 39% $3.66 billion at December 31, 2002 Home equity loans 12% All Others 5% |
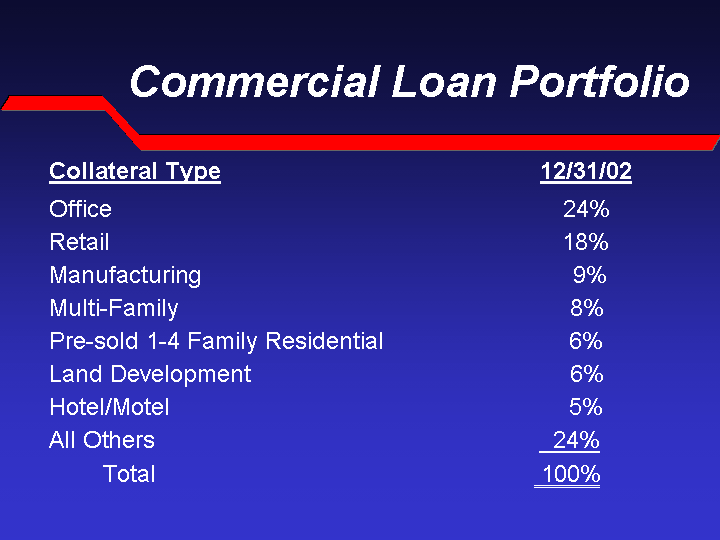
| Commercial Loan Portfolio Collateral Type 12/31/02 Office 24% Retail 18% Manufacturing 9% Multi-Family 8% Pre-sold 1-4 Family Residential 6% Land Development 6% Hotel/Motel 5% All Others 24% Total 100% |
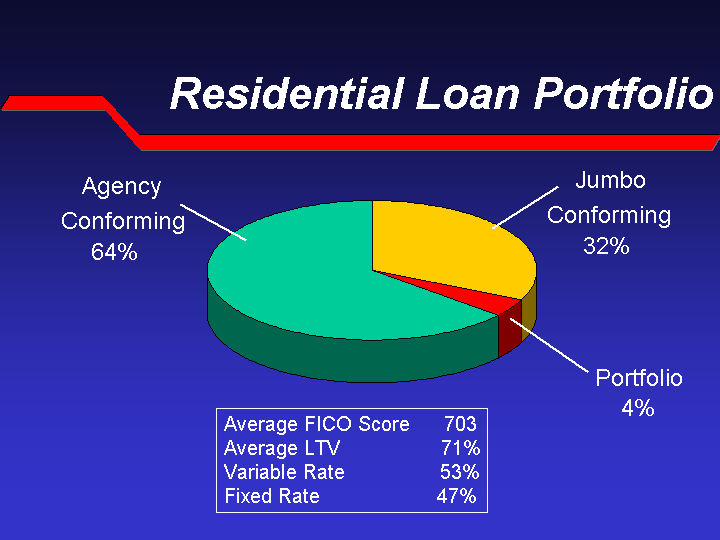
| Residential Loan Portfolio Jumbo Portfolio Agency Conforming East 0.32 0.04 0.64 Average FICO Score 703 Average LTV 71% Variable Rate 53% Fixed Rate 47% Agency Conforming Jumbo Conforming Portfolio 64% 4% 32% |

| Consumer Loan Portfolio Other Home Equity East 0.29 0.71 Home Equity Portfolio Average FICO Score 732 Average CLTV 75% Variable Rate 58% Fixed Rate 42% Other Home Equity Loans 29% 71% |
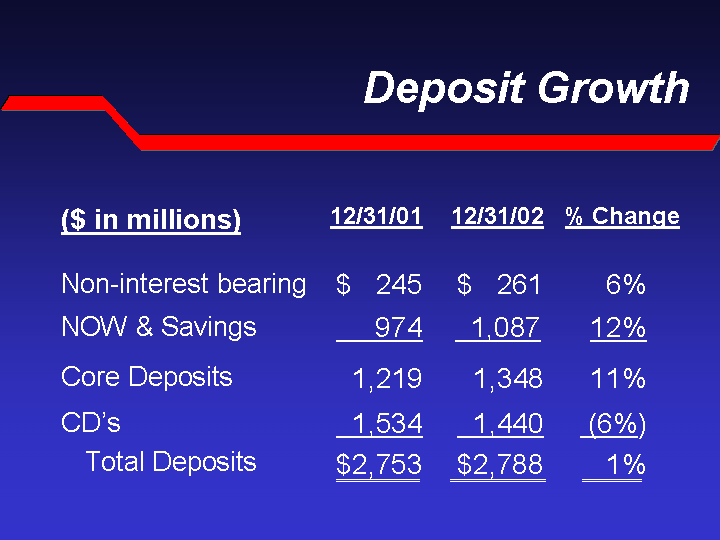
| Deposit Growth ($ in millions) 12/31/01 12/31/02 Non-interest bearing $ 245 $ 261 6% NOW & Savings 974 1,087 12% Core Deposits 1,219 1,348 11% CD's Total Deposits 1,534 $2,753 1,440 $2,788 (6%) 1% % Change |
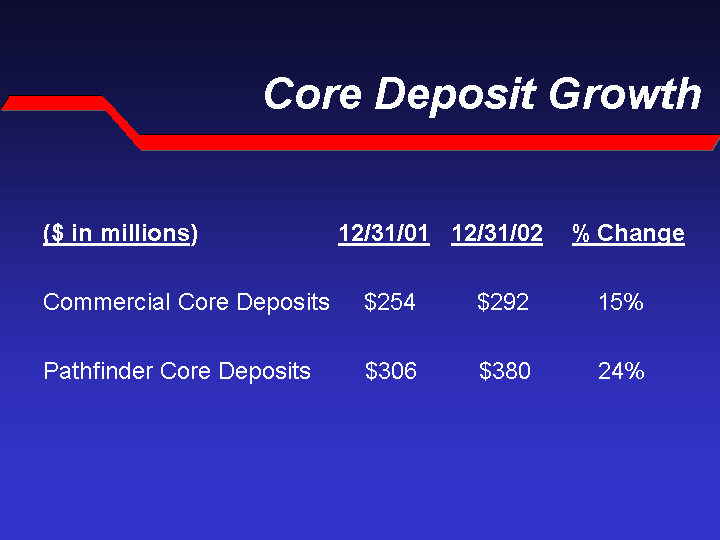
| Core Deposit Growth ($ in millions) 12/31/01 12/31/02 % Change Commercial Core Deposits $254 $292 15% Pathfinder Core Deposits $306 $380 24% |
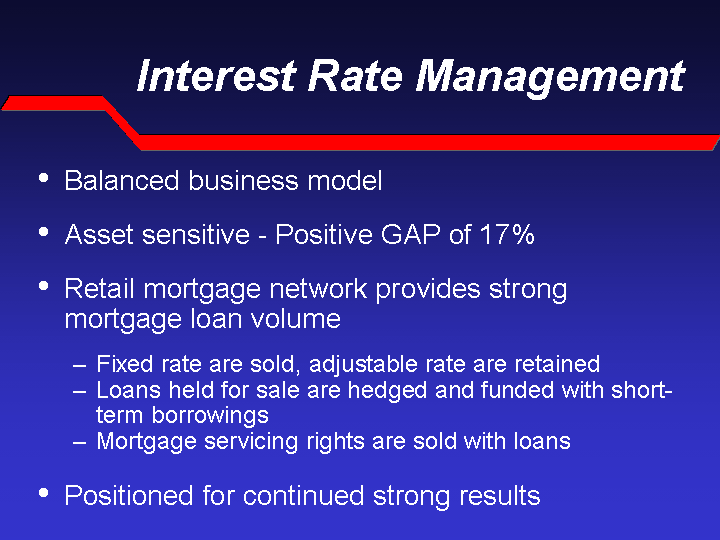
| Interest Rate Management Balanced business model Asset sensitive - Positive GAP of 17% Retail mortgage network provides strong mortgage loan volume Fixed rate are sold, adjustable rate are retained Loans held for sale are hedged and funded with short- term borrowings Mortgage servicing rights are sold with loans Positioned for continued strong results |

| Trading Volume and Market Coverage Average monthly volume of 3.3 million shares 43 Market Makers - Including research coverage from: Fahnestock & Co. Inc. - Buy Stifel, Nicolaus & Company - Buy Robert W. Baird - Outperform Howe Barnes - Outperform A.G. Edwards - Market Perform RBC Capital - Market Perform Keefe, Bruyette & Woods - Market Perform Cohen Brothers & Company - Market Perform Active stock buyback program |
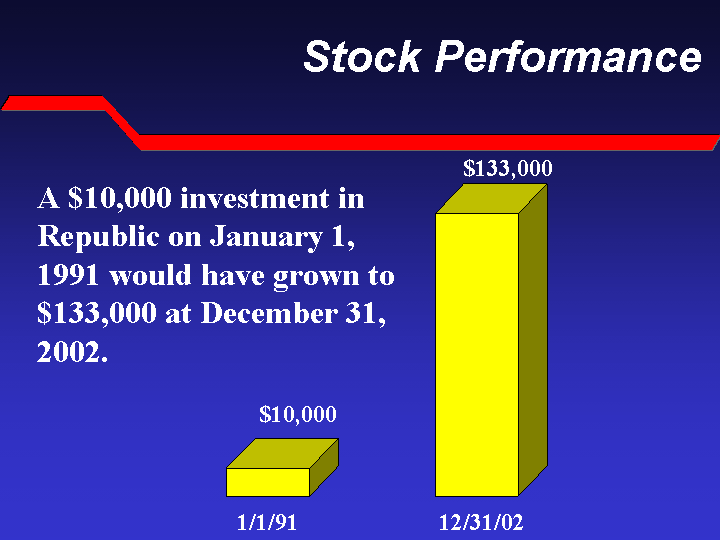
| Stock Performance 1/1/91 12/31/00 East 10000 133000 1/1/91 12/31/02 A $10,000 investment in Republic on January 1, 1991 would have grown to $133,000 at December 31, 2002. $10,000 $133,000 |
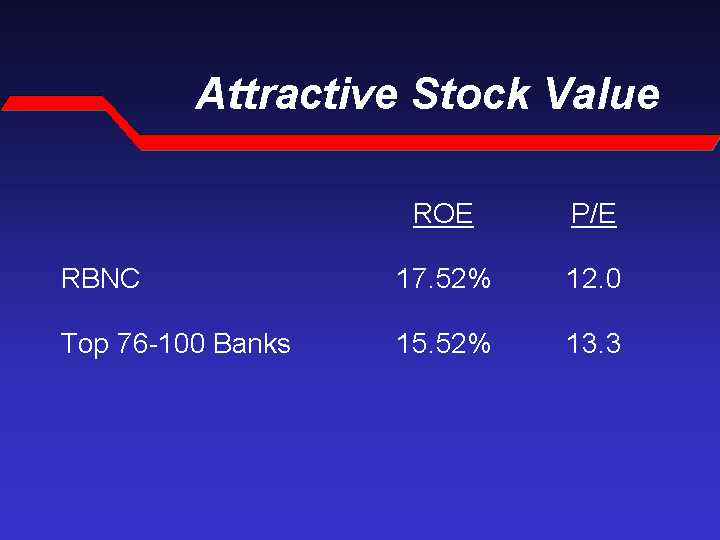
| Attractive Stock Value ROE P/E RBNC 17.52% 12.0 Top 76-100 Banks 15.52% 13.3 |
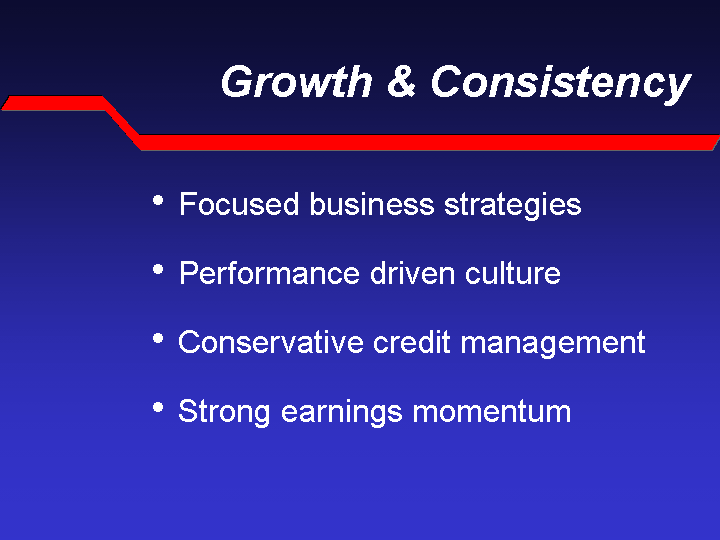
| Growth & Consistency Focused business strategies Performance driven culture Conservative credit management Strong earnings momentum |
SIGNATURES
Pursuant to the requirements of the Securities Exchange Act of 1934, the registrant has duly caused this report to be signed on its behalf by the undersigned hereunto duly authorized.
| | | | | | | |
| | | REPUBLIC BANCORP INC. |
| | | | | | | |
| | | | | | | |
| Date: February 26, 2003 | | By: | | /s/ Thomas F. Menacher |
| | | | |
|
| | | | | Name: | | Thomas F. Menacher |
| | | | | Its: | | Executive Vice President, Treasurer and Chief Financial Officer |