
Exhibit 99 EARNINGS PRESS RELEASE | February 26, 2025 PARAMOUNT REPORTS Q4 AND FULL YEAR 2024 EARNINGS RESULTS Strong Content Slate Drove Solid Top Line Results ▪ Total Company Revenue Grew 5% for Q4 Continued Momentum in Streaming ▪ Paramount+ Increased Revenue by 16% for Q4 and 33% for FY – [PLUTO: Reached ▪ Subscribers Grew by 5.6 Million in Q4 and 10 Million for FY, Reaching 77.5 Million Nearly 0M Monthly ▪ DTC Adjusted OIBDA Improved by $204 Million for Q4 and by Nearly $1.2 Billion in 2024 Active Users (MAUs) Globally] Strengthened Balance Sheet in 2024 – Affiliate & ▪ Generated FY Net Operating Cash Flow of $752 Million and Free Cash Flow of $489 Million, Up Subscription Revenue Significantly from Prior Year Grew (1)%, Including Growth in DTC ▪ Achieved Targeted Annual Run-Rate Cost Savings of $500 Million Subscription Revenue In addition, Skydance transactions are expected to close in the first half of 2025 – Theatrical Revenue Increased n/m – Advertising Revenue Declined 1%, STATEMENT FROM GEORGE CHEEKS, CHRIS MCCARTHY & BRIAN ROBBINS, CO-CEOS Reflecting Macroeconomic We are proud of the transformative year we delivered since becoming Co-CEOs, which marks a Headwinds] significant turning point for Paramount as we shift into a streaming-first company. DTC profitability improved $1.2 billion in 2024, driven by an impressive year at Paramount+, where we added 10 million new subscribers and delivered a 33% increase in revenue, which gives us – subscription revenue great confidence Paramount+ will achieve full year domestic profitability for 2025. In Q4, grew 7% year-over- Paramount+ saw the highest level of engagement yet and achieved a new record, ranking as year the #2 domestic SVOD service for hours watched across all Original Series. These remarkable – Filmed Entertainment achievements would not have been possible without the hard work of our talented teams and revenue grew 67% creative partners for whom we are deeply appreciative. year-over-year – Theatrical Revenue grew n/m year-over- year led by the box $ IN MILLIONS, EXCEPT PER SHARE AMOUNTS Three Months Ended December 31 Twelve Months Ended December 31 office success of Smile GAAP 2024 2023 B/(W)% 2024 2023 B/(W)% Revenue $ 7,984 $ 7,638 5 % $ 29,213 $ 29,652 (1)% [Paramount continues to demonstrate the success of its global multiplatform strategy, with ▪ TV Media 4,979 5,168 (4) % 18,779 20,085 (7)% popular content at its core. Nowhere was this more evident than in the growth of Paramount+, ▪ Direct-to-Consumer 2,013 1,869 8 % 7,632 6,736 13 % which added a record 9.9M subscribers in the fourth quarter, driven by hit content like Top Gun: ▪ Filmed Entertainment 1,081 647 67 % 2,955 2,957 — % Maverick, 1923 and Criminal Minds: Evolution. In 2022, Paramount Pictures had the second ▪ Eliminations (89) (46) ( 93) % (153) (126) ( 21) % highest hit rate in the industry with 6 of its 8 films opening at #1 in the U.S. box office, CBS (a) Operating income (loss) $ 129 $ 404 (68)% $ (5,269) $ (451) n/m (a) continued its 14-year streak as the #1 broadcast network, and Paramount regained its position as Diluted EPS from continuing operations attributable to Paramount $ (.33) $ (.02) n/m $ (9.36) $ (2.06) n/m the most-watched media family in linear television. Our content and platform strategy is working (b) Non-GAAP and, with even more exceptional content coming this year, we expect to return the company to Adjusted OIBDA $ 406 $ 520 ( 22)% $ 3,118 $ 2,390 30 % earnings growth in 2024.] Adjusted diluted EPS from continuing operations attributable to Paramount $ (.11) $ .04 n/m $ 1.54 $ .52 196 % (a) During the second quarter of 2024, we recorded a goodwill impairment charge for our Cable Networks reporting unit of $5.98 billion. (b) Non-GAAP measures are detailed in the Supplemental Disclosures at the end of this release. *Simon & Schuster, which was sold in October 2023, has been presented as a discontinued operation in the companyʼs consolidated financial statements. B/(W) – Better/(Worse); n/m - not meaningful
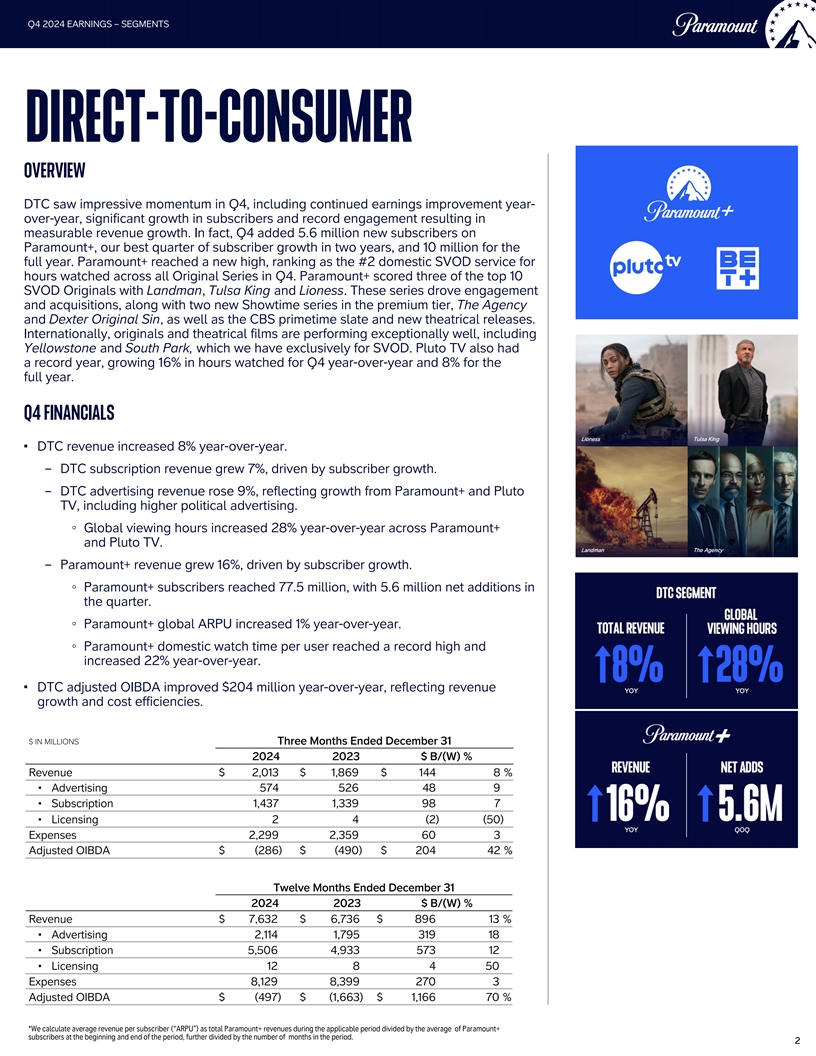
– Subscription revenue grew 7% year-over-year to $1,437 million, principally reflecting paid subscriber growth on Paramount+. Q4 2024 EARNINGS – SEGMENTS DIRECT-TO-CONSUMER OVERVIEW DTC saw impressive momentum in Q4, including continued earnings improvement year- over-year, significant growth in subscribers and record engagement resulting in measurable revenue growth. In fact, Q4 added 5.6 million new subscribers on Paramount+, our best quarter of subscriber growth in two years, and 10 million for the full year. Paramount+ reached a new high, ranking as the #2 domestic SVOD service for hours watched across all Original Series in Q4. Paramount+ scored three of the top 10 SVOD Originals with Landman, Tulsa King and Lioness. These series drove engagement and acquisitions, along with two new Showtime series in the premium tier, The Agency and Dexter Original Sin, as well as the CBS primetime slate and new theatrical releases. Internationally, originals and theatrical films are performing exceptionally well, including Yellowstone and South Park, which we have exclusively for SVOD. Pluto TV also had a record year, growing 16% in hours watched for Q4 year-over-year and 8% for the full year. Q4 FINANCIALS ▪ DTC revenue increased 8% year-over-year. – DTC subscription revenue grew 7%, driven by subscriber growth. Lawmen: Bass Reeves Frasier – DTC advertising revenue rose 9%, reflecting growth from Paramount+ and Pluto TV, including higher political advertising. ◦ Global viewing hours increased 28% year-over-year across Paramount+ and Pluto TV. – Paramount+ revenue grew 16%, driven by subscriber growth. ◦ Paramount+ subscribers reached 77.5 million, with 5.6 million net additions in NCIS Good Burger 2 the quarter. ◦ Paramount+ global ARPU increased 1% year-over-year. ◦ Paramount+ domestic watch time per user reached a record high and increased 22% year-over-year. ▪ DTC adjusted OIBDA improved $204 million year-over-year, reflecting revenue growth and cost efficiencies. $ IN MILLIONS Three Months Ended December 31 2024 2023 $ B/(W) % Revenue $ 2,013 $ 1,869 $ 144 8 % ▪ Advertising 574 526 48 9 ▪ Subscription 1,437 1,339 98 7 ▪ Licensing 2 4 (2) (50) Expenses 2,299 2,359 60 3 Adjusted OIBDA $ (286) $ (490) $ 204 42 % Twelve Months Ended December 31 2024 2023 $ B/(W) % Revenue $ 7,632 $ 6,736 $ 896 13 % ▪ Advertising 2,114 1,795 319 18 ▪ Subscription 5,506 4,933 573 12 ▪ Licensing 12 8 4 5 0 Expenses 8,129 8,399 270 3 Adjusted OIBDA $ (497) $ (1,663) $ 1,166 70 % *We calculate average revenue per subscriber (“ARPU”) as total Paramount+ revenues during the applicable period divided by the average of Paramount+ subscribers at the beginning and end of the period, further divided by the number of months in the period. 2 2 n/m - not meaningful
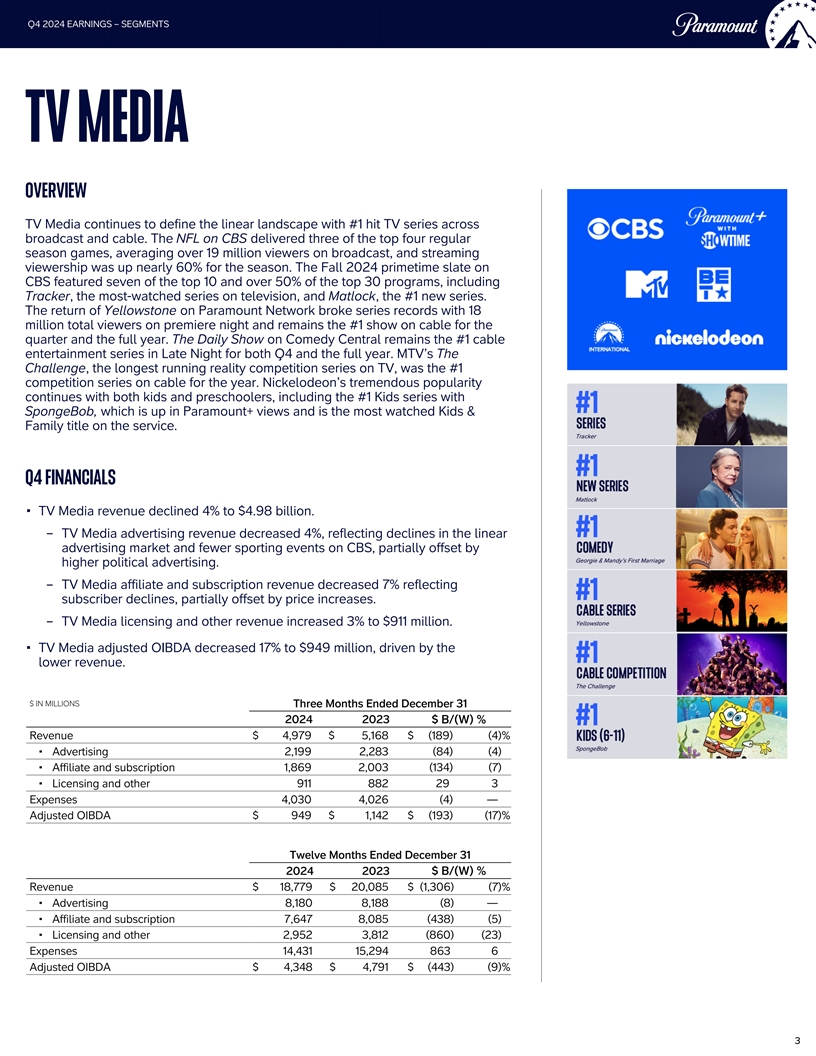
Q4 2024 EARNINGS – SEGMENTS TV MEDIA OVERVIEW TV Media continues to define the linear landscape with #1 hit TV series across broadcast and cable. The NFL on CBS delivered three of the top four regular season games, averaging over 19 million viewers on broadcast, and streaming viewership was up nearly 60% for the season. The Fall 2024 primetime slate on CBS featured seven of the top 10 and over 50% of the top 30 programs, including Tracker, the most-watched series on television, and Matlock, the #1 new series. The return of Yellowstone on Paramount Network broke series records with 18 million total viewers on premiere night and remains the #1 show on cable for the quarter and the full year. The Daily Show on Comedy Central remains the #1 cable entertainment series in Late Night for both Q4 and the full year. MTV’s The Challenge, the longest running reality competition series on TV, was the #1 competition series on cable for the year. Nickelodeon’s tremendous popularity continues with both kids and preschoolers, including the #1 Kids series with SpongeBob, which is up in Paramount+ views and is the most watched Kids & Family title on the service. Q4 FINANCIALS 1883 ▪ TV Media revenue declined 4% to $4.98 billion. – TV Media advertising revenue decreased 4%, reflecting declines in the linear advertising market and fewer sporting events on CBS, partially offset by higher political advertising. – TV Media affiliate and subscription revenue decreased 7% reflecting SpongeBob SquarePants The Challenge: USA subscriber declines, partially offset by price increases. – TV Media licensing and other revenue increased 3% to $911 million. Source: Nielsen Media Research ▪ TV Media adjusted OIBDA decreased 17% to $949 million, driven by the lower revenue. $ IN MILLIONS Three Months Ended December 31 2024 2023 $ B/(W) % Revenue $ 4,979 $ 5,168 $ (189) (4) % Three Months Ended September 30 $ IN MILLIONS ▪ Advertising 2,199 2,283 (84) ( 4) 2022 2021 $ B/(W) % ▪ Affiliate and subscription 1,869 2,003 (134) ( 7) Revenue $ 4,948 $ 5,220 $ (272) (5)% ▪ Licensing and other 911 882 29 3 ▪ Advertising 1,973 2,039 (66) (3) Expenses 4,030 4,026 (4) — ▪ Affiliate and subscription 2,000 2,108 (108) (5) Adjusted OIBDA $ 949 $ 1,142 $ (193) (17) % ▪ Licensing and other 975 1,073 (98) (9) Expenses 3,717 3,835 118 3 Twelve Months Ended December 31 Adjusted OIBDA $ 1,231 $ 1,385 $ (154) ( 11)% 2024 2023 $ B/(W) % Revenue $ 18,779 $ 20,085 $ (1,306) (7) % Nine Months Ended September 30 $ IN MILLIONS ▪ Advertising 8,180 8,188 (8) — 2022 2021 $ B/(W) % ▪ Affiliate and subscription 7,647 8,085 (438) ( 5) Revenue $ 15,849 $ 16,432 $ (583) (4) % ▪ Licensing and other 2,952 3,812 (860) ( 23) ▪ Advertising 6,668 7,230 (562) (8) Expenses 14,431 15,294 863 6 ▪ Affiliate and subscription 6,156 6,303 (147) (2) Adjusted OIBDA $ 4,348 $ 4,791 $ (443) ( 9)% ▪ Licensing and other 3,025 2,899 126 4 Expenses 11,694 11,778 84 1 Adjusted OIBDA $ 4,155 $ 4,654 $ (499) ( 11) % 3 3 Source: Nielsen Media Research

Q4 2024 EARNINGS – SEGMENTS FILMED ENTERTAINMENT OVERVIEW Paramount Pictures’ franchise-driven strategy delivered significant revenue growth in Q4, supported by Sonic the Hedgehog 3, which is approaching nearly $500 million at the global box office, making it the highest-grossing film in the franchise, and is expected to be one of the 10 most profitable Paramount Pictures releases of the last decade. Across its three installments, the Sonic the Hedgehog series has reached $1.2 billion at the global box office. Ridley Scott’s Gladiator II crossed $460 million globally and Smile 2 debuted at #1 at the global box office, outearning its predecessor’s opening weekend and demonstrating strength and balance of the studio’s theatrical offerings. Q4 FINANCIALS ▪ Filmed Entertainment revenue increased 67% to $1.08 billion. – Theatrical revenues increased $336 million, driven by the releases of Gladiator II and Sonic the Hedgehog 3. – Licensing and other revenues increased 17%, reflecting a higher volume of licensing of library titles and higher studio facility revenue compared with 2023, which was impacted by the labor strikes. ▪ Filmed Entertainment adjusted OIBDA decreased $66 million, as a result of Three Months Ended September 30 marketing costs associated with the theatrical releases of five films in the quarter $ IN MILLIONS compared to one film in the year ago period. 2022 2021 $ B/(W) % Revenue $ 783 $ 530 $ 253 48 % ▪ Advertising 3 2 1 50 ▪ Theatrical 231 67 164 2 45 ▪ Licensing and other 549 461 88 19 $ IN MILLIONS Three Months Ended December 31 Expenses 742 554 (188) (34) 2024 2023 $ B/(W) % Adjusted OIBDA $ 41 $ (24) $ 65 n/m Revenue $ 1,081 $ 647 $ 434 67 % ▪ Advertising 6 3 3 100 Nine Months Ended September 30 ▪ Theatrical 414 78 336 n/m $ IN MILLIONS ▪ Licensing and other 661 566 95 1 7 2022 2021 $ B/(W) % Expenses 1,123 623 (500) (80) Revenue $ 2,770 $ 1,993 $ 777 39 % Adjusted OIBDA $ (42) $ 24 $ (66) n/m ▪ Advertising 17 14 3 2 1 ▪ Theatrical 1,126 202 924 457 Twelve Months Ended December 31 ▪ Licensing and other 1,627 1,777 (150) ( 8) 2024 2023 $ B/(W) % Expenses 2,585 1,786 (799) ( 45) Revenue $ 2,955 $ 2,957 $ (2) — % Adjusted OIBDA $ 185 $ 207 $ (22) ( 11)% ▪ Advertising 16 24 (8) ( 33) ▪ Theatrical 813 813 — — ▪ Licensing and other 2,126 2,120 6 — Expenses 3,051 3,076 25 1 Adjusted OIBDA $ (96) $ (119) $ 23 1 9 % n/m - not meaningful BALANCE SHEET & LIQUIDITY ▪ As of December 31, 2024, the company had $2.5B of cash on its balance sheet and a committed $3.5B $2.5B $3.5B revolving credit facility that remains undrawn. 4 4

Q4 2024 EARNINGS – SKYDANCE TRANSACTIONS SKYDANCE TRANSACTIONS Completion of the Skydance transactions is subject to regulatory approvals and customary closing conditions. The transactions are expected to close in the first half of 2025. Until then, Paramount continues to operate in the normal course of business. Three Months Ended September 30 $ IN MILLIONS 2022 2021 $ B/(W) % Revenue $ 783 $ 530 $ 253 4 8 % ▪ Advertising 3 2 1 5 0 ▪ Theatrical 231 67 164 2 45 ▪ Licensing and other 549 461 88 1 9 Expenses 742 554 (188) (34) Adjusted OIBDA $ 41 $ (24) $ 65 n/m Nine Months Ended September 30 $ IN MILLIONS 2022 2021 $ B/(W) % Revenue $ 2,770 $ 1,993 $ 777 3 9 % ▪ Advertising 17 14 3 2 1 ▪ Theatrical 1,126 202 924 457 ▪ Licensing and other 1,627 1,777 (150) (8) Expenses 2,585 1,786 (799) ( 45) Adjusted OIBDA $ 185 $ 207 $ (22) ( 11) % BALANCE SHEET & LIQUIDITY ▪ As of December 31, 2024, the company had $2.5B of cash on its balance sheet and a committed $3.5B $2.5B $3.5B revolving credit facility that remains undrawn. 5 5
ABOUT PARAMOUNT Paramount (NASDAQ: PARA; PARAA) is a leading global media, streaming and entertainment company that creates premium content and experiences for audiences worldwide. Driven by iconic consumer brands, its portfolio includes CBS, Paramount Pictures, Nickelodeon, MTV, Comedy Central, BET, Paramount+ and Pluto TV. The company holds one of the industry’s most extensive libraries of TV and film titles. In addition to offering innovative streaming services and digital video products, Paramount provides powerful capabilities in production, distribution and advertising solutions. For more information about Paramount, please visit www.paramount.com and follow @ParamountCo on social platforms. PARA-IR CAUTIONARY NOTE CONCERNING FORWARD-LOOKING STATEMENTS This communication contains both historical and forward-looking statements, including statements related to our future results, performance and achievements. All statements that are not statements of historical fact are, or may be deemed to be, forward-looking statements within the meaning of the Private Securities Litigation Reform Act of 1995. Similarly, statements that describe our objectives, plans or goals are or may be forward-looking statements. These forward-looking statements reflect our current expectations concerning future results and events; generally can be identified by the use of statements that include phrases such as “believe,” “expect,” “anticipate,” “intend,” “plan,” “foresee,” “likely,” “will,” “may,” “could,” “estimate” or other similar words or phrases; and involve known and unknown risks, uncertainties and other factors that are difficult to predict and which may cause our actual results, performance or achievements to be different from any future results, performance or achievements expressed or implied by these statements. These risks, uncertainties and other factors include, among others: risks related to our streaming business; the adverse impact on our advertising revenues as a result of changes in consumer behavior, advertising market conditions and deficiencies in audience measurement; risks related to operating in highly competitive and dynamic industries, including cost increases; the unpredictable nature of consumer behavior, as well as evolving technologies and distribution models; risks related to our decisions to make investments in new businesses, products, services and technologies, and the evolution of our business strategy; the potential for loss of carriage or other reduction in or the impact of negotiations for the distribution of our content; damage to our reputation or brands; losses due to asset impairment charges for goodwill, intangible assets, FCC licenses and content; liabilities related to discontinued operations and former businesses; increasing scrutiny of, and evolving expectations for, sustainability initiatives; evolving business continuity, cybersecurity, privacy and data protection and similar risks; content infringement; domestic and global political, economic and regulatory factors affecting our businesses generally; the inability to hire or retain key employees or secure creative talent; disruptions to our operations as a result of labor disputes; challenges realizing synergies and other anticipated benefits expected from the Transactions, including integrating the Companyʼs and Skydanceʼs businesses successfully; the dilution to the earnings per share of New Paramount which may negatively affect the price of New Paramount Class B Common Stock; any negative effects following the completion of the Transactions on the market price of New Paramount Class B Common Stock; the uncertainty of the Companyʼs stockholders with respect to the value of the stock consideration they will receive; the risks that holders of our Class B Common Stock may not receive all merger consideration in the form they elect; the reduced ownership and economic interest of our existing stockholders in New Paramount; the cutbacks the PIPE Transaction is subject to in the event that stock elections exceed specified thresholds; the risks that the Transactions may be prevented or delayed or the anticipated benefits of the Transactions could be reduced if we do not obtain certain regulatory approvals; the conditions to the Closing to which the Transactions are subject; our and New Paramountʼs continued incurrence of significant transaction and merger-related transaction costs in connection with the Transactions; business uncertainties, including the effect of the Transactions on the Companyʼs employees, commercial partners, clients and customers, and contractual restrictions while the Transactions are pending; the Transaction Agreementʼs limitation on our ability to pursue alternatives to the Transactions; tax consequences of the Transactions that may adversely affect holders of our Common Stock; the imposition of a new U.S. federal excise tax on us or on New Paramount in connection with redemptions by us or New Paramount of our respective shares; interests of our executive officers, directors and affiliates of Paramount that are different from, or in addition to, the rights of our stockholders; risks related to a failure to complete the Transactions which could negatively impact our businesses or financial results and the stock price of our Common Stock; lawsuits relating to the Transactions potentially preventing or delaying the closing of the Transactions and/or resulting in substantial costs; the waiver of one or more of the conditions to Closing without re-obtaining stockholder approval; difficulties retaining, motivating and recruiting executives and other key employees before and following the completion of the Transactions in light of uncertainty regarding the Transactions; the Transactions triggering change of control or other provisions in certain agreements which may allow third parties to terminate or alter existing contracts or relationships; our stockholders not being entitled to appraisal rights in connection with the Transactions; changes and uncertainties with respect to taxes in the jurisdictions in which New Paramount will operate which may have an adverse effect on New Paramountʼs business; volatility in the prices of our Common Stock; potential conflicts of interest arising from our ownership structure with a controlling stockholder; and other factors described in our news releases and filings with the Securities and Exchange Commission, including but not limited to our most recent Annual Report on Form 10-K and reports on Form 10-Q and Form 8-K. There may be additional risks, uncertainties and factors that we do not currently view as material or that are not necessarily known. The forward-looking statements included in this communication are made only as of the date of this report, and we do not undertake any obligation to publicly update any forward-looking statements to reflect subsequent events or circumstances. 6 6

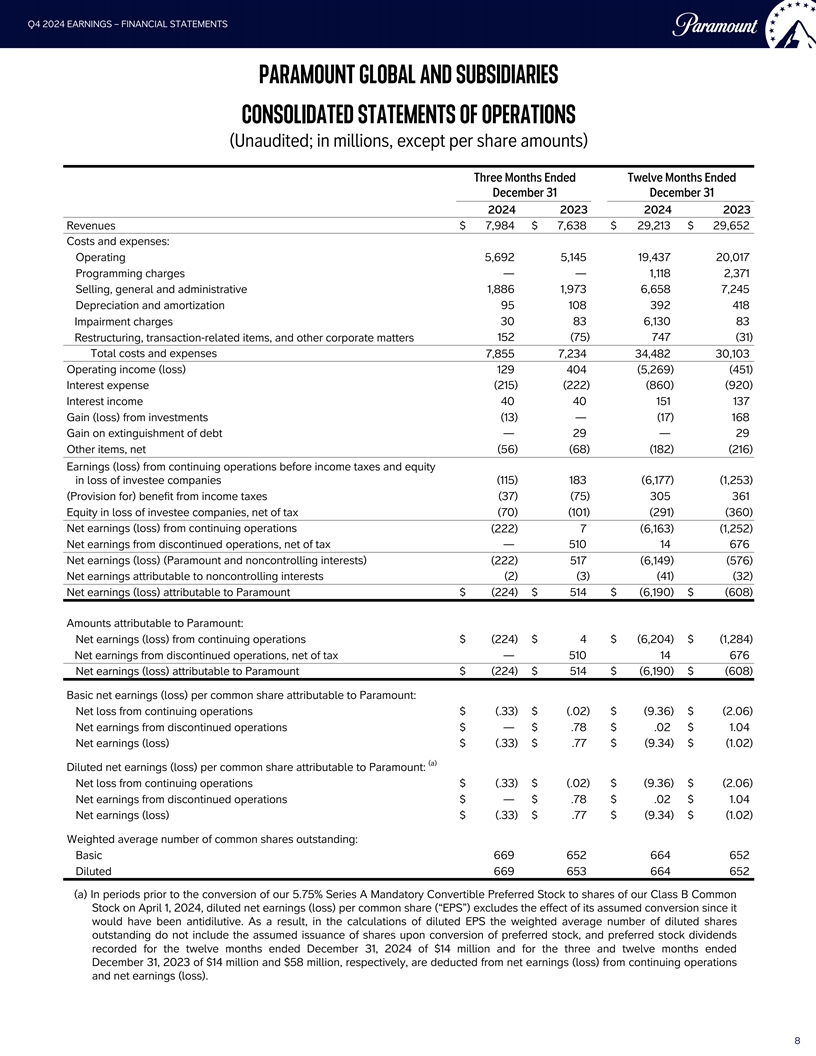
Q4 2024 EARNINGS – FINANCIAL STATEMENTS PARAMOUNT GLOBAL AND SUBSIDIARIES CONSOLIDATED STATEMENTS OF OPERATIONS (Unaudited; in millions, except per share amounts) Three Months Ended Twelve Months Ended December 31 December 31 2024 2023 2024 2023 Revenues $ 7,984 $ 7,638 $ 29,213 $ 29,652 Costs and expenses: Operating 5,692 5,145 19,437 20,017 Programming charges — — 1,118 2,371 Selling, general and administrative 1,886 1,973 6,658 7,245 Depreciation and amortization 95 108 392 418 Impairment charges 30 83 6,130 83 Restructuring, transaction-related items, and other corporate matters 152 (75) 747 (31) Total costs and expenses 7,855 7,234 34,482 30,103 Operating income (loss) 129 404 (5,269) (451) Interest expense (215) (222) (860) (920) Interest income 40 40 151 137 Gain (loss) from investments (13) — (17) 168 Gain on extinguishment of debt — 29 — 29 Other items, net (56) (68) (182) (216) Earnings (loss) from continuing operations before income taxes and equity in loss of investee companies (115) 183 (6,177) (1,253) (Provision for) benefit from income taxes (37) (75) 305 361 Equity in loss of investee companies, net of tax (70) (101) (291) (360) Net earnings (loss) from continuing operations (222) 7 (6,163) (1,252) Net earnings from discontinued operations, net of tax — 510 14 676 Net earnings (loss) (Paramount and noncontrolling interests) (222) 517 (6,149) (576) Net earnings attributable to noncontrolling interests (2) (3) (41) (32) Net earnings (loss) attributable to Paramount $ (224) $ 514 $ (6,190) $ (608) Amounts attributable to Paramount: Net earnings (loss) from continuing operations $ (224) $ 4 $ (6,204) $ (1,284) Net earnings from discontinued operations, net of tax — 510 14 676 Net earnings (loss) attributable to Paramount $ (224) $ 514 $ (6,190) $ (608) Basic net earnings (loss) per common share attributable to Paramount: Net loss from continuing operations $ (.33) $ (.02) $ (9.36) $ (2.06) Net earnings from discontinued operations $ — $ .78 $ .02 $ 1.04 Net earnings (loss) $ (.33) $ .77 $ (9.34) $ (1.02) (a) Diluted net earnings (loss) per common share attributable to Paramount: Net loss from continuing operations $ (.33) $ (.02) $ (9.36) $ (2.06) Net earnings from discontinued operations $ — $ .78 $ .02 $ 1.04 Net earnings (loss) $ (.33) $ .77 $ (9.34) $ (1.02) Weighted average number of common shares outstanding: Basic 669 652 664 652 Diluted 669 653 664 652 (a) In periods prior to the conversion of our 5.75% Series A Mandatory Convertible Preferred Stock to shares of our Class B Common Stock on April 1, 2024, diluted net earnings (loss) per common share (“EPS”) excludes the effect of its assumed conversion since it would have been antidilutive. As a result, in the calculations of diluted EPS the weighted average number of diluted shares outstanding do not include the assumed issuance of shares upon conversion of preferred stock, and preferred stock dividends recorded for the twelve months ended December 31, 2024 of $14 million and for the three and twelve months ended December 31, 2023 of $14 million and $58 million, respectively, are deducted from net earnings (loss) from continuing operations and net earnings (loss). 8
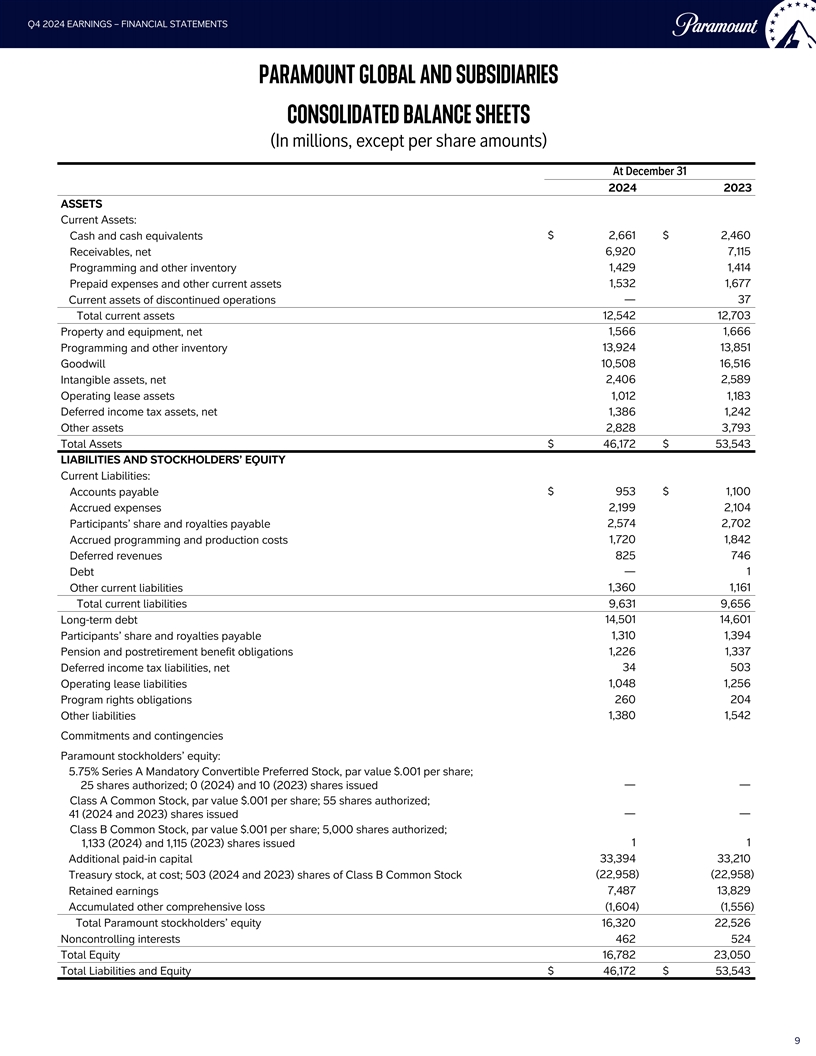
Q4 2024 EARNINGS – FINANCIAL STATEMENTS PARAMOUNT GLOBAL AND SUBSIDIARIES CONSOLIDATED BALANCE SHEETS (In millions, except per share amounts) At December 31 2024 2023 ASSETS Current Assets: Cash and cash equivalents $ 2,661 $ 2,460 Receivables, net 6,920 7,115 Programming and other inventory 1,429 1,414 Prepaid expenses and other current assets 1,532 1,677 Current assets of discontinued operations — 37 Total current assets 12,542 12,703 Property and equipment, net 1,566 1,666 Programming and other inventory 13,924 13,851 Goodwill 10,508 16,516 Intangible assets, net 2,406 2,589 Operating lease assets 1,012 1,183 Deferred income tax assets, net 1,386 1,242 Other assets 2,828 3,793 Total Assets $ 46,172 $ 53,543 LIABILITIES AND STOCKHOLDERS’ EQUITY Current Liabilities: Accounts payable $ 953 $ 1,100 Accrued expenses 2,199 2,104 Participants’ share and royalties payable 2,574 2,702 Accrued programming and production costs 1,720 1,842 Deferred revenues 825 746 Debt — 1 Other current liabilities 1,360 1,161 Total current liabilities 9,631 9,656 Long-term debt 14,501 14,601 Participants’ share and royalties payable 1,310 1,394 Pension and postretirement benefit obligations 1,226 1,337 Deferred income tax liabilities, net 34 503 Operating lease liabilities 1,048 1,256 Program rights obligations 260 204 Other liabilities 1,380 1,542 Commitments and contingencies Paramount stockholders’ equity: 5.75% Series A Mandatory Convertible Preferred Stock, par value $.001 per share; — — 25 shares authorized; 0 (2024) and 10 (2023) shares issued Class A Common Stock, par value $.001 per share; 55 shares authorized; — — 41 (2024 and 2023) shares issued Class B Common Stock, par value $.001 per share; 5,000 shares authorized; 1,133 (2024) and 1,115 (2023) shares issued 1 1 Additional paid-in capital 33,394 33,210 Treasury stock, at cost; 503 (2024 and 2023) shares of Class B Common Stock (22,958) (22,958) Retained earnings 7,487 13,829 Accumulated other comprehensive loss (1,604) (1,556) Total Paramount stockholders’ equity 16,320 22,526 Noncontrolling interests 462 524 Total Equity 16,782 23,050 Total Liabilities and Equity $ 46,172 $ 53,543 9
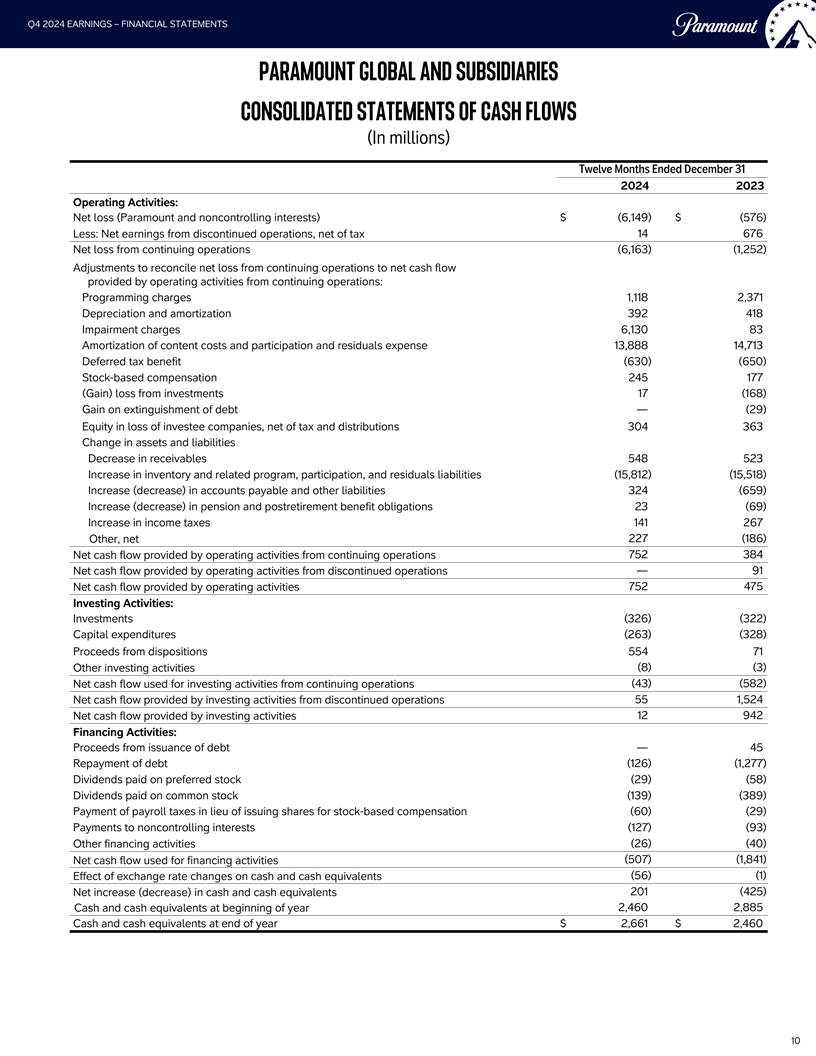
Q4 2024 EARNINGS – FINANCIAL STATEMENTS PARAMOUNT GLOBAL AND SUBSIDIARIES CONSOLIDATED STATEMENTS OF CASH FLOWS (In millions) Twelve Months Ended December 31 2024 2023 Operating Activities: Net loss (Paramount and noncontrolling interests) $ (6,149) $ (576) Less: Net earnings from discontinued operations, net of tax 14 676 Net loss from continuing operations (6,163) (1,252) Adjustments to reconcile net loss from continuing operations to net cash flow provided by operating activities from continuing operations: Programming charges 1,118 2,371 Depreciation and amortization 392 418 Impairment charges 6,130 83 Amortization of content costs and participation and residuals expense 13,888 14,713 Deferred tax benefit (630) (650) Stock-based compensation 245 177 (Gain) loss from investments 17 (168) Gain on extinguishment of debt — (29) Equity in loss of investee companies, net of tax and distributions 304 363 Change in assets and liabilities Decrease in receivables 548 523 Increase in inventory and related program, participation, and residuals liabilities (15,812) (15,518) Increase (decrease) in accounts payable and other liabilities 324 (659) Increase (decrease) in pension and postretirement benefit obligations 23 (69) Increase in income taxes 141 267 Other, net 227 (186) Net cash flow provided by operating activities from continuing operations 752 384 Net cash flow provided by operating activities from discontinued operations — 91 Net cash flow provided by operating activities 752 475 Investing Activities: Investments (326) (322) Capital expenditures (263) (328) Proceeds from dispositions 554 71 Other investing activities (8) (3) Net cash flow used for investing activities from continuing operations (43) (582) Net cash flow provided by investing activities from discontinued operations 55 1,524 Net cash flow provided by investing activities 12 942 Financing Activities: Proceeds from issuance of debt — 45 Repayment of debt (126) (1,277) Dividends paid on preferred stock (29) (58) Dividends paid on common stock (139) (389) Payment of payroll taxes in lieu of issuing shares for stock-based compensation (60) (29) Payments to noncontrolling interests (127) (93) Other financing activities (26) (40) Net cash flow used for financing activities (507) (1,841) Effect of exchange rate changes on cash and cash equivalents (56) (1) Net increase (decrease) in cash and cash equivalents 201 (425) Cash and cash equivalents at beginning of year 2,460 2,885 Cash and cash equivalents at end of year $ 2,661 $ 2,460 10
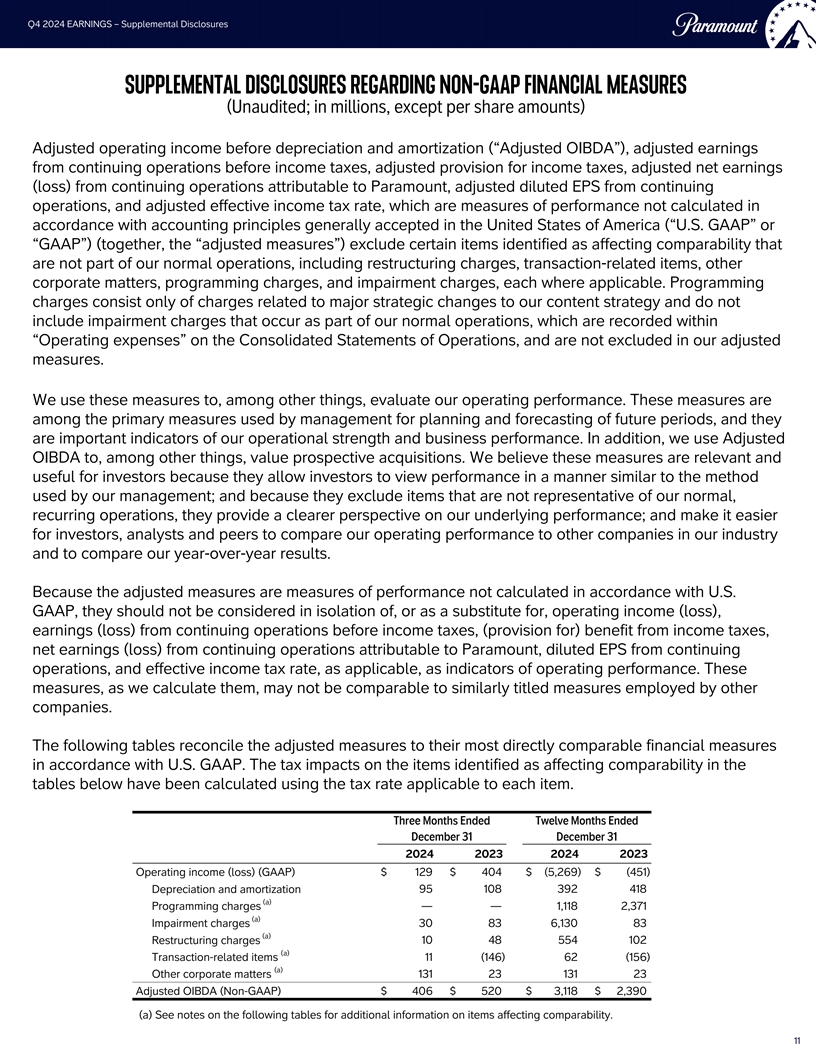
Q4 2024 EARNINGS – Supplemental Disclosures SUPPLEMENTAL DISCLOSURES REGARDING NON-GAAP FINANCIAL MEASURES (Unaudited; in millions, except per share amounts) Adjusted operating income before depreciation and amortization (“Adjusted OIBDA”), adjusted earnings from continuing operations before income taxes, adjusted provision for income taxes, adjusted net earnings (loss) from continuing operations attributable to Paramount, adjusted diluted EPS from continuing operations, and adjusted effective income tax rate, which are measures of performance not calculated in accordance with accounting principles generally accepted in the United States of America (“U.S. GAAP” or “GAAP”) (together, the “adjusted measures”) exclude certain items identified as affecting comparability that are not part of our normal operations, including restructuring charges, transaction-related items, other corporate matters, programming charges, and impairment charges, each where applicable. Programming charges consist only of charges related to major strategic changes to our content strategy and do not include impairment charges that occur as part of our normal operations, which are recorded within “Operating expenses” on the Consolidated Statements of Operations, and are not excluded in our adjusted measures. We use these measures to, among other things, evaluate our operating performance. These measures are among the primary measures used by management for planning and forecasting of future periods, and they FBI are important indicators of our operational strength and business performance. In addition, we use Adjusted OIBDA to, among other things, value prospective acquisitions. We believe these measures are relevant and useful for investors because they allow investors to view performance in a manner similar to the method used by our management; and because they exclude items that are not representative of our normal, recurring operations, they provide a clearer perspective on our underlying performance; and make it easier for investors, analysts and peers to compare our operating performance to other companies in our industry and to compare our year-over-year results. Because the adjusted measures are measures of performance not calculated in accordance with U.S. GAAP, they should not be considered in isolation of, or as a substitute for, operating income (loss), earnings (loss) from continuing operations before income taxes, (provision for) benefit from income taxes, net earnings (loss) from continuing operations attributable to Paramount, diluted EPS from continuing operations, and effective income tax rate, as applicable, as indicators of operating performance. These measures, as we calculate them, may not be comparable to similarly titled measures employed by other companies. Three Months Ended September 30 $ IN MILLIONS The following tables reconcile the adjusted measures to their most directly comparable financial measures 2022 2021 $ B/(W) % in accordance with U.S. GAAP. The tax impacts on the items identified as affecting comparability in the Revenue $ 4,948 $ 5,220 $ (272) ( 5) % tables below have been calculated using the tax rate applicable to each item. ▪ Advertising 1,973 2,039 (66) (3) ▪ Affiliate and subscription 2,000 2,108 (108) (5) Three Months Ended Twelve Months Ended ▪ Licensing and other 975 1,073 (98) (9) December 31 December 31 Expenses 3,717 3,835 118 3 2024 2023 2024 2023 Adjusted OIBDA $ 1,231 $ 1,385 $ (154) (11)% Operating income (loss) (GAAP) $ 129 $ 404 $ (5,269) $ (451) Depreciation and amortization 95 108 392 418 Nine Months Ended September 30 $ IN MILLIONS (a) Programming charges — — 1,118 2,371 2022 2021 $ B/(W) % (a) Impairment charges 30 83 6,130 83 Revenue $ 15,849 $ 16,432 $ (583) ( 4) % (a) Restructuring charges 10 48 554 102 ▪ Advertising 6,668 7,230 (562) (8) (a) Transaction-related items 11 (146) 62 (156) ▪ Affiliate and subscription 6,156 6,303 (147) ( 2) (a) Other corporate matters 131 23 131 23 ▪ Licensing and other 3,025 2,899 126 4 Adjusted OIBDA (Non-GAAP) $ 406 $ 520 $ 3,118 $ 2,390 Expenses 11,694 11,778 84 1 Adjusted OIBDA $ 4,155 $ 4,654 $ (499) (11) % (a) See notes on the following tables for additional information on items affecting comparability. 11
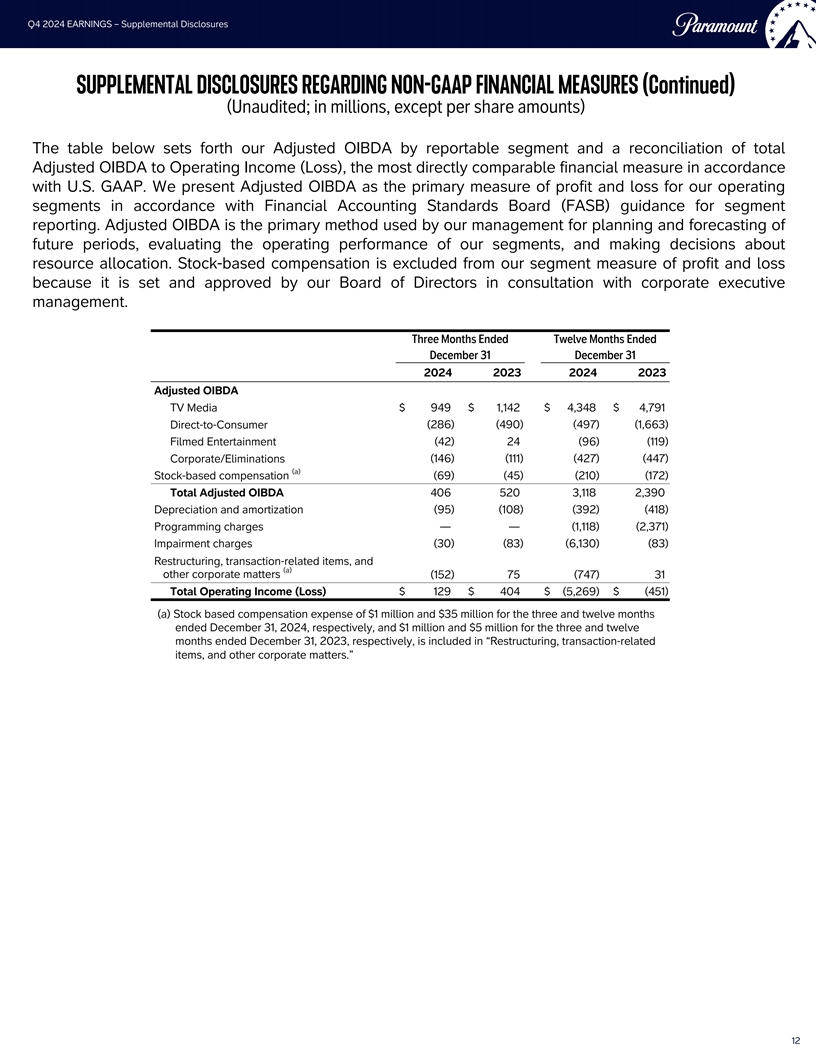
Q4 2024 EARNINGS – Supplemental Disclosures SUPPLEMENTAL DISCLOSURES REGARDING NON-GAAP FINANCIAL MEASURES (Continued) (Unaudited; in millions, except per share amounts) The table below sets forth our Adjusted OIBDA by reportable segment and a reconciliation of total Adjusted OIBDA to Operating Income (Loss), the most directly comparable financial measure in accordance with U.S. GAAP. We present Adjusted OIBDA as the primary measure of profit and loss for our operating segments in accordance with Financial Accounting Standards Board (FASB) guidance for segment reporting. Adjusted OIBDA is the primary method used by our management for planning and forecasting of future periods, evaluating the operating performance of our segments, and making decisions about resource allocation. Stock-based compensation is excluded from our segment measure of profit and loss because it is set and approved by our Board of Directors in consultation with corporate executive management. Three Months Ended Twelve Months Ended December 31 December 31 2024 2023 2024 2023 Adjusted OIBDA TV Media $ 949 $ 1,142 $ 4,348 $ 4,791 (286) (490) (497) (1,663) Direct-to-Consumer FBI Filmed Entertainment (42) 24 (96) (119) Corporate/Eliminations (146) (111) (427) (447) (a) Stock-based compensation (69) (45) (210) (172) Total Adjusted OIBDA 406 520 3,118 2,390 Depreciation and amortization (95) (108) (392) (418) Programming charges — — (1,118) (2,371) Impairment charges (30) (83) (6,130) (83) Restructuring, transaction-related items, and (a) other corporate matters (152) 75 (747) 31 Total Operating Income (Loss) $ 129 $ 404 $ (5,269) $ (451) (a) Stock based compensation expense of $1 million and $35 million for the three and twelve months ended December 31, 2024, respectively, and $1 million and $5 million for the three and twelve months ended December 31, 2023, respectively, is included in “Restructuring, transaction-related items, and other corporate matters.” Three Months Ended September 30 $ IN MILLIONS 2022 2021 $ B/(W) % Revenue $ 4,948 $ 5,220 $ (272) ( 5) % ▪ Advertising 1,973 2,039 (66) ( 3) ▪ Affiliate and subscription 2,000 2,108 (108) (5) ▪ Licensing and other 975 1,073 (98) (9) Expenses 3,717 3,835 118 3 Adjusted OIBDA $ 1,231 $ 1,385 $ (154) ( 11) % Nine Months Ended September 30 $ IN MILLIONS 2022 2021 $ B/(W) % Revenue $ 15,849 $ 16,432 $ (583) (4)% ▪ Advertising 6,668 7,230 (562) ( 8) ▪ Affiliate and subscription 6,156 6,303 (147) ( 2) ▪ Licensing and other 3,025 2,899 126 4 Expenses 11,694 11,778 84 1 Adjusted OIBDA $ 4,155 $ 4,654 $ (499) ( 11) % 12
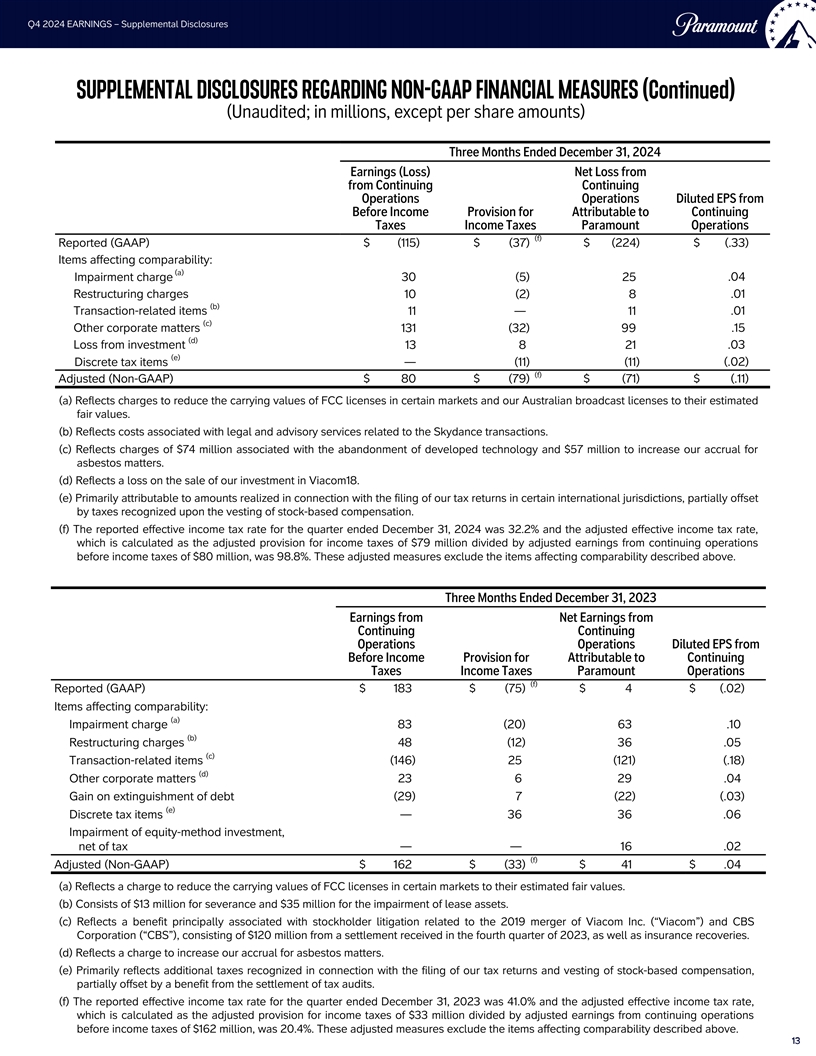
Q4 2024 EARNINGS – Supplemental Disclosures SUPPLEMENTAL DISCLOSURES REGARDING NON-GAAP FINANCIAL MEASURES (Continued) (Unaudited; in millions, except per share amounts) Three Months Ended December 31, 2024 Earnings (Loss) Net Loss from from Continuing Continuing Operations Operations Diluted EPS from Before Income Provision for Attributable to Continuing Taxes Income Taxes Paramount Operations (f) Reported (GAAP) $ (115) $ (37) $ (224) $ (.33) Items affecting comparability: (a) Impairment charge 30 (5) 25 .04 Restructuring charges .01 10 (2) 8 (b) Transaction-related items 11 — 11 .01 (c) Other corporate matters 131 (32) 99 .15 (d) Loss from investment 13 8 21 .03 (e) (.02) Discrete tax items — (11) (11) (f) Adjusted (Non-GAAP) $ 80 $ (79) $ (71) $ (.11) (a) Reflects charges to reduce the carrying values of FCC licenses in certain markets and our Australian broadcast licenses to their estimated fair values. FBI (b) Reflects costs associated with legal and advisory services related to the Skydance transactions. (c) Reflects charges of $74 million associated with the abandonment of developed technology and $57 million to increase our accrual for asbestos matters. (d) Reflects a loss on the sale of our investment in Viacom18. (e) Primarily attributable to amounts realized in connection with the filing of our tax returns in certain international jurisdictions, partially offset by taxes recognized upon the vesting of stock-based compensation. (f) The reported effective income tax rate for the quarter ended December 31, 2024 was 32.2% and the adjusted effective income tax rate, which is calculated as the adjusted provision for income taxes of $79 million divided by adjusted earnings from continuing operations before income taxes of $80 million, was 98.8%. These adjusted measures exclude the items affecting comparability described above. Three Months Ended December 31, 2023 Earnings from Net Earnings from Continuing Continuing Operations Operations Diluted EPS from Before Income Provision for Attributable to Continuing Taxes Income Taxes Paramount Operations (f) Reported (GAAP) $ 183 $ (75) $ 4 $ (.02) Items affecting comparability: (a) Impairment charge 83 (20) 63 .10 (b) Three Months Ended September 30 Restructuring charges 48 (12) 36 .05 $ IN MILLIONS (c) Transaction-related items (146) 25 (121) (.18) 2022 2021 $ B/(W) % (d) Revenue $ 4,948 $ 5,220 $ (272) (5)% Other corporate matters 23 6 29 .04 ▪ Advertising 1,973 2,039 (66) ( 3) Gain on extinguishment of debt (29) 7 (22) (.03) ▪ Affiliate and subscription 2,000 2,108 (108) (5) (e) Discrete tax items — 36 36 .06 ▪ Licensing and other 975 1,073 (98) ( 9) Impairment of equity-method investment, Expenses 3,717 3,835 118 3 net of tax — — 16 .02 Adjusted OIBDA $ 1,231 $ 1,385 $ (154) ( 11) % (f) Adjusted (Non-GAAP) $ 162 $ (33) $ 41 $ .04 (a) Reflects a charge to reduce the carrying values of FCC licenses in certain markets to their estimated fair values. Nine Months Ended September 30 $ IN MILLIONS (b) Consists of $13 million for severance and $35 million for the impairment of lease assets. 2022 2021 $ B/(W) % (c) Reflects a benefit principally associated with stockholder litigation related to the 2019 merger of Viacom Inc. (“Viacom”) and CBS Revenue $ 15,849 $ 16,432 $ (583) (4)% Corporation (“CBS”), consisting of $120 million from a settlement received in the fourth quarter of 2023, as well as insurance recoveries. ▪ Advertising 6,668 7,230 (562) ( 8) (d) Reflects a charge to increase our accrual for asbestos matters. ▪ Affiliate and subscription 6,156 6,303 (147) (2) (e) Primarily reflects additional taxes recognized in connection with the filing of our tax returns and vesting of stock-based compensation, ▪ Licensing and other 3,025 2,899 126 4 partially offset by a benefit from the settlement of tax audits. Expenses 11,694 11,778 84 1 (f) The reported effective income tax rate for the quarter ended December 31, 2023 was 41.0% and the adjusted effective income tax rate, Adjusted OIBDA $ 4,155 $ 4,654 $ (499) (11)% which is calculated as the adjusted provision for income taxes of $33 million divided by adjusted earnings from continuing operations before income taxes of $162 million, was 20.4%. These adjusted measures exclude the items affecting comparability described above. 1 13 3 Source: Nielsen Media Research
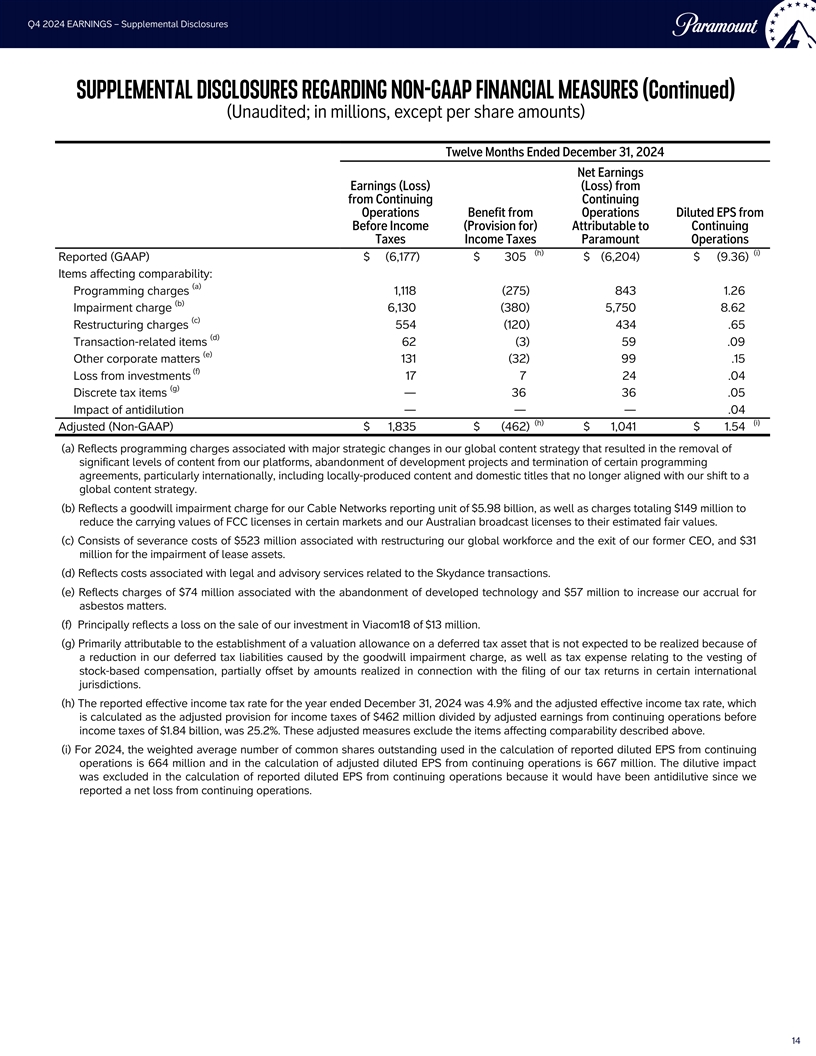
Q4 2024 EARNINGS – Supplemental Disclosures SUPPLEMENTAL DISCLOSURES REGARDING NON-GAAP FINANCIAL MEASURES (Continued) (Unaudited; in millions, except per share amounts) Twelve Months Ended December 31, 2024 Net Earnings Earnings (Loss) (Loss) from from Continuing Continuing Operations Benefit from Operations Diluted EPS from Before Income (Provision for) Attributable to Continuing Taxes Income Taxes Paramount Operations (h) (i) Reported (GAAP) $ (6,177) $ 305 $ (6,204) $ (9.36) Items affecting comparability: (a) Programming charges 1,118 (275) 843 1.26 (b) Impairment charge 6,130 (380) 5,750 8.62 (c) Restructuring charges 554 (120) 434 .65 (d) Transaction-related items 62 (3) 59 .09 (e) Other corporate matters 131 (32) 99 .15 (f) Loss from investments 17 7 24 .04 (g) Discrete tax items — 36 36 .05 Impact of antidilution — — — .04 (h)(i) Adjusted (Non-GAAP) $ 1,835 $ (462) $ 1,041 $ 1.54 FBI (a) Reflects programming charges associated with major strategic changes in our global content strategy that resulted in the removal of significant levels of content from our platforms, abandonment of development projects and termination of certain programming agreements, particularly internationally, including locally-produced content and domestic titles that no longer aligned with our shift to a global content strategy. (b) Reflects a goodwill impairment charge for our Cable Networks reporting unit of $5.98 billion, as well as charges totaling $149 million to reduce the carrying values of FCC licenses in certain markets and our Australian broadcast licenses to their estimated fair values. (c) Consists of severance costs of $523 million associated with restructuring our global workforce and the exit of our former CEO, and $31 million for the impairment of lease assets. (d) Reflects costs associated with legal and advisory services related to the Skydance transactions. (e) Reflects charges of $74 million associated with the abandonment of developed technology and $57 million to increase our accrual for asbestos matters. (f) Principally reflects a loss on the sale of our investment in Viacom18 of $13 million. (g) Primarily attributable to the establishment of a valuation allowance on a deferred tax asset that is not expected to be realized because of a reduction in our deferred tax liabilities caused by the goodwill impairment charge, as well as tax expense relating to the vesting of stock-based compensation, partially offset by amounts realized in connection with the filing of our tax returns in certain international jurisdictions. (h) The reported effective income tax rate for the year ended December 31, 2024 was 4.9% and the adjusted effective income tax rate, which is calculated as the adjusted provision for income taxes of $462 million divided by adjusted earnings from continuing operations before income taxes of $1.84 billion, was 25.2%. These adjusted measures exclude the items affecting comparability described above. Three Months Ended September 30 $ IN MILLIONS (i) For 2024, the weighted average number of common shares outstanding used in the calculation of reported diluted EPS from continuing 2022 2021 $ B/(W) % operations is 664 million and in the calculation of adjusted diluted EPS from continuing operations is 667 million. The dilutive impact Revenue $ 4,948 $ 5,220 $ (272) ( 5) % was excluded in the calculation of reported diluted EPS from continuing operations because it would have been antidilutive since we reported a net loss from continuing operations. ▪ Advertising 1,973 2,039 (66) ( 3) ▪ Affiliate and subscription 2,000 2,108 (108) ( 5) ▪ Licensing and other 975 1,073 (98) ( 9) Expenses 3,717 3,835 118 3 Adjusted OIBDA $ 1,231 $ 1,385 $ (154) (11)% Nine Months Ended September 30 $ IN MILLIONS 2022 2021 $ B/(W) % Revenue $ 15,849 $ 16,432 $ (583) ( 4)% ▪ Advertising 6,668 7,230 (562) ( 8) ▪ Affiliate and subscription 6,156 6,303 (147) ( 2) ▪ Licensing and other 3,025 2,899 126 4 Expenses 11,694 11,778 84 1 Adjusted OIBDA $ 4,155 $ 4,654 $ (499) ( 11)% 14 Source: Nielsen Media Research

Q4 2024 EARNINGS – Supplemental Disclosures SUPPLEMENTAL DISCLOSURES REGARDING NON-GAAP FINANCIAL MEASURES (Continued) (Unaudited; in millions, except per share amounts) Twelve Months Ended December 31, 2023 Net Earnings Earnings (Loss) (Loss) from from Continuing Continuing Operations Benefit from Operations Diluted EPS from Before Income (Provision for) Attributable to Continuing Taxes Income Taxes Paramount Operations (h) Reported (GAAP) $ (2.06) $ (1,253) $ 361 $ (1,284) Items affecting comparability: (a) Programming charges 2,371 (582) 1,789 2.74 (b) Impairment charges 83 (20) 63 .10 (c) Restructuring charges 102 (25) 77 .12 (d) Transaction-related items (156) 27 (129) (.20) (e) Other corporate matters 23 6 29 .05 (f) Gain from investments (168) 60 (108) (.17) Gain on extinguishment of debt (29) 7 (22) (.03) (g) Discrete tax items — (31) (31) (.05) FBI Impairment of equity-method investment, net of tax — — 16 .02 (h) Adjusted (Non-GAAP) $ 973 $ (197) $ 400 $ .52 (a) Reflects programming charges associated with major strategic changes in our global content strategy in connection with the integration of Paramount+ and Showtime into a single product offering and initiatives to rationalize our international product offerings as we shifted to a global programming strategy. These strategy changes led to content being removed from our platforms or abandoned, the write-off of development costs, and termination of programming agreements. (b) Reflects a charge to reduce the carrying values of FCC licenses in certain markets to their estimated fair values. (c) Consists of $67 million for severance costs and $35 million for the impairment of lease assets. (d) Reflects a benefit principally associated with stockholder litigation related to the 2019 merger of Viacom and CBS, consisting of $120 million from a settlement received in the fourth quarter of 2023, as well as insurance recoveries. (e) Reflects a charge to increase our accrual for asbestos matters. (f) Reflects a gain recognized on our retained interest in Viacom18 following the discontinuance of equity method accounting resulting from the dilution of our interest from 49% to 13%. (g) Primarily reflects tax benefits from the resolution of an income tax matter in a foreign jurisdiction, guidance issued in 2023 by the Internal Revenue Service that resulted in additional foreign taxes from 2022 being eligible for a foreign tax credit, and the settlement of income tax audits, partially offset by tax expense relating to the vesting of stock-based compensation. (h) The reported effective income tax rate for the year ended December 31, 2023 was 28.8% and the adjusted effective income tax rate, which is calculated as the adjusted provision for income taxes of $197 million divided by adjusted earnings from continuing operations before income taxes of $973 million, was 20.2%. These adjusted measures exclude the items affecting comparability described above. Three Months Ended September 30 $ IN MILLIONS 2022 2021 $ B/(W) % Revenue $ 4,948 $ 5,220 $ (272) (5)% ▪ Advertising 1,973 2,039 (66) (3) ▪ Affiliate and subscription 2,000 2,108 (108) ( 5) ▪ Licensing and other 975 1,073 (98) ( 9) Expenses 3,717 3,835 118 3 Adjusted OIBDA $ 1,231 $ 1,385 $ (154) (11) % Nine Months Ended September 30 $ IN MILLIONS 2022 2021 $ B/(W) % Revenue $ 15,849 $ 16,432 $ (583) ( 4)% ▪ Advertising 6,668 7,230 (562) ( 8) ▪ Affiliate and subscription 6,156 6,303 (147) ( 2) ▪ Licensing and other 3,025 2,899 126 4 Expenses 11,694 11,778 84 1 Adjusted OIBDA $ 4,155 $ 4,654 $ (499) (11) % 15 Source: Nielsen Media Research

Q4 2024 EARNINGS – Supplemental Disclosures SUPPLEMENTAL DISCLOSURES REGARDING NON-GAAP FINANCIAL MEASURES (Continued) (Unaudited; in millions) Free Cash Flow Free cash flow is a non-GAAP financial measure. Free cash flow reflects our net cash flow provided by (used for) operating activities from continuing operations less capital expenditures. We deduct capital expenditures when we calculate free cash flow because investment in capital expenditures is a use of cash that is directly related to our operations. Our net cash flow provided by (used for) operating activities from continuing operations is the most directly comparable U.S. GAAP financial measure. Management believes free cash flow provides investors with an important perspective on the cash available to us to service debt, pay dividends, make strategic acquisitions and investments, maintain our capital assets, satisfy our tax obligations, and fund ongoing operations and working capital needs. We believe the presentation of free cash flow is relevant and useful for investors because it allows investors to evaluate the cash generated from our underlying operations in a manner similar to the method used by management. Free cash flow is one of the quantitative performance metrics used in determining our annual incentive compensation awards. In addition, free cash flow is a primary FBI measure used externally by our investors, analysts and industry peers for purposes of valuation and comparison of our operating performance to other companies in our industry. As free cash flow is not a measure calculated in accordance with U.S. GAAP, free cash flow should not be considered in isolation of, or as a substitute for, either net cash flow provided by (used for) operating activities from continuing operations as a measure of liquidity or net earnings (loss) as a measure of operating performance. Free cash flow, as we calculate it, may not be comparable to similarly titled measures employed by other companies. The following table presents a reconciliation of our net cash flow provided by operating activities from continuing operations to free cash flow. Three Months Ended Twelve Months Ended December 31 December 31 2024 2023 2024 2023 Net cash flow provided by operating activities from continuing operations (GAAP) $ 168 $ 558 $ 752 $ 384 Capital expenditures (112) (115) (263) (328) Three Months Ended September 30 $ IN MILLIONS Free cash flow (Non-GAAP) $ 56 $ 443 $ 489 $ 56 2022 2021 $ B/(W) % Revenue $ 4,948 $ 5,220 $ (272) (5)% ▪ Advertising 1,973 2,039 (66) ( 3) ▪ Affiliate and subscription 2,000 2,108 (108) (5) ▪ Licensing and other 975 1,073 (98) ( 9) Expenses 3,717 3,835 118 3 Adjusted OIBDA $ 1,231 $ 1,385 $ (154) ( 11) % Nine Months Ended September 30 $ IN MILLIONS 2022 2021 $ B/(W) % Revenue $ 15,849 $ 16,432 $ (583) (4) % ▪ Advertising 6,668 7,230 (562) ( 8) ▪ Affiliate and subscription 6,156 6,303 (147) (2) ▪ Licensing and other 3,025 2,899 126 4 Expenses 11,694 11,778 84 1 Adjusted OIBDA $ 4,155 $ 4,654 $ (499) ( 11) % 16 Source: Nielsen Media Research